| | | FREE WRITING PROSPECTUS |
| | | FILED PURSUANT TO RULE 433 |
| | | REGISTRATION FILE NO.: 333-255934-09 |
| | | |
| Dated November 20, 2023 | BMO 2023-C7 |
| Structural and Collateral Term Sheet |
BMO 2023-C7 Mortgage Trust |
$739,304,766 (Approximate Mortgage Pool Balance) |
| |
$[ ] (Approximate Offered Certificates) |
| |
BMO Commercial Mortgage Securities LLC Depositor |
COMMERCIAL MORTGAGE PASS-THROUGH CERTIFICATES, SERIES 2023-C7 |
Bank of Montreal Citi Real Estate Funding Inc. UBS AG Starwood Mortgage Capital LLC RRECM Capital II, LLC (formerly known as Sabal Capital II, LLC) Greystone Commercial Mortgage Capital LLC KeyBank National Association Sponsors and Mortgage Loan Sellers |
| BMO Capital Markets | KeyBanc Capital Markets | UBS Securities LLC | Citigroup |
| Co-Lead Managers and Joint Bookrunners |
Academy Securities
Co-Manager | Bancroft Capital, LLC
Co-Manager | Drexel Hamilton
Co-Manager |
| THE INFORMATION IN THIS STRUCTURAL AND COLLATERAL TERM SHEET IS NOT COMPLETE AND MAY BE AMENDED PRIOR TO THE TIME OF SALE. THIS TERM SHEET IS NOT AN OFFER TO SELL THESE SECURITIES AND IT IS NOT A SOLICITATION OF AN OFFER TO BUY THESE SECURITIES IN ANY JURISDICTION WHERE THE OFFER OR SALE IS NOT PERMITTED. |
| |
| Dated November 20, 2023 | BMO 2023-C7 |
This material is for your information, and none of BMO Capital Markets Corp., Citigroup Global Markets Inc., KeyBanc Capital Markets Inc., UBS Securities LLC, Academy Securities, Inc., Bancroft Capital, LLC and Drexel Hamilton, LLC (collectively, the “Underwriters”) are soliciting any action based upon it. This material is not to be construed as an offer to sell or the solicitation of any offer to buy any security in any jurisdiction where such an offer or solicitation would be illegal.
The depositor has filed a registration statement (including the prospectus) with the Securities and Exchange Commission (File No. 333-255934) for the offering to which this communication relates. Before you invest, you should read the prospectus in the registration statement and other documents the depositor has filed with the Securities and Exchange Commission for more complete information about the depositor, the issuing entity and this offering. You may get these documents for free by visiting EDGAR on the SEC website at www.sec.gov. Alternatively, the depositor or BMO Capital Markets Corp., any other underwriter, or any dealer participating in this offering will arrange to send you the prospectus if you request it by calling 1-866-864-7760. The Offered Certificates referred to in these materials, and the asset pool backing them, are subject to modification or revision (including the possibility that one or more Classes of Certificates may be split, combined or eliminated at any time prior to issuance or availability of a final prospectus) and are offered on a “when, as and if issued” basis. You understand that, when you are considering the purchase of these Certificates, a contract of sale will come into being no sooner than the date on which the relevant Class has been priced and we have verified the allocation of Certificates to be made to you; any “indications of interest” expressed by you, and any “soft circles” generated by us, will not create binding contractual obligations for you or us.
Neither this document nor anything contained in this document shall form the basis for any contract or commitment whatsoever. The information contained in this document is preliminary as of the date of this document, supersedes any previous such information delivered to you and will be superseded by any such information subsequently delivered prior to the time of sale. These materials are subject to change, completion or amendment from time to time. The information should be reviewed only in conjunction with the entire offering document relating to the Commercial Mortgage Pass-Through Certificates, Series 2023-C7 (the “Offering Document”). All of the information contained herein is subject to the same limitations and qualifications contained in the Offering Document. The information contained herein does not contain all relevant information relating to the underlying mortgage loans or mortgaged properties. Such information is described elsewhere in the Offering Document. The information contained herein will be more fully described elsewhere in the Offering Document. The information contained herein should not be viewed as projections, forecasts, predictions or opinions with respect to value. Prior to making any investment decision, prospective investors are strongly urged to read the Offering Document its entirety. Neither the Securities and Exchange Commission nor any state securities commission has approved or disapproved of these securities or determined if this free writing prospectus is truthful or complete. Any representation to the contrary is a criminal offense.
This document has been prepared by the Underwriters for information purposes only and does not constitute, in whole or in part, a prospectus for the purposes of Regulation (EU) 2017/1129 (as amended or superseded) and/or Part VI of the Financial Services and Markets Act 2000 (as amended) or other offering document.
The attached information contains certain tables and other statistical analyses (the “Computational Materials”) which have been prepared in reliance upon information furnished by the Mortgage Loan Sellers. Numerous assumptions were used in preparing the Computational Materials, which may or may not be reflected herein. As such, no assurance can be given as to the Computational Materials’ accuracy, appropriateness or completeness in any particular context; or as to whether the Computational Materials and/or the assumptions upon which they are based reflect present market conditions or future market performance. The Computational Materials should not be construed as either projections or predictions or as legal, tax, financial or accounting advice. You should consult your own counsel, accountant and other advisors as to the legal, tax, business, financial and related aspects of a purchase of these Certificates. Any weighted average lives, yields and principal payment periods shown in the Computational Materials are based on prepayment and/or loss assumptions, and changes in such prepayment and/or loss assumptions may dramatically affect such weighted average lives, yields and principal payment periods. In addition, it is possible that prepayments or losses on the underlying assets will occur at rates higher or lower than the rates shown in the attached Computational Materials. The specific characteristics of the Certificates may differ from those shown in the Computational Materials due to differences between the final underlying assets and the preliminary underlying assets used in preparing the Computational Materials. The principal amount and designation of any security described in the Computational Materials are subject to change prior to issuance. None of the Underwriters or any of their respective affiliates make any representation or warranty as to the actual rate or timing of payments or losses on any of the underlying assets or the payments or yield on the Certificates. The information in this presentation is based upon management forecasts and reflects prevailing conditions and management’s views as of this date, all of which are subject to change. In preparing this presentation, we have relied upon and assumed, without independent verification, the accuracy and completeness of all information available from public sources or which was provided to us by or on behalf of the Mortgage Loan Sellers or which was otherwise reviewed by us.
This document contains forward-looking statements. If and when included in this document, the words “expects”, “intends”, “anticipates”, “estimates” and analogous expressions and all statements that are not historical facts, including statements about our beliefs or expectations, are intended to identify forward-looking statements. Any forward-looking statements are made subject to risks and uncertainties which could cause actual results to differ materially from those stated. Those risks and uncertainties include, among other things, declines in general economic and business conditions, increased competition, changes in demographics, changes in political and social conditions, regulatory initiatives and changes in consumer preferences, many of which are beyond our control and the control of any other person or entity related to this offering. The forward-looking statements made in this document are made as of the date hereof. We have no obligation to update or revise any forward-looking statement.
BMO Capital Markets is a trade name used by BMO Financial Group for the wholesale banking businesses of Bank of Montreal, BMO Harris Bank N.A. (member FDIC), Bank of Montreal Europe p.l.c, and Bank of Montreal (China) Co. Ltd, the institutional broker dealer business of BMO Capital Markets Corp. (Member FINRA and SIPC) and the agency broker dealer business of Clearpool Execution Services, LLC (Member FINRA and SIPC) in the U.S., and the institutional broker dealer businesses of BMO Nesbitt Burns Inc. (Member Investment Industry Regulatory Organization of Canada and Member Canadian Investor Protection Fund) in Canada and Asia, Bank of Montreal Europe p.l.c. (authorized and regulated by the Central Bank of Ireland) in Europe and BMO Capital Markets Limited (authorized and regulated by the Financial Conduct Authority) in the UK and Australia.
| Dated November 20, 2023 | BMO 2023-C7 |
IMPORTANT NOTICE RELATING TO AUTOMATICALLY-GENERATED EMAIL DISCLAIMERS
Any legends, disclaimers or other notices that may appear at the bottom of any email communication to which this document is attached relating to (1) these materials not constituting an offer (or a solicitation of an offer), (2) no representation that these materials are accurate or complete and may not be updated or (3) these materials possibly being confidential, are not applicable to these materials and should be disregarded. Such legends, disclaimers or other notices have been automatically generated as a result of these materials having been sent via Bloomberg or another system.
THE CERTIFICATES REFERRED TO IN THESE MATERIALS ARE SUBJECT TO MODIFICATION OR REVISION (INCLUDING THE POSSIBILITY THAT ONE OR MORE CLASSES OF CERTIFICATES MAY BE SPLIT, COMBINED OR ELIMINATED AT ANY TIME PRIOR TO ISSUANCE OR AVAILABILITY OF A FINAL PROSPECTUS) AND ARE OFFERED ON A “WHEN, AS AND IF ISSUED” BASIS.
THE UNDERWRITERS MAY FROM TIME TO TIME PERFORM INVESTMENT BANKING SERVICES FOR, OR SOLICIT INVESTMENT BANKING BUSINESS FROM, ANY COMPANY NAMED IN THESE MATERIALS. THE UNDERWRITERS AND/OR THEIR AFFILIATES OR RESPECTIVE EMPLOYEES MAY FROM TIME TO TIME HAVE A LONG OR SHORT POSITION IN ANY CERTIFICATE OR CONTRACT DISCUSSED IN THESE MATERIALS.
| THE INFORMATION IN THIS STRUCTURAL AND COLLATERAL TERM SHEET IS NOT COMPLETE AND MAY BE AMENDED PRIOR TO THE TIME OF SALE. THIS TERM SHEET IS NOT AN OFFER TO SELL THESE SECURITIES AND IT IS NOT A SOLICITATION OF AN OFFER TO BUY THESE SECURITIES IN ANY JURISDICTION WHERE THE OFFER OR SALE IS NOT PERMITTED. |
| | 3 | |
| Structural and Collateral Term Sheet | | BMO 2023-C7 |
| Collateral Characteristics |
Mortgage Loan Seller | Number of Mortgage Loans | Number of Mortgaged Properties | Aggregate
Cut-off Date Balance | |
| BMO | 8 | 27 | $240,850,000 | 32.6% |
| CREFI | 6 | 9 | $183,166,296 | 24.8% |
| UBS AG | 4 | 7 | $89,908,333 | 12.2% |
| SMC | 4 | 4 | $74,100,000 | 10.0% |
| Regions | 6 | 6 | $72,581,000 | 9.8% |
| GCMC | 3 | 3 | $42,699,137 | 5.8% |
| KeyBank | 1 | 29 | $36,000,000 | 4.9% |
| Total: | 32 | 85 | $739,304,766 | 100.0% |
| Loan Pool | |
| | Initial Pool Balance (“IPB”): | $739,304,766 |
| | Number of Mortgage Loans: | 32 |
| | Number of Mortgaged Properties: | 85 |
| | Average Cut-off Date Balance per Mortgage Loan: | $23,103,274 |
| | Weighted Average Current Mortgage Rate: | 7.20127% |
| | 10 Largest Mortgage Loans as % of IPB: | 53.9% |
| | Weighted Average Remaining Term to Maturity: | 108 months |
| | Weighted Average Seasoning: | 2 months |
| | | |
| Credit Statistics | |
| | Weighted Average UW NCF DSCR: | 1.69x |
| | Weighted Average UW NOI Debt Yield(1): | 13.2% |
| | Weighted Average Cut-off Date Loan-to-Value Ratio (“LTV”): | 53.4% |
| | Weighted Average Maturity Date/ARD LTV: | 52.1% |
| | | |
| Other Statistics | |
| | % of Mortgage Loans with Additional Debt: | 9.0% |
| | % of Mortgage Loans with Single Tenants(2): | 16.7% |
| | % of Mortgage Loans secured by Multiple Properties: | 34.8% |
| | |
| Amortization | |
| | Weighted Average Original Amortization Term: | 360 months |
| | Weighted Average Remaining Amortization Term: | 360 months |
| | % of Mortgage Loans with Interest-Only: | 77.1% |
| | % of Mortgage Loans with Partial Interest-Only followed by Amortizing Balloon: | 18.4% |
| | % of Mortgage Loans with Amortizing Balloon: | 4.6% |
| | | |
| Lockboxes | |
| | % of Mortgage Loans with Hard Lockboxes: | 67.7% |
| | % of Mortgage Loans with Springing Lockboxes: | 21.4% |
| | % of Mortgage Loans with Soft Lockboxes: | 10.8% |
| | | |
| Reserves | |
| | % of Mortgage Loans Requiring Monthly Tax Reserves: | 58.2% |
| | % of Mortgage Loans Requiring Monthly Insurance Reserves: | 45.3% |
| | % of Mortgage Loans Requiring Monthly CapEx Reserves: | 49.3% |
| | % of Mortgage Loans Requiring Monthly TI/LC Reserves(3): | 37.1% |
| (1) | In the case of Loan No. 7, the UW NOI Debt Yield (11.6%) is based on Cut-off Date Principal Balance after netting out a $4,200,000 holdback reserve. The UW NOI Debt Yield based on Cut-off Date Principal Balance without netting out the holdback reserve is 10.2%. |
| (2) | Excludes mortgage loans that are secured by multiple properties with multiple tenants. |
| (3) | Calculated only with respect to the Cut-off Date Balance of mortgage loans secured or partially secured by office, industrial, retail, data center and mixed use properties. |
| THE INFORMATION IN THIS STRUCTURAL AND COLLATERAL TERM SHEET IS NOT COMPLETE AND MAY BE AMENDED PRIOR TO THE TIME OF SALE. THIS TERM SHEET IS NOT AN OFFER TO SELL THESE SECURITIES AND IT IS NOT A SOLICITATION OF AN OFFER TO BUY THESE SECURITIES IN ANY JURISDICTION WHERE THE OFFER OR SALE IS NOT PERMITTED. |
| | 4 | |
| Structural and Collateral Term Sheet | | BMO 2023-C7 |
| Collateral Characteristics |
| Ten Largest Mortgage Loans |
| No. | Loan Name | City, State | Mortgage Loan Seller | No.
of Prop. | Cut-off Date Balance | % of IPB | Square Feet / Rooms / Units | Property Type | UW
NCF DSCR | UW NOI Debt Yield(1) | Cut-off Date LTV | Maturity Date/ARD LTV |
| 1 | Woodfield Mall | Schaumburg, IL | BMO | 1 | $68,000,000 | 9.2% | 1,064,590 | Retail | 2.02x | 14.4% | 42.4% | 42.4% |
| 2 | Arundel Mills and Marketplace | Hanover, MD | CREFI | 1 | $60,000,000 | 8.1% | 1,938,983 | Retail | 1.98x | 16.1% | 41.4% | 41.4% |
| 3 | Bala Plaza Portfolio | Bala Cynwyd, PA | CREFI | 3 | $40,000,000 | 5.4% | 1,136,771 | Various | 1.68x | 16.2% | 47.4% | 47.4% |
| 4 | RTL Retail Portfolio | Various, Various | KeyBank | 29 | $36,000,000 | 4.9% | 3,117,102 | Retail | 1.97x | 13.8% | 51.2% | 51.2% |
| 5 | 2136 Honeywell Avenue | Bronx, NY | SMC | 1 | $36,000,000 | 4.9% | 101 | Multifamily | 1.20x | 9.9% | 59.1% | 54.6% |
| 6 | MRP Solutions Portfolio | Various, Various | BMO | 2 | $34,000,000 | 4.6% | 560,141 | Industrial | 1.78x | 11.0% | 59.4% | 59.4% |
| 7 | The Park at Trowbridge | Southfield, MI | BMO | 1 | $33,000,000 | 4.5% | 320 | Multifamily | 1.34x | 11.6% | 45.2% | 45.2% |
| 8 | Tusk Multifamily Portfolio | Various, Various | UBS AG | 3 | $33,000,000 | 4.5% | 523 | Multifamily | 1.25x | 8.9% | 63.5% | 63.5% |
| 9 | New Mountain - Cleaver Brooks | Various, Various | BMO | 7 | $31,350,000 | 4.2% | 799,679 | Industrial | 1.95x | 13.6% | 53.8% | 53.8% |
| 10 | Metra Portfolio | Various, MI | CREFI | 2 | $27,216,296 | 3.7% | 450,104 | Industrial | 1.30x | 11.6% | 59.4% | 55.1% |
| | | | | | | | | | | | | |
| | Top 3 Total/Weighted Average | 5 | $168,000,000 | 22.7% | | | 1.92x | 15.4% | 43.2% | 43.2% |
| | Top 5 Total/Weighted Average | 35 | $240,000,000 | 32.5% | | | 1.82x | 14.4% | 46.8% | 46.1% |
| | Top 10 Total/Weighted Average | 50 | $398,566,296 | 53.9% | | | 1.71x | 13.1% | 50.5% | 49.8% |
| | Non-Top 10 Total/Weighted Average | 35 | $340,738,470 | 46.1% | | | 1.66x | 13.3% | 56.7% | 54.8% |
| (1) | In the case of Loan No. 7, the UW NOI Debt Yield (11.6%) is based on Cut-off Date Principal Balance after netting out a $4,200,000 holdback reserve. The UW NOI Debt Yield based on Cut-off Date Principal Balance without netting out the holdback reserve is 10.2%. |
| THE INFORMATION IN THIS STRUCTURAL AND COLLATERAL TERM SHEET IS NOT COMPLETE AND MAY BE AMENDED PRIOR TO THE TIME OF SALE. THIS TERM SHEET IS NOT AN OFFER TO SELL THESE SECURITIES AND IT IS NOT A SOLICITATION OF AN OFFER TO BUY THESE SECURITIES IN ANY JURISDICTION WHERE THE OFFER OR SALE IS NOT PERMITTED. |
| | 5 | |
| Structural and Collateral Term Sheet | | BMO 2023-C7 |
| Collateral Characteristics |
| Pari Passu Companion Loan Summary |
No. | Loan Name | | Trust Cut-off Date Balance | Aggregate Pari Passu Loan Cut-off Date Balance | Controlling Pooling/Trust & Servicing Agreement | Master Servicer | Special Servicer | Related Pari Passu Loan(s) Securitizations | Related Pari Passu Loan(s) Original Balance |
| 1 | Woodfield Mall | BMO | $68,000,000 | $226,000,000 | BMO 2023-C7(1) | Midland(1) | KeyBank(1) | Future Securitization(s) | $226,000,000 |
| 2 | Arundel Mills and Marketplace | CREFI | $60,000,000 | $300,000,000 | BMO 2023-C7(1) | Midland(1) | KeyBank(1) | Future Securitization(s) | $300,000,000 |
| 3 | Bala Plaza Portfolio | CREFI | $40,000,000 | $59,500,000 | BMO 2023-C7(1) | Midland(1) | KeyBank(1) | Future Securitization(s) | $59,500,000 |
| 4 | RTL Retail Portfolio | KeyBank | $36,000,000 | $224,000,000 | BBCMS 2023-C22 | Midland | Rialto | BBCMS 2023-C21
BBCMS 2023-C22
Future Securitization(s) | $62,500,000
$68,833,334
$92,666,666 |
| 12 | 11 West 42nd Street | UBS AG | $26,333,333 | $247,666,667 | BANK5 2023-5YR3 | Wells Fargo | Greystone | BMO 2023-5C1
BMO 2023-C6
BMO 2023-5C2
BANK5 2023-5YR3
BBCMS 2023-C21
BBCMS 2023-5C23(2)
Future Securitization(s) | $62,500,000
$25,000,000
$18,833,333
$75,000,000
$15,000,000
$20,000,000
$31,333,334 |
| 13 | OPI Portfolio | UBS AG | $25,000,000 | $29,300,000 | BMO 2023-C7(1) | Midland(1) | KeyBank(1) | Future Securitization(s) | $29,300,000 |
| 14 | Creekside Town Center | BMO | $24,000,000 | $47,525,000 | BMO 2023-C7(1) | Midland(1) | KeyBank(1) | Future Securitization(s) | $47,525,000 |
| 18 | 60 Hudson | BMO | $20,000,000 | $260,000,000 | BBCMS 2023-C22(3) | Midland(3) | Rialto(3) | BBCMS 2023-C22
Future Securitization(s) | $40,000,000
$220,000,000 |
| 19 | Knoll Ridge Apartments | BMO | $17,500,000 | $25,000,000 | BBCMS 2023-C22 | Midland | Rialto | BBCMS 2023-C22 | $25,000,000 |
| 20 | 645 North Michigan Avenue | CREFI | $17,000,000 | $38,000,000 | BMO 2023-C7(1) | Midland(1) | KeyBank(1) | Future Securitization(s) | $38,000,000 |
| 25 | Regency Retail Portfolio | BMO | $13,000,000 | $40,000,000 | BBCMS 2023-C22 | Midland | Rialto | BBCMS 2023-C22 | $40,000,000 |
| (1) | In the case of Loan Nos. 1, 2, 3, 13, 14 and 20, until the securitization of the related controlling pari passu companion loan, the related whole loan will be serviced and administered pursuant to the pooling and servicing agreement for the BMO 2023-C7 securitization transaction by the parties thereto. Upon the securitization of the related controlling pari-passu companion loan, servicing of the related whole loan will shift to the servicers under the servicing agreement with respect to such future securitization transaction, which servicing agreement will become the Controlling Pooling/Trust & Servicing Agreement. |
| (2) | Based on a publicly available prospectus. The BBCMS 2023-5C23 transaction is expected to close prior to the closing of this securitization transaction. |
| (3) | In the case of Loan No. 18, until the securitization of the related controlling pari passu companion loan, the related whole loan will be serviced and administered pursuant to the pooling and servicing agreement for the BBCMS 2023-C22 securitization transaction by the parties thereto. Upon the securitization of the related controlling pari-passu companion loan, servicing of the related whole loan will shift to the servicers under the servicing agreement with respect to such future securitization transaction, which servicing agreement will become the Controlling Pooling/Trust & Servicing Agreement. |
| THE INFORMATION IN THIS STRUCTURAL AND COLLATERAL TERM SHEET IS NOT COMPLETE AND MAY BE AMENDED PRIOR TO THE TIME OF SALE. THIS TERM SHEET IS NOT AN OFFER TO SELL THESE SECURITIES AND IT IS NOT A SOLICITATION OF AN OFFER TO BUY THESE SECURITIES IN ANY JURISDICTION WHERE THE OFFER OR SALE IS NOT PERMITTED. |
| | 6 | |
| Structural and Collateral Term Sheet | | BMO 2023-C7 |
| Collateral Characteristics |
| Mortgaged Properties by Type |
| | | | | | Weighted Average |
| Property Type | Property Subtype | Number of Properties | Cut-off Date Principal Balance | % of IPB | UW
NCF DSCR | UW
NOI DY(1) | Cut-off Date LTV | Maturity Date/ARD LTV |
| Retail | Anchored | 41 | $149,904,467 | 20.3% | 1.62x | 12.4% | 59.9% | 57.6% |
| | Super Regional Mall | 2 | 128,000,000 | 17.3 | 2.00x | 15.2% | 41.9% | 41.9% |
| | Unanchored | 3 | 13,765,000 | 1.9 | 2.12x | 16.0% | 49.8% | 47.8% |
| | Shadow Anchored | 3 | 2,511,533 | 0.3 | 1.80x | 12.7% | 58.3% | 58.3% |
| | Subtotal: | 49 | $294,181,000 | 39.8% | 1.81x | 13.8% | 51.6% | 50.3% |
| Multifamily | Garden | 7 | $73,500,000 | 9.9% | 1.29x | 9.5% | 64.6% | 64.6% |
| | Mid Rise | 2 | 69,000,000 | 9.3 | 1.27x | 10.7% | 52.5% | 50.1% |
| | Subtotal: | 9 | $142,500,000 | 19.3% | 1.28x | 10.1% | 58.7% | 57.6% |
| Industrial | Warehouse/Manufacturing | 9 | $65,350,000 | 8.8% | 1.86x | 12.2% | 56.7% | 56.7% |
| | Manufacturing | 3 | 32,791,296 | 4.4 | 1.40x | 11.7% | 59.2% | 55.7% |
| | Subtotal: | 12 | $98,141,296 | 13.3% | 1.71x | 12.1% | 57.6% | 56.4% |
| Office | Suburban | 4 | $56,530,111 | 7.6% | 1.69x | 14.8% | 48.7% | 48.7% |
| | CBD | 2 | 33,477,900 | 4.5 | 1.47x | 12.1% | 49.2% | 49.2% |
| | Subtotal: | 6 | $90,008,011 | 12.2% | 1.60x | 13.8% | 48.9% | 48.9% |
| Hospitality | Full Service | 2 | $33,500,000 | 4.5% | 1.50x | 15.6% | 56.9% | 55.1% |
| | Limited Service | 2 | 20,550,000 | 2.8 | 1.47x | 14.9% | 65.0% | 60.6% |
| | Subtotal: | 4 | $54,050,000 | 7.3% | 1.49x | 15.4% | 60.0% | 57.2% |
| Mixed Use | Medical Office/Retail | 1 | $17,000,000 | 2.3% | 1.57x | 14.2% | 57.9% | 51.3% |
| | Office/Retail | 2 | 9,424,459 | 1.3 | 1.60x | 15.7% | 49.8% | 49.0% |
| | Subtotal: | 3 | $26,424,459 | 3.6% | 1.58x | 14.7% | 55.0% | 50.5% |
| Other | Data Center | 1 | $20,000,000 | 2.7% | 3.92x | 24.2% | 17.5% | 17.5% |
| Self Storage | Self Storage | 1 | $14,000,000 | 1.9% | 1.33x | 10.3% | 59.6% | 59.6% |
| Total / Weighted Average: | 85 | $739,304,766 | 100.0% | 1.69x | 13.2% | 53.4% | 52.1% |
| (1) | In the case of Loan No. 7, the UW NOI Debt Yield (11.6%) is based on Cut-off Date Principal Balance after netting out a $4,200,000 holdback reserve. The UW NOI Debt Yield based on Cut-off Date Principal Balance without netting out the holdback reserve is 10.2%. |
| THE INFORMATION IN THIS STRUCTURAL AND COLLATERAL TERM SHEET IS NOT COMPLETE AND MAY BE AMENDED PRIOR TO THE TIME OF SALE. THIS TERM SHEET IS NOT AN OFFER TO SELL THESE SECURITIES AND IT IS NOT A SOLICITATION OF AN OFFER TO BUY THESE SECURITIES IN ANY JURISDICTION WHERE THE OFFER OR SALE IS NOT PERMITTED. |
| | 7 | |
| Structural and Collateral Term Sheet | | BMO 2023-C7 |
| No. 1 – Woodfield Mall |
| THE INFORMATION IN THIS STRUCTURAL AND COLLATERAL TERM SHEET IS NOT COMPLETE AND MAY BE AMENDED PRIOR TO THE TIME OF SALE. THIS TERM SHEET IS NOT AN OFFER TO SELL THESE SECURITIES AND IT IS NOT A SOLICITATION OF AN OFFER TO BUY THESE SECURITIES IN ANY JURISDICTION WHERE THE OFFER OR SALE IS NOT PERMITTED. |
| | 8 | |
| Structural and Collateral Term Sheet | | BMO 2023-C7 |
| No. 1 – Woodfield Mall |
| THE INFORMATION IN THIS STRUCTURAL AND COLLATERAL TERM SHEET IS NOT COMPLETE AND MAY BE AMENDED PRIOR TO THE TIME OF SALE. THIS TERM SHEET IS NOT AN OFFER TO SELL THESE SECURITIES AND IT IS NOT A SOLICITATION OF AN OFFER TO BUY THESE SECURITIES IN ANY JURISDICTION WHERE THE OFFER OR SALE IS NOT PERMITTED. |
| | 9 | |
| Structural and Collateral Term Sheet | | BMO 2023-C7 |
| No. 1 – Woodfield Mall |
| THE INFORMATION IN THIS STRUCTURAL AND COLLATERAL TERM SHEET IS NOT COMPLETE AND MAY BE AMENDED PRIOR TO THE TIME OF SALE. THIS TERM SHEET IS NOT AN OFFER TO SELL THESE SECURITIES AND IT IS NOT A SOLICITATION OF AN OFFER TO BUY THESE SECURITIES IN ANY JURISDICTION WHERE THE OFFER OR SALE IS NOT PERMITTED. |
| | 10 | |
| Structural and Collateral Term Sheet | | BMO 2023-C7 |
| No. 1 – Woodfield Mall |
| THE INFORMATION IN THIS STRUCTURAL AND COLLATERAL TERM SHEET IS NOT COMPLETE AND MAY BE AMENDED PRIOR TO THE TIME OF SALE. THIS TERM SHEET IS NOT AN OFFER TO SELL THESE SECURITIES AND IT IS NOT A SOLICITATION OF AN OFFER TO BUY THESE SECURITIES IN ANY JURISDICTION WHERE THE OFFER OR SALE IS NOT PERMITTED. |
| | 11 | |
| Structural and Collateral Term Sheet | | BMO 2023-C7 |
| No. 1 – Woodfield Mall |
| THE INFORMATION IN THIS STRUCTURAL AND COLLATERAL TERM SHEET IS NOT COMPLETE AND MAY BE AMENDED PRIOR TO THE TIME OF SALE. THIS TERM SHEET IS NOT AN OFFER TO SELL THESE SECURITIES AND IT IS NOT A SOLICITATION OF AN OFFER TO BUY THESE SECURITIES IN ANY JURISDICTION WHERE THE OFFER OR SALE IS NOT PERMITTED. |
| | 12 | |
Not Funded
| Structural and Collateral Term Sheet | | BMO 2023-C7 |
| No. 1 – Woodfield Mall |
| Mortgage Loan Information | | Property Information |
| Mortgage Loan Seller: | BMO | | Single Asset / Portfolio: | Single Asset |
| Original Principal Balance(1): | $68,000,000 | | Title: | Fee Simple / Leased Fee |
| Cut-off Date Principal Balance(1): | $68,000,000 | | Property Type – Subtype: | Retail – Super-Regional Mall |
| % of IPB: | 9.2% | | Net Rentable Area (SF): | 1,064,590 |
| Loan Purpose: | Refinance | | Location: | Schaumburg, Illinois |
| Borrower: | Woodfield Mall LLC | | Year Built / Renovated: | 1971, 1995 / 2015, 2016, 2018 |
| Borrower Sponsors: | International Mall Investors LLC and Simon Property Group, L.P. | | Occupancy(4): | 96.1% |
| Interest Rate: | 6.85000% | | Occupancy Date: | 11/14/2023 |
| Note Date: | 11/21/2023 | | 4th Most Recent NOI (As of): | $27,546,528 (12/31/2020) |
| Maturity Date: | 12/1/2033 | | 3rd Most Recent NOI (As of): | $37,229,630 (12/31/2021) |
| Interest-only Period: | 120 months | | 2nd Most Recent NOI (As of): | $36,506,153 (12/31/2022) |
| Original Term: | 120 months | | Most Recent NOI (As of): | $36,477,631 (TTM 10/31/2023) |
| Original Amortization Term: | None | | UW Economic Occupancy: | 95.5% |
| Amortization Type: | Interest Only | | UW Revenues: | $75,029,161 |
| Call Protection: | L(24),DorYM1(89),O(7) | | UW Expenses: | $32,816,238 |
| Lockbox / Cash Management(2): | Hard / Springing | | UW NOI: | $42,212,924 |
| Additional Debt(1): | Yes | | UW NCF: | $41,153,257 |
| Additional Debt Balance(1): | $226,000,000 | | Appraised Value / Per SF: | $694,000,000 / $652 |
| Additional Debt Type(1): | Pari Passu | | Appraisal Date: | 10/27/2023 |
| | | | | |
| Escrows and Reserves(3) | | Financial Information(1) |
| | Initial | Monthly | Initial Cap | | Cut-off Date Loan / SF: | $272.16 |
| Taxes: | $0 | Springing | NAP | | Maturity Date Loan / SF: | $272.16 |
| Insurance: | $0 | Springing | NAP | | Cut-off Date LTV(5): | 42.4% |
| Replacement Reserves: | $0 | Springing | NAP | | Maturity Date LTV(5): | 42.4% |
| Deferred Maintenance: | $0 | NAP | NAP | | UW NCF DSCR: | 2.02x |
| TI/LC: | $5,445,975 | Springing | NAP | | UW NOI Debt Yield: | 14.4% |
| Other(4): | $1,603,122 | NAP | NAP | | | |
| | | | | | | |
| Sources and Uses |
| Sources | Proceeds | % of Total | | | Uses | Proceeds | % of Tot | al |
| Whole Loan | $294,000,000 | 77.1 | % | | Loan Payoff | $372,898,903 | 97.7 | % |
| Sponsor Equity | 87,509,237 | 22.9 | | | Upfront Reserves | 7,049,097 | 1.9 | |
| | | | | Closing Costs | 1,561,237 | 0.4 | |
| Total Sources | $381,509,237 | 100.0 | % | | Total Uses | $381,509,237 | 100.0 | % |
| (1) | The Woodfield Mall Mortgage Loan (as defined below) is part of a whole loan evidenced by 16 pari passu notes with an aggregate original principal balance of $294,000,000. Financial Information in the chart above reflects the Woodfield Mall Whole Loan (as defined below). For additional information, see “The Loan” below. |
| (2) | The borrower is required to cause rents to be deposited into a lockbox account established at origination under the Woodfield Mall Whole Loan documents, and the borrower will have access to the funds in the lockbox account and use the lockbox account as an operating account so long as no Lockbox Event (as defined below) continues. During the continuance of a Lockbox Event, the borrower will not have any further access to the funds in the lockbox account except as otherwise expressly provided in the Woodfield Mall Whole Loan documents. |
| (3) | For a full description of Escrows and Reserves, please refer to “Escrows and Reserves” below. |
| (4) | Other Initial Escrows and Reserves consist of (i) $638,391 for a gap rent reserve and (ii) $964,731 for an upfront free rent reserve. |
| (5) | Occupancy for the Woodfield Mall Property (as defined below) includes temporary tenants. As of November 14, 2023, the Woodfield Mall Property was 87.5% occupied excluding temporary tenants. As of November 14, 2023, occupancy for the Woodfield Mall (as defined below) including temporary tenants was 98.1% and excluding temporary tenants was 98.0%. |
| THE INFORMATION IN THIS STRUCTURAL AND COLLATERAL TERM SHEET IS NOT COMPLETE AND MAY BE AMENDED PRIOR TO THE TIME OF SALE. THIS TERM SHEET IS NOT AN OFFER TO SELL THESE SECURITIES AND IT IS NOT A SOLICITATION OF AN OFFER TO BUY THESE SECURITIES IN ANY JURISDICTION WHERE THE OFFER OR SALE IS NOT PERMITTED. |
| | 13 | |
Not Funded
| Structural and Collateral Term Sheet | | BMO 2023-C7 |
| No. 1 – Woodfield Mall |
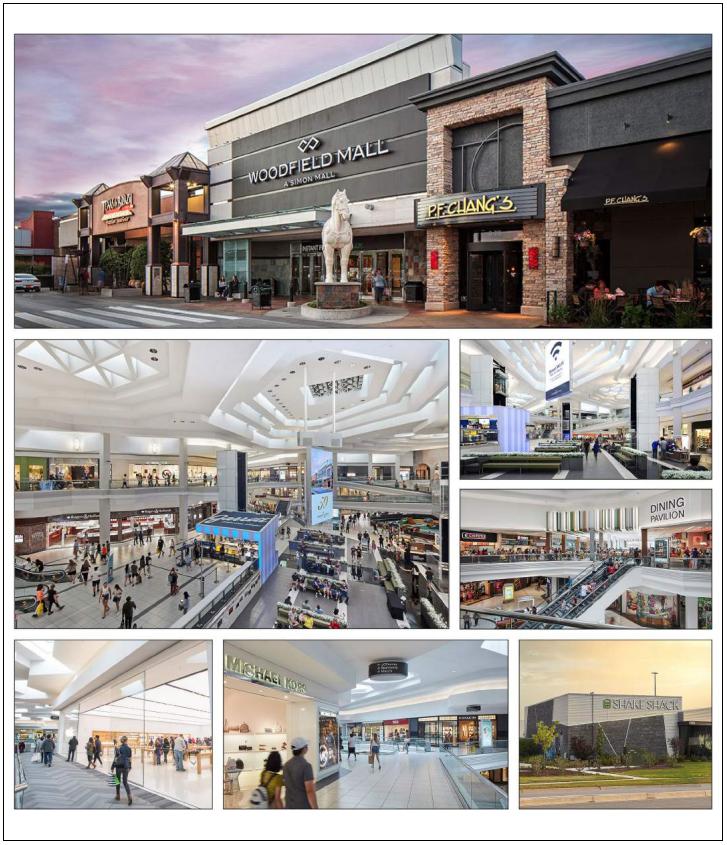
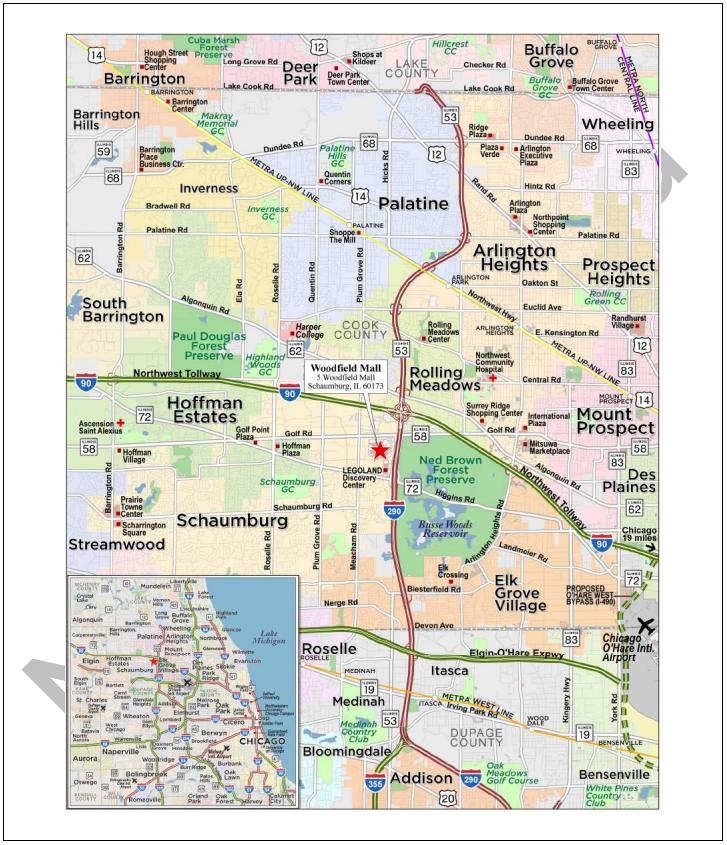
The Loan. The largest mortgage loan (the “Woodfield Mall Mortgage Loan”) is part of a whole loan (the “Woodfield Mall Whole Loan”) evidenced by 16 pari passu promissory notes in the aggregate original principal amount of $294,000,000. The Woodfield Mall Mortgage Loan is evidenced by two non-controlling notes which have an aggregate outstanding principal balance as of the Cut-off Date of $68,000,000. The Woodfield Mall Mortgage Loan will be included in the BMO 2023-C7 securitization trust and represent approximately 9.2% of the Initial Pool Balance. The Woodfield Mall Whole Loan was co-originated on November 21, 2023 by Bank of Montreal (“BMO”), Barclays Capital Real Estate Inc. (“Barclays”) and Bank of America, N.A. (“BANA”). The Woodfield Mall Whole Loan is secured by the borrower’s fee interest and leased fee interest in a portion of the super-regional mall (the “Woodfield Mall”) located in Schaumburg, Illinois (such portion of the mall securing the Woodfield Mall Whole Loan, the “Woodfield Mall Property”). The borrower owns the fee interest in the Woodfield Mall Property. The borrower ground leased a portion of the Woodfield Mall (the “Nordstrom Parcel”) to Nordstrom pursuant to the ground lease (the “Nordstrom Ground Lease”) between Nordstrom as ground lessor and the borrower as ground lessee. The Woodfield Mall Property collectively represents approximately 49.5% of the total 2,152,069 square feet of net rentable area at the Woodfield Mall (the “Total Mall NRA”).
The Woodfield Mall Whole Loan proceeds were used to refinance the existing debt on the Woodfield Mall Property, fund upfront reserves and pay origination costs. The Woodfield Mall Whole Loan accrues interest at a fixed rate of 6.85000% per annum. The table below summarizes the promissory notes that comprise the Woodfield Mall Whole Loan. The relationship between the holders of the Woodfield Mall Whole Loan is governed by a co-lender agreement as described under “Description of the Mortgage Pool—The Whole Loans—The Serviced Pari Passu Whole Loans” and “Description of the Mortgage Pool —The Whole Loans—The Outside Serviced Pari Passu Whole Loans” in the Preliminary Prospectus. The Woodfield Mall Whole Loan will be serviced pursuant to the pooling and servicing agreement for the BMO 2023-C7 trust.
The Property. The Woodfield Mall is a two- and three-story partially enclosed Class “A” super-regional mall, totaling 2,152,069 square feet on an approximately 133.05-acre site in Schaumburg, Illinois. Woodfield Mall was built in 1971 by Taubman Centers and expanded in 1995, and with renovations occurring in 2015, 2016 and 2018. The Woodfield Mall provides parking via 8,949 surface parking and parking garage spaces, resulting in a parking ratio of approximately 4.2 spaces per 1,000 square feet of Total Mall NRA. The Woodfield Mall Property consists of 1,064,590 square feet of net rentable area (approximately 49.5% of the Total Mall NRA).
As of November 14, 2023, the Woodfield Mall Property was 96.1% occupied by over 200 tenants (including temporary tenants, which occupy approximately 8.6% of the Woodfield Mall Property (the “Total Collateral NRA”)). No underwritten base rent is attributable to such temporary tenants. Approximately 47.8% of the Total Collateral NRA is occupied by 20 major tenants (each of which occupies 10,000 or more square feet of net rentable area) and one collateral anchor tenant (Nordstrom).
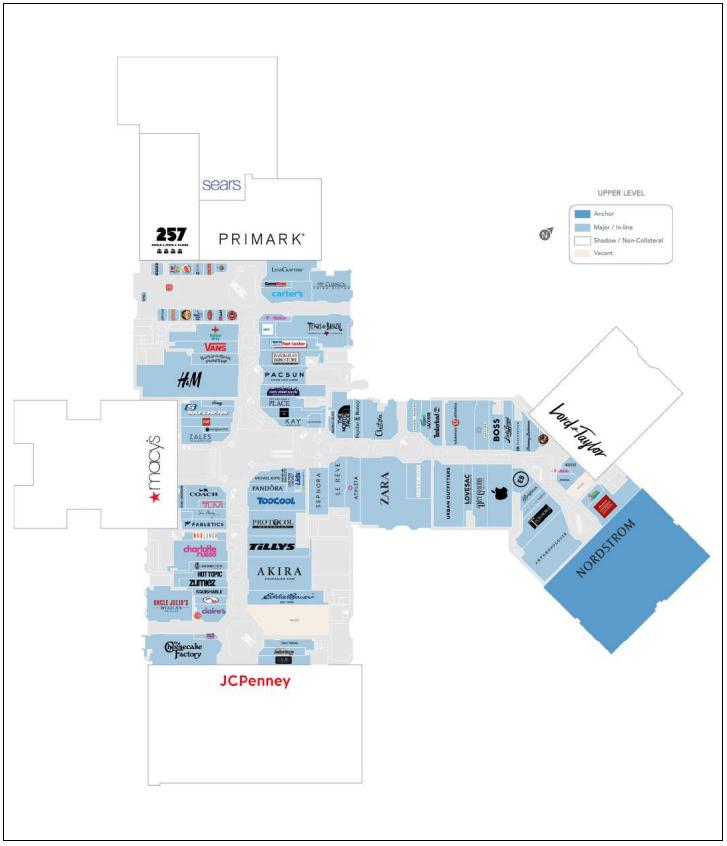
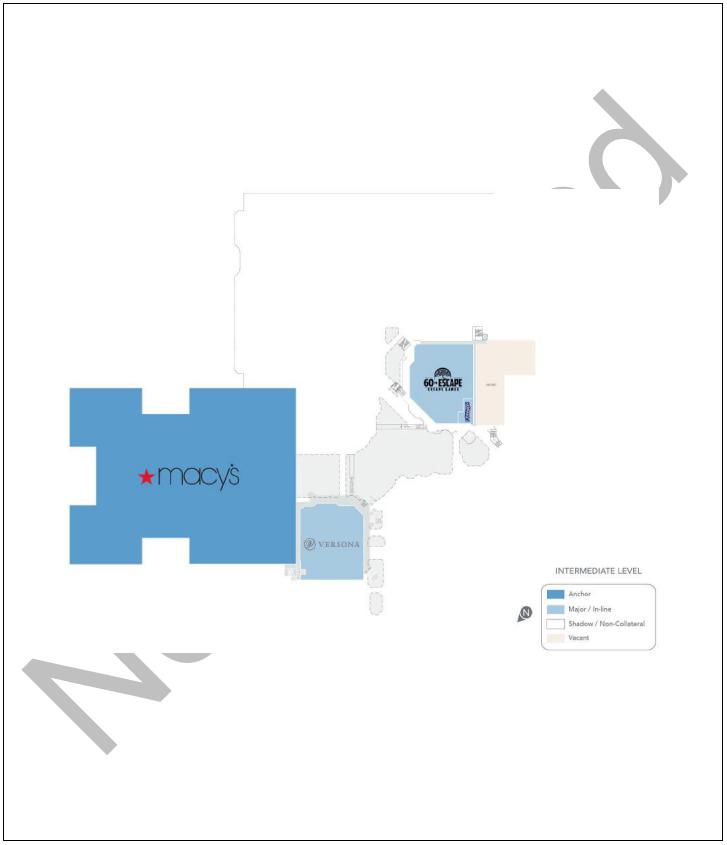
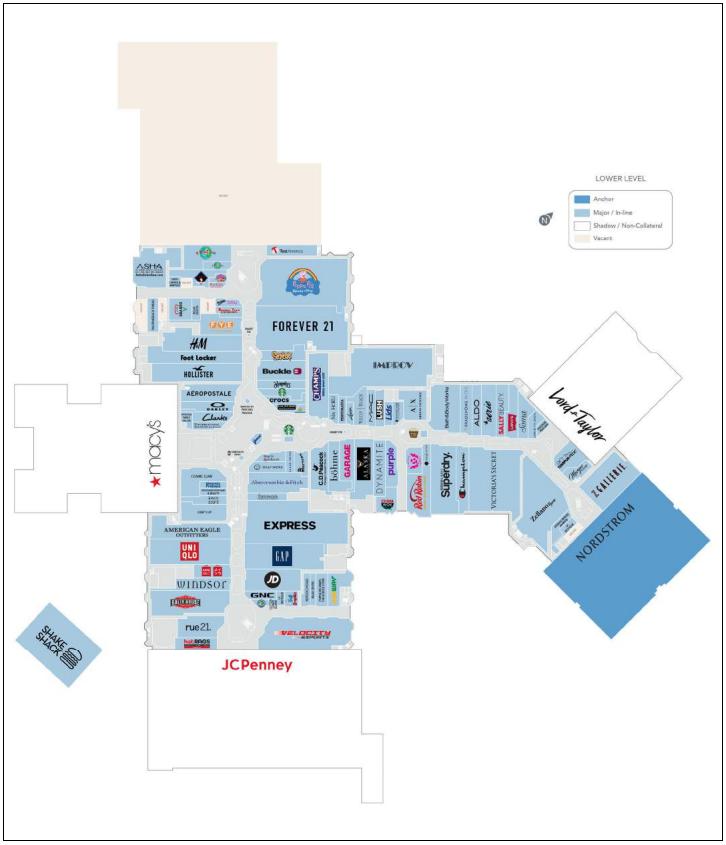
The portion of the Woodfield Mall occupied by six anchor tenants, namely Macy’s, J.C. Penney, Sears, Primark, Level 257 and Lord & Taylor (the “Non-Collateral Anchors”), representing approximately 50.5% of the Total Mall NRA, and is not part of the collateral securing the Woodfield Mall Mortgage Loan. As used in this term sheet, the term “Woodfield Mall Property” collectively refers to the portion of the mall securing the Woodfield Mall Whole Loan and does not include any portion of the mall owned and occupied by the Non-Collateral Anchors, and the term “Woodfield Mall” collectively refers to the entire mall including the portion of the mall occupied by the Non-Collateral Anchors that is not part of the collateral securing the Woodfield Mall Whole Loan. The information relating to the Woodfield Mall Property in this term sheet does not include any space occupied by the Non-Collateral Anchors, unless otherwise expressly stated herein.
The most recent expansion of the Woodfield Mall Property occurred in 1995, and such expansion included Nordstrom and the mall shops leading to Nordstrom. Renovations of the Woodfield Mall Property occurred in 2015, 2016 and 2018, with the most recent renovation involving a food court.
Major Tenants. The three largest tenants at the Woodfield Mall Property based on underwritten base rent are H&M, Zara and Victoria’s Secret/Pink.
H&M (27,320 square feet; 2.6% NRA; 6.1% of underwritten base rent): H&M Hennes & Mauritz (“H&M”) is a global retailer offering affordable apparel for men, women, and children. H&M was incorporated in 1947 and remains under the control of the family of founder Erling Persson. H&M group’s brands are H&M, H&M Home, COS, Weekday, Monki, & Other Stories, ARKET, Afound and Singular Society. As of 2022, H&M operated over 4,000 stores across 79 markets with approximately
| THE INFORMATION IN THIS STRUCTURAL AND COLLATERAL TERM SHEET IS NOT COMPLETE AND MAY BE AMENDED PRIOR TO THE TIME OF SALE. THIS TERM SHEET IS NOT AN OFFER TO SELL THESE SECURITIES AND IT IS NOT A SOLICITATION OF AN OFFER TO BUY THESE SECURITIES IN ANY JURISDICTION WHERE THE OFFER OR SALE IS NOT PERMITTED. |
| | 14 | |
Not Funded
| Structural and Collateral Term Sheet | | BMO 2023-C7 |
| No. 1 – Woodfield Mall |
150,000 employees. H&M has been a tenant at the Woodfield Mall Property since 2014 under a lease with an expiration date of January 31, 2029 and no renewal or termination options.
Victoria’s Secret/Pink (18,269 SF, 1.7% of NRA, 3.7% of underwritten base rent). Victoria’s Secret & Co. (“Victoria’s Secret/Pink”) is a Fortune 500 specialty retailer of modern, fashion-inspired collections including signature bras, panties, lingerie, casual sleepwear, athleisure and swim, as well as award-winning prestige fragrances and body care. Victoria’s Secret comprises two brands, Victoria’s Secret and PINK, founded in 1977 by Roy and Gaye Raymond. Victoria’s Secret employs over 30,000 associates across approximately 1,360 retail stores in approximately 70 countries. Victoria’s Secret has been a tenant at the Woodfield Mall Property since 2013 under a lease with an expiration date of January 31, 2028 and no renewal or termination options.
Zara (21,759 square feet; 2.0% NRA; 3.6% of underwritten base rent): Zara is a global clothing retailer having approximately 3,000 stores across 96 countries. Zara is the flagship brand of the Inditex Group. Inditex Group has a variety of brands including Zara, Pull&Bear, Massimo Dutti, Bershka, Stradivarius and Oysho Y Zara, located across 213 markets worldwide. The United States has 98 Inditex Group stores as of January 2019. Zara has been a tenant at the Woodfield Mall Property since 2015 under a lease with an expiration date of October 31, 2028 and no renewal or termination options.
The two largest tenants at the Woodfield Mall based on net rentable area are Macy’s (a Non-Collateral Anchor Tenant) and J.C. Penney (a Non-Collateral Anchor Tenant), and the largest tenant at the Woodfield Mall Property based on net rentable area is Nordstrom.
Nordstrom (200,000 square feet, 18.8% of Total Collateral NRA, 0.0% of underwritten base rent): Nordstrom (Moody’s/S&P/Fitch: Ba1/BB+/BBB-) was founded in 1901 as a retail shoe business in Seattle, Washington. Nordstrom offers an extensive selection of brand-name and private label merchandise for women, men, young adults and children focused on apparel, shoes, beauty, accessories and home goods. The Nordstrom Ground Lease at the Woodfield Mall Property has an original commencement date of March 3, 1995 and expiration date of March 2, 2025. The Nordstrom Ground Lease has seven, 10-year renewal options remaining. Nordstrom does not pay base rent.
Macy’s (Non-Collateral Anchor, 315,498 square feet, 0.0% of Total Collateral NRA, 0.0% of underwritten base rent): Founded in 1858 and headquartered in New York, New York, Macy’s (Moody’s/S&P/Fitch: Ba2/BB+/BBB-) is a department store chain that operates approximately 725 stores in the United States and Washington, D.C., as well as Guam and Puerto Rico. Macy’s has three banners that include Macy’s, bluemercury, and Bloomingdale’s (and accompanying e-commerce sites), that sell men's, women's, and children's apparel and accessories, cosmetics, and home furnishings, among other merchandise. Macy’s has a lease expiration date of December 31, 2050.
J.C. Penney (Non-Collateral Anchor, 288,550 square feet, 0.0% of Total Collateral NRA, 0.0% of underwritten base rent): Founded in 1902 and headquartered in Plano, Texas, J.C. Penney (Moody’s/S&P/Fitch: NR/NR/NR) is a department store chain with approximately 10,000 employees. J.C. Penney sells products including family apparel, footwear, accessories, fine and fashion jewelry, home furnishings, and beauty products through Sephora. J.C. Penney is an original tenant at the Woodfield Mall Property having been a tenant since October 10, 1971. J.C. Penney has a lease expiration date of December 31, 2050.
Appraisal. According to the appraisal, Woodfield Mall Property had an “as-is” appraised value of $694,000,000 as of October 27, 2023. The table below shows the appraiser’s “as-is” conclusions.
| Appraisal Valuation Summary(1) |
| Appraisal Approach | Appraised Value | Capitalization Rate(2) |
| Income Capitalization Approach | $694,000,000 | 6.00% |
| (2) | The appraiser used a discounted cash flow approach to arrive at the appraised value. The capitalization rates shown above represent the overall capitalization rate. |
Environmental. According to the Phase I environmental assessment dated November 7, 2023, there was no evidence of any recognized environmental conditions at the Woodfield Mall Property.
| THE INFORMATION IN THIS STRUCTURAL AND COLLATERAL TERM SHEET IS NOT COMPLETE AND MAY BE AMENDED PRIOR TO THE TIME OF SALE. THIS TERM SHEET IS NOT AN OFFER TO SELL THESE SECURITIES AND IT IS NOT A SOLICITATION OF AN OFFER TO BUY THESE SECURITIES IN ANY JURISDICTION WHERE THE OFFER OR SALE IS NOT PERMITTED. |
| | 15 | |
Not Funded
| Structural and Collateral Term Sheet | | BMO 2023-C7 |
| No. 1 – Woodfield Mall |
The following table presents certain information relating to the historical occupancy of the Woodfield Mall Property:
| Historical and Current Occupancy |
| 2020(1) | 2021(1) | 2022(1) | Current(2) |
| 91.0% | 93.0% | 95.0% | 96.1% |
| (1) | Historical Occupancies are as of December 31 of each respective year and include temporary tenants. Occupancy does not include net rentable area for Non-Collateral Anchor Tenants. |
| (2) | Based on the underwritten rent roll dated November 14, 2023. Current occupancy of the in-line tenants less than 10,000 square feet is 95.2% |
The following table presents certain information relating to the major tenants based on the net rentable area of the Woodfield Mall:
| Top Tenant Summary(1) |
| Tenant | Ratings
Moody’s/S&P/Fitch(2) | Total Mall NRA (SF) | % of
Total Collateral NRA(3) | UW Base Rent PSF(1) | UW Base Rent(1) | % of Total
UW Base Rent(1) | TTM September 2023 Sales $(4) | Sales PSF(4) | Occ Cost | Lease
Expiration Date |
| Non-Collateral Anchor Tenants | | | | | | | | | | |
| Macy's | Ba2/BB+/BBB- | 315,498 | NAP | | $0.00 | $0 | 0.0 | % | $45,400,000 | $144 | NAV | 12/31/2050 |
| J.C. Penney(5) | NR/NR/NR | 288,550 | NAP | | $0.00 | 0 | 0.0 | | $16,500,000 | $57 | 3.6% | 12/31/2050 |
| Sears(6) | NR/NR/NR | 272,678 | NAP | | $0.00 | 0 | 0.0 | | NAV | NAV | NAV | 12/31/2050 |
| Primark(6) | NR/NR/NR | 50,000 | NAP | | $0.00 | 0 | 0.0 | | NAV | NAV | NAV | NAV |
| Level 257(6) | NR/NR/NR | 42,094 | NAP | | $0.00 | 0 | 0.0 | | NAV | NAV | NAV | NAV |
| Lord & Taylor(5) | NR/NR/NR | 118,659 | NAP | | $0.00 | 0 | 0.0 | | NAV | NAV | NAV | 12/31/2050 |
| Non-Collateral Anchor Tenants Subtotal / Wtd. Avg. | | 1,087,479 | NAP | | $0.00 | $0 | 0.0 | % | | | | |
| Collateral Anchor Tenant | | | | | | | | | | |
| Nordstrom | Ba1/BB+/BBB- | 200,000 | 18.8 | % | $0.00 | $0 | 0.0 | % | $17,037,470 | $85 | NAV | 03/02/2025 |
| Major Tenants | | | | | | | | | | |
| H&M | NR/NR/NR | 27,320 | 2.6 | % | $82.62 | 2,257,171 | 6.1 | $10,374,930 | $379.76 | 21.9% | 01/31/2029 |
| Victoria's Secret/Pink | NR/NR/NR | 18,269 | 1.7 | | $75.00 | 1,370,175 | 3.7 | $11,569,094 | $633.26 | 20.9% | 01/31/2028 |
| Zara | NR/NR/NR | 21,759 | 2.0 | | $61.59 | 1,340,243 | 3.6 | $16,127,709 | $741.20 | 9.3% | 10/31/2028 |
| Express/Express Men | NR/NR/NR | 20,176 | 1.9 | | $57.84 | 1,166,913 | 3.2 | $5,307,887 | $263.08 | 24.1% | 04/30/2029 |
| Cheesecake Factory | NR/NR/NR | 11,879 | 1.1 | | $67.80 | 805,432 | 2.2 | $13,685,994 | $1,152.12 | 7.8% | 01/31/2026 |
| Urban Outfitters | NR/NR/NR | 10,775 | 1.0 | | $66.63 | 717,884 | 1.9 | NAV | NAV | NAV | 08/31/2033 |
| The Gap/Gap Kids | NR/NR/NR | 11,202 | 1.1 | | $57.43 | 643,379 | 1.7 | $2,409,049 | $215.06 | 29.1% | 01/31/2027 |
| Hollister Co. | NR/NR/NR | 9,210 | 0.9 | | $65.83 | 606,304 | 1.6 | $6,343,726 | $688.79 | 20.0% | 01/31/2024 |
| Velocity Esports | NR/NR/NR | 15,360 | 1.4 | | $35.81 | 550,000 | 1.5 | NAV | NAV | NAV | 05/31/2036 |
| Uniqlo | NR/NR/NR | 11,384 | 1.1 | | $47.54 | 541,216 | 1.5 | $9,919,451 | $871.35 | 8.5% | 01/31/2029 |
| Major Tenants Subtotal / Wtd. Avg. | | 157,334 | 14.8 | % | $63.55 | $9,998,717 | 27.1 | % | | | | |
| Remaining Occupied | | 665,850 | 62.5 | % | $40.33 | $26,855,145 | 72.9 | % | | | | |
| Occupied Collateral Total | | 1,023,184 | 96.1 | % | $36.02 | $36,853,862 | 100.0 | % | | | | |
| Vacant | | 41,406 | 3.9 | | | | | | | | |
| Collateral Total / Wtd. Avg. | | 1,064,590 | 100.0 | % | | $36,853,862 | 100.0 | % | | | | |
| | | | | | | | | | | |
| Collateral + Non Collateral Total | | 2,152,069 | 100.0 | % | | | | | | | |
| | | | | | | | | | | |
| (1) | Based on the underwritten rent roll dated November 14, 2023 inclusive of rent steps through November 30, 2024. |
| (2) | In certain instances, ratings provided are those of the parent company of the entity shown, whether or not the parent company guarantees the lease. |
| (3) | % of Total Collateral NRA refers only to the Woodfield Mall Property and does not include the portion of the Woodfield Mall occupied by the Non-Collateral Anchors. |
| (4) | All information regarding sales and occupancy costs presented in this termsheet with respect to the Woodfield Mall is based upon information provided by the borrower sponsor. In certain instances, sales figures represent estimates because the tenants are not required to report, or otherwise may not have reported, sales information on a timely basis. Further, because sales are self-reported, such information is not independently verified by the borrower sponsor. Sales are as of the 12 months ended September 2023. |
| (5) | J.C. Penney and Lord & Taylor do not pay rent but pay certain reimbursements. |
| (6) | Sears has subleased 50,000 square feet to Primark, and 42,094 square feet to Level 257. |
| THE INFORMATION IN THIS STRUCTURAL AND COLLATERAL TERM SHEET IS NOT COMPLETE AND MAY BE AMENDED PRIOR TO THE TIME OF SALE. THIS TERM SHEET IS NOT AN OFFER TO SELL THESE SECURITIES AND IT IS NOT A SOLICITATION OF AN OFFER TO BUY THESE SECURITIES IN ANY JURISDICTION WHERE THE OFFER OR SALE IS NOT PERMITTED. |
| | 16 | |
Not Funded
| Structural and Collateral Term Sheet | | BMO 2023-C7 |
| No. 1 – Woodfield Mall |
The following table presents certain information relating to the tenant sales of the Woodfield Mall Property:
| Comparable In-line Sales(1) |
| Tenants < 10,000 SF | 2019 | 2020(2) | 2021 | 2022 | TTM September 2023 |
| Gross Mall Sales | $274,505,000 | NAP | $269,467,000 | $269,130,000 | $294,883,000 |
| Gross Mall Sales (Ex-Apple) | $220,566,000 | NAP | $240,722,000 | $233,070,000 | $256,280,000 |
| Sales PSF (Inline < 10,000 SF) | $726 | NAP | $755 | $807 | $820 |
| Sales PSF (Inline < 10,000 SF, Ex-Apple) | $597 | NAP | $691 | $717 | $730 |
| Occupancy Cost (Inline < 10,000 SF)(3) | 17.4% | NAP | 16.6% | 15.4% | 14.7% |
| Occupancy Cost (Inline < 10,000 SF, Ex-Apple)(3) | 21.2% | NAP | 18.2% | 17.3% | 16.5% |
| (1) | All information regarding sales and occupancy costs presented herein with respect to the Woodfield Mall Property is based upon information provided by the borrower sponsor. In certain instances, sales figures represent estimates because the tenants are not required to report, or otherwise may not have reported sales information on a timely basis. Further, because sales are self-reported, such information is not independently verified by the borrower sponsor. |
| (2) | The Woodfield Mall Property was closed due to the COVID-19 pandemic through a portion of 2022. |
| (3) | Occupancy Cost is calculated by the sum of base rents, percentage rents and all expense recoveries divided by annual sales. |
The following table presents certain information relating to the major tenant sales of the Woodfield Mall:
| Major Tenant Sales by Type(1) |
| Tenant Name | 2019 | 2020(2) | 2021 | 2022 | TTM September 2023 |
| Macy's(3) | $51,000,000 | $28,100,000 | $45,900,000 | $45,400,000 | $45,400,000 |
| Nordstrom | $53,600,000 | $37,500,000 | $40,100,000 | $42,000,000 | $42,000,000 |
| J.C. Penney(3) | $21,900,000 | $13,700,000 | $15,100,000 | $16,500,000 | $16,500,000 |
| Department Stores | $126,500,000 | $79,300,000 | $101,100,000 | $103,900,000 | $103,900,000 |
In-Line Tenants | $337,753,000 | $210,500,000 | $353,998,000 | $362,968,000 | $380,594,000 |
| Apple | $53,939,000 | $21,311,000 | $28,745,000 | $36,060,000 | $38,603,000 |
| Total Woodfield Mall | $518,192,000 | $311,111,000 | $483,843,000 | $502,928,000 | $523,097,000 |
| (1) | All sales information presented herein with respect to the Woodfield Mall Property is based upon information provided by the borrower sponsor. In certain instances, sales figures represent estimates because the tenants are not required to report, or otherwise may not have reported sales information on a timely basis. Further, because sales are self-reported, such information is not independently verified by the borrower sponsor. |
| (2) | The Woodfield Mall Property was closed due to the COVID-19 pandemic through a portion of 2022. |
| (3) | Macy’s and J.C. Penney are Non-Collateral Anchors. |
| THE INFORMATION IN THIS STRUCTURAL AND COLLATERAL TERM SHEET IS NOT COMPLETE AND MAY BE AMENDED PRIOR TO THE TIME OF SALE. THIS TERM SHEET IS NOT AN OFFER TO SELL THESE SECURITIES AND IT IS NOT A SOLICITATION OF AN OFFER TO BUY THESE SECURITIES IN ANY JURISDICTION WHERE THE OFFER OR SALE IS NOT PERMITTED. |
| | 17 | |
Not Funded
| Structural and Collateral Term Sheet | | BMO 2023-C7 |
| No. 1 – Woodfield Mall |
The following table presents certain information relating to the tenant lease expirations at the Woodfield Mall Property:
| Lease Rollover Schedule(1)(2) |
| Year | Number of Leases Expiring | Net Rentable Area Expiring | % of NRA Expiring | UW Base Rent Expiring(3) | % of UW Base Rent Expiring(3) | Cumulative Net Rentable Area Expiring | Cumulative % of NRA Expiring | Cumulative UW Base Rent Expiring(3) | Cumulative % of UW Base Rent Expiring(3) |
| Vacant | NAP | 41,406 | 3.9 | % | NAP | NA | P | 41,406 | | 3.9% | NAP | NA | P |
| 2023 & MTM | 7 | 21,886 | 2.1 | | $1,181,355 | 3.2 | % | 63,292 | | 6.0% | $1,181,355 | 3.2% | |
| 2024 | 25 | 78,764 | 7.4 | | 4,516,592 | 12.3 | | 142,056 | | 13.3% | $5,697,946 | 15.5% | |
| 2025 | 23 | 265,320 | 24.9 | | 3,242,897 | 8.8 | | 407,376 | | 38.3% | $8,940,844 | 24.3% | |
| 2026 | 38 | 144,818 | 13.6 | | 6,168,658 | 16.7 | | 552,194 | | 51.9% | $15,109,502 | 41.0% | |
| 2027 | 18 | 57,775 | 5.4 | | 3,089,980 | 8.4 | | 609,969 | | 57.3% | $18,199,482 | 49.4% | |
| 2028 | 18 | 80,709 | 7.6 | | 5,357,144 | 14.5 | | 690,678 | | 64.9% | $23,556,626 | 63.9% | |
| 2029 | 20 | 105,967 | 10.0 | | 6,255,091 | 17.0 | | 796,645 | | 74.8% | $29,811,716 | 80.9% | |
| 2030 | 7 | 28,745 | 2.7 | | 1,479,397 | 4.0 | | 825,390 | | 77.5% | $31,291,113 | 84.9% | |
| 2031 | 4 | 7,102 | 0.7 | | 395,209 | 1.1 | | 832,492 | | 78.2% | $31,686,322 | 86.0% | |
| 2032 | 5 | 18,655 | 1.8 | | 614,059 | 1.7 | | 851,147 | | 80.0% | $32,300,381 | 87.6% | |
| 2033 | 14 | 43,869 | 4.1 | | 2,661,904 | 7.2 | | 895,016 | | 84.1% | $34,962,285 | 94.9% | |
| 2034 | 7 | 39,914 | 3.7 | | 1,041,577 | 2.8 | | 934,930 | | 87.8% | $36,003,862 | 97.7% | |
| 2035 & Beyond | 2 | 38,323 | 3.6 | | 850,000 | 2.3 | | 973,253 | | 91.4% | $36,853,862 | 100.0% | |
| Temporary Tenants | 24 | 91,337 | 8.6 | | 0 | 0.0 | | 1,064,590 | | 100.0% | $36,853,862 | 100.0% | |
| Total Collateral | 212 | 1,064,590 | 100.0 | % | $36,853,862 | 100.0 | % | | | | |
| (1) | Based on the underwritten rent roll dated November 14, 2023. |
| (2) | Certain leases may have termination options that are exercisable prior to the originally stated expiration date of the lease and that are not considered in this Lease Rollover Schedule. |
| (3) | UW Base Rent Expiring, % of UW Base Rent Expiring and Cumulative UW Base Rent Expiring and Cumulative % of UW Base Rent Expiring include contractual rent steps through November 2024. |
| THE INFORMATION IN THIS STRUCTURAL AND COLLATERAL TERM SHEET IS NOT COMPLETE AND MAY BE AMENDED PRIOR TO THE TIME OF SALE. THIS TERM SHEET IS NOT AN OFFER TO SELL THESE SECURITIES AND IT IS NOT A SOLICITATION OF AN OFFER TO BUY THESE SECURITIES IN ANY JURISDICTION WHERE THE OFFER OR SALE IS NOT PERMITTED. |
| | 18 | |
Not Funded
| Structural and Collateral Term Sheet | | BMO 2023-C7 |
| No. 1 – Woodfield Mall |
The following table presents certain information relating to the operating history and underwritten cash flows of the Woodfield Mall Property:
| Operating History and Underwritten Net Cash Flow |
| | 2019 | 2020 | 2021 | 2022 | 10/31/2023 TTM(1) | Underwritten | Per Square Foot(2) | %(3) |
| Rents in Place | $41,174,170 | $37,184,667 | $34,297,836 | $31,325,141 | $31,995,485 | $36,145,721 | $33.95 | | 46.2 | % |
| Rent Steps | 0 | 0 | 0 | 0 | 0 | 708,141 | 0.67 | | 0.9 | |
| Percent in Lieu | 445,565 | 1,229,560 | 2,406,499 | 2,469,287 | 2,347,073 | 1,409,551 | 1.32 | | 1.8 | |
| Percent Rent | 811,987 | 341,531 | 3,278,507 | 4,355,569 | 4,441,146 | 4,032,529 | 3.79 | | 5.2 | |
| Vacant Income(4) | 0 | 0 | 0 | 0 | 0 | 3,244,349 | 3.05 | | 4.1 | |
| Gross Potential Rent | $42,431,722 | $38,755,758 | $39,982,842 | $38,149,997 | $38,783,704 | $45,540,290 | $42.78 | | 58.2 | % |
| Total Reimbursements | 35,104,199 | 23,802,491 | 25,870,805 | 28,065,713 | 26,816,583 | 26,220,282 | 24.63 | | 33.5 | |
| Temporary Tenants | 4,396,324 | 2,837,003 | 4,433,113 | 4,598,726 | 4,329,039 | 4,329,039 | 4.07 | | 5.5 | |
| Other Rents | 236,767 | 176,161 | 230,481 | 219,885 | 275,155 | 275,155 | 0.26 | | 0.4 | |
| Media Income | 1,309,770 | 709,843 | 1,251,746 | 1,471,910 | 1,480,496 | 1,480,496 | 1.39 | | 1.9 | |
| Lease Settlement Income | 472,562 | 909,740 | 1,585,822 | 1,797,721 | 304,962 | 0 | 0.00 | | 0.0 | |
| Deferred Rent | 485,119 | 12,837 | 0 | 170,470 | 0 | 0 | 0.00 | | 0.0 | |
| Other Income | 617,296 | 533,957 | 348,322 | 391,178 | 428,248 | 428,248 | 0.40 | | 0.5 | |
| Net Rental Income | $85,053,759 | $67,737,790 | $73,703,131 | $74,865,600 | $72,418,187 | $78,273,510 | $73.52 | | 100.0 | % |
| (Vacancy/Credit Loss)(5) | 0 | 0 | 0 | 0 | 0 | (3,244,349) | (3.05) | | (4.1 | ) |
| Effective Gross Income | $85,053,759 | $67,737,790 | $73,703,131 | $74,865,600 | $72,418,187 | $75,029,161 | $70.48 | | 95.9 | % |
| Total Expenses(6) | 34,048,763 | 40,191,262 | 36,473,501 | 38,359,447 | 35,940,556 | 32,816,238 | 30.83 | | 43.7 | |
| Net Operating Income | $51,004,996 | $27,546,528 | $37,229,630 | $36,506,153 | $36,477,631 | $42,212,924 | $39.65 | | 56.3 | % |
| Capital Expenditures | 0 | 0 | 0 | 0 | 0 | 195,077 | 0.18 | | 0.3 | |
| TI/LC | 0 | 0 | 0 | 0 | 0 | 864,590 | 0.81 | | 1.2 | |
| Net Cash Flow | $51,004,996 | $27,546,528 | $37,229,630 | $36,506,153 | $36,477,631 | $41,153,257 | $38.66 | | 54.8 | % |
| (1) | 10/31/2023 TTM reflects the trailing 12-month period ending October 31, 2023. Contractual rent steps are through November 2024. |
| (2) | Per Square Foot is calculated using the Total Collateral NRA. |
| (3) | % column represents percent of Net Rental Income for all revenue lines and represents percent of Effective Gross Income for the remainder of fields. |
| (4) | Vacant Income reflects the gross up of vacancy at average in-place rents. |
| (5) | The underwritten economic occupancy is 95.5%. The Woodfield Mall Property was 96.1% leased based on the November 14, 2023 underwritten rent roll, including leases executed by the origination date. |
| (6) | The management fee is underwritten to reflect 4.00% of below market rate, temporary and overage rents, capped at $1,000,000. Real estate taxes were underwritten based on the actual tax bills for all of the property tax parcels at the Woodfield Mall Property (including the Nordstrom Parcel), inclusive of any tax reimbursements. |
The Market. The Woodfield Mall Property is located in Schaumburg, Illinois, within the Chicago-Naperville-Elgin, IL-IN-WI core-based statistical area (the “Chicago CBSA”). Chicago is a major Great Lakes port and is considered the commercial, financial, industrial, and cultural center of the midwestern United States. The region surrounding Chicago is a major warehouse and distribution hub, supported by its comprehensive network of highway, water, rail, and air routes. The trade, transportation and utilities sector dominates Chicago CBSA as the largest employment sector with roughly 20.5% of the regional workforce.
The Woodfield Mall Property is located in Schaumburg, Illinois and is easily accessible from both Chicago and its surrounding suburbs. The Woodfield Mall Property is situated in the northwest Chicago suburb and is considered a desirable position within the Chicago MSA due to its proximity to the densely populated residential areas that surround the area and its easy access to both I-90 and I-290. Uses in the immediate area generally include a mixture of commercial, residential, hotel, and office. The Woodfield Mall Property is located approximately 27 miles from the central business district of Chicago. The O'Hare International Airport is located approximately 13 miles away from the Woodfield Mall Property. Public transit options are also readily available, with the Schaumburg Metra station providing a convenient train connection to Chicago. Additionally, Pace buses service the area, ensuring accessibility for those without personal vehicles.
| THE INFORMATION IN THIS STRUCTURAL AND COLLATERAL TERM SHEET IS NOT COMPLETE AND MAY BE AMENDED PRIOR TO THE TIME OF SALE. THIS TERM SHEET IS NOT AN OFFER TO SELL THESE SECURITIES AND IT IS NOT A SOLICITATION OF AN OFFER TO BUY THESE SECURITIES IN ANY JURISDICTION WHERE THE OFFER OR SALE IS NOT PERMITTED. |
| | 19 | |
Not Funded
| Structural and Collateral Term Sheet | | BMO 2023-C7 |
| No. 1 – Woodfield Mall |
Schaumburg is home to 10 industrial parks, including 13.2 million square feet of space in over 400 facilities, 67 shopping centers totaling more than 9.5 million square feet of space, and 12.1 million square feet of office space spread throughout more than 90 buildings. Additional economic activity is generated by the Renaissance Schaumburg Hotel & Convention Center, with an additional 25 hotels supporting the community. The area is also home to numerous office complexes, including Two Century Centre, an office complex north of the Woodfield Mall Property, past Golf Road (Illinois Route 58), and east of N. Roosevelt Boulevard. In addition, the neighborhood is scattered with car dealerships, fast food chains, and gas stations.
According to the appraisal, the 2022 population within a 5-, 10- and 15-mile radius of the Woodfield Mall Property was 270,430, 949,592 and 2,109,255, respectively. Additionally, for the same time period, the average household income within the same radii was $119,090, $119,024 and $124,631, respectively.
According to the appraisal, the Woodfield Mall Property is located within the Chicago retail market and the Far Northwest retail submarket. As of the second quarter of 2023, the Chicago retail market contains 106,053,000 square feet of space and the overall vacancy rate was 12.7%, which is a decrease from 12.8% in 2018. As of the second quarter of 2023, the Far Northwest retail submarket contained approximately 6.9 million square feet of retail space inventory with a vacancy rate of 11.5% and an average asking rental rate of $18.20 per square foot.
| THE INFORMATION IN THIS STRUCTURAL AND COLLATERAL TERM SHEET IS NOT COMPLETE AND MAY BE AMENDED PRIOR TO THE TIME OF SALE. THIS TERM SHEET IS NOT AN OFFER TO SELL THESE SECURITIES AND IT IS NOT A SOLICITATION OF AN OFFER TO BUY THESE SECURITIES IN ANY JURISDICTION WHERE THE OFFER OR SALE IS NOT PERMITTED. |
| | 20 | |
Not Funded
| Structural and Collateral Term Sheet | | BMO 2023-C7 |
| No. 1 – Woodfield Mall |
The following table presents certain information relating to comparable retail centers for the Woodfield Mall Property:
| Competitive Retail Center Summary(1) |
| Property Name/Location | Year Built / Renovated or Expanded | Total NRA (SF) | Total Occupancy | Distance to Subject | Sales PSF | Major Tenants |
Woodfield Mall 5 Woodfield Mall Schaumburg, IL | 1971, 1995 / 2015, 2016, 2018 | 1,064,590(2)(3) | 96.1% | NAP | $730(2) | Macy’s J.C. Penney Nordstrom Sears Lord & Taylor Primark Level 257 |
Streets of Woodfield 601 N Martingale Road Schaumburg, IL | 1991, 1993, 1997, 2009 / 2000 | 692,549 | 96.0% | 0.6 miles | NAV | Dick’s Sporting Goods RH Outlet AMC Loews (20 Screens) Whole Foods Crate & Barrel |
The Arboretum of South Barrington 100 W Higgins Road South Barrington, IL | 2007-2008, 2016, 2018, 2019, 2022 / NAP | 484,409 | 83.0% | 8.1 miles | NAV | L.L. Bean Star Cinema Grill Pinstripes DSW Arhaus |
Fashion Outlets of Chicago 5220 Fashion Outlets Way Rosemont, IL | 2013 / NAP | 538,735 | 99.0% | 12.9 miles | $1,036 | Forever 21 Nike Nordstrom rack Polo Ralph Lauren Bloomingdale’s Outlet Saks Fifth Avenue Off 5th |
Oakbrook Center 100 Oakbrook Center Oak Brook, IL | 1962, 2016, 2017, 2021 / 2014 | 1,886,885 | 92.0% | 15.3 miles | $1,326; $1,129 (Ex-Apple) | Macy’s Nordstrom Neiman Marcus AMC Theater (12 Screens) Crate & Barrel |
Westfield Old Orchard 4905 Old Orchard Center Skokie, IL | 1956 / 2022-2023 | 1,508,431 | 91.0% | 15.5 miles | $902; $830 (Ex-Apple) | Macy’s Nordstrom Bloomie’s Cinemex Crate & Barrel |
Northbrook Court 1515 Lake Cook Road Northbrook, IL | 1976 / 1996 | 1,014,506 | 92.0% | 19.2 miles | $833; $705 (Ex-Apple) | Neiman Marcus AMC (14 Screens) Crate & Barrel Forever 21 Gap |
Chicago Ridge Mall 444 Ridgeland Avenue Chicago Ridge, IL | 1981 / 2004 | 832,350 | 73.0% | 30.3 miles | $629 | Kohl’s Dick’s Sporting Goods AMC Theater (6 Screens) Michaels ALDI Old Navy Forever 21 |
| (1) | Source: Appraisal, unless stated otherwise. |
| (2) | Represents sales per square foot as of the 12 months ended September 2023 for in-line tenants (excluding Apple). |
| (3) | Total NRA (SF) includes only the Total Collateral NRA. |
The Borrower. The borrower for the Woodfield Mall Whole Loan is Woodfield Mall LLC, a single purpose entity with two independent directors. Legal counsel to the borrower delivered a non-consolidation opinion in connection with the origination of the Woodfield Mall Whole Loan.
The Borrower Sponsors. The borrower sponsors and non-recourse carveout guarantors of the Woodfield Mall Whole Loan are International Mall Investors LLC (“IMI”) and Simon Property Group, L.P. (“Simon”). The Woodfield Mall Property ownership is a joint venture between IMI and Simon, with each owning 50%.
| THE INFORMATION IN THIS STRUCTURAL AND COLLATERAL TERM SHEET IS NOT COMPLETE AND MAY BE AMENDED PRIOR TO THE TIME OF SALE. THIS TERM SHEET IS NOT AN OFFER TO SELL THESE SECURITIES AND IT IS NOT A SOLICITATION OF AN OFFER TO BUY THESE SECURITIES IN ANY JURISDICTION WHERE THE OFFER OR SALE IS NOT PERMITTED. |
| | 21 | |
Not Funded
| Structural and Collateral Term Sheet | | BMO 2023-C7 |
| No. 1 – Woodfield Mall |
Property Management. The Woodfield Mall Property is managed by Simon Management Associates, LLC, an affiliate of the borrower sponsor.
Escrows and Reserves. At origination, the borrower was required to deposit into escrow (i) approximately $[5,449,975] for outstanding tenant improvement allowances and leasing commissions identified in a schedule to the related loan agreement, (ii) approximately $[638,391] for a gap rent reserve and (iii) approximately $[964,731] for a free rent reserve.
Tax Escrows – During the continuance of a Lockbox Event (as defined below), the borrower is required to escrow 1/12th of the annual estimated tax payments on a monthly basis.
Insurance Escrows – During the continuance of a Lockbox Event, the borrower is required to escrow 1/12th of the annual estimated insurance payments on a monthly basis, except if the Woodfield Mall Property is insured under a blanket policy meeting the requirements set forth in the related loan agreement (in which case, no insurance escrows will be required, notwithstanding the occurrence of a Lockbox Event).
Replacement Reserves – During the continuance of a Lockbox Event, the borrower is required to escrow approximately $[__].
Rollover Reserve – During the continuance of a Lockbox Event, the borrower is required to escrow an amount equal $[___] for lease rollover reserves.
Lockbox / Cash Management. The Woodfield Mall Whole Loan is structured with a hard lockbox and springing cash management. The borrower and property manager are required to direct the tenants to pay rent directly into the lockbox account, and to deposit any rents otherwise received in such account within two business days after receipt. So long as no Lockbox Event (as defined below) has occurred and is continuing, the borrower will have access to the funds in the lockbox account and may use the lockbox account as an operating account. During the continuance of a Lockbox Event, all funds in the lockbox account are required to be swept on a weekly basis to a lender-controlled cash management account. Funds in the cash management account are required to be applied to debt service and the reserves and escrows described above, with any excess funds (i) to be deposited into the TI/LC reserve, if the Lockbox Event is caused by a Tenant Trigger Event, or into an excess cash flow reserve account held by the lender as cash collateral for the Woodfield Mall Whole Loan, if the Lockbox Event is not solely caused by a Tenant Trigger Event, or if (ii) no Lockbox Event is continuing, disbursed to the borrower.
A “Lockbox Event” means the period commencing upon the occurrence of (i) an event of default, (ii) a bankruptcy action of the borrower or property manager, or (iii) a Debt Yield Trigger Event (as defined below). A Lockbox Event will end (a) with respect to the matters described in clause (i) above, if the event of default has been waived by the lender, (b) with respect to the matters described in clause (ii) above, if the applicable property manager is replaced within 60 days or the bankruptcy action is dismissed within 90 days without any adverse consequences to the Woodfield Mall Property, or (c) with respect to matters described in clause (iii) above, a cure of the Debt Yield Trigger Event occurs. A Lockbox Event may not be cured more than five times during the term of the Woodfield Mall Whole Loan
A “Debt Yield Trigger Event” will occur if as of any date of determination, the debt yield based on the trailing four calendar quarter period is less than 10.0% for two consecutive calendar quarters and will be cured upon the debt yield being greater than or equal to 10.0% for two consecutive calendar quarters.
Subordinate Debt. None. However, the borrower is permitted to obtain property assessed clean energy (PACE) or similar loans in an aggregate amount up to $5 million subject to lender’s approval.
Mezzanine Debt. None.
Partial Release. Not permitted.
Ground Lease. None.
| THE INFORMATION IN THIS STRUCTURAL AND COLLATERAL TERM SHEET IS NOT COMPLETE AND MAY BE AMENDED PRIOR TO THE TIME OF SALE. THIS TERM SHEET IS NOT AN OFFER TO SELL THESE SECURITIES AND IT IS NOT A SOLICITATION OF AN OFFER TO BUY THESE SECURITIES IN ANY JURISDICTION WHERE THE OFFER OR SALE IS NOT PERMITTED. |
| | 22 | |
| Structural and Collateral Term Sheet | | BMO 2023-C7 |
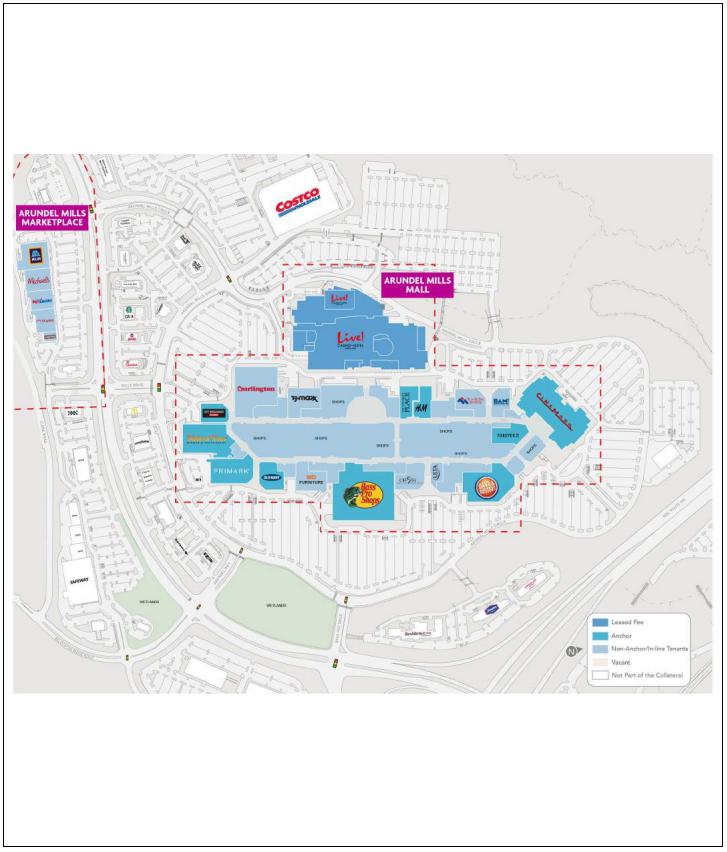
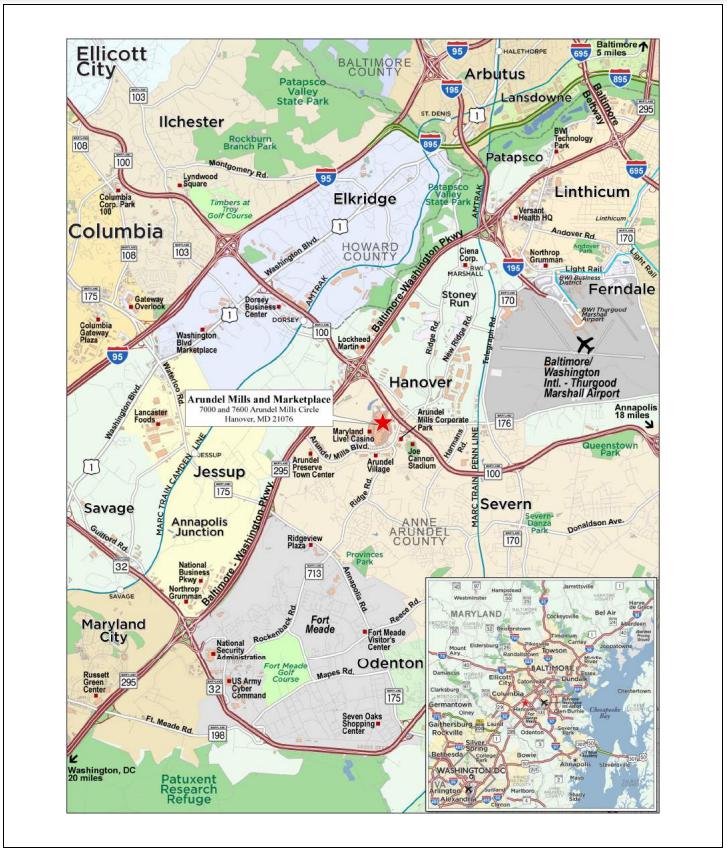
| No. 2 – Arundel Mills and Marketplace |

| THE INFORMATION IN THIS STRUCTURAL AND COLLATERAL TERM SHEET IS NOT COMPLETE AND MAY BE AMENDED PRIOR TO THE TIME OF SALE. THIS TERM SHEET IS NOT AN OFFER TO SELL THESE SECURITIES AND IT IS NOT A SOLICITATION OF AN OFFER TO BUY THESE SECURITIES IN ANY JURISDICTION WHERE THE OFFER OR SALE IS NOT PERMITTED. |
| | 23 | |
| Structural and Collateral Term Sheet | | BMO 2023-C7 |
| No. 2 – Arundel Mills and Marketplace |
| THE INFORMATION IN THIS STRUCTURAL AND COLLATERAL TERM SHEET IS NOT COMPLETE AND MAY BE AMENDED PRIOR TO THE TIME OF SALE. THIS TERM SHEET IS NOT AN OFFER TO SELL THESE SECURITIES AND IT IS NOT A SOLICITATION OF AN OFFER TO BUY THESE SECURITIES IN ANY JURISDICTION WHERE THE OFFER OR SALE IS NOT PERMITTED. |
| | 24 | |
| Structural and Collateral Term Sheet | | BMO 2023-C7 |
| No. 2 – Arundel Mills and Marketplace |
| THE INFORMATION IN THIS STRUCTURAL AND COLLATERAL TERM SHEET IS NOT COMPLETE AND MAY BE AMENDED PRIOR TO THE TIME OF SALE. THIS TERM SHEET IS NOT AN OFFER TO SELL THESE SECURITIES AND IT IS NOT A SOLICITATION OF AN OFFER TO BUY THESE SECURITIES IN ANY JURISDICTION WHERE THE OFFER OR SALE IS NOT PERMITTED. |
| | 25 | |
| Structural and Collateral Term Sheet | | BMO 2023-C7 |
| No. 2 – Arundel Mills and Marketplace |
| Loan Information | | Property Information |
| Loan Seller: | CREFI | | Single Asset / Portfolio: | Single Asset |
| Original Principal Balance(1): | $60,000,000 | | Title: | Fee |
| Cut-off Date Principal Balance(1): | $60,000,000 | | Property Type – Subtype: | Retail – Super Regional Mall |
| % of IPB: | 8.1% | | Net Rentable Area (SF)(7): | 1,938,983 |
| Loan Purpose: | Refinance | | Location: | Hanover, MD |
| Borrowers: | Arundel Mills Limited Partnership and Arundel Mills Marketplace Limited Partnership | | Year Built / Renovated: | 2000, 2002, 2012 / NAP |
| Borrower Sponsor: | Simon Property Group, L.P. | | Occupancy(8): | 98.3% |
| Interest Rate: | 7.70100% | | Occupancy Date: | 6/15/2023 |
| Note Date: | 10/5/2023 | | 4th Most Recent NOI (As of)(9): | $42,286,167 (12/31/2020) |
| Maturity Date: | 11/1/2033 | | 3rd Most Recent NOI (As of)(9): | $52,018,087 (12/31/2021) |
| Interest-only Period: | 120 months | | 2nd Most Recent NOI (As of): | $52,750,256 (12/31/2022) |
| Original Term: | 120 months | | Most Recent NOI (As of)(10): | $51,525,734 (TTM 8/31/2023) |
| Original Amortization Term: | None | | UW Economic Occupancy: | 98.1% |
| Amortization Type: | Interest Only | | UW Revenues: | $74,354,670 |
| Call Protection(2): | L(25),D(89),O(6) | | UW Expenses: | $16,415,944 |
| Lockbox / Cash Management: | Hard / Springing | | UW NOI(10): | $57,938,726 |
| Additional Debt(1)(3)(4): | Yes | | UW NCF: | $55,557,554 |
| Additional Debt Balance(1)(3)(4): | $300,000,000 | | Appraised Value / Per SF(7): | $870,600,000 / $449 |
| Additional Debt Type(1)(3)(4): | Pari Passu | | Appraisal Date: | 9/1/2023 |
| | | | | |
| Escrows and Reserves(5) | | Financial Information(1) |
| | Initial | Monthly | Initial Cap | | | Whole Loan | |
| Taxes: | $0 | Springing | N/A | | Cut-off Date Loan / SF(7): | $186 | |
| Insurance: | $0 | Springing | N/A | | Maturity Date Loan / SF(7): | $186 | |
| Replacement Reserves: | $0 | Springing | N/A | | Cut-off Date LTV: | 41.4% | |
| TI/LC: | $0 | $231,942 | $5,566,608 | | Maturity Date LTV: | 41.4% | |
| Deferred Maintenance: | $0 | $0 | N/A | | UW NCF DSCR: | 1.98x | |
| Other(6): | $4,384,369 | $0 | N/A | | UW NOI Debt Yield: | 16.1% | |
| | | | | | | |
| Sources and Uses |
| Sources | Proceeds | % of Total | | Uses | Proceeds | % of Total |
| Whole Loan(1) | $360,000,000 | 91.8 | % | | Loan Payoff | $384,870,923 | 98.1 | % |
| Sponsor Equity | 32,236,503 | 8.2 | | | Upfront Reserves | 4,384,369 | 1.1 | |
| | | | | Closing Costs | 2,981,210 | 0.8 | |
| Total Sources | $392,236,503 | 100.0 | % | | Total Uses | $392,236,503 | 100.0 | % |
| (1) | The Arundel Mills and Marketplace Mortgage Loan (as defined below) is part of the Arundel Mills and Marketplace Whole Loan (as defined below), which is comprised of 16 pari passu promissory notes with an aggregate original principal balance of $360,000,000. The financial information presented in the chart above shows the Cut-off Date Loan / SF, Maturity Date Loan / SF, Cut-off Date LTV, Maturity Date LTV, U/W NCF DSCR and U/W NOI Debt Yield based on the aggregate Cut-off Date principal balance of the Arundel Mills and Marketplace Whole Loan. |
| (2) | Defeasance of the Arundel Mills and Marketplace Whole Loan is permitted at any time after the earlier to occur of (a) the end of the two-year period commencing on the closing date of the securitization of the last promissory note representing a portion of the Arundel Mills and Marketplace Whole Loan to be securitized and (b) December 1, 2026. The assumed defeasance lockout period of 25 payments is based on the closing date of the BMO 2023-C7 transaction in December 2023. The actual defeasance lockout period may be longer. If any pari passu note has not been securitized for two years by December 1, 2026, the borrowers may prepay any note that has not been securitized for two years upon payment of a prepayment fee equal to the greater of (i) 1% of the prepaid amount or (ii) yield maintenance basis in conjunction with defeasance of any securitized pari passu note. In addition, the Arundel Mills and Marketplace Whole Loan may be prepaid in connection with a partial release, as described under “Partial Release” below. |
| (3) | See “The Loan” section below for further discussion of additional mortgage debt. |
| (4) | The Arundel Mills and Marketplace Property (as defined below) is subject to an existing property assessed clean energy loan in an original principal amount of $2,037,877.38 from Petros PACE Finance, LLC, a Texas limited liability company to the borrower. The PACE loan has a 16-year term with final payment occurring in November 2035. The annual debt service is $195,956.85 and the remaining balance, including all interest and administrative expenses, as of October 2023 was $1,633,579.73. Payments and any accrued interest are collected on the tax bill for the Arundel Mills and Marketplace Property and constitute a first lien on the Arundel Mills and Marketplace Property that has a priority over any mortgage loan. In addition, the Arundel Mills and Marketplace Whole Loan documents permit the borrowers to enter into an additional PACE loan for an amount not to exceed $5,000,000. |
| (5) | See “Escrows and Reserves” section below for further discussion of reserve requirements. |
| THE INFORMATION IN THIS STRUCTURAL AND COLLATERAL TERM SHEET IS NOT COMPLETE AND MAY BE AMENDED PRIOR TO THE TIME OF SALE. THIS TERM SHEET IS NOT AN OFFER TO SELL THESE SECURITIES AND IT IS NOT A SOLICITATION OF AN OFFER TO BUY THESE SECURITIES IN ANY JURISDICTION WHERE THE OFFER OR SALE IS NOT PERMITTED. |
| | 26 | |
| Structural and Collateral Term Sheet | | BMO 2023-C7 |
| No. 2 – Arundel Mills and Marketplace |
| (6) | Other Initial Escrows and Reserves consist of (i) $3,796,478 for an outstanding tenant improvements and leasing commissions reserve, and (ii) $587,891 for an upfront gap rent reserve. |
| (7) | The Arundel Mills and Marketplace Property includes a larger mall and lifestyle center which consists of 1,391,652 square feet of owned improvements and 547,331 square feet of leased fee improvements. The Cut-off Date Loan / SF, Maturity Date Loan / SF, and Appraised Value / SF are based on the total square feet of 1,938,983. The Cut-off Date Loan / SF, Maturity Date Balance Loan / SF, and Appraised Value / Per SF based on the Owned SF (as defined below) of 1,391,652 is $258.69, $258.69, and $625.59, respectively. |
| (8) | Occupancy represents the occupancy excluding square footage from the leased fee tenant, Live Casino Hotel Maryland, and is based on the Owned SF totaling 1,391,652. Occupancy including Live Casino Hotel Maryland is 98.8%. |
| (9) | The increase from 4th Most Recent NOI to 3rd Most Recent NOI was primarily driven by an increase in bad debt/collection loss in 2020 due to the effect of the novel coronavirus pandemic. |
| (10) | The increase from the Most Recent NOI to UW NOI is driven by 18 new and renewal leases commencing in 2023 and 2024 totaling 113,039 square feet (5.8% of SF and 8.3% of underwritten rent) and rent steps of $604,665. |
The Loan. The second largest loan (the “Arundel Mills and Marketplace Mortgage Loan”) is part of a whole loan (the “Arundel Mills and Marketplace Whole Loan”) evidenced by 16 pari passu notes with an aggregate outstanding principal balance as of the Cut-off Date of $360,000,000. The Arundel Mills and Marketplace Whole Loan is secured by a first mortgage lien on the borrowers’ fee interest in a 1,837,764 square feet regional mall (“Arundel Mills”) and a 101,219 square feet lifestyle center (“Arundel Marketplace”) totaling 1,938,983 square feet located in Hanover, Maryland (the “Arundel Mills and Marketplace Property”). The Arundel Mills and Marketplace Mortgage Loan is evidenced by the non-controlling Note A-4-1 and Note A-4-3 with an aggregate outstanding principal balance as of the Cut-off Date of $60,000,000. The Arundel Mills and Marketplace Whole Loan was co-originated by Wells Fargo Bank, National Association (“WFB”), Société Générale Financial Corporation (“SGFC”), DBR Investments Co. Limited (“DBRI”) and Citi Real Estate Funding Inc. (“CREFI”) on October 5, 2023. The Arundel Mills and Marketplace Whole Loan pari passu notes other than those evidencing the Arundel Mills and Marketplace Mortgage Loan are referred to herein as the “Arundel Mills and Marketplace Pari Passu Companion Loans.” The Arundel Mills and Marketplace Whole Loan will be serviced pursuant to the pooling and servicing agreement for the BMO 2023-C7 trust until the controlling note A-1 is securitized, whereupon the Arundel Mills and Marketplace Whole Loan will be serviced pursuant to the pooling and servicing agreement for such future securitization trust. The relationship between the holders of the Arundel Mills and Marketplace Whole Loan is governed by a co-lender agreement as described under “Description of the Mortgage Pool—The Whole Loans—The Serviced Pari Passu Whole Loans” and “—The Whole Loans—The Outside Serviced Pari Passu Whole Loans” in the Preliminary Prospectus.
| Whole Loan Summary |
| Note | Original Balance | Cut-off Date Balance | Note Holder | Controlling Piece |
| A-1-1(1) | $50,000,000 | $50,000,000 | WFB | Yes |
| A-1-2(1) | $30,000,000 | $30,000,000 | WFB | No |
| A-1-3(1) | $15,000,000 | $15,000,000 | WFB | No |
| A-1-4(1) | $10,000,000 | $10,000,000 | WFB | No |
| A-2-1(1) | $40,000,000 | $40,000,000 | SGFC | No |
| A-2-2(1) | $30,000,000 | $30,000,000 | SGFC | No |
| A-2-3(1) | $10,000,000 | $10,000,000 | SGFC | No |
| A-2-4(1) | $5,000,000 | $5,000,000 | SGFC | No |
| A-3-1(1) | $25,000,000 | $25,000,000 | DBRI | No |
| A-3-2(1) | $20,000,000 | $20,000,000 | DBRI | No |
| A-3-3(1) | $15,000,000 | $15,000,000 | DBRI | No |
| A-3-4(1) | $15,000,000 | $15,000,000 | DBRI | No |
| A-3-5(1) | $10,000,000 | $10,000,000 | DBRI | No |
| A-4-1 | $40,000,000 | $40,000,000 | BMO 2023-C7 | No |
| A-4-2(1) | $25,000,000 | $25,000,000 | CREFI | No |
| A-4-3 | $20,000,000 | $20,000,000 | BMO 2023-C7 | No |
| Whole Loan | $360,000,000 | $360,000,000 | | |
| (1) | Expected to be contributed to one or more future securitization(s). |
The Property. The Arundel Mills and Marketplace Property comprises Arundel Mills, a 1,837,764 square feet regional mall, which includes 1,391,652 of owned square feet (the “Owned SF”) and 547,331 of leased fee square feet, and Arundel Marketplace, a 101,219 square feet lifestyle center, together totaling 1,938,983 square feet located in Hanover, Maryland. Arundel Mills is anchored by Live Casino Hotel Maryland (“Live Casino Hotel”), which owns its improvements and ground leases the underlying land from the borrower, Bass Pro Shops Outdoor (“Bass Pro”), Burlington, Dave & Buster’s, Medieval Times and Cinemark Theatres (“Cinemark”). Arundel Mills is an enclosed mall with multiple wings and entrances, containing a food court and anchor tenants. Arundel Marketplace is leased to major tenants including Aldi, Michael’s, Staples and PetSmart. Built between 2000, 2002 and 2012 the Arundel Mills and Marketplace Property is situated on a 208.08-acre parcel and contains 6,207 parking spaces (4.5/1,000 square feet), which excludes the spaces within the casino parking structure. The collateral tenancy, outside of the anchors, is granular with no other tenant making up more than 3.3% of the Owned SF. Notable tenants include T.J. Maxx, Saks Fifth Avenue Off 5th, Old Navy, Polo Ralph Lauren, Ulta Beauty, Nike Factory Store, The
| THE INFORMATION IN THIS STRUCTURAL AND COLLATERAL TERM SHEET IS NOT COMPLETE AND MAY BE AMENDED PRIOR TO THE TIME OF SALE. THIS TERM SHEET IS NOT AN OFFER TO SELL THESE SECURITIES AND IT IS NOT A SOLICITATION OF AN OFFER TO BUY THESE SECURITIES IN ANY JURISDICTION WHERE THE OFFER OR SALE IS NOT PERMITTED. |
| | 27 | |
| Structural and Collateral Term Sheet | | BMO 2023-C7 |
| No. 2 – Arundel Mills and Marketplace |
North Face, and Victoria’s Secret. As of June 15, 2023, the Arundel Mills and Marketplace Property was 98.3% leased based on Owned SF and 98.8% leased based on total SF by 177 tenants.
The trailing 12-month in-line sales per square foot as of July 31, 2023 are $559 per square foot, representing a 10.0% increase over 2019. As of the trailing 12-month period as of July 31, 2023, the in-line occupancy cost ratio is 13.0%. The table below provides an overview of sales by inline tenants with less than 10,000 square feet.
| Sales for Inline Tenants(1) |
| | 2019 Sales PSF | 2020 Sales PSF | 2021 Sales PSF | 2022 Sales PSF | TTM 7/31/2023 Sales PSF |
| Inline Sales (< 10,000 SF) | $508 | $394 | $568 | $562 | $559 |
| Occupancy Cost | 13.8% | 17.6% | 12.9% | 12.7% | 13.0% |
| (1) | Information obtained from the borrower. |
Major Tenants. The three largest tenants based on underwritten base rent are Cinemark, Live Casino Hotel and Dave & Buster’s.
Cinemark (107,190 square feet; 5.5% of net rentable area (“NRA”); 9.1% of underwritten base rent). Founded in 1984 and headquartered in Plano, Texas, Cinemark is the third-largest movie theater chain in the United States, operating 5,812 screens across 514 theaters in the US and Latin America as of June 30, 2023. Cinemark operates 24 screens at the Arundel Mills and Marketplace Property and, according to the appraisal, this is the strongest performing theater in a 15-mile radius with 1.2 million visitors during the trailing 12-month period ending in August 2023. Cinemark has been a tenant at the Arundel Mills and Marketplace Property since 2000 and has a lease expiration of December 2025. The tenant has three, 5-year extension options and no termination options.
Live Casino Hotel (547,331 square feet; 28.2% of NRA; 5.5% of underwritten base rent). Live Casino Hotel is owned by The Cordish Companies, which started in 1910 and is a real estate developer and owner operator of multiple businesses in the entertainment industry. Live Casino Hotel offers a wide range of gaming and entertainment options with approximately 206 tables, 310 hotel rooms, a spa, and 75,000 square feet of event space. Live Casino Hotel attracts more than 10 million visitors annually and features the largest gambling floor of any casino in the country. Live Casino Hotel has been a tenant at the Arundel Mills and Marketplace Property since June 2012. Live Casino Hotel owns its improvements and leases the underlying land from the borrowers pursuant to a ground lease expiring in June 2111 with one, 11-year and one, 10-year renewal option. Live Casino Hotel may terminate its lease on June 30, 2027, which is the expiration of the first 15-year period from the rent commencement date, or at the end of any 10-year period thereafter with 365 days’ notice. In addition to base rent, Live Casino Hotel pays percentage rent equal to 1% of retail and gaming gross revenues, less percentage rent allowance of $1,500,000. The underwritten Live Casino Hotel percentage rent is $6,324,300, which is based on TTM 7/31/2023 sales.
Dave & Buster’s (63,631 square feet; 3.3% of NRA; 4.5% of underwritten base rent). Founded in 1982 in Dallas, Texas, Dave & Buster’s is an entertainment venue including an arcade, sports bar and restaurant. Today, there are over 150 locations across North America with a total of over 20 million visitors annually. Dave & Buster’s has been a tenant at the Arundel Mills and Marketplace Property since 2000 and has a lease expiration in May 2026. The tenant has two, 5-year extension options and no termination options.
The following table presents certain information relating to the historical occupancy of the Arundel Mills and Marketplace Property:
| Historical and Current Occupancy(1)(2) |
| 2019(3) | 2020(3) | 2021(3) | 2022(3) | Current(4) |
| 98.2% | 94.2% | 93.2% | 97.2% | 98.3% |
| (1) | Historical Information obtained from the Arundel Mills and Marketplace borrowers. |
| (2) | Occupancy represents the occupancy excluding the square footage from the leased fee tenant, Live Casino Hotel, and is based on the Owned SF. Occupancy as of June 15, 2023 based on the total square feet is 98.8%. |
| (3) | Historical Occupancy excludes temporary tenants at the Arundel Mills and Marketplace Property. |
| (4) | Current Occupancy is based on the underwritten rent roll dated as of June 15, 2023. |
| THE INFORMATION IN THIS STRUCTURAL AND COLLATERAL TERM SHEET IS NOT COMPLETE AND MAY BE AMENDED PRIOR TO THE TIME OF SALE. THIS TERM SHEET IS NOT AN OFFER TO SELL THESE SECURITIES AND IT IS NOT A SOLICITATION OF AN OFFER TO BUY THESE SECURITIES IN ANY JURISDICTION WHERE THE OFFER OR SALE IS NOT PERMITTED. |
| | 28 | |
| Structural and Collateral Term Sheet | | BMO 2023-C7 |
| No. 2 – Arundel Mills and Marketplace |
The following table presents certain information relating to the major tenants (of which, certain tenants may have co-tenancy provisions) at the Arundel Mills and Marketplace Property:
| Tenant Summary(1) |
| Tenant | Credit Rating (Fitch/Moody's/S&P)(2) | Net Rentable Area (SF) | % of Total NRA | UW Base Rent PSF(3)(4) | U/W Base Rent(3)(4) | % of Total UW Base Rent | Lease Expiration Date |
| Anchor Tenant (leased fee)(5) | | | | | | | |
| Live Casino Hotel(6)(7) | NR/NR/NR | 547,331 | 28.2% | $4.08 | $2,231,337 | (8) | 5.5% | 6/5/2111 |
| Total/Wtd. Avg. | | 547,331 | 28.2% | $4.08 | $2,231,337 | | 5.5% | |
| | | | | | | | |
| Major Tenants | | | | | | | |
| Cinemark | B+/NR/B+ | 107,190 | 5.5% | $34.00 | $3,644,460 | | 9.1% | 12/31/2025 |
| Dave & Buster's | NR/NR/NR | 63,631 | 3.3 | $28.60 | 1,819,847 | | 4.5 | 5/31/2026 |
| Primark(9) | NR/NR/A | 46,143 | 2.4 | $25.16 | 1,161,117 | | 2.9 | 8/31/2033 |
| Forever 21 | NR/NR/NR | 25,211 | 1.3 | $41.72 | 1,051,790 | (10) | 2.6 | 1/31/2026 |
| Bass Pro | NR/NR/NR | 127,672 | 6.6 | $7.01 | 895,134 | (10) | 2.2 | 10/3/2026 |
| The Children’s Place | NR/NR/NR | 20,816 | 1.1 | $36.02 | 749,792 | | 1.9 | 4/30/2025 |
| Old Navy | NR/Ba3/BB | 26,044 | 1.3 | $28.64 | 745,958 | | 1.9 | 1/31/2027 |
| Michael Kors | BBB-/NR/BBB- | 6,861 | 0.4 | $95.52 | 655,363 | | 1.6 | 4/30/2028 |
| H&M | NR/NR/BBB | 20,296 | 1.0 | $27.71 | 562,336 | (10) | 1.4 | 1/31/2028 |
| Off Broadway Shoes | NR/NR/NR | 21,526 | 1.1 | $23.91 | 514,691 | | 1.3 | 1/31/2026 |
| Medieval Times | NR/NR/NR | 66,244 | 3.4 | $7.50 | 496,680 | | 1.2 | 8/31/2033 |
| Total/Wtd. Avg. | | 531,634 | 27.4% | $23.13 | $12,297,168 | | 30.6% | |
| | | | | | | | |
| Non-Major Tenants(11) | | 835,783 | 43.1% | $30.73 | $25,684,060 | | 63.9% | |
| | | | | | | | |
| Occupied Collateral Total | | 1,914,748 | 98.8% | $27.78(12) | $40,212,565 | | 100.0% | |
| Vacant Space | | 24,235 | 1.2% | | | | |
| Total/Wtd. Avg. | | 1,938,983 | 100.0% | | | | |
| (1) | Based on the underwritten rent roll dated as of June 15, 2023. |
| (2) | Certain ratings are those of the parent company whether or not the parent guarantees the lease. |
| (3) | UW Base Rent PSF and U/W Base Rent includes percentage in-lieu of rents totaling $3,023,713. |
| (4) | UW Base Rent and UW Base Rent PSF includes $604,665 of rent steps through September 2024. |
| (5) | Live Casino Hotel owns its own improvements and ground leases the land from the borrower. |
| (6) | Live Casino Hotel may terminate its lease on June 30, 2027, which is the expiration of the first 15-year period from the rent commencement date, or at the end of any 10 year period thereafter. |
| (7) | Live Casino Hotel has one, 11-year extension option and one, 10-year extension option. |
| (8) | Live Casino Hotel also pays percentage rent, which equates to 1% of retail and gaming gross revenues, less percentage rent allowance of $1,500,000. The underwritten Live Casino Hotel percentage rent is $6,324,300, which is based on TTM 7/31/2023 sales and not included in the UW Base Rent. |
| (9) | If Primark does not achieve sales of at least $12,000,000 during the fourth lease year (9/1/2026-8/31/2027), tenant may terminate its lease within 120 days of the expiration of the fourth lease year. |
| (10) | Forever 21, Bass Pro and H&M Annual U/W Base Rent PSF and U/W Base Rent PSF represent percentage in-lieu of rent based on the tenants’ TTM 7/31/2023 sales. |
| (11) | Non-Major Tenants includes three tenants, The North Face, Brooks Brothers, and True Religion, totaling 15,717 square feet (1.1% of Owned SF), with lease start dates in June 2024, May 2024, and February 2024, respectively. |
| (12) | Occupied Collateral Total U/W Base Rent PSF are based on the Owned SF and excludes Net Rentable Area (SF) and U/W Base Rent from the leased fee tenant, Live Casino Hotel. |
| THE INFORMATION IN THIS STRUCTURAL AND COLLATERAL TERM SHEET IS NOT COMPLETE AND MAY BE AMENDED PRIOR TO THE TIME OF SALE. THIS TERM SHEET IS NOT AN OFFER TO SELL THESE SECURITIES AND IT IS NOT A SOLICITATION OF AN OFFER TO BUY THESE SECURITIES IN ANY JURISDICTION WHERE THE OFFER OR SALE IS NOT PERMITTED. |
| | 29 | |
| Structural and Collateral Term Sheet | | BMO 2023-C7 |
| No. 2 – Arundel Mills and Marketplace |
The following table presents a summary of sales and occupancy costs for certain tenants at the Arundel Mills and Marketplace Property:
| Sales and Occupancy Cost Summary(1) |
| | 2020 Sales (PSF) | 2021 Sales (PSF) | 2022 Sales (PSF) | TTM 7/31/2023 Sales (PSF) |
| Live Casino Hotel(2) | $463,348,000 | $723,949,000 | $785,282,000 | $782,430,000 |
| Cinemark(3) | $146,750 | $382,500 | $588,875 | $690,661 |
| Dave & Buster’s | $108.61 | $223.33 | $251.94 | $258.58 |
| Primark | NAV | NAV | NAV | NAV |
| Forever 21 | $116.30 | $243.82 | $209.63 | $185.42 |
| Bass Pro | $322.68 | $347.17 | $346.38 | $350.56 |
| The Children’s Place | $99.44 | $209.50 | $180.49 | $175.94 |
| Old Navy | $157.54 | $286.94 | $257.30 | $257.59 |
| Michael Kors | $569.01 | $787.20 | $895.93 | $816.75 |
| H&M | $185.50 | $315.68 | $309.37 | $291.65 |
| Off Broadway Shoes | $124.50 | $222.15 | $229.26 | $212.70 |
| Medieval Times | $29.30 | $73.71 | $154.85 | $177.06 |
| (1) | Information obtained from the borrower. |
| (2) | Live Casino Hotel is the ground lessee and owns its improvements. Historical sales are shown on an annual basis above. |
| (3) | Calculated based on a sales per screen basis. |
The following table presents certain information relating to the lease rollover schedule at the Arundel Mills and Marketplace Property:
| Lease Rollover Schedule(1)(2) |
| Year | Number of Leases Expiring | Net Rentable Area Expiring | % of NRA Expiring | UW Base Rent Expiring(3) | % of UW Base Rent Expiring | Cumulative Net Rentable Area Expiring | Cumulative % of NRA Expiring | Cumulative UW Base Rent Expiring | Cumulative % of UW Base Rent Expiring |
| Vacant | NAP | 24,235 | 1.2 | % | NAP | NAP | | 24,235 | 1.2% | NAP | NAP |
| 2023 & MTM | 11 | 25,904 | 1.3 | | $1,441,580 | 3.6 | % | 50,139 | 2.6% | $1,441,580 | 3.6% |
| 2024 | 42 | 145,714 | 7.5 | | 5,321,562 | 13.2 | | 195,853 | 10.1% | $6,763,143 | 16.8% |
| 2025 | 26 | 249,150 | 12.8 | | 7,710,372 | 19.2 | | 445,003 | 23.0% | $14,473,515 | 36.0% |
| 2026 | 23 | 418,423 | 21.6 | | 7,077,611 | 17.6 | | 863,426 | 44.5% | $21,551,126 | 53.6% |
| 2027 | 24 | 103,687 | 5.3 | | 4,697,690 | 11.7 | | 967,113 | 49.9% | $26,248,816 | 65.3% |
| 2028 | 16 | 113,056 | 5.8 | | 3,708,472 | 9.2 | | 1,080,169 | 55.7% | $29,957,288 | 74.5% |
| 2029 | 14 | 56,297 | 2.9 | | 2,542,768 | 6.3 | | 1,136,466 | 58.6% | $32,500,056 | 80.8% |
| 2030 | 6 | 21,905 | 1.1 | | 931,272 | 2.3 | | 1,158,371 | 59.7% | $33,431,328 | 83.1% |
| 2031 | 2 | 6,199 | 0.3 | | 265,149 | 0.7 | | 1,164,570 | 60.1% | $33,696,477 | 83.8% |
| 2032 | 1 | 30,641 | 1.6 | | 300,000 | 0.7 | | 1,195,211 | 61.6% | $33,996,477 | 84.5% |
| 2033 | 9 | 182,701 | 9.4 | | 3,399,377 | 8.5 | | 1,377,912 | 71.1% | $37,395,854 | 93.0% |
| 2034 & Beyond | 3 | 561,071 | 28.9 | | 2,816,711 | 7.0 | | 1,938,983 | 100.0% | $40,212,565 | 100.0% |
| Total | 177 | 1,938,983 | 100.0 | % | $40,212,565 | 100.0 | % | | | | |
| (1) | Based on the underwritten rent roll dated June 15, 2023. |
| (2) | Certain tenants may have termination options that are exercisable prior to the originally stated expiration date of the subject lease and that are not considered in the Lease Rollover Schedule. |
| (3) | UW Base Rent Expiring includes percentage in-lieu of rent totaling $3,023,713 and rent steps totaling $604,665 through September 2024. |
| THE INFORMATION IN THIS STRUCTURAL AND COLLATERAL TERM SHEET IS NOT COMPLETE AND MAY BE AMENDED PRIOR TO THE TIME OF SALE. THIS TERM SHEET IS NOT AN OFFER TO SELL THESE SECURITIES AND IT IS NOT A SOLICITATION OF AN OFFER TO BUY THESE SECURITIES IN ANY JURISDICTION WHERE THE OFFER OR SALE IS NOT PERMITTED. |
| | 30 | |
| Structural and Collateral Term Sheet | | BMO 2023-C7 |
| No. 2 – Arundel Mills and Marketplace |
The following table presents certain information relating to the underwritten cash flows of the Arundel Mills and Marketplace Property:
| Operating History and Underwriting Net Cash Flow |
| | 2020 | 2021 | 2022 | TTM August 2023(1) | Underwritten | Per Square Foot | %(2) |
| In Place Rent | $33,938,041 | $33,271,004 | $32,940,359 | $34,871,979 | $36,584,187 | $18.87 | 48.5 | % |
| Contractual Rent Steps(3) | 0 | 0 | 0 | 0 | 604,665 | 0.31 | 0.8 | |
| Potential Income from Vacant Space | 0 | 0 | 0 | 0 | 1,028,517 | 0.53 | 1.4 | |
| Percentage in Lieu(4) | 2,365,569 | 4,167,022 | 3,784,601 | 2,469,932 | 3,023,713 | 1.56 | 4.0 | |
| Gross Potential Rent | $36,303,610 | $37,438,026 | $36,724,960 | $37,341,911 | $41,241,082 | $21.27 | 54.7 | % |
| Percentage Rent(5) | 3,354,054 | 7,437,689 | 8,482,789 | 8,559,268 | 8,491,820 | 4.38 | 11.3 | |
| Temp Tenant Income | 2,264,738 | 3,091,587 | 3,631,703 | 3,339,445 | 3,339,445 | 1.72 | 4.4 | |
| Reimbursement Revenue | 21,644,732 | 21,147,941 | 20,262,474 | 20,258,479 | 21,856,710 | 11.27 | 29.0 | |
| Other Revenue(6) | 112,149 | 367,765 | 406,519 | 454,130 | 454,130 | 0.23 | 0.6 | |
| Net Rental Income | $63,679,283 | $69,483,008 | $69,508,445 | $69,953,233 | $75,383,187 | $38.88 | 100.0 | % |
| Less Free Rent & Credit Loss | (6,402,854) | (81,074) | 475,767 | (228,717) | 0 | 0.00 | 0.0 | |
| Less Vacancy | 0 | 0 | 0 | 0 | (1,028,517) | (0.53) | (2.5) | (7) |
| Effective Gross Income | $57,276,429 | $69,401,934 | $69,984,212 | $69,724,516 | $74,354,670 | $38.35 | 98.6 | % |
| | | | | | | | |
| Real Estate Taxes | 5,406,023 | 5,550,627 | 3,310,098 | 5,186,899 | 5,186,899 | 2.68 | 7.0 | |
| Insurance | 593,510 | 625,192 | 703,339 | 759,782 | 759,782 | 0.39 | 1.0 | |
| Management Fee | 2,385,373 | 2,769,663 | 2,901,210 | 2,782,838 | 1,000,000 | 0.52 | 1.3 | |
| Other Expenses | 6,605,356 | 8,438,365 | 10,319,309 | 9,469,263 | 9,469,263 | 4.88 | 12.7 | |
| Total Expenses | $14,990,262 | $17,383,847 | $17,233,956 | $18,198,782 | $16,415,944 | $8.47 | 22.1 | % |
| | | | | | | | |
| Net Operating Income | $42,286,167(8) | $52,018,087(8) | $52,750,256 | $51,525,734(9) | $57,938,726(9) | $29.88 | 77.9 | % |
| TI/LC | 0 | 0 | 0 | 0 | 2,102,842 | 1.08 | 2.8 | |
| Capital Expenditures | 0 | 0 | 0 | 0 | 278,330 | 0.14 | 0.4 | |
| Net Cash Flow | $42,286,167 | $52,018,087 | $52,750,256 | $51,525,734 | $55,557,554 | $28.65 | 74.7 | % |
| | | | | | | | |
| (1) | TTM August 2023 reflects the trailing 12-month period ending August 31, 2023. |
| (2) | Represents (i) percent of Net Rental Income for all revenue fields, (ii) percent of Gross Potential Rent for Vacancy and Free Rent & Credit Loss and (iii) percent of Effective Gross Income for all other fields. |
| (3) | Represents rent steps through September 2024. |
| (4) | Percentage in Lieu rents are underwritten based on the tenants’ TTM 7/31/2023 sales. |
| (5) | Primarily comprised of percentage rent paid by Live Casino Hotel, which equates to 1% of retail and gaming gross revenues, less percentage rent allowance of $1,500,000. The underwritten Live Casino Hotel percentage rent is $6,324,300, which is based on TTM 7/31/2023 sales. |
| (6) | Other Revenue includes revenue from tenant services, media, and telecom. |
| (7) | Represents the underwritten economic vacancy %. The Arundel Mills and Marketplace Property was 98.3% occupied based on the Owned SF as of June 15, 2023. |
| (8) | The increase in 2020 Net Operating Income to 2021 Net Operating Income was primarily driven by an increase in bad debt/collection loss in 2020 due to the effect of the novel coronavirus pandemic. |
| (9) | The increase from the TTM August 2023 Net Operating Income to the Underwritten Net Operating Income is driven by 18 new and renewal leases commencing in 2023 and 2024 totaling 113,039 square feet (5.8% of owned SF and 8.3% of underwritten rent) and underwritten rent steps of $604,665. |
Environmental. According to the Phase I environmental site assessments dated September 25, 2023 and September 29, 2023, there was no evidence of any recognized environmental conditions at the Arundel Mills and Marketplace Property.
| THE INFORMATION IN THIS STRUCTURAL AND COLLATERAL TERM SHEET IS NOT COMPLETE AND MAY BE AMENDED PRIOR TO THE TIME OF SALE. THIS TERM SHEET IS NOT AN OFFER TO SELL THESE SECURITIES AND IT IS NOT A SOLICITATION OF AN OFFER TO BUY THESE SECURITIES IN ANY JURISDICTION WHERE THE OFFER OR SALE IS NOT PERMITTED. |
| | 31 | |
| Structural and Collateral Term Sheet | | BMO 2023-C7 |
| No. 2 – Arundel Mills and Marketplace |
Appraisal. According to the appraisal, the Arundel Mills and Marketplace Whole Loan had an “as is” appraised value of $870,600,000 as of September 1, 2023. The table below shows the appraisal’s conclusions.
| Arundel Mills and Marketplace(1) |
| Property | Value | Capitalization Rate |
| Arundel Mills and Marketplace | $870,600,000 | 6.50% |
| Total / Wtd. Avg | $870,600,000 | 6.50% |
The Market. The Arundel Mills and Marketplace Property is located in Hanover, Maryland, approximately 13.0 miles south of Baltimore and 28.9 miles north of Washington, D.C. According to the appraisal, the neighborhood is primarily comprised of retail and residential uses with the Arundel Mills and Marketplace Property anchoring a dominant commercial corridor. Primary access to the area is provided by State Highway 100, which is adjacent to the Arundel Mills and Marketplace Property and had a traffic count of approximately 74,222 vehicles per day, and Interstate 295, which is approximately two miles from the Arundel Mills and Marketplace Property. According to the appraisal, the top five employers in the surrounding area are Fort Meade, Johns Hopkins University, Johns Hopkins Hospital, University of Maryland Medical Systems, and University System of Maryland.
Within a one-, three-, and five-mile radius of the Arundel Mills and Marketplace Property, the 2022 average household income was approximately $148,021, $145,352, and $145,096, respectively; and within the same radii, the 2022 estimated population was 9,168, 53,846 and 155,847 respectively.
According to a third-party market research report, the property is situated within the BWI/Anne Arundel retail submarket of the Baltimore retail market. As of November 2023, the submarket reported total inventory of approximately 4.4 million square feet with a 1.1% vacancy rate and average rents of $27.55 per square foot.
The following table presents certain information relating to the appraiser’s market rent conclusions for the Arundel Mills and Marketplace Property:
| Market Rent Summary(1) |
| | Market Rent (PSF) | Lease Term (Yrs.) | Rent Increase Projections | New Tenant Improvements |
| Less Than <1,000 SF | $85.00 | 7 | 3.0% annually | $65.00 |
| 1,000-2,499 SF | $44.00 | 7 | 3.0% annually | $65.00 |
| 2,500-4,999 SF | $32.50 | 7 | 3.0% annually | $65.00 |
| 5,000-9,999 SF | $37.50 | 7 | 3.0% annually | $65.00 |
| Over 10,000 SF | $36.50 | 7 | 3.0% annually | $65.00 |
| Jewelry | $91.00 | 7 | 3.0% annually | $65.00 |
| Food Court | $202.50 | 7 | 3.0% annually | $65.00 |
| Restaurant | $39.00 | 7 | 3.0% annually | $150.00 |
| Kiosk | $385.00 | 7 | 3.0% annually | $0.00 |
| Jr. Anchor | $21.50 | 10 | 10.0% Mid-Term | $100.00 |
| Major | $22.50 | 10 | 10.0% Mid-Term | $100.00 |
| Anchor | $7.25 | 10 | 10.0% Mid-Term | $0.00 |
| Movie Theater | $31.00 | 10 | 10.0% Mid-Term | $65.00 |
| Grocery Anchor(2) | $15.00 | 20 | 10.0% every 5 years | $15.00 |
| Junior Anchor(2) | $17.00 | 10 | 10.0% Mid-Term | $15.00 |
| Large Inline(2) | $40.00 | 5 | 3.0% annually | $20.00 |
| (2) | Market rent conclusions for Arundel Marketplace. |
| THE INFORMATION IN THIS STRUCTURAL AND COLLATERAL TERM SHEET IS NOT COMPLETE AND MAY BE AMENDED PRIOR TO THE TIME OF SALE. THIS TERM SHEET IS NOT AN OFFER TO SELL THESE SECURITIES AND IT IS NOT A SOLICITATION OF AN OFFER TO BUY THESE SECURITIES IN ANY JURISDICTION WHERE THE OFFER OR SALE IS NOT PERMITTED. |
| | 32 | |
| Structural and Collateral Term Sheet | | BMO 2023-C7 |
| No. 2 – Arundel Mills and Marketplace |
The table below presents certain information relating to comparable retail centers pertaining to the Arundel Mills and Marketplace Property identified by the appraiser:
| Competitive Set(1) |
| Property Name | Year Built/Renovated | Total NRA | Total Occupancy | Anchor / Major Tenants | Distance to Arundel Mills and Marketplace Property |
| Arundel Mills and Marketplace | 2000, 2002, 2012/NAP | 1,938,983 | 98.3%(2) | Live Casino Hotel, Bass Pro, Burlington,
Dave & Buster’s, Medieval Times and
Cinemark | |
| Marley Station | 1987/2006 | 1,086,384 | 55.7% | Macy’s, JCPenney | 9.0 miles |
| Waugh Chapel Towne Centre | 2012/NAP | 662,717 | 97.1% | Wegmans, Target, Dick’s Sporting Goods,
Regal Waugh Chapel | 13.0 miles |
| The Mall in Columbia | 1971/2018 | 1,439,872 | 91.7% | Macy’s, JCPenney, Nordstrom, AMC Columbia
14, Lidl | 13.2 miles |
| Security Square Mall | 1900/1998 | 1,345,170 | 97.8% | Macy’s, Burlington, AMC Security Square 8 | 16.2 miles |
| The Gallery at Harborplace | 1980/2019 | 327,774 | 50.4% | NAV | 12.5 miles |
| Westfield Wheaton | 1958/2016 | 1,522,828 | 97.2% | Macy’s, Target, Costco Wholesale, JCPenney | 27.6 miles |
| Weighted Average | | | 89.3% | | |
| (1) | Information obtained from the appraisal, unless otherwise specified. |
| (2) | Based on the Owned SF of the underwritten rent roll as of June 15, 2023. Total Occupancy based on total square feet is 98.8% |
The Borrowers. The borrowers are Arundel Mills Limited Partnership and Arundel Mills Marketplace Limited Partnership, each a Delaware limited partnership with two independent directors. The borrowers are each joint ventures between Simon Property Group, L.P. (59.3%) and Kan Am Group (40.7%). Legal counsel to the borrowers delivered a non-consolidation opinion in connection with the origination of the Arundel Mills and Marketplace Whole Loan.
The Borrower Sponsors. The borrower sponsor and non-recourse carveout guarantor of the Arundel Mills and Marketplace Whole Loan is Simon Property Group, L.P. (“Simon”). Simon Property Group, Inc. (NYSE: SPG) is a real estate investment trust engaged in the ownership of shopping, dining, entertainment and mixed-use destinations. Simon has approximately 400 retail centers across 24 countries. Pursuant to the Arundel Mills and Marketplace Whole Loan documents, so long as one or more of Simon Property Group, Inc. or Simon Property Group, L.P. (collectively, “Simon Key Principal”) or an affiliate of Simon Key Principal is the non-recourse carveout guarantor, the non-recourse carveout guarantor’s liability under the guaranty is limited to 20.0% of the original principal balance of the Arundel Mills and Marketplace Whole Loan (i.e., $72,000,000) in the aggregate, plus all of the reasonable out-of-pocket costs and expenses (including court costs and reasonable attorneys’ fees) incurred by the lender in the enforcement of the related guaranty or the preservation of the lender’s rights under such guaranty. In addition, there is no separate environmental indemnity with respect to the Arundel Mills and Marketplace Whole Loan. The non-recourse carveout guaranty covers breaches of representations, warranties and indemnification provisions in the loan agreement concerning environmental laws and hazardous materials; however, such coverage is subject to the cap described above.
Property Management. The Arundel Mills and Marketplace Property is managed by Simon Management Associates II, LLC, an affiliate of the borrowers.
Escrows and Reserves. At origination of the Arundel Mills and Marketplace Whole Loan, the borrowers deposited approximately (i) $587,891 into a reserve account for gap rent and (ii) $3,796,478 into a reserve account for outstanding TI/LC.
Tax Reserve – After the occurrence of a Control Event (as defined below) or during a Lockbox Event Period (as defined below), or at any time (x) any property taxes are not paid by the borrowers prior to the assessment of a penalty, or (y) upon request of the lender, the borrowers fail to promptly provide evidence that property taxes have been paid prior to the assessment of a penalty, the loan documents require the borrowers to make monthly payments into the real estate tax reserve in an amount equal to 1/12th of the property taxes that the lender reasonably estimates will be payable during the ensuing 12 months.
| THE INFORMATION IN THIS STRUCTURAL AND COLLATERAL TERM SHEET IS NOT COMPLETE AND MAY BE AMENDED PRIOR TO THE TIME OF SALE. THIS TERM SHEET IS NOT AN OFFER TO SELL THESE SECURITIES AND IT IS NOT A SOLICITATION OF AN OFFER TO BUY THESE SECURITIES IN ANY JURISDICTION WHERE THE OFFER OR SALE IS NOT PERMITTED. |
| | 33 | |
| Structural and Collateral Term Sheet | | BMO 2023-C7 |
| No. 2 – Arundel Mills and Marketplace |
Insurance Reserve – After the occurrence of a Control Event or during a Lockbox Event Period, the borrowers have not provided satisfactory evidence to the lender that the property is covered by policies that are being maintained as part of a reasonably acceptable blanket insurance policy, the loan documents require the borrowers to make ongoing monthly deposits in an amount equal to 1/12th of the insurance premiums that the lender reasonably estimates will be payable for the renewal of the coverage afforded by the policies in order to accumulate sufficient funds to pay the premiums at least 30 days prior to expiration.
Replacement Reserve – After the occurrence of a Control Event or during the Lockbox Event Period, the loan documents require springing ongoing monthly deposits of $39,430 for replacement reserves.
TI / LC Reserve – The Arundel Mills and Marketplace Whole Loan documents require ongoing monthly deposits of $231,942 for tenant improvements and leasing commissions reserves, subject to a cap of $5,566,608, provided that no such cap shall apply during a Lockbox Event Period.
Gap Rent Reserve – The Arundel Mills and Marketplace Whole Loan documents require an upfront deposit of $587,891 for gap and free rent related to Kids Empire, Brooks Brothers, and Komma Tea.
Outstanding TI/LC Reserve – The Arundel Mills and Marketplace Whole Loan documents require an upfront deposit of $3,796,478 for outstanding tenant improvements and leasing commissions related to Primark, Under Armour, Kids Empire, Adidas, The North Face, Brooks Brothers, Vera Bradley, Spencer’s, and Movado Company Store.
A “Control Event” will occur upon Simon Key Principal not owning at least 50% of the direct or indirect interests in the borrowers or not controlling the borrowers.
Lockbox / Cash Management. The Arundel Mills and Marketplace Whole Loan is structured with a hard lockbox and springing cash management. The borrowers are required to deposit all rents into a lender-controlled lockbox account within two business days of receipt, and to direct all tenants to make direct rent deposits into the lockbox account. As long as a Lockbox Event Period is not in effect, all funds in the lockbox account are required to be distributed to the borrowers weekly. During the continuance of a Lockbox Event Period, all funds in the lockbox will be transferred weekly to a lender-controlled cash management account to be disbursed in accordance with the Arundel Mills and Marketplace Whole Loan documents, with any excess funds required to be held as additional security in an excess cash flow subaccount controlled by the lender for so long as the Lockbox Event Period continues.
A “Lockbox Event Period” will commence upon the earlier of the following (each of the items in clauses (i) through (v), a “Lockbox Event”):
| | (i) | the occurrence of an event of default; |
| | (ii) | any bankruptcy action of the borrowers; |
| (iii) | a bankruptcy action of the manager if the manager is an affiliate of the borrowers, and provided the manager is not replaced within 60 days with a qualified manager; |
| (iv) | the net operating income debt yield (“NOI DY”), based on the trailing four calendar quarter period, is below 10.5%, for two consecutive calendar quarters; or |
| | (v) | the occurrence of a Major Tenant Trigger Event (as defined below). |
A Lockbox Event Period will end upon the occurrence of the following:
| | ● | with regard to clause (i), the cure of such event of default; |
| ● | with regard to clause (iii), the borrowers replace the manager with a qualified manager under a replacement management agreement within 60 days, or the bankruptcy action is discharged or dismissed within 90 days without any adverse consequences to the property or loan; |
| ● | with regard to clause (iv), the NOI DY being 10.5% or greater for two consecutive calendar quarters; or |
| ● | with regard to clause (v), so long as only one Major Tenant Trigger Event exists, the earlier to occur of (x) the date on which the applicable Major Tenant Threshold Amount (as defined below) has been deposited in the excess cash reserve account or (y) a Major Tenant Trigger Event Cure (as defined below) has occurred; provided, however, that, the expiration or termination of the Lockbox Event Period is subject to the following conditions, among others set forth in the Arundel Mills and Marketplace Whole Loan documents: (i) no other Lockbox Event shall have occurred and be continuing, (ii) no other event of default shall have occurred and be continuing, and (iii) the borrowers may not cure a Lockbox Event (x) more than a total of five times in the aggregate during the term of the Loan or (y) triggered by a bankruptcy action of the borrowers. |
A “Major Tenant Trigger Event” will commence upon the occurrence of any of the following: (i) a bankruptcy action of Bass Pro Shops, Cinemark, Live Casino Hotel, or any replacement tenant occupying at least 50% of the space (each, a “Major Tenant”); (ii) a Major Tenant going dark or vacating, on a permanent basis (other than temporary closures due to renovation, closures less than 90 days, or
| THE INFORMATION IN THIS STRUCTURAL AND COLLATERAL TERM SHEET IS NOT COMPLETE AND MAY BE AMENDED PRIOR TO THE TIME OF SALE. THIS TERM SHEET IS NOT AN OFFER TO SELL THESE SECURITIES AND IT IS NOT A SOLICITATION OF AN OFFER TO BUY THESE SECURITIES IN ANY JURISDICTION WHERE THE OFFER OR SALE IS NOT PERMITTED. |
| | 34 | |
| Structural and Collateral Term Sheet | | BMO 2023-C7 |
| No. 2 – Arundel Mills and Marketplace |
closures mandated by law or related to COVID stay-at-home orders); or (iii) a Major Tenant failing to give notice to renew its lease by the earlier of (a) the date required under the lease or (b) the date that is 6 months prior to the lease expiration date.
A “Major Tenant Threshold Amount” means, with respect to (i) the space occupied by Bass Pro, the amount of $6,383,600, (ii) with respect to the space occupied by Cinemark, the amount of $5,359,500 and (iii) with respect to the space occupied by Live Casino Hotel, the amount of $13,037,450.
An “Major Tenant Trigger Event Cure” will commence upon the occurrence of any of the following: (A) with regard to clause (i) of the definition of Major Tenant Trigger Event, (a) Major Tenant has assumed and any applicable bankruptcy court has affirmed such assumption of the Major Tenant lease, and Major Tenant is in occupancy of its full space or (b) at the borrowers’ election, the guarantor has delivered to the lender a guaranty in the applicable Major Tenant Threshold Amount, (B) with regard to clause (ii) of the definition of Major Tenant Trigger Event, (a) the applicable Major Tenant continuously operates its business for at least 30 consecutive days during normal business hours and is paying full rent as is required under the lease or (b) at the borrowers’ election, the guarantor has delivered to the lender a guaranty in the applicable Major Tenant Threshold Amount, and (C) with regard to clause (iii) of the definition of Major Tenant Trigger Event, (a) the date on which Major Tenant renews and/or extends its lease, (b) at least 50% of the applicable Major Tenant space has been leased to one or more new tenants, (c) the applicable Major Tenant Threshold Amount has been deposited in the excess cash reserve account, or (d) at the borrowers’ election, the guarantor has delivered to the lender a guaranty in the applicable Major Tenant Threshold Amount.
Subordinate Debt. None.
Mezzanine Debt. None.
Partial Release. Provided that no event of default exists and a Control Event has not occurred, (I) with respect to a partial prepayment, at any time, and (II) with respect to a partial defeasance, from and after the earlier to occur of (a) December 1, 2026, and (b) the date that is two years after the closing date of the securitization that includes the last note to be securitized, the Arundel Mills and Marketplace Whole Loan documents permit the release of Arundel Marketplace, which has an allocated loan amount of $11,000,000, upon defeasance or prepayment (together with, if prior to the open period, payment of a prepayment fee equal to the greater of 1.00% of the amount prepaid and a yield maintenance premium), as applicable, of 100% of such allocated loan amount of $11,000,000, provided the following conditions, among others, are satisfied: (i) (a) lender’s determination that the post-release debt yield for the remaining property is equal to or greater than the pre-release debt yield for the mortgaged property, or (b) borrower’s partial defeasance or partial prepayment of the loan in an amount that would result in the post-release debt yield for the remaining property being equal to or greater than the pre-release debt yield for the mortgaged property; (ii) an opinion of counsel that the partial release satisfies REMIC related requirements; and (iii) if the property is conveyed to an affiliate, (a) receipt of an officer’s certificate confirming that the intended primary use of the property will not be exclusively for retail, (b) any tenants being relocated to the property from the mall property have been replaced with comparable tenants on comparable rental terms, (c) the release will not have a material adverse effect on the remaining property and (d) a rent roll and leasing plan for the property and the Arundel Mills Marketplace.
Additionally, there is a non-income producing vacant forestry land parcel eligible for free release (without prepayment or defeasance) from the Arundel Mills and Marketplace Whole Loan, the value of which was not deducted from the appraised value in the appraisal, nor was such parcel separately valued in the appraisal.
Ground Lease. None.
| THE INFORMATION IN THIS STRUCTURAL AND COLLATERAL TERM SHEET IS NOT COMPLETE AND MAY BE AMENDED PRIOR TO THE TIME OF SALE. THIS TERM SHEET IS NOT AN OFFER TO SELL THESE SECURITIES AND IT IS NOT A SOLICITATION OF AN OFFER TO BUY THESE SECURITIES IN ANY JURISDICTION WHERE THE OFFER OR SALE IS NOT PERMITTED. |
| | 35 | |
| Structural and Collateral Term Sheet | | BMO 2023-C7 |
| No. 3 – Bala Plaza Portfolio |
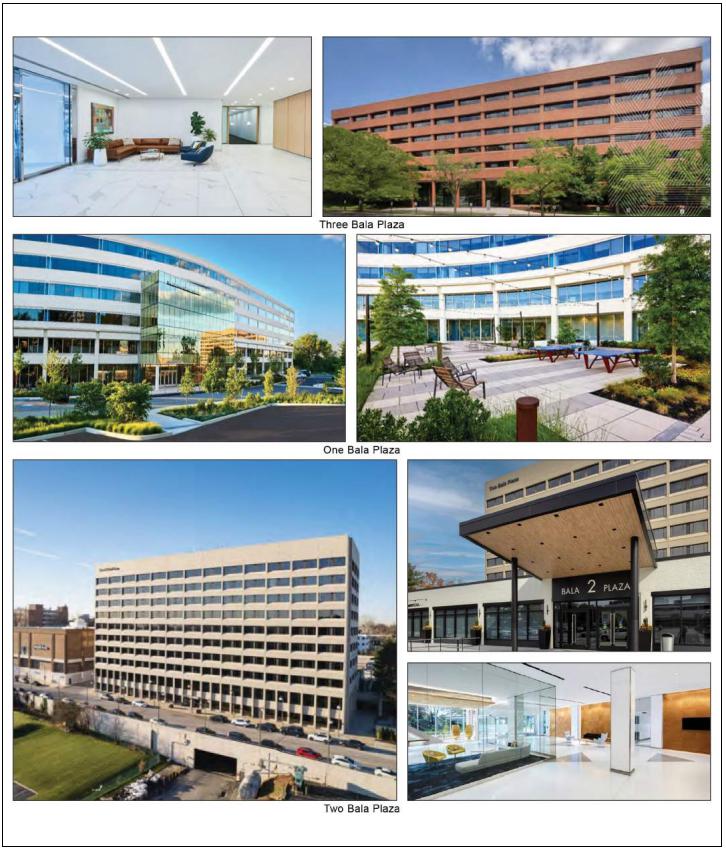
| THE INFORMATION IN THIS STRUCTURAL AND COLLATERAL TERM SHEET IS NOT COMPLETE AND MAY BE AMENDED PRIOR TO THE TIME OF SALE. THIS TERM SHEET IS NOT AN OFFER TO SELL THESE SECURITIES AND IT IS NOT A SOLICITATION OF AN OFFER TO BUY THESE SECURITIES IN ANY JURISDICTION WHERE THE OFFER OR SALE IS NOT PERMITTED. |
| | 36 | |
| Structural and Collateral Term Sheet | | BMO 2023-C7 |
| No. 3 – Bala Plaza Portfolio |
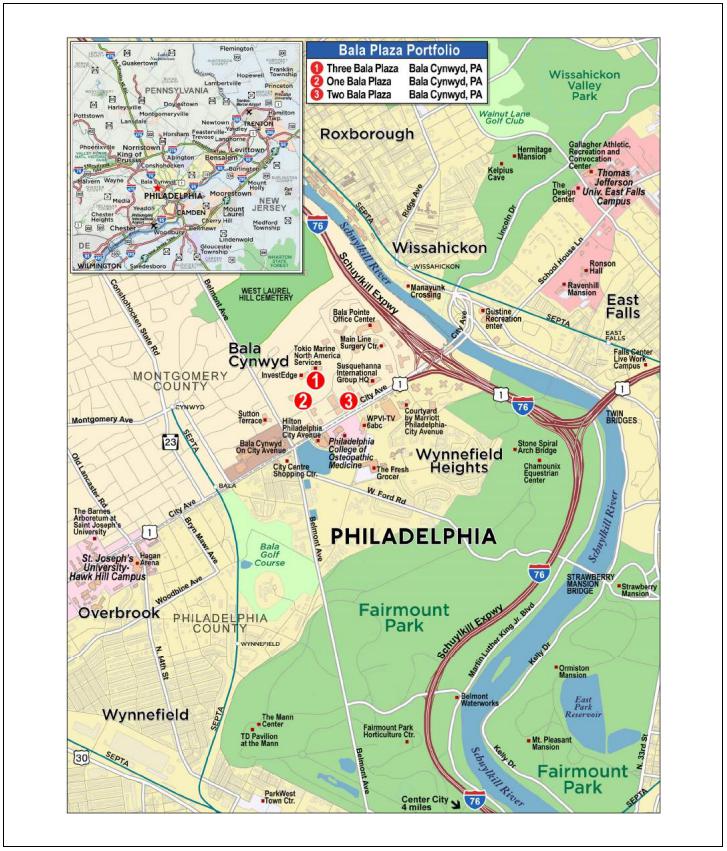
| THE INFORMATION IN THIS STRUCTURAL AND COLLATERAL TERM SHEET IS NOT COMPLETE AND MAY BE AMENDED PRIOR TO THE TIME OF SALE. THIS TERM SHEET IS NOT AN OFFER TO SELL THESE SECURITIES AND IT IS NOT A SOLICITATION OF AN OFFER TO BUY THESE SECURITIES IN ANY JURISDICTION WHERE THE OFFER OR SALE IS NOT PERMITTED. |
| | 37 | |
| Structural and Collateral Term Sheet | | BMO 2023-C7 |
| No. 3 – Bala Plaza Portfolio |
| Mortgage Loan Information | | Property Information |
| Mortgage Loan Seller: | CREFI | | Single Asset / Portfolio: | Portfolio |
| Original Principal Balance(1): | $40,000,000 | | Title: | Fee |
| Cut-off Date Principal Balance(1): | $40,000,000 | | Property Type – Subtype: | Various |
| % of IPB: | 5.4% | | Net Rentable Area (SF): | 1,136,771 |
| Loan Purpose: | Acquisition | | Location: | Bala Cynwyd, PA |
| Borrowers: | Bala Plaza Park LLC, Story of Jonah LLC and Adjmi Bala PropCo LLC | | Year Built / Renovated(5): | Various / Various |
| Borrower Sponsors: | Carolyn Dayon, Harry Adjmi, Eva Vegh and Yael Ishakis | | Occupancy: | 89.4% |
| Interest Rate: | 8.71000% | | Occupancy Date: | 8/30/2023 |
| Note Date: | 11/2/2023 | | 4th Most Recent NOI (As of): | $14,391,911 (12/31/2020) |
| Maturity Date: | 11/6/2028 | | 3rd Most Recent NOI (As of): | $15,021,589 (12/31/2021) |
| Interest-only Period: | 60 months | | 2nd Most Recent NOI (As of): | $14,540,415 (12/31/2022) |
| Original Term: | 60 months | | Most Recent NOI (As of): | $15,493,025 (TTM 8/31/2023) |
| Original Amortization Term: | None | | UW Economic Occupancy: | 89.8% |
| Amortization Type: | Interest Only | | UW Revenues: | $33,476,790 |
| Call Protection(2): | L(3),YM1(50),O(7) | | UW Expenses: | $17,313,636 |
| Lockbox / Cash Management: | Hard / Springing | | UW NOI: | $16,163,153 |
| Additional Debt(1)(6): | Yes | | UW NCF: | $14,744,653 |
| Additional Debt Balance(1)(6): | $59,500,000 / $30,000,000 | | Appraised Value / Per SF: | $210,100,000 / $185 |
| Additional Debt Type(1)(6): | Pari Passu / Mezzanine | | Appraisal Date: | 7/27/2023 |
| | | | | |
| Escrows and Reserves(3) | | Financial Information(1) |
| | Initial | Monthly | Initial Cap | | | Whole Loan | Total Debt |
| Taxes: | $346,446 | $346,446 | N/A | | Cut-off Date Loan / SF: | | $88 | | $114 |
| Insurance: | $56,824 | $28,412 | N/A | | Maturity Date Loan / SF: | | $88 | | $114 |
| Replacement Reserves: | $0 | $23,514 | $846,514 | | Cut-off Date LTV: | | 47.4% | | 61.6% |
| TI / LC: | $5,000,000 | Springing | $2,000,000 | | Maturity Date LTV: | | 47.4% | | 61.6% |
| Other(4): | $3,708,965 | $0 | N/A | | UW NCF DSCR: | | 1.68x | | 1.43x |
| | | | | | UW NOI Debt Yield: | | 16.2% | | 12.5% |
| | | | | | | | |
| Sources and Uses |
| Sources | Proceeds | % of Total | | Uses | Proceeds | % of Total |
Whole Loan(1) | $99,500,000 | 49.5 | % | | Purchase Price | $185,000,000 | 92.0 | % |
| Mezzanine Loan(6) | 30,000,000 | 14.9 | | | Upfront Reserves | 9,112,235 | 4.5 | |
| Borrower Sponsor Equity | 51,299,773 | 25.5 | | | Closing Costs | 6,986,046 | 3.5 | |
| Other Sources(7) | 20,298,509 | 10.1 | | | | | |
| Total Sources | $201,098,281 | 100.0 | % | | Total Uses | $201,098,281 | 100.0 | % |
| (1) | The Bala Plaza Portfolio Mortgage Loan (as defined below) is part of the Bala Plaza Portfolio Whole Loan (as defined below) which is comprised of three pari passu promissory notes with an aggregate original principal balance of $99,500,000. The Bala Plaza Portfolio Whole Loan was originated by Citi Real Estate Funding Inc. (“CREFI”). The Financial Information in the chart above is based on the aggregate outstanding principal balance as of the Cut-off Date of the Bala Plaza Portfolio Whole Loan and the total debt inclusive of a $30,000,000 mezzanine loan. |
| (2) | The borrowers have the option to prepay the Bala Plaza Portfolio Whole Loan in whole but not in part (i) on or after the payment date occurring in May 2028 without the payment of any prepayment premium or (ii) at anytime other than the period commencing 60 days prior to an anticipated securitization of any portion of the Bala Plaza Portfolio Whole Loan and ending 60 days after the closing of such securitization with the payment of a yield maintenance premium. The assumed prepayment lockout period of three payments is based on the closing date of this transaction in December 2023. The actual lockout period may be longer. |
| (3) | For a full description of Escrows and Reserves, please refer to “Escrows and Reserves” below. |
| (4) | Other reserves include an initial garage repair reserve of $2,300,000, an initial unfunded obligations reserve of approximately $1,179,363 and an initial free rent reserve of approximately $229,601. See “Escrows and Reserves” below. |
| (5) | See the “Portfolio Summary” chart below. |
| (6) | See “Mezzanine Debt” below. |
| (7) | Other Sources primarily consists of a seller credit of $15,796,250, security deposit credit of approximately $1,957,748, tenant improvements credit of approximately $1,104,456 and approximately $1,440,054 of other miscellaneous credits. |
| THE INFORMATION IN THIS STRUCTURAL AND COLLATERAL TERM SHEET IS NOT COMPLETE AND MAY BE AMENDED PRIOR TO THE TIME OF SALE. THIS TERM SHEET IS NOT AN OFFER TO SELL THESE SECURITIES AND IT IS NOT A SOLICITATION OF AN OFFER TO BUY THESE SECURITIES IN ANY JURISDICTION WHERE THE OFFER OR SALE IS NOT PERMITTED. |
| | 38 | |
| Structural and Collateral Term Sheet | | BMO 2023-C7 |
| No. 3 – Bala Plaza Portfolio |
The Loan. The third largest mortgage loan (the “Bala Plaza Portfolio Mortgage Loan”) is part of a whole loan (the “Bala Plaza Portfolio Whole Loan”) secured by the borrowers’ fee interests in two office and one mixed use property totaling 1,136,771 square feet located in Bala Cynwyd, Pennsylvania (the “Bala Plaza Portfolio Properties”). The Bala Plaza Portfolio Whole Loan is comprised of three pari passu notes, with an aggregate outstanding principal balance as of the Cut-off Date of $99,500,000. The Bala Plaza Portfolio Whole Loan was originated on November 2, 2023 by CREFI and accrues interest at a fixed rate of 8.71000% per annum. The Bala Plaza Portfolio Whole Loan has an initial term of five years and is interest-only for the full term. The scheduled maturity date of the Bala Plaza Portfolio Whole Loan is the payment date that occurs on November 6, 2028. The Bala Plaza Portfolio Mortgage Loan is evidenced by the non-controlling Note A-2 with an aggregate outstanding principal balance as of the Cut-off Date of $40,000,000. The remaining notes are currently held by CREFI and are expected to be contributed to one or more future securitization trust(s). The relationship between the holders of the Bala Plaza Portfolio Whole Loan is governed by a co-lender agreement as described under “Description of the Mortgage Pool—The Whole Loans—The Outside Serviced Pari Passu Whole Loans” and “The Pooling and Servicing Agreement—Servicing of the Outside Serviced Mortgage Loans” in the Preliminary Prospectus.
| Whole Loan Summary |
| Note | Original Balance | Cut-off Date Balance | Note Holder | Controlling Piece |
| A-1(1) | $50,000,000 | $50,000,000 | CREFI | Yes |
| A-2 | $40,000,000 | $40,000,000 | BMO 2023-C7 | No |
| A-3(1) | $9,500,000 | $9,500,000 | CREFI | No |
| Whole Loan | $99,500,000 | $99,500,000 | | |
| (1) | Expected to be contributed to one or more securitization trust(s). |
The Properties. The Bala Plaza Portfolio Properties consist of three properties located in Bala Cynwyd, Pennsylvania which total 1,136,771 square feet and are comprised of two seven-story, Class A office buildings totaling 390,899 square feet, located at 251 Saint Asaphs Road in Bala Cynwyd, Pennsylvania (the “Three Bala Plaza Property”), a six-story, Class A office property totaling 386,788 square feet located at 231 Saint Asaphs Road in Bala Cynwyd, Pennsylvania (the “One Bala Plaza Property”) and a ten-story, Class A, 359,084 square foot mixed use office / retail property located at 333 East City Avenue in Bala Cynwyd, Pennsylvania (the “Two Bala Plaza Property”).
The Bala Plaza Portfolio Properties are located approximately four miles northwest of the Philadelphia CBD, slightly outside of the city limits. The Bala Plaza Portfolio Properties were built between 1968 and 1983 and were each recently renovated between 2020 and 2021 including approximately $56.0 million of capital improvements between 2017 and 2021. Renovations include an approximately $41.6 million redevelopment of One Bala Plaza along with HVAC upgrades, roof replacement, new restrooms, lobby renovations and fitness center expansion at the Bala Plaza Portfolio Properties.
As of August 30, 2023, the Bala Plaza Portfolio Properties were 89.4% occupied by 85 unique tenants. The largest tenant at the Bala Plaza Portfolio Properties is Tokio Marine North America, Inc. which accounts for 26.0% of NRA and 30.3% of underwritten base rent. Outside of Tokio Marine North America, Inc. no tenant accounts for more than 3.6% of NRA and 5.1% of underwritten base Rent. The Bala Plaza Portfolio Properties have had strong leasing momentum throughout the COVID-19 pandemic with 41 new leases and 56 renewals being executed since January 2020 which account for 41.7% of NRA and 54.9% of underwritten base rent.
| THE INFORMATION IN THIS STRUCTURAL AND COLLATERAL TERM SHEET IS NOT COMPLETE AND MAY BE AMENDED PRIOR TO THE TIME OF SALE. THIS TERM SHEET IS NOT AN OFFER TO SELL THESE SECURITIES AND IT IS NOT A SOLICITATION OF AN OFFER TO BUY THESE SECURITIES IN ANY JURISDICTION WHERE THE OFFER OR SALE IS NOT PERMITTED. |
| | 39 | |
| Structural and Collateral Term Sheet | | BMO 2023-C7 |
| No. 3 – Bala Plaza Portfolio |
The following table presents certain information relating to the Bala Plaza Portfolio Properties:
| Portfolio Summary |
| Property Name | City, State | Year Built / Renovated(1) | Sq. Ft.(2) | Occupancy(2) | Allocated Whole Loan Cut-off Date Balance | % of Allocated Whole Loan Cut-off Date Balance | Appraised Value(1) | U/W NOI(2) | % of U/W NOI |
| Three Bala Plaza | Bala Cynwyd, PA | 1983 / 2020 | 390,899 | 87.1% | $41,102,468 | 41.3 | % | $85,500,000 | $6,964,032 | 43.1 | % |
| One Bala Plaza | Bala Cynwyd, PA | 1968 / 2021 | 386,788 | 88.9% | 39,180,794 | 39.4 | | 81,300,000 | 5,628,610 | 34.8 | |
| Two Bala Plaza | Bala Cynwyd, PA | 1969 / 2020 | 359,084 | 92.6% | 19,216,738 | 19.3 | | 43,300,000 | 3,570,511 | 22.1 | |
| Total | | | 1,136,771 | 89.4% | $99,500,000 | 100.0 | % | $210,100,000 | $16,163,153 | 100.0 | % |
| (2) | Based on the underwritten rent rolls dated August 30, 2023. |
Major Tenants. The three largest tenants based on underwritten base rent are Tokio Marine North America, Inc., Global Indemnity Group, Inc. (“Global Indemnity Group”) and NCS Pearson, Inc.
Tokio Marine North America, Inc. (295,930 square feet; 26.0% of NRA; 30.3% of underwritten base rent): Tokio Marine North America, Inc. leases 90,687 square feet of space at the Three Bala Plaza Property and 205,243 square feet of space at the One Bala Plaza Property. Tokio Marine North America, Inc. is an insurance solutions conglomerate that manages multiple companies including Philadelphia Insurance Companies (“Philadelphia Insurance”) and Tokio Marine America Insurance Company.
Tokio Marine North America, Inc. operates Philadelphia Insurance out of the One Bala Plaza Property which serves as its headquarters. Philadelphia Insurance is a national property/casualty and professional liability insurance carrier that designs, markets and underwrites commercial products and services. Philadelphia Insurance has over 2,000 employees and serves over 120 specialized business markets across the United States. The Philadelphia Insurance lease is guaranteed by Tokio Marine North America, Inc. Philadelphia Insurance has been at the One Bala Plaza Property since June 2017 and has a lease term through January 2035 with no termination and one renewal option for five or ten years.
Tokio Marine North America, Inc. operates Tokio Marine North America Services out of the Three Bala Plaza Property which serves as its headquarters. Tokio Marine North America Services provides services to Tokio Marine Group companies in finance and accounting, information technology, internal audit, actuarial, legal, facilities, corporate communications and human resources supporting more than 3,000 people and $4 billion in annual premium revenue. Tokio Marine North America Services has been at the Three Bala Plaza Property since October 2019 and has a lease term through January 2035 with no termination and one renewal option for five or ten years.
Global Indemnity Group (40,517 square feet; 3.6% of NRA; 5.1% of underwritten base rent): Global Indemnity Group (NYSE: GBLI) is a specialty property and casualty insurance company that provides services for small to middle-market businesses. Global Indemnity Group has three offices across the United States and one office in Ireland with its lease at the Three Bala Plaza Property serving as its United States Headquarters. Global Indemnity Group has been at the Three Bala Plaza Property since March 2007 and has a current lease term through December 2029 with two five-year renewal options. Global Indemnity Group has a one-time right to terminate its lease as of December 31, 2025, upon 12 months’ prior written notice to the landlord.
NCS Pearson, Inc. (37,395 square feet; 3.3% of NRA; 4.5% of underwritten base rent): NCS Pearson, Inc. provides software applications and technologies for education, testing, assessment and data management. NCS Pearson, Inc. has been a tenant at the Three Bala Plaza Property since May 2011 and has a current lease term through July 2026 with no termination options and one, five-year renewal option.
| THE INFORMATION IN THIS STRUCTURAL AND COLLATERAL TERM SHEET IS NOT COMPLETE AND MAY BE AMENDED PRIOR TO THE TIME OF SALE. THIS TERM SHEET IS NOT AN OFFER TO SELL THESE SECURITIES AND IT IS NOT A SOLICITATION OF AN OFFER TO BUY THESE SECURITIES IN ANY JURISDICTION WHERE THE OFFER OR SALE IS NOT PERMITTED. |
| | 40 | |
| Structural and Collateral Term Sheet | | BMO 2023-C7 |
| No. 3 – Bala Plaza Portfolio |
Appraisal. According to the appraisal, the Bala Plaza Portfolio Whole Loan had an “as is” appraised value of $210,100,000 as of July 27, 2023. The table below shows the appraiser’s “as-is” conclusions.
| Bala Plaza Portfolio(1) |
| Property | Property Type - Subtype | Value(2) | Capitalization Rate(2) |
| Three Bala Plaza | Office – Suburban | $85,500,000 | 7.50% |
| One Bala Plaza | Office – Suburban | $81,300,000 | 7.50% |
| Two Bala Plaza | Mixed Use – Office/Retail | $43,300,000 | 7.50% |
| Total / Wtd. Avg | | $210,100,000 | 7.50% |
| (2) | The appraiser used a discounted cash flow analysis utilizing a 9.0% discount rate and 7.75% terminal capitalization rate to arrive at its value. The capitalization rates shown above represent the direct capitalization rate. |
Environmental. According to the Phase I environmental assessments dated August 3, 2023, there was no evidence of any recognized environmental conditions at the Bala Plaza Portfolio Properties.
The following table presents certain information relating to the historical and current occupancy of the Bala Plaza Portfolio Properties:
| Historical and Current Occupancy(1) |
| 2019 | 2020 | 2021 | 2022 | Current(2) |
| 91.6% | 90.8% | 90.8% | 92.8% | 89.4% |
| (1) | Historical Occupancies are the annual average physical occupancy of each respective year. |
| (2) | Based on the underwritten rent rolls dated August 30, 2023. |
| THE INFORMATION IN THIS STRUCTURAL AND COLLATERAL TERM SHEET IS NOT COMPLETE AND MAY BE AMENDED PRIOR TO THE TIME OF SALE. THIS TERM SHEET IS NOT AN OFFER TO SELL THESE SECURITIES AND IT IS NOT A SOLICITATION OF AN OFFER TO BUY THESE SECURITIES IN ANY JURISDICTION WHERE THE OFFER OR SALE IS NOT PERMITTED. |
| | 41 | |
| Structural and Collateral Term Sheet | | BMO 2023-C7 |
| No. 3 – Bala Plaza Portfolio |
The following table presents certain information relating to the largest tenants based on underwritten base rent at the Bala Plaza Portfolio Properties:
| Top Tenant Summary(1) |
| Tenant | Property | Ratings Moody’s/S&P/Fitch(2) | Net Rentable Area (SF) | % of Total NRA | UW Base Rent PSF(3) | UW Base Rent(3) | % of Total UW Base Rent(3) | Lease Expiration Date |
| Tokio Marine North America, Inc.(4) | Various | NR/NR/NR | 295,930 | 26.0 | % | $30.70 | $9,083,693 | 30.3 | % | 1/31/2035 |
| Global Indemnity Group, Inc.(5) | Three Bala Plaza | NR/NR/NR | 40,517 | 3.6 | | $37.50 | 1,519,388 | 5.1 | | 12/31/2029 |
| NCS Pearson, Inc. | Three Bala Plaza | NR/NR/NR | 37,395 | 3.3 | | $36.35 | 1,359,295 | 4.5 | | 7/31/2026 |
| Beasley Media Group, LLC | One Bala Plaza | NR/NR/NR | 36,858 | 3.2 | | $35.00 | 1,290,030 | 4.3 | | 3/31/2029 |
| Investedge, Inc. | Three Bala Plaza | NR/NR/NR | 28,563 | 2.5 | | $36.50 | 1,042,550 | 3.5 | | 5/31/2026 |
| Vitalyst, LLC | One Bala Plaza | NR/NR/NR | 26,530 | 2.3 | | $34.75 | 921,918 | 3.1 | | 12/31/2025 |
| Massachusetts Mutual Life Insurance Company | Two Bala Plaza | Aa3/AA+/AA | 24,985 | 2.2 | | $36.50 | 911,953 | 3.0 | | 6/30/2025 |
| Harmelin Media, Inc. | Three Bala Plaza | NR/NR/NR | 23,810 | 2.1 | | $36.50 | 869,065 | 2.9 | | 6/30/2024 |
| United States Postal Service | Two Bala Plaza | NR/NR/NR | 20,479 | 1.8 | | $37.33 | 764,482 | 2.6 | | 4/30/2026 |
| Manko Gold Katcher & Fox, LLP(6) | Three Bala Plaza | NR/NR/NR | 19,736 | 1.7 | | $38.50 | 759,836 | 2.5 | | 3/31/2033 |
| Major Tenants | | | 554,803 | 48.8 | % | $33.39 | $18,522,209 | 61.8 | % | |
| Other Tenants | | | 461,947 | 40.6 | | $24.73 | $11,425,080 | 38.2 | | |
| Total Occupied | | | 1,016,750 | 89.4 | % | $29.45 | $29,947,289 | 100.0 | % | |
| Vacant Space | | | 120,021 | 10.6 | | | | | |
| Total / Wtd. Avg. | | | 1,136,771 | 100.0 | % | | | | |
| (1) | Based on the underwritten rent rolls dated August 30, 2023. |
| (2) | In certain instances, ratings provided are those of the parent company of the entity shown, whether or not the parent company guarantees the lease. |
| (3) | UW Base Rent PSF, UW Base Rent and % of Total UW Base Rent include straight-line rent steps of $66,561 and contractual rent steps through September 1, 2024 for the Three Bala Plaza Property and Two Bala Plaza Property and through October 1, 2024 for the One Bala Plaza Property totaling $450,694. |
| (4) | Tokio Marine North America, Inc. leases 90,687 square feet of space at the Three Bala Plaza Property and 205,243 square feet of space at the One Bala Plaza Property. |
| (5) | Global Indemnity Group, Inc. has the one-time right to terminate its lease effective December 31, 2025, by providing written notice to landlord on or before December 31, 2024, and the payment of a termination fee. |
| (6) | Manko Gold Katcher & Fox, LLP has the one-time right to terminate its lease effective August 15, 2029 by providing written notice to landlord on or before August 15, 2028 and the payment of a termination fee. |
| THE INFORMATION IN THIS STRUCTURAL AND COLLATERAL TERM SHEET IS NOT COMPLETE AND MAY BE AMENDED PRIOR TO THE TIME OF SALE. THIS TERM SHEET IS NOT AN OFFER TO SELL THESE SECURITIES AND IT IS NOT A SOLICITATION OF AN OFFER TO BUY THESE SECURITIES IN ANY JURISDICTION WHERE THE OFFER OR SALE IS NOT PERMITTED. |
| | 42 | |
| Structural and Collateral Term Sheet | | BMO 2023-C7 |
| No. 3 – Bala Plaza Portfolio |
The following table presents certain information relating to tenant lease expirations at the Bala Plaza Portfolio Properties:
| Lease Rollover Schedule(1)(2) |
| Year | Number of Leases Expiring | Net Rentable Area Expiring | % of NRA Expiring | UW Base Rent Expiring(3) | % of UW Base Rent Expiring(3) | Cumulative Net Rentable Area Expiring | Cumulative % of NRA Expiring | Cumulative UW Base Rent Expiring(3) | Cumulative % of UW Base Rent Expiring(3) |
| Vacant | NAP | 120,021 | 10.6 | % | NAP | NA | P | 120,021 | 10.6% | NAP | NAP |
| 2023 & MTM | 0 | 0 | 0.0 | | $0 | 0.0 | % | 120,021 | 10.6% | $0 | 0.0% |
| 2024(4) | 25 | 102,899 | 9.1 | | 3,538,571 | 11.8 | | 222,920 | 19.6% | $3,538,571 | 11.8% |
| 2025(5) | 12 | 84,073 | 7.4 | | 2,980,916 | 10.0 | | 306,993 | 27.0% | $6,519,487 | 21.8% |
| 2026(6) | 16 | 139,662 | 12.3 | | 5,031,551 | 16.8 | | 446,655 | 39.3% | $11,551,038 | 38.6% |
| 2027 | 7 | 116,970 | 10.3 | | 667,046 | 2.2 | | 563,625 | 49.6% | $12,218,084 | 40.8% |
| 2028 | 10 | 59,787 | 5.3 | | 2,266,649 | 7.6 | | 623,412 | 54.8% | $14,484,733 | 48.4% |
| 2029 | 4 | 88,280 | 7.8 | | 3,198,465 | 10.7 | | 711,692 | 62.6% | $17,683,198 | 59.0% |
| 2030 | 3 | 31,311 | 2.8 | | 1,100,265 | 3.7 | | 743,003 | 65.4% | $18,783,463 | 62.7% |
| 2031 | 1 | 14,237 | 1.3 | | 452,025 | 1.5 | | 757,240 | 66.6% | $19,235,488 | 64.2% |
| 2032 | 2 | 8,329 | 0.7 | | 303,882 | 1.0 | | 765,569 | 67.3% | $19,539,370 | 65.2% |
| 2033 | 3 | 31,367 | 2.8 | | 1,200,535 | 4.0 | | 796,936 | 70.1% | $20,739,905 | 69.3% |
| 2034 & Beyond(7) | 2 | 339,835 | 29.9 | | 9,207,384 | 30.7 | | 1,136,771 | 100.0% | $29,947,289 | 100.0% |
| Total | 85 | 1,136,771 | 100.0 | % | $29,947,289 | 100.0 | % | | | | |
| (1) | Based on the underwritten rent rolls dated August 30, 2023. |
| (2) | Certain tenants have more than one lease. Certain tenants may have lease termination or contraction options that are exercisable prior to the originally stated expiration date of the subject lease and that are not considered in the lease rollover schedule. |
| (3) | UW Base Rent Expiring, % of UW Base Rent Expiring, Cumulative UW Base Rent Expiring and Cumulative % of UW Base Rent Expiring include straight-line rent steps of $66,561 and contractual rent steps through September 1, 2024 for the Three Bala Plaza Property and Two Bala Plaza Property and through October 1, 2024 for the One Bala Plaza Property totaling $450,694. |
| (4) | Includes one tenant, Pagano’s Market Bala, Inc at the One Bala Plaza Property with no UW Base Rent attributed to this tenant. |
| (5) | Includes one tenant, Top Hat Coffee Co. LLC at the Two Bala Plaza Property with no UW Base Rent attributed to this tenant. |
| (6) | Includes one tenant, American Bowtie, Inc at the Two Bala Plaza Property with no UW Base Rent attributed to this tenant. |
| (7) | 2034 & Beyond is inclusive of 40,562 square feet of storage space to which no lease or rent is attributable. |
| THE INFORMATION IN THIS STRUCTURAL AND COLLATERAL TERM SHEET IS NOT COMPLETE AND MAY BE AMENDED PRIOR TO THE TIME OF SALE. THIS TERM SHEET IS NOT AN OFFER TO SELL THESE SECURITIES AND IT IS NOT A SOLICITATION OF AN OFFER TO BUY THESE SECURITIES IN ANY JURISDICTION WHERE THE OFFER OR SALE IS NOT PERMITTED. |
| | 43 | |
| Structural and Collateral Term Sheet | | BMO 2023-C7 |
| No. 3 – Bala Plaza Portfolio |
The following table presents certain information relating to operating history and underwritten cash flows at the Bala Plaza Portfolio Properties:
| Operating History and Underwriting Net Cash Flow |
| | 2019 | 2020 | 2021 | 2022 | TTM(1) | Underwritten | Per Square Foot | %(2) | |
| In-Place Rent | $24,789,504 | $26,660,349 | $27,912,429 | $27,333,932 | $28,358,463 | $29,430,034 | $25.89 | 80.6 | % |
| Contractual Rent Steps(3) | 0 | 0 | 0 | 0 | 0 | 517,255 | 0.46 | 1.4 | |
| Potential Income from Vacant Space | 0 | 0 | 0 | 0 | 0 | 3,725,588 | 3.28 | 10.2 | |
| Gross Potential Rent | $24,789,504 | $26,660,349 | $27,912,429 | $27,333,932 | $28,358,463 | $33,672,877 | $29.62 | 92.2 | % |
| Total Reimbursements | 2,871,453 | 1,644,112 | 2,618,582 | 3,882,587 | 4,078,929 | 2,849,514 | 2.51 | 7.8 | |
| Total Gross Income | $27,660,957 | $28,304,461 | $30,531,011 | $31,216,518 | $32,437,391 | $36,522,391 | $32.13 | 100.0 | % |
| Other Income(4) | 505,433 | 500,746 | 521,499 | 655,220 | 687,649 | 679,987 | 0.60 | 1.9 | |
| (Vacancy/Credit Loss) | 0 | 0 | 0 | 0 | 0 | (3,725,588) | (3.28) | (10.2 | ) |
| Effective Gross Income | $28,166,390 | $28,805,208 | $31,052,511 | $31,871,739 | $33,125,041 | $33,476,790 | $29.45 | 91.7 | % |
| Management Fee | 928,183 | 988,838 | 1,084,279 | 1,070,431 | 1,157,461 | 1,004,304 | 0.88 | 3.0 | |
| Real Estate Taxes | 3,872,860 | 3,971,722 | 4,040,953 | 4,125,520 | 3,990,605 | 4,306,720 | 3.79 | 12.9 | |
| Insurance | 161,259 | 169,607 | 191,143 | 261,531 | 262,208 | 324,911 | 0.29 | 1.0 | |
| Other Expenses(5) | 9,771,722 | 9,283,130 | 10,714,546 | 11,873,843 | 12,221,742 | 11,677,701 | 10.27 | 34.9 | |
| Total Expenses | $14,734,024 | $14,413,296 | $16,030,922 | $17,331,324 | $17,632,016 | $17,313,636 | $15.23 | 51.7 | % |
| Net Operating Income | $13,432,366 | $14,391,911 | $15,021,589 | $14,540,415 | $15,493,025 | $16,163,153 | $14.22 | 48.3 | % |
| Capital Expenditures | 0 | 0 | 0 | 0 | 0 | 282,171 | 0.25 | 0.8 | |
| TI / LC | 0 | 0 | 0 | 0 | 0 | 1,136,329 | 1.00 | 3.4 | |
| Net Cash Flow | $13,432,366 | $14,391,911 | $15,021,589 | $14,540,415 | $15,493,025 | $14,744,653 | $12.97 | 44.0 | % |
| (1) | TTM reflects the trailing 12-month period ending August 31, 2023. |
| (2) | % column represents percent of Total Gross Income for all revenue lines and represents percent of Effective Gross Income for the remainder of fields. |
| (3) | Underwritten Contractual Rent Steps include straight-line rent steps of $66,561 and contractual rent steps through September 1, 2024 for the Three Bala Plaza Property and Two Bala Plaza Property and through October 1, 2024 for the One Bala Plaza Property totaling $450,694. |
| (4) | Other Income includes storage rent, license fees and percentage rent for Pagano’s Market Bala, Inc, Top Hat Coffee Co. LLC and American Bowtie, Inc. |
| (5) | Other Expenses consist of payroll and benefits, cleaning, repairs and maintenance, utilities and general, administrative expenses and non-reimbursable expenses. |
The Market. The Bala Plaza Portfolio Properties are located in Bala Cynwyd, Pennsylvania within the Philadelphia-Camden-Wilmington, PA-NJ-DE-MD MSA (“Philadelphia MSA”). The Bala Plaza Portfolio Properties are located off of East City Avenue and Saint Asaphs Road with nearby access to Interstate 76 within a mile of the Bala Plaza Portfolio Properties. Other major transportation arterials within proximity of the Bala Plaza Portfolio Properties include US Route 30 and US Route 13.
According to the appraisal, the Bala Plaza Portfolio Properties are located in the Bala Cynwyd/Narberth submarket of the Philadelphia MSA. As of the second quarter of 2023, the Bala Cynwyd/Narberth submarket had a total office inventory of 3,741,473 square feet, a vacancy rate of 13.6%, average asking rent of $35.39 per square foot and positive net absorption of 42,469 square feet in the first half of 2023.
| THE INFORMATION IN THIS STRUCTURAL AND COLLATERAL TERM SHEET IS NOT COMPLETE AND MAY BE AMENDED PRIOR TO THE TIME OF SALE. THIS TERM SHEET IS NOT AN OFFER TO SELL THESE SECURITIES AND IT IS NOT A SOLICITATION OF AN OFFER TO BUY THESE SECURITIES IN ANY JURISDICTION WHERE THE OFFER OR SALE IS NOT PERMITTED. |
| | 44 | |
| Structural and Collateral Term Sheet | | BMO 2023-C7 |
| No. 3 – Bala Plaza Portfolio |
The following table presents certain information relating to comparable office leases at Bala Plaza Portfolio Properties:
| Comparable Office Rental Summary(1) |
| Property Name | Tenant | Suite Size (SF) | Commencement | Lease Term (Yrs) | Rent (PSF) |
| Bala Plaza Portfolio | Various | Various | Various | Various | $29.45(2) |
| One Belmont | Quality Progression | 11,900 SF | July 2023 | 10.4 yrs | $32.00 |
| Five Tower Bridge | Crown Caste USA Inc. | 29,150 SF | July 2023 | 10.7 yrs | $35.16 |
| 100 4 Falls Corporate Ctr | Burns White | 22,119 SF | March 2023 | 5.0 yrs | $32.00 |
| Swedesford Road Office | Trinseo | 25,314 SF | September 2022 | 10.0 yrs | $28.41 |
| One Presidential | Pep Boys | 35,950 SF | February 2022 | 10.0 yrs | $30.50 |
| Five Towe Bridge | Teksystems | 16,874 SF | January 2022 | 6.0 yrs | $41.00 |
| (2) | Based on the underwritten rent roll dated August 30, 2023. |
The Borrowers. The borrowers are Bala Plaza Park LLC, Story of Jonah LLC and Adjmi Bala PropCo LLC, as tenants in common with respect to the Bala Plaza Portfolio Whole Loan. Each borrower is a Delaware limited liability company and single-purpose entity having at least one independent director in its organizational structure. Legal counsel to the borrowers delivered a non-consolidation opinion in connection with the origination of the Bala Plaza Portfolio Whole Loan.
The Borrower Sponsors. The borrower sponsors and non-recourse carveout guarantors are Carolyn Dayon, Harry Adjmi, Eva Vegh and Yael Ishakis. Carolyn Dayon is an experienced real estate property management professional and is the co-founder and operator of MS Management, LLC and Mint Management LLC. Harry Adjmi helps run A&H Acquisitions, a Manhattan based privately held real estate investment company with over 100 properties in its portfolio. Eva Vegh has a background in real estate sales and real estate development. She founded Woodstone Properties, LLC in 2011 to acquire and develop new projects. Lastly, Yael Ishakis is a licensed mortgage broker and vice president at FM Home Loans.
Property Management. The Bala Plaza Portfolio Properties are managed by Bala Plaza MGMT LLC, a borrower-affiliated management company.
Escrows and Reserves. At origination of the Bala Plaza Portfolio Whole Loan, the borrowers deposited approximately (i) $346,446 into a reserve account for real estate taxes, (ii) $56,824 into a reserve account for insurance premiums, (iii) $5,000,000, into a reserve account for tenant improvements and leasing commissions, (iv) $2,300,000 into a reserve account for garage repairs, (v) $1,179,363 into a reserve account for unfunded obligations and (vi) $229,601 into a reserve account for free rent.
Tax Reserve – The borrowers are required to deposit into a real estate tax reserve, on a monthly basis, 1/12 of the taxes that the lender estimates will be payable over the next-ensuing 12-month period (initially estimated to be approximately $346,446).
Insurance Reserve – The borrowers are required to deposit into an insurance reserve, on a monthly basis, 1/12 of the amount which will be sufficient to pay the insurance premiums due for the renewal of coverage afforded by such policies (initially estimated to be approximately $28,412).
Replacement Reserve – The borrowers are required to deposit into a replacement reserve, on a monthly basis, $23,514, subject to a cap equal to approximately $846,514.
TI / LC Reserve – On each monthly payment date following the first date on which the balance of funds on deposit in the tenant improvements and leasing commissions reserve account is less than $2,000,000, the borrowers are required to deposit approximately $165,779 into such account, subject to a cap of $2,000,000.
| THE INFORMATION IN THIS STRUCTURAL AND COLLATERAL TERM SHEET IS NOT COMPLETE AND MAY BE AMENDED PRIOR TO THE TIME OF SALE. THIS TERM SHEET IS NOT AN OFFER TO SELL THESE SECURITIES AND IT IS NOT A SOLICITATION OF AN OFFER TO BUY THESE SECURITIES IN ANY JURISDICTION WHERE THE OFFER OR SALE IS NOT PERMITTED. |
| | 45 | |
| Structural and Collateral Term Sheet | | BMO 2023-C7 |
| No. 3 – Bala Plaza Portfolio |
Lockbox / Cash Management. The Bala Plaza Portfolio Whole Loan is structured with a hard lockbox and springing cash management. The borrowers were required to, (x) upon the origination of the Bala Plaza Portfolio Whole Loan, deliver a notice to each tenant directing them to remit all payments under the applicable lease directly to the lender-controlled lockbox account (or to the borrowers to deposit such sums into the lockbox account in accordance with the terms of the Bala Plaza Portfolio Whole Loan documents) and (y) within two days after the post office deposit box is opened in connection with lockbox account, send updated notices directing such tenants to pay all rent and other sums due under the applicable lease directly to the lender-controlled lockbox account. All revenue received by the borrowers, or the property manager, are required to be deposited in the lockbox account promptly following receipt. All funds deposited into the lockbox are required to be transferred on each business day to or at the direction of the borrowers unless a Trigger Period (as defined below) exists and the lender elects (in its sole and absolute discretion) to deliver a restricted account notice, whereby the lender instructs the institution maintaining the lockbox account to transfer all funds on deposit in the lockbox account on each business day to the cash management account. Upon the occurrence and during the continuance of a Trigger Period, if lender elects to deliver a restricted account notice, all funds in the lockbox account are required to be swept on each business day to a lender-controlled cash management account to be applied and disbursed in accordance with the Bala Plaza Portfolio Whole Loan documents, and all excess cash flow funds remaining in the cash management account after the application of such funds (i) to the extent that a Trigger Period has occurred and is continuing (other than due solely to the existence of a Mezzanine Loan Trigger Period (as defined below)), may be held by the lender in an excess cash flow reserve account as additional collateral for the Bala Plaza Portfolio Whole Loan and (ii) to the extent that a Trigger Period due solely to the existence of a Mezzanine Loan Trigger Period has occurred and is continuing, be deposited into a reserve account for the payment of amounts owed under the Bala Plaza Portfolio Mezzanine Loan (as defined below). Upon the cure of the applicable Trigger Period, so long as no other Trigger Period exists, the lender is required to return any amounts remaining on deposit in the excess cash flow reserve account to the borrowers.
A “Trigger Period” means a period (A) commencing upon the earliest of (i) the occurrence and continuance of an event of default, (ii) the debt service coverage ratio being less than 1.10x, (iii) the occurrence of a Specified Tenant Trigger Period (as defined below) and (iv) the occurrence of a Mezzanine Loan Trigger Period; and (B) expiring upon (w) with regard to clause (i) above, the cure (if applicable) of such event of default, (x) with regard to clause (ii) above, the date that the debt service coverage ratio is equal to or greater than 1.15x for two consecutive calendar quarters, (y) with regard to clause (iii) above, a Specified Tenant Trigger Period ceasing to exist and (z) with regard to clause (iv) above, the cessation of all Mezzanine Loan Trigger Periods.
A “Specified Tenant” means as applicable (i) Tokio Marine North America, Inc. d/b/a Philadelphia Insurance Companies, (ii) any other lease(s) of the Specified Tenant space (or any portion thereof), (iii) any other tenant (together with affiliates thereof) that (A) accounts for 20% or more of the total rental income from the Bala Plaza Portfolio Properties or (B) leases (in the aggregate) not less than 20% of leasable square footage of the Bala Plaza Portfolio Properties and (iv) any guarantor(s) or parent companies or other persons providing credit support for the applicable related Specified Tenant lease including, without limitation, Philadelphia Consolidated Holding Corp., a Pennsylvania corporation.
A “Specified Tenant Trigger Period” means a period (A) commencing upon the first to occur of (i) Specified Tenant being in default under the applicable Specified Tenant lease beyond any applicable notice and cure periods, (ii) Specified Tenant failing to be in actual, physical possession of the Specified Tenant space (or applicable portion thereof), (iii) Specified Tenant failing to be open for business during customary hours and/or “going dark” in the Specified Tenant space (or applicable portion thereof), (iv) Specified Tenant giving notice that it is terminating its lease for all or any portion of the Specified Tenant space (or applicable portion thereof), (v) any termination or cancellation of any Specified Tenant lease (including, without limitation, rejection in any bankruptcy or similar insolvency proceeding) and/or any Specified Tenant lease failing to otherwise be in full force and effect, (vi) any bankruptcy or similar insolvency of Specified Tenant, and (vii) the Specified Tenant failing to provide written notice to the borrowers extending or renewing the applicable Specified Tenant lease for the applicable Specified Tenant renewal term on or prior to the earlier to occur of (1) twelve months prior to the expiration of the then applicable term of the applicable Specified Tenant lease and (2) the date required under a Specified Tenant lease by which the tenant thereunder is required to give notice of its exercise of a renewal option thereunder, in each case, in accordance with the applicable terms and conditions thereof and the Bala Plaza Portfolio Whole Loan documents; and (B) expiring upon the first to occur of the lender’s receipt of evidence reasonably acceptable to the lender of (1) the satisfaction of the applicable Specified Tenant Cure Conditions (as defined below), or (2) the borrowers leasing the entire Specified Tenant space (or applicable portion thereof) pursuant to one or more leases with terms of at least five years in accordance with the applicable terms and conditions of the Bala Plaza Portfolio Whole Loan documents, the applicable tenant(s) under
| THE INFORMATION IN THIS STRUCTURAL AND COLLATERAL TERM SHEET IS NOT COMPLETE AND MAY BE AMENDED PRIOR TO THE TIME OF SALE. THIS TERM SHEET IS NOT AN OFFER TO SELL THESE SECURITIES AND IT IS NOT A SOLICITATION OF AN OFFER TO BUY THESE SECURITIES IN ANY JURISDICTION WHERE THE OFFER OR SALE IS NOT PERMITTED. |
| | 46 | |
| Structural and Collateral Term Sheet | | BMO 2023-C7 |
| No. 3 – Bala Plaza Portfolio |
such lease(s) being in actual, physical occupancy of the space demised under its lease, all contingencies to effectiveness of such lease have expired or been satisfied, each such lease has commenced and a rent commencement date has been established.
“Specified Tenant Cure Conditions” means each of the following, as applicable (i) the Specified Tenant has cured all defaults under the applicable Specified Tenant lease, (ii) the applicable Specified Tenant is in actual, physical possession of the Specified Tenant space (or applicable portion thereof), open to the public for business during customary hours and not “dark” in the Specified Tenant space (or applicable portion thereof), (iii) the applicable Specified Tenant has revoked or rescinded all termination or cancellation notices with respect to the applicable Specified Tenant lease and has re-affirmed the applicable Specified Tenant lease as being in full force and effect, (iv) in the event the Specified Tenant Trigger Period is due to the applicable Specified Tenant’s failure to extend or renew the applicable Specified Tenant lease in accordance with clause (vii) of the definition of Specified Tenant Trigger Period, the applicable Specified Tenant has renewed or extended the applicable Specified Tenant lease in accordance with the terms thereof and the Bala Plaza Portfolio Whole Loan documents for the Specified Tenant renewal term, (v) with respect to any applicable bankruptcy or insolvency proceedings involving the applicable Specified Tenant and/or the applicable Specified Tenant lease, the applicable Specified Tenant is no longer insolvent or subject to any bankruptcy or insolvency proceedings and has affirmed the applicable Specified Tenant lease pursuant to final, non-appealable order of a court of competent jurisdiction, and (vi) the applicable Specified Tenant is paying full, unabated rent under the applicable Specified Tenant lease.
“Mezzanine Loan Trigger Period” means any period (i) commencing upon the date that the mezzanine lender delivers written notice to lender that a mezzanine loan event of default exists, and (ii) ending on the date that the mezzanine lender delivers written notice to Lender that a mezzanine loan event of default no longer exists.
Subordinate Debt. None.
Mezzanine Debt. Concurrently with the origination of the Bala Plaza Portfolio Whole Loan, Bala Plaza, Inc. originated a mezzanine loan (the “Bala Plaza Portfolio Mezzanine Loan” and together with the Bala Plaza Whole Loan, the “Bala Plaza Portfolio Total Debt”) in the amount of $30,000,000 to be secured by the mezzanine borrowers’ interests in the borrowers. The Bala Plaza Portfolio Mezzanine Loan accrues interest at a rate of 5.0000% per annum to be paid as part of each monthly debt service payment amount. The Bala Plaza Portfolio Mezzanine Loan has a final maturity date of November 6, 2028. An intercreditor agreement between the lender under the Bala Plaza Portfolio Whole Loan and the lender under the Bala Plaza Portfolio Mezzanine Loan was executed simultaneously with the origination of the Bala Plaza Portfolio Mezzanine Loan.
Partial Release. Provided that no Trigger Period is continuing under the Bala Plaza Portfolio Whole Loan documents, at any time prior to the maturity date, except during the period commencing (a) sixty days prior to an anticipated securitization of the Bala Plaza Portfolio Whole Loan and ending (b) sixty days after the Bala Plaza Portfolio Whole Loan has been sold to such securitization, the borrowers may obtain the release of one or more individual Bala Plaza Portfolio Properties in connection with an arms-length sale of such Bala Plaza Portfolio Property to a third party unaffiliated with any borrower, provided that, among other conditions: (i) the borrowers prepay the debt in an amount equal to the greater of (a) 125% of the allocated loan amount for the individual Bala Plaza Portfolio Property, and (b) 100% of the net sales proceeds applicable to such individual Bala Plaza Portfolio Property, (ii) the borrowers have delivered a REMIC opinion, (iii) any conditions to such partial release under the Bala Plaza Portfolio Mezzanine Loan documents have been satisfied, or the Bala Plaza Portfolio Mezzanine Loan has been fully repaid, (iv) as of the date of notice of the partial release and the consummation of the partial release, after giving effect to the release, the debt service coverage ratio with respect to the remaining Bala Plaza Portfolio Properties is greater than the greater of (a) the debt service coverage ratio as of the origination of the Bala Plaza Portfolio Whole Loan, and (b) the debt service coverage ratio for all of the Bala Plaza Portfolio Properties immediately prior to the date of notice of the partial release or the consummation of the partial release, as applicable, (v) as of the date of notice of the partial release and the consummation of the partial release, after giving effect to the release, the debt yield with respect to the remaining Bala Plaza Portfolio Properties is equal to or greater than the greater of (a) the debt yield as of the origination of the Bala Plaza Portfolio Whole Loan, and (b) the debt yield for all of the Bala Plaza Portfolio Properties immediately prior to the date of notice of the partial release or the consummation of the partial release, as applicable, and (vi) as of the date of notice of the partial release and the consummation of the partial release, after giving effect to the release, the loan-to-value ratio with respect to the remaining Bala Plaza Portfolio Properties is no greater than the lesser of (a) the loan-to-value ratio as of the origination of the Bala Plaza Portfolio Whole Loan, and (b) the loan-to-value ratio for all
| THE INFORMATION IN THIS STRUCTURAL AND COLLATERAL TERM SHEET IS NOT COMPLETE AND MAY BE AMENDED PRIOR TO THE TIME OF SALE. THIS TERM SHEET IS NOT AN OFFER TO SELL THESE SECURITIES AND IT IS NOT A SOLICITATION OF AN OFFER TO BUY THESE SECURITIES IN ANY JURISDICTION WHERE THE OFFER OR SALE IS NOT PERMITTED. |
| | 47 | |
| Structural and Collateral Term Sheet | | BMO 2023-C7 |
| No. 3 – Bala Plaza Portfolio |
of the Bala Plaza Portfolio Properties immediately prior to the date of notice of the partial release or the consummation of the partial release, as applicable.
Provided that no Trigger Period is continuing under the related Bala Plaza Portfolio Whole Loan documents, at any time prior to the maturity date, except during the period commencing (a) sixty days prior to an anticipated securitization of the Bala Plaza Portfolio Whole Loan and ending (b) sixty days after the Bala Plaza Portfolio Whole Loan has been sold to such securitization, the borrowers may obtain the release of one or more parcels of land within the boundary of the Bala Plaza Portfolio Properties that (x) does not include any portion of any of the portions of the Bala Plaza Portfolio Properties indicated in the diagrams attached as Schedule V to the Bala Plaza Portfolio Whole Loan Agreement,(y) is separately subdivided, and (z) complies with the requirements of the development agreement encumbering the Bala Plaza Portfolio Properties, provided that, among other conditions: (i) the borrowers have delivered a REMIC opinion, and (ii) any conditions to such partial release under the Bala Plaza Portfolio Mezzanine Loan documents have been satisfied, or the Bala Plaza Portfolio Mezzanine Loan has been fully repaid.
Ground Lease. None.
| THE INFORMATION IN THIS STRUCTURAL AND COLLATERAL TERM SHEET IS NOT COMPLETE AND MAY BE AMENDED PRIOR TO THE TIME OF SALE. THIS TERM SHEET IS NOT AN OFFER TO SELL THESE SECURITIES AND IT IS NOT A SOLICITATION OF AN OFFER TO BUY THESE SECURITIES IN ANY JURISDICTION WHERE THE OFFER OR SALE IS NOT PERMITTED. |
| | 48 | |
| Structural and Collateral Term Sheet | | BMO 2023-C7 |
| No. 4 – RTL Retail Portfolio |
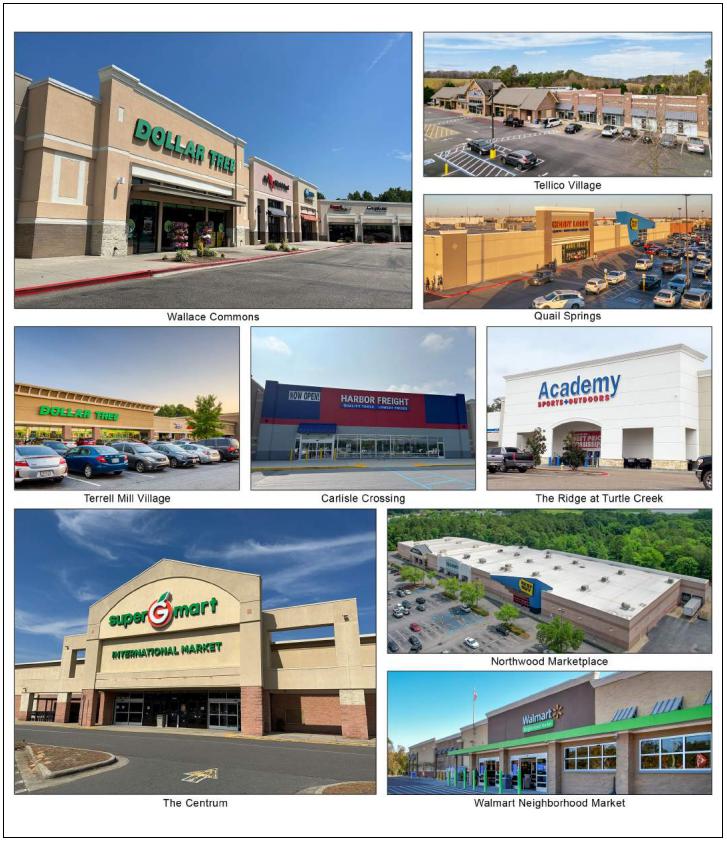
| THE INFORMATION IN THIS STRUCTURAL AND COLLATERAL TERM SHEET IS NOT COMPLETE AND MAY BE AMENDED PRIOR TO THE TIME OF SALE. THIS TERM SHEET IS NOT AN OFFER TO SELL THESE SECURITIES AND IT IS NOT A SOLICITATION OF AN OFFER TO BUY THESE SECURITIES IN ANY JURISDICTION WHERE THE OFFER OR SALE IS NOT PERMITTED. |
| | 49 | |
| Structural and Collateral Term Sheet | | BMO 2023-C7 |
| No. 4 – RTL Retail Portfolio |
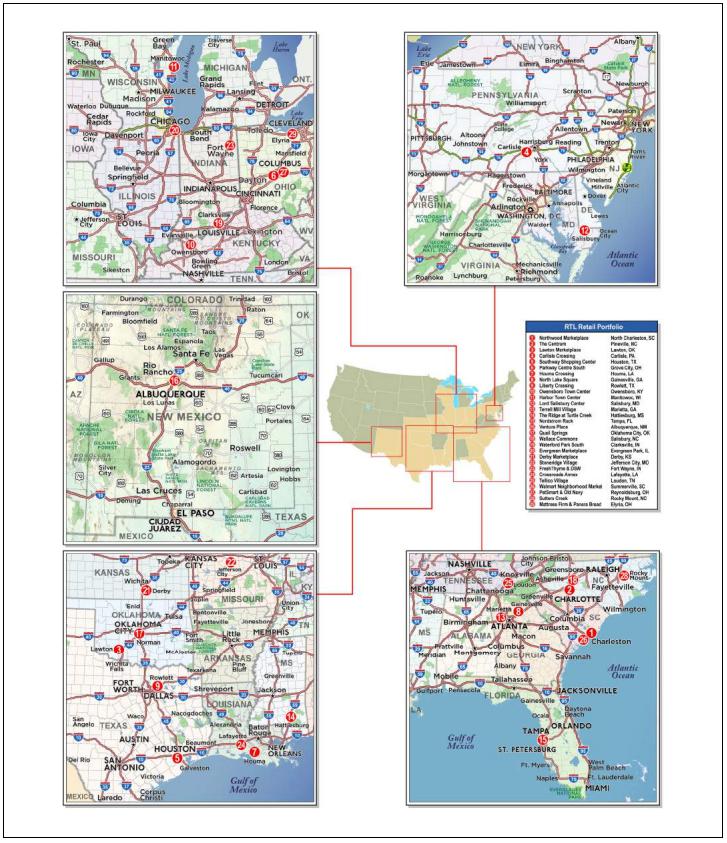
| THE INFORMATION IN THIS STRUCTURAL AND COLLATERAL TERM SHEET IS NOT COMPLETE AND MAY BE AMENDED PRIOR TO THE TIME OF SALE. THIS TERM SHEET IS NOT AN OFFER TO SELL THESE SECURITIES AND IT IS NOT A SOLICITATION OF AN OFFER TO BUY THESE SECURITIES IN ANY JURISDICTION WHERE THE OFFER OR SALE IS NOT PERMITTED. |
| | 50 | |
| Structural and Collateral Term Sheet | | BMO 2023-C7 |
| No. 4 – RTL Retail Portfolio |
| Mortgage Loan Information | | Property Information |
| Mortgage Loan Sellers: | KeyBank | | Single Asset / Portfolio: | Portfolio |
| Original Principal Balance(1): | $36,000,000 | | Title: | Fee |
| Cut-off Date Principal Balance(1): | $36,000,000 | | Property Type – Subtype: | Retail – Various |
| % of IPB: | 4.9% | | Net Rentable Area (SF): | 3,117,102 |
| Loan Purpose: | Recapitalization | | Location: | Various |
| Borrowers(2): | Various | | Year Built / Renovated: | Various / Various |
| Borrower Sponsor(3): | Global Net Lease, Inc. | | Occupancy: | 95.3% |
| Interest Rate: | 6.44575% | | Occupancy Date: | 9/1/2023 |
| Note Date: | 8/30/2023 | | 4th Most Recent NOI (As of)(6): | NAV |
| Maturity Date: | 9/6/2033 | | 3rd Most Recent NOI (As of)(6): | NAV |
| Interest-only Period: | 120 months | | 2nd Most Recent NOI (As of)(7): | $27,051,928 (12/31/2022) |
| Original Term: | 120 months | | Most Recent NOI (As of): | $33,695,199 (TTM 6/30/2023) |
| Original Amortization Term: | None | | UW Economic Occupancy: | 95.0% |
| Amortization Type: | Interest Only | | UW Revenues: | $53,888,610 |
| Call Protection(4): | L(12),YM1(15),DorYM1(86),O(7) | | UW Expenses: | $17,916,793 |
| Lockbox / Cash Management: | Hard / Springing | | UW NOI: | $35,971,817 |
| Additional Debt(1): | Yes | | UW NCF: | $33,409,746 |
| Additional Debt Balance(1): | $224,000,000 | | Appraised Value / Per SF(8): | $508,200,000 / $163 |
| Additional Debt Type(1): | Pari Passu | | Appraisal Date(8): | 7/31/2023 |
| | | | | |
| | | | | |
| Escrows and Reserves(5) | | Financial Information(1) |
| | Initial | Monthly | Initial Cap | | Cut-off Date Loan / SF: | $83 | |
| Taxes: | $4,174,654 | $596,379 | N/A | | Maturity Date Loan / SF: | $83 | |
| Insurance: | $5,240 | $1,310 | N/A | | Cut-off Date LTV(8): | 51.2% | |
| Replacement Reserve: | $0 | Springing | N/A | | Maturity Date LTV(8): | 51.2% | |
| TI / LC: | $0 | Springing | N/A | | UW NCF DSCR: | 1.97x | |
| Immediate Repairs: | $1,027,622 | $0 | N/A | | UW NOI Debt Yield: | 13.8% | |
| Environmental Reserve: | $977,500 | $0 | N/A | | | | |
| Outstanding TI / LC: | $9,576,923 | $0 | N/A | | | | |
| Outstanding Free Rent: | $311,601 | $0 | N/A | | | | |
| Outstanding Gap Rent: | $241,832 | $0 | N/A | | | | |
| | | | | | | |
| Sources and Uses |
| Sources | Proceeds | % of Total | | Uses | Proceeds | % of Total | |
| Whole Loan | $260,000,000 | 100.0% | | Return of Equity | $238,632,813 | 91.8 | % |
| | | | | Reserves | 16,315,372 | 6.3 | |
| | | | | Closing Costs | 5,051,814 | 1.9 | |
| Total Sources | $260,000,000 | 100.0% | | Total Uses | $260,000,000 | 100.0 | % |
| (1) | The RTL Retail Portfolio Mortgage Loan (as defined below) is part of a whole loan evidenced by 17 pari passu notes with an aggregate outstanding principal balance as of the Cut-off Date of $260.0 million (the “RTL Retail Portfolio Whole Loan”). The Financial Information in the chart above reflects the RTL Retail Portfolio Whole Loan. |
| (2) | The borrowers are 29 Delaware limited liability companies and special purpose entities that are subsidiaries of The Necessity Retail REIT Operating Partnership, L.P. See the footnotes to Annex A-1 in the Preliminary Prospectus for the names of each entity. |
| (3) | Global Net Lease, Inc. and The Necessity Retail REIT, Inc. completed a merger on September 12, 2023. Before the expected merger, the borrower sponsor was The Necessity Retail REIT Operating Partnership, L.P., but with the completion of the merger, the borrower sponsor is now Global Net Lease, Inc. |
| (4) | Defeasance of the RTL Retail Portfolio Whole Loan is permitted at any time after the date that is the earliest to occur of (i) two years after the closing date of the securitization that includes the last note to be securitized and (ii) August 30, 2026. The RTL Retail Portfolio Whole Loan may be voluntarily prepaid in full, but not in part, after the payment date in September 2024, with the payment of a yield maintenance premium if such prepayment occurs prior to the payment date in March 2033. The RTL Retail Portfolio Whole Loan may be voluntarily prepaid at any time on or after the payment date in March 2033 without the payment of a yield maintenance premium. The assumed defeasance lockout period of 27 payments is based on the anticipated closing date of the BMO 2023-C7 securitization trust in December 2023. The actual defeasance lockout period may be longer. |
| (5) | For a full description of Escrows and Reserves, see “Escrows and Reserves” below. |
| (6) | Historical cash flows are unavailable as 24 of the 29 RTL Retail Portfolio Properties were acquired in 2022 and such information is not available. |
| (7) | 24 of the mortgaged properties were acquired between February 2022 and April 2022. For such mortgaged properties, 2022 cash flows only include financials from the acquisition date through December 2022. |
| THE INFORMATION IN THIS STRUCTURAL AND COLLATERAL TERM SHEET IS NOT COMPLETE AND MAY BE AMENDED PRIOR TO THE TIME OF SALE. THIS TERM SHEET IS NOT AN OFFER TO SELL THESE SECURITIES AND IT IS NOT A SOLICITATION OF AN OFFER TO BUY THESE SECURITIES IN ANY JURISDICTION WHERE THE OFFER OR SALE IS NOT PERMITTED. |
| | 51 | |
| Structural and Collateral Term Sheet | | BMO 2023-C7 |
| No. 4 – RTL Retail Portfolio |
| (8) | The Appraised Value represents the “as portfolio” value which includes a portfolio premium to the portfolio properties if sold together on a bulk basis. The sum of the “as-is” appraised values on a stand-alone basis is $498,190,000. The Cut-off Date LTV Ratio and Maturity Date LTV Ratio based on the aggregate stand-alone appraised “as-is” values are both 52.2%. |
The Loan. The RTL Retail Portfolio mortgage loan (the “RTL Retail Portfolio Mortgage Loan”) is part of a fixed rate whole loan secured by the borrowers’ fee interests in a 3,117,102 square foot retail portfolio comprised of 29 properties located in 19 states (the “RTL Retail Portfolio Properties”). The RTL Retail Portfolio Whole Loan was co-originated by Barclays, BMO, Société Générale Financial Corporation (“SGFC”) and KeyBank National Association (“KeyBank”), consists of 17 pari passu notes and accrues interest at a rate of 6.44575% per annum. Morgan Stanley Bank, N.A. (“MSNBA”) purchased Note A-3 from Barclays on September 21, 2023. The RTL Retail Portfolio Whole Loan has a 10-year term, is interest-only for the full term of the loan and accrues interest on an Actual/360 basis. The non-controlling Notes A-12, A-13 and A-14, with an aggregate Cut-off Date Balance of $36,000,000, will be included in the BMO 2023-C7 securitization trust. The RTL Retail Portfolio Whole Loan is serviced pursuant to the pooling and servicing agreement for the BBCMS 2023-C22 securitization trust. See “Description of the Mortgage Pool—The Whole Loans—The Serviced Pari Passu Whole Loans” and “The Pooling and Servicing Agreement” in the Preliminary Prospectus.
| Whole Loan Summary |
| Note | Original Balance | Cut-off Date Balance | | Note Holder | Controlling Piece |
| A-1 | $28,500,000 | $28,500,000 | | BBCMS 2023-C22 | Yes |
| A-2 | $32,500,000 | $32,500,000 | | BBCMS 2023-C21 | No |
| A-3(1) | $30,000,000 | $30,000,000 | | MSBNA | No |
| A-4 | $15,000,000 | $15,000,000 | | BBCMS 2023-C22 | No |
| A-5(1) | $18,800,000 | $18,800,000 | | SGFC | No |
| A-6(1) | $12,500,000 | $12,500,000 | | SGFC | No |
| A-7(1) | $10,033,333 | $10,033,333 | | SGFC | No |
| A-8 | $7,000,000 | $7,000,000 | | BBCMS 2023-C22 | No |
| A-9 | $30,000,000 | $30,000,000 | | BBCMS 2023-C21 | No |
| A-10 | $14,000,000 | $14,000,000 | | BMO | No |
| A-11 | $5,333,334 | $5,333,334 | | BBCMS 2023-C22 | No |
| A-12 | $15,000,000 | $15,000,000 | | BMO 2023-C7 | No |
| A-13 | $11,000,000 | $11,000,000 | | BMO 2023-C7 | No |
| A-14 | $10,000,000 | $10,000,000 | | BMO 2023-C7 | No |
| A-15 | $8,000,000 | $8,000,000 | | BBCMS 2023-C22 | No |
| A-16 | $7,333,333 | $7,333,333 | | KeyBank | No |
| A-17 | $5,000,000 | $5,000,000 | | BBCMS 2023-C22 | No |
| Whole Loan | $260,000,000 | $260,000,000 | | | |
| (1) | Expected to be contributed to one or more future securitization trust(s). Note denominations are subject to change. |
The Properties. The RTL Retail Portfolio Properties consist of 29 retail centers located in 19 different states and totaling 3,117,102 square feet. 27 of the RTL Retail Portfolio Properties are anchored, while the other two are shadow anchored. The RTL Retail Portfolio Properties were 95.3% occupied by 188 unique tenants as of September 1, 2023. The borrower sponsor acquired five of the RTL Retail Portfolio Properties in 2017 and the rest were acquired in 2022. Since the acquisition of the remaining 24 RTL Retail Portfolio Properties, occupancy of the RTL Retail Portfolio Properties has been at least 94.0%. Eight of the RTL Retail Portfolio Properties are anchored or shadow anchored by 11 tenants (the “Non-Collateral Tenants”), and the space occupied by the Non-Collateral Tenants is not part of the collateral securing the RTL Retail Portfolio Whole Loan. The information relating to the RTL Retail Portfolio Properties in this term sheet does not include any space occupied by the Non-Collateral Tenants, unless otherwise expressly stated herein.
| THE INFORMATION IN THIS STRUCTURAL AND COLLATERAL TERM SHEET IS NOT COMPLETE AND MAY BE AMENDED PRIOR TO THE TIME OF SALE. THIS TERM SHEET IS NOT AN OFFER TO SELL THESE SECURITIES AND IT IS NOT A SOLICITATION OF AN OFFER TO BUY THESE SECURITIES IN ANY JURISDICTION WHERE THE OFFER OR SALE IS NOT PERMITTED. |
| | 52 | |
| Structural and Collateral Term Sheet | | BMO 2023-C7 |
| No. 4 – RTL Retail Portfolio |
The following table presents certain information relating to the RTL Retail Portfolio Properties:
| Portfolio Summary |
| Property Name | Location | Year Built /
Renovated | SF(1) | Occ. %(2) | Allocated
Cut-off Date Whole Loan Amount (“ALA”) | % of ALA | Appraised Value | % of Appraised Value |
| Northwoods Marketplace | North Charleston, SC | 1998 / NAP | 236,078 | 97.8% | $21,500,000 | 8.3 | % | $41,200,000 | 8.1 | % |
| The Centrum | Pineville, NC | 1997 / 2020 | 274,446 | 79.9%(2) | 17,210,000 | 6.6 | | 36,800,000 | 7.2 | |
| Lawton Marketplace | Lawton, OK | 2013 / 2023 | 196,715 | 98.9% | 16,180,000 | 6.2 | | 31,000,000 | 6.1 | |
| Carlisle Crossing | Carlisle, PA | 2005 / NAP | 152,487 | 95.3% | 15,760,000 | 6.1 | | 30,200,000 | 5.9 | |
| Southway Shopping Center | Houston, TX | 1976-2011 /
NAP | 181,836 | 100.0% | 15,660,000 | 6.0 | | 30,000,000 | 5.9 | |
| Parkway Centre South | Grove City, OH | 2004 / NAP | 131,887 | 100.0% | 13,550,000 | 5.2 | | 25,000,000 | 4.9 | |
| Houma Crossing | Houma, LA | 2008 / NAP | 181,423 | 83.4% | 12,940,000 | 5.0 | | 24,800,000 | 4.9 | |
| North Lake Square | Gainesville, GA | 2015, 2016 /
NAP | 140,116 | 99.0% | 12,790,000 | 4.9 | | 24,500,000 | 4.8 | |
| Liberty Crossing | Rowlett, TX | 2007 / NAP | 105,769 | 93.2% | 12,470,000 | 4.8 | | 23,900,000 | 4.7 | |
| Owensboro Town Center | Owensboro, KY | 1992, 1996,
1997, 1999 /
2010, 2015 | 164,941 | 90.5% | 11,850,000 | 4.6 | | 22,700,000 | 4.5 | |
| Harbor Town Center | Manitowoc, WI | 2005 / NAP | 138,744 | 93.0% | 9,600,000 | 3.7 | | 18,400,000 | 3.6 | |
| Lord Salisbury Center | Salisbury, MD | 2005 / NAP | 113,821 | 98.8% | 9,140,000 | 3.5 | | 15,600,000 | 3.1 | |
| Terrell Mill Village | Marietta, GA | 1974 / 2012 | 75,184 | 100.0% | 8,980,000 | 3.5 | | 17,200,000 | 3.4 | |
| The Ridge at Turtle Creek | Hattiesburg, MS | 1992 / NAP | 98,705 | 100.0% | 8,090,000 | 3.1 | | 15,500,000 | 3.0 | |
| Nordstrom Rack | Tampa, FL | 1994 / NAP | 45,457 | 97.7% | 7,720,000 | 3.0 | | 14,800,000 | 2.9 | |
| Ventura Place | Albuquerque, NM | 2008 / NAP | 66,595 | 96.0% | 7,350,000 | 2.8 | | 14,090,000 | 2.8 | |
| Quail Springs | Oklahoma City, OK | 1984 / 2004 | 100,404 | 100.0% | 6,940,000 | 2.7 | | 13,300,000 | 2.6 | |
| Wallace Commons | Salisbury, NC | 2008 / NAP | 98,509 | 98.5% | 6,680,000 | 2.6 | | 12,800,000 | 2.5 | |
| Waterford Park South | Clarksville, IN | 2005, 2006 /
2008 | 91,906 | 93.4% | 6,580,000 | 2.5 | | 12,600,000 | 2.5 | |
| Evergreen Marketplace | Evergreen Park, IL | 2013 / NAP | 49,842 | 100.0% | 5,950,000 | 2.3 | | 11,400,000 | 2.2 | |
| Derby Marketplace | Derby, KS | 2015 / NAP | 100,000 | 100.0% | 5,480,000 | 2.1 | | 10,500,000 | 2.1 | |
| Stoneridge Village | Jefferson City, MO | 2008 / NAP | 72,483 | 100.0% | 5,350,000 | 2.1 | | 9,300,000 | 1.8 | |
| FreshThyme & DSW | Fort Wayne, IN | 1985 / 2014 | 49,033 | 100.0% | 3,910,000 | 1.5 | | 7,500,000 | 1.5 | |
| Crossroads Annex | Lafayette, LA | 2012 / NAP | 40,578 | 100.0% | 3,710,000 | 1.4 | | 7,100,000 | 1.4 | |
| Tellico Village | Loudon, TN | 2008 / NAP | 40,928 | 100.0% | 3,440,000 | 1.3 | | 6,600,000 | 1.3 | |
| Walmart Neighborhood Market | Summerville, SC | 2015 / NAP | 51,441 | 100.0% | 3,240,000 | 1.2 | | 6,200,000 | 1.2 | |
| PetSmart & Old Navy | Reynoldsburg, OH | 2012 / NAP | 28,970 | 100.0% | 2,970,000 | 1.1 | | 5,700,000 | 1.1 | |
| Sutters Creek | Rocky Mount, NC | 1996 / NAP | 80,004 | 100.0% | 2,690,000 | 1.0 | | 5,150,000 | 1.0 | |
| Mattress Firm & Panera Bread | Elyria, OH | 2016 / NAP | 8,800 | 100.0% | 2,270,000 | 0.9 | | 4,350,000 | 0.9 | |
| Total | | | 3,117,102 | 95.3% | $260,000,000 | 100.0 | % | $508,200,000(3) | 100.0 | % |
| (1) | Information is based on the underwritten rent roll as of dated September 1, 2023. |
| (2) | Occupancy excludes 11 non-collateral tenants at The Centrum mortgaged property, including Home Depot and Best Buy. |
| (3) | The total Appraised Value represents the “as portfolio” value which includes a portfolio premium to the portfolio properties if sold together on a bulk basis. The sum of the “as-is” appraised values on a stand-alone basis is $498,190,000. |
| THE INFORMATION IN THIS STRUCTURAL AND COLLATERAL TERM SHEET IS NOT COMPLETE AND MAY BE AMENDED PRIOR TO THE TIME OF SALE. THIS TERM SHEET IS NOT AN OFFER TO SELL THESE SECURITIES AND IT IS NOT A SOLICITATION OF AN OFFER TO BUY THESE SECURITIES IN ANY JURISDICTION WHERE THE OFFER OR SALE IS NOT PERMITTED. |
| | 53 | |
| Structural and Collateral Term Sheet | | BMO 2023-C7 |
| No. 4 – RTL Retail Portfolio |
Major Tenants.
Hobby Lobby Stores, Inc. (277,512 square feet; 8.9% of portfolio NRA; 5.4% of portfolio underwritten base rent). Hobby Lobby Stores, Inc. (“Hobby Lobby”) was founded in 1972 and has over 900 stores today as the largest privately-owned arts-and-crafts retailer in the world. Hobby Lobby has over 43,000 employees and operates in 48 different states. Hobby Lobby had revenue of approximately $7.7 billion in 2022, which was an approximately 20.3% year-over-year increase from 2021. Hobby Lobby occupies 55,126 square feet at the Quail Springs mortgaged property with a lease expiration date of September 30, 2028, and three, five-year renewal options remaining. Hobby Lobby occupies 55,710 square feet at the Sutters Creek mortgaged property with a lease expiration date of August 31, 2031, and two, five-year renewal options remaining. Hobby Lobby occupies 56,676 square feet at the Houma Crossing mortgaged property with a lease expiration date of August 31, 2031, and two, five-year renewal options remaining. Hobby Lobby occupies 55,000 square feet at the Derby Marketplace mortgaged property with a lease expiration date of September 30, 2030, and four, five-year renewal options remaining. Hobby Lobby occupies 55,000 square feet at the North Lake Square mortgaged property with a lease expiration date of October 31, 2030, and three, five-year renewal options remaining. Hobby Lobby does not have any termination options at any of the mortgaged properties.
Academy Sports and Outdoors (182,928 square feet; 5.9% of portfolio NRA; 5.2% of portfolio underwritten base rent). Academy Sports and Outdoors (“Academy Sports”) is a full-line sporting goods and outdoor recreation retailer throughout the United States. Academy Sports was founded in 1938 and now operates 271 stores across 18 different states. Academy Sports has plans to expand by opening 13 to 15 stores in 2023 and 120 to 140 stores by the end of 2027. Academy Sports occupies 45,000 square feet at the Stoneridge Village mortgaged property with a lease expiration date of February 28, 2039, and three, five-year renewal options remaining. Academy Sports occupies 75,760 square feet at The Ridge at Turtle Creek mortgaged property with a lease expiration date of January 31, 2035, and four, five-year renewal options remaining. Academy Sports occupies 62,168 square feet at the Lawton Marketplace mortgaged property with a lease expiration date of January 31, 2033, and three, five-year renewal options remaining. Academy Sports does not have any termination options at any of the mortgaged properties.
Ross Dress For Less (167,328 square feet; 5.4% of portfolio NRA; 4.8% of portfolio underwritten base rent). Ross Dress For Less (“Ross”) is an American chain of discount department stores headquartered in Dublin, California. Ross is the largest off-price retailer in the U.S., operating 1,704 stores in 40 different states, the District of Columbia and Guam. Ross reported 2022 revenues of $18.7 billion and was named a Fortune 500 company. Ross Stores Inc., the parent company of Ross, has approximately 100,000 employees. Ross occupies 27,657 square feet at the Liberty Crossing mortgaged property with a lease expiration date of January 31, 2026, and three, five-year renewal options remaining. Ross occupies 31,815 square feet at the Southway Shopping Center mortgaged property with a lease expiration date of January 31, 2026, and two, five-year renewal options remaining. Ross occupies 27,623 square feet at the Waterford Park South mortgaged property with a lease expiration date of January 31, 2025, and four, five-year renewal options remaining. Ross occupies 25,046 square feet at the Evergreen Marketplace mortgaged property with a lease expiration date of January 31, 2029, and four, five-year renewal options remaining. Ross occupies 30,187 square feet at the Lord Salisbury Center mortgaged property with a lease expiration date of January 31, 2026, and two, five-year renewal options remaining. Ross occupies 25,000 square feet at the Derby Marketplace mortgaged property with a lease expiration date of January 31, 2027, and has four, five-year renewal options remaining. Ross does not have any termination options at any of the mortgaged properties.
Appraisals. According to the appraisals, the RTL Retail Portfolio Properties had an “as portfolio” value of $508,200,000 as of July 31, 2023, which is inclusive of an approximately 2.0% portfolio premium to the portfolio properties if sold together on a bulk basis. Additionally, the RTL Retail Portfolio Properties had an aggregate “as-is” appraised value of $498,190,000 as of between July 7, 2023, and July 25, 2023.
| Appraisal Valuation Summary(1) |
| Property | Appraised Value | Capitalization Rate(2) |
| RTL Retail Portfolio Properties | $508,200,000 | 7.39% |
| (2) | Represents the weighted average capitalization rate based on the individual appraised values of each of the RTL Retail Portfolio Properties. |
| THE INFORMATION IN THIS STRUCTURAL AND COLLATERAL TERM SHEET IS NOT COMPLETE AND MAY BE AMENDED PRIOR TO THE TIME OF SALE. THIS TERM SHEET IS NOT AN OFFER TO SELL THESE SECURITIES AND IT IS NOT A SOLICITATION OF AN OFFER TO BUY THESE SECURITIES IN ANY JURISDICTION WHERE THE OFFER OR SALE IS NOT PERMITTED. |
| | 54 | |
| Structural and Collateral Term Sheet | | BMO 2023-C7 |
| No. 4 – RTL Retail Portfolio |
Environmental. According to the Phase I environmental reports (each, an “ESA”) each dated August 1, 2023, a recognized environmental condition (a “REC”) was found at the Terrell Mill Village mortgaged property (3.5% ALA, 2.4% of portfolio NRA) in connection with dry cleaning operations at the mortgaged property that included the use of Perchloroethylene, which impacted the soil and groundwater, from 1973 until approximately 2005. A subsurface investigation was recommended at the Terrell Mill Village mortgaged property in connection with the REC. Environmental insurance was obtained at origination of the RTL Retail Portfolio Whole Loan, with an expiration date of February 11, 2032, that will cover such contamination. At origination, the borrowers reserved $977,500 to cover the cost of further testing to determine certain vapor intrusion conditions exist and to mitigate any such intrusion, as described in the RTL Retail Portfolio Whole Loan documents. Additionally, a controlled recognized environmental condition (a “CREC”) was identified at the Evergreen Marketplace mortgaged property (2.3% ALA, 1.6% of portfolio NRA) in connection with the former use as a golf course, which contained an underground storage tank (a “UST”) that caused a release into the soil. The UST case was issued a no further action determination with a use restriction, which states that the mortgaged property may only be used for industrial and commercial purposes. Based on report remediation activities, locations of the affected areas relative to the mortgaged property, and confirmation soil analytical results from a 2012 report, historical uses of the Evergreen Marketplace mortgaged property are considered a CREC and the ESA recommends continued compliance with the use restriction. See “Description of the Mortgage Pool—Statistical Characteristics of the Mortgage Loans—Environmental Considerations” in the Preliminary Prospectus.
The following table presents certain information relating to the historical and current occupancy of the RTL Retail Portfolio Properties:
| Historical and Current Occupancy(1) |
| 2020(2)(3) | 2021(2) | 2022 | Current(4) |
| 76.5% | 90.7% | 94.1% | 95.3% |
| (1) | Historical occupancy is as of December 31 of each respective year. |
| (2) | Based on occupancy statistics at the Liberty Crossing, Southway Shopping Center, Northwoods Marketplace, The Centrum, and Quail Springs mortgaged properties, which were acquired by the borrower sponsor in 2017. The other 24 mortgaged properties had not yet been acquired by the borrower sponsor, and such information was not available. These five mortgaged properties were 93.6% occupied as of the end of 2022 and 92.5% occupied as of September 1, 2023. |
| (3) | The 2020 historical occupancy of 76.5% is driven by The Centrum mortgaged property which was 39.0% occupied. The Centrum mortgaged property’s occupancy increased to 78.0% in 2021 driven by a new 20-year lease for 108,714 square feet to Super G Market, a family-owned grocery store. |
| (4) | Current Occupancy is as of September 1, 2023. |
| THE INFORMATION IN THIS STRUCTURAL AND COLLATERAL TERM SHEET IS NOT COMPLETE AND MAY BE AMENDED PRIOR TO THE TIME OF SALE. THIS TERM SHEET IS NOT AN OFFER TO SELL THESE SECURITIES AND IT IS NOT A SOLICITATION OF AN OFFER TO BUY THESE SECURITIES IN ANY JURISDICTION WHERE THE OFFER OR SALE IS NOT PERMITTED. |
| | 55 | |
| Structural and Collateral Term Sheet | | BMO 2023-C7 |
| No. 4 – RTL Retail Portfolio |
The following table presents certain information relating to the largest tenants based on net rentable area at the RTL Retail Portfolio Properties:
| Top Ten Tenant Summary(1) |
| Tenant | Property / Property Count | Ratings
Moody’s/S&P/ Fitch(2) | Net Rentable Area (SF) | % of
Total NRA | UW Base Rent PSF(3) | UW Base Rent(3) | % of Total
UW Base Rent(3) | Lease
Exp. Date | Sales PSF(4) | Occupancy Cost(4) |
| Hobby Lobby | 5(5) | NR / NR / NR | 277,512 | 8.9 | % | $7.74 | $2,149,125 | 5.4% | Various(5) | NAV | NAV |
| Academy Sports | 3(6) | NR / BB / NR | 182,928 | 5.9 | | $11.27 | $2,060,914 | 5.2% | Various(6) | NAV | NAV |
| Ross | 6(7) | A2 / BBB+ / NR | 167,328 | 5.4 | | $11.48 | $1,921,113 | 4.8% | Various(7) | $552.59(8) | 3.2%(8) |
| PetSmart | 9(9) | B3 / B+ / NR | 158,353 | 5.1 | | $15.38 | $2,434,699 | 6.1% | Various(9) | NAV | NAV |
| Best Buy | 4(10) | A3 / BBB+ / NR | 150,981 | 4.8 | | $9.77 | $1,475,221 | 3.7% | Various(10) | NAV | NAV |
| Kohls Corporation | 2(11) | Ba3 / BB / BBB- | 137,062 | 4.4 | | $6.89 | $943,882 | 2.4% | 1/31/2029 | NAV | NAV |
| TJ Maxx | 5(12) | A2 / A / NR | 123,913 | 4.0 | | $10.11 | $1,252,852 | 3.1% | Various(12) | $447.52(13) | 3.8%(13) |
| Super G Mart | The Centrum | NR / NR / NR | 108,714 | 3.5 | | $6.00 | $652,284 | 1.6% | 5/31/2042 | NAV | NAV |
| Michaels | 4(14) | Caa2 / B- / NR | 88,275 | 2.8 | | $12.11 | $1,069,053 | 2.7% | Various(14) | $151.34(15) | 10.5%(15) |
| Five Below | 9(16) | NR / NR / NR | 79,239 | 2.5 | | $16.75 | $1,326,940 | 3.3% | Various(16) | NAV | NAV |
| Top Ten Tenants | | | 1,474,305 | 47.3 | % | $10.37 | $15,286,082 | 38.4% | | | |
| | | | | | | | | | | |
| Non Top Ten Tenants | | 1,496,417 | 48.0 | % | $16.39 | $24,519,919 | 61.6% | | | |
| | | | | | | | | | | |
| Occupied Collateral Total / Wtd. Avg. | 2,970,722 | 95.3 | % | $13.40 | $39,806,001 | 100.0% | | | |
| | | | | | | | | | | |
| Vacant Space | | | 146,380 | 4.7 | % | | | | | | |
| | | | | | | | | | | |
| Collateral Total | | | 3,117,102 | 100.0 | % | | | | | | |
| | | | | | | | | | | |
| (1) | Based on the underwritten rent roll dated as of September 1, 2023, with rent steps through August 2024. |
| (2) | In certain instances, ratings provided are for the parent company of the entity listed in the “Tenant” field whether or not the parent company guarantees the lease. |
| (3) | UW Base Rent, UW Base Rent PSF and % of Total UW Base Rent include $326,233 of contractual rent steps through August 2024 and $101,189 of percentage rent. |
| (4) | Sales PSF and Occupancy Cost represent the trailing 12-month period ending March 31, 2023. |
| (5) | Hobby Lobby occupies 55,126 square feet at the Quail Springs mortgaged property with a lease expiration date of September 30, 2028, 55,710 square feet at the Sutters Creek mortgaged property with a lease expiration date of August 31, 2031, 56,676 square feet at the Houma Crossing mortgaged property with a lease expiration date of August 31, 2031, 55,000 square feet at the Derby Marketplace mortgaged property with a lease expiration date of September 30, 2030, and 55,000 square feet at the North Lake Square mortgaged property with a lease expiration date of October 31, 2030. |
| (6) | Academy Sports occupies 45,000 square feet at the Stoneridge Village mortgaged property with a lease expiration date of February 28, 2039, 75,760 square feet at The Ridge at Turtle Creek mortgaged property with a lease expiration date of January 31, 2035, and 62,168 square feet at the Lawton Marketplace mortgaged property with a lease expiration date of January 31, 2033. |
| (7) | Ross occupies 27,657 square feet at the Liberty Crossing mortgaged property with a lease expiration date of January 31, 2026, 31,815 square feet at the Southway Shopping Center mortgaged property with a lease expiration date of January 31, 2026, 27,623 square feet at the Waterford Park South mortgaged property with a lease expiration date of January 31, 2025, 25,046 square feet at the Evergreen Marketplace mortgaged property with a lease expiration date of January 31, 2029, 30,187 square feet at the Lord Salisbury Center mortgaged property with a lease expiration date of January 31, 2026, and 25,000 square feet at the Derby Marketplace mortgaged property with a lease expiration date of January 31, 2027. |
| (8) | Based on sales for Ross at the Southway Shopping Center mortgaged property. |
| (9) | PetSmart occupies 20,087 square feet at the Liberty Crossing mortgaged property with a lease expiration date of January 31, 2024, 17,445 square feet at the Northwoods Marketplace mortgaged property with a lease expiration date of November 30, 2028, 13,858 square feet at the PetSmart & Old Navy mortgaged property with a lease expiration date of September 30, 2032, 20,087 square feet at the Waterford Park South mortgaged property with a lease expiration date of January 31, 2032, 12,157 square feet at the Stoneridge Village mortgaged property with a lease expiration date of January 31, 2027, 20,087 square feet at the Carlisle Crossing mortgaged property with a lease expiration date of June 30, 2026, 23,197 square feet at the Owensboro Town Center mortgaged property with a lease expiration date of August 31, 2033, 19,107 square feet at the Parkway Centre South mortgaged property with a lease expiration date of January 31, 2025, and 12,328 square feet at the Lawton Marketplace mortgaged property with a lease expiration date of January 31, 2024. |
| (10) | Best Buy occupies 30,000 square feet at the Southway Shopping Center mortgaged property with a lease expiration date of January 31, 2028, 43,278 square feet at the Northwoods Marketplace mortgaged property with a lease expiration date of November 25, 2028, 45,278 square feet at the Quail Springs mortgaged property with a lease expiration date of March 31, 2025, and 32,425 square feet at the Owensboro Town Center mortgaged property with a lease expiration date of March 31, 2026. |
| (11) | Kohls Corporation occupies 68,423 square feet at the Harbor Town Center mortgaged property and 68,639 square feet at the Wallace Commons mortgaged property. Each lease expires on January 31, 2029. |
| (12) | TJ Maxx occupies 22,504 square feet at the Harbor Town Center mortgaged property with a lease expiration date of May 31, 2028, 29,409 square feet at the Owensboro Town Center mortgaged property with a lease expiration date of January 31, 2027, 28,000 square feet at the Parkway Centre South mortgaged property with a lease expiration date of November 30, 2026, 24,000 square feet at the Lawton Marketplace mortgaged property with a lease expiration date of August 31, 2028, and 20,000 square feet at the Derby Marketplace mortgaged property with a lease expiration date of March 31, 2026. |
| (13) | Based on sales at the Parkway Centre South mortgaged property. |
| (14) | Michaels occupies 23,327 square feet at the Northwoods Marketplace mortgaged property with a lease expiration date of February 28, 2026, 21,727 square feet at the Waterford Park South mortgaged property with a lease expiration date of February 28, 2026, 21,574 square feet at the Evergreen Marketplace mortgaged property with a lease expiration date of February 28, 2026, and 21,647 square feet at the Carlisle Crossing mortgaged property with a lease expiration date of May 31, 2026. |
| (15) | Based on sales at the Carlisle Crossing and Northwoods Marketplace mortgaged properties. |
| (16) | Five Below occupies 8,474 square feet at the Liberty Crossing mortgaged property with a lease expiration date of February 29, 2032, 8,933 square feet at the Southway |
| THE INFORMATION IN THIS STRUCTURAL AND COLLATERAL TERM SHEET IS NOT COMPLETE AND MAY BE AMENDED PRIOR TO THE TIME OF SALE. THIS TERM SHEET IS NOT AN OFFER TO SELL THESE SECURITIES AND IT IS NOT A SOLICITATION OF AN OFFER TO BUY THESE SECURITIES IN ANY JURISDICTION WHERE THE OFFER OR SALE IS NOT PERMITTED. |
| | 56 | |
| Structural and Collateral Term Sheet | | BMO 2023-C7 |
| No. 4 – RTL Retail Portfolio |
Shopping Center mortgaged property with a lease expiration date of January 31, 2027, 8,000 square feet at the Stoneridge Village mortgaged property with a lease expiration date of January 31, 2026, 9,450 square feet at the Carlisle Crossing mortgaged property with a lease expiration date of January 31, 2032, 9,000 square feet at the Owensboro Town Center mortgaged property with a lease expiration date of June 30, 2026, 9,330 square feet at the Parkway Centre South mortgaged property with a lease expiration date of January 31, 2032, 10,000 square feet at the Houma Crossing mortgaged property with a lease expiration date of January 31, 2029, 7,941 square feet at the Lawton Marketplace mortgaged property with a lease expiration date of January 31, 2030, and 8,111 square feet at the North Lake Square mortgaged property with a lease expiration date of July 31, 2026.
The following table presents certain information relating to the tenant lease expirations at the RTL Retail Portfolio Properties:
| Lease Rollover Schedule(1)(2) |
| Year | Number of Leases Expiring | Net Rentable Area Expiring | % of NRA Expiring | UW Base Rent Expiring(3) | % of UW Base Rent Expiring(3) | Cumulative Net Rentable Area Expiring | Cumulative % of NRA Expiring | Cumulative UW Base Rent Expiring(3) | Cumulative % of UW Base Rent Expiring |
| Vacant | NAP | 146,380 | 4.7 | % | NAP | NA | P | 146,380 | 0.0% | | NAP | NAP | |
| 2023 & MTM | 7 | 33,108 | 1.1 | | $653,123 | 1.6 | % | 179,488 | 1.1% | | $653,123 | 1.6% | |
| 2024 | 34 | 175,134 | 5.6 | | 3,008,031 | 7.6 | | 354,622 | 6.7% | | $3,661,154 | 9.2% | |
| 2025 | 29 | 181,893 | 5.8 | | 2,744,328 | 6.9 | | 536,515 | 12.5% | | $6,405,482 | 16.1% | |
| 2026 | 48 | 477,019 | 15.3 | | 6,521,264 | 16.4 | | 1,013,534 | 27.8% | | $12,926,746 | 32.5% | |
| 2027 | 36 | 235,924 | 7.6 | | 3,980,423 | 10.0 | | 1,249,458 | 35.4% | | $16,907,168 | 42.5% | |
| 2028 | 38 | 454,788 | 14.6 | | 5,930,282 | 14.9 | | 1,704,246 | 50.0% | | $22,837,450 | 57.4% | |
| 2029 | 17 | 284,055 | 9.1 | | 3,430,732 | 8.6 | | 1,988,301 | 59.1% | | $26,268,182 | 66.0% | |
| 2030 | 15 | 256,766 | 8.2 | | 3,666,652 | 9.2 | | 2,245,067 | 67.3% | | $29,934,834 | 75.2% | |
| 2031 | 9 | 147,450 | 4.7 | | 1,424,004 | 3.6 | | 2,392,517 | 72.1% | | $31,358,838 | 78.8% | |
| 2032 | 16 | 200,157 | 6.4 | | 2,600,853 | 6.5 | | 2,592,674 | 78.5% | | $33,959,692 | 85.3% | |
| 2033 | 14 | 182,187 | 5.8 | | 2,484,082 | 6.2 | | 2,774,861 | 84.3% | | $36,443,774 | 91.6% | |
| 2034 & Beyond | 10 | 342,241 | 11.0 | | 3,362,227 | 8.4 | | 3,117,102 | 95.3% | | $39,806,001 | 100.0% | |
| Total | 273 | 3,117,102 | 100.0 | % | $39,806,001 | 100.0 | % | | | | |
| (1) | Based on the underwritten rent roll dated as of September 1, 2023, with rent steps through August 2024. |
| (2) | Certain tenants may have lease termination options that are exercisable prior to the originally stated expiration date of the subject lease and that are not considered in the Lease Rollover Schedule. |
| (3) | UW Base Rent Expiring, % of UW Base Rent Expiring, Cumulative UW Base Rent Expiring and Cumulative % of UW Base Rent Expiring are inclusive of $326,233 of contractual rent steps through August 2024 and $101,189 of percentage rent. |
| THE INFORMATION IN THIS STRUCTURAL AND COLLATERAL TERM SHEET IS NOT COMPLETE AND MAY BE AMENDED PRIOR TO THE TIME OF SALE. THIS TERM SHEET IS NOT AN OFFER TO SELL THESE SECURITIES AND IT IS NOT A SOLICITATION OF AN OFFER TO BUY THESE SECURITIES IN ANY JURISDICTION WHERE THE OFFER OR SALE IS NOT PERMITTED. |
| | 57 | |
| Structural and Collateral Term Sheet | | BMO 2023-C7 |
| No. 4 – RTL Retail Portfolio |
The following table presents certain information relating to the operating history and underwritten cash flows of the RTL Retail Portfolio Properties:
| Operating History and Underwritten Net Cash Flow(1) |
| | 2022 | TTM(2) | Underwritten | Per Square Foot | % | (3) |
| Rents in Place(4) | $30,907,670 | $37,311,334 | $39,378,579 | $12.63 | | 69.4 | % |
| Rent Steps(5) | 0 | 0 | 326,233 | 0.10 | | 0.6 | |
| Straight Line Rent | 0 | 0 | 7,000 | 0.00 | | 0.0 | |
| Percentage Rent | 0 | 155,969 | 101,189 | 0.03 | | 0.2 | |
| Vacancy Gross Up | 0 | 0 | 2,763,888 | 0.89 | | 4.9 | |
| Gross Potential Rent | $30,907,670 | $37,467,303 | $42,576,889 | $13.66 | | 75.1 | % |
| Total Reimbursements | 10,208,401 | 11,658,704 | 14,147,963 | 4.54 | | 24.9 | |
| Net Rental Income | $41,116,072 | $49,126,007 | $56,724,852 | $18.20 | | 100.0 | % |
| Other Income | 0 | 68,582 | 0 | 0.00 | | 0.0 | |
| (Vacancy/Credit Loss) | 0 | 0 | (2,836,243) | (0.91 | ) | (5.0 | ) |
| Effective Gross Income | $41,116,072 | $49,194,589 | $53,888,610 | $17.29 | | 95.0 | % |
| | | | | | |
| Taxes | 5,916,899 | 6,767,608 | 6,913,585 | 2.22 | | 12.8 | |
| Insurance | 1,195,587 | 1,243,194 | 2,053,265 | 0.66 | | 3.8 | |
| Maintenance | 4,012,845 | 3,848,515 | 4,836,221 | 1.55 | | 9.0 | |
| Management Fee | 1,550,658 | 1,956,924 | 1,886,101 | 0.61 | | 3.5 | |
| Other Expenses | 1,388,155 | 1,683,149 | 2,227,621 | 0.71 | | 4.1 | |
| Total Expenses | $14,064,144 | $15,499,390 | $17,916,793 | $5.75 | | 33.2 | % |
| | | | | | |
| Net Operating Income | $27,051,928 | $33,695,199 | $35,971,817 | $11.54 | | 66.8 | % |
| | | | | | |
| TI/LC | 0 | 0 | 2,040,576 | 0.65 | | 3.8 | |
| Cap Ex | 0 | 0 | 521,495 | 0.17 | | 1.0 | |
| | | | | | |
| Net Cash Flow | $27,051,928 | $33,695,199 | $33,409,746 | $10.72 | | 62.0 | % |
| (1) | Based on the underwritten rent roll dated September 1, 2023. |
| (2) | TTM reflects the trailing 12 months ending June 30, 2023. |
| (3) | % column represents percent of Net Rental Income for revenue fields and represents percent of Effective Gross Income for the remainder of fields. |
| (4) | Since July 1, 2022, there has been 539,910 square feet (17.3% of NRA) of new leases or renewals representing approximately $8.1 million (20.5% of underwritten rents in place). |
| (5) | Includes contractual rent steps through August 2024. |
| THE INFORMATION IN THIS STRUCTURAL AND COLLATERAL TERM SHEET IS NOT COMPLETE AND MAY BE AMENDED PRIOR TO THE TIME OF SALE. THIS TERM SHEET IS NOT AN OFFER TO SELL THESE SECURITIES AND IT IS NOT A SOLICITATION OF AN OFFER TO BUY THESE SECURITIES IN ANY JURISDICTION WHERE THE OFFER OR SALE IS NOT PERMITTED. |
| | 58 | |
| Structural and Collateral Term Sheet | | BMO 2023-C7 |
| No. 4 – RTL Retail Portfolio |
The Markets. The RTL Retail Portfolio Properties consist of 29 properties located across 19 different states. The RTL Retail Portfolio Properties are located in submarkets with average vacancy rates ranging from 0.6% to 7.5%. Market rent rate per square foot ranges from $5.48 to $34.98.
The following table presents certain market information relating to the RTL Retail Portfolio Properties:
| Market Summary(1) |
| Location | Market | Submarket | UW Rental Rate PSF(2)(3) | Market Rent Rate PSF | Average Submarket Vacancy |
| Northwoods Marketplace | North Charleston, SC | Charleston | North Charleston | $14.01 | $13.87 | 4.60% |
| The Centrum | Pineville, NC | Charlotte | Outer Southeast | $10.27 | $11.57 | 3.00% |
| Southway Shopping Center | Houston, TX | Houston | Southwest | $14.20 | $14.08 | 3.80% |
| Parkway Centre South | Grove City, OH | Columbus | Southwest | $16.67 | $15.71 | 5.10% |
| Lawton Marketplace | Lawton, OK | Lawton MSA | Lawton | $14.07 | $14.50 | 7.50% |
| Owensboro Town Center | Owensboro, KY | Owensboro MSA | Daviess County | $12.77 | $12.68 | 4.10% |
| Carlisle Crossing | Carlisle, PA | Harrisburg | Harrisburg West | $16.34 | $16.87 | 4.40% |
| North Lake Square | Gainesville, GA | Atlanta | Gainesville/Hall County | $13.11 | $13.97 | 3.50% |
| Liberty Crossing | Rowlett, TX | Dallas-Fort Worth | Sachse/Rowlett | $17.69 | $18.65 | 3.40% |
| Lord Salisbury Center | Salisbury, MD | Salisbury MSA | Wicomico County | $14.20 | $13.34 | 5.50% |
| Ventura Place | Albuquerque, NM | Albuquerque | Far Northeast Heights | $16.59 | $16.06 | 2.90% |
| Houma Crossing | Houma, LA | Houma-Thibodaux MSA | Houma | $11.52 | $12.77 | 2.10% |
| Terrell Mill Village | Marietta, GA | Atlanta | Cumberland/Galleria | $19.19 | $18.15 | 4.20% |
| Harbor Town Center | Manitowoc, WI | Green Bay MSA | Manitowoc County | $10.30 | $10.24 | 2.50% |
| The Ridge at Turtle Creek | Hattiesburg, MS | Hattiesburg | Hattiesburg/South Area | $13.12 | $13.33 | 2.30% |
| Waterford Park South | Clarksville, IN | Louisville MSA | South Clark County | $12.95 | $15.60 | 3.70% |
| Nordstrom Rack | Tampa, FL | Hillsborough County | Central Tampa Submarket | $23.24 | $23.23 | 1.80% |
| Wallace Commons | Salisbury, NC | Charlotte | Rowan County | $10.20 | $10.46 | 2.00% |
| Quail Springs | Oklahoma City, OK | Oklahoma County | North Oklahoma City | $9.76 | $11.00 | 5.10% |
| Evergreen Marketplace | Evergreen Park, IL | Chicago | Near South Cook | $16.85 | $16.03 | 6.20% |
| Derby Marketplace | Derby, KS | Wichita | Derby-Haysville-Mulvane | $8.28 | $10.79 | 2.30% |
| FreshThyme & DSW | Fort Wayne, IN | Fort Wayne MSA | North Fort Wayne | $13.31 | $12.56 | 5.30% |
| Tellico Village | Loudon, TN | Knoxville | Loudon County | $12.64 | $12.72 | 0.60% |
| Sutters Creek | Rocky Mount, NC | Nash, Wake, Franklin, Warren, Halifax, Edgecombe, Wilson, Johnston counties | Nash County | $6.13 | $5.48 | 6.90% |
| PetSmart & Old Navy | Reynoldsburg, OH | Columbus | Fairfield County | $16.47 | $16.50 | 4.40% |
| Stoneridge Village | Jefferson City, MO | Jefferson City | NAV | $15.52 | $13.00 | NAV |
| Walmart Neighborhood Market | Summerville, SC | Charleston | Dorchester County | $8.98 | $9.55 | 6.40% |
| Mattress Firm & Panera Bread | Elyria, OH | Cleveland | Lorain County | $36.35 | $34.98 | 3.00% |
| Crossroads Annex | Lafayette, LA | Lafayette MSA | Greater Lafayette | $16.39 | $16.00 | 1.40% |
| Weighted Average | | | | $13.40 | $13.63 | 3.9% |
| (1) | Source: Appraisals dated between July 7, 2023, and July 25, 2023. |
| (2) | Based on the underwritten rent roll dated September 1, 2023. |
| (3) | Includes $326,233 of contractual rent steps through August 2024 and $101,189 of percentage rent across the portfolio. |
| THE INFORMATION IN THIS STRUCTURAL AND COLLATERAL TERM SHEET IS NOT COMPLETE AND MAY BE AMENDED PRIOR TO THE TIME OF SALE. THIS TERM SHEET IS NOT AN OFFER TO SELL THESE SECURITIES AND IT IS NOT A SOLICITATION OF AN OFFER TO BUY THESE SECURITIES IN ANY JURISDICTION WHERE THE OFFER OR SALE IS NOT PERMITTED. |
| | 59 | |
| Structural and Collateral Term Sheet | | BMO 2023-C7 |
| No. 4 – RTL Retail Portfolio |
The Borrowers. The borrowers are 29 Delaware limited liability companies and special purpose entities, each with two independent directors. Legal counsel to the borrowers provided a non-consolidation opinion in connection with the origination of the RTL Retail Portfolio Whole Loan.
The Borrower Sponsor. The borrower sponsor and non-recourse carveout guarantor was The Necessity Retail REIT Operating Partnership, L.P. (NASDAQ: RTL) prior to the completion of the Global Net Lease Merger (as defined below). At completion of the Global Net Lease Merger, Global Net Lease, Inc. became, and is currently, the borrower sponsor and non-recourse carveout guarantor. The Necessity Retail REIT Operating Partnership, L.P. (“RTL”) is a publicly traded real estate investment with a focus on acquiring and managing a diversified portfolio of primarily service-oriented and traditional retail and distribution related commercial real estate properties in the United States. RTL has a portfolio consisting of 991 net leased properties in 46 different states and the District of Columbia totaling approximately 27.4 million square feet as of June 30, 2023. RTL’s portfolio was 92.7% leased with a 6.9 weighted average lease term remaining as of June 30, 2023. 66% and 37% of annualized straight-line rent in RTL’s single-tenant portfolio and from multi-tenant anchor tenants, respectively, was attributed to investment grade, or implied investment grade, tenants as of June 30, 2023. RTL reported revenue of approximately $106.7 million in the second quarter of 2023.
The Necessity Retail REIT, Inc. (“RTL Parent”) and Global Net Lease, Inc. completed a merger on September 12, 2023 (such merger of RTL Parent with Global Net Lease, Inc., the “Global Net Lease Merger”). RTL had been externally managed by AR Global Investments, LLC. However, the combined entity is now internally managed. Global Net Lease, Inc. is a publicly traded real estate investment trust that specializes in sale-leaseback transactions involving single tenant, mission critical income producing net-leased assets. Prior to the Global Net Lease Merger, as of June 30, 2023, Global Net Lease, Inc. had a portfolio consisting of 1,308 properties totaling approximately 66.9 million square feet. As of June 30, 2023, Global Net Lease, Inc.’s portfolio was 96% leased with a weighted average remaining lease term of 6.9 years.
Property Management. The RTL Retail Portfolio Properties are currently managed by Necessity Retail Properties, LLC, an affiliate of the borrower sponsor.
Escrows and Reserves. At origination, the borrowers deposited into escrow (i) approximately $4,174,654 for real estate taxes, (ii) $5,240 for insurance premiums, (iii) $1,027,622 for deferred maintenance, (iv) $9,576,923 for outstanding TI/LCs, (v) $977,500 for the environmental reserve fund, (vi) $311,601 for outstanding free rent and (vii) $241,832 for gap rent.
Tax Escrow – On a monthly basis, the borrowers are required to escrow approximately $596,379 for real estate taxes. The borrowers are not required to make monthly tax deposits for an individual mortgaged property if (i) no event of default has occurred and is continuing, (ii) the applicable property is leased to a single tenant and that tenant is paying any taxes directly with satisfactory evidence given to the lender, (iii) no Cash Sweep Period (as defined below) is in effect and (iv) the applicable lease is in full force and effect and there is no event of default under the lease.
Insurance Escrow – On a monthly basis, the borrowers are required to escrow approximately $1,310 for insurance premiums. The borrowers are not required to pay monthly insurance premiums if they obtain a blanket policy satisfactory to the lender or, in regard to an individual mortgaged property, if (i) no event of default has occurred and is continuing, (ii) the applicable property is leased to a single tenant and that tenant is paying any insurance premiums directly with satisfactory evidence given to the lender, (iii) no Cash Sweep Period is in effect and (iv) the applicable lease is in full force and effect and there is no event of default under the lease.
Replacement Reserves – During a Cash Sweep Period, the borrowers are required to escrow 1/12th of the product obtained by multiplying $0.25 by the aggregate square footage of the RTL Retail Portfolio Properties (initially approximately $64,940 per month). In the event of a partial release, the monthly deposit will be reduced by an amount equal to 1/12th of the product obtained by multiplying $0.25 by the total number of rentable square feet of the individual mortgaged property that is the subject of such partial release.
TI/LC Reserve – During a Cash Sweep Period, the borrowers are required to escrow 1/12th of the product obtained by multiplying $1.50 by the total number of rentable square feet of the RTL Retail Portfolio Properties (initially approximately $389,638 per month). In the event of a partial release, the monthly deposit will be reduced by an amount equal to 1/12th of
| THE INFORMATION IN THIS STRUCTURAL AND COLLATERAL TERM SHEET IS NOT COMPLETE AND MAY BE AMENDED PRIOR TO THE TIME OF SALE. THIS TERM SHEET IS NOT AN OFFER TO SELL THESE SECURITIES AND IT IS NOT A SOLICITATION OF AN OFFER TO BUY THESE SECURITIES IN ANY JURISDICTION WHERE THE OFFER OR SALE IS NOT PERMITTED. |
| | 60 | |
| Structural and Collateral Term Sheet | | BMO 2023-C7 |
| No. 4 – RTL Retail Portfolio |
the product obtained by multiplying $1.50 by the total number of rentable square feet of the individual mortgaged property that is the subject of such partial release.
A “Cash Sweep Period” will commence upon a Cash Sweep Event (as defined below) and will terminate upon the cure of such Cash Sweep Event.
Lockbox / Cash Management. The RTL Retail Portfolio Whole Loan is structured with a hard lockbox and springing cash management. The borrowers were required to establish a lockbox account and deliver letters to the tenants (excluding any tenants who use VersaPay to pay their rent) at the RTL Retail Portfolio Properties directing them to pay all rents directly into a lender-controlled lockbox account. Additionally, all revenues and other monies received by the borrowers or related property manager are required to be deposited into the lockbox account within one business day upon receipt. During the occurrence and continuance of a Cash Sweep Event, all funds are required to be swept each business day into the cash management account controlled by the lender and disbursed on each payment date in accordance with the RTL Retail Portfolio Whole Loan documents, with all excess cash flow to be held as additional security for the RTL Retail Portfolio Whole Loan.
A “Cash Sweep Event” means the occurrence of (i) an event of default, (ii) a Debt Yield Trigger Event (as defined below), or (iii) a Hobby Lobby Trigger Event (as defined below). A Cash Sweep Event will end upon, with respect to clause (i), a cure of such event of default, with respect to clause (ii), (a) achieving a net cash flow debt yield of at least 9.95% for two consecutive calendar quarters, (b) the delivery by the borrowers to the lender of the Debt Yield Cure – Letter of Credit (as defined below), or (c) the borrowers’ completion of a Debt Yield Cure – Partial Prepayment (as defined below), or with respect to clause (iii) the occurrence of a Hobby Lobby Trigger Event Cure (as defined below).
A “Debt Yield Trigger Event” will commence upon (i) the net operating income debt yield being less than 9.95% for two consecutive calendar quarters or (ii) if the borrowers previously cured or prevented a Debt Yield Trigger Event by depositing a Debt Yield Cure – Letter of Credit with the lender, the expiration of the three month period that commenced on the date the borrowers delivered such Debt Yield Cure – Letter of Credit to the lender; provided, however, that a Debt Yield Trigger Event will not be deemed to have occurred if, within five business days of the date described in clause (i) or (ii) of this definition, the borrowers deposit with the lender the applicable Debt Yield Cure – Letter of Credit or complete the applicable Debt Yield Cure – Partial Prepayment.
A “Debt Yield Cure – Letter of Credit” means a letter of credit in an amount equal to the excess cash flow that would have been swept in the three-month period immediately preceding the applicable date of determination if a Cash Sweep Period had been in effect during such time, as reasonably determined by the lender. Each Debt Yield Cure – Letter of Credit will be effective for a period of three months and the borrowers may continue to prevent subsequent Debt Yield Trigger Events after each three-month period by depositing with the lender additional Debt Yield Cure – Letters of Credit on, or prior to, the expiration of each such three-month period.
A “Debt Yield Cure – Partial Prepayment” means a partial prepayment of the loan in accordance with the RTL Retail Portfolio Whole Loan documents in an amount (including any required yield maintenance premium) that results in a reduction of the then-outstanding balance of the RTL Retail Portfolio Whole Loan to achieve a net cash flow debt yield equal to or greater than 9.95% for the trailing 12-month period.
A “Hobby Lobby Trigger Event” will occur if Hobby Lobby or its parent company, or the guarantor of any Hobby Lobby lease, becomes a debtor in any bankruptcy or insolvency proceeding or has its assets made subject to the jurisdiction of a bankruptcy court; provided, however, a Cash Sweep Event will not be deemed to have occurred, and a Cash Sweep Period will not commence, solely as a result of a Hobby Lobby Trigger Event if a Hobby Lobby Reserve Funds Cap Cure (as defined below) occurs within five business days of such Hobby Lobby Trigger Event.
“Hobby Lobby Trigger Event Cure” means that (i) the borrowers provide the lender with (a) reasonably satisfactory evidence that the assets of Hobby Lobby or its parent company or lease guarantor are no longer subject to the jurisdiction of the bankruptcy court, and (b) satisfactory evidence that each Hobby Lobby lease or its guaranty (as applicable) has been affirmed and is in full force and effect, including an updated tenant estoppel certificate from Hobby Lobby that is reasonably acceptable to the lender confirming that each Hobby Lobby lease is in full effect, Hobby Lobby is paying full contractual
| THE INFORMATION IN THIS STRUCTURAL AND COLLATERAL TERM SHEET IS NOT COMPLETE AND MAY BE AMENDED PRIOR TO THE TIME OF SALE. THIS TERM SHEET IS NOT AN OFFER TO SELL THESE SECURITIES AND IT IS NOT A SOLICITATION OF AN OFFER TO BUY THESE SECURITIES IN ANY JURISDICTION WHERE THE OFFER OR SALE IS NOT PERMITTED. |
| | 61 | |
| Structural and Collateral Term Sheet | | BMO 2023-C7 |
| No. 4 – RTL Retail Portfolio |
rent, without offset or free rent credit and that there is no default by either party under any Hobby Lobby lease; (ii) the satisfaction of the Hobby Lobby Replacement Lease Criteria (as defined below); or (iii) occurrence of a Hobby Lobby Reserve Funds Cap Cure.
“Hobby Lobby Reserve Funds Cap Cure” means that (i) the borrowers have deposited with the lender an amount in cash equal to the Hobby Lobby Reserve Funds Cap (as defined below), (ii) during the applicable Cash Sweep Period, the amount on deposit in the excess cash flow reserve account at any time exceeds the Hobby Lobby Reserve Funds Cap, or (iii) the borrowers have deposited with the lender a Hobby Lobby letter of credit, which is an amount equal to the Hobby Lobby Reserve Funds Cap.
“Hobby Lobby Reserve Funds Cap” means an amount equal to (i) $4,295,952.13, less (ii) if applicable, the Hobby Lobby Replacement Rent Amount (as defined below).
“Hobby Lobby Replacement Rent Amount” means, following the occurrence of a Hobby Lobby Trigger Event and the execution of one or more Hobby Lobby replacement leases that demise a portion (but not all) of the Hobby Lobby premises, an amount equal to base rent required to be paid by each replacement tenant to the borrowers under the applicable replacement lease for the two year period immediately subsequent to the effective date of such replacement lease.
“Hobby Lobby Replacement Lease Criteria” means (i) the borrowers have entered into one or more Hobby Lobby replacement leases; (ii) each Hobby Lobby replacement tenant is in physical occupancy of the space covered by the applicable replacement lease; and (iii) the borrowers provide the lender with (a) a copy of each executed Hobby Lobby replacement lease, (b) a tenant estoppel certificate in form and substance reasonably satisfactory to the lender executed by each Hobby Lobby replacement tenant which confirms that such replacement lease is in full effect and such replacement tenant is in physical occupancy of the space and paying full contractual rent, (c) upon request of the lender, unless the Hobby Lobby replacement lease is fully subordinate to the loan by its terms, a subordination, non-disturbance and attornment agreement in form and substance satisfactory to the lender executed by each Hobby Lobby replacement tenant and the lender, (d) satisfactory evidence that the borrowers have performed and paid for all tenant improvements relating to such Hobby Lobby replacement tenant and that there are no unpaid leasing commissions associated with such Hobby Lobby replacement tenant, and (e) an updated rent roll.
Subordinate and Mezzanine Debt. None.
Permitted Future Mezzanine Debt. Not permitted.
Partial Release. On any payment date following (a) the payment date in September 2024 (with payment of a yield maintenance premium) or (b) the earlier of two years following the last note to be securitized or August 30, 2026 (with either a partial defeasance or payment of a yield maintenance premium), the borrowers may obtain the release of any of the RTL Retail Portfolio Properties with 15 days’ notice if the following conditions (among others) are met: (i) no event of default has occurred and is continuing; (ii) the borrowers pay all costs and provide customary documentation as described in the RTL Retail Portfolio Whole Loan documents; (iii) as of the date of consummation of the partial release, (a) if 70% or more of the aggregate rentable square footage of such released property is occupied by tenants as of the partial release date, the debt service coverage ratio with respect to the remaining individual mortgaged properties will be no less than the greater of (A) 2.01x and (B) the debt service coverage ratio immediately prior to the partial release or (b) if less than 70% of the aggregate rentable square footage of such released property is occupied by tenants as of the partial release date, then the debt service coverage ratio with respect to the remaining individual mortgaged properties will be no less than the debt service coverage ratio immediately prior to the partial release; (iv) as of the date of consummation of the partial release, (a) if 70% or more of the aggregate rentable square footage of such released property is occupied by tenants as of the partial release date, the debt yield with respect to the remaining individual mortgaged properties will be no less than the greater of (A) 13.11% and (B) the debt yield immediately prior to the partial release or (b) if less than 70% of the aggregate rentable square footage of such released property is occupied by tenants as of the partial release date, the net cash flow debt yield with respect to the remaining individual mortgaged property will be no less than the debt yield immediately prior to the partial release; and (v) payment of the release amount equal to 115% of the allocated loan amount for such individual property (including any applicable yield maintenance premium).
Ground Lease. None.
| THE INFORMATION IN THIS STRUCTURAL AND COLLATERAL TERM SHEET IS NOT COMPLETE AND MAY BE AMENDED PRIOR TO THE TIME OF SALE. THIS TERM SHEET IS NOT AN OFFER TO SELL THESE SECURITIES AND IT IS NOT A SOLICITATION OF AN OFFER TO BUY THESE SECURITIES IN ANY JURISDICTION WHERE THE OFFER OR SALE IS NOT PERMITTED. |
| | 62 | |
| Structural and Collateral Term Sheet | | BMO 2023-C7 |
| No. 5 – 2136 Honeywell Avenue |

| THE INFORMATION IN THIS STRUCTURAL AND COLLATERAL TERM SHEET IS NOT COMPLETE AND MAY BE AMENDED PRIOR TO THE TIME OF SALE. THIS TERM SHEET IS NOT AN OFFER TO SELL THESE SECURITIES AND IT IS NOT A SOLICITATION OF AN OFFER TO BUY THESE SECURITIES IN ANY JURISDICTION WHERE THE OFFER OR SALE IS NOT PERMITTED. |
| | 63 | |
| Structural and Collateral Term Sheet | | BMO 2023-C7 |
| No. 5 – 2136 Honeywell Avenue |
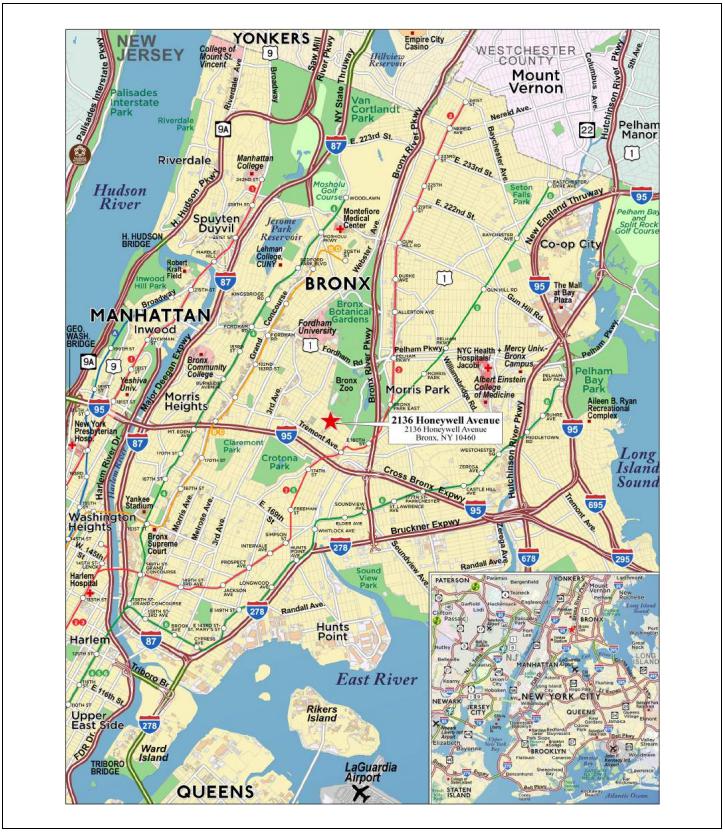
| THE INFORMATION IN THIS STRUCTURAL AND COLLATERAL TERM SHEET IS NOT COMPLETE AND MAY BE AMENDED PRIOR TO THE TIME OF SALE. THIS TERM SHEET IS NOT AN OFFER TO SELL THESE SECURITIES AND IT IS NOT A SOLICITATION OF AN OFFER TO BUY THESE SECURITIES IN ANY JURISDICTION WHERE THE OFFER OR SALE IS NOT PERMITTED. |
| | 64 | |
| Structural and Collateral Term Sheet | | BMO 2023-C7 |
| No. 5 – 2136 Honeywell Avenue |
| Mortgage Loan Information | | Property Information |
| Mortgage Loan Seller: | SMC | | Single Asset / Portfolio: | Single Asset |
| Original Principal Balance: | $36,000,000 | | Title: | Fee |
| Cut-off Date Principal Balance: | $36,000,000 | | Property Type - Subtype: | Multifamily – Mid Rise |
| % of Pool by IPB: | 4.9% | | Net Rentable Area (Units): | 101 |
| Loan Purpose: | Refinance | | Location: | Bronx, NY |
| Borrower: | SH Honeywell DE LLC | | Year Built / Renovated: | 2023 / NAP |
| Borrower Sponsors: | Martin Joseph; Hershy Silberstein | | Occupancy(2): | 93.1% |
| Interest Rate: | 7.25000% | | Occupancy Date: | 11/14/2023 |
| Note Date: | 11/17/2023 | | 4th Most Recent NOI (As of)(3): | NAV |
| Maturity Date: | 12/6/2033 | | 3rd Most Recent NOI (As of)(3): | NAV |
| Interest-only Period: | 36 months | | 2nd Most Recent NOI (As of)(3): | NAV |
| Original Term: | 120 months | | Most Recent NOI (As of)(3): | NAV |
| Original Amortization: | 360 months | | UW Economic Occupancy: | 97.0% |
| Amortization Type: | Interest Only, Amortizing Balloon | | UW Revenues: | $4,072,437 |
| Call Protection: | L(24),D(92),O(4) | | UW Expenses: | $508,021 |
| Lockbox / Cash Management: | Springing | | UW NOI: | $3,564,417 |
| Additional Debt: | No | | UW NCF: | $3,539,167 |
| Additional Debt Balance: | N/A | | Appraised Value / Per Unit: | $60,900,000 / $602,970 |
| Additional Debt Type: | N/A | | Appraisal Date: | 8/1/2023 |
| | | | | |
| Escrows and Reserves(1) | | Financial Information |
| | Initial | Monthly | Initial Cap | | Cut-off Date Loan / Unit: | $356,436 |
| Taxes: | $1,615 | $1,615 | N/A | | Maturity Date Loan / Unit: | $329,458 |
| Insurance: | $54,798 | $9,133 | N/A | | Cut-off Date LTV: | 59.1% |
| Replacement Reserves: | $0 | $2,104 | N/A | | Maturity Date LTV: | 54.6% |
| Other Reserve: | $9,403,864 | $0 | N/A | | UW NCF DSCR: | 1.20x |
| | | | | | UW NOI Debt Yield: | 9.9% |
| | | | | | | |
| Sources and Uses |
| Sources | Proceeds | % of Total | | Uses | Proceeds | % of Total |
| Mortgage Loan | $36,000,000 | 100.0% | | Payoff Existing Debt | $23,050,592 | 64.0 | % |
| | | | | Upfront Reserves | 9,460,277 | 26.3 | |
| | | | | Return of Equity | 2,418,127 | 6.7 | |
| | | | | Closing Costs | 1,071,003 | 3.0 | |
| Total Sources | $36,000,000 | 100.0% | | Total Uses | $36,000,000 | 100.0 | % |
| (1) | For a full description of Escrows and Reserves, see “Escrows and Reserves” below. |
| (2) | The 2136 Honeywell Avenue Property (as defined below) was 93.1% leased as of November 14, 2023. Martin Joseph and Hershy Silberstein entered into a master lease for the seven vacant units (the “Master Lease”) which would equate to 100% occupancy at the 2136 Honeywell Avenue Property after giving effect to such master lease. At any time following the first two months of the 2136 Honeywell Avenue Mortgage Loan (as defined below) term, the Master Lease will terminate for an unleased residential unit upon the lender’s receipt of (i) a fully executed lease for such residential unit, (ii) satisfactory evidence that the tenant is in occupancy of such residential unit, (iii) approval documentation from CityFHEPS (as defined below) for such residential unit and (iv) satisfactory evidence that initial rent for the unit has been received. |
| (3) | Historical financial information is not available as the 2136 Honeywell Avenue Property was completed in 2023. |
The Loan. The fifth largest mortgage loan (the “2136 Honeywell Avenue Mortgage Loan”) is secured by the borrower’s fee interest in a recently developed mid-rise multifamily property located in the Bronx, New York (the “2136 Honeywell Avenue Property”). The 2136 Honeywell Avenue Mortgage Loan has an outstanding principal balance as of the Cut-off Date of approximately $36.0 million, has a 10-year term and, following a three-year interest-only period, amortizes on a 30-year schedule. The scheduled maturity date of the 2136 Honeywell Avenue Mortgage Loan is December 6, 2033.
| THE INFORMATION IN THIS STRUCTURAL AND COLLATERAL TERM SHEET IS NOT COMPLETE AND MAY BE AMENDED PRIOR TO THE TIME OF SALE. THIS TERM SHEET IS NOT AN OFFER TO SELL THESE SECURITIES AND IT IS NOT A SOLICITATION OF AN OFFER TO BUY THESE SECURITIES IN ANY JURISDICTION WHERE THE OFFER OR SALE IS NOT PERMITTED. |
| | 65 | |
| Structural and Collateral Term Sheet | | BMO 2023-C7 |
| No. 5 – 2136 Honeywell Avenue |
The Property. The 2136 Honeywell Avenue Property is a 101-unit, eight-story multifamily property, located at the corner of Honeywell Avenue and 181st Street in the Bronx, New York. The 2136 Honeywell Avenue Property was recently developed by the borrower sponsors and features a mix of studio, one-, two- and three-bedroom residential units. The 2136 Honeywell Avenue Property’s units feature electric oven/range combination and refrigerator/freezer. Building amenities include elevators, video intercom, rooftop area and common laundry. Additionally, the 2136 Honeywell Avenue Property features a 55-space parking garage which is leased to a sponsor-affiliate for approximately $99,600 per annum. The borrower sponsors are providing a personal guarantee for payments on the parking garage lease. According to the sponsor, total developments costs for the 2136 Honeywell Avenue Property were $42,700,000.
The 2136 Honeywell Avenue Property benefits from a 35-year 421A tax exemption under which 30% of units are required to be rent stabilized and regulated by the New York City Housing Preservation & Development. For years one through 25 of such exemption, 100% of the projected assessed value of the 2136 Honeywell Avenue Property improvements on the tax lot is exempt from real estate taxes. The exemption falls to 30% in years 26 through 35. Taxes were underwritten to actual 2023/2024 taxes and equate to $15,891 versus the appraisal’s estimated full tax liability for 2024/2025 of $830,473.
In addition, the borrower sponsors are utilizing the Family Homelessness and Eviction Protection Supplement program (“CityFHEPS”) in order to lease the 2136 Honeywell Avenue Property. All tenants at the 2136 Honeywell Avenue Property utilize housing vouchers provided under the CityFHEPS, a rental assistance program administered by the New York City Department of Social Services to help tenants find and keep housing. The 2136 Honeywell Avenue Mortgage Loan will become fully recourse to the borrower and borrower sponsors in the event that (a) there is a breach or violation of the CityFHEPS program by the borrower and/or borrower sponsors, (b) the 2136 Honeywell Avenue Property does not qualify for the benefits of the CityFHEPS program for any reason, (c) the CityFHEPS program no longer exists or is terminated for any reason by the City of New York and/or (d) if the borrower fails to maintain the 421A tax exemption.
The following table presents detailed information with respect to the units at the 2136 Honeywell Avenue Property:
| Unit Summary |
| Unit Type | No. of Units(1) | % of Total | Occupied Collateral Units(1) | % of Units
Occupied | Average Unit Size (SF)(1) | Monthly Market Rental Rate(2) | Monthly Market Rental Rate per SF(2) | Average Monthly Market Rental Rate(1)(3) | Average Monthly Market Rental Rate per SF(2)(3) |
| Studio | 19 | 18.8 | % | 14 | 73.7% | 402 | $2,887 | $7.18 | $2,768 | $6.89 |
| 1 BR / 1 BA | 17 | 16.8 | | 15 | 88.2% | 513 | $3,170 | $6.18 | $2,955 | $5.76 |
| 2 BR / 1 BA | 64 | 63.4 | | 64 | 100.0% | 734 | $3,686 | $5.02 | $3,634 | $4.95 |
| 3 BR / 2 BA | 1 | 1.0 | | 1 | 100.0% | 882 | $4,509 | $5.11 | $4,215 | $4.78 |
| Total/Wtd. Avg. | 101 | 100.0 | % | 94 | 93.1% | 636 | $3,457 | $5.62 | $3,362 | $5.45 |
| (1) | Based on the borrower rent roll dated November 14, 2023. |
| (3) | Represents rents that are charged under either (i) permissible CityFHEPS rents or (ii) affordable housing regulations for households earning 130% of area median income as projected in the appraisal. |
The following table presents certain information with respect to the historical and current occupancy of the 2136 Honeywell Avenue Property:
| Historical and Current Occupancy(1) |
| 2020 | 2021 | 2022 | Current(2) |
| NAP | NAP | NAP | 93.1% |
| (1) | Historical occupancy is not available as the 2136 Honeywell Avenue Property was completed in 2023. |
| (2) | Current Occupancy is as of November 14, 2023. The borrower sponsors entered into a Master Lease for the seven vacant units which would equate to 100% occupancy at the 2136 Honeywell Avenue Property after giving effect to such Master Lease. |
| THE INFORMATION IN THIS STRUCTURAL AND COLLATERAL TERM SHEET IS NOT COMPLETE AND MAY BE AMENDED PRIOR TO THE TIME OF SALE. THIS TERM SHEET IS NOT AN OFFER TO SELL THESE SECURITIES AND IT IS NOT A SOLICITATION OF AN OFFER TO BUY THESE SECURITIES IN ANY JURISDICTION WHERE THE OFFER OR SALE IS NOT PERMITTED. |
| | 66 | |
| Structural and Collateral Term Sheet | | BMO 2023-C7 |
| No. 5 – 2136 Honeywell Avenue |
Appraisal. According to the appraisal, the 2136 Honeywell Avenue Property had an “as-is” appraised value of $60,900,000 as of August 1, 2023. The table below shows the appraiser’s “as-is” conclusions.
| Appraisal Valuation Summary(1) |
| Appraisal Approach | Appraised Value | Capitalization Rate(2) |
| Direct Capitalization Approach | $60,900,000 | 6.00% |
| (2) | The appraiser used a discounted cash flow approach to arrive at the appraised value. The capitalization rates shown above represent the overall capitalization rate. |
Environmental. According to a Phase I environmental assessment dated August 14, 2023, there was no evidence of any recognized environmental conditions at the 2136 Honeywell Avenue Property.
The following table presents certain information with respect to the operating history and underwritten cash flows of the 2136 Honeywell Avenue Property:
| Operating History and Underwritten Net Cash Flow(1) |
| | Underwritten | Per Unit | | %(2) | |
| Gross Potential Rent(3) | $4,075,296 | $40,349 | | 100. | 0% |
| Gross Potential Rent | $4,075,296 | $40,349 | | 100. | 0% |
| Total Reimbursements | 0 | 0 | | 0. | 0 |
| Net Rental Income | $4,075,296 | $40,349 | | 100. | 0% |
| (Vacancy/Credit Loss)(3) | (122,259) | (1,210 | ) | (3. | 0) |
| Other Income(4) | 119,400 | 1,182 | | 2. | 9 |
| Effective Gross Income | $4,072,437 | $40,321 | | 99. | 9% |
| | | | |
| Total Expenses | $508,021 | $5,030 | | 12. | 5% |
| | | | |
| Net Operating Income | $3,564,417 | $35,291 | | 87. | 5% |
| | | | |
| Replacement Reserves | 25,250 | 250 | | 0. | 6 |
| TI/LC | 0 | 0 | | 0. | 0 |
| Net Cash Flow | $3,539,167 | $35,041 | | 86. | 9% |
| (1) | The 2136 Honeywell Avenue Property was completed in 2023 and historical financial and occupancy information is not available. |
| (2) | % column represents percentage of Net Rental Income for all revenue lines and represents percentage of Effective Gross Income for the remaining fields. |
| (3) | Underwritten Gross Potential Rent and Vacancy/Credit Loss includes income from the seven master leased units and assumes a 3.0% vacancy. |
| (4) | Other Income is comprised of contractual parking income and projected laundry income. |
The Market. The 2136 Honeywell Avenue Property is located in the Bronx, New York. According to the appraisal, the 2136 Honeywell Avenue Property is located in the Bronx multifamily submarket. According to the appraisal, the Bronx multifamily submarket has a vacancy rate of approximately 4.5% and average asking rents of $2,006 per unit as of the second quarter of 2023. Within a one-, three- and five-mile radius of the 2136 Honeywell Avenue Property, the estimated 2023 population is 135,905, 1,302,917 and 2,017,259, respectively. Within the same radii, the estimated 2023 average annual household income is $49,533, $59,916 and $69,171, respectively.
| THE INFORMATION IN THIS STRUCTURAL AND COLLATERAL TERM SHEET IS NOT COMPLETE AND MAY BE AMENDED PRIOR TO THE TIME OF SALE. THIS TERM SHEET IS NOT AN OFFER TO SELL THESE SECURITIES AND IT IS NOT A SOLICITATION OF AN OFFER TO BUY THESE SECURITIES IN ANY JURISDICTION WHERE THE OFFER OR SALE IS NOT PERMITTED. |
| | 67 | |
| Structural and Collateral Term Sheet | | BMO 2023-C7 |
| No. 5 – 2136 Honeywell Avenue |
The following table presents certain information relating to comparable multifamily rental properties to the 2136 Honeywell Avenue Property:
| Comparable Rental Summary(1) |
| Property Address | Year Built | Occupancy | # Units | Unit Mix | Average SF per Unit | Average Rent per SF | Average Rent per Unit |
2136 Honeywell Avenue(2) Bronx, NY | 2023 | 93.1% | 101 | Studio 1BR / 1BA 2BR / 1BA 3BR / 2BA | 402 513 734 882 | $6.89 $5.76 $4.95 $4.78 | $2,768 $2,955 $3,634 $4,215 |
2321 Belmont Avenue Bronx, NY | 2022 | 100.0% | 42 | 1BR / 1BA 2BR / 1BA 3BR / 2BA | 500 875 1,600 | $4.50 $3.37 $2.66 | $2,251 $2,952 $4,253 |
2330 Hoffman Street Bronx, NY | 2016 | 91.6% | 46 | 1BR / 1BA 2BR / 1BA 3BR / 1BA | 713 976 1,167 | $2.55 $2.49 $2.77 | $1,821 $2,428 $3,237 |
2306 Webster Avenue Bronx, NY | 2019 | 100.0% | 71 | Studio 1BR / 1BA 2BR / 1BA | 450 550 650 | $4.23 $3.55 $3.42 | $1,905 $1,951 $2,224 |
2065-2067 Ryer Avenue Bronx, NY | 2019 | 100.0% | 132 | Studio 1BR / 1BA 2BR / 2BA | 330 512 734 | $6.35 $4.14 $3.27 | $2,094 $2,121 $2,402 |
| (1) | Source: Appraisal and market report, unless otherwise indicated. Comparables reflect market rate units. |
| (2) | Based on the borrower rent roll dated November 14, 2023 or as otherwise provided by the borrower. |
The Borrower. The borrower is SH Honeywell DE LLC, a Delaware limited liability company and special purpose entity with one independent director. Legal counsel to the borrower provided a non-consolidation opinion in connection with the origination of the 2136 Honeywell Avenue Mortgage Loan.
The Borrower Sponsors. The borrower sponsors and guarantors are Martin Joseph and Hershy Silberstein. Mr. Joseph is a local New York City based real estate developer and founder of Metropolitan Realty Exemptions, a Brooklyn-based real estate consultancy firm. Metropolitan Realty Exemptions advises developers on ICAP, J51, 421A and inclusionary housing projects. Metropolitan Realty Exemptions has represented clients throughout Queens, the Bronx and Brooklyn. Additionally, Mr. Joseph has interests in various multifamily developments located throughout Brooklyn and the Bronx. Mr. Silberstein is a local New York City based real estate developer. Mr. Silberstein currently owns and operates eight multifamily properties containing 167 units located in Brooklyn and the Bronx.
Property Management. The 2136 Honeywell Avenue Property is managed by MRE Property Management LLC, an affiliate of the borrower.
Escrows and Reserves. At origination, the borrower deposited into escrow (i) approximately $1,615 for real estate taxes, (ii) approximately $54,798 for insurance premiums, (iii) $8,000,000 for a holdback reserve and (iv) $1,403,864 for a debt service reserve.
Tax Escrows – On a monthly basis, the borrower is required to escrow 1/12th of the annual estimated tax payments, which currently equates to $1,615.
Insurance Escrows – On a monthly basis, the borrower is required to escrow 1/12th of the annual estimated insurance payments, which currently equates to approximately $9,133.
Replacement Reserves – On a monthly basis, the borrower is required to escrow $2,104 for replacement reserves.
Holdback Reserve – At origination, the borrower deposited into escrow $8,000,000 in connection with the leasing of the seven unleased units at the 2136 Honeywell Avenue Property. Such funds may be released to the borrower, no earlier than two months after the origination date of the 2136 Honeywell Avenue Mortgage Loan, upon (i) the borrower providing evidence that the 2136 Honeywell Avenue Property is 100% occupied, (ii) the lender receiving approval documentation from CityFHEPS for all 101 units at the 2136 Honeywell Avenue Property and (iii) the debt service coverage ratio (as calculated by the lender utilizing trailing one-month income and underwritten expenses) being equal to or greater than 1.20x.
| THE INFORMATION IN THIS STRUCTURAL AND COLLATERAL TERM SHEET IS NOT COMPLETE AND MAY BE AMENDED PRIOR TO THE TIME OF SALE. THIS TERM SHEET IS NOT AN OFFER TO SELL THESE SECURITIES AND IT IS NOT A SOLICITATION OF AN OFFER TO BUY THESE SECURITIES IN ANY JURISDICTION WHERE THE OFFER OR SALE IS NOT PERMITTED. |
| | 68 | |
| Structural and Collateral Term Sheet | | BMO 2023-C7 |
| No. 5 – 2136 Honeywell Avenue |
Debt Service Reserve – At origination, the borrower deposited into escrow $1,403,864 for a debt service reserve. The first six months of debt service will be paid out of the debt service reserve.
Lockbox / Cash Management. The 2136 Honeywell Avenue Mortgage Loan is structured with a springing lockbox and springing cash management. The 2136 Honeywell Avenue Mortgage Loan requires that during the continuance of a 2136 Honeywell Avenue Sweep Event Period (as defined below), the borrower or property manager, as applicable, is required to establish and maintain a lockbox account for the remainder of the 2136 Honeywell Avenue Mortgage Loan term. The borrower is required to direct tenants to pay all rents directly into the lockbox account. Upon the occurrence and during the continuance of a 2136 Honeywell Avenue Sweep Event Period, all funds in the lockbox account are required to be swept daily to a cash management account under the control of the lender to be applied and disbursed in accordance with the 2136 Honeywell Avenue Mortgage Loan documents, and all excess cash flow funds remaining in the cash management account after the application of such funds in accordance with the 2136 Honeywell Avenue Mortgage Loan documents are required to be held by the lender in an excess cash flow reserve account as additional collateral for the 2136 Honeywell Avenue Mortgage Loan. To the extent that no 2136 Honeywell Avenue Sweep Event Period is continuing, all excess cash flow funds are required to be disbursed to the borrower.
A “2136 Honeywell Avenue Sweep Event Period” will commence upon the earliest of the following: (i) the occurrence of an event of default under the 2136 Honeywell Avenue Mortgage Loan documents; or (ii) commencing on or after November 17, 2024, the date on which the debt service coverage ratio (based on a 30-year amortization schedule) is less than 1.15x based on the trailing 12 months.
A 2136 Honeywell Avenue Sweep Event Period will end: (a) with regard to clause (i), upon the cure of such event of default and the lender’s acceptance of such cure in its sole and absolute discretion and (b) with regard to clause (ii), upon the debt service coverage ratio (based on a 30-year amortization schedule) based on the trailing 12-month period being at least 1.20x for two consecutive calendar quarters.
Subordinate and Mezzanine Debt. None.
Permitted Future Mezzanine Debt. Not permitted.
Partial Release. Not permitted.
Ground Lease. None.
| THE INFORMATION IN THIS STRUCTURAL AND COLLATERAL TERM SHEET IS NOT COMPLETE AND MAY BE AMENDED PRIOR TO THE TIME OF SALE. THIS TERM SHEET IS NOT AN OFFER TO SELL THESE SECURITIES AND IT IS NOT A SOLICITATION OF AN OFFER TO BUY THESE SECURITIES IN ANY JURISDICTION WHERE THE OFFER OR SALE IS NOT PERMITTED. |
| | 69 | |
| Structural and Collateral Term Sheet | | BMO 2023-C7 |
| No. 6 – MRP Solutions Portfolio |
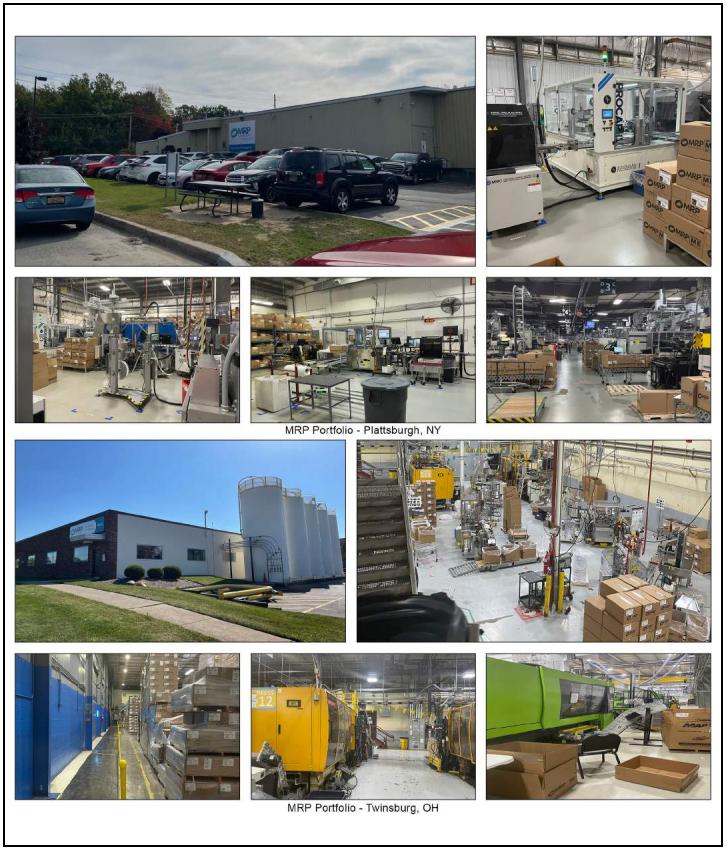
| THE INFORMATION IN THIS STRUCTURAL AND COLLATERAL TERM SHEET IS NOT COMPLETE AND MAY BE AMENDED PRIOR TO THE TIME OF SALE. THIS TERM SHEET IS NOT AN OFFER TO SELL THESE SECURITIES AND IT IS NOT A SOLICITATION OF AN OFFER TO BUY THESE SECURITIES IN ANY JURISDICTION WHERE THE OFFER OR SALE IS NOT PERMITTED. |
| | 70 | |
| Structural and Collateral Term Sheet | | BMO 2023-C7 |
| No. 6 – MRP Solutions Portfolio |
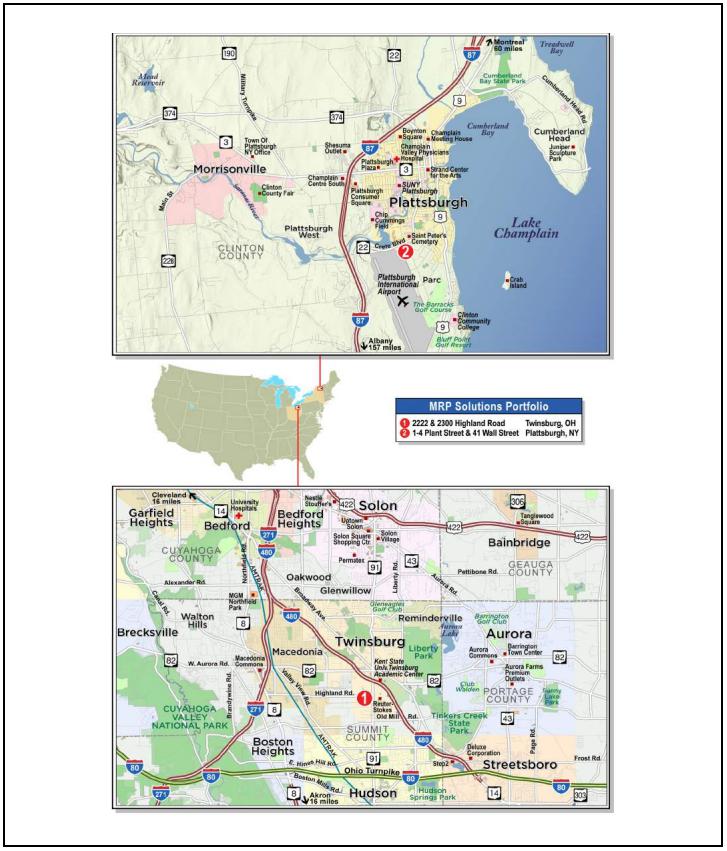
| THE INFORMATION IN THIS STRUCTURAL AND COLLATERAL TERM SHEET IS NOT COMPLETE AND MAY BE AMENDED PRIOR TO THE TIME OF SALE. THIS TERM SHEET IS NOT AN OFFER TO SELL THESE SECURITIES AND IT IS NOT A SOLICITATION OF AN OFFER TO BUY THESE SECURITIES IN ANY JURISDICTION WHERE THE OFFER OR SALE IS NOT PERMITTED. |
| | 71 | |
| Structural and Collateral Term Sheet | | BMO 2023-C7 |
| No. 6 – MRP Solutions Portfolio |
| Mortgage Loan Information | | Property Information |
| Mortgage Loan Seller: | BMO | | Single Asset / Portfolio: | Portfolio |
| Original Principal Balance: | $34,000,000 | | Title: | Fee |
| Cut-off Date Principal Balance: | $34,000,000 | | Property Type – Subtype: | Industrial – Warehouse / Manufacturing |
| % of IPB: | 4.6% | | Net Rentable Area (SF): | 560,141 |
| Loan Purpose: | Recapitalization | | Location: | Various |
| Borrower: | AGNL Caps, L.L.C. | | Year Built / Renovated(2): | Various / Various |
| Borrower Sponsors: | AG Net Lease IV (Q) Corp., AG Net Lease IV Corp. and AG Net Lease Realty Fund IV Investments (H-1), L.P. | | Occupancy: | 100.0% |
| Interest Rate: | 6.09000% | | Occupancy Date: | 11/17/2023 |
| Note Date: | 11/17/2023 | | 4th Most Recent NOI (As of)(3): | NAV |
| Maturity Date: | 12/6/2033 | | 3rd Most Recent NOI (As of)(3): | NAV |
| Interest-only Period: | 120 months | | 2nd Most Recent NOI (As of)(3): | NAV |
| Original Term: | 120 months | | Most Recent NOI (As of)(3): | NAV |
| Original Amortization Term: | None | | UW Economic Occupancy: | 100.0% |
| Amortization Type: | Interest Only | | UW Revenues: | $3,732,246 |
| Call Protection: | L(24),DorYM1(89),O(7) | | UW Expenses: | $0 |
| Lockbox / Cash Management: | Hard / Springing | | UW NOI: | $3,732,246 |
| Additional Debt: | No | | UW NCF: | $3,732,246 |
| Additional Debt Balance: | N/A | | Appraised Value / Per SF: | $57,200,000 / $102 |
| Additional Debt Type: | N/A | | Appraisal Date: | 9/13/2023 |
| | | | | |
| Escrows and Reserves(1) | | Financial Information |
| | Initial | Monthly | Initial Cap | | Cut-off Date Loan / SF: | $61 |
| Taxes: | $0 | Springing | N/A | | Maturity Date Loan / SF: | $61 |
| Insurance: | $0 | Springing | N/A | | Cut-off Date LTV: | 59.4% |
| Replacement Reserves: | $0 | Springing | $112,316 | | Maturity Date LTV: | 59.4% |
| TI / LC Reserve: | $0 | Springing | $561,578 | | UW NCF DSCR: | 1.78x |
| | | | | | UW NOI Debt Yield: | 11.0% |
| | | | | | | |
| Sources and Uses |
| Sources | Proceeds | % of Total | | Uses | Proceeds | % of Total |
| Mortgage Loan | $34,000,000 | 100.0% | | Principal Equity Distribution | $29,016,061 | 85.3 | % |
| | | | | Closing Costs | 4,983,939 | 14.7 | |
| Total Sources | $34,000,000 | 100.0% | | Total Uses | $34,000,000 | 100.0 | % |
| (1) | For a full description of escrows and reserves, see “Escrows and Reserves” below. |
| (2) | See “Portfolio Summary” table herein. |
| (3) | Historical cash flows were not provided as the borrower acquired the MRP Solutions Portfolio Properties in a sale-leaseback transaction in 2022. |
The Loan. The sixth largest mortgage loan (the “MRP Solutions Portfolio Mortgage Loan”) is secured by the borrower’s fee interest in two industrial properties located in Plattsburgh, New York and Twinsburg, Ohio (the “MRP Solutions Portfolio Properties”). The MRP Solutions Portfolio Mortgage Loan was originated on November 17, 2023, by Bank of Montreal. The MRP Solutions Portfolio Mortgage Loan has a 10-year interest only term and accrues interest at a rate of 6.09000% per annum. The scheduled maturity date of the MRP Solutions Portfolio Mortgage Loan is the payment date that occurs on December 6, 2033.
The Properties. The MRP Solutions Portfolio Properties consist of two industrial properties, with an aggregate of 560,141 square feet. The MRP Solutions Portfolio Properties are located in Plattsburgh, New York (“Plattsburgh Property”) and Twinsburg, Ohio (“Twinsburg Property”). The MRP Solutions Portfolio Properties are 100% occupied with a single tenant, MRP Solutions (the “Tenant”).
| THE INFORMATION IN THIS STRUCTURAL AND COLLATERAL TERM SHEET IS NOT COMPLETE AND MAY BE AMENDED PRIOR TO THE TIME OF SALE. THIS TERM SHEET IS NOT AN OFFER TO SELL THESE SECURITIES AND IT IS NOT A SOLICITATION OF AN OFFER TO BUY THESE SECURITIES IN ANY JURISDICTION WHERE THE OFFER OR SALE IS NOT PERMITTED. |
| | 72 | |
| Structural and Collateral Term Sheet | | BMO 2023-C7 |
| No. 6 – MRP Solutions Portfolio |
The following table presents certain information relating to the MRP Solutions Portfolio Properties:
| Portfolio Summary |
| Property Name | Year Built / Renovated | Net Rentable Area (SF) (1) | Occupancy %(1) | Allocated Loan Amount (“ALA”) | % of ALA | Appraised Value | % of Appraised Value | UW NCF | % of UW NCF |
| Plattsburgh Property | 1978 / 2000 | 410,837 | 100.0% | $26,391,691 | 77.6 | % | $43,500,000 | 76.0 | % | $2,714,693 | 72.7 | % |
| Twinsburg Property | 1966 / 2023 | 149,304 | 100.0% | 7,608,309 | 22.4 | | 13,700,000 | 24.0 | | 1,017,552 | 27.3 | |
| Total | | 560,141 | 100.0% | $34,000,000 | 100.0 | % | $57,200,000 | 100.0 | % | $3,732,246 | 100.0 | % |
| (1) | Based on underwritten rent roll dated as of November 17, 2023. |
Plattsburgh Property (73.3% of NRA; 72.7% of underwritten base rent). The Plattsburgh Property is a 410,837 square foot, industrial property containing two, one- and two-story buildings located at 1-4 Plant Street & 41 Wall Street in Plattsburgh, New York. The buildings, located on a 21.75-acre site, were built in 1978 and renovated in 2000.
Twinsburg Property (26.7% of NRA; 27.3% of underwritten base rent). The Twinsburg Property is a 149,304 square foot, industrial property containing two, single-story buildings located at 2222 & 2300 Highland Road in Twinsburg, Ohio. The buildings, located on a 13.17-acre, were built in 1966 and renovated in 2023.
Sole Tenant.
MOLD-RITE PLASTICS, LLC, a Delaware limited liability company (“MRP”) (560,141 square feet; 100.0% NRA; 100.0% of underwritten base rent): MRP Solutions is a leading provider of high-quality, injection molded plastic closures, jars and packaging components. Since 1976, MRP Solutions has served a diverse range of markets including nutraceutical, pharmaceutical, food and beverage, personal care, home care and automotive.
Appraisal. According to the appraisal, the MRP Solutions Portfolio Properties had an “as-is” appraised value of $57,200,000 as of September 13, 2023. The table below shows the appraiser’s “as-is” conclusions.
| | Appraisal Valuation Summary(1) |
| Property Name | Appraisal Approach | Appraised Value | Capitalization Rate(2) |
| Plattsburg Property | Direct Capitalization Approach | $43,500,000 | 6.25% |
| Twinsburg Property | Direct Capitalization Approach | $13,700,000 | 7.25% |
| (2) | The capitalization rates shown above represent the overall capitalization rate. |
Environmental. According to the Phase I environmental assessments dated September 18, 2023, there was evidence of a recognized environmental condition at the Twinsburg Property. The lack of sampling data or closure documentation for the historic Underground Storage Tanks (“UST”) (size and contents unknown) located at the 2222 Highland Road building of the Twinsburg Property, which was reportedly closed-in-place, is identified as a Recognized Environmental Condition (“REC”). There is no regulatory obligation to take any further action with respect to this UST at this time. Environmental insurance will be obtained to address this REC. There was no evidence of any recognized environmental conditions at the Plattsburgh Property.
The following table presents certain information relating to the historical and current occupancy of the MRP Solutions Portfolio Properties:
| Historical and Current Occupancy |
| 2020(1) | 2021(1) | 2022(1) | Current(2) |
| NAV | NAV | NAV | 100.0% |
| (1) | Historical cash flows were not provided as the borrower acquired the MRP Solutions Portfolio Properties in a sale-leaseback transaction in June 2022. |
| (2) | Current occupancy is based on the underwritten rent roll dated as of November 17, 2023. |
| THE INFORMATION IN THIS STRUCTURAL AND COLLATERAL TERM SHEET IS NOT COMPLETE AND MAY BE AMENDED PRIOR TO THE TIME OF SALE. THIS TERM SHEET IS NOT AN OFFER TO SELL THESE SECURITIES AND IT IS NOT A SOLICITATION OF AN OFFER TO BUY THESE SECURITIES IN ANY JURISDICTION WHERE THE OFFER OR SALE IS NOT PERMITTED. |
| | 73 | |
| Structural and Collateral Term Sheet | | BMO 2023-C7 |
| No. 6 – MRP Solutions Portfolio |
The following table presents certain information relating to the sole tenant based on net rentable area at the MRP Solutions Portfolio Properties:
| Sole Tenant Summary(1) |
| Tenant | Ratings
Moody’s/S&P/ Fitch | Net Rentable Area (SF) | % of
Total NRA | UW
Base Rent PSF(2) |
UW
Base Rent(2) | % of Total
UW Base Rent | Lease
Exp. Date |
| MRP Solutions | NR/NR/NR | 560,141 | 100.0% | $6.66 | $3,732,246 | 100.0% | 6/1/2047 |
| Occupied Collateral Total / Wtd. Avg. | | 560,141 | 100.0% | $6.66 | $3,732,246 | 100.0% | |
| Vacant Space | | 0 | 0.0% | | | | |
| Collateral Total | | 560,141 | 100.0% | | | | |
| | | | | | | | |
| | | | | | | | |
| (1) | Based on underwritten rent roll dated as of November 17, 2023. |
| (2) | UW Base Rent PSF and UW Base Rent include contractual rent steps per the tenants’ lease terms to July 1, 2024 totaling $82,128. |
The following table presents certain information relating to the tenant lease expirations at the MRP Solutions Portfolio Properties:
| Lease Rollover Schedule(1) |
| Year | Number of Leases Expiring | Net
Rentable
Area
Expiring | % of NRA Expiring | UW Base Rent Expiring(2) | % of UW Base Rent Expiring(2) | Cumulative Net Rentable Area Expiring | Cumulative
% of NRA
Expiring | Cumulative UW Base Rent Expiring(2) | Cumulative % of UW Base Rent Expiring(2) |
| Vacant | NAP | 0 | 0.0 | % | NAP | NA | P | 0 | 0.0% | NAP | NAP |
| 2023 & MTM | 0 | 0 | 0.0 | | $0 | 0.0 | % | 0 | 0.0% | $0 | 0.0% |
| 2024 | 0 | 0 | 0.0 | | 0 | 0.0 | | 0 | 0.0% | $0 | 0.0% |
| 2025 | 0 | 0 | 0.0 | | 0 | 0.0 | | 0 | 0.0% | $0 | 0.0% |
| 2026 | 0 | 0 | 0.0 | | 0 | 0.0 | | 0 | 0.0% | $0 | 0.0% |
| 2027 | 0 | 0 | 0.0 | | 0 | 0.0 | | 0 | 0.0% | $0 | 0.0% |
| 2028 | 0 | 0 | 0.0 | | 0 | 0.0 | | 0 | 0.0% | $0 | 0.0% |
| 2029 | 0 | 0 | 0.0 | | 0 | 0.0 | | 0 | 0.0% | $0 | 0.0% |
| 2030 | 0 | 0 | 0.0 | | 0 | 0.0 | | 0 | 0.0% | $0 | 0.0% |
| 2031 | 0 | 0 | 0.0 | | 0 | 0.0 | | 0 | 0.0% | $0 | 0.0% |
| 2032 | 0 | 0 | 0.0 | | 0 | 0.0 | | 0 | 0.0% | $0 | 0.0% |
| 2033 | 0 | 0 | 0.0 | | 0 | 0.0 | | 0 | 0.0% | $0 | 0.0% |
| 2034 & Beyond | 1 | 560,141 | 100.0 | | 3,732,246 | 100.0 | | 560,141 | 100.0% | $3,732,246 | 100.0% |
| Total | 1 | 560,141 | 100.0 | % | $3,732,246 | 100.0 | % | | | | |
| (1) | Based on underwritten rent roll dated as of November 17, 2023. |
| (2) | UW Base Rent Expiring, % of UW Base Rent Expiring, Cumulative UW Base Rent Expiring and Cumulative % of UW Base Rent Expiring include contractual rent steps per the tenant’s lease terms to July 1, 2024 totaling $82,128. |
| THE INFORMATION IN THIS STRUCTURAL AND COLLATERAL TERM SHEET IS NOT COMPLETE AND MAY BE AMENDED PRIOR TO THE TIME OF SALE. THIS TERM SHEET IS NOT AN OFFER TO SELL THESE SECURITIES AND IT IS NOT A SOLICITATION OF AN OFFER TO BUY THESE SECURITIES IN ANY JURISDICTION WHERE THE OFFER OR SALE IS NOT PERMITTED. |
| | 74 | |
| Structural and Collateral Term Sheet | | BMO 2023-C7 |
| No. 6 – MRP Solutions Portfolio |
The following table presents certain information relating to the operating history and underwritten cash flows of the MRP Portfolio Properties:
| Operating History and Underwritten Net Cash Flow(1) |
| | Underwritten | Per Square Foot | %(2) |
| Rents in Place | $3,650,118 | $6.52 | | 97.8 | % |
| Rent Steps(3) | 82,128 | 0.15 | | 2.2 | |
| Gross Potential Rent | $3,732,246 | $6.66 | | 100.0 | % |
| Total Reimbursements | 0 | 0.00 | | 0.0 | |
| Net Rental Income | $3,732,246 | $6.66 | | 100.0 | % |
| Other Income | 0 | 0.00 | | 0.0 | |
| (Vacancy/Credit Loss) | 0 | 0.00 | | 0.0 | |
| Effective Gross Income | $3,732,246 | $6.66 | | 100.0 | % |
| Total Expenses | $0 | $0.00 | | 0.0 | % |
| Net Operating Income | $3,732,246 | $6.66 | | 100.0 | % |
| Total Leasing & Capital Cost | 0 | 0.00 | | 0.0 | |
| Net Cash Flow | $3,732,246 | $6.66 | | 100.0 | % |
| (1) | Historical cash flows were not provided as the borrower acquired the MRP Solutions Portfolio Properties in a sale-leaseback transaction in June 2022. |
| (2) | % column represents percent of Net Rental Income for all revenue lines and represents percent of Effective Gross Income for the remainder of fields. |
| (3) | Rent Steps per the tenant’s lease terms to July 1, 2024 totaling $82,128. |
The Markets. The Plattsburgh Property is located in Clinton County, which is in northeastern New York. Clinton is accessible to Interstate 87, U.S. Routes 9, and State Route 22. Clinton benefits from its location within the state of New York’s northeast corner, being in close in proximity to the growing metropolitan areas of Burlington, Vermont and Montreal, Quebec. According to the appraisal, Clinton had a 2022 total population of 79,369 and experienced an annual growth rate decrease of 0.2%, which was lower than the New York annual growth rate decrease of 0.7%.
The Plattsburgh economy is based on the wholesale/retail trade, healthcare, and education industries. The Plattsburgh Property is approximately a quarter mile north of State Route 22 and two miles east of Interstate 87. Retail uses in the area include Burger King, Latitude 44 Bistro, Family Dollar, and Southside Grocery. Office uses consist of Labor Department, Mckinley and Moore Tax Services, and Alexander Edwards & Company, CPAs, P.C. Industrial developments nearby include BFG International, Cintube International Ltd's, Plattco Corporation, and EuroGear Incorporated. The Plattsburgh Property is approximately two miles south of SUNY Plattsburgh. The University of Vermont Health Network is the regional health provider having its main facilities approximately three miles north of Plattsburgh Property.
According to the appraisal, the 2022 population within a one-, three- and five-mile radius of the Plattsburgh Property was 4,716, 24,231 and 32,260, respectively. The 2022 median household income within the same radii was $55,109, $57,177 and $59,824, respectively.
| THE INFORMATION IN THIS STRUCTURAL AND COLLATERAL TERM SHEET IS NOT COMPLETE AND MAY BE AMENDED PRIOR TO THE TIME OF SALE. THIS TERM SHEET IS NOT AN OFFER TO SELL THESE SECURITIES AND IT IS NOT A SOLICITATION OF AN OFFER TO BUY THESE SECURITIES IN ANY JURISDICTION WHERE THE OFFER OR SALE IS NOT PERMITTED. |
| | 75 | |
| Structural and Collateral Term Sheet | | BMO 2023-C7 |
| No. 6 – MRP Solutions Portfolio |
The following table presents certain information relating to comparable industrial leases for the Plattsburgh Property:
| Comparable Rental Summary(1) |
| Property Name/Location | Year Built / Renovated | NRA (SF) | Tenant Name | Lease Size (SF) | Rent PSF | Commencement | Lease Term (Years) | Lease Type |
Plattsburgh Property 1-4 Plant Street & 41 Wall Street Plattsburgh, NY | 1978 / 2000 | 410,837(2) | MRP Solutions(2) | 410,837(2) | $6.61(2) | Jun-22(2) | 25.0(2) | NNN(2) |
Windsor Industrial 123 Day Hill Road Windsor, CT | 1972 / 2022 | 328,700 | Specialty Printing | 328,700 | $5.00 | Nov-22 | 10.0 | NNN |
IEC Electronics 105 Norton Street Newark, NY | 1980 / NAP | 251,245 | IEC Electronics Corp | 251,245 | $8.66 | Feb-20 | 15.0 | NNN |
NVR Industrial Building 7 Enterprise Drive Delanco, NJ | 2004 / NAP | 132,300 | NVR Inc. | 132,300 | $7.80 | Jan-22 | 17.0 | NNN |
1 Stanley Drive 1 Stanley Drive Aston, PA | 2003 / 2007 | 147,000 | Visual Communications | 147,000 | $6.75 | Aug-21 | 10.0 | NNN |
Pureland Industrial Complex 2115 High Hill Road Bridgeport, NJ | 1979 / 1994 | 184,794 | Custom Building Products | 184,794 | $5.40 | Jul-21 | 10.0 | NNN |
| (1) | Information obtained from the appraisal unless otherwise indicated. |
| (2) | Based on the underwritten rent roll dated as of November 17, 2023. |
The following table presents certain information relating to comparable industrial sales for the Plattsburgh Property:
| Comparable Industrial Sales(1) |
| Property / Location | NRA (SF) | Year Built / Renovated | Occupancy | Sale Date | Sale Price | Sale Price PSF | Adjusted Sale Price PSF |
| Plattsburgh Property | 410,837(2) | 1978 / 2000 | 100.0%(2) | NAP | NAP | NAP | NAP |
| 1-4 Plant Street & 41 Wall Street Plattsburgh, NY |
| 6 Wheeling Road | 198,686 | 2010 / NAP | NAV | Jan-22 | $43,560,000 | $219 | $193 |
| Dayton, NJ |
| 6965 Airport Highway Lane | 104,214 | 1970 / NAP | NAV | Aug-21 | $11,325,000 | $109 | $91 |
| Pennsauken Township, NJ |
| 740 Coopertown Road | 133,284 | 1978 / 2022 | NAV | Dec-21 | $14,928,816 | $112 | $110 |
| Delanco, NJ |
| 31 Windsor Place | 142,991 | 1967 / NAP | NAV | May-21 | $17,800,000 | $124 | $117 |
| Central Islip, NY |
| (1) | Information obtained from the appraisal unless otherwise indicated. |
| (2) | Based on the underwritten rent roll dated as of November 17, 2023. |
The Twinsburg Property is located in Twinsburg, Ohio, a suburban community in northeastern Ohio. Twinsburg is located in the Akron metropolitan statistical area (the “Akron MSA”) and is primarily impacted by the greater economy of Summit County. Twinsburg has a variety of retail, office, medical, and industrial uses that serve the community. The Akron MSA is in the Great Lakes region, approximately 39 miles south of Lake Erie. Total employment has increased annually over the past decade in the state of Ohio by 0.5% and increased annually by 0.1% in the Akron MSA.
According to the appraisal, the 2022 population within a one-, three- and five-mile radius of the Twinsburg Property was 1,167, 29,702 and 85,005, respectively. The 2022 median household income within the same radii was $86,289, $113,975 and $108,933, respectively.
| THE INFORMATION IN THIS STRUCTURAL AND COLLATERAL TERM SHEET IS NOT COMPLETE AND MAY BE AMENDED PRIOR TO THE TIME OF SALE. THIS TERM SHEET IS NOT AN OFFER TO SELL THESE SECURITIES AND IT IS NOT A SOLICITATION OF AN OFFER TO BUY THESE SECURITIES IN ANY JURISDICTION WHERE THE OFFER OR SALE IS NOT PERMITTED. |
| | 76 | |
| Structural and Collateral Term Sheet | | BMO 2023-C7 |
| No. 6 – MRP Solutions Portfolio |
The following table presents certain information relating to comparable industrial leases for the Twinsburg Property:
| Comparable Rental Summary(1) |
| Property Name/Location | Year Built | NRA (SF) | Tenant Name | Lease Size (SF) | Rent PSF | Commencement | Lease Term (Years) | Lease Type |
Twinsburg Property 2222 & 2300 Highland Road Twinsburg, OH | 1966 / 2023 | 149,304(2) | MRP Solutions(2) | 149,304(2) | $6.82(2) | Jun-22(2) | 25.0(2) | NNN(2) |
Industrial 400 Sprow I Road Huron Township, OH | 2007 / NAP | 177,800 | PPG Industries | 177,800 | $5.22 | Jul-22 | 2.5 | NNN |
Solon Industrial 30333 Emerald Valley Pkwy Solon, OH | 2004 / NAP | 120,000 | Radix | 120,000 | $5.50 | Dec-22 | 5.0 | NNN |
Single-Tenant Industrial 6255 Suder Ave. Toledo, OH | 1998 / 2019 | 45,320 | Flooring Outlet | 45,320 | $6.00 | Apr-23 | 5.0 | NNN |
Industrial 34929 Curtis Boulevard Eastlake, OH | 1972 / NAP | 69,733 | MPI Products | 69,733 | $5.27 | Jun-23 | 3.9 | NNN |
Industrial 1441 Western Avenue Cincinnati, OH | 1985 / NAP | 101,297 | Encore Technologies | 101,297 | $6.50 | Jul-23 | 5.0 | NNN |
| (1) | Information obtained from the appraisal unless otherwise indicated. |
| (2) | Based on the underwritten rent roll dated as of November 17, 2023. |
The following table presents certain information relating to comparable industrial sales for the Twinsburg Property:
| Comparable Industrial Sales(1) |
| Property / Location | NRA (SF) | Year Built | Occupancy | Sale Date | Sale Price | Sale Price PSF | Adjusted Sale Price PSF |
Twinsburg Property 2222 & 2300 Highland Road | 149,304(2) | 1966 / 2023 | 100.0%(2) | NAP | NAP | NAP | NAP |
| Twinsburg, OH |
Roth Bros Inc. Headquarters 3821 Crum Road | 122,676 | 1955 / 2013 | 100.0% | Jun-22 | $7,500,000 | $61 | $72 |
| Youngstown, OH |
1500 Chamberlain 1500 Chamberlain Boulevard | 203,300 | 1963 / NAP | 100.0% | Aug-22 | $13,000,000 | $64 | $88 |
| Conneaut, OH |
Foltz Manufacturing 17200 Foltz Industrial Parkway | 45,050 | 1999 / NAP | 100.0% | Dec-22 | $3,966,000 | $88 | $80 |
| Strongsville, OH |
Ohio Aluminum 4840 Warner Road | 80,000 | 1970 / NAP | 100.0% | May-23 | $4,257,796 | $53 | $75 |
| Garfield Heights, OH |
| (1) | Information obtained from the appraisal unless otherwise indicated. |
| (2) | Based on the underwritten rent roll dated as of November 17, 2023. |
The Borrower. The borrower is AGNL Caps, L.L.C., a Delaware limited liability company with one independent director. Legal counsel to the borrower delivered a non-consolidation opinion in connection with the origination of the MRP Solutions Portfolio Mortgage Loan.
The Borrower Sponsors. The nonrecourse carve-out guarantors are AG Net Lease IV (Q) Corp., a Delaware corporation, AG Net Lease IV Corp., a Delaware corporation, and AG Net Lease Realty Fund IV Investments (H-1), L.P., a Delaware limited partnership (individually and collectively, “Sponsors” and “Guarantors”). Found in 1988, TPG Angelo Gordon (“Angelo Gordon”) is an alternative investment advisory that manages approximately $76 billion as of September 30, 2023. Angelo Gordon has over 700 employees across the U.S., Europe and Asia.
| THE INFORMATION IN THIS STRUCTURAL AND COLLATERAL TERM SHEET IS NOT COMPLETE AND MAY BE AMENDED PRIOR TO THE TIME OF SALE. THIS TERM SHEET IS NOT AN OFFER TO SELL THESE SECURITIES AND IT IS NOT A SOLICITATION OF AN OFFER TO BUY THESE SECURITIES IN ANY JURISDICTION WHERE THE OFFER OR SALE IS NOT PERMITTED. |
| | 77 | |
| Structural and Collateral Term Sheet | | BMO 2023-C7 |
| No. 6 – MRP Solutions Portfolio |
Property Management. The MRP Solutions Portfolio Properties are self-managed.
Escrows and Reserves.
Tax Escrows – Upon the occurrence and during the continuance of an event of default or Trigger Period (as defined below), on a monthly basis, the borrower is required to escrow 1/12th of the annual estimated tax payments.
Insurance Escrows – Upon the occurrence and during the continuance of an event of default or Trigger Period, on a monthly basis, the borrower is required to escrow 1/12th of the premiums estimated to be payable during the next 12 months.
Replacement Reserve – On each payment date during the continuance of an event of default or Trigger Period*, the borrower is required to deposit monthly replacement reserve amount of approximately $112,316; provided however, the monthly deposits into the replacement reserve account would be suspended for so long as the amount in the replacement reserve account is equal to or greater than $112,315.60 as of the Note Date (equal to $0.20 per square foot) (the Replacement Reserve Threshold Amount”), provided, further, however, at any time the amount in the replacement reserve account is less than approximately $56,157.80 as of the Note Date (equal to $0.10 per square foot), the borrower is required to deposit the monthly replacement reserve amount until the amount in the replacement reserve account is once again equal to or greater than the Replacement Reserve Threshold Amount. *Borrower is not required to reserve funds in the replacement reserve account so long as: (i) the Critical Tenant lease is in full force and effect, and (ii) Critical Tenant shall be current in its payment of replacements with respect to the Properties consistent with the requirements of the Critical Tenant lease.
TI/LC Reserve – On each payment date during the continuance of an event of default or Trigger Period, the borrower is required to deposit monthly TI/LC amount of $280,789, provided however, the monthly deposits into the TI/LC reserve account would be suspended for so long as the amount in the TI/LC reserve account is equal to or greater $561,578 as of the Note Date (equal to $1.00 per square foot) (the “TI/LC Threshold Amount”), provided, further, however, at any time the amount in the TI/LC reserve account is less than approximately $280,789 (equal to $0.50 per square foot), the borrower is required to deposit the monthly TI/LC amount until the amount in the TI/LC reserve account is once again equal to or greater the TI/LC Threshold Amount.
Rollover Reserve – During a Trigger Period caused by a Tenant Trigger Event, borrower shall deposit into the rollover reserve account, an amount equal to all excess cash flow in accordance the Loan Agreement; provided, however, solely during a continuing Trigger Period caused by a Dark Tenant Trigger Event (defined below), deposits into the rollover reserve account shall be suspended for so long as the amount contained therein is equal to or greater than the Dark Tenant Threshold Amount
Lockbox / Cash Management. The MRP Solutions Portfolio Mortgage Loan is structured with a hard lockbox and springing cash management. In connection with the origination of the MRP Solutions Portfolio Mortgage Loan, the borrower delivered tenant instruction letter requiring the Critical Tenant to deposit all rents payable under the Critical Tenant lease into the clearing account controlled by the lender. Notwithstanding the foregoing, the Critical Tenant is required to deposit all revenues otherwise received into the clearing account within three business days of receipt. All sums on deposit in the clearing account are required to be transferred to a cash management account controlled by the lender upon the occurrence and during the continuance of a Trigger Period and are required to be applied and disbursed in accordance with the MRP Solutions Portfolio Mortgage Loan documents.
A “Trigger Period” means any of the following: (a) any period from (i) the occurrence of a Bankruptcy Trigger Event (as defined below), to either (x) such bankruptcy proceeding is dismissed and the applicable tenant is in occupancy, paying normal periodic rent and is otherwise in compliance with the term of its lease and has provided an updated estoppel certificate in the form provided as of the closing date or another form reasonably acceptable to the lender, (y) (I) the applicable tenant has affirmed its lease during the bankruptcy proceeding or (II) the applicable lease is assumed by a successor in interest to tenant pursuant to an order of a bankruptcy court in accordance with the bankruptcy code in connection with a restructuring or reorganization of tenant, and in the case of (I) or (II), is in occupancy, paying normal periodic rent, is otherwise in compliance with the terms of such lease and has provided an updated estoppel certificate in the form provided as of the closing date or another form reasonably acceptable to the lender, or (z) the applicable lease is cancelled, terminated or otherwise rejected in such bankruptcy proceeding and the MRP Solutions Portfolio Properties are subject to one or more Approved Substitute Lease (as defined below); or (ii) the occurrence of Dark Tenant Trigger Event
| THE INFORMATION IN THIS STRUCTURAL AND COLLATERAL TERM SHEET IS NOT COMPLETE AND MAY BE AMENDED PRIOR TO THE TIME OF SALE. THIS TERM SHEET IS NOT AN OFFER TO SELL THESE SECURITIES AND IT IS NOT A SOLICITATION OF AN OFFER TO BUY THESE SECURITIES IN ANY JURISDICTION WHERE THE OFFER OR SALE IS NOT PERMITTED. |
| | 78 | |
| Structural and Collateral Term Sheet | | BMO 2023-C7 |
| No. 6 – MRP Solutions Portfolio |
(as defined below), to either (w) the applicable tenant, that gave rise to the Dark Tenant Trigger Event, has recommenced its business and operations in the applicable portion of the MRP Solutions Portfolio Properties and is paying normal periodic rent and is otherwise in compliance with the term of its lease and has provided the lender with an updated estoppel certificate, (x) the applicable portion of the MRP Solutions Portfolio Properties that gave rise to the Dark Tenant Trigger Event is subject to one or more Approved Substitute Leases, (y) the lease is assumed by a successor in interest to tenant pursuant to an order of a bankruptcy court in accordance with the bankruptcy code in connection with a restructuring or reorganization of tenant, or (z) such time as the balance on deposited in the TI/LC reserve is not less than $2,099,358; and (b) any period from the occurrence of an event of default under the Permitted Mezzanine Loan or the New Mezzanine Loan (as defined in the Cooperation Agreement) until the earlier to occur of such event of default is waived by the holder of such Permitted Mezzanine Loan or New Mezzanine Loan (as applicable) or the debt is paid in full. A Trigger Period will not be terminated unless, at the time Borrower satisfies the conditions for termination of the applicable Trigger Period as set forth in clause (a) or clause (b) above, there is no continuing event of default and no other event has occurred which would cause an additional Trigger Period as described above.
An “Approved Substitute Lease” means a bona-fide lease with a third party tenant conforming in all material respects with the requirements of the MRP Solutions Portfolio Mortgage Loan documents and providing for (i) minimum base rent equal to or greater than the greater of (a) the amount the amount per square foot corresponding to each individual property as set forth in the MRP Solutions Portfolio Mortgage Loan documents and (b) the lesser of (x) the then prevailing market rental rate as determined by a nationally recognized brokerage firm selected by the borrower (the “Approved Leasing Broker”), (y) the then applicable rental rate that would otherwise have been payable under the Critical Tenant (as defined below) lease that is intended to be replaced, and (ii) a term at least equal to the greater of (a) one year and (b) the lesser of (x) the then prevailing market lease term as determined by the Approved Leasing Broker, or (y) the remaining term under the Critical Tenant lease that is intended to be replaced.
A “Bankruptcy Trigger Event” means the occurrence of the following: (i) (x) the date of the filing of a bankruptcy petition by Critical Tenant or any guarantor of the Critical Tenant lease under the bankruptcy code, or (y) in the context of an involuntary filing of a bankruptcy petition against Critical Tenant or any guarantor of the Critical Tenant lease under the bankruptcy code or (ii) the occurrence of a Dark Tenant Trigger Event (as defined below).
A “Critical Tenant” means (i) MRP and (ii) any Tenant pursuant to an Approved Substitute Lease.
A “Dark Tenant Trigger Event” means the earliest of any of the following: the date Critical Tenant terminates, “goes dark”, discontinues its operations or business, vacates, or ceases to occupy one or more individual MRP Solutions Portfolio Properties (excluding any portion of the MRP Solutions Portfolio Properties subleased in accordance with the terms of the Critical Tenant lease which sublease or subleases demise less than 20% of the net leasable area of the MRP Solutions Portfolio Properties as a whole) in violation of the Critical Tenant lease (including purporting to terminate the Critical Tenant lease) beyond any applicable notice and cure period which results in an event of default thereunder.
Subordinate Debt. None.
Mezzanine Debt. None. However, the borrower will be permitted to enter into a mezzanine loan (“Permitted Mezzanine Loan”), provided all the following conditions are satisfied: (a) no event of default; (b) the holder of the Permitted Mezzanine Loan is an institutional lender and is required to be approved by the lender; provided, in no event, may the holder of the Permitted Mezzanine Loan be the borrower of an affiliate of the borrower; (c) the holder is not permitted at any time the indebtedness remains outstanding to sell or transfer its right in the Permitted Mezzanine Loan except as otherwise pursuant to the intercreditor agreement; (d) the Permitted Mezzanine Loan is only undertaken pursuant to those loan documents approved by the lender in the lender’s reasonable discretion; (e) the lender and the holder of the Permitted Mezzanine Loan enter into and execute an intercreditor agreement in form and substance acceptable to lender and any rating agency; (f) the Permitted Mezzanine Loan is not secured by a lien on the MRP Solutions Portfolio Properties or constitutes an obligation of the borrower but, rather, constitutes an obligation of the mezzanine borrower and any guarantor thereof and is secured solely by a security interest in mezzanine borrower’s direct or indirect ownership interests in the borrower (the “Membership Interest”) and other assets of the mezzanine borrower; in no event may the mezzanine borrower attempt to grant any lien or security interest in the MRP Solutions Portfolio Properties to secure the Permitted Mezzanine Loan; (g) the holder of the Permitted Mezzanine Loan is not entitled to foreclose on the Membership Interest except in a manner consistent with the intercreditor agreement; (h) the combined loan-to-value ratio at the time of such subordinate financing does not exceed the
| THE INFORMATION IN THIS STRUCTURAL AND COLLATERAL TERM SHEET IS NOT COMPLETE AND MAY BE AMENDED PRIOR TO THE TIME OF SALE. THIS TERM SHEET IS NOT AN OFFER TO SELL THESE SECURITIES AND IT IS NOT A SOLICITATION OF AN OFFER TO BUY THESE SECURITIES IN ANY JURISDICTION WHERE THE OFFER OR SALE IS NOT PERMITTED. |
| | 79 | |
| Structural and Collateral Term Sheet | | BMO 2023-C7 |
| No. 6 – MRP Solutions Portfolio |
closing date loan-to-value ratio based on an appraisal of the MRP Solutions Portfolio Properties; (i) the annual combined DSCR on the MRP Solutions Portfolio Mortgage Loan and the Permitted Mezzanine Loan is equal to or greater than the closing date DSCR; (j) the combined debt yield is equal to or greater than the closing date debt yield; (k) (i) the Permitted Mezzanine Loan is fully non-recourse to the borrower as to principal and interest, (ii) such Permitted Mezzanine Loan is only payable to the extent available net cash flow is available, (iii) defaults under the Permitted Mezzanine Loan are limited solely to monetary defaults and fraud, (iv) any proceeds from the Permitted Mezzanine Loan will be applied to the MRP Solutions Portfolio Properties and operations, (v) any obligations under the Permitted Mezzanine Loan provide for a fixed rate of interest and (vi) to the extent any balloon payment is due at the maturity of such Permitted Mezzanine Loan, (a) such maturity does not occur prior to the maturity of the MRP Solutions Portfolio Mortgage Loan and allow at least two one-year extensions at the option of the mezzanine borrower, or (b) any balloon payment may be paid following the maturity of the MRP Solutions Portfolio Mortgage Loan without the payment of any prepayment premium or prepayment fee; (l) the borrower has paid all of lender’s reasonable and actual out-of-pocket costs and out-of-pocket expenses related to the approval of the Permitted Mezzanine Loan; (m) the Permitted Mezzanine Loan is expressly subordinate and inferior in all respects to the MRP Solutions Portfolio Mortgage Loan; and (n) the rating condition is satisfied or deemed satisfied or waived.
Partial Release. Solely in connection with a Permitted Release Casualty Event (as defined below), the borrower may obtain the release of the applicable MRP Solutions Portfolio Property upon the satisfaction of the following conditions, among others: (a) no event of default; (b) the borrower either prepays the MRP Solutions Portfolio Mortgage Loan in its entirety or, after the expiration of the lockout period, partially defeases the MRP Solutions Portfolio Mortgage Loan, in each case in an amount equal to the 110% of the allocated loan amount attributable to the applicable individual MRP Solutions Portfolio Property to be released; (c) following such partial release event, the borrower continues to be a single purpose entity; (d) after giving effect to such partial release event, the DSCR for the remaining MRP Solutions Portfolio Property is not less than the greater of (i) 1.78x or (ii) the DSCR of the MRP Solutions Portfolio Properties immediately prior to such partial release event; (e) after giving effect to such partial release event, the loan-to-value ratio for the remaining MRP Solutions Portfolio Property does not exceed the lesser of: (i) 59% or (ii) the loan-to-value ratio of the MRP Solutions Portfolio Property immediately prior to such partial release event; and (f) after giving effect to such partial release event, the debt yield for the remaining MRP Solutions Portfolio Property is no less than the greater of: (i) 11% or (ii) the debt yield immediately prior to such partial release event.
A “Permitted Release Casualty Event” means the occurrence of a casualty or condemnation at the MRP Solutions Portfolio Properties, which casualty or condemnation results in Critical Tenant terminating the Critical Tenant lease with respect to such property.
Ground Lease. None.
| THE INFORMATION IN THIS STRUCTURAL AND COLLATERAL TERM SHEET IS NOT COMPLETE AND MAY BE AMENDED PRIOR TO THE TIME OF SALE. THIS TERM SHEET IS NOT AN OFFER TO SELL THESE SECURITIES AND IT IS NOT A SOLICITATION OF AN OFFER TO BUY THESE SECURITIES IN ANY JURISDICTION WHERE THE OFFER OR SALE IS NOT PERMITTED. |
| | 80 | |
| Structural and Collateral Term Sheet | | BMO 2023-C7 |
| No. 7 – The Park at Trowbridge |
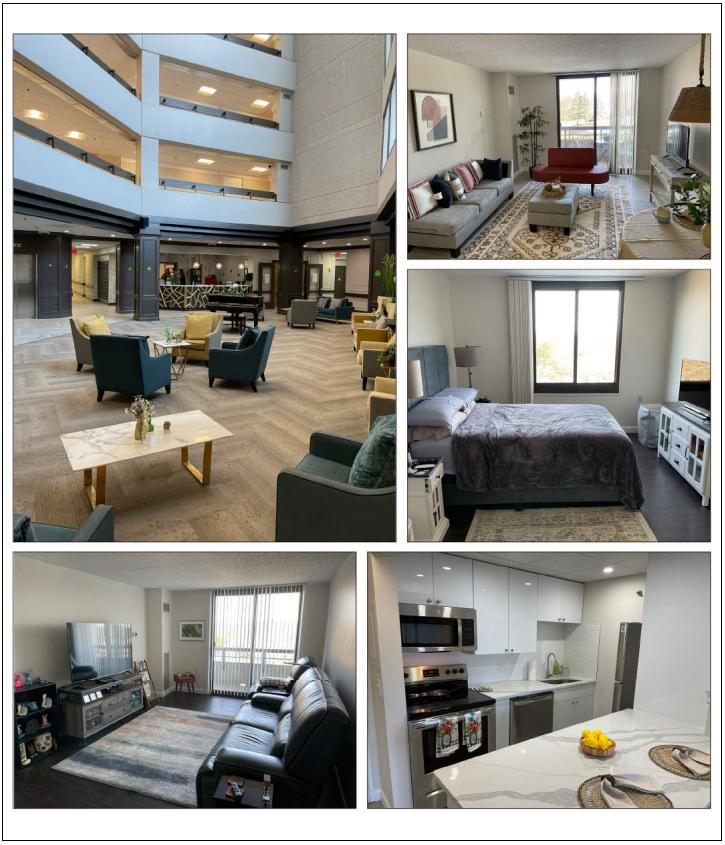
| THE INFORMATION IN THIS STRUCTURAL AND COLLATERAL TERM SHEET IS NOT COMPLETE AND MAY BE AMENDED PRIOR TO THE TIME OF SALE. THIS TERM SHEET IS NOT AN OFFER TO SELL THESE SECURITIES AND IT IS NOT A SOLICITATION OF AN OFFER TO BUY THESE SECURITIES IN ANY JURISDICTION WHERE THE OFFER OR SALE IS NOT PERMITTED. |
| | 81 | |
| Structural and Collateral Term Sheet | | BMO 2023-C7 |
| No. 7 – The Park at Trowbridge |

| THE INFORMATION IN THIS STRUCTURAL AND COLLATERAL TERM SHEET IS NOT COMPLETE AND MAY BE AMENDED PRIOR TO THE TIME OF SALE. THIS TERM SHEET IS NOT AN OFFER TO SELL THESE SECURITIES AND IT IS NOT A SOLICITATION OF AN OFFER TO BUY THESE SECURITIES IN ANY JURISDICTION WHERE THE OFFER OR SALE IS NOT PERMITTED. |
| | 82 | |
| Structural and Collateral Term Sheet | | BMO 2023-C7 |
| No. 7 – The Park at Trowbridge |
| Mortgage Loan Information | | Property Information |
| Mortgage Loan Seller: | BMO | | Single Asset / Portfolio: | Single Asset |
| Original Principal Balance: | $33,000,000 | | Title: | Fee |
| Cut-off Date Principal Balance: | $33,000,000 | | Property Type – Subtype: | Multifamily – Mid Rise |
| % of IPB: | 4.5% | | Net Rentable Area (Units): | 320 |
| Loan Purpose: | Refinance | | Location: | Southfield, MI |
| Borrower: | Park at Trowbridge Associates LLC | | Year Built / Renovated: | 1988 / 2023 |
| Borrower Sponsor: | David Dedvukaj | | Occupancy: | 82.8% |
| Interest Rate: | 7.28000% | | Occupancy Date: | 10/1/2023 |
| Note Date: | 11/6/2023 | | 4th Most Recent NOI (As of)(2): | NAV |
| Maturity Date: | 11/6/2033 | | 3rd Most Recent NOI (As of)(2): | NAV |
| Interest-only Period: | 120 months | | 2nd Most Recent NOI (As of)(2): | NAV |
| Original Term: | 120 months | | Most Recent NOI (As of)(2): | NAV |
| Original Amortization Term: | None | | UW Economic Occupancy: | 82.8% |
| Amortization Type: | Interest Only | | UW Revenues: | $5,099,464 |
| Call Protection: | L(25),D(90),O(5) | | UW Expenses: | $1,746,408 |
| Lockbox / Cash Management: | Soft / Springing | | UW NOI: | $3,353,056 |
| Additional Debt: | No | | UW NCF: | $3,273,056 |
| Additional Debt Balance: | N/A | | Appraised Value / Per Unit: | $73,000,000 / $228,125 |
| Additional Debt Type: | N/A | | Appraisal Date: | 10/23/2023 |
| | | | | |
| Escrows and Reserves(1) | | Financial Information |
| | Initial | Monthly | Initial Cap | | Cut-off Date Loan / Unit: | $103,125 | |
| Taxes: | $148,178 | $37,045 | N/A | | Maturity Date Loan / Unit: | $103,125 | |
| Insurance: | $293,784 | $32,643 | N/A | | Cut-off Date LTV: | 45.2% | |
| Replacement Reserves: | $500,000 | $6,667 | $400,000 | | Maturity Date LTV: | 45.2% | |
| Earn-Out Reserve: | $4,200,000 | $0 | N/A | | UW NCF DSCR(3): | 1.34x | |
| | | | | | UW NOI Debt Yield(3): | 11.6% | |
| | | | | | | |
| Sources and Uses |
| Sources | Proceeds | % of Total | | Uses | Proceeds | % of Total |
| Mortgage Loan | $33,000,000 | 100.0% | | Loan Payoff | $18,652,772 | 56.5 | % |
| | | | | Return of Equity | 8,404,784 | 25.5 | |
| | | | | Upfront Reserves | 5,141,962 | 15.6 | |
| | | | | Closing Costs | 800,483 | 2.4 | |
| Total Sources | $33,000,000 | 100.0% | | Total Uses | $33,000,000 | 100.0 | % |
| (1) | For a full description of Escrows and Reserves, please refer to “Escrows and Reserves” below. |
| (2) | Historical operating history is not available as The Park at Trowbridge Property (as defined below) was acquired by the borrower in April 2021. Upon the acquisition of The Park at Trowbridge Property, the borrower began extensive renovation and rebranding of The Park at Trowbridge Property. The assisted living regulations on The Park at Trowbridge Property were removed in December 2021 and the renovations were completed in September 2023. |
| (3) | At origination of The Park at Trowbridge Mortgage Loan (as defined below), the borrower deposited $4,200,000 into an earn-out reserve, to be released to the borrower upon certain conditions being met as described in “Earn-Out Reserve” below. The UW NOI Debt Yield calculation is based on an assumed The Park at Trowbridge Mortgage Loan principal balance of $28,800,000, which is The Park at Trowbridge Mortgage Loan Cut-off Date Balance net of the $4,200,000 earn-out reserve. The UW NOI Debt Yield based on The Park at Trowbridge Mortgage Loan Cut-off Date Balance of $33,000,000 is 10.2%. |
The Loan. The seventh largest mortgage loan (“The Park at Trowbridge Mortgage Loan”) is secured by the borrower’s fee interest in a 320-unit, mid rise multifamily property located in Southfield, Michigan (“The Park at Trowbridge Property”). The Park at Trowbridge Mortgage Loan was originated on November 6, 2023 by Bank of Montreal. The Park at Trowbridge Mortgage Loan accrues interest at an interest rate of 7.28000% per annum. The Park at Trowbridge Mortgage Loan has an original term of 120 months, has a remaining term of 119 months and is interest only for the entire term. The scheduled maturity date of The Park at Trowbridge Mortgage Loan is the monthly payment date that occurs on November 6, 2033.
| THE INFORMATION IN THIS STRUCTURAL AND COLLATERAL TERM SHEET IS NOT COMPLETE AND MAY BE AMENDED PRIOR TO THE TIME OF SALE. THIS TERM SHEET IS NOT AN OFFER TO SELL THESE SECURITIES AND IT IS NOT A SOLICITATION OF AN OFFER TO BUY THESE SECURITIES IN ANY JURISDICTION WHERE THE OFFER OR SALE IS NOT PERMITTED. |
| | 83 | |
| Structural and Collateral Term Sheet | | BMO 2023-C7 |
| No. 7 – The Park at Trowbridge |
The Property. The Park at Trowbridge Property consists of an eight-story multifamily building, totaling 320 residential units on approximately 7.00 acres. The Park at Trowbridge Property is located in Southfield, Michigan, with access to M-10, the John C Lodge Freeway and I-696 is within a quarter mile of The Park at Trowbridge Property. The Park at Trowbridge Property features a range of one-bedroom and two-bedroom residential units and is subject to a consent judgement entered into by the City of Southfield, which requires all residents at The Park at Trowbridge Property to be at least 55 years of age or older and requires certain amenities and building services to be provided to such residents. Community amenities at The Park at Trowbridge Property include a barbeque area, conference room, cybercafé, fitness center, laundry facility, study rooms, carports, central boiler and chiller / cooling tower, elevators, fire sprinklers, flat roofs and on-site management. Unit amenities at The Park at Trowbridge Property include carpeted flooring, dishwasher, garbage disposal, microwave oven, plank flooring, private patios / balconies, quartz countertops, range / oven, refrigerator and stainless steel appliances. The Park at Trowbridge Property has 216 parking spaces, resulting in a ratio of approximately 0.68 parking spaces per unit.
The following table presents detailed information with respect to the unit mix at The Park at Trowbridge Property:
| Unit Mix Summary(1) |
| Unit Type | No. of Units | % of Total | Average Unit Size (SF) | Average Monthly Rental Rate | Average Monthly Rental Rate per SF | Average Monthly Market Rental Rate | Average Monthly Market Rental Rate per SF |
| 1 Bedroom | 198 | 61.9 | % | 591 | $1,468 | $2.48 | $1,591 | $2.69 |
| 2 Bedroom | 122 | 38.1 | | 909 | $1,749 | $1.92 | $1,992 | $2.19 |
| Total/Wtd. Avg. | 320 | 100.0 | % | 712 | $1,583 | $2.25 | $1,744 | $2.45 |
| (1) | Based on the underwritten rent roll as of October 1, 2023. Average Monthly Rental Rate and Average Monthly Rental Rate per SF reflect average monthly in-place rent for occupied units. |
Appraisal. According to the appraisal, The Park at Trowbridge Property had an “as-is” appraised value of $73,000,000 as of October 23, 2023. The table below shows the appraiser’s “as-is” conclusions.
| Appraisal Valuation Summary(1) |
| Appraisal Approach | Appraised Value | Capitalization Rate(2) |
| Direct Capitalization Approach | $73,000,000 | 6.00% |
| (2) | The appraiser used a discounted cash flow approach to arrive at the appraised value. The capitalization rates shown above represent the overall capitalization rate. |
Environmental. According to the Phase I report dated October 27, 2023, there was no evidence of any recognized environmental conditions at The Park at Trowbridge Property.
The following table presents certain information relating to the historical and current occupancy of The Park at Trowbridge Property:
| Historical and Current Multifamily Occupancy(1) |
| 2020 | 2021 | 2022 | Current(2) |
| NAP | NAP | NAP | 82.8% |
| (1) | Historical occupancy is not available as The Park at Trowbridge Property was acquired by the borrower in April 2021. Upon acquisition of The Park at Trowbridge Property, the borrower began an extensive renovation and rebranding of The Park at Trowbridge Property. The assisted living regulations on The Park at Trowbridge Property were removed in December 2021 and the renovations were completed in September 2023. |
| (2) | Current occupancy is as of October 1, 2023. |
| THE INFORMATION IN THIS STRUCTURAL AND COLLATERAL TERM SHEET IS NOT COMPLETE AND MAY BE AMENDED PRIOR TO THE TIME OF SALE. THIS TERM SHEET IS NOT AN OFFER TO SELL THESE SECURITIES AND IT IS NOT A SOLICITATION OF AN OFFER TO BUY THESE SECURITIES IN ANY JURISDICTION WHERE THE OFFER OR SALE IS NOT PERMITTED. |
| | 84 | |
| Structural and Collateral Term Sheet | | BMO 2023-C7 |
| No. 7 – The Park at Trowbridge |
The following table presents certain information relating to the underwritten cash flows of The Park at Trowbridge Property:
| Underwritten Net Cash Flow |
| | Underwritten | Per Unit | %(1) |
| Gross Potential Rent | $6,123,264 | | $19,135 | | 100.0 | % |
| (Vacancy) | (1,087,800) | | (3,399) | | (17.8) | |
| Net Rental Income | $5,035,464 | | $15,736 | | 82.2 | % |
| Other Income | 64,000 | | 200 | | 1.0 | |
| Effective Gross Income | $5,099,464 | | $15,936 | | 83.3 | % |
| | | | |
| Total Expenses(2) | 1,746,408 | | 5,458 | | 34.2 | |
| | | | |
| Net Operating Income | $3,353,056 | | $10,478 | | 65.8 | % |
| | | | |
| Replacement Reserve | 80,000 | | 250 | | 1.6 | |
| | | | |
| Net Cash Flow | $3,273,056 | | $10,228 | | 64.2 | % |
| (1) | % column represents percent of Gross Potential Rent for revenue fields and represents percent of Effective Gross Income for the remainder of fields. |
| (2) | The Park at Trowbridge Property is subject to a 5-year real estate tax exemption that began effective on January 1, 2023 and is scheduled to expire on December 30, 2027. Such tax exemption is expected to result in the tax savings of approximately $174,310 in total during the 5-year period. Taxes were underwritten at $461,965, which is the 10-year average of (i) five years of estimated real estate taxes reduced by the total amount of projected tax savings ($174,310) and (ii) five years of full estimated taxes without the benefit of the tax exemption. |
The Market. The Park at Trowbridge Property is located in Southfield, Michigan, within the Detroit-Warren-Dearborn, MI Metropolitan Statistical Area (the “Detroit MSA”). According to the appraisal, the median household income was $69,898, which is expected to increase over the next five years by 15.2%. The leading industries in the Detroit MSA are manufacturing, health care/social assistance and retail trade sectors. The Park at Trowbridge Property is located in the southeastern Oakland County, approximately 20 miles from the Detroit central business district. The local area is primarily occupied by high-density residential and commercial/office developments. Primary access to the subject neighborhood is provided by Telegraph Road, Franklin Road, Berg Road, Ten Mile Road, Nine Mile Road and Civic Center Drive, all primary commercial thoroughfares.
The Park at Trowbridge Property is situated in the Southfield apartment submarket. According to the appraisal, as of the second quarter of 2023, the Southfield apartment submarket contained 3,961 units and had an overall vacancy rate of 8.0%, with net absorption totaling -23 units and an average rent of $1,326 per unit.
According to the appraisal, the 2023 population within a one-, three-, and five-mile radius of The Park at Trowbridge Property is 8,975, 70,856, and 250,363, respectively. According to the appraisal, the 2023 median household income within the same radii is $45,686, $66,233, and $64,410, respectively.
| THE INFORMATION IN THIS STRUCTURAL AND COLLATERAL TERM SHEET IS NOT COMPLETE AND MAY BE AMENDED PRIOR TO THE TIME OF SALE. THIS TERM SHEET IS NOT AN OFFER TO SELL THESE SECURITIES AND IT IS NOT A SOLICITATION OF AN OFFER TO BUY THESE SECURITIES IN ANY JURISDICTION WHERE THE OFFER OR SALE IS NOT PERMITTED. |
| | 85 | |
| Structural and Collateral Term Sheet | | BMO 2023-C7 |
| No. 7 – The Park at Trowbridge |
The following table presents certain information relating to comparable multifamily rental properties to The Park at Trowbridge Property:
| Comparable Rental Summary(1) |
| Property / Location | Year Built / Renovated | Occupancy | # of Units | Unit Mix | Average SF per Unit | Average Rent per SF | Average Rent per Unit |
| The Park at Trowbridge | 1988 / 2023 | 82.8%(2) | 198(2) | 1 Bed 1 Bath(2) | 591(2) | $2.48(2) | $1,468(2) |
| 24111 Civic Center Drive | 122(2) | 2 Bed 2 Bath(2) | 909(2) | $1.92(2) | $1,749(2) |
| Southfield, MI | | | | | |
| Imperial Senior Suites | 1972 / 2013 | 96.0% | 119 | 1 Bed 1 Bath | 640 | $1.80 | $1,149 |
| 27600 Franklin Road | | | 68 | 2 Bed 1 Bath | 840 - 860 | $1.65 | $1,399 |
| Southfield, MI | | | 7 | 3 Bed 1 Bath | 1,150 | $1.37 | $1,575 |
| Solaire Active Adult Community | 1972 / 2008 | 95.0% | 14 | Studio | 680 | $1.35 | $919 |
| 15700-15800 Providence Drive | | | 250 | 1 Bed 1 Bath | 750 | $1.39 | $1,040 |
| Southfield, MI | | | 112 | 2 Bed 2 Bath | 1,100 | $1.24 | $1,364 |
| | | | 0 | 2 Bed 2 Bath PH | 1,600 | $1.03 | $1,644 |
| | | | 6 | 3 Bed 2.5 Bath PH | 1,600 | $1.07 | $1,714 |
| Oxford Park | 1974 / NAP | 98.0% | 178 | 1 Bed 1 Bath | 520 | $2.17 | $1,129 |
| 2345 Oxford Road | | | 36 | 2 Bed 1 Bath | 720 | $1.94 | $1,399 |
| Berkley, MI | | | | | | | |
| Town Court Apartments | 2021 / NAP | 97.0% | 48 | 1 Bed 1 Bath | 762 | $2.33 | $1,778 |
| 7110 Orchard Lake Road | | | 3 | 1 Bed 1 Bath | 844 | $2.46 | $2,075 |
| West Bloomfield, MI | | | 3 | 1 Bed 1 Bath | 849 | $2.41 | $2,049 |
| | | | 2 | 1 Bed 1 Bath | 851 | $2.43 | $2,072 |
| | | | 21 | 1 Bed 1 Bath | 862 | $2.23 | $1,925 |
| | | | 3 | 2 Bed 2 Bath | 994 | $2.24 | $2,226 |
| | | | 30 | 2 Bed 2 Bath | 1,106 | $2.01 | $2,219 |
| | | | 38 | 2 Bed 2 Bath | 1,137 | $2.05 | $2,334 |
| | | | 6 | 2 Bed 2 Bath | 1,218 | $1.96 | $2,390 |
| | | | 17 | 2 Bed 2 Bath | 1,279 | $1.83 | $2,344 |
| | | | 3 | 3 Bed 2 Bath | 1,293 | $2.20 | $2,841 |
| | | | 1 | 2 Bed 2 Bath | 1,323 | $1.71 | $2,268 |
| | | | 6 | 3 Bed 2 Bath | 1,333 | $1.95 | $2,601 |
| | | | 6 | 2 Bed 2 Bath | 1,374 | $1.89 | $2,595 |
| | | | 1 | 3 Bed 2 Bath | 1,426 | $2.06 | $2,943 |
| | | | 4 | 3 Bed 2 Bath | 1,466 | $1.79 | $2,624 |
| (1) | Source: Appraisal, unless otherwise indicated. |
| (2) | Based on underwritten rent roll dated as of October 1, 2023. Average Rent per SF and Average Rent per Unit reflect average monthly in-place rent for occupied units. |
The Borrower. The borrower under The Park at Trowbridge Mortgage Loan is Park at Trowbridge Associates LLC, a special-purpose entity and Delaware limited liability company with two independent directors. Legal counsel to the borrower delivered a non-consolidation opinion in connection with the origination of The Park at Trowbridge Mortgage Loan.
The Borrower Sponsor. The borrower sponsor and non-recourse carveout guarantor is David Dedvukaj. David Dedvukaj is a founder of Contour Holding Company LLC (“Contour”). According to the borrower sponsor, Contour owns and manages over 3,000 multifamily units in Alabama, Ohio, Georgia, South Carolina and Michigan.
Property Management. The Park at Trowbridge Property is managed by Contour Realty Management Inc. (“Contour Realty”), an affiliate of Contour. property management company headquartered in Bloomfield Hills, Michigan. Contour Realty manages 3,000 multifamily units and has 200 dedicated on-site teams. Contour Realty manages multifamily communities in Alabama, Ohio, Georgia, South Carolina and Michigan.
Escrows and Reserves. At origination of The Park at Trowbridge Mortgage Loan, the borrower deposited (i) approximately $148,178 into a real estate tax reserve account, (ii) approximately $293,784 into an insurance reserve account, (iii) $500,000 for approved capital expense work (the “Approved Capital Expense Work”) into a replacement reserve account and (iv) $4,200,000 into an earn-out reserve account.
Tax Escrows – The borrower is required to deposit into a real estate tax reserve, on a monthly basis, approximately $37,045.
Insurance Escrows – The borrower is required to deposit into an insurance reserve, on a monthly basis, approximately $32,643.
| THE INFORMATION IN THIS STRUCTURAL AND COLLATERAL TERM SHEET IS NOT COMPLETE AND MAY BE AMENDED PRIOR TO THE TIME OF SALE. THIS TERM SHEET IS NOT AN OFFER TO SELL THESE SECURITIES AND IT IS NOT A SOLICITATION OF AN OFFER TO BUY THESE SECURITIES IN ANY JURISDICTION WHERE THE OFFER OR SALE IS NOT PERMITTED. |
| | 86 | |
| Structural and Collateral Term Sheet | | BMO 2023-C7 |
| No. 7 – The Park at Trowbridge |
Replacement Reserves – The borrower is required to deposit into a replacement reserve, on a monthly basis, approximately $6,667. The borrower will cease monthly deposits when funds on deposit in the replacement reserve are greater than or equal to $400,000, excluding the Approved Capital Expense Work.
Earn-Out Reserve – On or prior to November 6, 2025, provided that no event of default then exists, upon the written request of the borrower, the lender will calculate the minimum amount (the “Earn-Out Release Amount”) that, following such release, would result in both (i) an Earn-Out Debt Yield (as defined below) as of the end of the prior month equal to or greater than 11.0% and (ii) an Earn-Out Loan to Value Ratio (as defined below) equal to or less than 52.5%. In the event that the Earn-Out Release Amount is equal to or greater than the lesser of (i) $1,500,000 and (ii) the remaining funds in the earn-out reserve account, the lender will disburse to the borrower the applicable Earn-Out Release Amount. After November 6, 2025, the lender may either (i) apply earn-out reserve funds to partially prepay The Park at Trowbridge Mortgage Loan which prepayment would not be considered an event of default (and the borrower must pay (A) if the earn-out reserve funds are applied to partially prepay The Park at Trowbridge Mortgage Loan on a day other than a monthly payment date, interest on the principal amount so prepaid through the next succeeding monthly payment date and (B) the yield maintenance premium due in connection with such prepayment) or (ii) continue to hold the earn-out reserve funds as additional collateral for The Park at Trowbridge Mortgage Loan. Upon completion of a defeasance event or payment in full by the borrower of The Park at Trowbridge Mortgage Loan, the lender will disburse to the borrower all remaining earn-out reserve funds.
“Earn-Out Debt Yield” means, as of any date of determination, the percentage determined by Lender by dividing (i) the underwritten net cash flow by (ii) the Earn-Out Outstanding Principal Balance (as defined below).
“Earn-Out Loan to Value Ratio” means, as of the date of its calculation, a ratio (expressed as a percentage) calculated by the lender, the numerator of which is equal to the Earn-Out Outstanding Principal Balance and the denominator of which is equal to the aggregate appraised value of The Park at Trowbridge Property (provided, however, that with respect to such calculation, the lender will be required to use the most recent appraisal of The Park at Trowbridge Property provided that such appraisal is dated within 12 months of such calculation).
“Earn-Out Outstanding Principal Balance” means, as of the date on which the lender receives a request for disbursement from the earn-out reserve account, an amount equal to (i) the outstanding principal balance of The Park at Trowbridge Mortgage Loan on such date less (ii) the remaining funds in the earn-out reserve account on such date (but determined assuming that the applicable Earn-Out Release Amount has already been disbursed to the borrower).
Lockbox / Cash Management. The Park at Trowbridge Mortgage Loan is structured with a soft lockbox and springing cash management. Upon the occurrence and during the continuance of a Trigger Period (as defined below) (other than an event of default), provided no event of default is then continuing, the lender will direct the cash management bank to withdraw all funds on deposit in the cash management account on the date immediately preceding each payment date, to be applied and disbursed in accordance with The Park at Trowbridge Mortgage Loan documents, and all excess cash flow funds remaining in the cash management account after the application of such funds in accordance with The Park at Trowbridge Mortgage Loan documents may be held by the lender in an excess cash flow reserve account as additional collateral for The Park at Trowbridge Mortgage Loan.
A “Trigger Period” will commence upon (i) the occurrence and continuance of an event of default, or (ii) the debt service coverage ratio of The Park at Trowbridge Mortgage Loan being less than 1.25x and will be cured when (A) with respect to clause (i) above, no event of default is continuing or (B) with respect to clause (ii) above, the debt service coverage ratio of The Park at Trowbridge Mortgage Loan is greater than 1.25x for two consecutive calendar quarters.
Subordinate and Mezzanine Debt. None.
Partial Release. Not permitted.
Ground Lease. None.
| THE INFORMATION IN THIS STRUCTURAL AND COLLATERAL TERM SHEET IS NOT COMPLETE AND MAY BE AMENDED PRIOR TO THE TIME OF SALE. THIS TERM SHEET IS NOT AN OFFER TO SELL THESE SECURITIES AND IT IS NOT A SOLICITATION OF AN OFFER TO BUY THESE SECURITIES IN ANY JURISDICTION WHERE THE OFFER OR SALE IS NOT PERMITTED. |
| | 87 | |
| Structural and Collateral Term Sheet | | BMO 2023-C7 |
| No. 8 – Tusk Multifamily Portfolio |
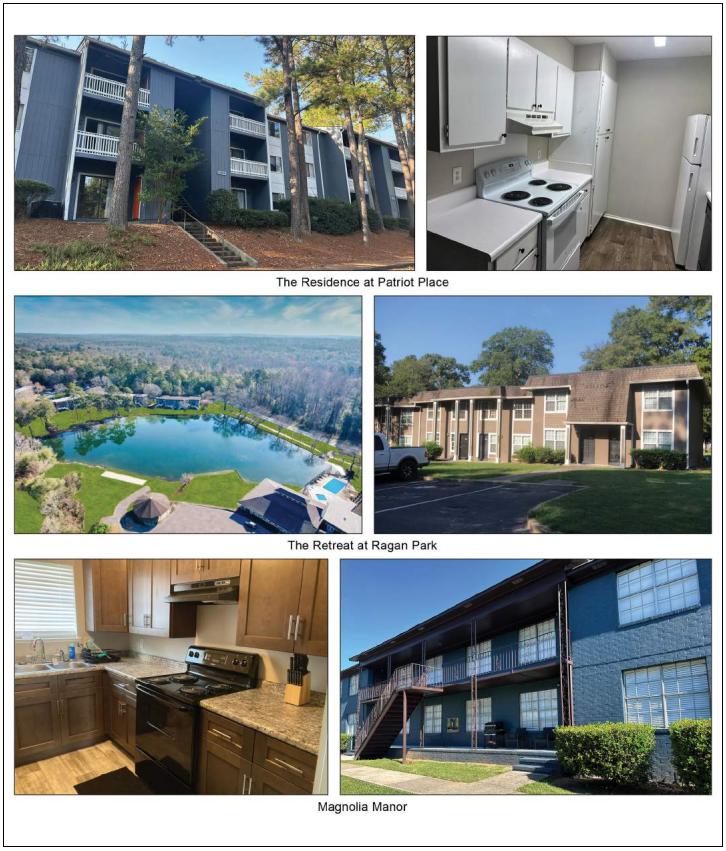
| THE INFORMATION IN THIS STRUCTURAL AND COLLATERAL TERM SHEET IS NOT COMPLETE AND MAY BE AMENDED PRIOR TO THE TIME OF SALE. THIS TERM SHEET IS NOT AN OFFER TO SELL THESE SECURITIES AND IT IS NOT A SOLICITATION OF AN OFFER TO BUY THESE SECURITIES IN ANY JURISDICTION WHERE THE OFFER OR SALE IS NOT PERMITTED. |
| | 88 | |
| Structural and Collateral Term Sheet | | BMO 2023-C7 |
| No. 8 – Tusk Multifamily Portfolio |
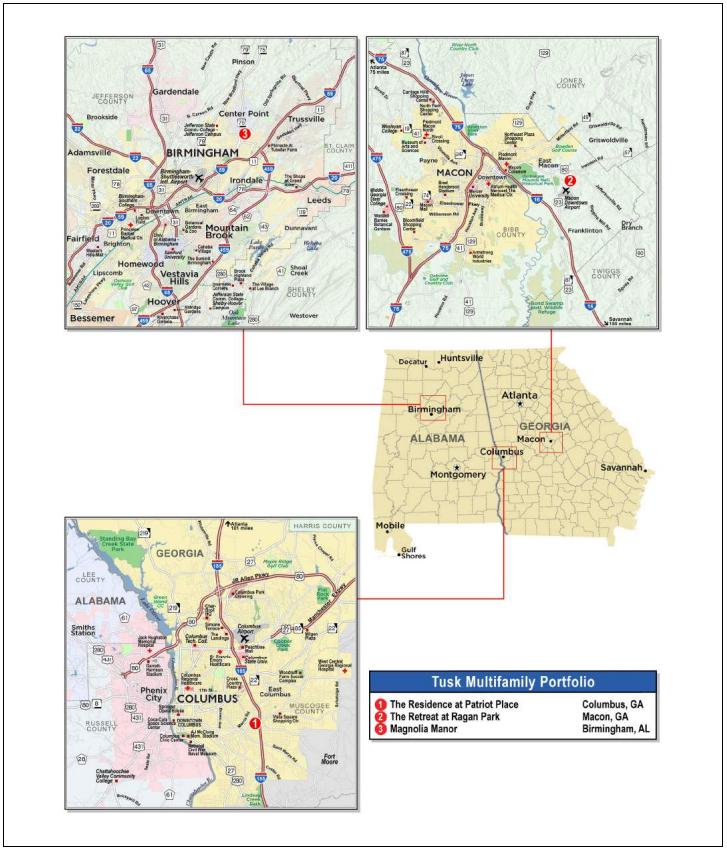
| THE INFORMATION IN THIS STRUCTURAL AND COLLATERAL TERM SHEET IS NOT COMPLETE AND MAY BE AMENDED PRIOR TO THE TIME OF SALE. THIS TERM SHEET IS NOT AN OFFER TO SELL THESE SECURITIES AND IT IS NOT A SOLICITATION OF AN OFFER TO BUY THESE SECURITIES IN ANY JURISDICTION WHERE THE OFFER OR SALE IS NOT PERMITTED. |
| | 89 | |
| Structural and Collateral Term Sheet | | BMO 2023-C7 |
| No. 8 – Tusk Multifamily Portfolio |
| Mortgage Loan Information | | Property Information |
| Mortgage Loan Seller: | UBS AG | | Single Asset / Portfolio: | Portfolio |
| Original Principal Balance: | $33,000,000 | | Title: | Fee |
| Cut-off Date Principal Balance: | $33,000,000 | | Property Type – Subtype: | Multifamily – Garden |
| % of IPB: | 4.5% | | Net Rentable Area (Units): | 523 |
| Loan Purpose: | Refinance | | Location: | Various, Various |
| Borrowers: | TEP Ragan DE, LLC, Magnolia Manor Apartments DE LLC and Residence at Patriot Place DE, LLC | | Year Built / Renovated: | Various / 2023 |
| Borrower Sponsor: | Moshe Horn | | Occupancy: | 83.4% |
| Interest Rate: | 6.75100% | | Occupancy Date(1): | Various |
| Note Date: | 11/17/2023 | | 4th Most Recent NOI (As of)(2): | NAV |
| Maturity Date: | 12/6/2028 | | 3rd Most Recent NOI (As of) (2): | NAV |
| Interest-only Period: | 60 months | | 2nd Most Recent NOI (As of): | $2,383,117 (12/31/2022) |
| Original Term: | 60 months | | Most Recent NOI (As of)(3): | $2,763,475 (Various) |
| Original Amortization Term: | None | | UW Economic Occupancy: | 83.2% |
| Amortization Type: | Interest Only | | UW Revenues: | $5,020,470 |
| Call Protection: | L(12),YM1(41),O(7) | | UW Expenses: | $2,067,851 |
| Lockbox / Cash Management: | Soft / Springing | | UW NOI: | $2,952,619 |
| Additional Debt: | No | | UW NCF: | $2,821,869 |
| Additional Debt Balance: | N/A | | Appraised Value / Per Unit: | $52,000,000 / $99,426 |
| Additional Debt Type: | N/A | | Appraisal Date(4): | Various |
| | | | | |
| Escrows and Reserves(5) | | Financial Information |
| | Initial | Monthly | Initial Cap | | Cut-off Date Loan / Unit: | $63,098 | |
| Taxes: | $69,758 | $26,830 | N/A | | Maturity Date Loan / Unit: | $63,098 | |
| Insurance: | $79,884 | $22,190 | N/A | | Cut-off Date LTV: | 63.5% | |
| Replacement Reserves: | $0 | $21,792 | N/A | | Maturity Date LTV: | 63.5% | |
| Immediate Repairs: | $534,766 | $0 | N/A | | UW NCF DSCR: | 1.25x | |
| Other: | $1,257,500 | $0 | N/A | | UW NOI Debt Yield: | 8.9% | |
| | | | | | | | |
| | | | | | | |
| Sources and Uses |
| Sources | Proceeds | % of Total | | Uses | Proceeds | % of Total |
| Mortgage Loan | $33,000,000 | 96.0 | % | | Loan Payoff | $28,338,908 | 82.4 | % |
| Borrower Equity | 1,381,771 | 4.0 | | | Closing Costs | 4,100,956 | 11.9 | |
| | | | | Reserves | 1,941,908 | 5.6 | |
| Total Sources | $34,381,771 | 100.0 | % | | Total Uses | $34,381,771 | 100.0% | |
| (1) | Occupancy Date is based on the underwritten rent rolls dated (x) October 1, 2023 for The Residence at Patriot Place Property (as defined below) and The Retreat at Ragan Park Property (as defined below) and (y) October 27, 2023 for the Magnolia Manor Property (as defined below). |
| (2) | The borrower sponsor acquired the Tusk Multifamily Portfolio Properties (as defined below) from 2020 to 2021. As such, 4th Most Recent NOI and 3rd Most Recent NOI are unavailable. |
| (3) | Most Recent NOI reflects the trailing 12 months ending (x) September 30, 2023 for The Residence at Patriot Place Property and The Retreat at Ragan Park Property and (y) August 31, 2023 for the Magnolia Manor Property. |
| (4) | See “Appraisals” below. |
| (5) | For a full description of Escrows and Reserves, see “Escrows and Reserves” below. |
The Loan. The Tusk Multifamily Portfolio mortgage loan (the “Tusk Multifamily Portfolio Mortgage Loan”) is secured by the borrowers’ fee interest in three garden-style multifamily properties located in Georgia and Alabama (collectively, the “Tusk Multifamily Portfolio Properties” or the “Tusk Multifamily Portfolio”). The Tusk Multifamily Portfolio Mortgage Loan accrues interest at a fixed rate of 6.75100% per annum. The Tusk Multifamily Portfolio Mortgage Loan has a five-year term and is interest-only for the term of the loan. The scheduled maturity date of the Tusk Multifamily Portfolio Mortgage Loan is the payment date that occurs on December 6, 2028.
| THE INFORMATION IN THIS STRUCTURAL AND COLLATERAL TERM SHEET IS NOT COMPLETE AND MAY BE AMENDED PRIOR TO THE TIME OF SALE. THIS TERM SHEET IS NOT AN OFFER TO SELL THESE SECURITIES AND IT IS NOT A SOLICITATION OF AN OFFER TO BUY THESE SECURITIES IN ANY JURISDICTION WHERE THE OFFER OR SALE IS NOT PERMITTED. |
| | 90 | |
| Structural and Collateral Term Sheet | | BMO 2023-C7 |
| No. 8 – Tusk Multifamily Portfolio |
The Properties. The Tusk Multifamily Portfolio Properties are comprised of a 257-unit multifamily property in Columbus, Georgia (“The Residence at Patriot Place Property”), a 122-unit multifamily property in Birmingham, Alabama (the “Magnolia Manor Property”) and a 144-unit multifamily property in Macon, Georgia (“The Retreat at Ragan Park Property”). The Tusk Multifamily Portfolio Properties were built between 1970 and 1987 and renovated in 2023. The Tusk Multifamily Portfolio was 83.4% occupied as of (x) October 1, 2023 for The Residence at Patriot Place Property and The Retreat at Ragan Park Property and (y) October 27, 2023 for the Magnolia Manor Property. The borrower sponsor acquired the Tusk Multifamily Portfolio Properties from 2020 to 2021 for approximately $33.3 million and has since invested approximately $7.6 million in capital expenditures.
The following table presents certain information relating to the Tusk Multifamily Portfolio Properties:
| Portfolio Summary(1) |
| Property Name | Year Built / Renovated | Units(2) | Occupancy %(2) | Allocated
Cut-off Date Loan Amount (“ALA”) | % of ALA | Appraised Value | % of Appraised Value | UW NOI(2) | % of UW NOI(2) |
| The Residence at Patriot Place | 1972 / 2023 | 257 | 89.9% | $17,250,000 | 52.3 | % | $25,600,000 | 49.2 | % | $1,326,880 | 44.9% |
| Magnolia Manor | 1970, 1979, 1987 / 2023 | 122 | 73.0% | 8,000,000 | 24.2 | | 11,600,000 | 22.3 | | 774,414 | 26.2% |
| The Retreat at Ragan Park | 1973 / 2023 | 144 | 80.6% | 7,750,000 | 23.5 | | 14,800,000 | 28.5 | | 851,325 | 28.8% |
| Total/Wtd. Avg. | | 523 | 83.4% | $33,000,000 | 100.0 | % | $52,000,000 | 100.0 | % | $2,952,619 | 100.0% |
| (1) | Source: Appraisals unless otherwise indicated. |
| (2) | Based on the underwritten rent rolls dated (x) October 1, 2023 for The Residence at Patriot Place Property and The Retreat at Ragan Park Property and (y) October 27, 2023 for the Magnolia Manor Property. |
The Residence at Patriot Place Property. The Residence at Patriot Place Property is a 257-unit garden style multifamily property located at 3626, 3700 & 3708 Buena Vista Road in Columbus, Georgia. The Residence at Patriot Place Property consists of 13, two-story apartment buildings, one, one-story clubhouse/leasing office and one, two-story amenity building. As of October 1, 2023, The Residence at Patriot Place Property was 89.9% occupied, which is approximately 5.1% below stabilized occupancy of 95.0%. The improvements were constructed in 1972 and are situated on a 23.81-acre site. The Residence at Patriot Place Property features one-, two- and three-bedroom layouts ranging in size from 605 to 1,446 square feet. Market rents range from $675 to $1,060 per month, with an average market rent of approximately $774 and an average unit size of 845 square feet. Unit features include carpeted flooring, dishwasher, fireplace, laminate countertops, range/oven, refrigerator, tub/shower combination, vinyl flooring and washer/dryer. Community amenities include a barbeque area, clubhouse, fitness center, laundry facility, pool, tennis court, and on-site management. The borrower sponsor acquired The Residence at Patriot Place Property in November of 2021 for approximately $18.4 million and has since invested approximately $3.7 million in capital expenditures.
The following table presents detailed information with respect to the units at The Residence at Patriot Place Property:
| Unit Summary(1) |
| Unit Type | No. of Units | % of Total | Average Unit Size (SF) | Average Monthly Rental Rate(2) | Average Monthly Rental Rate per SF(2) | Average Monthly Market Rental Rate(3) | Average Monthly Market Rental Rate per SF(3) |
| 1BD/1A - D | 1 | 0.4 | % | 605 | $660 | $1.09 | $685 | $1.13 |
| 1BD/1A - A | 75 | 29.2 | | 644 | $639 | $0.99 | $675 | $1.05 |
| 1BD/1A - B | 16 | 6.2 | | 675 | $749 | $1.11 | $875 | $1.30 |
| 1BD/1A - C | 28 | 10.9 | | 697 | $694 | $1.00 | $735 | $1.05 |
| 2BD/1BA - A | 8 | 3.1 | | 797 | $858 | $1.08 | $915 | $1.15 |
| 2BD/1BA - B | 64 | 24.9 | | 920 | $760 | $0.83 | $775 | $0.84 |
| 2BD/1.5BA | 57 | 22.2 | | 1,073 | $788 | $0.73 | $835 | $0.78 |
| 3BD/2.5BA | 8 | 3.1 | | 1,446 | $1,057 | $0.73 | $1,060 | $0.73 |
| Total/Wtd. Avg. | 257 | 100.0 | % | 845 | $737 | $0.90 | $774 | $0.95 |
| (1) | Based on the underwritten rent roll dated October 1, 2023. |
| (2) | Based only on occupied units. |
| THE INFORMATION IN THIS STRUCTURAL AND COLLATERAL TERM SHEET IS NOT COMPLETE AND MAY BE AMENDED PRIOR TO THE TIME OF SALE. THIS TERM SHEET IS NOT AN OFFER TO SELL THESE SECURITIES AND IT IS NOT A SOLICITATION OF AN OFFER TO BUY THESE SECURITIES IN ANY JURISDICTION WHERE THE OFFER OR SALE IS NOT PERMITTED. |
| | 91 | |
| Structural and Collateral Term Sheet | | BMO 2023-C7 |
| No. 8 – Tusk Multifamily Portfolio |
Magnolia Manor Property. The Magnolia Manor Property is a 122-unit garden style multifamily property located at 132 14th Avenue Northeast in Birmingham, Alabama. The Magnolia Manor Property consists of 11, two- to three-story apartment buildings. As of October 27, 2023, the Magnolia Manor Property was 73.0% occupied, which is approximately 22.0% below stabilized occupancy of 95.0%. The improvements were constructed in 1970, 1979 and 1987 and are situated on a 6.49-acre site. The Magnolia Manor Property features one-, two- and three-bedroom layouts ranging in size from 655 to 1,206 square feet. Market rents range from $665 to $930 per month, with an average market rent of approximately $783 and an average unit size of 920 square feet. 37% of occupied units at the Magnolia Manor Property are leased by month-to-month tenants. Additionally, approximately 29% of occupied units at the Magnolia Manor Property are leased by tenants pursuant to leases that cannot be found following a prior change in property management. See “Master Lease” below. Unit features include carpeted flooring, dishwasher, laminate countertops, plank flooring, range/oven, refrigerator and washer/dryer connections. The borrower sponsor acquired the Magnolia Manor Property in November of 2020 for approximately $7.6 million and has since invested approximately $2.2 million in capital expenditures.
The following table presents detailed information with respect to the units at the Magnolia Manor Property:
| Unit Summary(1) |
| Unit Type | No. of Units | % of Total | Average Unit Size (SF) | Average Monthly Rental Rate(2) | Average Monthly Rental Rate per SF(2) | Average Monthly Market Rental Rate(3) | Average Monthly Market Rental Rate per SF(3) |
| 1BD/1BA - 1 | 18 | 14.8 | % | 655 | $701 | $1.07 | $665 | $1.02 |
| 1BR/1BA - 2 | 6 | 4.9 | | 714 | $687 | $0.96 | $705 | $0.99 |
| 2BR/2BA - 1 | 15 | 12.3 | | 835 | $855 | $1.02 | $785 | $0.94 |
| 2BR/2.5BA - 2 | 15 | 12.3 | | 882 | $802 | $0.91 | $770 | $0.87 |
| 2BR/2BA - 3 | 15 | 12.3 | | 953 | $813 | $0.85 | $800 | $0.84 |
| 2BR/2BA - 4 | 32 | 26.2 | | 1,011 | $812 | $0.80 | $800 | $0.79 |
| 3BR/2BA - 1 | 1 | 0.8 | | 985 | $0 | $0.00 | $825 | $0.84 |
| 3BR/2BA - 2 | 3 | 2.5 | | 1,036 | $1,026 | $0.99 | $880 | $0.85 |
| 3BR/2BA - 3 | 5 | 4.1 | | 1,104 | $879 | $0.80 | $930 | $0.84 |
| 3BR/2BA - 4 | 3 | 2.5 | | 1,106 | $966 | $0.87 | $855 | $0.77 |
| 3BR/2BA - 5 | 9 | 7.4 | | 1,206 | $874 | $0.72 | $855 | $0.71 |
| Total/Wtd. Avg. | 122 | 100.0 | % | 920 | $821 | $0.89 | $783 | $0.87 |
| (1) | Based on the underwritten rent roll dated October 27, 2023. |
| (2) | Based only on occupied units. |
The Retreat at Ragan Park Property. The Retreat at Ragan Park Property is a 144-unit garden style multifamily property located at 2730 & 2800 Masseyville Road in Macon, Georgia. The Retreat at Ragan Park Property consists of 15, two-story apartment buildings, one, one-story clubhouse/leasing office and one, one-story amenity building. As of October 1, 2023, The Retreat at Ragan Park Property was 80.6% occupied, which is approximately 13.4% below stabilized occupancy of 94.0%. The improvements were constructed in 1973 and are situated on a 33.56-acre site. The Retreat at Ragan Park Property features one-, two- and three-bedroom layouts ranging in size from 900 to 1,500 square feet. Market rents range from $715 to $900 per month, with an average market rent of approximately $796 and an average unit size of 1,147 square feet. Unit features include carpeted flooring, dishwasher, laminate countertops, range/oven, refrigerator, vinyl flooring and washer/dryer connections. Community amenities include a clubhouse, a lake, a pool, and on-site management. The borrower sponsor acquired The Retreat at Ragan Park Property in February of 2020 for approximately $7.3 million and has since invested approximately $1.7 million in capital expenditures.
| THE INFORMATION IN THIS STRUCTURAL AND COLLATERAL TERM SHEET IS NOT COMPLETE AND MAY BE AMENDED PRIOR TO THE TIME OF SALE. THIS TERM SHEET IS NOT AN OFFER TO SELL THESE SECURITIES AND IT IS NOT A SOLICITATION OF AN OFFER TO BUY THESE SECURITIES IN ANY JURISDICTION WHERE THE OFFER OR SALE IS NOT PERMITTED. |
| | 92 | |
| Structural and Collateral Term Sheet | | BMO 2023-C7 |
| No. 8 – Tusk Multifamily Portfolio |
The following table presents detailed information with respect to the units at The Retreat at Ragan Park Property:
| Unit Summary(1) |
| Unit Type | No. of Units | % of Total | Average Unit Size (SF) | Average Monthly Rental Rate(2) | Average Monthly Rental Rate per SF(2) | Average Monthly Market Rental Rate(3) | Average Monthly Market Rental Rate per SF(3) |
| 1BD/1BA | 32 | 22.2 | % | 900 | $695 | $0.77 | $715 | $0.79 |
| 2BD/1BA | 12 | 8.3 | | 1,050 | $733 | $0.70 | $760 | $0.72 |
| 2BD/1.5BA | 13 | 9.0 | | 1,100 | $753 | $0.68 | $765 | $0.70 |
| 2BD/2BA 1 | 43 | 29.9 | | 1,110 | $764 | $0.69 | $795 | $0.72 |
| 2BD/2BA 2 | 12 | 8.3 | | 1,150 | $777 | $0.68 | $805 | $0.70 |
| 3BD/2.5BA | 32 | 22.2 | | 1,500 | $873 | $0.58 | $900 | $0.60 |
| Total/Wtd. Avg. | 144 | 100.0 | % | 1,147 | $769 | $0.68 | $796 | $0.71 |
| (1) | Based on the underwritten rent roll dated October 1, 2023. |
| (2) | Based only on occupied units. |
Appraisals. According to the appraisals, the Tusk Multifamily Portfolio Properties had a combined “as-is” appraised value of $52,000,000 as of September 18, 2023 for The Residence at Patriot Place Property, September 12, 2023 for The Retreat at Ragan Park Property and August 17, 2023 for the Magnolia Manor Property. The table below shows the appraiser’s “as-is” conclusions.
| Appraisal Valuation Summary(1) |
| Property Name | Appraisal Approach | Appraised Value | Capitalization Rate(2) |
| The Residence at Patriot Place | Income Capitalization Approach | $25,600,000 | 5.75% |
| Magnolia Manor | Income Capitalization Approach | $11,600,000 | 6.25% |
| The Retreat at Ragan Park | Income Capitalization Approach | $14,800,000 | 5.75% |
| (2) | The appraiser used a discounted cash flow approach to arrive at the appraised values. The capitalization rates shown above represent the overall capitalization rate. |
Environmental. According to the Phase I environmental assessments dated August 22, 2023 for the Magnolia Manor Property and September 13, 2023 for The Residence at Patriot Place Property and The Retreat at Ragan Park Property, there was no evidence of any recognized environmental conditions at the Tusk Multifamily Portfolio Properties.
The following table presents certain information relating to the historical and current occupancy of the Tusk Multifamily Portfolio Properties:
| Historical and Current Occupancy(1) |
| Property Name | 2022 | Current(2) |
| The Residence at Patriot Place | 85.0% | 89.9% |
| Magnolia Manor | 65.0% | 73.0% |
| The Retreat at Ragan Park | 75.0% | 80.6% |
| (1) | Historical occupancy is the average of the respective year. |
| (2) | Current Occupancy is as of (x) October 1, 2023 for The Residence at Patriot Place Property and The Retreat at Ragan Park Property and (y) October 27, 2023 for the Magnolia Manor Property. |
| THE INFORMATION IN THIS STRUCTURAL AND COLLATERAL TERM SHEET IS NOT COMPLETE AND MAY BE AMENDED PRIOR TO THE TIME OF SALE. THIS TERM SHEET IS NOT AN OFFER TO SELL THESE SECURITIES AND IT IS NOT A SOLICITATION OF AN OFFER TO BUY THESE SECURITIES IN ANY JURISDICTION WHERE THE OFFER OR SALE IS NOT PERMITTED. |
| | 93 | |
| Structural and Collateral Term Sheet | | BMO 2023-C7 |
| No. 8 – Tusk Multifamily Portfolio |
The following table presents certain information relating to the historical and underwritten cash flows of the Tusk Multifamily Portfolio Properties:
| Operating History and Underwritten Net Cash Flow |
| | 2022 | TTM(1) | Underwritten | Per Unit | %(2) |
| Gross Potential Rent | $4,939,245 | $4,856,561 | $4,794,576 | | $9,167 | | 120.2 | % |
| (Vacancy/Credit Loss) | (1,605,149) | (1,234,861) | (805,320) | | (1,540) | | (20.2) | |
| Net Rental Income | $3,334,096 | $3,621,701 | $3,989,256 | | $7,628 | | 100.0 | % |
| Other Income | 847,193 | 1,031,214 | 1,031,214 | | 1,972 | | 25.8 | |
| Effective Gross Income | $4,181,289 | $4,652,914 | $5,020,470 | | $9,599 | | 125.8 | % |
| | | | | | |
| Total Expenses | 1,798,171 | 1,889,439 | 2,067,851 | | 3,954 | | 41.2 | |
| | | | | | |
| Net Operating Income | $2,383,117 | $2,763,475 | $2,952,619 | | $5,646 | | 58.8 | % |
| | | | | | |
| Total Capex/RR | 0 | 0 | 130,750 | | 250 | | 2.6 | |
| | | | | | |
| Net Cash Flow | $2,383,117 | $2,763,475 | $2,821,869 | | $5,396 | | 56.2 | % |
| (1) | TTM reflects the trailing 12 months ending (x) September 30, 2023 for The Residence at Patriot Place Property and The Retreat at Ragan Park Property and (y) August 31, 2023 for the Magnolia Manor Property. |
| (2) | % column represents percent of Net Rental Income for revenue fields and represents percent of Effective Gross Income for the remainder of fields. |
The Markets. The Tusk Multifamily Portfolio Properties are located in Georgia (75.8% of ALA) and Alabama (24.2% of ALA).
Columbus (52.3% of ALA): The Residence at Patriot Place Property is in Muscogee County, Georgia located approximately 4.1 miles east of downtown Columbus, Georgia, 86.5 miles east of Montgomery, Alabama, and 107 miles south of downtown Atlanta, Georgia. Primary access to the area is provided by Interstate 85, Interstate 185 and US Route 80. According to a third-party market research report, The Residence at Patriot Place Property is located in the Southeast Columbus multifamily submarket, which had approximately 3,041 units of inventory, a vacancy rate of 13.0% and asking rent of $729 per unit as of August 2023.
Birmingham (24.2% of ALA): The Magnolia Manor Property is in Jefferson County, Alabama located approximately 12 miles northeast of downtown Birmingham. The Magnolia Manor Property is located within three miles of both U.S. Highway 11 and Interstate 59 and is located 7.3 miles northeast of Interstate 20. According to a third-party market research report, the Magnolia Manor Property is located in the Center Point multifamily submarket, which had approximately 4,339 units of inventory, a vacancy rate of 14.3% and asking rent of $812 per unit as of August 2023.
Macon (23.5% of ALA): The Retreat at Ragan Park Property is in Bibb County, Georgia located approximately 4.6 miles east of the downtown Macon, 87 miles southeast of Atlanta, and 103 miles east of downtown Columbus. The Macon central business district is known for its historically significant office buildings and residential neighborhoods. Primary access to the area is provided by Interstate 75, US Route 41 and US Route 80. According to a third-party market research report, The Retreat at Ragan Park Property is located in the Bibb County multifamily submarket, which had approximately 13,761 units of inventory, a vacancy rate of 13.5% and asking rent of $1,078 per unit as of August 2023.
| THE INFORMATION IN THIS STRUCTURAL AND COLLATERAL TERM SHEET IS NOT COMPLETE AND MAY BE AMENDED PRIOR TO THE TIME OF SALE. THIS TERM SHEET IS NOT AN OFFER TO SELL THESE SECURITIES AND IT IS NOT A SOLICITATION OF AN OFFER TO BUY THESE SECURITIES IN ANY JURISDICTION WHERE THE OFFER OR SALE IS NOT PERMITTED. |
| | 94 | |
| Structural and Collateral Term Sheet | | BMO 2023-C7 |
| No. 8 – Tusk Multifamily Portfolio |
The following table presents certain market information with respect to the Tusk Multifamily Portfolio Properties:
| Market Overview(1) |
| Property Name | Year Built / Renovated(2) | No. of Units(3) | Submarket | Property Vacancy(3) | Submarket Vacancy | Appraisal Concluded Vacancy(2) | Submarket Inventory (Units) | UW Base Rent Per Unit(3)(4) | Submarket Rent Per Unit |
| The Residence at Patriot Place | 1972 / 2023 | 257 | Southeast Columbus | 10.1% | 13.0% | 5.0% | 3,041 | $737 | $729 |
| Magnolia Manor | 1970, 1979, 1987 / 2023 | 122 | Center Point | 27.0% | 14.3% | 5.0% | 4,339 | $821 | $812 |
| The Retreat at Ragan Park | 1973 / 2023 | 144 | Bibb County | 19.4% | 13.5% | 6.0% | 13,761 | $769 | $1,078 |
| Total/Wtd. Avg. | 523 | | 16.6% | 13.4% | 5.3% | | $762 | $839 |
| (1) | Source: Third-party market research reports, unless otherwise indicated. |
| (3) | Based on the underwritten rent rolls dated (x) October 1, 2023 for The Residence at Patriot Place Property and The Retreat at Ragan Park Property and (y) October 27, 2023 for the Magnolia Manor Property. |
| (4) | UW Base Rent Per Unit excludes underwritten vacant space. |
The following table presents certain demographic information with respect to the Tusk Multifamily Portfolio Properties:
| Demographics Overview |
| Property Name | No. of Units(1) | ALA | % of ALA | UW NCF | % of UW NCF | Estimated 2023 Population (5-mile Radius)(2) | Estimated 2023 Average Household Income (5-mile Radius)(2) |
| The Residence at Patriot Place | 257 | $17,250,000 | 52.3 | % | $1,262,630 | 44.7 | % | 150,557 | | $58,257 |
| Magnolia Manor | 122 | 8,000,000 | 24.2 | | 743,914 | 26.4 | | 99,315 | | $68,117 |
| The Retreat at Ragan Park | 144 | 7,750,000 | 23.5 | | 815,325 | 28.9 | | 38,517 | | $58,481 |
| Total/Wtd. Avg. | 523 | $33,000,000 | 100.0 | % | $2,821,869 | 100.0 | % | 107,755 | | $60,618 |
| (1) | Based on the underwritten rent rolls dated (x) October 1, 2023 for The Residence at Patriot Place Property and The Retreat at Ragan Park Property and (y) October 27, 2023 for the Magnolia Manor Property. |
| (2) | Information obtained from third-party market research reports. |
The Borrowers. The borrowers are Residence at Patriot Place DE, LLC, TEP Ragan DE, LLC and Magnolia Manor Apartments DE LLC, each a bankruptcy remote, newly formed Delaware limited liability company special purpose entity with one independent director in each of its organizational structures. Legal counsel to the borrowers provided a non-consolidation opinion in connection with the origination of the Tusk Multifamily Portfolio Mortgage Loan.
The Borrower Sponsor. The borrower sponsor of the Tusk Multifamily Portfolio Mortgage Loan is Moshe Horn. The guarantors of the Tusk Multifamily Portfolio Mortgage Loan are Moshe Horn, Ari Biderman and Mordechy Donat. Moshe Horn is the founder of Tusk Equity Partners, a private real estate investment company specializing in real estate investments. Tusk Equity Partners owns, operates, and invests in the Southeast United States, with a particular concentration on the Atlanta Metropolitan Statistical Area, throughout the states of Georgia, Alabama, and the Carolinas. Tusk Equity Partners has sold over 8,500 residential apartments, providing homes for over 25,000 residents and employing over 150 team members.
Property Management. The Tusk Multifamily Portfolio Properties are managed by EMBA Management Group LLC, an affiliate of the borrower sponsor.
Escrows and Reserves. At origination, the borrowers were required to deposit into escrow (i) approximately $69,758 for real estate taxes, (ii) approximately $79,884 for insurance premiums, (iii) approximately $534,766 for immediate repairs and (iv) $1,105,000 for a unit renovation funds reserve. Additionally, the borrowers reserved $152,500 at origination for a fire damage reserve fund. See “Description of the Mortgage Pool—Property Types— Multifamily Properties”.
Tax Escrows – On a monthly basis, the borrowers are required to escrow 1/12th of the annual estimated tax payments to the tax reserve, which currently equates to approximately $26,830.
| THE INFORMATION IN THIS STRUCTURAL AND COLLATERAL TERM SHEET IS NOT COMPLETE AND MAY BE AMENDED PRIOR TO THE TIME OF SALE. THIS TERM SHEET IS NOT AN OFFER TO SELL THESE SECURITIES AND IT IS NOT A SOLICITATION OF AN OFFER TO BUY THESE SECURITIES IN ANY JURISDICTION WHERE THE OFFER OR SALE IS NOT PERMITTED. |
| | 95 | |
| Structural and Collateral Term Sheet | | BMO 2023-C7 |
| No. 8 – Tusk Multifamily Portfolio |
Insurance Escrows – On a monthly basis, the borrowers are required to escrow 1/12th of the annual estimated insurance premiums to the insurance reserve, which currently equates to $22,190.
Replacement Reserves – On a monthly basis, the borrowers are required to escrow $21,792 for replacement reserves.
Lockbox / Cash Management. The Tusk Multifamily Portfolio Mortgage Loan is structured with a soft lockbox and springing cash management. During the continuance of a Cash Management Trigger Event (as defined below), all funds in the lockbox account are required to be swept each business day to a lender-controlled cash management account and disbursed in accordance with the Tusk Multifamily Portfolio Mortgage Loan documents, and all excess funds on deposit in the cash management account (after payment of required monthly reserve deposits, the debt service payment on the Tusk Multifamily Portfolio Mortgage Loan, operating expenses and cash management bank fees) are required to be applied as follows: (a) if a Cash Sweep Trigger Event (as defined below) has occurred and is continuing, to the lender-controlled excess cash flow account or (b) if no Cash Sweep Trigger Event has occurred and is continuing, to the borrowers.
A “Cash Management Trigger Event” means a period commencing upon the occurrence of (i) an event of default, (ii) any bankruptcy action involving the borrowers, the guarantors, the key principal, SPC party or the affiliated property manager, (iii) the trailing 12-month period debt service coverage ratio falling below 1.20x or (iv) the indictment for fraud or misappropriation of funds of the borrowers, the guarantors, the key principal or an affiliated or third-party property manager (provided that, in the case of the third-party property manager, such fraud or misappropriation is related to the Tusk Multifamily Portfolio Properties), and expiring upon (a) with respect to clause (i) above, the cure of such event of default and the acceptance of such cure by the lender, (b) with respect to clause (ii) above, the filing being discharged or dismissed within 45 days, and the lender’s determination that such filing does not materially increase the borrowers’, the guarantors’, the SPC party’s or the key principal’s monetary obligations, or materially and adversely affect the key principal’s, the SPC party’s, the guarantors’ or the property manager’s ability to carry out their obligations under the Tusk Multifamily Portfolio Mortgage Loan documents, as applicable, or, in the case of the property manager, the replacement of the property manager with a third-party property manager that constitutes a qualified property manager under the Tusk Multifamily Portfolio Mortgage Loan documents, (c) with respect to clause (iii) above, the trailing 12-month period debt service coverage ratio being at least 1.25x for two consecutive calendar quarters or (d) with respect to clause (iv) above, the dismissal of the applicable indictment with prejudice or acquittal of the applicable person, or the replacement of the property manager with a third-party property manager that constitutes a qualified property manager under the Tusk Multifamily Portfolio Mortgage Loan documents.
A “Cash Sweep Trigger Event” means a period commencing upon the occurrence of (i) an event of default, (ii) any bankruptcy action involving the borrowers, the guarantors, the key principal, SPC party or an affiliated property manager or (iii) the 12-month period debt service coverage ratio falling below 1.20x, and expiring upon (a) with respect to clause (i) above, the cure of such event of default and the acceptance of such cure by the lender, (b) with respect to clause (ii) above, the filing being discharged or dismissed within 45 days, and the lender’s determination that such filing does not materially increase the borrowers’, the guarantors’, the SPC party or the key principal’s monetary obligations, or materially and adversely affect the key principal’s, the SPC party’s, the guarantors’ or the property manager’s ability to carry out their obligations under the Tusk Multifamily Portfolio Mortgage Loan documents, as applicable, or, in the case of the property manager, the replacement of the property manager with a third-party property manager that constitutes a qualified property manager under the Tusk Multifamily Portfolio Mortgage Loan documents or (c) with respect to clause (iii) above, the 12-month period debt service coverage ratio being at least 1.25x for two consecutive calendar quarters.
Master Lease. At origination of the Tusk Multifamily Portfolio Mortgage Loan, the borrower of the Magnolia Manor Property, Magnolia Manor Apartments DE LLC (the “Master Lease Landlord”), entered into a master lease (the “Master Lease”) with a newly formed affiliate of the Master Lease Landlord, Magnolia Manor Master Tenant, LLC (the “Master Lease Tenant”), with respect to (i) leases with month-to-month tenancies and (ii) rents payable from tenants with missing leases that the Master Lease Landlord is unable to locate and deliver to the lender (collectively, clauses (i) and (ii), individually, a “Covered Lease”; and the unit to which a Covered Lease applies, a “Covered Unit”). Pursuant to the Master Lease, on a monthly basis, the Master Lease Tenant will pay a rental amount equal to the greatest of the following with respect to such Covered Unit: (i) the rent for such Covered Unit as of the commencement date of the Master Lease (the closing date) (or, if such apartment unit becomes a Covered Unit after the commencement date, as of the date such apartment unit becomes a Covered Unit), (ii) the highest monthly rent charged for such Covered Unit after the date of the Master Lease, and (iii) the then-current monthly rent for such Covered Unit, as shown on the monthly rent roll required to be submitted to the lender
| THE INFORMATION IN THIS STRUCTURAL AND COLLATERAL TERM SHEET IS NOT COMPLETE AND MAY BE AMENDED PRIOR TO THE TIME OF SALE. THIS TERM SHEET IS NOT AN OFFER TO SELL THESE SECURITIES AND IT IS NOT A SOLICITATION OF AN OFFER TO BUY THESE SECURITIES IN ANY JURISDICTION WHERE THE OFFER OR SALE IS NOT PERMITTED. |
| | 96 | |
| Structural and Collateral Term Sheet | | BMO 2023-C7 |
| No. 8 – Tusk Multifamily Portfolio |
pursuant to the Tusk Multifamily Portfolio Mortgage Loan documents. The obligations of the Master Lease Tenant under the Master Lease are guaranteed by guarantors for the Tusk Multifamily Portfolio Mortgage Loan.
An apartment unit at the Magnolia Manor Property will cease to be a Covered Unit, and thereupon to be excluded and removed from the Master Lease, upon the occurrence of the following with respect to such Covered Unit: (i) such apartment unit being leased to a third-party tenant after the date of the Master Lease, in accordance with the terms and provisions of the Tusk Multifamily Portfolio Mortgage Loan documents, for residential occupancy by such tenant, pursuant to a bona fide arms-length lease, for a term of not less than one year, at a rent not less than 95% of the rent most recently applicable to such apartment unit as a Covered Unit, and (ii) the tenant of such unit having made its first full monthly rent payment after taking occupancy of such unit. Moreover, if and when less than 5.0% of the income at the Magnolia Manor Property is derived from Covered Leases, the Master Lease will terminate in its entirety.
Subordinate and Mezzanine Debt. None.
Permitted Future Mezzanine Debt. The Tusk Multifamily Portfolio Mortgage Loan documents permit future mezzanine debt secured by a pledge of direct equity interests in the borrowers subject to the satisfaction of certain conditions including, among others, (i) immediately after giving effect to such debt (x) the combined loan-to-value ratio may not exceed the combined loan-to-value ratio at origination of the Tusk Multifamily Portfolio Mortgage Loan, (y) the combined debt yield, as calculated in accordance with the Tusk Multifamily Portfolio Mortgage Loan documents, is at least the combined debt yield at origination of the Tusk Multifamily Portfolio Mortgage Loan and (z) the combined debt service coverage ratio, as calculated in accordance with the Tusk Multifamily Portfolio Mortgage Loan documents, is at least the combined debt service coverage ratio at origination of the Tusk Multifamily Portfolio Mortgage Loan, and (ii) execution of a subordination and intercreditor agreement reasonably acceptable to the lender and satisfactory to the rating agencies.
Partial Release. Not permitted.
Ground Lease. None.
| THE INFORMATION IN THIS STRUCTURAL AND COLLATERAL TERM SHEET IS NOT COMPLETE AND MAY BE AMENDED PRIOR TO THE TIME OF SALE. THIS TERM SHEET IS NOT AN OFFER TO SELL THESE SECURITIES AND IT IS NOT A SOLICITATION OF AN OFFER TO BUY THESE SECURITIES IN ANY JURISDICTION WHERE THE OFFER OR SALE IS NOT PERMITTED. |
| | 97 | |
| Structural and Collateral Term Sheet | | BMO 2023-C7 |
| No. 9 – New Mountain - Cleaver-Brooks |
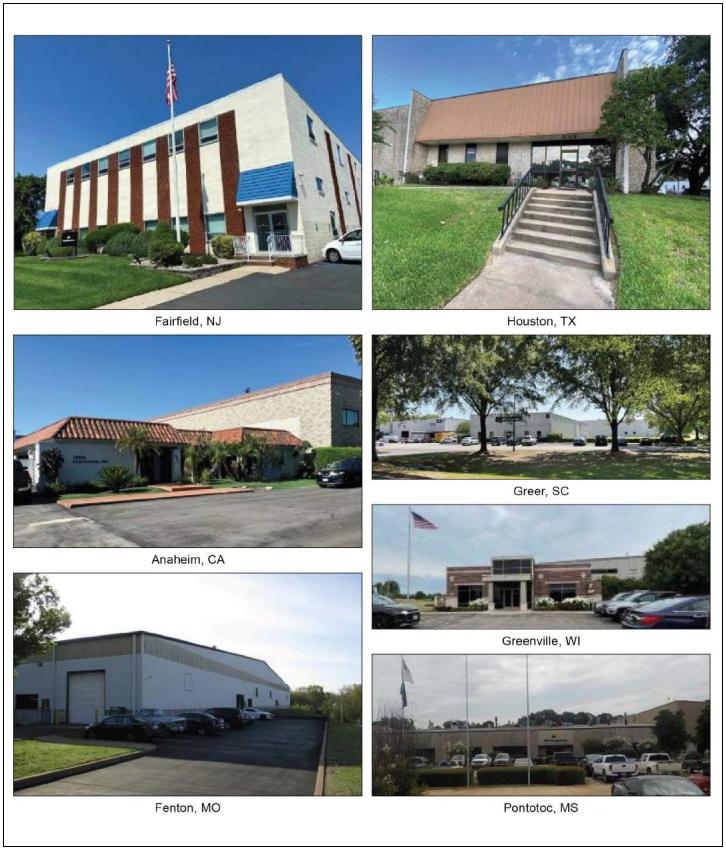
| THE INFORMATION IN THIS STRUCTURAL AND COLLATERAL TERM SHEET IS NOT COMPLETE AND MAY BE AMENDED PRIOR TO THE TIME OF SALE. THIS TERM SHEET IS NOT AN OFFER TO SELL THESE SECURITIES AND IT IS NOT A SOLICITATION OF AN OFFER TO BUY THESE SECURITIES IN ANY JURISDICTION WHERE THE OFFER OR SALE IS NOT PERMITTED. |
| | 98 | |
| Structural and Collateral Term Sheet | | BMO 2023-C7 |
| No. 9 – New Mountain - Cleaver-Brooks |
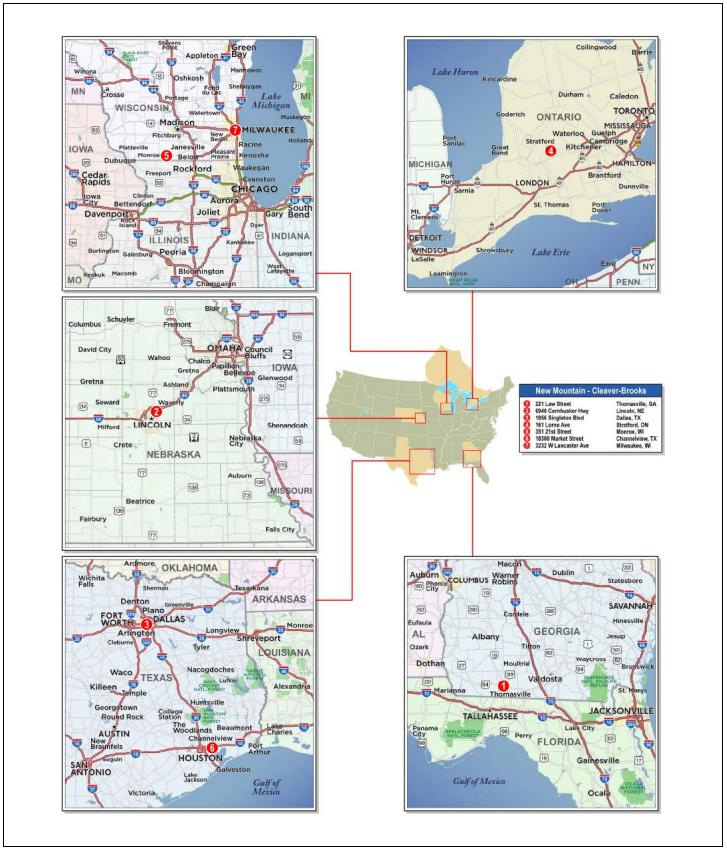
| THE INFORMATION IN THIS STRUCTURAL AND COLLATERAL TERM SHEET IS NOT COMPLETE AND MAY BE AMENDED PRIOR TO THE TIME OF SALE. THIS TERM SHEET IS NOT AN OFFER TO SELL THESE SECURITIES AND IT IS NOT A SOLICITATION OF AN OFFER TO BUY THESE SECURITIES IN ANY JURISDICTION WHERE THE OFFER OR SALE IS NOT PERMITTED. |
| | 99 | |
| Structural and Collateral Term Sheet | | BMO 2023-C7 |
| No. 9 – New Mountain - Cleaver-Brooks |
| Mortgage Loan Information | | Property Information |
| Mortgage Loan Seller: | BMO | | Single Asset / Portfolio: | Portfolio |
| Original Principal Balance: | $31,350,000 | | Title: | Fee |
| Cut-off Date Principal Balance: | $31,350,000 | | Property Type – Subtype: | Industrial – Warehouse/Manufacturing |
| % of IPB: | 4.2% | | Net Rentable Area (SF): | 799,679 |
| Loan Purpose: | Recapitalization | | Location(1): | Various |
| Borrowers: | NM CVRB, L.P. and NM Cleaver Canada Corp. | | Year Built / Renovated(2): | Various / Various |
| Borrower Sponsors: | New Mountain Net Lease Partners II Corporation | | Occupancy: | 100.0% |
| Interest Rate: | 6.32300% | | Occupancy Date: | 11/1/2023 |
| Note Date: | 11/17/2023 | | 4th Most Recent NOI (As of)(3): | NAV |
| Maturity Date: | 12/6/2033 | | 3rd Most Recent NOI (As of)(3): | NAV |
| Interest-only Period: | 120 months | | 2nd Most Recent NOI (As of)(3): | NAV |
| Original Term: | 120 months | | Most Recent NOI (As of)(3): | NAV |
| Original Amortization Term: | None | | UW Economic Occupancy: | 95.0% |
| Amortization Type: | Interest Only | | UW Revenues: | $5,344,806 |
| Call Protection: | L(23), YM1(1), DorYM(91), O(5) | | UW Expenses: | $1,068,961 |
| Lockbox / Cash Management: | Hard / Springing | | UW NOI: | $4,275,844 |
| Additional Debt | No | | UW NCF: | $3,915,989 |
| Additional Debt Balance: | NAP | | Appraised Value / Per SF: | $58,265,000 / $73 |
| Additional Debt Type: | NAP | | Appraisal Date: | Various |
| | | | | |
| Escrows and Reserves(4) | | Financial Information |
| | Initial | Monthly | Initial Cap | | Cut-off Date Loan / SF: | $39 | |
| Taxes: | $0 | Springing | N/A | | Maturity Date Loan / SF: | $39 | |
| Insurance: | $0 | Springing | N/A | | Cut-off Date LTV: | 53.8% | |
| Replacement Reserves: | $0 | Springing | N/A | | Maturity Date LTV: | 53.8% | |
| TI / LC: | $0 | Springing | N/A | | UW NCF DSCR: | 1.95x | |
| | | | | | UW NOI Debt Yield: | 13.6% | |
| | | | | | | | |
| Sources and Uses |
| Sources | Proceeds | % of Total | | Uses | Proceeds | % of Total | |
| Mortgage Loan | $31,350,000 | 100.0% | | Principal Equity Distribution | $29,314,976 | 93.5 | % |
| | | | | Closing Costs | 2,035,024 | 6.5 | |
| Total Sources | $31,350,000 | 100.0% | | Total Uses | $31,350,000 | 100.0 | % |
| (1) | See “Portfolio Summary” table herein. |
| (2) | The New Mountain - Cleaver-Brooks Portfolio properties were built between 1925 and 2008, with renovations at the properties spanning between 1982 and 2016, across two properties. |
| (3) | Historical financial information is not available due to the acquisition of the New Mountain - Cleaver-Brooks Portfolio in a sale-leaseback transaction in July 2023. |
| (4) | See “Escrows and Reserves” below for further discussion of reserve information. |
The Loan. The ninth largest mortgage loan (the “New Mountain - Cleaver-Brooks Mortgage Loan”) is evidenced a promissory note with a principal balance as of the Cut-off Date of $31,350,000, secured by a first lien mortgage on the borrower’s fee interest in a 799,679 square foot, industrial warehouse/manufacturing portfolio consisting of seven individual properties (each, a “New Mountain - Cleaver-Brooks Property” and collectively, the “New Mountain - Cleaver-Brooks Properties” or the “New Mountain - Cleaver-Brooks Portfolio”) located in Texas (2 properties), Wisconsin (2 properties), Georgia (1 property), Nebraska (1 property) and Ontario, Canada (1 property). The New Mountain - Cleaver-Brooks Mortgage Loan was originated by Goldman Sachs Bank USA on November 17, 2023 has a 10-year interest-only term and accrues interest at a rate of 6.32300% per annum. The New Mountain - Cleaver-Brooks Mortgage Loan is being sold by GS Commercial Real Estate LLC to Bank of Montreal (or “BMO”) to be contributed to the BMO 2023-C7 Mortgage Trust, pursuant to an agreement dated and effective November 21, 2023. The purchase and sale of the Mortgage Loan is expected to be completed not less than two business days prior to the settlement of the BMO 2023-C7 transaction.
| THE INFORMATION IN THIS STRUCTURAL AND COLLATERAL TERM SHEET IS NOT COMPLETE AND MAY BE AMENDED PRIOR TO THE TIME OF SALE. THIS TERM SHEET IS NOT AN OFFER TO SELL THESE SECURITIES AND IT IS NOT A SOLICITATION OF AN OFFER TO BUY THESE SECURITIES IN ANY JURISDICTION WHERE THE OFFER OR SALE IS NOT PERMITTED. |
| | 100 | |
| Structural and Collateral Term Sheet | | BMO 2023-C7 |
| No. 9 – New Mountain - Cleaver-Brooks |
The proceeds of the New Mountain - Cleaver-Brooks Mortgage Loan were used by the borrowers to recapitalize the New Mountain - Cleaver-Brooks Portfolio, and pay closing costs.
The New Mountain - Cleaver-Brooks Mortgage Loan had an original term of 120 months and has a remaining term of 120 months as of the Cut-off Date. The New Mountain - Cleaver-Brooks Mortgage Loan requires interest-only payments during the full term. The scheduled maturity date of the New Mountain - Cleaver Brooks Loan is the payment date in December 2033. Voluntary prepayment of the New Mountain - Cleaver-Brooks Mortgage Loan in whole (or in part as described below under “—Partial Release”) is permitted on or after the due date occurring in [August] 2033 without payment of any prepayment premium. In addition, voluntary prepayment of the New Mountain - Cleaver-Brooks Mortgage Loan in whole (or in part as described below under “—Partial Release”) is permitted at any time on or after the second anniversary of the origination date (or, solely in connection with a partial release as described below under “—Partial Release,” prior to the second anniversary of the origination date) with payment of a prepayment premium. Defeasance of the New Mountain - Cleaver-Brooks Mortgage Loan in whole (or in part as described below under “—Partial Release”) is permitted at any time after the second anniversary of the Closing Date.
The Properties. The New Mountain - Cleaver-Brooks Portfolio is comprised of seven industrial facilities totaling 799,679 square feet, inclusive of Cleaver-Brooks’ (the “Tenant”) corporate headquarters. In aggregate, the New Mountain - Cleaver-Brooks Portfolio represents over 90% of the Tenant’s manufacturing footprint. The New Mountain - Cleaver-Brooks Portfolio consists of seven of the Tenant’s global manufacturing, distribution, research and development and service facilities, across four states in the US and Ontario, Canada, with the Canadian property comprising 14.8% square feet and 12.3% of UW Base Rent which is paid in U.S. dollars. These facilities manufacture, distribute, service and support the Tenant’s global operations and specific operating segments, such as Packaged Boiler & Burners (Thomasville, GA, Stratford, ON and Monroe, WI), Engineered Systems (Lincoln, NE), Boiler Services (Dallas, TX and Channelview, TX), Aftermarket Solutions (Thomasville, GA), as well as research and development (Milwaukee, WI).
Sole Tenant. The sole tenant, Cleaver-Brooks, was founded in 1929 and operates as a boiler room solutions provider that works in industries, such as Food & Beverage, Manufacturing, Chemical, Healthcare, Utilities, Higher Education, Petrochemical and Governments, to tailor custom solutions that increase energy efficiency and decrease emissions levels. Cleaver-Brooks offers a broad range of products to help customers optimize their boiler systems including the most advanced boilers in the industry, integrated control options and high efficiency burners. Cleaver-Brooks’ offers its clients full-service boiler room solutions globally, with 93% of revenues generated across the United States and Canada. Cleaver-Brooks was acquired by Harbour Group in 2012, which has invested approximately $205 million of equity into the business of Cleaver-Brooks throughout its hold period.
Upon purchasing the New Mountain - Cleaver-Brooks Portfolio, the borrowers executed an absolute NNN unitary master lease (the “Lease”) with Cleaver Brooks. The Lease has a term of 25 years with four 5-year renewal options for a fully extended term of 45 years, with 2.5% annual rent escalations. The Lease has no termination options (except in connection with certain casualty or condemnation events).
Appraisal. According to the appraisal, the New Mountain - Cleaver-Brooks Portfolio had an “as-is” appraised value of $58,265,000 between August 4, 2023 and August 9, 2023. The table below shows the appraiser’s “as-is” conclusions.
| Appraisal Valuation Summary(1) |
| Property | Appraised Value | Capitalization Rate(2) |
| 6940 Cornhusker Highway | $16,590,000 | 7.50% |
| 221 Law Street | $14,400,000 | 7.75% |
| 1956 Singleton Boulevard | $12,300,000 | 7.50% |
| 351 21st Street | $6,250,000 | 7.50% |
| 161 Lorne Avenue West | $6,225,000 | 9.25% |
| 18300 Market Street | $1,300,000 | 7.00% |
| 3232 West Lancaster Avenue | $1,200,000 | 8.00% |
| Total/Wtd. Avg. | $58,265,000 | 7.75% |
| (2) | The appraiser used a discounted cash flow approach to arrive at the appraised value. The capitalization rates shown above represent the overall capitalization rate. |
Environmental. According to the Phase I environmental reports dated May 19, 2023, the environmental consultant identified recognized environmental conditions at each of the New Mountain - Cleaver-Brooks Properties and identified controlled environmental conditions at the 351 21st Street and the 3232 West Lancaster Avenue properties. See “Description of the Mortgage Pool—Environmental Considerations” in the Preliminary Prospectus.
| THE INFORMATION IN THIS STRUCTURAL AND COLLATERAL TERM SHEET IS NOT COMPLETE AND MAY BE AMENDED PRIOR TO THE TIME OF SALE. THIS TERM SHEET IS NOT AN OFFER TO SELL THESE SECURITIES AND IT IS NOT A SOLICITATION OF AN OFFER TO BUY THESE SECURITIES IN ANY JURISDICTION WHERE THE OFFER OR SALE IS NOT PERMITTED. |
| | 101 | |
| Structural and Collateral Term Sheet | | BMO 2023-C7 |
| No. 9 – New Mountain - Cleaver-Brooks |
The following table presents certain information relating to the current occupancy of the New Mountain - Cleaver-Brooks Portfolio:
| Current Occupancy(1)(2) |
| 100.0% |
| (1) | There is no reported historical occupancy due to the borrower acquiring the collateral in a sale-leaseback transaction in July 2023. |
| (2) | Current occupancy is based on the underwritten rent roll as of November 1, 2023. |
The following table presents certain information relating to the sole tenant at the New Mountain - Cleaver-Brooks Portfolio:
| Tenant Summary(1) |
| Tenant | Ratings Moody’s/S&P/Fitch | Net Rentable Area (SF) | % of Total NRA | UW Base Rent PSF | UW Base Rent | % of Total UW Base Rent | Lease Expiration Date |
| Cleaver – Brooks(2) | NR/NR/NR | 799,679 | 100.0% | $5.56 | $4,446,000 | 100.0% | 7/31/2048 |
| Total Occupied | | 799,679 | 100.0% | $5.56 | $4,446,000 | 100.0% | |
| Vacant Space | | 0 | 0.0 | | | | |
| Total / Wtd. Avg. | | 799,679 | 100.0% | | | | |
| (1) | Based on the underwritten rent roll as of November 1, 2023, inclusive of rent steps through November 2024. |
| (2) | The Tenant occupies all of the New Mountain - Cleaver-Brooks Properties as sole tenant under an absolute triple-net master lease agreement. The lease has an initial term of 25 years and four, 5-year renewal options, for a fully extended term of 45 years, and contains no termination options (outside of casualty and condemnation). The base rent will escalate by 2.5% each year for the entire initial lease term. There are four 5-year extension options. The lease is guaranteed by Cleaver-Holdings Inc. |
The following table presents certain information relating to the New Mountain - Cleaver-Brooks Portfolio:
| Portfolio Summary |
| Property | City, State | Year Built / Renovated | Net Rentable Area (SF)(1) | Occupancy %(1) | Allocated Mortgage Loan Amount | % of Allocated Mortgage Loan Amount | Appraised Value(2) | UW NCF(1) | % of UW NCF(1) |
| 6940 Cornhusker Highway | Lincoln, NE | 1962 / 2016 | 188,604 | 100.0% | $9,597,270 | 30.6 | % | $16,590,000 | $1,094,136 | 27.9 | % |
| 221 Law Street | Thomasville, GA | 1967 / 1982,1995, 2011 | 235,000 | 100.0% | 8,330,361 | 26.6 | | 14,400,000 | 956,479 | 24.4 | |
| 1956 Singleton Boulevard | Dallas, TX | 1957 - 1983 / NAP | 122,549 | 100.0% | 7,115,517 | 22.7 | | 12,300,000 | 811,115 | 20.7 | |
| 351 21st Street | Monroe, WI | 1958 - 1995 / NAP | 87,241 | 100.0% | 3,615,608 | 11.5 | | 6,250,000 | 422,204 | 10.8 | |
| 161 Lorne Avenue West(3) | Stratford, ON | 1958 - 2008 / NAP | 118,585 | 100.0% | 1,245,000 | 4.0 | | 6,225,000 | 474,638 | 12.1 | |
| 18300 Market Street | Channelview, TX | 2001 / NAP | 7,500 | 100.0% | 752,047 | 2.4 | | 1,300,000 | 83,181 | 2.1 | |
| 3232 West Lancaster Avenue | Milwaukee, WI | 1925 - 1933 / NAP | 40,200 | 100.0% | 694,197 | 2.2 | | 1,200,000 | 74,236 | 1.9 | |
| Total | | | 799,679 | 100.0% | 31,350,000 | 100.0 | % | $58,265,000 | $3,915,989 | 100.0 | % |
| (1) | Based on the underwritten rent roll as of November 1, 2023, inclusive of rent steps through November 2024. |
| (3) | Located in Canada. Under the Lease, the Tenant is required to pay rent with respect to this property in U.S. dollars. |
| THE INFORMATION IN THIS STRUCTURAL AND COLLATERAL TERM SHEET IS NOT COMPLETE AND MAY BE AMENDED PRIOR TO THE TIME OF SALE. THIS TERM SHEET IS NOT AN OFFER TO SELL THESE SECURITIES AND IT IS NOT A SOLICITATION OF AN OFFER TO BUY THESE SECURITIES IN ANY JURISDICTION WHERE THE OFFER OR SALE IS NOT PERMITTED. |
| | 102 | |
| Structural and Collateral Term Sheet | | BMO 2023-C7 |
| No. 9 – New Mountain - Cleaver-Brooks |
The following table presents certain information relating to the Tenant Lease expiration date at the New Mountain – Cleaver-Brooks Portfolio:
| Lease Rollover Schedule(1) |
Year | Number of Leases Expiring | Net Rentable Area Expiring | % of Net Rental Area Expiring | UW Base Rent Expiring | % of UW Base Rent Expiring | Cumulative Net Rentable Area Expiring | Cumulative % of NRA Expiring | Cumulative UW Base Rent Expiring | Cumulative % of UW Base Rent Expiring |
| Vacant | NAP | 0 | 0.0 | % | NAP | | NAP | | 0 | | 0.0% | | NAP | | NA | P |
| 2023 & MTM | 0 | 0 | 0.0 | | $0 | | 0.0 | % | 0 | | 0.0% | | $0 | | 0.0 | % |
| 2024 | 0 | 0 | 0.0 | | 0 | | 0.0 | | 0 | | 0.0% | | $0 | | 0.0 | % |
| 2025 | 0 | 0 | 0.0 | | 0 | | 0.0 | | 0 | | 0.0% | | $0 | | 0.0 | % |
| 2026 | 0 | 0 | 0.0 | | 0 | | 0.0 | | 0 | | 0.0% | | $0 | | 0.0 | % |
| 2027 | 0 | 0 | 0.0 | | 0 | | 0.0 | | 0 | | 0.0% | | $0 | | 0.0 | % |
| 2028 | 0 | 0 | 0.0 | | 0 | | 0.0 | | 0 | | 0.0% | | $0 | | 0.0 | % |
| 2029 | 0 | 0 | 0.0 | | 0 | | 0.0 | | 0 | | 0.0% | | $0 | | 0.0 | % |
| 2030 | 0 | 0 | 0.0 | | 0 | | 0.0 | | 0 | | 0.0% | | $0 | | 0.0 | % |
| 2031 | 0 | 0 | 0.0 | | 0 | | 0.0 | | 0 | | 0.0% | | $0 | | 0.0 | % |
| 2032 | 0 | 0 | 0.0 | | 0 | | 0.0 | | 0 | | 0.0% | | $0 | | 0.0 | % |
| 2033 | 0 | 0 | 0.0 | | 0 | | 0.0 | | 0 | | 0.0% | | $0 | | 0.0 | % |
| 2034 & Beyond(2) | 1 | 799,679 | 100.0 | | 4,446,000 | | 100.0 | | 799,679 | | 100.0% | | $4,446,000 | | 100.0 | % |
| Total | 1 | 799,679 | 100.0 | % | $4,446,000 | | 100.0 | % | | | | |
| (1) | Based on the underwritten rent roll as of November 1, 2023, inclusive of rent steps through November 2024. |
| (2) | The Tenant occupies all of the New Mountain - Cleaver-Brooks Properties as sole tenant under an absolute triple-net master lease agreement. The lease has an initial term of 25 years and four, 5-year renewal options, for a fully extended term of 45 years, and contains no termination options (outside of casualty and condemnation). The base rent will escalate by 2.5% each year for the entire initial lease term. There are four 5-year extension options. The lease is guaranteed by Cleaver-Holdings Inc. |
The following table presents certain information relating to the underwritten cash flows of the New Mountain - Cleaver-Brooks Portfolio:
| Underwritten Net Cash Flow(1) |
| | | Underwritten | Per Square Foot | %(2) |
| Base Rent | | $4,446,000 | $5.56 | | 83.2 | % |
| Conctractual Rent Steps | | 111,150 | 0.14 | | 2.1 | |
| Recoveries and Vacancy Loss | | 787,656 | 0.98 | | 14.7 | |
| Effective Gross Income | | $5,344,806 | $6.68 | | 100.0 | % |
| Management Fee | | 160,344 | 0.20 | | 3.8 | |
| Other Operating Expenses | | 908,617 | 1.14 | | 21.3 | |
| Total Expenses | | $1,068,961 | $1.34 | | 25.0 | % |
| Net Operating Income | | $4,275,844 | $5.35 | | 100.0 | % |
| Replacement Reserves | | 119,952 | 0.15 | | 2.8 | |
| TI/LC | | 239,904 | 0.30 | | 5.6 | |
| Net Cash Flow | | $3,915,989 | $4.90 | | 91.6 | % |
| (1) | Based on the underwritten rent roll as of November 1, 2023, inclusive of rent steps through November 2024. |
| (2) | The “%” column represents percent of Effective Gross Income for the revenue items and Net Operating Income for the remainder of the fields. |
| THE INFORMATION IN THIS STRUCTURAL AND COLLATERAL TERM SHEET IS NOT COMPLETE AND MAY BE AMENDED PRIOR TO THE TIME OF SALE. THIS TERM SHEET IS NOT AN OFFER TO SELL THESE SECURITIES AND IT IS NOT A SOLICITATION OF AN OFFER TO BUY THESE SECURITIES IN ANY JURISDICTION WHERE THE OFFER OR SALE IS NOT PERMITTED. |
| | 103 | |
| Structural and Collateral Term Sheet | | BMO 2023-C7 |
| No. 9 – New Mountain - Cleaver-Brooks |
The Market. See below for relevant data pertaining to the industrial markets for each of the seven portfolio properties’ respective markets:
| Market Summary(1) |
| Market | Market Inventory (SF) | Market Vacancy | Market Rent ($) | Net Absorbtion (SF) |
| Thomasville, GA | 6,600,000 | 2.1% | 6.88 | (122,000) |
| Lincoln, NE | 32,400,000 | 2.6% | 7.09 | (15,600) |
| Dallas, TX | 1,100,000,000 | 7.9% | 9.34 | 32,700,000 |
| Toronto, ON(2) | 866,000,000 | 1.4% | 14.43 | 6,100,000 |
| Madison, WI | 75,700,000 | 2.9% | 7.60 | 1,300,000 |
| Milwaukee, WI | 263,000,000 | 2.2% | 6.74 | 3,400,000 |
| Houston, TX | 803,000,000 | 6.4% | 8.81 | 20,100,000 |
| (1) | Source: Third party provider. |
| (2) | Located in Canada. Under the Lease, the Tenant is required to pay rent with respect to this property in USD. |
The Borrowers. The borrowers are NM CVRB, L.P., a Delaware limited partnership and NM Cleaver Canada Corp., a British Columbia corporation, each a special purpose entity with one independent director in its organizational structure.
The Borrower Sponsor. The borrower sponsor is New Mountain Net Lease Partners II Corporation.
Property Management. The New Mountain - Cleaver-Brooks Portfolio Properties are self-managed by William Warren Properties, Inc., an affiliate of the borrowers, pursuant to individual management agreements.
Escrows and Reserves. At loan origination, the borrowers were not required to make any upfront deposits.
Tax Reserve – On each payment date during a New Mountain - Cleaver-Brooks Portfolio Trigger Period, the borrowers are required to deposit into a real estate tax reserve an amount equal to 1/12 of the amount that the lender reasonably estimates will be necessary to pay real estate taxes over the next 12-month period (such reserve will be conditionally waived so long as no event of default under the New Mountain - Cleaver-Brooks Portfolio Mortgage Loan documents has occurred and is continuing, the tenant is required to pay such taxes and, upon the request of the lender, the borrowers has provided evidence that taxes have been paid in accordance with the requirements of the New Mountain - Cleaver-Brooks Portfolio Mortgage Loan documents).
Insurance Reserve – On each due date during a New Mountain - Cleaver-Brooks Portfolio Trigger Period, the borrowers are required to deposit into an insurance reserve an amount equal to 1/12 of the amount that the lender reasonably estimates will be necessary to cover premiums over the next 12-month period (such reserve will be conditionally waived so long as no event of default under the New Mountain - Cleaver-Brooks Portfolio Mortgage Loan documents has occurred and is continuing, the Tenant is required to pay such insurance premiums and, upon the request of the lender, the borrowers have provided evidence that insurance premiums have been paid in accordance with the requirements of the New Mountain - Cleaver-Brooks Portfolio Mortgage Loan documents).
TI/LC Reserve – On each payment date during a New Mountain - Cleaver-Brooks Portfolio Trigger Period, the borrowers are required to deposit approximately $66,640 into a tenant improvement and leasing commissions reserve, capped at $1.50 per square foot (excluding amounts deposited therein in respect of lease termination proceeds).
Capital Expenditure Reserve – On each payment date during a New Mountain - Cleaver-Brooks Portfolio Trigger Period, the borrowers are required to deposit approximately $9,996 into a capital expenditure reserve, capped at $0.30 per square foot.
Master Lease Reserve – Upon the occurrence of a New Mountain - Cleaver-Brooks Portfolio Master Lease Trigger Event (as defined below), the borrowers are required to deposit all excess cash flow into a master lease reserve account as described below under “—Lockbox/Cash Management;” provided, however, any amounts required to be deposited in the master lease reserve account may, at the borrowers’ election, be provided instead in the form of one or more letters of credit up to an aggregate amount of 10% of the then outstanding principal balance of the New Mountain - Cleaver-Brooks Portfolio Mortgage Loan.
Lockbox / Cash Management. The New Mountain - Cleaver-Brooks Portfolio Mortgage Loan documents require a hard lockbox and springing cash management. The borrowers were required to deliver a tenant direction letter to the Tenant directing the Tenant to remit its rents directly to the lender-controlled lockbox. So long as no New Mountain - Cleaver-Brooks Portfolio Trigger Period or event of default under the New Mountain - Cleaver-Brooks Portfolio Mortgage Loan documents then exists, all funds deposited into the lockbox account
| THE INFORMATION IN THIS STRUCTURAL AND COLLATERAL TERM SHEET IS NOT COMPLETE AND MAY BE AMENDED PRIOR TO THE TIME OF SALE. THIS TERM SHEET IS NOT AN OFFER TO SELL THESE SECURITIES AND IT IS NOT A SOLICITATION OF AN OFFER TO BUY THESE SECURITIES IN ANY JURISDICTION WHERE THE OFFER OR SALE IS NOT PERMITTED. |
| | 104 | |
| Structural and Collateral Term Sheet | | BMO 2023-C7 |
| No. 9 – New Mountain - Cleaver-Brooks |
are required to be transferred on each business day to a borrower-controlled operating account. Upon the occurrence and during the continuance of a New Mountain - Cleaver-Brooks Portfolio Trigger Period or event of default under the New Mountain - Cleaver-Brooks Portfolio Loan documents, all funds in the lockbox account are required to be swept on each business day to a cash management account under the control of the lender.
During the continuance of a New Mountain - Cleaver-Brooks Portfolio Trigger Period or, at the lender’s sole discretion, during an event of default under the New Mountain - Cleaver-Brooks Portfolio Mortgage Loan documents, funds in the cash management account will be applied and disbursed for payment of taxes, insurance premiums, operating expenses, debt service, reserves, and other amounts payable in accordance with the New Mountain - Cleaver-Brooks Portfolio Mortgage Loan documents, and all excess cash flow funds remaining in the cash management account after the application of such funds in accordance with the New Mountain - Cleaver-Brooks Portfolio Mortgage Loan documents are required to be held by the lender (a) during the continuance of a New Mountain - Cleaver-Brooks Portfolio Trigger Period caused by a New Mountain - Cleaver-Brooks Portfolio Master Lease Trigger Event, in the master lease reserve account or (b) during the continuance of a New Mountain - Cleaver-Brooks Portfolio Trigger Period during which a New Mountain - Cleaver-Brooks Portfolio Master Lease Trigger Event is not in effect, (x) to the extent that the balance in the excess cash flow reserve account is less than an amount equal to the monthly base rent under the master lease or any replacement master lease (as of the date of the commencement of the applicable New Mountain - Cleaver-Brooks Portfolio Trigger Period) multiplied by 18 (the “New Mountain - Cleaver-Brooks Portfolio Excess Cash Flow Threshold Amount”), in an excess cash flow reserve account as additional collateral for the New Mountain - Cleaver-Brooks Portfolio Mortgage Loan and (y) to the extent that the balance in the excess cash flow reserve account equals or exceeds the New Mountain - Cleaver-Brooks Portfolio Excess Cash Flow Threshold Amount, in a borrower-controlled operating account. Upon the occurrence and during the continuance of an event of default under the New Mountain - Cleaver-Brooks Portfolio Mortgage Loan documents or any bankruptcy action of the borrowers, the lender may apply funds to the debt in such priority as it may determine.
A “New Mountain - Cleaver-Brooks Portfolio Trigger Period” means each period that commences when (a) the tenant files for bankruptcy and concludes when (x) (i) the tenant assumes the master lease in connection with such bankruptcy or (ii) the borrowers have relet any applicable New Mountain - Cleaver-Brooks Portfolio Property pursuant to an approved substitute lease resulting in a debt service coverage ratio of at least 1.25x or (y) the borrowers have deposited with the lender cash or a letter of credit in such amount as calculated pursuant to the New Mountain - Cleaver-Brooks Portfolio Mortgage Loan documents (a “Master Lease Trigger Period Avoidance Condition”); (b) (i) the Tenant has ceased its business operations in more than the lesser of (x) two individual New Mountain - Cleaver-Brooks Portfolio Properties or (y) such New Mountain - Cleaver-Brooks Portfolio Properties that, in the aggregate, exceed more than 15% of the base rent for the Property or (ii) terminated the master lease (a “Go-Dark Event”) and concludes when (x) (1) a Go-Dark Event is no longer continuing and (2) the Tenant has provided an estoppel certificate confirming its intent to occupy the applicable New Mountain - Cleaver-Brooks Portfolio Property in accordance with the master lease, or (y) the borrowers have relet any applicable New Mountain - Cleaver-Brooks Portfolio Property pursuant to an approved substitute lease resulting in a debt service coverage ratio of at least 1.25x or (z) the Master Lease Trigger Period Avoidance Condition is satisfied (any of the events described in clauses (a) and (b), a “New Mountain - Cleaver-Brooks Portfolio Master Lease Trigger Event”); (c) the debt service coverage ratio as of the last day of any two consecutive fiscal quarters, is less than 1.25x and concludes when (x) the debt service coverage ratio, as of the last day of any two consecutive fiscal quarters, is equal to or greater than 1.25x or (y) the borrowers has deposited with the lender cash or a letter of credit in such amount as calculated pursuant to the New Mountain - Cleaver-Brooks Portfolio Mortgage Loan documents [(a “DSCR Trigger Period Avoidance Condition”)] and/or (d) commences when (and if) the financial reports required under the New Mountain - Cleaver-Brooks Portfolio Mortgage Loan documents are not delivered to the lender as and when required and concludes when such reports are delivered and they indicate that, in fact, no New Mountain - Cleaver-Brooks Portfolio Trigger Period based upon clause (c) above is ongoing.
Subordinate and Mezzanine Debt. None.
Partial Release. The New Mountain - Cleaver-Brooks Portfolio Mortgage Loan documents permit the borrowers to obtain the release of any individual New Mountain - Cleaver-Brooks Portfolio Property from the lien of the New Mountain - Cleaver-Brooks Portfolio Mortgage Loan documents following the occurrence of either (x) a casualty or condemnation that results in the Tenant terminating its master lease with respect to such New Mountain - Cleaver-Brooks Portfolio Property (a “Permitted Release Casualty Event”) or (y) (a) a default or an event of default under the New Mountain - Cleaver-Brooks Portfolio Mortgage Loan documents that is solely caused by the Tenant or (b) a monetary or material non-monetary default by the Tenant under the master lease that would (1) give the borrowers the right under the master lease to terminate the master lease or (2) result in the occurrence of a default or event of default under the New Mountain - Cleaver-Brooks Portfolio Mortgage Loan documents (a “Permitted Release Default Event”), provided that, among other conditions, (i) the borrowers prepay or defease a portion of the New Mountain - Cleaver-Brooks Portfolio Mortgage Loan in an amount equal to (x) 115% of the allocated New Mountain - Cleaver-Brooks Portfolio Mortgage Loan amount for such New Mountain - Cleaver-Brooks Property with respect to a release due to a Permitted Release Casualty Event or (y) 120% of the allocated New Mountain - Cleaver-Brooks Portfolio Mortgage Loan amount for such New Mountain - Cleaver-Brooks Property with respect to a release due to a Permitted Release Default Event, plus the payment of a yield maintenance premium (if applicable), (ii) no event of default is continuing, or in the case of a release due to a Permitted Release Default Event, (w) the release would cure such event of default, (x) such event of default is not the result of either borrowers’ gross negligence or willful misconduct, (y) no other event of default is continuing, and (z) the release will be completed
| THE INFORMATION IN THIS STRUCTURAL AND COLLATERAL TERM SHEET IS NOT COMPLETE AND MAY BE AMENDED PRIOR TO THE TIME OF SALE. THIS TERM SHEET IS NOT AN OFFER TO SELL THESE SECURITIES AND IT IS NOT A SOLICITATION OF AN OFFER TO BUY THESE SECURITIES IN ANY JURISDICTION WHERE THE OFFER OR SALE IS NOT PERMITTED. |
| | 105 | |
| Structural and Collateral Term Sheet | | BMO 2023-C7 |
| No. 9 – New Mountain - Cleaver-Brooks |
prior to the expiration of the cure period for such event of default (which may be extended if the borrowers are diligently pursuing such cure), and (iii) the borrowers deliver to the lender a REMIC opinion if required by the lender.
Ground Lease. None.
| THE INFORMATION IN THIS STRUCTURAL AND COLLATERAL TERM SHEET IS NOT COMPLETE AND MAY BE AMENDED PRIOR TO THE TIME OF SALE. THIS TERM SHEET IS NOT AN OFFER TO SELL THESE SECURITIES AND IT IS NOT A SOLICITATION OF AN OFFER TO BUY THESE SECURITIES IN ANY JURISDICTION WHERE THE OFFER OR SALE IS NOT PERMITTED. |
| | 106 | |
| Structural and Collateral Term Sheet | | BMO 2023-C7 |
| No. 10 – Metra Portfolio |
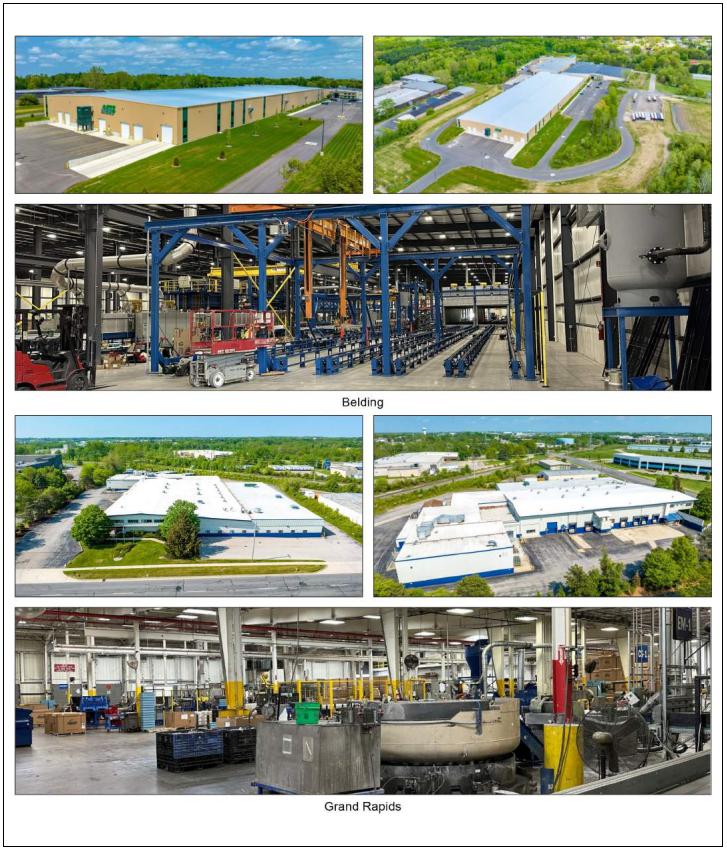
| THE INFORMATION IN THIS STRUCTURAL AND COLLATERAL TERM SHEET IS NOT COMPLETE AND MAY BE AMENDED PRIOR TO THE TIME OF SALE. THIS TERM SHEET IS NOT AN OFFER TO SELL THESE SECURITIES AND IT IS NOT A SOLICITATION OF AN OFFER TO BUY THESE SECURITIES IN ANY JURISDICTION WHERE THE OFFER OR SALE IS NOT PERMITTED. |
| | 107 | |
| Structural and Collateral Term Sheet | | BMO 2023-C7 |
| No. 10 – Metra Portfolio |
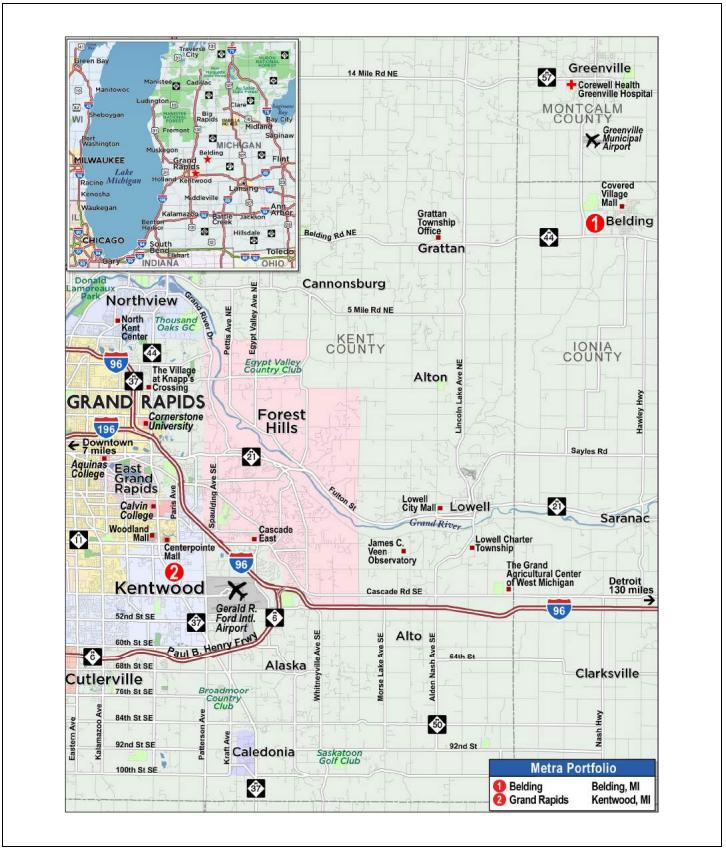
| THE INFORMATION IN THIS STRUCTURAL AND COLLATERAL TERM SHEET IS NOT COMPLETE AND MAY BE AMENDED PRIOR TO THE TIME OF SALE. THIS TERM SHEET IS NOT AN OFFER TO SELL THESE SECURITIES AND IT IS NOT A SOLICITATION OF AN OFFER TO BUY THESE SECURITIES IN ANY JURISDICTION WHERE THE OFFER OR SALE IS NOT PERMITTED. |
| | 108 | |
| Structural and Collateral Term Sheet | | BMO 2023-C7 |
| No. 10 – Metra Portfolio |
| Mortgage Loan Information | | Property Information |
| Mortgage Loan Seller: | CREFI | | Single Asset / Portfolio: | Portfolio |
| Original Principal Balance: | $27,216,296 | | Title: | Fee |
| Cut-off Date Principal Balance: | $27,216,296 | | Property Type – Subtype: | Industrial – Manufacturing |
| % of IPB: | 3.7% | | Net Rentable Area (SF): | 450,104 |
| Loan Purpose: | Acquisition | | Location(1): | Various, MI |
| Borrower: | Rapid Aluminum, LLC | | Year Built / Renovated(1): | Various / Various |
| Borrower Sponsor: | Agracel, Inc. | | Occupancy: | 100.0% |
| Interest Rate: | 7.50000% | | Occupancy Date: | 10/24/2023 |
| Note Date: | 10/24/2023 | | 4th Most Recent NOI (As of)(4): | NAV |
| Maturity Date: | 11/6/2033 | | 3rd Most Recent NOI (As of)(4): | NAV |
| Interest-only Period: | 36 months | | 2nd Most Recent NOI (As of)(4): | NAV |
| Original Term: | 120 months | | Most Recent NOI (As of)(4): | NAV |
| Original Amortization Term: | 360 | | UW Economic Occupancy: | 95.0% |
| Amortization Type: | Interest Only, Amortizing Balloon | | UW Revenues: | $3,702,918 |
| Call Protection: | L(25),D(88),O(7) | | UW Expenses: | $555,438 |
| Lockbox / Cash Management: | Hard / Springing | | UW NOI: | $3,147,480 |
| Additional Debt: | No | | UW NCF: | $2,965,370 |
| Additional Debt Balance: | N/A | | Appraised Value / Per SF: | $45,830,000 / $102 |
| Additional Debt Type: | N/A | | Appraisal Date: | 8/2/2023 |
| | | | | |
| Escrows and Reserves(2) | | Financial Information |
| | Initial | Monthly | Initial Cap | | Cut-off Date Loan / SF: | $60 | |
| Taxes: | $0 | Springing | N/A | | Maturity Date Loan / SF: | $56 | |
| Insurance: | $0 | Springing | N/A | | Cut-off Date LTV: | 59.4% | |
| Replacement Reserves: | $0 | Springing | N/A | | Maturity Date LTV: | 55.1% | |
| TI / LC: | $0 | Springing | N/A | | UW NCF DSCR: | 1.30x | |
| Other(3): | $62,500 | $0 | N/A | | UW NOI Debt Yield: | 11.6% | |
| | | | | | | |
| Sources and Uses |
| Sources | Proceeds | % of Total | | Uses | Proceeds | % of Total |
Mortgage Loan | $27,216,296 | 61.8 | % | | Purchase Price | $41,871,225 | 95.1 | % |
| Borrower Sponsor Equity | 16,805,252 | 38.2 | | | Closing Costs | 2,087,823 | 4.7 | |
| | | | Upfront Reserves | 62,500 | 0.1 | |
| Total Sources | $44,021,548 | 100.0 | % | | Total Uses | $44,021,548 | 100.0 | % |
| (1) | See the “Portfolio Summary” chart below. |
| (2) | For a full description of Escrows and Reserves, please refer to “Escrows and Reserves” below. |
| (3) | Other Initial reserves include an environmental reserve of $62,500. See “Escrows and Reserves” below. |
| (4) | 4th Most Recent NOI, 3rd Most Recent NOI, 2nd Most Recent NOI and Most Recent NOI are not available because the borrower sponsor acquired the Metra Portfolio Properties (as defined below) in a sale-leaseback transaction. |
The Loan. The tenth largest mortgage loan (the “Metra Portfolio Mortgage Loan”) is secured by the borrower’s fee interest in two industrial properties totaling 450,104 square feet located in Belding and Kentwood, Michigan (the “Metra Portfolio Properties”). The Metra Portfolio Mortgage Loan has an aggregate outstanding principal balance as of the Cut-off Date of $27,216,296. The Metra Portfolio Mortgage Loan was originated on October 24, 2023 by Citi Real Estate Funding Inc. (“CREFI”) and accrues interest at a fixed rate of 7.50000% per annum. The Metra Portfolio Mortgage Loan has an initial term of ten-years and is interest-only for the first 36 months then amortizing on a 360-month schedule for the remainder of the term. The scheduled maturity date of the Metra Portfolio Mortgage Loan is the payment date that occurs on November 6, 2033.
| THE INFORMATION IN THIS STRUCTURAL AND COLLATERAL TERM SHEET IS NOT COMPLETE AND MAY BE AMENDED PRIOR TO THE TIME OF SALE. THIS TERM SHEET IS NOT AN OFFER TO SELL THESE SECURITIES AND IT IS NOT A SOLICITATION OF AN OFFER TO BUY THESE SECURITIES IN ANY JURISDICTION WHERE THE OFFER OR SALE IS NOT PERMITTED. |
| | 109 | |
| Structural and Collateral Term Sheet | | BMO 2023-C7 |
| No. 10 – Metra Portfolio |
The Properties. The Metra Portfolio Properties are comprised of a 380,325 square foot industrial property located at 7200 Industrial Drive in Belding, Michigan (the “Belding Property”) and a 69,779 square foot industrial property located at 3801 36th Street Southeast in Kentwood, Michigan (the “Grand Rapids Property”).
The following table presents certain information relating to the Metra Portfolio Properties:
| Portfolio Summary |
| Property Name | City, State | Year Built / Renovated(1) | Sq. Ft.(2) | Occupancy(2) | Allocated Whole Loan Cut-off Date Balance | % of Allocated Whole Loan Cut-off Date Balance | Appraised Value(1) | U/W NOI | % of U/W NOI |
| Belding | Belding, Michigan | 1989, 2017, 2022 / 2018 | 380,325 | 100.0% | $22,922,737 | 84.2% | $38,600,000 | $2,658,526 | 84.5 | % |
| Grand Rapids | Kentwood, Michigan | 1966 / 2020 | 69,779 | 100.0% | 4,293,559 | 15.8 | 7,230,000 | 488,954 | 15.5 | |
| Total | | | 450,104 | 100.0% | $27,216,296 | 100.0% | $45,830,000 | $3,147,480 | 100.0 | % |
| (2) | Based on the underwritten rent rolls dated October 24, 2023. |
Belding Property
The Belding Property is comprised of three industrial manufacturing buildings totaling 380,325 square feet located at 7200 Industrial Drive in Belding, Michigan. The Belding Property was originally constructed in 1989, expanded in 2017 and 2022 with the original building being subsequently renovated in 2018. The Belding Property is situated on a 51.8-acre site and contains 18 to 26-foot clear heights, 13 dock-high doors, and 12 drive-in doors.
Grand Rapids Property
The Grand Rapids Property is comprised of an industrial manufacturing building and shed totaling 69,779 square feet located at 3801 36th Street Southeast in Kentwood, Michigan. The Grand Rapids Property was originally constructed in 1966 and subsequently renovated in 2020. The Grand Rapids Property is situated on a 4.59-acre site and contains 26-foot clear heights, nine dock-high doors, and one drive-in door.
Sole Tenant. The sole tenant at the Metra Portfolio Properties is Extruded Aluminum Corporation, which leases the Metra Portfolio Properties through two affiliate subsidiaries, Belding Machinery and Equipment Leasing, LLC, with respect to the Belding Property, and Aluminum Fabrication Company, LLC, with respect to the Grand Rapids Property (450,104 square feet; 100.0% of NRA; 100.0% of underwritten base rent): Founded in 1987, Extruded Aluminum Corporation is an aluminum manufacturer that serves the Midwest and offers a line of extrusions, including standard shapes in raw lineals and custom extrusions and aluminum base alloy basic shapes. Upon purchasing the Metra Portfolio Properties, the borrower sponsor executed leases at the Metra Portfolio Properties which have a current lease term through September 2048 and no renewal or termination options.
Appraisal. According to the appraisal, the Metra Portfolio Properties had an “as is” appraised value of $45,830,000 as of August 2, 2023. The table below shows the appraiser’s “as-is” conclusions.
| Metra Portfolio(1) |
| Property | Value | Capitalization Rate |
| Belding | $38,600,000 | 7.00% |
| Grand Rapids | $7,230,000 | 6.90% |
| Total / Wtd. Avg(2) | $45,830,000 | 6.98% |
| (2) | Total / Wtd. Avg is based on the appraised value of each Metra Portfolio Property. |
Environmental. The Phase I environmental report dated as of September 19, 2023 identifies a recognized environmental condition at the Belding Property associated with aluminum impacts to site soils above the Residential Drinking Water Protection criteria. In addition, the Phase I dated as of September 19, 2023 identifies a controlled recognized environmental condition for the Grand Rapids Property associated with historic operations. See “Description of the Mortgage Pool—Environmental Considerations” in the Preliminary Prospectus.
| THE INFORMATION IN THIS STRUCTURAL AND COLLATERAL TERM SHEET IS NOT COMPLETE AND MAY BE AMENDED PRIOR TO THE TIME OF SALE. THIS TERM SHEET IS NOT AN OFFER TO SELL THESE SECURITIES AND IT IS NOT A SOLICITATION OF AN OFFER TO BUY THESE SECURITIES IN ANY JURISDICTION WHERE THE OFFER OR SALE IS NOT PERMITTED. |
| | 110 | |
| Structural and Collateral Term Sheet | | BMO 2023-C7 |
| No. 10 – Metra Portfolio |
The following table presents certain information relating to the current occupancy of the Metra Portfolio Properties:
| Current Occupancy(1)(2) |
| Current |
| 100.0% |
| (1) | Based on the underwritten rent rolls dated October 24, 2023 |
| (2) | Historical Occupancy is not available because the borrower sponsor acquired the Metra Portfolio Properties via a sale leaseback transaction. |
The following table presents certain information relating to the sole tenant at the Metra Portfolio Properties:
| Sole Tenant Summary(1) |
| Tenant | Property | Ratings Moody’s/S&P/Fitch(2) | Net Rentable Area (SF) | % of Total NRA | UW Base Rent PSF(3) | UW Base Rent(3) | % of Total UW Base Rent(3) | Lease Expiration Date |
| Extruded Aluminum Corporation | Belding | NR/NR/NR | 380,325 | 84.5 | % | $7.42 | $2,823,140 | 84.5 | % | 9/30/2048 |
| Extruded Aluminum Corporation | Grand Rapids | NR/NR/NR | 69,779 | 15.5 | | $7.44 | 519,230 | 15.5 | | 9/30/2048 |
| Total Occupied | | | 450,104 | 100.0 | % | $7.43 | $3,342,371 | 100.0 | % | |
| Vacant Space | | | 0 | 0 | | | | | |
| Total / Wtd. Avg. | | | 450,104 | 100.0 | % | | | | |
| (1) | Based on the underwritten rent rolls dated October 24, 2023. |
| (2) | In certain instances, ratings provided are those of the parent company of the entity shown, whether or not the parent company guarantees the lease. |
| (3) | UW Base Rent PSF, UW Base Rent and % of Total UW Base Rent include contractual rent steps through November 1, 2024 totaling $97,351. |
The following table presents certain information relating to the tenant lease expiration at the Metra Portfolio Properties:
| Lease Rollover Schedule(1)(2) |
| Year | Number of Leases Expiring | Net Rentable Area Expiring | % of NRA Expiring | UW Base Rent Expiring(3) | % of UW Base Rent Expiring(3) | Cumulative Net Rentable Area Expiring | Cumulative % of NRA Expiring | Cumulative UW Base Rent Expiring(3) | Cumulative % of UW Base Rent Expiring(3) |
| Vacant | NAP | 0 | 0.0 | % | NAP | NA | P | 0 | 0.0% | NAP | NAP |
| 2023 & MTM | 0 | 0 | 0.0 | | $0 | 0.0 | % | 0 | 0.0% | $0 | 0.0% |
| 2024 | 0 | 0 | 0.0 | | 0 | 0.0 | | 0 | 0.0% | $0 | 0.0% |
| 2025 | 0 | 0 | 0.0 | | 0 | 0.0 | | 0 | 0.0% | $0 | 0.0% |
| 2026 | 0 | 0 | 0.0 | | 0 | 0.0 | | 0 | 0.0% | $0 | 0.0% |
| 2027 | 0 | 0 | 0.0 | | 0 | 0.0 | | 0 | 0.0% | $0 | 0.0% |
| 2028 | 0 | 0 | 0.0 | | 0 | 0.0 | | 0 | 0.0% | $0 | 0.0% |
| 2029 | 0 | 0 | 0.0 | | 0 | 0.0 | | 0 | 0.0% | $0 | 0.0% |
| 2030 | 0 | 0 | 0.0 | | 0 | 0.0 | | 0 | 0.0% | $0 | 0.0% |
| 2031 | 0 | 0 | 0.0 | | 0 | 0.0 | | 0 | 0.0% | $0 | 0.0% |
| 2032 | 0 | 0 | 0.0 | | 0 | 0.0 | | 0 | 0.0% | $0 | 0.0% |
| 2033 | 0 | 0 | 0.0 | | 0 | 0.0 | | 0 | 0.0% | $0 | 0.0% |
| 2034 & Beyond(4) | 1 | 450,104 | 100.0 | | 3,342,371 | 100.0 | | 450,104 | 100.0% | $3,342,371 | 100.0% |
| Total | 1 | 450,104 | 100.0 | % | $3,342,371 | 100.0 | % | | | | |
| (1) | Based on the underwritten rent rolls dated October 24, 2023. |
| (2) | Certain tenants have more than one lease. Certain tenants may have lease termination or contraction options that are exercisable prior to the originally stated expiration date of the subject lease and that are not considered in the lease rollover schedule. |
| (3) | UW Base Rent Expiring, % of UW Base Rent Expiring, Cumulative UW Base Rent Expiring and Cumulative % of UW Base Rent Expiring include contractual rent steps through November 1, 2024, totaling $97,351. |
| (4) | The tenant, Extruded Aluminum Corporation, executed new 25-year absolute NNN leases at the Metra Portfolio Properties that expire in September 2048 with no termination options. |
| THE INFORMATION IN THIS STRUCTURAL AND COLLATERAL TERM SHEET IS NOT COMPLETE AND MAY BE AMENDED PRIOR TO THE TIME OF SALE. THIS TERM SHEET IS NOT AN OFFER TO SELL THESE SECURITIES AND IT IS NOT A SOLICITATION OF AN OFFER TO BUY THESE SECURITIES IN ANY JURISDICTION WHERE THE OFFER OR SALE IS NOT PERMITTED. |
| | 111 | |
| Structural and Collateral Term Sheet | | BMO 2023-C7 |
| No. 10 – Metra Portfolio |
The following table presents certain information relating to the underwritten cash flows at the Metra Portfolio Properties:
| Underwritten Net Cash Flow(1)(2) |
| | Underwritten | Per Square Foot | %(3) |
| In-Place Rent | $3,245,020 | $7.21 | 83.3 | % |
| Contractual Rent Steps(4) | 97,351 | 0.22 | 2.5 | |
| Potential Income from Vacant Space | 0 | 0.00 | 0.0 | |
| Gross Potential Rent | $3,342,371 | $7.43 | 85.8 | % |
| Total Reimbursements | 555,438 | 1.23 | 14.3 | |
| Total Gross Income | $3,897,808 | $8.66 | 100.0 | % |
| (Vacancy/Credit Loss) | (194,890) | (0.43) | (5.0 | ) |
| Effective Gross Income | $3,702,918 | $8.23 | 95.0 | % |
| Total Expenses | $555,438 | $1.23 | 15.0 | % |
| Net Operating Income | $3,147,480 | $6.99 | 85.0 | % |
| Capital Expenditures | 67,516 | 0.15 | 1.8 | |
| TI / LC | 114,595 | 0.25 | 3.1 | |
| Net Cash Flow | $2,965,370 | $6.59 | 80.1 | % |
| (1) | Based on the underwritten rent roll dated October 24, 2023. |
| (2) | Historical financial information is not available due to the acquisition of the Metra Portfolio Properties via a sale leaseback transaction. |
| (3) | The “%” column represents percent of Total Gross Income for all revenue lines and represents percent of Effective Gross Income for the remainder of the fields. |
| (4) | Contractual Rent Steps runs through November 1, 2024. |
The Market. The Metra Portfolio Properties are located in the Grand Rapids-Kentwood, Michigan MSA.
The Belding Property is located at 7200 Industrial Drive in Belding, Michigan and is part of the Iona and Montcalm Counties Industrial submarket. According to the appraisal, as of the second quarter of 2023, the submarket had inventory of 6,979,936 square feet and a vacancy rate of 1.20%.
The Grand Rapids Property is located at 3801 36th Street Southeast in Kentwood, Michigan and is part of the Southeast Grand Rapids/Cascade submarket. According to the appraisal, as of the second quarter of 2023, the submarket had inventory of 34,779,619 square feet and a vacancy rate of 1.8%.
The following table presents certain information relating to comparable office sales to the Belding Property:
| Comparable Industrial Rental Summary(1) |
| Property Name / Address | Tenant | Suite Size (SF) | Commencement | Lease Term (Yrs.) | Rent (PSF) |
| Belding Property | Extruded Aluminum Corporation | 380,325(2) | Oct 2023(2) | 25.0 Yrs.(2) | $7.42(2) |
| 801 East Milham Avenue, Portage, MI | Abraxas / Pfizer | 240,000 | June 2023 | 7.0 Yrs. | $7.45 |
| 45000 Helm Street, Plymouth, MI | Intertek | 200,000 | Jan 2023 | 13.0 Yrs. | $7.56 |
| 15100 8 Mile Road, Oak Park, MI | Tire Wholesalers Company, Inc. | 275,401 | Nov 2022 | 10.3 Yrs. | $6.90 |
| 5010 52nd Street, Grand Rapids, MI | CharityUSA.com | 161,954 | Oct 2021 | 20.0 Yrs. | $7.54 |
| 5200 Hoffman Street, Elkhart, IN | Winnebago Industries, Inc. | 282,700 | Dec 2021 | 10.0 Yrs. | $7.13 |
| 100 Paragon Pky, Mansfield, OH | School Specialty Inc. | 314,736 | Oct 2020 | 5.0 Yrs. | $9.75 |
| (2) | Based on the underwritten rent roll dated October 24, 2023. |
| THE INFORMATION IN THIS STRUCTURAL AND COLLATERAL TERM SHEET IS NOT COMPLETE AND MAY BE AMENDED PRIOR TO THE TIME OF SALE. THIS TERM SHEET IS NOT AN OFFER TO SELL THESE SECURITIES AND IT IS NOT A SOLICITATION OF AN OFFER TO BUY THESE SECURITIES IN ANY JURISDICTION WHERE THE OFFER OR SALE IS NOT PERMITTED. |
| | 112 | |
| Structural and Collateral Term Sheet | | BMO 2023-C7 |
| No. 10 – Metra Portfolio |
The following table presents certain information relating to comparable industrial sales to the Grand Rapids Property:
| Comparable Industrial Rental Summary(1) |
| Property Name / Address | Tenant | Suite Size (SF) | Commencement | Lease Term (Yrs.) | Rent (PSF) |
| Grand Rapids Property | Extruded Aluminum Corporation | 69,779 SF(2) | Oct 2023(2) | 25.0 Yrs.(2) | $7.44(2) |
5010 52nd Street, Grand Rapids, MI | CharityUSA.com | 161,954 SF | Oct 2021 | 20.0 Yrs. | $7.54 |
2290 South Canal Road, Lansing, MI | FedEx Ground | 147,001 SF | Oct 2022 | 10.0 Yrs. | $9.15 |
1872 Enterprise Drive, Rochester Hills, MI | Gainwell Technologies, LLC | 55,367 SF | Sept 2023 | 5.0 Yrs. | $7.62 |
575 Byrne Industrial Drive Northeast, Rockford, MI | The Materials Group | 75,000 SF | May 2023 | 5.0 Yrs. | $6.75 |
| (2) | Based on the underwritten rent roll dated October 24, 2023. |
The Borrower. The borrower is Rapid Aluminum, LLC, a Delaware limited liability company and single-purpose entity having at least one independent director in its organizational structure. Legal counsel to the borrower delivered a non-consolidation opinion in connection with the origination of the Metra Portfolio Mortgage Loan.
The Borrower Sponsor. The borrower sponsor and non-recourse carveout guarantor is Agracel, Inc. (“Agracel”). Founded in 1986, Agracel is an Illinois-based commercial real estate investment company that specializes in middle-market single-tenant net leased industrial properties. Agracel has developed over 23 million square feet of industrial space in 22 states.
Property Management. The Metra Portfolio Properties are managed by Agracel which is a borrower-affiliated management company and the non-recourse carveout guarantor.
Escrows and Reserves. At origination of the Metra Portfolio Mortgage Loan, the borrower deposited $62,500 into an upfront environmental reserve.
Tax Reserve – On each monthly payment date when the Reserve Waver Conditions (as defined below) are not satisfied, the borrower is required to deposit into a real estate tax reserve 1/12 of the real estate taxes that the lender estimates will be payable over the next-ensuing 12-month period.
Insurance Reserve – On each monthly payment date when the Reserve Waiver Conditions are not satisfied, the borrower is required to deposit into an insurance reserve 1/12 of the amount which would be sufficient to pay the insurance premiums due for the renewal of coverage.
Replacement Reserve – On and after the occurrence and continuance of Trigger Period (as defined below), the borrower is required to deposit into a replacement reserve, on a monthly basis, approximately $5,626.��
TI / LC Reserve – On and after the occurrence and continuance of Trigger Period, the borrower is required to deposit into a tenant improvement and leasing commissions reserve, on a monthly basis, approximately $9,550.
“Reserve Waiver Conditions” means each of the following: (i) no Trigger Period has occurred and is continuing, (ii) the Specified Tenant (as defined below) lease is in full force and effect with no defaults thereunder, (iii) the Specified Tenant is obligated to, pursuant to the Specified Tenant lease, and continues to, make the payments and perform the obligations required under the Specified Tenant lease, in each case, relating to the obligations and liabilities for which the applicable reserve account was established (and in each case directly to the applicable governmental authority or insurance carrier, as applicable) and delivers evidence of the same by no later than the dates required under the Metra Portfolio Mortgage Loan documents, (iv) the Specified Tenant is not bankrupt or insolvent, and (v) the Specified Tenant has not expressed its intention in writing to terminate, cancel or default under the Specified Tenant lease (including, without limitation, in connection with any rejection in any bankruptcy or similar insolvency proceeding).
| THE INFORMATION IN THIS STRUCTURAL AND COLLATERAL TERM SHEET IS NOT COMPLETE AND MAY BE AMENDED PRIOR TO THE TIME OF SALE. THIS TERM SHEET IS NOT AN OFFER TO SELL THESE SECURITIES AND IT IS NOT A SOLICITATION OF AN OFFER TO BUY THESE SECURITIES IN ANY JURISDICTION WHERE THE OFFER OR SALE IS NOT PERMITTED. |
| | 113 | |
| Structural and Collateral Term Sheet | | BMO 2023-C7 |
| No. 10 – Metra Portfolio |
Lockbox / Cash Management. The Metra Portfolio Mortgage Loan is structured with a hard lockbox and springing cash management. At origination of the Metra Portfolio Mortgage Loan, the borrower was required to deliver a notice to each tenant directing them to remit all payments under the applicable lease directly to the lender-controlled lockbox account. The borrower is required, or cause the property manager, to immediately deposit all revenue received by the borrower or the property manager into the lockbox account. All funds deposited into the lockbox are required to be transferred on each business day to or at the direction of the borrower unless a Trigger Period (as defined below) exists and the lender elects (in its sole and absolute discretion) to deliver a restricted account notice, whereby the lender instructs the institution maintaining the lockbox account to transfer all funds on deposit in the lockbox account on each business day to the cash management account. Upon the occurrence and during the continuance of a Trigger Period, if lender elects to deliver a restricted account notice, all funds in the lockbox account are required to be transferred on each business day to a lender-controlled cash management account to be applied and disbursed in accordance with the Metra Portfolio Mortgage Loan documents, and all excess cash flow funds remaining in the cash management account after the application of such funds may be held by the lender in an excess cash flow reserve account as additional collateral for the Metra Portfolio Mortgage Loan.
A “Trigger Period” means a period (A) commencing upon the earliest of (i) the occurrence and continuance of an event of default, (ii) the debt service coverage ratio being less than 1.20x, and (iii) the occurrence of a Specified Tenant Trigger Period (as defined below), and (B) expiring upon (x) with regard to clause (i) above, the cure (if applicable) of such event of default, (y) with regard to clause (ii) above, the date that the debt service coverage ratio is equal to or greater than 1.25x for two consecutive calendar quarters, and (z) with regard to clause (iii) above, a Specified Tenant Trigger Period ceasing to exist.
A “Specified Tenant” means, as applicable, (i) Belding Machinery and Equipment Leasing, LLC, (ii) Aluminum Fabrication Company, LLC, (iii) any replacement tenant of any entity listed in the foregoing clauses (i) and (ii), (iv) any other person that (together with any affiliates thereof) (a) accounts for (in the aggregate) 20% of the total rental income for the Metra Portfolio Properties, in the aggregate, or (b) leases (in the aggregate) not less than 20% of the total leasable square feet of the Metra Portfolio Properties, in the aggregate, and (v) any parent or affiliate of any of the foregoing providing a guaranty or other credit support for the applicable Specified Tenant lease and any other guarantor(s) of the applicable related Specified Tenant lease(s).
A “Specified Tenant Trigger Period” means a period (A) commencing upon the first to occur of (i) Specified Tenant being in default under the applicable Specified Tenant lease, (ii) Specified Tenant failing to be in actual, physical possession of the Specified Tenant space (or applicable portion thereof), (iii) Specified Tenant failing to be open for business during customary hours and/or “going dark” in the Specified Tenant space (or applicable portion thereof), (iv) Specified Tenant giving notice that it is terminating its lease for all or any portion of the Specified Tenant space (or applicable portion thereof), (v) any termination or cancellation of any Specified Tenant lease (including, without limitation, rejection in any bankruptcy or similar insolvency proceeding) and/or any Specified Tenant lease failing to otherwise be in full force and effect, (vi) any bankruptcy or similar insolvency of Specified Tenant, and (vii) a Specified Tenant Parent Net Debt/ EBITDA Trigger (as defined below) and (B) expiring upon the first to occur of the lender’s receipt of evidence reasonably acceptable to the lender of (1) the satisfaction of the applicable Specified Tenant Cure Conditions (as defined below), or (2) the borrower leasing the entire Specified Tenant space (or applicable portion thereof) pursuant to one or more leases in accordance with the applicable terms and conditions of the Metra Portfolio Mortgage Loan documents, the applicable tenant(s) under such lease(s) being in actual, physical occupancy of the space demised under its lease, all contingencies to effectiveness of such lease have expired or been satisfied, each such lease has commenced and a rent commencement date has been established and, in the lender’s judgment, the applicable Specified Tenant excess cash flow condition is satisfied in connection therewith.
“Specified Tenant Cure Conditions” means each of the following, as applicable (i) the applicable Specified Tenant has cured all defaults under the applicable Specified Tenant lease and no other default under such Specified Tenant lease occurs for a period of three consecutive months following such cure, (ii) the applicable Specified Tenant is in actual, physical possession of the Specified Tenant Space (or applicable portion thereof) and open for business during customary hours and not “dark” in the Specified Tenant Space (or applicable portion thereof), (iii) the applicable Specified Tenant has revoked or rescinded all termination or cancellation notices with respect to the applicable Specified Tenant lease and has re-affirmed the applicable Specified Tenant lease as being in full force and effect, (iv) with respect to any applicable bankruptcy or
| THE INFORMATION IN THIS STRUCTURAL AND COLLATERAL TERM SHEET IS NOT COMPLETE AND MAY BE AMENDED PRIOR TO THE TIME OF SALE. THIS TERM SHEET IS NOT AN OFFER TO SELL THESE SECURITIES AND IT IS NOT A SOLICITATION OF AN OFFER TO BUY THESE SECURITIES IN ANY JURISDICTION WHERE THE OFFER OR SALE IS NOT PERMITTED. |
| | 114 | |
| Structural and Collateral Term Sheet | | BMO 2023-C7 |
| No. 10 – Metra Portfolio |
insolvency proceedings involving the applicable Specified Tenant and/or the applicable Specified Tenant lease, the applicable Specified Tenant is no longer insolvent or subject to any bankruptcy or insolvency proceedings and has affirmed the applicable Specified Tenant lease pursuant to final, non-appealable order of a court of competent jurisdiction, (v) the applicable Specified Tenant is paying full, unabated rent under the applicable Specified Tenant lease, and (vi) in the event the Specified Tenant Trigger Period is due to a Specified Tenant Parent Net Debt/EBITDA Trigger, the applicable Specified Tenant Parent with respect to which such Specified Tenant Parent Net Debt/EBITDA Trigger occurred satisfies the Specified Tenant Parent Net Debt/EBITDA Cure Condition (as defined below).
“Specified Tenant Parent Net Debt/EBITDA Trigger” means a condition wherein Fengari Holdings I B.V. ceases to, as of the applicable date of determination, then maintain a net debt to adjusted EBITDA ratio, as determined by the lender from Fengari Holdings I B.V.’s financial statements most recently delivered to the lender, of equal to or less than 5.50 to 1.00.
“Specified Tenant Parent Net Debt/EBITDA Cure Condition” means a condition which will be satisfied to the extent that as of the applicable date of determination, Specified Tenant then maintains (and has maintained for at least two (2) consecutive calendar quarters) a net debt to adjusted EBITDA ratio, as determined by the lender from Fengari Holdings I B.V’s financial statements most recently delivered to the lender, of less than 5.00 to 1.00.
Subordinate Debt. None.
Mezzanine Debt. None.
Partial Release. Not Permitted.
Ground Lease. None.
| THE INFORMATION IN THIS STRUCTURAL AND COLLATERAL TERM SHEET IS NOT COMPLETE AND MAY BE AMENDED PRIOR TO THE TIME OF SALE. THIS TERM SHEET IS NOT AN OFFER TO SELL THESE SECURITIES AND IT IS NOT A SOLICITATION OF AN OFFER TO BUY THESE SECURITIES IN ANY JURISDICTION WHERE THE OFFER OR SALE IS NOT PERMITTED. |
| | 115 | |