| | | FREE WRITING PROSPECTUS |
| | | FILED PURSUANT TO RULE 433 |
| | | REGISTRATION FILE NO.: 333-280224-02 |
| Dated October 18, 2024 | BMO 2024-C10 |
| Structural and Collateral Term Sheet |
BMO 2024-C10 Mortgage Trust |
$723,973,556 (Approximate Mortgage Pool Balance) |
| |
$642,526,000 (Approximate Offered Certificates) |
| |
BMO Commercial Mortgage Securities LLC Depositor |
| |
Commercial Mortgage Pass-Through Certificates, Series 2024-C10 |
| |
| |
Bank of Montreal 3650 Real Estate Investment Trust 2 LLC Citi Real Estate Funding Inc. Starwood Mortgage Capital LLC German American Capital Corporation Zions Bancorporation, N.A. Goldman Sachs Mortgage Company Sponsors and Mortgage Loan Sellers |
BMO Capital
Markets | Deutsche Bank
Securities | Goldman Sachs & Co.
LLC | Citigroup |
| Co-Lead Managers and Joint Bookrunners |
Academy Securities
Co-Manager | Bancroft Capital, LLC
Co-Manager | Drexel Hamilton
Co-Manager |
| THE INFORMATION IN THIS STRUCTURAL AND COLLATERAL TERM SHEET IS NOT COMPLETE AND MAY BE AMENDED PRIOR TO THE TIME OF SALE. THIS TERM SHEET IS NOT AN OFFER TO SELL THESE SECURITIES AND IT IS NOT A SOLICITATION OF AN OFFER TO BUY THESE SECURITIES IN ANY JURISDICTION WHERE THE OFFER OR SALE IS NOT PERMITTED. |
| | | |
| Dated October 18, 2024 | BMO 2024-C10 |
This material is for your information, and none of BMO Capital Markets Corp., Citigroup Global Markets Inc., Deutsche Bank Securities Inc., Goldman Sachs & Co. LLC, Academy Securities, Inc., Bancroft Capital, LLC and Drexel Hamilton, LLC (collectively, the “Underwriters”) are soliciting any action based upon it. This material is not to be construed as an offer to sell or the solicitation of any offer to buy any security in any jurisdiction where such an offer or solicitation would be illegal.
The depositor has filed a registration statement (including the prospectus) with the Securities and Exchange Commission (File No. 333-280224) for the offering to which this communication relates. Before you invest, you should read the prospectus in the registration statement and other documents the depositor has filed with the Securities and Exchange Commission for more complete information about the depositor, the issuing entity and this offering. You may get these documents for free by visiting EDGAR on the SEC website at www.sec.gov. Alternatively, the depositor or BMO Capital Markets Corp., any other underwriter, or any dealer participating in this offering will arrange to send you the prospectus if you request it by calling 1-888-200-0266. The Publicly Offered Certificates referred to in these materials, and the asset pool backing them, are subject to modification or revision (including the possibility that one or more Classes of Certificates may be split, combined or eliminated at any time prior to issuance or availability of a final prospectus) and are offered on a “when, as and if issued” basis. You understand that, when you are considering the purchase of these Certificates, a contract of sale will come into being no sooner than the date on which the relevant Class has been priced and we have verified the allocation of Certificates to be made to you; any “indications of interest” expressed by you, and any “soft circles” generated by us, will not create binding contractual obligations for you or us.
Neither this document nor anything contained in this document shall form the basis for any contract or commitment whatsoever. The information contained in this document is preliminary as of the date of this document, supersedes any previous such information delivered to you and will be superseded by any such information subsequently delivered prior to the time of sale. These materials are subject to change, completion or amendment from time to time. The information should be reviewed only in conjunction with the entire offering document relating to the Commercial Mortgage Pass-Through Certificates, Series 2024-C10 (the “Offering Document”). All of the information contained herein is subject to the same limitations and qualifications contained in the Offering Document. The information contained herein does not contain all relevant information relating to the underlying mortgage loans or mortgaged properties. Such information is described elsewhere in the Offering Document. The information contained herein will be more fully described elsewhere in the Offering Document. The information contained herein should not be viewed as projections, forecasts, predictions or opinions with respect to value. Prior to making any investment decision, prospective investors are strongly urged to read the Offering Document its entirety. Neither the Securities and Exchange Commission nor any state securities commission has approved or disapproved of these securities or determined if this free writing prospectus is truthful or complete. Any representation to the contrary is a criminal offense.
This document has been prepared by the Underwriters for information purposes only and does not constitute, in whole or in part, a prospectus for the purposes of Regulation (EU) 2017/1129 (as amended or superseded) and/or Part VI of the Financial Services and Markets Act 2000 (as amended) or other offering document.
The attached information contains certain tables and other statistical analyses (the “Computational Materials”) which have been prepared in reliance upon information furnished by the Mortgage Loan Sellers. Numerous assumptions were used in preparing the Computational Materials, which may or may not be reflected herein. As such, no assurance can be given as to the Computational Materials’ accuracy, appropriateness or completeness in any particular context; or as to whether the Computational Materials and/or the assumptions upon which they are based reflect present market conditions or future market performance. The Computational Materials should not be construed as either projections or predictions or as legal, tax, financial or accounting advice. You should consult your own counsel, accountant and other advisors as to the legal, tax, business, financial and related aspects of a purchase of these Certificates. Any weighted average lives, yields and principal payment periods shown in the Computational Materials are based on prepayment and/or loss assumptions, and changes in such prepayment and/or loss assumptions may dramatically affect such weighted average lives, yields and principal payment periods. In addition, it is possible that prepayments or losses on the underlying assets will occur at rates higher or lower than the rates shown in the attached Computational Materials. The specific characteristics of the Certificates may differ from those shown in the Computational Materials due to differences between the final underlying assets and the preliminary underlying assets used in preparing the Computational Materials. The principal amount and designation of any security described in the Computational Materials are subject to change prior to issuance. None of the Underwriters or any of their respective affiliates make any representation or warranty as to the actual rate or timing of payments or losses on any of the underlying assets or the payments or yield on the Certificates. The information in this presentation is based upon management forecasts and reflects prevailing conditions and management’s views as of this date, all of which are subject to change. In preparing this presentation, we have relied upon and assumed, without independent verification, the accuracy and completeness of all information available from public sources or which was provided to us by or on behalf of the Mortgage Loan Sellers or which was otherwise reviewed by us.
This document contains forward-looking statements. If and when included in this document, the words “expects”, “intends”, “anticipates”, “estimates” and analogous expressions and all statements that are not historical facts, including statements about our beliefs or expectations, are intended to identify forward-looking statements. Any forward-looking statements are made subject to risks and uncertainties which could cause actual results to differ materially from those stated. Those risks and uncertainties include, among other things, declines in general economic and business conditions, increased competition, changes in demographics, changes in political and social conditions, regulatory initiatives and changes in consumer preferences, many of which are beyond our control and the control of any other person or entity related to this offering. The forward-looking statements made in this document are made as of the date hereof. We have no obligation to update or revise any forward-looking statement.
BMO Capital Markets is a trade name used by BMO Financial Group for the wholesale banking businesses of Bank of Montreal, BMO Harris Bank N.A. (member FDIC), Bank of Montreal Europe p.l.c, and Bank of Montreal (China) Co. Ltd, the institutional broker dealer business of BMO Capital Markets Corp. (Member FINRA and SIPC) and the agency broker dealer business of Clearpool Execution Services, LLC (Member FINRA and SIPC) in the U.S., and the institutional broker dealer businesses of BMO Nesbitt Burns Inc. (Member Investment Industry Regulatory Organization of Canada and Member Canadian Investor Protection Fund) in Canada and Asia, Bank of Montreal Europe p.l.c. (authorized and regulated by the Central Bank of Ireland) in Europe and BMO Capital Markets Limited (authorized and regulated by the Financial Conduct Authority) in the UK and Australia.
Securities and investment banking activities in the United States are performed by Deutsche Bank Securities Inc., a member of NYSE, FINRA and SIPC, and its broker-dealer affiliates. Lending and other commercial banking activities in the United States are performed by Deutsche Bank AG and its banking affiliates.
| THE INFORMATION IN THIS STRUCTURAL AND COLLATERAL TERM SHEET IS NOT COMPLETE AND MAY BE AMENDED PRIOR TO THE TIME OF SALE. THIS TERM SHEET IS NOT AN OFFER TO SELL THESE SECURITIES AND IT IS NOT A SOLICITATION OF AN OFFER TO BUY THESE SECURITIES IN ANY JURISDICTION WHERE THE OFFER OR SALE IS NOT PERMITTED. |
| | 2 | |
| Dated October 18, 2024 | BMO 2024-C10 |
IMPORTANT NOTICE RELATING TO AUTOMATICALLY-GENERATED EMAIL DISCLAIMERS
Any legends, disclaimers or other notices that may appear at the bottom of any email communication to which this document is attached relating to (1) these materials not constituting an offer (or a solicitation of an offer), (2) no representation that these materials are accurate or complete and may not be updated or (3) these materials possibly being confidential, are not applicable to these materials and should be disregarded. Such legends, disclaimers or other notices have been automatically generated as a result of these materials having been sent via Bloomberg or another system.
THE CERTIFICATES REFERRED TO IN THESE MATERIALS ARE SUBJECT TO MODIFICATION OR REVISION (INCLUDING THE POSSIBILITY THAT ONE OR MORE CLASSES OF CERTIFICATES MAY BE SPLIT, COMBINED OR ELIMINATED AT ANY TIME PRIOR TO ISSUANCE OR AVAILABILITY OF A FINAL PROSPECTUS) AND ARE OFFERED ON A “WHEN, AS AND IF ISSUED” BASIS.
THE UNDERWRITERS MAY FROM TIME TO TIME PERFORM INVESTMENT BANKING SERVICES FOR, OR SOLICIT INVESTMENT BANKING BUSINESS FROM, ANY COMPANY NAMED IN THESE MATERIALS. THE UNDERWRITERS AND/OR THEIR AFFILIATES OR RESPECTIVE EMPLOYEES MAY FROM TIME TO TIME HAVE A LONG OR SHORT POSITION IN ANY CERTIFICATE OR CONTRACT DISCUSSED IN THESE MATERIALS.
| THE INFORMATION IN THIS STRUCTURAL AND COLLATERAL TERM SHEET IS NOT COMPLETE AND MAY BE AMENDED PRIOR TO THE TIME OF SALE. THIS TERM SHEET IS NOT AN OFFER TO SELL THESE SECURITIES AND IT IS NOT A SOLICITATION OF AN OFFER TO BUY THESE SECURITIES IN ANY JURISDICTION WHERE THE OFFER OR SALE IS NOT PERMITTED. |
| | 3 | |
| Structural and Collateral Term Sheet | | BMO 2024-C10 |
| Indicative Capital Structure |
| Offered Certificates | | | | | |
Classes of Certificates | Expected Ratings (Fitch/KBRA/Moody’s)(1) | Approximate Initial Certificate Balance or Notional Amount(2) | Approximate Initial Credit Support(3) | Initial
Pass-
Through Rate(4) | Pass-Through
Rate Description | Expected Weighted Avg. Life (yrs.)(5) | Expected Principal Window(5) |
| Class A-1 | AAAsf/AAA(sf)/Aaa(sf) | $1,337,000 | | 30.000% | % | (6) | 2.72 | 12/24-11/29 |
| Class A-3 | AAAsf/AAA(sf)/Aaa(sf) | $69,700,000 | | 30.000% | % | (6) | 7.09 | 05/31-05/32 |
| Class A-4 | AAAsf/AAA(sf)/Aaa(sf) | (7) | | 30.000% | % | (6) | (7) | (7) |
| Class A-5 | AAAsf/AAA(sf)/Aaa(sf) | (7) | | 30.000% | % | (6) | (7) | (7) |
| Class A-SB | AAAsf/AAA(sf)/Aaa(sf) | $2,221,000 | | 30.000% | % | (6) | 7.05 | 11/29-09/33 |
| Class X-A | AAAsf/AAA(sf)/Aaa(sf) | $506,781,000 | (8) | N/A | % | Variable IO(9) | N/A | N/A |
| Class X-B(11) | A-sf/AAA(sf)/NR | $135,745,000 | (8) | N/A | % | Variable IO(9) | N/A | N/A |
| Class A-S | AAAsf/AAA(sf)/Aa2(sf) | $66,968,000 | | 20.750% | % | (6) | 9.94 | 10/34-10/34 |
| Class B | AA-sf/AA(sf)/NR | $39,818,000 | | 15.250% | % | (6) | 10.00 | 10/34-11/34 |
| Class C(11) | A-sf/A-(sf)/NR | $28,959,000 | | 11.250% | % | (6) | 10.02 | 11/34-11/34 |
| Non-Offered Certificates(10) | | | | | |
Classes of Certificates | Expected Ratings (Fitch/KBRA/Moody’s)(1) | Approximate Initial Certificate Balance or Notional Amount(2) | Approximate Initial Credit Support(3) | Initial Pass-
Through Rate(4) | Pass-Through Rate Description | Expected Weighted Avg. Life (yrs.)(5) | Expected Principal Window(5) |
| Class X-D(11) | BBBsf/AAA(sf)/NR | $7,457,000(8) | | N/A | % | Variable IO(9) | N/A | N/A |
| Class D(11) | BBBsf/A-(sf)/NR | $7,457,000 | | 10.220% | % | (6) | 10.02 | 11/34-11/34 |
| Class E-RR(11) | BBB-sf/BBB(sf)/NR | $16,072,000 | | 8.000% | % | (6) | 10.02 | 11/34-11/34 |
| Class F-RR(11) | BB-sf/BB+(sf)/NR | $15,385,000 | | 5.875% | % | (6) | 10.02 | 11/34-11/34 |
| Class G-RR(11) | B-sf/BB-(sf)/NR | $10,859,000 | | 4.375% | % | (6) | 10.02 | 11/34-11/34 |
| Class J-RR(11) | NR/NR/NR | $31,674,555 | | 0.000% | % | (6) | 10.02 | 11/34-11/34 |
| Class R(12) | N/A | N/A | | N/A | N/A | N/A | N/A | N/A |
| | | | | | | |
| (1) | It is a condition of issuance that the offered certificates and certain classes of non-offered certificates receive the ratings set forth above. The anticipated ratings shown are those of Fitch Ratings, Inc. (“Fitch”), Kroll Bond Rating Agency, LLC (“KBRA”) and Moody’s Investors Service, Inc. (“Moody’s”), as indicated. Subject to the discussion under “Ratings” in the Preliminary Prospectus, the ratings on the certificates address the likelihood of the timely receipt by holders of all payments of interest to which they are entitled on each distribution date and, except in the case of the interest only certificates, the ultimate receipt by holders of all payments of principal to which they are entitled on or before the applicable rated final distribution date. Certain nationally recognized statistical rating organizations, as defined in Section 3(a)(62) of the Securities Exchange Act of 1934, as amended, that were not hired by the depositor may use information they receive pursuant to Rule 17g-5 under the Securities Exchange Act of 1934, as amended, or otherwise to rate the offered certificates. We cannot assure you as to what ratings a non-hired nationally recognized statistical rating organization would assign. See “Risk Factors—Other Risks Relating to the Certificates—Nationally Recognized Statistical Rating Organizations May Assign Different Ratings to the Offered Certificates; Ratings of the Offered Certificates Reflect Only the Views of the Applicable Rating Agencies as of the Dates Such Ratings Were Issued; Ratings May Affect ERISA Eligibility; Ratings May Be Downgraded” in the Preliminary Prospectus. Fitch, KBRA and Moody’s have informed us that the “sf” designation in the ratings represents an identifier of structured finance product ratings. For additional information about this identifier, prospective investors can go to the related rating agency’s website. The depositor and the underwriters have not verified, do not adopt and do not accept responsibility for any statements made by the rating agencies on those websites. Credit ratings referenced throughout this structural and collateral term sheet (this “Term Sheet”) are forward-looking opinions about credit risk and express a rating agency’s opinion about the willingness and ability of an issuer of securities to meet its financial obligations in full and on time. Ratings are not indications of investment merit and are not buy, sell or hold recommendations, a measure of asset value or an indication of the suitability of an investment. |
| (2) | Approximate, subject to a variance of plus or minus 5% and further subject to any additional variances described in the footnotes below. In addition, the notional amounts of the Class X-A, Class X-B and Class X-D certificates (collectively, the “Class X certificates”) may vary depending upon the final pricing of the respective classes of principal balance certificates (as defined in footnote (6) below) whose certificate balances comprise such notional amounts, and, if as a result of such pricing (a) the pass-through rate of any class of Class X certificates would be equal to zero at all times, such class of Class X certificates will not be issued on the closing date of this securitization or (b) the pass-through rate of any class of principal balance certificates whose certificate balance comprises such notional amount is at all times equal to the weighted average of the net interest rates on the mortgage loans (in each case, adjusted, if necessary, to accrue on the basis of a 360-day year consisting of twelve 30-day months) as in effect from time to time, the certificate balance of such class of principal balance certificates may not be part of, and there may be a corresponding reduction in, such notional amount of the related class of Class X certificates. |
| (3) | "Approximate Initial Credit Support" means, with respect to any class of principal balance certificates, the quotient, expressed as a percentage, of (i) the aggregate of the initial certificate balances of all classes of principal balance certificates, if any, junior to the subject class of principal balance certificates, divided by (ii) the aggregate of the initial certificate balances of all classes of principal balance certificates. The approximate initial credit support percentages set forth for the Class A-1, Class A-2, Class A-4, Class A-5 and Class A-SB certificates are represented in the aggregate. |
| (4) | Approximate per annum rate as of the closing date. |
| (5) | Determined assuming no prepayments prior to the maturity date or any anticipated repayment date, as applicable, for any mortgage loan and based on the modeling assumptions described under “Yield, Prepayment and Maturity Considerations” in the Preliminary Prospectus. |
| (6) | The pass-through rate for each class of the Class A-1, Class A-3, Class A-4, Class A-5, Class A-SB, Class A-S, Class B, Class C, Class D, Class E-RR, Class F-RR, Class G-RR and Class J-RR certificates (collectively, the “principal balance certificates”, and collectively with the Class X certificates and the Class R certificates, the “certificates”) will generally be equal to one of (i) a fixed per annum rate, (ii) the weighted average of the net interest rates on the mortgage loans (in each case, adjusted, if necessary, to accrue on the basis of a 360-day year consisting of twelve 30-day months) as in effect from time to time, (iii) a rate equal to the lesser of a specified per annum rate and the weighted average rate described in clause (ii), or (iv) the weighted average rate described in clause (ii) less a specified percentage, but no less than 0.000%. See “Description of the Certificates—Distributions—Pass-Through Rates” in the Preliminary Prospectus. |
| (7) | The exact initial certificate balances of the Class A-4 and Class A-5 certificates are unknown and will be determined based on the final pricing of those classes of certificates. However, the respective initial certificate balances, weighted average lives and principal windows of the Class A-4 and Class A-5 certificates are expected to be within the applicable ranges reflected in the following chart. The aggregate initial certificate balance of the Class A-4 and Class A-5 certificates is expected to be approximately $433,523,000 subject to a variance of plus or minus 5%. |
| THE INFORMATION IN THIS STRUCTURAL AND COLLATERAL TERM SHEET IS NOT COMPLETE AND MAY BE AMENDED PRIOR TO THE TIME OF SALE. THIS TERM SHEET IS NOT AN OFFER TO SELL THESE SECURITIES AND IT IS NOT A SOLICITATION OF AN OFFER TO BUY THESE SECURITIES IN ANY JURISDICTION WHERE THE OFFER OR SALE IS NOT PERMITTED. |
| | 4 | |
| Structural and Collateral Term Sheet | | BMO 2024-C10 |
| Indicative Capital Structure |
Class of Certificates | Expected Range of Initial Certificate Balances | Expected Range of Weighted Avg. Lives (Yrs) | Expected Range of Principal Windows |
| Class A-4 | $0 - $200,000,000 | N/A – 9.58 | N/A – 09/33-09/34 |
| Class A-5 | $233,523,000 - $433,523,000 | 9.91 – 9.76 | 09/34-10/34–09/33-10/34 |
| (8) | The Class X certificates will not have certificate balances and will not be entitled to receive distributions of principal. Interest will accrue on each class of Class X certificates at the related pass-through rate based upon the related notional amount. The notional amount of each class of the Class X certificates will be equal to the certificate balance or the aggregate of the certificate balances, as applicable, from time to time of the class or classes of principal balance certificates identified in the same row as such class of Class X certificates in the chart below (as to such class of Class X certificates, the “corresponding principal balance certificates”): |
| Class of Class X Certificates | Class(es) of Corresponding
Principal Balance Certificates |
| Class X-A | Class A-1, Class A-3, Class A-4, Class A-5 and Class A-SB |
| Class X-B | Class A-S, Class B and Class C |
| Class X-D | Class D |
| (9) | The pass-through rate for each class of Class X certificates will generally be a per annum rate equal to the excess, if any, of (i) the weighted average of the net interest rates on the mortgage loans (in each case, adjusted, if necessary, to accrue on the basis of a 360-day year consisting of twelve 30-day months) as in effect from time to time, over (ii) the pass-through rate (or, if applicable, the weighted average of the pass-through rates) of the class or classes of corresponding principal balance certificates as in effect from time to time, as described in the Preliminary Prospectus. |
| (10) | The classes of certificates set forth below “Non-Offered Certificates” in the table are not offered hereby. |
| (11) | In satisfaction of its risk retention obligations, 3650 Real Estate Investment Trust 2 LLC (as “retaining sponsor” with respect to this securitization transaction) is expected to acquire and retain (directly or through one or more of its “majority-owned affiliates”), in accordance with the credit risk retention rules applicable to this securitization transaction, all of the Class E-RR, Class F-RR, Class G-RR and Class J-RR certificates (collectively, the “HRR Certificates”), which will collectively constitute an “eligible horizontal residual interest” with an aggregate fair value expected to represent at least 5.0% of the fair value, as of the closing date for this transaction, of all of the “ABS interests” (i.e., all of the certificates (other than the Class R certificates)) issued by the issuing entity. The initial certificate balances of the Class C, Class D and Class E-RR certificates may be reallocated between those classes based on the determination of the respective aggregate fair values, as of the closing date for this transaction, of all of the certificates (other than the Class R certificates), in order to satisfy the foregoing; provided, that the initial certificate balance of the Class D certificates will be equal to at least 1.0% of the aggregate of the initial certificate balances of all of the principal balance certificates. Any such reallocation of the initial certificate balance of the Class D certificates would have a corresponding effect on the notional amount of the Class X-D certificates, and any such reallocation of the initial certificate balance of the Class C certificates would have a corresponding effect on the notional amount of the Class X-B certificates (with respect to the portion thereof that corresponds to the initial certificate balance of the Class C certificates). “Retaining sponsor”, “majority-owned affiliates”, “eligible horizontal residual interest” and “ABS interests” have the meanings given to such terms in Regulation RR. See “Credit Risk Retention” in the Preliminary Prospectus. |
| (12) | The Class R certificates will not have a certificate balance, notional amount, pass-through rate, rating or rated final distribution date. The Class R certificates will represent the residual interests in each of two separate REMICs, as further described in the Preliminary Prospectus. The Class R certificates will not be entitled to distributions of principal or interest. |
| THE INFORMATION IN THIS STRUCTURAL AND COLLATERAL TERM SHEET IS NOT COMPLETE AND MAY BE AMENDED PRIOR TO THE TIME OF SALE. THIS TERM SHEET IS NOT AN OFFER TO SELL THESE SECURITIES AND IT IS NOT A SOLICITATION OF AN OFFER TO BUY THESE SECURITIES IN ANY JURISDICTION WHERE THE OFFER OR SALE IS NOT PERMITTED. |
| | 5 | |
| Structural and Collateral Term Sheet | | BMO 2024-C10 |
| Summary of Transaction Terms |
| Publicly Offered Certificates: | $642,526,000 monthly pay, multi-class, commercial mortgage REMIC pass-through Certificates. |
| Co-Lead Managers and Joint Bookrunners: | BMO Capital Markets Corp., Citigroup Global Markets Inc., Deutsche Bank Securities Inc. and Goldman Sachs & Co. LLC |
| Co-Managers: | Academy Securities, Inc., Bancroft Capital, LLC and Drexel Hamilton, LLC |
| Mortgage Loan Sellers: | 3650 Real Estate Investment Trust 2 LLC (“3650 REIT”) (29.8%); Bank of Montreal (“BMO”) (24.5%); Citi Real Estate Funding Inc. (“CREFI”) (19.4%); Starwood Mortgage Capital LLC (“SMC”) (8.5%); German American Capital Corporation (“GACC”) (7.9%); Zions Bancorporation, N.A. (“ZBNA”) (7.1%); and Goldman Sachs Mortgage Company (“GSMC”) (2.8%). |
| Master Servicer: | KeyBank National Association |
| Special Servicer: | 3650 REIT Loan Servicing LLC |
| Directing Holder/Controlling Class Representative: | 3650 Real Estate Investment Trust 2 LLC or an affiliate |
| Trustee: | Wilmington Savings Fund Society, FSB |
| Certificate Administrator: | Citibank, N.A. |
| Operating Advisor: | Park Bridge Lender Services LLC |
| Asset Representations Reviewer: | Park Bridge Lender Services LLC |
| Rating Agencies: | Fitch Ratings, Inc. (“Fitch”), Kroll Bond Rating Agency, LLC (“KBRA”) and Moody’s Investors Service, Inc. (“Moody’s”). |
| U.S. Credit Risk Retention: | For a discussion on the manner in which 3650 Real Estate Investment Trust 2 LLC, as retaining sponsor, intends to satisfy the U.S. credit risk retention requirements, see “Credit Risk Retention” in the Preliminary Prospectus. |
| EU Credit Risk Retention: | The transaction is not structured to satisfy the EU risk retention and due diligence requirements. |
| Closing Date: | On or about November 7, 2024. |
| Cut-off Date: | With respect to each mortgage loan, the related due date in November 2024, or in the case of any mortgage loan that has its first due date after November 2024, the date that would have been its due date in November 2024 under the terms of that mortgage loan if a monthly debt service payment were scheduled to be due in that month. |
| Distribution Date: | The 4th business day after the Determination Date in each month, commencing in December 2024. |
| Determination Date: | 11th day of each month, or if the 11th day is not a business day, the next succeeding business day, commencing in December 2024. |
| Assumed Final Distribution Date: | The Distribution Date in November 2034 which is the latest anticipated repayment date of the Certificates. |
| Rated Final Distribution Date: | The Distribution Date in November 2057. |
| Tax Treatment: | The Publicly Offered Certificates are expected to be treated as REMIC “regular interests” for U.S. federal income tax purposes. |
| Form of Offering: | The Class A-1, Class A-3, Class A-4, Class A-5, Class A-SB, Class X-A, Class X-B, Class A-S, Class B and Class C certificates (the “Publicly Offered Certificates”) will be offered publicly. The Class X-D, Class D, Class E-RR, Class F-RR, Class G-RR, Class J-RR and Class R certificates (the “Privately Offered Certificates”) will be offered domestically to Qualified Institutional Buyers and to Institutional Accredited Investors (other than the Class R certificates) and to institutions that are not U.S. Persons pursuant to Regulation S (other than the Class R certificates). |
| SMMEA Status: | The Publicly Offered Certificates will not constitute “mortgage related securities” for purposes of SMMEA. |
| ERISA: | The Publicly Offered Certificates are expected to be ERISA eligible. |
| Optional Termination: | On any Distribution Date on which the aggregate principal balance of the pool of mortgage loans is less than 1% of the aggregate principal balance of the mortgage loans as of the cut-off date, certain entities specified in the Preliminary Prospectus will have the option to purchase all of the remaining mortgage loans (and all property acquired through exercise of remedies in respect of any mortgage loan) at the price specified in the Preliminary Prospectus. Refer to “Pooling and Servicing Agreement—Termination; Retirement of Certificates” and “—Optional Termination; Optional Mortgage Loan Purchase” in the Preliminary Prospectus. |
| Minimum Denominations: | The Publicly Offered Certificates (other than the Class X-A and Class X-B Certificates) will be issued in minimum denominations of $10,000 and integral multiples of $1 in excess of $10,000. The Class X-A and Class X-B certificates will be issued in minimum denominations of $1,000,000 and in integral multiples of $1 in excess of $1,000,000. |
| Settlement Terms: | DTC, Euroclear and Clearstream Banking. |
| Analytics: | The transaction is expected to be modeled by Bloomberg, L.P., Trepp, LLC, Intex Solutions, Inc., BlackRock Financial Management, Inc., CMBS.com, Inc., Moody’s Analytics, Markit Group Limited, RealINSIGHT, Thompson Reuters Corporation, Intercontinental Exchange | ICE Data Services, KBRA Analytics, LLC, DealView Technologies Ltd., Recursion Co and CRED iQ. |
| THE INFORMATION IN THIS STRUCTURAL AND COLLATERAL TERM SHEET IS NOT COMPLETE AND MAY BE AMENDED PRIOR TO THE TIME OF SALE. THIS TERM SHEET IS NOT AN OFFER TO SELL THESE SECURITIES AND IT IS NOT A SOLICITATION OF AN OFFER TO BUY THESE SECURITIES IN ANY JURISDICTION WHERE THE OFFER OR SALE IS NOT PERMITTED. |
| | 6 | |
| Structural and Collateral Term Sheet | | BMO 2024-C10 |
| Summary of Transaction Terms |
| Risk Factors: | THE CERTIFICATES INVOLVE CERTAIN RISKS AND MAY NOT BE SUITABLE FOR ALL INVESTORS. REFER TO THE “SUMMARY OF RISK FACTORS” AND “RISK FACTORS” SECTIONS OF THE PRELIMINARY PROSPECTUS. |
| THE INFORMATION IN THIS STRUCTURAL AND COLLATERAL TERM SHEET IS NOT COMPLETE AND MAY BE AMENDED PRIOR TO THE TIME OF SALE. THIS TERM SHEET IS NOT AN OFFER TO SELL THESE SECURITIES AND IT IS NOT A SOLICITATION OF AN OFFER TO BUY THESE SECURITIES IN ANY JURISDICTION WHERE THE OFFER OR SALE IS NOT PERMITTED. |
| | 7 | |
| Structural and Collateral Term Sheet | | BMO 2024-C10 |
| Collateral Characteristics |
Mortgage Loan Seller | Number of Mortgage Loans | Number of Mortgaged Properties | Aggregate
Cut-off Date Balance | | Roll-up Aggregate Cut-off Date Balance | Roll-up Aggregate % of Cut-off Date Balance |
| 3650 REIT | 9 | 9 | $215,975,000 | 29.8% | $215,975,000 | 29.8% |
| BMO | 6 | 11 | $177,596,461 | 24.5% | $177,596,461 | 24.5% |
| CREFI | 4 | 36 | $140,268,000 | 19.4% | $140,268,000 | 19.4% |
| SMC | 4 | 4 | $61,449,095 | 8.5% | $61,449,095 | 8.5% |
| GACC | 1 | 1 | $17,000,000 | 2.3% | $57,000,000 | 7.9% |
| ZBNA | 3 | 3 | $51,685,000 | 7.1% | $51,685,000 | 7.1% |
| GSMC | - | - | - | - | $20,000,000 | 2.8% |
| GACC, GSMC | 1 | 1 | $60,000,000 | 8.3% | - | - |
| Total: | 28 | 65 | $723,973,556 | 100.0% | $723,973,556 | 100.0% |
| Loan Pool | |
| | Initial Pool Balance (“IPB”): | $723,973,556 |
| | Number of Mortgage Loans: | 28 |
| | Number of Mortgaged Properties: | 65 |
| | Average Cut-off Date Balance per Mortgage Loan: | $25,856,198 |
| | Weighted Average Current Mortgage Rate: | 6.11205% |
| | 10 Largest Mortgage Loans as % of IPB: | 60.3% |
| | Weighted Average Remaining Term to Maturity: | 115 months |
| | Weighted Average Seasoning: | 5 months |
| | | |
| Credit Statistics | |
| | Weighted Average UW NCF DSCR(1)(2): | 2.02x |
| | Weighted Average UW NOI Debt Yield(1)(3): | 12.8% |
| | Weighted Average Cut-off Date Loan-to-Value Ratio (“LTV”)(1)(3)(4): | 55.4% |
| | Weighted Average Maturity Date/ARD LTV(1)(3)(4): | 55.1% |
| | | |
| Other Statistics | |
| | % of Mortgage Loans with Additional Debt: | 5.5% |
| | % of Mortgage Loans with Single Tenants(5): | 28.4% |
| | % of Mortgage Loans secured by Multiple Properties: | 18.6% |
| | |
| Amortization | |
| | Weighted Average Original Amortization Term(6): | 345 months |
| | Weighted Average Remaining Amortization Term(6): | 345 months |
| | % of Mortgage Loans with Interest-Only: | 94.9% |
| | % of Mortgage Loans with Amortizing Balloon: | 2.6% |
| | % of Mortgage Loans with Partial Interest-Only followed by Amortizing Balloon: | 2.5% |
| | | |
| Lockboxes(7) | |
| | % of Mortgage Loans with Hard Lockboxes: | 69.6% |
| | % of Mortgage Loans with Springing Lockboxes: | 24.1% |
| | % of Mortgage Loans with Soft Lockbox: | 3.5% |
| | % of Mortgage Loans with Soft (Residential); Hard (Commercial) Lockbox: | 2.9% |
| | | |
| Reserves | |
| | % of Mortgage Loans Requiring Monthly Tax Reserves: | 41.1% |
| | % of Mortgage Loans Requiring Monthly Insurance Reserves: | 16.2% |
| | % of Mortgage Loans Requiring Monthly CapEx Reserves: | 28.8% |
| | % of Mortgage Loans Requiring Monthly TI/LC Reserves(8): | 19.6% |
(See footnotes on following page)
| THE INFORMATION IN THIS STRUCTURAL AND COLLATERAL TERM SHEET IS NOT COMPLETE AND MAY BE AMENDED PRIOR TO THE TIME OF SALE. THIS TERM SHEET IS NOT AN OFFER TO SELL THESE SECURITIES AND IT IS NOT A SOLICITATION OF AN OFFER TO BUY THESE SECURITIES IN ANY JURISDICTION WHERE THE OFFER OR SALE IS NOT PERMITTED. |
| | 8 | |
| Structural and Collateral Term Sheet | | BMO 2024-C10 |
| Collateral Characteristics |
| (1) | In the case of Loan Nos. 1, 2, 3, 8, 14, 17, 19, 20, 21 and 24, the UW NCF DSCR, UW NOI Debt Yield, Cut-off Date LTV and Maturity Date/ARD LTV calculations include the related Pari Passu Companion Loan(s). In the case of Loan No. 6, the UW NCF DSCR, UW NOI Debt Yield, Cut-off Date LTV and Maturity Date/ARD LTV calculations exclude the related mezzanine loan. |
| (2) | For the mortgage loans that are interest-only for the entire term and accrue interest on an Actual/360 basis, the Monthly Debt Service Amount ($) was calculated as 1/12th of the product of (i) the Original Balance ($), (ii) the Interest Rate % and (iii) 365/360. |
| (3) | In the case of Loan No. 9, the Cut-off Date LTV, Maturity Date/ARD LTV and UW NOI Debt Yield are based on Cut-off Date Principal Balance after netting out a $2,500,000 holdback reserve. The Cut-off Date LTV, Maturity Date/ARD LTV and UW NOI Debt Yield based on Cut-off Date Principal Balance without netting out the holdback reserve are 64.9%, 64.9% and 9.5%, respectively. |
| (4) | In the case of Loan No. 5, the Cut-off Date LTV and Maturity Date/ARD LTV are calculated by using an appraised value based on an “as portfolio” assumption. In the case of Loan No. 25, the Cut-off Date LTV and Maturity Date/ARD LTV are calculated by using an appraised value based on an “hypothetical as if complete today” assumption. Refer to the definition of “Appraised Value” under “Description of the Mortgage Pool—Certain Calculations and Definitions” in the Preliminary Prospectus for additional details. |
| (5) | Excludes mortgage loans that are secured by multiple properties leased to separate single tenants. |
| (6) | Excludes 24 mortgage loans that are interest-only for the entire term or until the anticipated repayment date. |
| (7) | For a more detailed description of lockboxes, refer to “Description of the Mortgage Pool—Certain Calculations and Definitions” and “—Certain Terms of the Mortgage Loans—Mortgaged Property Accounts” in the Preliminary Prospectus. |
| (8) | Calculated only with respect to the Cut-off Date Balance of mortgage loans secured or partially secured by office, industrial, retail, multifamily (with commercial tenants) and mixed use properties. |
| THE INFORMATION IN THIS STRUCTURAL AND COLLATERAL TERM SHEET IS NOT COMPLETE AND MAY BE AMENDED PRIOR TO THE TIME OF SALE. THIS TERM SHEET IS NOT AN OFFER TO SELL THESE SECURITIES AND IT IS NOT A SOLICITATION OF AN OFFER TO BUY THESE SECURITIES IN ANY JURISDICTION WHERE THE OFFER OR SALE IS NOT PERMITTED. |
| | 9 | |
| Structural and Collateral Term Sheet | | BMO 2024-C10 |
| Collateral Characteristics |
| Ten Largest Mortgage Loans |
| No. | Loan Name | City, State | Mortgage Loan Seller | No.
of Prop. | Cut-off Date Balance | % of IPB | Square Feet / Rooms / Units | Property Type | UW
NCF DSCR(1)(2) | UW NOI Debt Yield(1)(3) | Cut-off Date LTV(1)(3)(4) | Maturity Date/ARD LTV(1)(3)(4) |
| 1 | Newport Centre | Jersey City, NJ | GACC, GSMC | 1 | $60,000,000 | 8.3% | 966,186 | Retail | 2.66x | 15.3% | 43.0% | 43.0% |
| 2 | The Mall of Victor Valley | Victorville, CA | BMO | 1 | $60,000,000 | 8.3% | 479,261 | Retail | 2.10x | 15.0% | 59.4% | 59.4% |
| 3 | Poindexter Industrial Portfolio | Various, Various | CREFI | 31 | $54,070,000 | 7.5% | 4,526,168 | Industrial | 2.62x | 15.0% | 39.9% | 39.9% |
| 4 | White Oak Village | Richmond, VA | ZBNA | 1 | $44,450,000 | 6.1% | 397,605 | Retail | 1.95x | 12.6% | 52.3% | 52.3% |
| 5 | Douglas Dynamics | Various, Various | BMO | 6 | $42,097,500 | 5.8% | 791,583 | Industrial | 1.80x | 11.6% | 62.9% | 62.9% |
| 6 | South Carolina Industrial | Union, SC | 3650 REIT | 1 | $40,000,000 | 5.5% | 135,939 | Industrial | 1.82x | 13.7% | 52.2% | 52.2% |
| 7 | Sterling Portfolio | Various, Various | CREFI | 3 | $38,760,000 | 5.4% | 991,022 | Industrial | 1.68x | 11.5% | 64.1% | 64.1% |
| 8 | Creekside Town Center | Roseville, CA | 3650 REIT | 1 | $36,525,000 | 5.0% | 360,891 | Retail | 1.52x | 11.3% | 56.9% | 56.9% |
| 9 | Diamond Ridge Apartments | Houston, TX | SMC | 1 | $31,000,000 | 4.3% | 500 | Multifamily | 1.25x | 10.4% | 59.6% | 59.6% |
| 10 | Bradley Fair | Wichita, KS | 3650 REIT | 1 | $30,000,000 | 4.1% | 1,434,847 | Other | 1.04x | 6.7% | 75.0% | 75.0% |
| | | | | | | | | | | | | |
| | Top 3 Total/Weighted Average | | 33 | $174,070,000 | 24.0% | | | 2.45x | 15.1% | 47.7% | 47.7% |
| | Top 5 Total/Weighted Average | | 40 | $260,617,500 | 36.0% | | | 2.26x | 14.1% | 50.9% | 50.9% |
| | Top 10 Total/Weighted Average | | 47 | $436,902,500 | 60.3% | | | 1.95x | 12.8% | 55.0% | 55.0% |
| | Non-Top 10 Total/Weighted Average | | 18 | $287,071,056 | 39.7% | | | 2.11x | 12.8% | 56.1% | 55.3% |
| (1) | In the case of Loan Nos. 1, 2, 3, 8, 14, 17, 19, 20, 21 and 24, the UW NCF DSCR, UW NOI Debt Yield, Cut-off Date LTV and Maturity Date/ARD LTV calculations include the related Pari Passu Companion Loan(s). In the case of Loan No. 6, the UW NCF DSCR, UW NOI Debt Yield, Cut-off Date LTV and Maturity Date/ARD LTV calculations exclude the related mezzanine loan. |
| (2) | For the mortgage loans that are interest-only for the entire term and accrue interest on an Actual/360 basis, the Monthly Debt Service Amount ($) was calculated as 1/12th of the product of (i) the Original Balance ($), (ii) the Interest Rate % and (iii) 365/360. |
| (3) | In the case of Loan No. 9, the Cut-off Date LTV, Maturity Date/ARD LTV and UW NOI Debt Yield are based on Cut-off Date Principal Balance after netting out a $2,500,000 holdback reserve. The Cut-off Date LTV, Maturity Date/ARD LTV and UW NOI Debt Yield based on Cut-off Date Principal Balance without netting out the holdback reserve are 64.9%, 64.9% and 9.5%, respectively. |
| (4) | In the case of Loan No. 5, the Cut-off Date LTV and Maturity Date/ARD LTV are calculated by using an appraised value based on an “as portfolio” assumption. In the case of Loan No. 25, the Cut-off Date LTV and Maturity Date/ARD LTV are calculated by using an appraised value based on an “hypothetical as if complete today” assumption. Refer to the definition of “Appraised Value” under “Description of the Mortgage Pool—Certain Calculations and Definitions” in the Preliminary Prospectus for additional details. |
| THE INFORMATION IN THIS STRUCTURAL AND COLLATERAL TERM SHEET IS NOT COMPLETE AND MAY BE AMENDED PRIOR TO THE TIME OF SALE. THIS TERM SHEET IS NOT AN OFFER TO SELL THESE SECURITIES AND IT IS NOT A SOLICITATION OF AN OFFER TO BUY THESE SECURITIES IN ANY JURISDICTION WHERE THE OFFER OR SALE IS NOT PERMITTED. |
| | 10 | |
| Structural and Collateral Term Sheet | | BMO 2024-C10 |
| Collateral Characteristics |
| Pari Passu Companion Loan Summary |
No. | Loan Name | | Trust Cut-off Date Balance | Aggregate Pari Passu Companion Loan Cut-off Date Balance | Controlling Pooling/Trust & Servicing Agreement | Master Servicer | Special Servicer | Related Pari Passu Loan(s) Securitizations | Related Pari Passu Companion Loan(s) Original Balance |
| 1 | Newport Centre | GACC, GSMC | $60,000,000 | $128,000,000 | BANK 2024-BNK48(1) | Wells Fargo(1) | LNR Partners(1) | BANK 2024-BNK48 Future Securitization(s) | $20,000,000 $108,000,000 |
| 2 | The Mall of Victor Valley | BMO | $60,000,000 | $25,000,000 | BMO 2024-C10 | KeyBank | 3650 REIT | Future Securitization(s) | $25,000,000 |
| 3 | Poindexter Industrial Portfolio | CREFI | $54,070,000 | $85,000,000 | BANK 2024-BNK48 | Wells Fargo | LNR Partners | BANK 2024-BNK48 | $85,000,000 |
| 8 | Creekside Town Center | 3650 REIT | $36,525,000 | $35,000,000 | BMO 2024-C10 | KeyBank | 3650 REIT | BMO 2023-C7 BBCMS 2024-C24 | $24,000,000 $11,000,000 |
| 14 | La Habra Marketplace | 3650 REIT | $25,000,000 | $70,000,000 | BBCMS 2023-C21 | Midland | 3650 REIT | BMO 2023-C3 BMO 2023-C5 BBCMS 2023-C21 | $20,000,000 $15,000,000 $35,000,000 |
| 17 | 500 Delaware | 3650 REIT | $20,000,000 | $65,000,000 | 3650R 2022-PF2 | Midland | 3650 REIT | 3650R 2022-PF2 BBCMS 2023-C21 BMARK 2024-V9 Future Securitization(s) | $20,000,000 $15,000,000 $5,000,000 $25,000,000 |
| 19 | Arizona Grand Resort and Spa | GACC | $17,000,000 | $108,000,000 | BBCMS 2024-C28 | Wells Fargo | LNR Partners | BBCMS 2024-C28 Future Securitization(s) | $70,000,000 $38,000,000 |
| 20 | Centene | 3650 REIT | $15,600,000 | $31,200,000 | 3650R 2021-PF1 | Midland | 3650 REIT | 3650R 2021-PF1 BBCMS 2023-C21 | $15,600,000 $15,600,000 |
| 21 | Grapevine Mills | BMO | $15,500,000 | $234,500,000 | WFCM 2024-C63 | Wells Fargo | Argentic | BMO 2024-C9 WFCM 2024-C63 BANK 2024-BNK48 | $94,000,000 $60,000,000 $80,500,000 |
| 24 | 1516 Motor Parkway | 3650 REIT | $9,100,000 | $9,100,000 | BBCMS 2023-C21 | Midland | 3650 REIT | BBCMS 2023-C21 | $9,100,000 |
| (1) | In the case of Loan No. 1, until the securitization of the related controlling pari passu companion loan, the related whole loan will be serviced and administered pursuant to the pooling and servicing agreement for the BANK 2024-BNK48 securitization transaction by the parties thereto. Upon the securitization of the related controlling pari-passu companion loan, servicing of the related whole loan will shift to the servicers under the servicing agreement with respect to such future securitization transaction, which servicing agreement will become the Controlling Pooling/Trust & Servicing Agreement. |
| THE INFORMATION IN THIS STRUCTURAL AND COLLATERAL TERM SHEET IS NOT COMPLETE AND MAY BE AMENDED PRIOR TO THE TIME OF SALE. THIS TERM SHEET IS NOT AN OFFER TO SELL THESE SECURITIES AND IT IS NOT A SOLICITATION OF AN OFFER TO BUY THESE SECURITIES IN ANY JURISDICTION WHERE THE OFFER OR SALE IS NOT PERMITTED. |
| | 11 | |
| Structural and Collateral Term Sheet | | BMO 2024-C10 |
| Collateral Characteristics |
No. | Loan Name | Trust
Cut-off Date Balance | Pari Passu Companion Loan(s) Cut-off Date Balance | Subordinate Debt Cut-off Date Balance(1) | Total Debt Cut-off Date Balance | Mortgage Loan UW NCF DSCR(2) | Total Debt UW NCF DSCR(3) | Mortgage Loan
Cut-off Date LTV(2) | Total Debt Cut-off Date LTV | Mortgage Loan UW NOI Debt Yield(2) | Total Debt UW NOI Debt Yield |
| 6 | South Carolina Industrial | $40,000,000 | NAP | $10,000,000 | $50,000,000 | 1.82x | 1.12x | 52.2% | 65.3% | 13.7% | 11.0% |
| (1) | In the case of Loan No. 6, subordinate debt represents one subordinate mezzanine loan. |
| (2) | Mortgage Loan UW NCF DSCR, Mortgage Loan Cut-off Date LTV and Mortgage Loan UW NOI Debt Yield calculations include any related Pari Passu Companion Loans (if applicable), but exclude the related mezzanine loan. |
| (3) | In the case of Loan No. 6, the related mezzanine loan accrues interest at a rate of (i) 14.000% per annum from the origination date through and including December 4, 2029, and (ii) 15.000% per annum from December 5, 2029 through the end of the term, to be paid as part of each monthly debt service payment amount. |
| THE INFORMATION IN THIS STRUCTURAL AND COLLATERAL TERM SHEET IS NOT COMPLETE AND MAY BE AMENDED PRIOR TO THE TIME OF SALE. THIS TERM SHEET IS NOT AN OFFER TO SELL THESE SECURITIES AND IT IS NOT A SOLICITATION OF AN OFFER TO BUY THESE SECURITIES IN ANY JURISDICTION WHERE THE OFFER OR SALE IS NOT PERMITTED. |
| | 12 | |
| Structural and Collateral Term Sheet | | BMO 2024-C10 |
| Collateral Characteristics |
| Mortgaged Properties by Type(1) |
| | | | | | Weighted Average |
| Property Type | Property Subtype | Number of Properties | Cut-off Date
Principal
Balance | % of IPB | UW
NCF DSCR(2)(3) | UW
NOI Debt Yield(2)(4) | Cut-off Date LTV(2)(4)(5) | Maturity Date/ARD LTV(2)(4)(5) |
| Retail | Super Regional Mall | 3 | $135,500,000 | 18.7% | 2.41x | 15.5% | 50.6% | 50.6% |
| | Anchored | 4 | 135,135,000 | 18.7 | 1.96x | 11.8% | 56.8% | 56.8% |
| | Single Tenant | 1 | 11,750,000 | 1.6 | 1.90x | 12.3% | 50.0% | 50.0% |
| | Subtotal: | 8 | $282,385,000 | 39.0% | 2.17x | 13.6% | 53.5% | 53.5% |
| Industrial | Manufacturing / Warehouse | 16 | $57,889,165 | 8.0% | 2.02x | 12.8% | 55.3% | 55.3% |
| | Manufacturing | 11 | 41,160,007 | 5.7 | 2.20x | 13.3% | 51.7% | 51.7% |
| | Warehouse | 6 | 40,060,711 | 5.5 | 1.87x | 12.1% | 47.2% | 47.2% |
| | R&D / Manufacturing | 1 | 40,000,000 | 5.5 | 1.82x | 13.7% | 52.2% | 52.2% |
| | Warehouse / Distribution | 4 | 30,128,387 | 4.2 | 1.99x | 12.2% | 59.7% | 57.6% |
| | Manufacturing / Distribution | 1 | 11,945,345 | 1.6 | 1.80x | 11.6% | 62.9% | 62.9% |
| | Manufacturing / Vehicle Storage | 4 | 10,147,602 | 1.4 | 2.62x | 15.0% | 39.9% | 39.9% |
| | R&D / Flex | 1 | 3,400,000 | 0.5 | 1.74x | 12.0% | 49.7% | 49.7% |
| | Vehicle Storage | 1 | 684,283 | 0.1 | 2.62x | 15.0% | 39.9% | 39.9% |
| | Subtotal: | 45 | $235,415,500 | 32.5% | 2.00x | 12.9% | 52.9% | 52.6% |
| Multifamily | Garden | 2 | $51,750,000 | 7.1% | 1.29x | 10.3% | 61.1% | 61.1% |
| | Mid Rise | 2 | 24,835,000 | 3.4 | 1.25x | 8.0% | 66.8% | 66.8% |
| | Subtotal: | 4 | $76,585,000 | 10.6% | 1.28x | 9.5% | 62.9% | 62.9% |
| Office | Suburban | 2 | $24,888,961 | 3.4% | 2.29x | 12.1% | 59.5% | 54.7% |
| | CBD | 1 | 20,000,000 | 2.8 | 2.02x | 10.1% | 67.6% | 67.6% |
| | Subtotal: | 3 | $44,888,961 | 6.2% | 2.17x | 11.2% | 63.1% | 60.5% |
| Other | Leased Fee | 1 | $30,000,000 | 4.1% | 1.04x | 6.7% | 75.0% | 75.0% |
| Mixed Use | Office / Retail | 1 | $28,000,000 | 3.9% | 2.23x | 13.3% | 54.2% | 54.2% |
| Hospitality | Full Service | 1 | $17,000,000 | 2.3% | 3.76x | 24.2% | 39.2% | 39.2% |
| | Limited Service | 1 | 8,500,000 | 1.2 | 1.70x | 16.2% | 54.8% | 48.5% |
| | Subtotal: | 2 | $25,500,000 | 3.5% | 3.07x | 21.5% | 44.4% | 42.3% |
| Self Storage | Self Storage | 1 | $1,199,095 | 0.2% | 5.54x | 41.4% | 13.1% | 11.2% |
| Total / Weighted Average: | 65 | $723,973,556 | 100.0% | 2.02x | 12.8% | 55.4% | 55.1% |
| (1) | Because this table presents information relating to the mortgaged properties and not mortgage loans, the information for mortgage loans secured by more than one mortgaged property is based on allocated loan amounts, individual appraised values, net cash flow or net operating income with respect to such individual mortgaged properties, as applicable. |
| (2) | In the case of Loan Nos. 1, 2, 3, 8, 14, 17, 19, 20, 21 and 24, the UW NCF DSCR, UW NOI Debt Yield, Cut-off Date LTV and Maturity Date/ARD LTV calculations include the related Pari Passu Companion Loan(s). In the case of Loan No. 6, the UW NCF DSCR, UW NOI Debt Yield, Cut-off Date LTV and Maturity Date/ARD LTV calculations exclude the related mezzanine loan. |
| (3) | For the mortgage loans that are interest-only for the entire term and accrue interest on an Actual/360 basis, the Monthly Debt Service Amount ($) was calculated as 1/12th of the product of (i) the Original Balance ($), (ii) the Interest Rate % and (iii) 365/360. |
| (4) | In the case of Loan No. 9, the Cut-off Date LTV, Maturity Date/ARD LTV and UW NOI Debt Yield are based on Cut-off Date Principal Balance after netting out a $2,500,000 holdback reserve. The Cut-off Date LTV, Maturity Date/ARD LTV and UW NOI Debt Yield based on Cut-off Date Principal Balance without netting out the holdback reserve are 64.9%, 64.9% and 9.5%, respectively. |
| (5) | In the case of Loan No. 5, the Cut-off Date LTV and Maturity Date/ARD LTV are calculated by using an appraised value based on an “as portfolio” assumption. In the case of Loan No. 25, the Cut-off Date LTV and Maturity Date/ARD LTV are calculated by using an appraised value based on an “hypothetical as if complete today” assumption. Refer to the definition of “Appraised Value” under “Description of the Mortgage Pool—Certain Calculations and Definitions” in the Preliminary Prospectus for additional details. |
| THE INFORMATION IN THIS STRUCTURAL AND COLLATERAL TERM SHEET IS NOT COMPLETE AND MAY BE AMENDED PRIOR TO THE TIME OF SALE. THIS TERM SHEET IS NOT AN OFFER TO SELL THESE SECURITIES AND IT IS NOT A SOLICITATION OF AN OFFER TO BUY THESE SECURITIES IN ANY JURISDICTION WHERE THE OFFER OR SALE IS NOT PERMITTED. |
| | 13 | |
| Structural and Collateral Term Sheet | | BMO 2024-C10 |
| Collateral Characteristics |
| Mortgaged Properties by Location(1) |
| | | | | Weighted Average |
State | Number of Properties | Cut-off Date Principal Balance | % of IPB | UW
NCF DSCR(2)(3) | UW
NOI Debt Yield(2)(4) | Cut-off Date LTV(2)(4)(5) | Maturity Date/ARD LTV(2)(4)(5) |
| Texas | 9 | $131,419,744 | 18.2% | 1.72x | 12.3% | 54.0% | 53.5% |
| California | 6 | 125,507,881 | 17.3 | 2.02x | 13.0% | 58.3% | 58.3% |
| Virginia | 3 | 80,452,827 | 11.1 | 2.09x | 13.2% | 53.7% | 53.7% |
| New Jersey | 2 | 71,750,000 | 9.9 | 2.54x | 14.8% | 44.1% | 44.1% |
| New York | 4 | 61,935,000 | 8.6 | 1.86x | 10.5% | 61.2% | 61.2% |
| South Carolina | 1 | 40,000,000 | 5.5 | 1.82x | 13.7% | 52.2% | 52.2% |
| Illinois | 4 | 38,705,295 | 5.3 | 1.69x | 12.5% | 62.0% | 60.6% |
| Kansas | 1 | 30,000,000 | 4.1 | 1.04x | 6.7% | 75.0% | 75.0% |
| Delaware | 1 | 20,000,000 | 2.8 | 2.02x | 10.1% | 67.6% | 67.6% |
| Florida | 3 | 18,632,617 | 2.6 | 2.49x | 9.9% | 56.3% | 56.3% |
| Arizona | 2 | 18,244,150 | 2.5 | 3.68x | 23.6% | 39.2% | 39.2% |
| Wisconsin | 3 | 17,420,427 | 2.4 | 1.89x | 12.0% | 60.3% | 60.3% |
| Ohio | 2 | 11,407,905 | 1.6 | 2.11x | 17.0% | 55.9% | 45.4% |
| Michigan | 3 | 11,020,303 | 1.5 | 2.06x | 12.7% | 55.5% | 55.5% |
| Maine | 1 | 10,041,967 | 1.4 | 1.80x | 11.6% | 62.9% | 62.9% |
| Pennsylvania | 4 | 8,320,256 | 1.1 | 2.62x | 15.0% | 39.9% | 39.9% |
| Iowa | 1 | 6,891,546 | 1.0 | 1.80x | 11.6% | 62.9% | 62.9% |
| Tennessee | 2 | 4,506,157 | 0.6 | 2.62x | 15.0% | 39.9% | 39.9% |
| Quebec | 1 | 4,276,767 | 0.6 | 2.62x | 15.0% | 39.9% | 39.9% |
| Utah | 2 | 4,179,568 | 0.6 | 2.62x | 15.0% | 39.9% | 39.9% |
| Georgia | 2 | 2,647,708 | 0.4 | 2.62x | 15.0% | 39.9% | 39.9% |
| Idaho | 1 | 1,419,109 | 0.2 | 2.62x | 15.0% | 39.9% | 39.9% |
| Maryland | 1 | 1,244,150 | 0.2 | 2.62x | 15.0% | 39.9% | 39.9% |
| Oklahoma | 1 | 1,088,632 | 0.2 | 2.62x | 15.0% | 39.9% | 39.9% |
| Alabama | 1 | 923,393 | 0.1 | 2.62x | 15.0% | 39.9% | 39.9% |
| Kentucky | 1 | 684,283 | 0.1 | 2.62x | 15.0% | 39.9% | 39.9% |
| Washington | 1 | 631,795 | 0.1 | 2.62x | 15.0% | 39.9% | 39.9% |
| Indiana | 2 | 622,075 | 0.1 | 2.62x | 15.0% | 39.9% | 39.9% |
| Total / Weighted Average: | 65 | $723,973,556 | 100.0% | 2.02x | 12.8% | 55.4% | 55.1% |
| (1) | Because this table presents information relating to the mortgaged properties and not mortgage loans, the information for mortgage loans secured by more than one mortgaged property is based on allocated loan amounts, individual appraised values, net cash flow or net operating income with respect to such individual mortgaged properties, as applicable. |
| (2) | In the case of Loan Nos. 1, 2, 3, 8, 14, 17, 19, 20, 21 and 24, the UW NCF DSCR, UW NOI Debt Yield, Cut-off Date LTV and Maturity Date/ARD LTV calculations include the related Pari Passu Companion Loan(s). In the case of Loan No. 6, the UW NCF DSCR, UW NOI Debt Yield, Cut-off Date LTV and Maturity Date/ARD LTV calculations exclude the related mezzanine loan. |
| (3) | For the mortgage loans that are interest-only for the entire term and accrue interest on an Actual/360 basis, the Monthly Debt Service Amount ($) was calculated as 1/12th of the product of (i) the Original Balance ($), (ii) the Interest Rate % and (iii) 365/360. |
| (4) | In the case of Loan No. 9, the Cut-off Date LTV, Maturity Date/ARD LTV and UW NOI Debt Yield are based on Cut-off Date Principal Balance after netting out a $2,500,000 holdback reserve. The Cut-off Date LTV, Maturity Date/ARD LTV and UW NOI Debt Yield based on Cut-off Date Principal Balance without netting out the holdback reserve are 64.9%, 64.9% and 9.5%, respectively. |
| (5) | In the case of Loan No. 5, the Cut-off Date LTV and Maturity Date/ARD LTV are calculated by using an appraised value based on an “as portfolio” assumption. In the case of Loan No. 25, the Cut-off Date LTV and Maturity Date/ARD LTV are calculated by using an appraised value based on an “hypothetical as if complete today” assumption. Refer to the definition of “Appraised Value” under “Description of the Mortgage Pool—Certain Calculations and Definitions” in the Preliminary Prospectus for additional details. |
| THE INFORMATION IN THIS STRUCTURAL AND COLLATERAL TERM SHEET IS NOT COMPLETE AND MAY BE AMENDED PRIOR TO THE TIME OF SALE. THIS TERM SHEET IS NOT AN OFFER TO SELL THESE SECURITIES AND IT IS NOT A SOLICITATION OF AN OFFER TO BUY THESE SECURITIES IN ANY JURISDICTION WHERE THE OFFER OR SALE IS NOT PERMITTED. |
| | 14 | |
| Structural and Collateral Term Sheet | | BMO 2024-C10 |
| Collateral Characteristics |
| Cut-off Date Principal Balance |
| | | | | Weighted Average |
| Range of Cut-off Date Principal Balances | Number of Loans | Cut-off Date Principal Balance | % of IPB | Mortgage Rate | Remaining Loan Term | UW
NCF DSCR(1)(2) | UW
NOI
Debt Yield(1)(3) | Cut-off
Date LTV(1)(3)(4) | Maturity Date/ARD LTV(1)(3)(4) |
| $1,199,095 | - | $4,999,999 | 3 | | $8,434,095 | 1.2 | % | 6.63008% | 119 | 2.07x | 14.8% | 52.0% | 51.7% |
| $5,000,000 | - | $9,999,999 | 3 | | 26,888,961 | 3.7 | | 5.76187% | 108 | 2.03x | 14.1% | 60.8% | 54.4% |
| $10,000,000 | - | $19,999,999 | 5 | | 78,128,000 | 10.8 | | 5.52136% | 110 | 2.55x | 15.7% | 50.1% | 49.3% |
| $20,000,000 | - | $29,999,999 | 7 | | 173,620,000 | 24.0 | | 5.69936% | 111 | 1.93x | 11.1% | 58.4% | 58.4% |
| $30,000,000 | - | $39,999,999 | 4 | | 136,285,000 | 18.8 | | 6.76844% | 114 | 1.40x | 10.1% | 63.5% | 63.5% |
| $40,000,000 | - | $49,999,999 | 3 | | 126,547,500 | 17.5 | | 6.60373% | 120 | 1.86x | 12.6% | 55.8% | 55.8% |
| $50,000,000 | - | $60,000,000 | 3 | | 174,070,000 | 24.0 | | 5.94643% | 118 | 2.45x | 15.1% | 47.7% | 47.7% |
| Total / Weighted Average: | 28 | | $723,973,556 | 100.0 | % | 6.11205% | 115 | 2.02x | 12.8% | 55.4% | 55.1% |
| | | | | Weighted Average |
Range of
Mortgage Interest Rates | Number of Loans | Cut-off Date Principal Balance | % of IPB | Mortgage Rate | Remaining Loan Term | UW
NCF DSCR(1)(2) | UW
NOI
Debt Yield(1)(3) | Cut-off
Date LTV(1)(3)(4) | Maturity Date/ARD LTV(1)(3)(4) |
| 3.41500% | - | 4.99999% | 4 | $69,700,000 | 9.6 | % | 3.93591% | 85 | 2.28x | 9.2% | 63.8% | 63.8% |
| 5.00000% | - | 5.99999% | 5 | 188,230,000 | 26.0 | | 5.63970% | 119 | 2.61x | 15.5% | 45.9% | 45.9% |
| 6.00000% | - | 6.49999% | 11 | 262,033,556 | 36.2 | | 6.26294% | 118 | 1.76x | 11.9% | 58.3% | 57.6% |
| 6.50000% | - | 6.99999% | 3 | 67,235,000 | 9.3 | | 6.71800% | 118 | 2.04x | 14.5% | 59.3% | 59.3% |
| 7.00000% | - | 7.49999% | 4 | 128,275,000 | 17.7 | | 7.26749% | 115 | 1.52x | 11.6% | 57.1% | 57.1% |
| 7.50000% | - | 7.53500% | 1 | 8,500,000 | 1.2 | | 7.53500% | 120 | 1.70x | 16.2% | 54.8% | 48.5% |
| Total / Weighted Average: | 28 | $723,973,556 | 100.0 | % | 6.11205% | 115 | 2.02x | 12.8% | 55.4% | 55.1% |
| Original Term to Maturity in Months |
| | | | | Weighted Average |
Original Term to
Maturity in Months | Number of Loans | Cut-off Date Principal Balance | % of IPB | Mortgage Rate | Remaining Loan Term | UW
NCF DSCR(1)(2) | UW
NOI
Debt Yield(1)(3) | Cut-off
Date LTV(1)(3)(4) | Maturity Date/ARD LTV(1)(3)(4) |
| 120 | 28 | $723,973,556 | 100.0 | % | 6.11205% | 115 | 2.02x | 12.8% | 55.4% | 55.1% |
| Total / Weighted Average: | 28 | $723,973,556 | 100.0 | % | 6.11205% | 115 | 2.02x | 12.8% | 55.4% | 55.1% |
| Remaining Term to Maturity in Months |
| | | | | Weighted Average |
| Range of Remaining Term to Maturity in Months | Number of Loans | Cut-off Date Principal Balance | % of IPB | Mortgage Rate | Remaining Loan Term | UW
NCF DSCR(1)(2) | UW
NOI
Debt Yield(1)(3) | Cut-off
Date LTV(1)(3)(4) | Maturity Date/ARD LTV(1)(3)(4) |
| 78 | - | 120 | 28 | $723,973,556 | 100.0 | % | 6.11205% | 115 | 2.02x | 12.8% | 55.4% | 55.1% |
| Total / Weighted Average: | 28 | $723,973,556 | 100.0 | % | 6.11205% | 115 | 2.02x | 12.8% | 55.4% | 55.1% |
| (1) | In the case of Loan Nos. 1, 2, 3, 8, 14, 17, 19, 20, 21 and 24, the UW NCF DSCR, UW NOI Debt Yield, Cut-off Date LTV and Maturity Date/ARD LTV calculations include the related Pari Passu Companion Loan(s). In the case of Loan No. 6, the UW NCF DSCR, UW NOI Debt Yield, Cut-off Date LTV and Maturity Date/ARD LTV calculations exclude the related mezzanine loan. |
| (2) | For the mortgage loans that are interest-only for the entire term and accrue interest on an Actual/360 basis, the Monthly Debt Service Amount ($) was calculated as 1/12th of the product of (i) the Original Balance ($), (ii) the Interest Rate % and (iii) 365/360. |
| (3) | In the case of Loan No. 9, the Cut-off Date LTV, Maturity Date/ARD LTV and UW NOI Debt Yield are based on Cut-off Date Principal Balance after netting out a $2,500,000 holdback reserve. The Cut-off Date LTV, Maturity Date/ARD LTV and UW NOI Debt Yield based on Cut-off Date Principal Balance without netting out the holdback reserve are 64.9%, 64.9% and 9.5%, respectively. |
| (4) | In the case of Loan No. 5, the Cut-off Date LTV and Maturity Date/ARD LTV are calculated by using an appraised value based on an “as portfolio” assumption. In the case of Loan No. 25, the Cut-off Date LTV and Maturity Date/ARD LTV are calculated by using an appraised value based on an “hypothetical as if complete today” assumption. Refer to the definition of “Appraised Value” under “Description of the Mortgage Pool—Certain Calculations and Definitions” in the Preliminary Prospectus for additional details. |
| THE INFORMATION IN THIS STRUCTURAL AND COLLATERAL TERM SHEET IS NOT COMPLETE AND MAY BE AMENDED PRIOR TO THE TIME OF SALE. THIS TERM SHEET IS NOT AN OFFER TO SELL THESE SECURITIES AND IT IS NOT A SOLICITATION OF AN OFFER TO BUY THESE SECURITIES IN ANY JURISDICTION WHERE THE OFFER OR SALE IS NOT PERMITTED. |
| | 15 | |
| Structural and Collateral Term Sheet | | BMO 2024-C10 |
| Collateral Characteristics |
Original Amortization Term in Months |
| | | | | Weighted Average |
Original
Amortization
Term in Months | Number of Loans | Cut-off Date Principal Balance | % of IPB | Mortgage Rate | Remaining Loan Term | UW
NCF DSCR(1)(2) | UW
NOI
Debt Yield(1)(3) | Cut-off
Date LTV(1)(3)(4) | Maturity Date/ARD LTV(1)(3)(4) |
| Interest Only | 24 | $686,707,500 | 94.9 | % | 6.09012% | 114 | 2.02x | 12.6% | 55.5% | 55.5% |
| 300 | 1 | 9,288,961 | 1.3 | | 6.36500% | 119 | 1.99x | 17.5% | 59.5% | 46.7% |
| 360 | 3 | 27,977,095 | 3.9 | | 6.56630% | 119 | 1.93x | 15.8% | 53.8% | 49.5% |
| Total / Weighted Average: | 28 | $723,973,556 | 100.0 | % | 6.11205% | 115 | 2.02x | 12.8% | 55.4% | 55.1% |
| Remaining Amortization Term in Months |
| | | | | Weighted Average |
| Range of Remaining Amortization Term in Months | Number of Loans | Cut-off Date Principal Balance | % of IPB | Mortgage Rate | Remaining Loan Term | UW
NCF DSCR(1)(2) | UW
NOI
Debt Yield(1)(3) | Cut-off
Date LTV(1)(3)(4) | Maturity Date/ARD LTV(1)(3)(4) |
| Interest Only | 24 | $686,707,500 | 94.9 | % | 6.09012% | 114 | 2.02x | 12.6% | 55.5% | 55.5% |
| 299 | - | 336 | 1 | 9,288,961 | 1.3 | | 6.36500% | 119 | 1.99x | 17.5% | 59.5% | 46.7% |
| 337 | - | 360 | 3 | 27,977,095 | 3.9 | | 6.56630% | 119 | 1.93x | 15.8% | 53.8% | 49.5% |
| Total / Weighted Average: | 28 | $723,973,556 | 100.0 | % | 6.11205% | 115 | 2.02x | 12.8% | 55.4% | 55.1% |
| | | | | Weighted Average |
| Amortization Types | Number of Loans | Cut-off Date Principal Balance | % of IPB | Mortgage Rate | Remaining Loan Term | UW
NCF DSCR(1)(2) | UW
NOI
Debt Yield(1)(3) | Cut-off
Date LTV(1)(3)(4) | Maturity Date/ARD LTV(1)(3)(4) |
| Interest Only | 24 | $686,707,500 | 94.9 | % | 6.09012% | 114 | 2.02x | 12.6% | 55.5% | 55.5% |
| Amortizing Balloon | 3 | 18,988,056 | 2.6 | | 6.88780% | 119 | 2.08x | 18.4% | 54.5% | 45.3% |
| Interest Only, Amortizing Balloon | 1 | 18,278,000 | 2.5 | | 6.13000% | 119 | 1.80x | 14.0% | 56.0% | 52.5% |
| Total / Weighted Average: | 28 | $723,973,556 | 100.0 | % | 6.11205% | 115 | 2.02x | 12.8% | 55.4% | 55.1% |
| Underwritten Net Cash Flow Debt Service Coverage Ratios(1)(2) |
| | | | | Weighted Average |
| Range of Underwritten Net Cash Flow Debt Service Coverage Ratios | Number of Loans | Cut-off Date Principal Balance | % of IPB | Mortgage Rate | Remaining Loan Term | UW
NCF DSCR(1)(2) | UW
NOI
Debt Yield(1)(3) | Cut-off
Date LTV(1)(3)(4) | Maturity Date/ARD LTV(1)(3)(4) |
| 1.04x | - | 1.49x | 5 | $106,585,000 | 14.7 | % | 6.72289% | 116 | 1.21x | 8.7% | 66.3% | 66.3% |
| 1.50x | - | 1.59x | 1 | 36,525,000 | 5.0 | | 7.28000% | 107 | 1.52x | 11.3% | 56.9% | 56.9% |
| 1.60x | - | 1.99x | 10 | 246,234,461 | 34.0 | | 6.49187% | 119 | 1.83x | 12.8% | 55.3% | 54.3% |
| 2.00x | - | 2.99x | 10 | 316,430,000 | 43.7 | | 5.50521% | 111 | 2.38x | 13.7% | 52.8% | 52.8% |
| 3.00x | - | 5.54x | 2 | 18,199,095 | 2.5 | | 5.60271% | 117 | 3.88x | 25.3% | 37.5% | 37.4% |
| Total / Weighted Average: | 28 | $723,973,556 | 100.0 | % | 6.11205% | 115 | 2.02x | 12.8% | 55.4% | 55.1% |
| (1) | In the case of Loan Nos. 1, 2, 3, 8, 14, 17, 19, 20, 21 and 24, the UW NCF DSCR, UW NOI Debt Yield, Cut-off Date LTV and Maturity Date/ARD LTV calculations include the related Pari Passu Companion Loan(s). In the case of Loan No. 6, the UW NCF DSCR, UW NOI Debt Yield, Cut-off Date LTV and Maturity Date/ARD LTV calculations exclude the related mezzanine loan. |
| (2) | For the mortgage loans that are interest-only for the entire term and accrue interest on an Actual/360 basis, the Monthly Debt Service Amount ($) was calculated as 1/12th of the product of (i) the Original Balance ($), (ii) the Interest Rate % and (iii) 365/360. |
| (3) | In the case of Loan No. 9, the Cut-off Date LTV, Maturity Date/ARD LTV and UW NOI Debt Yield are based on Cut-off Date Principal Balance after netting out a $2,500,000 holdback reserve. The Cut-off Date LTV, Maturity Date/ARD LTV and UW NOI Debt Yield based on Cut-off Date Principal Balance without netting out the holdback reserve are 64.9%, 64.9% and 9.5%, respectively. |
| (4) | In the case of Loan No. 5, the Cut-off Date LTV and Maturity Date/ARD LTV are calculated by using an appraised value based on an “as portfolio” assumption. In the case of Loan No. 25, the Cut-off Date LTV and Maturity Date/ARD LTV are calculated by using an appraised value based on an “hypothetical as if complete today” assumption. Refer to the definition of “Appraised Value” under “Description of the Mortgage Pool—Certain Calculations and Definitions” in the Preliminary Prospectus for additional details. |
| THE INFORMATION IN THIS STRUCTURAL AND COLLATERAL TERM SHEET IS NOT COMPLETE AND MAY BE AMENDED PRIOR TO THE TIME OF SALE. THIS TERM SHEET IS NOT AN OFFER TO SELL THESE SECURITIES AND IT IS NOT A SOLICITATION OF AN OFFER TO BUY THESE SECURITIES IN ANY JURISDICTION WHERE THE OFFER OR SALE IS NOT PERMITTED. |
| | 16 | |
| Structural and Collateral Term Sheet | | BMO 2024-C10 |
| Collateral Characteristics |
| LTV Ratios as of the Cut-off Date(1)(3)(4) |
| | | | | Weighted Average |
Range of
Cut-off Date LTVs | Number of Loans | Cut-off Date Principal Balance | % of IPB | Mortgage Rate | Remaining Loan Term | UW
NCF DSCR(1)(2) | UW
NOI
Debt Yield(1)(3) | Cut-off
Date LTV(1)(3)(4) | Maturity Date/ARD LTV(1)(3)(4) |
| 13.1% | - | 49.9% | 7 | $180,879,095 | 25.0 | % | 5.76673% | 118 | 2.62x | 15.9% | 41.8% | 41.8% |
| 50.0% | - | 59.9% | 12 | 332,551,961 | 45.9 | | 6.49555% | 116 | 1.90x | 13.1% | 56.2% | 55.5% |
| 60.0% | - | 64.9% | 4 | 126,607,500 | 17.5 | | 5.89372% | 112 | 1.80x | 10.8% | 63.2% | 63.2% |
| 65.0% | - | 75.0% | 5 | 83,935,000 | 11.6 | | 5.66609% | 106 | 1.48x | 8.1% | 70.0% | 70.0% |
| Total / Weighted Average: | 28 | $723,973,556 | 100.0 | % | 6.11205% | 115 | 2.02x | 12.8% | 55.4% | 55.1% |
| LTV Ratios as of the Maturity Date(1)(3)(4) |
| | | | | Weighted Average |
Range of
Maturity Date LTVs | Number of Loans | Cut-off Date Principal Balance | % of IPB | Mortgage Rate | Remaining Loan Term | UW
NCF DSCR(1)(2) | UW
NOI
Debt Yield(1)(3) | Cut-off
Date LTV(1)(3)(4) | Maturity Date/ARD LTV(1)(3)(4) |
| 11.2% | - | 49.9% | 9 | $198,668,056 | 27.4 | % | 5.87035% | 118 | 2.55x | 16.0% | 43.2% | 42.3% |
| 50.0% | - | 59.9% | 10 | 314,763,000 | 43.5 | | 6.47134% | 115 | 1.91x | 12.9% | 56.2% | 56.0% |
| 60.0% | - | 64.9% | 4 | 126,607,500 | 17.5 | | 5.89372% | 112 | 1.80x | 10.8% | 63.2% | 63.2% |
| 65.0% | - | 75.0% | 5 | 83,935,000 | 11.6 | | 5.66609% | 106 | 1.48x | 8.1% | 70.0% | 70.0% |
| Total / Weighted Average: | 28 | $723,973,556 | 100.0 | % | 6.11205% | 115 | 2.02x | 12.8% | 55.4% | 55.1% |
| | | | | Weighted Average |
| Prepayment Protection | Number of Loans | Cut-off Date Principal Balance | % of IPB | Mortgage Rate | Remaining Loan Term | UW
NCF DSCR(1)(2) | UW
NOI
Debt Yield(1)(3) | Cut-off
Date LTV(1)(3)(4) | Maturity Date/ARD LTV(1)(3)(4) |
| Defeasance | 15 | $399,754,095 | 55.2 | % | 5.86843% | 113 | 2.23x | 13.5% | 51.6% | 51.5% |
| Defeasance or Yield Maintenance | 9 | 265,234,461 | 36.6 | | 6.26312% | 117 | 1.84x | 12.3% | 60.0% | 59.4% |
| Yield Maintenance | 4 | 58,985,000 | 8.1 | | 7.08383% | 118 | 1.32x | 10.3% | 60.8% | 60.8% |
| Total / Weighted Average: | 28 | $723,973,556 | 100.0 | % | 6.11205% | 115 | 2.02x | 12.8% | 55.4% | 55.1% |
| | | | | Weighted Average |
| Loan Purpose | Number of Loans | Cut-off Date Principal Balance | % of IPB | Mortgage Rate | Remaining Loan Term | UW
NCF DSCR(1)(2) | UW
NOI
Debt Yield(1)(3) | Cut-off
Date LTV(1)(3)(4) | Maturity Date/ARD LTV(1)(3)(4) |
| Refinance | 17 | $381,923,056 | 52.8 | % | 6.11251% | 114 | 2.11x | 13.5% | 55.2% | 54.7% |
| Acquisition | 5 | 167,832,500 | 23.2 | | 6.12727% | 113 | 1.91x | 11.9% | 57.8% | 57.8% |
| Recapitalization | 5 | 120,148,000 | 16.6 | | 6.29725% | 117 | 1.58x | 10.8% | 59.9% | 59.4% |
| Refinance/Acquisition | 1 | 54,070,000 | 7.5 | | 5.65000% | 119 | 2.62x | 15.0% | 39.9% | 39.9% |
| Total / Weighted Average: | 28 | $723,973,556 | 100.0 | % | 6.11205% | 115 | 2.02x | 12.8% | 55.4% | 55.1% |
| (1) | In the case of Loan Nos. 1, 2, 3, 8, 14, 17, 19, 20, 21 and 24, the UW NCF DSCR, UW NOI Debt Yield, Cut-off Date LTV and Maturity Date/ARD LTV calculations include the related Pari Passu Companion Loan(s). In the case of Loan No. 6, the UW NCF DSCR, UW NOI Debt Yield, Cut-off Date LTV and Maturity Date/ARD LTV calculations exclude the related mezzanine loan. |
| (2) | For the mortgage loans that are interest-only for the entire term and accrue interest on an Actual/360 basis, the Monthly Debt Service Amount ($) was calculated as 1/12th of the product of (i) the Original Balance ($), (ii) the Interest Rate % and (iii) 365/360. |
| (3) | In the case of Loan No. 9, the Cut-off Date LTV, Maturity Date/ARD LTV and UW NOI Debt Yield are based on Cut-off Date Principal Balance after netting out a $2,500,000 holdback reserve. The Cut-off Date LTV, Maturity Date/ARD LTV and UW NOI Debt Yield based on Cut-off Date Principal Balance without netting out the holdback reserve are 64.9%, 64.9% and 9.5%, respectively. |
| (4) | In the case of Loan No. 5, the Cut-off Date LTV and Maturity Date/ARD LTV are calculated by using an appraised value based on an “as portfolio” assumption. In the case of Loan No. 25, the Cut-off Date LTV and Maturity Date/ARD LTV are calculated by using an appraised value based on an “hypothetical as if complete today” assumption. Refer to the definition of “Appraised Value” under “Description of the Mortgage Pool—Certain Calculations and Definitions” in the Preliminary Prospectus for additional details. |
| THE INFORMATION IN THIS STRUCTURAL AND COLLATERAL TERM SHEET IS NOT COMPLETE AND MAY BE AMENDED PRIOR TO THE TIME OF SALE. THIS TERM SHEET IS NOT AN OFFER TO SELL THESE SECURITIES AND IT IS NOT A SOLICITATION OF AN OFFER TO BUY THESE SECURITIES IN ANY JURISDICTION WHERE THE OFFER OR SALE IS NOT PERMITTED. |
| | 17 | |
| Structural and Collateral Term Sheet | | BMO 2024-C10 |
| Collateral Characteristics |
| Previous Securitization History(1) |
| No. | Mortgage Loan Seller | Loan/Property Name | Location | Property Type | Cut-off Date Principal Balance | % of IPB | Previous Securitization |
| 1 | GACC, GSMC | Newport Centre | Jersey City, NJ | Retail | $60,000,000 | 8.3% | CSMC 2022-NWPT |
| 2 | BMO | The Mall of Victor Valley | Victorville, CA | Retail | $60,000,000 | 8.3% | JPMBB 2014-C24 |
| 9 | SMC | Diamond Ridge Apartments | Houston, TX | Multifamily | $31,000,000 | 4.3% | BBCMS 2021-C10 |
| 16 | SMC | Quail Meadows Apartments | Houston, TX | Multifamily | $20,750,000 | 2.9% | CGCMT 2019-C7 |
| 19 | GACC | Arizona Grand Resort and Spa | Phoenix, AZ | Hospitality | $17,000,000 | 2.3% | CSAIL 2015-C3, CSAIL 2015-C4 |
| 21 | BMO | Grapevine Mills | Grapevine, TX | Retail | $15,500,000 | 2.1% | JPMBB 2014-C23, JPMBB 2014-C24, JPMBB 2014-C25 |
| 25 | SMC | Spark by Hilton O'Hare | Des Plaines, IL | Hospitality | $8,500,000 | 1.2% | WFRBS 2014-C24 |
| 27 | ZBNA | Airport Business Center | San Antonio, TX | Industrial | $3,400,000 | 0.5% | CGCMT 2014-GC25 |
| (1) | The table above represents the properties for which the previously existing debt was most recently securitized, based on information provided by the related borrower or obtained through searches of a third-party database. |
| THE INFORMATION IN THIS STRUCTURAL AND COLLATERAL TERM SHEET IS NOT COMPLETE AND MAY BE AMENDED PRIOR TO THE TIME OF SALE. THIS TERM SHEET IS NOT AN OFFER TO SELL THESE SECURITIES AND IT IS NOT A SOLICITATION OF AN OFFER TO BUY THESE SECURITIES IN ANY JURISDICTION WHERE THE OFFER OR SALE IS NOT PERMITTED. |
| | 18 | |
| Structural and Collateral Term Sheet | | BMO 2024-C10 |
| Class A-3(1) |
Class A-3
No. | Loan Name | Location | Cut-off Date Balance | % of IPB | Maturity Date Balance | % of Certificate Class(2) | Original Loan Term | Remaining Loan Term | UW NCF DSCR(3) | UW NOI Debt Yield(3) | Cut-off Date LTV(3) | Maturity Date/ARD LTV(3) |
| 14 | La Habra Marketplace | La Habra, CA | $25,000,000 | 3.5% | $25,000,000 | 35.9% | 120 | 85 | 2.33x | 8.9% | 62.1% | 62.1% |
| 17 | 500 Delaware | Wilmington, DE | $20,000,000 | 2.8% | $20,000,000 | 28.7% | 120 | 90 | 2.02x | 10.1% | 67.6% | 67.6% |
| 20 | Centene | Plantation, FL | $15,600,000 | 2.2% | $15,600,000 | 22.4% | 120 | 78 | 2.47x | 8.9% | 59.5% | 59.5% |
| 24 | 1516 Motor Parkway | Hauppauge, NY | $9,100,000 | 1.3% | $9,100,000 | 13.1% | 120 | 85 | 2.39x | 8.6% | 67.7% | 67.7% |
| Total / Weighted Average: | | $69,700,000 | 9.6% | $69,700,000 | 100.0% | 120 | 85 | 2.28x | 9.2% | 63.8% | 63.8% |
| (1) | The table above presents the mortgage loans whose balloon payments would be applied to pay down the certificate balance of the Class A-3 certificates, assuming a 0% CPR and applying the “Modeling Assumptions” described in the Preliminary Prospectus, including the assumptions that (i) none of the mortgage loans in the pool experience prepayments, defaults or losses; (ii) there are no extensions of maturity dates of any mortgage loans in the pool; and (iii) each mortgage loan in the pool is paid in full on its stated maturity date or anticipated repayment date. Each Class of Certificates, including the Class A-3 certificates, evidences undivided ownership interests in the entire pool of mortgage loans. Debt service coverage ratio, debt yield and loan-to-value ratio information does not take into account subordinate debt (whether or not secured by the mortgaged property), if any, that is allowed under the terms of any mortgage loans. See Annex A to the Preliminary Prospectus. |
| (2) | Reflects the percentage equal to the Percentage of the Maturity Date Balance divided by the initial Class A-3 Certificate Balance. |
| (3) | In the case of Loan No. 14, 17, 20 and 24, the UW NCF DSCR, UW NOI Debt Yield, Cut-off Date LTV and Maturity Date/ARD LTV calculations include the related Pari Passu Companion Loan(s). |
| THE INFORMATION IN THIS STRUCTURAL AND COLLATERAL TERM SHEET IS NOT COMPLETE AND MAY BE AMENDED PRIOR TO THE TIME OF SALE. THIS TERM SHEET IS NOT AN OFFER TO SELL THESE SECURITIES AND IT IS NOT A SOLICITATION OF AN OFFER TO BUY THESE SECURITIES IN ANY JURISDICTION WHERE THE OFFER OR SALE IS NOT PERMITTED. |
| | 19 | |
| Structural and Collateral Term Sheet | | BMO 2024-C10 |
| Structural Overview |
| ■ Certificates: | | The “Certificates” will consist of the Class A-1, Class A-3, Class A-4, Class A-5, Class A-SB, Class X-A, Class X-B, Class X-D, Class A-S, Class B, Class C, Class D, Class E-RR, Class F-RR, Class G-RR, Class J-RR and Class R certificates. The Certificates (other than the Class R certificates) are referred to as the “Regular Certificates”. The Class A-1, Class A-3, Class A-4, Class A-5, Class A-SB, Class A-S, Class B, Class C, Class D, Class E-RR, Class F-RR, Class G-RR and Class J-RR certificates are collectively referred to as the “Principal Balance Certificates”. The Class X-A, Class X-B and Class X-D certificates are collectively referred to as the “Class X Certificates”. |
| ■ Accrual: | | Each Class of Regular Certificates will accrue interest on a 30/360 basis. The Class R certificates will not accrue interest. |
| ■ Distributions: | | The aggregate amount available for distribution to holders of the Certificates on each distribution date will be the gross amount of interest, principal, yield maintenance charges and prepayment premiums collected with respect to the mortgage loans in the applicable one-month collection period, net of specified expenses of the issuing entity, including fees payable therefrom to, and losses, liabilities, advances (with interest thereon), costs and expenses reimbursable or indemnifiable therefrom to, the master servicer, the special servicer, the certificate administrator, the trustee, the operating advisor, the asset representations reviewer and CREFC®. On each Distribution Date, funds available for distribution to holders of the Certificates (exclusive of any portion thereof that represents (i) any yield maintenance charges and prepayment premiums collected on the mortgage loans and/or (ii) any excess interest accrued after the related anticipated repayment date on any mortgage loan with an anticipated repayment date) (“Available Funds”) will be distributed in the following amounts and order of priority (in each case to the extent of remaining available funds): 1. Class A-1, Class A-3, Class A-4, Class A-5, Class A-SB, Class X-A, Class X-B and Class X-D certificates: to interest on the Class A-1, Class A-3, Class A-4, Class A-5, Class A-SB, Class X-A, Class X-B and Class X-D certificates, up to, and pro rata in accordance with, their respective interest entitlements. 2. Class A-1, Class A-3, Class A-4, Class A-5 and Class A-SB certificates: to the extent of Available Funds allocable to principal received or advanced on the mortgage loans, (i) first to principal on the Class A-SB certificates until their certificate balance is reduced to the Class A-SB scheduled principal balance set forth in Annex F to the Preliminary Prospectus for the relevant Distribution Date, (ii) then to principal on the Class A-1 certificates until their certificate balance is reduced to zero, all funds available for distribution of principal remaining after the distribution to the Class A-SB certificates in clause (i) above, (iii) then to principal on the Class A-3 certificates until their certificate balance is reduced to zero, all funds available for distribution of principal remaining after the distribution to the Class A-1 certificates in clause (ii) above, (iv) then to principal on the Class A-4 certificates until their certificate balance is reduced to zero, all funds available for distribution of principal remaining after the distribution to the Class A-3 certificates in clause (iii) above, (v) then to principal on the Class A-5 certificates until their certificate balance is reduced to zero, all funds available for distribution of principal remaining after the distribution to the Class A-4 certificates in clause (iv) above and (vi) then to principal on the Class A-SB certificates until their certificate balance is reduced to zero, all funds available for distribution of principal remaining after the distributions to the Class A-5 certificates in clause (v) above. However, if the certificate balances of each and every class of the Class A-S, Class B, Class C, Class D, Class E-RR, Class F-RR, Class G-RR and Class J-RR certificates have been reduced to zero as a result of the allocation of mortgage loan losses and other unanticipated expenses to those certificates, then Available Funds allocable to principal will be distributed to the Class A-1, Class A-3, Class A-4, Class A-5 and Class A-SB certificates, pro rata, based on their respective certificate balances (and the schedule for the Class A-SB principal distributions will be disregarded). 3. Class A-1, Class A-3, Class A-4, Class A-5 and Class A-SB certificates: to reimburse the Class A-1, Class A-3, Class A-4, Class A-5 and Class A-SB certificates, pro rata, for any unreimbursed losses on the mortgage loans that were previously allocated to reduce the certificate balances of those classes, together with interest at their respective pass-through rates. 4. Class A-S certificates: (i) first, to interest on the Class A-S certificates in the amount of their interest entitlement; (ii) next, to the extent of Available Funds allocable to principal remaining after distributions in respect of principal to each class of Principal Balance Certificates with a higher principal payment priority (in this case, the Class A-1, Class A-3, Class A-4, Class A-5 and Class A-SB certificates), to principal on the Class A-S certificates until their certificate balance is reduced to zero; and (iii) next, to reimburse the Class A-S certificates for any unreimbursed losses on the mortgage loans that were previously allocated to reduce the certificate balance of that class, together with interest at its pass-through rate. |
| THE INFORMATION IN THIS STRUCTURAL AND COLLATERAL TERM SHEET IS NOT COMPLETE AND MAY BE AMENDED PRIOR TO THE TIME OF SALE. THIS TERM SHEET IS NOT AN OFFER TO SELL THESE SECURITIES AND IT IS NOT A SOLICITATION OF AN OFFER TO BUY THESE SECURITIES IN ANY JURISDICTION WHERE THE OFFER OR SALE IS NOT PERMITTED. |
| | 20 | |
| Structural and Collateral Term Sheet | | BMO 2024-C10 |
| Structural Overview |
| | 5. Class B certificates: (i) first, to interest on the Class B certificates in the amount of their interest entitlement; (ii) next, to the extent of Available Funds allocable to principal remaining after distributions in respect of principal to each class of Principal Balance Certificates with a higher principal payment priority (in this case, the Class A-1, Class A-3, Class A-4, Class A-5, Class A-SB and Class A-S certificates), to principal on the Class B certificates until their certificate balance is reduced to zero; and (iii) next, to reimburse Class B certificates for any unreimbursed losses on the mortgage loans that were previously allocated to reduce the certificate balance of that class, together with interest at its pass-through rate. 6. Class C certificates: (i) first, to interest on the Class C certificates in the amount of their interest entitlement; (ii) next, to the extent of Available Funds allocable to principal remaining after distributions in respect of principal to each class of Principal Balance Certificates with a higher principal payment priority (in this case, the Class A-1, Class A-3, Class A-4, Class A-5, Class A-SB, Class A-S and Class B certificates), to principal on the Class C certificates until their certificate balance is reduced to zero; and (iii) next, to reimburse the Class C certificates for any unreimbursed losses on the mortgage loans that were previously allocated to reduce the certificate balance of that class, together with interest at its pass-through rate. 7. After the Class A-1, Class A-3, Class A-4, Class A-5, Class A-SB, Class X-A, Class X-B, Class X-D, Class A-S, Class B and Class C certificates are paid all amounts to which they are entitled on such Distribution Date, the remaining Available Funds will be used to pay interest to the Class D, Class E-RR, Class F-RR, Class G-RR and Class J-RR certificates, and to pay principal to, and to reimburse (with interest) any unreimbursed losses to, the Class D, Class E-RR, Class F-RR, Class G-RR and Class J-RR certificates, sequentially in order, and with respect to each such class of Principal Balance Certificates, in a manner analogous to the Class C certificates pursuant to clause 6 above. |
■ Realized Losses: | | The certificate balances of the Principal Balance Certificates will each be reduced without distribution on any Distribution Date as a write-off to the extent of any loss realized on the mortgage loans allocated to the related class on such Distribution Date. On each Distribution Date, any such losses will be applied to the respective classes of Principal Balance Certificates in the following order, in each case until the related certificate balance is reduced to zero: first to the Class J-RR certificates; second, to the Class G-RR certificates; third, to the Class F-RR certificates; fourth, to the Class E-RR certificates; fifth, to the Class D certificates; sixth, to the Class C certificates; seventh, to the Class B certificates; eighth, to the Class A-S certificates; and, finally pro rata, to the Class A-1, Class A-3, Class A-4, Class A-5 and Class A-SB certificates, based on their then current respective certificate balances. The notional amount of each class of Class X Certificates will be reduced to reflect reductions in the certificate balance(s) of the class (or classes, as applicable) of Corresponding Principal Balance Certificates as a result of allocations of losses realized on the mortgage loans to such class(es) of Principal Balance Certificates. |
| THE INFORMATION IN THIS STRUCTURAL AND COLLATERAL TERM SHEET IS NOT COMPLETE AND MAY BE AMENDED PRIOR TO THE TIME OF SALE. THIS TERM SHEET IS NOT AN OFFER TO SELL THESE SECURITIES AND IT IS NOT A SOLICITATION OF AN OFFER TO BUY THESE SECURITIES IN ANY JURISDICTION WHERE THE OFFER OR SALE IS NOT PERMITTED. |
| | 21 | |
| Structural and Collateral Term Sheet | | BMO 2024-C10 |
| Structural Overview |
| ■ Prepayment Premiums and Yield Maintenance Charges: | | On each Distribution Date, until the notional amounts of the Class X-A, Class X-B and Class X-D certificates and the certificate balances of the Class A-1, Class A-3, Class A-4, Class A-5, Class A-SB, Class A-S, Class B, Class C, Class D and Class E-RR certificates have been reduced to zero, each yield maintenance charge collected on the mortgage loans during the related one-month collection period (or, in the case of an outside serviced mortgage loan, that accompanied a principal prepayment included in the Available Funds for such Distribution Date) is required to be distributed to holders of the Regular Certificates (excluding holders of the Class F-RR, Class G-RR and Class J-RR certificates) as follows: (a) first such yield maintenance charge will be allocated among (i) the group (the “YM Group A”) of the Class A-1, Class A-3, Class A-4, Class A-5, Class A-SB and Class X-A certificates, (ii) the group (the “YM Group A-S/B/C”) comprised of the Class A-S, Class B, Class C and Class X-B certificates, (iii) the group (the “YM Group D”) comprised of the Class D, and Class X-D certificates, and (iv) the group (the “YM Group E-RR”, and the YM Group A, the YM Group A-S/B/C, the YM Group D and the YM Group E-RR, collectively, the “YM Groups”), comprised solely of the Class E-RR certificates, pro rata, based upon the aggregate amount of principal distributed to the class or classes of Principal Balance Certificates in each YM Group on such Distribution Date, and (b) then the portion of such yield maintenance charge allocated to each YM Group will be further allocated as among the classes of Regular Certificates in such YM Group, in the following manner: (i) each class of Principal Balance Certificates in such YM Group will entitle the applicable certificateholders to receive on the applicable Distribution Date that portion of such yield maintenance charge equal to the product of (X) a fraction whose numerator is the amount of principal distributed to such class of Principal Balance Certificates on such Distribution Date and whose denominator is the total amount of principal distributed to all of the Principal Balance Certificates in that YM Group on such Distribution Date, (Y) except in the case of any YM Group comprised solely of one or more classes of Principal Balance Certificates, the Base Interest Fraction (as defined in the Preliminary Prospectus) for the related principal prepayment and such class of Principal Balance Certificates, and (Z) the portion of such yield maintenance charge allocated to such YM Group, and (ii) the portion of such yield maintenance charge allocated to such YM Group and remaining after such distributions with respect to the Principal Balance Certificates in such YM Group will be distributed to the class of Class X Certificates (if any) in such YM Group. If there is more than one class of Principal Balance Certificates in any YM Group entitled to distributions of principal on any particular Distribution Date on which yield maintenance charges are distributable to such classes, the aggregate portion of such yield maintenance charges allocated to such YM Group will be allocated among all such classes of Principal Balance Certificates up to, and on a pro rata basis in accordance with, their respective entitlements to those yield maintenance charges in accordance with the prior sentence of this paragraph. If a prepayment premium (calculated as a percentage of the amount prepaid) is imposed in connection with a prepayment rather than a yield maintenance charge, then the prepayment premium so collected will be allocated as described above. For this purpose, the discount rate used to calculate the Base Interest Fraction will be the discount rate used to determine the yield maintenance charge for mortgage loans that require payment at the greater of a yield maintenance charge or a minimum amount equal to a fixed percentage of the principal balance of the mortgage loan or, for mortgage loans that only have a prepayment premium based on a fixed percentage of the principal balance of the mortgage loan, such other discount rate as may be specified in the related loan documents. After the notional amounts of the Class X-A, Class X-B and Class X-D certificates and the certificate balances of the Class A-1, Class A-3, Class A-4, Class A-5, Class A-SB, Class A-S, Class B, Class C, Class D and Class E-RR certificates have been reduced to zero, all prepayment premiums and yield maintenance charges with respect to the mortgage loans will be allocated among the holders of the Class F-RR, Class G-RR and Class J-RR certificates as provided in the BMO 2024-C10 pooling and servicing agreement. No yield maintenance charges or prepayment premiums will be distributed to the holders of the Class R certificates. For a description of prepayment premiums and yield maintenance charges required on the mortgage loans, see Annex A to the Preliminary Prospectus. See also “Certain Legal Aspects of the Mortgage Loans—Default Interest and Limitations on Prepayments” in the Preliminary Prospectus. |
| ■ Advances: | | The master servicer and, if it fails to do so, the certificate administrator, will be obligated to make P&I advances with respect to each mortgage loan in the issuing entity and, with respect to all of the mortgage loans serviced under the BMO 2024-C10 pooling and servicing agreement, servicing advances, including paying delinquent property taxes, condominium assessments, insurance premiums and ground lease rents, but only to the extent that those advances are not deemed non-recoverable from collections on the related mortgage loan and, in the case of servicing advances, any related companion loans as described below. P&I advances are subject to reduction in connection with any appraisal reductions that may occur. The special servicer will have no obligation to make any advances, provided that, in an urgent or emergency situation requiring the making of a property protection advance, the special servicer may, in its sole discretion, make a property protection advance and will be entitled to reimbursement from the master servicer for such advance. The master servicer, the special servicer and the certificate administrator will each be entitled to receive interest on advances they make at the prime rate (and, solely in the case of the master servicer, subject to a floor of 2.0% per annum), compounded annually. |
| THE INFORMATION IN THIS STRUCTURAL AND COLLATERAL TERM SHEET IS NOT COMPLETE AND MAY BE AMENDED PRIOR TO THE TIME OF SALE. THIS TERM SHEET IS NOT AN OFFER TO SELL THESE SECURITIES AND IT IS NOT A SOLICITATION OF AN OFFER TO BUY THESE SECURITIES IN ANY JURISDICTION WHERE THE OFFER OR SALE IS NOT PERMITTED. |
| | 22 | |
| Structural and Collateral Term Sheet | | BMO 2024-C10 |
| Structural Overview |
■ Serviced Mortgage Loans/Outside Serviced Mortgage Loans: | | One or more whole loans may each constitute an “outside serviced whole loan”, in which case (as identified under “Collateral Characteristics—Pari Passu Companion Loan Summary” above), the BMO 2024-C10 pooling and servicing agreement is not the Controlling Pooling/Trust & Servicing Agreement(the “Controlling Servicing Agreement”), and each related mortgage loan constitutes an “outside serviced mortgage loan,” each related companion loan constitutes an “outside serviced companion loan,” and each related Controlling Servicing Agreement constitutes an “outside servicing agreement.” One or more whole loans may be identified in the Preliminary Prospectus as a “servicing shift whole loan”, in which case the related mortgage loan constitutes a “servicing shift mortgage loan” and each related companion loan constitutes a “servicing shift companion loan”. Any servicing shift whole loan will initially be serviced pursuant to the BMO 2024-C10 pooling and servicing agreement during which time such mortgage loan, such whole loan and each related companion loan will be a serviced mortgage loan, a serviced whole loan and a serviced companion loan (each as defined below), respectively. However, upon the inclusion of the related controlling pari passu companion loan in a future securitization transaction, the servicing of such mortgage loan will shift to the servicing agreement governing such securitization transaction, and such mortgage loan, such whole loan and each related companion loan will be an outside serviced mortgage loan, an outside serviced whole loan and an outside serviced companion loan, respectively. All of the mortgage loans transferred to the issuing entity (other than any outside serviced mortgage loan) are sometimes referred to in this Term Sheet as the “serviced mortgage loans” and, together with any related companion loans, as the “serviced loans” (which signifies that they are being serviced by the master servicer and the special servicer under the BMO 2024-C10 pooling and servicing agreement); each related whole loan constitutes a “serviced whole loan”; and each related companion loan constitutes a “serviced companion loan.” See “Description of the Mortgage Pool—The Whole Loans” in the Preliminary Prospectus. |
| ■ Appraisal Reduction Amounts: | | An Appraisal Reduction Amount generally will be created with respect to a required appraisal loan (which is a serviced loan as to which certain defaults, modifications or insolvency events have occurred (as further described in the Preliminary Prospectus)) in the amount, if any, by which the principal balance of such required appraisal loan, plus other amounts overdue or advanced in connection with such required appraisal loan, exceeds 90% of the appraised value of the related mortgaged property (subject to certain downward adjustments permitted under the BMO 2024-C10 pooling and servicing agreement) plus certain escrows and reserves (including letters of credit) held with respect to such required appraisal loan; provided that, if so provided in the related co-lender agreement, the holder of a subordinate companion loan may be permitted to post cash or a letter of credit to offset some or all of an Appraisal Reduction Amount. In the case of an outside serviced mortgage loan, any Appraisal Reduction Amounts will be calculated pursuant to, and by a party to, the related outside servicing agreement. In general, any Appraisal Reduction Amount calculated with respect to a whole loan will be allocated first, to any related subordinate companion loan(s) (up to the outstanding principal balance(s) thereof), and then, to the related mortgage loan and any related pari passu companion loan(s) on a pro rata basis in accordance with their respective outstanding principal balances. As a result of an Appraisal Reduction Amount being calculated for and/or allocated to a given mortgage loan, the interest portion of any P&I advance for such mortgage loan will be reduced, which (to the extent of the reduction in such P&I advance) will have the effect of reducing the amount of interest available to the most subordinate class(es) of Certificates then outstanding (i.e., first, to the Class J-RR certificates, then, to the Class G-RR certificates, then, to the Class F-RR certificates, then, to the Class E-RR certificates, then, to the Class D certificates, then, to the Class C certificates, then, to the Class B certificates, then, to the Class A-S certificates, and then, pro rata based on interest entitlements, to the Class A-1, Class A-3, Class A-4, Class A-5, Class A-SB, Class X-A, Class X-B, and Class X-D certificates). In general, a serviced loan will cease to be a required appraisal loan, and no longer be subject to an Appraisal Reduction Amount, when the same has ceased to be a specially serviced loan (if applicable), has been brought current for at least three consecutive months and no other circumstances exist that would cause such serviced loan to be a required appraisal loan. For various purposes under the BMO 2024-C10 pooling and servicing agreement (including, with respect to the Principal Balance Certificates, for purposes of determining the Non-Reduced Certificates and the Controlling Class, as well as the occurrence of a Control Termination Event and an Operating Advisor Consultation Trigger Event), any Appraisal Reduction Amounts in respect of or allocated to the mortgage loans will be allocated to notionally reduce the certificate balances of the Principal Balance Certificates as follows: first, to the Class J-RR, Class G-RR, Class F-RR, Class E-RR, Class D, Class C, Class B and Class A-S certificates, in that order, in each case until the related certificate balance is notionally reduced to zero; and then to the Class A-1, Class A-3, Class A-4, Class A-5, and Class A-SB certificates, pro rata based on certificate balance. |
■ Cumulative Appraisal Reduction Amounts: | | A “Cumulative Appraisal Reduction Amount”, as calculated as of any date of determination, is equal to the sum of (i) all Appraisal Reduction Amounts then in effect, and (ii) with respect to any AB Modified Loans, any Collateral Deficiency Amount then in effect. With respect to any class of certificates, references to any Cumulative Appraisal Reduction Amount allocable thereto mean the |
| THE INFORMATION IN THIS STRUCTURAL AND COLLATERAL TERM SHEET IS NOT COMPLETE AND MAY BE AMENDED PRIOR TO THE TIME OF SALE. THIS TERM SHEET IS NOT AN OFFER TO SELL THESE SECURITIES AND IT IS NOT A SOLICITATION OF AN OFFER TO BUY THESE SECURITIES IN ANY JURISDICTION WHERE THE OFFER OR SALE IS NOT PERMITTED. |
| | 23 | |
| Structural and Collateral Term Sheet | | BMO 2024-C10 |
| Structural Overview |
| | aggregate portion of any Appraisal Reduction Amounts and/or Collateral Deficiency Amounts comprising such Cumulative Appraisal Reduction Amount that are allocable to such class under the Pooling and Servicing Agreement. “Collateral Deficiency Amount” means, with respect to any AB Modified Loan as of any date of determination, the excess of (i) the stated principal balance of such AB Modified Loan (taking into account the related junior note(s) included therein), over (ii) the sum of (in the case of a whole loan, solely to the extent allocable to the subject mortgage loan) (x) the most recent appraised value for the related mortgaged property or mortgaged properties, plus (y) solely to the extent not reflected or taken into account in such appraised value and to the extent on deposit with, or otherwise under the control of, the lender as of the date of such determination, any capital or additional collateral contributed by the related borrower at the time the mortgage loan became (and as part of the modification related to) such AB Modified Loan for the benefit of the related mortgaged property or mortgaged properties (provided, that in the case of an outside serviced mortgage loan, the amounts set forth in this clause (y) will be taken into account solely to the extent relevant information is received), plus (z) any other escrows or reserves (in addition to any amounts set forth in the immediately preceding clause (y)) held by the lender in respect of such AB Modified Loan as of the date of such determination. For purposes of determining the identity of the Controlling Class and the existence of a Control Termination Event and an Operating Advisor Consultation Trigger Event, Collateral Deficiency Amounts will be allocable to the respective classes of Control Eligible Certificates (as defined below), in reverse alphabetical order of class designation, in a manner similar to the allocation of Appraisal Reduction Amounts to such classes. “AB Modified Loan” means any corrected mortgage loan (1) that became a corrected mortgage loan (which includes for purposes of this definition any outside serviced mortgage loan that became a “corrected” mortgage loan (or any term substantially similar thereto) pursuant to the related outside servicing agreement) due to a modification thereto that resulted in the creation of an A/B note structure (or similar structure) and as to which the new junior note(s) did not previously exist or the principal amount of the new junior note(s) was previously part of either an A note held by the trust or the original unmodified mortgage loan and (2) as to which an Appraisal Reduction Amount is not in effect. |
| ■ Age of Appraisals: | | Appraisals (which can be an update of a prior appraisal) with respect to a serviced loan are required to be no older than 9 months for purposes of determining appraisal reductions (other than the annual re-appraisal), market value, and other calculations as described in the Preliminary Prospectus. |
| ■ Sale of Defaulted Loans: | | There will be no “Fair Market Value Purchase Option”. Instead, defaulted mortgage loans will be sold in a process similar to the sale process for REO property. With respect to an outside serviced whole loan, the party acting as special servicer with respect to such outside serviced whole loan pursuant to the related outside servicing agreement (the “outside special servicer”) may offer to sell to any person (or may offer to purchase) for cash such outside serviced whole loan in accordance with the terms of the related outside servicing agreement during such time as such outside serviced whole loan constitutes a defaulted mortgage loan qualifying for sale thereunder and, in connection with any such sale, the related outside special servicer is required to sell both the applicable outside serviced mortgage loan and the related outside serviced pari passu companion loan(s) and, if so provided in the related co-lender agreement or the Controlling Servicing Agreement, any related subordinate companion loan(s), together as one defaulted loan. |
| ■ Directing Holder: | | The “Directing Holder” with respect to any mortgage loan or whole loan serviced under the BMO 2024-C10 pooling and servicing agreement will be: ● except (i) with respect to an excluded mortgage loan, (ii) with respect to a serviced whole loan as to which the Controlling Note is held outside the issuing entity (sometimes referred to in this Term Sheet as a “serviced outside controlled whole loan”), and (iii) during any period that a Control Termination Event has occurred and is continuing, the Controlling Class Representative; and ● with respect to any serviced outside controlled whole loan (which may include a servicing shift whole loan or any other serviced whole loan with a controlling companion loan held outside the issuing entity), if and for so long as such holder is entitled under the related co-lender agreement to exercise consent rights similar to those entitled to be exercised by the Controlling Class Representative, the holder of the related Controlling Note (during any such period, the “outside controlling note holder”). The applicable directing holder (or equivalent party) with respect to any outside serviced mortgage loan will be, in general, (i) in the event the related Controlling Note is included in the subject outside securitization transaction, the controlling class representative (or equivalent entity) under the related outside servicing agreement, and (ii) in all other cases, the third party holder of the related Controlling Note or its representative (which may be a controlling class representative (or equivalent entity) under a separate securitization transaction to which such note has been transferred (if any)), as provided in the related co-lender agreement. |
| THE INFORMATION IN THIS STRUCTURAL AND COLLATERAL TERM SHEET IS NOT COMPLETE AND MAY BE AMENDED PRIOR TO THE TIME OF SALE. THIS TERM SHEET IS NOT AN OFFER TO SELL THESE SECURITIES AND IT IS NOT A SOLICITATION OF AN OFFER TO BUY THESE SECURITIES IN ANY JURISDICTION WHERE THE OFFER OR SALE IS NOT PERMITTED. |
| | 24 | |
| Structural and Collateral Term Sheet | | BMO 2024-C10 |
| Structural Overview |
| | An “excluded mortgage loan” is, if the Controlling Class Representative is the Directing Holder with respect to the subject mortgage loan, a mortgage loan or related whole loan with respect to which the Controlling Class Representative or the holder(s) of more than 50% of the Controlling Class (by certificate balance) is (or are) a Borrower Party (as defined in the Preliminary Prospectus). |
| ■ Controlling Class Representative: | | The “Controlling Class Representative” will be the controlling class certificateholder or other representative designated by at least a majority of the controlling class certificateholders by certificate balance. The “Controlling Class” is, as of any time of determination, the most subordinate class of the Control Eligible Certificates that has an outstanding certificate balance as notionally reduced by any Cumulative Appraisal Reduction Amount allocable to such class, at least equal to 25% of the initial certificate balance of that class of certificates; provided that (except under the circumstances set forth in the next proviso) if no such class meets the preceding requirement, then the Class G-RR certificates will be the controlling class; provided, further, however, that if, at any time, the aggregate outstanding certificate balance of the classes of Principal Balance Certificates senior to the Control Eligible Certificates has been reduced to zero (without regard to the allocation of any Cumulative Appraisal Reduction Amounts), then the “Controlling Class” will be the most subordinate class of Control Eligible Certificates with an outstanding certificate balance greater than zero (without regard to the allocation of any Cumulative Appraisal Reduction Amounts). The “Control Eligible Certificates” consist of the Class E-RR, Class F-RR, Class G-RR and Class J-RR certificates. See “The Pooling and Servicing Agreement—Directing Holder” in the Preliminary Prospectus. No other class of certificates will be eligible to act as the controlling class or appoint a Controlling Class Representative. No person may exercise any of the rights and powers of the Controlling Class Representative with respect to an excluded mortgage loan. On the Closing Date, 3650 Real Estate Investment Trust 2 LLC or its affiliate, is expected to (i) purchase the Class E-RR, Class F-RR, Class G-RR and Class J-RR certificates, and (ii) to appoint itself or an affiliate as the initial Controlling Class Representative. |
■ Control Termination Event: | | A “Control Termination Event” will, with respect to any mortgage loan, either (a) occur when none of the classes of the Control Eligible Certificates has an outstanding certificate balance (as notionally reduced by any Cumulative Appraisal Reduction Amount then allocable to such class) that is at least equal to 25% of the initial certificate balance of that class of certificates or (b) be deemed to occur as described below; provided, however, that a Control Termination Event will in no event exist at any time that the certificate balance of each class of the Principal Balance Certificates senior to the Control Eligible Certificates (without regard to the allocation of Cumulative Appraisal Reduction Amounts) has been reduced to zero. With respect to excluded mortgage loans as to which the Controlling Class Representative would otherwise be the Directing Holder, a Control Termination Event will be deemed to exist. The holders of Certificates representing the majority of the certificate balance of the most senior class of Control Eligible Certificates whose certificate balance is notionally reduced to less than 25% of the initial certificate balance of that class as a result of an allocation of an Appraisal Reduction Amount or a Collateral Deficiency Amount, as applicable, to such class will have the right to challenge the Special Servicer’s Appraisal Reduction Amount determination or a Collateral Deficiency Amount determination, as applicable, and, at their sole expense, obtain a second appraisal for any serviced loan for which an Appraisal Reduction Event has occurred or as to which there exists a Collateral Deficiency Amount, under the circumstances described in the Preliminary Prospectus. |
■ Consultation Termination Event: | | A “Consultation Termination Event” will, with respect to any mortgage loan, either (a) occur when none of the classes of Control Eligible Certificates has an outstanding certificate balance, without regard to the allocation of any Cumulative Appraisal Reduction Amount, that is equal to or greater than 25% of the initial certificate balance of that class of certificates or (b) be deemed to occur as described below; provided, however, that a Consultation Termination Event will in no event exist at any time that the certificate balance of each class of the Principal Balance Certificates senior to the Control Eligible Certificates (without regard to the allocation of Cumulative Appraisal Reduction Amounts) has been reduced to zero. With respect to excluded mortgage loans as to which the Controlling Class Representative would otherwise be a Consulting Party, a Consultation Termination Event will be deemed to exist. |
■ Control/Consultation Rights: | | With respect to any Serviced Loan, the applicable Directing Holder will be entitled to have consent and/or consultation rights under the BMO 2024-C10 pooling and servicing agreement with respect to certain major decisions (including with respect to assumptions, waivers, certain loan modifications and workouts) and other matters with respect to each serviced loan. After the occurrence and during the continuance of a Control Termination Event, the consent rights of the Controlling Class Representative will terminate, and the Controlling Class Representative will retain non-binding consultation rights under the BMO 2024-C10 pooling and servicing agreement with respect to certain major decisions and other matters with respect to the serviced mortgage loans, other than (i) any excluded mortgage loan and (ii) any serviced outside controlled whole loan. |
| THE INFORMATION IN THIS STRUCTURAL AND COLLATERAL TERM SHEET IS NOT COMPLETE AND MAY BE AMENDED PRIOR TO THE TIME OF SALE. THIS TERM SHEET IS NOT AN OFFER TO SELL THESE SECURITIES AND IT IS NOT A SOLICITATION OF AN OFFER TO BUY THESE SECURITIES IN ANY JURISDICTION WHERE THE OFFER OR SALE IS NOT PERMITTED. |
| | 25 | |
| Structural and Collateral Term Sheet | | BMO 2024-C10 |
| Structural Overview |
| | After the occurrence and during the continuance of a Consultation Termination Event, all of these rights of the Controlling Class Representative with respect to the applicable serviced loans will terminate. With respect to any serviced outside controlled whole loan (including any servicing shift whole loan for so long as it is serviced under the BMO 2024-C10 pooling and servicing agreement), the holder of the related Controlling Note or its representative (which holder or representative will not be the Controlling Class Representative) will instead be entitled to exercise the above-described consent and consultation rights, to the extent provided under the related co-lender agreement. With respect to each outside serviced whole loan, the applicable outside controlling class representative or other related controlling noteholder pursuant to, and subject to the limitations set forth in, the related outside servicing agreement and the related co-lender agreement will have consent, consultation, approval and direction rights with respect to certain major decisions (including with respect to assumptions, waivers, loan modifications and workouts) regarding such outside serviced whole loan, as provided for in the related co-lender agreement and in the related outside servicing agreement. To the extent permitted under the related co-lender agreement, the Controlling Class Representative (so long as a Consultation Termination Event does not exist) may have certain consultation rights with respect to each outside serviced whole loan. See “Description of the Mortgage Pool—The Whole Loans” in the Preliminary Prospectus. |
| ■ Termination of Special Servicer: | | At any time, the special servicer (but not any outside special servicer for any outside serviced whole loan) may be removed and replaced by the applicable Directing Holder, if any, with or without cause upon satisfaction of certain conditions specified in the BMO 2024-C10 pooling and servicing agreement. After the occurrence and during the continuance of a Control Termination Event, the holders of at least 25% of the voting rights of the Regular Certificates (without regard to the application of any Appraisal Reduction Amounts) may request a vote to replace the special servicer (with respect to all of the serviced loans other than any serviced outside controlled whole loan). The subsequent vote may result in the termination and replacement of the special servicer if, within 180 days of the initial request for that vote, the holders of (a) at least 66-2/3% of the voting rights allocable to the Certificates of those holders that voted on the matter (provided that holders representing the applicable Certificateholder Quorum voted on the matter), or (b) more than 50% of the voting rights of each class of Certificates that are Non-Reduced Certificates vote affirmatively to so replace. “Non-Reduced Certificates” means each class of Principal Balance Certificates that has an outstanding certificate balance as may be notionally reduced by any Appraisal Reduction Amounts allocated to that class, equal to or greater than 25% of an amount equal to the initial certificate balance of that class of certificates minus all principal payments made on such class of certificates. Notwithstanding the foregoing, but subject to the discussion in the next paragraph, solely with respect to a serviced outside controlled whole loan (including any servicing shift whole loan, for so long as it is serviced pursuant to the BMO 2024-C10 pooling and servicing agreement), only the holder of the related Controlling Note or its representative may terminate the special servicer without cause (solely with respect to the related whole loan) and appoint a replacement special servicer for that whole loan. If the operating advisor determines, in its sole discretion exercised in good faith, that (1) the special servicer has failed to comply with the servicing standard and (2) a replacement of the special servicer would be in the best interest of the certificateholders (as a collective whole), the operating advisor will have the right to recommend the replacement of the special servicer with respect to the serviced loans, resulting in a solicitation of a certificateholder vote. The subsequent vote may result in the termination and replacement of the special servicer if, within 180 days of the initial request for that vote, the holders of at least a majority of the aggregate outstanding principal balance of the Certificates of those holders that voted on the matter (provided that holders representing the applicable Certificateholder Quorum vote on the matter) vote affirmatively to so replace. “Certificateholder Quorum” means a quorum that: (a) for purposes of a vote to terminate and replace the special servicer or the asset representations reviewer at the request of the holders of Certificates evidencing not less than 25% of the voting rights (without regard to the application of any Appraisal Reduction Amounts), consists of the holders of Certificates evidencing at least 50% of the voting rights (taking into account the allocation of any Appraisal Reduction Amounts to notionally reduce the certificate balances of the respective classes of Principal Balance Certificates) of all of the Regular Certificates, on an aggregate basis; and (b) for purposes of a vote to terminate and replace the special servicer based on a recommendation of the operating advisor, consists of the holders of Certificates evidencing at least 20% of the aggregate of the outstanding principal balances of all Certificates, with |
| THE INFORMATION IN THIS STRUCTURAL AND COLLATERAL TERM SHEET IS NOT COMPLETE AND MAY BE AMENDED PRIOR TO THE TIME OF SALE. THIS TERM SHEET IS NOT AN OFFER TO SELL THESE SECURITIES AND IT IS NOT A SOLICITATION OF AN OFFER TO BUY THESE SECURITIES IN ANY JURISDICTION WHERE THE OFFER OR SALE IS NOT PERMITTED. |
| | 26 | |
| Structural and Collateral Term Sheet | | BMO 2024-C10 |
| Structural Overview |
| | such quorum including at least (3) holders and/or beneficial owners of Certificates that are not “affiliated” (as defined in Regulation RR) with each other. The related outside special servicer under each outside servicing agreement generally may be (or, if the applicable outside servicing agreement has not yet been executed, it is anticipated that such outside special servicer may be) replaced by the related outside controlling class representative (or an equivalent party), or the vote of the requisite holders of certificates issued, under the applicable outside servicing agreement (depending on whether or not the equivalent of a control termination event or a consultation termination event exists under that outside servicing agreement) or by any applicable other controlling noteholder under the related co-lender agreement in a manner generally similar to the manner in which the special servicer may be replaced under the BMO 2024-C10 pooling and servicing agreement as described above in this “Termination of Special Servicer” section (although there will be differences, in particular as regards certificateholder votes and the timing of when an outside special servicer may be terminated based on the recommendation of an operating advisor). If the special servicer, to its knowledge, becomes a Borrower Party with respect to a mortgage loan, the special servicer will not be permitted to act as special servicer with respect to that mortgage loan. Subject to certain limitations described in the Preliminary Prospectus, any applicable Directing Holder will be entitled to appoint a replacement special servicer for that mortgage loan. If there is no applicable Directing Holder or if the applicable Directing Holder does not take action to appoint a replacement special servicer within the requisite time period, a replacement special servicer will be appointed in the manner specified in the BMO 2024-C10 pooling and servicing agreement. |
| ■ Voting Rights: | | At all times during the term of the BMO 2024-C10 pooling and servicing agreement, the voting rights for the Certificates (the “voting rights”) will be allocated among the respective classes of certificateholders in the following percentages: (1) 1% in the aggregate in the case of the respective classes of the Class X Certificates, allocated pro rata based upon their respective notional amounts as of the date of determination (for so long as the notional amount of at least one class of the Class X Certificates is greater than zero), and (2) in the case of any class of Principal Balance Certificates, a percentage equal to the product of 99% (or, if the notional amounts of all classes of the Class X Certificates have been reduced to zero, 100%) and a fraction, the numerator of which is equal to the certificate balance of such class of Principal Balance Certificates as of the date of determination, and the denominator of which is equal to the aggregate of the certificate balances of all classes of the Principal Balance Certificates, in each case, as of the date of determination, provided, that in certain circumstances described under “The Pooling and Servicing Agreement” in the Preliminary Prospectus, voting rights will only be exercisable by holders of Certificates that are Non-Reduced Certificates and/or may otherwise be exercisable or allocated in a manner that takes into account the allocation of Appraisal Reduction Amounts. The voting rights of any class of certificates are required to be allocated among certificateholders of such class in proportion to their respective percentage interests. The Class R certificates will not be entitled to any voting rights. |
| ■ Servicing Compensation: | | Modification Fees: Certain fees resulting from modifications, amendments, waivers or other changes to the terms of the loan documents, as more fully described in the Preliminary Prospectus, will be used to offset expenses on the related serviced mortgage loan (i.e. reimburse the trust for certain expenses, including unreimbursed advances and interest on unreimbursed advances previously incurred (other than special servicing fees, workout fees and liquidation fees) on the related serviced mortgage loan but not yet reimbursed to the trust or servicers or to pay expenses (other than special servicing fees, workout fees and liquidation fees) that are still outstanding in each case unless as part of the written modification the related borrower is required to pay these amounts on a going forward basis or in the future). Any excess modification fees not so applied to offset expenses will be available as compensation to the master servicer and/or special servicer. Within any prior 12-month period, all such excess modification fees earned by the master servicer or by the special servicer (after taking into account the offset described below applied during such 12-month period) with respect to any serviced mortgage loan will be subject to a cap equal to the greater of (i) 1% of the outstanding principal balance of such mortgage loan after giving effect to such transaction and (ii) $25,000. All excess modification fees earned by the special servicer will be required to offset any future workout fees or liquidation fees payable with respect to the related serviced mortgage loan or related REO property; provided, that if the serviced mortgage loan ceases being a corrected loan, and is subject to a subsequent modification, any excess modification fees earned by the special servicer prior to such serviced mortgage loan ceasing to be a corrected loan will no longer be offset against |
| THE INFORMATION IN THIS STRUCTURAL AND COLLATERAL TERM SHEET IS NOT COMPLETE AND MAY BE AMENDED PRIOR TO THE TIME OF SALE. THIS TERM SHEET IS NOT AN OFFER TO SELL THESE SECURITIES AND IT IS NOT A SOLICITATION OF AN OFFER TO BUY THESE SECURITIES IN ANY JURISDICTION WHERE THE OFFER OR SALE IS NOT PERMITTED. |
| | 27 | |
| Structural and Collateral Term Sheet | | BMO 2024-C10 |
| Structural Overview |
| | future liquidation fees and workout fees unless such serviced mortgage loan ceased to be a corrected loan within 18 months of it becoming a modified mortgage loan. Penalty Fees: All late fees and default interest will first be used to reimburse certain expenses previously incurred with respect to the related mortgage loan (including special servicing fees, workout fees and liquidation fees) but not yet reimbursed to the trust, the master servicer or the special servicer or to pay certain expenses (including special servicing fees, workout fees and liquidation fees) that are still outstanding on the related mortgage loan, and any excess received with respect to a serviced loan will be paid to the master servicer (for penalty fees accrued while a non-specially serviced loan) and the special servicer (for penalty fees accrued while a specially serviced loan). To the extent any amounts reimbursed out of penalty charges are subsequently recovered on a related serviced loan, they will be paid to the master servicer or special servicer who would have been entitled to the related penalty charges that were previously used to reimburse such expense. Liquidation / Workout Fees: Liquidation fees will be calculated at the lesser of (a) 1.0% or (b) with respect to any serviced mortgage loan (or related serviced whole loan, if applicable) or related REO Property, such lesser rate as would result in a liquidation fee of $1,000,000, for each serviced loan that is a specially serviced loan and any REO property, subject in any case to a minimum liquidation fee of $25,000. For any serviced loan that is a corrected loan, workout fees will be calculated at the lesser of (a) 1.0% and (b) such lower rate as would result in a workout fee of $1,000,000 when applied to each expected payment of principal and interest (other than (i) default interest and (ii) any “excess interest” accrued after the related anticipated repayment date on any mortgage loan with an anticipated repayment date) on the related serviced loan (or related serviced whole loan, if applicable) from the date such serviced loan becomes a corrected loan through and including the then related maturity date, subject in any case to a minimum workout fee of $25,000. Notwithstanding the foregoing, in connection with a maturity default, no liquidation or workout fee will be payable in connection with a payoff or refinancing of the related serviced loan within 90 days of the maturity default, but the special servicer may collect and retain appropriate fees from the related borrower in connection with the subject liquidation or workout. In the case of an outside serviced whole loan, calculation of the foregoing amounts payable to the related outside servicer or outside special servicer may be different than as described above. For example, the extent to which modification fees and penalty fees are applied to offset expenses may be different and liquidation fees and workout fees may be subject to different caps or no caps. |
| ■ Operating Advisor: | | The operating advisor will, in general and under certain circumstances described in the Preliminary Prospectus, have the following rights and responsibilities with respect to the serviced mortgage loans: ● reviewing the actions of the special servicer with respect to specially serviced loans and with respect to certain major decisions regarding non-specially serviced loans as to which the operating advisor has consultation rights; ● reviewing reports provided by the special servicer to the extent set forth in the BMO 2024-C10 pooling and servicing agreement; ● reviewing for accuracy certain calculations made by the special servicer; ● issuing an annual report generally setting forth, among other things, its assessment of whether the special servicer is performing its duties in compliance with the servicing standard and the BMO 2024-C10 pooling and servicing agreement and identifying any material deviations therefrom; ● recommending the replacement of the special servicer if the operating advisor determines, in its sole discretion exercised in good faith, that (1) the special servicer has failed to comply with the servicing standard and (2) a replacement of the special servicer would be in the best interest of the certificateholders (as a collective whole); and ● after the occurrence and during the continuance of an Operating Advisor Consultation Trigger Event, consulting on a non-binding basis with the special servicer with respect to certain major decisions (and such other matters as are set forth in the BMO 2024-C10 pooling and servicing agreement) in respect of the applicable serviced mortgage loan(s) and/or related companion loan(s). An “Operating Advisor Consultation Trigger Event” will occur when the aggregate outstanding certificate balance of the HRR Certificates (as notionally reduced by any Cumulative Appraisal Reduction Amounts then allocable to the HRR Certificates) is 25% or less of the initial aggregate certificate balance of the HRR Certificates. With respect to excluded mortgage loans, an Operating Advisor Consultation Trigger Event will be deemed to exist. |
| THE INFORMATION IN THIS STRUCTURAL AND COLLATERAL TERM SHEET IS NOT COMPLETE AND MAY BE AMENDED PRIOR TO THE TIME OF SALE. THIS TERM SHEET IS NOT AN OFFER TO SELL THESE SECURITIES AND IT IS NOT A SOLICITATION OF AN OFFER TO BUY THESE SECURITIES IN ANY JURISDICTION WHERE THE OFFER OR SALE IS NOT PERMITTED. |
| | 28 | |
| Structural and Collateral Term Sheet | | BMO 2024-C10 |
| Structural Overview |
| | Notwithstanding the foregoing, the operating advisor will generally have no obligations or consultation rights as operating advisor under the BMO 2024-C10 pooling and servicing agreement with respect to any outside serviced mortgage loan or any related REO property. The operating advisor will be subject to termination and replacement if the holders of at least 15% of the voting rights of Non-Reduced Certificates vote to terminate and replace the operating advisor and such termination and replacement is affirmatively voted for by the holders of more than 50% of the voting rights allocable to the Non-Reduced Certificates of those holders that exercise their right to vote (provided that holders entitled to exercise at least 50% of the voting rights allocable to the Non-Reduced Certificates exercise their right to vote within 180 days of the initial request for a vote). The holders initiating such vote will be responsible for the fees and expenses in connection with the vote and replacement. See “The Pooling and Servicing Agreement—Operating Advisor” in the Preliminary Prospectus. |
| ■ Asset Representations Reviewer: | | The asset representations reviewer will be required to review certain delinquent mortgage loans after a specified delinquency threshold has been exceeded and the required percentage of certificateholders vote to direct a review of such delinquent mortgage loans. An asset review will occur when either (1) mortgage loans with an aggregate outstanding principal balance of 30% or more of the aggregate outstanding principal balance of all of the mortgage loans (including any REO mortgage loans) held by the issuing entity as of the end of the applicable collection period are at least 60 days delinquent in respect of their related monthly payments or balloon payment, if any (for purposes of this paragraph, “delinquent loans”) or (2) at least 15 mortgage loans are delinquent loans as of the end of the applicable collection period and the aggregate outstanding principal balance of such delinquent loans constitutes at least 20% of the aggregate outstanding principal balance of all of the mortgage loans (including any REO mortgage loans) held by the issuing entity as of the end of the applicable collection period. The asset representations reviewer may be terminated and replaced without cause. Upon (i) the written direction of certificateholders evidencing not less than 25% of the voting rights requesting a vote to terminate and replace the asset representations reviewer with a proposed successor asset representations reviewer that is an eligible asset representations reviewer, and (ii) payment by such holders to the certificate administrator of the reasonable fees and expenses to be incurred by the certificate administrator in connection with administering such vote, the certificate administrator will promptly provide notice of such request to all certificateholders and the asset representations reviewer by posting such notice on its internet website, and by mailing such notice to all certificateholders and the asset representations reviewer. Upon the affirmative vote of certificateholders evidencing at least 75% of the voting rights allocable to those holders that exercise their right to vote (provided that holders representing the applicable Certificateholder Quorum exercise their right to vote within 180 days of the initial request for a vote), the trustee will be required to terminate all of the rights and obligations of the asset representations reviewer under the BMO 2024-C10 pooling and servicing agreement by written notice to the asset representations reviewer, and the proposed successor asset representations reviewer will be appointed. See “The Pooling and Servicing Agreement—The Asset Representations Reviewer” in the Preliminary Prospectus. |
| ■ Dispute Resolution Provisions: | | The mortgage loan sellers will be subject to the dispute resolution provisions set forth in the BMO 2024-C10 pooling and servicing agreement to the extent those provisions are triggered with respect to any mortgage loan sold to the depositor by a mortgage loan seller and such mortgage loan seller will be obligated under the related mortgage loan purchase agreement to comply with all applicable provisions and to take part in any mediation or arbitration proceedings that may result. Generally, in the event that a Repurchase Request (as defined in the Preliminary Prospectus) with respect to a mortgage loan is not “Resolved” (as defined below) within 180 days after the related mortgage loan seller receives such Repurchase Request, then the enforcing servicer will be required to send a notice to the “Initial Requesting Certificateholder” (if any) indicating the enforcing servicer’s intended course of action with respect to the Repurchase Request. If (a) the enforcing servicer’s intended course of action with respect to the Repurchase Request does not involve pursuing further action to exercise rights against the applicable mortgage loan seller with respect to the Repurchase Request and the Initial Requesting Certificateholder, if any, or any other certificateholder or certificate owner of Certificates wishes to exercise its right to refer the matter to mediation (including nonbinding arbitration) or arbitration, or (b) the enforcing servicer’s intended course of action is to pursue further action to exercise rights against the related mortgage loan seller with respect to the Repurchase Request but the Initial Requesting Certificateholder, if any, or any other certificateholder or certificate owner of Certificates does not agree with the dispute resolution method selected by the enforcing servicer, then the Initial Requesting Certificateholder, if any, or such other certificateholder or certificate owner may deliver a written notice to the enforcing servicer indicating its intent to exercise its right to refer the matter to either mediation or arbitration. In addition, any other certificateholder or certificate owner of Certificates may deliver, within the time frame provided in the BMO 2024-C10 pooling and servicing agreement, a written notice requesting the right to participate in any dispute resolution consultation that is conducted by the enforcing servicer following the enforcing servicer’s receipt of the notice described in the preceding sentence. |
| THE INFORMATION IN THIS STRUCTURAL AND COLLATERAL TERM SHEET IS NOT COMPLETE AND MAY BE AMENDED PRIOR TO THE TIME OF SALE. THIS TERM SHEET IS NOT AN OFFER TO SELL THESE SECURITIES AND IT IS NOT A SOLICITATION OF AN OFFER TO BUY THESE SECURITIES IN ANY JURISDICTION WHERE THE OFFER OR SALE IS NOT PERMITTED. |
| | 29 | |
| Structural and Collateral Term Sheet | | BMO 2024-C10 |
| Structural Overview |
| | “Resolved” means, with respect to a Repurchase Request, (i) that any material breach of representations and warranties or a material document defect has been cured, (ii) the related mortgage loan has been repurchased in accordance with the related mortgage loan purchase agreement, (iii) a mortgage loan has been substituted for the related mortgage loan in accordance with the related mortgage loan purchase agreement, (iv) the applicable mortgage loan seller has made a “loss of value payment”, (v) a contractually binding agreement has been entered into between the enforcing servicer, on behalf of the issuing entity, and the related mortgage loan seller that settles the related mortgage loan seller’s obligations under the related mortgage loan purchase agreement, or (vi) the related mortgage loan is no longer property of the issuing entity as a result of a sale or other disposition in accordance with the BMO 2024-C10 pooling and servicing agreement. See “The Pooling and Servicing Agreement—Dispute Resolution Provisions” in the Preliminary Prospectus. |
| ■ Liquidated Loan Waterfall: | | Upon liquidation of any mortgage loan, all net liquidation proceeds related to the mortgage loan (but not any related companion loan) will be applied (after allocation to offset certain advances and expenses) so that amounts allocated as a recovery of accrued and unpaid interest will not, in the first instance, include any delinquent interest that was not advanced as a result of Appraisal Reduction Amounts or interest that accrued on any junior note(s) if such mortgage loan is an AB Modified Loan. After the adjusted interest amount is so allocated, any remaining liquidation proceeds will be allocated to pay principal on the mortgage loan until the unpaid principal amount of the mortgage loan has been reduced to zero. Any remaining liquidation proceeds will then be allocated to pay delinquent interest that was not advanced as a result of Appraisal Reduction Amounts and any interest that accrued on any junior note(s) if such mortgage loan is an AB Modified Loan. |
| ■ Credit Risk Retention: | | This securitization transaction will be subject to the credit risk retention rules of Section 15G of the Securities Exchange Act of 1934, as amended. An economic interest in the credit risk of the mortgage loans in this securitization transaction is expected to be retained pursuant to risk retention regulations (as codified at 17 CFR Part 246) promulgated under Section 15G (“Regulation RR”), as an “eligible horizontal residual interest” in the form of the HRR Certificates. 3650 Real Estate Investment Trust 2 LLC will act as retaining sponsor under Regulation RR for this securitization transaction and is expected, on the closing date, to satisfy its risk retention obligation through the acquisition and retention (directly or through one or more of its majority-owned affiliates) of all of the HRR Certificates. For a further discussion of the manner in which the credit risk retention requirements are expected to be satisfied by 3650 Real Estate Investment Trust 2 LLC, as retaining sponsor for this securitization transaction, see “Credit Risk Retention” in the Preliminary Prospectus. |
| ■ Investor Communications: | | The certificate administrator is required to include on any Form 10–D any request received from a certificateholder to communicate with other certificateholders related to certificateholders exercising their rights under the terms of the BMO 2024-C10 pooling and servicing agreement. Any certificateholder wishing to communicate with other certificateholders regarding the exercise of its rights under the terms of the BMO 2024-C10 pooling and servicing agreement will be able to deliver a written request signed by an authorized representative of the requesting investor to the certificate administrator. |
| ■ Deal Website: | | The certificate administrator will maintain a deal website including, but not limited to: ● all special notices delivered. ● summaries of final asset status reports. ● all appraisals in connection with an appraisal reduction plus any subsequent appraisal updates. ● an “Investor Q&A Forum” and a voluntary investor registry. |
| ■ Cleanup Call: | | On any Distribution Date on which the aggregate unpaid principal balance of the mortgage loans (including mortgage loans as to which the related mortgaged properties have become REO properties) remaining in the issuing entity is less than 1% of the aggregate principal balance of the pool of mortgage loans as of the Cut-off Date (excluding for the purposes of this calculation, the unpaid principal balance of any mortgage loan with an anticipated repayment date, but in such case only if the option described above is exercised after the Distribution Date related to the collection period in which the corresponding anticipated repayment date occurs), certain specified persons will have the option to purchase all of the remaining mortgage loans (and all property acquired through exercise of remedies in respect of any mortgage loan) at the price specified in the Preliminary Prospectus. Exercise of the option will terminate the issuing entity and retire the then outstanding certificates. If the aggregate certificate balances of the Class A-1, Class A-3, Class A-4, Class A-5, Class A-SB, Class A-S, Class B, Class C, Class D and Class E-RR certificates and the notional amounts of the Class X-A, Class X-B and Class X-D certificates have been reduced to zero and if the master servicer has received from the remaining certificateholders the payment specified in the BMO 2024-C10 pooling and servicing agreement, the issuing entity could also be terminated in connection with an exchange of all the then-outstanding certificates (excluding the Class R certificates) for the mortgage |
| THE INFORMATION IN THIS STRUCTURAL AND COLLATERAL TERM SHEET IS NOT COMPLETE AND MAY BE AMENDED PRIOR TO THE TIME OF SALE. THIS TERM SHEET IS NOT AN OFFER TO SELL THESE SECURITIES AND IT IS NOT A SOLICITATION OF AN OFFER TO BUY THESE SECURITIES IN ANY JURISDICTION WHERE THE OFFER OR SALE IS NOT PERMITTED. |
| | 30 | |
| Structural and Collateral Term Sheet | | BMO 2024-C10 |
| Structural Overview |
| | loans remaining in the issuing entity, as further described under “The Pooling and Servicing Agreement—Optional Termination; Optional Mortgage Loan Purchase” in the Preliminary Prospectus. |
The Publicly Offered Certificates involve certain risks and may not be suitable for all investors. For information regarding certain risks associated with an investment in the Publicly Offered Certificates, see “Summary of Risk Factors” and “Risk Factors” in the Preliminary Prospectus. Capitalized terms used but not otherwise defined in this Term Sheet have the respective meanings assigned to those terms in the Preliminary Prospectus.
| THE INFORMATION IN THIS STRUCTURAL AND COLLATERAL TERM SHEET IS NOT COMPLETE AND MAY BE AMENDED PRIOR TO THE TIME OF SALE. THIS TERM SHEET IS NOT AN OFFER TO SELL THESE SECURITIES AND IT IS NOT A SOLICITATION OF AN OFFER TO BUY THESE SECURITIES IN ANY JURISDICTION WHERE THE OFFER OR SALE IS NOT PERMITTED. |
| | 31 | |
| Structural and Collateral Term Sheet | | BMO 2024-C10 |
| No. 1 – Newport Centre |

| THE INFORMATION IN THIS STRUCTURAL AND COLLATERAL TERM SHEET IS NOT COMPLETE AND MAY BE AMENDED PRIOR TO THE TIME OF SALE. THIS TERM SHEET IS NOT AN OFFER TO SELL THESE SECURITIES AND IT IS NOT A SOLICITATION OF AN OFFER TO BUY THESE SECURITIES IN ANY JURISDICTION WHERE THE OFFER OR SALE IS NOT PERMITTED. |
| | 32 | |
| Structural and Collateral Term Sheet | | BMO 2024-C10 |
| No. 1 – Newport Centre |
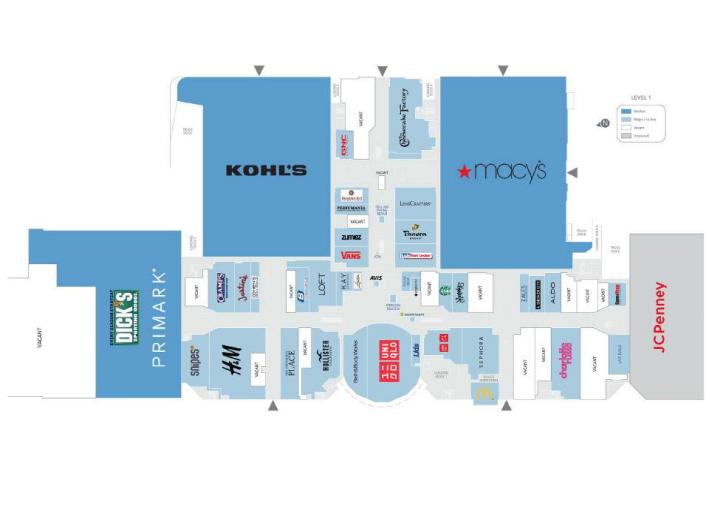
| THE INFORMATION IN THIS STRUCTURAL AND COLLATERAL TERM SHEET IS NOT COMPLETE AND MAY BE AMENDED PRIOR TO THE TIME OF SALE. THIS TERM SHEET IS NOT AN OFFER TO SELL THESE SECURITIES AND IT IS NOT A SOLICITATION OF AN OFFER TO BUY THESE SECURITIES IN ANY JURISDICTION WHERE THE OFFER OR SALE IS NOT PERMITTED. |
| | 33 | |
| Structural and Collateral Term Sheet | | BMO 2024-C10 |
| No. 1 – Newport Centre |
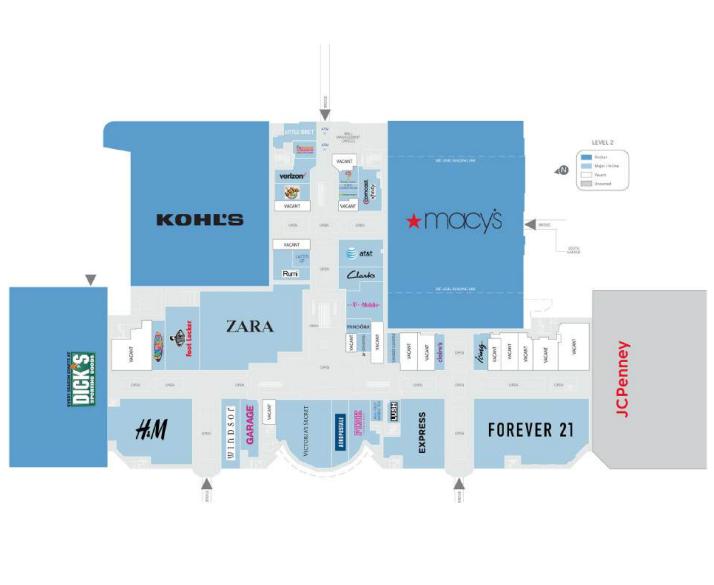
| THE INFORMATION IN THIS STRUCTURAL AND COLLATERAL TERM SHEET IS NOT COMPLETE AND MAY BE AMENDED PRIOR TO THE TIME OF SALE. THIS TERM SHEET IS NOT AN OFFER TO SELL THESE SECURITIES AND IT IS NOT A SOLICITATION OF AN OFFER TO BUY THESE SECURITIES IN ANY JURISDICTION WHERE THE OFFER OR SALE IS NOT PERMITTED. |
| | 34 | |
| Structural and Collateral Term Sheet | | BMO 2024-C10 |
| No. 1 – Newport Centre |

| THE INFORMATION IN THIS STRUCTURAL AND COLLATERAL TERM SHEET IS NOT COMPLETE AND MAY BE AMENDED PRIOR TO THE TIME OF SALE. THIS TERM SHEET IS NOT AN OFFER TO SELL THESE SECURITIES AND IT IS NOT A SOLICITATION OF AN OFFER TO BUY THESE SECURITIES IN ANY JURISDICTION WHERE THE OFFER OR SALE IS NOT PERMITTED. |
| | 35 | |
| Structural and Collateral Term Sheet | | BMO 2024-C10 |
| No. 1 – Newport Centre |

| THE INFORMATION IN THIS STRUCTURAL AND COLLATERAL TERM SHEET IS NOT COMPLETE AND MAY BE AMENDED PRIOR TO THE TIME OF SALE. THIS TERM SHEET IS NOT AN OFFER TO SELL THESE SECURITIES AND IT IS NOT A SOLICITATION OF AN OFFER TO BUY THESE SECURITIES IN ANY JURISDICTION WHERE THE OFFER OR SALE IS NOT PERMITTED. |
| | 36 | |
| Structural and Collateral Term Sheet | | BMO 2024-C10 |
| No. 1 – Newport Centre |
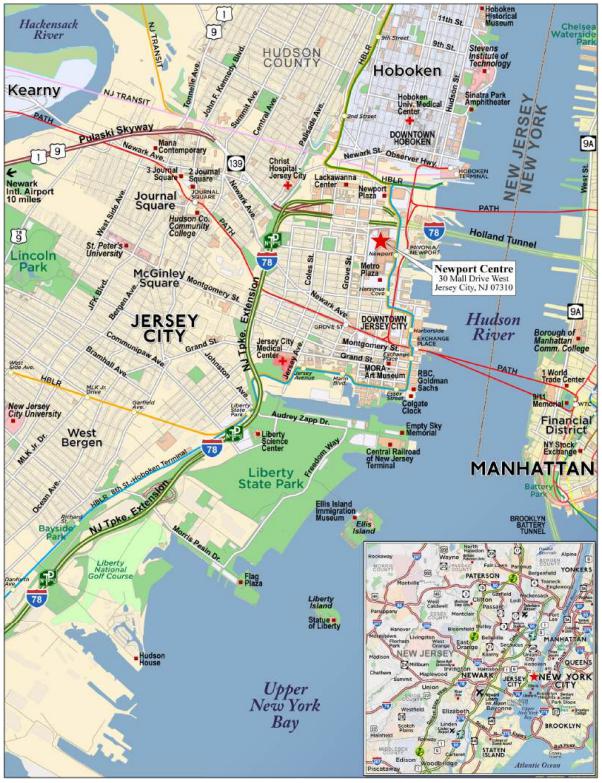
| THE INFORMATION IN THIS STRUCTURAL AND COLLATERAL TERM SHEET IS NOT COMPLETE AND MAY BE AMENDED PRIOR TO THE TIME OF SALE. THIS TERM SHEET IS NOT AN OFFER TO SELL THESE SECURITIES AND IT IS NOT A SOLICITATION OF AN OFFER TO BUY THESE SECURITIES IN ANY JURISDICTION WHERE THE OFFER OR SALE IS NOT PERMITTED. |
| | 37 | |
| Structural and Collateral Term Sheet | | BMO 2024-C10 |
| No. 1 – Newport Centre |
| Mortgage Loan Information | | Property Information |
| Mortgage Loan Sellers: | GACC, GSMC | | Single Asset / Portfolio: | Single Asset |
| Original Principal Balance(1): | $60,000,000 | | Title: | Fee |
| Cut-off Date Principal Balance(1): | $60,000,000 | | Property Type – Subtype: | Retail – Super Regional Mall |
| % of IPB: | 8.3% | | Net Rentable Area (SF): | 966,186 |
| Loan Purpose: | Refinance | | Location: | Jersey City, NJ |
| Borrower: | Newport Centre, LLC | | Year Built / Renovated: | 1987 / 2006 |
| Borrower Sponsors:(2) | Simon Newport Limited Partnership and LF Newport Jersey Limited Partnership | | Occupancy: | 92.5% |
| Interest Rate: | 5.4370% | | Occupancy Date: | 7/29/2024 |
| Note Date: | 8/22/2024 | | 4th Most Recent NOI (As of): | $26,124,900 (12/31/2021) |
| Maturity Date: | 9/1/2034 | | 3rd Most Recent NOI (As of): | $27,402,194 (12/31/2022) |
| Interest-only Period: | 120 months | | 2nd Most Recent NOI (As of): | $27,822,648 (12/31/2023) |
| Original Term: | 120 months | | Most Recent NOI (As of): | $27,014,364 (TTM 6/30/2024) |
| Original Amortization Term: | None | | UW Economic Occupancy: | 95.4% |
| Amortization Type: | Interest Only | | UW Revenues: | $47,183,709 |
| Call Protection(3): | L(26),D(87),O(7) | | UW Expenses: | $18,421,481 |
| Lockbox / Cash Management: | Hard / Springing | | UW NOI: | $28,762,228 |
| Additional Debt(1): | Yes | | UW NCF: | $27,602,805 |
| Additional Debt Balance(1): | $128,000,000 | | Appraised Value / Per SF: | $436,800,000 / $452 |
| Additional Debt Type(1): | Pari Passu | | Appraisal Date: | 7/11/2024 |
| | | | | |
| Escrows and Reserves(4) | | Financial Information(1) |
| | Initial | Monthly | Initial Cap | | Cut-off Date Loan / SF: | $195 |
| Taxes: | $0 | Springing | N/A | | Maturity Date Loan / SF: | $195 |
| Insurance: | $0 | Springing | N/A | | Cut-off Date LTV: | 43.0% |
| Replacement Reserves: | $0 | Springing | N/A | | Maturity Date LTV: | 43.0% |
| TI / LC Reserve: | $0 | Springing | N/A | | UW NCF DSCR: | 2.66x |
| | | | | | UW NOI Debt Yield: | 15.3% |
| | | | | | | |
| | | | | | | |
| Sources and Uses |
| Sources | Proceeds | % of Total | | Uses | Proceeds | % of Total |
| Whole Loan(1) | $188,000,000 | 100.0% | | Loan Payoff: | $156,209,178 | 83.1 | % |
| | | | | Return of Equity: | 30,599,394 | 16.3 | |
| | | | | Closing Costs: | 1,191,428 | 0.6 | |
| Total Sources | $188,000,000 | 100.0% | | Total Uses: | $188,000,000 | 100.0 | % |
| (1) | The Newport Centre Mortgage Loan (as defined below) is part of the Newport Centre Whole Loan (as defined below), which is evidenced by nine pari passu promissory notes with an aggregate original principal balance of $188,000,000. The Financial Information presented above is based on the aggregate original principal balance of the promissory notes comprising the Newport Centre Whole Loan. |
| (2) | The borrower sponsors are affiliated with the borrower sponsor of the Grapevine Mills Mortgage Loan, which is also being contributed to the BMO 2024-C10 transaction. |
| (3) | Defeasance of the Newport Centre Whole Loan is permitted at any time after the earlier to occur of (a) October 1, 2027 and (b) the end of the two-year period commencing on the closing date of the securitization of the last promissory note representing a portion of the Newport Centre Whole Loan to be securitized. The assumed defeasance lockout period of 26 payments is based on the closing date of the BMO 2024-C10 transaction in November 2024. The actual lockout period may be longer. |
| (4) | See “Escrows and Reserves” below for further discussion of reserve information. |
The Loan. The largest mortgage loan (the “Newport Centre Mortgage Loan”) is part of a whole loan (“Newport Centre Whole Loan”) that is evidenced by nine pari passu promissory notes with an aggregate outstanding principal balance as of the Cut-off Date of $188,000,000, and accrues interest at a fixed rate of 5.43700% per annum on an Actual/360 basis. The Newport Centre Whole Loan is secured by the borrower’s fee interest in a super regional mall located in Jersey City, New Jersey (the “Newport Centre Property”). The Newport Centre Whole Loan was co-originated on August 22, 2024 by German American Capital Corporation (“GACC”) and Goldman Sachs Bank USA (“GSBI”). The Newport Centre Mortgage Loan is evidenced by non-controlling notes A-1-2-1, A-1-3, and A-2-1-1 and has an outstanding principal balance as of the Cut-off Date of $60,000,000. The scheduled maturity date of the Newport Centre Whole Loan is September 1, 2034.
| THE INFORMATION IN THIS STRUCTURAL AND COLLATERAL TERM SHEET IS NOT COMPLETE AND MAY BE AMENDED PRIOR TO THE TIME OF SALE. THIS TERM SHEET IS NOT AN OFFER TO SELL THESE SECURITIES AND IT IS NOT A SOLICITATION OF AN OFFER TO BUY THESE SECURITIES IN ANY JURISDICTION WHERE THE OFFER OR SALE IS NOT PERMITTED. |
| | 38 | |
| Structural and Collateral Term Sheet | | BMO 2024-C10 |
| No. 1 – Newport Centre |
The Newport Centre Whole Loan will be serviced under the pooling and servicing agreement for the BANK 2024-BNK48 securitization trust until the controlling note A-1-1 is securitized, at which time servicing will shift to the pooling and servicing agreement for such future securitization. See “Description of the Mortgage Pool—The Whole Loans” and “The Pooling and Servicing Agreement—Servicing of the Outside Serviced Mortgage Loans—Servicing Shift Mortgage Loans” in the Preliminary Prospectus.
The table below identifies the promissory notes that comprise the Newport Centre Whole Loan:
| Whole Loan Summary |
| Note | Original Balance | Cut-off Date Balance | Note Holder | Controlling Piece |
| A-1-1(1) | $40,000,000 | $40,000,000 | GACC | Yes |
| A-1-2-1 | $20,000,000 | $20,000,000 | BMO 2024-C10 | No |
| A-1-2-2(1) | $10,000,000 | $10,000,000 | GACC | No |
| A-1-3 | $20,000,000 | $20,000,000 | BMO 2024-C10 | No |
| A-1-4(1) | $30,000,000 | $30,000,000 | GACC | No |
| A-2-1-1 | $20,000,000 | $20,000,000 | BMO 2024-C10 | No |
| A-2-1-2(1) | $10,000,000 | $10,000,000 | GSBI | No |
| A-2-2 | $20,000,000 | $20,000,000 | BANK 2024-BNK48 | No |
| A-2-3(1) | $18,000,000 | $18,000,000 | GSBI | No |
| Whole Loan | $188,000,000 | $188,000,000 | | |
| (1) | Expected to be contributed to one or more future securitization trusts. |
The Property. The Newport Centre Property is a 966,186 square foot super regional mall property located in Jersey City, New Jersey. The Newport Centre Property was built in 1987 and most recently renovated in 2006 and is a three-story enclosed mall situated on a 33.39-acre parcel. The Newport Centre Property is anchored by Kohl’s, Macy’s and Sears (currently occupied by Dick’s House of Sport & Primark) and shadow anchored by JC Penney. Macy’s owns its improvements and ground leases the underlying land from the borrower. Sears also owns its improvements and ground leases the underlying land from the borrower; however Sears subleases its space to Dick’s House of Sport & Primark with a small portion of the bottom floor space currently vacant. JC Penney owns its store and the underlying land and is not part of the collateral for the Newport Centre Whole Loan. JCPenney serves as a non-collateral anchor of the Newport Centre Property. Notable tenants at the Newport Centre Property include H&M, AMC Theatres and Zara. As of July 29, 2024 the Newport Centre Property was 92.5% leased.
The following table presents certain information relating to the sales history of certain tenants at the Newport Centre Property:
| Sales History(1) |
| | 2021 Sales (PSF) | 2022 Sales (PSF) | 2023 Sales (PSF) | TTM 6/30/2024 Sales
(PSF) |
| H&M | $331.05 | $330.34 | $275.99 | $263.61 |
| AMC Theatres | $101.45 | $197.28 | $231.20 | $208.39 |
| Zara | $454.65 | $472.78 | $496.87 | $473.28 |
| Kohl's | $57.89 | $86.68 | $99.73 | $55.41 |
| Victoria's Secret | $595.86 | $568.97 | $534.11 | $518.28 |
| (1) | All sales information presented herein with respect to the Newport Centre Property is based upon information obtained from the borrower. |
Major Tenants. The three largest tenants based on underwritten base rent are H&M, AMC Theatres, and Sears (subject to a ground lease that is subleased to Dick’s House of Sport & Primark).
H&M (26,863 SF; 2.8% of NRA; 7.0% of underwritten annual rent): H&M is a multinational fashion and design company based in Sweden that focuses on fast-fashion clothing. Founded in 1947, H&M now has over 4,000 stores in more than 75 markets. H&M’s current lease at the Newport Centre Property expires in January 2030. H&M has no termination options.
AMC Theatres (45,165 SF; 4.7% of NRA; 6.9% of underwritten annual rent): AMC Theatres is the largest movie theater chain in the United States and in the world. AMC Theatres has approximately 900 theatres and more than 10,000 screens
| THE INFORMATION IN THIS STRUCTURAL AND COLLATERAL TERM SHEET IS NOT COMPLETE AND MAY BE AMENDED PRIOR TO THE TIME OF SALE. THIS TERM SHEET IS NOT AN OFFER TO SELL THESE SECURITIES AND IT IS NOT A SOLICITATION OF AN OFFER TO BUY THESE SECURITIES IN ANY JURISDICTION WHERE THE OFFER OR SALE IS NOT PERMITTED. |
| | 39 | |
| Structural and Collateral Term Sheet | | BMO 2024-C10 |
| No. 1 – Newport Centre |
across the globe serving approximately 350 million guests annually. In the U.S., AMC Theatres operates approximately 660 theatres with 8,200 screens serving 265 million guests. At the Newport Centre Property, AMC Theatres has 11 screens. AMC Theatres has been at the Newport Centre Property since December 1987 and its lease expires in January 2026 with three, five-year renewal options remaining and has no termination options.
Sears (subleased to Dick’s House of Sport & Primark) (192,000 SF; 19.9% of NRA; 6.8% of underwritten annual rent): Sears is an American retailer offering a range of home merchandise, apparel and automotive products and services through Sears-branded and affiliated full-line and specialty retail stores in the United States. Sears’ current lease at the Newport Centre Property expires in October 2027. Sears has subleased its entire top floor to Dick’s new concept, Dick’s House of Sport (“Dick’s”), and Primark is taking two-thirds of the bottom floor with the remaining space yet to be subleased.
Dick’s and Primark have each signed subleases for their respective portions of the Sears space, but only Dick’s has taken occupancy. Dick’s has taken possession of its space and will open fall 2025. Primark is expected to take possession of its space on November 1, 2024 and open early summer 2025. We cannot assure you that Primark will take possession of its space or that Dick’s House of Sport and Primark will open as expected or at all.
Dick's Sporting Goods, Inc. is an American chain of sporting goods stores founded in 1948. It is the largest sporting goods retailer in the United States and is listed on the Fortune 500. Dick’s House of Sport is a new concept introduced by Dick’s Sporting Goods, Inc. It is an approximately 82,500 square foot store that provides customers with a wide assortment of products along with in-store experiences, including a climbing wall, multiple golf bays with simulators, and multi-sport cages for baseball, softball, lacrosse, and soccer.
Primark is an international clothing retailer that sells affordable clothing, accessories, footwear, beauty products, and homeware for women, men, and children. The company was founded in Dublin, Ireland in 1969 by Arthur Ryan, with the goal of making affordable clothing available in Ireland. Primark has since expanded to over 418 stores in 15 countries, including the UK, United States, Spain, Germany, and Italy.
Appraisal. According to the appraisal, the Newport Centre Property had an “as-is” appraised value of $436,800,000 as of July 11, 2024. The table below shows the appraisal’s “as-is” conclusions.
| Appraisal Valuation Summary(1) |
| Appraisal Approach | Appraised Value | Capitalization Rate |
| Income Capitalization Approach | $436,800,000 | 6.50% |
Environmental. According to the Phase I environmental report dated July 18, 2024, there was evidence of a recognized environmental condition at the Newport Centre Property related to historical coal-gas manufacturing at two on-site locations from approximately 1885 through the late 1920s. The Newport Centre Property is currently being remediated in a New Jersey Department of Environmental Protection (“NJDEP”) remediation program on behalf of the state. Remedial actions are ongoing until the NJDEP deems the responses to be completed according to established cleanup goals. See “Description of the Mortgage Pool—Environmental Considerations” in the Preliminary Prospectus.
The following table presents certain information relating to the historical and current occupancy of the Newport Centre Property:
| Historical and Current Occupancy(1) |
| 2021 | 2022 | 2023 | Current(2) |
| 83.3% | 86.0% | 82.7% | 92.5% |
| | (1) | Historical occupancies are as of December 31 for each respective year. |
| | (2) | Based on the underwritten rent roll dated July 29, 2024. |
| THE INFORMATION IN THIS STRUCTURAL AND COLLATERAL TERM SHEET IS NOT COMPLETE AND MAY BE AMENDED PRIOR TO THE TIME OF SALE. THIS TERM SHEET IS NOT AN OFFER TO SELL THESE SECURITIES AND IT IS NOT A SOLICITATION OF AN OFFER TO BUY THESE SECURITIES IN ANY JURISDICTION WHERE THE OFFER OR SALE IS NOT PERMITTED. |
| | 40 | |
| Structural and Collateral Term Sheet | | BMO 2024-C10 |
| No. 1 – Newport Centre |
The following table presents certain information relating to the largest tenants by underwritten base rent (of which, certain tenants have co-tenancy provisions) at the Newport Centre Property:
| Top Tenant Summary(1) |
| Tenant | Credit Rating (Moody's/
S&P/Fitch)(2) | Net Rentable Area (SF) | % of Total NRA | UW Base Rent PSF | UW Base Rent | % of Total UW Base Rent | Lease Exp. Date |
| H&M | NR/BBB/NR | 26,863 | 2.8% | $52.66 | $1,414,620 | 7.0% | 1/31/2030 |
| AMC Theatres | Ca/NR/NR | 45,165 | 4.7% | $31.22 | $1,410,000 | 6.9% | 1/31/2026 |
| Sears (Dick's House of Sport & Primark)(3) | NR/NR/NR | 192,000 | 19.9% | $7.21 | $1,385,000 | 6.8% | 10/31/2027 |
| Zara | NR/NR/NR | 23,662 | 2.4% | $55.26 | $1,307,554 | 6.4% | 10/31/2028 |
| Kohl's | Ba3/BB/BB | 144,654 | 15.0% | $5.58 | $807,169 | 4.0% | 1/29/2028 |
| Victoria's Secret | B1/BB-/NR | 9,895 | 1.0% | $58.00 | $573,910 | 2.8% | 1/31/2025 |
| Sephora | NR/NR/NR | 5,815 | 0.6% | $80.87 | $470,243 | 2.3% | 1/31/2028 |
| Uniqlo | NR/NR/NR | 11,983 | 1.2% | $38.49 | $461,226 | 2.3% | 1/31/2034 |
| Foot Locker | Ba3/BB/NR | 6,624 | 0.7% | $69.53 | $460,567 | 2.3% | 1/31/2027 |
| Avis Rent-A-Car | NR/BB/NR | 100 | 0.0% | $3,997.50 | $399,750 | 2.0% | 1/31/2029 |
| Major Tenants | | 466,761 | 48.3% | $18.62 | $8,690,039 | 42.8% | |
| Non-Major Tenants | | 426,559 | 44.1% | 27.24 | $11,619,744 | 57.2% | |
| Total Occupied | | 893,320 | 92.5% | $22.74 | $20,309,783 | 100.0% | |
| Vacant Space | | 72,866 | 7.5% | | | | |
| Total | | 966,186 | 100.0% | | | | |
| (1) | Based on the underwritten rent roll dated July 29, 2024. |
| (2) | Certain ratings are those of the parent company whether or not the parent guarantees the lease. |
| (3) | Dick’s has taken possession of its space and will open fall 2025. Primark is expected to take possession of its space on November 1, 2024 and open early summer 2025. |
The following table presents certain information relating to the lease rollover schedule at the Newport Centre Property:
| Lease Rollover Schedule(1)(2) |
| Year | Number of Leases Expiring | Net Rentable Area Expiring | % of NRA Expiring | UW Base Rent Expiring | % of UW Base Rent Expiring | Cumulative Net Rentable Area Expiring | Cumulative % of NRA Expiring | Cumulative UW Base Rent Expiring | Cumulative % of UW Base Rent Expiring |
| Vacant | NAP | 72,866 | 7.5 | % | NAP | NA | P | 72,866 | 7.5% | | NAP | NAP |
| 2024 & MTM | 13 | 18,126 | 1.9 | % | $1,399,383 | 6.9 | %% | 90,992 | 9.4% | | $1,399,383 | 6.9% |
| 2025 | 15 | 34,223 | 3.5 | % | 2,113,477 | 10.4 | % | 125,215 | 13.0% | | $3,512,860 | 17.3% |
| 2026 | 19 | 96,227 | 10.0 | % | 3,608,065 | 17.8 | % | 221,442 | 22.9% | | $7,120,925 | 35.1% |
| 2027 | 13 | 228,259 | 23.6 | % | 3,425,449 | 16.9 | % | 449,701 | 46.5% | | $10,546,375 | 51.9% |
| 2028 | 11 | 422,169 | 43.7 | % | 3,478,432 | 17.1 | % | 871,870 | 90.2% | | $14,024,807 | 69.1% |
| 2029 | 10 | 21,273 | 2.2 | % | 1,864,328 | 9.2 | % | 893,143 | 92.4% | | $15,889,134 | 78.2% |
| 2030 | 6 | 35,367 | 3.7 | % | 2,389,629 | 11.8 | % | 928,510 | 96.1% | | $18,278,764 | 90.0% |
| 2031 | 1 | 726 | 0.1 | % | 99,382 | 0.5 | % | 929,236 | 96.2% | | $18,378,146 | 90.5% |
| 2032 | 3 | 7,044 | 0.7 | % | 526,082 | 2.6 | % | 936,280 | 96.9% | | $18,904,228 | 93.1% |
| 2033 | 3 | 3,669 | 0.4 | % | 276,331 | 1.4 | % | 939,949 | 97.3% | | $19,180,559 | 94.4% |
| 2034 | 3 | 16,448 | 1.7 | % | 770,946 | 3.8 | % | 956,397 | 99.0% | | $19,951,506 | 98.2% |
| 2035 & Beyond | 3 | 9,789 | 1.0 | % | 358,277 | 1.8 | % | 966,186 | 100.0% | | $20,309,783 | 100.0% |
| Total/Wtd. Avg. | 100 | 966,186 | 100.0 | % | $20,309,783 | 100.0 | % | | | | |
| (1) | Based on the underwritten rent roll dated July 29, 2024. |
| (2) | Certain tenants may have lease termination options that are exercisable prior to the stated expiration date of the subject lease or leases which are not considered in the Lease Rollover Schedule. |
| THE INFORMATION IN THIS STRUCTURAL AND COLLATERAL TERM SHEET IS NOT COMPLETE AND MAY BE AMENDED PRIOR TO THE TIME OF SALE. THIS TERM SHEET IS NOT AN OFFER TO SELL THESE SECURITIES AND IT IS NOT A SOLICITATION OF AN OFFER TO BUY THESE SECURITIES IN ANY JURISDICTION WHERE THE OFFER OR SALE IS NOT PERMITTED. |
| | 41 | |
| Structural and Collateral Term Sheet | | BMO 2024-C10 |
| No. 1 – Newport Centre |
The following table presents certain information relating to the historical and underwritten cash flows of the Newport Centre Property:
| Operating History and Underwritten Net Cash Flow |
| | 2019 | 2020 | 2021 | 2022 | 2023 | TTM 6/30/2024 | Underwritten | PSF | %(1) | |
| Base Rent(2) | $20,564,204 | $20,338,102 | $18,549,753 | $19,306,882 | $19,270,653 | $19,146,217 | $20,309,783 | $21.02 | 41.1 | % |
| Rent Steps | 0 | 0 | 0 | 0 | 0 | 0 | 259,850 | 0.27 | 0.5 | |
| Recoveries | 15,345,651 | 15,581,064 | 13,975,987 | 15,371,903 | 15,270,988 | 15,205,829 | 14,276,516 | 14.78 | 28.9 | |
| Other Income | 11,230,520 | 6,356,856 | 9,909,900 | 11,462,036 | 12,872,322 | 12,586,027 | 12,337,560 | 12.77 | 24.9 | |
| Value of Vacant Space | 0 | 0 | 0 | 0 | 0 | 0 | 2,274,447 | 2.35 | 4.6 | |
| Total Gross Income | $47,140,375 | $42,276,022 | $42,435,640 | $46,140,821 | $47,413,963 | $46,938,073 | $49,458,156 | $51.19 | 100.0 | % |
| (Vacancy/Bad Debt) | 17,020 | (4,531,116) | (508,428) | 291,531 | (225,830) | (251,829) | (2,274,447) | (2.35) | (4.6 | ) |
| Effective Gross Income | $47,157,395 | $37,744,906 | $41,927,212 | $46,432,352 | $47,188,133 | $46,686,244 | $47,183,709 | $48.84 | 95.4 | % |
| Real Estate Taxes | 4,119,652 | 4,306,134 | 4,292,885 | 5,668,751 | 6,025,755 | 6,060,072 | 5,753,660 | 5.96 | 12.2 | |
| Insurance | 802,878 | 798,798 | 774,449 | 835,508 | 848,610 | 865,888 | 901,508 | 0.93 | 1.9 | |
| Utilities | 2,387,284 | 1,944,879 | 2,310,660 | 2,941,366 | 2,337,947 | 2,325,281 | 2,511,587 | 2.60 | 5.3 | |
| Repairs & Maintenance | 1,444,702 | 1,231,504 | 1,508,906 | 1,771,794 | 1,835,080 | 1,895,740 | 1,910,156 | 1.98 | 4.0 | |
| Management Fee | 2,058,409 | 1,650,597 | 1,915,075 | 2,039,250 | 2,070,600 | 2,010,650 | 1,250,000 | 1.29 | 2.6 | |
| Other Expenses | 5,877,233 | 4,330,456 | 5,000,337 | 5,773,489 | 6,247,493 | 6,514,249 | 6,094,570 | 6.31 | 12.9 | |
| Total Expenses | $16,690,158 | $14,262,368 | $15,802,312 | $19,030,158 | $19,365,485 | $19,671,880 | $18,421,481 | $19.07 | 39.0 | % |
| Net Operating Income | $30,467,237 | $23,482,538 | $26,124,900 | $27,402,194 | $27,822,648 | $27,014,364 | $28,762,228 | $29.77 | 61.0 | % |
| Total TI/LC, Capex/RR | 0 | 0 | 0 | 0 | 0 | 0 | 1,159,423 | 1.20 | 2.5 | |
| Net Cash Flow | $30,467,237 | $23,482,538 | $26,124,900 | $27,402,194 | $27,822,648 | $27,014,364 | $27,602,805 | $28.57 | 58.5 | % |
| (1) | Represents percent of Total Gross Income for all revenue fields and percent of Effective Gross Income for all other fields. |
| (2) | Underwritten Base Rent is based on the underwritten rent roll dated July 29, 2024. |
The Market. The Newport Centre Property is located in Jersey City, New Jersey in the Jersey City Waterfront District in northern New Jersey. According to the appraisal, the northern New Jersey region is named the “gateway region” given its easy access to Manhattan. The Newport Centre Property is the largest retail development in Hudson County and occupies a densely-developed city infill location, leaving few available sites for competing development. The area is accessible by highways, ferry, subway and light rail.
According to the appraisal, Jersey City is the fastest-growing metropolitan area in New Jersey and ranks 3rd for fastest residential growth in the country. Newport, New Jersey ranks 13th for highest office density in the country, with eight commercial buildings, 5,600,000 square feet of space, consisting of 50 corporations (including: Bank of America, Chase Manhattan Bank, Cigna Healthcare, Citi Group, Fidelity Investments, Forbes Media, HSBC, JP Morgan Chase, Merrill Lynch and UBS Financial Services). According to the appraisal, there are approximately 30,000 employees that work in Newport, with 97% of them shopping at Newport Centre, benefiting from New Jersey’s tax-free pricing on apparel. According to the appraisal, the average household income in the area is $123,149.
According to the appraisal, Northern New Jersey’s demographic characteristics indicate a population that is identical in age to the nation and earns $36,477 more in terms of average annual household income when compared to other areas of the United States. The region also contains a higher concentration of educational attainment than the United States, with 42.3% of its population having a bachelor’s degree or higher versus 31.9% for the nation.
According to the appraisal, the Newport Centre Property is in the Hudson submarket of northern New Jersey. The submarket is 94.0% occupied with an average asking rent of $28.98 per square foot. Over the past five years, new construction activity in the Hudson submarket outpaced absorption, with an annual average of 10,400 square feet completed and 8,800 square feet absorbed.
| THE INFORMATION IN THIS STRUCTURAL AND COLLATERAL TERM SHEET IS NOT COMPLETE AND MAY BE AMENDED PRIOR TO THE TIME OF SALE. THIS TERM SHEET IS NOT AN OFFER TO SELL THESE SECURITIES AND IT IS NOT A SOLICITATION OF AN OFFER TO BUY THESE SECURITIES IN ANY JURISDICTION WHERE THE OFFER OR SALE IS NOT PERMITTED. |
| | 42 | |
| Structural and Collateral Term Sheet | | BMO 2024-C10 |
| No. 1 – Newport Centre |
The following table presents information regarding certain competitive properties to the Newport Centre Property:
Competitive Property Summary(1) |
| | Newport Centre | The Mills at Jersey Gardens | The Shops at Riverside | Garden State Plaza | Willowbrook Mall | Bergen Town Center |
Year Built/ Renovated | 1987 / 2006 | 1999/2013 | 1986/2020 | 1957/2000 | 1969/1997 | 1957/2020 |
| Total GLA (SF) | 966,186(2) | 1,300,000 | 743,800 | 2,130,000 | 1,525,000 | 1,020,000 |
| Ownership | Simon Property Group | Simon Property Group | Simon Property Group | Unibail Rodamco- Westfield SE | Seritage Growth Properties | Urban Edge Properties |
| Occupancy % | 92.5%(2) | 95.0% | 90.0% | 92.0% | 99.0% | 91.0% |
| Inline Sales PSF | $714(3) | $1,025 | $910 | $950 | $925 | $670 |
| Anchors | Macy’s, Kohl’s, JCPenney (non-collateral), Sears (Dicks & Primark) | AMC Theatres, Burlington, Cohoes, Forever 21, Marshalls, Saks Off 5th | Bloomingdale’s, Barnes and Noble, AMC Theatres | Macy’s, Neiman Marcus, Nordstrom, AMC Theatres | Bloomingdale’s, Macy’s, BJ’s Wholesale Club, JCPenney, Cinemark | Kohl’s, Target, Whole Foods |
| (1) | Source: Third party report. |
| (2) | Information is based on the underwritten rent roll dated July 29, 2024. |
| (3) | Represents sales PSF as of June 2024 as provided by the borrower sponsors. |
The Borrower. The borrower under the Newport Centre Whole Loan is Newport Centre, LLC, a Delaware limited liability company and single purpose entity with two independent directors in its organizational structure. Legal counsel to the borrower delivered a non-consolidation opinion in connection with the origination of the Newport Centre Whole Loan.
The Borrower Sponsors. The borrower sponsors are Simon Newport Limited Partnership (“Simon”) and LF Newport Jersey Limited Partnership. The non-recourse carveout guarantor is Newport Associates Phase I Developers Limited Partnership.
Simon is a real estate investment trust engaged in the ownership of premier shopping, dining, entertainment and mixed-use destinations and an S&P 100 company (Simon Property Group, NYSE: SPG). Simon’s properties across North America, Europe and Asia provide community gathering places for millions of people every day and generate billions of dollars in annual sales.
Property Management. The Newport Centre Property is currently managed by M.S. Management Associates, Inc., an affiliate of the borrower.
Escrows and Reserves.
Real Estate Taxes – During a Lockbox Event Period (as defined below), the borrower is required to deposit monthly to a real estate tax reserve 1/12th of the annual estimated real estate taxes.
Insurance – During a Lockbox Event Period, to the extent the borrower has not provided evidence satisfactory to the lender that the Newport Centre Property is covered by a reasonably acceptable blanket insurance policy, the borrower is required to deposit monthly 1/12th of the annual estimated insurance premiums to the insurance reserve.
Replacement Reserve – During a Lockbox Event Period, the borrower is required to deposit monthly approximately $8,396 to a reserve for replacements to the Newport Centre Property.
Rollover Reserve – During a Lockbox Event Period, the borrower is required to deposit monthly approximately $64,583 to a reserve for costs of tenant improvements, tenant allowances and/or leasing commissions incurred by the borrower under leases at the Newport Centre Property.
Lockbox / Cash Management. The Newport Centre Whole Loan is structured with a hard lockbox and springing cash management. All rents from the Newport Centre Property are required to be deposited directly to the lockbox by tenants upon delivery of a tenant direction letter. During a Lockbox Event Period, funds will be transferred to the lender-controlled cash management account within two business days and disbursed according to the Newport Centre Whole Loan documents. During a Lockbox Event Period, all excess cash is required to be held by the lender as additional security for the Newport Centre Whole Loan; provided that excess cash will be disbursed at the direction of the borrower in the event
| THE INFORMATION IN THIS STRUCTURAL AND COLLATERAL TERM SHEET IS NOT COMPLETE AND MAY BE AMENDED PRIOR TO THE TIME OF SALE. THIS TERM SHEET IS NOT AN OFFER TO SELL THESE SECURITIES AND IT IS NOT A SOLICITATION OF AN OFFER TO BUY THESE SECURITIES IN ANY JURISDICTION WHERE THE OFFER OR SALE IS NOT PERMITTED. |
| | 43 | |
| Structural and Collateral Term Sheet | | BMO 2024-C10 |
| No. 1 – Newport Centre |
of shortfalls in certain monthly expense items, so long as no event of default is continuing for which the lender has initiated an enforcement action.
A “Lockbox Event” will occur during the existence of any of: (i) an event of default, (ii) a bankruptcy action of the borrower or property manager if the property manager is an affiliate of the borrower and not replaced within 60 days by a qualified property manager in accordance with the Newport Centre Whole Loan documents, (iii) a Debt Yield Trigger Event (as defined below) or (iv) a Major Tenant Trigger Event (as defined below).
A “Lockbox Event Period” will commence on the occurrence of a Lockbox Event and continue until the occurrence of the applicable Lockbox Termination Event (as defined below).
A “Lockbox Termination Event” means (a) if the Lockbox Event is caused solely by the occurrence of a Debt Yield Trigger Event, the achievement of a Debt Yield Trigger Event cure, (b) if the Lockbox Event is caused solely by an event of default, the acceptance by the lender of a cure of such event of default (which cure the lender is not obligated to accept and may reject or accept in its sole and absolute discretion) provided that the lender has not accelerated the Newport Centre Whole Loan, moved for a receiver or commenced foreclosure proceedings, (c) if the Lockbox Event is caused solely by a bankruptcy action of the property manager, if the borrower replaces the property manager with a qualified property manager under a replacement management agreement in accordance with the Newport Centre Whole Loan documents within 60 days or such bankruptcy action of the property manager is discharged or dismissed within 90 days without any adverse consequences to the Newport Centre Property or the Newport Centre Whole Loan, or (d) if the Lockbox Event is caused solely by the occurrence of a Major Tenant Trigger Event, so long as only one (1) Major Tenant Trigger Event exists, the earlier to occur of (x) the date on which the applicable Major Tenant Threshold Amount has been deposited in the excess cash flow reserve account or (y) a Major Tenant Trigger Event has been cured in accordance with the Newport Centre Whole Loan documents; provided, however, that, each such Lockbox Termination Event set forth in this definition will be subject to the following conditions, (i) no other Lockbox Event exists, (ii) no other event of default exists under the Newport Centre Whole Loan documents, (iii) the borrower may not cure a Lockbox Event (x) more than a total of five times in the aggregate during the term of the Newport Centre Whole Loan or (y) triggered by a bankruptcy action of the borrower at any time during the term of the Newport Centre Whole Loan, and (iv) the borrower has paid all of the lender’s reasonable out-of-pocket expenses incurred in connection with such Lockbox Termination Event including, reasonable attorney’s fees and expenses.
A “Debt Yield Trigger Event” means, as of any date of determination, the debt yield based on the trailing four calendar quarter period immediately preceding such date of determination is less than 11.5% for two consecutive calendar quarters and will be cured upon the achievement of a debt yield of 11.5% or greater for two consecutive calendar quarters.
A “Major Tenant” means (i) Macy’s, (ii) Kohl’s, (iii) AMC Theatres, and/or (iv) any replacement tenant that occupies (x) at least 75% of the entire premises occupied by AMC Theatres as of the origination date, and/or (as applicable) (y) 50% of the entire premises occupied by Macy’s or Kohl’s as of the origination date.
An “Major Tenant Trigger Event” will commence on the earlier to occur of (i) a bankruptcy action of a Major Tenant, (ii) a Major Tenant Operations Event (meaning the date that a Major Tenant “goes dark” or vacates, on a permanent basis (or for more than 90 consecutive days with an intention to vacate permanently) its demised space at the Newport Centre Property; provided that none of the following will constitute a Major Tenant Operations Event: (a) a temporary closure in connection with a restoration or renovation, (b) any other temporary closure with a duration of less than 90 days, (c) a temporary closure in compliance with applicable law, regulations and/or governmental mandates or (d) a temporary closure related to COVID mandated stay-at-home closures), or (iii) a Major Tenant Renewal Event (as defined below).
An “Major Tenant Renewal Event”” will commence unless such Major Tenant lease has been renewed or extended on terms approved in writing by lender, the earlier of (x) the date on which such Major Tenant gives notice that it will not be renewing its lease in accordance with its terms, and (y) the date in its lease by which such Major Tenant is required to give notice to renew.
“Major Tenant Threshold Amount” means, with respect to (i) the space occupied by Macy’s as of the origination date, the amount of $11,494,450.00, (ii) with respect to the space occupied by Kohl’s as of the origination date, the amount of $7,232,700.00 and (iii) with respect to the space occupied by AMC Theatres as of the origination date, the amount of $2,258,250.00.
| THE INFORMATION IN THIS STRUCTURAL AND COLLATERAL TERM SHEET IS NOT COMPLETE AND MAY BE AMENDED PRIOR TO THE TIME OF SALE. THIS TERM SHEET IS NOT AN OFFER TO SELL THESE SECURITIES AND IT IS NOT A SOLICITATION OF AN OFFER TO BUY THESE SECURITIES IN ANY JURISDICTION WHERE THE OFFER OR SALE IS NOT PERMITTED. |
| | 44 | |
| Structural and Collateral Term Sheet | | BMO 2024-C10 |
| No. 1 – Newport Centre |
Subordinate and Mezzanine Debt. None.
Permitted Future Mezzanine or Subordinate Debt. Not Permitted.
Partial Release. Not Permitted.
Ground Lease. None.
| THE INFORMATION IN THIS STRUCTURAL AND COLLATERAL TERM SHEET IS NOT COMPLETE AND MAY BE AMENDED PRIOR TO THE TIME OF SALE. THIS TERM SHEET IS NOT AN OFFER TO SELL THESE SECURITIES AND IT IS NOT A SOLICITATION OF AN OFFER TO BUY THESE SECURITIES IN ANY JURISDICTION WHERE THE OFFER OR SALE IS NOT PERMITTED. |
| | 45 | |
| Structural and Collateral Term Sheet | | BMO 2024-C10 |
| No. 2 – The Mall of Victor Valley |
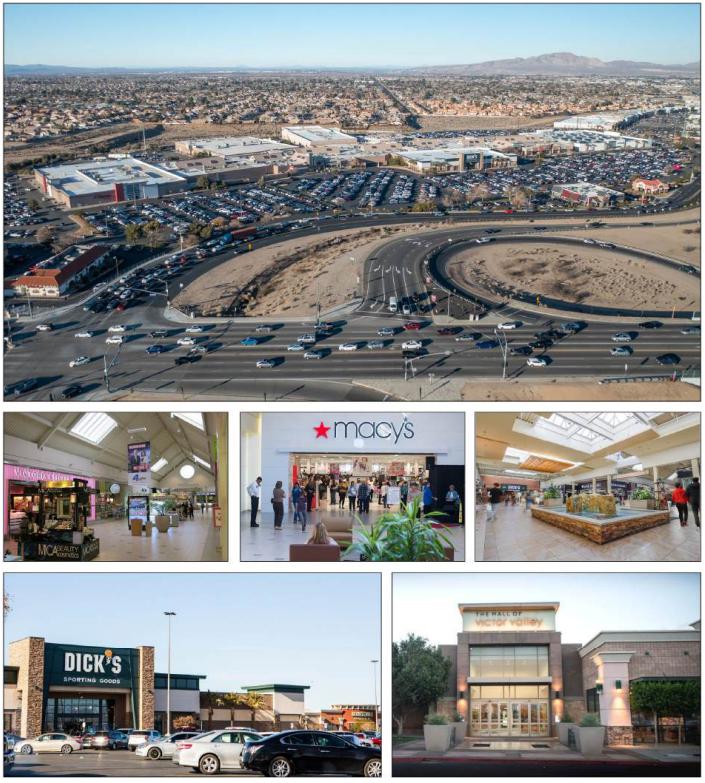
| THE INFORMATION IN THIS STRUCTURAL AND COLLATERAL TERM SHEET IS NOT COMPLETE AND MAY BE AMENDED PRIOR TO THE TIME OF SALE. THIS TERM SHEET IS NOT AN OFFER TO SELL THESE SECURITIES AND IT IS NOT A SOLICITATION OF AN OFFER TO BUY THESE SECURITIES IN ANY JURISDICTION WHERE THE OFFER OR SALE IS NOT PERMITTED. |
| | 46 | |
| Structural and Collateral Term Sheet | | BMO 2024-C10 |
| No. 2 – The Mall of Victor Valley |

| THE INFORMATION IN THIS STRUCTURAL AND COLLATERAL TERM SHEET IS NOT COMPLETE AND MAY BE AMENDED PRIOR TO THE TIME OF SALE. THIS TERM SHEET IS NOT AN OFFER TO SELL THESE SECURITIES AND IT IS NOT A SOLICITATION OF AN OFFER TO BUY THESE SECURITIES IN ANY JURISDICTION WHERE THE OFFER OR SALE IS NOT PERMITTED. |
| | 47 | |
| Structural and Collateral Term Sheet | | BMO 2024-C10 |
| No. 2 – The Mall of Victor Valley |

| THE INFORMATION IN THIS STRUCTURAL AND COLLATERAL TERM SHEET IS NOT COMPLETE AND MAY BE AMENDED PRIOR TO THE TIME OF SALE. THIS TERM SHEET IS NOT AN OFFER TO SELL THESE SECURITIES AND IT IS NOT A SOLICITATION OF AN OFFER TO BUY THESE SECURITIES IN ANY JURISDICTION WHERE THE OFFER OR SALE IS NOT PERMITTED. |
| | 48 | |
| Structural and Collateral Term Sheet | | BMO 2024-C10 |
| No. 2 – The Mall of Victor Valley |
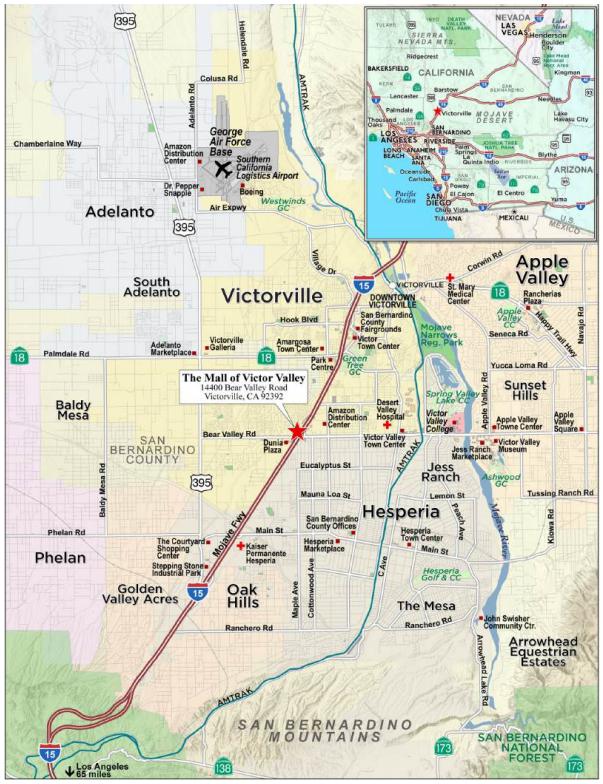
| THE INFORMATION IN THIS STRUCTURAL AND COLLATERAL TERM SHEET IS NOT COMPLETE AND MAY BE AMENDED PRIOR TO THE TIME OF SALE. THIS TERM SHEET IS NOT AN OFFER TO SELL THESE SECURITIES AND IT IS NOT A SOLICITATION OF AN OFFER TO BUY THESE SECURITIES IN ANY JURISDICTION WHERE THE OFFER OR SALE IS NOT PERMITTED. |
| | 49 | |
| Structural and Collateral Term Sheet | | BMO 2024-C10 |
| No. 2 – The Mall of Victor Valley |
| Mortgage Loan Information | | Property Information |
| Mortgage Loan Seller: | BMO | | Single Asset / Portfolio: | Single Asset |
| Original Principal Balance(1): | $60,000,000 | | Title: | Fee |
| Cut-off Date Principal Balance(1): | $60,000,000 | | Property Type – Subtype: | Retail – Super Regional Mall |
| % of IPB: | 8.3% | | Net Rentable Area (SF)(3): | 479,261 |
| Loan Purpose: | Refinance | | Location: | Victorville, CA |
| Borrower: | Macerich Victor Valley LP | | Year Built / Renovated: | 1986 / 2006-2007, 2012-2013, 2022-2023 |
| Borrower Sponsor: | The Macerich Partnership, L.P. | | Occupancy(4): | 98.9% |
| Interest Rate: | 6.72300% | | Occupancy Date(4): | 8/2/2024 |
| Note Date: | 8/22/2024 | | 4th Most Recent NOI (As of): | $13,309,753 (12/31/2021) |
| Maturity Date: | 9/6/2034 | | 3rd Most Recent NOI (As of): | $12,950,147 (12/31/2022) |
| Interest-only Period: | 120 months | | 2nd Most Recent NOI (As of): | $12,620,683 (12/31/2023) |
| Original Term: | 120 months | | Most Recent NOI (As of): | $12,777,146 (TTM 6/30/2024) |
| Original Amortization Term: | None | | UW Economic Occupancy: | 94.4% |
| Amortization Type: | Interest Only | | UW Revenues: | $18,132,998 |
| Call Protection(2): | L(26),DorYM1(87),O(7) | | UW Expenses: | $5,360,546 |
| Lockbox / Cash Management: | Hard / Springing | | UW NOI: | $12,772,452 |
| Additional Debt(1): | Yes | | UW NCF: | $12,170,506 |
| Additional Debt Balance(1): | $25,000,000 | | Appraised Value / Per SF(3): | $143,100,000 / $299 |
| Additional Debt Type(1): | Pari Passu | | Appraisal Date: | 6/12/2024 |
| | | | | |
| Escrows and Reserves(5) | | Financial Information(1) |
| | Initial | Monthly | Initial Cap | | Cut-off Date Loan / SF(3): | $177 |
| Taxes: | $0 | Springing | N/A | | Maturity Date Loan / SF(3): | $177 |
| Insurance: | $0 | Springing | N/A | | Cut-off Date LTV: | 59.4% |
| Replacement Reserves: | $0 | Springing | $191,704 | | Maturity Date LTV: | 59.4% |
| Rollover Reserves: | $0 | Springing | $958,522 | | UW NCF DSCR: | 2.10x |
| Outstanding TI / LC: | $167,463 | $0 | N/A | | UW NOI Debt Yield: | 15.0% |
| | | | | | | |
| Sources and Uses |
| Sources | Proceeds | % of Total | | Uses | Proceeds | % of Total |
| Whole Loan(1) | $85,000,000 | 73.0 | % | | Loan Payoff | $115,393,463 | 99.1 | % |
| Sponsor Equity | 31,430,303 | 27.0 | | | Closing Costs | 869,377 | 0.7 | |
| | | | | Reserves | 167,463 | 0.1 | |
| Total Sources | $116,430,303 | 100. | 0% | | Total Uses | $116,430,303 | 100.0 | % |
| (1) | The Mall of Victor Valley Mortgage Loan (as defined below) is part of The Mall of Victor Valley Whole Loan (as defined below), which is evidenced by four pari passu promissory notes with an aggregate principal balance of $85,000,000. The Financial Information presented above is based on the aggregate principal balance of the promissory notes comprising The Mall of Victor Valley Whole Loan. |
| (2) | The lockout period will be at least 26 payment dates beginning with and including the first payment date on October 6, 2024. Voluntary prepayment (with the greater of a yield maintenance premium or 1% of the principal balance of The Mall of Victor Valley Whole Loan in full (but not in part) is permitted at any time following the payment date in September 2027. Defeasance or voluntary prepayment with yield maintenance of The Mall of Victor Valley Whole Loan in full (but not in part) is permitted at any time following the earlier to occur of (i) September 6, 2027 or (ii) the date that is two years from the closing date of the securitization that includes the last pari passu note to be securitized. The assumed lockout period of 26 payments is based on the expected BMO 2024-C10 securitization trust closing date in November 2024. The actual lockout period may be longer. |
| (3) | The Mall of Victor Valley Property (as defined below) consists of 479,261 square feet of collateral and does not include Non-Collateral Square Footage (as defined below). |
| (4) | Occupancy includes all tenants in place, specialty leasing tenants of greater than six months, and tenants with signed leases as of the reporting period. Occupancy excludes gross leasable area for anchor tenants. |
| (5) | See “Escrows and Reserves” below for further discussion of reserve information. |
| THE INFORMATION IN THIS STRUCTURAL AND COLLATERAL TERM SHEET IS NOT COMPLETE AND MAY BE AMENDED PRIOR TO THE TIME OF SALE. THIS TERM SHEET IS NOT AN OFFER TO SELL THESE SECURITIES AND IT IS NOT A SOLICITATION OF AN OFFER TO BUY THESE SECURITIES IN ANY JURISDICTION WHERE THE OFFER OR SALE IS NOT PERMITTED. |
| | 50 | |
| Structural and Collateral Term Sheet | | BMO 2024-C10 |
| No. 2 – The Mall of Victor Valley |
The Loan. The second largest mortgage loan (“The Mall of Victor Valley Mortgage Loan”) is part of a whole loan (“The Mall of Victor Valley Whole Loan”) evidenced by four pari passu promissory notes in the aggregate original principal amount of $85,000,000. The Mall of Victor Valley Whole Loan was co-originated on August 22, 2024 by JPMorgan Chase Bank, National Association (“JPM”) and Bank of Montreal (“BMO”). The Mall of Victor Valley Mortgage Loan is evidenced by (i) the controlling note A-1-1 and (ii) the non-controlling note A-2-1 and A-2-2 (which notes are expected to be purchased by BMO from JPM on or prior to the BMO 2024-C10 securitization trust closing date), which have an aggregate outstanding principal balance as of the Cut-off Date of $60,000,000. The Mall of Victor Valley Whole Loan is secured by the borrower’s fee simple interest in a 479,261 square foot portion of a 589,161 square foot enclosed super regional mall located in Victorville, California (“The Mall of Victor Valley Property”) for The Mall of Victor Valley Whole Loan and does not include any portion of the regional mall that is occupied by Macy’s and Red Lobster (which own their own parcels). The Mall of Victor Valley Whole Loan has a 10-year term, with an interest-only period accruing interest at a rate of 6.72300% per annum on an Actual/360 basis. The scheduled maturity date of The Mall of Victor Valley Whole Loan is September 6, 2034.
The Mall of Victor Valley Whole Loan will be serviced pursuant to the pooling and servicing agreement for the BMO 2024-C10 trust securitization. The relationship between the holders of notes evidencing The Mall of Victor Valley Whole Loan is governed by a co-lender agreement as described under “Description of the Mortgage Pool—The Whole Loans—The Serviced Pari Passu Whole Loans” and “The Pooling and Servicing Agreement” in the Preliminary Prospectus.
The table below identifies the promissory notes that comprise The Mall of Victor Valley Whole Loan:
| Whole Loan Summary |
| Note | Original Balance | Cut-off Date Balance | Note Holder | Controlling Piece |
| A-1-1 | $30,000,000 | $30,000,000 | BMO 2024-C10 | Yes |
| A-1-2(1) | $25,000,000 | $25,000,000 | BMO | No |
| A-2-1 | $15,000,000 | $15,000,000 | BMO 2024-C10 | No |
| A-2-2 | $15,000,000 | $15,000,000 | BMO 2024-C10 | No |
| Whole Loan | $85,000,000 | $85,000,000 | | |
| (1) | Expected to be contributed to one or more future securitization trusts. |
The Property. The Mall of Victor Valley Property is part of a single-story, super regional mall located in Victorville, California. The Mall of Victor Valley Property consists of 479,261 of owned square feet within a super regional mall of 589,161 square feet, which is anchored by a 98,400 square foot Macy’s (non-collateral), a 91,776 square foot JCPenney and a 49,965 square foot DICK’S Sporting Goods. Macy’s and Red Lobster (the “Non-Collateral Tenants”) make up the 109,900 square feet not owned by the borrower sponsor (the “Non-Collateral Square Footage”). The Mall of Victor Valley Property is 98.9% leased as of August 2, 2024. The Mall of Victor Valley Property has 4,164 surface parking spaces, resulting in a parking ratio of approximately 7.07 spaces per 1,000 square feet of space including Non-Collateral Tenants.
The borrower sponsor and the City of Victorville entered into a long-term development agreement, effective from 2012 through 2039, which along with approving a framework for mall improvements, also included an assistance payment provision incentivizing the borrower sponsor to proceed with the development. The principal components of the redevelopment included the JCPenney expansion, Macy’s remodel, mall entry remodel, new pylon signs, and backfilling the former JCPenney with DICK’s Sporting Goods. The agreement secured tax increment financing subsidies through the City of Victorville providing a portion of sales tax receipts generated in excess of $1 million, payable annually to the borrower up to a cap of $18.9 million over the 27-year term. The redevelopment work was completed under the agreement, and borrower has received the subsidy since 2013.
Major Tenants. The three largest tenants based on underwritten base rent are Cinemark, DICK’S Sporting Goods and Victoria’s Secret.
Cinemark (62,118 square feet, 13.0% of net rentable area (“NRA”), 10.1% of underwritten base rent): Cinemark is an American movie theatre company founded in 1984 and headquartered in Plano, Texas. As of June 30, 2024 Cinemark operates 502 theatres and 5,708 screens across the United States and Latin America. Cinemark occupies 62,118 square feet on a lease that commenced on November 17, 2006 and expires November 30, 2026 with no renewal or termination options.
DICK’S Sporting Goods (49,965 square feet, 10.4% of NRA, 8.4% of underwritten base rent): DICK’S Sporting Goods is a sports apparel and equipment retailer with 724 locations as of February 3, 2024 that was founded in 1948 in Binghamton, New
| THE INFORMATION IN THIS STRUCTURAL AND COLLATERAL TERM SHEET IS NOT COMPLETE AND MAY BE AMENDED PRIOR TO THE TIME OF SALE. THIS TERM SHEET IS NOT AN OFFER TO SELL THESE SECURITIES AND IT IS NOT A SOLICITATION OF AN OFFER TO BUY THESE SECURITIES IN ANY JURISDICTION WHERE THE OFFER OR SALE IS NOT PERMITTED. |
| | 51 | |
| Structural and Collateral Term Sheet | | BMO 2024-C10 |
| No. 2 – The Mall of Victor Valley |
York. DICK’S Sporting Goods occupies 49,965 square feet on a lease that expires January 31, 2029 with no renewal or termination options.
Victoria’s Secret (8,512 square feet, 1.8% of NRA, 3.4% of underwritten base rent) Victoria’s Secret (NYSE: VSCO) is an American lingerie, clothing, and beauty retailer. The company was founded in 1977 and is headquartered in Reynoldsburg, Ohio. Victoria’s Secret operates approximately 1,350 stores in 70 countries and employs approximately 30,000 people. Victoria’s Secret has been a tenant at The Mall of Victor Valley Property since November 2000. Victoria’s Secret occupies 8,512 square feet on a lease expiring on March 31, 2035 with no renewal or termination options.
The largest tenant based on net rentable area at The Mall of Victor Valley Property is JCPenney.
JCPenney (91,776 SF, 19.1% of NRA, 0.8% of underwritten base rent): JCPenney was founded in Wyoming in 1902 and has been one of the United States’ largest retailers of apparel, home, jewelry, and beauty merchandise with a growing portfolio of national brands. JCPenney has 656 stores across the United States and Puerto Rico and employs more than 50,000 people worldwide. JCPenney has been a tenant at The Mall of Victor Valley Property since 1986. JCPenney has a current lease expiration of March 31, 2033 with no renewal or termination options.
Appraisal. According to the appraisal, The Mall of Victor Valley Property had an “as-is” appraised value of $143,100,000 as of June 12, 2024. The table below shows the appraisal’s “as-is” conclusions.
| Appraisal Valuation Summary(1) |
| Appraisal Approach | Appraised Value | Capitalization Rate |
| Income Capitalization Approach | $143,100,000 | 9.25% |
Environmental. The Phase I environmental assessment of The Mall of Victor Valley Property dated July 3, 2024 identified no recognized environmental conditions, controlled environmental conditions or significant data gaps.
The following table presents certain information relating to the historical occupancy of The Mall of Victor Valley Property:
| Historical and Current Occupancy(1) |
| 2021 | 2022 | 2023 | Current(2)(3) |
| 98.8% | 96.5% | 99.1% | 98.9% |
| (1) | Historical occupancies are as of December 31 of each respective year, unless otherwise specified. |
| (2) | Based on the underwritten rent roll dated August 2, 2024. |
| (3) | Occupancy includes all tenants in place, specialty leasing tenants of greater than six months, and tenants with signed leases as of the reporting period. Occupancy excludes gross leasable area for anchor tenants. |
| THE INFORMATION IN THIS STRUCTURAL AND COLLATERAL TERM SHEET IS NOT COMPLETE AND MAY BE AMENDED PRIOR TO THE TIME OF SALE. THIS TERM SHEET IS NOT AN OFFER TO SELL THESE SECURITIES AND IT IS NOT A SOLICITATION OF AN OFFER TO BUY THESE SECURITIES IN ANY JURISDICTION WHERE THE OFFER OR SALE IS NOT PERMITTED. |
| | 52 | |
| Structural and Collateral Term Sheet | | BMO 2024-C10 |
| No. 2 – The Mall of Victor Valley |
The following table presents certain information relating to the top 10 tenants by underwritten base rent (of which, certain tenants have co-tenancy provisions) at The Mall of Victor Valley Property:
| Top Tenant Summary(1) |
| Tenant | Ratings
Moody’s/S&P/Fitch(2) | Total Mall NRA (SF) | % of
Total Collateral NRA(3) | UW Base Rent PSF | UW Base Rent | % of Total
UW Base Rent | TTM June 2024 Sales $(4) | Sales PSF(4) | Occ Cost(4) | Lease
Expiration Date |
| Non-Collateral Anchor Tenants | | | | | | | | | | |
| Macy's | Ba2/BB+/BBB- | 98,400 | NAP | | $0.00 | $0 | 0.0% | $22,000,000 | $223.58 | 0.5% | 12/31/2082 |
| Red Lobster | NR/NR/NR | 11,500 | NAP | | $0.00 | 0 | 0.0 | NAV | NAV | NAV | 12/31/2037 |
| Non-Collateral Anchor Tenants Subtotal / Wtd. Avg. | | 109,900 | NAP | | $0.00 | $0 | 0.0% | | | | |
| Collateral Anchor Tenants | | | | | | | | | | |
| JCPenney | NR/NR/NR | 91,776 | 19.1 | % | $1.00 | $91,776 | 0.8% | $12,000,000 | $130.75 | 3.6% | 3/31/2033 |
| Top 10 Tenants | | | | | | | | | | |
| Cinemark | NR/NR/NR | 62,118 | 13.0 | % | $19.00 | $1,180,242 | 10.1% | $8,657,789 | $139.38 | 17.2% | 11/30/2026 |
| DICK'S Sporting Goods | Baa3/BBB/NR | 49,965 | 10.4 | | $19.80 | 989,307 | 8.4 | $11,608,518 | $232.33 | 8.5% | 1/31/2029 |
| Victoria's Secret | B1/BB-/NR | 8,512 | 1.8 | | $46.76 | 398,025 | 3.4 | $5,553,186 | $652.39 | 10.3% | 3/31/2035 |
| Daniel's Jewelers | NR/NR/NR | 1,298 | 0.3 | | $238.69 | 309,814 | 2.6 | $2,266,822 | $1,746.40 | 17.1% | 2/28/2027 |
| Hollister Co. | NR/NR/NR | 5,351 | 1.1 | | $56.00 | 299,661 | 2.6 | $1,954,490 | $365.26 | 17.6% | 1/31/2029 |
| Shoe Palace | NR/NR/NR | 3,622 | 0.8 | | $71.35 | 258,421 | 2.2 | $3,621,863 | $999.96 | 8.9% | 7/31/2025 |
| JD Sports | NR/NR/NR | 6,255 | 1.3 | | $40.86 | 255,550 | 2.2 | $4,363,418 | $697.59 | 8.9% | 9/30/2029 |
| Kevin Jewelers | NR/NR/NR | 1,458 | 0.3 | | $169.62 | 247,307 | 2.1 | $2,096,031 | $1,437.61 | 15.6% | 4/30/2026 |
| Tillys | NR/NR/NR | 6,973 | 1.5 | | $34.25 | 238,812 | 2.0 | $2,591,515 | $371.65 | 25.0% | 3/31/2029 |
| Kay Jewelers | NR/NR/NR | 1,595 | 0.3 | | $144.28 | 230,124 | 2.0 | $2,438,071 | $1,528.57 | 12.8% | 1/31/2025 |
| Top 10 Tenants Subtotal / Wtd. Avg. | | 147,147 | 30.7 | % | $29.95 | $4,407,264 | 37.5% | | | | |
| Remaining Occupied | | 250,981 | 52.4 | % | $27.50 | $6,901,311 | 58.8% | | | | |
| Occupied Collateral Total | | 398,128 | 83.1 | % | $28.40 | $11,738,741(5) | 100.0% | | | | |
| Vacant | | 81,133 | 16.9 | % | | | | | | | |
| Collateral Total / Wtd. Avg. | | 479,261 | 100.0 | % | | $11,738,741(5) | 100.0% | | | | |
| | | | | | | | | | | |
| Collateral + Non Collateral Total | | 589,161 | 100.0 | % | | | | | | | |
| | | | | | | | | | | |
| (1) | Based on the underwritten rent roll dated August 2, 2024 inclusive of rent steps through September 1, 2025. |
| (2) | In certain instances, ratings provided are those of the parent company of the entity shown, whether or not the parent company guarantees the lease. |
| (3) | % of Total Collateral NRA refers only to The Mall of Victor Valley Property and does not include the portion occupied by the Non-Collateral Tenants. |
| (4) | All information regarding sales and occupancy costs presented in this term sheet with respect to The Mall of Victor Valley Property is based upon information provided by the borrower sponsor. In certain instances, sales figures represent estimates because the tenants are not required to report, or otherwise may not have reported, sales information on a timely basis. Further, because sales are self-reported, such information is not independently verified by the borrower sponsor. Sales are as of the 12 months ended June 2024. |
| (5) | Includes $430,166 of underwritten base rent attributable to Sears, which is a dark tenant but continues to pay its contractual lease obligations. |
The following table presents certain information relating to comparable in-line sales of The Mall of Victor Valley Property:
| Comparable In-Line Sales |
| | 2019 | 2020 | 2021 | 2022 | 2023 | June 2024 - TTM |
| In-Line Sales(1) | $574 | NAV | $748 | $614 | $560 | $537 |
| Occupancy Cost(2) | 13.1% | NAV | NAV | 13.1% | 13.8% | 13.9% |
| (1) | Based on sales per square foot for all tenants open for 12 months or more. Excludes tenants >10,000 SF, arcades, and non-retail stores. |
| (2) | Cost of Occupancy is calculated by the sum of rent, percentage rent, CAM and taxes divided by annual sales for tenants open for 12 months or more. Excludes non-collateral stores, JC Penney, Sears, Cinemark, and Dick's Sporting Goods. Cost of Occupancy not calculated during periods effected by COVID. |
| THE INFORMATION IN THIS STRUCTURAL AND COLLATERAL TERM SHEET IS NOT COMPLETE AND MAY BE AMENDED PRIOR TO THE TIME OF SALE. THIS TERM SHEET IS NOT AN OFFER TO SELL THESE SECURITIES AND IT IS NOT A SOLICITATION OF AN OFFER TO BUY THESE SECURITIES IN ANY JURISDICTION WHERE THE OFFER OR SALE IS NOT PERMITTED. |
| | 53 | |
| Structural and Collateral Term Sheet | | BMO 2024-C10 |
| No. 2 – The Mall of Victor Valley |
The following table presents certain information relating to the lease rollover schedule at The Mall of Victor Valley Property:
| Lease Rollover Schedule(1)(2) |
| Year | Number of Leases Expiring | Net Rentable Area Expiring | % of NRA Expiring | UW Base
Rent Expiring | % of UW Base Rent Expiring | Cumulative Net Rentable Area Expiring | Cumulative % of NRA Expiring | Cumulative UW Base Rent Expiring | Cumulative % of UW Base Rent Expiring |
| Vacant(3) | NAP | 81,133 | 16.9 | % | $430,166 | 3.7 | % | 81,133 | 16.9% | $430,166 | 3.7% |
| 2024 & MTM | 8 | 16,424 | 3.4 | | 737,940 | 6.3 | | 97,557 | 20.4% | $1,168,106 | 10.0% |
| 2025 | 28 | 70,959 | 14.8 | | 2,725,071 | 23.2 | | 168,516 | 35.2% | $3,893,178 | 33.2% |
| 2026 | 11 | 73,318 | 15.3 | | 2,138,421 | 18.2 | | 241,834 | 50.5% | $6,031,599 | 51.4% |
| 2027 | 9 | 8,882 | 1.9 | | 1,148,096 | 9.8 | | 250,716 | 52.3% | $7,179,695 | 61.2% |
| 2028 | 8 | 15,367 | 3.2 | | 615,945 | 5.2 | | 266,083 | 55.5% | $7,795,640 | 66.4% |
| 2029 | 11 | 86,421 | 18.0 | | 2,557,992 | 21.8 | | 352,504 | 73.6% | $10,353,632 | 88.2% |
| 2030 | 1 | 894 | 0.2 | | 33,765 | 0.3 | | 353,398 | 73.7% | $10,387,397 | 88.5% |
| 2031 | 2 | 2,035 | 0.4 | | 250,601 | 2.1 | | 355,433 | 74.2% | $10,637,998 | 90.6% |
| 2032 | 2 | 3,158 | 0.7 | | 153,805 | 1.3 | | 358,591 | 74.8% | $10,791,804 | 91.9% |
| 2033 | 3 | 101,643 | 21.2 | | 363,512 | 3.1 | | 460,234 | 96.0% | $11,155,315 | 95.0% |
| 2034 | 1 | 10,515 | 2.2 | | 185,400 | 1.6 | | 470,749 | 98.2% | $11,340,715 | 96.6% |
| 2035 & Beyond | 1 | 8,512 | 1.8 | | 398,025 | 3.4 | | 479,261 | 100.0% | $11,738,741 | 100.0% |
| Total | 85 | 479,261 | 100.0 | % | $11,738,741 | 100.0 | % | | | | |
| (1) | Information is based on the underwritten rent roll dated August 2, 2024 inclusive of rent steps equal to approximately $230,256 through September 1, 2025. |
| (2) | Certain tenants may have lease termination options that are exercisable prior to the stated expiration date of the subject lease or leases which are not considered in the Lease Rollover Schedule. |
| (3) | Includes 78,212 square feet of net rentable area and $430,166 of underwritten base rent attributable to Sears which has a lease expiration date of October 24, 2024. Sears is a dark tenant but continues to pay its contractual lease obligations. |
| THE INFORMATION IN THIS STRUCTURAL AND COLLATERAL TERM SHEET IS NOT COMPLETE AND MAY BE AMENDED PRIOR TO THE TIME OF SALE. THIS TERM SHEET IS NOT AN OFFER TO SELL THESE SECURITIES AND IT IS NOT A SOLICITATION OF AN OFFER TO BUY THESE SECURITIES IN ANY JURISDICTION WHERE THE OFFER OR SALE IS NOT PERMITTED. |
| | 54 | |
| Structural and Collateral Term Sheet | | BMO 2024-C10 |
| No. 2 – The Mall of Victor Valley |
The following table presents certain information relating to the operating history and underwritten net cash flow of The Mall of Victor Valley Property:
| Operating History and Underwritten Net Cash Flow |
| | 2019 | 2020 | 2021 | 2022 | 2023 | TTM June 2024 | Underwritten | Per Square
Foot | %(1) |
| Base Rent(2)(3) | $10,419,274 | $10,124,184 | $10,368,384 | $10,386,513 | $10,717,354 | $10,910,997 | $11,078,319 | $23.12 | 64.2 | % |
| Rent Steps(4) | 0 | 0 | 0 | 0 | 0 | 0 | 230,256 | 0.48 | 1.3 | |
| Percent in Lieu | 31,361 | 95,603 | 253,243 | 114,661 | 87,728 | 28,738 | 0 | 0.00 | 0.0 | |
| Percentage Rent | 383,268 | 153,746 | 1,259,985 | 1,134,230 | 759,638 | 721,535 | 475,897 | 0.99 | 2.8 | |
| Vacancy Reimbursement | 0 | 0 | 0 | 0 | 0 | 0 | 970,526 | 2.03 | 5.6 | |
| Total Base Rent | $10,833,903 | $10,373,533 | $11,881,612 | $11,635,404 | $11,564,720 | $11,661,270 | $12,754,997 | $26.61 | 73.9 | % |
| Reimbursements | 3,785,993 | 3,544,104 | 3,626,917 | 4,133,470 | 4,359,071 | 4,611,978 | 4,500,919 | 9.39 | 26.1 | |
| Gross Potential Rent | $14,619,896 | $13,917,637 | $15,508,529 | $15,768,874 | $15,923,791 | $16,273,248 | $17,255,917 | $36.01 | 100.0 | % |
| Other Income(5) | 2,051,045 | 1,182,176 | 2,009,050 | 2,077,750 | 1,907,540 | 1,847,608 | 1,847,608 | 3.86 | 10.7 | |
| In-Place Vacancy | 0 | 0 | 0 | 0 | 0 | 0 | (970,526) | (2.03) | (5.6 | ) |
| Effective Gross Income | $16,670,941 | $15,099,813 | $17,517,579 | $17,846,624 | $17,831,332 | $18,120,856 | $18,132,998 | $37.84 | 105.1 | % |
| Real Estate Taxes | 1,755,623 | 1,782,763 | 1,720,056 | 1,750,290 | 1,831,032 | 1,861,597 | 1,833,732 | 3.83 | 10.1 | |
| Insurance | 207,848 | 293,519 | 354,137 | 389,815 | 537,016 | 599,276 | 654,466 | 1.37 | 3.6 | |
| Other Expenses | 2,731,662 | 2,334,637 | 2,133,633 | 2,756,372 | 2,842,601 | 2,882,837 | 2,872,348 | 5.99 | 15.8 | |
| Total Expenses | $4,695,133 | $4,410,919 | $4,207,826 | $4,896,477 | $5,210,649 | $5,343,710 | $5,360,546 | $11.19 | 29.6 | % |
| Net Operating Income | $11,975,808 | $10,688,894 | $13,309,753 | $12,950,147 | $12,620,683 | $12,777,146 | $12,772,452 | $26.65 | 70.4 | % |
| Total TI/LC, Capex/RR | 0 | 0 | 0 | 0 | 0 | 0 | 601,946 | 1.26 | 3.3 | |
| Net Cash Flow | $11,975,808 | $10,688,894 | $13,309,753 | $12,950,147 | $12,620,683 | $12,777,146 | $12,170,506 | $25.39 | 67.1 | % |
| (1) | % column represents percent of Gross Potential Rent for all revenue lines and represents percent of Effective Gross Income for the remainder of fields. |
| (2) | Underwritten Base Rent reflects annualized in-place base rent for in-place tenants and recently executed leases as of March 2024. Rental revenues have been adjusted to be exclusive of deferred straight-line minimum rent and termination income. |
| (3) | Includes $430,166 of underwritten base rent attributable to Sears which has a lease expiration date of October 24, 2024. Sears is a dark tenant but continues to pay its contractual lease obligations. |
| (4) | Based on the underwritten rent roll dated August 2, 2024, inclusive of rent steps through September 1, 2025 totaling $230,256. |
| (5) | Other Income includes specialty leasing, business development income, tax incentive income and storage rent. |
The Market. The Mall of Victor Valley Property is located in San Bernardino County, California, approximately 35 miles north of the city of San Bernardino and 80 miles northeast of downtown Los Angeles. According to the appraisal, the neighborhood economy relies on transportation and logistics due to its location relative to major highways (I-15 and Route 66), and the top employer in the surrounding area is the Southern California Logistics Airport. The Mall of Victor Valley Property is the only enclosed mall in the area anchoring commercial and retail development. Primary access to the area is provided by Interstate 15, which is adjacent to The Mall of Victor Valley Property.
Within a seven-, ten- and fifteen-mile radius of The Mall of Victor Valley Property, the 2022 average household income was approximately $75,279, $75,719 and $75,736, respectively; and within the same radii, the 2022 estimated population was 275,255, 355,174, and 387,677, respectively.
According to the appraisal, The Mall of Victor Valley Property is situated within the Victorville submarket of the San Bernardino/Riverside retail market. As of the first quarter of 2024, the submarket reported total inventory of approximately 4.5 million square feet with a 6.5% vacancy rate and average rents of $17.99 per square foot.
| THE INFORMATION IN THIS STRUCTURAL AND COLLATERAL TERM SHEET IS NOT COMPLETE AND MAY BE AMENDED PRIOR TO THE TIME OF SALE. THIS TERM SHEET IS NOT AN OFFER TO SELL THESE SECURITIES AND IT IS NOT A SOLICITATION OF AN OFFER TO BUY THESE SECURITIES IN ANY JURISDICTION WHERE THE OFFER OR SALE IS NOT PERMITTED. |
| | 55 | |
| Structural and Collateral Term Sheet | | BMO 2024-C10 |
| No. 2 – The Mall of Victor Valley |
The following table presents certain information relating to the appraiser’s market rent conclusions for The Mall of Victor Valley Property:
| Market Rent Summary(1) |
| | Market Rent (PSF) | Lease Term (Yrs.) | Rent Increase Projections | New Tenant Improvements |
| 0 to 1,199 SF Space | $135.00 | 8 | 3.0% annually | $35.00 |
| 1,200-2,000 SF Space | $30.00 | 8 | 3.0% annually | $35.00 |
| 2,001-3,500 SF Space | $27.00 | 8 | 3.0% annually | $35.00 |
| 3501-5,000 SF Space | $20.00 | 8 | 3.0% annually | $35.00 |
| 5001-7,500 SF Space | $47.00 | 8 | 3.0% annually | $35.00 |
| Over 7,500 | $27.00 | 8 | 3.0% annually | $35.00 |
| Restaurant Space | $25.00 | 8 | 3.0% annually | $75.00 |
| Food Court Space | $110.00 | 8 | 3.0% annually | $35.00 |
| Kiosk Space | $525.00 | 5 | 3.0% annually | 0$0.00 |
| Major Space | $20.00 | 10 | 10.0% Mid-Term | $15.00 |
| Cinema Space | $20.00 | 10 | 10.0% Mid-Term | $15.00 |
| Anchor Space | $5.00 | 10 | 10.0% Mid-Term | $10.00 |
| Anchor Space - Unowned | $0.00 | 10 | N/A | $10.00 |
The Borrower and Borrower Sponsor. The borrower is Macerich Victor Valley LP, a single purpose entity which has as its general partner a Delaware limited liability company with two independent directors. Legal counsel to the borrower delivered a non-consolidation opinion in connection with the origination of The Mall of Victor Valley Whole Loan. The borrower sponsor and non-recourse carveout guarantor is The Macerich Partnership, L.P., a Delaware limited partnership headquartered in Santa Monica, California and a provider of real estate investment services. The Macerich Partnership, L.P. acquires, leases, manages, develops, and redevelops malls and community centers.
Property Management. The Mall of Victor Valley Property is managed by Macerich Property Management Company, LLC, an affiliate of the borrower sponsor.
Escrows and Reserves. At origination, the borrower was required to deposit into escrow $167,463 for an outstanding TI/LC reserve.
Tax Escrows - During the continuance of a Trigger Period (as defined below), the borrower is required to escrow 1/12th of the annual estimated tax payments on a monthly basis. At the borrower’s option, all or any portion of this amount may be in the form of credit support.
Insurance Escrows – During the continuance of a Trigger Period, the borrower is required to escrow 1/12th of the annual estimated insurance payments on a monthly basis, except if The Mall of Victor Valley Property is insured under a blanket policy meeting the requirements set forth in The Mall of Victor Valley Whole Loan documents (in which case, no insurance escrows will be required, notwithstanding the occurrence of a Trigger Period). At the borrower’s option, all or any portion of this amount may be in the form of credit support.
Capital Expenditure Reserve - During the continuance of a Trigger Period, the borrower is required to escrow an amount equal to the gross leasable area (excluding the Non-Collateral Square Footage and any tenant that is required to pay for all repairs and maintenance costs for its entire leased premises, roof and structural components), multiplied by $0.20 and divided by 12 months. The monthly replacement reserve amount is estimated to be approximately $7,988. The borrower is permitted to cease monthly deposits when the replacement reserve balance is equal to the sum of 24 monthly deposits, currently estimated to be approximately $191,704. At the borrower’s option, all or any portion of this amount may be in the form of credit support.
Rollover Reserve – During the continuance of a Trigger Period, the borrower is required to escrow an amount equal to the gross leasable area (excluding the Non-Collateral Square Footage and the premises leased to (i) Cinemark and/or (ii) DICK’s Sporting Goods, provided that each of the foregoing exercises the renewal option set forth in the applicable lease for such premises in effect as of the origination date of The Mall of Victor Valley Whole Loan) multiplied by $1.00 and divided
| THE INFORMATION IN THIS STRUCTURAL AND COLLATERAL TERM SHEET IS NOT COMPLETE AND MAY BE AMENDED PRIOR TO THE TIME OF SALE. THIS TERM SHEET IS NOT AN OFFER TO SELL THESE SECURITIES AND IT IS NOT A SOLICITATION OF AN OFFER TO BUY THESE SECURITIES IN ANY JURISDICTION WHERE THE OFFER OR SALE IS NOT PERMITTED. |
| | 56 | |
| Structural and Collateral Term Sheet | | BMO 2024-C10 |
| No. 2 – The Mall of Victor Valley |
by 12 months. The monthly rollover reserve amount is estimated to be approximately $39,938. The borrower is not required to make any monthly deposits when the rollover reserve balance is equal to the sum of 24 monthly deposits, currently estimated to be $958,522. During a Trigger Period, the borrower is required to deposit any amount paid in excess of $2 million with respect to a lease modification or termination. At the borrower’s option, all or any portion of this amount may be in the form of credit support or a guaranty of limited payment.
Lockbox / Cash Management. The Mall of Victor Valley Whole Loan is structured with a hard lockbox and springing cash management. The borrower and property manager are required to direct the tenants to pay rent directly into the lockbox account, and to deposit any rents otherwise received in such account within three business days after receipt. So long as no Trigger Period is continuing, the borrower will have access to the funds deposited into the lockbox account, and may utilize the lockbox account as its operating account. During the continuance of a Trigger Period, all funds in the lockbox account are required to be swept on a weekly basis and on the second business day before each payment date to a lender-controlled cash management account. Funds in the cash management account are required to be applied to debt service, the monthly operating budget expenses and the reserves and escrows described above, with any excess funds, if no Trigger Period is continuing, disbursed to the borrower.
A “Trigger Period” means the period commencing upon the occurrence of (i) an event of default or (ii) a Low Debt Yield Period (as defined below). A Trigger Period will end (a) with respect to the matters described in clause (i) above, if the event of default has been waived by the lender and no other event of default is then continuing or (b) with respect to the matters described in clause (ii) above, if a cure of the Low Debt Yield Period occurs.
A “Low Debt Yield Period” will commence if, as of any Calculation Date (as defined below), The Mall of Victor Valley Whole Loan debt yield is less than 11.0%, and end if The Mall of Victor Valley Whole Loan has achieved a debt yield of at least 11.0% for two consecutive Calculation Dates.
A “Calculation Date” will be the 60th day following the end of each calendar quarter during the term.
Subordinate and Mezzanine Debt. None.
Permitted Future Subordinate or Mezzanine Debt. Not permitted.
Partial Release. The borrower may obtain the release of one or more Out Parcels (as defined below) without the payment of a release price, subject to satisfaction of certain conditions including, but not limited to, (i) no event of default has occurred and is continuing, (ii) regardless of whether such release is successfully consummated, the borrower pays to the lender a processing fee in the amount of $15,000, (iii) the remaining The Mall of Victor Valley Property constitutes a separate tax lot (or the borrower has filed an application for a separate tax lot and the borrower sponsor guarantees the payment of taxes on such release parcel pending the final issuance of such separate tax lot), (iv) the borrower certifies to the lender that the remaining The Mall of Victor Valley Property with all easements appurtenant and other permitted encumbrances thereto will not, strictly as a result of such transfer, be in violation of any reciprocal easement agreements or major leases, or any then applicable law, statute, rule or regulation and (v) satisfaction of any REMIC release conditions.
An “Out Parcel” means each of the following: (i) certain real property that is as of the date of any potential release non-income producing and unimproved for tenant occupancy and the release of which does not have a material adverse effect on (a) the business, profits, operations or financial condition of the borrower, (b) the ability of the borrower to repay The Mall of Victor Valley Whole Loan in accordance with the terms of The Mall of Victor Valley Whole Loan documents, or (c) the ongoing operations of the remaining The Mall of Victor Valley Property; and (ii) certain real property that is as of the date of any potential release non-income producing and improved by structures that (a) were vacant as of the origination date and (b) have been vacant and non-income producing continuously since the origination date and for at least three years prior to the date of any potential release; and (iii) the Sears parcel. The Sears parcel may be released when an event of default has occurred and is continuing
Ground Lease. None.
Pace Loan. The borrower is permitted to obtain property assessed clean energy (PACE) or similar loans in an aggregate amount up to $10.0 million without the consent of the lender.
| THE INFORMATION IN THIS STRUCTURAL AND COLLATERAL TERM SHEET IS NOT COMPLETE AND MAY BE AMENDED PRIOR TO THE TIME OF SALE. THIS TERM SHEET IS NOT AN OFFER TO SELL THESE SECURITIES AND IT IS NOT A SOLICITATION OF AN OFFER TO BUY THESE SECURITIES IN ANY JURISDICTION WHERE THE OFFER OR SALE IS NOT PERMITTED. |
| | 57 | |
| Structural and Collateral Term Sheet | | BMO 2024-C10 |
| No. 3 – Poindexter Industrial Portfolio |

| THE INFORMATION IN THIS STRUCTURAL AND COLLATERAL TERM SHEET IS NOT COMPLETE AND MAY BE AMENDED PRIOR TO THE TIME OF SALE. THIS TERM SHEET IS NOT AN OFFER TO SELL THESE SECURITIES AND IT IS NOT A SOLICITATION OF AN OFFER TO BUY THESE SECURITIES IN ANY JURISDICTION WHERE THE OFFER OR SALE IS NOT PERMITTED. |
| | 58 | |
| Structural and Collateral Term Sheet | | BMO 2024-C10 |
| No. 3 – Poindexter Industrial Portfolio |

| THE INFORMATION IN THIS STRUCTURAL AND COLLATERAL TERM SHEET IS NOT COMPLETE AND MAY BE AMENDED PRIOR TO THE TIME OF SALE. THIS TERM SHEET IS NOT AN OFFER TO SELL THESE SECURITIES AND IT IS NOT A SOLICITATION OF AN OFFER TO BUY THESE SECURITIES IN ANY JURISDICTION WHERE THE OFFER OR SALE IS NOT PERMITTED. |
| | 59 | |
| Structural and Collateral Term Sheet | | BMO 2024-C10 |
| No. 3 – Poindexter Industrial Portfolio |
| Mortgage Loan Information | | Property Information |
| Mortgage Loan Seller: | CREFI | | Single Asset / Portfolio: | Portfolio |
| Original Principal Balance(1): | $54,070,000 | | Title(5): | Fee |
| Cut-off Date Principal Balance(1): | $54,070,000 | | Property Type – Subtype(6): | Industrial – Various |
| % of Pool by IPB: | 7.5% | | Net Rentable Area (SF): | 4,526,168 |
| Loan Purpose(2): | Refinance / Acquisition | | Location(6): | Various, Various |
| Borrowers: | Poindexter Properties, LLC and Poindexter Properties Canada LTD. | | Year Built / Renovated(6): | Various / Various |
| Borrower Sponsor: | J.B. Poindexter & Co., Inc. | | Occupancy: | 100.0% |
| Interest Rate: | 5.65000% | | Occupancy Date(7): | Various |
| Note Date: | 9/16/2024 | | 4th Most Recent NOI (As of)(8): | NAV |
| Maturity Date: | 10/6/2034 | | 3rd Most Recent NOI (As of)(8): | NAV |
| Interest-only Period: | 120 months | | 2nd Most Recent NOI (As of)(8): | NAV |
| Original Term: | 120 months | | Most Recent NOI (As of)(8): | NAV |
| Original Amortization Term: | None | | UW Economic Occupancy: | 95.0% |
| Amortization Type: | Interest Only | | UW Revenues: | $21,558,358 |
| Call Protection(3): | L(25),D(88),O(7) | | UW Expenses: | $646,751 |
| Lockbox / Cash Management: | Hard / Springing | | UW NOI: | $20,911,608 |
| Additional Debt(1): | Yes | | UW NCF: | $20,911,608 |
| Additional Debt Balance(1): | $85,000,000 | | Appraised Value / Per SF: | $348,250,000/ $77 |
| Additional Debt Type(1): | Pari Passu | | Appraisal Date(9): | Various |
| | | | | |
| Escrows and Reserves(4) | | Financial Information(1) |
| | Initial | Monthly | Initial Cap | | Cut-off Date Loan / SF: | $31 | |
| Taxes: | $0 | Springing | N/A | | Maturity Date Loan / SF: | $31 | |
| Insurance: | $0 | Springing | N/A | | Cut-off Date LTV: | 39.9% | |
| Replacement Reserve: | $0 | Springing | N/A | | Maturity Date LTV: | 39.9% | |
| TI / LC: | $0 | Springing | N/A | | UW NCF DSCR: | 2.62x | |
| | | | | | UW NOI Debt Yield: | 15.0% | |
| | | | | | | | |
| Sources and Uses |
| Sources | Proceeds | % of Total | | Uses | Proceeds | % of Total |
| Whole Loan(1) | $139,070,000 | 100.0% | | Loan Payoff(2) | $108,033,051 | 77.7 | % |
| | | | | Purchase Price(2) | 20,523,309 | 14.8 | |
| | | | | Sponsor Equity | 7,465,235 | 5.4 | |
| | | | | Closing Costs | 3,048,405 | 2.2 | |
| Total Sources | $139,070,000 | 100.0% | | Total Uses | $139,070,000 | 100.0 | % |
| (1) | The Poindexter Industrial Portfolio Mortgage Loan (as defined below) is part of the Poindexter Industrial Portfolio Whole Loan (as defined below) which is comprised of four pari passu promissory notes with an aggregate original principal balance and Cut-off Date balance of $139,070,000. The Poindexter Industrial Portfolio Whole Loan was originated by Citi Real Estate Funding Inc. (“CREFI”). The financial information presented above is based on the Poindexter Industrial Portfolio Whole Loan. |
| (2) | Loan proceeds at origination were used to repay prior debt of $108,033,051, acquire the Salt Lake City property for $20,523,309 from an affiliate of the borrower sponsor, fund upfront reserves and return equity to the borrower sponsor. |
| (3) | The Poindexter Industrial Portfolio Whole Loan permits prepayment with a prepayment fee equal to the greater of 1.0% of the amount prepaid and a yield maintenance premium (if prior to the open prepayment date) in connection with a partial release. See “Release of Property” below. |
| (4) | See “Escrows and Reserves” below for further discussion of reserve information. |
| (5) | The Loudon property is a ground leasehold interest in connection with a payment in lieu of taxes (“PILOT”) arrangement applicable to the property, which PILOT expires in 2026. The applicable development authority joined the related deed of trust to encumber the fee interest. Real estate taxes were underwritten assuming all tenants pay taxes pursuant to their triple net leases, and accordingly the PILOT was not underwritten. |
| (6) | See “Portfolio Summary” below. |
| (7) | Occupancy Dates are as of the underwritten rent rolls dated between September 1, 2024 and November 6, 2024. |
| (8) | 4th Most Recent NOI, 3rd Most Recent NOI, 2nd Most Recent NOI, and Most Recent NOI information is not available because all of the mortgaged properties are leased on triple net leases. |
| (9) | Appraisal Dates range from August 1, 2024 to August 16, 2024. |
| THE INFORMATION IN THIS STRUCTURAL AND COLLATERAL TERM SHEET IS NOT COMPLETE AND MAY BE AMENDED PRIOR TO THE TIME OF SALE. THIS TERM SHEET IS NOT AN OFFER TO SELL THESE SECURITIES AND IT IS NOT A SOLICITATION OF AN OFFER TO BUY THESE SECURITIES IN ANY JURISDICTION WHERE THE OFFER OR SALE IS NOT PERMITTED. |
| | 60 | |
| Structural and Collateral Term Sheet | | BMO 2024-C10 |
| No. 3 – Poindexter Industrial Portfolio |
The Loan. The third largest mortgage loan (the “Poindexter Industrial Portfolio Mortgage Loan”) is part of a whole loan (the “Poindexter Industrial Portfolio Whole Loan”) secured by the borrowers’ fee interests in a 4,526,168 SF, 31 property, industrial portfolio located across 19 states and Canada (the “Poindexter Industrial Portfolio Properties”). The Poindexter Industrial Portfolio Whole Loan is evidenced by four promissory notes with an aggregate outstanding principal balance as of the Cut-off Date of $139,070,000. The Poindexter Industrial Portfolio Whole Loan was originated on September 16, 2024 by CREFI and accrues interest at a fixed rate of 5.65000% per annum on an Actual/360 basis. The Poindexter Industrial Portfolio Whole Loan has a ten-year term and is interest-only for the full term. The scheduled maturity date of the Poindexter Industrial Portfolio Whole Loan is the payment date that occurs on October 6, 2034. The Poindexter Industrial Portfolio Mortgage Loan is evidenced by the non-controlling Note A-2, Note A-3 and Note A-4 with an aggregate outstanding principal balance as of the Cut-off Date of $54,070,000.
The relationship between the holders of the Poindexter Industrial Portfolio Whole Loan is governed by a co-lender agreement as described under “Description of the Mortgage Pool— The Whole Loans—The Outside Serviced Pari Passu Whole Loans” in the Preliminary Prospectus. The Poindexter Industrial Portfolio Whole Loan will be serviced under the pooling and servicing agreement for the BANK5 2024-BNK48 securitization trust. See “The Pooling and Servicing Agreement—Servicing of the Outside Serviced Mortgage Loans.”
The table below identifies the promissory notes that comprise the Poindexter Industrial Portfolio Whole Loan:
| Whole Loan Summary |
| Note | Original Balance | Cut-off Date Balance | Note Holder | Controlling Note |
| A-1 | $85,000,000 | $85,000,000 | BANK5 2024-BNK48 | Yes |
| A-2 | $24,070,000 | $24,070,000 | BMO 2024-C10 | No |
| A-3 | $15,000,000 | $15,000,000 | BMO 2024-C10 | No |
| A-4 | $15,000,000 | $15,000,000 | BMO 2024-C10 | No |
| Whole Loan | $139,070,000 | $139,070,000 | | |
The Properties. The Poindexter Industrial Portfolio Properties are comprised of 31 industrial properties totaling 4,526,168 square feet that are geographically diversified across 19 states and one Canadian province. The Poindexter Industrial Portfolio Properties were 100.0% leased as of the rent rolls dated between September 1, 2024 and November 6, 2024 by seven operating companies owned by JB Poindexter & Co., an affiliate of the borrower, accounting for 98.1% of NRA and two independent manufacturing companies accounting for the remaining 1.9% of NRA and 2.2% of underwritten base rent. The Poindexter Industrial Portfolio Properties are used for manufacturing, vehicle storage, and warehouse and distribution, and feature clear heights ranging from 9’ to 62’, 541 drive-in doors, and 155 dock high doors.
| THE INFORMATION IN THIS STRUCTURAL AND COLLATERAL TERM SHEET IS NOT COMPLETE AND MAY BE AMENDED PRIOR TO THE TIME OF SALE. THIS TERM SHEET IS NOT AN OFFER TO SELL THESE SECURITIES AND IT IS NOT A SOLICITATION OF AN OFFER TO BUY THESE SECURITIES IN ANY JURISDICTION WHERE THE OFFER OR SALE IS NOT PERMITTED. |
| | 61 | |
| Structural and Collateral Term Sheet | | BMO 2024-C10 |
| No. 3 – Poindexter Industrial Portfolio |
The following table presents certain information relating to the Poindexter Industrial Portfolio Properties:
| Portfolio Summary |
| Property Name | Location | Industrial Subtype | Year Built / Renovated(1) | Sq. Ft.(2) | Allocated Whole Loan Cut-off Date Balance | % of Allocated Whole Loan Cut-off Date Balance | Appraised Value(1) | U/W NOI | % of U/W NOI |
| Ringgold | Ringgold, VA | Manufacturing | 2008 / 2019 | 878,000 | $17,600,000 | 12.7% | $47,000,000 | $2,448,627 | 11.7 | % |
| Laval | Laval, QC | Manufacturing/Vehicle Storage | 1987 / NAP | 117,533 | 11,000,000 | 7.9% | 26,830,000 | 1,652,110 | 7.9 | % |
| Loudon | Loudon, TN | Manufacturing | 1996, 2005, 2007 / 2015 | 334,024 | 9,750,000 | 7.0% | 23,800,000 | 1,468,204 | 7.0 | % |
| Salt Lake City | Salt Lake City, UT | Manufacturing/Warehouse | 2009 / NAP | 109,914 | 8,400,000 | 6.0% | 20,800,000 | 1,032,452 | 4.9 | % |
| Morgantown | Morgantown, PA | Manufacturing/Vehicle Storage | 1950 / 2014 | 246,843 | 7,800,000 | 5.6% | 19,100,000 | 1,249,047 | 6.0 | % |
| Reading | Reading, PA | Manufacturing/Warehouse | 1951 / 1998 | 323,381 | 6,600,000 | 4.7% | 16,100,000 | 720,278 | 3.4 | % |
| Orrville | Orrville, OH | Manufacturing/Warehouse | 1922 / 2018 | 347,024 | 5,450,000 | 3.9% | 13,300,000 | 876,492 | 4.2 | % |
| Riverside I | Riverside, CA | Manufacturing | 1979 / NAP | 66,000 | 5,400,000 | 3.9% | 13,700,000 | 671,562 | 3.2 | % |
| Spring Hill | Spring Hill, FL | Manufacturing | 2008 / NAP | 80,400 | 5,300,000 | 3.8% | 12,900,000 | 917,410 | 4.4 | % |
| Janesville | Janesville, WI | Manufacturing/Vehicle Storage | 1990 / 2015 | 196,098 | 5,000,000 | 3.6% | 12,400,000 | 823,050 | 3.9 | % |
| Sturgis II | Sturgis, MI | Manufacturing | 1967 / 2020 | 204,555 | 4,900,000 | 3.5% | 12,700,000 | 903,114 | 4.3 | % |
| Denver | Denver, PA | Manufacturing/Warehouse | 2000 / 2017 | 98,485 | 4,700,000 | 3.4% | 11,500,000 | 764,191 | 3.7 | % |
| Sturgis I | Sturgis, MI | Manufacturing | 1960 / NAP | 175,700 | 4,200,000 | 3.0% | 11,000,000 | 779,990 | 3.7 | % |
| Social Circle | Social Circle, GA | Manufacturing/Warehouse | 1970 / 1994 | 200,342 | 3,800,000 | 2.7% | 9,200,000 | 572,273 | 2.7 | % |
| Caldwell | Caldwell, ID | Manufacturing/Warehouse | 2018 / NAP | 37,100 | 3,650,000 | 2.6% | 8,900,000 | 506,073 | 2.4 | % |
| Brenham | Brenham, TX | Manufacturing/Warehouse | 1993 / 2002 | 128,225 | 3,500,000 | 2.5% | 8,600,000 | 624,575 | 3.0 | % |
| Clinton | Clinton, MD | Manufacturing/Warehouse | 1962, 1969 / NAP | 17,552 | 3,200,000 | 2.3% | 7,900,000 | 507,120 | 2.4 | % |
| Ehrenberg | Ehrenberg, AZ | Manufacturing/Warehouse | 1986 / 2017 | 120,416 | 3,200,000 | 2.3% | 7,900,000 | 465,267 | 2.2 | % |
| Rydal | Rydal, GA | Manufacturing/Warehouse | 1987, 2000, 2014 / NAP | 102,697 | 3,010,000 | 2.2% | 7,300,000 | 485,812 | 2.3 | % |
| Claremore | Claremore, OK | Manufacturing | 1981 / NAP | 101,498 | 2,800,000 | 2.0% | 6,800,000 | 520,767 | 2.5 | % |
| West Palm Beach | West Palm Beach, FL | Manufacturing/Warehouse | 1984 / NAP | 24,890 | 2,500,000 | 1.8% | 6,150,000 | 372,307 | 1.8 | % |
| Decatur | Decatur, AL | Manufacturing/Warehouse | 1965 / 2018 | 183,804 | 2,375,000 | 1.7% | 5,800,000 | 300,165 | 1.4 | % |
| North Salt Lake | North Salt Lake, UT | Manufacturing/Warehouse | 1980 / 1996 | 26,145 | 2,350,000 | 1.7% | 5,700,000 | 348,040 | 1.7 | % |
| Ephrata | Ephrata, PA | Manufacturing/Vehicle Storage | 1970 / NAP | 55,198 | 2,300,000 | 1.7% | 5,600,000 | 372,102 | 1.8 | % |
| Nashville | Nashville, TN | Warehouse/Distribution | 1995 / 2022 | 18,144 | 1,840,000 | 1.3% | 4,500,000 | 278,231 | 1.3 | % |
| Louisville | Louisville, KY | Manufacturing | 1997 / NAP | 26,325 | 1,760,000 | 1.3% | 4,300,000 | 259,678 | 1.2 | % |
| Riverside II | Riverside, CA | Vehicle Storage | NAP / NAP | 137,214 | 1,760,000 | 1.3% | 3,900,000 | 160,754 | 0.8 | % |
| Corsicana | Corsicana, TX | Manufacturing/Warehouse | 1982 / 2012 | 75,616 | 1,700,000 | 1.2% | 6,700,000 | 397,553 | 1.9 | % |
| Centralia | Centralia, WA | Warehouse | 1950 / 2000 | 47,826 | 1,625,000 | 1.2% | 3,970,000 | 200,330 | 1.0 | % |
| Indianapolis | Indianapolis, IN | Warehouse | 1970 / 2012 | 28,364 | 1,100,000 | 0.8% | 2,650,000 | 162,393 | 0.8 | % |
| Elkhart | Elkhart, IN | Warehouse | 1983 / 2010 | 16,855 | 500,000 | 0.4% | 1,250,000 | 71,641 | 0.3 | % |
| Total / Wtd. Avg. | | | | 4,526,168 | $139,070,000 | 100.0% | $348,250,000 | $20,911,608 | 100.0 | % |
| (2) | Based on the underwritten rent rolls dated between September 1, 2024 and November 6, 2024. |
| THE INFORMATION IN THIS STRUCTURAL AND COLLATERAL TERM SHEET IS NOT COMPLETE AND MAY BE AMENDED PRIOR TO THE TIME OF SALE. THIS TERM SHEET IS NOT AN OFFER TO SELL THESE SECURITIES AND IT IS NOT A SOLICITATION OF AN OFFER TO BUY THESE SECURITIES IN ANY JURISDICTION WHERE THE OFFER OR SALE IS NOT PERMITTED. |
| | 62 | |
| Structural and Collateral Term Sheet | | BMO 2024-C10 |
| No. 3 – Poindexter Industrial Portfolio |
Major Tenants.
Morgan Olson (1,592,279 SF, 35.2% of NRA, 26.8% of underwritten base rent) Acquired by JB Poindexter & Co. in 2003, Morgan Olson is a leading North American producer of walk-in step vans and has won multiple Work Truck Show Innovation of the Year awards from an industry association. Morgan Olson leases space at four of the Poindexter Industrial Portfolio Properties and has a current lease term through December 2039 with no renewal or termination options.
Morgan Truck (1,477,424 SF, 32.6% of NRA, 35.6% of underwritten base rent) Acquired by JB Poindexter & Co. in 1990, Morgan Truck is a North American company that does light and medium-duty truck body manufacturing and uplift for dry freight, refrigerated, platform, and custom-built commercial bodies. Morgan Truck leases space at 11 of the Poindexter Industrial Portfolio Properties including the Laval property in Quebec, Canada and has a current lease term through December 2039 with no renewal or termination options.
Reading Truck (793,713 SF, 17.5% of NRA, 26.9% of underwritten base rent) Acquired by JB Poindexter & Co. in 2015, Reading Truck is a manufacturer and distributor which has been designing and building work truck bodies for 65 years. Reading Truck leases space at 11 of the Poindexter Industrial Portfolio Properties and has a current lease term through December 2039 with no renewal or termination options.
Masterack (200,342 SF, 4.4% of NRA, 2.7% of underwritten base rent) Acquired by JB Poindexter & Co. in 2017, Masterack is a designer and manufacturer of commercial-grade van and pickup cargo management solutions for large fleets and automakers. Masterack has factory-certified ship-through service on over 40 models of vans, trucks, SUVs and sedans. Masterack leases space at the Social Circle property and has a current lease term through December 2039 with no renewal or termination options.
The following table presents certain information regarding the largest tenants at the Poindexter Industrial Portfolio Properties:
| Top Tenant Summary(1) |
| Tenants | Property Count | Credit Rating (Fitch/ Moody’s/ S&P)(2) | Tenant SF | Approx.% of
Portfolio SF | Annual UW
Rent | Annual UW
Rent PSF | % of Total Portfolio Annual UW Rent | Lease Expiration | Term. Option (Y/N) | Renewal Option |
| Morgan Olson(3) | 4 | NR/B1/NR | 1,592,279 | 35.2% | $5,903,784 | $3.71 | 26.8% | 12/31/2039 | N | N |
| Morgan Truck(3) | 11 | NR/B1/NR | 1,477,424 | 32.6% | 7,854,444 | $5.32 | 35.6% | 12/31/2039 | N | N |
| Reading Truck(3) | 11 | NR/B1/NR | 793,713 | 17.5% | 5,929,944 | $7.47 | 26.9% | 12/31/2039 | N | N |
| Masterack LLC(3) | 1 | NR/B1/NR | 200,342 | 4.4% | 603,324 | $3.01 | 2.7% | 12/31/2039 | N | N |
| EFP LLC(3) | 1 | NR/B1/NR | 183,804 | 4.1% | 316,452 | $1.72 | 1.4% | 12/31/2039 | N | N |
| MIC Group LLC(3) | 1 | NR/B1/NR | 128,225 | 2.8% | 658,464 | $5.14 | 3.0% | 12/31/2039 | N | N |
| Leer(3) | 2 | NR/B1/NR | 64,681 | 1.4% | 286,728 | $4.43 | 1.3% | 12/31/2039 | N | N |
| JLG Industries | 1 | NR/NR/NR | 45,500 | 1.0% | 246,038 | $5.41 | 1.1% | 8/28/2028 | N | 1, 5-Year |
| Lippert Components Manufacturing | 1 | NR/NR/NR | 40,200 | 0.9% | 247,080 | $6.15 | 1.1% | 6/30/2028 | N | N |
| Largest Tenants | | | 4,526,168 | 100.0% | $22,046,258 | $4.87 | 100.0% | | | |
| Remaining | | | 0 | 0.0% | | | | | | |
| Vacant | | | 0 | 0.0% | | | | | | |
| Total | | | 4,526,168 | 100% | | | | | | |
| (1) | Based on the underwritten rent rolls dated between September 1, 2024 and November 6, 2024. |
| (2) | Certain ratings are those of the parent company whether or not the parent guarantees the lease. |
| (3) | Morgan Olson, Morgan Truck, Reading Truck, Masterack LLC, EFP LLC, MIC Group LLC and Leer are affiliates of the borrower sponsor. JB Poindexter & Co. has entered into contribution agreements with each tenant, pursuant to which it has agreed to timely pay, or cause sufficient funds to be paid to the tenant in order for the tenant to pay, the obligations of the tenant under its lease when the same shall be due and payable. See “Description of the Mortgage Pool—Affiliated Leases” in the Preliminary Prospectus. |
| THE INFORMATION IN THIS STRUCTURAL AND COLLATERAL TERM SHEET IS NOT COMPLETE AND MAY BE AMENDED PRIOR TO THE TIME OF SALE. THIS TERM SHEET IS NOT AN OFFER TO SELL THESE SECURITIES AND IT IS NOT A SOLICITATION OF AN OFFER TO BUY THESE SECURITIES IN ANY JURISDICTION WHERE THE OFFER OR SALE IS NOT PERMITTED. |
| | 63 | |
| Structural and Collateral Term Sheet | | BMO 2024-C10 |
| No. 3 – Poindexter Industrial Portfolio |
The following table presents certain information relating to the lease rollover at the Poindexter Industrial Portfolio Properties:
| Lease Rollover Schedule(1)(2) |
| Year | # of Leases Rolling | SF Rolling | Approx. % of SF Rolling | Approx. Cumulative % of SF Rolling | Total UW Rent Rolling | Approx. % of Total UW Rent Rolling | Approx. Cumulative % of Total UW Rent Rolling | UW Rent PSF Rolling |
| MTM | 0 | 0 | 0.0% | 0.0% | $0 | 0.0% | 0.0% | $0.00 |
| 2024 | 0 | 0 | 0.0% | 0.0% | 0 | 0.0% | 0.0% | $0.00 |
| 2025 | 0 | 0 | 0.0% | 0.0% | 0 | 0.0% | 0.0% | $0.00 |
| 2026 | 0 | 0 | 0.0% | 0.0% | 0 | 0.0% | 0.0% | $0.00 |
| 2027 | 0 | 0 | 0.0% | 0.0% | 0 | 0.0% | 0.0% | $0.00 |
| 2028 | 2 | 85,700 | 1.9% | 1.9% | 493,118 | 2.2% | 2.2% | $5.75 |
| 2029 | 0 | 0 | 0.0% | 1.9% | 0 | 0.0% | 2.2% | $0.00 |
| 2030 | 0 | 0 | 0.0% | 1.9% | 0 | 0.0% | 2.2% | $0.00 |
| 2031 | 0 | 0 | 0.0% | 1.9% | 0 | 0.0% | 2.2% | $0.00 |
| 2032 | 0 | 0 | 0.0% | 1.9% | 0 | 0.0% | 2.2% | $0.00 |
| 2033 | 0 | 0 | 0.0% | 1.9% | 0 | 0.0% | 2.2% | $0.00 |
| 2034 | 0 | 0 | 0.0% | 1.9% | 0 | 0.0% | 2.2% | $0.00 |
| 2035 & Thereafter | 31 | 4,440,468 | 98.1% | 100.0% | 21,553,140 | 97.8% | 100.0% | $4.85 |
| Vacant | 0 | 0 | 0.0% | 0.0% | 0 | 0.0% | 0.0% | $0.00 |
| Total/Wtd. Avg. | 33 | 4,526,168 | 100.0% | 100.0% | $22,046,258 | 100.0% | 100.0% | $4.87 |
| (1) | Based on the underwritten rent rolls dated between September 1, 2024 and November 6, 2024. |
| (2) | Certain tenants may have lease termination options that are exercisable prior to the stated expiration date of the subject lease or leases which are not considered in the Lease Rollover Schedule. |
The following table presents certain information relating to the historical and current occupancy of the Poindexter Industrial Portfolio Properties:
| Historical and Current Occupancy(1) |
| 2021 | 2022 | 2023 | Current(2) |
| NAV | NAV | NAV | 100.0% |
| (1) | Historical occupancies are not available because the properties are all leased on NNN leases. |
| (2) | Current occupancy is based on the underwritten rent rolls dated between September 1, 2024 and November 6, 2024. |
| THE INFORMATION IN THIS STRUCTURAL AND COLLATERAL TERM SHEET IS NOT COMPLETE AND MAY BE AMENDED PRIOR TO THE TIME OF SALE. THIS TERM SHEET IS NOT AN OFFER TO SELL THESE SECURITIES AND IT IS NOT A SOLICITATION OF AN OFFER TO BUY THESE SECURITIES IN ANY JURISDICTION WHERE THE OFFER OR SALE IS NOT PERMITTED. |
| | 64 | |
| Structural and Collateral Term Sheet | | BMO 2024-C10 |
| No. 3 – Poindexter Industrial Portfolio |
Appraisals. The appraisals concluded to an aggregate “as-is” value for the Poindexter Industrial Portfolio Properties of $348,250,000 as of the valuation dates between August 1, 2024 and August 16, 2024. The table below shows the appraiser’s “as-is” conclusions:
| Poindexter Industrial Portfolio Appraised Value(1) |
| Property | Value | Capitalization Rate |
| Ringgold | $47,000,000 | 6.5% |
| Laval | $26,830,000 | 6.5% |
| Loudon | $23,800,000 | 6.5% |
| Morgantown | $19,100,000 | 7.0% |
| Salt Lake City | $20,800,000 | 6.0% |
| Sturgis II | $12,700,000 | 7.5% |
| Spring Hill | $12,900,000 | 6.8% |
| Janesville | $12,400,000 | 7.0% |
| Sturgis I | $11,000,000 | 7.5% |
| Reading | $16,100,000 | 6.8% |
| Orrville | $13,300,000 | 6.8% |
| Riverside I | $13,700,000 | 5.8% |
| Brenham | $8,600,000 | 7.8% |
| Social Circle | $9,200,000 | 7.0% |
| Denver | $11,500,000 | 6.8% |
| Claremore | $6,800,000 | 7.5% |
| Caldwell | $8,900,000 | 5.8% |
| Clinton | $7,900,000 | 6.8% |
| Rydal | $7,300,000 | 7.0% |
| Ehrenberg | $7,900,000 | 6.8% |
| Corsicana | $6,700,000 | 6.3% |
| Ephrata | $5,600,000 | 7.0% |
| West Palm Beach | $6,150,000 | 6.5% |
| North Salt Lake | $5,700,000 | 6.0% |
| Decatur | $5,800,000 | 7.5% |
| Nashville | $4,500,000 | 6.5% |
| Louisville | $4,300,000 | 6.3% |
| Centralia | $3,970,000 | 7.3% |
| Riverside II | $3,900,000 | 6.8% |
| Indianapolis | $2,650,000 | 6.5% |
| Elkhart | $1,250,000 | 6.5% |
| Total/ Wtd. Avg. | $348,250,000 | 6.68% |
Environmental Matters. According to the Phase I environmental site assessments dated between August 19, 2024 and August 27, 2024, there were recognized environmental conditions at seven of the Poindexter Industrial Portfolio Properties and controlled recognized environmental conditions at eight of the Poindexter Industrial Portfolio Properties. See “Description of the Mortgage Pool—Environmental Considerations” in the Preliminary Prospectus.
| THE INFORMATION IN THIS STRUCTURAL AND COLLATERAL TERM SHEET IS NOT COMPLETE AND MAY BE AMENDED PRIOR TO THE TIME OF SALE. THIS TERM SHEET IS NOT AN OFFER TO SELL THESE SECURITIES AND IT IS NOT A SOLICITATION OF AN OFFER TO BUY THESE SECURITIES IN ANY JURISDICTION WHERE THE OFFER OR SALE IS NOT PERMITTED. |
| | 65 | |
| Structural and Collateral Term Sheet | | BMO 2024-C10 |
| No. 3 – Poindexter Industrial Portfolio |
Underwritten Net Cash Flow. The following table presents certain information relating to the underwritten net cash flow at the Poindexter Industrial Portfolio Properties:
| Underwritten Net Cash Flow (1) |
| | UW | UW PSF |
| Base Rent | $22,046,258 | $4.87 |
| Contractual Rent Steps | 0 | 0.00 |
| Potential Income from Vacant Space | 0 | 0.00 |
| Gross Potential Rent | $22,046,258 | $4.87 |
| Reimbursements | 646,751 | 0.14 |
| Total Gross Income | $22,693,009 | $5.01 |
| (Vacancy / Credit Loss) | (1,134,650) | (0.25) |
| Effective Gross Income | $21,558,358 | $4.76 |
| Management Fee | 646,751 | 0.14 |
| Real Estate Taxes | 0 | 0.00 |
| Insurance | 0 | 0.00 |
| Other Expenses | 0 | 0.00 |
| Total Expenses(3) | $646,751 | $0.14 |
| | | |
| Net Operating Income | $20,911,608 | $4.62 |
| Capital Expenditures | 0 | 0.00 |
| Net Cash Flow | $20,911,608 | $4.62 |
| | | |
| Occupancy (%) | 100.0%(2) | |
| NOI DSCR(4) | 2.62x | |
| NCF DSCR(4) | 2.62x | |
| NOI Debt Yield(4) | 15.0% | |
| NCF Debt Yield(4) | 15.0% | |
| (1) | Based on the underwritten rent rolls dated between September 1, 2024 and November 6, 2024. Historical financial information is not available because the tenants are all leased on NNN leases. |
| (2) | UW Occupancy represents most recent occupancy as of the underwritten rent rolls dated between September 1, 2024 and November 6, 2024. |
| (3) | Expenses other than management fees were not underwritten, due to the tenants’ NNN leases. |
| (4) | The debt service coverage ratios and debt yields are based on the Poindexter Industrial Portfolio Whole Loan. |
| THE INFORMATION IN THIS STRUCTURAL AND COLLATERAL TERM SHEET IS NOT COMPLETE AND MAY BE AMENDED PRIOR TO THE TIME OF SALE. THIS TERM SHEET IS NOT AN OFFER TO SELL THESE SECURITIES AND IT IS NOT A SOLICITATION OF AN OFFER TO BUY THESE SECURITIES IN ANY JURISDICTION WHERE THE OFFER OR SALE IS NOT PERMITTED. |
| | 66 | |
| Structural and Collateral Term Sheet | | BMO 2024-C10 |
| No. 3 – Poindexter Industrial Portfolio |
The Market. The Poindexter Industrial Portfolio Properties are located across 19 states and one province of Canada and have the following concentrations based on total square footage:
| Geographic Distribution |
| State / Province | Number of Properties | SF | % of SF | UW NOI | % of UW NOI |
| Virginia | 1 | 878,000 | 19.4% | $2,448,627 | 11.7% |
| Pennsylvania | 4 | 723,907 | 16.0% | $3,105,619 | 14.9% |
| Michigan | 2 | 380,255 | 8.4% | $1,683,104 | 8.0% |
| Tennessee | 2 | 352,168 | 7.8% | $1,746,436 | 8.4% |
| Ohio | 1 | 347,024 | 7.7% | $876,492 | 4.2% |
| Georgia | 2 | 303,039 | 6.7% | $1,058,085 | 5.1% |
| Texas | 2 | 203,841 | 4.5% | $1,022,128 | 4.9% |
| California | 2 | 203,214 | 4.5% | $832,315 | 4.0% |
| Wisconsin | 1 | 196,098 | 4.3% | $823,050 | 3.9% |
| Alabama | 1 | 183,804 | 4.1% | $300,165 | 1.4% |
| Utah | 2 | 136,059 | 3.0% | $1,380,491 | 6.6% |
| Arizona | 1 | 120,416 | 2.7% | $465,267 | 2.2% |
| Quebec | 1 | 117,533 | 2.6% | $1,652,110 | 7.9% |
| Florida | 2 | 105,290 | 2.3% | $1,289,717 | 6.2% |
| Oklahoma | 1 | 101,498 | 2.2% | $520,767 | 2.5% |
| Washington | 1 | 47,826 | 1.1% | $200,330 | 1.0% |
| Indiana | 2 | 45,219 | 1.0% | $234,034 | 1.1% |
| Idaho | 1 | 37,100 | 0.8% | $506,073 | 2.4% |
| Kentucky | 1 | 26,325 | 0.6% | $259,678 | 1.2% |
| Maryland | 1 | 17,552 | 0.4% | $507,120 | 2.4% |
| THE INFORMATION IN THIS STRUCTURAL AND COLLATERAL TERM SHEET IS NOT COMPLETE AND MAY BE AMENDED PRIOR TO THE TIME OF SALE. THIS TERM SHEET IS NOT AN OFFER TO SELL THESE SECURITIES AND IT IS NOT A SOLICITATION OF AN OFFER TO BUY THESE SECURITIES IN ANY JURISDICTION WHERE THE OFFER OR SALE IS NOT PERMITTED. |
| | 67 | |
| Structural and Collateral Term Sheet | | BMO 2024-C10 |
| No. 3 – Poindexter Industrial Portfolio |
The following table presents certain information relating to the submarkets at the Poindexter Industrial Portfolio Properties:
| Industrial Market Analysis(1) |
| Property Name / Address | Market | Submarket | Submarket Inventory | Submarket Vacancy | Market Rent (PSF) | UW Base Rent PSF(2) |
Brenham 3140 S. Blue Bell Rd, Brenham, TX | Houston Industrial | Brenham Industrial - 30 Miles | 12,156,216 | 3.10% | $9.49 | $5.14 |
Caldwell 3820 Skyway St, Caldwell, ID | Boise MSA | Canyon County | 24,268,983 | 10.30% | $10.39 | $14.38 |
Centralia 2400 Commercial Rd, Centralia, WA | Puget Sound | Olympia | 22,311,706 | 5.40% | $13.15 | $4.42 |
Claremore 2800 N. Lynn Riggs Blvd, Claremore, OK | Tulsa MSA | Rogers County | 10,815,832 | 0.60% | $7.64 | $5.41 |
Clinton 6401 & 6315 Aaron Ln, Clinton, MD | Washington, DC MSA | Prince George's County | 48,652,066 | 4.30% | $13.59 | $30.46 |
Corsicana 8051 Morgan Circle, Corsicana, TX | Dallas/Ft Worth | Texas East Area | 51,587,463 | 5.70% | $8.35 | $5.54 |
Decatur 1102 Brooks St. SE, Decatur, AL | Decatur, AL MSA | Alabama North Area | 77,493,241 | 2.30% | $6.53 | $1.72 |
Denver 1658 Dry Tavern Rd, Denver, PA | Lancaster MSA | 8 Mile Radius | 12,624,208 | 1.00% | $7.65 | $8.18 |
Ehrenberg 18275 Morgan Drive, Ehrenberg, AZ | Western Arizona | La Paz County | 575,681 | 5.30% | $8.20 | $4.07 |
Elkhart 28858 Ventura Dr, Elkhart, IN | Elkhart - South Bend MSA | Outlying Elkhart County | 83,285,911 | 3.30% | $5.23 | $4.48 |
Ephrata 485 Wenger Dr, Ephrata, PA | Lancaster County | 5 Mile Radius | 6,190,235 | 1.80% | $7.65 | $7.11 |
Indianapolis 2770 Bluff Rd, Indianapolis, IN | Indianapolis MSA | White River Parkway | 14,130,118 | 3.90% | $6.26 | $6.04 |
Janesville 3100 E. Morgan Way, Janesville, WI | Milwaukee Madison | Rock County | 29,239,613 | 5.20% | $5.12 | $4.42 |
Laval 3600 Boulevard Industriel, Laval, Quebec | Montreal CMA | Laval | NAV | 2.80% | $20.32 | $14.82 |
Loudon 9600 Corporate Park Drive, Loudon TN | Knoxville | Loudon County | 6,785,304 | 0.20% | $7.43 | $4.63 |
Louisville 5620 Fern Valley Rd, Louisville, KY | Louisville | South Central | 67,016,104 | 3.40% | $5.14 | $10.40 |
Morgantown 111 Morgan Way, Morgantown, PA | Lehigh Valley | Berks County | 58,848,322 | 7.80% | $8.56 | $5.33 |
Nashville 1801 Lebanon Pike, Nashville, TN | Nashville | East | 11,882,148 | 0.60% | $9.20 | $16.17 |
North Salt Lake 330 W Center Street, North Salt Lake, UT | Salt Lake City | Davis North | 57,582,024 | 1.90% | $10.91 | $14.03 |
Orrville 600 E Chestnut St, Orville, OH | Canton MSA & Surrounding Non-Metro Counties | Canton & Surrounding Non-Metro, 100K+, YB < 2000 | 32,540,096 | 3.90% | $4.86 | $2.66 |
Reading 201 Hancock Blvd, Reading, PA | Lehigh Valley | Berks County | 58,848,322 | 7.80% | $8.56 | $2.35 |
Ringgold 100 Morgan Olson Way, Ringold, VA | Danville | Danville | 17,191,091 | 5.10% | $4.37 | $2.94 |
Riverside I 7888 Lincoln Ave, Riverside, CA | Inland Empire | Riverside | 79,338,864 | 6.90% | $14.16 | $10.73 |
Riverside II 7322 Jurupa Ave, Riverside,CA | Inland Empire | Riverside | 79,338,864 | 6.90% | $14.16 | $1.24 |
Rydal 4120 Highway 411 NE, Rydal, GA | Atlanta | Kennesaw/Acworth | 9,039,649 | 2.10% | $5.38 | $4.99 |
Salt Lake City 4285 West 1385 South, Salt Lake City, UT | Salt Lake City | California Avenue | 53,896,200 | 5.50% | $10.91 | $9.90 |
Social Circle 1 Waters Dr, Social Circle, GA | Atlanta | South Walton County | 5,700,293 | 0.90% | $5.38 | $3.01 |
Spring Hill 15800 Hudson Ave, Springhill, FL | Tampa MSA | Pasco County | 14,478,958 | 9.10% | $11.77 | $12.03 |
Sturgis I 1861 South Centerville Rd, Sturgis, MI | West Michigan | Southwest Michigan | 35,623,851 | 1.90% | $5.85 | $4.68 |
Sturgis II 1801 South Nottawa St, Sturgis, MI | West Michigan | Southwest Michigan | 35,623,851 | 1.90% | $5.85 | $4.65 |
West Palm Beach 2983 South Military Trail, West Palm Beach, FL | Palm Beach County | Lake Worth West | 2,917,804 | 1.40% | $15.43 | $15.77 |
| (2) | Based on the underwritten rent rolls dated between September 1, 2024 and November 6, 2024. |
| THE INFORMATION IN THIS STRUCTURAL AND COLLATERAL TERM SHEET IS NOT COMPLETE AND MAY BE AMENDED PRIOR TO THE TIME OF SALE. THIS TERM SHEET IS NOT AN OFFER TO SELL THESE SECURITIES AND IT IS NOT A SOLICITATION OF AN OFFER TO BUY THESE SECURITIES IN ANY JURISDICTION WHERE THE OFFER OR SALE IS NOT PERMITTED. |
| | 68 | |
| Structural and Collateral Term Sheet | | BMO 2024-C10 |
| No. 3 – Poindexter Industrial Portfolio |
The Borrowers. The borrowers are Poindexter Properties, LLC, a Delaware limited liability company and Poindexter Properties Canada LTD., a body corporate incorporated pursuant to the law of the Province of Alberta, Canada, each a single-purpose entity with one independent director in its organizational structure. Legal counsel to the borrowers delivered a non-consolidation opinion in connection with the origination of the Poindexter Industrial Portfolio Whole Loan.
The Borrower Sponsor. The non-recourse carveout guarantor is John B. Poindexter, Chief Executive Officer, Chairman and sole owner of the borrower sponsor, JB Poindexter & Co., Inc. (“JB Poindexter & Co.”). JB Poindexter & Co. is a privately held, diversified manufacturing company primarily focused on the transportation sector. JB Poindexter & Co. employs 8,500 team members globally with manufacturing operations across North America and is rated B1 by Moody’s. JB Poindexter & Co. is the parent company to Morgan Truck, Reading Truck, Morgan Olson, MIC Group LLC, Masterack LLC (“Masterack”), EFP LLC and Leer, which affiliated tenants collectively lease 98.1% of the net rentable area and represent 97.8% of underwritten base rent at the Poindexter Industrial Portfolio Properties. JB Poindexter & Co. has entered into contribution agreements with each tenant, pursuant to which it has agreed to timely pay, or cause sufficient funds to be paid to the tenant in order for the tenant to pay, the obligations of the tenant under its lease when the same shall be due and payable. See “Description of the Mortgage Pool—Affiliated Leases” in the Preliminary Prospectus.
Property Management. The Poindexter Industrial Portfolio Properties are self-managed by the borrower sponsor.
Escrows and Reserves.
Real Estate Taxes – On a monthly basis, the borrowers are required to escrow 1/12th of the taxes that the lender reasonably estimates will be payable over the next-ensuing 12-month period; provided, however, that the borrowers are not obligated to make the portion of such monthly tax deposit on account of any tenant which pays all taxes directly to the applicable governmental authority pursuant to such tenant’s lease (collectively, the “Tax Paying Tenants”) for so long as (i) no event of default has occurred and is continuing, (ii) the borrowers provide proof of payment by the tenant (or the borrowers) directly to the taxing authority on or before 15 days prior to the delinquency date of such taxes and (iii) the lease(s) with the applicable Tax Paying Tenant are and continue to be in full force and effect and are not subject to any default beyond any applicable grace or notice and cure period. As of the origination date, all tenants are Tax Paying Tenants.
Insurance – On a monthly basis, the borrowers are required to escrow 1/12th of the amount which would be sufficient to pay the insurance premiums due for the renewal of coverage afforded by the insurance policies; provided, however, that the borrowers are not obligated to make such monthly insurance deposit if (i) no event of default has occurred and is continuing, (ii) the policies maintained by the borrowers covering the Poindexter Industrial Portfolio Properties are part of a blanket or umbrella policy approved by lender in its reasonable discretion, (iii) the borrowers provide lender evidence of renewal of such policies, and (iv) the borrowers provide lender paid receipts for the payment of the insurance premiums prior to the expiration dates of the policies. At origination of the Poindexter Industrial Portfolio Whole Loan, an acceptable blanket policy was in place.
Replacement Reserve – Upon the occurrence of a Trigger Period (as defined below) and for as long as such Trigger Period is continuing, the borrowers are required to deposit into a replacement reserve, on a monthly basis, approximately $37,718 for replacements at the Poindexter Industrial Portfolio Properties.
TI/LC Reserve - Upon the occurrence of a Trigger Period and for as long as such Trigger Period is continuing, the borrowers are required to deposit into a leasing reserve, on a monthly basis, approximately $94,295.
Lockbox / Cash Management. The Poindexter Industrial Portfolio Whole Loan is structured with a hard lockbox and springing cash management. At origination of the Poindexter Industrial Portfolio Whole Loan, the borrowers were required to establish a lender controlled lockbox account and are required to promptly (but in any event, within two (2) business days of receipt) deposit or cause to be deposited all revenue from the Poindexter Industrial Portfolio Properties directly into such lender-controlled lockbox account. The borrowers were required to deliver a notice to all tenants at the Poindexter Industrial Portfolio Properties directing them to remit rent and all other sums due under the applicable lease directly to the lender-controlled lockbox account. All funds deposited into the lockbox account are required to be transferred on each business day to or at the direction of the borrowers unless a Trigger Period exists, in which case all funds in the lockbox account are required to be swept on each business day to a lender-controlled cash management account to be applied and disbursed in accordance with the Poindexter Industrial Portfolio Whole Loan documents, and all excess cash flow funds remaining in the cash management account after the application of such funds in accordance with the Poindexter Industrial Portfolio
| THE INFORMATION IN THIS STRUCTURAL AND COLLATERAL TERM SHEET IS NOT COMPLETE AND MAY BE AMENDED PRIOR TO THE TIME OF SALE. THIS TERM SHEET IS NOT AN OFFER TO SELL THESE SECURITIES AND IT IS NOT A SOLICITATION OF AN OFFER TO BUY THESE SECURITIES IN ANY JURISDICTION WHERE THE OFFER OR SALE IS NOT PERMITTED. |
| | 69 | |
| Structural and Collateral Term Sheet | | BMO 2024-C10 |
| No. 3 – Poindexter Industrial Portfolio |
Whole Loan documents are required to be held by the lender in an excess cash flow reserve account as additional collateral for the Poindexter Industrial Portfolio Whole Loan, provided that, so long as no event of default is continuing, the lender is required to allow funds in such account to be used by the borrowers to make certain tax-related distributions to their parent entities. Upon the cure of the applicable Trigger Period, so long as no other Trigger Period exists, the lender is required to return any amounts remaining on deposit in the excess cash flow reserve account to the borrowers. Upon an event of default under the Poindexter Industrial Portfolio Whole Loan documents, the lender will apply funds to the debt in such priority as it may determine.
“Trigger Period” means a period (A) commencing upon the earlier of (i) the occurrence and continuance of an event of default under the Poindexter Industrial Portfolio Whole Loan documents, (ii) the debt service coverage ratio being less than 1.30x as of any determination date after January 1, 2025, and (iii) the occurrence of a Specified Tenant Trigger Period (as defined below); and (B) expiring upon (x) with regard to clause (i) above, the cure or waiver (if applicable) of such event of default, (y) with regard to clause (ii) above, the date that the debt service coverage ratio is equal to or greater than 1.30x for two consecutive calendar quarters and (z) with regard to clause (iii) above, the Specified Tenant Trigger Period ceasing to exist and no other Specified Tenant Trigger Period is then continuing.
“Specified Tenant Trigger Period” means a period (A) commencing upon the first to occur of (i) one or more Specified Tenants (as defined below) being in default beyond applicable notice and cure periods under Specified Tenant leases representing 20% or more of the total gross rents of all Specified Tenant leases, (ii) one or more Specified Tenants representing 20% or more of the total gross rents of all Specified Tenant leases, (a) failing to be in actual, physical possession, (b) failing to be open for business during customary hours and/or (c) “going dark”, in each case, in the Specified Tenant space (or applicable portion thereof), (iii) one or more Specified Tenants giving notice that it is terminating its lease for all or any portion of the Specified Tenant space comprising 20% or more of the total gross rents of all Specified Tenant leases, (iv) the termination or cancellation of one or more Specified Tenant leases (including, without limitation, rejection in any bankruptcy or similar insolvency proceeding) and/or one or more Specified Tenant leases failing to otherwise be in full force and effect, in each case, representing 20% or more of the total gross rents of all Specified Tenant leases, (v) any bankruptcy or similar insolvency of any Specified Tenant and (vi) J.B. Poindexter & Co. ceasing to meet the Credit Rating Condition (as defined below) (the “Credit Rating Trigger”) and (B) expiring upon the first to occur of the lender’s receipt of evidence reasonably acceptable to the lender of (1) the satisfaction of the applicable Specified Tenant Cure Conditions (as defined below); or (2) the borrowers leasing the entirety of the applicable Specified Tenant space (or applicable portion thereof that gave rise to the Specified Tenant Trigger Period) in accordance with the applicable terms and conditions of the Poindexter Industrial Portfolio Whole Loan documents, the applicable tenant under such lease being in actual, physical occupancy of, and open to the public for business in, the space demised under its lease and paying full, unabated rent.
“Specified Tenant” means, as applicable, (i) Reading Asset I, LLC, (ii) Morgan Truck Body, LLC, (iii) Reading Truck Equipment, LLC, (iv) Truck Accessories Group, LLC, (v) Reading Truck Body, LLC, (vi) Reading Midwest Distribution, LLC, (vii) Morgan Olson, LLC, (viii) MIC Group, LLC, (ix) Masterstack, (x) EFP, LLC, (xi) Societe Morgan Transit, Inc. and (xii) any other lessee(s) of the Specified Tenant space (or any portion thereof) and any guarantor of any Specified Tenant lease (whether pursuant to a contribution agreement or otherwise).
The “Credit Rating Condition” means JB Poindexter & Co maintains a long-term corporate family rating of at least “B3” from Moody’s, provided that if Moody’s does not maintain an applicable rating, an equivalent rating from any of S&P, Fitch or any other nationally-recognized rating agency designated by lender in connection with a securitization transaction may be used to meet this condition.
“Specified Tenant Cure Conditions” means each of the following, as applicable (i) the applicable Specified Tenant has cured all defaults under the applicable Specified Tenant lease, (ii) the applicable Specified Tenant is in actual, physical possession of the Specified Tenant space (or applicable portion thereof), open to the public for business during customary hours and not “dark” in the Specified Tenant space (or applicable portion thereof), (iii) the applicable Specified Tenant has revoked or rescinded all termination or cancellation notices with respect to the applicable Specified Tenant lease and has re-affirmed the applicable Specified Tenant lease as being in full force and effect, (iv) with respect to any applicable bankruptcy or insolvency proceedings involving the applicable Specified Tenant and/or the applicable Specified Tenant lease, the applicable Specified Tenant has affirmed or assumed the applicable Specified Tenant lease, without material modification, pursuant to a final, non-appealable order of a court of competent jurisdiction, (v) the applicable Specified Tenant is paying full, unabated rent under the applicable Specified Tenant lease and (vi) in the event the Specified Tenant Trigger Period is due to a Credit Rating Trigger, JB Poindexter & Co. maintains a long-term corporate family rating of at
| THE INFORMATION IN THIS STRUCTURAL AND COLLATERAL TERM SHEET IS NOT COMPLETE AND MAY BE AMENDED PRIOR TO THE TIME OF SALE. THIS TERM SHEET IS NOT AN OFFER TO SELL THESE SECURITIES AND IT IS NOT A SOLICITATION OF AN OFFER TO BUY THESE SECURITIES IN ANY JURISDICTION WHERE THE OFFER OR SALE IS NOT PERMITTED. |
| | 70 | |
| Structural and Collateral Term Sheet | | BMO 2024-C10 |
| No. 3 – Poindexter Industrial Portfolio |
least “B1” from Moody’s or if Moody’s does not maintain an applicable rating, an equivalent rating from any of S&P, Fitch or any other nationally -recognized rating agency designated by lender in connection with a securitization transaction.
Letters of Credit. Upon no less than ten days written notice to lender, the borrowers may provide a letter of credit in lieu of any of the required cash deposits into any reserve fund (except for the excess cash flow reserve), provided that such letter of credit is in the amount of the required cash deposit into the applicable reserve fund and otherwise meets all applicable requirements under the Poindexter Industrial Portfolio Whole Loan documents. Upon prior written notice to lender, the borrowers may replace a letter of credit with a cash deposit to the applicable reserve fund.
Current Mezzanine or Secured Subordinate Indebtedness. None.
Permitted Future Mezzanine or Secured Subordinate Indebtedness. Not permitted.
Release of Property. Provided that no event of default has occurred and is continuing under the Poindexter Industrial Portfolio Whole Loan documents, the borrowers may at any time, other than during the period commencing 90 days prior to a securitization and ending 90 days after a securitization of the Poindexter Industrial Portfolio Whole Loan, obtain the release of any one or more individual Poindexter Industrial Portfolio Properties from the lien of the Poindexter Industrial Portfolio Whole Loan, subject to the satisfaction of certain conditions, including, but not limited to, (i) prepayment of the Poindexter Industrial Portfolio Whole Loan in the amount of the applicable Release Price (as defined below) together with any applicable interest shortfall and a prepayment fee (the “Prepayment Fee”) equal to the greater of 1.0% of the amount prepaid and a yield maintenance premium (to the extent such prepayment occurs any time other than six months prior to the maturity date), (ii) after giving effect to such release, the debt service coverage ratio with respect to the remaining individual Poindexter Industrial Portfolio Properties is greater than (1) the debt service coverage ratio of all individual Poindexter Industrial Portfolio Properties prior to the partial release and (2) 2.49x, (iii) after giving effect to the partial release, the loan-to-value ratio of the remaining Poindexter Industrial Portfolio Properties is no greater than the lesser of (1) the loan-to-value ratio of all individual Poindexter Industrial Portfolio Properties prior to the partial release and (2) 49.0%, and (iv) compliance with certain REMIC related provisions.
“Release Price” means, with respect to any individual Poindexter Industrial Portfolio Property, an amount equal to 110% of the allocated loan amount for such individual Poindexter Industrial Portfolio Property.
The borrower may satisfy the release conditions relating to debt service coverage ratio and loan-to-value ratio in clauses (ii) and (iii) of the paragraph above by prepaying the Poindexter Industrial Portfolio Whole Loan together with any then applicable Prepayment Fee, or by making a cash deposit or delivering a letter of credit, in each case in an amount which, if applied to reduce the principal amount of the Poindexter Industrial Portfolio Whole Loan, would cause such conditions to be satisfied. In the event the borrower makes a cash deposit or provides a letter of credit, then at such time as such debt service coverage ratio and loan-to-value ratio conditions are satisfied without giving effect to such cash deposit or letter of credit, such cash deposit or letter of credit will be returned to the borrower upon its request.
Ground Lease. The borrower’s interest in the Loudon, TN property is a ground leasehold interest in connection with a payment in lieu of taxes (“PILOT”) arrangement applicable to the property, which PILOT expires in 2026. The applicable development authority joined the related deed of trust to encumber the fee interest. Real estate taxes were underwritten assuming that all tenants pay taxes pursuant to their triple net leases, and accordingly the PILOT was not underwritten.
| THE INFORMATION IN THIS STRUCTURAL AND COLLATERAL TERM SHEET IS NOT COMPLETE AND MAY BE AMENDED PRIOR TO THE TIME OF SALE. THIS TERM SHEET IS NOT AN OFFER TO SELL THESE SECURITIES AND IT IS NOT A SOLICITATION OF AN OFFER TO BUY THESE SECURITIES IN ANY JURISDICTION WHERE THE OFFER OR SALE IS NOT PERMITTED. |
| | 71 | |
| Structural and Collateral Term Sheet | | BMO 2024-C10 |
| No. 4 – White Oak Village |

| THE INFORMATION IN THIS STRUCTURAL AND COLLATERAL TERM SHEET IS NOT COMPLETE AND MAY BE AMENDED PRIOR TO THE TIME OF SALE. THIS TERM SHEET IS NOT AN OFFER TO SELL THESE SECURITIES AND IT IS NOT A SOLICITATION OF AN OFFER TO BUY THESE SECURITIES IN ANY JURISDICTION WHERE THE OFFER OR SALE IS NOT PERMITTED. |
| | 72 | |
| Structural and Collateral Term Sheet | | BMO 2024-C10 |
| No. 4 – White Oak Village |
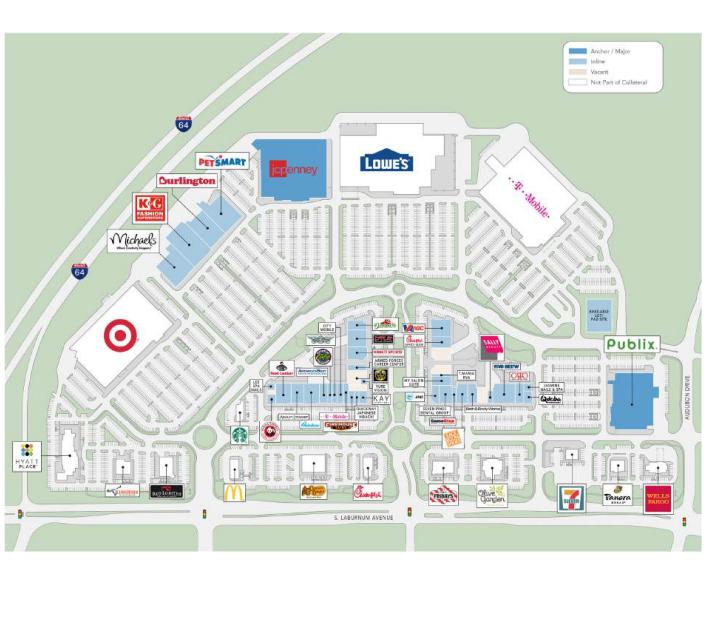
| THE INFORMATION IN THIS STRUCTURAL AND COLLATERAL TERM SHEET IS NOT COMPLETE AND MAY BE AMENDED PRIOR TO THE TIME OF SALE. THIS TERM SHEET IS NOT AN OFFER TO SELL THESE SECURITIES AND IT IS NOT A SOLICITATION OF AN OFFER TO BUY THESE SECURITIES IN ANY JURISDICTION WHERE THE OFFER OR SALE IS NOT PERMITTED. |
| | 73 | |
| Structural and Collateral Term Sheet | | BMO 2024-C10 |
| No. 4 – White Oak Village |

| THE INFORMATION IN THIS STRUCTURAL AND COLLATERAL TERM SHEET IS NOT COMPLETE AND MAY BE AMENDED PRIOR TO THE TIME OF SALE. THIS TERM SHEET IS NOT AN OFFER TO SELL THESE SECURITIES AND IT IS NOT A SOLICITATION OF AN OFFER TO BUY THESE SECURITIES IN ANY JURISDICTION WHERE THE OFFER OR SALE IS NOT PERMITTED. |
| | 74 | |
| Structural and Collateral Term Sheet | | BMO 2024-C10 |
| No. 4 – White Oak Village |
| Mortgage Loan Information | | Property Information |
| Mortgage Loan Seller: | ZBNA | | Single Asset / Portfolio: | Single Asset |
| Original Principal Balance: | $44,450,000 | | Title: | Fee |
| Cut-off Date Principal Balance: | $44,450,000 | | Property Type – Subtype: | Retail – Anchored |
| % of IPB: | 6.1% | | Net Rentable Area (SF): | 397,605 |
| Loan Purpose: | Acquisition | | Location: | Richmond, VA |
| Borrower: | Triple Bar White Oak, LLC | | Year Built / Renovated: | 2008 / NAP |
| Borrower Sponsors: | Robert V. Gothier, Jr. and Mark X. DiSanto | | Occupancy: | 93.2% |
| Interest Rate: | 6.10000% | | Occupancy Date: | 9/9/2024 |
| Note Date: | 9/10/2024 | | 4th Most Recent NOI (As of): | $5,284,033 (12/31/2021) |
| Maturity Date: | 10/6/2034 | | 3rd Most Recent NOI (As of): | $5,522,428 (12/31/2022) |
| Interest-only Period: | 120 months | | 2nd Most Recent NOI (As of): | $5,514,501 (12/31/2023) |
| Original Term: | 120 months | | Most Recent NOI (As of): | $5,495,267 (TTM 6/30/2024) |
| Original Amortization Term: | None | | UW Economic Occupancy: | 90.0% |
| Amortization Type: | Interest Only | | UW Revenues: | $7,348,911 |
| Call Protection: | L(25),D(90),O(5) | | UW Expenses: | $1,769,494 |
| Lockbox / Cash Management: | Springing | | UW NOI: | $5,579,417 |
| Additional Debt: | No | | UW NCF: | $5,365,926 |
| Additional Debt Balance: | N/A | | Appraised Value / Per SF: | $85,000,000 / $214 |
| Additional Debt Type: | N/A | | Appraisal Date: | 7/23/2024 |
| | | | | |
| Escrows and Reserves(1) | | Financial Information |
| | Initial | Monthly | Initial Cap | | Cut-off Date Loan / SF: | $112 |
| Taxes: | $325,047 | $46,435 | N/A | | Maturity Date Loan / SF: | $112 |
| Insurance: | $0 | Springing | N/A | | Cut-off Date LTV: | 52.3% |
| Replacement Reserves: | $250,000 | Springing | $250,000 | | Maturity Date LTV: | 52.3% |
| TI / LC: | $1,250,000 | Springing | $1,250,000 | | UW NCF DSCR: | 1.95x |
| Rent Concession Reserve: | $31,373 | $0 | N/A | | UW NOI Debt Yield: | 12.6% |
| Existing TI / LC Reserve: | $1,660,826 | $0 | N/A | | | |
| | | | | | | |
| Sources and Uses |
| Sources | Proceeds | % of Total | | Uses | Proceeds | % of Total | |
| Mortgage Loan | $44,450,000 | 64.9 | % | | Purchase Price | $63,502,857 | 92.7 | % |
| Borrower Sponsor Equity | 22,517,134 | 32.9 | | | Upfront Reserves | 3,517,246 | 5.1 | |
| Seller Credits | 1,500,000 | 2.2 | | | Closing Costs | 1,447,031 | 2.1 | |
| Total Sources | $68,467,134 | 100.0 | % | | Total Uses | $68,467,134 | 100.0 | % |
| (1) | For a full description of Escrows and Reserves, please refer to “Escrows and Reserves” below. |
The Loan. The fourth largest mortgage loan (the “White Oak Village Mortgage Loan”) is evidenced by a single promissory note in the original principal amount of $44,450,000 and is secured by the borrower’s fee interest in an anchored retail power center located in Richmond, Virginia (the “White Oak Village Property”). The White Oak Village Mortgage Loan was originated on September 10, 2024 by Zions Bancorporation, N.A. (“ZBNA”) and proceeds, along with approximately $22.5 million of equity contributed by the borrower sponsors and $1.5 million in seller credits, were used to acquire the White Oak Village Property, fund upfront reserves and pay closing costs. The White Oak Village Mortgage Loan accrues interest at a fixed rate of 6.10000% per annum on an Actual/360 basis, has a 10-year original term and is interest-only for the full term. The scheduled maturity date of the White Oak Village Mortgage Loan is October 6, 2034.
The Property. The White Oak Village Property is a seven building, Class A anchored retail power center totaling 397,605 square feet, situated along the South Laburnum Avenue retail corridor in Richmond, Virginia. Together with the non-collateral Lowe’s and Target, the White Oak Village Property is well-located along a highly traveled roadway, featuring combined traffic counts of approximately 33,768 vehicles per day. Constructed in 2008, the White Oak Village Property is situated on a 75.8-acre parcel and is anchored by the national grocery chain Publix and junior anchors PetSmart, Michael’s, Burlington Coat Factory and K&G Men’s Company, along with JCPenney which operates its space pursuant to a ground
| THE INFORMATION IN THIS STRUCTURAL AND COLLATERAL TERM SHEET IS NOT COMPLETE AND MAY BE AMENDED PRIOR TO THE TIME OF SALE. THIS TERM SHEET IS NOT AN OFFER TO SELL THESE SECURITIES AND IT IS NOT A SOLICITATION OF AN OFFER TO BUY THESE SECURITIES IN ANY JURISDICTION WHERE THE OFFER OR SALE IS NOT PERMITTED. |
| | 75 | |
| Structural and Collateral Term Sheet | | BMO 2024-C10 |
| No. 4 – White Oak Village |
lease. Additional notable in-line tenants include Five Below, Foot Locker, Hibbett Sporting Goods, Rack Room Shoes, Bath & Body Works, AT&T, T-Mobile and GameStop, plus several dining options including Wingstop, Qdoba Mexican Grill, Panda Express and Firehouse Subs. Reporting in-line tenants have weighted average sales of $383 per square foot, representing a 7.9% weighted average occupancy cost as of each tenant’s respective most recent trailing twelve month reporting period. As of the Cut-off Date, tenants have been in occupancy at the White Oak Village Property for a weighted average of 12.8 years. The seller completed approximately $1,048,769 in capital expenditures at the White Oak Village Property from 2021-2023, including HVAC, LED lighting, plumbing enhancements and upgrades, parking lot, sidewalk and fixture upgrades.
As of September 9, 2024, the White Oak Village Property was 93.2% occupied by 37 tenants and has averaged 94.3% occupancy from 2014 through 2023. No single tenant, besides the grocery anchor Publix, represents more than 6.4% of underwritten base rent and only JCPenney, which occupies its space pursuant to a ground lease, and the grocery anchor Publix, represent more than 5.8% of the net rentable area. Per the zoning report, the White Oak Village Property contains 2,697 surface parking spaces, resulting in a parking ratio of approximately 6.8 spaces per 1,000 square feet of rentable area.
Major Tenants. The three largest tenants based on underwritten base rent are Publix, PetSmart and K&G Men’s Company.
Publix (60,951 square feet; 15.3% of NRA, 22.2% of underwritten base rent): Founded in 1930 in Winter Haven, Florida, Publix employs approximately 255,000 people across 1,378 stores throughout the southeastern United States. Publix is one of the largest employee-owned companies and a top 10 largest-volume supermarket chain in the nation. Nationally, 2022 sales totaled approximately $54.5 billion. Publix has been a tenant at the White Oak Village Property since October 2008, with its current lease expiration date four years beyond the White Oak Village Mortgage Loan’s stated maturity in October 2038 and has five remaining 5-year extension options, with no unilateral termination options. The base rental rate for the next renewal option, if exercised, would be $23.88 per square foot from October 2038 to October 2043.
PetSmart (20,547 square feet; 5.2% of NRA, 6.3% of underwritten base rent, Moody’s/S&P/Fitch: B1/B+/NR): Founded in 1987, PetSmart has over 21 proprietary retail pet product brands and employs approximately 50,000 associates across over 1,660 stores, seven distribution centers and two home offices in the United States and Canada. At the White Oak Village Property, the PetSmart location features pet grooming and training services in-store. PetSmart has been a tenant since March 2009 and its current lease expiration date is in February 2029 and the tenant has three, 5-year extension options remaining, with no unilateral termination options. The base rental rate for the next renewal option, if exercised, would be $18.50 per square foot from March 2029 to February 2034.
K&G Men’s Company (22,854 square feet; 5.7% of NRA, 5.9% of underwritten base rent, Moody’s/S&P/Fitch: NR/B/NR): With more than 85 store locations nationally, K&G Men’s Company (“K&G”) offers up to 60% discounts on department store prices on brand-name men’s, women’s and children’s clothing, footwear and accessories along with in-store tailoring services. Men’s designers include Joseph Abboud, Calvin Klein, Perry Ellis, Kenneth Cole, Sean John, and Nautica, while contemporary women's designers include Tahari, Lauren by Ralph Lauren, Nine West, Anne Klein, and Calvin Klein. K&G has been a tenant at the White Oak Village Property since February 2013, with its current lease expiration date in February 2028 and has two, 5-year extension options remaining, with no unilateral termination options. The base rental rate for the next renewal option, if exercised, would be $15.97 per square foot from March 2028 to February 2033.
The following table presents certain information relating to the historical occupancy of the White Oak Village Property:
| Historical and Current Occupancy |
| 2019(1) | 2020(1) | 2021(1) | 2022(1) | 2023(1) | Current(2) |
| 93.3% | 93.1% | 96.5% | 95.1% | 94.6% | 93.2% |
| (1) | Historical Occupancies are as of December 31 of each respective year. |
| (2) | Based on the underwritten rent roll dated September 9, 2024. |
| THE INFORMATION IN THIS STRUCTURAL AND COLLATERAL TERM SHEET IS NOT COMPLETE AND MAY BE AMENDED PRIOR TO THE TIME OF SALE. THIS TERM SHEET IS NOT AN OFFER TO SELL THESE SECURITIES AND IT IS NOT A SOLICITATION OF AN OFFER TO BUY THESE SECURITIES IN ANY JURISDICTION WHERE THE OFFER OR SALE IS NOT PERMITTED. |
| | 76 | |
| Structural and Collateral Term Sheet | | BMO 2024-C10 |
| No. 4 – White Oak Village |
Appraisal. According to the appraisal, the “as-is” appraised value of the White Oak Village Property as of July 23, 2024 was $85,000,000. The table below shows the appraisal’s “as-is” conclusions.
Appraisal Valuation Summary(1) |
Property | Appraised Value | Capitalization Rate |
| White Oak Village | $85,000,000 | 7.50% |
Environmental. The Phase I environmental assessment at the White Oak Village Property dated July 24, 2024 did not identify any recognized environmental conditions.
The following table presents certain information relating to the largest tenants based on underwritten base rent at the White Oak Village Property:
| Tenant Summary(1) |
| Tenant | Ratings
Moody’s/S&P/Fitch(2) | Net Rentable Area (SF) | % of
Total NRA | UW Base Rent PSF(3) | UW Base Rent(3) | % of Total
UW Base Rent(3) | Sales PSF/Year(4) | UW Occ. Costs(5) | Lease
Exp. Date |
| Publix | NR/NR/NR | 60,951 | 15. | 3% | $20.63 | $1,257,419 | 22. | 2% | NAV | NAV | 10/6/2038 |
| PetSmart | B1/B+/NR | 20,547 | 5.2 | | $17.50 | 359,573 | 6.3 | | NAV | NAV | 2/28/2029 |
| K&G Men’s Company | NR/B/NR | 22,854 | 5.7 | | $14.52 | 331,840 | 5.9 | | NAV | NAV | 2/29/2028 |
| Five Below | NR/NR/NR | 10,570 | 2.7 | | $28.00 | 295,960 | 5.2 | | NAV | NAV | 7/31/2035 |
| Burlington Coat Factory(6) | Ba2/BB+/NR | 18,016 | 4.5 | | $16.00 | 288,256 | 5.1 | | NAV | NAV | 2/28/2035 |
| Michael’s | B3/B-/NR | 20,356 | 5.1 | | $12.75 | 259,539 | 4.6 | | NAV | NAV | 7/31/2029 |
| JCPenney(7) | NR/NR/NR | 105,607 | 26.6 | | $1.89 | 200,000 | 3.5 | | NAV | NAV | 3/31/2029 |
| Downtown Locker Room | NR/NR/NR | 7,011 | 1.8 | | $27.50 | 192,803 | 3.4 | | $529 | 6.4% | 8/31/2033 |
| Fashion Gallery (Rainbow) | NR/NR/NR | 7,606 | 1.9 | | $23.24 | 176,763 | 3.1 | | $202 | 16.6% | 1/31/2030 |
| Foot Locker | Ba2/BB/NR | 7,578 | 1.9 | | $22.00 | 166,716 | 2.9 | | $290 | 9.0% | 1/31/2030 |
| Top 10 Tenants | | 281,096 | 70. | 7% | $12.55 | $3,528,869 | 62.3 | % | | | |
| Other Tenants | | 89,627 | 22. | 5% | $23.83 | $2,135,524 | 37.7 | % | | | |
| Occupied Collateral Total / Wtd. Avg. | | 370,723 | 93. | 2% | $15.28 | $5,664,393 | 100.0 | % | | | |
| | | | | | | | | | |
| Vacant Space | | 26,882 | 6. | 8% | | | | | | |
| | | | | | | | | | |
| Collateral Total | | 397,605 | 100. | 0% | | | | | | |
| | | | | | | | | | |
| (1) | Based on the underwritten rent roll dated September 9, 2024. |
| (2) | In certain instances, ratings provided are those of the parent company of the entity shown, whether or not the parent company guarantees the lease. |
| (3) | UW Base Rent, % of Total UW Base Rent and UW Base Rent PSF include contractual rent steps through August 2025 for 16 tenants totaling $63,834 but does not include straight-line rent averaging for the investment-grade tenants T-Mobile and Virginia Alcoholic Beverage. |
| (4) | Sales PSF/Year are as of the trailing 12-month period ending June 30, 2024 for Foot Locker and Downtown Locker Room and ending May 31, 2024, for Fashion Gallery (Rainbow), as provided by the tenants to the borrower. |
| (5) | UW Occ. Costs are based on underwritten base rent and reimbursements and most recently reported sales. |
| (6) | Burlington Coat Factory is expected to commence rent payments upon the date the tenant opens for business, which is estimated to be in October 2024. All applicable tenant improvements, leasing commissions and gap rent through and including November 2024 were escrowed upfront in connection with the origination of the White Oak Village Mortgage Loan. |
| (7) | JCPenney occupies its space on a ground lease. |
| THE INFORMATION IN THIS STRUCTURAL AND COLLATERAL TERM SHEET IS NOT COMPLETE AND MAY BE AMENDED PRIOR TO THE TIME OF SALE. THIS TERM SHEET IS NOT AN OFFER TO SELL THESE SECURITIES AND IT IS NOT A SOLICITATION OF AN OFFER TO BUY THESE SECURITIES IN ANY JURISDICTION WHERE THE OFFER OR SALE IS NOT PERMITTED. |
| | 77 | |
| Structural and Collateral Term Sheet | | BMO 2024-C10 |
| No. 4 – White Oak Village |
The following table presents certain information relating to the tenant lease expirations at the White Oak Village Property:
| Lease Rollover Schedule(1)(2) |
| Year | Number of Leases Expiring | Net Rentable Area Expiring | % of NRA Expiring | UW Base Rent Expiring(3) | % of UW Base Rent Expiring(3) | Cumulative Net Rentable Area Expiring | Cumulative % of NRA Expiring | Cumulative UW Base Rent Expiring(3) | Cumulative % of UW Base Rent Expiring(3) |
| Vacant | NAP | 26,882 | 6.8% | NAP | NAP | 26,882 | 6.8% | NAP | NAP |
| 2024 & MTM | 1 | 3,948 | 1.0% | $6,000 | 0.1% | 30,830 | 7.8% | $6,000 | 0.1% |
| 2025 | 3 | 9,595 | 2.4% | 180,900 | 3.2% | 40,425 | 10.2% | $186,900 | 3.3% |
| 2026 | 4 | 16,948 | 4.3% | 298,978 | 5.3% | 57,373 | 14.4% | $485,878 | 8.6% |
| 2027 | 4 | 14,212 | 3.6% | 319,876 | 5.6% | 71,585 | 18.0% | $805,754 | 14.2% |
| 2028 | 6 | 30,980 | 7.8% | 629,115 | 11.1% | 102,565 | 25.8% | $1,434,869 | 25.3% |
| 2029 | 7 | 157,023 | 39.5% | 1,230,753 | 21.7% | 259,588 | 65.3% | $2,665,622 | 47.1% |
| 2030 | 2 | 15,184 | 3.8% | 343,479 | 6.1% | 274,772 | 69.1% | $3,009,102 | 53.1% |
| 2031 | 4 | 16,731 | 4.2% | 328,819 | 5.8% | 291,503 | 73.3% | $3,337,921 | 58.9% |
| 2032 | 0 | 0 | 0.0% | 0 | 0.0% | 291,503 | 73.3% | $3,337,921 | 58.9% |
| 2033 | 1 | 7,011 | 1.8% | 192,803 | 3.4% | 298,514 | 75.1% | $3,530,723 | 62.3% |
| 2034 | 2 | 7,554 | 1.9% | 228,034 | 4.0% | 306,068 | 77.0% | $3,758,757 | 66.4% |
| 2035 & Beyond | 4 | 91,537 | 23.0% | 1,905,635 | 33.6% | 397,605 | 100.0% | $5,664,393 | 100.0% |
| Total | 38 | 397,605 | 100.0% | $5,664,393 | 100.0% | | | | |
| (1) | Based on the underwritten rent roll dated September 9, 2024. |
| (2) | Certain tenants may have lease termination options that are exercisable prior to the originally stated expiration date of the subject lease and that are not considered in the lease rollover schedule. |
| (3) | UW Base Rent Expiring, % of UW Base Rent Expiring, Cumulative UW Base Rent Expiring and Cumulative % of UW Base Rent Expiring include contractual rent steps through August 2025 for 16 tenants totaling $63,834 but does not include the $8,669 of straight-line rent averaging credit for the investment-grade tenants T-Mobile and Virginia Alcoholic Beverage. |
| THE INFORMATION IN THIS STRUCTURAL AND COLLATERAL TERM SHEET IS NOT COMPLETE AND MAY BE AMENDED PRIOR TO THE TIME OF SALE. THIS TERM SHEET IS NOT AN OFFER TO SELL THESE SECURITIES AND IT IS NOT A SOLICITATION OF AN OFFER TO BUY THESE SECURITIES IN ANY JURISDICTION WHERE THE OFFER OR SALE IS NOT PERMITTED. |
| | 78 | |
| Structural and Collateral Term Sheet | | BMO 2024-C10 |
| No. 4 – White Oak Village |
The following table presents certain information relating to the operating history and underwritten cash flows of the White Oak Village Property:
| Operating History and Underwritten Net Cash Flow |
| | 2021 | 2022 | 2023 | 6/30/2024 TTM | Underwritten | Per Square Foot | %(1) |
| Base Rent(2) | $4,948,249 | $5,348,805 | $5,380,886 | $5,405,265 | $5,673,062 | $14.27 | 69.5 | % |
| Grossed Up Vacant Space | 0 | 0 | 0 | 0 | 672,050 | 1.69 | 8.2 | |
| Gross Potential Rent | $4,948,249 | $5,348,805 | $5,380,886 | $5,405,265 | $6,345,112 | $15.96 | 77.8 | % |
| Other Income(3) | 120,860 | 89,436 | 112,611 | 135,158 | 63,600 | 0.16 | 0.8 | |
| Percentage Rent(4) | 197,685 | 152,714 | 119,293 | 80,100 | 46,340 | 0.12 | 0.6 | |
| Total Reimbursements | 1,625,384 | 1,878,833 | 1,841,983 | 1,824,773 | 1,703,339 | 4.28 | 20.9 | |
| Net Rental Income | $6,892,178 | $7,469,787 | $7,454,773 | $7,445,296 | $8,158,390 | $20.52 | 100.0 | % |
| (Vacancy & Credit Loss)(5) | 252,940 | (64,504) | (18,058) | (8,667) | (809,479) | (2.04) | (9.9 | ) |
| Effective Gross Income | $7,145,118 | $7,405,283 | $7,436,715 | $7,436,629 | $7,348,911 | $18.48 | 90.1 | % |
| Total Expenses(6) | $1,861,086 | $1,882,855 | $1,922,213 | $1,941,362 | $1,769,494 | $4.45 | 24.1 | % |
| Net Operating Income | $5,284,033 | $5,522,428 | $5,514,501 | $5,495,267 | $5,579,417 | $14.03 | 75.9 | % |
| Capital Expenditures | 0 | 0 | 0 | 0 | 59,641 | 0.15 | 0.8 | |
| TI / LC | 0 | 0 | 0 | 0 | 153,850 | 0.39 | 2.1 | |
| Net Cash Flow | $5,284,033 | $5,522,428 | $5,514,501 | $5,495,267 | $5,365,926 | $13.50 | 73.0 | % |
| (1) | % column represents percent of Net Rental Income for all revenue lines and represents percent of Effective Gross Income for the remainder of fields. |
| (2) | Underwritten Base Rent includes contractual rent steps through August 2025 for 16 tenants totaling $63,834 and $8,669 of straight-line rent averaging for the investment-grade tenants T-Mobile and Virginia Alcoholic Beverage. |
| (3) | Other Income reflects the in-place contractual agreements for Tesla parking lot income, Verizon Wireless Telecommunication income, Spirit Halloween (pursuant to a temporary license agreement), Better World parking lot income and tenant signage. |
| (4) | Percentage Rent includes current sales / breakpoint income for Lee Spa Nails, Kay Jewelers and Rack Room Shoes. |
| (5) | Historically, the Vacancy & Credit Loss consists of bad debt, including bad debt associated with the COVID-19 pandemic. The underwritten economic occupancy is 90.0%, based on gross potential income, exclusive of Other Income. The White Oak Village Property was 93.2% physically occupied based on the September 9, 2024 rent roll. |
| (6) | The management fee is underwritten to reflect 4.0% of Effective Gross Income and is subordinate to the White Oak Village Mortgage Loan. The White Oak Village Property is managed by a borrower sponsor affiliate. |
The Market. The White Oak Village Property is located at the intersection of I-64 and South Laburnum Avenue, approximately 5.4 miles east of the Richmond, Virginia central business district (“CBD”). Per a third party market research report, traffic counts total approximately 33,768 vehicles per day at the White Oak Village Property. Primary access to the area is provided by Interstates 64, 295 and 95, South Laburnum Avenue, Williamsburg Road, Charles City Road and Airport Drive, with approximate driving times to the Richmond CBD and the Richmond International Airport of 11 and 7 minutes, respectively. The greater Richmond area is home to eight Fortune 500 companies spanning the health care, food, automotive, utilities and insurance sectors.
According to the appraisal, the immediate area surrounding the White Oak Village Property includes a mix of commercial, retail, industrial and some interspersed residential developments. Demand generators include a number of industrial bulk warehouse and flex facilities in the area, as well as the Richmond International Airport. The airport has seven major air carriers with nonstop flights to 22 destinations, allowing for over 3.5 million passengers to travel annually. Per the appraisal, among the several large industrial tenants in the immediate neighborhood are Weyerhaeuser, Stanley, Nabisco, Whitehall Robins, Eastport, AT&T and Tetra Pak. Additionally, Virginia Commonwealth University, with a student enrollment of over 28,500, has its campus situated approximately 6.7 miles northwest of the White Oak Village Property.
According to the appraisal, within a one-, three- and five-mile radius of the White Oak Village Property, the 2024 average household income was approximately $70,454, $70,697 and $81,173, respectively; and within the same radii, the 2024 estimated population was 5,874, 54,458 and 125,789, respectively. According to a third-party market research report, the White Oak Village Property is situated within the East End retail submarket of the Richmond – VA retail market. As of September 12, 2024, the submarket reported total retail inventory of approximately 4.4 million square feet with a 1.9% vacancy rate and average asking rents of $18.33 per square foot. The submarket vacancy rate has decreased from 5.3% in 2018 and has averaged 3.1% from 2014-2023.
| THE INFORMATION IN THIS STRUCTURAL AND COLLATERAL TERM SHEET IS NOT COMPLETE AND MAY BE AMENDED PRIOR TO THE TIME OF SALE. THIS TERM SHEET IS NOT AN OFFER TO SELL THESE SECURITIES AND IT IS NOT A SOLICITATION OF AN OFFER TO BUY THESE SECURITIES IN ANY JURISDICTION WHERE THE OFFER OR SALE IS NOT PERMITTED. |
| | 79 | |
| Structural and Collateral Term Sheet | | BMO 2024-C10 |
| No. 4 – White Oak Village |
The following table presents certain information relating to the comparable grocery store leases for the White Oak Village Property:
Comparable Grocery Rental Summary(1)
|
| Property Name/Location | Tenant | Suite Size (SF) | Rent PSF (NNN) | Escalations | Lease Start Date | Lease Term (Years) |
White Oak Village Richmond, VA (Subject) | Publix(2) | 60,951(2) | $20.63(2) | 10% Every 5 Years | Jun-2016(2) | 30.0(2) |
Whole Foods Towson Towson, MD | Whole Foods | 45,000 | $25.00 | 10% Every 5 Years | Feb-22 | 20.0 |
Reistertown Shopping Center Reistertown, MD | Lidl | 30,000 | $11.00 | 10% in Years 6 and 11 | Nov-21 | 20.0 |
Wegman's at Haley Rise Reston, VA | Wegmans Food Markets | 80,000 | $18.75 | 10% in Year 11 | Nov-21 | 20.0 |
2323 Wisconsin Avenue NW Washington, D.C. | Whole Foods | 35,240 | $40.00 | 12% Every Five Years | Feb-21 | 25.0 |
The Town Center at Embry Mills Stafford, VA | Publix Supermarkets | 48,387 | $19.50 | Flat | Feb-21 | 20.0 |
Mazza Gallerie Washington, D.C. | Lidl | 28,791 | $31.00 | 10% Every 5 Years | Jan-21 | 15.0 |
8915-8981 Ox Road Lorton, VA | Giant | 55,000 | $21.75 | 10% Every 5 Years | Nov-20 | 10.0 |
Giant Food Springfield, VA | Giant | 75,000 | $23.25 | 15% in Year 11 | Nov-20 | 20.0 |
Henrdon Centre I Herndon, VA | Sprouts | 31,663 | $20.00 | 10% Every 5 Years | Jul-20 | 10.0 |
967 Florida Avenue NW Washington, D.C. | Whole Foods | 46,000 | $30.00 | 10% Every 5 Years | Jul-20 | 20.0 |
Pasadena Crossroads Pasadena, MD | Sprouts | 29,630 | $17.80 | 3.00% Annually | Apr-20 | 10.0 |
Giant Food Alexandria, VA | Giant | 53,837 | $19.00 | 10% Every 5 Years | Jan-20 | 20.0 |
| (2) | Based on the underwritten rent roll dated September 9, 2024. |
| THE INFORMATION IN THIS STRUCTURAL AND COLLATERAL TERM SHEET IS NOT COMPLETE AND MAY BE AMENDED PRIOR TO THE TIME OF SALE. THIS TERM SHEET IS NOT AN OFFER TO SELL THESE SECURITIES AND IT IS NOT A SOLICITATION OF AN OFFER TO BUY THESE SECURITIES IN ANY JURISDICTION WHERE THE OFFER OR SALE IS NOT PERMITTED. |
| | 80 | |
| Structural and Collateral Term Sheet | | BMO 2024-C10 |
| No. 4 – White Oak Village |
The following table presents certain information relating to the comparable Junior Anchor retail leases for the White Oak Village Property:
| Comparable Jr. Anchor Retail Rental Summary(1) |
| Property Name/Location | Tenant | Suite Size (SF) | Rent PSF (NNN) | Escalations | Lease Date | Lease Term (Years) |
White Oak Village Richmond, VA (Subject) | Michael’s Stores, K&G Men’s Company, Burlington Coat Factory, PetSmart(2) | 18,016 – 22,854(2)(3) | $12.75 -$17.50(2)(3) | Various(2) | Various(2) | Various(2) |
Germantown Shopping Center Germantown, MD | Petco | 14,868 | $20.00 | Flat | 2024 | 5.0 |
Broad Street Plaza Glen Allen, VA | Kids Empire | 16,155 | $14.50 | 10% in Yr 6 | 2023 | 10.0 |
Valley View Crossing Roanoke, VA | Bioplasma Services | 10,223 | $23.22 | 12.5% in Yr 6 | 2023 | 10.0 |
Freedom Village Shopping Center Sykesville, MD | Goodwill | 22,387 | $15.04 | 10% in Yr 6 | 2023 | 12.0 |
Germantown Shopping Center Germantown, MD | Big Blue Swim School | 11,900 | $20.00 | 12% in Yr 6 | 2023 | 10.0 |
Staples Mill Square Richmond, VA | Marshall’s | 22,087 | $11.25 | $0.50 PSF in Yr 6 | 2022 | 10.0 |
Shops at 69th Street Upper Darby, PA | Five Below | 11,280 | $23.00 | 10% in Yr 6 | 2022 | 10.0 |
Clemmons Market Clemmons, NC | Ulta Beauty | 11,000 | $19.00 | Flat | 2022 | 10.0 |
Laurel Lakes Laurel, MD | Dds | 21,668 | $16.00 | 5% in Yr 6 | 2022 | 10.0 |
Casto Park West Village Morrisville, NC | Trader Joe’s | 13,363 | $19.00 | 2% annually | 2022 | 10.0 |
The Commons Salisbury, MD | Ulta Beauty | 10,885 | $16.00 | Flat | 2021 | 5.0 |
| (2) | Based on the underwritten rent roll dated September 9, 2024. |
| (3) | Excludes JCPenney as the tenant occupies its space pursuant to a ground lease. |
The following table presents certain information relating to the competitive retail properties to the White Oak Village Property, ranging in size from 59,592 square feet to 205,657 square feet, which have reported occupancy rates ranging from 89% to 100% and quoted rents ranging from $18.00 to $40.00 per square foot.
| In-line Tenants Comparable Retail Rentals(1) |
| Property Name/Location | Year Built/Renovated | Size (SF) | Occupancy | Tenant Names | Quoted Rate PSF (NNN) | Distance to Subject (mi.) |
White Oak Village 4501-4591 South Laburnum Avenue Richmond, VA (Subject) | 2008/NAP | 397,605(2) | 93.2%(2) | Ashley Stewart, City Mobile, T-Mobile, Kay Jewelers, Jasmine Nails & Spa(2) | $22.00 - $45.32(2) | -- |
Libbie Place Shopping Center 5401-5719 W. Broad St. Richmond, VA | 1996/1997 | 205,657 | 100.0% | Einstein Brothers Bagels, Mid Wireless, James River Eye Assoc., Richmond Dental | $31.11 - $38.77 | 9.4 |
Stony Point Village 3000-3096 Stony Point Road Richmond, VA | 1984/NAP | 106,542 | 100.0% | Confidential, Confidential, Baggio, Good Foods Grocery | $24.13 - $27.00 | 12.0 |
Ivymont Square 14111 Midlothian Turnpike Midlothian, VA | 1990/2006 | 155,835 | 97.0% | Available, Confidential, Tops China | $28.00 - $33.00 | 17.0 |
Short Pump Station 11301-11351 W. Broad St. Richmond, VA | 2007/2008 | 91,369 | 97.0% | Available | $40.00 | 16.0 |
Ridge Shopping Center 1501, 1505, 1507 and 1529 North Parham Road Richmond, VA | 1968/2007 | 94,646 | 89.0% | Club Pilates, Bar Method (LOI), Pet Valu | $18.00 - $26.00 | 13.0 |
Staples Mill Square 9041 Staples Mill Road Richmond, VA | 2007/NAP | 59,592 | 95.0% | The Grounded Roots LLC | $27.00 | 12.0 |
Carytown Exchange 3540 West Cary Street Richmond, VA | 2020/NAP | 116,333 | 96.0% | Midtown Yoga | $37.25 | 7.7 |
Staples Mill Marketplace 9000-9120 Staples Mill Rd Henrico, VA | 2014/NAV | 148,661 | 100.0% | Potros Mexican Restaurant, Great Clips | $27.82 - $35.02 | 12.0 |
| (1) | Source: Appraisal, unless otherwise indicated. |
| (2) | Based on the underwritten rent roll dated September 9, 2024. |
| THE INFORMATION IN THIS STRUCTURAL AND COLLATERAL TERM SHEET IS NOT COMPLETE AND MAY BE AMENDED PRIOR TO THE TIME OF SALE. THIS TERM SHEET IS NOT AN OFFER TO SELL THESE SECURITIES AND IT IS NOT A SOLICITATION OF AN OFFER TO BUY THESE SECURITIES IN ANY JURISDICTION WHERE THE OFFER OR SALE IS NOT PERMITTED. |
| | 81 | |
| Structural and Collateral Term Sheet | | BMO 2024-C10 |
| No. 4 – White Oak Village |
The table below presents certain information relating to comparable sales pertaining to the White Oak Village Property identified by the appraiser:
| Comparable Sales(1) |
| Property Name | Location | Rentable Area (SF) | Sale Date | Sale Price (PSF) | OAR |
| Giant Center | Gainesville, VA | 103,950 | Jun-2024 | $280 | 7.2% |
| Stonebridge at Potomac Town Center | Woodbridge, VA | 504,000 | Aug-2023 | $342 | 7.3% |
| Largo Town Center | Upper Marlboro, MD | 277,348 | Aug-2023 | $252 | 7.0% |
| Stonehenge Village | Midlothian, VA | 214,207 | May-2023 | $247 | 6.7% |
| Woodmore Town Center | Lanham, MD | 712,000 | Dec-2021 | $270 | 6.0% |
The following table presents certain information relating to the appraisal’s market rent conclusion for the White Oak Village Property:
| Market Rent Summary(1) |
| | Grocer | Anchor | Jr. Anchor | | In-line |
| Market Rent (PSF) | $21.00 | $8.25 | $16.50 | | $30.00 |
| Lease Term (Years) | 10 | 10 | 10 | | 5 |
| Lease Type (Reimbursements) | NNN | NNN | NNN | | NNN |
| Tenant Improvements (New) | $40.00 per SF | $40.00 per SF | $40.00 per SF | | $20.00 per SF |
| Tenant Improvements (Renewal) | $10.00 per SF | $10.00 per SF | $10.00 per SF | | $10.00 per SF |
| Free Rent | 0 months | 0 months | 0 months | | 0 months |
The Borrower. The borrower for the White Oak Village Mortgage Loan is Triple Bar White Oak, LLC, a Delaware limited liability company and a bankruptcy remote single purpose entity with one independent director. Legal counsel to the borrower delivered a non-consolidation opinion in connection with the origination of the White Oak Village Mortgage Loan.
The Borrower Sponsors. The non-recourse carveout guarantors and borrower sponsors are Robert V. Gothier, Jr. and Mark X. DiSanto. Mr. Gothier is the founder of J.C. Bar Properties, Inc. (“J.C. Bar”), a full-service commercial real estate company which acquires, manages, and leases grocery-anchored shopping and power centers in the Mid-Atlantic United States. Founded in 2006, J.C. Bar has completed over $1 billion in mixed-use and retail projects and currently manages over 3 million square feet across more than 40 shopping centers.
Mr. DiSanto is the Chief Executive Officer of Triple Crown Corporation, which provides real estate acquisition, construction and property management services. Since 1977, Triple Crown Corporation has constructed and developed approximately 3,000 single family homes, 1,500 apartments and over 6.4 million square feet of commercial space.
Robert V. Gothier, Jr. was involved as a non-controlling partner in a prior loan foreclosure in 2020, unrelated to the White Oak Village Property. See “Description of the Mortgage Pool—Default History, Bankruptcy Issues and Other Proceedings” in the Preliminary Prospectus.
Property Management. The White Oak Village Property is managed by J.C. Bar, an affiliate of one of the borrower sponsors, Robert V. Gothier, Jr. (see “The Borrower Sponsors” above).
Escrows and Reserves. As of the date of origination of the White Oak Village Mortgage Loan, the borrower was required to deposit (i) $325,047 in a real estate tax reserve account, (ii) $250,000 in a replacement reserve account, (iii) $1,250,000 in a general leasing reserve, (iv) $31,373 in a rent concession reserve for the tenant Burlington Coat Factory and (v) $1,660,826 in an existing TI/LC reserve for tenants City Mobile, Burlington Coat Factory, Five Below and Verizon. Certain reserves may have been drawn upon between the time of origination and the Cut-off Date.
Tax Reserve – The borrower is required to deposit into a real estate tax reserve, on a monthly basis an amount equal to 1/12th of the real estate taxes that the lender estimates will be payable during the next 12 months (initially approximately $46,435).
Insurance Reserve – The White Oak Village Mortgage Loan documents do not require ongoing monthly insurance reserve deposits as long as (i) no event of default is continuing; (ii) the White Oak Village Property is covered under a blanket or
| THE INFORMATION IN THIS STRUCTURAL AND COLLATERAL TERM SHEET IS NOT COMPLETE AND MAY BE AMENDED PRIOR TO THE TIME OF SALE. THIS TERM SHEET IS NOT AN OFFER TO SELL THESE SECURITIES AND IT IS NOT A SOLICITATION OF AN OFFER TO BUY THESE SECURITIES IN ANY JURISDICTION WHERE THE OFFER OR SALE IS NOT PERMITTED. |
| | 82 | |
| Structural and Collateral Term Sheet | | BMO 2024-C10 |
| No. 4 – White Oak Village |
umbrella policy reasonably acceptable to the lender; (iii) the borrower provides the lender with evidence of renewal of such policies; and (iv) the borrower provides the lender with paid receipts for payment of the insurance premiums by no later than ten business days prior to the policy expiration dates.
Replacement Reserve – The White Oak Village Mortgage Loan documents require ongoing monthly replacement reserve deposits of $4,971, which the lender may require the borrower to increase (not more than once per year) upon 30 days’ notice to the borrower if the lender reasonably determines such increase is necessary to maintain the proper operation of the White Oak Village Property. Deposits into the replacement reserve (exclusive of any pending disbursements therefrom) will be capped at $250,000 as long as no event of default is continuing and the White Oak Village Property is being adequately maintained (as determined by the lender based on annual site inspections).
Leasing Reserve – The White Oak Village Mortgage Loan documents require ongoing monthly general tenant improvements and leasing commissions reserves of $21,537. Deposits into the leasing reserve (exclusive of any pending disbursements therefrom) will be capped at $1,250,000 as long as no Cash Trap Event Period (as defined below) is continuing. During the continuance of a Cash Trap Event Period, no cap will apply on the leasing reserve.
Lockbox / Cash Management. The White Oak Village Mortgage Loan is structured with a springing lockbox and springing cash management. Within 30 days from receipt of written notice from the lender that a Cash Trap Event Period has commenced, the borrower is required to, among other things, (i) execute a deposit account control agreement to establish a deposit account with a clearing bank and (ii) send executed letters directing all tenants to deposit all sums due under their respective leases directly into said deposit account. During the continuance of a Cash Trap Event Period, all funds in the deposit account are required to be swept periodically to a lender-controlled cash management account. If the borrower or property manager receive any rents or income directly, each is required to deposit such amounts into the deposit account within one business day of receipt. So long as a Cash Trap Event Period is in effect, all excess funds will be swept to an excess cash flow subaccount controlled by the lender and held for so long as such a Cash Trap Event Period is continuing, provided, however, that during a Cash Trap Event Period caused solely by a Major Tenant Event Period (as defined below), and provided that no other Cash Trap Event Period subsequently commences or is continuing, such sweep will be subject to a cap of $2,750,000 (such funds being swept into a Major Tenant leasing reserve account), with all excess over $2,750,000 being disbursed back to the borrower. For the avoidance of doubt, the Major Tenant Event Period cap is independent and in addition to any cap contemplated for the leasing reserve discussed in the “Escrows and Reserves” section above.
A “Cash Trap Event Period” will commence upon the earlier of the following:
| (i) | the occurrence of an event of default; |
| (ii) | the net cash flow debt service coverage ratio, assuming an amortization period of 30 years (“Amortizing NCF DSCR”) falling below 1.20x (tested quarterly) (a “Low DSCR Event”), provided, however, if within five business days of written notice from the lender, the borrower has delivered cash and cash equivalents or a letter of credit in an amount equal to six months of excess cash flow, as determined by the lender in its reasonable discretion (with such deposit being required every subsequent six month period in which a Low DSCR Event is continuing) (the “DSCR Cash Trap Avoidance Collateral”), no Low DSCR Event will be deemed to have occurred; or |
| (iii) | a Major Tenant Event Period, provided, however, if within five business days of written notice from the lender, the borrower delivers cash and cash equivalents or a letter of credit in an amount equal to $2,750,000, no Major Tenant Event Period will be deemed to have occurred. |
A Cash Trap Event Period will end upon the occurrence of the following:
| ● | with regard to clause (i), the cure of such event of default and the lender’s acceptance of such cure; |
| ● | with regard to clause (ii), the Amortizing NCF DSCR being equal to or greater than 1.25x for two consecutive calendar quarters; or |
| ● | with regard to clause (iii), a Major Tenant Event Period Cure (as defined below). |
| THE INFORMATION IN THIS STRUCTURAL AND COLLATERAL TERM SHEET IS NOT COMPLETE AND MAY BE AMENDED PRIOR TO THE TIME OF SALE. THIS TERM SHEET IS NOT AN OFFER TO SELL THESE SECURITIES AND IT IS NOT A SOLICITATION OF AN OFFER TO BUY THESE SECURITIES IN ANY JURISDICTION WHERE THE OFFER OR SALE IS NOT PERMITTED. |
| | 83 | |
| Structural and Collateral Term Sheet | | BMO 2024-C10 |
| No. 4 – White Oak Village |
A “Major Tenant Event Period” will commence upon the earliest to occur of the following with respect to Publix, as well as its successors and assigns, and any replacement tenant for all or a portion of such tenant’s space (individually or collectively, as applicable, “Major Tenant”):
| (i) | a Major Tenant, or its parent or guarantor filing, or otherwise becoming involved as debtor in a bankruptcy or similar insolvency proceeding; |
| (ii) | a Major Tenant “going dark”, vacating or otherwise failing to continually occupy its space (or any material portion thereof), or giving notice of its intent to commence any of the foregoing; |
| (iii) | a Major Tenant surrendering, terminating or canceling its lease (or any material portion thereof), or otherwise failing or ceasing to be in full force and effect, or a Major Tenant giving notice of, or commencing a legal proceeding asserting any of the foregoing; |
| (iv) | a default occurring (beyond any applicable notice and cure period) under a Major Tenant lease; or |
| (v) | a Major Tenant failing to renew or extend the term of its lease on or prior to the date that is the earlier of (x) six months prior to the date of scheduled expiration, (y) the deadline to renew such lease as set forth therein, to the extent that such lease expressly provides for such deadline and (z) the date the Major Tenant provides actual notice of its intent not to renew such lease. |
A “Major Tenant Event Period Cure” will occur upon:
| | ● | solely with regards to clause (i) above, (x) a Major Tenant Re-Tenanting Event (as defined below) having occurred or (y) two consecutive calendar quarters after the bankruptcy or insolvency proceeding having terminated in a manner satisfactory to the lender, such Major Tenant’s lease having been affirmed and the terms of such lease, as affirmed, being satisfactory to the lender; |
| | ● | solely with regards to clause (ii) above, (x) a Major Tenant Re-Tenanting Event having occurred or (y) the applicable Major Tenant having resumed its normal business operations in its entire space for a period of two consecutive calendar quarters; |
| | ● | solely with regards to clause (iii) above, (x) a Major Tenant Re-Tenanting Event having occurred or (y) such Major Tenant having (A) revoked any notification of any such termination, cancellation, or surrender of such lease and (B) delivered to the lender a tenant estoppel certificate reasonably acceptable to the lender; |
| | ● | solely with regards to clause (iv) above, (x) a Major Tenant Re-Tenanting Event having occurred or (y) the subject default having been cured and no other default under the related lease having occurred (beyond any applicable notice and cure period) for a period of two consecutive calendar quarters; or |
| | ● | solely with regards to clause (v) above, (x) a Major Tenant Re-Tenanting Event having occurred or (y) the lender having received evidence that the Major Tenant extended the term of its lease pursuant to the terms thereof (or on terms and conditions otherwise acceptable to the lender) for a period of no less than five years, such evidence to include, without limitation, a tenant estoppel certificate from the applicable Major Tenant acceptable to the lender, confirming that all obligations of the borrower to such Major Tenant with respect to tenant improvements and leasing commissions having been satisfied in full and that such Major Tenant is then paying full, unabated rent pursuant to the terms thereof. |
A “Major Tenant Re-Tenanting Event” will occur upon the lender receiving satisfactory evidence (including, without limitation, a satisfactory tenant estoppel) that (i) all of the applicable Major Tenant space at the White Oak Village Property has been leased to one or more satisfactory replacement tenants, each pursuant to a satisfactory replacement lease; (ii) each such tenant is in occupancy of its premises, is open for normal business and is paying full, unabated rent pursuant to the terms of its lease (or such abatement having been reserved); and (iii) all tenant improvement costs and leasing commissions provided in each such replacement lease having been paid (or sufficient funds having been deposited into the leasing reserve subaccount for payment of such amounts).
Subordinate and Mezzanine Debt. None.
Permitted Future Subordinate and Mezzanine Debt. Not permitted.
Partial Release. Provided that no event of default exists, the borrower has the right to obtain the release of the 1.0-acre excess land/pad site parcel, upon satisfaction of certain conditions set forth in the White Oak Village Mortgage Loan
| THE INFORMATION IN THIS STRUCTURAL AND COLLATERAL TERM SHEET IS NOT COMPLETE AND MAY BE AMENDED PRIOR TO THE TIME OF SALE. THIS TERM SHEET IS NOT AN OFFER TO SELL THESE SECURITIES AND IT IS NOT A SOLICITATION OF AN OFFER TO BUY THESE SECURITIES IN ANY JURISDICTION WHERE THE OFFER OR SALE IS NOT PERMITTED. |
| | 84 | |
| Structural and Collateral Term Sheet | | BMO 2024-C10 |
| No. 4 – White Oak Village |
documents. The 1.0-acre excess land/pad site parcel is unimproved and produces no income. The value of the excess land parcel was not included in the appraised value of the White Oak Village Property.
Ground Lease. None.
| THE INFORMATION IN THIS STRUCTURAL AND COLLATERAL TERM SHEET IS NOT COMPLETE AND MAY BE AMENDED PRIOR TO THE TIME OF SALE. THIS TERM SHEET IS NOT AN OFFER TO SELL THESE SECURITIES AND IT IS NOT A SOLICITATION OF AN OFFER TO BUY THESE SECURITIES IN ANY JURISDICTION WHERE THE OFFER OR SALE IS NOT PERMITTED. |
| | 85 | |
| Structural and Collateral Term Sheet | | BMO 2024-C10 |
| No. 5 – Douglas Dynamics |
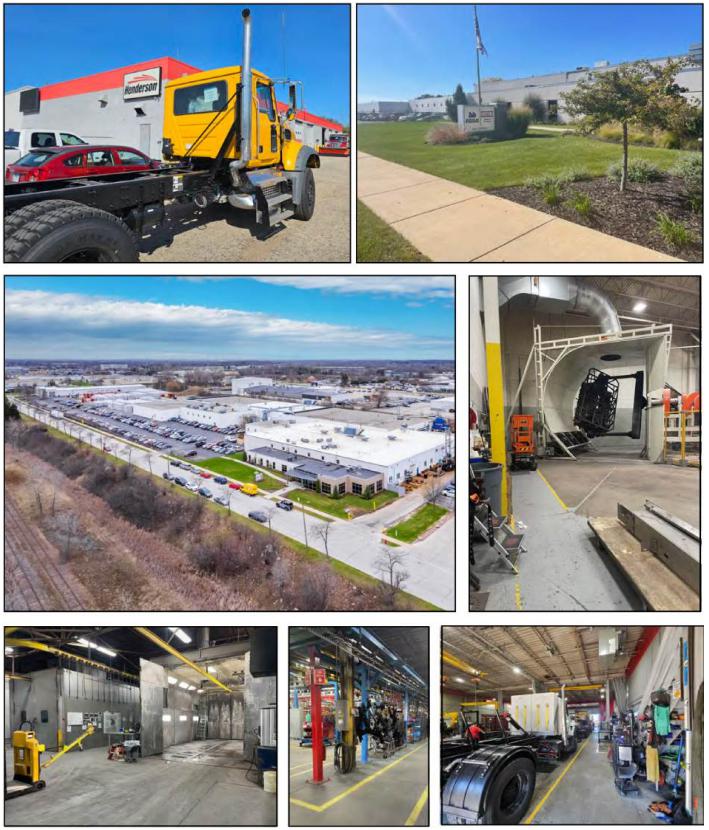
| THE INFORMATION IN THIS STRUCTURAL AND COLLATERAL TERM SHEET IS NOT COMPLETE AND MAY BE AMENDED PRIOR TO THE TIME OF SALE. THIS TERM SHEET IS NOT AN OFFER TO SELL THESE SECURITIES AND IT IS NOT A SOLICITATION OF AN OFFER TO BUY THESE SECURITIES IN ANY JURISDICTION WHERE THE OFFER OR SALE IS NOT PERMITTED. |
| | 86 | |
| Structural and Collateral Term Sheet | | BMO 2024-C10 |
| No. 5 – Douglas Dynamics |
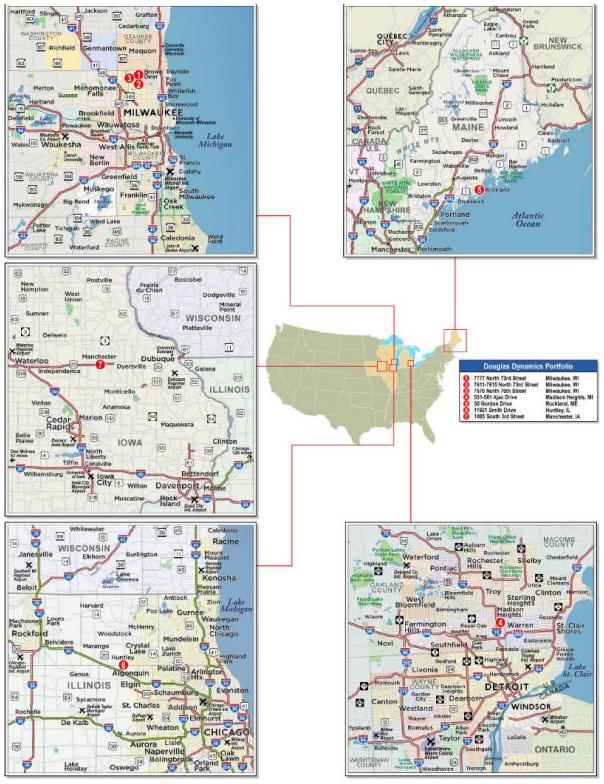
| THE INFORMATION IN THIS STRUCTURAL AND COLLATERAL TERM SHEET IS NOT COMPLETE AND MAY BE AMENDED PRIOR TO THE TIME OF SALE. THIS TERM SHEET IS NOT AN OFFER TO SELL THESE SECURITIES AND IT IS NOT A SOLICITATION OF AN OFFER TO BUY THESE SECURITIES IN ANY JURISDICTION WHERE THE OFFER OR SALE IS NOT PERMITTED. |
| | 87 | |
| Structural and Collateral Term Sheet | | BMO 2024-C10 |
| No. 5 – Douglas Dynamics |
| Mortgage Loan Information | | Property Information |
| Mortgage Loan Seller: | BMO | | Single Asset / Portfolio: | Portfolio |
| Original Principal Balance: | $42,097,500 | | Title: | Fee |
| Cut-off Date Principal Balance: | $42,097,500 | | Property Type – Subtype(2): | Industrial – Various |
| % of IPB: | 5.8% | | Net Rentable Area (SF): | 791,583 |
| Loan Purpose: | Acquisition | | Location(2): | Various, Various |
| Borrower: | AGNL Blizzard, L.L.C. | | Year Built / Renovated(2): | Various / Various |
| Borrower Sponsors(1): | Angelo, Gordon & Co., L.P. and TPG, Inc. | | Occupancy: | 100.0% |
| Interest Rate: | 6.36000% | | Occupancy Date: | 11/6/2024 |
| Note Date: | 10/9/2024 | | 4th Most Recent NOI (As of)(3): | NAV |
| Maturity Date: | 11/6/2034 | | 3rd Most Recent NOI (As of)(3): | NAV |
| Interest-only Period: | 120 months | | 2nd Most Recent NOI (As of)(3): | NAV |
| Original Term: | 120 months | | Most Recent NOI (As of)(3): | NAV |
| Original Amortization Term: | None | | UW Economic Occupancy: | 100.0% |
| Amortization Type: | Interest Only | | UW Revenues: | $4,892,500 |
| Call Protection: | L(24),DorYM1(89),O(7) | | UW Expenses: | $0 |
| Lockbox / Cash Management: | Hard / Springing | | UW NOI: | $4,892,500 |
| Additional Debt: | No | | UW NCF: | $4,892,500 |
| Additional Debt Balance: | N/A | | Appraised Value / Per SF(4): | $66,900,000 / $85 |
| Additional Debt Type: | N/A | | Appraisal Date(4): | 9/10/2024 |
| | | | | |
| Escrows and Reserves(5) | | Financial Information |
| | Initial | Monthly | Initial Cap | | Cut-off Date Loan / SF: | $53 |
| Taxes: | $0 | Springing | N/A | | Maturity Date Loan / SF: | $53 |
| Insurance: | $0 | Springing | N/A | | Cut-off Date LTV(4): | 62.9% |
| Replacement Reserves: | $0 | Springing | $13,193 | | Maturity Date LTV(4): | 62.9% |
| TI / LC: | $0 | Springing | $65,965 | | UW NCF DSCR: | 1.80x |
| | | | | | UW NOI Debt Yield: | 11.6% |
| | | | | | | |
| Sources and Uses |
| Sources | Proceeds | % of Total | | Uses | Proceeds | % of Total | |
| Mortgage Loan | $42,097,500 | 64.9 | % | | Purchase Price | $64,150,000 | 98.9 | % |
| Borrower Sponsor Equity | 22,766,836 | 35.1 | | | Closing Costs | 714,336 | 1.1 | |
| | | | | | | |
| Total Sources | $64,864,336 | 100.0 | % | | Total Uses | $64,864,336 | 100.0 | % |
| (1) | The borrower sponsors are affiliated with the borrower sponsors of the Sterling Portfolio Mortgage Loan, the Tropicale Foods Mortgage Loan and the Quantix Mortgage Loan, which are also being contributed to the BMO 2024-C10 transaction. |
| (2) | See the “Portfolio Summary” chart below. |
| (3) | Historical financial information is unavailable given the borrower sponsor purchased the Douglas Dynamics Portfolio Properties (as defined below) in a sale leaseback transaction in September 2024. |
| (4) | The Appraised Value / Per SF represents the “As Portfolio” appraised value, which assumes a 4.30% portfolio premium is applied to the aggregate sum of the individual appraised values. The individual appraisal valuation dates are between August 26, 2024 and September 10, 2024. The aggregate of the “as-is” appraised values of the Douglas Dynamics Portfolio Properties is $64,140,000, which results in a Cut-off Date LTV and Maturity Date LTV of 65.6%. |
| (5) | For a full description of Escrows and Reserves, see “Escrows and Reserves” below. |
The Loan. The fifth largest mortgage loan (the “Douglas Dynamics Portfolio Mortgage Loan”) is evidenced by a single promissory note in the original principal amount of $42,097,500 and is secured by the borrower’s fee interest in a six-property industrial portfolio located in Wisconsin, Michigan, Illinois, Iowa and Maine (the “Douglas Dynamics Portfolio” or “Douglas Dynamics Portfolio Properties” and each, a “Douglas Dynamics Portfolio Property”). The Douglas Dynamics Portfolio Mortgage Loan was originated on October 9, 2024 by Bank of Montreal (“BMO”) and proceeds, along with approximately $22.8 million of equity contributed by the borrower sponsors, were used to acquire the Douglas Dynamics Portfolio in a sale leaseback transaction and pay closing costs. The Douglas Dynamics Portfolio Mortgage Loan accrues interest at a fixed rate of 6.36000% per annum on an Actual/360 basis, has a 10-year original term and is interest-only for the full term. The scheduled maturity date of the Douglas Dynamics Portfolio Mortgage Loan is November 6, 2034.
| THE INFORMATION IN THIS STRUCTURAL AND COLLATERAL TERM SHEET IS NOT COMPLETE AND MAY BE AMENDED PRIOR TO THE TIME OF SALE. THIS TERM SHEET IS NOT AN OFFER TO SELL THESE SECURITIES AND IT IS NOT A SOLICITATION OF AN OFFER TO BUY THESE SECURITIES IN ANY JURISDICTION WHERE THE OFFER OR SALE IS NOT PERMITTED. |
| | 88 | |
| Structural and Collateral Term Sheet | | BMO 2024-C10 |
| No. 5 – Douglas Dynamics |
The Properties. The Douglas Dynamics Portfolio Properties are a portfolio comprising 791,583 square feet across six industrial properties located in Wisconsin, Michigan, Illinois, Iowa and Maine. The Douglas Dynamics Portfolio Properties are 100% occupied by Douglas Dynamics (as defined below), a North American manufacturer of snow and ice control equipment for both the commercial and municipal end markets, with an installed base of over 500,000 snowplows and sand and salt spreaders in service.
The following table presents certain information relating to the Douglas Dynamics Portfolio Properties, which is presented in descending order of their allocated loan amounts:
| Portfolio Summary(1) |
| Property Name | City, State(2) | Property Type – Subtype(2) | Year Built / Renovated (2) | SF | Occupancy | Allocated Mortgage Loan Cut-off Date Balance | % of Allocated Mortgage Loan Cut-off Date Balance | Appraised Value(2)(3) | % of UW Base Rent(4) |
| Milwaukee 7777 | Milwaukee, WI | Industrial – Manufacturing/Distribution | 1965-1970 / NAP | 215,242 | 100.0% | $11,945,345 | 28.4% | $18,200,000 | 27.7% |
| Rockland | Rockland, ME | Industrial – Manufacturing | 1999 / 2007 | 203,640 | 100.0% | 10,041,967 | 23.9 | 15,300,000 | 25.7% |
| Madison Heights | Madison Heights, MI | Industrial – Manufacturing | 1988 / 2000 | 116,045 | 100.0% | 7,482,250 | 17.8 | 11,400,000 | 16.9% |
| Manchester | Manchester, IA | Industrial – Warehouse | 1958-2015 / NAP | 169,286 | 100.0% | 6,891,546 | 16.4 | 10,500,000 | 16.5% |
| Milwaukee 7676 | Milwaukee, WI | Industrial – Manufacturing | 1977 / NAP | 60,038 | 100.0% | 3,531,097 | 8.4 | 5,380,000 | 8.2% |
| Huntley | Huntley, IL | Industrial – Warehouse | 1980 / NAP | 27,332 | 100.0% | 2,205,295 | 5.2 | 3,360,000 | 4.9% |
| Total/Wtd. Avg. | | | | 791,583 | 100.0% | $42,097,500 | 100.0% | $66,900,000(3) | 100.0% |
| (1) | Based on the underwritten rent roll dated November 6, 2024, unless otherwise indicated. |
| (3) | The Appraised Value represents the “As Portfolio” appraised value, which assumes a 4.30% portfolio premium is applied to the aggregate sum of the individual appraised values. The individual appraisal valuation dates are between August 26, 2024 and September 10, 2024. The aggregate of the “as-is” appraised values of the Douglas Dynamics Portfolio Properties is $64,140,000, which results in a Cut-off Date LTV and Maturity Date LTV of 65.6%. |
| (4) | % of UW Base Rent is based on the underwritten rent roll dated November 6, 2024, inclusive of rent steps through October 2025. |
Sole Tenant.
Douglas Dynamics (791,583 square feet; 100.0% of NRA; 100.0% of underwritten base rent). The sole tenant for the Douglas Dynamics Portfolio is Douglas Dynamics, L.L.C. (“Douglas Dynamics”) (NYSE: PLOW), rated NR/BB-/NR by Moody’s, S&P and Fitch, a manufacturer and upfitter of commercial work truck attachments and equipment in North America. Douglas Dynamic’s brands have been a part of the work truck industry for more than 75 years. Headquartered in Milwaukee, Wisconsin, Douglas Dynamics employs 1,800 people across its six manufacturing locations and 15 installation and distribution centers across the United States.
| THE INFORMATION IN THIS STRUCTURAL AND COLLATERAL TERM SHEET IS NOT COMPLETE AND MAY BE AMENDED PRIOR TO THE TIME OF SALE. THIS TERM SHEET IS NOT AN OFFER TO SELL THESE SECURITIES AND IT IS NOT A SOLICITATION OF AN OFFER TO BUY THESE SECURITIES IN ANY JURISDICTION WHERE THE OFFER OR SALE IS NOT PERMITTED. |
| | 89 | |
| Structural and Collateral Term Sheet | | BMO 2024-C10 |
| No. 5 – Douglas Dynamics |
The following table presents certain information relating to the sole tenant of the Douglas Dynamics Portfolio Properties:
| Tenant Summary(1) |
| Tenant | Ratings
Moody’s/S&P/Fitch | Net Rentable Area (SF) | % of
Total NRA | UW Base Rent PSF(1) | UW Base Rent(1) | % of Total
UW Base Rent(1) | Lease
Exp. Date |
| Douglas Dynamics | NR / BB- / NR | 791,583 | 100.0% | $6.18 | $4,892,500 | 100.0% | 10/31/2039(2) |
| | | | | | | | |
| Occupied Collateral Total / Wtd. Avg. | 791,583 | 100.0% | $6.18 | $4,892,500 | 100.0% | |
| | | | | | | | |
| Vacant Space | | 0 | 0.0% | | | | |
| | | | | | | | |
| Collateral Total | | 791,583 | 100.0% | | | | |
| | | | | | | |
| (1) | Based on the underwritten rent roll dated November 6, 2024. UW Base Rent, UW Base Rent PSF and % of Total UW Base Rent is based on the underwritten rent roll dated November 6, 2024, inclusive of rent steps through October 2025. |
| (2) | The tenant has a current lease expiration in 2039 with two, 10-year renewal options remaining and no termination options. |
The following table presents certain information relating to the lease rollover schedule for the Douglas Dynamics Portfolio Properties:
| Lease Rollover Schedule(1) |
| Year | Number of Leases Expiring | Net Rentable Area Expiring | % of NRA Expiring | UW Base Rent Expiring | % of UW Base Rent Expiring | Cumulative Net Rentable Area Expiring | Cumulative % of NRA Expiring | Cumulative UW Base Rent Expiring | Cumulative % of UW Base Rent Expiring |
| Vacant | NAP | 0 | 0.0 | % | NAP | NA | P | 0 | 0.0% | NAP | NAP | |
| 2024 & MTM | 0 | 0 | 0.0 | | $0 | 0.0 | % | 0 | 0.0% | $0 | 0.0% | |
| 2025 | 0 | 0 | 0.0 | | 0 | 0.0 | | 0 | 0.0% | $0 | 0.0% | |
| 2026 | 0 | 0 | 0.0 | | 0 | 0.0 | | 0 | 0.0% | $0 | 0.0% | |
| 2027 | 0 | 0 | 0.0 | | 0 | 0.0 | | 0 | 0.0% | $0 | 0.0% | |
| 2028 | 0 | 0 | 0.0 | | 0 | 0.0 | | 0 | 0.0% | $0 | 0.0% | |
| 2029 | 0 | 0 | 0.0 | | 0 | 0.0 | | 0 | 0.0% | $0 | 0.0% | |
| 2030 | 0 | 0 | 0.0 | | 0 | 0.0 | | 0 | 0.0% | $0 | 0.0% | |
| 2031 | 0 | 0 | 0.0 | | 0 | 0.0 | | 0 | 0.0% | $0 | 0.0% | |
| 2032 | 0 | 0 | 0.0 | | 0 | 0.0 | | 0 | 0.0% | $0 | 0.0% | |
| 2033 | 0 | 0 | 0.0 | | 0 | 0.0 | | 0 | 0.0% | $0 | 0.0% | |
| 2034 | 0 | 0 | 0.0 | | 0 | 0.0 | | 0 | 0.0% | $0 | 0.0% | |
| 2035 & Beyond | 1 | 791,583 | 100.0 | | 4,892,500 | 100.0 | | 791,583 | 100.0% | $4,892,500 | 100.0% | |
| Total | 1 | 791,583 | 100.0 | % | $4,892,500 | 100.0 | % | | | | |
| (1) | Based on the underwritten rent roll dated November 6, 2024. UW Base Rent Expiring is based on the underwritten rent roll dated November 6, 2024, inclusive of rent steps through October 2025. |
| THE INFORMATION IN THIS STRUCTURAL AND COLLATERAL TERM SHEET IS NOT COMPLETE AND MAY BE AMENDED PRIOR TO THE TIME OF SALE. THIS TERM SHEET IS NOT AN OFFER TO SELL THESE SECURITIES AND IT IS NOT A SOLICITATION OF AN OFFER TO BUY THESE SECURITIES IN ANY JURISDICTION WHERE THE OFFER OR SALE IS NOT PERMITTED. |
| | 90 | |
| Structural and Collateral Term Sheet | | BMO 2024-C10 |
| No. 5 – Douglas Dynamics |
The Market. The following table presents certain market information relating to the Douglas Dynamics Portfolio Properties:
| Market Area Summary(1) |
| Property Name | Market | Submarket | Submarket Inventory (SF)(2) | Submarket Vacancy(2) | Submarket NNN Rent PSF(2) |
| Milwaukee 7777 | Milwaukee, WI | Milwaukee NW | 36,024,995 | 4.20% | $6.01 |
| Rockland | NAV | NAV | 67,400,000(3) | 5.20%(3) | $8.13(3) |
| Madison Heights | Detroit, MI | Troy Area East | 12,507,807 | 4.30% | $9.34 |
| Manchester | NAV | NAV | 320,000,000(4) | 3.38%(4) | $6.58(4) |
| Milwaukee 7676 | Milwaukee, WI | Milwaukee NW | 36,024,995 | 4.20% | $6.01 |
| Huntley | Chicago, IL | McHenry County | 35,379,762 | 2.20% | $9.24 |
| (1) | Source: Appraisals, unless otherwise indicated. |
| (2) | Submarket Inventory (SF), Submarket Vacancy, and Submarket NNN Rent PSF are TTM as of the second quarter of 2024. |
| (3) | Based on data for Maine industrial properties as of the third quarter of 2024 due to Market and Submarket data being unavailable for Rockland. |
| (4) | Based on data for Iowa industrial properties as of the third quarter of 2024 due to Market and Submarket data being unavailable for Manchester. |
Environmental. According to the Phase I environmental assessments dated on dates ranging from July 23, 2024 to September 3, 2024, there was no evidence of any recognized environmental conditions at any of the Douglas Dynamics Portfolio Properties.
The following table presents certain information relating to the historical and current occupancy of the Douglas Dynamics Portfolio:
| Historical and Current Occupancy(1) |
| 2021 | 2022 | 2023 | Current(2) |
| 100.0% | 100.0% | 100.0% | 100.0% |
| (1) | Historical Occupancies are as of December 31 of each respective year, unless otherwise specified. |
| (2) | Current Occupancy is as of November 6, 2024. |
Appraisals. According to the appraisals, the Douglas Dynamics Portfolio Properties had an aggregate “as-is” value of $64,140,000 as of various dates in August and September 2024 and an “As Portfolio” appraised value of $66,900,000, which assumed a portfolio premium of approximately 4.30% on the aggregate value of the individual property values. Based on the aggregate of the “as-is” appraised values of $64,140,000, the Cut-off Date LTV and Maturity Date LTV for the Douglas Dynamics Portfolio Mortgage Loan is 65.6%.
| Douglas Dynamics Appraised Value(1) |
| Property Name | Appraised Value | Capitalization Rate |
| Milwaukee 7777 | $18,200,000 | 7.25% |
| Rockland | $15,300,000 | 8.00% |
| Madison Heights | $11,400,000 | 7.00% |
| Manchester | $10,500,000 | 7.50% |
| Milwaukee 7676 | $$5,380,000 | 7.25% |
| Huntley | $$3,360,000 | 7.00% |
| Total / Wtd. Avg. | $$66,900,000(2) | 7.41%(3) |
| (2) | The Appraised Value represents the “As Portfolio” appraised value, which assumes a 4.30% portfolio premium is applied to the aggregate sum of the individual appraised values. The individual appraisal valuation dates are between August 26, 2024 and September 10, 2024. The aggregate of the “as-is” appraised values of the Douglas Dynamics Portfolio Properties is $64,140,000, which results in a Cut-off Date LTV and Maturity Date LTV of 65.6%. |
| (3) | Total / Wtd. Avg. is based on the appraised value of each Douglas Dynamics Portfolio Property. |
| THE INFORMATION IN THIS STRUCTURAL AND COLLATERAL TERM SHEET IS NOT COMPLETE AND MAY BE AMENDED PRIOR TO THE TIME OF SALE. THIS TERM SHEET IS NOT AN OFFER TO SELL THESE SECURITIES AND IT IS NOT A SOLICITATION OF AN OFFER TO BUY THESE SECURITIES IN ANY JURISDICTION WHERE THE OFFER OR SALE IS NOT PERMITTED. |
| | 91 | |
| Structural and Collateral Term Sheet | | BMO 2024-C10 |
| No. 5 – Douglas Dynamics |
The following table presents certain information relating to the underwritten cash flows of the Douglas Dynamics Portfolio Properties:
| Underwritten Net Cash Flow(1)(2) |
| | Underwritten | Per Square Foot | %(3) |
| Rents in Place(2) | $4,892,500 | | $6.18 | | 100.0 | % |
| Vacant Income | 0 | | 0.00 | | 0.0 | |
| Gross Potential Rent | $4,892,500 | | $6.18 | | 100.0 | % |
| Total Reimbursements | 0 | | 0.00 | | 0.0 | |
| Net Rental Income | $4,892,500 | | $6.18 | | 100.0 | % |
| (Vacancy/Credit Loss) | 0 | | 0.00 | | 0.0 | |
| Effective Gross Income | $4,892,500 | | $6.18 | | 100.0 | % |
| | | | |
| Total Expenses | $0 | | $0.00 | | 0.0 | % |
| | | | |
| Net Operating Income | $4,892,500 | | $6.18 | | 100.0 | % |
| | | | |
| Total TI/LC, Capex/RR | 0 | | 0.00 | | 0.0 | |
| | | | |
| Net Cash Flow | $4,892,500 | | $6.18 | | 100.0 | % |
| (1) | Historical financial information is not available because the borrower acquired the mortgaged property in a sale leaseback transaction in 2024. |
| (2) | Based on the underwritten rent roll dated November 6, 2024. Underwritten Rents in Place is based on the underwritten rent roll dated November 6, 2024, inclusive of rent steps through October 2025. |
| (3) | % column represents percent of Net Rental Income for all revenue lines and represents percent of Effective Gross Income for the remainder of fields. |
The Borrower. The borrower is AGNL Blizzard, L.L.C., a Delaware limited liability company and special purpose entity with one independent director. Legal counsel to the borrower delivered a non-consolidation opinion in connection with the origination of the Douglas Dynamics Portfolio Mortgage Loan.
The Borrower Sponsors. The borrower sponsors are Angelo, Gordon & Co., L.P. and TPG, Inc., and the non-recourse carve-out guarantors are AG Net Lease Realty Fund V REIT LLC and AG Net Lease Realty Fund V Investments (H-1), L.P. TPG Angelo Gordon is a diversified credit and real estate platform. The company currently manages approximately $78 billion across a broad range of credit and real estate strategies and has been investing on behalf of pension funds, corporations, endowments, and foundations for 35 years.
The non-recourse carve-out guaranty is several, with approximate splits of 80.3% for AG Net Lease Realty Fund V REIT LLC, and 19.7% for AG Net Lease Realty Fund V Investments (H-1), L.P.
Property Management. The Douglas Dynamics Portfolio is self-managed.
Escrows and Reserves.
Tax Escrows – On a monthly basis, the borrower is required to escrow 1/12th of the annual estimated tax payments. Notwithstanding the foregoing, so long as no event of default or Trigger Period (as defined below) is continuing, the borrower is not required to fund the reserve.
Insurance Escrows – On a monthly basis, the borrower is required to escrow 1/12th of the annual estimated insurance premium payments. Notwithstanding the foregoing, so long as no event of default or Trigger Period is continuing, the borrower is not required to fund the reserve.
Additionally, for both the Tax and Insurance Escrows, upon the occurrence of a Trigger Period or event of default, the borrower will not be required to fund the reserves as long as (i) the Douglas Dynamics lease is in full force and effect, (ii) Douglas Dynamics is current on its payment of taxes and assessments, and (iii) Douglas Dynamics is current in its payment of real estate taxes and provision of insurance consistent with its requirements under its lease.
| THE INFORMATION IN THIS STRUCTURAL AND COLLATERAL TERM SHEET IS NOT COMPLETE AND MAY BE AMENDED PRIOR TO THE TIME OF SALE. THIS TERM SHEET IS NOT AN OFFER TO SELL THESE SECURITIES AND IT IS NOT A SOLICITATION OF AN OFFER TO BUY THESE SECURITIES IN ANY JURISDICTION WHERE THE OFFER OR SALE IS NOT PERMITTED. |
| | 92 | |
| Structural and Collateral Term Sheet | | BMO 2024-C10 |
| No. 5 – Douglas Dynamics |
Replacement Reserves – On a monthly, basis upon the occurrence of a Trigger Period or event of default, the borrower is required to escrow approximately $6,597 for the payment or reimbursement of approved capital expenses, provided, however, monthly deposits into the Capital Expenditure Reserve will be suspended for so long as the amount contained therein is equal to or greater than the Capital Expenditure Threshold Amount (as defined below), provided, further, however, at any time after the Capital Expenditure Threshold Amount has been satisfied and monthly deposits into the Capital Expenditure Reserve have been suspended, monthly deposits will recommence if the amount on deposit in the Capital Expenditure Reserve Account is ever less than the Capital Expenditure Recommencement Deposit Amount (as defined below) and will continue until such time as the amount on deposit in the Capital Expenditure Reserve is once again equal to the Capital Expenditure Threshold Amount.
“Capital Expenditure Threshold Amount” means at any time the product of (x) $0.20 times (y) the aggregate number of rentable square feet then contained in the Douglas Dynamics Portfolio Properties. The initial Capital Expenditure Threshold Amount as of the origination date of the Douglas Dynamics Portfolio Mortgage Loan is equal to $13,193.05.
“Capital Expenditure Recommencement Deposit Amount” means at any time the product of (x) $0.10 times (y) the aggregate number of rentable square feet then contained in the Douglas Dynamics Portfolio Properties. The initial Capital Expenditure Recommencement Deposit Amount as of the origination date of the Douglas Dynamics Portfolio Mortgage Loan is equal to $6,596.53.
TI/LC Reserve – On a monthly basis, upon the occurrence and during the continuance of an event of default or a Trigger Period, the borrower is required to escrow approximately $32,983 for tenant improvements and leasing commissions, provided, however, monthly deposits into the TI/LC Reserve will be suspended for so long as the amount contained therein is equal to or greater than the TI/LC Reserve Threshold Amount (as defined below), provided, further, however, at any time after the TI/LC Reserve Threshold Amount has been satisfied and monthly deposits into the TI/LC Reserve have been suspended, monthly deposits will recommence if the amount on deposit in the TI/LC Reserve Account is ever less than the TI/LC Reserve Recommencement Deposit Amount (as defined below) and will continue until such time as the amount on deposit in the TI/LC Reserve is once again equal to the TI/LC Reserve Threshold Amount.
“TI/LC Reserve Threshold Amount” means at any time the product of (x) $1.00 times (y) the aggregate number of rentable square feet then contained in the Douglas Dynamics Portfolio Properties. The initial TI/LC Reserve Threshold Amount as of the origination date of the Douglas Dynamics Portfolio Mortgage Loan is equal to $65,965.25.
“TI/LC Reserve Recommencement Deposit Amount” means at any time the product of (x) $0.50 times (y) the aggregate number of rentable square feet then contained in the Douglas Dynamics Portfolio Properties. The initial TI/LC Reserve Recommencement Deposit Amount as of the origination date of the Douglas Dynamics Portfolio Mortgage Loan is equal to $32,982.63.
Rollover Reserve – On a monthly basis, upon the occurrence of a Trigger Period caused by a Tenant Trigger Event (as defined below), the borrower is required to escrow all excess cash flows for tenant improvements and leasing commissions; provided, however, solely during a continuing Trigger Period caused by a Dark Tenant Trigger Event (as defined below), deposits into the Rollover Reserve shall be suspended for so long as the amount contained therein is equal to or greater than the Dark Tenant Threshold Amount (as defined below).
Lockbox / Cash Management. The Douglas Dynamics Portfolio Mortgage Loan is structured with a hard lockbox and springing cash management. The Douglas Dynamics Portfolio Mortgage Loan requires that the borrower deliver tenant direction letters to the tenants directing such tenants to pay all rents into the lockbox account. Upon the occurrence and during the continuance of a Trigger Period, the borrower will not have access to the funds in the lockbox account and such funds will be transferred to the lender-controlled cash management account and disbursed according to the Douglas Dynamics Portfolio Mortgage Loan documents and all excess cash flow funds remaining in the cash management account after the application of such funds in accordance with the Douglas Dynamics Portfolio Mortgage Loan documents are required to be held by the lender in an excess cash flow reserve account as additional collateral for the Douglas Dynamics Portfolio Mortgage Loan. To the extent that no Trigger Period or event of default is continuing, the lender will specify the borrower’s operating account for all excess cash remittance by the lockbox bank.
A “Trigger Period” means any of the following: (a) any period from (i) the occurrence of a Tenant Trigger Event to (ii) (A) as it relates to a Bankruptcy Trigger Event (as defined below), either (x) such bankruptcy proceeding is dismissed and the
| THE INFORMATION IN THIS STRUCTURAL AND COLLATERAL TERM SHEET IS NOT COMPLETE AND MAY BE AMENDED PRIOR TO THE TIME OF SALE. THIS TERM SHEET IS NOT AN OFFER TO SELL THESE SECURITIES AND IT IS NOT A SOLICITATION OF AN OFFER TO BUY THESE SECURITIES IN ANY JURISDICTION WHERE THE OFFER OR SALE IS NOT PERMITTED. |
| | 93 | |
| Structural and Collateral Term Sheet | | BMO 2024-C10 |
| No. 5 – Douglas Dynamics |
applicable tenant is in occupancy, paying normal periodic rent and is otherwise in compliance with the terms of its lease and has provided an updated estoppel certificate in the form provided as of the origination date or another form reasonably acceptable to the lender, (y) (I) the applicable tenant has affirmed its lease during the bankruptcy proceeding or (II) the applicable lease is assumed by a successor in interest to the tenant pursuant to an order of a bankruptcy court in accordance with the Bankruptcy Code in connection with a restructuring or reorganization of such tenant, and in the case of (I) or (II), is in occupancy, paying normal periodic rent, is otherwise in compliance with the terms of such lease and has provided an updated estoppel certificate in the form provided as of the closing date or another form reasonably acceptable to the lender, or (z) the applicable lease will be cancelled, terminated or otherwise rejected in such bankruptcy proceeding and the property is subject to one or more Approved Substitute Leases (as defined below); or (B) as it relates to a Dark Tenant Trigger Event, either (w) the lender is provided with evidence reasonably satisfactory to the lender that the applicable tenant has recommenced its business and operations in the applicable portion of the property that gave rise to the Dark Tenant Trigger Event, is paying normal periodic rent and is otherwise in compliance with the terms of its lease and has provided the lender with an updated estoppel certificate reasonably acceptable to the lender, (x) the applicable portion of the property that gave rise to the Dark Tenant Trigger Event is subject to one or more Approved Substitute Leases, (y) the lease is assumed by a successor in interest to such tenant pursuant to an order of a bankruptcy court in accordance with the Bankruptcy Code in connection with a restructuring or reorganization of such tenant, or (z) such time as the balance on deposited in the Rollover Reserve account is not less than the Dark Tenant Threshold Amount; and (b) the period from the occurrence of an event of default under the Permitted Mezzanine Loan (as defined below) or the New Mezzanine Loan (as defined below) until the earlier to occur of such event of default is waived by the holder of such Permitted Mezzanine Loan or New Mezzanine Loan (as applicable) or the Indebtedness is paid in full.
A “Tenant Trigger Event” means the occurrence of either of the following: (i) (x) the date of the filing of a bankruptcy petition by the Critical Tenant (as defined below) or any guarantor of the Critical Tenant Lease (as defined below) under the Bankruptcy Code, or (y) in the context of an involuntary filing of a bankruptcy petition against the Critical Tenant or any guarantor of the Critical Tenant Lease under the Bankruptcy Code, the date that is 60 days after the filing of such petition provided the same has not been discharged or dismissed within such 60 day period (the Tenant Trigger Events described in this clause (i) being sometimes referred to, collectively, as a “Bankruptcy Trigger Event”); or (ii) the occurrence of a Dark Tenant Trigger Event. For the purposes of this definition, all references to the Critical Tenant shall be deemed to refer to any tenant under an Approved Substitute Lease, and all references to the Critical Tenant Lease shall be deemed to refer to any Approved Substitute Lease.
“Approved Substitute Lease” means a bona-fide lease with a third-party tenant conforming in all material respects with the requirements of the Douglas Dynamics Portfolio Mortgage Loan documents.
A “Dark Tenant Trigger Event” means the earliest of any of the following: the date Critical Tenant terminates, “goes dark”, discontinues its operations or business, vacates or ceases to occupy one or more individual Douglas Dynamics Portfolio Properties (excluding any portion of the Douglas Dynamics Portfolio Properties subleased in accordance with the terms of the Critical Tenant Lease which sublease or subleases demise less than 20% of the net leasable area of the Douglas Dynamics Portfolio Properties as a whole) in violation of the Critical Tenant Lease (including purporting to terminate the Critical Tenant Lease) beyond any applicable notice and cure period which results in an event of default thereunder.
“Dark Tenant Threshold Amount” means an amount equal to 12 times the monthly payment amount.
“Critical Tenant” means (i) Douglas Dynamics and (ii) any tenant pursuant to an Approved Substitute Lease.
“Critical Tenant Lease” means (i) the Douglas Dynamics lease and (ii) any Approved Substitute Lease that has replaced the Douglas Dynamics lease (or has replaced an Approved Substitute Lease) in accordance with the terms set forth in the Douglas Dynamics Portfolio Mortgage Loan documents.
Subordinate and Mezzanine Debt. None.
Permitted Future Subordinate or Mezzanine Debt. Provided that no event of default is continuing under the Douglas Dynamics Portfolio Mortgage Loan documents, a constituent party of the borrower is permitted to incur a mezzanine loan (the “Douglas Dynamics Mezzanine Loan,” “Permitted Mezzanine Loan” or “New Mezzanine Loan”) secured by the equity interest held by such constituent party in the borrower under the Douglas Dynamics Portfolio Mortgage Loan, subject to the satisfaction of certain requirements set forth in the Douglas Dynamics Portfolio Mortgage Loan documents, which
| THE INFORMATION IN THIS STRUCTURAL AND COLLATERAL TERM SHEET IS NOT COMPLETE AND MAY BE AMENDED PRIOR TO THE TIME OF SALE. THIS TERM SHEET IS NOT AN OFFER TO SELL THESE SECURITIES AND IT IS NOT A SOLICITATION OF AN OFFER TO BUY THESE SECURITIES IN ANY JURISDICTION WHERE THE OFFER OR SALE IS NOT PERMITTED. |
| | 94 | |
| Structural and Collateral Term Sheet | | BMO 2024-C10 |
| No. 5 – Douglas Dynamics |
include, but are not limited to: (i) the actual combined loan-to-value ratio based on the Douglas Dynamics Portfolio Mortgage Loan and the Douglas Dynamics Mezzanine Loan is no more than 65.6%; (ii) the actual combined DSCR based on the Douglas Dynamics Portfolio Mortgage Loan and the Douglas Dynamics Mezzanine Loan is equal to or greater than 1.80x; (iii) the actual combined debt yield based on the Douglas Dynamics Portfolio Mortgage Loan and the Douglas Dynamics Mezzanine Loan is equal to or greater than 11.6%; (iv) the execution of an intercreditor agreement acceptable to the lender and satisfactory to the rating agencies; and (v) if required by the lender, receipt of a rating agency confirmation.
Partial Release. Provided that no event of default is continuing under the Douglas Dynamics Portfolio Mortgage Loan documents, at any time after the date that is the earlier to occur of two years after the closing date of the BMO 2024-C10 securitization or three years from the origination date, the borrower may deliver defeasance collateral and obtain release of any individual Douglas Dynamics Portfolio Property other than the Rockland Property and the Wisconsin Property (each as defined in the Douglas Dynamics Portfolio Mortgage Loan documents) (a “Partial Release Event”), provided that, among other conditions, (i) the borrower delivers to the lender an endorsement to the title insurance policy evidencing the continued first lien priority of the security instrument (and with no such additional title matters) subject, however, to the Partial Release Event; (ii) after giving effect to such Partial Release Event, the debt service coverage ratio for the remaining Douglas Dynamics Portfolio Properties is no less than the greater of: (a) 1.80x or (b) the debt service coverage ratio of the Douglas Dynamics Portfolio Properties immediately prior to such Partial Release Event; provided, that if the foregoing test is not satisfied, the borrower will be permitted at its option, in order to satisfy the foregoing condition on or prior to the date of consummation of the Partial Release Event, to either (A) prepay a portion of the unpaid principal balance of the Douglas Dynamics Portfolio Mortgage Loan in an amount which, if applied to the unpaid principal balance of the Douglas Dynamics Portfolio Mortgage Loan, would result in the Douglas Dynamics Portfolio Mortgage Loan achieving the debt service coverage ratio threshold (the “Release DSCR Paydown Amount”) or (B) deposit cash collateral or a letter of credit with the lender in an amount equal to the Release DSCR Paydown Amount; (iii) after giving effect to such Partial Release Event, the loan-to-value ratio for the remaining Douglas Dynamics Portfolio Properties does not exceed the lesser of: (a) 65.6% or (b) the loan-to-value ratio of the Douglas Dynamics Portfolio Properties immediately prior to such Partial Release Event (the “LTV Threshold”); provided, that if the foregoing test is not satisfied, the borrower will be permitted at its option, in order to satisfy the foregoing condition on or prior to the date of consummation of the Partial Release Event, to either (A) prepay a portion of the unpaid principal balance of the Douglas Dynamics Portfolio Mortgage Loan in an amount which, if applied to the unpaid principal balance of the Douglas Dynamics Portfolio Mortgage Loan, would result in the Douglas Dynamics Portfolio Mortgage Loan achieving the LTV Threshold (the “Release LTV Paydown Amount”) or (B) deposit cash collateral or a letter of credit with the lender in an amount equal to the Release LTV Paydown Amount; (iv) after giving effect to such Partial Release Event, the debt yield for the remaining Douglas Dynamics Portfolio Properties will be no less than the greater of: (i) 11.6% or (ii) the debt yield immediately prior to such Partial Release Event (the “Debt Yield Threshold”); provided, that if the foregoing test is not satisfied, the borrower will be permitted at its option, in order to satisfy the foregoing condition on or prior to the date of consummation of the Partial Release Event, to either (A) prepay a portion of the unpaid principal balance of the Douglas Dynamics Portfolio Mortgage Loan in an amount which, if applied to the unpaid principal balance of the Douglas Dynamics Portfolio Mortgage Loan, would result in the Douglas Dynamics Portfolio Mortgage Loan achieving the Debt Yield Threshold (the “Release Debt Yield Paydown Amount”) or (B) deposit cash collateral or a letter of credit with the lender in an amount equal to the Release Debt Yield Paydown Amount; and (v) the borrower pays all reasonable costs and out-of-pocket expenses of lender actually incurred in connection with the Partial Release Event, including (i) any costs and expenses associated with a release of the lien of the security instrument, (ii) reasonable attorneys’ fees and expenses incurred in connection with the Partial Release Event, (iii) the reasonable and actual costs and expenses of the rating agencies, (iv) any out-of-pocket costs and expenses associated with satisfying a rating condition and any endorsement to the title insurance policy; and (v) any recording fees, revenue, documentary stamp or intangible taxes or any other tax or charge due in connection with, or otherwise required to accomplish, the Partial Release Event. Payment of the foregoing costs and expenses by the borrower will be a condition precedent to the execution by the lender of the partial release instrument.
Ground Lease. None.
| THE INFORMATION IN THIS STRUCTURAL AND COLLATERAL TERM SHEET IS NOT COMPLETE AND MAY BE AMENDED PRIOR TO THE TIME OF SALE. THIS TERM SHEET IS NOT AN OFFER TO SELL THESE SECURITIES AND IT IS NOT A SOLICITATION OF AN OFFER TO BUY THESE SECURITIES IN ANY JURISDICTION WHERE THE OFFER OR SALE IS NOT PERMITTED. |
| | 95 | |
| Structural and Collateral Term Sheet | | BMO 2024-C10 |
| No. 6 – South Carolina Industrial |
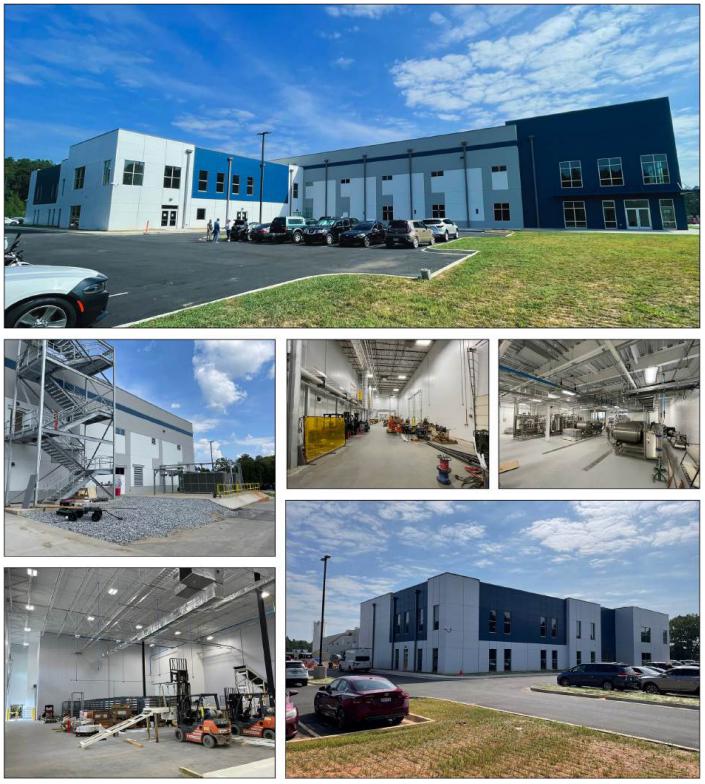
| THE INFORMATION IN THIS STRUCTURAL AND COLLATERAL TERM SHEET IS NOT COMPLETE AND MAY BE AMENDED PRIOR TO THE TIME OF SALE. THIS TERM SHEET IS NOT AN OFFER TO SELL THESE SECURITIES AND IT IS NOT A SOLICITATION OF AN OFFER TO BUY THESE SECURITIES IN ANY JURISDICTION WHERE THE OFFER OR SALE IS NOT PERMITTED. |
| | 96 | |
| Structural and Collateral Term Sheet | | BMO 2024-C10 |
| No. 6 – South Carolina Industrial |

| THE INFORMATION IN THIS STRUCTURAL AND COLLATERAL TERM SHEET IS NOT COMPLETE AND MAY BE AMENDED PRIOR TO THE TIME OF SALE. THIS TERM SHEET IS NOT AN OFFER TO SELL THESE SECURITIES AND IT IS NOT A SOLICITATION OF AN OFFER TO BUY THESE SECURITIES IN ANY JURISDICTION WHERE THE OFFER OR SALE IS NOT PERMITTED. |
| | 97 | |
| Structural and Collateral Term Sheet | | BMO 2024-C10 |
| No. 6 – South Carolina Industrial |
| Mortgage Loan Information | | Property Information |
| Mortgage Loan Seller: | 3650 REIT | | Single Asset / Portfolio: | Single Asset |
| Original Principal Balance: | $40,000,000 | | Title: | Fee |
| Cut-off Date Principal Balance: | $40,000,000 | | Property Type – Subtype: | Industrial – R&D / Manufacturing |
| % of IPB: | 5.5% | | Net Rentable Area (SF): | 135,939 |
| Loan Purpose: | Refinance | | Location: | Union, SC |
| Borrower: | CHRP Union SC Myco I LLC | | Year Built / Renovated: | 2018 / 2023 |
| Borrower Sponsors: | Philip W. Cyburt and Spencer C. Atkins | | Occupancy: | 100.0% |
| Interest Rate: | 7.42000% | | Occupancy Date: | 11/5/2024 |
| Note Date: | 10/10/2024 | | 4th Most Recent NOI (As of)(2): | NAV |
| Maturity Date: | 11/5/2034 | | 3rd Most Recent NOI (As of)(2): | NAV |
| Interest-only Period: | 120 months | | 2nd Most Recent NOI (As of)(2): | NAV |
| Original Term: | 120 months | | Most Recent NOI (As of)(2): | NAV |
| Original Amortization Term: | None | | UW Economic Occupancy: | 97.0% |
| Amortization Type: | Interest Only | | UW Revenues: | $5,649,751 |
| Call Protection: | L(24),D(92),O(4) | | UW Expenses: | $169,493 |
| Lockbox / Cash Management: | Hard / In Place | | UW NOI: | $5,480,258 |
| Additional Debt(1): | Yes | | UW NCF: | $5,480,258 |
| Additional Debt Balance(1): | $10,000,000 | | Appraised Value / Per SF: | $76,600,000 / $563 |
| Additional Debt Type(1): | Mezzanine | | Appraisal Date: | 1/30/2024 |
| | | | | |
| Escrows and Reserves(3) | | Financial Information |
| | Initial | Monthly | Initial Cap | | | Whole Loan | Total Debt |
| Taxes: | $0 | Springing | N/A | | Cut-off Date Loan / SF: | $294 | $368 |
| Insurance: | $0 | Springing | N/A | | Maturity Date Loan / SF: | $294 | $294 |
| Replacement Reserves: | $0 | $0 | N/A | | Cut-off Date LTV: | 52.2% | 65.3% |
| TI/LC Reserve: | $0 | $0 | N/A | | Maturity Date LTV: | 52.2% | 52.2% |
| Other Reserves: | $0 | Springing | N/A | | UW NCF DSCR: | 1.82x | 1.12x |
| | | | | | UW NOI Debt Yield: | 13.7% | 11.0% |
| | | | | | | |
| Sources and Uses(3) |
| Sources | Proceeds | % of Total | | Uses | Proceeds | % of Total |
| Mortgage Loan | $40,000,000 | 77.3 | % | | Loan Payoff | $50,180,141 | 96.9 | % |
| Mezzanine Loan | 10,000,000 | 19.3 | | | Closing Costs | 1,578,992 | 3.1 | |
| Borrower Equity | 1,759,133 | 3.4 | | | | | |
| Total Sources | $51,759,133 | 100.0 | % | | Total Uses | $51,759,133 | 100.0 | % |
| (1) | See “Description of the Mortgage Pool–Additional Indebtedness–Existing Mezzanine Debt” in the Preliminary Prospectus. |
| (2) | Historical financial information is not available because the South Carolina Industrial Property (as defined below) was originally constructed in 2018 and the build-to-suit for the tenant was completed in 2023. |
| (3) | For a full description of Escrows and Reserves, see “Escrows and Reserves” below. |
The Loan. The sixth largest mortgage loan (the “South Carolina Industrial Mortgage Loan”) has an outstanding principal balance as of the Cut-off Date of $40,000,000 and is secured by the borrower’s fee interest in a 135,939, single-tenant industrial property located at 260 Midway Drive in Union, Union County, South Carolina (the “South Carolina Industrial Property”). The South Carolina Industrial Mortgage Loan was originated on October 10, 2024 by 3650 Real Estate Investment Trust 2 LLC (“3650 REIT”) and accrues interest at a rate of 7.42000% per annum. The South Carolina Industrial Mortgage Loan has a ten-year term, is interest-only for the entire term and accrues interest on an Actual/360 basis. The scheduled maturity date of the South Carolina Industrial Mortgage Loan is November 5, 2034.
| THE INFORMATION IN THIS STRUCTURAL AND COLLATERAL TERM SHEET IS NOT COMPLETE AND MAY BE AMENDED PRIOR TO THE TIME OF SALE. THIS TERM SHEET IS NOT AN OFFER TO SELL THESE SECURITIES AND IT IS NOT A SOLICITATION OF AN OFFER TO BUY THESE SECURITIES IN ANY JURISDICTION WHERE THE OFFER OR SALE IS NOT PERMITTED. |
| | 98 | |
| Structural and Collateral Term Sheet | | BMO 2024-C10 |
| No. 6 – South Carolina Industrial |
The Property. The South Carolina Industrial Property consists of a single, two-story industrial building totaling 135,939 square feet situated on an approximately 24.93-acre site located in Union, South Carolina. The South Carolina Industrial Property contains 118 surface parking spaces or 0.9 spaces per 1,000 square feet.
The South Carolina Industrial Property is occupied by a single tenant, MycoWorks, with a 30-year triple-net lease and was completed as a build-to-suit for the tenant in August 2023. The South Carolina Industrial Property serves as MycoWorks’ first commercial scale manufacturing facility. MycoWorks contributed approximately $14.6 million of hard and soft costs towards the project development, for which it received no equity/ownership attribution. Additionally, MycoWorks spent approximately $52.5 million for equipment and installation. As such, MycoWorks’ total funding towards the project was approximately $67.1 million. The borrower sponsors invested approximately $52.9 million in development costs resulting in a total cost basis of approximately $120.0 million.
Sole Tenant.
MycoWorks (135,939 square feet; 100.0% of NRA; 100.0% of underwritten base rent) specializes in mycelium-grown materials for use as sustainable leather alternatives. MycoWorks’ patented technology engineers mycelium (the network of threads found in the root structure of fungi) to produce a natural material, including its flagship product Reishi, which resembles animal-based leathers in look, feel, aesthetics, and performance but with lower environmental impact. MycoWorks occupies 100.0% of the South Carolina Industrial Property under a lease that commenced on September 1, 2023, with a lease expiration date of August 1, 2053 and has two, five-year renewal options remaining, and no termination options. Additionally, the rent includes annual escalations based on the previous year’s CPI, subject to a minimum annual escalation of 3.00% and maximum annual escalation of 6.00%. MycoWorks has posted with the landlord a letter of credit for $5.8 million as security for MycoWorks’ obligations under the MycoWorks lease, which has been assigned to the lender in connection with the South Carolina Industrial Mortgage Loan (the “MycoWorks Letter of Credit”).
Environmental. According to the Phase I environmental assessment dated February 1, 2024, there was no evidence of any recognized environmental conditions at the South Carolina Industrial Property.
The following table presents certain information relating to the historical and current occupancy of the South Carolina Industrial Property:
| Historical and Current Occupancy(1) |
| 2021 | 2022 | 2023 | Current(2) |
| NAV | NAV | NAV | 100.0% |
| (1) | Historical occupancies are not available as the South Carolina Industrial Property was completed as a build-to-suit for the tenant in 2023. |
| (2) | Current occupancy is as of November 5, 2024. |
The following table presents certain information relating to the sole tenant at the South Carolina Industrial Property:
| Sole Tenant Summary(1) |
| Tenant | Ratings
Moody’s/S&P/Fitch | Net Rentable Area (SF) | % of
Total NRA | UW Base Rent PSF | UW Base Rent | % of Total
UW Base Rent | Lease
Exp. Date |
| MycoWorks | NR / NR / NR | 135,939 | 100.0 | % | $36.29 | $4,932,879 | 100.0% | 9/1/2053 |
| Occupied Collateral Total / Wtd. Avg. | 135,939 | 100.0 | % | $36.29 | $4,932,879 | 100.0% | |
| Vacant Space | | 0 | 0.0 | | | | | |
| Collateral Total | | 135,939 | 100.0 | % | | | | |
| | | | | | |
| (1) | Based on the underwritten rent roll dated September 1, 2024. |
| THE INFORMATION IN THIS STRUCTURAL AND COLLATERAL TERM SHEET IS NOT COMPLETE AND MAY BE AMENDED PRIOR TO THE TIME OF SALE. THIS TERM SHEET IS NOT AN OFFER TO SELL THESE SECURITIES AND IT IS NOT A SOLICITATION OF AN OFFER TO BUY THESE SECURITIES IN ANY JURISDICTION WHERE THE OFFER OR SALE IS NOT PERMITTED. |
| | 99 | |
| Structural and Collateral Term Sheet | | BMO 2024-C10 |
| No. 6 – South Carolina Industrial |
The following table presents certain information relating to the sole tenant’s lease expiration at the South Carolina Industrial Property:
| Lease Rollover Schedule(1) |
| Year | Number of Leases Expiring | Net Rentable Area Expiring | % of NRA Expiring | UW Base Rent Expiring | % of UW Base Rent Expiring | Cumulative Net Rentable Area Expiring | Cumulative % of NRA Expiring | Cumulative UW Base Rent Expiring | Cumulative % of UW Base Rent Expiring |
| Vacant | NAP | 0 | 0.0 | % | NAP | NAP | 0 | 0.0% | NAP | NAP | |
| 2024 & MTM | 0 | 0 | 0.0 | | $0 | 0.0 | % | 0 | 0.0% | $0 | 0.0% | |
| 2025 | 0 | 0 | 0.0 | | 0 | 0.0 | | 0 | 0.0% | $0 | 0.0% | |
| 2026 | 0 | 0 | 0.0 | | 0 | 0.0 | | 0 | 0.0% | $0 | 0.0% | |
| 2027 | 0 | 0 | 0.0 | | 0 | 0.0 | | 0 | 0.0% | $0 | 0.0% | |
| 2028 | 0 | 0 | 0.0 | | 0 | 0.0 | | 0 | 0.0% | $0 | 0.0% | |
| 2029 | 0 | 0 | 0.0 | | 0 | 0.0 | | 0 | 0.0% | $0 | 0.0% | |
| 2030 | 0 | 0 | 0.0 | | 0 | 0.0 | | 0 | 0.0% | $0 | 0.0% | |
| 2031 | 0 | 0 | 0.0 | | 0 | 0.0 | | 0 | 0.0% | $0 | 0.0% | |
| 2032 | 0 | 0 | 0.0 | | 0 | 0.0 | | 0 | 0.0% | $0 | 0.0% | |
| 2033 | 0 | 0 | 0.0 | | 0 | 0.0 | | 0 | 0.0% | $0 | 0.0% | |
| 2034 | 0 | 0 | 0.0 | | 0 | 0.0 | | 0 | 0.0% | $0 | 0.0% | |
| 2035 & Beyond | 1 | 135,939 | 100.0 | | 4,932,879 | 100.0 | | 135,939 | 100.0% | $4,932,879 | 100.0% | |
| Total Collateral | 1 | 135,939 | 100.0 | % | $4,932,879 | 100.0 | % | | | | |
| (1) | Based on the underwritten rent roll dated September 1, 2024. |
The following table presents certain information relating to the underwritten cash flows of the South Carolina Industrial Property:
| Underwriting Net Cash Flow(1) |
| | Underwritten | Per Square Foot | %(2) |
| In Place Rent | $4,932,879 | | $36.29 | 84.7 | % |
| Rent Steps(3) | 722,114 | | 5.31 | 12.4 | |
| Gross Potential Rent | $5,654,993 | | $41.60 | 97.1 | % |
| Total Reimbursements | 169,493 | | 1.25 | 2.9 | |
| Net Rental Income | $5,824,485 | | $42.85 | 100.0 | % |
| (Vacancy/Credit Loss) | (174,735) | | (1.29) | (3.0 | ) |
| Effective Gross Income | $5,649,751 | | $41.56 | 97.0 | % |
| Total Expenses | 169,493 | | 1.25 | 3.0 | |
| Net Operating Income | $5,480,258 | | $40.31 | 97.0 | % |
| Capital Expenditures | 0 | | 0.00 | 0.0 | |
| TI/LC | 0 | | 0.00 | 0.0 | |
| Net Cash Flow | $5,480,258 | | $40.31 | 97.0 | % |
| (1) | Historical financial information is not available because the South Carolina Industrial Property was originally constructed in 2018 and completed as a build-to-suit for the tenant in 2023. |
| (2) | % column represents percent of Total Gross Income for all revenue lines and represents percent of Effective Gross Income for the remainder of fields. |
| (3) | Rent Steps are based on the average of the contractual rent steps through the term of the MycoWorks lease. |
Appraisal. According to the appraisal, the South Carolina Industrial Property had an “as-is” appraised value of $76,600,000 as of January 30, 2024. The table below shows the appraisal’s “as-is” conclusions.
| Appraisal Valuation Summary(1) |
| Appraisal Approach | Appraised Value | Capitalization Rate(2) |
| Income Capitalization Approach | $76,600,000 | 6.25% |
| (2) | The appraisal used a discounted cash flow approach also to arrive at the appraised value. The capitalization rate shown above represents the overall capitalization rate. |
| THE INFORMATION IN THIS STRUCTURAL AND COLLATERAL TERM SHEET IS NOT COMPLETE AND MAY BE AMENDED PRIOR TO THE TIME OF SALE. THIS TERM SHEET IS NOT AN OFFER TO SELL THESE SECURITIES AND IT IS NOT A SOLICITATION OF AN OFFER TO BUY THESE SECURITIES IN ANY JURISDICTION WHERE THE OFFER OR SALE IS NOT PERMITTED. |
| | 100 | |
| Structural and Collateral Term Sheet | | BMO 2024-C10 |
| No. 6 – South Carolina Industrial |
The Market. The South Carolina Industrial Property is located in the northern portion of South Carolina, within the Spartanburg, SC metropolitan statistical area (“Spartanburg MSA”). The Spartanburg MSA is comprised of only one county, Union County, and only one major city, Spartanburg. According to the appraisal, as of 2022, the Spartanburg MSA had an estimated population of approximately 340,564 and experienced an annual growth rate of 1.7%, which was higher than the South Carolina annual growth rate of 1.1%. The Spartanburg MSA accounts for 6.5% of the total South Carolina population.
The South Carolina Industrial Property is located in Union County, South Carolina and is situated at Midway Green Industrial Park in the Greenville-Spartanburg region of South Carolina. The South Carolina Industrial Property is accessible from one street, with the main entrance and primary point of ingress/egress being Midway Drive. State Highway 176 is a major transportation arterial proximate to the South Carolina Industrial Property, providing linkage to the surrounding area. The South Carolina Industrial Property has proximity to Greenville-Spartanburg Airport (approximately 34 miles), Charlotte Douglas International Airport (approximately 54 miles) and Troy Shelton Field (civil airport) (approximately 2 miles). Access to the South Carolina Industrial Property is provided by State Highway 176, Cross Keys Highway 49, Midway Drive, Industrial Park Road and Lukesville Road.
The South Carolina Industrial Property is situated in the Spartanburg industrial market. As of the first quarter of 2024, the Spartanburg industrial market contains 118,242,712 square feet, a vacancy rate of 12.2% and asking rent of $5.26 per square foot. The estimated 2022 population within a one-, three- and five-mile radius of the South Carolina Industrial Property is 185, 8,456 and 15,121, respectively. The estimated 2022 median household income within the same radii is $41,749, $40,651 and $39,781, respectively.
The following table presents certain information relating to comparable warehouse leases to the South Carolina Industrial Property:
| Lease Comparables Summary(1) |
Property Name / Location | Year Built / Renovated | Size (SF) | Tenant | Tenant Size (SF) | Rent PSF | Commencement | Lease Term (Years) |
South Carolina Industrial Property Union, SC | 2018 / 2023 | 135,939(2) | MycoWorks(2) | 135,939(2) | $36.29(2) | Sep-23(2) | 30.0(2) |
Pathway Devens Devens, MA | 2023 / NAP | 187,000 | Electric Hydrogen | 187,000 | $54.25 | Jul-2023 | 7.0 |
Keystone VII Morrisville, NC | 1999 / NAP | 87,134 | Heat Biologics | 15,996 | $32.75 | Jun-2021 | 8.0 |
R & D NNJ Princeton, NJ | 1980 / 2011 | 52,770 | PMV Pharma | 52,770 | $32.50 | Feb-2021 | 10.4 |
R&D Waltham, MA | 1965 / 1997 | 51,540 | Boston IVF | 51,540 | $23.60 | Dec-2017 | 11.0 |
Flex/R&D Morrisville, NC | 1999 / NAP | 87,134 | Confidential Tenant | 33,940 | $23.00 | Nov-2016 | 10.0 |
| (1) | Source: Appraisal, unless otherwise specified. |
| (2) | Information is based on the underwritten rent roll dated September 1, 2024. |
| THE INFORMATION IN THIS STRUCTURAL AND COLLATERAL TERM SHEET IS NOT COMPLETE AND MAY BE AMENDED PRIOR TO THE TIME OF SALE. THIS TERM SHEET IS NOT AN OFFER TO SELL THESE SECURITIES AND IT IS NOT A SOLICITATION OF AN OFFER TO BUY THESE SECURITIES IN ANY JURISDICTION WHERE THE OFFER OR SALE IS NOT PERMITTED. |
| | 101 | |
| Structural and Collateral Term Sheet | | BMO 2024-C10 |
| No. 6 – South Carolina Industrial |
The following table presents certain information relating to comparable sales for the South Carolina Industrial Property:
Comparable Sales(1) |
| Property/Location | Sale Date | Total NRA (SF) | Total Occupancy | Sale Price | Sale Price PSF | Adjusted Sales Price PSF |
South Carolina Industrial Property Union, SC | NAP | 135,939(2) | 100.0% | (2)(3) | NAP | NAP | NAP |
Park Point Durham, NC | Sep-2022 | 662,607 | 88.0% | | $379,991,000 | $573 | $560 |
Devon Industrial Park Wayne, PA | Jul-2022 | 155,200 | 100.0% | | $57,000,000 | $367 | $473 |
Princeton R & D Princeton, NJ | May-2022 | 78,992 | 100.0% | | $34,000,000 | $430 | $490 |
Research and Development Property San Jose, CA | April-2022 | 196,647 | 100.0% | | $103,829,000 | $528 | $492 |
High-Tech - R & D Industrial Plymouth, MI | Nov-2021 | 79,901 | 100.0% | | $31,000,000 | $388 | $466 |
Parmer 7.3 Austin, TX | Jul-2021 | 335,825 | 100.0% | | $184,100,000 | $548 | $577 |
| (1) | Source: Appraisal, unless otherwise specified. |
| (2) | Based on the underwritten rent roll dated September 1, 2024. |
| (3) | Total Occupancy is as of the cut-off date. |
The Borrower. The borrower is CHRP Union SC Myco I LLC, a Delaware limited liability company with two independent directors in its organizational structure. Legal counsel to the borrower delivered a non-consolidation opinion in connection with the origination of the South Carolina Industrial Mortgage Loan.
The South Carolina Industrial Mortgage Loan is partially recourse to the borrower and guarantor in an amount equal to the difference between $20,000,000 and the last dollar of the outstanding principal balance of the South Carolina Industrial Mortgage Loan (which shall be reduced in an amount equal to the tenant letter of credit which is successfully applied by the lender to the South Carolina Industrial Mortgage Loan and which may be further reduced by subsequent delivery to the lender of additional acceptable letters of credit); the South Carolina Industrial Mortgage Loan documents provide for a release of this partial recourse to the extent tenant’s credit rating is at least “BB” by S&P (or an equivalent credit rating by Moody's). See “Description of the Mortgage Pool—Single-Purpose Entity Covenants” in the Preliminary Prospectus.
The Borrower Sponsors. The borrower sponsors and non-recourse carveout guarantors for the South Carolina Industrial Mortgage Loan are Philip W. Cyburt and Spencer C. Atkins. Philip W. Cyburt is the owner of CH Realty Partners, a real estate firm based out of Los Angeles, California, specializing in the acquisition, development, repositioning, and management of real estate assets.
Philip W. Cyburt has held leadership positions with Boeing Realty Corp., GenCorp Real Estate Group, Lehman Bros. Holdings, Laurus Corp. and Monday Properties.
Spencer C. Atkins is the CEO of The Atkins Group. The Atkins group is an Urbana, IL based company that has real estate holdings consisting of residential, farm, industrial, office and commercial properties. The Atkins Group currently invests and manages real estate properties in Illinois, Indiana, Iowa, Kentucky, and California.
Property Management. The South Carolina Industrial Property is managed by Cyburt Holdings, LLC, a borrower affiliated management company.
Escrows and Reserves.
Tax Escrows – On each monthly payment date, the borrower is required to escrow 1/12th of the annual estimated real estate taxes. Such reserve has been conditionally waived so long as (i) no event of default has occurred and is continuing, (ii) the MycoWorks lease is in full force and effect and no default beyond any applicable cure period is continuing thereunder, (iii) MycoWorks is required under the MycoWorks lease to pay all taxes for the South Carolina Industrial Property directly to the appropriate governmental taxing authority, and (iv) MycoWorks pays all taxes with respect to the South Carolina Industrial Property directly to the applicable governmental taxing authority and the borrower delivers to the lender evidence thereof no later than 30 days before the date they would be delinquent if not paid.
| THE INFORMATION IN THIS STRUCTURAL AND COLLATERAL TERM SHEET IS NOT COMPLETE AND MAY BE AMENDED PRIOR TO THE TIME OF SALE. THIS TERM SHEET IS NOT AN OFFER TO SELL THESE SECURITIES AND IT IS NOT A SOLICITATION OF AN OFFER TO BUY THESE SECURITIES IN ANY JURISDICTION WHERE THE OFFER OR SALE IS NOT PERMITTED. |
| | 102 | |
| Structural and Collateral Term Sheet | | BMO 2024-C10 |
| No. 6 – South Carolina Industrial |
Insurance Escrows – On each monthly payment date, the borrower is required to escrow 1/12th of the annual estimated insurance payments. Such reserve has been conditionally waived so long (i) no event of default has occurred and is continuing, (ii) the MycoWorks Lease is in full force and effect and no default beyond any applicable cure period is continuing thereunder, (iii) MycoWorks continues to be obligated under the MycoWorks Lease to maintain insurance covering the South Carolina Industrial Property in form and substance satisfactory to the lender which satisfies the insurance requirements set forth in the South Carolina Industrial Mortgage Loan documents, (iv) the policies maintained by MycoWorks covering the South Carolina Industrial Property are approved by the lender, (v) MycoWorks maintains all such policies in full force and effect and (vi) the lender receives, not less than ten days prior to the expiration of such policies, evidence reasonably satisfactory to the lender that MycoWorks has paid any and all insurance premiums on all such insurance required to be maintained pursuant to the South Carolina Industrial Mortgage Loan documents together with evidence of renewals of such insurance policies.
Low DSCR Cure Reserve – If the borrower deposits one or more Low DSCR Cure Deposits (as defined below) with the lender in cash to avoid the commencement of a Cash Trap Event Period caused solely by a Low DSCR Trigger Event (as defined below), the lender will transfer the funds into the Low DSCR Cure Reserve account to be held as additional collateral for the South Carolina Industrial Mortgage Loan.
Partial Release Reserve – In the event that the borrower is effectuating a release of the Release Parcel (as defined below), then the borrower is required to deposit an amount equal to the Release Amount (as defined below), which will be transferred into the Partial Release Reserve account to be held as cash collateral for the South Carolina Industrial Mortgage Loan.
MycoWorks LOC Reserve – In the event that the lender draws upon the MycoWorks Letter of Credit, then the lender may direct that any amounts drawn will be paid to the lender and transferred into MycoWorks LOC Reserve account, to be held by the lender as cash collateral for the South Carolina Industrial Mortgage Loan; provided, however, in the event that the borrower enters into a lease approved by the lender in accordance with the South Carolina Industrial Mortgage Loan documents and no event of default is continuing, then the borrower is permitted to use these funds for qualified leasing expenses in connection with such lease.
Lockbox / Cash Management. The South Carolina Industrial Mortgage Loan is structured with a hard lockbox and in place cash management. The borrower and property manager are required to direct the tenants to pay rent directly into the lockbox account, and to deposit any rents otherwise received in such account within one business day after receipt. All funds in the lockbox account are required to be swept on a daily basis into a lender-controlled cash management account and disbursed in accordance with the South Carolina Industrial Mortgage Loan documents. During the continuance of a Cash Trap Event Period all excess funds on deposit in the cash management account (after payment of required monthly reserve deposits) are required to be applied and disbursed in accordance with the South Carolina Industrial Mortgage Loan documents.
A “Cash Trap Event Period” means a period commencing upon the occurrence of (i) an event of default under the South Carolina Industrial Mortgage Loan documents, (ii) the borrower’s failure to maintain a debt service coverage ratio of at least 1.40x (a “Low DSCR Trigger Event”), (iii) the commencement of a Lease Sweep Period (as defined below), (iv) the occurrence of a mezzanine loan event of default, or (v) the MycoWorks Liquidity Financials (as defined below) deadline, if as of such date the lender has not have received the applicable MycoWorks Liquidity Financials due on such MycoWorks Liquidity Financials deadline, which such Cash Trap Event Period will expire upon (A) the cure (if applicable) of such event of default, (B) the debt service coverage ratio is equal to or greater than 1.40x for two consecutive calendar quarters, (C) such Lease Sweep Period having ended, (D) the receipt by the lender of a mezzanine loan event of default revocation notice, or (E) upon the receipt by the lender of the applicable MycoWorks Liquidity Financials that had not previously been delivered by the applicable MycoWorks Liquidity Financials deadline. In order to avoid the commencement of a Cash Trap Event Period caused solely by a Low DSCR Trigger Event, the borrower may deposit cash (the “Low DSCR Cure Deposit”) or a letter of credit with the lender, in an amount that, if applied to reduce the then outstanding principal balance of the South Carolina Industrial Mortgage Loan, would be sufficient to increase the debt service coverage ratio to an amount that equals or exceeds 1.40x; provided, however, that the borrower will only be permitted to deposit a maximum of two Low DSCR Cure Deposits with the lender during the term of the South Carolina Industrial Mortgage Loan.
A “Lease Sweep Period” (i) will commence on the first monthly payment date following the occurrence of any of the following: (a) with respect to each Lease Sweep Lease (as defined below), the earlier to occur of: (i) 12 months prior to the earliest stated expiration of a Lease Sweep Lease; (ii) the date required under a Lease Sweep Lease by which the tenant thereunder is required to give notice of its exercise of a renewal option thereunder, and (iii) the date that any tenant under
| THE INFORMATION IN THIS STRUCTURAL AND COLLATERAL TERM SHEET IS NOT COMPLETE AND MAY BE AMENDED PRIOR TO THE TIME OF SALE. THIS TERM SHEET IS NOT AN OFFER TO SELL THESE SECURITIES AND IT IS NOT A SOLICITATION OF AN OFFER TO BUY THESE SECURITIES IN ANY JURISDICTION WHERE THE OFFER OR SALE IS NOT PERMITTED. |
| | 103 | |
| Structural and Collateral Term Sheet | | BMO 2024-C10 |
| No. 6 – South Carolina Industrial |
a Lease Sweep Lease gives notice of its intention not to renew or extend its Lease Sweep Lease, (b) the date that (i) any Lease Sweep Lease (or any material portion thereof) is surrendered, cancelled or terminated prior to its then-current expiration date or (ii) the borrower or property manager receives notice from any tenant under a Lease Sweep Lease of its intent to surrender, cancel or terminate the Lease Sweep Lease (or any material portion thereof) prior to its then-current expiration date; (c) the date that any tenant under a Lease Sweep Lease discontinues its business (i.e., “goes dark”) in its Lease Sweep Space at the South Carolina Industrial Property (or any material portion thereof) or vacates or ceases occupying its Lease Sweep Space at the South Carolina Industrial Property (or any material portion thereof) or gives notice that it intends to do any of the foregoing (other than for certain temporary closures for renovations or due to a pandemic or epidemic), (d) upon a default under a Lease Sweep Lease by the tenant, (e) the occurrence of a lease sweep tenant party insolvency proceeding; or (f) the commencement of a MycoWorks Liquidity Sweep Period (as defined below); and (ii) will end upon the first to occur of the following: (A) in the case of clauses (i)(a), (i)(b), (i)(c), (i)(d) and (i)(e) above, upon the occurrence of an Acceptable Lease Sweep Lease Event (as defined below); (B) in the case of clause (i)(b)(i) above, such notice of surrender, cancellation or termination is validly and irrevocably revoked in writing by the related tenant; (C) in the case of clause (i)(c) above, the applicable tenant under the Lease Sweep Lease has re-commenced operations at its Lease Sweep Space at the South Carolina Industrial Property during normal business hours, in accordance with the terms of its Lease Sweep Lease, for a period of six consecutive months following such cure; (D) in the case of clause (i)(d) above, the date on which the subject default has been cured, and no other default under such Lease Sweep Lease occurs for a period of three consecutive months following such cure; (E) in the case of clause (i)(e) above, either (a) the applicable lease sweep tenant party insolvency proceeding has been terminated for a period of at least two consecutive calendar quarters and the applicable Lease Sweep Lease has been affirmed, assumed or assigned in a manner reasonably satisfactory to the lender or (b) the applicable Lease Sweep Lease has been assumed and assigned to a third party in a manner reasonably satisfactory to the lender; and (F) in the case of clause (i)(f) above, such MycoWorks Liquidity Sweep Period has ended pursuant to the terms of the South Carolina Industrial Mortgage Loan documents.
A “Lease Sweep Lease” means (i) that certain MycoWorks lease or (ii) any renewal or replacement lease with respect to all or a portion of the Lease Sweep Space.
A “Lease Sweep Space” means the space demised under the applicable Lease Sweep Lease.
An “Acceptable Lease Sweep Event” means the entirety of the Lease Sweep Space is leased pursuant to one or more Qualified Leases and each of the following conditions have been satisfied: the borrower has delivered to the lender (i) an officer’s certificate attaching a complete copy of such Qualified Lease(s) and confirming the same to be a true, correct and complete copy thereof, and confirming that: (a) the applicable tenant(s) have accepted possession of the premises demised under such Qualified Lease(s), (b) the applicable tenant(s) are in occupancy of all of the space demised under such Qualified Lease(s) and are open for business and paying regularly scheduled payments of base rent in accordance with the Qualified Lease(s) without right of abatement, offset or credit and any free rent periods, if any, have expired, (c) the applicable tenant(s) (or its corporate parent(s)) is/are not the subject of a bankruptcy action, (d) the tenant improvements described in such Qualified Lease(s) have been constructed in accordance with the plans and specifications therefor and have been accepted by the applicable tenant(s), (e) all construction costs, have been paid in full or reserved for pursuant to the South Carolina Industrial Loan documents, (f) all contingencies under all such Qualified Lease(s) to the effectiveness of such Qualified Lease(s) have been satisfied, and (g) all leasing commissions payable in connection with any such Qualified Lease(s) have been paid in full and all tenant improvement obligations, or allowances, concessions or rebates or other landlord obligations of an inducement nature have been completed and paid in full; and (ii) at the lender’s option, a tenant estoppel certificate from the applicable the tenant(s), which must be in form and substance reasonably satisfactory to the lender confirming the conditions set forth in clauses (a) through and including (g) above, have been satisfied.
A “MycoWorks Liquidity Financials” means those items required to be delivered by MycoWorks to the borrower pursuant to the MycoWorks Lease.
A “MycoWorks Liquidity Sweep Period” means a period (x) commencing upon such time that the value of MycoWorks’ unencumbered liquid assets is less than $23,950,000 in the aggregate as determined by the lender, and (y) ending upon such time that the value of MycoWorks’ unencumbered liquid assets is greater than $23,950,000 in the aggregate as determined by lender.
Subordinate and Mezzanine Debt. Concurrently with the origination of the South Carolina Industrial Mortgage Loan, 3650 REIT originated a mezzanine loan (the “South Carolina Industrial Mezzanine Loan” and together with the South Carolina Industrial Mortgage Loan, the “South Carolina Industrial Total Debt”) in the amount of $10,000,000, to be secured by the
| THE INFORMATION IN THIS STRUCTURAL AND COLLATERAL TERM SHEET IS NOT COMPLETE AND MAY BE AMENDED PRIOR TO THE TIME OF SALE. THIS TERM SHEET IS NOT AN OFFER TO SELL THESE SECURITIES AND IT IS NOT A SOLICITATION OF AN OFFER TO BUY THESE SECURITIES IN ANY JURISDICTION WHERE THE OFFER OR SALE IS NOT PERMITTED. |
| | 104 | |
| Structural and Collateral Term Sheet | | BMO 2024-C10 |
| No. 6 – South Carolina Industrial |
mezzanine borrowers’ interests in the borrower. The South Carolina Industrial Mezzanine Loan accrues interest at a rate of (i) 14.0000% per annum from the origination date through and including December 4, 2029, and (ii) 15.0000% per annum from December 5, 2029 through the end of the term, to be paid as part of each monthly debt service payment amount. The South Carolina Industrial Mezzanine Loan has a final maturity date of November 5, 2034. An intercreditor agreement between the lender under the South Carolina Industrial Mortgage Loan and the lender under the South Carolina Industrial Mezzanine Loan was executed simultaneously with the origination of the South Carolina Industrial Mezzanine Loan. Based on the South Carolina Industrial Mortgage Loan and the South Carolina Industrial Mezzanine Loan, the cumulative Cut-off Date loan-to-value is 65.3%, the cumulative UW NCF debt service coverage ratio is 1.12x and the cumulative UW NCF debt yield is 11.0%. The rights of the mezzanine lender under the South Carolina Industrial Mezzanine Loan are further described under “Description of the Mortgage Pool–Additional Indebtedness–Existing Mezzanine Debt” in the Preliminary Prospectus.
Permitted Future Subordinate or Mezzanine Debt. Not permitted.
Partial Release. In connection with the potential construction of additional improvements for MycoWorks, on any business day, the borrower may (x) subdivide the real property comprising the South Carolina Industrial Property by creating a separate legal description for the Release Parcel, (y) obtain a release of the lien of the security instrument with respect to the Release Parcel from the lien of the security instrument encumbering the South Carolina Industrial Property and (z) transfer the Release Parcel to an affiliate of the borrower, provided that, among other things, (i) no Cash Trap Event Period has occurred and is continuing, (ii) payment of the Release Amount, (iii) MycoWorks is (x) in occupancy of the improvements on the South Carolina Industrial Property, (y) paying full unabated rent in accordance with the terms and provisions of the MycoWorks lease and (z) not in default under the MycoWorks lease (iv) after giving effect to such release, (x) the debt yield for the remaining South Carolina Industrial Property may be no less than 13% and (y) the loan to value ratio of the remaining South Carolina Industrial Property may be no more than 50%, (v) satisfaction of any REMIC release conditions and (vi) the borrower may not exercise these rights during the period commencing on the date that is 30 days prior to the date of any intended securitization of the South Carolina Industrial Mortgage Loan and ending on the date that is 30 days after the date of such securitization of the South Carolina Industrial Mortgage Loan.
The “Release Parcel” is a vacant and unimproved parcel of land that has been subdivided from the South Carolina Industrial Property.
The “Release Amount” is an amount equal to the product of (x) the aggregate amount of acreage of the Release Parcel being released and (y) $10,000.00.
Ground Lease. None.
| THE INFORMATION IN THIS STRUCTURAL AND COLLATERAL TERM SHEET IS NOT COMPLETE AND MAY BE AMENDED PRIOR TO THE TIME OF SALE. THIS TERM SHEET IS NOT AN OFFER TO SELL THESE SECURITIES AND IT IS NOT A SOLICITATION OF AN OFFER TO BUY THESE SECURITIES IN ANY JURISDICTION WHERE THE OFFER OR SALE IS NOT PERMITTED. |
| | 105 | |
| Structural and Collateral Term Sheet | | BMO 2024-C10 |
| No. 7 – Sterling Portfolio |
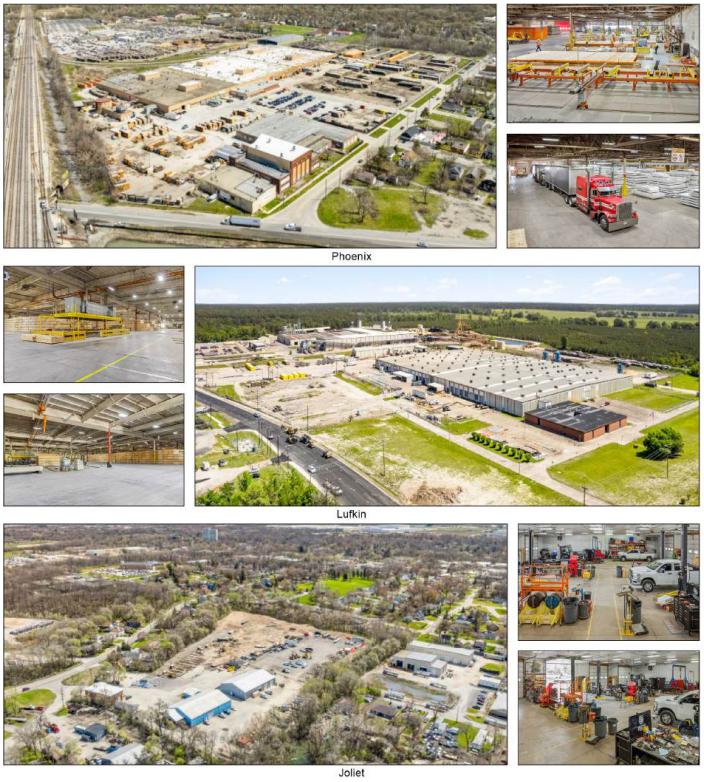
| THE INFORMATION IN THIS STRUCTURAL AND COLLATERAL TERM SHEET IS NOT COMPLETE AND MAY BE AMENDED PRIOR TO THE TIME OF SALE. THIS TERM SHEET IS NOT AN OFFER TO SELL THESE SECURITIES AND IT IS NOT A SOLICITATION OF AN OFFER TO BUY THESE SECURITIES IN ANY JURISDICTION WHERE THE OFFER OR SALE IS NOT PERMITTED. |
| | 106 | |
| Structural and Collateral Term Sheet | | BMO 2024-C10 |
| No. 7 – Sterling Portfolio |

| THE INFORMATION IN THIS STRUCTURAL AND COLLATERAL TERM SHEET IS NOT COMPLETE AND MAY BE AMENDED PRIOR TO THE TIME OF SALE. THIS TERM SHEET IS NOT AN OFFER TO SELL THESE SECURITIES AND IT IS NOT A SOLICITATION OF AN OFFER TO BUY THESE SECURITIES IN ANY JURISDICTION WHERE THE OFFER OR SALE IS NOT PERMITTED. |
| | 107 | |
| Structural and Collateral Term Sheet | | BMO 2024-C10 |
| No. 7 – Sterling Portfolio |
| Mortgage Loan Information | | Property Information |
| Mortgage Loan Seller: | CREFI | | Single Asset / Portfolio: | Portfolio |
| Original Principal Balance: | $38,760,000 | | Title: | Fee |
| Cut-off Date Principal Balance: | $38,760,000 | | Property Type – Subtype(4): | Industrial – Various |
| % of IPB: | 5.4% | | Net Rentable Area (SF): | 991,022 |
| Loan Purpose(1): | Recapitalization | | Location(4): | Various, Various |
| Borrower: | AGNL Timber, L.P. | | Year Built / Renovated(4): | Various / Various |
| Borrower Sponsors(2): | Angelo, Gordon & Co., L.P. and TPG, Inc. | | Occupancy: | 100.0% |
| Interest Rate: | 6.21000% | | Occupancy Date: | 11/6/2024 |
| Note Date: | 9/27/2024 | | 4th Most Recent NOI (As of)(5): | NAV |
| Maturity Date: | 10/6/2034 | | 3rd Most Recent NOI (As of)(5): | NAV |
| Interest-only Period: | 120 months | | 2nd Most Recent NOI (As of)(5): | NAV |
| Original Term: | 120 months | | Most Recent NOI (As of)(5): | NAV |
| Original Amortization Term: | None | | UW Economic Occupancy: | 95.0% |
| Amortization Type: | Interest Only | | UW Revenues: | $6,449,744 |
| Call Protection: | YM1(25),DorYM1(88),O(7) | | UW Expenses: | $2,003,355 |
| Lockbox / Cash Management: | Hard / Springing | | UW NOI: | $4,446,388 |
| Additional Debt: | No | | UW NCF: | $4,107,268 |
| Additional Debt Balance: | N/A | | Appraised Value / Per SF: | $60,450,000 / $61 |
| Additional Debt Type: | N/A | | Appraisal Date(6): | Various |
| | | | | |
| Escrows and Reserves(3) | | Financial Information |
| | Initial | Monthly | Initial Cap | | Cut-off Date Loan / SF: | $39 |
| Taxes: | $0 | Springing | N/A | | Maturity Date Loan / SF: | $39 |
| Insurance: | $0 | Springing | N/A | | Cut-off Date LTV: | 64.1% |
| Replacement Reserves: | $0 | Springing | N/A | | Maturity Date LTV: | 64.1% |
| TI / LC: | $0 | $0 | N/A | | UW NCF DSCR: | 1.68x |
| | | | | | UW NOI Debt Yield: | 11.5% |
| | | | | | | |
| Sources and Uses |
| Sources | Proceeds | % of Total | | Uses | Proceeds | % of Total |
| Mortgage Loan | $38,760,000 | 100.0% | | Sponsor Equity(1) | $38,007,067 | 98.1 | % |
| | | | | Closing Costs | 752,933 | 1.9 | |
| | | | | | | |
| Total Sources | $38,760,000 | 100.0% | | Total Uses | $38,760,000 | 100.0 | % |
| (1) | The borrower sponsors acquired the Sterling Portfolio Properties (as defined below) unencumbered for $59,035,000 as part of a sale-leaseback transaction on August 22, 2024. The Sterling Portfolio Mortgage Loan (as defined below) is being used to recapitalize the borrower sponsors. |
| (2) | The borrower sponsors are affiliates of the borrower sponsors under the Douglas Dynamics Portfolio Mortgage Loan, the Tropicale Foods Mortgage Loan and the Quantix Mortgage Loan, which are also being contributed to the BMO 2024-C10 securitization. |
| (3) | See “Escrows and Reserves” below for a further discussion of reserve requirements. |
| (4) | See the “Portfolio Summary” chart below. |
| (5) | Historical financial information is not available because the Sterling Portfolio Properties were recently acquired in a sale-leaseback transaction and leases were not previously in place. |
| (6) | Appraisal Dates are between August 19, 2024 and August 21, 2024. |
| THE INFORMATION IN THIS STRUCTURAL AND COLLATERAL TERM SHEET IS NOT COMPLETE AND MAY BE AMENDED PRIOR TO THE TIME OF SALE. THIS TERM SHEET IS NOT AN OFFER TO SELL THESE SECURITIES AND IT IS NOT A SOLICITATION OF AN OFFER TO BUY THESE SECURITIES IN ANY JURISDICTION WHERE THE OFFER OR SALE IS NOT PERMITTED. |
| | 108 | |
| Structural and Collateral Term Sheet | | BMO 2024-C10 |
| No. 7 – Sterling Portfolio |
The Loan. The seventh largest mortgage loan (the “Sterling Portfolio Mortgage Loan”) is secured by the borrower’s fee interest in three industrial manufacturing, warehouse and distribution properties totaling 991,022 square feet located in Illinois and Texas (the “Sterling Portfolio Properties”). The Sterling Portfolio Mortgage Loan has an outstanding principal balance as of the Cut-off Date of $38,760,000. The Sterling Portfolio Mortgage Loan was originated on September 27, 2024 by Citi Real Estate Funding Inc. and accrues interest at a fixed rate of 6.21000% per annum on an Actual/360 basis. The Sterling Portfolio Mortgage Loan has an initial term of ten years and is interest-only for the full term. The scheduled maturity date of the Sterling Portfolio Mortgage Loan is the payment date that occurs on October 6, 2034.
The Properties. The Sterling Portfolio Properties consist of a 596,566 square foot industrial manufacturing and warehouse property located at 501 East 151st Street in Phoenix, Illinois (the “Phoenix Property”), a 369,505 square foot industrial manufacturing and warehouse property located at 7309 US Highway 69 in Lufkin, Texas (the “Lufkin Property”), and a 24,951 square foot warehouse and distribution center located at 811-813 Richards Street in Joliet, Illinois (the “Joliet Property”). As of November 6, 2024, the Sterling Portfolio Properties were 100.0% leased to a single tenant, Sterling Lumber Parent, LLC (“Sterling”).
The following table presents certain information relating to the Sterling Portfolio Properties:
| Portfolio Summary |
| Property Name | City, State | Year Built / Renovated(1) | Subtype | Sq. Ft.(2) | Occupancy(2) | Allocated Cut-off Date Balance | % of Allocated Cut-off Date Balance | Appraised Value(1) | U/W NOI | % of U/W NOI |
| Phoenix | Phoenix, IL | 1956 / 2016 | Manufacturing / Warehouse | 596,566 | 100.0% | $25,965,000 | 67.0% | $40,300,000 | $2,982,689 | 67.1 | % |
| Lufkin | Lufkin, TX | 1975 / NAP | Manufacturing / Warehouse | 369,505 | 100.0% | 10,760,000 | 27.8% | 17,000,000 | 1,228,209 | 27.6 | |
| Joliet | Joliet, IL | 1958 / 2017 | Warehouse / Distribution | 24,951 | 100.0% | 2,035,000 | 5.3% | 3,150,000 | 235,490 | 5.3 | |
| Total | | | | 991,022 | 100.0% | $38,760,000 | 100.0% | $60,450,000 | $4,446,388 | 100.0 | % |
| (2) | Based on the underwritten rent rolls dated November 6, 2024. |
Phoenix
The Phoenix Property is comprised of an industrial manufacturing and warehouse building totaling 596,566 square feet located at 501 East 151st Street in Phoenix, Illinois, approximately 23.6 miles south of Chicago. The Phoenix Property was originally constructed in 1956 and renovated in 2016. The Phoenix Property is comprised of two buildings situated on an approximately 61.8-acre site. The Phoenix Property contains 25- to 30-foot clear heights, three dock-high loading doors and 40 drive-in doors.
Lufkin
The Lufkin Property is comprised of an industrial manufacturing and warehouse building totaling 369,505 square feet located at 7309 US Highway 69 in Lufkin, Texas. The Lufkin Property was originally constructed in 1975 and is located approximately 129.0 miles northwest of Houston, Texas and 183 miles southwest of Dallas, Texas. The Lufkin Property is comprised of two one-story buildings situated on an approximately 43.2-acre site and contains 24 to 39-foot clear heights, four dock-high loading doors and 33 drive-in doors.
Joliet
The Joliet Property is comprised of an industrial warehouse and distribution center totaling 24,951 square feet located at 811-813 Richards Street in Joliet, Illinois. The Joliet Property is located approximately 44.5 miles from Chicago and 26.8 miles from the Phoenix Property. The Joliet Property was originally constructed in 1958 and renovated in 2017. The Joliet Property is comprised of one two-story building and three one-story buildings situated on a 13.90-acre site and contains 14- to 22-foot clear heights with 10 drive-in doors.
Sole Tenant. The Sterling Portfolio Properties are 100.0% leased to Sterling pursuant to a single master lease. Founded in 1949, Sterling provides site access solutions to clients including in site access planning, right of way site preparation and restoration, temporary access road and pad construction, water crossing and air bridges, regulatory and environmental compliance and emergency work. Sterling has a team of over 500 employees and specializes in the production of cross-laminated timber (“CLT”) mats, which is an engineered hardwood mat used to form temporary roads, walkways and work
| THE INFORMATION IN THIS STRUCTURAL AND COLLATERAL TERM SHEET IS NOT COMPLETE AND MAY BE AMENDED PRIOR TO THE TIME OF SALE. THIS TERM SHEET IS NOT AN OFFER TO SELL THESE SECURITIES AND IT IS NOT A SOLICITATION OF AN OFFER TO BUY THESE SECURITIES IN ANY JURISDICTION WHERE THE OFFER OR SALE IS NOT PERMITTED. |
| | 109 | |
| Structural and Collateral Term Sheet | | BMO 2024-C10 |
| No. 7 – Sterling Portfolio |
platforms. Sterling is the largest manufacturer of CLT mats in the United States having produced over 800,000 CLT panels. Both the Phoenix Property and Lufkin Property have the capacity to produce 1,000 of Sterling’s TerraLam branded CLT panels per day. Sterling has a current lease term at the Sterling Portfolio Properties through August 2044 with two, ten-year renewal options and no termination options.
The following table presents certain information relating to the historical and current occupancy of the Sterling Portfolio Properties:
| Historical and Current Occupancy(1) |
| 2021 | 2022 | 2023 | Current(2) |
| NAV | NAV | NAV | 100.0% |
| (1) | Historical Occupancy is not available because the borrower acquired the Sterling Portfolio Properties via a sale leaseback transaction and no leases were previously in place. |
| (2) | Based on the underwritten rent rolls dated November 6, 2024. |
The following table presents certain information relating to the sole tenant at the Sterling Portfolio Properties:
| Tenant Summary(1) |
Tenant | Credit Rating (Moody’s/
S&P/Fitch) | Net Rentable Area (SF) | % of Net Rentable Area | U/W
Base Rent | U/W Base Rent
Per SF | % of Total U/W Base Rent | Lease Expiration | Termination Option (Y/N) | Renewal Option |
| Sterling | NR/NR/NR | 991,022 | 100.0 | % | $4,785,848 | $4.83 | 100.0% | 8/31/2044 | N | 2 x 10 Yr |
| Total Occupied | | 991,022 | 100.0 | % | $4,785,848 | $4.83 | 100.0% | | | |
| Vacant | | 0 | 0.0 | | | | | | | |
| Total | | 991,022 | 100.0 | % | | | | | | |
| (1) | Based on the underwritten rent rolls dated November 6, 2024, inclusive of contractual rent steps of $128,088 through September 1, 2025. |
| THE INFORMATION IN THIS STRUCTURAL AND COLLATERAL TERM SHEET IS NOT COMPLETE AND MAY BE AMENDED PRIOR TO THE TIME OF SALE. THIS TERM SHEET IS NOT AN OFFER TO SELL THESE SECURITIES AND IT IS NOT A SOLICITATION OF AN OFFER TO BUY THESE SECURITIES IN ANY JURISDICTION WHERE THE OFFER OR SALE IS NOT PERMITTED. |
| | 110 | |
| Structural and Collateral Term Sheet | | BMO 2024-C10 |
| No. 7 – Sterling Portfolio |
The following table presents certain information relating to the sole tenant’s lease expiration at the Sterling Portfolio Properties:
| Lease Rollover Schedule(1) |
| Year | Number of Leases Expiring | Net Rentable Area Expiring | % of NRA Expiring | UW Base Rent Expiring | % of UW Base Rent Expiring | Cumulative Net Rentable Area Expiring | Cumulative % of NRA Expiring | Cumulative UW Base Rent Expiring | Cumulative % of UW Base Rent Expiring |
| Vacant | NAP | 0 | 0.0% | NAP | NAP | 0 | 0.0% | NAP | NAP |
| 2024 & MTM | 0 | 0 | 0.0% | $0 | 0.0% | 0 | 0.0% | $0 | 0.0% |
| 2025 | 0 | 0 | 0.0% | 0 | 0.0% | 0 | 0.0% | $0 | 0.0% |
| 2026 | 0 | 0 | 0.0% | 0 | 0.0% | 0 | 0.0% | $0 | 0.0% |
| 2027 | 0 | 0 | 0.0% | 0 | 0.0% | 0 | 0.0% | $0 | 0.0% |
| 2028 | 0 | 0 | 0.0% | 0 | 0.0% | 0 | 0.0% | $0 | 0.0% |
| 2029 | 0 | 0 | 0.0% | 0 | 0.0% | 0 | 0.0% | $0 | 0.0% |
| 2030 | 0 | 0 | 0.0% | 0 | 0.0% | 0 | 0.0% | $0 | 0.0% |
| 2031 | 0 | 0 | 0.0% | 0 | 0.0% | 0 | 0.0% | $0 | 0.0% |
| 2032 | 0 | 0 | 0.0% | 0 | 0.0% | 0 | 0.0% | $0 | 0.0% |
| 2033 | 0 | 0 | 0.0% | 0 | 0.0% | 0 | 0.0% | $0 | 0.0% |
| 2034 | 0 | 0 | 0.0% | 0 | 0.0% | 0 | 0.0% | $0 | 0.0% |
| 2035 & Beyond | 1 | 991,022 | 100.0% | 4,785,848 | 100.0% | 991,022 | 100.0% | $4,785,848 | 100.0% |
| Total | 1 | 991,022 | 100.0% | $4,785,848 | 100.0% | | | | |
| (1) | Based on the underwritten rent rolls dated November 6, 2024, inclusive of contractual rent steps of $128,088 through September 1, 2025. |
| THE INFORMATION IN THIS STRUCTURAL AND COLLATERAL TERM SHEET IS NOT COMPLETE AND MAY BE AMENDED PRIOR TO THE TIME OF SALE. THIS TERM SHEET IS NOT AN OFFER TO SELL THESE SECURITIES AND IT IS NOT A SOLICITATION OF AN OFFER TO BUY THESE SECURITIES IN ANY JURISDICTION WHERE THE OFFER OR SALE IS NOT PERMITTED. |
| | 111 | |
| Structural and Collateral Term Sheet | | BMO 2024-C10 |
| No. 7 – Sterling Portfolio |
The following table presents certain information relating to underwritten net cash flow at the Sterling Portfolio Properties:
| Underwritten Net Cash Flow(1)(2) |
| | Underwritten | Per Square Foot | %(3) |
| Base Rent | $4,657,760 | | $4.70 | | 68.6 | % |
| Contractual Rent Steps | 128,088 | | 0.13 | | 1.9 | |
| Gross Potential Rent | $4,785,848 | | $4.83 | | 70.5 | % |
| Total Reimbursements | 2,003,355 | | 2.02 | | 29.5 | |
| Total Gross Income | $6,789,204 | | $6.85 | | 100.0 | % |
| (Vacancy / Credit Loss) | (339,460) | | (0.34) | | (5.0 | ) |
| Effective Gross Income | $6,449,744 | | $6.51 | | 95.0 | % |
| Management Fee | 193,492 | | 0.20 | | 3.0 | |
| Real Estate Taxes | 696,067 | | 0.70 | | 10.8 | |
| Insurance | 277,981 | | 0.28 | | 4.3 | |
| Other Expenses(4) | 835,815 | | 0.84 | | 13.0 | |
| Total Expenses | $2,003,355 | | $2.02 | | 31.1 | % |
| Net Operating Income | $4,446,388 | | $4.49 | | 68.9 | % |
| Capital Expenditures | 145,638 | | 0.15 | | 2.3 | |
| TI/LC | 193,482 | | 0.20 | | 3.0 | |
| Net Cash Flow | $4,107,268 | | $4.14 | | 63.7 | % |
| (1) | Based on the underwritten rent rolls dated as of November 6, 2024, inclusive of contractual rent steps of $128,088 through September 1, 2025. |
| (2) | Historical financial information is not available because the Sterling Portfolio Properties were recently acquired in a sale-leaseback transaction and leases were not previously in place. |
| (3) | % column represents percent of Total Gross Income for all revenue lines and represents percent of Effective Gross Income for the remainder of fields. |
| (4) | Other Expenses includes repairs and maintenance, utilities and general and administrative expenses. |
Appraisals. According to the appraisals, dated between August 19, 2024 and August 21, 2024, the Sterling Portfolio Properties had an aggregate “as-is” appraised value of $60,450,000 and an aggregate hypothetical market value “as dark” of $46,100,000 as of August 19, 2024 to August 21, 2024. The table below shows the appraisal’s “as-is” conclusions. Based on the “as dark” value of $46,100,000, the Cut-off Date LTV and Maturity Date LTV for the Sterling Portfolio Mortgage Loan are each 84.1%.
| Sterling Portfolio(1) |
| Property | Value | Capitalization Rate |
| Phoenix | $40,300,000 | 7.75% |
| Lufkin | $17,000,000 | 7.75% |
| Joliet | $3,150,000 | 7.75% |
| Total / Wtd. Avg(2) | $60,450,000 | 7.75% |
| (2) | Total / Wtd. Avg is based on the appraised value of each Sterling Portfolio property. |
Environmental. According to the Phase I environmental reports dated September 11, 2024, with respect to (i) the Lufkin Property, a REC was identified relating to impacts to soil and groundwater caused by manufacturing operations historically conducted onsite and (ii) the Phoenix Property, a controlled REC was identified relating to prior industrial use and the former operation of several underground storage tanks. See “Description of the Mortgage Pool – Statistical Characteristics of the Mortgage Loans – Environmental Considerations” in the Preliminary Prospectus.
| THE INFORMATION IN THIS STRUCTURAL AND COLLATERAL TERM SHEET IS NOT COMPLETE AND MAY BE AMENDED PRIOR TO THE TIME OF SALE. THIS TERM SHEET IS NOT AN OFFER TO SELL THESE SECURITIES AND IT IS NOT A SOLICITATION OF AN OFFER TO BUY THESE SECURITIES IN ANY JURISDICTION WHERE THE OFFER OR SALE IS NOT PERMITTED. |
| | 112 | |
| Structural and Collateral Term Sheet | | BMO 2024-C10 |
| No. 7 – Sterling Portfolio |
The Markets. The Sterling Portfolio Properties are located in Illinois (two properties, 62.7% of net rentable area and 72.2% of underwritten rent) and Texas (one property, 37.3% of net rentable area and 27.8% of underwritten rent). According to the appraisals, the Sterling Portfolio Properties are located in three separate submarkets with weighted average submarket rent of $7.58 per square foot and vacancy of 4.5%.
The following table presents certain market information with respect to the Sterling Portfolio Properties:
| Market Analysis(1) |
| Property Name / Address | Market | Submarket | Submarket Inventory | Submarket Vacancy | Submarket Rent (PSF) | UW Base Rent PSF(2) |
Phoenix 501 East 151st Street Phoenix, IL 60426 | Chicago | Near South Cook | 50,162,490 | 4.6% | $7.63 | $5.37 |
Lufkin 7309 US Highway 69 Lufkin, TX 75901 | Houston | 40 Mile Radius | 6,936,054 | 3.5% | $6.95 | $3.60 |
Joliet 811-813 Richards Street Joliet, IL 60433 | Chicago | Joliet Area | 110,767,385 | 7.9% | $10.29 | $10.07 |
| Total / Wtd. Avg. (based on UW NOI) | | | 167,865,929 | 4.5% | $7.58 | $5.13 |
| (2) | Based on the underwritten rent rolls dated as of November 6, 2024, inclusive of contractual rent steps of $128,088 through September 1, 2025. |
The following table presents certain demographic information with respect to the Sterling Portfolio Properties:
| Demographic Summary(1) |
| | | Population(2) | Median Household Income(2) |
| Property Name | Location | 1-Mile | 3-Mile | 5-Mile | 1-Mile | 3-Mile | 5-Mile |
| Phoenix | Phoenix, IL | 11,328 | 86,271 | 239,318 | $47,798 | $51,685 | $57,291 |
| Lufkin | Lufkin, TX | 432 | 4,126 | 12,747 | $75,000 | $65,633 | $61,517 |
| Joliet | Joliet, IL | 7,851 | 65,724 | 125,707 | $50,269 | $57,264 | $66,152 |
| Wtd. Avg. (based on UW NOI)(2) | | 8,134 | 62,492 | 170,716 | $55,443 | $55,833 | $58,928 |
| (2) | Population and Median Household Income data are from 2024. |
The following table presents certain information relating to the appraisal’s market rent conclusion with respect to the Sterling Portfolio Properties:
| Market Lease Terms(1) |
| Property Name | Submarket Rent (PSF) | Lease Term (Years) | Concessions (New/Renewal) | Lease Type (Reimbursements) | Rent Increase Projections | Tenant Improvements (New Tenants) (PSF) | Tenant Improvements (Renewals) (PSF) |
| Phoenix | $7.63 | 10 | 2 mos. / 1 mos. | NNN | 3.0% | $2.00 | $1.00 |
| Lufkin | $6.95 | 5 | 0 mos. / 0 mos. | NNN | 3.0% | $0.30 | $0.15 |
| Joliet | $10.29 | 7 | 2 mos. / 1 mos. | NNN | 3.0% | $2.00 | $1.00 |
The Borrower. The borrower is AGNL Timber, L.P., a Delaware limited partnership and single purpose entity having at least one independent director in its organizational structure. Legal counsel to the borrower delivered a non-consolidation opinion in connection with the origination of the Sterling Portfolio Mortgage Loan.
The Borrower Sponsors. The borrower sponsors are Angelo, Gordon & Co., L.P. and TPG, Inc. and the non-recourse carveout guarantors are AG Net Lease Realty Fund V REIT LLC and AG Net Lease Realty Fund V Investments (H-1), L.P., severally (but not jointly). Angelo Gordon is a privately-held registered investment advisor dedicated to alternative investing. The firm was founded in 1988 and as of December 31, 2023, had approximately $78 billion of assets under management. Angelo Gordon has experience in a broad range of absolute return strategies for both institutional and high net worth investors. Angelo Gordon began investing in commercial real estate in 1993 and has acquired over $45 billion of real estate assets across the globe.
| THE INFORMATION IN THIS STRUCTURAL AND COLLATERAL TERM SHEET IS NOT COMPLETE AND MAY BE AMENDED PRIOR TO THE TIME OF SALE. THIS TERM SHEET IS NOT AN OFFER TO SELL THESE SECURITIES AND IT IS NOT A SOLICITATION OF AN OFFER TO BUY THESE SECURITIES IN ANY JURISDICTION WHERE THE OFFER OR SALE IS NOT PERMITTED. |
| | 113 | |
| Structural and Collateral Term Sheet | | BMO 2024-C10 |
| No. 7 – Sterling Portfolio |
Property Management. The Sterling Portfolio Properties are currently self-managed.
Escrows and Reserves. At origination of the Sterling Portfolio Mortgage Loan, the borrower was not required to fund any initial reserves.
Immediate Repairs – The borrower is not obligated to fund an immediate repairs reserve provided that the repairs are the responsibility of the Specified Tenant (as defined below) and are being completed by Specified Tenant. However, pursuant to the lease with Specified Tenant and an escrow agreement among Specified Tenant, the borrower and First American Title Insurance Company (“FATIC”), as escrow agent, $233,800 (the “Immediate Repair Holdback Funds”) was held back from the purchase price of the Sterling Portfolio Properties in the sale/leaseback transaction for the Sterling Portfolio Properties, to cover the cost of immediate repairs that Sterling is required to either complete or arrange for the completion of pursuant to its lease. After completion of the immediate repairs and satisfaction by Sterling of the requirements for release of the Immediate Repair Holdback Funds, the borrower (as landlord) is required to notify FATIC and Sterling that the requirements have been met and direct FATIC to deliver the Immediate Repair Holdback Funds to Sterling.
Tax Escrows – On a monthly basis during a Tax Trigger Period (as defined below), the borrower is required to deposit 1/12th of the property taxes that the lender estimates will be payable over the next-ensuing 12-month period.
Insurance Escrows – On a monthly basis during an Insurance Trigger Period (as defined below), if the liability or casualty policy maintained by the borrower covering the Sterling Portfolio Properties or any portion thereof does not constitute an approved blanket or umbrella policy, or if the lender requires the borrower to obtain a separate insurance policy, the borrower is required to deposit 1/12th of the amount which would be sufficient to pay the insurance premiums due for the renewal of coverage afforded by such policies.
Replacement Reserves – On a monthly basis during a Replacement Reserve Trigger Period (as defined below), the borrower is required to escrow approximately $12,136 for replacement reserves.
“Tax Trigger Period” means each monthly payment date during any period when (i) a Trigger Period (as defined below) is then continuing and (ii) neither the borrower nor the Specified Tenant has timely paid the taxes directly to the appropriate taxing authority.
“Insurance Trigger Period” means any period when (i) a Trigger Period is then continuing and (ii) neither the borrower nor the Specified Tenant has timely paid the insurance premiums due on the insurance policies required under the Sterling Portfolio Mortgage Loan documents to the issuer of such insurance policies.
“Replacement Reserve Trigger Period” means each monthly payment date during any period when: (i) a Trigger Period is then continuing and (ii) neither the borrower nor the Specified Tenant (as defined below) has diligently made the required replacements and/or alterations to the Sterling Portfolio Properties.
Letters of Credit. The borrower may, at its option, provide a letter of credit meeting the requirements of the Sterling Portfolio Mortgage Loan documents in lieu of making any required deposit to a reserve.
Lockbox / Cash Management. The Sterling Portfolio Mortgage Loan is structured with a hard lockbox and springing cash management. The borrower is required to deliver a notice to all tenants directing them to remit all payments under the leases directly to the lender-controlled lockbox. The borrower is required to cause revenue received by the borrower (and if the Sterling Portfolio Properties are managed by a third party, the property manager) from the Sterling Portfolio Properties to be immediately deposited into such lockbox. All funds deposited into the lockbox are required to be transferred on each business day to or at the direction of the borrower unless a Trigger Period exists. Upon the occurrence and during the continuance of a Trigger Period, at the lender’s election, all funds in the lockbox account are required to be swept on each business day to a cash management account under the control of the lender to be applied and disbursed in accordance with the Sterling Portfolio Mortgage Loan documents, and all excess cash flow funds remaining in the cash management account after the application of such funds in accordance with the Sterling Portfolio Mortgage Loan documents are required to be held by the lender in an excess cash flow reserve account and as additional collateral for the Sterling Portfolio Mortgage Loan; provided that if the Excess Cash Flow Cap Conditions (as defined below) are satisfied in full at any time that the borrower is obligated to make deposits into the excess cash flow reserve account, such deposits will be subject to
| THE INFORMATION IN THIS STRUCTURAL AND COLLATERAL TERM SHEET IS NOT COMPLETE AND MAY BE AMENDED PRIOR TO THE TIME OF SALE. THIS TERM SHEET IS NOT AN OFFER TO SELL THESE SECURITIES AND IT IS NOT A SOLICITATION OF AN OFFER TO BUY THESE SECURITIES IN ANY JURISDICTION WHERE THE OFFER OR SALE IS NOT PERMITTED. |
| | 114 | |
| Structural and Collateral Term Sheet | | BMO 2024-C10 |
| No. 7 – Sterling Portfolio |
the Excess Cash Flow Cap (as defined below). Upon the cure of the applicable Trigger Period, so long as no other Trigger Period exists, the lender is required to return any amounts remaining on deposit in the excess cash flow reserve account to the borrower. Upon an event of default under the Sterling Portfolio Mortgage Loan documents, the lender may apply funds to the Sterling Portfolio Mortgage Loan in such order, priority and proportions as the lender deems proper.
“Trigger Period” means a period (A) commencing upon the earliest of (i) the occurrence and continuance of an event of default under the Sterling Portfolio Mortgage Loan documents, (ii) the occurrence of a DSCR Event (as defined below) or (iii) the occurrence of a Specified Tenant Trigger Period (as defined below), and (B) expiring upon (x) with regard to clause (i) above, the cure (if applicable) of such event of default under the Sterling Portfolio Mortgage Loan documents, (y) with regard to clause (ii) above, the date that the debt service coverage ratio is equal to or greater than 1.20x for two consecutive calendar quarters; provided that if the DSCR Event occurs solely because of the events described in clause (A)(i) or (A)(iii) of the definition of Specified Tenant Trigger Period below and the borrower cures the same by depositing additional cash collateral or a letter of credit into the excess cash flow account, any such amounts will be included in calculating whether a DSCR Event occurred, and (z) with regard to clause (A)(iii) above, the satisfaction of the Specified Tenant Cure Conditions (as defined below).
“Specified Tenant Trigger Period” means a period (A) commencing upon the first to occur of (i) an event of default by the Specified Tenant under the Specified Tenant lease arising directly as result of the Specified Tenant’s failure to be in actual, physical possession of, or abandoning, the Specified Tenant space (or applicable portion thereof), (ii) any termination or cancellation of the Specified Tenant lease (including, without limitation, rejection in any bankruptcy or similar insolvency proceeding) or (iii) any bankruptcy or similar insolvency of the Specified Tenant, and (B) expiring upon the lender’s receipt of evidence reasonably acceptable to the lender (which such evidence includes, without limitation, a duly executed estoppel certificate from the Specified Tenant in form and substance acceptable to the lender) of the satisfaction of the applicable Specified Tenant Cure Conditions (as defined below).
“Specified Tenant Cure Conditions” means (A) with respect to clause (A)(i) of the definition of Specified Tenant Trigger Period, the lender’s receipt of satisfactory evidence that any event of default by the Specified Tenant under the Specified Tenant lease arising directly as a result of the Specified Tenant’s failure to be in actual, physical possession of, or abandoning the Specified Tenant space (or applicable portion thereof) has been cured, or, in the event that the Excess Cash Flow Cap Conditions are satisfied in full, the earlier date that the amount on deposit in the excess cash flow account is equal to the Excess Cash Flow Cap (as defined below), and the borrower may deposit additional cash or deliver a letter of credit to the lender in an amount sufficient to satisfy the Excess Cash Flow Cap, (B) with respect to clause (A)(ii) of the definition of Specified Tenant Trigger Period, the date the Specified Tenant space has been re-leased pursuant to one or more replacement leases approved by the lender in accordance with the Sterling Portfolio Mortgage Loan documents and the tenant(s) thereunder are in actual physical occupancy of the Specified Tenant space and paying full unabated rent, and (C) with respect to clause (A)(iii) of the definition of Specified Tenant Trigger Period, the earliest to occur of: (i) the date that the Specified Tenant is no longer insolvent or subject to any bankruptcy or insolvency proceedings and has affirmed the Specified Tenant lease pursuant to a final, non-appealable order of a court of competent jurisdiction, (ii) if the Specified Tenant lease is assumed or assigned to a new entity in connection with such proceedings, the date the bankruptcy court has issued a final order approving the Specified Tenant’s reorganization plan, (iii) if the Specified Tenant lease is rejected or otherwise terminated due to any bankruptcy or insolvency proceedings, the date the Specified Tenant space has been re-leased pursuant to one or more replacement leases approved by the lender in accordance with the Sterling Portfolio Mortgage Loan documents and the tenants thereunder are in actual physical occupancy of the Specified Tenant space and paying full unabated rent, or (iv) if the Excess Cash Flow Cap Conditions are satisfied in full, the date that the amount in the excess cash flow account is equal to the Excess Cash Flow Cap, and the borrower may deposit additional cash or deliver a letter of credit to the lender in an amount sufficient to satisfy the Excess Cash Flow Cap.
“Excess Cash Flow Cap Conditions” means (a) a Trigger Period exists solely as a result of a Specified Tenant Trigger Period, (b) no other Trigger Period has occurred and is continuing, and (c) as of the applicable date of determination, the maturity date of the Sterling Portfolio Mortgage Loan is scheduled to occur in no earlier than two years.
“Excess Cash Flow Cap” means an amount equal to 18 months of base rent payable under the Specified Tenant lease.
“DSCR Event” means that the debt service coverage ratio is less than 1.20x for two consecutive calendar quarters.
| THE INFORMATION IN THIS STRUCTURAL AND COLLATERAL TERM SHEET IS NOT COMPLETE AND MAY BE AMENDED PRIOR TO THE TIME OF SALE. THIS TERM SHEET IS NOT AN OFFER TO SELL THESE SECURITIES AND IT IS NOT A SOLICITATION OF AN OFFER TO BUY THESE SECURITIES IN ANY JURISDICTION WHERE THE OFFER OR SALE IS NOT PERMITTED. |
| | 115 | |
| Structural and Collateral Term Sheet | | BMO 2024-C10 |
| No. 7 – Sterling Portfolio |
“Specified Tenant” means, as applicable, (a) Sterling Lumber Parent LLC, as tenant under the Specified Tenant lease, together with its successors and permitted assigns, (b) Sterling Lumber Intermediate Holdings, LLC, as guarantor under the Specified Tenant lease, together with its successors and permitted assigns, or (c) any replacement of the foregoing in accordance with the Sterling Portfolio Mortgage Loan documents.
Subordinate and Mezzanine Debt. None.
Permitted Future Mezzanine or Subordinate Debt. Provided that no event of default is continuing under the Sterling Portfolio Mortgage Loan documents, the borrower has the right to incur a future mezzanine loan at any time from and after the date that is two years after the closing date of the BMO 2024-C10 securitization, subject to the satisfaction of the requirements set forth in the Sterling Portfolio Mortgage Loan documents, which include, but are not limited to: (i) if such mezzanine debt has a floating interest rate, the mezzanine borrower must purchase an interest rate cap agreement (“IRCA”) from a counterparty reasonably acceptable to the lender with a notional amount not less than the outstanding balance of the mezzanine debt, (ii) the aggregate loan-to-value ratio based on the Sterling Portfolio Mortgage Loan and the mezzanine loan is no greater than 65.0%; (iii) the actual combined debt service coverage ratio based on the Sterling Portfolio Mortgage Loan and the mezzanine loan is equal to or greater than 1.68x (and if the mezzanine loan has a floating interest rate, the debt service coverage ratio calculation must assume that the floating rate index at all times equals the greater of the strike price under the IRCA and the then current floating rate index); (iv) the actual combined net cash flow debt yield based on the Sterling Portfolio Mortgage Loan and the mezzanine loan is equal to or greater than 10.6%; (v) the execution of an intercreditor agreement satisfactory to the lender in its reasonable discretion; (vi) if required by the lender, receipt of a rating agency confirmation; and (vii) the maturity of the mezzanine loan is coterminous with, or longer than, the maturity date of the Sterling Portfolio Mortgage Loan.
Partial Release. Provided that no event of default has occurred and is continuing under the Sterling Portfolio Mortgage Loan documents (other than an event of default that would be cured by or in connection with the partial release), the borrower may, at any time after the date that is two years after the closing date of the BMO 2024-C10 securitization, obtain the release of the Joliet Property from the lien of the Sterling Portfolio Mortgage Loan documents, subject to the satisfaction of certain conditions, including, but not limited to, (i) partial prepayment or partial defeasance, as applicable, of the Sterling Portfolio Mortgage Loan in an amount equal to 110% of the allocated loan amount attributable to the Joliet Property together with any applicable interest shortfall and, in the case of a partial prepayment, a prepayment fee (the “Prepayment Fee”) equal to the greater of 1.0% of the amount prepaid and a yield maintenance premium (to the extent such prepayment occurs prior to the monthly payment date occurring six months prior to the maturity date), (ii) after giving effect to such release, the debt service coverage ratio with respect to the remaining Sterling Portfolio Properties is greater than the greater of (1) the debt service coverage ratio of all individual Sterling Portfolio Properties prior to the partial release and (2) 1.68x, (iii) after giving effect to the partial release, the debt yield of the remaining Sterling Portfolio Properties is greater than the greater of (1) the debt yield of all Sterling Portfolio Properties prior to the partial release and (2) 10.60%, (iv) after giving effect to the partial release, the loan-to-value ratio of the remaining Sterling Portfolio Properties is no greater than the lesser of (1) the loan-to-value ratio of all individual Sterling Portfolio Properties prior to the partial release and (2) 65.0%, and (v) compliance with certain REMIC related provisions.
Ground Lease. None.
| THE INFORMATION IN THIS STRUCTURAL AND COLLATERAL TERM SHEET IS NOT COMPLETE AND MAY BE AMENDED PRIOR TO THE TIME OF SALE. THIS TERM SHEET IS NOT AN OFFER TO SELL THESE SECURITIES AND IT IS NOT A SOLICITATION OF AN OFFER TO BUY THESE SECURITIES IN ANY JURISDICTION WHERE THE OFFER OR SALE IS NOT PERMITTED. |
| | 116 | |
| Structural and Collateral Term Sheet | | BMO 2024-C10 |
| No. 8 – Creekside Town Center |
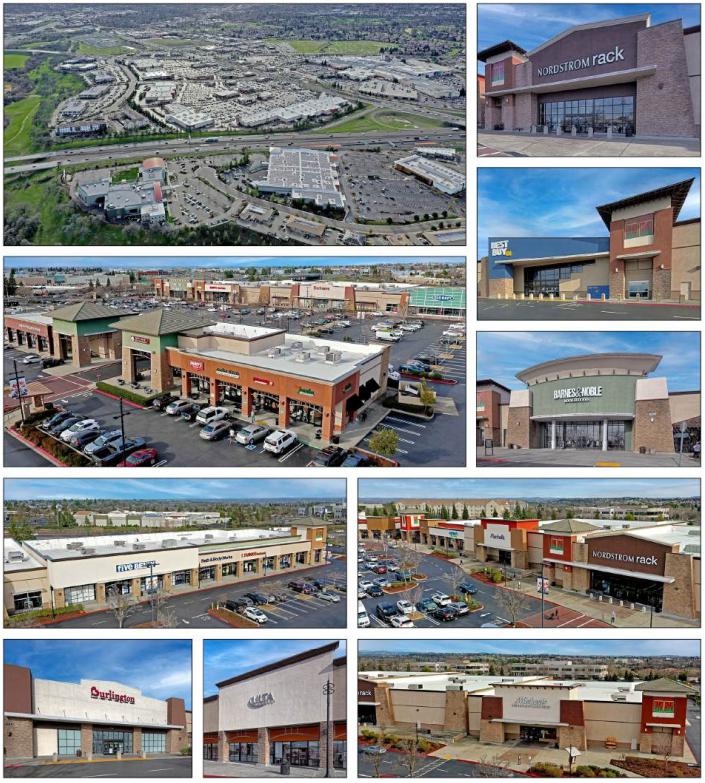
| THE INFORMATION IN THIS STRUCTURAL AND COLLATERAL TERM SHEET IS NOT COMPLETE AND MAY BE AMENDED PRIOR TO THE TIME OF SALE. THIS TERM SHEET IS NOT AN OFFER TO SELL THESE SECURITIES AND IT IS NOT A SOLICITATION OF AN OFFER TO BUY THESE SECURITIES IN ANY JURISDICTION WHERE THE OFFER OR SALE IS NOT PERMITTED. |
| | 117 | |
| Structural and Collateral Term Sheet | | BMO 2024-C10 |
| No. 8 – Creekside Town Center |
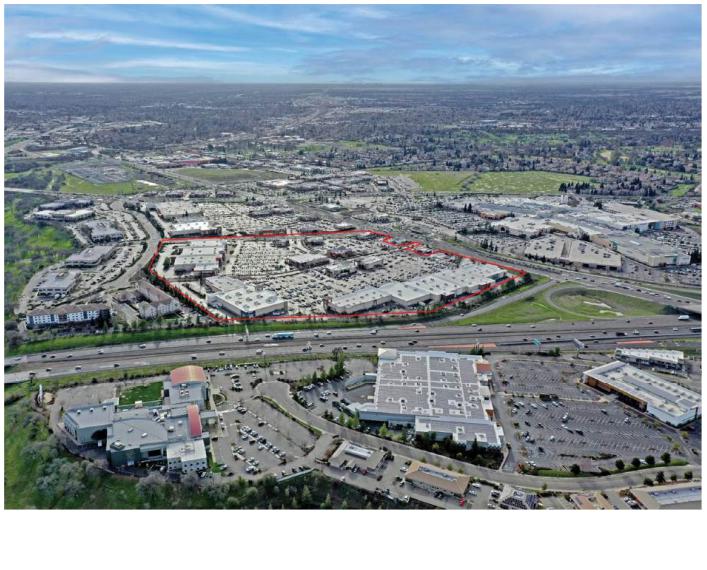
| THE INFORMATION IN THIS STRUCTURAL AND COLLATERAL TERM SHEET IS NOT COMPLETE AND MAY BE AMENDED PRIOR TO THE TIME OF SALE. THIS TERM SHEET IS NOT AN OFFER TO SELL THESE SECURITIES AND IT IS NOT A SOLICITATION OF AN OFFER TO BUY THESE SECURITIES IN ANY JURISDICTION WHERE THE OFFER OR SALE IS NOT PERMITTED. |
| | 118 | |
| Structural and Collateral Term Sheet | | BMO 2024-C10 |
| No. 8 – Creekside Town Center |
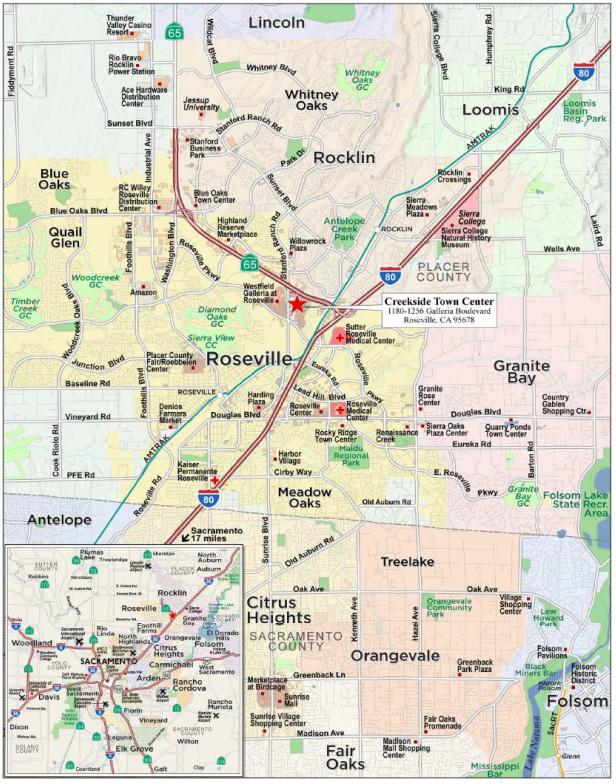
| THE INFORMATION IN THIS STRUCTURAL AND COLLATERAL TERM SHEET IS NOT COMPLETE AND MAY BE AMENDED PRIOR TO THE TIME OF SALE. THIS TERM SHEET IS NOT AN OFFER TO SELL THESE SECURITIES AND IT IS NOT A SOLICITATION OF AN OFFER TO BUY THESE SECURITIES IN ANY JURISDICTION WHERE THE OFFER OR SALE IS NOT PERMITTED. |
| | 119 | |
| Structural and Collateral Term Sheet | | BMO 2024-C10 |
| No. 8 – Creekside Town Center |
| Mortgage Loan Information | | Property Information |
| Mortgage Loan Seller: | 3650 REIT | | Single Asset / Portfolio: | Single Asset |
| Original Principal Balance(1): | $36,525,000 | | Title: | Fee |
| Cut-off Date Principal Balance(1): | $36,525,000 | | Property Type – Subtype: | Retail – Anchored |
| % of IPB: | 5.0% | | Net Rentable Area (SF): | 360,891 |
| Loan Purpose: | Acquisition | | Location: | Roseville, CA |
| Borrower: | Mt. Pleasant Realty, LLC | | Year Built / Renovated: | 1999-2001 / NAP |
| Borrower Sponsors: | Cane Living Trust Dated February 17, 1981 and The Ronald and Mary Ellen Cane 1996 Irrevocable Trust | | Occupancy: | 95.6% |
| Interest Rate: | 7.28000% | | Occupancy Date: | 7/31/2024 |
| Note Date: | 9/28/2023 | | 4th Most Recent NOI (As of): | $6,294,826 (12/31/2020) |
| Maturity Date: | 10/5/2033 | | 3rd Most Recent NOI (As of): | $6,882,688 (12/31/2021) |
| Interest-only Period: | 120 months | | 2nd Most Recent NOI (As of): | $7,214,525 (12/31/2022) |
| Original Term: | 120 months | | Most Recent NOI (As of): | $8,076,341 (8/31/2024 TTM) |
| Original Amortization Term: | None | | UW Economic Occupancy: | 95.3% |
| Amortization Type: | Interest Only | | UW Revenues: | $10,764,587 |
| Call Protection: | L(37),D(78),O(5) | | UW Expenses: | $2,658,944 |
| Lockbox / Cash Management: | Springing / Springing | | UW NOI: | $8,105,643 |
| Additional Debt(1): | Yes | | UW NCF: | $8,030,841 |
| Additional Debt Balance(1): | $35,000,000 | | Appraised Value / Per SF: | $125,600,000 / $348 |
| Additional Debt Type(1): | Pari Passu | | Appraisal Date: | 8/25/2023 |
| | | | | |
| Escrows and Reserves(2) | | Financial Information(1) |
| | Initial | Monthly | Cap | | Cut-off Date Loan / SF: | $198 |
| Taxes: | $104,378 | $104,378 | N/A | | Maturity Date Loan / SF: | $198 |
| Insurance: | $20,555 | $20,555 | N/A | | Cut-off Date LTV: | 56.9% |
| Replacement Reserves: | $0 | $0 | N/A | | Maturity Date LTV: | 56.9% |
| TI / LC Reserve(3): | $2,500,000 | Springing | $1,500,000 | | UW NCF DSCR: | 1.52x |
| Other Reserve(4): | $185,505 | Springing | N/A | | UW NOI Debt Yield: | 11.3% |
| | | | | | | |
| Sources and Uses |
| Sources | Proceeds | % of Total | | Uses | Proceeds | % of Total |
| Whole Loan | $71,525,000 | 55.1 | % | | Purchase Price | $125,500,000 | 96.6 | % |
| Borrower Sponsor Equity | 58,342,802 | 44.9 | % | | Upfront Reserves | 2,810,438 | 2.2 | |
| | | % | | Closing Costs | 1,557,364 | 1.2 | % |
| Total Sources | $129,867,802 | 100.0 | % | | Total Uses | $129,867,802 | 100.0 | % |
| (1) | The Creekside Town Center Mortgage Loan (as defined below) is part of a whole loan evidenced by six pari passu notes with an aggregate original principal balance of $71,525,000. Financial Information in the chart above reflects the Creekside Town Center Whole Loan (as defined below). For additional information, see “The Loan” below. |
| (2) | Please see “Escrows and Reserves” below for further discussion of reserve information. |
| (3) | On each monthly payment date, the borrower is required to deposit $22,556 subject to a cap of $1,500,000; provided, however, that upon such time as the balance of the funds in the rollover reserve account is greater than or equal to $1,500,000, the borrower is not required to make monthly rollover reserve payments. |
| (4) | Other reserves consist of an initial outstanding TI/LC Reserve of approximately $185,505 and a springing DSCR Trigger Reserve. |
The Loan. The eighth largest mortgage loan (the “Creekside Town Center Mortgage Loan”) is part of a fixed rate whole loan (the “Creekside Town Center Whole Loan”) secured by the borrower’s fee interest in a 360,891 square foot, anchored retail property located in Roseville, California (the “Creekside Town Center Property”). The Creekside Town Center Whole Loan is evidenced by six pari passu promissory notes in the aggregate original principal amount of $71,525,000 and accrues interest at a fixed rate of 7.28000% per annum on an Actual/360 basis. The Creekside Town Center Whole Loan was originated on September 28, 2023 by 3650 Real Estate Investment Trust 2 LLC (“3650 REIT”). The Creekside Town Center Whole Loan has a 10-year term and is interest only for the entire term. The scheduled maturity date of the Creekside Town Center Whole Loan is October 5, 2033. The Creekside Town Center Mortgage Loan is evidenced by the controlling Note A-1 and non-controlling Notes A-2, A-3 and A-4 with an aggregate outstanding principal balance as of the Cut-off Date of $36,525,000. The Creekside Town Center Whole Loan will be serviced pursuant to the pooling and servicing agreement for
| THE INFORMATION IN THIS STRUCTURAL AND COLLATERAL TERM SHEET IS NOT COMPLETE AND MAY BE AMENDED PRIOR TO THE TIME OF SALE. THIS TERM SHEET IS NOT AN OFFER TO SELL THESE SECURITIES AND IT IS NOT A SOLICITATION OF AN OFFER TO BUY THESE SECURITIES IN ANY JURISDICTION WHERE THE OFFER OR SALE IS NOT PERMITTED. |
| | 120 | |
| Structural and Collateral Term Sheet | | BMO 2024-C10 |
| No. 8 – Creekside Town Center |
the BMO 2024-C10 trust. The relationship between the holders of the Creekside Town Center Whole Loan is governed by a co-lender agreement. See “Description of the Mortgage Pool—The Whole Loans—The Serviced Pari Passu Whole Loans” and “The Pooling and Servicing Agreement” in the Preliminary Prospectus.
The table below identifies the promissory notes that comprise the Creekside Town Center Whole Loan:
| Whole Loan Summary |
| Note | Original Balance | Cut-off Date Balance | Note Holder | Controlling Piece |
| A-1 | $15,525,000 | | $15,525,000 | | BMO 2024-C10 | Yes |
| A-2 | $5,000,000 | | $5,000,000 | | BMO 2024-C10 | No |
| A-3 | $7,000,000 | | $7,000,000 | | BMO 2024-C10 | No |
| A-4 | $9,000,000 | | $9,000,000 | | BMO 2024-C10 | No |
| A-5 | $24,000,000 | | $24,000,000 | | BMO 2023-C7 | No |
| A-6 | $11,000,000 | | $11,000,000 | | BBCMS 2024-C24 | No |
| Whole Loan | $71,525,000 | | $71,525,000 | | | |
The Property. The Creekside Town Center Property is a multi-tenant power center that contains 360,891 square feet of rentable area situated on a 39.35-acre site in Roseville, CA. The improvements feature ten, single-story buildings completed in 1999 through 2001. There are 1,888 on-site surface parking spaces, resulting in a parking ratio of 5.23 per 1,000 square feet of net rentable area. The Creekside Town Center Property features 253,032 square feet of anchor space, 68,688 square feet of inline space and 21,376 square feet of outparcel space.
The Creekside Town Center Property is a power center, located in a regional shopping node, directly across the street from the primary ingress/egress of the Westfield Galleria at Roseville (“Westfield Galleria”), the Sacramento region’s fortress mall. According to a third party market research report, Westfield Galleria is the highest trafficked retail destination in the Sacramento MSA, with the mall’s anchors, Macy’s (98th percentile), JCPenney (96th percentile), and Nordstrom (75th percentile), ranking amongst the highest trafficked stores in their respective chains within the state of California. According to the same report, the Creekside Town Center Property ranks in the 90th and 96th percentile for number of visits among retail centers in California and the United States. The Creekside Town Center and surrounding retail core is positioned at the interchange of Interstate-80 (131,387 vehicles per day) and CA Highway-65 (117,400 vehicles per day) in Roseville, CA.
The Creekside Town Center Property is 95.6% occupied by 30 tenants as of July 31, 2024, including national anchor tenants Best Buy, Burlington Coat Factory, Bobs Discount Furniture, Nordstrom Rack, and Marshalls among others. Twenty of the 30 existing tenants at the Creekside Town Center Property, or 76.7% and 80.5% of the existing tenancy by revenue and square footage, respectively, have occupied the Creekside Town Center Property for over 20 years.
Major Tenants.
Best Buy (46,005 square feet, 12.7% of NRA; A3/BBB+/NR by Moody’s/S&P/Fitch): Founded in 1966 and headquartered in Richfield, Minnesota, Best Buy Co Inc (“Best Buy”) is a retailer of electronic products. Best Buy offers products including consumer electronics, computing and mobile phones, appliances, entertainment products, home office products and more. Best Buy also offers a number of services such as consultation, design, set-up, technical support, delivery and installation for home theater, mobile audio and appliances. Best Buy markets its products under Best Buy, Future Shop, Geek Squad, Magnolia, Yellow Tag, Rocketfish, Modal and My Best Buy brand names. Best Buy operates over 1,000 stores in the United States, Canada, and Mexico with 959 stores in the United States alone as of August 2024. Best Buy has been a tenant at the Creekside Town Center Property since 2001 and has a lease extending to January 2026. Best Buy renewed its lease in 2021, and has one, five-year extension option remaining. The Best Buy lease has no termination options.
Burlington Coat Factory (37,212 square feet, 10.3% of NRA; NR/BB+/NR by Moody’s/S&P/Fitch): Founded in 1972, Burlington Coat Factory is a nationally recognized off-price retailer. Burlington Coat Factory is a Fortune 500 company and its common stock is traded on the New York Stock Exchange under the ticker symbol “BURL”. As of the end of the second quarter of 2024, Burlington Coat Factory operates 1,057 stores in 46 states and Puerto Rico. Burlington Coat Factory has been a tenant at the Creekside Town Center Property since 2001 and has a lease extending to January 2026. Burlington Coat Factory reported net income of $74 million for the second quarter ended August 3, 2024. The Burlington Coat Factory lease has three, five-year extension options remaining and has no termination options.
| THE INFORMATION IN THIS STRUCTURAL AND COLLATERAL TERM SHEET IS NOT COMPLETE AND MAY BE AMENDED PRIOR TO THE TIME OF SALE. THIS TERM SHEET IS NOT AN OFFER TO SELL THESE SECURITIES AND IT IS NOT A SOLICITATION OF AN OFFER TO BUY THESE SECURITIES IN ANY JURISDICTION WHERE THE OFFER OR SALE IS NOT PERMITTED. |
| | 121 | |
| Structural and Collateral Term Sheet | | BMO 2024-C10 |
| No. 8 – Creekside Town Center |
Bobs Discount Furniture (34,456 square feet, 9.5% of NRA; NR/NR/NR by Moody’s/S&P/Fitch): Founded in 1991 and headquartered in Manchester, Connecticut, Bobs Discount Furniture is a manufacturer and retailer offering home furnishing products such as furniture, mattresses, bed frames, and more Operating in the United States, Bobs Discount Furniture has approximately 177 stores as of July 2024. Bobs Discount Furniture has been a tenant at the Creekside Town Center Property since May 2022 under an initial ten-year lease. The Bobs Discount Furniture lease has three, five-year extension options remaining and no termination options.
The following information presents certain information relating to the historical occupancy of the Creekside Town Center Property:
| Historical and Current Occupancy(1) |
| 2020 | 2021 | 2022 | Current(2) |
| 94.2% | 83.3% | 94.8% | 95.6% |
| (1) | Historical Occupancy is as of December 31 of each respective year. The Creekside Town Center Property was acquired by the borrower in September 2023. Historical financials prepared by the prior owner of the Creekside Town Center Property were provided by the borrower sponsors. |
| (2) | Current Occupancy is as of July 31, 2024. |
The following table presents certain information relating to the major tenants at the Creekside Town Center Property:
| Top Tenant Summary(1)(4) |
| Tenant | Ratings
Moody’s/S&P/Fitch(2) | Net Rentable Area (SF) | % of
Total NRA | UW Base Rent PSF(3) | UW Base Rent(3) | % of Total
UW Base Rent(3) | Lease
Exp. Date |
| Best Buy | A3/BBB+/NR | 46,005 | 12.7 | % | $16.38 | $753,638 | 9.5 | % | 1/31/2026 |
| Burlington Coat Factory | Ba1/BB+/NR | 37,212 | 10.3 | % | $5.59 | 207,902 | 2.6 | | 1/31/2026 |
| Bob’s Discount Furniture | NR/NR/NR | 34,456 | 9.5 | % | $18.00 | 620,208 | 7.8 | | 5/31/2032 |
| Nordstrom Rack | Ba2/BB+/BB | 32,794 | 9.1 | % | $22.50 | 737,865 | 9.3 | | 8/31/2026 |
| Marshalls | NR/NR/NR | 30,709 | 8.5 | % | $18.15 | 557,368 | 7.0 | | 1/31/2027 |
| Old Navy | Ba3/BB/NR | 25,020 | 6.9 | | $18.75 | 469,125 | 5.9 | | 9/30/2025 |
| Michaels | NR/NR/NR | 24,336 | 6.7 | % | $20.52 | 499,253 | 6.3 | | 7/31/2026 |
| Barnes & Noble | NR/NR/NR | 22,500 | 6.2 | | $18.85 | 424,125 | 5.3 | | 1/31/2031 |
| Ulta | NR/NR/NR | 10,795 | 3.0 | | $37.00 | 399,415 | 5.0 | | 4/30/2026 |
| Five Below | NR/NR/NR | 8,792 | 2.4 | % | $30.00 | 263,760 | 3.3 | | 1/31/2030 |
| Major Tenants | 272,619 | 75.5 | % | $18.09 | $4,932,659 | 62.0 | % | |
| Other Tenants | | 72,321 | 20.0 | % | $41.80 | 3,023,352 | 38.0 | % | |
| Occupied Collateral Total | | 344,940 | 95.6 | % | $23.06 | $7,956,011 | 100.0 | % | |
| Vacant Space | | 15,951 | 4.4 | % | | | | |
| Collateral Total | | 360,891 | 100.0 | % | | | | |
| | | | | | | | |
| (1) | Based on the underwritten rent roll as of July 31, 2024. |
| (2) | In certain instances, ratings provided are those of the parent company of the entity shown, whether or not the parent company guarantees the lease. |
| (3) | UW Base Rent PSF, UW Base Rent and % of Total UW Base Rent includes rent steps totaling $38,779 through February 2025. |
| (4) | All of the tenants listed in the table above (other than Ulta and Five Below) are anchor tenants. The eight anchor tenants reflected above represent approximately 70.1% of net rentable area and approximately 53.7% of total UW Base Rent. |
| THE INFORMATION IN THIS STRUCTURAL AND COLLATERAL TERM SHEET IS NOT COMPLETE AND MAY BE AMENDED PRIOR TO THE TIME OF SALE. THIS TERM SHEET IS NOT AN OFFER TO SELL THESE SECURITIES AND IT IS NOT A SOLICITATION OF AN OFFER TO BUY THESE SECURITIES IN ANY JURISDICTION WHERE THE OFFER OR SALE IS NOT PERMITTED. |
| | 122 | |
| Structural and Collateral Term Sheet | | BMO 2024-C10 |
| No. 8 – Creekside Town Center |
The following table presents certain information relating to the lease rollover schedule at the Creekside Town Center Property:
| Lease Rollover Schedule(1)(2) |
| Year | Number of Leases Expiring | Net Rentable Area Expiring | % of NRA Expiring | UW Base Rent Expiring(3) | % of UW Base Rent Expiring(3) | Cumulative Net Rentable Area Expiring | Cumulative % of NRA Expiring | Cumulative UW Base Rent Expiring(3) | Cumulative % of UW Base Rent Expiring(3) |
| Vacant | NAP | 15,951 | 4.4 | % | NAP | NA | P | 15,951 | 4.4% | NAP | NAP |
| 2024 & MTM | 0 | 0 | 0.0 | | $0 | 0.0 | % | 15,951 | 4.4% | $0 | 0.0% |
| 2025 | 4 | 30,380 | 8.4 | | 723,381 | 9.1 | | 46,331 | 12.8% | $723,381 | 9.1% |
| 2026 | 7 | 164,279 | 45.5 | | 3,215,989 | 40.4 | | 210,610 | 58.4% | $3,939,369 | 49.5% |
| 2027 | 3 | 43,948 | 12.2 | | 1,146,449 | 14.4 | | 254,558 | 70.5% | $5,085,818 | 63.9% |
| 2028 | 1 | 1,140 | 0.3 | | 54,720 | 0.7 | | 255,698 | 70.9% | $5,140,538 | 64.6% |
| 2029 | 3 | 12,068 | 3.3 | | 481,984 | 6.1 | | 267,766 | 74.2% | $5,622,522 | 70.7% |
| 2030 | 3 | 18,222 | 5.0 | | 660,138 | 8.3 | | 285,988 | 79.2% | $6,282,660 | 79.0% |
| 2031 | 1 | 22,500 | 6.2 | | 424,125 | 5.3 | | 308,488 | 85.5% | $6,706,785 | 84.3% |
| 2032 | 2 | 36,456 | 10.1 | | 722,054 | 9.1 | | 344,944 | 95.6% | $7,428,839 | 93.4% |
| 2033 | 1 | 5,000 | 1.4 | | 120,000 | 1.5 | | 349,944 | 97.0% | $7,548,839 | 94.9% |
| 2034 | 2 | 3,947 | 1.1 | | 197,291 | 2.5 | | 353,891 | 98.1% | $7,746,130 | 97.4% |
| 2035 | 0 | 0 | 0.0 | | 0 | 0.0 | | 353,891 | 98.1% | $7,746,130 | 97.4% |
| 2036 & Beyond | 3 | 7,000 | 1.9 | | 209,881 | 2.6 | | 360,891 | 100.0% | $7,956,011 | 100.0% |
| Total | 30 | 360,891 | 100.0 | % | $7,956,011 | 100.0 | % | | | | |
| (1) | Based on the underwritten rent roll as of July 31, 2024. |
| (2) | Certain tenants may have lease termination options that are exercisable prior to the stated expiration date of the subject lease or leases which are not considered in the Lease Rollover Schedule. |
| (3) | UW Base Rent Expiring, % of UW Base Rent Expiring, Cumulative UW Base Rent Expiring and Cumulative % of UW Base Rent Expiring include rent steps totaling $38,779 through February 2025. |
| THE INFORMATION IN THIS STRUCTURAL AND COLLATERAL TERM SHEET IS NOT COMPLETE AND MAY BE AMENDED PRIOR TO THE TIME OF SALE. THIS TERM SHEET IS NOT AN OFFER TO SELL THESE SECURITIES AND IT IS NOT A SOLICITATION OF AN OFFER TO BUY THESE SECURITIES IN ANY JURISDICTION WHERE THE OFFER OR SALE IS NOT PERMITTED. |
| | 123 | |
| Structural and Collateral Term Sheet | | BMO 2024-C10 |
| No. 8 – Creekside Town Center |
The following table presents certain information relating to the historical operating results and underwritten cash flows of the Creekside Town Center Property:
| Operating History and Underwritten Net Cash Flow(1) |
| | 2020 | 2021 | 2022 | TTM(2) | Underwritten | Per Square Foot | %(3) |
| Rents in Place | $7,462,302 | $6,680,428 | $7,297,716 | $7,629,206 | $7,917,232 | | $21.94 | | 71.3 | % |
| Vacancy Gross Up | 0 | 0 | 0 | 0 | 520,030 | | 1.44 | | 4.7 | |
| Rent Abatement | (256,145) | (71,364) | 0 | (9,120) | 0 | | 0.00 | | 0.0 | |
| Percentage Rent | 0 | 0 | 5694.97 | 0 | 0 | | 0.00 | | 0.0 | |
| Rent Steps(4) | 0 | 0 | 0 | 0 | 38,779 | | 0.11 | | 0.3 | |
| Bad Debt | (866,332) | 377,202 | 60,168 | 0 | 0 | | 0.00 | | 0.0 | |
| Gross Potential Income | $6,339,826 | $6,986,266 | $7,363,579 | $7,620,086 | $8,476,041 | | $23.49 | | 76.4 | % |
| Total Reimbursements | 2,062,121 | 2,085,292 | 2,071,409 | 2,746,842 | 2,623,581 | | 7.27 | | 23.6 | |
| Net Rental Income | $8,401,947 | $9,071,558 | $9,434,988 | $10,366,928 | $11,099,622 | | $30.76 | | 100.0 | % |
| (Vacancy/Credit Loss) | 0 | 0 | 0 | 0 | (520,030) | | (1.44) | | (4.7 | ) |
| Other Income(5) | 59,573 | 115,302 | 169,754 | 184,995 | 184,995 | | 0.51 | | 1.7 | |
| Effective Gross Income | $8,461,520 | $9,186,860 | $9,604,742 | $10,551,923 | $10,764,587 | | $29.83 | | 97.0 | % |
| Management Fee | 268,807 | 322,690 | 346,253 | 285,480 | 322,938 | | 0.89 | | 3.0 | |
| Real Estate Taxes | 1,098,942 | 1,107,903 | 1,120,336 | 1,024,517 | 1,166,920 | | 3.23 | | 10.8 | |
| Insurance | 105,638 | 115,173 | 123,647 | 243,154 | 246,655 | | 0.68 | | 2.3 | |
| Other Expenses(6) | 693,307 | 758,406 | 799,982 | 922,431 | 922,431 | | 2.56 | | 8.6 | |
| Total Expenses | $2,166,694 | $2,304,172 | $2,390,218 | $2,475,582 | $2,658,944 | | $7.37 | | 24.7 | % |
| Net Operating Income | $6,294,826 | $6,882,688 | $7,214,525 | $8,076,341 | $8,105,643 | | $22.46 | | 75.3 | % |
| Capital Expenditures | 0 | 0 | 0 | 0 | 54,134 | | 0.15 | | 0.5 | |
| TI/LC | 0 | 0 | 0 | 0 | 20,668 | | 0.06 | | 0.2 | |
| Net Cash Flow | $6,294,826 | $6,882,688 | $7,214,525 | $8,076,341 | $8,030,841 | | $22.25 | | 74.6 | % |
| (1) | Based on the underwritten rent roll dated July 31, 2024. The Creekside Town Center Property was acquired by the borrower in September 2023. Historical financials prepared by the prior owner of the Creekside Town Center Property were provided by the borrower sponsors. |
| (2) | TTM reflects the trailing 12-month period ended August 31, 2024. |
| (3) | % column represents percent of Net Rental Income for all revenue lines and represents percent of Effective Gross Income for the remainder of fields. |
| (4) | UW Rent Steps includes contractual rent steps totaling $38,779 to February 2025. |
| (5) | Other Income includes parking income and other miscellaneous income. |
| (6) | Other Expenses consist of common area maintenance, utilities and marketing expenses. |
Appraisal. According to the appraisal, the Creekside Town Center Property had an “as-is” appraised value of $125,600,000 as of August 25, 2023. The table below shows the appraisal’s “as-is” conclusions.
| Appraisal Valuation Summary(1) |
| Appraisal Approach | Appraised Value | Capitalization Rate(2) |
| Income Capitalization Approach | $125,600,000 | 6.25% |
| (2) | The appraisal used a discounted cash flow approach also to arrive at the appraised value. The capitalization rate shown above represents the overall capitalization rate. |
Environmental. According to the Phase I environmental site assessment dated August 2, 2023, there was no evidence of any recognized environmental conditions at the Creekside Town Center Property and no further action is recommended.
The Market. The Creekside Town Center Property is located in Roseville, California approximately 19 miles northeast of Downtown Sacramento and 1.5 miles from the intersection of Interstate 80 and Highway 65. Interstate 80 provides access to Sacramento and San Francisco (105 miles southwest of the Creekside Town Center Property). The Creekside Town Center Property is located in the premiere retail hub in Placer County. The Creekside Town Center Property is located in the Sacramento retail market. The Sacramento retail market is home to companies and institutions including the University of California, Davis and UC Davis Health, Sutter Health, and Kaiser Permanente. According to the appraisal, the 2022 population within a one-, three- and five-mile radius of the Creekside Town Center Property was 10,448, 111,284 and
| THE INFORMATION IN THIS STRUCTURAL AND COLLATERAL TERM SHEET IS NOT COMPLETE AND MAY BE AMENDED PRIOR TO THE TIME OF SALE. THIS TERM SHEET IS NOT AN OFFER TO SELL THESE SECURITIES AND IT IS NOT A SOLICITATION OF AN OFFER TO BUY THESE SECURITIES IN ANY JURISDICTION WHERE THE OFFER OR SALE IS NOT PERMITTED. |
| | 124 | |
| Structural and Collateral Term Sheet | | BMO 2024-C10 |
| No. 8 – Creekside Town Center |
246,095, respectively. The 2022 average household income within the same radii was $130,360, $123,826 and $133,421, respectively.
According to a third party market research report, the Creekside Town Center Property is in the Sacramento retail market. As of September 2024, the Sacramento retail market reported retail inventory of approximately 112.7 million square feet with an overall vacancy rate of 5.9% and an average effective rent of $23.47 per square foot. The Sacramento retail market reported positive absorption of 486,000 square feet for the trailing twelve months as of September 2024.
According to a third party market research report, the Creekside Town Center Property is in the Roseville/Rocklin retail submarket. As of September 2024, the Roseville/Rocklin retail submarket reported inventory of approximately 15.9 million square feet with an overall vacancy rate of 4.9% and an average effective rent of $27.11 per square foot. The submarket reported negative absorption of approximately 66,500 square feet for the trailing twelve months as of September 2024.
The following table presents certain information relating to comparable anchor retail centers for the Creekside Town Center Property:
| Comparable Anchor Retail Rental Summary(1) |
| Property Name | Location | Tenant | Suite Size (SF) | Lease Commencement | Lease Term (Yrs) | Rent (PSF) | Rent Steps | Lease Type |
| Creekside Town Center | Roseville, CA | Nordstrom Rack | 32,794(2) | Sep-01(2) | 25(2) | $22.50(2) | N/A(2) | Net(2) |
| Rock Creek Plaza | Auburn, CA | Old Navy | 15,850 | Feb-23 | 10 | $15.00 | 10% midterm | Net |
| Nordstrom Rack | Visalia, CA | Nordstrom Rack | 29,000 | Oct-22 | 10 | $16.00 | 10% midterm | Net |
| Amazon Fresh | Rocklin, CA | Amazon Fresh | 44,030 | Oct-22 | 15 | $21.23 | 10% midterm | Net |
| Southside Shopping Center | Santa Rosa, CA | Total Wine | 22,000 | Sep-22 | 10 | $25.00 | 10% midterm | Net |
| Burlington | Clovis, CA | Burlington | 20,500 | Aug-22 | 10 | $15.72 | $0.50 PSF every 5 yrs. | Net |
| Market Square at Arden Fair | Sacramento, CA | Crunch Fitness | 31,148 | Jul-22 | 10 | $16.80 | 14% midterm | Net |
| Park West Place | Stockton, CA | Bob's Discount Furniture | 22,500 | Jun-22 | 10 | $16.00 | 10% midterm | Net |
| Broadstone Plaza | Folsom, CA | Bob's Discount Furniture | 35,223 | Nov-21 | 10 | $16.50 | Step | Net |
| (1) | Source: Appraisal unless otherwise indicated. |
| (2) | Based on the underwritten rent roll as of July 31, 2024. |
The following table presents certain information relating to the comparable inline/Pad retail leases for the Creekside Town Center Property:
| Inline/Pad Comparable Retail Rental Summary(1) |
Property Name | Location | Tenant | Suite Size (SF) | Lease Commencement | Lease Term (Yrs) | Rent (PSF) | Rent Steps | Lease Type |
| Creekside Town Center | Roseville, CA | Five Below | 8,792(2) | May-20(2) | 10.0(2) | $30.00(2) | 10% in 5 Yrs.(2) | Net(2) |
| Woodcreek Village Shopping Center | Roseville, CA | Wells Fargo | 4,039 | May-23 | 5 | $45.36 | 3% per annum | Net |
| Renaissance Creek | Roseville, CA | Stretchlab | 1,100 | Apr-23 | 10 | $34.20 | 3% per annum | Net |
| The Ridge | Elk Grove, CA | Chipotle Mexican Grill | 1,200 | Mar-23 | 5 | $45.00 | 3% per annum | Net |
| Madison Marketplace | Sacramento, CA | Dave's Hot Chicken | 2,480 | Jan-23 | 10 | $51.00 | 10% midterm | Net |
| Market Square at Arden Fair | Sacramento, CA | Party City | 10,521 | Sep-22 | 10 | $25.00 | 3% per annum | Net |
| Campus Oaks Town Center | Roseville, CA | Smashburger | 3,009 | Aug-22 | 10 | $48.00 | 10% midterm | Net |
| Campus Oaks | Roseville, CA | HotWorx | 1,754 | May-22 | 10 | $42.00 | 2.25% midterm | Net |
| Sienna Ridge | El Dorado Hills, CA | Bank of America | 2,000 | Aug-21 | 10 | $39.00 | 10% midterm | Net |
| (1) | Source: Appraisal unless otherwise indicated. |
| (2) | Based on the underwritten rent roll as of July 31, 2024.
|
| THE INFORMATION IN THIS STRUCTURAL AND COLLATERAL TERM SHEET IS NOT COMPLETE AND MAY BE AMENDED PRIOR TO THE TIME OF SALE. THIS TERM SHEET IS NOT AN OFFER TO SELL THESE SECURITIES AND IT IS NOT A SOLICITATION OF AN OFFER TO BUY THESE SECURITIES IN ANY JURISDICTION WHERE THE OFFER OR SALE IS NOT PERMITTED. |
| | 125 | |
| Structural and Collateral Term Sheet | | BMO 2024-C10 |
| No. 8 – Creekside Town Center |
The following table presents certain information relating to the comparable retail sales for the Creekside Town Center Property:
| Comparable Retail Sales(1) |
| Property / Location | Net Rentable Area (SF) | Year Built /
Renovated | Occupancy | Sale Date | Sale Price | Price PSF |
Creekside Town Center
1180-1256 Galleria Boulevard
Roseville, CA | 360,891(2) | 1999-2001 / NAP | 95.6%(2) | NAP | NAP | NAP |
Mission Valley West
826-1072 Camino Del Rio North
San Diego, CA | 216,010 | 1999 / NAP | 100.0% | Jul-23 | $125,150,000 | $579.37 |
Poinsettia Plaza
4687-4731 Telephone Rd.
Ventura, CA | 157,322 | 1986 / NAP | 97.0% | Jan-23 | $66,000,000 | $419.52 |
The Village at Topanga
6320 Topanga Canyon Boulevard
Woodland Hills, CA | 593,979 | 2015 / NAP | 96.0% | Dec-22 | $325,000,000 | $547.16 |
Broadstone Plaza I (Portion)
2705-2775 East Bidwell Street
Folsom, CA | 244,335 | 2001 / NAP | 98.0% | Oct-22 | $62,750,000 | $256.82 |
Gateway at Kearny Mesa (Portion) 7153-7215 Clairemont Mesa Blvd
San Diego, CA | 194,303 | 2001 / NAP | 100.0% | Apr-22 | $89,800,500 | $462.17 |
Nut Tree Shopping Center
1601-1679 E. Monte Vista Avenue
Vacaville, CA | 337,537 | 2006 / NAP | 96.0% | Apr-22 | $124,500,000 | $368.85 |
| (1) | Source: Appraisal unless otherwise indicated. |
| (2) | Based on the underwritten rent roll as of July 31, 2024. |
The Borrower. The borrower is Mt. Pleasant Realty, LLC, a Delaware limited liability company and single-purpose entity having at least two independent directors in its organizational structure. Legal counsel to the borrower delivered a non-consolidation opinion in connection with the origination of the Creekside Town Center Mortgage Loan.
The Borrower Sponsors. The non-recourse carveout guarantors and borrower sponsors are Cane Living Trust Dated February 17, 1981 and The Ronald and Mary Ellen Cane 1996 Irrevocable Trust. Cane Companies Management Inc. is a Sacramento based real estate company run by Ronald Cane, a real estate investor and broker. Its portfolio consists of six properties across California and is valued in excess of $400 million including the Creekside Town Center Property.
Property Management. The Creekside Town Center Property is managed by Vestar Properties, Inc. (“Vestar”), a third-party property management company. Vestar is a privately held real estate company that focuses on the acquisition, management, leasing and development of retail real estate with a significant market share in the western United States. Vestar has over 30 million square feet currently under operation and management.
Escrows and Reserves. At origination, the borrower deposited (i) approximately $104,378 for real estate taxes, (ii) approximately $20,555 for insurance premiums, (iii) $2,500,000 for tenant improvements and leasing commissions and (iv) approximately $185,505 for outstanding tenant improvements and leasing commissions in connection with tenants Vision Works, Cold Stone and Carters.
Tax Escrows – The borrower is required to deposit into a real estate tax reserve, on a monthly basis, 1/12th of the taxes that the lender estimates will be payable over the next-ensuing 12-month period (initially estimated to be approximately $104,378).
Insurance Reserve – The borrower is required to deposit into an insurance reserve, on a monthly basis, 1/12th of the amount which will be sufficient to pay the insurance premiums due for the renewal of coverage afforded by the related policies (initially estimated to be approximately $20,555).
Replacement Reserve – The borrower currently is not required to make monthly deposits for replacement reserves. However, the lender may reassess the need for such deposits periodically (but not more than once per year).
| THE INFORMATION IN THIS STRUCTURAL AND COLLATERAL TERM SHEET IS NOT COMPLETE AND MAY BE AMENDED PRIOR TO THE TIME OF SALE. THIS TERM SHEET IS NOT AN OFFER TO SELL THESE SECURITIES AND IT IS NOT A SOLICITATION OF AN OFFER TO BUY THESE SECURITIES IN ANY JURISDICTION WHERE THE OFFER OR SALE IS NOT PERMITTED. |
| | 126 | |
| Structural and Collateral Term Sheet | | BMO 2024-C10 |
| No. 8 – Creekside Town Center |
TI/LC Reserve – On a monthly basis, the borrower is required to deposit approximately $22,556 to pay for tenant allowances, tenant improvements and leasing commissions, capped at $1,500,000.
DSCR trigger reserve – Within 10 days after written notice from the lender that a DSCR Trigger Event Period (as defined below) has commenced, the borrower is required to deposit funds in an amount equal to the DSCR Trigger Deposit Amount (as defined below) with the lender, which amount will be transferred by the lender into the DSCR trigger subaccount to be held by the lender as cash collateral for the Creekside Town Center Whole Loan.
Lockbox / Cash Management. The Creekside Town Center Whole Loan is structured with a springing lockbox and springing cash management. If, as of any DSCR Trigger Anniversary (as defined below), any DSCR Trigger Event Period remains uncured, then on or before such DSCR Trigger Anniversary, the borrower is required to elect to either (i) make an additional deposit to the DSCR trigger subaccount in an amount equal to the DSCR Trigger Deposit Amount no later than ten days after the applicable DSCR Trigger Anniversary (such date, the “Additional DSCR Trigger Deposit Deadline”) or (ii) enter into or cause the manager to enter into a lockbox account and a cash management account agreement within twenty days (subject to an additional ten days’ extension in the event the borrower satisfies certain conditions set forth in the Creekside Town Center Whole Loan documents) of the applicable DSCR Trigger Anniversary. If on any DSCR Trigger Anniversary the borrower elects to make an additional DSCR Trigger Deposit and the borrower fails to deposit such sums with the lender on or before the Additional DSCR Trigger Deposit Deadline, then (i) such failure will, at the lender’s option, constitute an event of default, (ii) the borrower and non-recourse guarantors will have recourse liability for such amount and (iii) at the lender’s option, within fifteen days of the date of such failure the borrower and the manager shall enter into a clearing account agreement and a cash management agreement. The borrower is required to (or cause the property manager to) deposit any rents received from the Creekside Town Center Property into the lockbox account within two business days after the establishment of the lockbox account and cash management account. Following the establishment of the lockbox account and cash management account, the borrower is required to (or cause the property manager to) direct all rents generated by the Creekside Town Center Property into the lockbox account. All amounts on deposit in the lockbox account are required to be swept on a daily basis into the cash management account and applied as provided in the Creekside Town Center Whole Loan documents.
A “DSCR Trigger Event Period” means a period commencing upon the occurrence of the debt service coverage ratio falling below 1.15x and expiring upon the achievement of debt service coverage ratio of 1.15x or greater for one calendar quarter.
A “DSCR Trigger Deposit Amount” means $767,000.
A “DSCR Trigger Anniversary” means the yearly anniversary of the commencement of any DSCR Trigger Event Period.
Subordinate and Mezzanine Debt. None.
Permitted Future Subordinate or Mezzanine Debt. Not permitted.
Partial Release. Not permitted
Ground Lease. None.
| THE INFORMATION IN THIS STRUCTURAL AND COLLATERAL TERM SHEET IS NOT COMPLETE AND MAY BE AMENDED PRIOR TO THE TIME OF SALE. THIS TERM SHEET IS NOT AN OFFER TO SELL THESE SECURITIES AND IT IS NOT A SOLICITATION OF AN OFFER TO BUY THESE SECURITIES IN ANY JURISDICTION WHERE THE OFFER OR SALE IS NOT PERMITTED. |
| | 127 | |
| Structural and Collateral Term Sheet | | BMO 2024-C10 |
| No. 9 – Diamond Ridge Apartments |

| THE INFORMATION IN THIS STRUCTURAL AND COLLATERAL TERM SHEET IS NOT COMPLETE AND MAY BE AMENDED PRIOR TO THE TIME OF SALE. THIS TERM SHEET IS NOT AN OFFER TO SELL THESE SECURITIES AND IT IS NOT A SOLICITATION OF AN OFFER TO BUY THESE SECURITIES IN ANY JURISDICTION WHERE THE OFFER OR SALE IS NOT PERMITTED. |
| | 128 | |
| Structural and Collateral Term Sheet | | BMO 2024-C10 |
| No. 9 – Diamond Ridge Apartments |
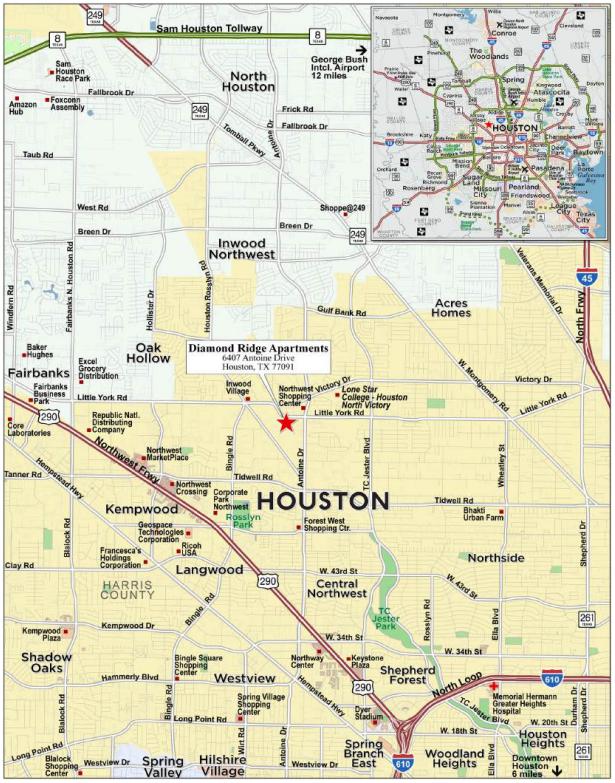
| THE INFORMATION IN THIS STRUCTURAL AND COLLATERAL TERM SHEET IS NOT COMPLETE AND MAY BE AMENDED PRIOR TO THE TIME OF SALE. THIS TERM SHEET IS NOT AN OFFER TO SELL THESE SECURITIES AND IT IS NOT A SOLICITATION OF AN OFFER TO BUY THESE SECURITIES IN ANY JURISDICTION WHERE THE OFFER OR SALE IS NOT PERMITTED. |
| | 129 | |
| Structural and Collateral Term Sheet | | BMO 2024-C10 |
| No. 9 – Diamond Ridge Apartments |
| Mortgage Loan Information | | Property Information |
| Mortgage Loan Seller: | SMC | | Single Asset / Portfolio: | Single Asset |
| Original Principal Balance: | $31,000,000 | | Title: | Fee |
| Cut-off Date Principal Balance: | $31,000,000 | | Property Type - Subtype: | Multifamily – Garden |
| % of Pool by IPB: | 4.3% | | Net Rentable Area (Units): | 500 |
| Loan Purpose: | Refinance | | Location: | Houston, TX |
| Borrower: | APTDR, LLC | | Year Built / Renovated: | 1980 / 2022 |
| Borrower Sponsor(1): | Gary W. Gates, Jr. | | Occupancy: | 97.2% |
| Interest Rate: | 7.23500% | | Occupancy Date: | 7/31/2024 |
| Note Date: | 8/5/2024 | | 4th Most Recent NOI (As of): | $2,165,354 (12/31/2021) |
| Maturity Date: | 8/6/2034 | | 3rd Most Recent NOI (As of): | $2,536,184 (12/31/2022) |
| Interest-only Period: | 120 months | | 2nd Most Recent NOI (As of): | $3,007,553 (12/31/2023) |
| Original Term: | 120 months | | Most Recent NOI (As of): | $3,122,893 (6/30/2024 TTM) |
| Original Amortization Term: | None | | UW Economic Occupancy: | 95.2% |
| Amortization Type: | Interest Only | | UW Revenues: | $5,462,187 |
| Call Protection: | L(9),YM1(107),O(4) | | UW Expenses: | $2,503,705 |
| Lockbox / Cash Management: | Springing / Springing | | UW NOI: | $2,958,482 |
| Additional Debt: | No | | UW NCF: | $2,833,482 |
| Additional Debt Balance: | N/A | | Appraised Value / Per Unit: | $47,800,000 / $95,600 |
| Additional Debt Type: | N/A | | Appraisal Date: | 7/10/2024 |
| | | | | |
| Escrows and Reserves(2) | | Financial Information |
| | Initial | Monthly | Initial Cap | | Cut-off Date Loan / Unit: | $62,000 |
| Taxes: | $563,117 | $70,390 | N/A | | Maturity Date Loan / Unit: | $62,000 |
| Insurance: | $73,938 | $14,057 | N/A | | Cut-off Date LTV(3): | 59.6% |
| Replacement Reserves: | $0 | $10,417 | N/A | | Maturity Date LTV(3): | 59.6% |
| Deferred Maintenance: | $47,180 | $0 | N/A | | UW NCF DSCR: | 1.25x |
| Other Reserve(3): | $2,500,000 | $0 | N/A | | UW NOI Debt Yield(3): | 10.4% |
| | | | | | | |
| Sources and Uses |
| Sources | Proceeds | % of Total | | Uses | Proceeds | % of Total |
| Mortgage Loan | $31,000,000 | 100.0% | | Loan Payoff | $23,309,517 | 75.2 | % |
| | | | | Return of Equity | 4,278,470 | 13.8 | |
| | | | | Upfront Reserves | 3,184,235 | 10.3 | |
| | | | | Closing Costs | 227,778 | 0.7 | |
| Total Sources | $31,000,000 | 100.0% | | Total Uses | $31,000,000 | 100.0 | % |
| (1) | The borrower sponsor is an affiliate of the borrower sponsor under the Quail Meadows Apartments mortgage loan, which is also being contributed to the BMO 2024-C10 securitization. |
| (2) | For a full description of Escrows and Reserves, see “Escrows and Reserves” below. |
| (3) | At origination of the Diamond Ridge Apartments Mortgage Loan (as defined below), the borrower deposited $2,500,000 into an economic holdback reserve, to be released to the borrower upon the net operating income debt yield at the Diamond Ridge Apartments Property (as defined below) being at least 9.75% based on a trailing 12-month period and satisfactory completion of all required repairs. Notwithstanding the foregoing, no disbursement is permitted prior to the payment date in March 2025. The Cut-off Date LTV, Maturity Date LTV and UW NOI Debt Yield calculations are based on an assumed Diamond Ridge Apartments Mortgage Loan Cut-off Date Balance of approximately $28,500,000, which is net of the $2,500,000 economic holdback reserve. Assuming the gross Diamond Ridge Apartments Mortgage Loan Cut-off Date Balance of approximately $31,000,000, the Cut-off Date LTV, Maturity Date LTV and UW NOI Debt Yield calculations are 64.9%, 64.9% and 9.5%, respectively. |
The Loan. The ninth largest mortgage loan (the “Diamond Ridge Apartments Mortgage Loan”) is secured by the borrower’s fee interest in a garden-style multifamily property located in Houston, Texas (the “Diamond Ridge Apartments Property”). The Diamond Ridge Apartments Mortgage Loan was originated on August 5, 2024 by Starwood Mortgage Capital LLC. The Diamond Ridge Apartments Mortgage Loan has an outstanding principal balance as of the Cut-off Date of $31.0 million, has a 10-year term, accrues interest at a fixed rate of 7.23500% per annum on an Actual/360 basis and is interest-only for the loan term. The scheduled maturity date of the Diamond Ridge Apartments Mortgage Loan is August 6, 2034.
| THE INFORMATION IN THIS STRUCTURAL AND COLLATERAL TERM SHEET IS NOT COMPLETE AND MAY BE AMENDED PRIOR TO THE TIME OF SALE. THIS TERM SHEET IS NOT AN OFFER TO SELL THESE SECURITIES AND IT IS NOT A SOLICITATION OF AN OFFER TO BUY THESE SECURITIES IN ANY JURISDICTION WHERE THE OFFER OR SALE IS NOT PERMITTED. |
| | 130 | |
| Structural and Collateral Term Sheet | | BMO 2024-C10 |
| No. 9 – Diamond Ridge Apartments |
The Property. The Diamond Ridge Apartments Property is a 500-unit garden-style multifamily property built in 1980 and renovated in 2022. As of July 31, 2024, the Diamond Ridge Apartments Property was 97.2% occupied. The Diamond Ridge Apartments Property is located at 6407 Antoine Drive, approximately 13 miles north of downtown Houston. The 18.37-acre parcel is improved with 35 two-story apartment buildings and one single-story leasing office. The improvements are masonry construction. Access to the Diamond Ridge Apartments Property is controlled via electronic access gates located at the primary entry point. The Diamond Ridge Apartments Property contains 744 parking spaces equating to a parking ratio of approximately 1.5 spaces per unit. All parking spaces and vehicle drives are paved. The Diamond Ridge Apartments Property features one-, two- and three-bedroom layouts ranging in size from 535 to 1,190 square feet. According to the appraisal, market rents range from $785 to $1,435 per month, with an average market rent of $965 and an average unit size of 813 square feet. Community amenities include gated controlled access, laundry facilities, security system, sun deck, surface parking lot and clubhouse. Unit features include, among other items, air conditioning, balcony, dishwashers and garbage disposals, ceiling fans and high-speed internet access. The borrower sponsor acquired the Diamond Ridge Apartments Property in June 2020 for a purchase price of $22,250,000. At the time of acquisition, there were approximately 70 vacant units and multiple down units. Since acquisition, the borrower sponsor has spent approximately $7,400,000 on capital improvements, which included unit rehab, roof replacement, exterior siding replacement, exterior painting, stair/balcony replacement, sidewalk repair, HVAC replacement, parking repair, ceramic tile installation, foundation repair, new appliance installation, landscaping, electrical repairs and gate repairs.
The following table presents detailed information with respect to the units at the Diamond Ridge Apartments Property:
| Unit Summary |
| Unit Type | No. of Units(1) | % of Total | Occupied Collateral Units(1) | % of Units Occupied(1) | Average Unit Size (SF)(1) | Monthly Market Rental Rate(2) | Monthly Market Rental Rate per SF(2) | Average Monthly Market Rental Rate(1) | Average Monthly Market Rental Rate per SF(1) |
| 1 BR / 1 BA | 56 | 11.2 | % | 54 | 96.4% | 535 | $785 | $1.47 | $776 | $1.45 |
| 1 BR / 1 BA | 96 | 19.2 | | 94 | 97.9% | 680 | $835 | $1.23 | $822 | $1.21 |
| 1 BR / 1 BA | 112 | 22.4 | | 110 | 98.2% | 735 | $840 | $1.14 | $850 | $1.16 |
| 1 BR / 1 BA | 80 | 16.0 | | 77 | 96.3% | 850 | $965 | $1.14 | $942 | $1.11 |
| 2 BR / 1.5 BA | 80 | 16.0 | | 77 | 96.3% | 975 | $1,115 | $1.14 | $1,099 | $1.13 |
| 2 BR / 2 BA | 52 | 10.4 | | 51 | 98.1% | 1,045 | $1,220 | $1.17 | $1,195 | $1.14 |
| 3 BR / 2 BA | 24 | 4.8 | | 23 | 95.8% | 1,190 | $1,435 | $1.21 | $1,368 | $1.15 |
| Total/Wtd. Avg. | 500 | 100.0 | % | 486 | 97.2% | 813 | $965 | $1.20 | $952 | $1.17 |
| (1) | Based on the borrower rent roll dated July 31, 2024. |
The Market. According to the appraisal, the Diamond Ridge Apartments Property is located in the Houston Area multifamily market. As of June 2024, the Houston Area multifamily market average monthly asking rent per square foot was $1.43 and vacancy was 11.4%. According to the appraisal, the Diamond Ridge Apartments Property is located in the Brookhollow/Northwest Crossing multifamily submarket. As of June 2024, the Brookhollow/Northwest Crossing multifamily submarket average monthly asking rent per square foot was $1.31 and vacancy was 8.0%.
According to the appraisal, the 2023 population within a one-, three- and five-mile radius of the Diamond Ridge Apartments Property is 19,475, 129,960 and 356,946, respectively. The 2023 average household income within the same radii is $58,349, $76,492 and $92,730, respectively.
| THE INFORMATION IN THIS STRUCTURAL AND COLLATERAL TERM SHEET IS NOT COMPLETE AND MAY BE AMENDED PRIOR TO THE TIME OF SALE. THIS TERM SHEET IS NOT AN OFFER TO SELL THESE SECURITIES AND IT IS NOT A SOLICITATION OF AN OFFER TO BUY THESE SECURITIES IN ANY JURISDICTION WHERE THE OFFER OR SALE IS NOT PERMITTED. |
| | 131 | |
| Structural and Collateral Term Sheet | | BMO 2024-C10 |
| No. 9 – Diamond Ridge Apartments |
The following table presents certain information relating to comparable multifamily rental properties to the Diamond Ridge Apartments Property:
| Comparable Rental Summary(1) |
| Property Address | Year Built / Renovated | Occupancy | # Units | Unit Mix | Average SF per Unit | Average Rent per SF | Average Rent per Unit |
Diamond Ridge Apartments(2) 6407 Antoine Drive Houston, TX | 1980 / 2022 | 97.2% | 500 | 1BR / 1BA 1BR / 1BA 1BR / 1BA 1BR / 1BA 2BR / 1.5BA 2BR / 2BA 3BR / 2BA | 535 680 735 850 975 1,045 1,190 | $1.45 $1.21 $1.16 $1.11 $1.13 $1.14 $1.15 | $776 $822 $850 $942 $1,099 $1,195 $1,368 |
Hollyview 5555 Holly View Drive Houston, TX | 1980 / 2012 | 91% | 328 | 1BR / 1BA 1BR / 1BA 1BR / 1BA 2BR / 1BA 2BR / 2BA | 581 620 660 857 960 | $1.52 $1.49 $1.36 $1.20 $1.29 | $885 $925 $900 $1,025 $1,240 |
Amir 5714 West Gulf Bank Road Houston, TX | 1981 / 2016 | 96% | 310 | 1BR / 1BA 1BR / 1BA 1BR / 1BA - Den 1BR / 1BA 1BR / 1BA 1BR / 1BA - Den 2BR / 2BA 2BR / 2BA 2BR / 2BA | 520 613 613 697 720 720 884 989 1,107 | $1.48 $1.27 $1.26 $1.21 $1.22 $1.14 $1.24 $1.13 $1.13 | $770 $780 $775 $845 $880 $820 $1,100 $1,120 $1,250 |
Cherry Creek 5801 Hollister Houston, TX | 1979 / 2017 | 95% | 274 | 1BR / 1BA 1BR / 1BA 1BR / 1.5BA - TH 2BR / 2BA 2BR / 2BA 2BR / 2.5BA | 578 667 829 1,001 1,024 1,172 | $1.52 $1.42 $1.24 $1.30 $1.28 $1.19 | $880 $950 $1,025 $1,300 $1,315 $1,400 |
Reserve at White Oak 6240 Antoine Drive Houston, TX | 1973 / 2011 | 94% | 339 | 1BR / 1BA 1BR / 1BA 1BR / 1BA 1BR / 1BA 2BR / 1BA 2BR / 1BA 2BR / 1BA 2BR / 2BA 2BR / 1.5BA - TH 3BR / 2BA | 656 742 822 846 890 1,024 1,088 1,200 1,331 1,484 | $1.30 $1.17 $1.08 $1.05 $1.15 $1.06 $0.97 $0.90 $0.89 $0.94 | $850 $870 $890 $890 $1,025 $1,085 $1,060 $1,085 $1,185 $1,395 |
Bend at Oak Forest 4000 Watonga Houston, TX | 1979 / 2016 | 93% | 392 | Studio 1BR / 1BA 1BR / 1BA 2BR / 1BA 2BR / 1BA 2BR / 2BA 2BR / 2BA 2BR / 2BA 3BR / 2BA | 480 504 660 710 720 910 978 1,050 1,210 | $1.58 $1.63 $1.42 $1.51 $1.54 $1.23 $1.25 $1.20 $1.26 | $759 $819 $939 $1,069 $1,109 $1,119 $1,219 $1,259 $1,519 |
| (1) | Source: Appraisal and market report, unless otherwise indicated. Comparables reflect market rate units. |
| (2) | Based on the borrower rent roll dated July 31, 2024 or as otherwise provided by the borrower. |
| THE INFORMATION IN THIS STRUCTURAL AND COLLATERAL TERM SHEET IS NOT COMPLETE AND MAY BE AMENDED PRIOR TO THE TIME OF SALE. THIS TERM SHEET IS NOT AN OFFER TO SELL THESE SECURITIES AND IT IS NOT A SOLICITATION OF AN OFFER TO BUY THESE SECURITIES IN ANY JURISDICTION WHERE THE OFFER OR SALE IS NOT PERMITTED. |
| | 132 | |
| Structural and Collateral Term Sheet | | BMO 2024-C10 |
| No. 9 – Diamond Ridge Apartments |
The following table presents certain information with respect to the historical and current occupancy of the Diamond Ridge Apartments Property:
| Historical and Current Occupancy |
| 2021(1) | 2022(1) | 2023(1) | Current(2) |
| 95.2% | 97.8% | 98.0% | 97.2% |
| (1) | Historical occupancy is as of December 31 of each respective year. |
| (2) | Current Occupancy is as of July 31, 2024. |
Appraisal. According to the appraisal, the Diamond Ridge Apartments Property had an “as-is” appraised value of $47,800,000 as of July 10, 2024. The table below shows the appraisal’s “as-is” conclusions.
| Appraisal Valuation Summary(1) |
| Appraisal Approach | Appraised Value | Capitalization Rate(2) |
| Direct Capitalization Approach | $47,800,000 | 6.00% |
| (2) | The appraisal used an income capitalization approach to arrive at the appraised value. The capitalization rates shown above represent the overall capitalization rate. |
Environmental. According to a Phase I environmental assessment dated July 22, 2024, there was no evidence of any recognized environmental conditions at the Diamond Ridge Apartments Property.
The following table presents certain information with respect to the historical operating performance and underwritten cash flows of the Diamond Ridge Apartments Property:
| Operating History and Underwritten Net Cash Flow |
| | 2021 | 2022 | 2023 | TTM(1) | Underwritten | Per Unit | %(2) |
| Gross Potential Rent | $3,998,507 | $4,673,927 | $5,142,804 | $5,366,387 | $5,637,294 | $11,275 | 100.0 | % |
| Net Rental Income | $3,998,507 | $4,673,927 | $5,142,804 | $5,366,387 | $5,637,294 | $11,275 | 100.0 | % |
| (Vacancy/Credit Loss) | 0 | 0 | 0 | 0 | (270,907) | (542) | (4.8 | ) |
| Other Income(3) | 47,302 | 57,266 | 77,122 | 95,800 | 95,800 | 192 | 1.7 | |
| Effective Gross Income | $4,045,809 | $4,731,194 | $5,219,926 | $5,462,187 | $5,462,187 | $10,924 | 96.9 | % |
| Total Expenses | $1,880,456 | $2,195,010 | $2,212,373 | $2,339,294 | $2,503,705 | $5,007 | 45.8 | % |
| Net Operating Income | $2,165,354 | $2,536,184 | $3,007,553 | $3,122,893 | $2,958,482 | $5,917 | 54.2 | % |
| Total Capex/RR | 0 | 0 | 0 | 0 | 125,000 | 250 | 2.3 | |
| Net Cash Flow | $2,165,354 | $2,536,184 | $3,007,553 | $3,122,893 | $2,833,482 | $5,667 | 51.9 | % |
| (1) | TTM reflects the trailing 12 months ending June 30, 2024. |
| (2) | % column represents percent of Net Rental Income for revenue fields and represents percent of Effective Gross Income for the remainder of fields. |
| (3) | Other Income is primarily comprised of late fees, laundry income and forfeited deposits. |
The Borrower. The borrower is APTDR, LLC, a Delaware limited liability company and special purpose entity with one independent director. Legal counsel to the borrower provided a non-consolidation opinion in connection with the origination of the Diamond Ridge Apartments Mortgage Loan.
The Borrower Sponsor. The borrower sponsor and non-recourse carve-out guarantor is Gary W. Gates, Jr., who owns and manages 46 multifamily properties totaling approximately 9,500 units primarily in the greater Houston, Texas area.
Property Management. The Diamond Ridge Apartments Property is managed by Gatesco, Inc., an affiliate of the borrower.
Escrows and Reserves. At origination, the borrower deposited into escrow approximately (i) $563,117 for real estate taxes, (ii) $73,938 for insurance premiums, (iii) $47,180 for deferred maintenance and (iv) $2,500,000 for a performance reserve.
Tax Escrows – On a monthly basis, the borrower is required to escrow 1/12th of the annual estimated tax payments, which currently equates to $70,390.
| THE INFORMATION IN THIS STRUCTURAL AND COLLATERAL TERM SHEET IS NOT COMPLETE AND MAY BE AMENDED PRIOR TO THE TIME OF SALE. THIS TERM SHEET IS NOT AN OFFER TO SELL THESE SECURITIES AND IT IS NOT A SOLICITATION OF AN OFFER TO BUY THESE SECURITIES IN ANY JURISDICTION WHERE THE OFFER OR SALE IS NOT PERMITTED. |
| | 133 | |
| Structural and Collateral Term Sheet | | BMO 2024-C10 |
| No. 9 – Diamond Ridge Apartments |
Insurance Escrows – On a monthly basis, the borrower is required to escrow 1/12th of the annual estimated insurance payments, which currently equates to approximately $14,057.
Replacement Reserves – On a monthly basis, the borrower is required to escrow $10,417 for replacement reserves.
Performance Reserve – At origination, the borrower deposited into escrow $2,500,000 as a performance holdback. Such funds may be released to the borrower, no earlier than the payment date in March 2025, upon the satisfaction of certain conditions, including, but not limited to, (i) the debt yield (as calculated by the lender) being equal to or greater than 9.75% and (ii) the lender’s receipt of reasonably satisfactory evidence that the borrower has completed all required repairs as set forth under the Diamond Ridge Apartments Mortgage Loan documents.
Lockbox / Cash Management. The Diamond Ridge Apartments Mortgage Loan is structured with a springing lockbox and springing cash management. The Diamond Ridge Apartments Mortgage Loan requires that during the continuance of a Diamond Ridge Apartments Sweep Event Period (as defined below), the borrower or property manager, as applicable, is required to establish and maintain a lockbox account for the remainder of the Diamond Ridge Apartments Mortgage Loan term. Following a Diamond Ridge Apartments Sweep Event Period, the borrower is required to direct tenants to pay all rents directly into the lockbox account. Upon the occurrence and during the continuance of a Diamond Ridge Apartments Sweep Event Period, all funds in the lockbox account are required to be swept daily to a cash management account under the control of the lender to be applied and disbursed in accordance with the Diamond Ridge Apartments Mortgage Loan documents, and all excess cash flow funds remaining in the cash management account after the application of such funds in accordance with the Diamond Ridge Apartments Mortgage Loan documents are required to be held by the lender in an excess cash flow reserve account as additional collateral for the Diamond Ridge Apartments Mortgage Loan.
To the extent that no Diamond Ridge Apartments Sweep Event Period is continuing, all excess cash flow funds are required to be disbursed to the borrower.
A “Diamond Ridge Apartments Sweep Event Period” will commence upon the earliest of the following: (i) the occurrence of an event of default under the Diamond Ridge Apartments Mortgage Loan documents; or (ii) commencing on or after February 5, 2025, the date on which the debt yield is less than 8.4%.
A Diamond Ridge Apartments Sweep Event Period will end with regard to: (a) clause (i), upon the cure of such event of default and the lender’s acceptance of such cure in its sole and absolute discretion and (b) clause (ii), upon the debt yield being at least 8.9% for two consecutive calendar quarters.
Subordinate and Mezzanine Debt. None.
Permitted Future Subordinate or Mezzanine Debt. Not permitted.
Partial Release. Not permitted.
Ground Lease. None.
| THE INFORMATION IN THIS STRUCTURAL AND COLLATERAL TERM SHEET IS NOT COMPLETE AND MAY BE AMENDED PRIOR TO THE TIME OF SALE. THIS TERM SHEET IS NOT AN OFFER TO SELL THESE SECURITIES AND IT IS NOT A SOLICITATION OF AN OFFER TO BUY THESE SECURITIES IN ANY JURISDICTION WHERE THE OFFER OR SALE IS NOT PERMITTED. |
| | 134 | |
| Structural and Collateral Term Sheet | | BMO 2024-C10 |
| No. 10 – Bradley Fair |
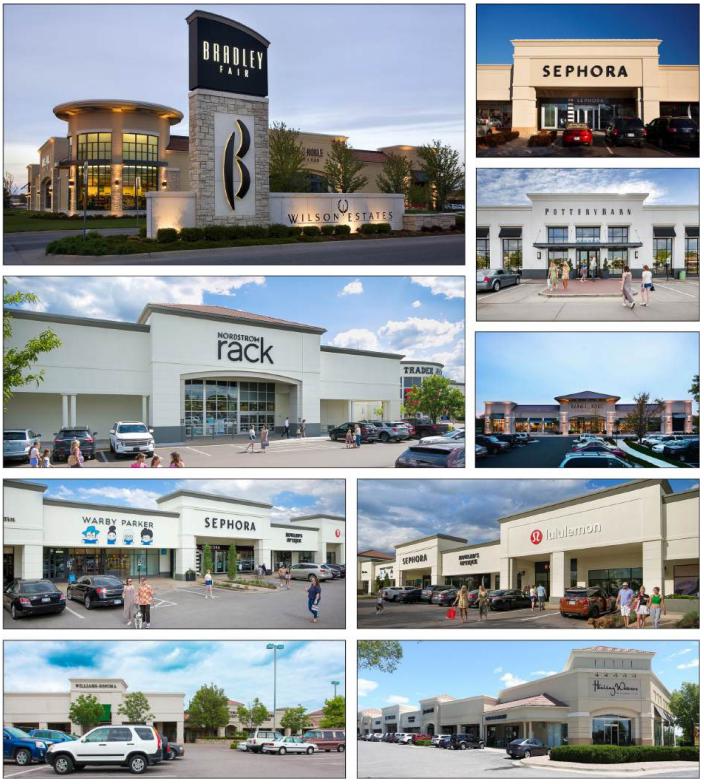
| THE INFORMATION IN THIS STRUCTURAL AND COLLATERAL TERM SHEET IS NOT COMPLETE AND MAY BE AMENDED PRIOR TO THE TIME OF SALE. THIS TERM SHEET IS NOT AN OFFER TO SELL THESE SECURITIES AND IT IS NOT A SOLICITATION OF AN OFFER TO BUY THESE SECURITIES IN ANY JURISDICTION WHERE THE OFFER OR SALE IS NOT PERMITTED. |
| | 135 | |
| Structural and Collateral Term Sheet | | BMO 2024-C10 |
| No. 10 – Bradley Fair |
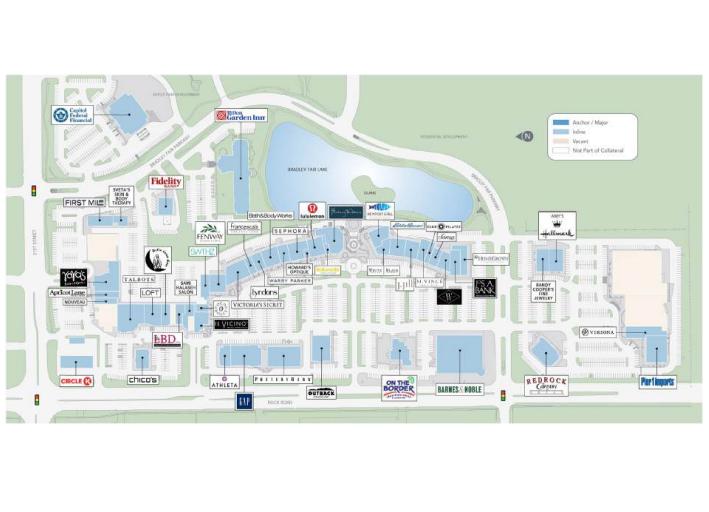
| THE INFORMATION IN THIS STRUCTURAL AND COLLATERAL TERM SHEET IS NOT COMPLETE AND MAY BE AMENDED PRIOR TO THE TIME OF SALE. THIS TERM SHEET IS NOT AN OFFER TO SELL THESE SECURITIES AND IT IS NOT A SOLICITATION OF AN OFFER TO BUY THESE SECURITIES IN ANY JURISDICTION WHERE THE OFFER OR SALE IS NOT PERMITTED. |
| | 136 | |
| Structural and Collateral Term Sheet | | BMO 2024-C10 |
| No. 10 – Bradley Fair |
| THE INFORMATION IN THIS STRUCTURAL AND COLLATERAL TERM SHEET IS NOT COMPLETE AND MAY BE AMENDED PRIOR TO THE TIME OF SALE. THIS TERM SHEET IS NOT AN OFFER TO SELL THESE SECURITIES AND IT IS NOT A SOLICITATION OF AN OFFER TO BUY THESE SECURITIES IN ANY JURISDICTION WHERE THE OFFER OR SALE IS NOT PERMITTED. |
| | 137 | |
| Structural and Collateral Term Sheet | | BMO 2024-C10 |
| No. 10 – Bradley Fair |
| Mortgage Loan Information | | Property Information |
| Mortgage Loan Sellers: | 3650 REIT | | Single Asset / Portfolio: | Single Asset |
| Original Principal Balance: | $30,000,000 | | Title: | Fee |
| Cut-off Date Principal Balance: | $30,000,000 | | Property Type – Subtype: | Other – Leased Fee |
| % of IPB: | 4.1% | | Net Rentable Area (SF): | 1,434,847 |
| Loan Purpose: | Recapitalization | | Location: | Wichita, KS |
| Borrower: | Bradley Fair Fee Owner LLC | | Year Built / Renovated: | NAP / NAP |
| Borrower Sponsor: | SDM Holdings LLC | | Occupancy: | NAP |
| Interest Rate: | 6.38500% | | Occupancy Date: | NAP |
| Note Date: | 2/12/2024 | | 4th Most Recent NOI (As of) (1): | NAV |
| Maturity Date: | 3/5/2034 | | 3rd Most Recent NOI (As of) (1): | NAV |
| Interest-only Period: | 120 months | | 2nd Most Recent NOI (As of) (1): | NAV |
| Original Term: | 120 months | | Most Recent NOI (As of) (1): | NAV |
| Original Amortization Term: | None | | UW Economic Occupancy: | 100.0% |
| Amortization Type: | Interest Only | | UW Revenues: | $2,016,936 |
| Call Protection: | L(32),DorYM1(81),O(7) | | UW Expenses: | $0 |
| Lockbox / Cash Management: | Hard / In Place | | UW NOI(1): | $2,016,936 |
| Additional Debt: | No | | UW NCF(1): | $2,016,936 |
| Additional Debt Balance: | N/A | | Appraised Value / Per SF: | $40,000,000 / $28 |
| Additional Debt Type: | N/A | | Appraisal Date: | 12/20/2023 |
| | | | | |
| Escrows and Reserves(2) | | Financial Information(3) |
| | Initial | Monthly | Cap | | Cut-off Date Loan / SF: | $21 |
Taxes: | $0 | $0 | N/A | | Maturity Date Loan / SF: | $21 |
| Insurance: | $0 | $0 | N/A | | Cut-off Date LTV: | 75.0% |
| TI / LC Reserve: | $0 | $0 | N/A | | Maturity Date LTV: | 75.0% |
| Replacement Reserve: | $0 | $0 | N/A | | UW NCF DSCR: | 1.04x |
| Debt Service Reserve: | $474,420 | $0 | N/A | | UW NOI Debt Yield: | 6.7% |
| | | | | | | |
| Sources and Uses |
| Sources | Proceeds | % of Total | | Uses | Proceeds | % of Total |
| Mortgage Loan | $30,000,000 | 100.0% | | Return of Equity | $28,802,313 | 96.0 | % |
| | | | | Closing Costs | 723,267 | 2.4 | |
| | | | | Upfront Reserves | 474,420 | 1.6 | |
| Total Sources | $30,000,000 | 100.0% | | Total Uses | $30,000,000 | 100.0 | % |
| (1) | UW NOI and UW NCF reflects the 10-year average of the ground rent. 4th Most Recent NOI, 3rd Most Recent NOI, 2nd Most Recent NOI and Most Recent NOI are unavailable as the ground rent payments began in February 2023. |
| (2) | See “Escrows and Reserves” below for further discussion of reserve information. |
| (3) | 31.6% LTV, 2.15x NOI DSCR and 13.9% NOI DY on a look through basis based on the leased fee appraised value on the Bradley Fair Shopping Center (as defined below) of $94,900,000 and the September 30, 2023 trailing twelve month financials at the Bradley Fair Shopping Center. |
The Loan. The tenth largest mortgage loan (the “Bradley Fair Mortgage Loan”) is secured by a 1,434,847 square foot leased fee land parcel in Wichita, Kansas (the “Bradley Fair Property”). The leasehold improvements (which are not part of the collateral for the Bradley Fair Mortgage Loan) consist of a 285,359 square foot, open-air lifestyle community center on the Bradley Fair Property (the “Bradley Fair Shopping Center”). The Bradley Fair Mortgage Loan is evidenced by one promissory note with an outstanding principal balance as of the Cut-off Date of $30,000,000. The Bradley Fair Mortgage Loan was originated on February 12, 2024 by 3650 Real Estate Investment Trust 2 LLC (“3650 REIT”). The Bradley Fair Mortgage Loan accrues interest at an interest rate of 6.38500% per annum on an Actual/360 basis. The Bradley Fair Mortgage Loan has an original term of 120 months and is interest only for the entire term. The scheduled maturity date of the Bradley Fair Mortgage Loan is March 5, 2034.
The Property. The Bradley Fair Property is a leased fee land parcel which contains the Bradley Fair Shopping Center, located at the intersection of Rock Road and 21st Street in Wichita, Kansas. The Bradley Fair Shopping Center is within the
| THE INFORMATION IN THIS STRUCTURAL AND COLLATERAL TERM SHEET IS NOT COMPLETE AND MAY BE AMENDED PRIOR TO THE TIME OF SALE. THIS TERM SHEET IS NOT AN OFFER TO SELL THESE SECURITIES AND IT IS NOT A SOLICITATION OF AN OFFER TO BUY THESE SECURITIES IN ANY JURISDICTION WHERE THE OFFER OR SALE IS NOT PERMITTED. |
| | 138 | |
| Structural and Collateral Term Sheet | | BMO 2024-C10 |
| No. 10 – Bradley Fair |
master planned community known as Wilson Estates. Wilson Estates includes a 103-key Hilton Garden Inn, approximately 547,000 square feet of office and retail space and Wilson Estates residential, a community with more than 200 homes ranging from $400,000 to over $2.5 million in value. The corporate headquarters for Koch Industries Inc. is located 4.5 miles northwest of the Bradley Fair Shopping Center and according to Forbes has approximately $125 billion in annual revenues and approximately 120,000 employees as of November 2023. The city is also home to the headquarters for Beechcraft and Cessna Aircraft Company.
The Bradley Fair Shopping Center is comprised of an open-air lifestyle community center totaling 285,359 square feet of rentable area. The Bradley Fair Shopping Center is comprised of 12 buildings that are occupied by 43 tenants and anchored by Trader Joe’s. Other major tenants include Lululemon, Warby Parker, Sephora, Pottery Barn, Barnes & Noble, GAP/Athleta and Nordstrom Rack. As of December 27, 2023, the Bradley Fair Shopping Center was 87.6% occupied with 60.0% of the rent roll having been in occupancy for upwards of 10 years, 20.0% having been in occupancy for 20 years or more, and 6.7% having been in occupancy for 30 years or more. According to a third-party market research report, the Trader Joe’s at the Bradley Fair Shopping Center ranks in the top 85% for visits nationwide and in the top 92% for visits in Kansas. According to the same report the Barnes & Noble at the Bradley Fair Shopping Center ranks in the top 89% for visits nationwide and the highest in Kansas.
The Bradley Fair Shopping Center is served by 1,604 surface parking spaces resulting in a parking ratio of 5.62 space per 1,000 square feet of net rentable area.
The borrower sponsor has had a controlling interest in the ownership of the Bradley Fair Shopping Center since 2019. On February 6, 2023, the borrower sponsor bifurcated its ownership in the Bradley Fair Property site into a fee interest and leasehold interest, which such leasehold is currently controlled by affiliates of the borrower sponsor. The 99-year ground lease between the borrower, as ground lessor, and Bradley Fair Properties LLC, an affiliate of the borrower, as ground lessee, is structured with an initial annual rent of $1.725 million with 2.35% annual escalations and a 10.0% increase every ten years beginning in 2033.
The following table presents certain information relating to historical performance of the Bradley Fair Shopping Center:
| Bradley Fair Shopping Center Historical Performance(1) |
| | 2013 | 2014 | 2015 | 2016 | 2017 | 2018 | 2019 | 2020(2) | 2021(2) | 2022(2) | TTM 9/30/2023(2) | Average |
| Occupancy | 100.0% | 97.0% | 95.0% | 88.0% | 86.0% | 86.0% | 81.0% | 79.0% | 83.0% | 83.0%(3) | 87.5%(3) | 87.8% |
| Total Revenue | $8,081,695 | $7,989,313 | $7,895,543 | $7,453,897 | $7,337,088 | $7,265,143 | $6,886,961 | $6,241,537 | $6,578,427 | $7,429,429 | $7,915,610 | $7,370,422 |
| Expenses | (2,661,931) | (2,954,360) | (2,783,419) | (2,761,359) | (2,823,987) | (2,982,546) | (3,093,670) | (2,987,716) | (3,116,122) | (3,643,397) | (3,748,258) | (3,050,615) |
| NOI | $5,419,764 | $5,034,953 | $5,112,124 | $4,692,538 | $4,513,101 | $4,282,597 | $3,793,291 | $3,253,821 | $3,462,305 | $3,786,032 | $4,167,352 | $4,319,807 |
| Look Through DY(4) | 18.1% | 16.8% | 17.0% | 15.6% | 15.0% | 14.3% | 12.6% | 10.8% | 11.5% | 12.6% | 13.9% | 14.4% |
| Total Revenue | $8,081,695 | $7,989,313 | $7,895,543 | $7,453,897 | $7,337,088 | $7,265,143 | $6,886,961 | $6,241,537 | $6,578,427 | $7,429,429 | $7,915,610 | $7,370,422 |
| UW Ground Rent(5) | 2,016,936 | 2,016,936 | 2,016,936 | 2,016,936 | 2,016,936 | 2,016,936 | 2,016,936 | 2,016,936 | 2,016,936 | 2,016,936 | 2,016,936 | 2,016,936 |
| Revenue/Ground Rent Coverage | 4.01x | 3.96x | 3.91x | 3.70x | 3.64x | 3.60x | 3.41x | 3.09x | 3.26x | 3.68x | 3.92x | 3.65x |
| NOI Before Ground Rent | $5,419,764 | $5,034,953 | $5,112,124 | $4,692,538 | $4,513,101 | $4,282,597 | $3,793,291 | $3,253,821 | $3,462,305 | $3,786,032 | $4,167,352 | $4,319,807 |
| UW Ground Rent(5) | 2,016,936 | 2,016,936 | 2,016,936 | 2,016,936 | 2,016,936 | 2,016,936 | 2,016,936 | 2,016,936 | 2,016,936 | 2,016,936 | 2,016,936 | 2,016,936 |
| NOI/Ground Rent Coverage | 2.69x | 2.50x | 2.53x | 2.33x | 2.24x | 2.12x | 1.88x | 1.61x | 1.72x | 1.88x | 2.07x | 2.14x |
| (1) | Per a third-party market research report, unless otherwise indicated. |
| (2) | Revenue, Expenses and NOI are based on the cash flows at the Bradley Fair Shopping Center. |
| (3) | 2022 occupancy is based on the Bradley Fair Shopping Center rent roll dated December 31, 2022. TTM 9/30/2023 occupancy is based on the Bradley Fair Shopping Center rent roll dated December 27, 2023. |
| (4) | Based on the cut-off date balance of the Bradley Fair Mortgage Loan. |
| (5) | Based on the underwritten cash flows of the ground rent at the Bradley Fair Property. |
| THE INFORMATION IN THIS STRUCTURAL AND COLLATERAL TERM SHEET IS NOT COMPLETE AND MAY BE AMENDED PRIOR TO THE TIME OF SALE. THIS TERM SHEET IS NOT AN OFFER TO SELL THESE SECURITIES AND IT IS NOT A SOLICITATION OF AN OFFER TO BUY THESE SECURITIES IN ANY JURISDICTION WHERE THE OFFER OR SALE IS NOT PERMITTED. |
| | 139 | |
| Structural and Collateral Term Sheet | | BMO 2024-C10 |
| No. 10 – Bradley Fair |
The following table presents certain information relating to the underwritten cash flows of the ground rent at the Bradley Fair Property:
| Underwritten Net Cash Flow |
| | Underwritten | Per Square Foot(1) | %(2) |
| Rents in Place | $2,016,936 | $1.41 | 100.0% |
| Effective Gross Income | $2,016,936 | $1.41 | 100.0% |
| Net Operating Income | $2,016,936 | $1.41 | 100.0% |
| Net Cash Flow | $2,016,936 | $1.41 | 100.0% |
| (1) | Based on the 1,434,847 square foot land parcel. |
| (2) | % column represents percent of Effective Gross Income. |
Appraisal. According to the appraisal, the Bradley Fair Property had an “as-is” appraised value of $40,000,000 as of December 20, 2023. The table below shows the appraisal’s “as-is” conclusions.
| Appraisal Valuation Summary(1) |
| Appraisal Approach | Appraised Value(2) | Capitalization Rate |
| Income Capitalization Approach | $40,000,000 | 4.50% |
| (2) | The appraisal provided a leased fee appraised value on the Bradley Fair Shopping Center of $94,900,000, equating to a look through loan-to-value ratio of 31.6%. |
Environmental. According to the Phase I environmental site assessment dated December 21, 2023, there was no evidence of any recognized environmental conditions at the Bradley Fair Property and no further action was recommended.
The Market. The Bradley Fair Property is located in the northeastern portion of the Wichita, KS metropolitan area (the “Wichita MSA”. The Wichita MSA is 4,139 square miles in size and ranks 92nd in population out of the nation’s 382 metropolitan areas.
According to the appraisal, the Bradley Fair Property is located in the Northeast retail submarket within the Wichita retail market. As of the second quarter of 2023, the Wichita retail market had an inventory of approximately 47.7 million square feet, with a vacancy rate of 3.7%. The market recorded average asking rents of $13.10 per square foot with 132,821 square feet absorbed in the second quarter of 2023.
The Northeast retail submarket reported retail inventory of approximately 8.1 million square feet with a vacancy rate of 3.8%. As of the second quarter of 2023, the submarket recorded average asking rents of $15.90 per square foot with 16,990 square feet absorbed and no new space delivered, provided that 9,800 square feet was under construction.
According to the appraisal, the 2023 population within a one-, three- and five-mile radius of the Bradley Fair Property was 7,095, 58,375, and 153,535, respectively, and the median household income within the same radii was $63,046, $66,144 and $58,033, respectively.
The Borrower. The borrower is Bradley Fair Fee Owner LLC, a Delaware limited liability company and single-purpose entity having at least one independent director in its organizational structure. Legal counsel to the borrower delivered a non-consolidation opinion in connection with the origination of the Bradley Fair Mortgage Loan. The borrower is affiliated with WS Development. WS Development was founded in 1990 and is a privately owned and vertically integrated real estate development firm headquartered outside of Boston, MA. WS Development is a long-term holder of assets, having developed or substantially redeveloped over 100 assets in 13 states and sold only four in its 35-year history. The majority of the company’s assets are comprised of retail centers.
The Borrower Sponsor. The non-recourse carveout guarantor and borrower sponsor is SDM Holdings LLC.
Property Management. The Bradley Fair Property is self-managed.
Escrows and Reserves. At origination of the Bradley Fair Mortgage Loan, the borrower deposited $474,420 into a payment reserve, an amount equal to 100% of the projected debt service shortfall, as determined by the lender.
| THE INFORMATION IN THIS STRUCTURAL AND COLLATERAL TERM SHEET IS NOT COMPLETE AND MAY BE AMENDED PRIOR TO THE TIME OF SALE. THIS TERM SHEET IS NOT AN OFFER TO SELL THESE SECURITIES AND IT IS NOT A SOLICITATION OF AN OFFER TO BUY THESE SECURITIES IN ANY JURISDICTION WHERE THE OFFER OR SALE IS NOT PERMITTED. |
| | 140 | |
| Structural and Collateral Term Sheet | | BMO 2024-C10 |
| No. 10 – Bradley Fair |
Lockbox / Cash Management. The Bradley Fair Mortgage Loan is structured with a hard lockbox and in place cash management. The borrower is required to cause all ground rents to be transmitted directly by ground lessee into a lender-controlled lockbox account. Any ground rents or any other income received by the borrower are required to be deposited in the lockbox account within one business day of receipt. Funds in the lockbox account will be swept daily into a cash management account and will be applied and disbursed in accordance with the Bradley Fair Mortgage Loan documents.
During the continuance of a Cash Trap Event Period (as defined below), the borrower is required to transfer all available cash to the lender, which will be transferred by the lender into a cash collateral subaccount and held as additional collateral for the Bradley Fair Mortgage Loan.
A “Cash Trap Event Period” means a period commencing upon the occurrence and continuance of an event of default and ending if the event of default has been cured and such cure has been accepted by the lender (provided that no other event of default has occurred and is continuing during and at the time of the expiration of such Cash Trap Event Period).
Subordinate and Mezzanine Debt. None.
Permitted Future Subordinate or Mezzanine Debt. Not permitted.
Partial Release. The borrower may obtain the release of two separate out parcels that are improved with buildings occupied by (i) On the Border (2.82 acres) and (ii) Chico’s (0.50 acres) at any time throughout the term of the Bradley Fair Mortgage Loan provided that, among other conditions, (a) no event of default exists; (b) with respect to each out parcel release, if the fee value of the applicable out parcel is greater than $600,000 (the “Paydown Trigger Amount”), as determined by lender pursuant to the appraisal for the Bradley Fair Property obtained by the lender prior to the date of the origination of the Bradley Fair Mortgage Loan (which appraisal valued the fee interest of each applicable out parcel as greater than $600,000), the borrower is required to either (x) prepay the Bradley Fair Mortgage Loan in an amount equal 110% of the Allocated Loan Amount (as defined below) for the applicable out parcel (the “Release Price”) or (y) consummate a partial defeasance event of the Bradley Fair Mortgage Loan in an amount equal to the Release Price (the “Partial Defeasance Amount”) and provide the lender with the partial defeasance collateral (an “Out Parcel Partial Defeasance”); and (z) except in connection with a partial defeasance event, pay the yield maintenance premium with respect to the portion of the Bradley Fair Mortgage Loan being prepaid, in accordance with the Bradley Fair Mortgage Loan documents; (c) with the release of the applicable out parcel, the borrower is required to simultaneously transfer the title or ownership of the applicable out parcel to a person other than the borrower; (d) the applicable out parcel is legally subdivided from the remaining Bradley Fair Property and the remaining Bradley Fair Property complies with all applicable subdivision laws, ordinances and regulations; and (e) with the release of the applicable out parcel, the borrower is required to simultaneously enter into and record a reciprocal easement agreement with the owner of the applicable out parcel.
An ”Allocated Loan Amount” for the applicable out parcel means $1,837,500 for the On the Border out parcel and $610,000 for the Chico’s out parcel.
Ground Lease. The 99-year ground lease commenced on February 6, 2023 and is structured with an initial annual rent payment of $1,725,000 with 2.35% annual escalations and then a 10.00% increase every ten years beginning in 2033.
| THE INFORMATION IN THIS STRUCTURAL AND COLLATERAL TERM SHEET IS NOT COMPLETE AND MAY BE AMENDED PRIOR TO THE TIME OF SALE. THIS TERM SHEET IS NOT AN OFFER TO SELL THESE SECURITIES AND IT IS NOT A SOLICITATION OF AN OFFER TO BUY THESE SECURITIES IN ANY JURISDICTION WHERE THE OFFER OR SALE IS NOT PERMITTED. |
| | 141 | |
| Structural and Collateral Term Sheet | | BMO 2024-C10 |
| No. 11 – Tropicale Foods |
| Mortgage Loan Information | | Property Information |
| Mortgage Loan Seller: | BMO | | Single Asset / Portfolio: | Single Asset |
| Original Principal Balance: | $29,710,000 | | Title: | Fee |
| Cut-off Date Principal Balance: | $29,710,000 | | Property Type – Subtype: | Industrial – Warehouse |
| % of IPB: | 4.1% | | Net Rentable Area (SF): | 210,028 |
| Loan Purpose: | Recapitalization | | Location: | Lubbock, TX |
| Borrowers: | AGNL Scoop, L.P. | | Year Built / Renovated: | 1972 / 2022 |
| Borrower Sponsors(1): | Angelo, Gordon & Co., L.P. and TPG, Inc. | | Occupancy: | 100.0% |
| Interest Rate: | 6.38500% | | Occupancy Date: | 11/6/2024 |
| Note Date: | 10/8/2024 | | 4th Most Recent NOI (As of)(2): | NAV |
| Maturity Date: | 11/6/2034 | | 3rd Most Recent NOI (As of)(2): | NAV |
| Interest-only Period: | 120 months | | 2nd Most Recent NOI (As of)(2): | NAV |
| Original Term: | 120 months | | Most Recent NOI (As of)(2): | NAV |
| Original Amortization Term: | None | | UW Economic Occupancy: | 100.0% |
| Amortization Type: | Interest Only | | UW Revenues: | $3,851,936 |
| Call Protection: | L(24),DorYM1(89),O(7) | | UW Expenses: | $265,556 |
| Lockbox / Cash Management: | Hard / Springing | | UW NOI: | $3,586,380 |
| Additional Debt: | No | | UW NCF: | $3,586,380 |
| Additional Debt Balance: | N/A | | Appraised Value / Per SF: | $69,600,000 / $331 |
| Additional Debt Type: | N/A | | Appraisal Date: | 8/16/2024 |
| | | | | |
| Escrows and Reserves | | Financial Information |
| | Initial | Monthly | Cap | | Cut-off Date Loan / SF: | $141 |
| Taxes(3): | $0 | Springing | N/A | | Maturity Date Loan / SF: | $141 |
| Insurance(3): | $0 | Springing | N/A | | Cut-off Date LTV: | 42.7% |
| Replacement Reserves(3): | $0 | Springing | $3,500 | | Maturity Date LTV: | 42.7% |
| TI / LC(3): | $0 | Springing | $17,502 | | UW NCF DSCR: | 1.86x |
| | | | | | UW NOI Debt Yield: | 12.1% |
| | | | | | | |
| Sources and Uses |
| Sources | Proceeds | % of Total | | Uses | Proceeds | % of Total |
| Mortgage Loan | $29,710,000 | 100.0% | | Principal Equity Distribution | $28,724,336 | 96.7 | % |
| | | | | Closing Costs | 985,664 | 3.3 | |
| Total Sources | $29,710,000 | 100.0% | | Total Uses | $29,710,000 | 100.0 | % |
| (1) | The borrower sponsors are affiliated with the borrower sponsors of the Sterling Portfolio Mortgage Loan, the the Douglas Dynamics Portfolio Properties and the Quantix Mortgage Loan, which are also being contributed to the BMO 2024-C10 transaction. |
| (2) | Historical financial information is unavailable given the borrower sponsor purchased the Tropicale Foods Property (as defined below) in a sale leaseback transaction since acquired in July 2022. |
| (3) | Monthly deposits for taxes, insurance, replacement reserves and TI/LC will be waived so long as there is no event of default or tenant trigger event, as defined in the Tropicale Foods Mortgage Loan documents, has occurred. |
| THE INFORMATION IN THIS STRUCTURAL AND COLLATERAL TERM SHEET IS NOT COMPLETE AND MAY BE AMENDED PRIOR TO THE TIME OF SALE. THIS TERM SHEET IS NOT AN OFFER TO SELL THESE SECURITIES AND IT IS NOT A SOLICITATION OF AN OFFER TO BUY THESE SECURITIES IN ANY JURISDICTION WHERE THE OFFER OR SALE IS NOT PERMITTED. |
| | 142 | |
| Structural and Collateral Term Sheet | | BMO 2024-C10 |
| No. 11 – Tropicale Foods |
The Loan. The eleventh largest mortgage loan (the “Tropicale Foods Mortgage Loan”) is evidenced by a single promissory note in the original principal amount of $29,710,000 and secured by a first mortgage lien on the borrower’s fee simple interest in a 210,028 square foot industrial property located in Lubbock, Texas (the “Tropicale Foods Property”). The Tropicale Foods Mortgage Loan was originated on October 8, 2024 by Bank of Montreal, has an outstanding balance as of the Cut-off Date of $29,710,000 and accrues interest at a fixed rate of 6.38500% per annum on an Actual/360 basis. The scheduled maturity date of the Tropicale Foods Mortgage Loan is November 6, 2034.
The Property. The Tropicale Foods Mortgage Loan is secured by a two-story industrial property totaling 210,028 square feet located in Lubbock, Texas. The property was built in 1972 and renovated in 2022. The borrower sponsor purchased the Tropicale Foods Property from Tropicale Foods, LLC (the “Tropicale Foods Tenant”), which subsequently executed a 22.5 year absolute net lease with no termination options for the entire Tropicale Foods Property. Since its acquisition of the Tropicale Foods Property, the borrower sponsor funded $27.3 million in capital expenditures, including refrigeration, mechanical, electrical and plumbing infrastructure as well as roof and parking lot replacements. Since 2022, the Tropicale Foods Tenant has funded $26.0 million in production related build out.
Tropicale Foods is a manufacturer of Hispanic-inspired frozen novelty products under the Helados Mexico brand. The Tropicale Foods Property is the Tropicale Foods Tenant’s sixth manufacturing site and the first located outside of California.
Environmental. According to the Phase I environmental report dated August 28, 2024, there was no evidence of any recognized environmental conditions at the Tropicale Foods Property.
The following table presents certain information relating to the historical and current occupancy of the Tropicale Foods Property:
| Historical and Current Occupancy |
| 2021(1) | 2022(1) | 2023(1) | Current(2) |
| NAV | NAV | NAV | 100.0% |
| (1) | The borrower sponsor acquired the Tropicale Foods Property in 2022. As such, historical occupancy is unavailable. |
| (2) | Current occupancy is based on the underwritten rent roll as of November 6, 2024. |
The following table presents certain information relating to the sole tenant at the Tropicale Foods Property:
| Sole Tenant Summary(1) |
| Tenant Name | Credit Rating (Moody's/ S&P/Fitch) | Net Rentable Area (SF) | % of Total NRA | UW Base Rent PSF | UW Base Rent | % of
Total
UW
Base
Rent | Lease Exp. Date |
| Tropicale Foods | NR/NR/NR | 210,028 | 100.0 | % | $17.08 | $3,586,380 | 100.0% | 9/30/2045 |
| Occupied Total Collateral | | 210,028 | 100.0 | % | $17.08 | $3,586,380 | 100.0% | |
| Vacant Space | | 0 | 0.0 | | | | | |
| Totals/ Wtd. Avg. | | 210,028 | 100.0 | % | | | | |
| (1) | Based on the underwritten rent roll dated November 6, 2024, inclusive of rent steps through March 2025. |
| THE INFORMATION IN THIS STRUCTURAL AND COLLATERAL TERM SHEET IS NOT COMPLETE AND MAY BE AMENDED PRIOR TO THE TIME OF SALE. THIS TERM SHEET IS NOT AN OFFER TO SELL THESE SECURITIES AND IT IS NOT A SOLICITATION OF AN OFFER TO BUY THESE SECURITIES IN ANY JURISDICTION WHERE THE OFFER OR SALE IS NOT PERMITTED. |
| | 143 | |
| Structural and Collateral Term Sheet | | BMO 2024-C10 |
| No. 11 – Tropicale Foods |
The following table presents certain information relating to the lease rollover schedule at the Tropicale Foods Property:
| Lease Rollover Schedule(1) |
| Year | Number of Leases Expiring | Net Rentable Area Expiring | % of NRA Expiring | UW Base Rent Expiring | % of UW Base Rent Expiring | Cumulative Net Rentable Area Expiring | Cumulative % of NRA Expiring | Cumulative UW Base Rent Expiring | Cumulative % of UW Base Rent Expiring |
| 2035 & Beyond | 1 | 210,028 | 100.0% | $3,586,380 | 100.0% | 210,028 | 100.0% | $3,586,380 | 100.0% |
| Total/Wtd. Avg. | 1 | 210,028 | 100.0% | $3,586,380 | 100.0% | | | | |
| (1) | Based on the underwritten rent roll dated November 6, 2024, inclusive of rent steps through March 2025. |
The following table presents certain information relating to the underwritten cash flows of the Tropicale Foods Property:
| Underwritten Net Cash Flow(1) |
| | Underwritten | PSF | %(2) |
| Base Rent | $3,481,922 | $16.58 | 90.4 | % |
| Rent Steps | 104,458 | 0.50 | 2.7 | |
| Total Base Rent(3) | $3,586,380 | $17.08 | 93.1 | % |
| Expense Recoveries | 265,556 | 1.26 | 6.9 | |
| Total Reimbursements | $265,556 | $1.26 | 6.9 | % |
| Gross Potential Rent | $3,851,936 | $18.34 | 100.0 | % |
| Total Vacancy | 0 | 0.00 | 0.0 | |
| Effective Gross Income | $3,851,936 | $18.34 | 100.0 | % |
| Management Fees | 37,392 | 0.18 | 1.0 | |
| Operating Expenses | 228,164 | 1.09 | 5.9 | |
| Total Expenses | $265,556 | $1.26 | 6.9 | % |
| Net Operating Income | $3,586,380 | $17.08 | 93.1 | % |
| Total TI/LC | 0 | 0.00 | 0.0 | |
| Capital Expenditures | 0 | 0.00 | 0.0 | |
| Net Cash Flow | $3,586,380 | $17.08 | 93.1 | % |
| (1) | Historical financial information is unavailable given the borrower sponsor purchased the Tropicale Foods Property in a sale-leaseback transaction in July 2022. |
| (2) | % column represents percent of Gross Potential Rent for all revenue fields and percent of Effective Gross Income for all other fields. |
| (3) | Based on the underwritten rent roll November 6, 2024, inclusive of rent steps through March 2025. |
| THE INFORMATION IN THIS STRUCTURAL AND COLLATERAL TERM SHEET IS NOT COMPLETE AND MAY BE AMENDED PRIOR TO THE TIME OF SALE. THIS TERM SHEET IS NOT AN OFFER TO SELL THESE SECURITIES AND IT IS NOT A SOLICITATION OF AN OFFER TO BUY THESE SECURITIES IN ANY JURISDICTION WHERE THE OFFER OR SALE IS NOT PERMITTED. |
| | 144 | |
| Structural and Collateral Term Sheet | | BMO 2024-C10 |
| No. 11 – Tropicale Foods |
The Market. The Tropicale Foods Property is located in Lubbock, Texas. Lubbock contains several major United States thoroughfares including US Highway 62, which runs from the Mexico/US border to the Canada/US border, US Highway 84, State Highway 289 and Interstate 27. Both US Highway 62 and Interstate Highway 27 are located within the vicinity of the Tropicale Foods Property providing primary access.
According to a third party market research report, the Tropicale Foods Property is located in the Southeast Inner Loop submarket, which has an inventory of more than 19.2 million square feet with no completions as of the second quarter of 2024. Submarket rents currently average $8.78 PSF, higher than the $7.64 market average, with a vacancy rate of 1.5%. Logistics space is the largest subtype in the submarket with 16.5 million square feet, followed by 2.8 million square feet of specialized space.
According to the appraisal, the 2024 total population within a 1-, 3- and 5-mile radius of the Tropicale Foods Property was 3,319, 52,408 and 121,053, respectively, and the 2024 median household income within the same radii was $32,932, $35,964 and $47,727, respectively.
The following table presents certain information relating to comparable industrial leases for the Tropicale Foods Property:
| Comparable Industrial Leases(1) |
Property Name Location | Year Built / Renovated | Total NRA (SF) | Tenant | Lease Date/ Term (Mos.) | Lease Size (SF) | Base Rent PSF | Reimb. |
Tropicale Foods Lubbock, TX | 1972 / 2022 | 210,028(2) | Tropicale Foods | Jul-22 / 270 | 210,028(2) | $17.08(2) | Triple Net |
Cold Summit Dallas Dallas, TX | 2021 / NAP | 343,250 | Lineage Logistics | Mar-23 / 68 | 205,931 | $16.00 | Triple Net |
Whole Foods Manor, TX | 2023 / NAP | 131,770 | Whole Foods | Apr-23 / 240 | 131,770 | $15.25 | Triple Net |
Woolf Logistics Waddell, AZ | 2022 / NAP | 347,500 | Lineage Logistics | Jan-24 / 64 | 174,300 | $16.92 | Triple Net |
733 Autonomous Drive Ridgeville, SC | 2023 / NAP | 293,814 | Performance Team, LLC | Aug-23 / 180 | 293,814 | $17.47 | Triple Net |
PL Cold Warehouse Greenfield, IN | 2023 / NAP | 297,740 | Progressive Logistics | Oct-23 / 180 | 297,740 | $19.83 | Triple Net |
| (1) | Information obtained from the appraisal unless otherwise indicated. |
| (2) | Based on the underwritten rent roll dated November 6, 2024, inclusive of rent steps through March 2025 totaling $104,458. |
| THE INFORMATION IN THIS STRUCTURAL AND COLLATERAL TERM SHEET IS NOT COMPLETE AND MAY BE AMENDED PRIOR TO THE TIME OF SALE. THIS TERM SHEET IS NOT AN OFFER TO SELL THESE SECURITIES AND IT IS NOT A SOLICITATION OF AN OFFER TO BUY THESE SECURITIES IN ANY JURISDICTION WHERE THE OFFER OR SALE IS NOT PERMITTED. |
| | 145 | |
| Structural and Collateral Term Sheet | | BMO 2024-C10 |
| No. 12 – Springfield Center |
| Mortgage Loan Information | | Property Information |
| Mortgage Loan Seller: | CREFI | | Single Asset / Portfolio: | Single Asset |
| Original Principal Balance: | $29,160,000 | | Title: | Fee |
| Cut-off Date Principal Balance: | $29,160,000 | | Property Type – Subtype: | Retail – Anchored |
| % of IPB: | 4.0% | | Net Rentable Area (SF): | 176,698 |
| Loan Purpose: | Acquisition | | Location: | Springfield, VA |
| Borrower: | HRP Springfield LLC | | Year Built / Renovated: | 1999 / NAP |
| Borrower Sponsors: | Joseph R. Staugaard, III, Samuel M.V. Hamilton, III and Brian D. Hickey | | Occupancy: | 100.0% |
| Interest Rate: | 5.84000% | | Occupancy Date: | 8/28/2024 |
| Note Date: | 9/18/2024 | | 4th Most Recent NOI (As of): | $4,188,810 (12/31/2021) |
| Maturity Date: | 10/6/2034 | | 3rd Most Recent NOI (As of)(2): | $4,162,513 (12/31/2022) |
| Interest-only Period: | 120 months | | 2nd Most Recent NOI (As of)(2): | $3,336,187 (12/31/2023) |
| Original Term: | 120 months | | Most Recent NOI (As of)(3): | $3,163,324 (TTM 6/30/2024) |
| Original Amortization Term: | None | | UW Economic Occupancy: | 95.1% |
| Amortization Type: | Interest Only | | UW Revenues: | $4,988,869 |
| Call Protection: | L(25),D(88),O(7) | | UW Expenses: | $975,970 |
| Lockbox / Cash Management: | Hard / Springing | | UW NOI(3): | $4,012,899 |
| Additional Debt: | No | | UW NCF: | $3,786,175 |
| Additional Debt Balance: | N/A | | Appraised Value / Per SF: | $49,300,000 / $279 |
| Additional Debt Type: | N/A | | Appraisal Date: | 8/1/2024 |
| | | | | |
| Escrows and Reserves | | Financial Information |
| | Initial | Monthly | Initial Cap | | Cut-off Date Loan / SF: | $165 | |
| Taxes: | $286,122 | $47,687 | N/A | | Maturity Date Loan / SF: | $165 | |
| Insurance(1): | $0 | Springing | N/A | | Cut-off Date LTV: | 59.1% | |
| Replacement Reserves: | $0 | $2,209 | N/A | | Maturity Date LTV: | 59.1% | |
| TI / LC: | $0 | $8,099 | $500,000 | | UW NCF DSCR: | 2.19x | |
| Deferred Maintenance: | $458,763 | $0 | N/A | | UW NOI Debt Yield: | 13.8% | |
| | | | | | | |
| Sources and Uses |
| Sources | Proceeds | % of Total | | Uses | Proceeds | % of Total |
| Mortgage Loan | $29,160,000 | 57.5 | % | | Purchase Price | $49,100,000 | 96.8 | % |
| Sponsor Equity | 20,754,072 | 40.9 | | | Closing Costs | 868,600 | 1.7 | |
| Other Sources | 799,413 | 1.6 | | | Upfront Reserves | 744,885 | 1.5 | |
| Total Sources | $50,713,484 | 100.0 | % | | Total Uses | $50,713,484 | 100.0 | % |
| (1) | If the liability or casualty policy maintained by the borrower is not an approved blanket or umbrella policy, on each monthly payment date, the borrower is required to deposit into an insurance reserve an amount equal to 1/12th of the insurance premiums that the lender estimates will be payable for the renewal of coverage. At origination of the Springfield Center Mortgage Loan (as defined below), the borrower maintained an approved blanket policy and was not obligated to make a deposit into the insurance reserve. |
| (2) | The decrease between the 3rd Most Recent NOI and 2nd Most Recent NOI is due to a former tenant vacating in 2023. |
| (3) | The increase between Most Recent NOI and UW NOI is primarily due to the largest tenant, Bob's Discount Furniture, which accounts for 21.4% of net rentable area and $983,034 of underwritten base rent commencing lease payments in May 2024. |
The Loan. The twelfth largest mortgage loan (the “Springfield Center Mortgage Loan”) is secured by the borrower’s fee interest in an anchored retail center totaling 176,698 square feet located in Springfield, Virginia (the “Springfield Center Property”). The Springfield Center Mortgage Loan was originated on September 18, 2024 by Citi Real Estate Funding Inc. (“CREFI”) and accrues interest at a fixed rate of 5.8400% per annum on an Actual/360 basis. The Springfield Center Mortgage Loan has an initial term of 10 years and is interest-only for the full term. The scheduled maturity date of the Springfield Center Mortgage Loan is the payment date that occurs on October 6, 2034.
| THE INFORMATION IN THIS STRUCTURAL AND COLLATERAL TERM SHEET IS NOT COMPLETE AND MAY BE AMENDED PRIOR TO THE TIME OF SALE. THIS TERM SHEET IS NOT AN OFFER TO SELL THESE SECURITIES AND IT IS NOT A SOLICITATION OF AN OFFER TO BUY THESE SECURITIES IN ANY JURISDICTION WHERE THE OFFER OR SALE IS NOT PERMITTED. |
| | 146 | |
| Structural and Collateral Term Sheet | | BMO 2024-C10 |
| No. 12 – Springfield Center |
The Property. The Springfield Center Property is an anchored retail center comprised of three buildings totaling 176,698 square feet positioned along Loisdale Road and Spring Mall Road in Springfield, Virginia. The Springfield Center Property was constructed in 1999 and is located on two non-contiguous sites encompassing approximately 14.4 acres. The Springfield Center Property features 787 parking spaces resulting in a parking ratio of 4.45 spaces per 1,000 square feet. The Springfield Center Property is anchored by Bob's Discount Furniture (“Bob’s”) and features other national retailers including Michael’s, Barnes & Noble and Marshall’s. Additionally, tenants comprising 60.4% of net rentable area have been in occupancy since 2008. As of August 28, 2024, the Springfield Center Property was 100.0% occupied by eight tenants at an average rent of $24.20 per square foot with a weighted average lease term remaining of 6.0 years.
Major Tenants. The three largest tenants at the Springfield Center Property based on underwritten base rent are Bob’s, DSW and Michael’s.
Bob’s (37,809 square feet; 21.4% of NRA; 23.0% of underwritten base rent): Founded in 1991, Bob’s provides a wide variety of furnishings, including living room furniture, bedroom furniture, dining room furniture, office furniture and home accents. Bob’s operates 177 stores spanning across 24 states. Bob’s was acquired by Bain Capital in 2013 and ranks as one of the 10 largest furniture chains in the United States as of July 2024. Bob’s recently commenced a 10-year lease in January 2024, with a current lease term through May 2034. Bob’s has two, five-year extension options and no termination options.
DSW (27,891 square feet; 15.8% of NRA; 18.1% of underwritten base rent): DSW is an American shoe retailer that sells designer and name brand shoes and fashion accessories. DSW currently operates over 500 stores in the United States and Canada in addition to an e-commerce website. DSW is a subsidiary of Designer Brands (NYSE: DBI). DSW has occupied the Springfield Center Property since November 1999. DSW recently executed a five-year extension in May 2024, extending the lease through January 2030. DSW has no termination options.
Michael’s (24,866 square feet; 14.1% of NRA; 13.7% of underwritten base rent): Founded in 1973, Michael’s is a provider of arts, crafts, framing, floral and wall décor, and merchandise for makers and do-it yourself home decorators. Michael’s currently operates over 1,300 stores in 49 states and Canada. Michael’s has occupied the Springfield Center Property since October 2000, has one, five-year extension option remaining and no termination options.
Environmental. According to the Phase I environmental assessment dated July 29, 2024, there was no evidence of any recognized environmental conditions at the Springfield Center Property.
The following table presents certain information relating to the historical and current occupancy of the Springfield Center Property:
| Historical and Current Occupancy(1) |
| 2021 | 2022 | 2023(2) | Current(3) |
| 100.0% | 100.0% | 82.2% | 100.0% |
| (1) | Historical Occupancies are the annual average physical occupancy of each respective year. |
| (2) | The drop in occupancy is attributable to Bed Bath & Beyond vacating its space in 2023. The space was subsequently backfilled by Bob’s. |
| (3) | Based on the underwritten rent roll dated August 28, 2024. |
| THE INFORMATION IN THIS STRUCTURAL AND COLLATERAL TERM SHEET IS NOT COMPLETE AND MAY BE AMENDED PRIOR TO THE TIME OF SALE. THIS TERM SHEET IS NOT AN OFFER TO SELL THESE SECURITIES AND IT IS NOT A SOLICITATION OF AN OFFER TO BUY THESE SECURITIES IN ANY JURISDICTION WHERE THE OFFER OR SALE IS NOT PERMITTED. |
| | 147 | |
| Structural and Collateral Term Sheet | | BMO 2024-C10 |
| No. 12 – Springfield Center |
The following table presents certain information relating to the largest tenants based on underwritten base rent at the Springfield Center Property:
| Top Tenant Summary(1) |
| Tenant | Ratings Moody’s/S&P/Fitch(2) | Net Rentable Area (SF) | % of Total NRA | UW Base Rent PSF(3) | UW Base Rent(3) | % of Total UW Base Rent(3) | Lease Expiration Date | Tenant Sales per SF(4) | Occupancy Cost |
| Bob's | NR/NR/NR | 37,809 | 21.4 | % | $26.00 | $983,034 | 23.0 | % | 5/31/2034 | NAV | NAV |
| DSW | NR/NR/NR | 27,891 | 15.8 | | $27.82 | 775,928 | 18.1 | | 1/31/2030 | NAV | NAV |
| Michael's | NR/NR/NR | 24,866 | 14.1 | | $23.60 | 586,838 | 13.7 | | 2/28/2026 | NAV | NAV |
| The Tile Shop | NR/NR/NR | 30,145 | 17.1 | | $19.00 | 572,755 | 13.4 | | 6/30/2028 | $111.95 | 21.8% |
| Barnes & Noble | NR/NR/NR | 22,320 | 12.6 | | $24.00 | 535,680 | 12.5 | | 2/28/2035 | $197.93 | 14.9% |
| Marshalls | NR/NR/NR | 20,567 | 11.6 | | $21.50 | 442,191 | 10.3 | | 3/31/2029 | $482.41 | 5.5% |
| Party City | NR/NR/NR | 11,600 | 6.6 | | $26.00 | 301,600 | 7.1 | | 1/31/2028 | $169.41 | 18.9% |
| Subway | NR/NR/NR | 1,500 | 0.8 | | $51.50 | 77,250 | 1.8 | | 3/31/2029 | $409.15 | 13.9% |
| Total Occupied | 176,698 | 100.0 | % | $24.20 | $4,275,275 | 100.0 | % | | | |
| Vacant Space | | 0 | 0.0 | | | | | | | |
| Total / Wtd. Avg. | 176,698 | 100.0 | % | | | | | | |
| (1) | Based on the underwritten rent roll dated August 28, 2024. |
| (2) | In certain instances, ratings provided are those of the parent company of the entity shown, whether or not the parent company guarantees the lease. |
| (3) | UW Base Rent PSF, UW Base Rent and % of Total UW Base Rent include contractual rent steps of $69,210 through April 1, 2025. |
| (4) | Tenant Sales per SF are based on 2023 sales data provided by the borrower. |
| THE INFORMATION IN THIS STRUCTURAL AND COLLATERAL TERM SHEET IS NOT COMPLETE AND MAY BE AMENDED PRIOR TO THE TIME OF SALE. THIS TERM SHEET IS NOT AN OFFER TO SELL THESE SECURITIES AND IT IS NOT A SOLICITATION OF AN OFFER TO BUY THESE SECURITIES IN ANY JURISDICTION WHERE THE OFFER OR SALE IS NOT PERMITTED. |
| | 148 | |
| Structural and Collateral Term Sheet | | BMO 2024-C10 |
| No. 12 – Springfield Center |
The following table presents certain information relating to tenant lease expirations at the Springfield Center Property:
| Lease Rollover Schedule(1)(2) |
| Year | Number of Leases Expiring | Net Rentable Area Expiring | % of NRA Expiring | UW Base Rent Expiring(3) | % of UW Base Rent Expiring(3) | Cumulative Net Rentable Area Expiring | Cumulative % of NRA Expiring | Cumulative UW Base Rent Expiring(3) | Cumulative % of UW Base Rent Expiring(3) |
| Vacant | NAP | 0 | 0.0 | % | NAP | NA | P | 0 | 0.0% | NAP | NAP |
| 2024 | 0 | 0 | 0.0 | | 0 | 0.0 | % | 0 | 0.0% | $0 | 0.0% |
| 2025 | 0 | 0 | 0.0 | | 0 | 0.0 | | 0 | 0.0% | $0 | 0.0% |
| 2026 | 1 | 24,866 | 14.1 | | 586,838 | 13.7 | | 24,866 | 14.1% | $586,838 | 13.7% |
| 2027 | 0 | 0 | 0.0 | | 0 | 0.0 | | 24,866 | 14.1% | $586,838 | 13.7% |
| 2028 | 2 | 41,745 | 23.6 | | 874,355 | 20.5 | | 66,611 | 37.7% | $1,461,192 | 34.2% |
| 2029 | 2 | 22,067 | 12.5 | | 519,441 | 12.1 | | 88,678 | 50.2% | $1,980,633 | 46.3% |
| 2030 | 1 | 27,891 | 15.8 | | 775,928 | 18.1 | | 116,569 | 66.0% | $2,756,561 | 64.5% |
| 2031 | 0 | 0 | 0.0 | | 0 | 0.0 | | 116,569 | 66.0% | $2,756,561 | 64.5% |
| 2032 | 0 | 0 | 0.0 | | 0 | 0.0 | | 116,569 | 66.0% | $2,756,561 | 64.5% |
| 2033 | 0 | 0 | 0.0 | | 0 | 0.0 | | 116,569 | 66.0% | $2,756,561 | 64.5% |
| 2034 | 1 | 37,809 | 21.4 | | 983,034 | 23.0 | | 154,378 | 87.4% | $3,739,595 | 87.5% |
| 2035 & Beyond | 1 | 22,320 | 12.6 | | 535,680 | 12.5 | | 176,698 | 100.0% | $4,275,275 | 100.0% |
| Total | 8 | 176,698 | 100.0 | % | $4,275,275 | 100.0 | % | | | | |
| (1) | Based on the underwritten rent roll dated August 28, 2024. |
| (2) | Certain tenants may have lease termination or contraction options that are exercisable prior to the originally stated expiration date of the subject lease and that are not considered in the lease rollover schedule. |
| (3) | UW Base Rent Expiring, % of UW Base Rent Expiring, Cumulative UW Base Rent Expiring and Cumulative % of UW Base Rent Expiring include contractual rent steps of $69,210 through April 1, 2025. |
| THE INFORMATION IN THIS STRUCTURAL AND COLLATERAL TERM SHEET IS NOT COMPLETE AND MAY BE AMENDED PRIOR TO THE TIME OF SALE. THIS TERM SHEET IS NOT AN OFFER TO SELL THESE SECURITIES AND IT IS NOT A SOLICITATION OF AN OFFER TO BUY THESE SECURITIES IN ANY JURISDICTION WHERE THE OFFER OR SALE IS NOT PERMITTED. |
| | 149 | |
| Structural and Collateral Term Sheet | | BMO 2024-C10 |
| No. 12 – Springfield Center |
The following table presents certain information relating to the operating history and underwritten net cash flows of the Springfield Center Property:
| Operating History and Underwritten Net Cash Flow |
| | 2021 | 2022 | 2023 | T12 June 2024 | Underwritten | Per Square Foot | %(1) |
| In Place Rent | $4,191,895 | $4,198,626(2) | $3,521,217(2) | $3,366,018(3) | $4,206,065(3) | $23.80 | | 80.6 | % |
| Contractual Rent Steps(4) | 0 | 0 | 0 | 0 | 69,210 | 0.39 | | 1.3 | |
| Gross Potential Rent | $4,191,895 | $4,198,626 | $3,521,217 | $3,366,018 | $4,275,275 | $24.20 | | 81.9 | % |
| Total Reimbursements | 1,008,813 | 964,424 | 728,626 | 751,245 | 944,917 | 5.35 | | 18.1 | |
| Total Gross Income | $5,200,708 | $5,163,050 | $4,249,843 | $4,117,262 | $5,220,192 | $29.54 | | 100.0 | % |
| Other Income | 47,715 | 41,770 | 37,440 | 35,180 | 25,500 | 0.14 | | 0.5 | |
| (Vacancy/Credit Loss) | 0 | 0 | 0 | 0 | (256,823) | (1.45 | ) | (4.9 | ) |
| Effective Gross Income | $5,248,423 | $5,204,820 | $4,287,283 | $4,152,442 | $4,988,869 | $28.23 | | 95.6 | % |
| Management Fee | 157,453 | 156,145 | 128,618 | 124,573 | 149,666 | 0.85 | | 3.0 | |
| Real Estate Taxes | 549,426 | 531,054 | 542,926 | 549,099 | 544,994 | 3.08 | | 10.9 | |
| Insurance | 69,002 | 71,882 | 83,519 | 80,136 | 46,000 | 0.26 | | 0.9 | |
| Other Expenses(5) | 283,732 | 283,227 | 196,033 | 235,310 | 235,310 | 1.33 | | 4.7 | |
| Total Expenses | $1,059,613 | $1,042,308 | $951,096 | $989,118 | $975,970 | $5.52 | | 19.6 | % |
| Net Operating Income | $4,188,810 | $4,162,513(2) | $3,336,187(2) | $3,163,324(3) | $4,012,899(3) | $22.71 | | 80.4 | % |
| Capital Expenditures | 0 | 0 | 0 | 0 | 26,505 | 0.15 | | 0.5 | |
| TI/LC | 0 | 0 | 0 | 0 | 200,219 | 1.13 | | 4.0 | |
| Net Cash Flow | $4,188,810 | $4,162,513 | $3,336,187 | $3,163,324 | $3,786,175 | $21.43 | | 75.9 | % |
| (1) | % column represents percent of Total Gross Income for all revenue lines and represents percent of Effective Gross Income for the remainder of fields. |
| (2) | The decrease between the 2022 In Place Rent and Net Operating Income and the 2023 In Place Rent and Net Operating Income is due to a former tenant vacating in 2023. |
| (3) | The increase between the T12 June 2024 In Place Rent and Net Operating Income and Underwritten In Place Rent and Net Operating Income is primarily due to Bob's, which accounts for 21.4% of net rentable area and $983,034 of underwritten base rent, commencing lease payments in May 2024. |
| (4) | Underwritten Contractual Rent Steps include contractual rent steps of $69,210 through April 1, 2025. |
| (5) | Other Expenses consist of general operating expenses and CAM expenses. |
| THE INFORMATION IN THIS STRUCTURAL AND COLLATERAL TERM SHEET IS NOT COMPLETE AND MAY BE AMENDED PRIOR TO THE TIME OF SALE. THIS TERM SHEET IS NOT AN OFFER TO SELL THESE SECURITIES AND IT IS NOT A SOLICITATION OF AN OFFER TO BUY THESE SECURITIES IN ANY JURISDICTION WHERE THE OFFER OR SALE IS NOT PERMITTED. |
| | 150 | |
| Structural and Collateral Term Sheet | | BMO 2024-C10 |
| No. 12 – Springfield Center |
The Market. The Springfield Center Property is located along Loisdale Road and Spring Mall Road in Springfield, Virginia. Springfield is located within Fairfax County and is part of the Washington-Arlington-Alexandria Metropolitan Statistical Area (“MSA”). The Springfield Center Property is located approximately 30 minutes outside of Washington D.C. According to the appraisal, the Springfield Center Property is located in the Springfield/Burke retail submarket of the Washington-Arlington-Alexandria MSA. As of the second quarter of 2024, the Springfield/Burke retail submarket had inventory of 9,012,942 square feet, a vacancy rate of 3.4%, and average asking rent of $40.34 per square foot.
According to the appraisal, the 2024 total population within a one-, three- and five-mile radius of the Springfield Center Property was 13,209, 103,677 and 349,194, respectively. Furthermore, the 2024 average household income within the same radii was $150,282, $184,880 and $171,699, respectively.
The following table presents information relating to comparable retail sales for the Springfield Center Property:
| Comparable Retail Sales Summary(1) |
| Property Name | Location | Distance From Subject | Transaction Date | Price / $PSF | Occupancy % | Size (SF) |
| Springfield Center Property | Springfield, VA | NAP | September 2024 | $49,100,000 / $278 | 100%(2) | 176,698(2) |
| Penn Mar Shopping Center | Forestville, MD | 19.8 miles | August 2024 | $68,500,000 / $181 | 91% | 378,205 |
| Riverview Plaza | Frederick, MD | 54.3 miles | July 2024 | $30,000,000 / $162 | 95% | 185,275 |
| Potomac Towne Center | Woodbridge, VA | 15.2 miles | August 2023 | $172,500,000 / $342 | 96% | 504,327 |
| Largo Towne Center | Largo, MD | 25.0 miles | July 2023 | $70,000,000 / $253 | 99% | 277,104 |
| Waldorf Marketplace | Waldorf, MD | 26.9 miles | March 2023 | $65,500,000 / $182 | 78% | 359,494 |
| Brandywine Crossing Phase I & II | Brandywine, MD | 27.3 miles | March 2022 | $64,000,000 / $277 | 93% | 231,036 |
| | | | | | | | | |
| (2) | Based on the underwritten rent roll dated August 28, 2024. |
| THE INFORMATION IN THIS STRUCTURAL AND COLLATERAL TERM SHEET IS NOT COMPLETE AND MAY BE AMENDED PRIOR TO THE TIME OF SALE. THIS TERM SHEET IS NOT AN OFFER TO SELL THESE SECURITIES AND IT IS NOT A SOLICITATION OF AN OFFER TO BUY THESE SECURITIES IN ANY JURISDICTION WHERE THE OFFER OR SALE IS NOT PERMITTED. |
| | 151 | |
| Structural and Collateral Term Sheet | | BMO 2024-C10 |
| No. 13 – Gotham Plaza |
| Mortgage Loan Information | | Property Information |
| Mortgage Loan Sellers: | 3650 REIT | | Single Asset / Portfolio: | Single Asset |
| Original Principal Balance: | $28,000,000 | | Title: | Fee |
| Cut-off Date Principal Balance: | $28,000,000 | | Property Type – Subtype: | Mixed Use – Office / Retail |
| % of IPB: | 3.9% | | Net Rentable Area (SF)(1): | 92,653 |
| Loan Purpose: | Refinance | | Location: | New York, NY |
| Borrower: | BDG Gotham Plaza, LLC | | Year Built / Renovated: | 2001 / NAP |
| Borrower Sponsor: | Edward Blumenfeld | | Occupancy(1): | 78.4% |
| Interest Rate: | 5.90000% | | Occupancy Date: | 8/14/2024 |
| Note Date: | 9/19/2024 | | 4th Most Recent NOI (As of): | $3,416,249 (12/31/2021) |
| Maturity Date: | 10/5/2034 | | 3rd Most Recent NOI (As of): | $3,962,622 (12/31/2022) |
| Interest-only Period: | 120 months | | 2nd Most Recent NOI (As of): | $3,466,919 (12/31/2023) |
| Original Term: | 120 months | | Most Recent NOI (As of): | $2,543,226 (6/30/2024 TTM) |
| Original Amortization Term: | None | | UW Economic Occupancy: | 79.8% |
| Amortization Type: | Interest Only | | UW Revenues: | $5,451,102 |
| Call Protection: | L(25),DorYM1(90),O(5) | | UW Expenses: | $1,723,832 |
| Lockbox / Cash Management: | Hard / Springing | | UW NOI: | $3,727,269 |
| Additional Debt: | No | | UW NCF: | $3,727,269 |
| Additional Debt Balance: | N/A | | Appraised Value / Per SF: | $51,700,000 / $558 |
| Additional Debt Type: | N/A | | Appraisal Date: | 5/30/2024 |
| | | | | |
| Escrows and Reserves | | Financial Information |
| | Initial | Monthly | Cap | | Cut-off Date Loan / SF: | $302 |
| Taxes: | $186,574 | $62,191 | N/A | | Maturity Date Loan / SF: | $302 |
| Insurance(2): | $0 | Springing | N/A | | Cut-off Date LTV: | 54.2% |
| Replacement Reserves: | $0 | $1,544 | N/A | | Maturity Date LTV: | 54.2% |
| TI / LC Reserve(3): | $1,300,000 | Springing | $1,000,000 | | UW NCF DSCR: | 2.23x |
| Other Reserve(4)(5): | $8,135,870 | Springing(6) | N/A | | UW NOI Debt Yield: | 13.3% |
| | | | | | | |
| Sources and Uses |
| Sources | Proceeds | % of Total | | Uses | Proceeds | % of Total |
| Mortgage Loan | $28,000,000 | 99.9 | % | | Loan Payoff | $17,245,372 | 61.5 | % |
| Borrower Sponsor Equity | 23,114 | 0.1 | | | Upfront Reserves | 9,622,444 | 34.3 | |
| | | | | Closing Costs | 1,155,297 | 4.1 | |
| Total Sources | $28,023,114 | 100.0 | % | | Total Uses | $28,023,114 | 100.0 | % |
| (1) | Net Rentable Area (SF) and Occupancy excludes the parking garage, which is comprised of 30,000 square feet. |
| (2) | On a monthly basis, the borrower is required to deposit 1/12th of an amount that would be sufficient to pay insurance premiums for the renewal of coverages; provided, such monthly deposits will be waived so long as the borrower maintains a blanket insurance policy acceptable to the lender and there is no event of default. |
| (3) | On a monthly basis, the borrower is required to deposit approximately $7,721 to pay for tenant allowances, tenant improvements and leasing commissions that may be incurred or required to be reimbursed by the borrower, capped at $1,000,000. |
| (4) | Other Reserves consist of an earnout reserve of $5,000,000, outstanding TI/LC reserve of $2,440,000, Taco Bell reserve of $89,484 and gap rent reserve of approximately $606,386. |
| (5) | The earnout reserve funds are deposited by the borrower as additional collateral for the loan and held in the earnout reserve subaccount. Disbursements from this account can be made once per quarter, provided no cash trap event period is continuing, and are contingent upon satisfying a debt yield condition and other specified requirements in the loan documents. If the conditions for disbursement are not met by the earnout reserve expiration date, the remaining funds will be held as additional collateral. On the open period start date, these funds will be applied towards prepayment of the debt, or upon the borrower's request, towards payment of the debt, subject to applicable premiums and shortfalls specified in the loan documents. |
| (6) | On a monthly basis during the continuance of a Lease Sweep Period (as defined below) (provided that no cash trap event period is then continuing, other than one triggered solely as a result of a Lease Sweep Period), the borrower is required to deposit all available cash into a lease sweep reserve subaccount for qualified leasing expenses with respect to any Lease Sweep Lease (as defined below). A “Lease Sweep Period” will commence on the first monthly payment date following the occurrence of any of the following, (a) with respect to a Lease Sweep Lease, the earlier to occur of (i) six months prior to the earliest stated expiration (including the stated expiration of any renewal term) of a Lease Sweep Lease, (ii) upon the date required under a Lease Sweep Lease by which the tenant thereunder is required to give notice of its exercise of a renewal option thereunder and such renewal has not been so exercised and (iii) the date that any tenant under a Lease Sweep Lease provides actual notice of its intent not to renew or extend its Lease Sweep Lease, (b) receipt of termination notice from a Lease Sweep Lease tenant by the borrower or manager, (c) if a Lease Sweep Lease is surrendered, cancelled or terminated prior to its then current expiration date, (d) if a Lease Sweep Lease tenant discontinues its business or vacates, (e) upon a monetary or material nonmonetary default by a Lease Sweep Lease tenant and (f) the occurrence of a Lease Sweep Lease tenant insolvency proceeding. A “Lease Sweep Lease” means the MTA lease and the Lifespire lease or any renewal or replacement of the MTA lease and the Lifespire lease. |
| THE INFORMATION IN THIS STRUCTURAL AND COLLATERAL TERM SHEET IS NOT COMPLETE AND MAY BE AMENDED PRIOR TO THE TIME OF SALE. THIS TERM SHEET IS NOT AN OFFER TO SELL THESE SECURITIES AND IT IS NOT A SOLICITATION OF AN OFFER TO BUY THESE SECURITIES IN ANY JURISDICTION WHERE THE OFFER OR SALE IS NOT PERMITTED. |
| | 152 | |
| Structural and Collateral Term Sheet | | BMO 2024-C10 |
| No. 13 – Gotham Plaza |
The Loan. The thirteenth largest mortgage loan (the “Gotham Plaza Mortgage Loan”) is evidenced by a single promissory note in the original principal amount of $28,000,000 and secured by a first mortgage lien on the borrower’s fee interest in a mixed-use property located in New York, New York (the “Gotham Plaza Property”). The Gotham Plaza Mortgage Loan was originated on September 19, 2024 by 3650 Real Estate Investment Trust 2 LLC (“3650 REIT”) and accrues interest at an interest rate of 5.90000% per annum on an Actual/360 basis. The Gotham Plaza Mortgage Loan has a 10-year term and is interest only for the entire term. The scheduled maturity date of the Gotham Plaza Mortgage Loan is October 5, 2034.
The Property. The Gotham Plaza Property is a 92,653 square feet mixed use office and retail property situated on a 1.24-acre through-block parcel located along the northerly side of East 125th Street, between Lexington and Third Avenue with additional frontage along East 126th Street in the East Harlem neighborhood of Manhattan in the City, County, and State of New York.
The Gotham Plaza Property was constructed in 2001 by the borrower, BDG Gotham Plaza, LLC (“BDG”), and consists of two condominium units which are comprised of a three-story mixed-use office and retail building and a subsurface parking garage. The Gotham Plaza Property is part of a larger five-unit condominium project resulting from the construction of an 11-story, 233-unit, residential building known as The Smile as well as an additional commercial condominium space that is currently utilized by Mount Sinai Hospital School of Nursing fronting East 126th Street. Both The Smile and the additional commercial condominium were developed as three additional condominium units in 2020 by BDG, which currently owns the three condominium units. Neither The Smile nor the additional commercial condominium units are collateral for the Gotham Plaza Mortgage Loan. The Gotham Plaza Property represents 41.4% of the total condominium development. In addition to the mixed-use office and retail building, the Gotham Plaza Property includes a 30,000 square feet subsurface level parking garage with 190 spaces. 25,931 of the rentable square footage at the Gotham Plaza Property is attributable to retail space and 66,722 is attributable to office space.
The Gotham Plaza Property is subject to an Industrial and Commercial Incentive Program (“ICIP”) tax abatement. The ICIP Final Certificate of Eligibility, issued on July 29, 2003, approved 123,500 square feet at the ICIP Property to receive 25-year ICIP benefits starting in the 2003/2004 tax year, expiring on June 30, 2028. The borrower has filed the ICIP Certificates of Continuing Use, and there have been no changes to the ICIP Property that would disqualify it from receiving ICIP benefits.
The Gotham Plaza Property is 78.4% occupied by nine tenants as of August 14, 2024. The largest tenant, Lifespire, represents 35.9% of the net rentable area and 40.3% of underwritten base rent.
Major Tenants. The three largest tenants at the Gotham Plaza Property are Lifespire, MTA and Foot Locker.
Lifespire (33,260 square feet; 35.9% of NRA, 40.3% of underwritten base rent): Lifespire, founded in 1951, is a not-for-profit social services company whose aim is to help individuals with intellectual/developmental disabilities. Lifespire currently has 82 locations throughout the five boroughs of New York City, as well as services and sites in Westchester, Ulster and Greene Counties. Lifespire is affiliated with the New York State Office for People With Development Disabilities and currently has over 1,000 employees serving 5,000 individuals in the region. Lifespire has been a tenant at the Gotham Plaza Property since inception. Lifespire’s lease expires in October of 2042.
MTA (17,647 square feet; 19.0% of NRA, 19.6% of underwritten base rent): The MTA is North America’s largest transportation network, serving a population of 15.3 million people across a 5,000 square-mile travel area surrounding New York City through Long Island, southeastern New York State, and Connecticut. The MTA network comprises the nation’s largest bus fleet and operates more subway and commuter rail cars than all other U.S. transit systems combined. The MTA executed a ten-year lease at the Gotham Plaza Property with two five-year renewal options. The MTA has signed a lease but is not yet in occupancy at the Gotham Plaza Property.
Foot Locker (5,350 square feet; 5.8% of NRA, 10.0% of underwritten base rent): Founded in 1974, Foot Locker, is an American multinational sportswear and footwear retailer headquartered in New York. As of February 3, 2024, Foot Locker, operated approximately 2,523 stores in 26 countries across North America, Europe, Australia, New Zealand and Asia. Foot Locker’s portfolio brands include Kids Foot Locker, Champs Sports, WSS and atmos. Foot Locker has been a tenant at the Gotham Plaza Property since inception. Foot Locker’s lease expires in January of 2032.
| THE INFORMATION IN THIS STRUCTURAL AND COLLATERAL TERM SHEET IS NOT COMPLETE AND MAY BE AMENDED PRIOR TO THE TIME OF SALE. THIS TERM SHEET IS NOT AN OFFER TO SELL THESE SECURITIES AND IT IS NOT A SOLICITATION OF AN OFFER TO BUY THESE SECURITIES IN ANY JURISDICTION WHERE THE OFFER OR SALE IS NOT PERMITTED. |
| | 153 | |
| Structural and Collateral Term Sheet | | BMO 2024-C10 |
| No. 13 – Gotham Plaza |
Environmental. According to the Phase I environmental site assessment dated June 3, 2024, there was no evidence of any recognized environmental conditions at the Gotham Plaza Property and no further action is recommended.
The following information presents certain information relating to the historical occupancy of the Gotham Plaza Property:
| Historical and Current Occupancy(1) |
| 2021 | 2022 | 2023 | Current(2) |
| 96.5% | 94.5% | 65.9% | 78.4% |
| (1) | Historical Occupancy is as of December 31 of each respective year. |
| (2) | Current Occupancy is as of August 14, 2024. |
The following table presents certain information relating to all tenants based on the net rentable area at the Gotham Plaza Property:
| Tenant Summary(1) |
| Tenant | Ratings
Moody’s/S&P/Fitch(2) | Net Rentable Area (SF) | % of
Total NRA | UW Base Rent PSF(3) | UW Base Rent(3) | % of Total
UW Base Rent(3) | Lease
Exp. Date |
| Lifespire | NR/NR/NR | 33,260 | 35.9 | % | $54.50 | $1,812,791 | 40.3% | 10/31/2042 |
| MTA(4)(5) | A3/AA+/AA | 17,647 | 19.0 | | $50.05 | 883,232 | 19.6% | 12/31/2034 |
| Foot Locker | Ba2/BB/NR | 5,350 | 5.8 | | $84.41 | 451,596 | 10.0% | 1/31/2032 |
| City MD | NR/NR/NR | 4,579 | 4.9 | | $83.00 | 380,057 | 8.5% | 1/30/2033 |
| Apple Bank | Baa1/NR/NR | 3,035 | 3.3 | | $100.00 | 303,500 | 6.8% | 6/30/2039 |
| Bank of America | Aa1/A+/AA | 2,538 | 2.7 | | $87.50 | 222,075 | 4.9% | 10/31/2027 |
| Pizza Hut(4) | Ba2/BB+/NR | 2,199 | 2.4 | | $58.21 | 128,000 | 2.8% | 9/30/2034 |
| Taco Bell | Ba2/BB+/NR | 2,120 | 2.3 | | $83.50 | 177,012 | 3.9% | 3/31/2033 |
| Dunkin Donuts(4) | B2/B+/NR | 1,940 | 2.1 | | $71.13 | 138,000 | 3.1% | 2/29/2040 |
| Total Occupied | 72,668 | 78.4 | % | $61.87 | $4,496,264 | 100.0% | |
| Vacant Space | | 19,985 | 21.6 | % | | | | |
| Collateral Total | | 92,653 | 100.00 | % | | | | |
| | | | | | | | |
| (1) | Based on the underwritten rent roll as of August 14, 2024. |
| (2) | In certain instances, ratings provided are those of the parent company of the entity shown, whether or not the parent company guarantees the lease. |
| (3) | UW Base Rent PSF, UW Base Rent and % of Total UW Base Rent includes rent steps totaling $79,623 through April 2025. |
| (4) | The MTA, Pizza Hut and Dunkin Donuts have signed leases but are not yet in occupancy. |
| (5) | The MTA lease has a one-time termination option, effective November 30, 2031, for which notice must be given no later than November 30, 2030. |
| THE INFORMATION IN THIS STRUCTURAL AND COLLATERAL TERM SHEET IS NOT COMPLETE AND MAY BE AMENDED PRIOR TO THE TIME OF SALE. THIS TERM SHEET IS NOT AN OFFER TO SELL THESE SECURITIES AND IT IS NOT A SOLICITATION OF AN OFFER TO BUY THESE SECURITIES IN ANY JURISDICTION WHERE THE OFFER OR SALE IS NOT PERMITTED. |
| | 154 | |
| Structural and Collateral Term Sheet | | BMO 2024-C10 |
| No. 13 – Gotham Plaza |
The following table presents certain information relating to the tenant lease expirations at the Gotham Plaza Property:
| Lease Rollover Schedule(1)(2) |
| Year | Number of Leases Expiring | Net Rentable Area Expiring | % of NRA Expiring | UW Base Rent Expiring(3) | % of UW Base Rent Expiring(3) | Cumulative Net Rentable Area Expiring | Cumulative % of NRA Expiring | Cumulative UW Base Rent Expiring(3) | Cumulative % of UW Base Rent Expiring(3) |
| Vacant | NAP | 19,985 | 21.6 | % | NAP | NA | P | 19,985 | 21.6% | NAP | NA | P |
| 2024 & MTM | 0 | 0 | 0.0 | | 0 | 0.0 | % | 19,985 | 21.6% | $0 | 0.0 | % |
| 2025 | 0 | 0 | 0.0 | | 0 | 0.0 | | 19,985 | 21.6% | $0 | 0.0 | % |
| 2026 | 0 | 0 | 0.0 | | 0 | 0.0 | | 19,985 | 21.6% | $0 | 0.0 | % |
| 2027 | 1 | 2,538 | 2.7 | | 222,075 | 4.9 | | 22,523 | 24.3% | $222,075 | 4.9 | % |
| 2028 | 0 | 0 | 0.0 | | 0 | 0.0 | | 22,523 | 24.3% | $222,075 | 4.9 | % |
| 2029 | 0 | 0 | 0.0 | | 0 | 0.0 | | 22,523 | 24.3% | $222,075 | 4.9 | % |
| 2030 | 0 | 0 | 0.0 | | 0 | 0.0 | | 22,523 | 24.3% | $222,075 | 4.9 | % |
| 2031 | 1 | 17,647 | 19.0 | | 883,232 | 19.6 | | 40,170 | 43.4% | $1,105,307 | 24.6 | % |
| 2032 | 1 | 5,350 | 5.8 | | 451,596 | 10.0 | | 45,520 | 49.1% | $1,556,903 | 34.6 | % |
| 2033 | 2 | 6,699 | 7.2 | | 557,069 | 12.4 | | 52,219 | 56.4% | $2,113,972 | 47.0 | % |
| 2034 | 1 | 2,199 | 2.4 | | 128,000 | 2.8 | | 54,418 | 58.7% | $2,241,972 | 49.9 | % |
| 2035 & Beyond | 3 | 38,235 | 41.3 | | 2,254,291 | 50.1 | | 92,653 | 100.0% | $4,496,264 | 100.0 | % |
| Total | 9 | 92,653 | 100.0 | % | $4,496,264 | 100.0 | % | | | | |
| (1) | Based on the underwritten rent roll as of August 14, 2024. |
| (2) | Certain tenants may have lease termination options that are exercisable prior to the stated expiration date of the subject lease or leases which are not considered in the Lease Rollover Schedule. |
| (3) | UW Base Rent Expiring, % of UW Base Rent Expiring, Cumulative UW Base Rent Expiring and Cumulative % of UW Base Rent Expiring include contractual rent steps totaling $79,623 through April 2025. |
The following table presents certain information relating to the historical operating results and underwritten cash flows of the Gotham Plaza Property:
| Operating History and Underwritten Net Cash Flow(1) |
| | 2021 | 2022 | 2023 | TTM 6/30/2024 | Underwritten | Per Square Foot | %(2) |
| Rents in Place | $3,490,504 | $4,095,620 | $4,031,393 | $3,332,173 | $4,416,640 | $47.67 | 71.1 | % |
| Vacancy Gross Up | 0 | 0 | 0 | 0 | 1,250,870 | 13.50 | 20.1 | |
| Rent Steps(3) | 0 | 0 | 0 | 0 | 217,122 | 2.34 | 3.5 | |
| Gross Potential Income | $3,490,504 | $4,095,620 | $4,031,393 | $3,332,173 | $5,884,633 | $63.51 | 94.7 | % |
| Total Reimbursements | 959,407 | 734,124 | 327,760 | 185,053 | 329,969 | 3.56 | 5.3 | |
| Net Rental Income | $4,449,911 | $4,829,745 | $4,359,153 | $3,517,226 | $6,214,602 | $67.07 | 100.0 | % |
| (Vacancy/Credit Loss) | 0 | 0 | 0 | 0 | (1,250,870) | (13.50) | (20.1 | ) |
| Other Income | 336,850 | 464,864 | 508,432 | 446,802 | 487,370 | 5.26 | 7.8 | |
| Effective Gross Income | $4,786,761 | $5,294,609 | $4,867,585 | $3,964,028 | $5,451,102 | $58.83 | 87.7 | % |
| Management Fee | 185,468 | 213,845 | 167,865 | 183,090 | 163,533 | 1.77 | 3.0 | |
| Real Estate Taxes | 410,529 | 501,001 | 578,341 | 650,340 | 966,109 | 10.43 | 17.7 | |
| Insurance | 33,008 | 57,607 | 109,294 | 106,448 | 113,267 | 1.22 | 2.1 | |
| Other Expenses(4) | 741,506 | 559,534 | 545,167 | 480,924 | 480,924 | 5.19 | 8.8 | |
| Total Expenses | $1,370,512 | $1,331,987 | $1,400,667 | $1,420,802 | $1,723,832 | $18.61 | 31.6 | % |
| Net Operating Income | $3,416,249 | $3,962,622 | $3,466,919 | $2,543,226 | $3,727,269 | $40.23 | 68.4 | % |
| Capital Expenditures | 0 | 0 | 0 | 0 | 18,531 | 0.20 | 0.3 | |
| TI/LC | 0 | 0 | 0 | 0 | 92,653 | 1.00 | 1.7 | |
| Upfront Reserve Credit | 0 | 0 | 0 | 0 | (111,184) | (1.20) | (2.0 | ) |
| Net Cash Flow | $3,416,249 | $3,962,622 | $3,466,919 | $2,543,226 | $3,727,269 | $40.23 | 68.4 | % |
| (1) | Based on the underwritten rent roll dated August 14, 2024. |
| (2) | % column represents percent of Net Rental Income for all revenue lines and represents percent of Effective Gross Income for the remainder of fields. |
| (3) | UW Rent Steps includes contractual rent steps totaling $79,623 through April 2025 and investment grade rent steps totaling $125,716. |
| (4) | Other Expenses consist of repairs and maintenance, utilities, general and administrative and payroll. |
| THE INFORMATION IN THIS STRUCTURAL AND COLLATERAL TERM SHEET IS NOT COMPLETE AND MAY BE AMENDED PRIOR TO THE TIME OF SALE. THIS TERM SHEET IS NOT AN OFFER TO SELL THESE SECURITIES AND IT IS NOT A SOLICITATION OF AN OFFER TO BUY THESE SECURITIES IN ANY JURISDICTION WHERE THE OFFER OR SALE IS NOT PERMITTED. |
| | 155 | |
| Structural and Collateral Term Sheet | | BMO 2024-C10 |
| No. 13 – Gotham Plaza |
The Market. The Gotham Plaza Property is located in the New York-Newark-Jersey City, NY-NJ-PA Metropolitan Statistical Area (the “New York MSA”), which had a 2023 population of approximately 20.2 million. According to the appraisal, the 2023 population within a one-, three-, and five-mile radius of the Gotham Plaza Property was 187,863, 1,302,888 and 2,894,691, respectively. Additionally, for the same radius, the median household income was $41,760, $62,674 and $65,916, respectively.
According to the appraisal, as of the first quarter of 2024, the New York office market had an inventory of 977.8 million square feet, with a vacancy rate of 14.1%. A total of 570,067 square feet of space was completed, while the market experienced a negative net absorption of approximately 3.1 million square feet, with 10.3 million square feet under construction. The asking rental rate in the market stood at $41.95 per square foot. The Gotham Plaza Property is located in the Harlem/North Manhattan submarket, which contains an inventory of 8.6 million square feet, with a vacancy rate of 14.7%. A total of 160,000 square feet was completed and delivered, while 408,627 square feet was under construction, with a positive net absorption of 437,868 square feet. The asking rental rate in the submarket stood at $45.72 per square foot.
According to the appraisal, as of the first quarter of 2024, the New York retail market had an inventory of 632.5 million square feet, with a vacancy rate of 4.1%. A total of 295,055 square feet of space was completed, while the market experienced a positive net absorption of 412,156 square feet, with 2.5 million square feet under construction. The asking rental rate in the market stood at $66.16 per square foot. The Gotham Plaza Property is located in the Harlem/North Manhattan retail submarket, which contains an inventory of approximately 10.5 million square feet, with a vacancy rate of 7.2%. No units were completed and delivered, while 291,354 square feet was under construction, with a negative net absorption of 27,242 square feet. The asking rental rate in the submarket stood at $73.98 per square foot.
The following table presents certain information relating to comparable office properties for the Gotham Plaza Property:
| Comparable Office Rental Summary(1) |
| Property Name | Location | Bldg. Size
(SF Net) | Tenant | Suite Size (SF) | Lease Commencement | Lease Term (Yrs) | Rent (PSF) | Lease Type |
| Gotham Plaza | New York, NY | 92,653(2) | Lifespire(2) | 33,260(2) | Oct-02(2) | 41(2) | $54.50(2) | Modified Gross |
| 215 West 125th Street | New York, NY | 170,841 | Listing | 22,500 | Current | 10 | $53.00 | Modified Gross |
| 520 West 135th Street | New York, NY | 57,884 | Emma Bowen Foundation | 32,000 | Jan-24 | 5.2 | $51.00 | Modified Gross |
| 55 West 125th Street | New York, NY | 228,017 | Dept of Veteran Affairs | 6,773 | Jan-24 | 10 | $53.00 | Modified Gross |
| 135 East 125th Street | New York, NY | 53,091 | Olgam Life | 12,700 | Feb-23 | 10 | $50.00 | Modified Gross |
| 5 West 125th Street | New York, NY | 125,992 | NYS DMV | 30,000 | Feb-23 | 10 | $54.00 | Modified Gross |
| 145 East 125th Street | New York, NY | 41,900 | Housing Works | 22,620 | Mar-22 | 30 | $43.50 | Modified Gross |
| (1) | Source: Appraisal unless otherwise indicated. |
| (2) | Based on the underwritten rent roll as of August 14, 2024 inclusive of rent steps through April 2025. |
The following table presents certain information relating to comparable retail properties for the Gotham Plaza Property:
| Comparable Retail Rental Summary(1) |
| Property Name | Location | Bldg. Size
(SF Net) | Tenant | Suite Size (SF) | Lease Commencement | Lease Term (Yrs) | Rent (PSF) | Lease Type |
| Gotham Plaza | New York, NY | 92,653(2) | Taco Bell(2) | 2,120(2) | Feb-21(2) | 12(2) | $83.50(2) | Net |
| 79 East 125th Street | New York, NY | 12,100 | Listing | 2,420 | Current | -- | $85.00 | Modified Gross |
| 2265 Second Avenue | New York, NY | 8,000 | Mexican Ice Cream Shop | 2,400 | Apr-24 | 5 | $70.00 | Full Service |
| 14 East 125th Street | New York, NY | 14,664 | 125th Finest Deli | 1,950 | Feb-24 | 10 | $74.00 | Modified Gross |
| 381 Lenox Avenue | New York, NY | 60,000 | Saint Louis Restaurant | 1,547 | Nov-23 | 10 | $85.33 | Full Service |
| 63 East 125th Street | New York, NY | 11,920 | Accra Express Corp | 1,500 | Sep-23 | 5 | $68.00 | Modified Gross |
| 4 East 125th Street | New York, NY | 41,080 | Harlem Harbor | 1,400 | Nov-23 | 10 | $69.00 | Full Service |
| One East Harlem | New York, NY | 464,074 | Teriyaki Madness | 1,500 | Sep-22 | 15 | $70.00 | Modified Gross |
| (1) | Source: Appraisal unless otherwise indicated. |
| (2) | Based on the underwritten rent roll as of August 14, 2024 inclusive of rent steps through April 2025. |
| THE INFORMATION IN THIS STRUCTURAL AND COLLATERAL TERM SHEET IS NOT COMPLETE AND MAY BE AMENDED PRIOR TO THE TIME OF SALE. THIS TERM SHEET IS NOT AN OFFER TO SELL THESE SECURITIES AND IT IS NOT A SOLICITATION OF AN OFFER TO BUY THESE SECURITIES IN ANY JURISDICTION WHERE THE OFFER OR SALE IS NOT PERMITTED. |
| | 156 | |
| Structural and Collateral Term Sheet | | BMO 2024-C10 |
| No. 14 – La Habra Marketplace |
| Mortgage Loan Information |
| Mortgage Loan Seller: | 3650 REIT |
| Original Principal Balance(1): | $25,000,000 |
| Cut-off Date Principal Balance(1): | $25,000,000 |
| % of IPB: | 3.5% |
| Loan Purpose: | Refinance |
| Borrower: | La Habra Associates, LLC |
| Borrower Sponsor: | Eric Sahn |
| Interest Rate: | 3.70000% |
| Note Date: | 12/3/2021 |
| Maturity Date: | 12/5/2031 |
| Interest-only Period: | 120 months |
| Original Term: | 120 months |
| Original Amortization Term: | None |
| Amortization Type: | Interest Only |
| Call Protection: | L(59),D(57),O(4) |
| Lockbox / Cash Management: | Soft / Springing |
| Additional Debt(1): | Yes |
| Additional Debt Balance(1): | $70,000,000 |
| Additional Debt Type(1): | Pari Passu |
| |
| Property Information |
| Single Asset / Portfolio: | Single Asset |
| Title: | Fee |
| Property Type – Subtype: | Retail – Anchored |
| Net Rentable Area (SF): | 372,476 |
| Location: | La Habra, CA |
| Year Built / Renovated: | 1968-2002 / 2005-2019 |
| Occupancy: | 95.3% |
| Occupancy Date: | 6/30/2024 |
| 4th Most Recent NOI (As of)(2): | $7,814,362 (12/31/2021) |
| 3rd Most Recent NOI (As of)(2): | $8,633,861 (12/31/2022) |
| 2nd Most Recent NOI (As of): | $8,268,464 (12/31/2023) |
| Most Recent NOI (As of): | $8,482,123 (TTM 6/30/2024) |
| UW Economic Occupancy: | 94.8% |
| UW Revenues: | $10,989,992 |
| UW Expenses: | $2,572,238 |
| UW NOI: | $8,417,754 |
| UW NCF: | $8,295,782 |
| Appraised Value / Per SF: | $153,000,000 / $411 |
| Appraisal Date: | 8/10/2021 |
| |
| Escrows and Reserves | | Financial Information(1) |
| | Initial | Monthly | Cap | | Cut-off Date Loan / SF: | $255 |
| Taxes: | $0 | $111,540 | N/A | | Maturity Date Loan / SF: | $255 |
| Insurance: | $0 | Springing | N/A | | Cut-off Date LTV: | 62.1% |
| Replacement Reserves: | $0 | $5,983 | $1,250,000 | | Maturity Date LTV: | 62.1% |
| TI / LC: | $3,250,000 | $29,917 | $1,250,000 | | UW NCF DSCR: | 2.33x |
| Environmental Reserve(3): | $550,000 | $0 | N/A | | UW NOI Debt Yield: | 8.9% |
| | | | |
| Sources and Uses |
| Sources | Proceeds | % of Total | | Uses | Proceeds | % of Total |
| Whole Loan(1) | $95,000,000 | 93.5 | % | | Loan Payoff | $96,536,855 | 95.0 | % |
| Borrower Equity | 6,633,789 | 6.5 | | | Upfront Reserves | 3,800,000 | 3.7 | |
| | | | | Closing Costs | 1,296,934 | 1.3 | |
| Total Sources | $101,633,789 | 100.0 | % | | Total Uses | $101,633,789 | 100.0 | % |
| (1) | The La Habra Marketplace Mortgage Loan (as defined below) is part of a whole loan evidenced by eight pari passu notes with an aggregate outstanding principal balance as of the Cut-off Date of $95.0 million (the “La Habra Marketplace Whole Loan”). The financial information in the chart above reflects the La Habra Marketplace Whole Loan. |
| (2) | The increase from the 4th Most Recent NOI to the 3rd Most Recent NOI was primarily attributed to leasing related to the borrower sponsor’s redevelopment of one of the vacant buildings previously occupied by Hometown Buffett into a multi-tenant building containing four shop spaces leased to Starbucks, See’s Candies, Crumbl Cookies, and Board & Brew. |
| (3) | The Initial Environmental Reserve deposit of $550,000 relates to the La Habra Remedial Work (as defined below) described under “Environmental” below. |
The Loan. The La Habra Marketplace mortgage loan (the “La Habra Marketplace Mortgage Loan”) is part of a fixed rate whole loan secured by the borrower’s fee interest in a grocery-anchored retail center with an aggregate of 372,476 square feet located in La Habra, California (the “La Habra Marketplace Property”). The La Habra Marketplace Whole Loan is evidenced by eight pari passu promissory notes in the aggregate original principal amount of $95,000,000 and accrues interest at a rate of 3.70000% per annum. The La Habra Marketplace Whole Loan has a 10-year term, is interest-only for the full term of the loan and accrues interest on an Actual/360 basis.
| THE INFORMATION IN THIS STRUCTURAL AND COLLATERAL TERM SHEET IS NOT COMPLETE AND MAY BE AMENDED PRIOR TO THE TIME OF SALE. THIS TERM SHEET IS NOT AN OFFER TO SELL THESE SECURITIES AND IT IS NOT A SOLICITATION OF AN OFFER TO BUY THESE SECURITIES IN ANY JURISDICTION WHERE THE OFFER OR SALE IS NOT PERMITTED. |
| | 157 | |
| Structural and Collateral Term Sheet | | BMO 2024-C10 |
| No. 14 – La Habra Marketplace |
The following table presents certain information relating to the notes that comprise the La Habra Marketplace Whole Loan:
| Whole Loan Summary |
| Note | Original Balance | Cut-off Date Balance | Note Holder | Controlling Piece |
| A-1-A | $10,000,000 | $10,000,000 | BMO 2022-C3 | No |
| A-1-B | 20,000,000 | 20,000,000 | BBCMS 2023-C21 | Yes |
| A-2-A | 7,650,000 | 7,650,000 | BMO 2024-C10 | No |
| A-2-B | 10,000,000 | 10,000,000 | BMO 2022-C3 | No |
| A-2-C | 15,000,000 | 15,000,000 | BMO 2023-C5 | No |
| A-3-A | 5,000,000 | 5,000,000 | BMO 2024-C10 | No |
| A-3-B | 12,350,000 | 12,350,000 | BMO 2024-C10 | No |
| A-3-C | 15,000,000 | 15,000,000 | BBCMS 2023-C21 | No |
| Whole Loan | $95,000,000 | $95,000,000 | | |
The Property. The La Habra Marketplace Property is a 372,476 square foot double grocery anchored retail center located on a 36.055-acre site at the northeast corner of Imperial Highway and Beach Boulevard in the City of La Habra, Orange County, California. The La Habra Marketplace Property features 17 single-story buildings built in various stages between 1968 and 2002, with the majority of the center developed between 1992 and 1996 and the most recent renovations performed between 2005 and 2019. The La Habra Marketplace Property is anchored by Regal Cinemas, LA Fitness, Hobby Lobby, Ross Dress For Less, Sprouts, and Smart & Final. The La Habra Marketplace Property has an I-shaped configuration comprised of anchor/in-line shop space, three multi-tenant pad buildings, and 10 single tenant pad buildings.
As of the June 30, 2024 rent roll, the La Habra Marketplace Property is 95.3% occupied by 40 tenants. The borrower sponsor recently redeveloped one of the vacant pad buildings previously occupied by Hometown Buffet into a multi-tenant retail building containing four shop spaces leased to Starbucks, See’s Candies, Crumbl Cookies, and Board & Brew. The improvements include a three tenant subanchor building located just west of the primary anchor shop building and a freestanding multiplex theater building (Regal Entertainment Group).
Since origination of the La Habra Marketplace Whole Loan, the borrower sponsor demolished a free-standing 3,450 square foot building and a building of the same size is currently under construction. As of the Cut-off Date, the demolition and site work have been completed and the concrete slab has been poured. Structural steel is in place and all underground work has been completed with framing underway. The borrower sponsor executed a new lease with CJ Foodville USA Inc. dba Tous Les Jours on April 4, 2024. CJ Foodville USA Inc. is expected to take occupancy and commence rent payments once construction has been completed.
Major Tenants.
Regal Entertainment Group (59,800 square feet, 16.1% of NRA, 6.5% of underwritten base rent): Regal Entertainment Group (“Regal”), together with its subsidiaries, operates as a motion picture exhibitor in the United States. Regal develops, acquires, and operates multi-screen theatres primarily in mid-sized metropolitan markets and suburban growth areas of larger metropolitan markets. It operates a theatre circuit under the brands of Regal Cinemas, United Artists, Edwards, Great Escape Theatres, and Hollywood Theaters. Regal was founded in 2002 and is based in Knoxville, Tennessee. Since February 2018, Regal has operated as a subsidiary of Cineworld Group plc (“Cineworld”). Regal’s lease has four, five-year renewal options remaining and no termination options.
LA Fitness (50,322 square feet, 13.5% of NRA, 10.5% of underwritten base rent): LA Fitness, operates a health club chain in various locations in the United States and Canada. It offers group fitness classes that offer training on aerobic basics, aqua fitness, body works plus abs, boot camp conditioning, cardio jam, club boxing circuit, cycling, kickbox cardio, Pilates, senior fitness workouts, Yoga, Tai Chi and Zumba, and personal training services. Fitness International, LLC, the parent company to LA Fitness, has over 700 locations across 27 states and Canada. LA Fitness also sells apparel for men and ladies, headgear, bags, and other merchandise through its online store. LA Fitness was founded in 1984 and is based in Irvine, California. LA Fitness’s has three, five-year renewal options remaining and no termination options.
| THE INFORMATION IN THIS STRUCTURAL AND COLLATERAL TERM SHEET IS NOT COMPLETE AND MAY BE AMENDED PRIOR TO THE TIME OF SALE. THIS TERM SHEET IS NOT AN OFFER TO SELL THESE SECURITIES AND IT IS NOT A SOLICITATION OF AN OFFER TO BUY THESE SECURITIES IN ANY JURISDICTION WHERE THE OFFER OR SALE IS NOT PERMITTED. |
| | 158 | |
| Structural and Collateral Term Sheet | | BMO 2024-C10 |
| No. 14 – La Habra Marketplace |
Hobby Lobby Stores, Inc. (44,060 square feet, 11.8% of NRA, 5.7% of underwritten base rent): Hobby Lobby Stores, Inc. (“Hobby Lobby”) owns and operates approximately 950 arts and craft stores in the United States. Hobby Lobby provides products under various categories that include home décors and frames, crafts and hobbies, scrapbook and paper crafts, fabric and sewing products, yarn and needle art products, beads and jewelry, baking and party supplies, floral and wedding supplies, wearable arts, seasonal and novelty products, and gift cards. It also sells products online. Hobby Lobby was founded in 1972 in Oklahoma City, Oklahoma. Hobby Lobby’s lease has three, five-year renewal options remaining and no termination options.
The following table presents certain information relating to the historical occupancy of the La Habra Marketplace Property:
| Historical and Current Occupancy(1) |
2021 | 2022 | 2023 | Current(2) |
| 92.5% | 95.2% | 98.1% | 95.3% |
| (1) | Historical occupancies are as of December 31 of each respective year. The borrower sponsor was able to backfill some smaller tenants with various new leases before the major tenants vacated their spaces. The borrower sponsor has since shifted its leasing strategy to focus on smaller tenants. |
| (2) | Current occupancy is based on the underwritten rent roll as of June 30, 2024. |
The following table presents certain information relating to the largest tenants at the La Habra Marketplace Property:
| Top Tenant Summary(1) |
Tenant | Ratings Moody’s/S&P /Fitch(2) | Net Rentable Area (SF) | % of
Total NRA | UW Base Rent PSF | UW Base Rent | % of Total
UW Base Rent | Lease Exp. Date |
| Anchor Tenants | | | | | | | |
| Regal Entertainment Group | NR/NR/NR | 59,800 | 16.1 | % | $9.03 | $540,000 | 6.5 | % | 4/30/2029 |
| LA Fitness | NR/NR/NR | 50,322 | 13.5 | | 17.40 | 875,603 | 10.5 | | 6/30/2034 |
| Hobby Lobby | NR/NR/NR | 44,060 | 11.8 | | 10.84 | 477,610 | 5.7 | | 6/30/2028 |
| Anchor Tenants Subtotal / Wtd. Avg. | | 154,182 | 41.4 | % | $12.28 | $1,893,213 | 22.7 | % | |
| Ross Dress For Less | A2/BBB+/NR | 25,920 | 7.0 | % | $15.10 | $391,392 | 4.7 | % | 1/31/2028 |
| Sprouts | NR/NR/NR | 25,252 | 6.8 | | 23.65 | 597,210 | 7.2 | | 9/30/2034 |
| Smart & Final | NR/NR/NR | 25,000 | 6.7 | | 21.00 | 525,000 | 6.3 | | 3/31/2032 |
| Ulta | NR/NR/NR | 10,940 | 2.9 | | 26.95 | 294,833 | 3.5 | | 9/30/2025 |
| Party City | NR/NR/NR | 10,749 | 2.9 | | 28.00 | 300,972 | 3.6 | | 1/31/2026 |
| PETCO | B3/B/NR | 9,000 | 2.4 | | 36.72 | 330,480 | 4.0 | | 1/31/2028 |
| Denny's | NR/NR/NR | 7,396 | 2.0 | | 30.89 | 228,462 | 2.7 | | 11/30/2039 |
| Major Tenants | | 268,439 | 72.1 | % | $16.99 | $4,561,562 | 54.6 | % | |
| Other Tenants | | 86,470 | 23.2 | % | $43.79 | $3,786,404 | 45.4 | % | |
| Occupied Collateral Total | 354,909 | 95.3 | % | $23.52 | $8,347,966 | 100.0 | % | |
| Vacant Space | | 17,567 | 4.7 | % | | |
| Collateral Total | | 372,476 | 100.0 | % | | |
| | | | | | | |
| (1) | Based on the underwritten rent roll dated June 30, 2024 and rent steps through February 1, 2025. |
| (2) | In certain instances, ratings provided are those of the parent company of the entity shown, whether or not the parent company guarantees the lease. |
| THE INFORMATION IN THIS STRUCTURAL AND COLLATERAL TERM SHEET IS NOT COMPLETE AND MAY BE AMENDED PRIOR TO THE TIME OF SALE. THIS TERM SHEET IS NOT AN OFFER TO SELL THESE SECURITIES AND IT IS NOT A SOLICITATION OF AN OFFER TO BUY THESE SECURITIES IN ANY JURISDICTION WHERE THE OFFER OR SALE IS NOT PERMITTED. |
| | 159 | |
| Structural and Collateral Term Sheet | | BMO 2024-C10 |
| No. 14 – La Habra Marketplace |
The following table presents certain information relating to the tenant lease expirations at the La Habra Marketplace Property:
| Lease Rollover Schedule(1)(2) |
Year | Number of Leases Expiring | Net
Rentable
Area Expiring | % of NRA Expiring | UW Base Rent Expiring | % of UW Base Rent Expiring | Cumulative Net Rentable Area Expiring | Cumulative % of NRA Expiring | Cumulative UW Base Rent Expiring | Cumulative % of UW Base Rent Expiring |
| Vacant | NAP | 17,567 | 4.7 | % | NAP | NA | P | 17,567 | 4.7% | NAP | NAP | |
| 2024 & MTM | 2 | 3,310 | 0.9 | | $122,363 | 1.5 | % | 20,877 | 5.6% | $122,363 | 1.5% | |
| 2025 | 5 | 20,861 | 5.6 | | 805,884 | 9.7 | | 41,738 | 11.2% | $928,246 | 11.1% | |
| 2026 | 8 | 33,464 | 9.0 | | 1,166,316 | 14.0 | | 75,202 | 20.2% | $2,094,563 | 25.1% | |
| 2027 | 6 | 19,089 | 5.1 | | 499,309 | 6.0 | | 94,291 | 25.3% | $2,593,871 | 31.1% | |
| 2028 | 4 | 82,630 | 22.2 | | 1,391,668 | 16.7 | | 176,921 | 47.5% | $3,985,540 | 47.7% | |
| 2029 | 1 | 59,800 | 16.1 | | 540,000 | 6.5 | | 236,721 | 63.6% | $4,525,540 | 54.2% | |
| 2030 | 2 | 3,600 | 1.0 | | 273,100 | 3.3 | | 240,321 | 64.5% | $4,798,640 | 57.5% | |
| 2031 | 2 | 6,405 | 1.7 | | 259,425 | 3.1 | | 246,726 | 66.2% | $5,058,065 | 60.6% | |
| 2032 | 2 | 28,000 | 7.5 | | 673,320 | 8.1 | | 274,726 | 73.8% | $5,731,385 | 68.7% | |
| 2033 | 5 | 14,780 | 4.0 | | 915,307 | 11.0 | | 289,506 | 77.7% | $6,646,691 | 79.6% | |
| 2034 | 2 | 75,574 | 20.3 | | 1,472,813 | 17.6 | | 365,080 | 98.0% | $8,119,504 | 97.3% | |
| 2035 & Beyond | 1 | 7,396 | 2.0 | | 228,462 | 2.7 | | 372,476 | 100.0% | $8,347,966 | 100.0% | |
| Total | 40 | 372,476 | 100.0 | % | $8,347,966 | 100.0 | % | | | | |
| (1) | Based on the underwritten rent roll dated June 30, 2024 and rent steps through February 1, 2025. |
| (2) | Certain tenants may have termination or contraction options (which may become exercisable prior to the originally stated expiration date of the tenant lease) that are not considered in the above Lease Rollover Schedule. |
Environmental. The Phase I environmental assessment dated September 15, 2021 identified certain recognized environmental conditions (each, a “REC”) at the La Habra Marketplace Property in connection with potential vapor intrusion risks from concentrations of tetrachloroethylene (“PCE”) in soil vapor related to the prior operation of dry cleaners at the La Habra Marketplace Property. The La Habra Marketplace Whole Loan documents require the borrower to, among other things, (i) complete certain vapor intrusion investigations recommended by the environmental consultant, (ii) complete any remedial actions recommended by the environmental consultant as a result of such investigations including, without limitation, sealing any vapor intrusion pathways and installing sub-slab depressurization systems (collectively, the “La Habra Remedial Work”) and (iii) for the entirety of the term of the La Habra Marketplace Whole Loan, comply with and perform any post mitigation sampling, monitoring or other actions recommended by the environmental consultant in connection with the RECs. At origination, the borrower deposited $550,000 with the lender in a vapor intrusion reserve in connection with the La Habra Remedial Work. Two rounds of indoor air sampling were completed at the La Habra Marketplace Property in January 2022 and June 2022 in the spaces formerly occupied by dry cleaners, as well as certain adjacent spaces, to evaluate if PCE and its breakdown products were present in indoor air at concentrations exceeding applicable regulatory criteria. According to the related environmental consultant’s report, dated July 7, 2022, no such exceedances were detected and the environmental consultant therefore concluded that volatile organic compounds in soil vapor were not migrating to indoor air. The environmental consultant did not recommend any additional indoor air sampling or assessment in the applicable portions of the La Habra Marketplace Property.
See “Description of the Mortgage Pool—Mortgage Pool Characteristics—Environmental Considerations” in the Preliminary Prospectus.
| THE INFORMATION IN THIS STRUCTURAL AND COLLATERAL TERM SHEET IS NOT COMPLETE AND MAY BE AMENDED PRIOR TO THE TIME OF SALE. THIS TERM SHEET IS NOT AN OFFER TO SELL THESE SECURITIES AND IT IS NOT A SOLICITATION OF AN OFFER TO BUY THESE SECURITIES IN ANY JURISDICTION WHERE THE OFFER OR SALE IS NOT PERMITTED. |
| | 160 | |
| Structural and Collateral Term Sheet | | BMO 2024-C10 |
| No. 14 – La Habra Marketplace |
The following table presents certain information relating to the operating history and underwritten cash flows of the La Habra Marketplace Property:
| Operating History and Underwritten Net Cash Flow(1) |
| | 2021 | 2022 | 2023 | TTM 6/30/2024 | Underwritten | Per Square Foot | %(2) |
| Rents in Place | $7,965,095 | $9,244,284 | $8,345,649 | $8,368,093 | $8,321,502 | $22.34 | 71.8 | % |
| Rent Steps(3) | 0 | 0 | 0 | 0 | 26,464 | 0.07 | 0.2 | |
| Percentage Rent | 87,795 | 0 | 0 | 42,652 | 42,652 | 0.11 | 0.4 | |
| Gross Up Vacant Rent | 0 | 0 | 0 | 0 | 602,051 | 1.62 | 5.2 | |
| Expense Recoveries | 2,500,334 | 2,236,194 | 2,583,994 | 2,568,415 | 2,568,415 | 6.90 | 22.2 | |
| Gross Potential Rent | $10,553,224 | $11,480,478 | $10,929,643 | $10,979,160 | $11,561,085 | 31.04 | 99.7 | % |
| Other Income | 11,068 | 0 | 11,039 | 30,959 | 30,959 | 0.08 | 0.3 | |
| Net Rental Income | $10,564,292 | $11,480,478 | $10,940,682 | $11,010,119 | $11,592,043 | $31.12 | 100.0 | % |
| (Vacancy/Credit Loss) | 0 | 0 | 0 | 0 | (602,051) | (1.62) | (5.2 | ) |
| Effective Gross Income | $10,564,292 | $11,480,478 | $10,940,682 | $11,010,119 | $10,989,992 | $29.51 | 94.8 | % |
| Total Expenses | $2,749,929 | $2,846,617 | $2,672,217 | $2,527,996 | $2,572,238 | $6.91 | 23.4 | % |
| Net Operating Income | $7,814,362 | $8,633,861 | $8,268,464 | $8,482,123 | $8,417,754 | $22.60 | 76.6 | % |
| Capital Expenditures | 0 | 0 | 0 | 0 | 74,495 | 0.20 | 0.7 | |
| TI/LC | 0 | 0 | 0 | 0 | 47,476 | 0.13 | 0.4 | |
| Net Cash Flow | $7,814,362 | $8,633,861 | $8,268,464 | $8,482,123 | $8,295,782 | $22.27 | 75.5 | % |
| (1) | Based on the underwritten rent roll dated June 30, 2024. |
| (2) | The % column represents percent of Net Rental Income for all revenue lines and represents percent of Effective Gross Income for the remainder of fields. |
| (3) | Includes contractual rent steps taken through February 1, 2025. |
The Market. The La Habra Marketplace Property is located in La Habra, California within Orange County. The La Habra Marketplace Property is located at the northeast corner of Imperial Highway and Beach Boulevard in the southwestern region of the city of La Habra. Located at Orange County's northernmost corner, La Habra is 7.3 square miles with a population of 62,730 and approximately 19,883 households. La Habra is approximately 20 miles from downtown Los Angeles and 95 miles from San Diego. It is bordered by the city of La Habra Heights in Los Angeles County to the north, Brea and Fullerton to the east, Fullerton to the south and Whittier, La Mirada and unincorporated Los Angeles County to the west. La Habra offers civic, recreational, social and cultural services to its residents, including 20 parks, a children's museum, community theater, tennis center, and diverse community center.
According to a third-party market report, the La Habra Marketplace Property is located in the Brea/La Habra retail submarket within the Orange County - CA retail market. As of September 2024, the Orange County - CA retail market had an inventory of 144.2 million square feet, with 138.2 million square feet of occupied space indicating an occupancy rate of 95.8%. The market experienced a positive net absorption of 185,344 square feet in the third quarter of 2024. The area achieved an average asking rent of $37.69 per square foot as of September 2024, an increase from the previous year’s asking rent of $36.97 per square foot.
As of September 2024, the Brea/La Habra retail submarket had an inventory of 9.1 million square feet, with 8.8 million square feet of occupied space indicating an occupancy rate of 96.6%. The submarket experienced a negative net absorption of 2,988 square feet. The area achieved an average asking rent of $34.60 per square foot, an increase from the previous year’s asking rent of $34.03 per square foot.
| THE INFORMATION IN THIS STRUCTURAL AND COLLATERAL TERM SHEET IS NOT COMPLETE AND MAY BE AMENDED PRIOR TO THE TIME OF SALE. THIS TERM SHEET IS NOT AN OFFER TO SELL THESE SECURITIES AND IT IS NOT A SOLICITATION OF AN OFFER TO BUY THESE SECURITIES IN ANY JURISDICTION WHERE THE OFFER OR SALE IS NOT PERMITTED. |
| | 161 | |
| Structural and Collateral Term Sheet | | BMO 2024-C10 |
| No. 14 – La Habra Marketplace |
The following table presents certain information relating to comparable retail centers for the La Habra Marketplace Property:
| Competitive Retail Center Summary(1) |
Property | Year Built / Renovated | Total NRA (SF) | Total Occupancy | Distance to Subject (Miles) | Major Tenants | Lease Area (SF) | Lease Date | Lease Term | Base Rent |
| La Habra Marketplace | 1968-2002 / | 372,476(2) | 95.3%(2) | NAP | Regal Entertainment Group | 59,800 | May-99 | 30.0 | 9.03 |
| | 2005–2019 | | | | LA Fitness | 50,322 | Sep-99 | 34.8 | 17.40 |
| | | | | | Hobby Lobby | 44,060 | Jun-18 | 10.0 | 10.84 |
| | | | | | Ross Dress For Less | 25,920 | Oct-90 | 37.3 | 15.10 |
| La Habra Towne Center | 1997 / 2017 | 75,808 | 99.0% | 1.5 | Smoke & Fire | 2,357 | Mar-20 | 5 | $36.00 |
| La Habra Imperial Promenade | 1995 / 2008 | 230,263 | 99.0% | 0.5 | Pearle Vision | 2,061 | Aug-20 | 10 | $41.40 |
| | | | | | FULA Noodle & Grill | 1,900 | Apr-19 | 5 | $59.40 |
| La Habra Palm Court | 1997 / 2004 | 138,000 | 99.0% | 0.2 | Retail Tenant | 1,400 | Jul-21 | 5 | $29.40 |
| | | | | | Retail Tenant | 2,450 | Feb-21 | 5 | $23.40 |
| | | | | | Soboro Cuisine | 1,200 | Mar-18 | 5 | $39.00 |
| La Habra Westridge Plaza | 2001 / N/A | 640,580 | 99.0% | 0.6 | Paris Baguette | 2,482 | Sep-17 | 10 | $51.60 |
| | | | | | Nekter Juice Bar | 1,225 | Jan-17 | 10 | $46.20 |
| Orangefair Marketplace | 1958 / 2004 | 403,648 | 95.0% | 4.7 | Happy Jewelers | 1,515 | Aug-20 | 5 | $34.92 |
| College Plaza | 1952 / 1982 | 99,082 | 85.0% | 5.4 | Lee's Sandwiches | 1,256 | Jun-20 | 5 | $42.00 |
| Amerige Heights Town Center | 2001 / N/A | 416,908 | 95.0% | 2.8 | Mountain Mike's Pizza | 2,000 | Jun-20 | 5 | $42.00 |
| Gordon Square | 1968 / 2000 | 117,581 | 100.0% | 3.59 | Best Care Pharmacy | 1,200 | Sep-19 | 5 | $53.42 |
| (1) | Based on the appraisal. |
| (2) | Based on the underwritten rent roll dated June 30, 2024. |
| THE INFORMATION IN THIS STRUCTURAL AND COLLATERAL TERM SHEET IS NOT COMPLETE AND MAY BE AMENDED PRIOR TO THE TIME OF SALE. THIS TERM SHEET IS NOT AN OFFER TO SELL THESE SECURITIES AND IT IS NOT A SOLICITATION OF AN OFFER TO BUY THESE SECURITIES IN ANY JURISDICTION WHERE THE OFFER OR SALE IS NOT PERMITTED. |
| | 162 | |
| Structural and Collateral Term Sheet | | BMO 2024-C10 |
| No. 15 – 236-244 East 13th Street |
| Mortgage Loan Information | | Property Information |
| Mortgage Loan Seller: | BMO | | Single Asset / Portfolio: | Single Asset |
| Original Principal Balance: | $21,000,000 | | Title: | Fee |
| Cut-off Date Principal Balance: | $21,000,000 | | Property Type - Subtype: | Multifamily – Mid Rise |
| % of Pool by IPB: | 2.9% | | Net Rentable Area (Units)(1): | 83 |
| Loan Purpose: | Refinance | | Location: | New York, NY |
| Borrower: | 236-244 East 13th Owner LLC | | Year Built / Renovated: | 1900/1989 |
| Borrower Sponsor: | Amended and Restated 2013 LG Revocable Trust | | Occupancy: | 96.3% |
| Interest Rate: | 6.18000% | | Occupancy Date: | 9/18/2024 |
| Note Date: | 10/7/2024 | | 4th Most Recent NOI (As of): | $742,305 (12/31/2021) |
| Maturity Date: | 11/6/2034 | | 3rd Most Recent NOI (As of): | $1,089,041 (12/31/2022) |
| Interest-only Period: | 120 months | | 2nd Most Recent NOI (As of): | $1,480,203 (12/31/2023) |
| Original Term: | 120 months | | Most Recent NOI (As of): | $1,521,272 (T-12 7/31/2024) |
| Original Amortization: | None | | UW Economic Occupancy: | 94.9% |
| Amortization Type: | Interest Only | | UW Revenues: | $2,994,852 |
| Call Protection: | L(24),D(89),O(7) | | UW Expenses: | $1,346,931 |
| Lockbox / Cash Management: | Soft (Residential); Hard (Commercial) / Springing | | UW NOI: | $1,647,921 |
| Additional Debt: | No | | UW NCF: | $1,626,276 |
| Additional Debt Balance: | N/A | | Appraised Value / Per Unit: | $31,400,000 / $378,313 |
| Additional Debt Type: | N/A | | Appraisal Date: | 9/9/2024 |
| | | | | |
| Escrows and Reserves | | Financial Information |
| | Initial | Monthly | Initial Cap | | Cut-off Date Loan / Unit: | $253,012 |
| Taxes: | $0 | $58,673 | N/A | | Maturity Date Loan / Unit: | $253,012 |
| Insurance: | $0 | Springing | N/A | | Cut-off Date LTV: | 66.9% |
| Replacement Reserves: | $0 | $1,453 | N/A | | Maturity Date LTV: | 66.9% |
| TI/LC Reserve: | $0 | $350 | N/A | | UW NCF DSCR: | 1.24x |
| | | | | | UW NOI Debt Yield: | 7.8% |
| | | | | | | |
| Sources and Uses |
| Sources | Proceeds | % of Total | | Uses | Proceeds | % of Total |
| Mortgage Loan | $21,000,000 | 97.6 | % | | Loan Payoff | $20,689,041 | 96.2 | % |
| Sponsor Equity | 517,186 | 2.4 | | | Closing Costs | 828,146 | 3.8 | |
| | | | | | | |
| Total Sources | $21,517,186 | 100.0 | % | | Total Uses | $21,517,186 | 100.0 | % |
| (1) | The 236-244 East 13th Street Property (as defined below) consists of (i) 83 multifamily units, and (ii) seven commercial units representing 4,204 square feet. |
The Loan. The fifteenth largest mortgage loan (the “236-244 East 13th Street Mortgage Loan”) is secured by the borrower’s fee simple interest in a mid-rise multifamily property located in New York, New York (the “236-244 East 13th Street Property”). The 236-244 East 13th Street Mortgage Loan was originated on October 7, 2024 by Bank of Montreal. The 236-244 East 13th Street Mortgage Loan has an outstanding principal balance as of the Cut-off Date of $21,000,000, has a ten-year term, accrues interest at a fixed rate of 6.18000% per annum on an Actual/360 basis and is interest-only for the loan term. The scheduled maturity date of the 236-244 East 13th Street Mortgage Loan is November 6, 2034.
The Property. The 236-244 East 13th Street Property was constructed in 1900 and renovated in 1989 and is comprised of three, six-story buildings located within the East Village neighborhood of New York City. The 236-244 East 13th Street Property unit mix includes eight one-bedroom, 53 two-bedroom, 20 three-bedroom and 2 four-bedroom units with 4,204 square feet of commercial space leased to seven tenants. The multifamily units feature hardwood plank flooring, ceiling mounted light fixtures, wall mounted wooden cabinets, stone countertops, ceramic tiled bathrooms, sheetrock painted walls, and appliances consisting of a refrigerator, gas range, and a microwave.
| THE INFORMATION IN THIS STRUCTURAL AND COLLATERAL TERM SHEET IS NOT COMPLETE AND MAY BE AMENDED PRIOR TO THE TIME OF SALE. THIS TERM SHEET IS NOT AN OFFER TO SELL THESE SECURITIES AND IT IS NOT A SOLICITATION OF AN OFFER TO BUY THESE SECURITIES IN ANY JURISDICTION WHERE THE OFFER OR SALE IS NOT PERMITTED. |
| | 163 | |
| Structural and Collateral Term Sheet | | BMO 2024-C10 |
| No. 15 – 236-244 East 13th Street |
The following table presents certain information with respect to the residential units at the 236-244 East 13th Street Property:
| 236-244 East 13th Street Unit Mix(1) |
| Unit Type | No. of Units | % of Total | Occupied Collateral Units(2) | % of Units Occupied(2) | Average Unit Size (SF)(5) | Average Monthly Rental Rate(1)(2) | Average Monthly Rental Rate per SF(1)(2)(5) | Average Monthly Market Rental Rate(3) | Average Monthly Market Rental Rate per SF(3)(5) |
| 1 BR/1 BA (Free Market) | 4 | 4.8 | % | 4 | 100.0% | 356 | $2,613 | $7.34 | $2,900 | $8.14 |
| 1 BR/1 BA (Rent Stabilized) | 4 | 4.8 | | 4 | 100.0% | 460 | $1,875 | $4.08 | $2,900 | $6.30 |
| 2 BR/1 BA (Free Market) | 34 | 41.0 | | 33 | 97.1% | 495 | $3,476 | $6.99 | $3,500 | $7.07 |
| 2 BR/1 BA (Rent Controlled) | 1 | 1.2 | | 1 | 100.0% | 650 | $563 | $0.87 | $3,500 | $5.38 |
| 2 BR/1 BA (Rent Stabilized) | 17 | 20.5 | | 16 | 94.1% | 572 | $1,239 | $2.13 | $3,500 | $6.12 |
| 3 BR/1 BA (Free Market) | 9 | 10.8 | | 9 | 100.0% | 700 | $4,730 | $6.76 | $5,000 | $7.14 |
| 3 BR/1 BA (Rent Controlled) | 2 | 2.4 | | 2 | 100.0% | 700 | $437 | $0.62 | $5,000 | $7.14 |
| 3 BR/1 BA (Rent Stabilized) | 9 | 10.8 | | 8 | 88.9% | 750 | $1,415 | $1.89 | $5,000 | $6.67 |
| 4 BR/2 BA (Free Market) | 1 | 1.2 | | 1 | 100.0% | 1,028$ | $7,513 | $7.31 | $6,500 | $6.32 |
| 4 BR/2 BA (Rent Stabilized) | 1 | 1.2 | | 1 | 100.0% | 829 | $7,617 | $9.19 | $6,500 | $7.84 |
| Total/Wtd. Avg. | 83(4) | 100.0% | (4) | 79 | 96.3% | 571(2) | $2,822 | $4.93 | $3,880 | $6.80 |
| (1) | Information based on the underwritten rent roll dated September 18, 2024, unless otherwise indicated. Average Monthly Rental Rate and Average Monthly Rental Rate per SF reflect average monthly in-place rent for occupied units. |
| (2) | One unit is considered an employee unit that was excluded from averages and occupied units. |
| (4) | Includes one unit that is considered an employee unit. |
| (5) | Based on a borrower rent roll. |
The following table presents certain information with respect to the historical and current occupancy of the 236-244 East 13th Street Property:
| Historical and Current Occupancy |
| 2021(1) | 2022(1) | 2023(1) | Current(2)(3) |
| 95.4% | 97.5% | 97.7% | 96.3% |
| (1) | Historical occupancy is as of December 31 of each respective year. |
| (2) | Current Occupancy represents occupancy for the multifamily and commercial units. |
| (3) | Current Occupancy is as of September 18, 2024. |
Environmental. According to a Phase I environmental assessment dated September 17, 2024, there was no evidence of any recognized environmental conditions at the 236-244 East 13th Street Property.
The Market. The 236-244 East 13th Street Property is located in Manhattan, New York within the East Village multifamily submarket. According to the appraisal, the New York MSA has an estimated population of 19,954,881 in 2024. The New York MSA ranks first out of all metropolitan area economies in the nation and has expanded at a 1.8% average annual rate. New York’s economy has been benefiting from a stable growth in population, higher income, and education levels. According to the appraisal, the East Village multifamily submarket has a vacancy rate of approximately 1.4% and average asking rents of $4,646 per unit as of Q2 2024. Within a one-, three- and five-mile radius of the 236-244 East 13th Street Property, the estimated 2024 population is 261,598, 1,195,183 and 2,898,088, respectively. Within the same radii, the estimated 2024 median annual household income is $117,287, $125,736 and $106,033, respectively.
| THE INFORMATION IN THIS STRUCTURAL AND COLLATERAL TERM SHEET IS NOT COMPLETE AND MAY BE AMENDED PRIOR TO THE TIME OF SALE. THIS TERM SHEET IS NOT AN OFFER TO SELL THESE SECURITIES AND IT IS NOT A SOLICITATION OF AN OFFER TO BUY THESE SECURITIES IN ANY JURISDICTION WHERE THE OFFER OR SALE IS NOT PERMITTED. |
| | 164 | |
| Structural and Collateral Term Sheet | | BMO 2024-C10 |
| No. 15 – 236-244 East 13th Street |
The following table presents certain information relating to comparable multifamily rental properties to the 236-244 East 13th Street Property:
| Comparable Rental Summary(1) |
| Property Address | Year Built | Occupancy | # Units | Unit Mix | Average SF per Unit(2)(3) | Average Monthly Rent per SF(2)(3) | Average Monthly Rent(2) |
236-244 East 13th Street(3) New York, NY | 1900 / 1989 | 96.3%(2) | 83(4) | 1 BR/1 BA (Free Market) 1 BR/1 BA (Rent Stabilized) 2 BR/1 BA (Free Market) 2 BR/1 BA (Rent Controlled) 2 BR/1 BA (Rent Stabilized) 3 BR/1 BA (Free Market) 3 BR/1 BA (Rent Controlled) 3 BR/1 BA (Rent Stabilized) 4 BR/2 BA (Free Market) 4 BR/2 BA (Rent Stabilized) | 356 460 495 650 572 700 700 750 1,028 829 | $7.34 $4.08 $6.99 $0.87 $2.13 $6.76 $0.62 $1.89 $7.31 $9.19 | $2,63 $1,875 $3,476 $563 $1,239 $4,730 $437 $1,415 $7,513 $7,617 |
| 325 East 5th Street | 1900 | NAV | NAV | 1 BR / 1 BA 2 BR / 1 BA 4 BR / 2.5 BA | NAV | $7.11 $6.69 NAV | $3,995 $4,495 $7,495 |
| 629 East 5th Street | 1900 | NAV | NAV | 1 BR / 1 BA 2 BR / 1 BA 3 BR / 1 BA 4 BR / 2 BA | NAV | $7.11 $6.69 $6.92 $7.00 | $3,700 $4,200 $6,520 $6,995 |
| 279 East 10th Street | 1910 | NAV | NAV | 1 BR / 1 BA 2 BR / 1 BA | NAV | $7.11 $6.69 | $3,795 $4,750 |
| 332 East 9th Street | 1900 | NAV | NAV | Studio 1 BR / 1 BA | NAV | NAV $7.11 | $3,100 $3,850 |
| 103 East 2nd Street | 1900 | NAV | NAV | 1 BR / 1 BA 2 BR / 1 BA 3 BR / 1.5 BA | NAV | $7.11 $6.69 NAV | $3,250 $4,300 $6,000 |
| 230 East 15th Street | 1920 | NAV | NAV | Studio 1 BR / 1 BA 3 BR / 1 BA | NAV | NAV $7.11 $6.92 | $2,895 $3,495 $5,895 |
| 205 East 15th Street | 1930 | NAV | NAV | Studio 1 BR / 1 BA | NAV | NAV $7.11 | $2,650 $2,980 |
| 221 East 10th Street | 1900 | NAV | NAV | 2 BR / 1 BA 4 BR / 2 BA | NAV | $6.69 $7.00 | $4,000 $7,286 |
| (1) | Source: Appraisal, unless otherwise indicated. Comparables reflect market rate units. |
| (2) | Subject values exclude employee unit. |
| (3) | Based on the underwritten rent roll dated September 18, 2024, or as otherwise provided by the borrower. |
| (4) | Includes one employee unit.
|
| THE INFORMATION IN THIS STRUCTURAL AND COLLATERAL TERM SHEET IS NOT COMPLETE AND MAY BE AMENDED PRIOR TO THE TIME OF SALE. THIS TERM SHEET IS NOT AN OFFER TO SELL THESE SECURITIES AND IT IS NOT A SOLICITATION OF AN OFFER TO BUY THESE SECURITIES IN ANY JURISDICTION WHERE THE OFFER OR SALE IS NOT PERMITTED. |
| | 165 | |
| Structural and Collateral Term Sheet | | BMO 2024-C10 |
| No. 15 – 236-244 East 13th Street |
The following table presents certain information with respect to the historical and underwritten cash flows of the 236-244 East 13th Street Property:
| Operating History and Underwritten Net Cash Flow(1) |
| | 2022 | 2023 | TTM 7/31/2024(2) | Underwritten | | Per Unit | | %(3) |
| In-Place Base Rent | $2,147,239 | $2,526,139 | $2,584,254 | $2,675,209 | | $32,231.43 | | 84.9 | % |
| Potential Income from Vacant Units | 0 | 0 | 0 | 144,000 | | 1,734.94 | | 4.6 | |
| SCRIE Credit | (7,726) | (8,032) | (8,263) | (8,263 | ) | (99.56 | ) | (0.3 | ) |
| Commercial Income | 344,003 | 311,867 | 310,305 | 341,306 | | 4,112.13 | | 10.8 | |
| Net Rental Income | $2,483,516 | $2,829,974 | $2,886,295 | $3,152,252 | | $37,978.94 | | 100.0 | % |
| Actual Residential Vacancy | 0 | 0 | 0 | (143,709 | ) | (1,731.43 | ) | (4.6 | ) |
| Bad Debt | (18,933) | 0 | 0 | 0 | | 0.00 | | 0.0 | |
| UW Vac Adjustment - Comm | 0 | 0 | 0 | (17,065 | ) | (205.61 | ) | (0.5 | ) |
| Other Income | 55,591 | 3,920 | 3,374 | 3,374 | | 40.65 | | 0.1 | |
| Effective Gross Income | $2,520,175 | $2,833,894 | $2,889,670 | $2,994,852 | | $36,082.55 | | 95.0 | % |
| Total Expenses | $1,431,133 | $1,353,691 | $1,368,398 | $1,346,931 | | $16,228.08 | | 45.0 | % |
| Net Operating Income | $1,089,041 | $1,480,203 | $1,521,272 | $1,647,921 | | $19,854.47 | | 55.0 | % |
| Replacement Reserves | 0 | 0 | 0 | 17,441 | | 210.13 | | 0.6 | |
| TI/LC | 0 | 0 | 0 | 4,204 | | 50.65 | | 0.1 | |
| Net Cash Flow | $1,089,041 | $1,480,203 | $1,521,272 | $1,626,276 | | $19,593.69 | | 54.3 | % |
| (1) | Source: Lender underwriting dated October 9, 2024. |
| (2) | The TTM represents the trailing twelve months ending July 31, 2024. |
| (3) | % column represents percentage of Net Rental Income for all revenue lines and represents percentage of Effective Gross Income for the remaining fields. |
| THE INFORMATION IN THIS STRUCTURAL AND COLLATERAL TERM SHEET IS NOT COMPLETE AND MAY BE AMENDED PRIOR TO THE TIME OF SALE. THIS TERM SHEET IS NOT AN OFFER TO SELL THESE SECURITIES AND IT IS NOT A SOLICITATION OF AN OFFER TO BUY THESE SECURITIES IN ANY JURISDICTION WHERE THE OFFER OR SALE IS NOT PERMITTED. |
| | 166 | |
| Structural and Collateral Term Sheet | | BMO 2024-C10 |
| Contacts |
| BMO Capital Markets CMBS Capital Markets & Banking |
| Contact | E-mail | Phone Number |
| Paul Vanderslice | paul.vanderslice@bmo.com | (917) 996-4514 |
| Managing Director | | |
| | | |
| David Schell | david.schell@bmo.com | (347) 996-0721 |
| Managing Director | | |
| | | |
| Ravish Kamath | ravish.kamath@bmo.com | (347) 668-1507 |
| Director | | |
| | | |
| BMO Capital Markets CMBS Trading & Structuring |
| Contact | E-Mail | Phone Number |
| Andrew Noonan | andrew.noonan@bmo.com | (347) 466-3147 |
| Managing Director | | |
| | | |
| Mary Kunka | mary.kunka@bmo.com | (347) 956-1226 |
| Managing Director | | |
| | | |
| Kiran Manda | kiran.manda@bmo.com | (347) 831-4776 |
| Managing Director | | |
| | | |
| Michael Chen | lei4.chen@bmo.com | (646) 265-0023 |
| Director | | |
| | | |
| BMO Capital Markets Securitized Products Syndicate |
| Contact | E-Mail | Phone Number |
| Alex Smith-Constantine | alex.smithconstantine@bmo.com | (212) 702-1866 |
| Managing Director | | |
| | | |
| Trinian Donohoe | trinian.donohoe@bmo.com | (212) 702-1866 |
| Vice President | | |
| | | |
| Citigroup CMBS Capital Markets and Securitization | |
| Contact | Contact | Contact |
| Rick Simpson | richard.simpson@citi.com | (212) 816-5343 |
| Managing Director | | |
| | | |
| Jason Mercandetti | jason.mercandetti@citi.com | (212) 816-6384 |
| Director | | |
| | | |
| Citigroup Structuring, Trading & Syndicate | |
| Contact | E-Mail | Phone Number |
| Raul Orozco | raul.d.orozco@citi.com | (212) 723-1295 |
| Managing Director | | |
| | | |
| Matt Perry | mattison.perry@citi.com | (212) 723-1295 |
| Director | | |
| | | |
| | | |
| | | |
| | | |
| | | |
| THE INFORMATION IN THIS STRUCTURAL AND COLLATERAL TERM SHEET IS NOT COMPLETE AND MAY BE AMENDED PRIOR TO THE TIME OF SALE. THIS TERM SHEET IS NOT AN OFFER TO SELL THESE SECURITIES AND IT IS NOT A SOLICITATION OF AN OFFER TO BUY THESE SECURITIES IN ANY JURISDICTION WHERE THE OFFER OR SALE IS NOT PERMITTED. |
| | 167 | |
| Structural and Collateral Term Sheet | | BMO 2024-C10 |
| Contacts |
| Deutsche Bank Securities Banking | |
| Contact | Contact | Contact |
| Lainie Kaye | lainie.kaye@db.com | (212) 250-5270 |
| Managing Director | | |
| | | |
| Michael Miller | michael.miller@db.com | (212) 250-0099 |
| Vice President | | |
| | | |
| Sam Lockwood | sam.lockwood@db.com | (212) 250-4569 |
| Vice President | | |
| | | |
| Deutsche Bank Securities Trading & Structuring | |
| Contact | Contact | Contact |
| Shaishav Agarwal | shaishav.agarwal@db.com | (212) 250-6290 |
| Managing Director | | |
| | | |
| Daniel Penn | daniel.penn@db.com | (212) 250-5149 |
| Managing Director | | |
| | | |
| Matt Smith | matt-t.smith@db.com | (212) 250-6155 |
| Director | | |
| | | |
| Ryan Horvath | ryan.horvath@db.com | (212) 250-5149 |
| Director | | |
| | | |
| Goldman Sachs Real Estate Financing Group - Securitization |
| Contact | E-Mail | Phone Number |
| Scott Epperson | scott.epperson@gs.com | (212) 934-2882 |
| Managing Director | | |
| | | |
| Justin Peterson | justin.peterson@gs.com | (212) 902-4283 |
| Vice President | | |
| | | |
| Raymond Todd | raymond.todd@gs.com | (972) 501-3979 |
| Vice President | | |
| | | |
| Goldman Sachs Real Estate Financing Group - Capital Markets |
| Contact | E-Mail | Phone Number |
| Nitin Jagga | nitin.jagga@gs.com | (212) 855-9035 |
| Vice President | | |
| | | |
| Rebecca Bayard | rebecca.bayard@gs.com | (212) 934-0848 |
| Vice President | | |
| | | |
| Goldman Sachs Syndicate & Structuring |
| Contact | E-Mail | Phone Number |
| Scott Walter | scott.walter@gs.com | (212) 357-8910 |
| Managing Director | | |
| | | |
| Lisa Schexnayder | lisa.schexnayder@gs.com | (212) 902-2330 |
| Vice President | | |
| | | |
| | | |
| THE INFORMATION IN THIS STRUCTURAL AND COLLATERAL TERM SHEET IS NOT COMPLETE AND MAY BE AMENDED PRIOR TO THE TIME OF SALE. THIS TERM SHEET IS NOT AN OFFER TO SELL THESE SECURITIES AND IT IS NOT A SOLICITATION OF AN OFFER TO BUY THESE SECURITIES IN ANY JURISDICTION WHERE THE OFFER OR SALE IS NOT PERMITTED. |
| | 168 | |