Building Your Future, Together
Real is a technology-powered real estate brokerage that is shaking up a $100B residential real estate brokerage industry with a new model that focuses on creating financial opportunity for agents. Because when you put agents first, you put clients first.
Real creates financial opportunities for agents in four key ways:

Page 2
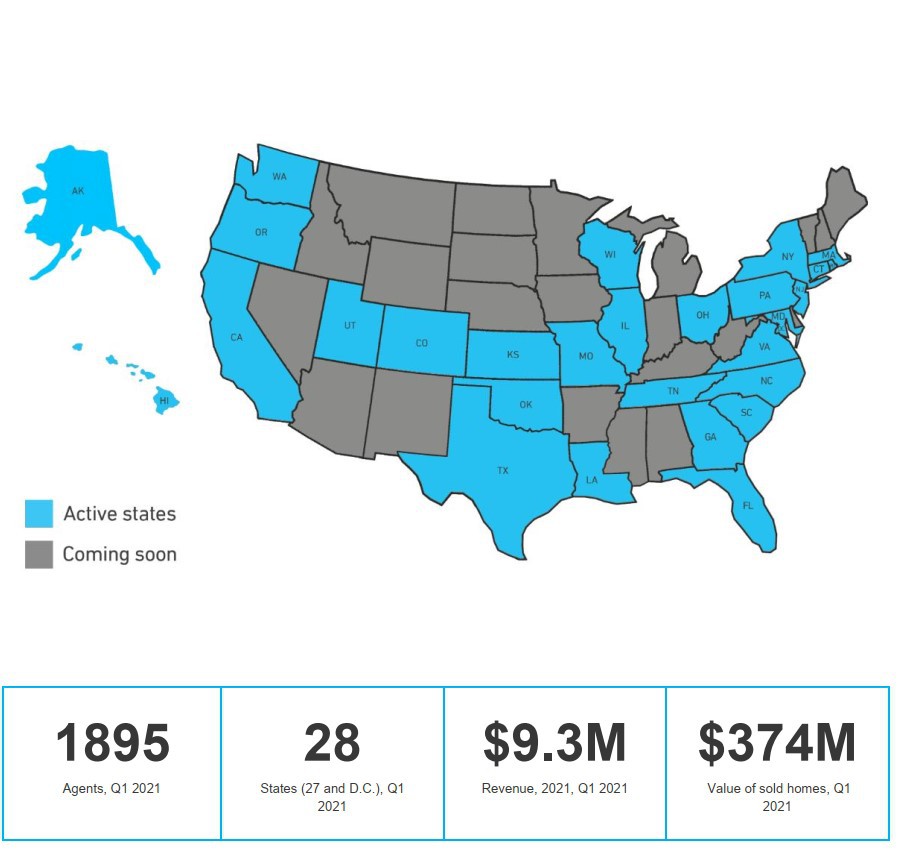
2021 Highlights
Real was founded in 2014 and is headquartered in Toronto and New York City. We provide brokerage services for the real estate market in the United States. At March 31, 2021, we were licensed in 27 states and the District of Columbia. Our fast-growing network of agents allows for strong relationship building, access to a nationwide referral network and seamless expansion opportunities.
Page 3
Introduction
This Management’s Discussion and Analysis (“MD&A”) is provided to enable a reader to assess the results of operations and financial condition of The Real Brokerage Inc. (formerly ADL Ventures Inc.) (“Real” or the “Company”). for the period ended March 31, 2021 and 2020. This MD&A is dated May 11, 2021 and should be read in conjunction with the unaudited interim condensed financial statements and related notes for the period ended March 31, 2021 and 2020 (“Financial Statements”). Unless the context indicates otherwise, references to “Real”, “the Company”, “we”, “us” and “our” in this MD&A refer to The Real Brokerage Inc. and its operations.
Forward-looking information
Certain information included in this MD&A contains forward-looking information within the meaning of applicable Canadian securities laws. This information includes, but is not limited to, statements made in Business Overview and Strategy, Results from Operations, and other statements concerning Real’s objectives, its strategies to achieve those objectives, as well as statements with respect to management’s beliefs, plans, estimates and intentions, and similar statements concerning anticipated future events, results, circumstances, performance or expectations that are not historical facts. Forward-looking information generally can be identified by the use of forward-looking terminology such as “outlook”, “objective”, “may”, “will”, “would”, “expect”, “intend”, “estimate”, “anticipate”, “believe”, “should”, “plan”, “continue”, or similar expressions suggesting future outcomes or events or the negative thereof. Such forward-looking information reflects management’s current beliefs and is based on information currently available. All forward-looking information in this MD&A is qualified by the following cautionary statements.
Forward looking information necessarily involves known and unknown risks and uncertainties, which may be general or specific and which give rise to the possibility that expectations, forecasts, predictions, projections or conclusions will not prove to be accurate, assumptions may not be correct and objectives, strategic goals and priorities may not be achieved. A variety of factors, many of which are beyond Real’s control, affect the operations, performance and results of the Company and its subsidiaries, and could call actual results to differ materially from current expectations of estimated or anticipated events or results.
Although Real believes that the expectations reflected in such forward-looking information are reasonable and represent the Company’s projections, expectations and beliefs at this time, such information involves known and unknown risks and uncertainties which may cause the Company’s actual performance and results in future periods to differ materially from any estimates or projections of future performance or results expressed or implied by such forward-looking information. See Risks and Uncertainties for further information. The reader is cautioned to consider these factors, uncertainties, and potential events carefully and not to put undue reliance on forward-looking information, as there can be no assurance that actual results will be consistent with such forward-looking information.
The forward-looking information included in this MD&A is made as of the date of this MD&A and should not be relied upon as representing Real’s views as of any date subsequent to the date of this MD&A. Management undertakes no obligation, except as required by applicable law, to publicly update or revise any forward-looking information, whether as a result of new information, future events or otherwise.
Business overview and strategy
Real is a growing multistate technology-powered real estate brokerage in the United States. We focus our operations on development of technology that helps real estate agents perform better as well as building a scalable, efficient brokerage operation that is not dependent on a cost-heavy brick and mortar presence in the markets that we operate in.
Page 4
Business overview and strategy (cont’d)
As a licensed real estate brokerage, our revenue is generated, primarily, by processing real estate transactions which entitle us to commissions. We pay a portion of our commission revenue to our agents and brokers.
Our strength is our ability to offer real estate agents a higher value, through a proprietary technology stack, at a lower cost, compared to other brokerages, while operating efficiently and scaling quickly.
Accelerated Growth
Following our listing on the TSX-V and the launch of our Agent Equity Program, we have entered into a period of growth, driven by an increase in the number of agents joining us on a monthly basis, as well as higher productivity of those newer cohorts. The beginning of the impact of that growth is reflected in our Q1 2021 revenue figures and we expect this trend to continue and accelerate in the following quarters.
Our non-brick and mortar based model is becoming increasingly desirable, especially given the impact of COVID-19 on agents and their needs for a platform that will enable them to work from anywhere, without being tied to a physical office.
Focus on Technology
The real estate industry has been very slow at adopting technology and real estate transactions remain notoriously difficult to manage. We believe there is an opportunity to create agent focused software products that will create a differentiation between Real and other brokerages. We also acknowledge that profitability in our industry is closely tied to the improvement of internal operations efficiency through automation and the ability to scale and expand rapidly.
Recent developments
RealtyCrunch Acquisition
On January 11, 2021, Real completed the acquisition of the business assets and intellectual property of RealtyCrunch Inc. (“RealtyCrunch”). The transaction was settled in cash for an aggregate purchase price of USD $1.1 million plus 184,275 common share purchase warrants of Real (each, a “Warrant”). Each Warrant is exercisable into one common share of Real (each, a “Common Share”) at a price of CAD $1.36 for a period of four years. In connection with this acquisition, Real also granted 2,441stock options (“Options”), which vest over a 4-year period.
In connection with the RealtyCrunch transaction, Pritesh Damani joined Real as Chief Product Officer.
Expansion to additional states
Real expanded its brokerage to Hawaii, Kansas, Oklahoma, Utah, and Wisconsin in the first quarter of 2021.
Business Strategy
Revenue-share model
As the vast majority of real estate agents are independent contractors, we believe that it is our responsibility to create multiple revenue sources and improve financial opportunities for agents. Our attractive commission split coupled with the equity incentives for agents provide great opportunities. We are now offering agents the opportunity to earn revenue-share, paid out of Real’s portion of commissions, for new agents that they personally refer to Real. The program launched in November 2019 is having a major impact on our agent count and revenue growth.
Page 5
Business overview and strategy (cont’d)
Agent’s experience
We focus on creating an unparalleled agent experience though development of a unique and comprehensive mobile focused platform. Our technology focuses on delivering agents an operating system for their business and assisting them with their marketing, productivity, support, education, transaction management and more.
Focus on teams
Real estate teams operate as “brokerages inside a brokerage”. A team is typically formed by a high producing agent who attracts other agents to work with them and enjoy the lead flow and mentoring provided by the team leader. To attract teams, we enhanced our team offering to include the full benefits of revenue sharing and the equity program to allow brokers and agents a financial mechanism to build teams across geographical boundaries in any of the markets that we serve without incurring significant additional expense, oversight responsibility, or liability while preserving and enhancing the agents and brokers’ personal brands. The growth in brokerage teams joining Real is having a positive impact, as reflected in first quarter revenue growth.
Tracking agent satisfaction
Agents’ satisfaction is top-of-mind for Real and we use the Net Promoter Score® (“NPS”) surveys for measurement and tracking. NPS is a measure of customer satisfaction and is measured on a scale between (100) and 100. An NPS above 50 is considered excellent. Real’s fourth quarter NPS was 68, with agents expressing satisfaction with the business model, culture, technology, support and leadership. Areas of focus for continued improvement include agent training, more insight into payment and equity data, and a smoother mobile app experience.
Objectives
Real seeks to become one of the leading real estate brokerages in the United States. Using our proprietary technology, we look to provide agents with all the tools they need in order to manage and market their business and succeed. Real plans to accomplish this through: (i) proprietary integration of technology and tools focused on facilitating and improving tasks performed by agents. (ii) the offering of attractive business terms to agents and creation of multiple potential revenue streams for agents. (iii) providing excellent support and service to our agents, and (iv) the creation of a nationwide collaborative community of agents. Leveraging the engagement of real estate agents and home buyers and sellers, Real will seek to generate revenue through a variety of different channels.
Presentation of financial information and non-IFRS measures
Presentation of financial information
Unless otherwise specified herein, financial results, including historical comparatives, contained in this MD&A are based on Real’s Financial Statements, which have been prepared in accordance with International Financial Reporting Standards (“IFRS”) as issued by the International Accounting Standards Board (“IASB”) and the interpretations of the IFRS Interpretations Committee. Unless otherwise specified, amounts are in U.S dollars and percentage changes are calculated using whole numbers.
Page 6
Presentation of financial information and non-IFRS measures (cont’d)
Non-GAAP measures
In addition to the reported IFRS measures, industry practice is to evaluate entities giving consideration to certain non-GAAP performance measures, such as earnings before interest, taxes, depreciation and amortization (“EBITDA”) or adjusted earnings before interest, taxes, depreciation and amortization (“Adjusted EBITDA”).
Management believes that these measures are helpful to investors because they are measures that the Company uses to measure performance relative to other entities. In addition to IFRS results, these measures are also used internally to measure the operating performance of the Company.
These measures are not in accordance with GAAP and have no standardized definitions, and as such, our computations of these non-GAAP measures may not be comparable to measures by other reporting issuers. In addition, Real’s method of calculating non-GAAP measures may differ from other reporting issuers, and accordingly, may not be comparable.
Earnings Before Interest, Taxes, Depreciation and Amortization
EBITDA is used as an alternative to net income because it excludes major non-cash items such as interest, taxes and amortization, which management considers non-operating in nature. A reconciliation of EBITDA to IFRS net income is presented under the section Results from Operations of this MD&A.
Adjusted Earnings Before Interest, Taxes, Depreciation and Amortization
Adjusted EBITDA is used as an alternative to net income because it excludes major non-cash items such as amortization, interest, stock-based compensation, current and deferred income tax expenses and other items management considers non-operating in nature. A reconciliation of Adjusted EBITDA to IFRS net income is presented under section Results from Operations of this MD&A.
Page 7
Results from operations
Select annual information
For the period ended March 31, | | 2021 | 2020 | 2019 |
Operating results | | | | |
Total revenues | | 9,309 | 2,936 | 4,795 |
Loss from continuing operations | | (3,823) | (243) | (510) |
Loss attributable to owners of the parent | | (3,823) | (243) | (510) |
Per share basis | | | | |
Basic and diluted loss per share | | (0.038) | (0.006) | (0.012) |
| | |
| | |
| | |
| | |
| | March 31, | December 31, | December 31, |
As at | Note | 2021 | 2020 | 2019 |
Total assets | | 22,834 | 21,907 | 408 |
Total liabilities | (ii) | 3,233 | 1,109 | 598 |
Liabilities to total assets | (i) (iii) | 14% | 5% | 147% |
EBITDA | (i) (iv) | (3,671) | (3,390) | (1,531) |
Adjusted EBITDA | (i) (iv) | (923) | (1,793) | (1,043) |
| |
|
| | |
(i) Represents a non-GAAP measure. Real's method for calculating non-GAAP measures may differ from other reporting issuers' methods and accordingly may not be comparable. For definitions and basis of presentation of Real's non-GAAP measures, refer to the non-GAAP measures section of this MD&A.
(ii) Total liabilities is defined as accounts payable and other financial liabilities, less preferred equity.
(iii) Liabilities to total assets is a non-GAAP measure and is calculated as total non-current liabilities divided by total assets.
(iv) EBITDA and Adjusted EBITDA is calculated on a trailing twelve month basis. Refer to non-GAAP measures section of this MD&A for further details.
For the period ended March 31, 2021, total revenues amounted to $9,309 compared to $2,936 for the period ended March 31, 2020, thus demonstrating that we are beginning to recognize the effects of the Company’s growth. For the period ended March 31, 2019, the Company recognized a large commercial transaction which accounted for a significant portion of revenues, during the periods ended March 31, 2020 and March 31, 2021 all revenues were resulting from our core business activities. The increase in revenues is attributable to an increase in productive agents on our platform, as well as expanding the number of states in which we operate. We are continually investing in the acquisition of productive agents on our platform, which will further translate into a larger transaction volume closed by our agents.
Page 8
Results from operations (cont’d)
A further breakdown in revenues generated during the year is included below:
| | | Three months ended March 31, | |
| | | 2021 | | | 2020 | |
| Major service lines | | | | | | |
| Commissions | | 9,259 | | | 2,917 | |
| Subscriptions | | - | | | 13 | |
| Other | | 50 | | | 6 | |
| Total revenue | | 9,309 | | | 2,936 | |
| Timing of revenue recognition | | | | | | |
| Products transferred at a point in time | | 9,259 | | | 2,917 | |
| Services transferred over time | | - | | | 13 | |
| Revenue from contracts with customers | | 9,259 | | | 2,930 | |
| Other revenue | | 50 | | | 6 | |
| Total revenue | | 9,309 | | | 2,936 | |
A further breakdown in expenses during the year is included below:
| | | Three months ended March 31, | |
| | | 2021 | | | 2020 | |
| Cost of sales | | 8,072 | | | 2,552 | |
| Operating Expenses | | | | | | |
| Compensation expenses | | 3,307 | | | 127 | |
| Consultancy | | 573 | | | 191 | |
| Advertising expenses | | 443 | | | 152 | |
| Administrative expenses | | 500 | | | 422 | |
| Dues and subscriptions | | 81 | | | 20 | |
| Depreciation | | 42 | | | 27 | |
| Travel | | 2 | | | 26 | |
| Occupancy costs | | 2 | | | (6 | ) |
| | | | | | | |
| Total cost of sales, selling expenses, administrative expenses | | 13,022 | | | 3,511 | |
We believe that growth can and should be balanced with profits and therefore plan and monitor spend responsibly to ensure we decrease our losses and work towards being EBITDA positive. Our loss as a percentage of total revenue was 39% for the period ended March 31, 2021 and 8% for the period ended March 31, 2020. This was primarily due to an increase in compensation expenses as a result of stock-based compensation issued in accordance with the acquisition of RealtyCrunch.
| For the period ended March 31, | | 2021 | | | 2020 | |
| Revenues | | 9,309 | | | 2,936 | |
| Cost of sales | | 8,072 | | | 2,552 | |
| Cost of sales as a percentage of revenues | | 87% | | | 87% | |
Page 9
Results from operations (cont’d)
The total cost of sales for the period ended March 31, 2021 was $8,072 in comparison to $2,552 for the period ended March 31, 2020. We typically pay our agents 85% of the gross commission earned on every real estate transaction and, as the total revenue increases, the total commission to agents’ expense increases accordingly.
Our compensation expenses for the period ended March 31, 2021 was $3,307 in comparison to $127 for the period ended March 31, 2020. The increase in compensation expenses were primarily due to an increase in stock-based compensation expense of $2,748 in comparison to $212 for the period ended March 31, 2020 as well as an increase in salaries and benefits. In January 2021, Real granted 2,441 Options in connection with the acquisition of RealtyCrunch, the amortized expense for which, comprises the majority of the increase in stock-based incentive compensation. The salaries and benefits expenses for the period end March 31, 2021 were $559 in comparison to $73 for the period ended December 31, 2020.
At March 31, 2021, Real had 34 full time employees which was an increase from 11 full time employees at March 31, 2020. The increase is attributable to Real’s commitment to better service its agents and to the growth and expansion of the Company.
Our consultancy expenses for the period ended March 31, 2021 was $573 in comparison to $191 for the period ended March 31, 2020. The increase in consultancy expenses was primarily due to legal and professional fees.
Our advertising expenses for the period ended March 31, 2021 was $443 compared to $152 for the period ended March 31, 2020 due to our efforts to attract agents. This increase is primarily comprised of $243 in revenue share paid to agents, as part of our revenue share model. Agents earn revenue-share for new agents that they personally refer to Real. We track the performance of each of our traditional advertising channels and constantly optimize spending. We advertise on multiple online platforms and websites such as Google Adwords, Facebook and Indeed.
Page 10
Summary of Quarterly Information
The following table provides selected quarterly financial information for the five most recently completed financial quarters ended March 31, 2021. This information reflects all adjustments of a recurring nature that are, in the opinion of management, necessary to present a fair statement of the results of operations for the periods presented. Quarter-to-quarter comparisons of financial results are not necessarily meaningful and should not be relied upon as an indication of future performance.
| | 2021 | | | | | | 2020 | | | | | | | |
| | Q1 | | | Q4 | | | Q3 | | | Q2 | | | Q1 | |
| Revenue | 9,309 | | | 7,090 | | | 3,939 | | | 2,594 | | | 2,936 | |
| Cost of sales | 8,072 | | | 6,342 | | | 3,198 | | | 2,313 | | | 2,552 | |
| Cost of sales | 8,072 | | | 6,342 | | | 3,198 | | | 2,313 | | | 2,552 | |
| Gross profit | 1,237 | | | 748 | | | 741 | | | 281 | | | 383 | |
| Administrative expenses | 4,080 | | | 1,774 | | | 988 | | | 482 | | | 784 | |
| Advertising expenses | 443 | | | 268 | | | 88 | | | 209 | | | 152 | |
| Research and development expenses | 427 | | | 76 | | | 75 | | | 49 | | | 23 | |
| Other income | - | | | (167 | ) | | - | | | (1 | ) | | - | |
| Operating loss | (3,713 | ) | | (1,203 | ) | | (410 | ) | | (458 | ) | | (575 | ) |
| Listing expenses | - | | | 32 | | | - | | | 803 | | | - | |
| Finance costs (income). Net | 110 | | | 111 | | | 12 | | | 15 | | | (322 | ) |
| Loss before tax | (3,823 | ) | | (1,346 | ) | | (422 | ) | | (1,276 | ) | | (243 | ) |
| Income taxes | - | | | - | | | - | | | | | | | |
| Net Loss | (3,823 | ) | | (1,346 | ) | | (422 | ) | | (1,276 | ) | | (243 | ) |
| Total loss and comprehensive loss | (3,823 | ) | | (1,346 | ) | | (422 | ) | | (1,276 | ) | | (243 | ) |
| Non operating expenses | | | | | | | | | | | | | | |
| Taxes | - | | | - | | | - | | | - | | | - | |
| Interest | 110 | | | 111 | | | 12 | | | 15 | | | (332 | ) |
| Depreciation | 42 | | | 32 | | | 10 | | | 22 | | | 27 | |
| Stock-based compensation | 2,748 | | | 802 | | | 139 | | | (15 | ) | | 212 | |
| Listing expenses | - | | | - | | | - | | | 459 | | | - | |
| Adjusted EBITDA | (923 | ) | | (401 | ) | | (261 | ) | | (795 | ) | | (336 | ) |
| Earnings per share | | | | | | | | | | | | | | |
| Basic and diluted loss per share | (0.038 | ) | | (0.009 | ) | | (0.003 | ) | | (0.008 | ) | | (0.006 | ) |
Quarterly trends and risks
Our quarterly results are dependent on the economic conditions within the markets for which we operate. The Company’s revenue and income can experience considerable variations from quarter to quarter and year to year due to factors beyond the Company’s control. The business is affected by the overall conditions of the real estate market, influenced primarily by economic growth, interest rates, unemployment, inventory, and mortgage rate volatility. The Company’s revenue from a real estate transaction is recorded only when a real estate transaction has been closed. Consequently, the timing of revenue recognition can materially affect quarterly results.
Page 11
Summary of Quarterly Information (cont’d)
Quarterly trends and risks (cont’d)
For the first half of 2020, the COVID-19 pandemic adversely affected the Company’s business and business worldwide. However, the overall impact of COVID-19 on the Company was not significant and the Company demonstrated growth on the second half of the year. The Company further recognized the effects of growth in the first quarter of 2021 and is positioned to continue to expand.
Liquidity and capital resources
Liquidity and cash management
Our primary sources of liquidity are cash and cash flows from operations as well as cash raised from investors in exchange for issuance of shares. The Company expects to meet all of its obligations and other commitments as they become due. The Company has various financing sources to fund operations and will continue to fund working capital needs through these sources along with cash flows generated from operating activities.
At March 31, 2021, our cash totaled $20,527. Cash is comprised of financial instruments with an original maturity of 90 days or less from the date of purchase, primarily money market funds. We hold no marketable securities.
Financing activities
We believe that our existing balances of cash and cash flows expected to be generated from our operations will be sufficient to satisfy our operating requirements for at least the next three years.
Our future capital requirements will depend on many factors, including our level of investment in technology, our rate of growth into new markets, and potential mergers and acquisitions. Our capital requirements may be affected by factors that we cannot control such as the residential real estate market, interest rates, and other monetary and fiscal policy changes to the manner in which we currently operate. To support and achieve our future growth plans, however, we may need or seek to obtain additional funding through equity or debt financing.
Page 12
Liquidity and capital resources (cont’d)
Financing activities (cont’d)
The following table presents liquidity as a percentage of debt:
| | | March 31, | | | December 31, | |
| As at, | | 2021 | | | 2020 | |
| Cash | | 20,527 | | | 21,226 | |
| Restricted cash | | 47 | | | 47 | |
| Other receivables | | 24 | | | 221 | |
| Liquidity | | 20,598 | | | 21,494 | |
| Loans and borrowings | | - | | | - | |
| Debt | | - | | | - | |
| | | | | | | |
| Liquidity expressed as a percentage of debt | | 0% | | | 0% | |
The Company’s debt obligations can be funded by cash, restricted cash, other receivables and revenues from operations.
Contractual obligations
As at March 31, 2021 the Company had no guarantees, leases, off-balance sheet arrangements other than those noted in our results from operations. We have a lease for our New York office that expires on June 30, 2023. The monthly rent expense per the lease for the period ended March 31, 2021 is $7 per month.
Capital management framework
Real defines capital as the aggregate of deficit and equity. The Company’s capital management framework is designed to maintain a level of capital that funds the operations and business strategies and builds long-term shareholder value.
The Company’s objective is to manage its capital structure in such a way as to diversify its funding sources, while minimizing its funding costs and risks. For 2021, Real expects to be able to satisfy all of its financing requirements through use of some or all of the following: cash on hand, cash generated by operations and through the public and private offerings of equity securities.
Page 13
Other metrics
Earnings before interest, taxes, depreciation and amortization
| For the period ended March 31, | | 2021 | | | 2020 | | | 2019 | |
| Total revenues | | 9,309 | | | 2,936 | | | 4,795 | |
| Net loss and comprehensive loss | | (3,823 | ) | | (243 | ) | | (510 | ) |
| Add (deduct): | | | | | | | | | |
| – Taxes | | - | | | - | | | - | |
| – Interest | | 110 | | | (332 | ) | | 2 | |
| – Depreciation | | 42 | | | 27 | | | 1 | |
| EBITDA | | (3,671 | ) | | (548 | ) | | (507 | ) |
Adjusted earnings before interest, taxes, depreciation and amortization
| For the period ended March 31, | | 2021 | | | 2020 | | | 2019 | |
| Net loss and comprehensive loss | | (3,823 | ) | | (243 | ) | | (510 | ) |
| Add (deduct): | | | | | | | | | |
| – Taxes | | - | | | - | | | - | |
| – Interest | | 110 | | | (332 | ) | | 2 | |
| – Depreciation | | 42 | | | 27 | | | 1 | |
| – Stock-based compensation | | 2,748 | | | 212 | | | 122 | |
| Adjusted EBITDA | | (923 | ) | | (336 | ) | | (385 | ) |
Significant accounting policies and other explanatory information
The preparation of the Financial Statements requires management to make estimates and judgments that affect the reported amounts of assets, liabilities, revenues and expenses and the related disclosures as of the date of the Company’s annual condensed consolidated financial statements. Actual results may differ from estimates under different assumptions and conditions.
Significant judgments include the timing of revenue recognition and consolidation adjustments. Our significant judgments have been reviewed and approved by the Audit Committee for completeness of disclosure on what management believes would be relevant and useful to investors in interpreting the amounts and disclosures in our annual condensed consolidated financial statements.
Changes in accounting policies
Amendments to IAS 1, Presentation of Financial Statements (“IAS 1”) and IAS 8, Accounting Policies, Changes in Accounting Estimates and Errors (“IAS 8”) – Definition of Material
In October 2018, the IASB issued amendments to IAS 1 and IAS 8 to align the definition of “material” across the standards and to clarify certain aspects of the definition. The new definition states that, “Information is material if omitting, misstating or obscuring it could reasonably be expected to influence decisions that the primary users of general purpose financial statements make on the basis of those financial statements, which provide financial information about a specific reporting entity.” These amendments are effective January 1, 2020. The amendments to the definition of material and have not had a significant impact on the Company’s Financial Statements.
Page 14
Future changes in accounting policies
The Company monitors the potential changes proposed by the IASB and analyzes the effect that changes in the standards may have on the Company’s operations. Standards issued but not yet effective up to the date of issuance of the Financial Statements are described below. This description is of the standards and interpretations issued that the Company reasonably expects to be applicable at a future date. The Company intends to adopt these standards when they become effective.
In January 2020, the IASB issued amendments to IAS 1 — Presentation of Financial Statements: Classification of Liabilities as Current or Non-Current to clarify how to classify debt and other liabilities as current or non-current, and in particular how to classify liabilities with an uncertain settlement rate and liabilities that may be settled by converting to equity. These amendments are effective on or after January 1, 2023. The Company does not expect any material impact from the adoption of these amendments.
In May 2020, the IASB issued Annual Improvements to IFRSs 2018 - 2020 Cycle. The improvements have amended four standards with effective date January 1, 2022: i) IFRS 1 — First-time Adoption of International Financial Reporting Standards in relation to allowing a subsidiary to measure cumulative translation differences using amounts reported by its parent, ii) IFRS 9 — Financial Instruments in relation to which fees an entity includes when applying the “10 percent” test for derecognition of financial liabilities, iii) IAS 41 — Agriculture in relation to the exclusion of taxation cash flows when measuring the fair value of a biological asset, and iv) IFRS 16 — Leases in relation to an illustrative example of reimbursement for leasehold improvements. The Company does not expect any material impact from the adoption of these amendments.
In August 2020, the IASB issued a package of amendments to IFRS 9 – Financial Instruments, IAS 39 – Financial Instruments: Recognition and Measurement, IFRS 7 – Financial Instruments: Disclosures, IFRS 4 – Insurance Contracts and IFRS 16 – Leases in response to the ongoing reform of inter-bank offered rates (IBOR) and other interest rate benchmarks. The amendments are aimed at helping companies to provide investors with useful information about the effects of the reform on those companies’ financial statements. These amendments complement amendments issued in 2019 and focus on the effects on financial statements when a company replaces the old interest rate benchmark with an alternative benchmark rate as a result of the reform. The new amendments relate to:
• changes to contractual cash flows – a company will not be required to derecognize or adjust the carrying amount of financial instruments for changes required by the interest rate benchmark reform, but will instead update the effective interest rate to reflect the change to the alternative benchmark rate;
• hedge accounting – a company will not have to discontinue its hedge accounting solely because it makes changes required by the interest rate benchmark reform if the hedge meets other hedge accounting criteria; and
• disclosures – a company will be required to disclose information about new risks that arise from the interest rate benchmark reform and how the company manages the transition to alternative benchmark rates.
Page 15
Future changes in accounting policies (cont’d)
These amendments are effective on or after January 1, 2021, with early adoption permitted.
In February 2021, the IASB issued amendments to IAS 1 — Presentation of Financial Statements and IFRS Practice Statement 2: Disclosure of Accounting policies which require companies to disclose their material accounting policy information rather than their significant accounting policies and provide guidance on how to apply the concept of materiality to accounting policy disclosures. These amendments are effective on or after January 1, 2023. The Company does not expect any material impact from the adoption of these amendments.
In February 2021, the IASB issued amendments to IAS 8 — Accounting Policies, Changes in Accounting Estimates and Errors: Definition of Accounting Estimates which clarify how companies should distinguish changes in accounting policies from changes in accounting estimates. These amendments are effective on or after January 1, 2023. The Company does not expect any material impact from the adoption of these amendments.
Disclosure controls and procedures and internal control over financial reporting
Disclosure controls and procedures
The Company’s Chief Executive Officer (the “CEO”) and Chief Financial Officer (the “CFO”) have designed or caused to design controls to provide reasonable assurance that: (i) material information relating to the Company is made known to management by others, particularly during the period in which the annual and interim filings are being prepared; and (ii) information required to be disclosed by the Company in its annual and interim filings or other reports filed or submitted under securities legislation is recorded, processed, summarized and reported within the time frame specified in the securities legislation.
Based on the evaluations, the CEO and CFO have concluded that the Company’s disclosure controls and procedures were adequate and effective.
Internal control over financial reporting
Real has established internal controls over financial reporting to provide reasonable assurance regarding the reliability of the Company’s financial reporting and the preparation of the Financial Statements for external purposes in accordance with IFRS. Management, including the Company’s CEO and CFO, have determined that as at March 31, 2021 and 2020, the internal controls over financial reporting were effective.
Inherent limitations
It should be noted that in a control system, no matter how well conceived and operated, can provide only reasonable, not absolute, assurance that the objectives of the control system are met. Given the inherent limitations in all control systems, no evaluation of controls can provide absolute assurance that all control issues, including instances of fraud, if any, have been detected. These inherent limitations include, among other items: (i) that management’s assumptions and judgments could ultimately prove to be incorrect under varying conditions and circumstances; (ii) the impact of any undetected errors; and (iii) controls may be circumvented by unauthorized acts of individuals, by collusion of two or more people, or by management override.
Page 16
Disclosure controls and procedures and internal control over financial reporting (cont’d)
Key management compensation
The Company’s key management personnel are comprised of the CEO, the CFO, Chief Product Officer, the Chief Strategy Officer, and other members of the executive team. Key management personnel compensation for the period consistent of the following:
| | | March 31, | | | March 31, | |
| | | 2021 | | | 2020 | |
| Salaries and benefits | | 271 | | | 108 | |
| Short-term employee benefits | | - | | | 2 | |
| Consultancy | | 90 | | | 16 | |
| Share-based payments | | 2,026 | | | 212 | |
| Compensation expenses related to Management | | 2,386 | | | 338 | |
Executive officers participate in the Company’s incentive program. Furthermore, real estate agents of the Company are entitled to participate in the incentive program if they meet certain eligibility criteria.
Market conditions and industry trends
General
Throughout the period ended March 31, 2021, home buyers leveraged interest rates to purchase homes at an increased level. The prospective buyers have lost purchasing power due to rising interest rates, which climbed to 3.45% at the end of March 2021, compared to 2.76% at the start of the year however, buyers are still actively in the market. Although mortgage rates have continued to rise, the general consensus among economists is to expect rates to remain below 4% in 2021.
According to the National Association of Realtors (“NAR”) housing statistics, existing home sales rose 12.3% from March 2020, but declined 3.7% from February 2021 across all regions. Pending home sales increased as of March 2021 by 23.3% from a year ago. The impressive increase in pending home sales is encouraging as pending home sales are a forward- looking indicator of future home sales.
Inventory
Low mortgage rates fueling increased demand have been causing inventory shortages in many housing markets, creating a challenging environment for home buyers. According to the NAR, inventory of existing homes for sale in the U.S. was 1.07 million as of March 2021 (down 28.2% from one year ago) and represented in 2.1 months of supply. We believe that level of supply represents an extreme seller’s market, making the high producing, listing focused teams that Real is attracting even more meaningful. Subsequently, NAR indicated the need for new home construction due to the high demand of homes and the record-low inventory levels.
Page 17
Market conditions and industry trends (cont’d)
Mortgage rates
According to the NAR, mortgage rates on commitments for 30-year, conventional, fixed-rate mortgages averaged 3.17% for March 2021, compared to 3.5% for March of 2020. Some lenders have increased their rates to account for the risk and overall financial uncertainty. Low mortgage rates are pushing buyers into the market as well as driving an increase in refinance applications.
Risks and uncertainties
There are a number of risk factors that could cause future results to differ materially from those described herein. The risks and uncertainties described herein are not the only ones the Company faces. Additional risks and uncertainties, including those that the Company does not know about as of the date of this MD&A, or that it currently deems immaterial, may also adversely affect the Company’s business. If any of the following risks actually occur, the Company’s business may be harmed, and its financial condition and the results of operation may suffer significantly.
Limited operating history
Our limited operating history makes it difficult for potential investors to evaluate our business or prospective operations. As a young company, we are subject to all the risks inherent in a developing organization, financing, expenditures, complications and delays inherent in a new business. Investors should evaluate an investment in us in light of the uncertainties encountered by developing companies in a competitive and evolving environment. Our business is dependent upon the implementation of our business plan. We may not be successful in implementing such plan and cannot guarantee that, if implemented, we will ultimately be able to attain profitability.
Rapid Growth
Real may not be able to scale its business quickly enough to meet the growing needs of its affiliated real estate professionals and if Real is not able to grow efficiently, its operating results could be harmed. As Real adds new real estate professionals, Real will need to devote additional financial and human resources to improving its internal systems, integrating with third- party systems, and maintaining infrastructure performance. In addition, Real will need to appropriately scale its internal business systems and our services organization, including support of our affiliated real estate professionals as its demographics expand over time. Any failure of or delay in these efforts could cause impaired system performance and reduced real estate professional satisfaction. These issues could reduce the attractiveness of Real to existing real estate professionals who might leave Real and result in decreased attraction of new real estate professionals and reduced revenue and financial results.
Additional financing
From time to time, Real may need additional financing to operate or grow its business. The ability to continue as a going concern may be dependent upon raising additional capital from time-to-time to fund operations. Real’s ability to obtain additional financing, if and when required, will depend on investor and lender willingness, its operating performance, the condition of the capital markets and other facts, and Real cannot assure anyone that additional financing will be available to it on favorable terms when required, or at all. If Real raises additional funds through the issuance of equity, equity-linked or debt securities, those securities may have rights, preferences or privileges senior to the rights of its current stock, and its existing stockholders may experience dilution. If Real is unable to obtain adequate financing or financing on terms satisfactory to it when it requires it, its ability to continue to support the operation or growth of its business could be significantly impaired and its operating results may be harmed.
Page 18
Risks and uncertainties (cont’d)
Reliance on United States real estate market
Real’s financial performance is closely tied to the strength of the residential real estate market in the United States, which is cyclical in nature and typically is affected by changes in conditions that are beyond Real’s control. Macroeconomic conditions that could adversely impact the growth of the real estate market and have a material adverse effect on our business include, but are not limited to, economic slowdown or recession, increased unemployment, increased energy costs, reductions in the availability of credit or higher interest rates, increased costs of obtaining mortgages, an increase in foreclosure activity, inflation, disruptions in capital markets, declines in the stock market, adverse tax policies or changes in other regulations, lower consumer confidence, lower wage and salary levels, or the public perception that any of these events may occur. Unfavorable general economic conditions in the United States or other markets Real enters and operates within could negatively affect the affordability of, and consumer demand for, our services which could have a material adverse effect on our business and profitability. In addition, federal and state governments, agencies and government- sponsored entities could take actions that result in unforeseen consequences to the real estate market or that otherwise could negatively impact Real’s business.
Regulation of United States real estate market
Real operates in the real estate industry which is a heavily regulated industry subject to complex, federal, state, provincial and local laws and regulations and third-party organizations’ regulations, policies and bylaws. Generally, the laws, rules and regulations that apply to Real’s business practices include, without limitation, the Real Estate Settlement Procedures Act (“RESPA”), the Fair Housing Act, the Dodd-Frank Act, and federal advertising and other laws, as well as comparable state statutes; rules of trade organizations such as NAR, local Multiple Listing Services, and state and local Associations of Realtors, licensing requirements and related obligations that could arise from our business practices relating to the provision of services other than real estate brokerage services; privacy regulations relating to our use of personal information collected from the registered users of our websites; laws relating to the use and publication of information through the Internet; and state real estate brokerage licensing requirements, as well as statutory due diligence, disclosure, record keeping and standard-of-care obligations relating to these licenses.
Additionally, the Dodd-Frank Act contains the Mortgage Reform and Anti-Predatory Lending Act (“Mortgage Act”), which imposes a number of additional requirements on lenders and servicers of residential mortgage loans, by amending certain existing provisions and adding new sections to RESPA and other federal laws. It also broadly prohibits unfair, deceptive or abusive acts or practices, and knowingly or recklessly providing substantial assistance to a covered person in violation of that prohibition. The penalties for noncompliance with these laws are also significantly increased by the Mortgage Act, which could lead to an increase in lawsuits against mortgage lenders and servicers.
Maintaining legal compliance is challenging and increases business costs due to resources required to continually monitor business practices for compliance with applicable laws, rules and regulations, and to monitor changes in the applicable laws themselves.
Real may not become aware of all the laws, rules and regulations that govern its business, or be able to comply with all of them, given the rate of regulatory changes, ambiguities in regulations, contradictions in regulations between jurisdictions, and the difficulties in achieving both company-wide and region-specific knowledge and compliance.
Page 19
Risks and uncertainties (cont’d)
Success of the platform
Our business strategy is dependent on our ability to develop platforms and features to attract new businesses and users, while retaining existing ones. Staffing changes, changes in user behavior, changes in agent growth rate or development of competing platforms may cause users to switch to alternative platforms or decrease their use of our platform. There is no guarantee that agents will use these features and we may fail to generate revenue. Additionally, any of the following events may cause decreased use of our platform:
• emergence of competing platforms and applications with novel technologies;
• inability to convince potential agents to join our platform;
• technical issues or delays in releasing, updating or integrating certain platforms or in the cross-compatibility of multiple platforms;
• security breaches with respect to our data;
• a rise in safety or privacy concerns; and
• an increase in the level of spam or undesired content on the network.
Management team
We are highly dependent on our management team, specifically our CEO. If we lose key employees, our business may suffer. Furthermore, our future success will also depend in part on the continued service of our key management personnel and our ability to identify, hire, and retain additional personnel. We do not carry “key-man” life insurance on the lives of our executive officer, employees or advisors. We experience intense competition for qualified personnel and may be unable to attract and retain the personnel necessary for the development of our business. Because of this competition, our compensation costs may increase significantly.
Monetization of platform
There is no guarantee that our efforts to monetize the Real platform will be successful. Furthermore, our competitors may introduce more advanced technologies that deliver a greater value proposition to realtors in the future. All these factors individually or collectively may preclude us from effectively monetizing our business which would have a material adverse effect on our financial condition and results of operation.
Seasonality of operations
Seasons and weather traditionally impact the real estate industry in the jurisdictions where Real operates. Continuous poor weather or natural disasters negatively impact listings and sales. Spring and summer seasons historically reflect greater sales periods in comparison to fall and winter seasons. Real has historically experienced lower revenues during the fall and winter seasons, as well as during periods of unseasonable weather, which reduces Real’s operating income, net income, operating margins and cash flow.
Real estate listings precede sales and a period of poor listings activity will negatively impact revenue. Past performance in similar seasons or during similar weather events can provide no assurance of future or current performance, and macroeconomic shifts in the markets Real serves can conceal the impact of poor weather or seasonality.
Page 20
Risks and uncertainties (cont’d)
Agent engagement
Our business model involves attracting real estate agents to our platform. There is no guarantee that growth strategies will bring new agents to our network. Changes in relationships with our partners, contractors and businesses we retain to grow our network may result in significant increases in the cost to acquire new agents. In addition, new agents may fail to engage with our network to the same extent current agents are engaging with our network resulting in decreased use of our network.
Decreases in the size of our agent base and/or decreased engagement on our network may impair our ability to generate revenue.
Managing growth
Successful implementation of our business strategy requires us to manage our growth. Growth could place an increasing strain on our management and financial resources. To manage growth effectively, we need to continuously: (i) evaluate definitive business strategies, goals and objectives; (ii) maintain a system of management controls; and (iii) attract and retain qualified personnel, as well as develop, train and manage management-level and other employees. If we fail to manage our growth effectively, our business, financial condition or operating results could be materially harmed.
Competition
We compete with both start-up and established technology companies and brokerages. Our competitors may have substantially greater financial, marketing and other resources than we do and may have been in business longer than we have or have greater name recognition and be better established in the technological or real estate markets than we are. If we are unable to compete successfully with other businesses in our existing market, we may not achieve our projected revenue and/or user targets which may have a material adverse effect on our financial condition.
Volatility
The market price of our Common Shares could fluctuate significantly in response to various factors and events, including, but not limited to: our ability to execute our business plan; operating results below expectations; announcements regarding regulatory developments with respect to the real estate industry; our issuance of additional securities, including debt or equity or a combination thereof, necessary to fund our operating expenses; announcements of technological innovations or new products by us or our competitors; and period-to-period fluctuations in our financial results. In addition, the securities markets have from time to time experienced significant price and volume fluctuations that are unrelated to the operating performance of particular companies. These market fluctuations may also materially and adversely affect the market price of our Common Shares.
An investment in our securities is speculative and involves a high degree of risk. Potential investors should be aware that the value of an investment in the Company may go down as well as up. In addition, there can be no certainty that the market value of an investment in the Company will fully reflect its underlying value. Investors could lose their entire investment.
Because we can issue additional Common Shares, purchasers of our Common Shares may incur immediate dilution and experience further dilution.
As of the date of this MD&A, we are authorized to issue an unlimited number of Common Shares, of which 143,401 Common Shares are issued and outstanding. Our board of directors has the authority to cause us to issue additional Common Shares without consent of any of stockholders. Consequently, our stockholders may experience further dilution in their ownership of our stock in the future, which could have an adverse effect on the trading market for our Common Shares.
Page 21
Risks and uncertainties (cont’d)
Loss of investment (cont’d)
Furthermore, our articles give our Board the right to create one or more new classes or series of shares. As a result, our Board may, without stockholder approval, issue shares of a new class or series with voting, dividend, conversion, liquidation or other rights that could adversely affect the voting power and equity interests of the holders of our Common Shares, as well as the price of our Common Shares.
Cyber security threats
A cyber incident is an intentional or unintentional event that could threatens the integrity, confidentiality or availability of the Company’s information resources. These events include, but are not limited to, unauthorized access to information systems, a disruption to our information systems, or loss of confidential information. Real’s primary risks that could result directly from the occurrence of a cyber incident include operational interruption, damage to our public image and reputation, and/or potentially impact the relationships with our customers.
We have implemented processes, procedures and controls to mitigate these risks, including, but not limited to, firewalls and antivirus programs and training and awareness programs on the risks of cyber incidents. These procedures and controls do not guarantee that the financial results may not be negatively impacted by such an incident.
Subsequent events
On April 22, 2021, the Company announced its expected filing of Form 40-F Registration Statement with the United States Securities and Exchange Commission (the “SEC”), in advance of an anticipated listing on the Nasdaq Capital Market. The listing of The Company’s Common Shares on Nasdaq remains subject to the approval of Nasdaq and the satisfaction of all applicable listing and regulatory requirements, including meeting the necessary share price requirements and the SEC declaring the Form 40-F Registration Statement effective. The Company will continue to maintain the listing of its Common Shares on the TSX Venture Exchange under the trading symbol “REAX”. The Company also will continue to maintain listing its Common Shares on the OTCQX under the trading symbol “REAXF” until listed on Nasdaq.
Subsequent to March 31, 2021, the Company has expanded its brokerage services to Oregon and Nevada.
Outstanding Share Data
As of May 11, 2021, the Company had 143,401 Common Shares issued and outstanding.
In addition, as of May 11, 2021, there were 18,465 Options outstanding under the Stock Option Plan with exercises prices ranging from $0.10 to $2.50 CAD per share and expiry dates ranging from January 2026 to March 2031. Each Option is exercisable for one Common Share. A total of 607 restricted share units (“RSUs”) were outstanding under the RSU Plan. Once vested, a total of 607 Common Shares will be issuable pursuant to the outstanding RSUs.
Additional information
These documents, as well as additional information regarding Real, have been filed electronically on Real’s website at www.joinreal.com and under the Company’s profile at www.sedar.com.
Page 22