
Investor Presentation May 4, 2023 EngageSmart Investor Presentation Exhibit 99.2
Forward-Looking Statements Certain statements in this presentation are “forward-looking statements” within the meaning of the Private Securities Litigation Reform Act of 1995 and are based on current expectations and assumptions that are subject to risks and uncertainties. All statements contained in this news release that do not relate to matters of historical fact should be considered forward-looking statements, and are generally identified by words such as “expect,” “intend,” “anticipate,” “estimate,” “believe,” “future,” “could,” “should,” “plan,” “aim,” and other similar expressions. These forward-looking statements include, but are not limited to, statements regarding anticipated financial performance and financial position, including our financial outlook for the second quarter and full year 2023 and thereafter, and other statements that are not historical facts. These forward-looking statements are neither promises nor guarantees, but involve risks and uncertainties that may cause actual results to differ materially from those contained in the forward-looking statements. Our actual results could differ materially from those anticipated in these forward-looking statements for many reasons, including, but not limited to, the following: our inability to sustain our rapid growth; failure to manage our infrastructure to support our future growth; our risk management efforts not being effective to prevent fraudulent activities; inability to attract new customers or convert trial customers into paying customers; inability to introduce new features or services successfully or to enhance our solutions; declines in customer renewals or failure to convince customers to broaden their use of solutions; inability to achieve or sustain profitability; failure to adapt and respond effectively to rapidly changing technology, evolving industry standards and regulations and changing business needs, requirements or preferences; real or perceived errors, failures or bugs in our solutions; intense competition; lack of success in establishing, growing or maintaining strategic partnerships; fluctuations in quarterly operating results; future acquisitions and investments diverting management’s attention and difficulties associated with integrating such acquired businesses; general economic conditions (including inflation and rising interest rates), both domestically and internationally, as well as economic conditions affecting industries in which our customers operate; the war in Ukraine; concentration of revenue in our InvoiceCloud and SimplePractice solutions; COVID-19 pandemic and its impact on our employees, customers, partners, clients and other key stakeholders; legal and regulatory risks; and technology and intellectual property-related risks, among others. Other important risk factors that could affect the outcome of the events set forth in these statements and that could affect the Company’s operating results and financial condition are discussed in Item 1A of our Annual Report on Form 10-K for the year ended December 31, 2022, and our subsequent Quarterly Reports on Form 10-Q, as updated by our future filings with the Securities and Exchange Commission (“SEC”). Such statements are based on the Company’s beliefs and assumptions and on information currently available to the Company. The Company disclaims any obligation to publicly update or revise any such forward-looking statements as a result of developments occurring after the date of this document except as required by law.
This presentation includes certain performance metrics and financial measures not based on GAAP, including Adjusted EBITDA, Adjusted EBITDA Margin, Adjusted Gross Profit, Adjusted Gross Margin, and Non-GAAP Operating Expenses, as well as key business metrics, including total Number of Customers and total Transactions Processed. Adjusted EBITDA, Adjusted EBITDA Margin, Adjusted Gross Profit, Adjusted Gross Margin, and Non-GAAP Operating Expenses are supplemental measures of our performance that are not required by, or presented in accordance with, GAAP and should not be considered as an alternative to net income, net income margin, gross profit, gross margin, and operating expenses or any other performance measure derived in accordance with GAAP. We define Adjusted EBITDA as net income excluding interest income (expense), net; provision for income taxes; depreciation; and amortization of intangible assets, as further adjusted for transaction-related expenses and stock-based compensation. We define Adjusted EBITDA Margin as Adjusted EBITDA divided by revenue. We define Adjusted Gross Profit as gross profit as adjusted for amortization of intangible assets and stock-based compensation. We define Adjusted Gross Margin as Adjusted Gross Profit divided by revenue. We define Non-GAAP Operating Expenses as GAAP operating expenses excluding stock-based compensation and transaction-related expenses. We define Non-GAAP Operating Expenses as a percentage of revenue as Non-GAAP Operating Expenses divided by revenue. We define Number of Customers as individuals or entities with whom we directly contract to use our solutions. We define Transactions Processed as the number of accepted payment transactions, such as credit card and debit card transactions, automated clearing house (“ACH”) payments, emerging electronic payments, other communication, text messaging and interactive voice response transactions, and other payment transaction types, which are facilitated through our platform during a given period. We believe Transactions Processed is a key business metric for investors because it directly correlates with transaction and usage-based revenue. We use Transactions Processed to evaluate changes in transaction and usage-based revenue over time. We calculate our dollar-based net retention rate at the end of a given period by using (a) the revenue from all customers during the twelve months ending one year prior to such period as the denominator and (b) the revenue from all remaining customers during the twelve months ending as of the end of such period minus the revenue from all customers who are new customers during those twelve months as the numerator. We define new customers as customers with whom we have generated less than twelve months of revenue. Acquired businesses are reflected in our dollar-based net retention rate beginning one year following the date of acquisition. We caution investors that amounts presented in accordance with our definitions of Adjusted EBITDA, Adjusted EBITDA Margin, Adjusted Gross Profit, Adjusted Gross Margin, and Non-GAAP Operating Expenses may not be comparable to similar measures disclosed by our competitors because not all companies and analysts calculate these non-GAAP financial measures in the same manner. We present these non-GAAP financial measures because we consider these metrics to be important supplemental measures of our performance and believe they are frequently used by securities analysts, investors, and other interested parties in the evaluation of companies in our industry. Management believes that investors’ understanding of our performance is enhanced by including these non-GAAP financial measures as a reasonable basis for comparing our ongoing results of operations. Non-GAAP financial measures assist management in assessing operating performance by removing the impact of items not directly resulting from our core operations, to present operating results on a consistent basis. Management uses these non-GAAP financial measures for planning purposes, including the preparation of our internal annual operating budget and financial projections; to evaluate the performance and effectiveness of our operational strategies; and to evaluate our capacity to expand our business. These non-GAAP financial measures have limitations as analytical tools, and should not be considered in isolation, or as an alternative to, or a substitute for net income, net income margin, gross profit, gross margin and operating expenses or other financial statement data presented in accordance with GAAP in our consolidated financial statements. Non-GAAP Financial Measures
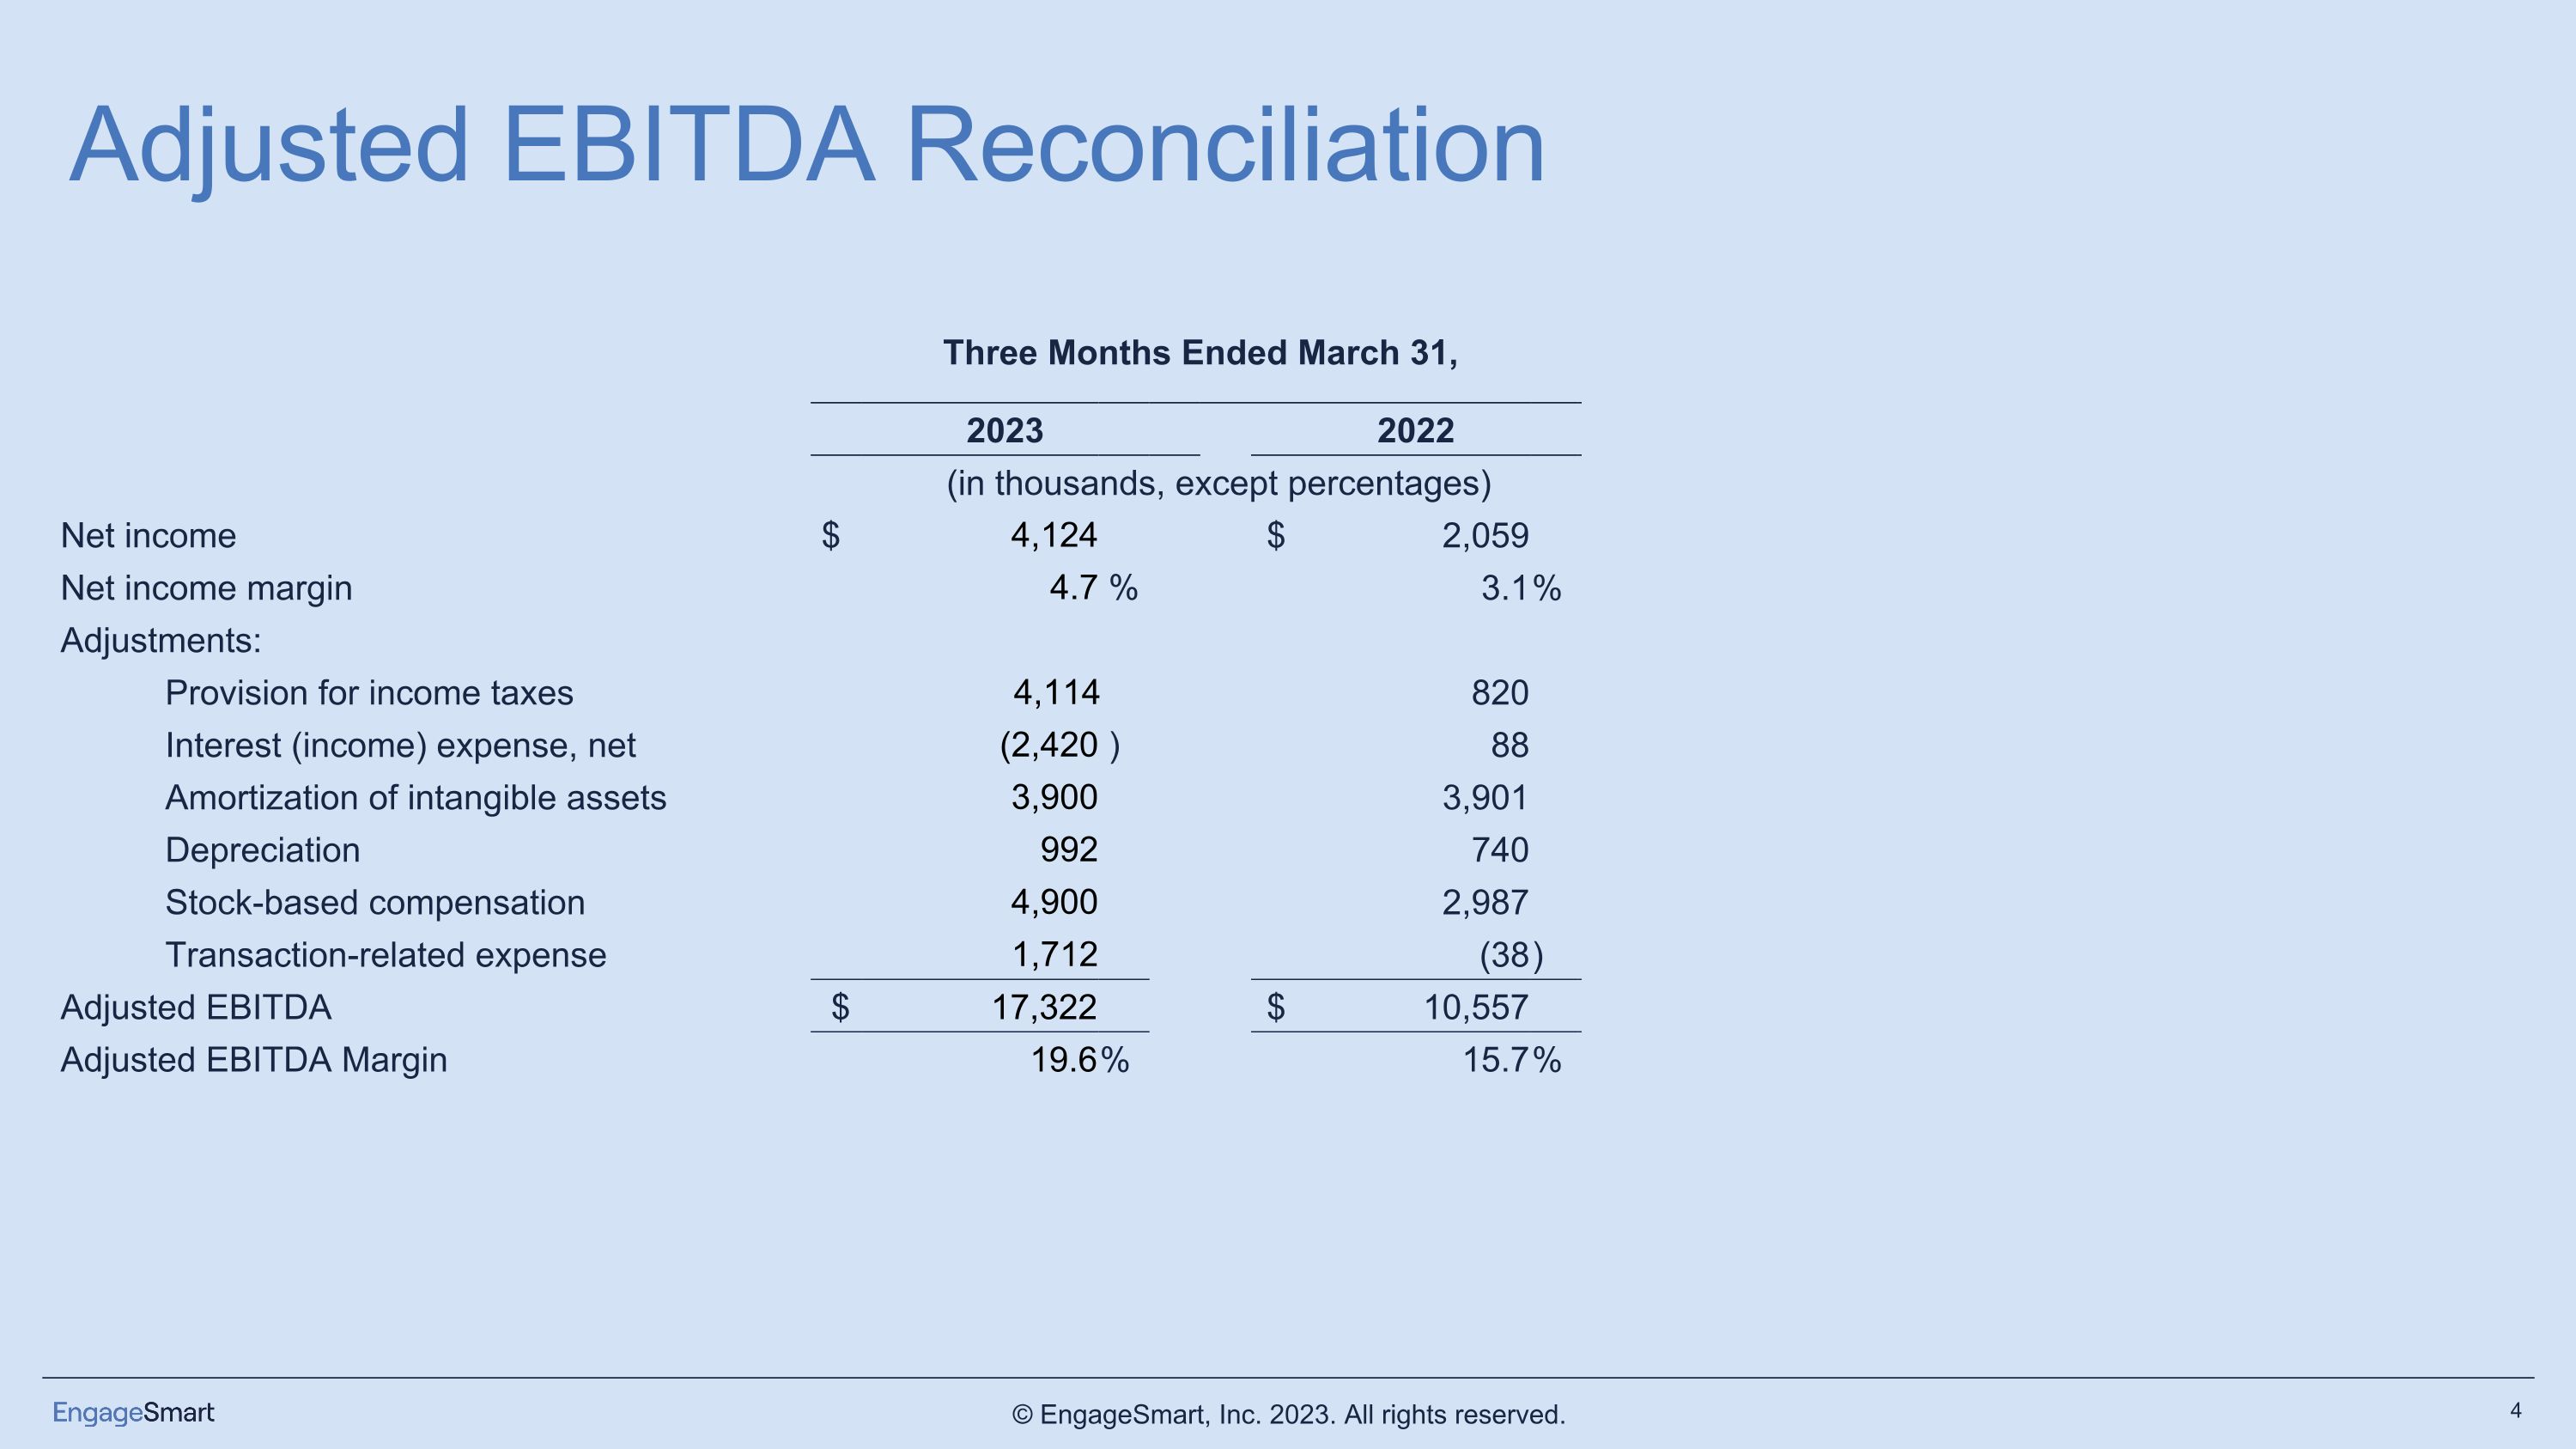
Adjusted EBITDA Reconciliation Three Months Ended March 31, 2023 2022 (in thousands, except percentages) Net income $ 4,124 $ 2,059 Net income margin 4.7 % 3.1 % Adjustments: Provision for income taxes 4,114 820 Interest (income) expense, net (2,420 ) 88 Amortization of intangible assets 3,900 3,901 Depreciation 992 740 Stock-based compensation 4,900 2,987 Transaction-related expense 1,712 (38 ) Adjusted EBITDA $ 17,322 $ 10,557 Adjusted EBITDA Margin 19.6 % 15.7 %
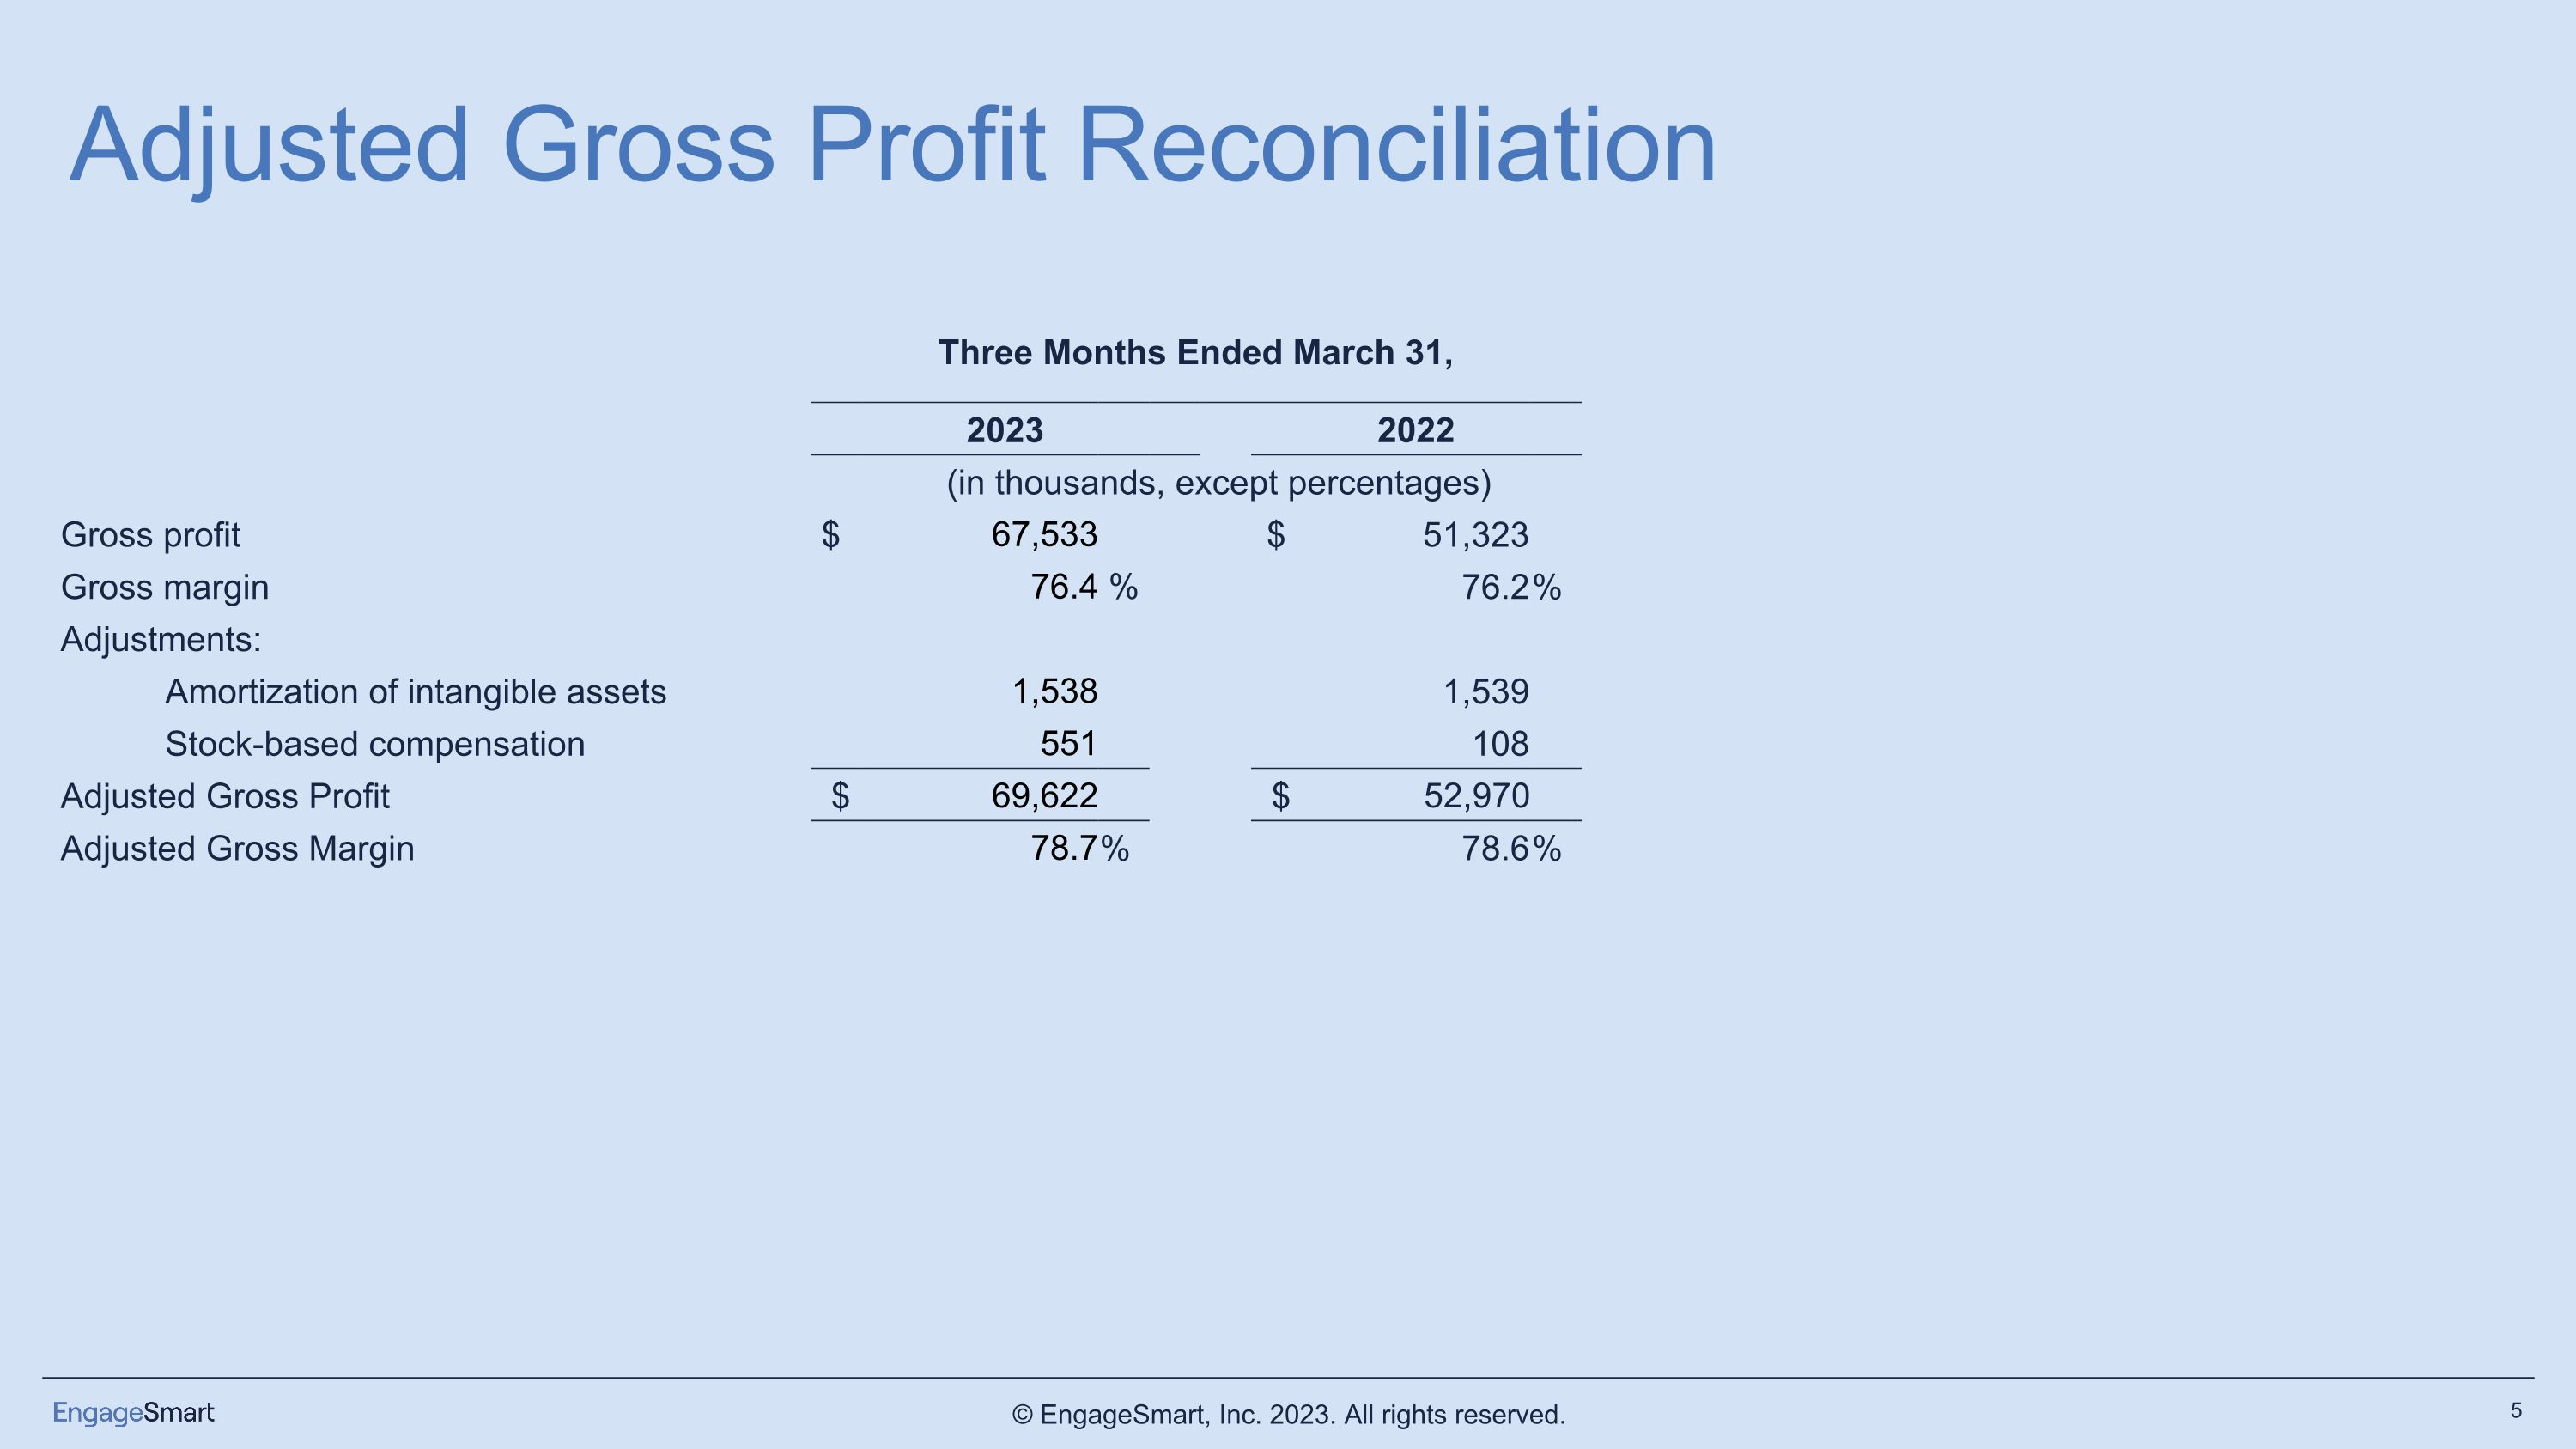
Three Months Ended March 31, 2023 2022 (in thousands, except percentages) Gross profit $ 67,533 $ 51,323 Gross margin 76.4 % 76.2 % Adjustments: Amortization of intangible assets 1,538 1,539 Stock-based compensation 551 108 Adjusted Gross Profit $ 69,622 $ 52,970 Adjusted Gross Margin 78.7 % 78.6 % Adjusted Gross Profit Reconciliation
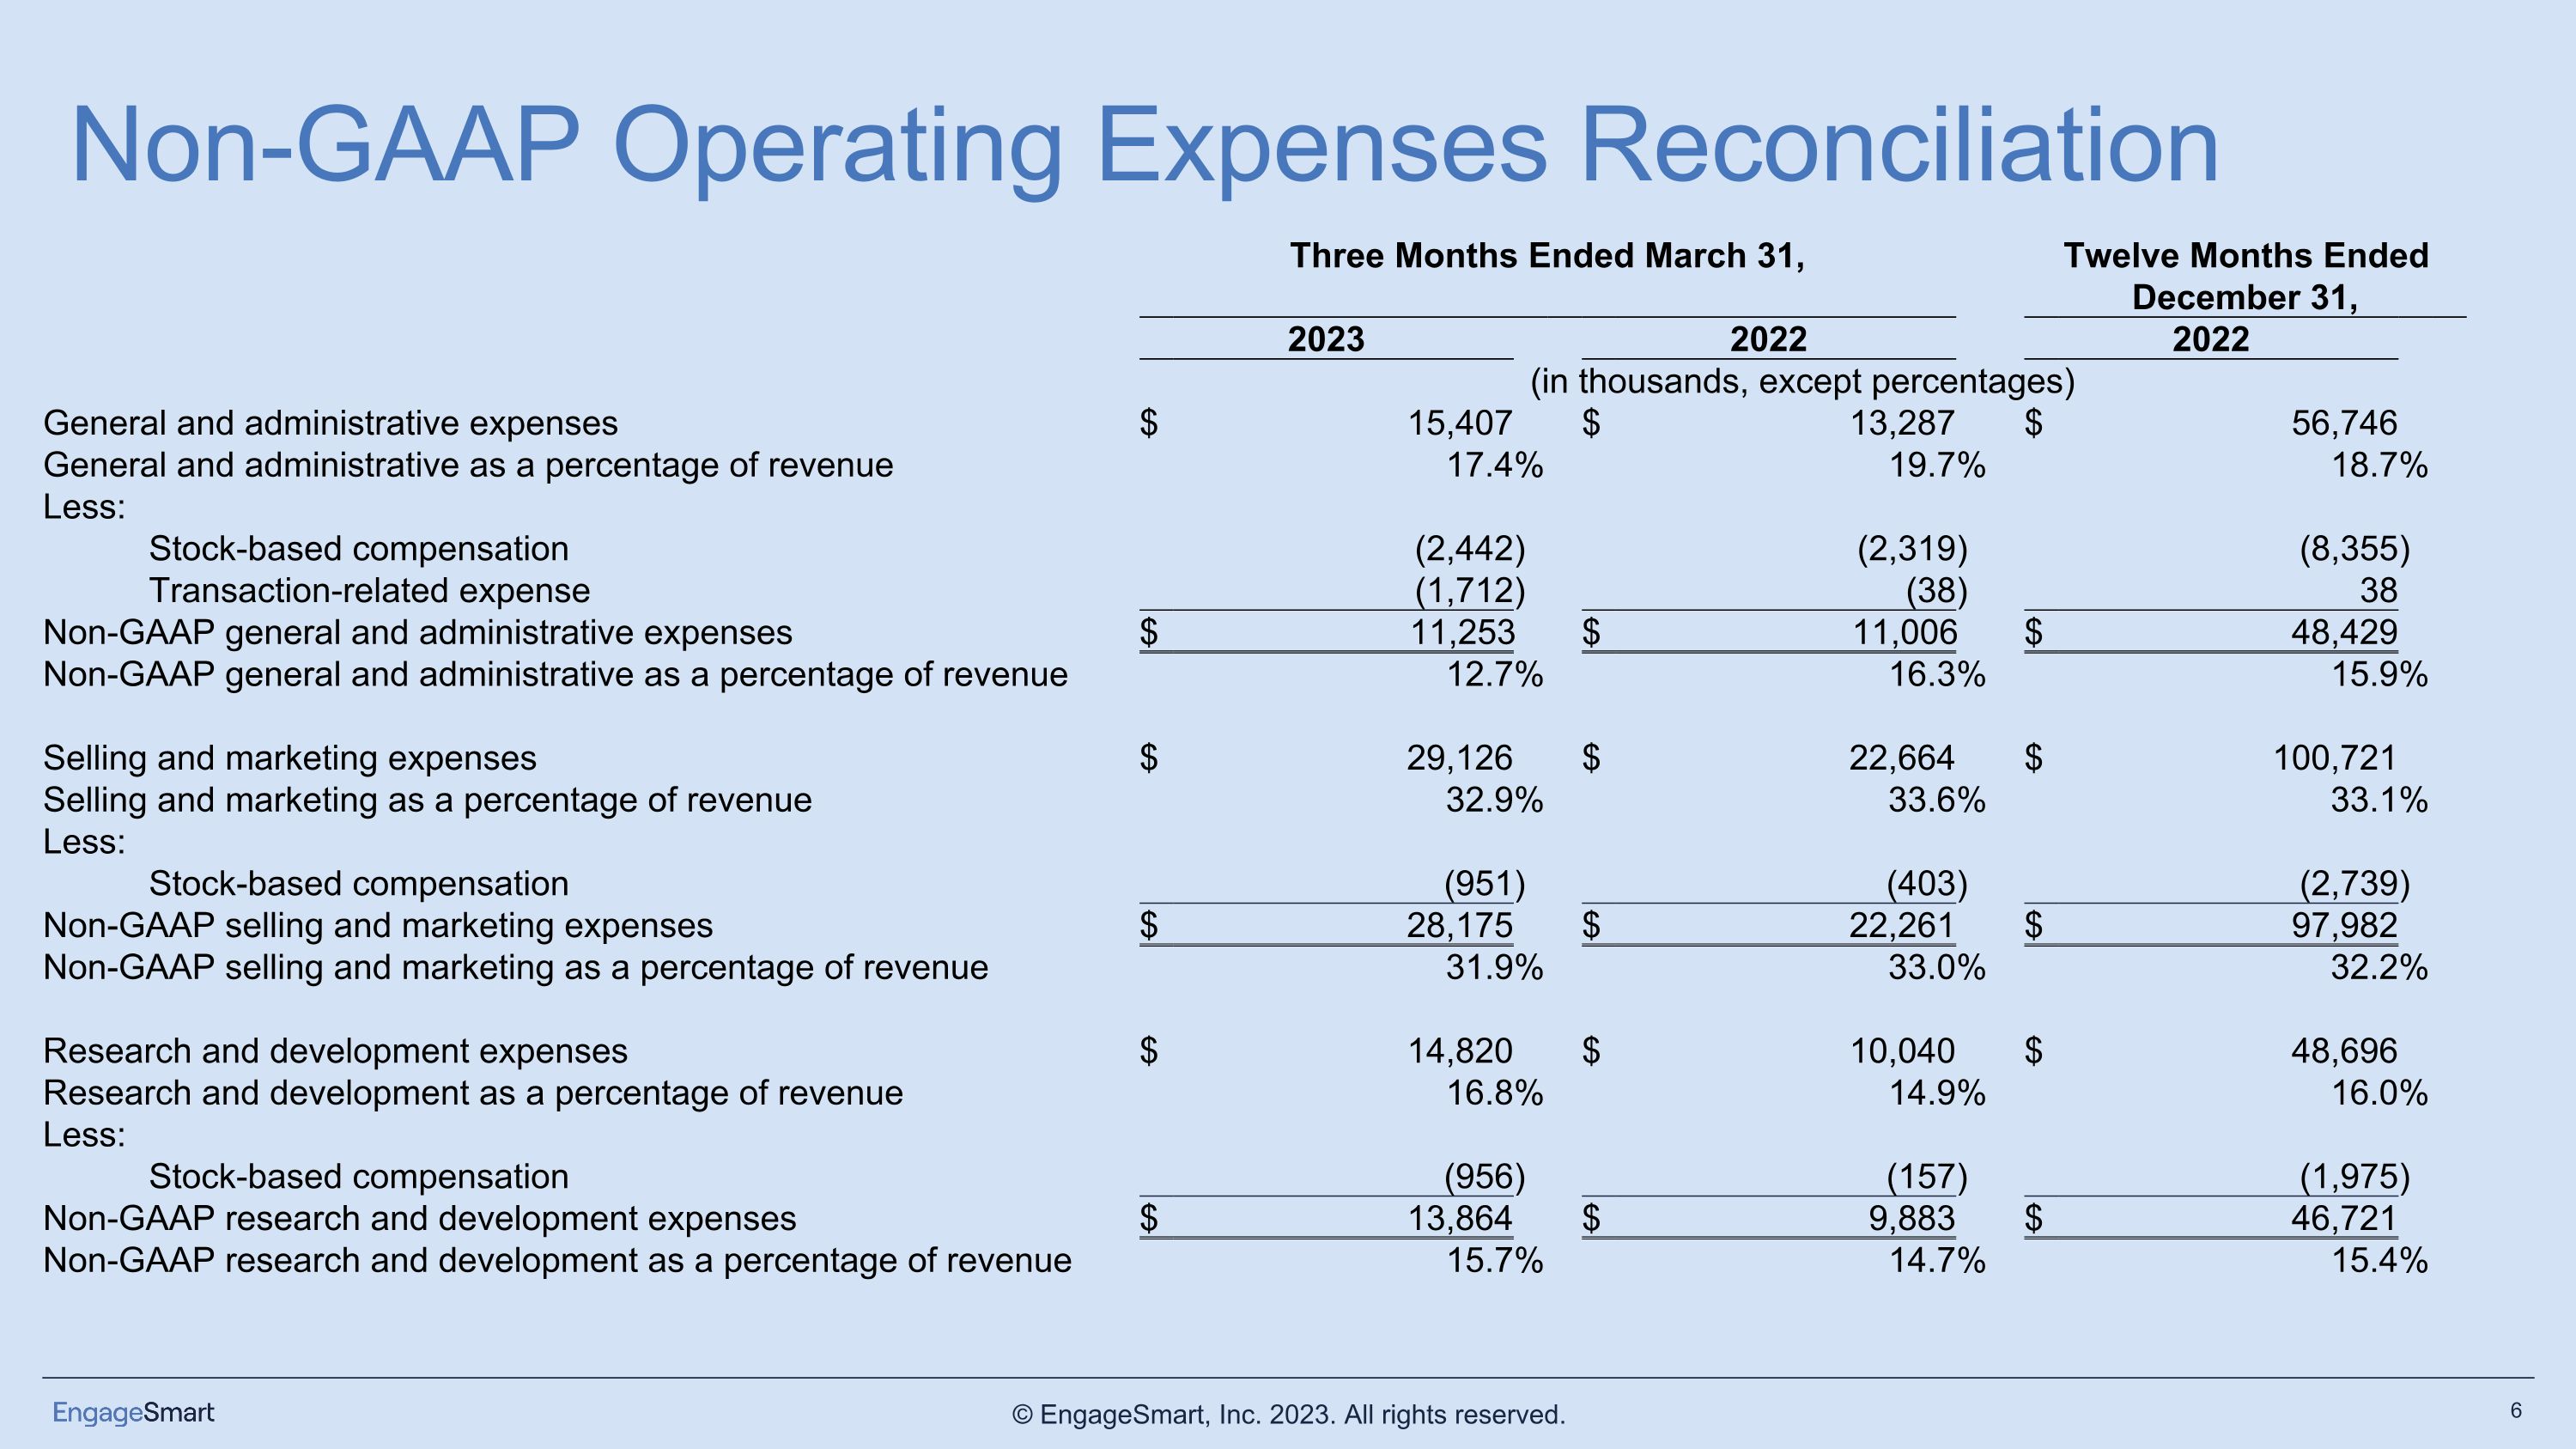
Non-GAAP Operating Expenses Reconciliation Three Months Ended March 31, Twelve Months Ended December 31, 2023 2022 2022 (in thousands, except percentages) General and administrative expenses $ 15,407 $ 13,287 $ 56,746 General and administrative as a percentage of revenue 17.4 % 19.7 % 18.7 % Less: Stock-based compensation (2,442 ) (2,319 ) (8,355 ) Transaction-related expense (1,712 ) (38 ) 38 Non-GAAP general and administrative expenses $ 11,253 $ 11,006 $ 48,429 Non-GAAP general and administrative as a percentage of revenue 12.7 % 16.3 % 15.9 % Selling and marketing expenses $ 29,126 $ 22,664 $ 100,721 Selling and marketing as a percentage of revenue 32.9 % 33.6 % 33.1 % Less: Stock-based compensation (951 ) (403 ) (2,739 ) Non-GAAP selling and marketing expenses $ 28,175 $ 22,261 $ 97,982 Non-GAAP selling and marketing as a percentage of revenue 31.9 % 33.0 % 32.2 % Research and development expenses $ 14,820 $ 10,040 $ 48,696 Research and development as a percentage of revenue 16.8 % 14.9 % 16.0 % Less: Stock-based compensation (956 ) (157 ) (1,975 ) Non-GAAP research and development expenses $ 13,864 $ 9,883 $ 46,721 Non-GAAP research and development as a percentage of revenue 15.7 % 14.7 % 15.4 %
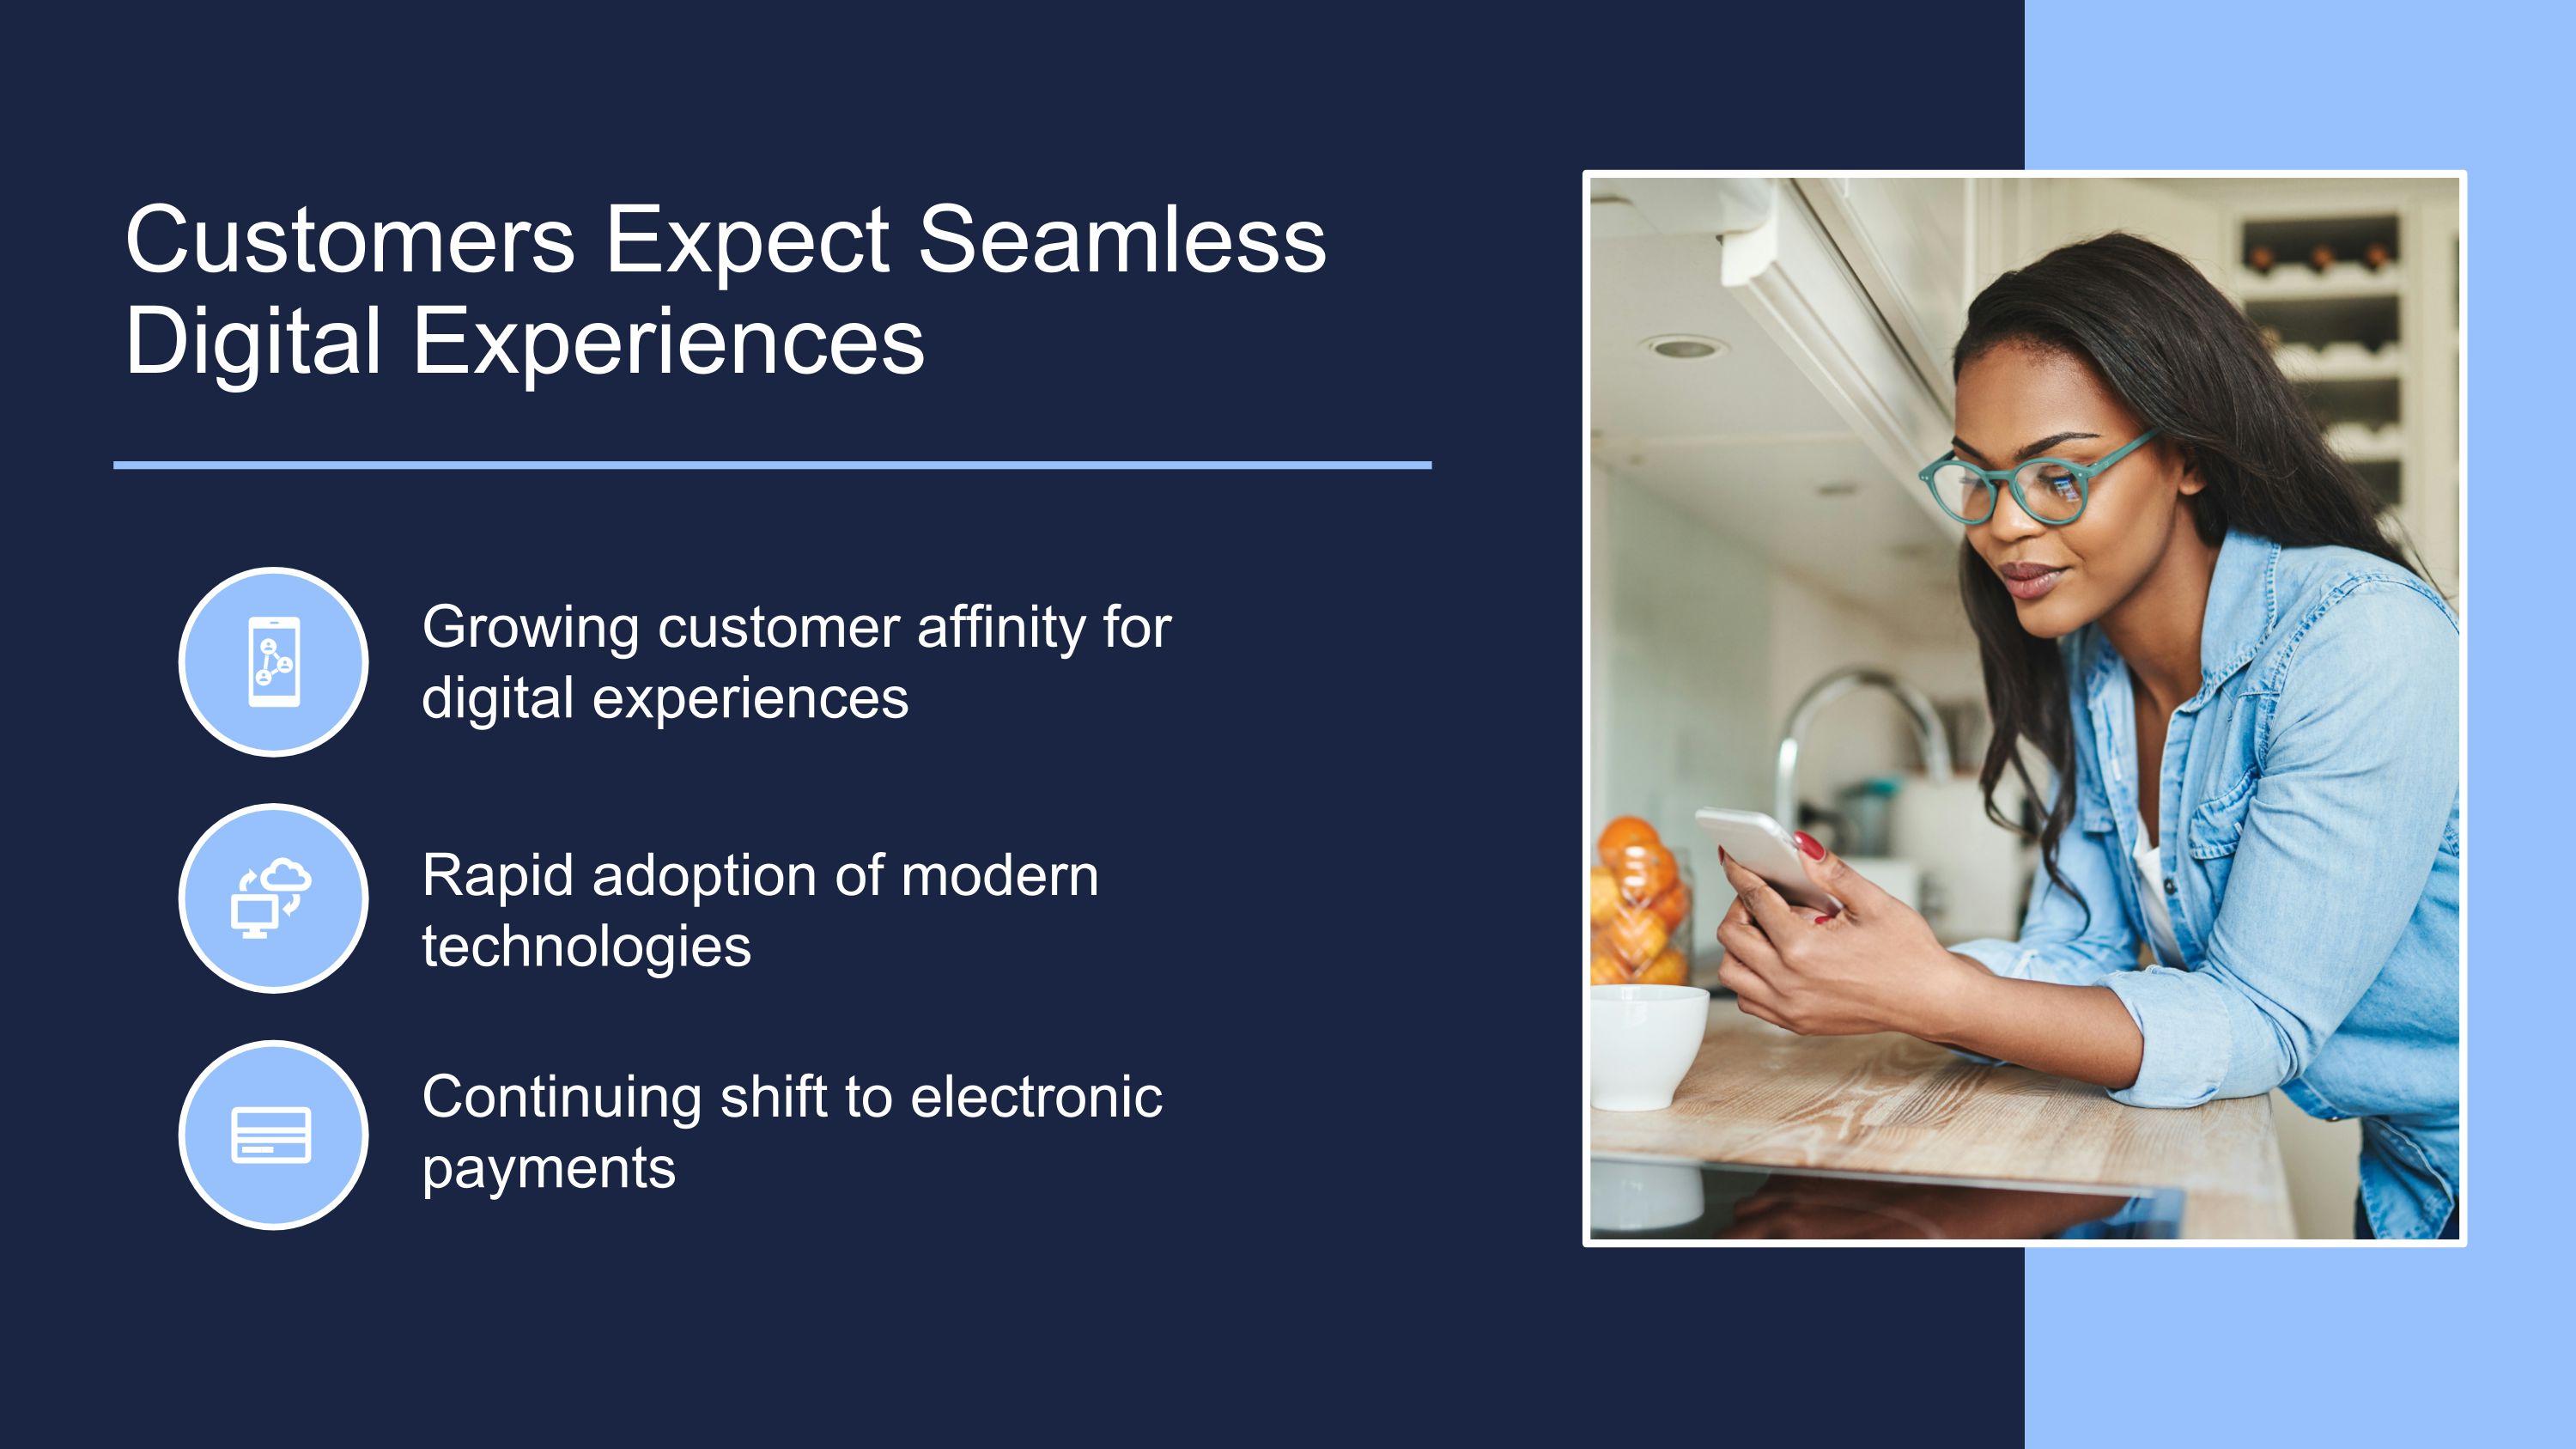
Growing customer affinity for digital experiences Rapid adoption of modern technologies Continuing shift to electronic payments Customers Expect Seamless Digital Experiences
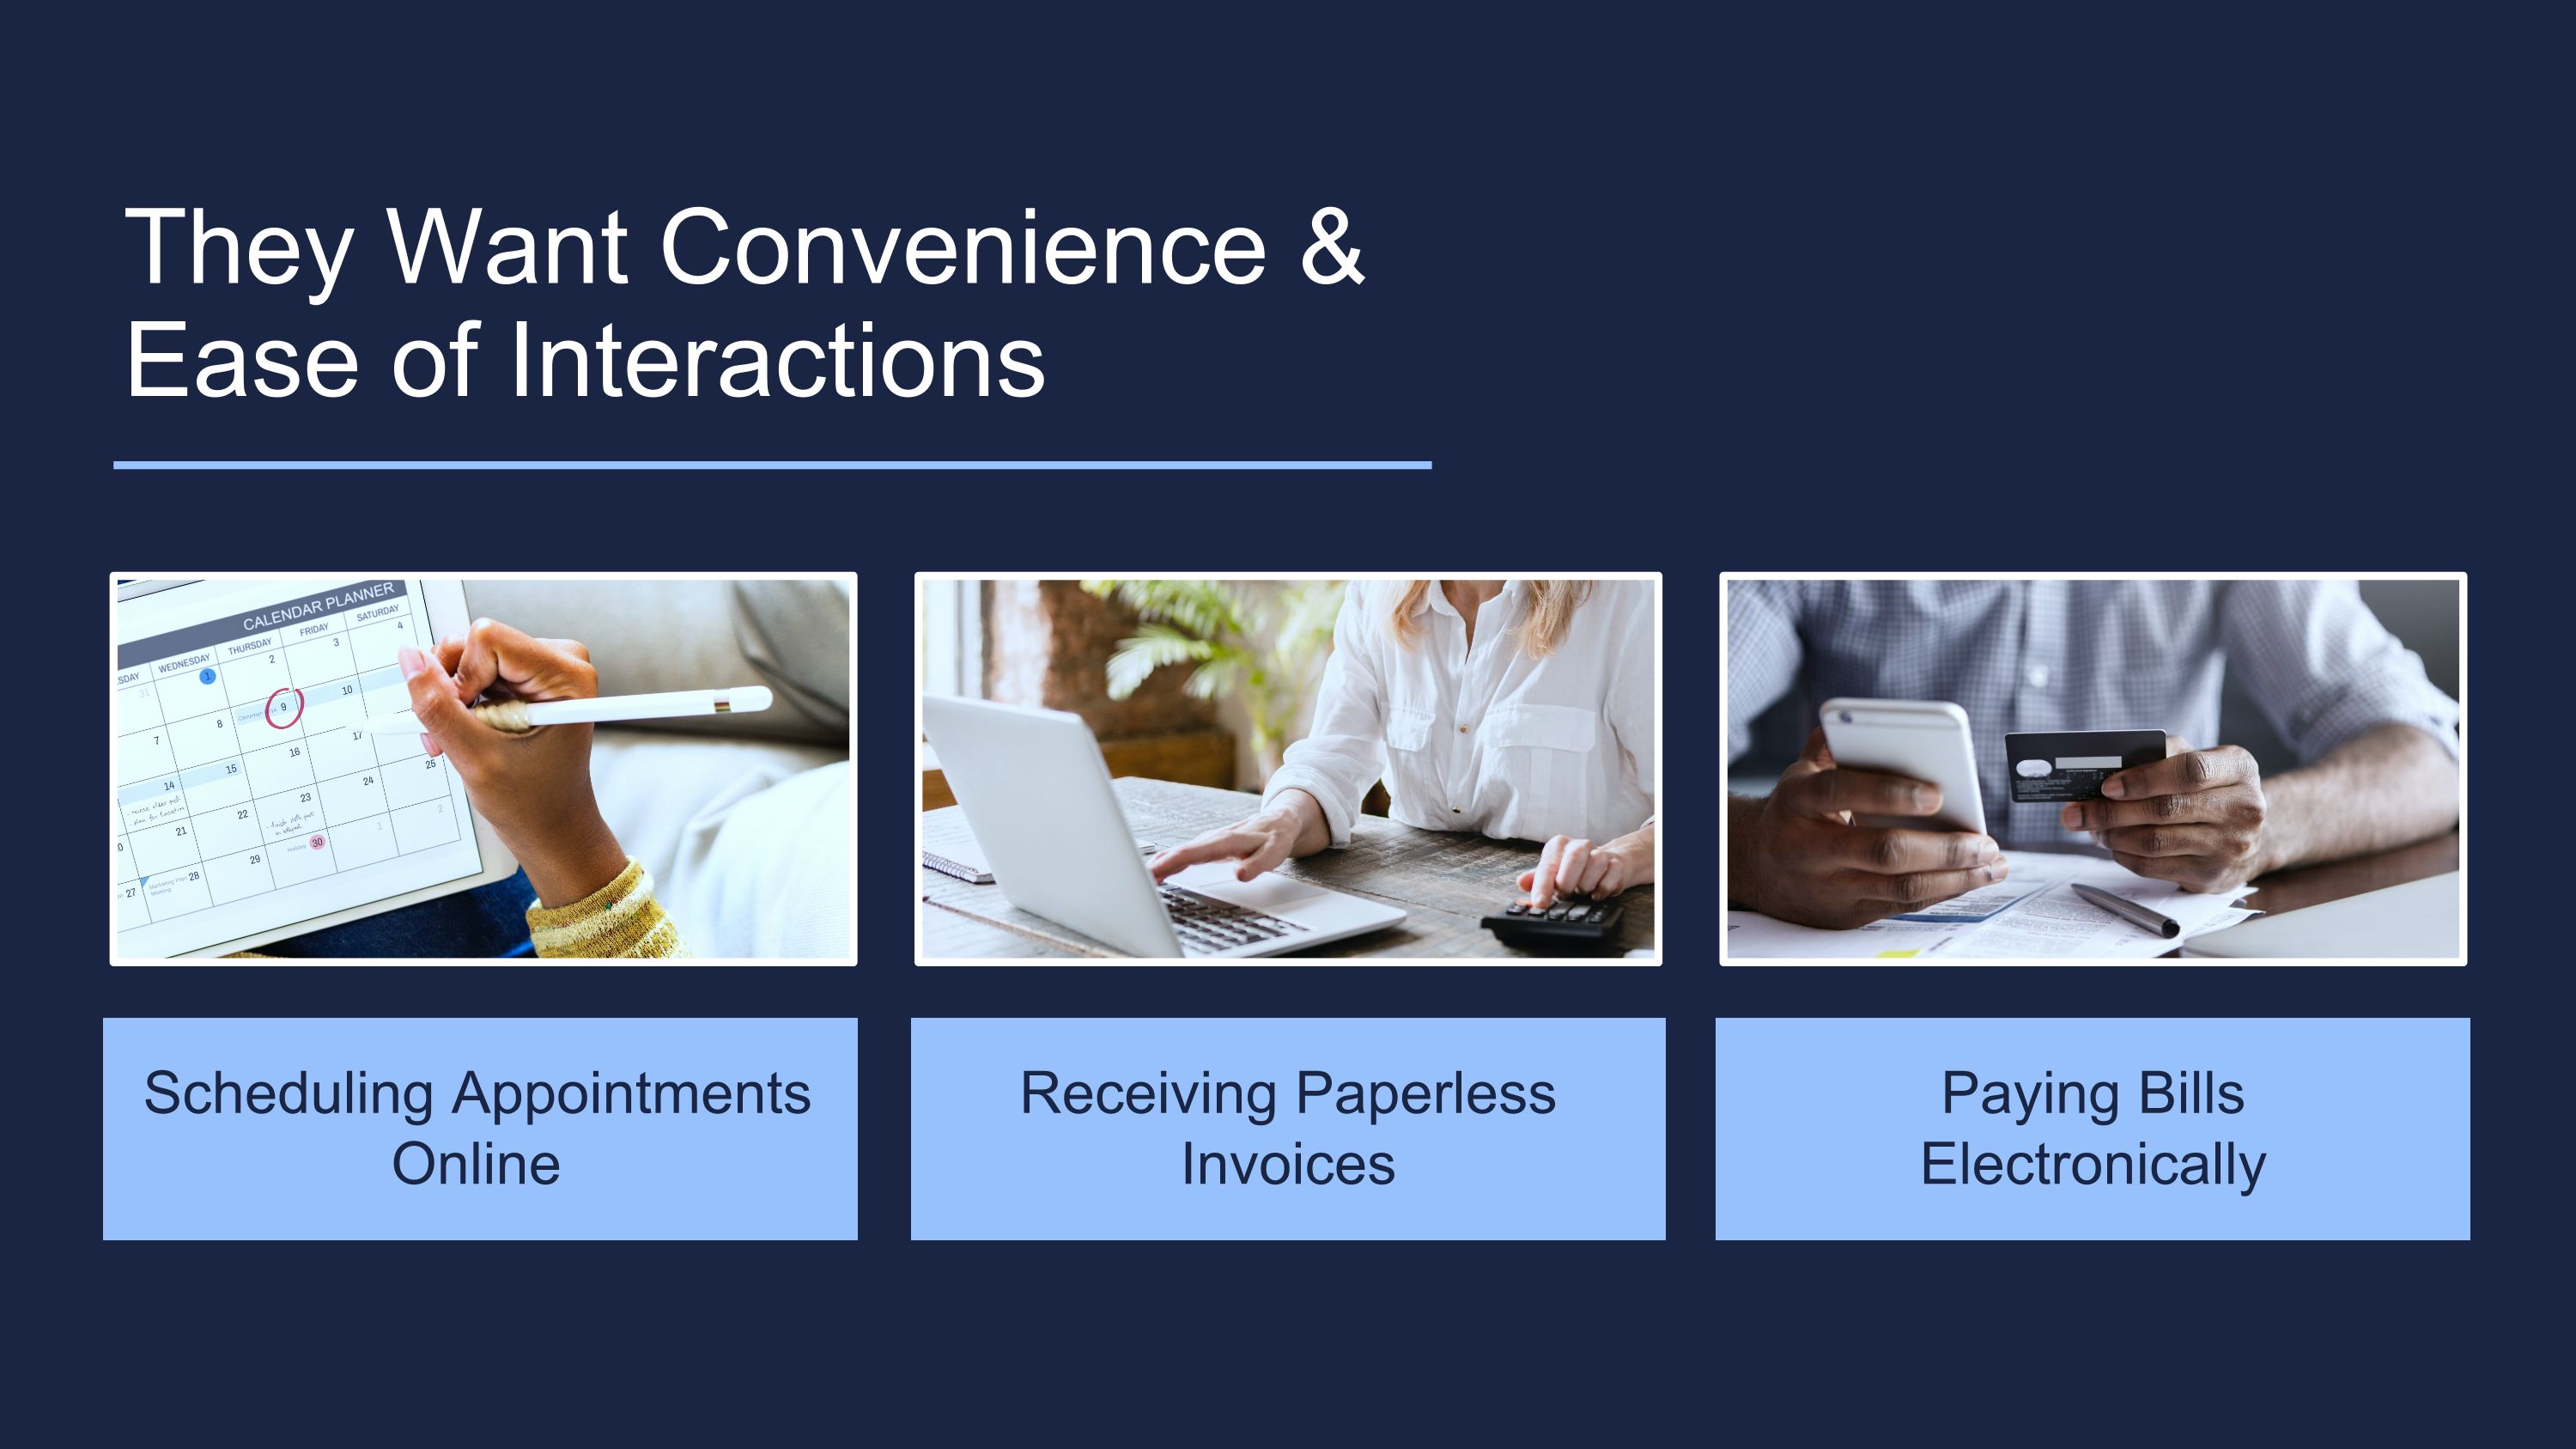
They Want Convenience & Ease of Interactions Scheduling Appointments Online Paying Bills Electronically Receiving Paperless Invoices

Yet Industries Are Saddled with Manual Processes Pen & paper Error-prone Resource-intensive

OUR MISSION Simplify Customer & Client Engagement Every time someone says,�it shouldn’t be this hard, they are right. “ ”
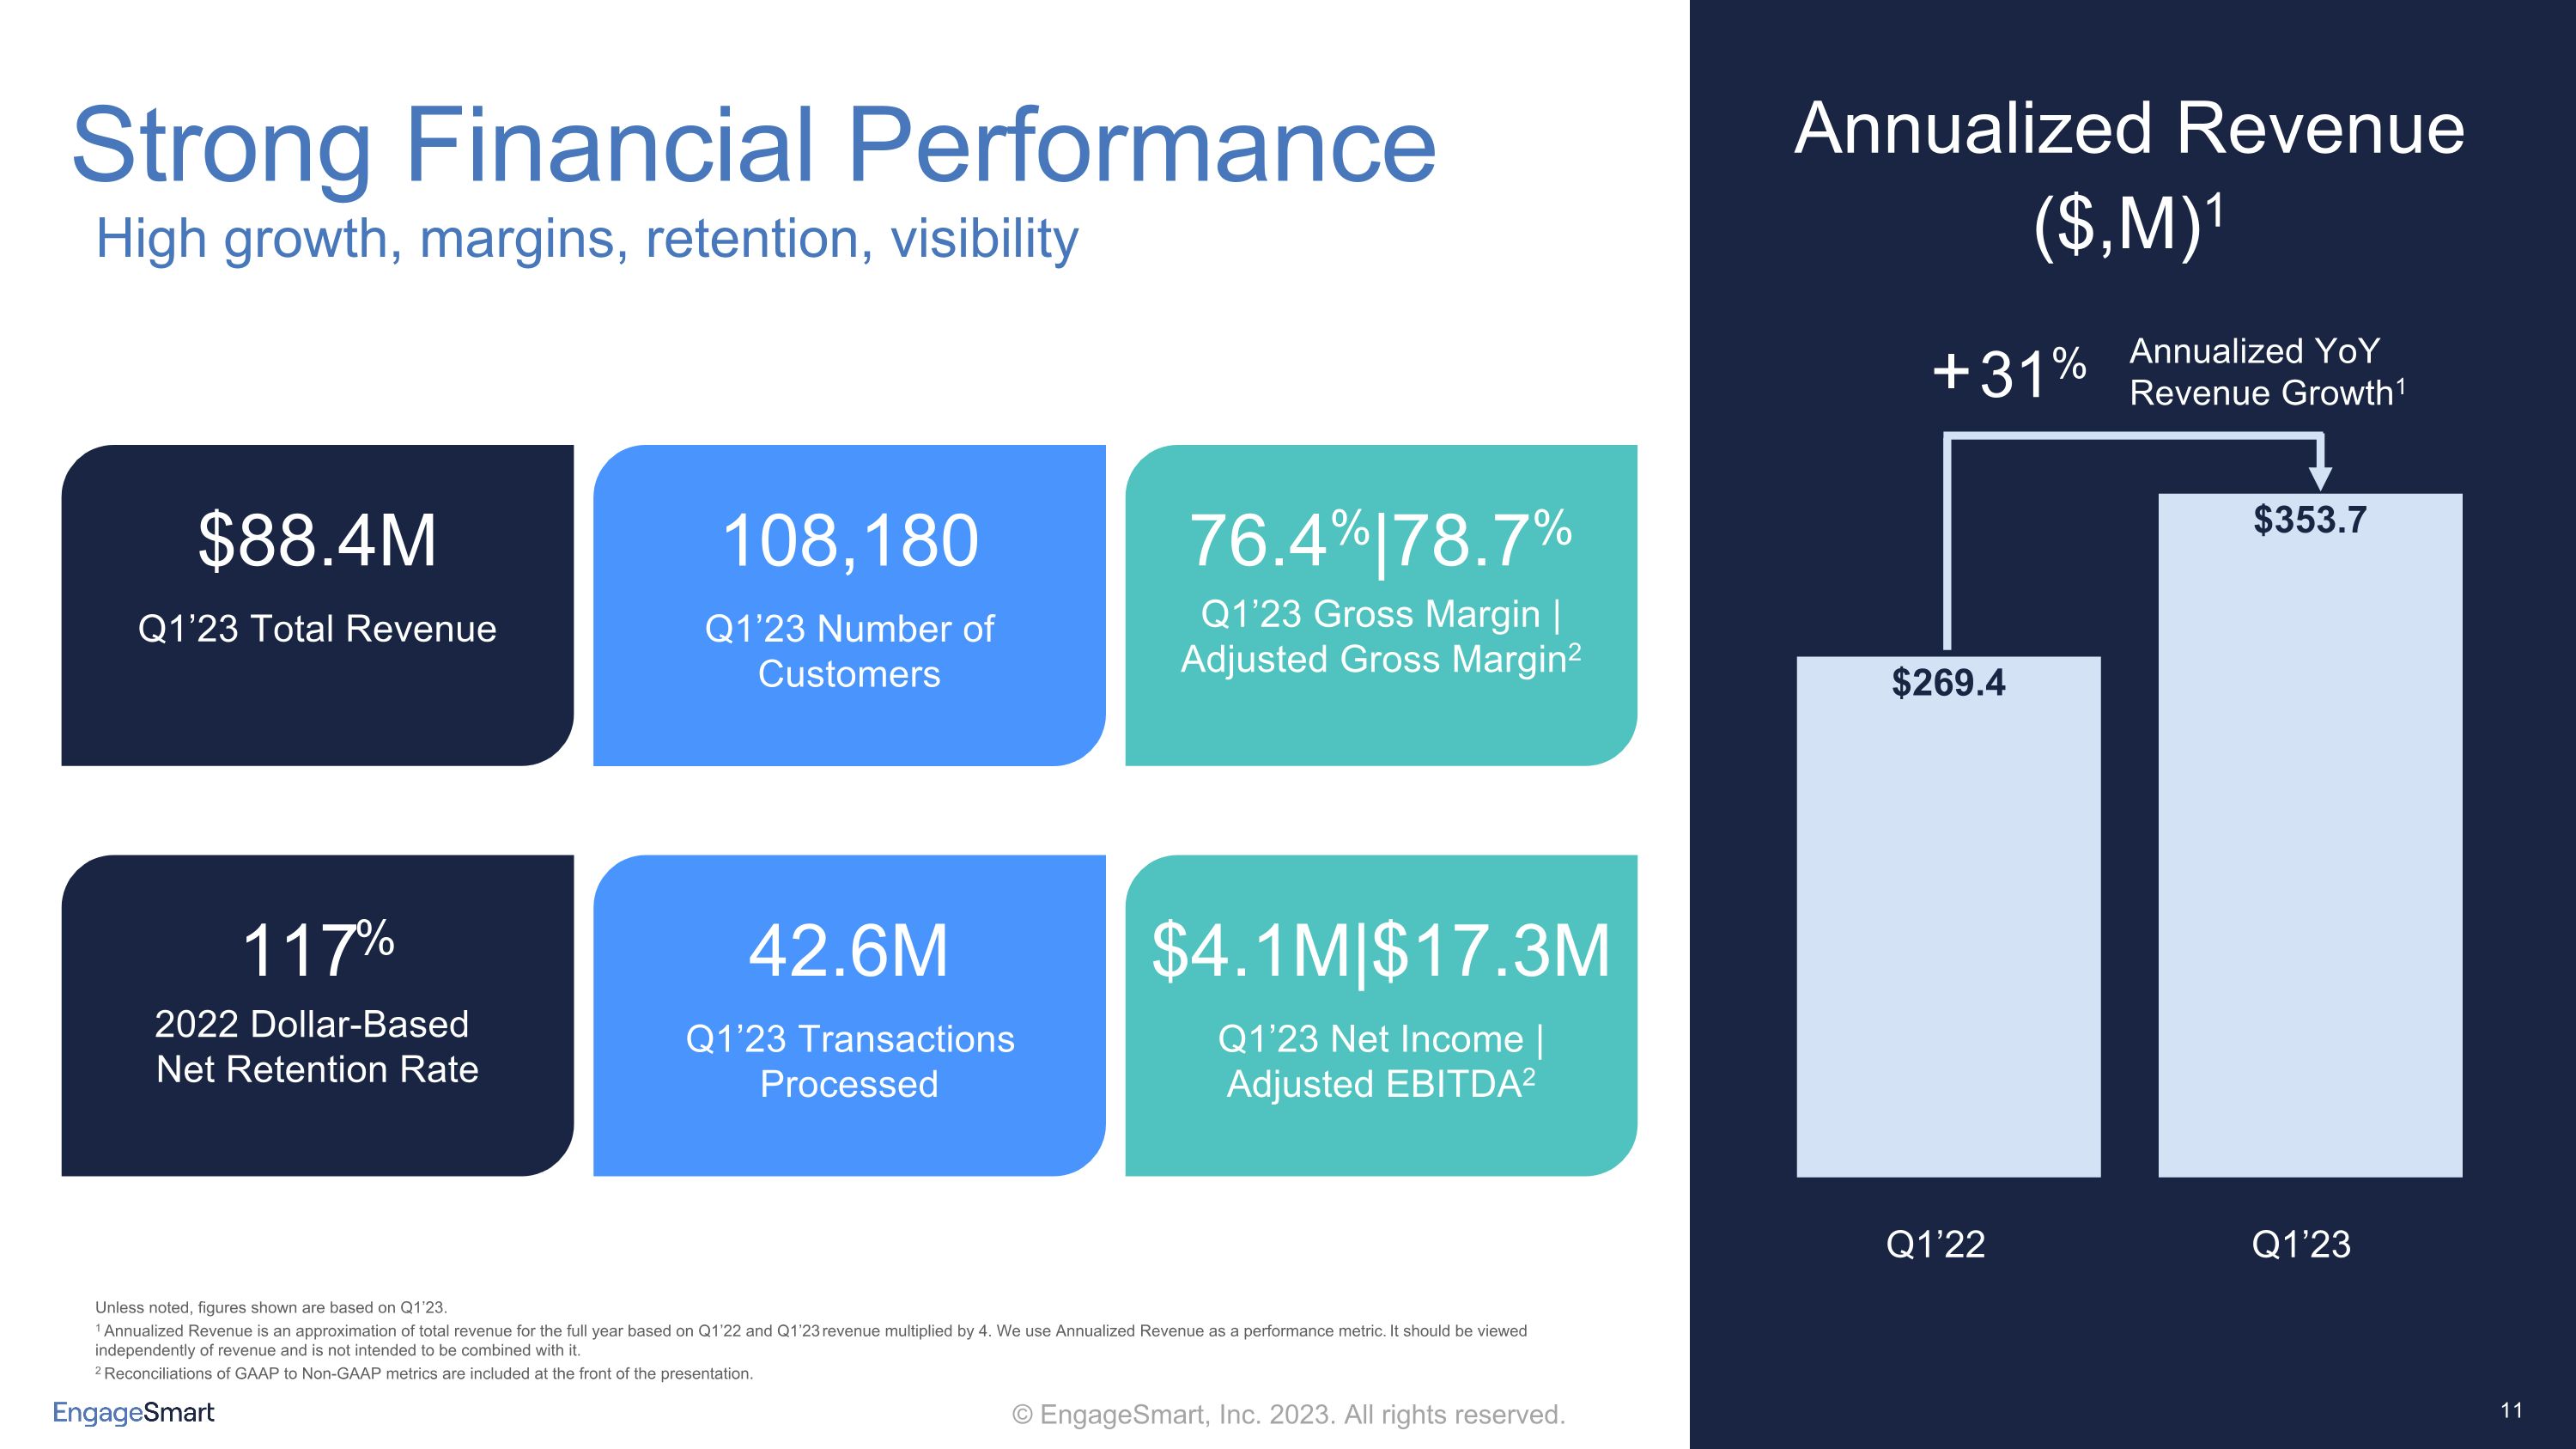
117% 2022 Dollar-Based Net Retention Rate $4.1M|$17.3M Q1’23 Net Income | Adjusted EBITDA2 42.6M Q1’23 Transactions Processed 76.4%|78.7% Q1’23 Gross Margin | Adjusted Gross Margin2 Unless noted, figures shown are based on Q1’23. 1 Annualized Revenue is an approximation of total revenue for the full year based on Q1’22 and Q1’23 revenue multiplied by 4. We use Annualized Revenue as a performance metric. It should be viewed independently of revenue and is not intended to be combined with it. 2 Reconciliations of GAAP to Non-GAAP metrics are included at the front of the presentation. Strong Financial Performance High growth, margins, retention, visibility $88.4M Q1’23 Total Revenue 108,180 Q1’23 Number of Customers 31% Annualized YoY Revenue Growth1 + Q1’22 Annualized Revenue ($,M)1 Q1’23
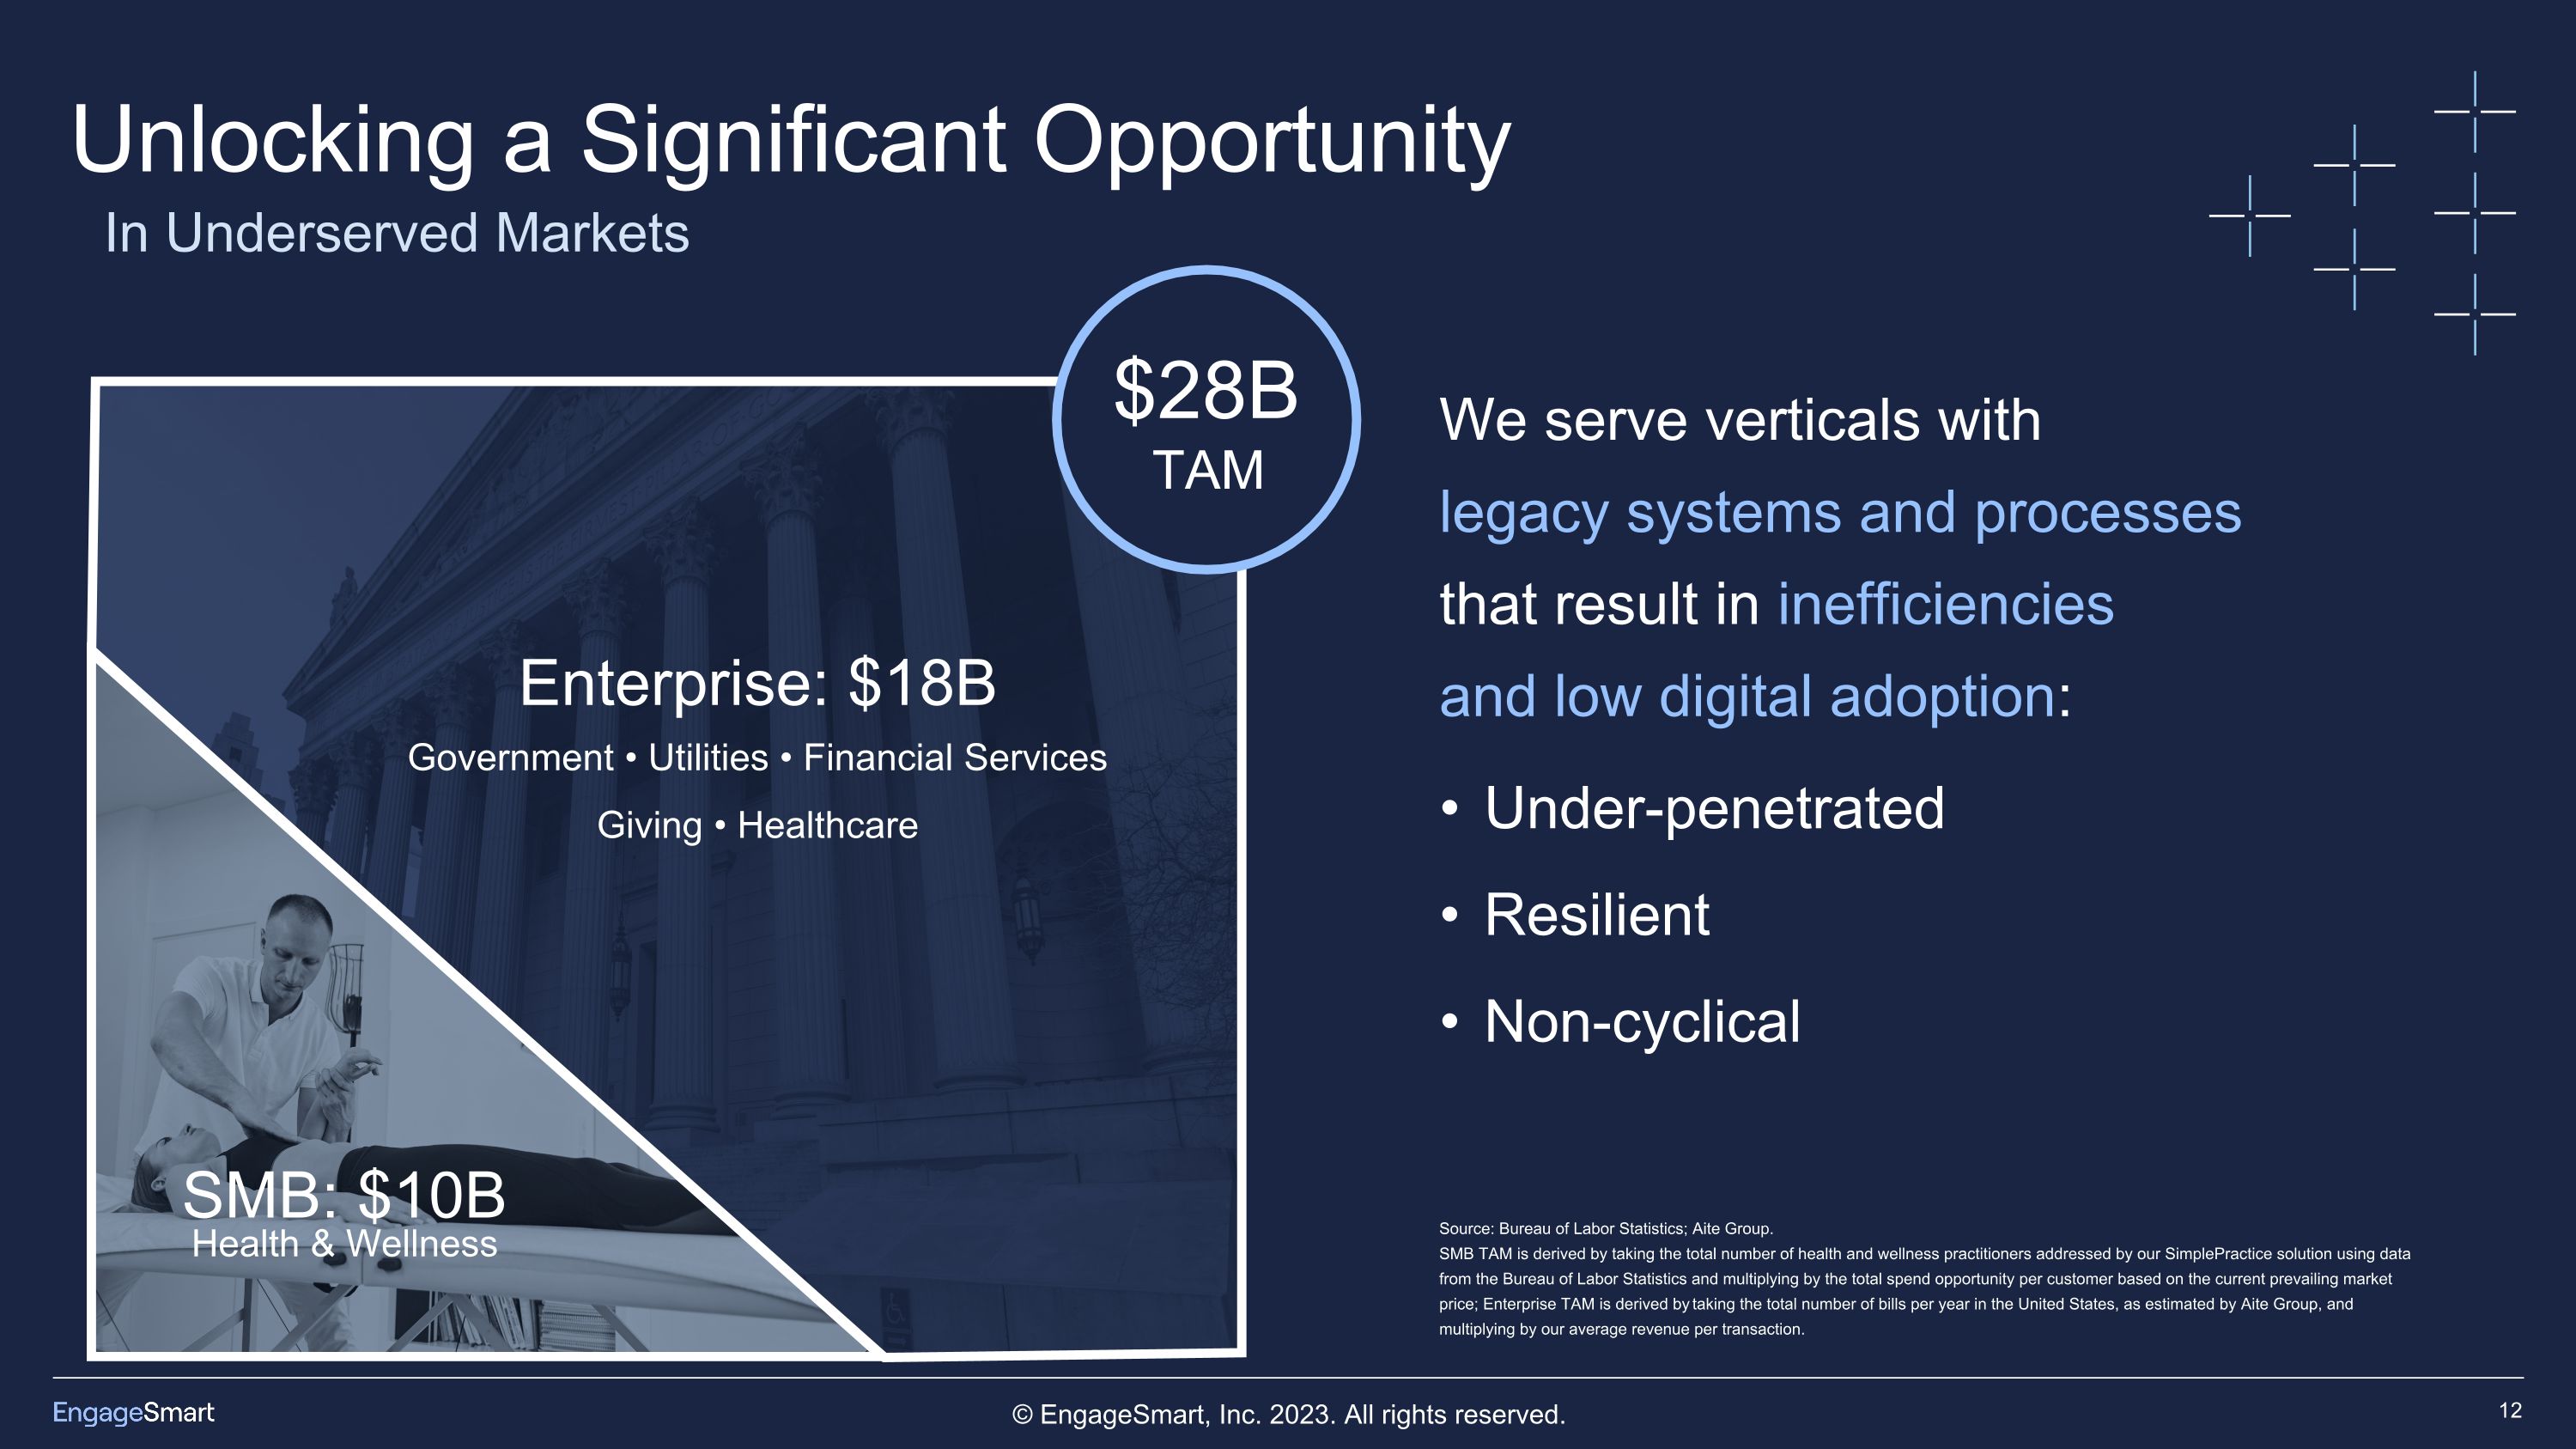
Unlocking a Significant Opportunity Enterprise: $18B Health & Wellness SMB: $10B We serve verticals with �legacy systems and processes �that result in inefficiencies �and low digital adoption: Under-penetrated Resilient Non-cyclical Source: Bureau of Labor Statistics; Aite Group. SMB TAM is derived by taking the total number of health and wellness practitioners addressed by our SimplePractice solution using data from the Bureau of Labor Statistics and multiplying by the total spend opportunity per customer based on the current prevailing market price; Enterprise TAM is derived by taking the total number of bills per year in the United States, as estimated by Aite Group, and multiplying by our average revenue per transaction. Government • Utilities • Financial Services Giving • Healthcare $28B TAM In Underserved Markets
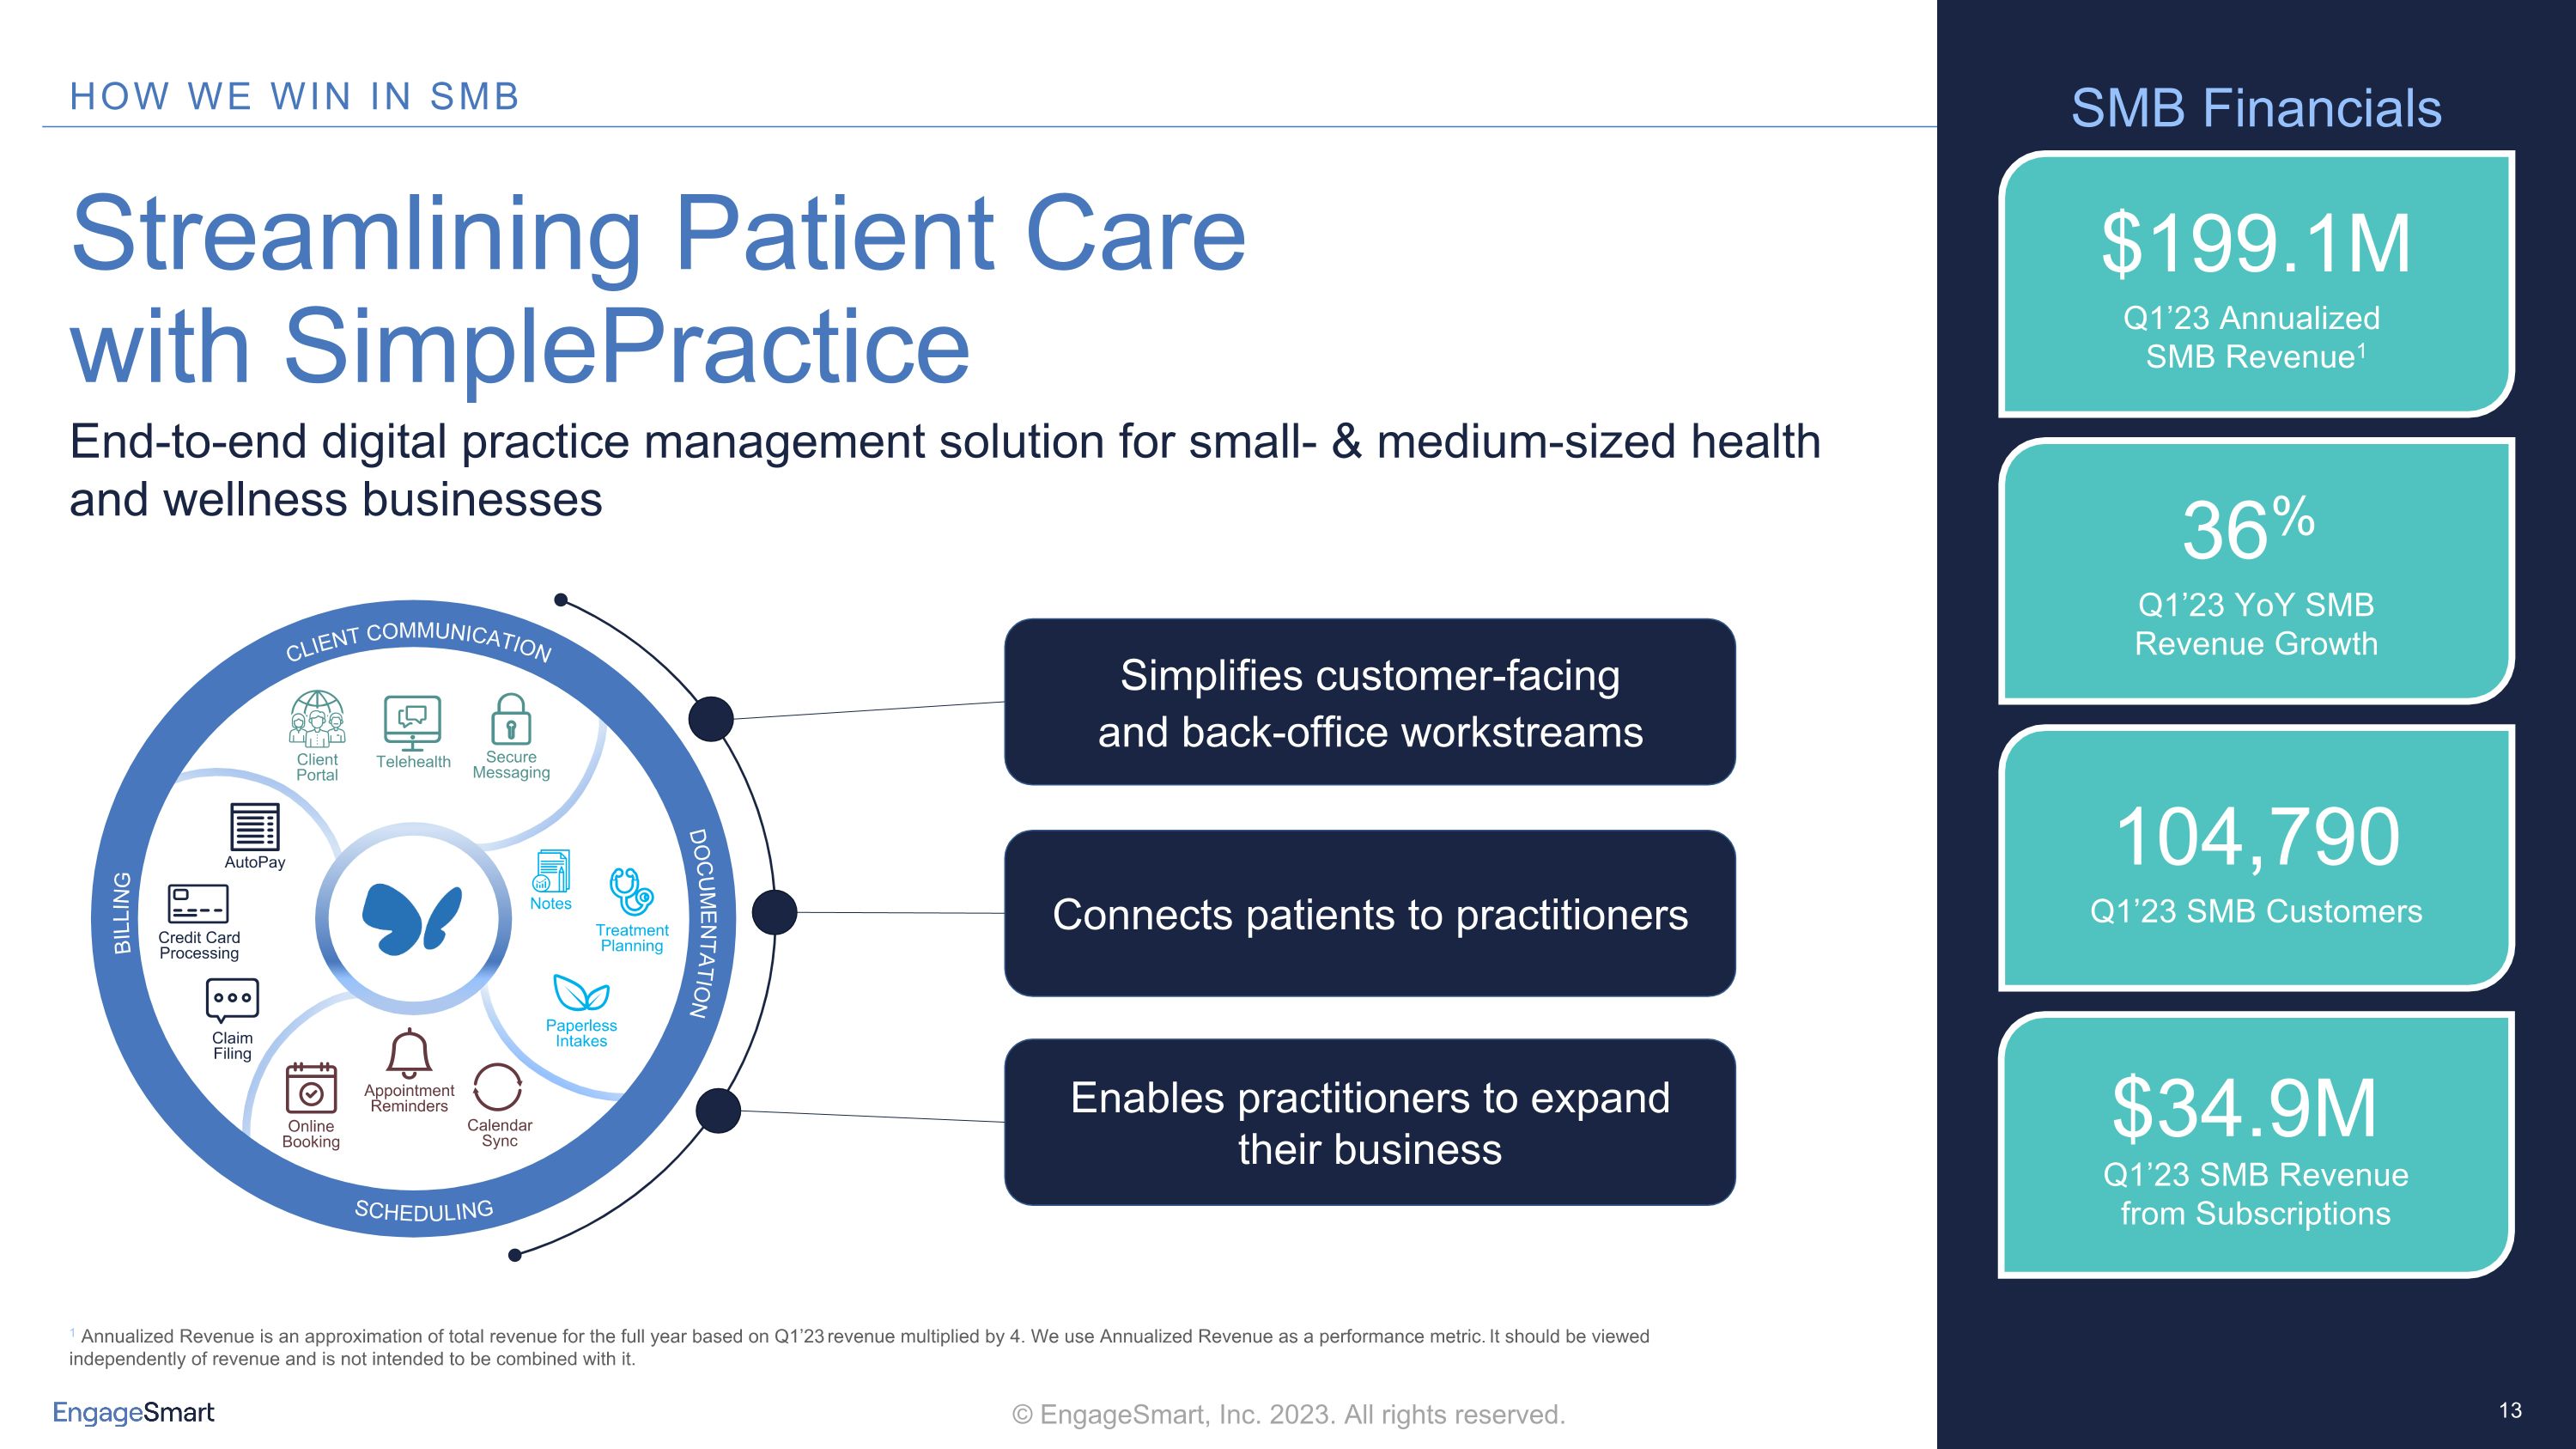
Streamlining Patient Care with SimplePractice End-to-end digital practice management solution for small- & medium-sized health and wellness businesses 1 Annualized Revenue is an approximation of total revenue for the full year based on Q1’23 revenue multiplied by 4. We use Annualized Revenue as a performance metric. It should be viewed independently of revenue and is not intended to be combined with it. $199.1M Q1’23 Annualized SMB Revenue1 36% Q1’23 YoY SMB Revenue Growth SMB Financials 104,790 Q1’23 SMB Customers $34.9M Q1’23 SMB Revenue from Subscriptions Simplifies customer-facing �and back-office workstreams Connects patients to practitioners Enables practitioners to expand their business Claim Filing Paperless Intakes AutoPay Treatment Planning Notes Credit Card Processing Calendar Sync Online Booking Appointment Reminders Secure Messaging Client Portal Telehealth CLIENT COMMUNICATION SCHEDULING BILLING DOCUMENTATION
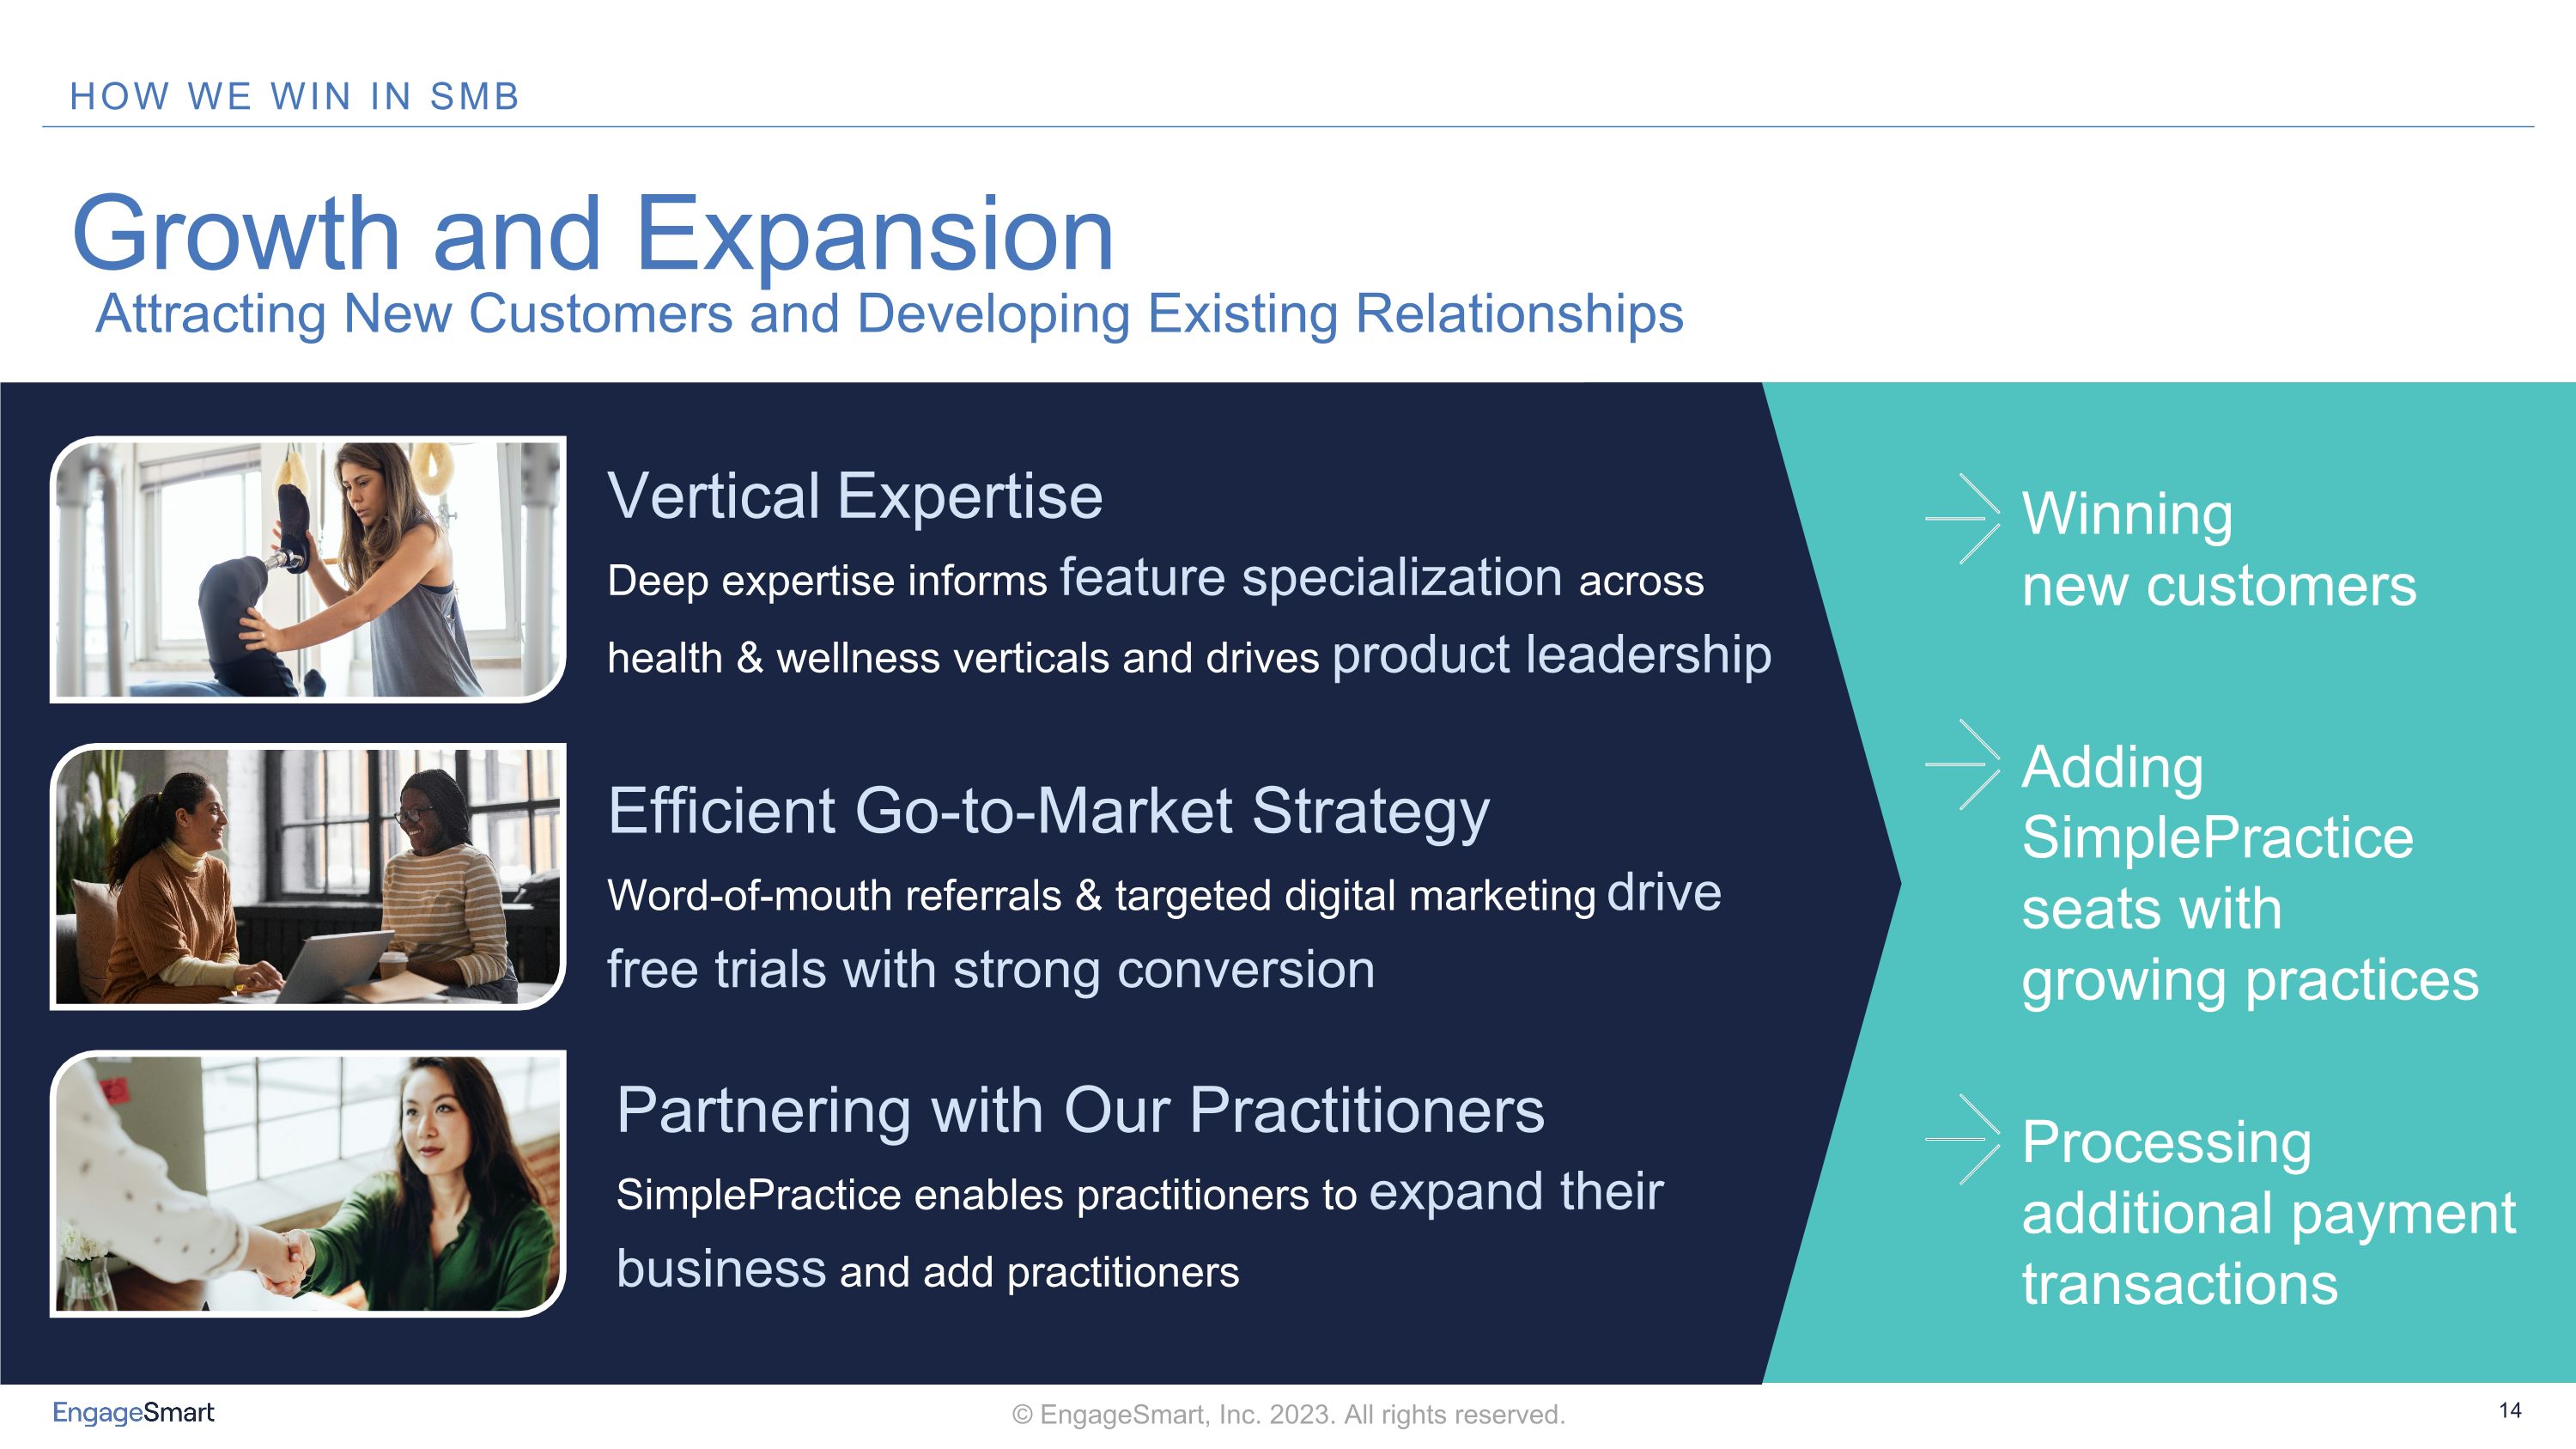
Growth and Expansion Vertical Expertise Deep expertise informs feature specialization across health & wellness verticals and drives product leadership Efficient Go-to-Market Strategy Word-of-mouth referrals & targeted digital marketing drive free trials with strong conversion Partnering with Our Practitioners SimplePractice enables practitioners to expand their business and add practitioners Attracting New Customers and Developing Existing Relationships Winning �new customers Adding SimplePractice �seats with �growing practices Processing additional payment transactions
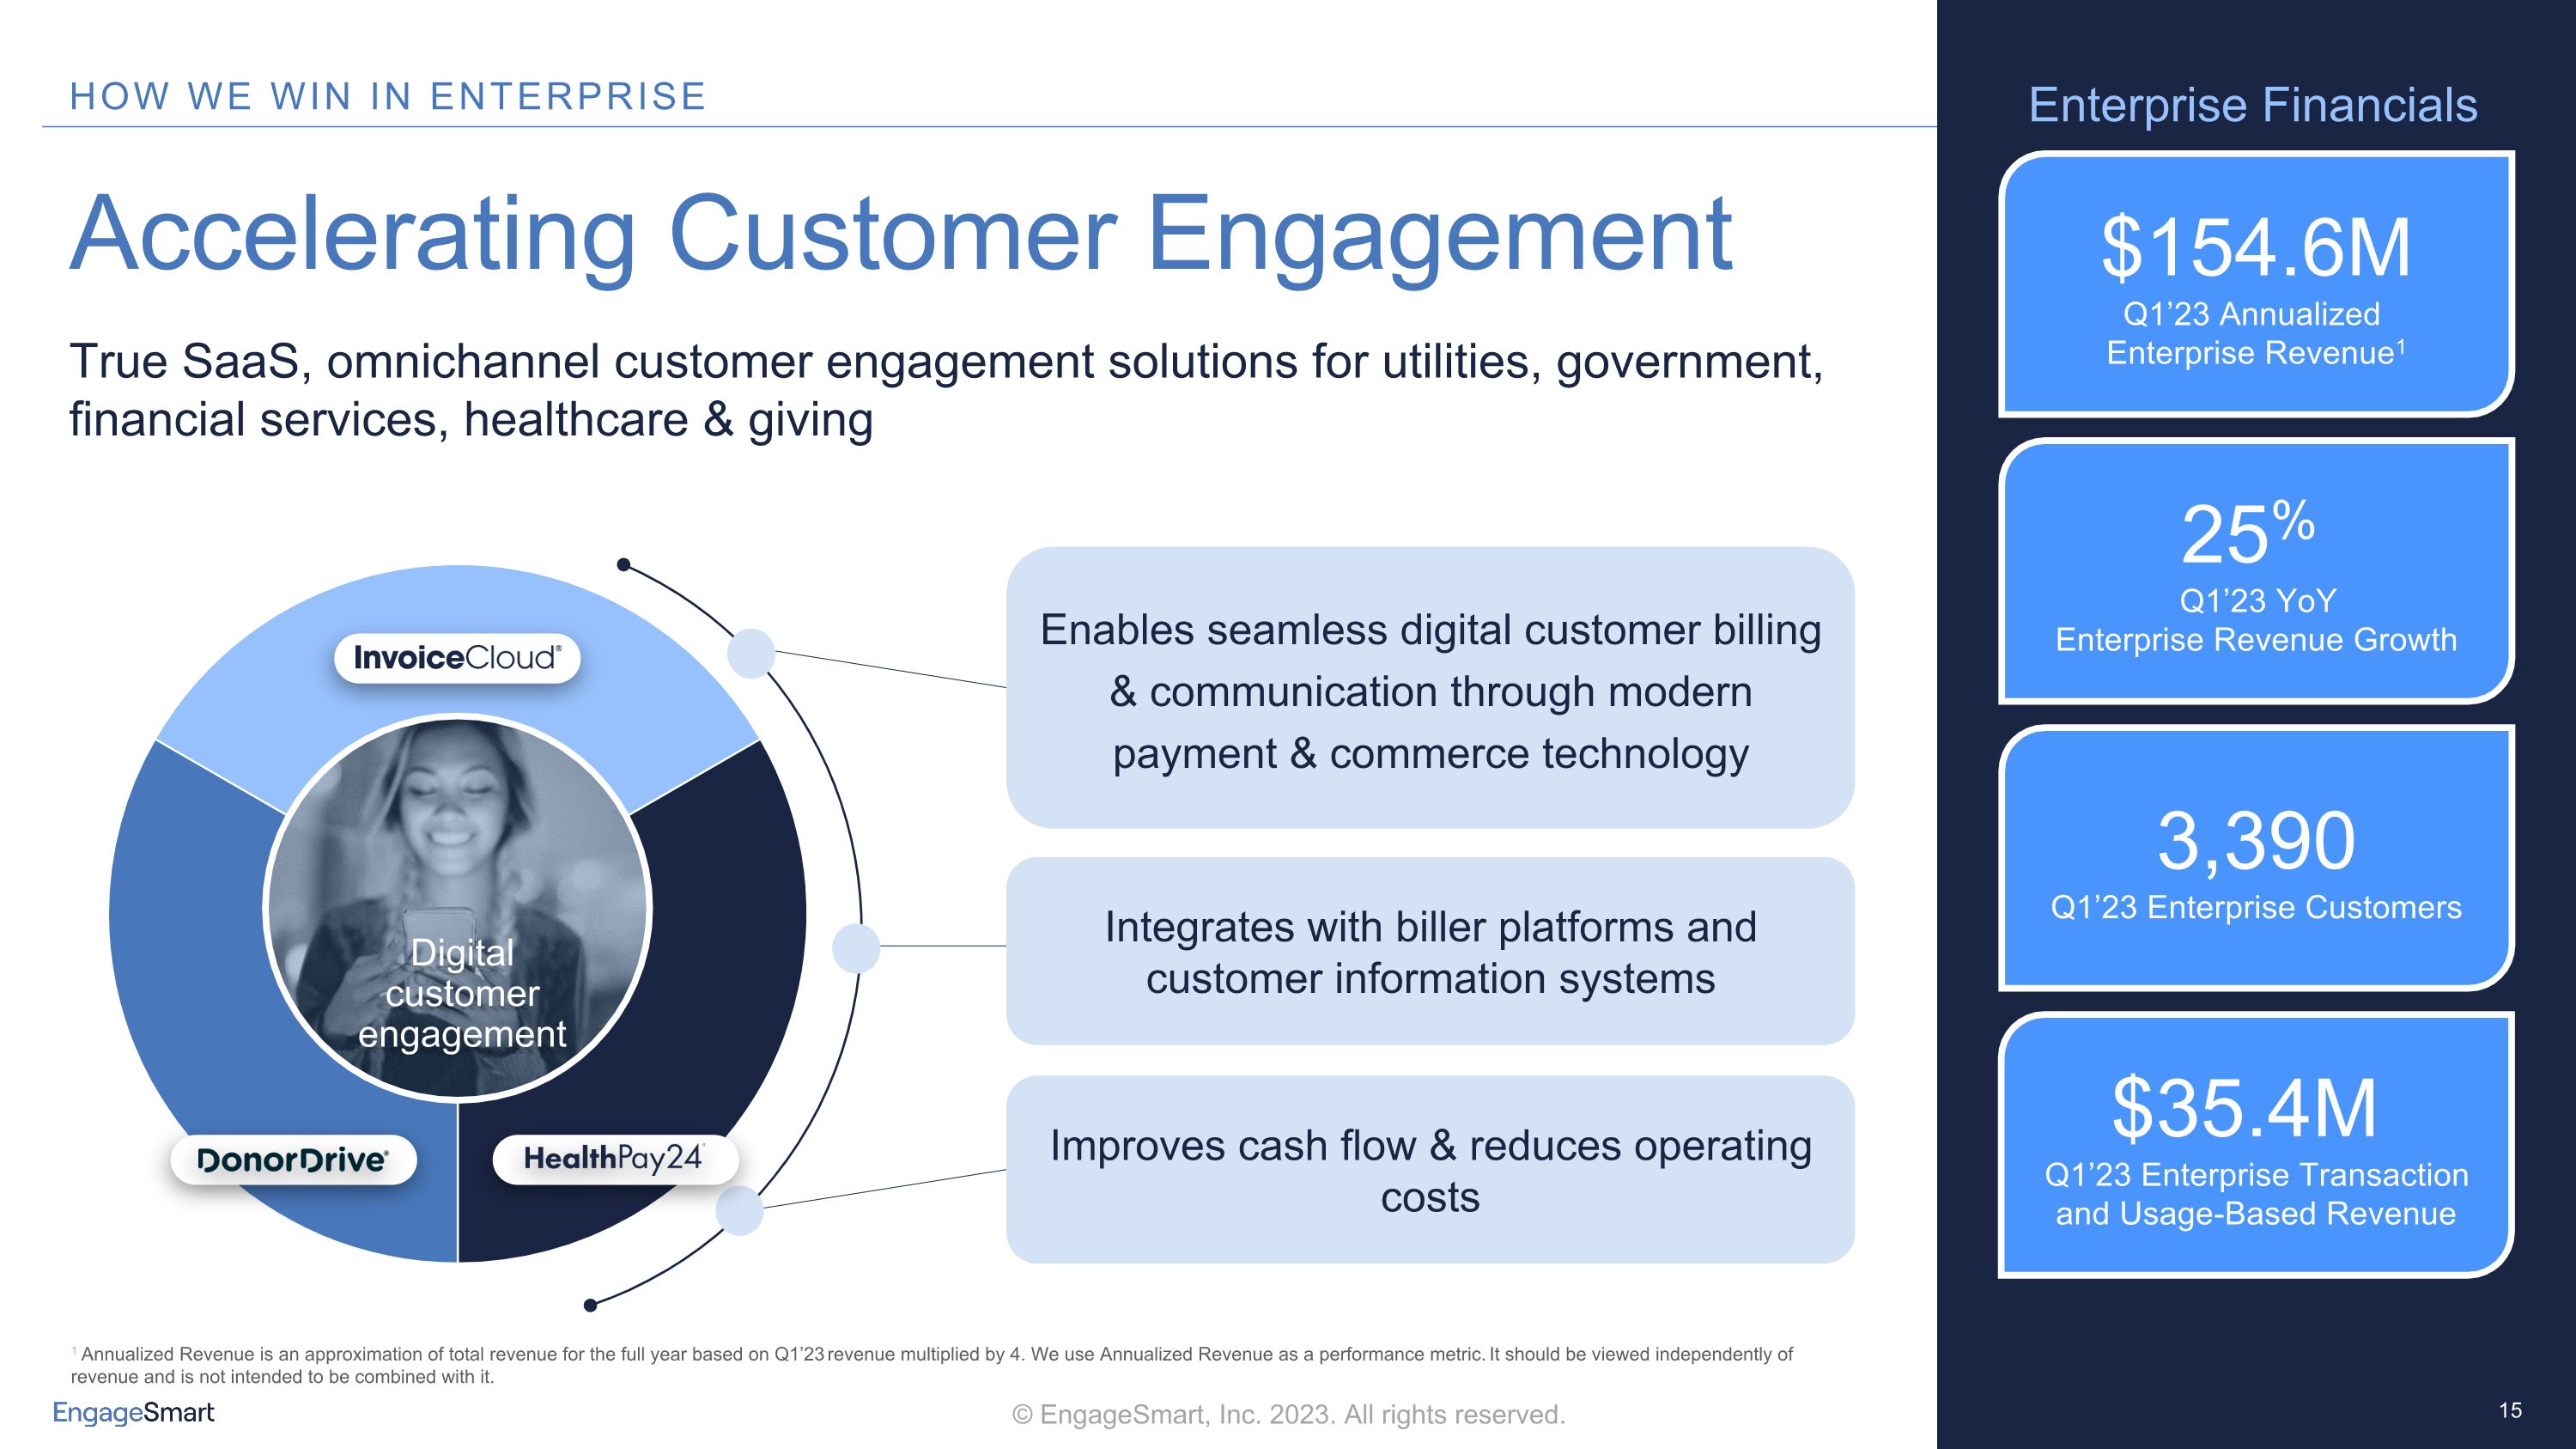
Enterprise Financials Enables seamless digital customer billing & communication through modern payment & commerce technology Integrates with biller platforms and customer information systems Improves cash flow & reduces operating costs True SaaS, omnichannel customer engagement solutions for utilities, government, financial services, healthcare & giving Accelerating Customer Engagement $154.6M Q1’23 Annualized Enterprise Revenue1 25% Q1’23 YoY Enterprise Revenue Growth 3,390 Q1’23 Enterprise Customers $35.4M Q1’23 Enterprise Transaction and Usage-Based Revenue 1 Annualized Revenue is an approximation of total revenue for the full year based on Q1’23 revenue multiplied by 4. We use Annualized Revenue as a performance metric. It should be viewed independently of revenue and is not intended to be combined with it. Digital customer engagement
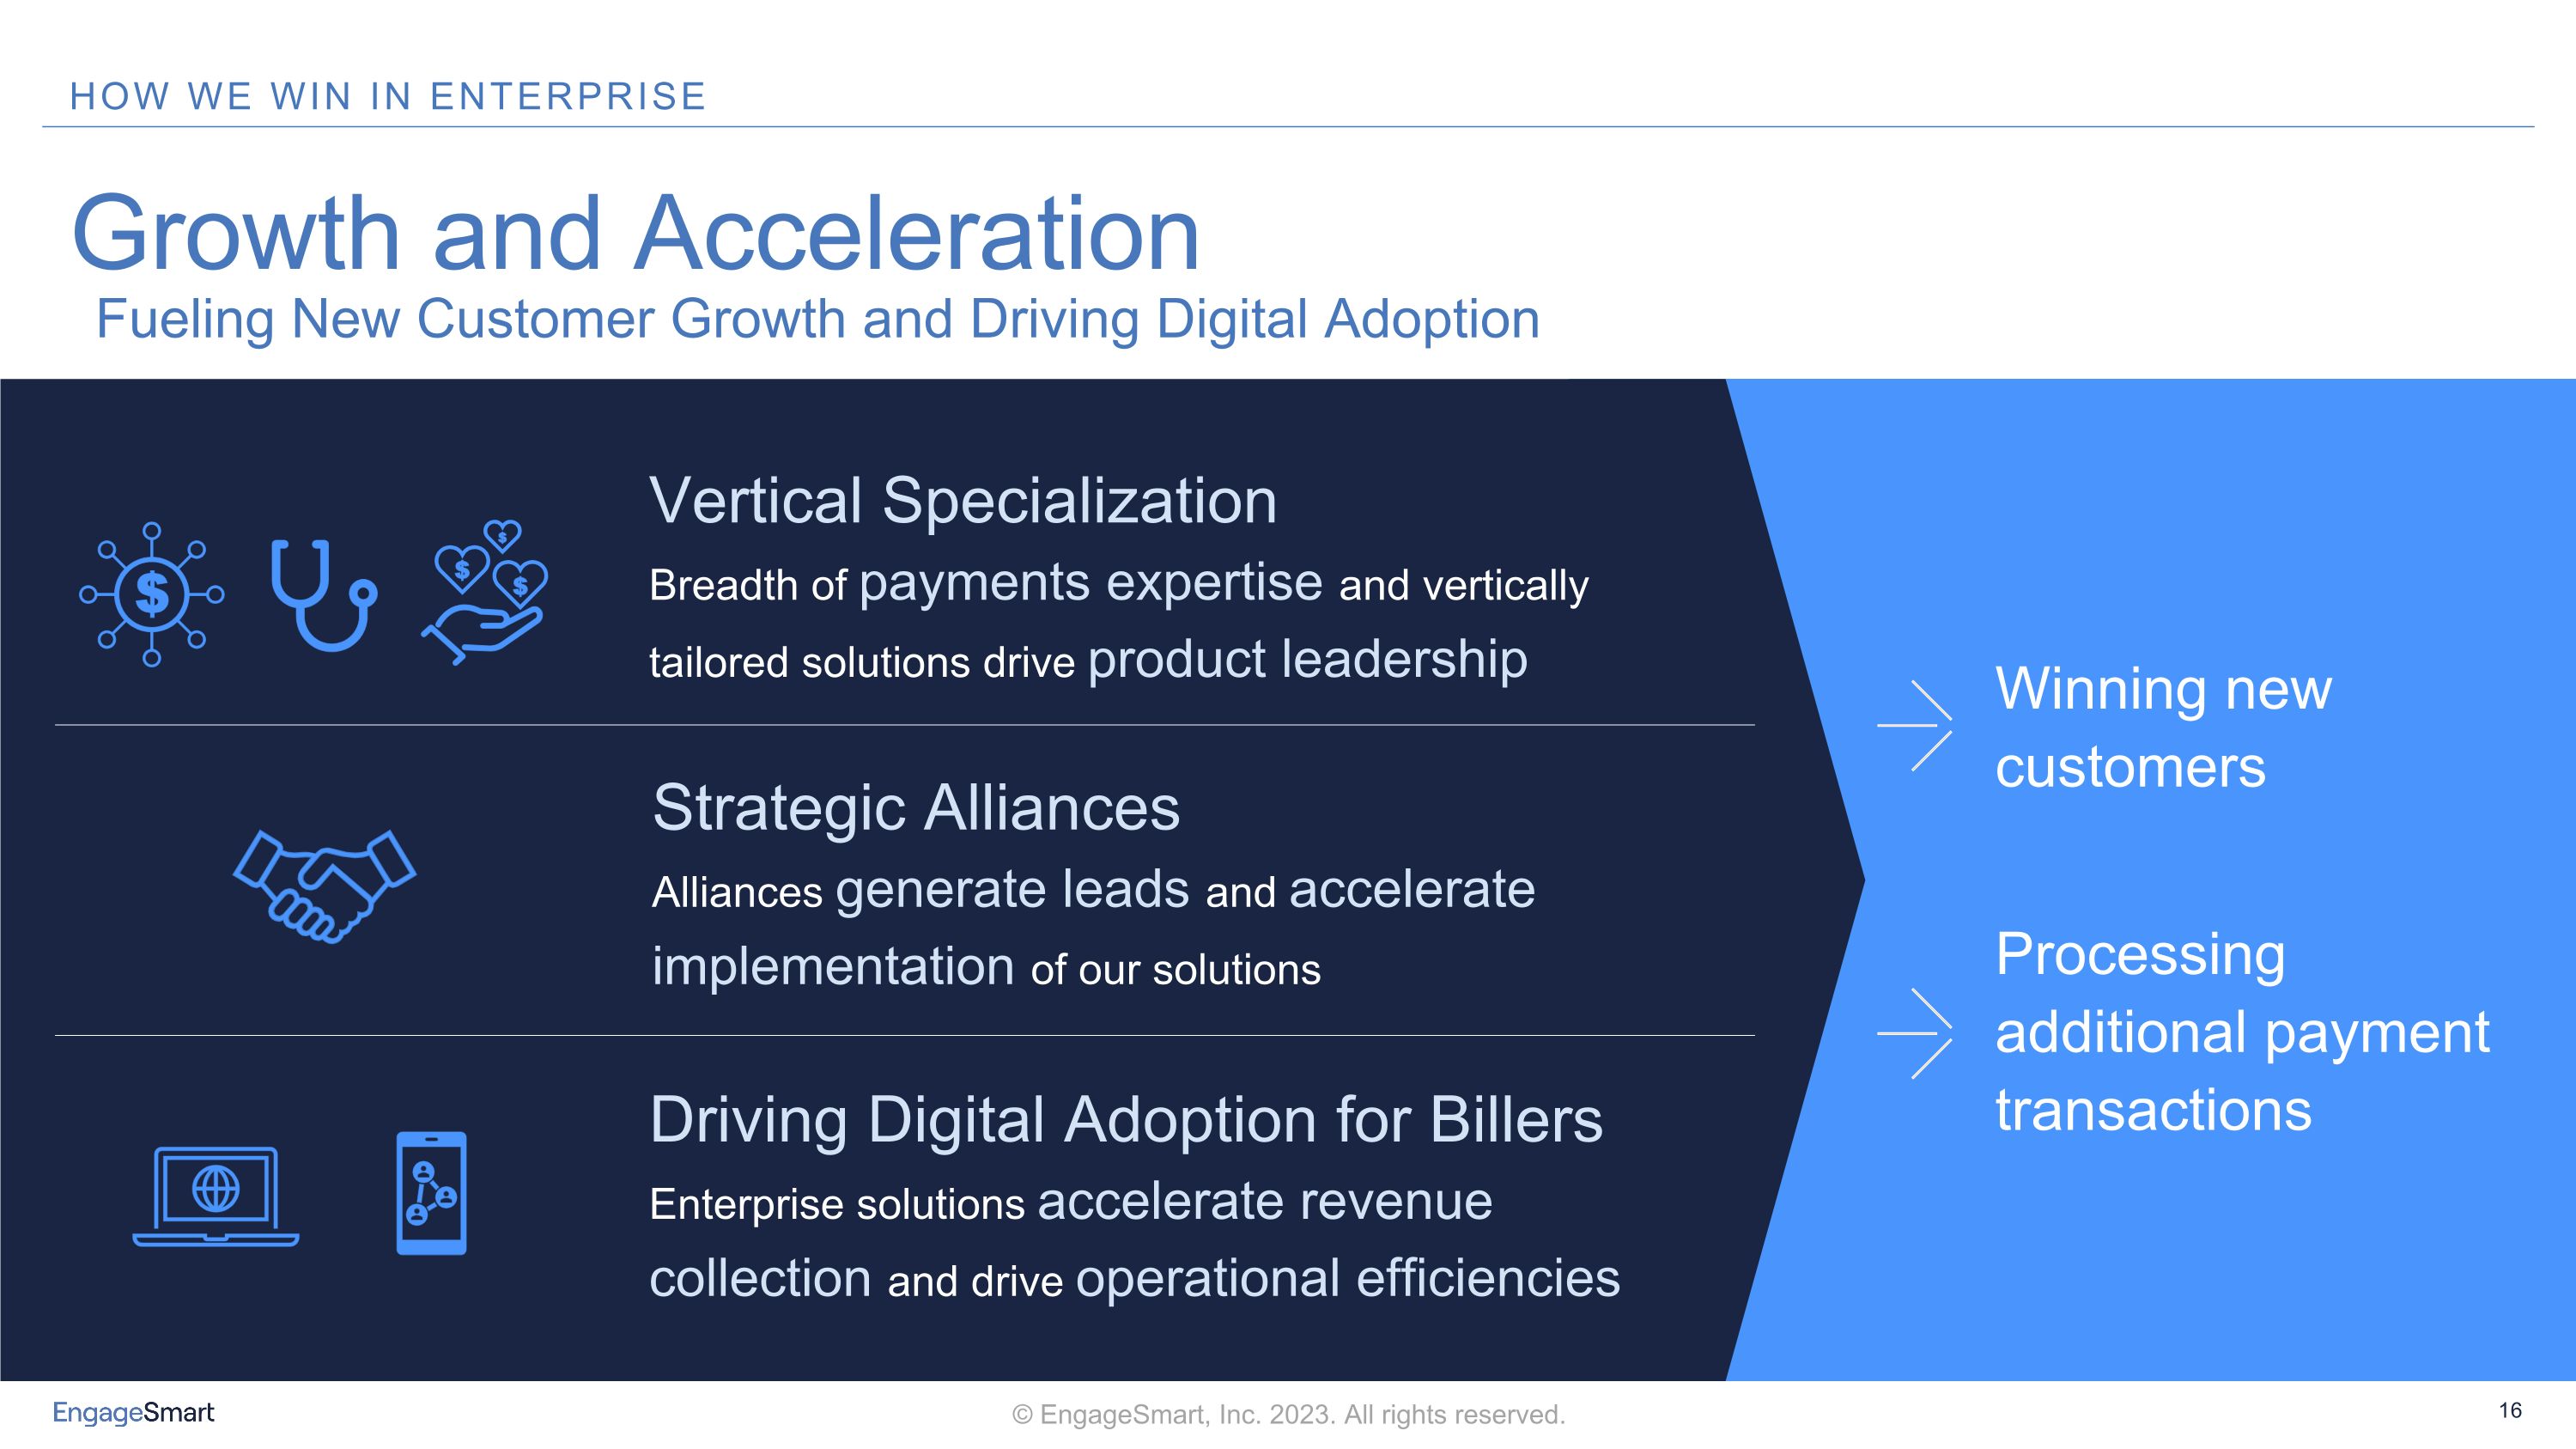
Growth and Acceleration Vertical Specialization Breadth of payments expertise and vertically tailored solutions drive product leadership Strategic Alliances Alliances generate leads and accelerate implementation of our solutions Driving Digital Adoption for Billers Enterprise solutions accelerate revenue collection and drive operational efficiencies Fueling New Customer Growth and Driving Digital Adoption Winning new customers Processing additional payment transactions
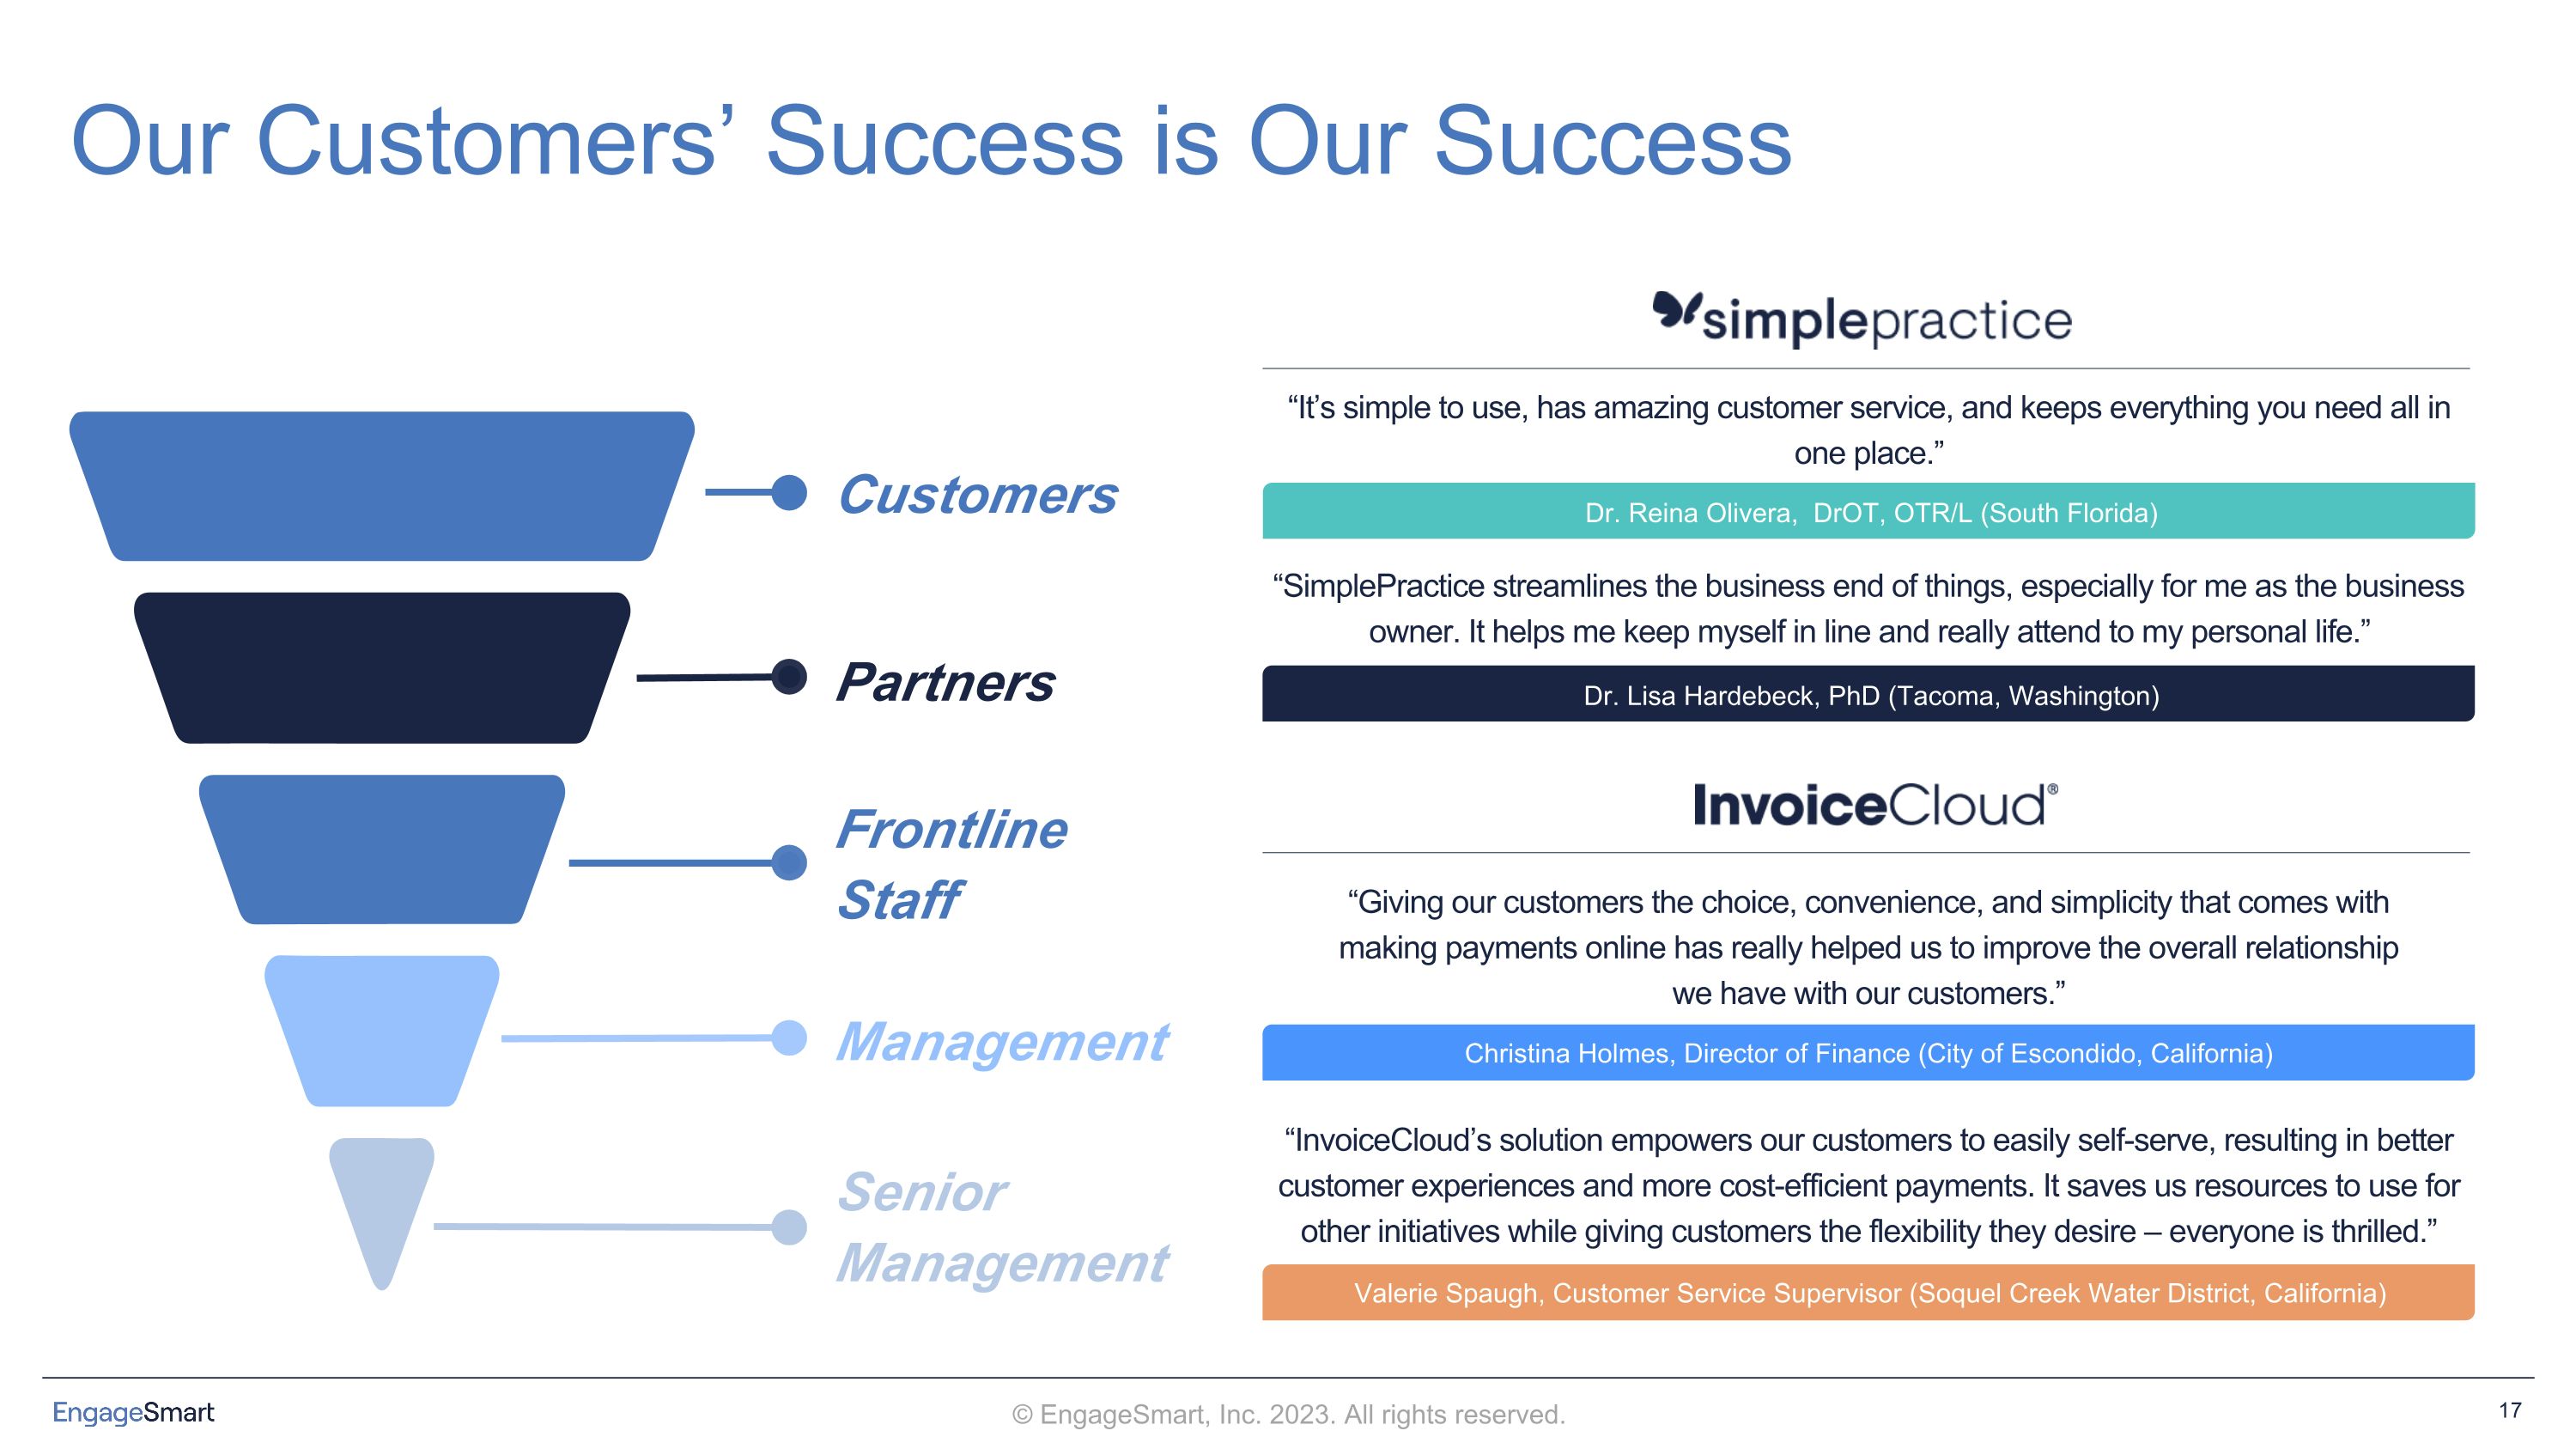
“It’s simple to use, has amazing customer service, and keeps everything you need all in one place.” Dr. Reina Olivera, DrOT, OTR/L (South Florida) “InvoiceCloud’s solution empowers our customers to easily self-serve, resulting in better customer experiences and more cost-efficient payments. It saves us resources to use for other initiatives while giving customers the flexibility they desire – everyone is thrilled.” Christina Holmes, Director of Finance (City of Escondido, California) “SimplePractice streamlines the business end of things, especially for me as the business owner. It helps me keep myself in line and really attend to my personal life.” Valerie Spaugh, Customer Service Supervisor (Soquel Creek Water District, California) “Giving our customers the choice, convenience, and simplicity that comes with making payments online has really helped us to improve the overall relationship we have with our customers.” Dr. Lisa Hardebeck, PhD (Tacoma, Washington) Our Customers’ Success is Our Success Customers Partners Frontline Staff Management Senior Management
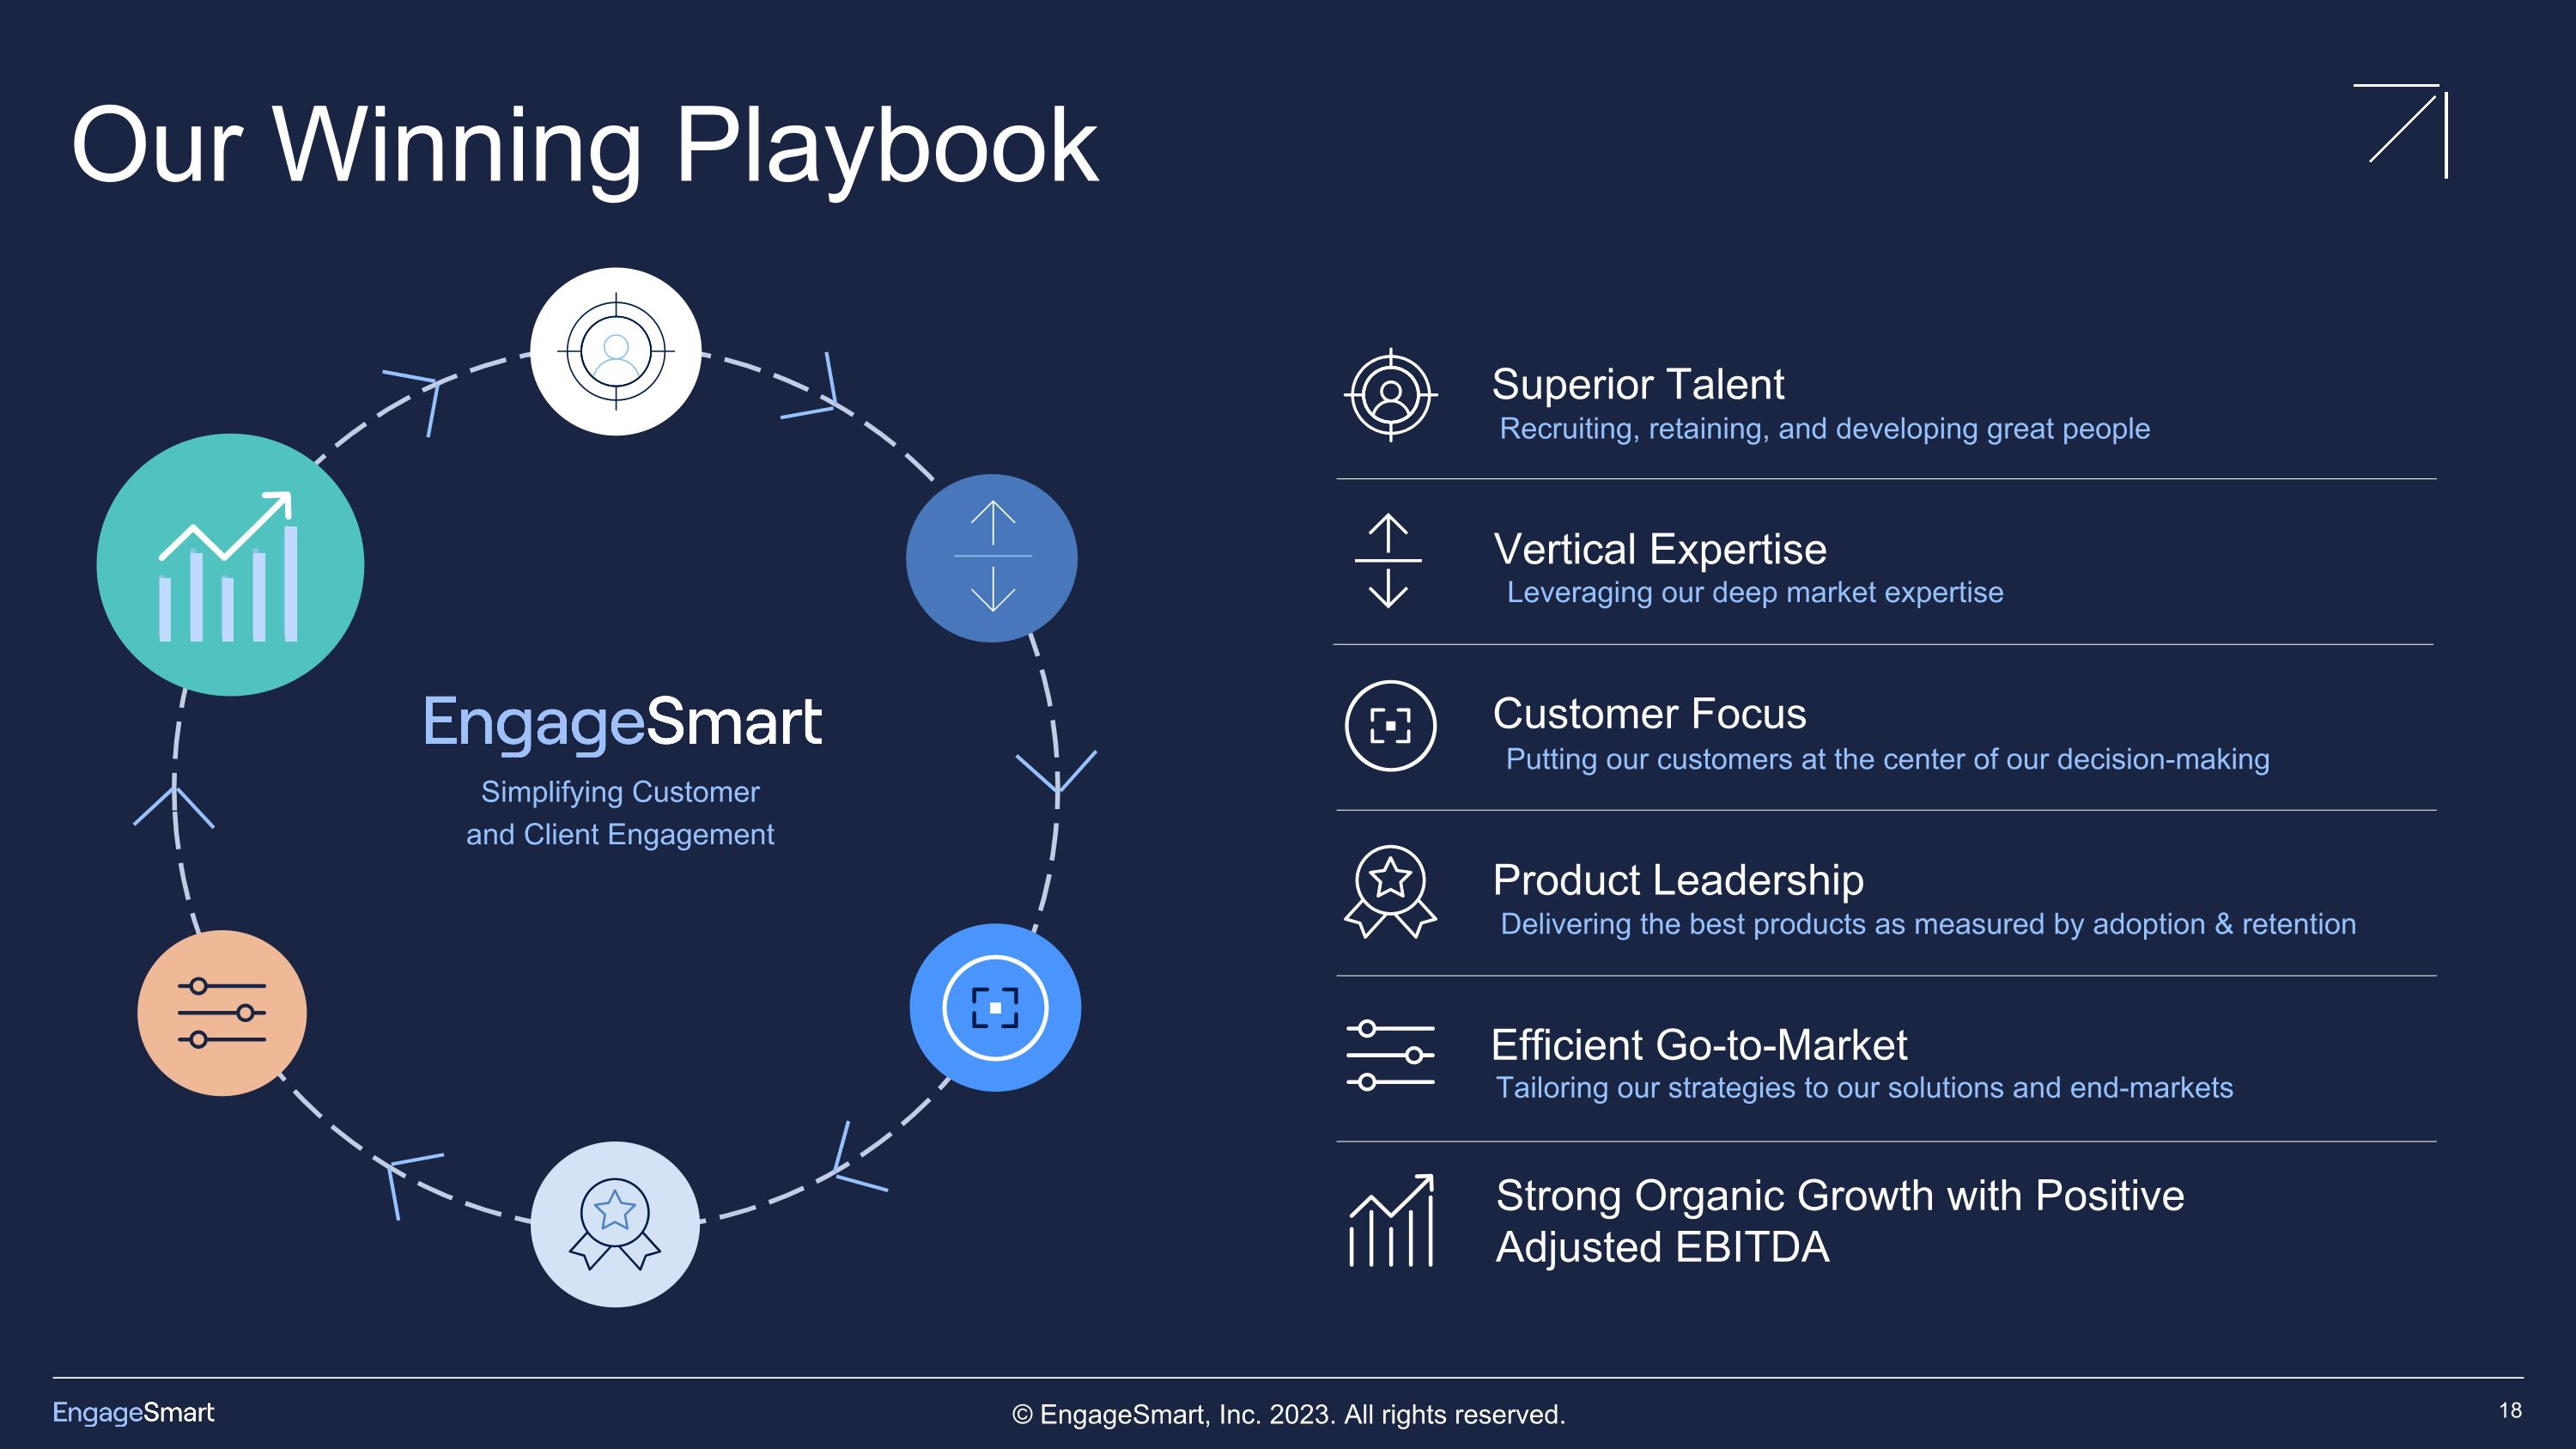
Simplifying Customer and Client Engagement Superior Talent Recruiting, retaining, and developing great people Vertical Expertise Leveraging our deep market expertise Customer Focus Putting our customers at the center of our decision-making Product Leadership Delivering the best products as measured by adoption & retention Efficient Go-to-Market Tailoring our strategies to our solutions and end-markets Strong Organic Growth with Positive Adjusted EBITDA Our Winning Playbook
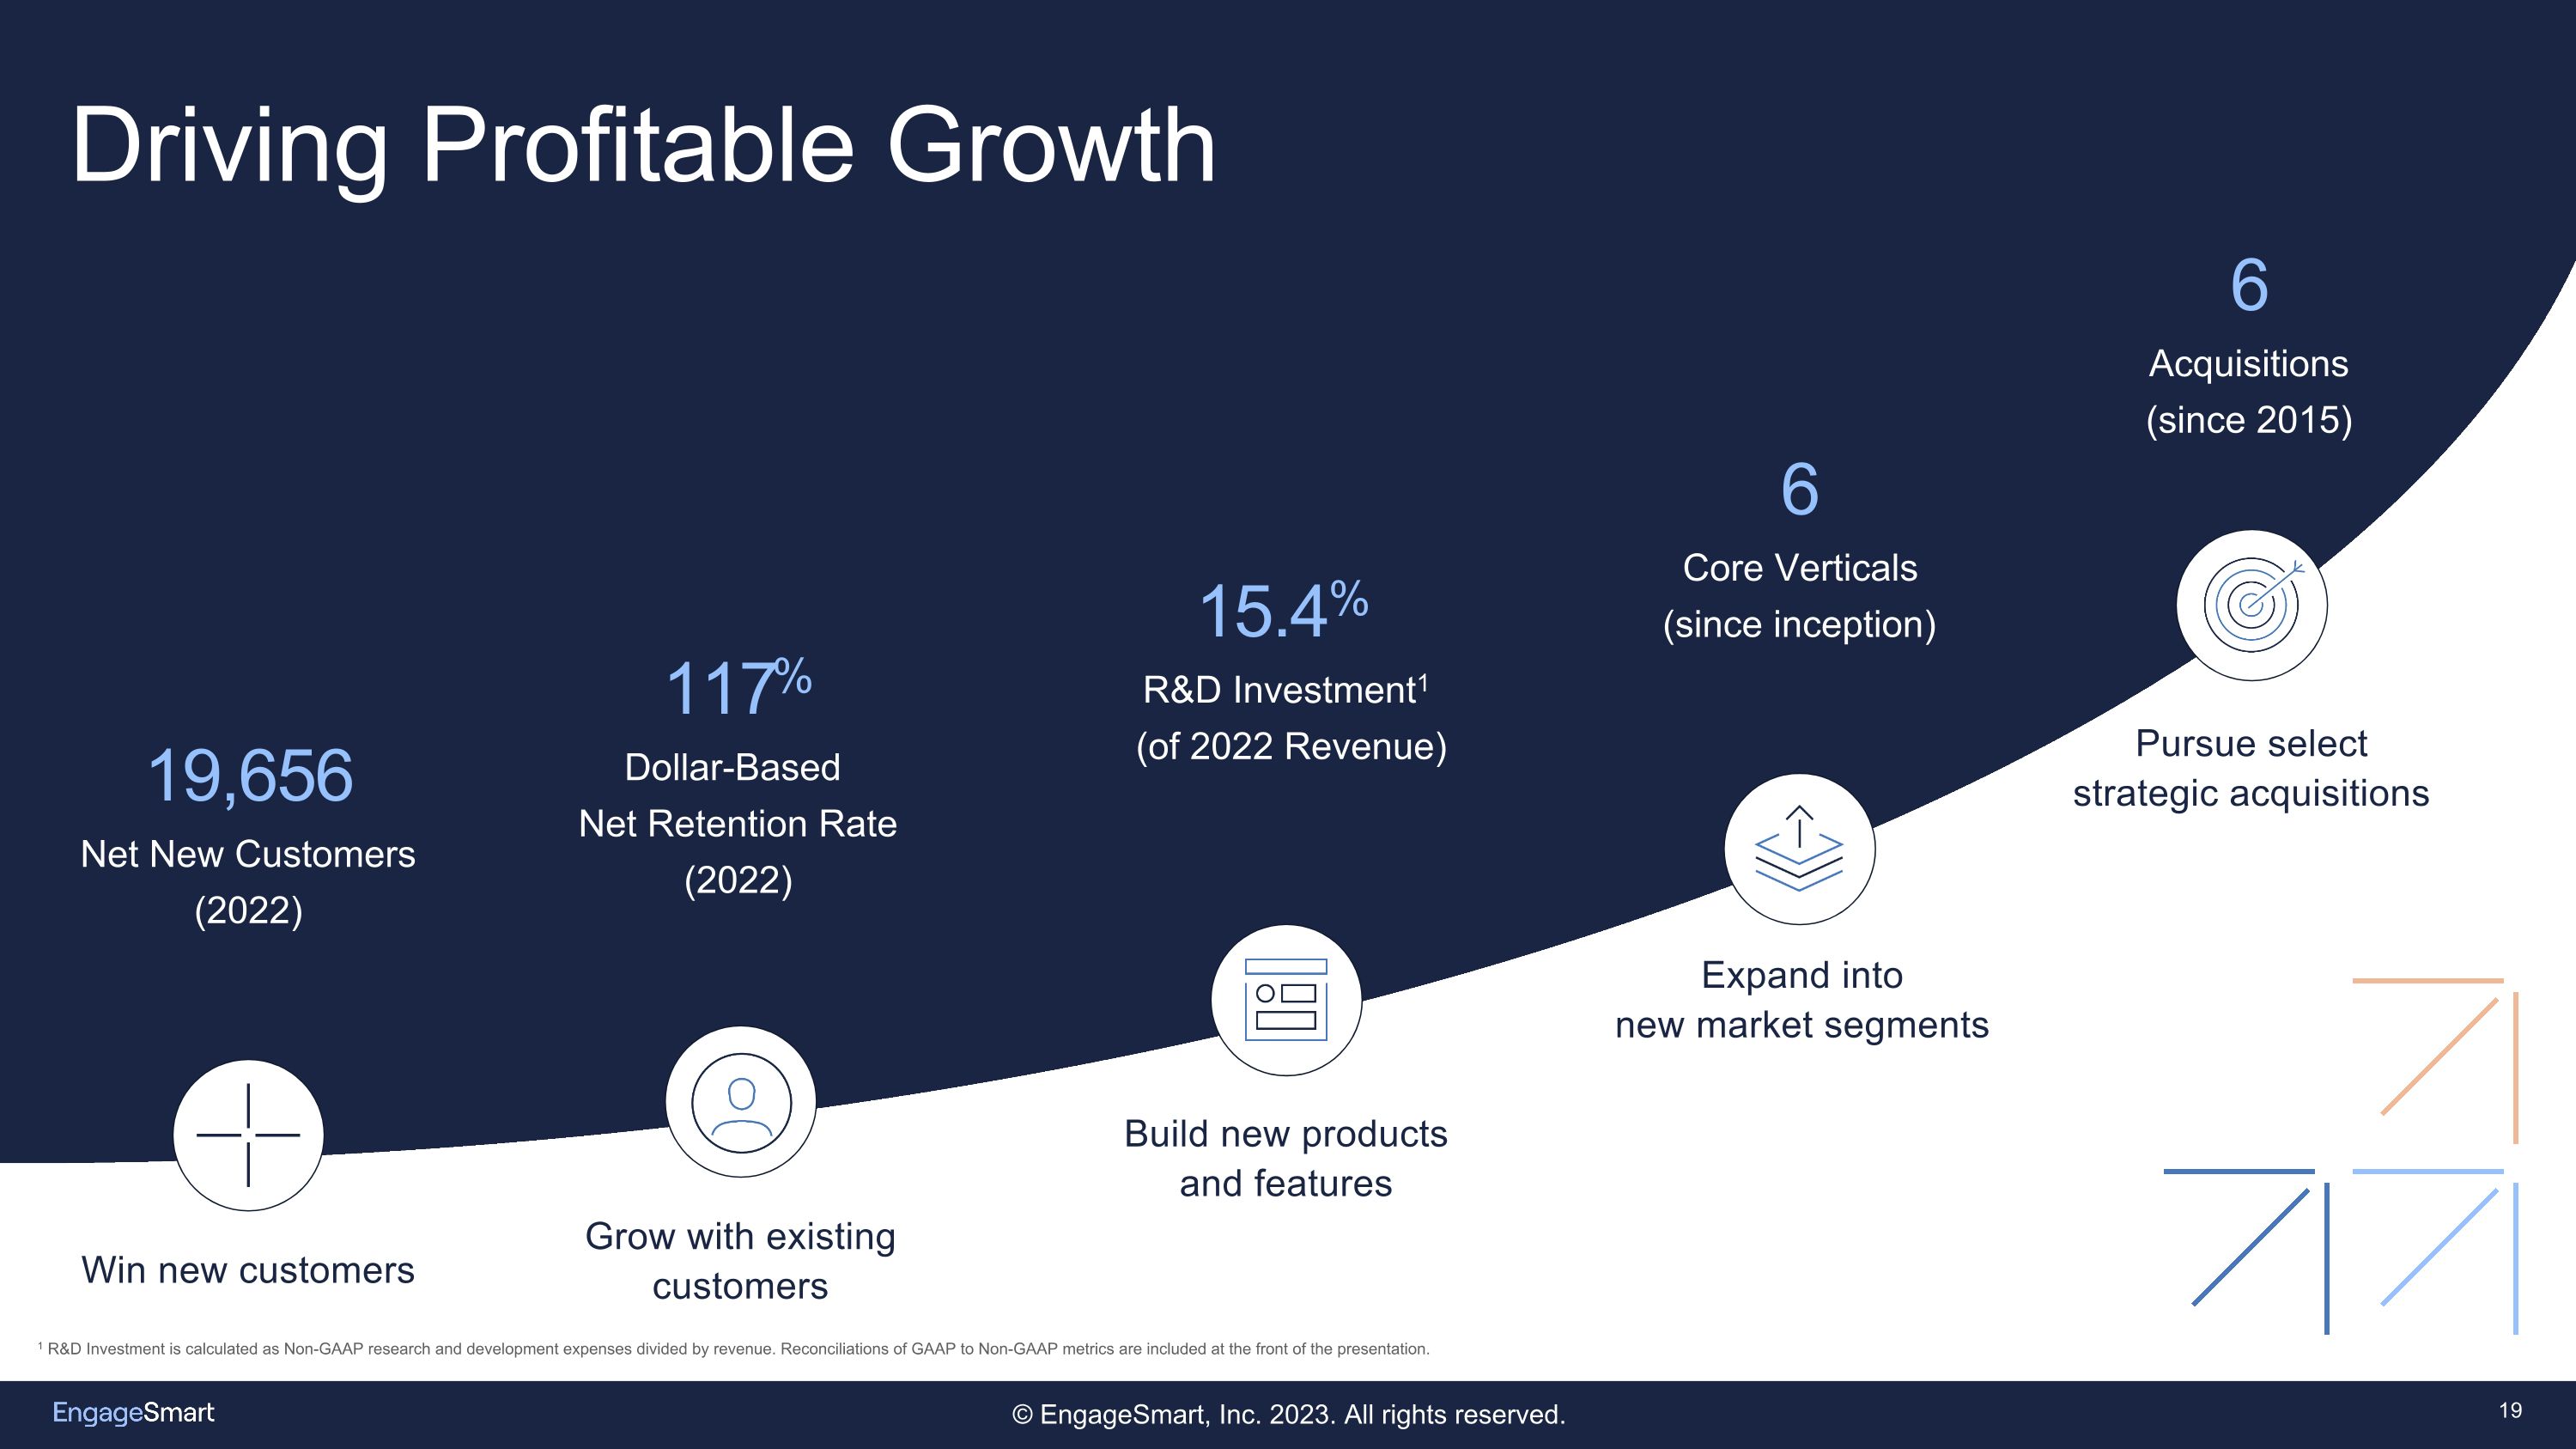
Driving Profitable Growth Build new products �and features 15.4% R&D Investment1� (of 2022 Revenue) Expand into�new market segments 6 Core Verticals (since inception) Win new customers 19,656 Net New Customers (2022) Pursue select�strategic acquisitions 6 Acquisitions (since 2015) 1 R&D Investment is calculated as Non-GAAP research and development expenses divided by revenue. Reconciliations of GAAP to Non-GAAP metrics are included at the front of the presentation. Grow with existing customers 117% Dollar-Based Net Retention Rate�(2022)

Creating Shareholder Value Recession Resistant Model Sticky Customer Relationships Product Leadership Across Verticals Winning Playbook Driven by Strong Leaders Compelling Market & Runway Durable Growth & Profitability

Financial Overview
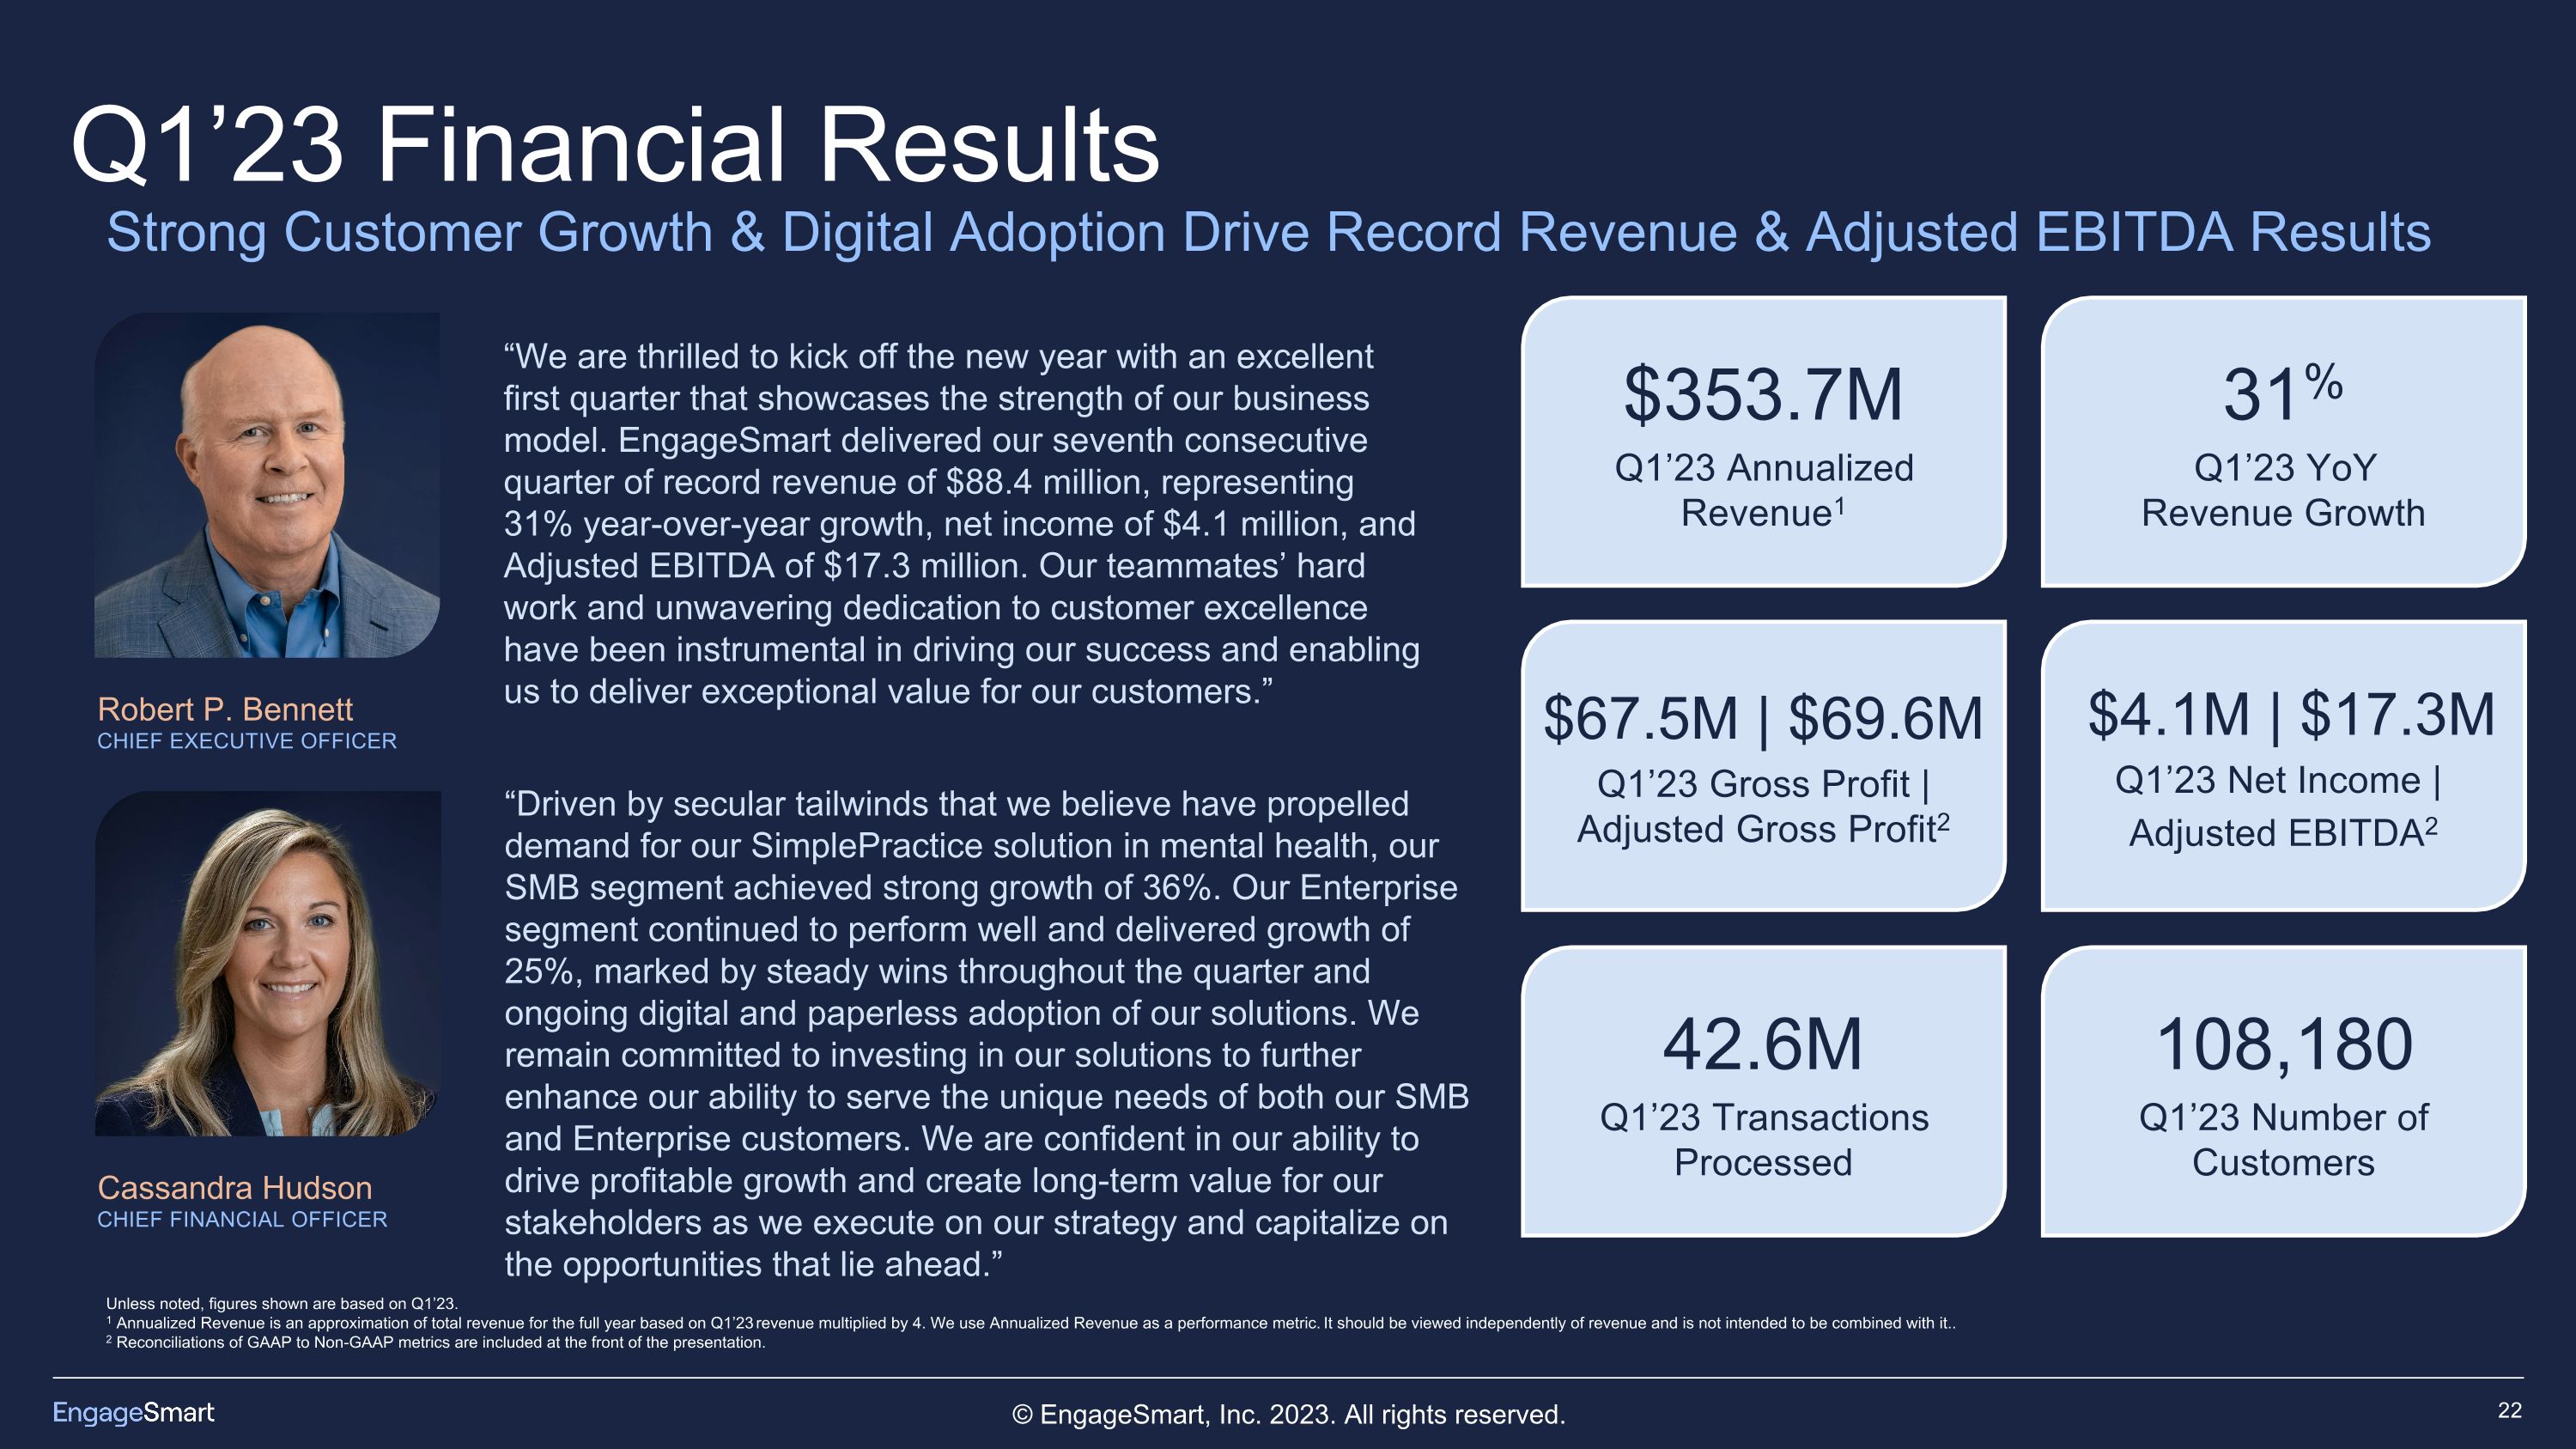
Q1’23 Financial Results Strong Customer Growth & Digital Adoption Drive Record Revenue & Adjusted EBITDA Results $67.5M | $69.6M Q1’23 Gross Profit | Adjusted Gross Profit2 108,180 Q1’23 Number of Customers 42.6M Q1’23 Transactions Processed 31% Q1’23 YoY �Revenue Growth $353.7M Q1’23 Annualized�Revenue1 Unless noted, figures shown are based on Q1’23. 1 Annualized Revenue is an approximation of total revenue for the full year based on Q1’23 revenue multiplied by 4. We use Annualized Revenue as a performance metric. It should be viewed independently of revenue and is not intended to be combined with it.. 2 Reconciliations of GAAP to Non-GAAP metrics are included at the front of the presentation. “Driven by secular tailwinds that we believe have propelled demand for our SimplePractice solution in mental health, our SMB segment achieved strong growth of 36%. Our Enterprise segment continued to perform well and delivered growth of 25%, marked by steady wins throughout the quarter and ongoing digital and paperless adoption of our solutions. We remain committed to investing in our solutions to further enhance our ability to serve the unique needs of both our SMB and Enterprise customers. We are confident in our ability to drive profitable growth and create long-term value for our stakeholders as we execute on our strategy and capitalize on the opportunities that lie ahead.” Robert P. Bennett CHIEF EXECUTIVE OFFICER Cassandra Hudson CHIEF FINANCIAL OFFICER “We are thrilled to kick off the new year with an excellent first quarter that showcases the strength of our business model. EngageSmart delivered our seventh consecutive quarter of record revenue of $88.4 million, representing 31% year-over-year growth, net income of $4.1 million, and Adjusted EBITDA of $17.3 million. Our teammates’ hard work and unwavering dedication to customer excellence have been instrumental in driving our success and enabling us to deliver exceptional value for our customers.” $4.1M | $17.3M Q1’23 Net Income | Adjusted EBITDA2
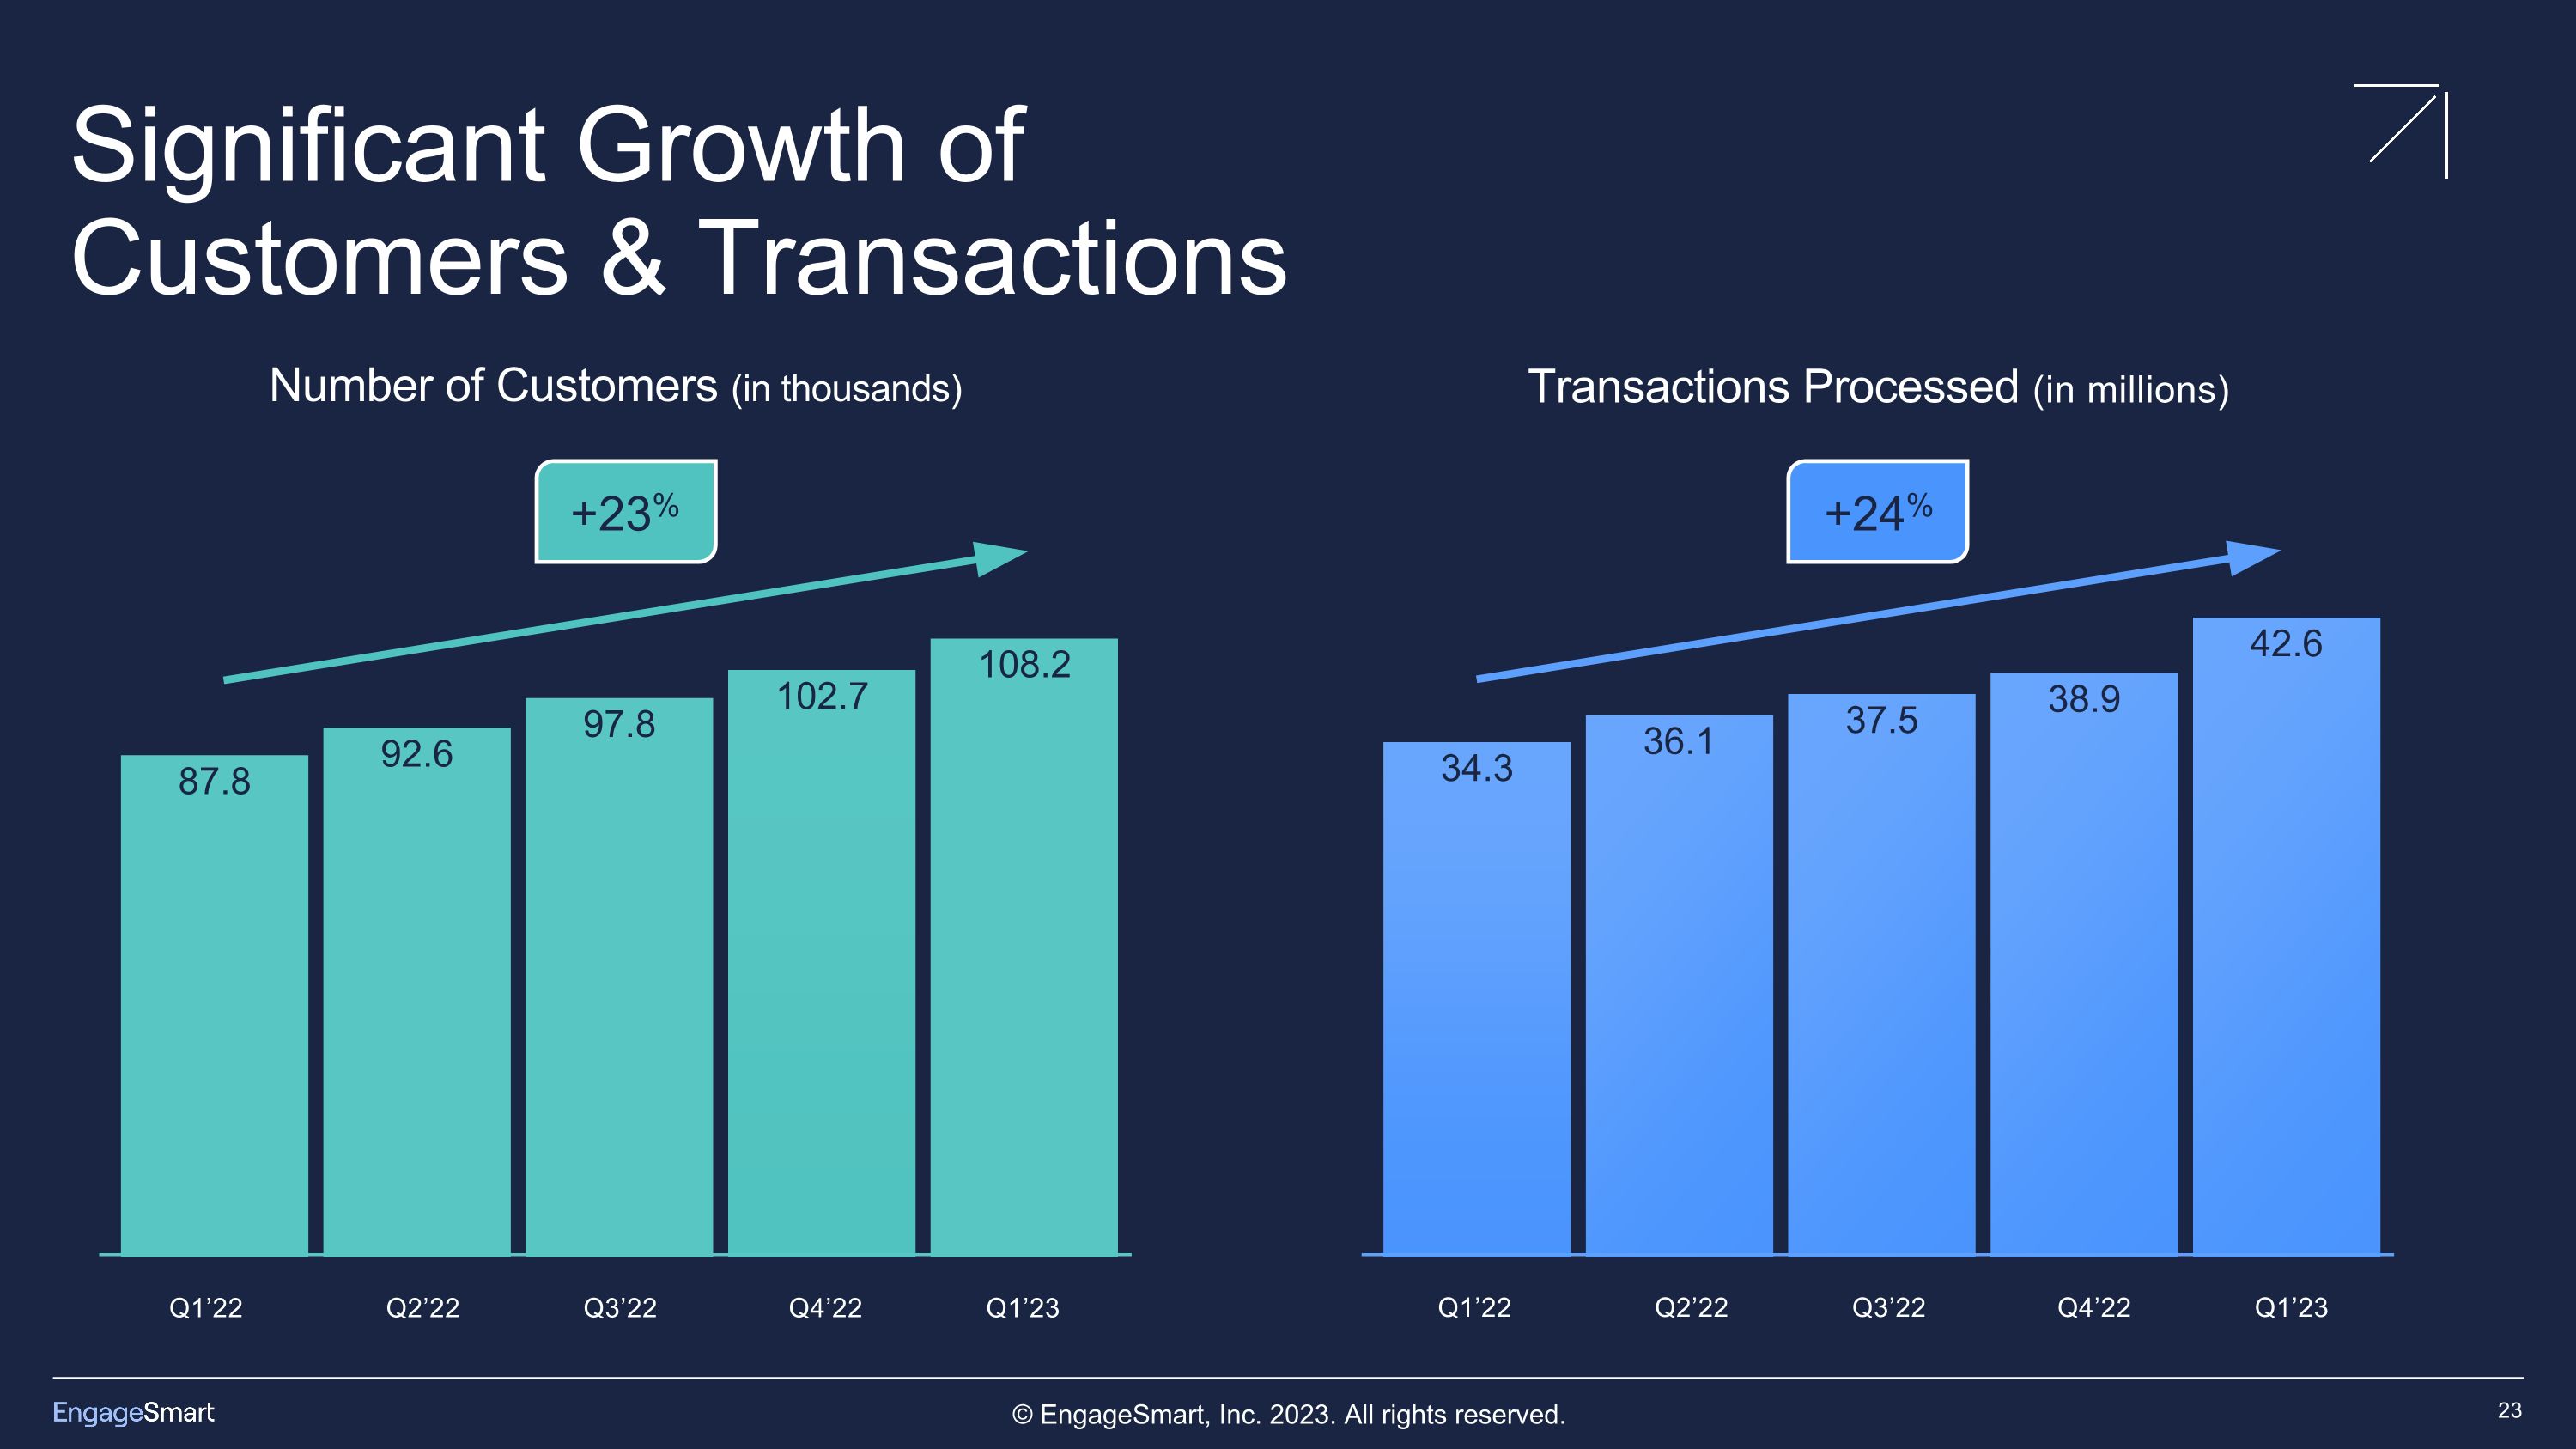
Significant Growth of Customers & Transactions Number of Customers (in thousands) Transactions Processed (in millions) +24% +23% Q1’22 Q2’22 Q3’22 Q4’22 Q1’23 Q1’22 Q2’22 Q3’22 Q4’22 Q1’23
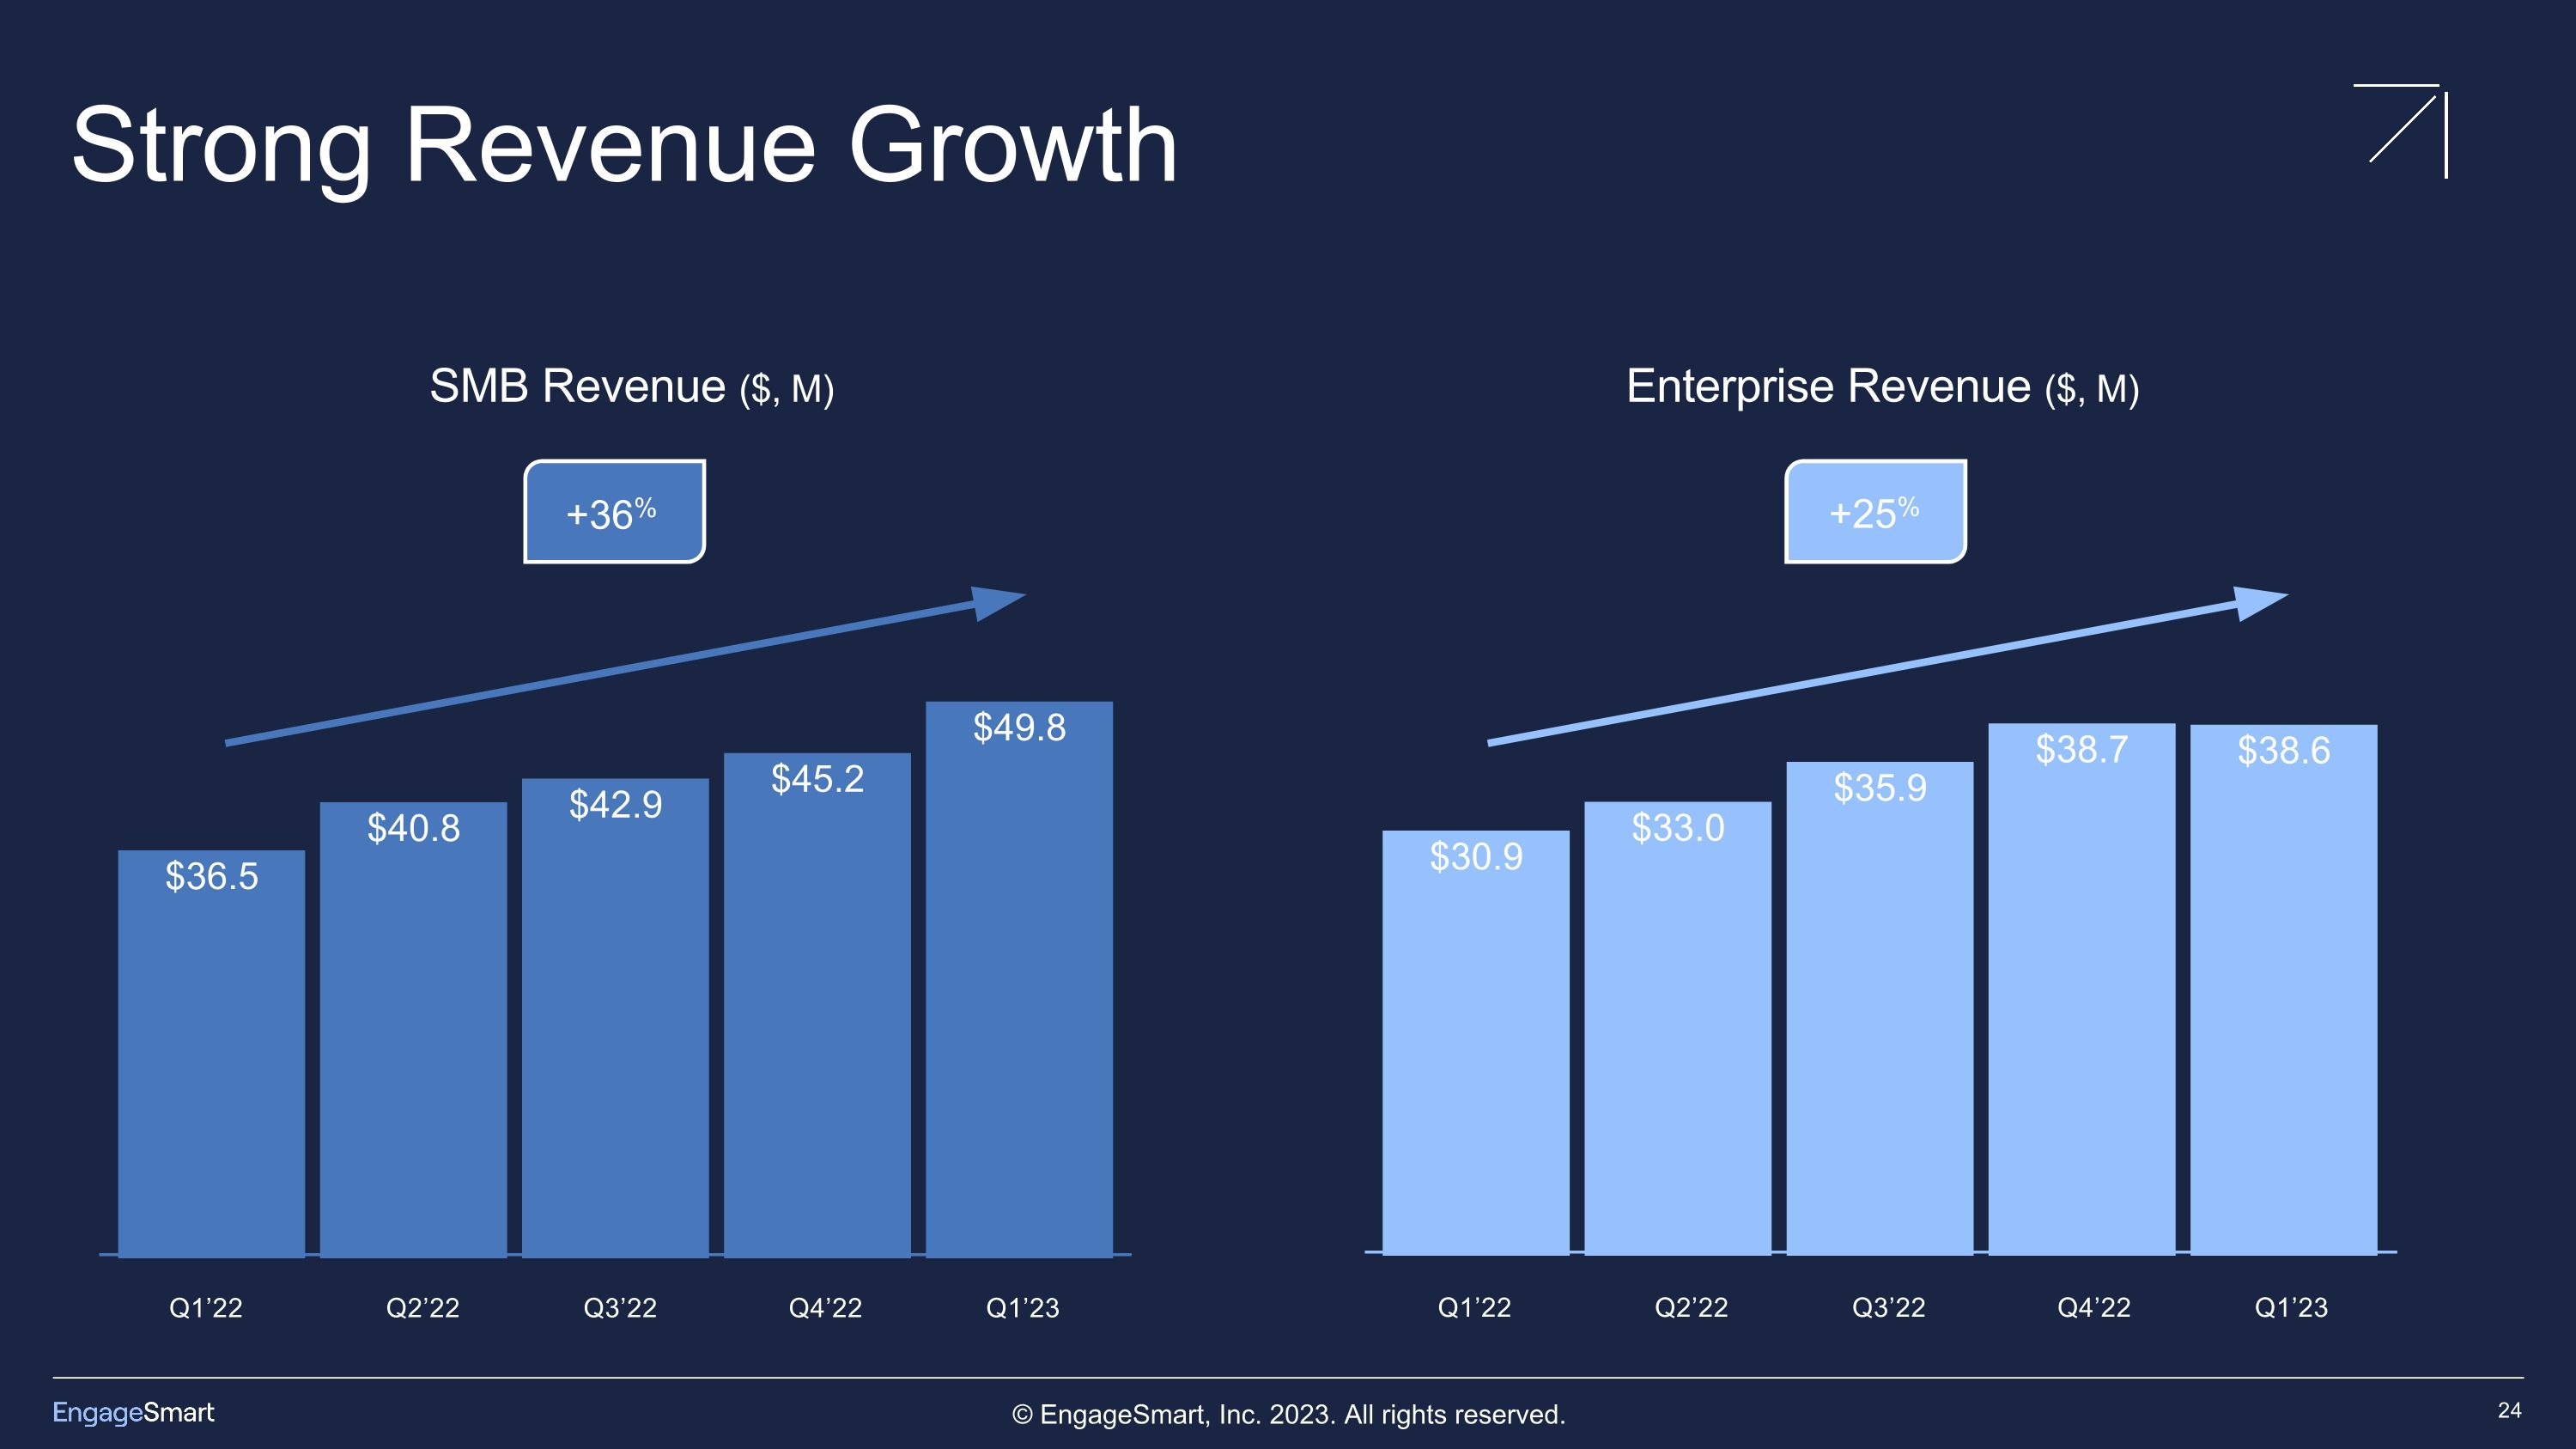
Strong Revenue Growth SMB Revenue ($, M) Enterprise Revenue ($, M) +25% +36% Q1’22 Q2’22 Q3’22 Q4’22 Q1’23 Q1’22 Q2’22 Q3’22 Q4’22 Q1’23
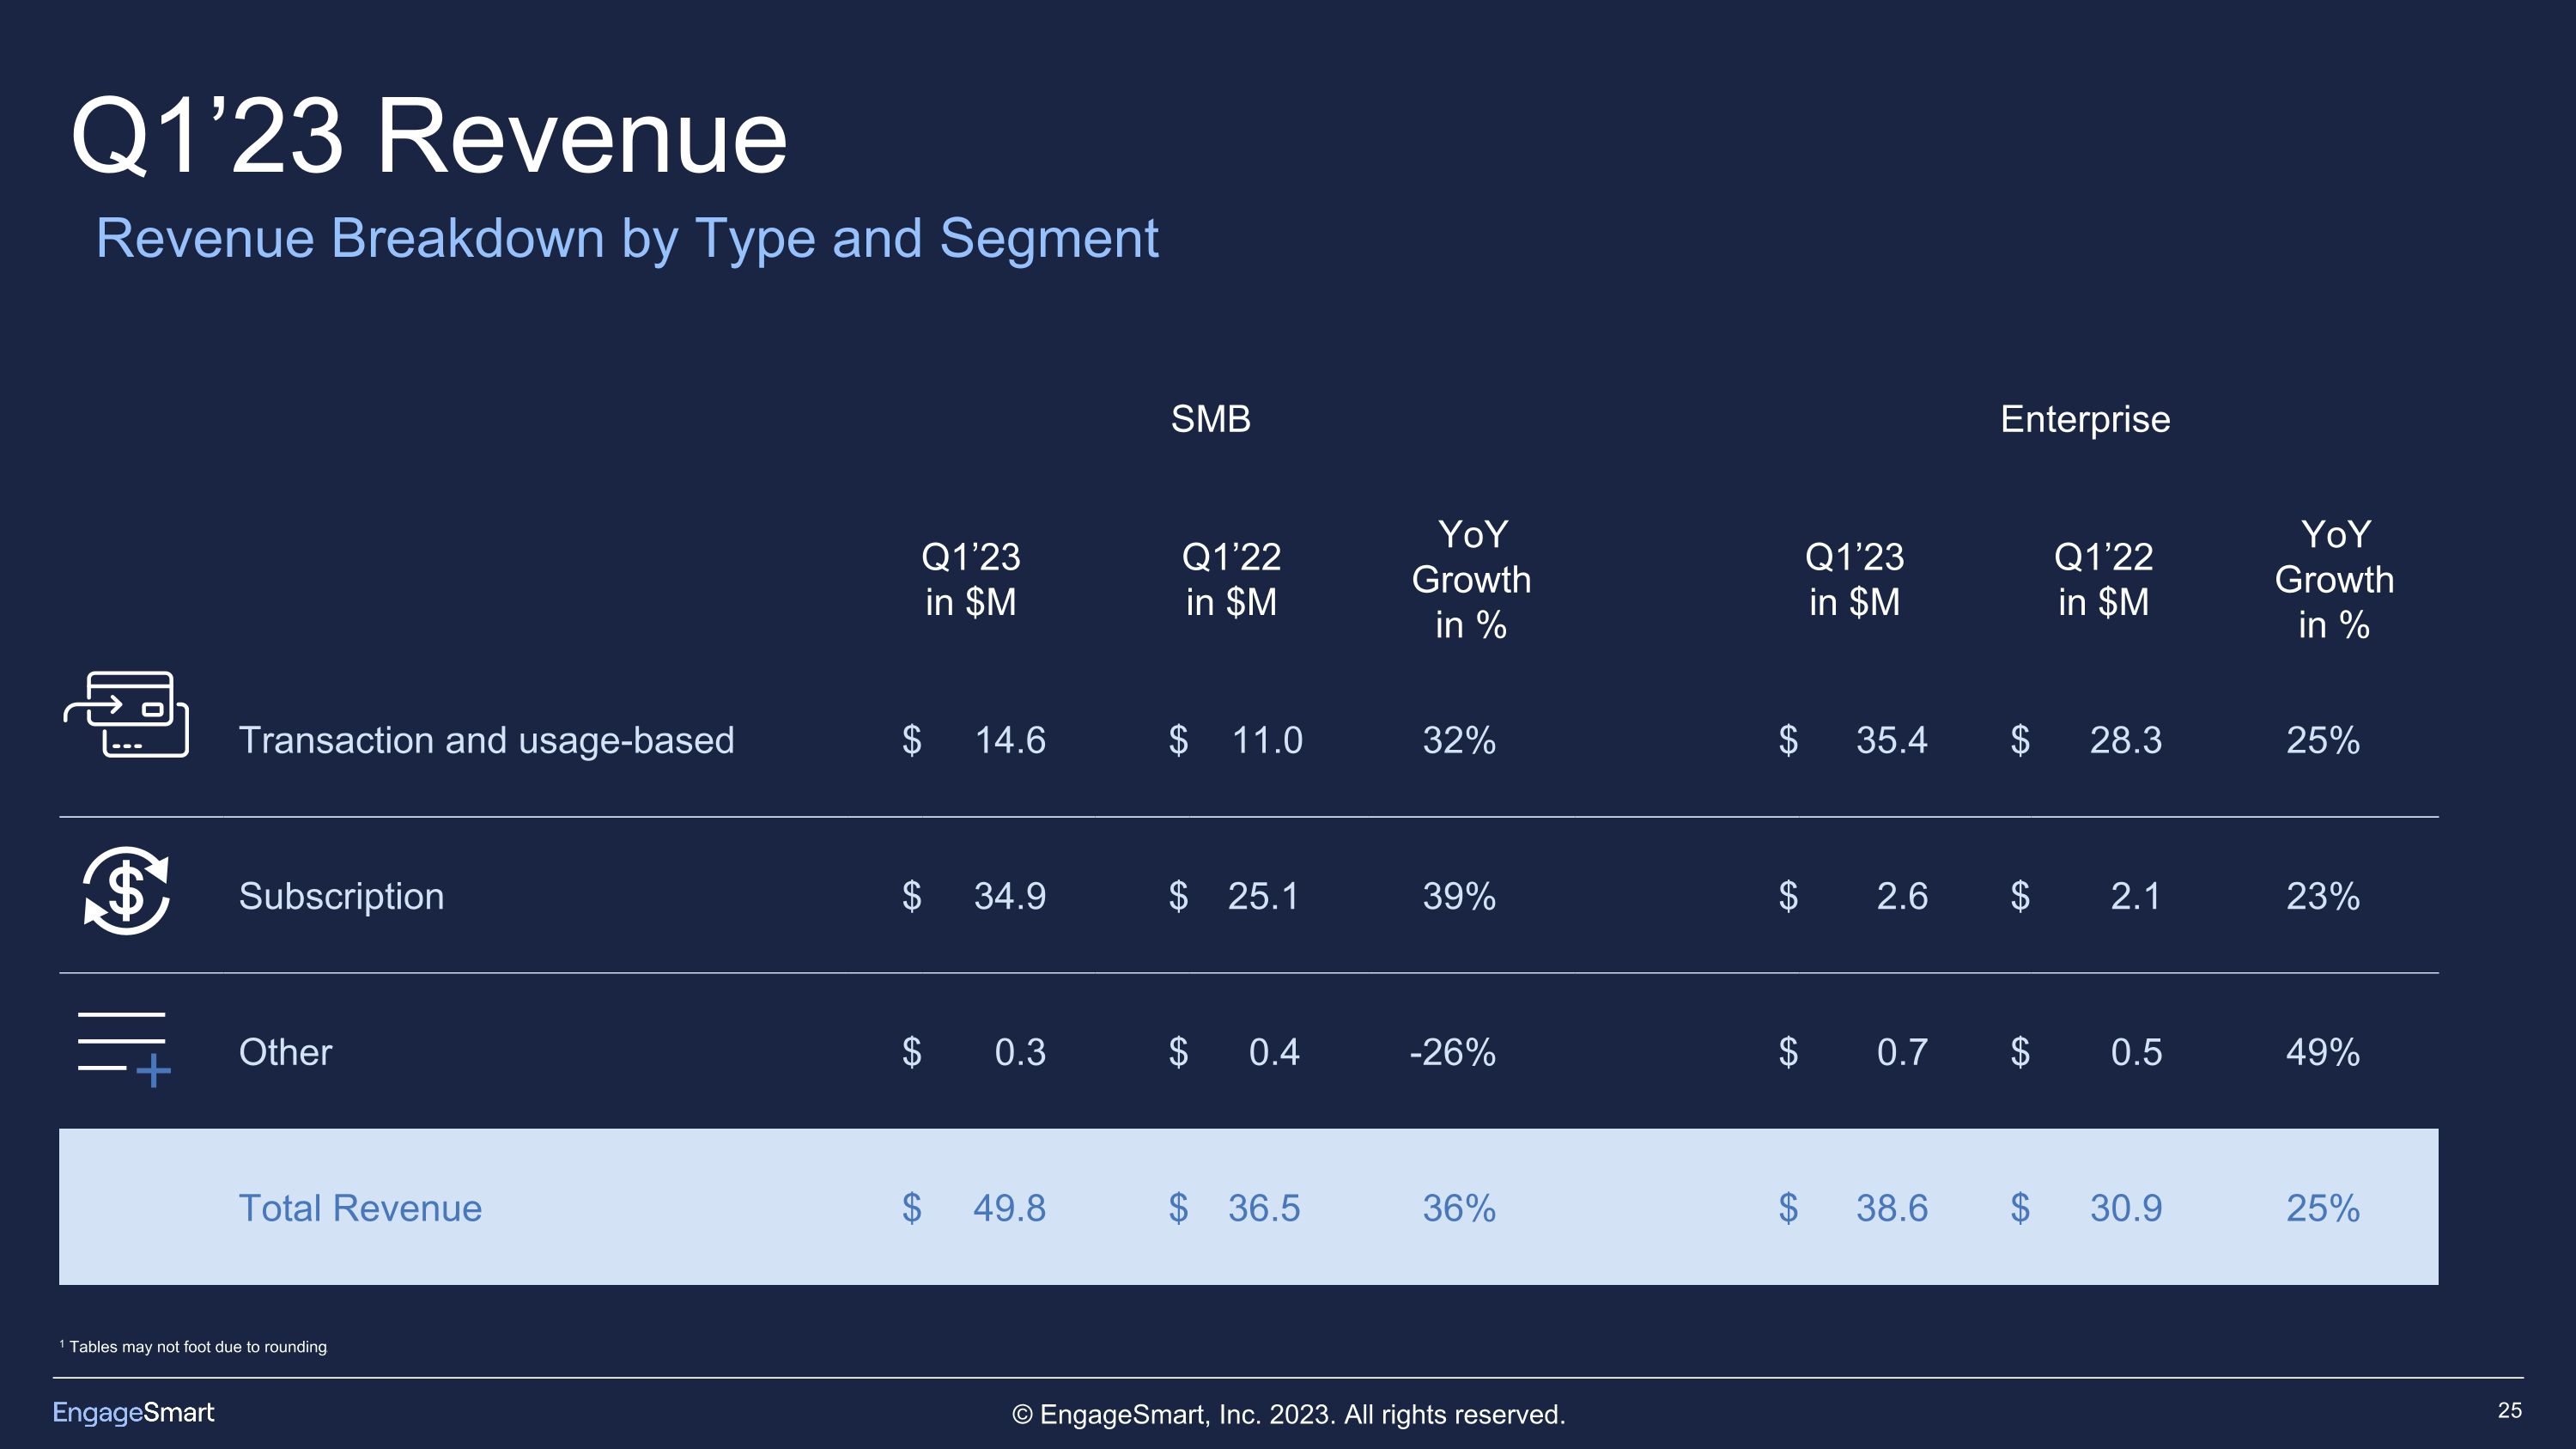
Revenue Breakdown by Type and Segment SMB Enterprise Q1’23 in $M Q1’22 in $M Q1’21 in $M YoY Growth in % Q1’23 in $M Q1’22 in $M Q1’21 in $M YoY Growth in % Transaction and usage-based $ 14.6 $ 11.0 32% $ 35.4 $ 28.3 25% Subscription $ 34.9 $ 25.1 39% $ 2.6 $ 2.1 23% Other $ 0.3 $ 0.4 -26% $ 0.7 $ 0.5 49% Total Revenue $ 49.8 $ 36.5 36% $ 38.6 $ 30.9 25% Q1’23 Revenue 1 Tables may not foot due to rounding.
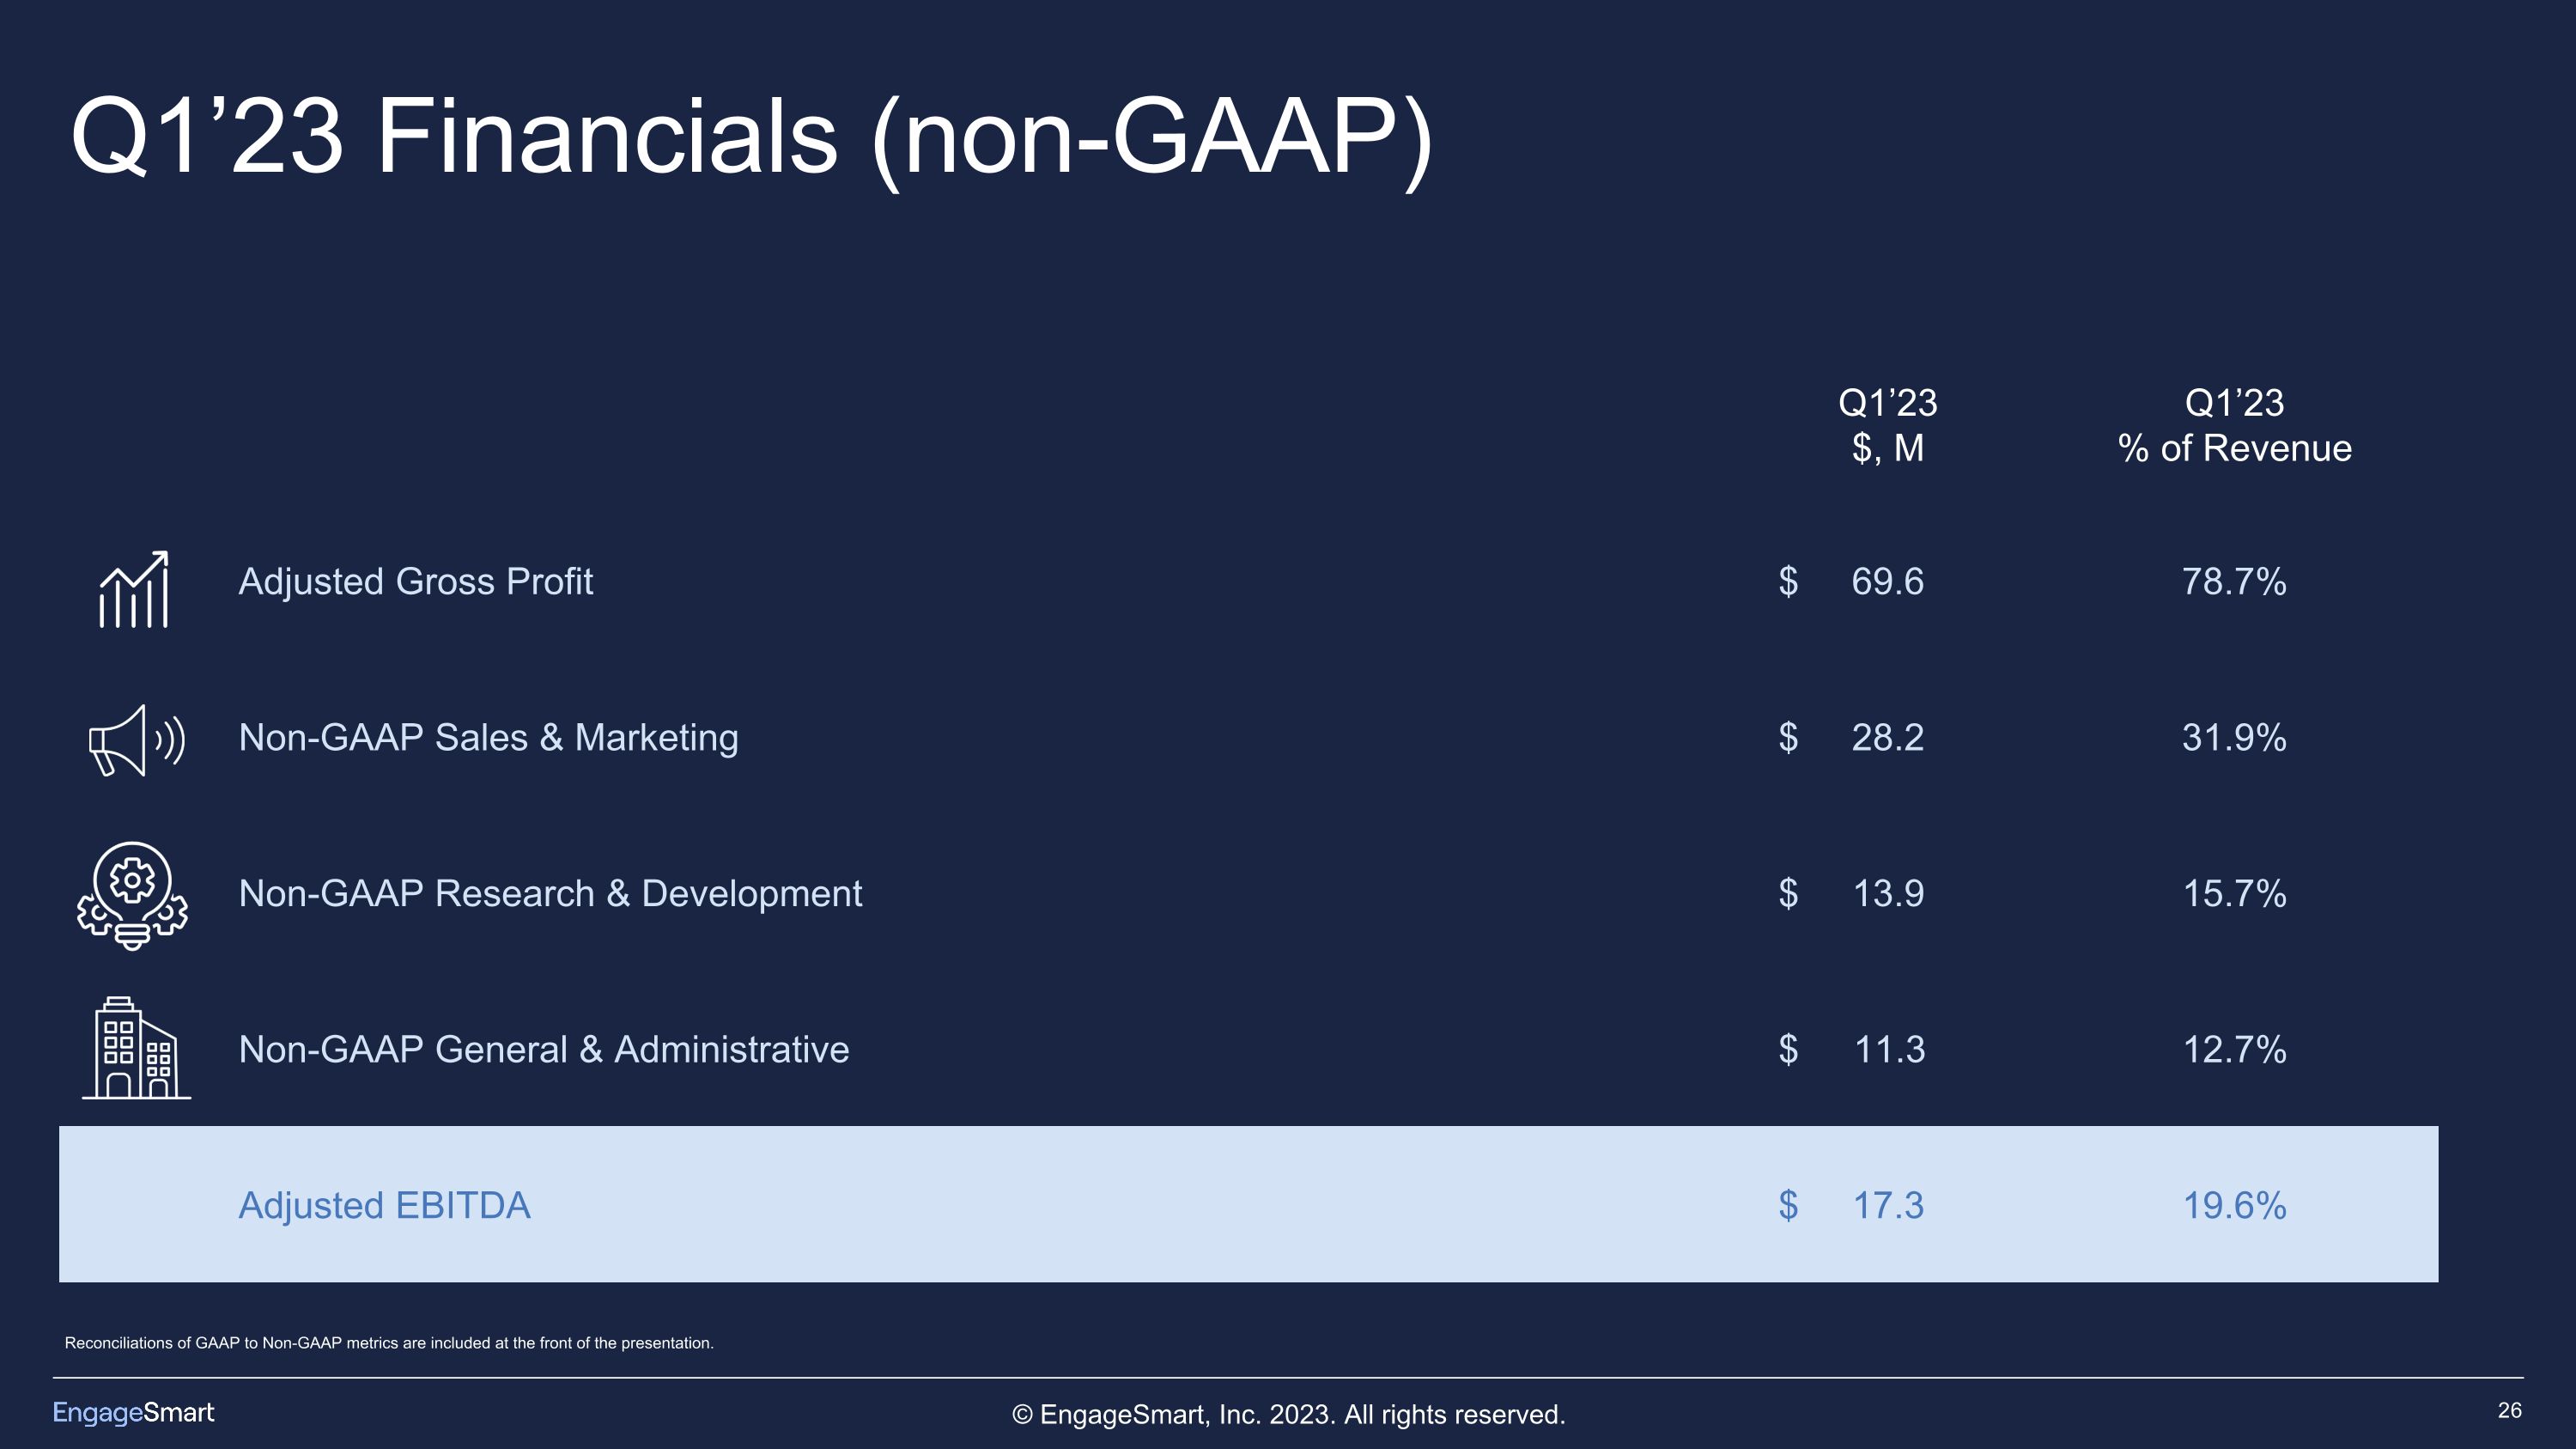
Reconciliations of GAAP to Non-GAAP metrics are included at the front of the presentation. Q1’23 $, M Q1’23 % of Revenue Adjusted Gross Profit $ 69.6 78.7% Non-GAAP Sales & Marketing $ 28.2 31.9% Non-GAAP Research & Development $ 13.9 15.7% Non-GAAP General & Administrative $ 11.3 12.7% Adjusted EBITDA $ 17.3 19.6% Q1’23 Financials (non-GAAP)
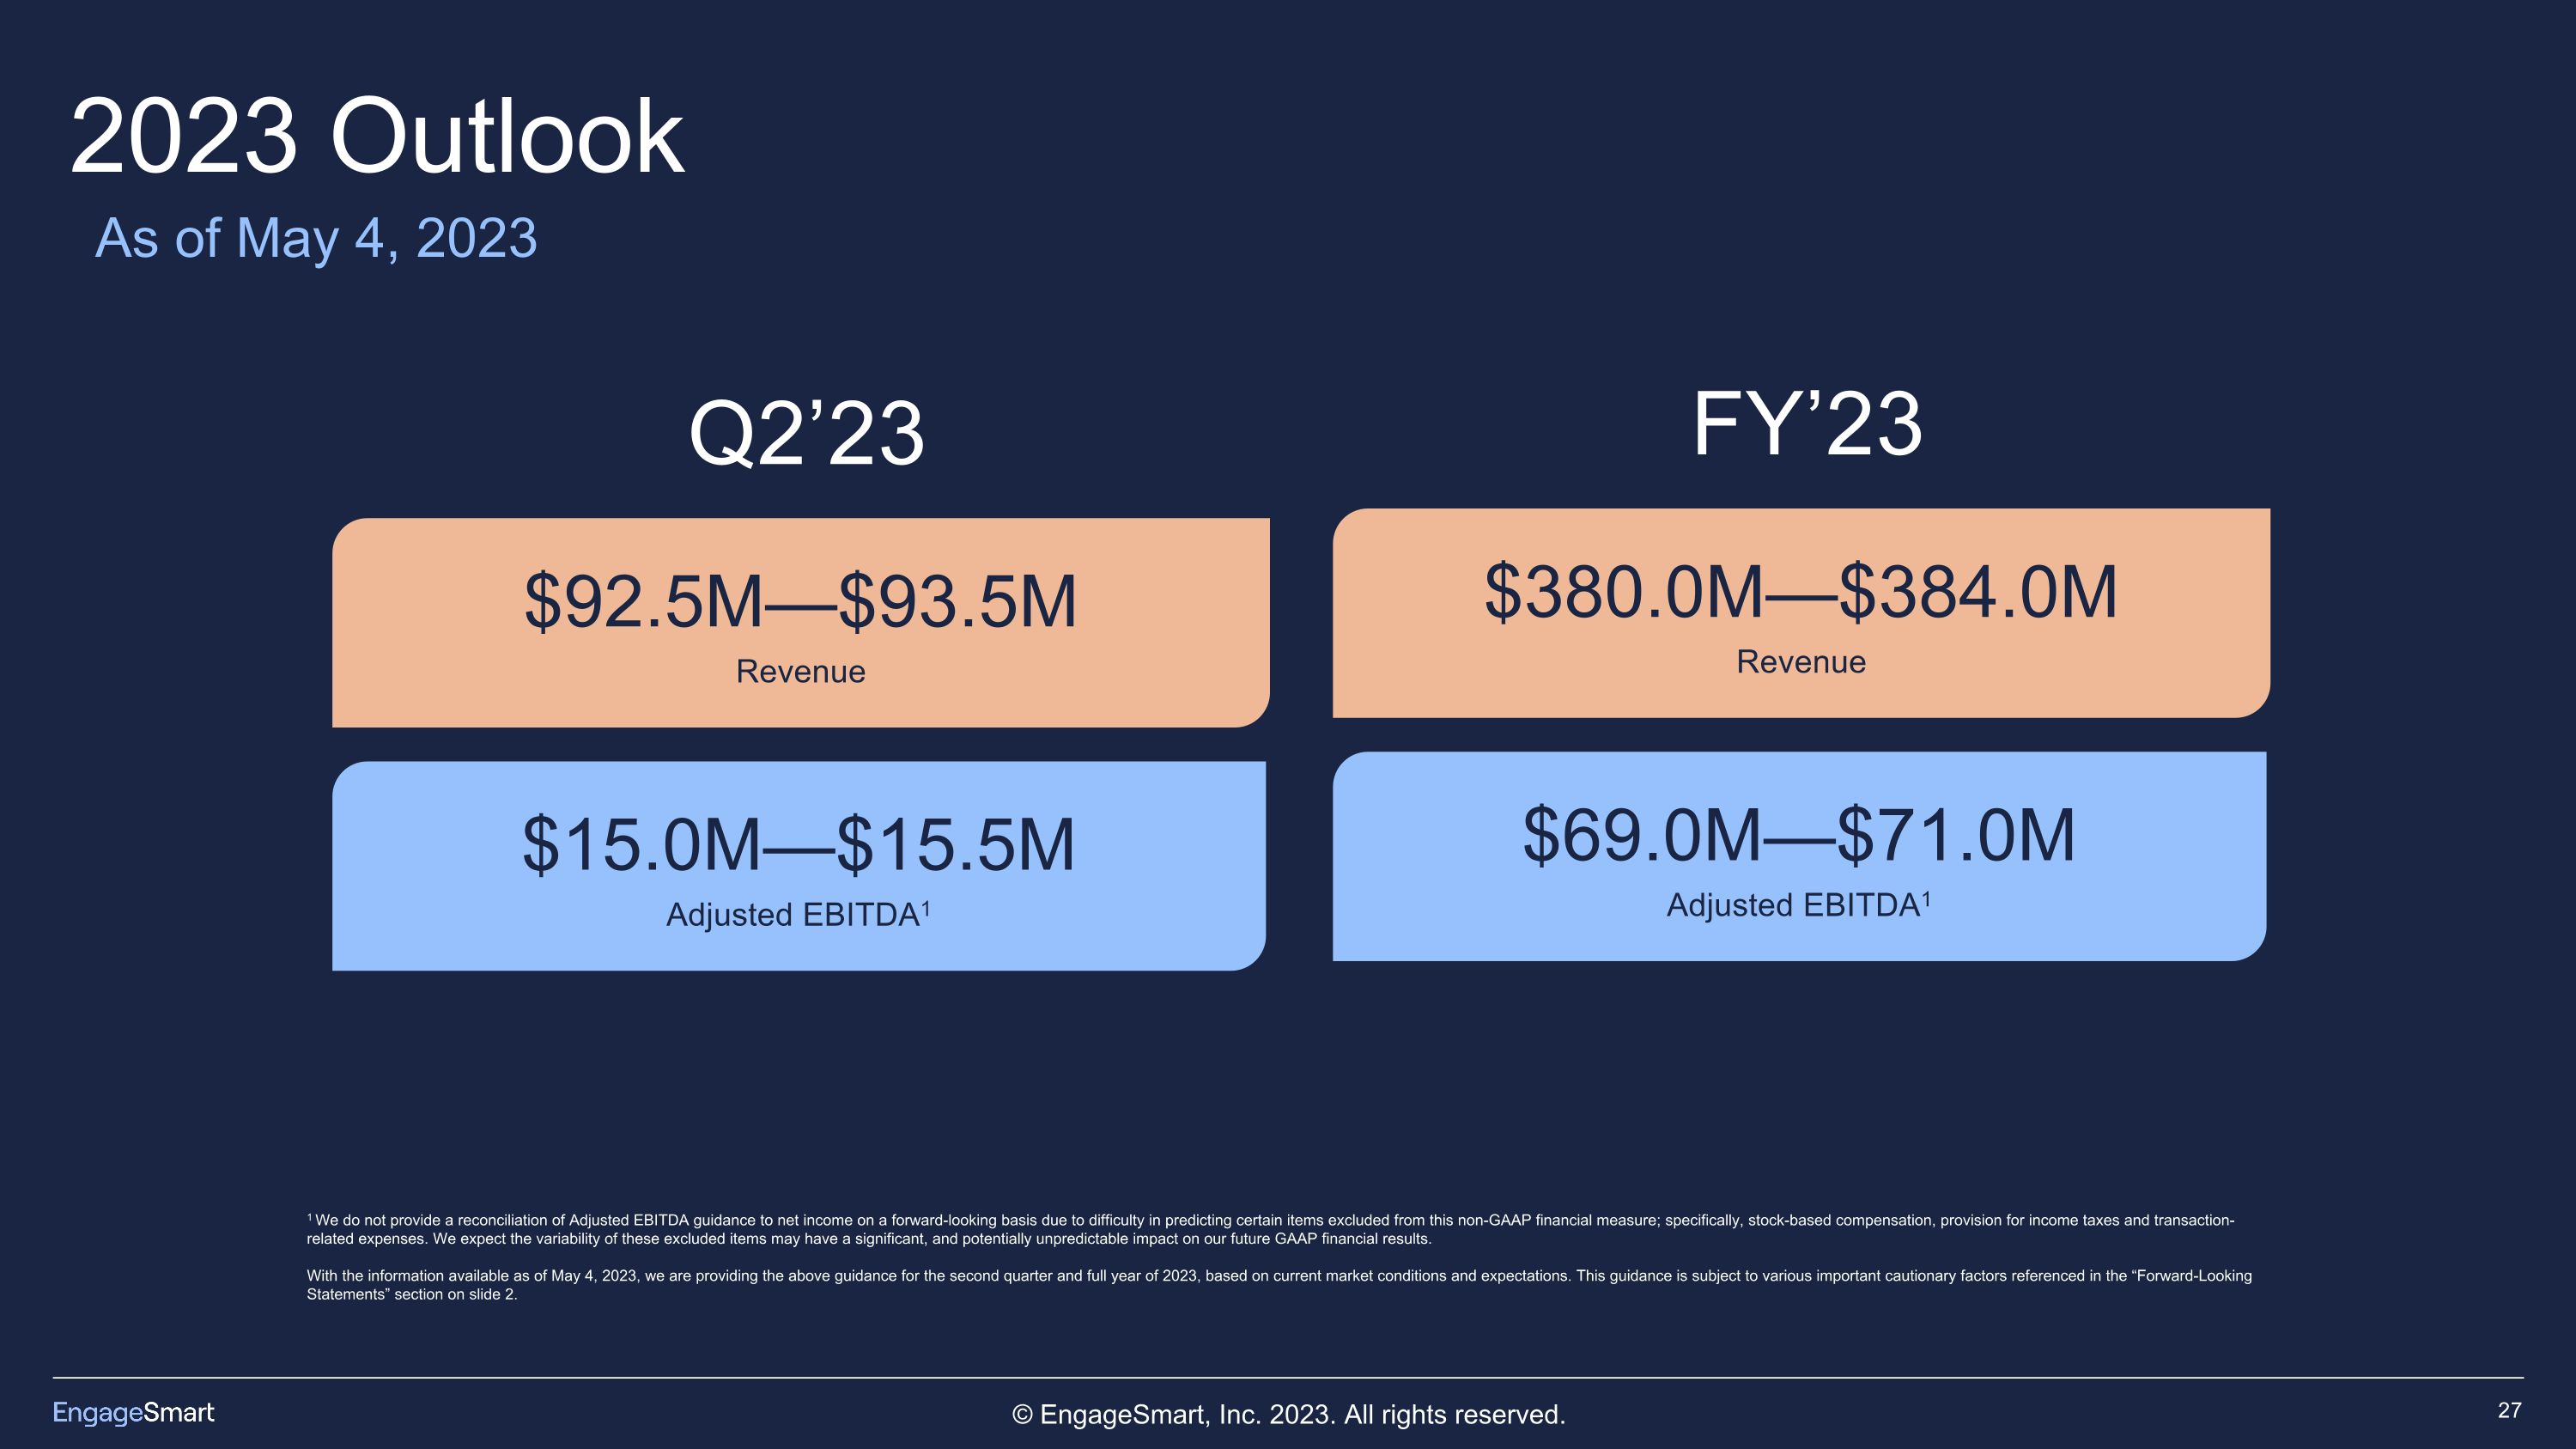
2023 Outlook $380.0M—$384.0M Revenue FY’23 $69.0M—$71.0M Adjusted EBITDA1 1 We do not provide a reconciliation of Adjusted EBITDA guidance to net income on a forward-looking basis due to difficulty in predicting certain items excluded from this non-GAAP financial measure; specifically, stock-based compensation, provision for income taxes and transaction-related expenses. We expect the variability of these excluded items may have a significant, and potentially unpredictable impact on our future GAAP financial results. With the information available as of May 4, 2023, we are providing the above guidance for the second quarter and full year of 2023, based on current market conditions and expectations. This guidance is subject to various important cautionary factors referenced in the “Forward-Looking Statements” section on slide 2. As of May 4, 2023 $92.5M—$93.5M Revenue Q2’23 $15.0M—$15.5M Adjusted EBITDA1


