Lind Capital Partners Municipal Credit Income Fund
Filed: 9 Apr 24, 4:53pm
united states
securities and exchange commission
washington, d.c. 20549
form n-csr
certified shareholder report of registered management
investment companies
Investment Company Act file number 811-23711
Lind Capital Partners Municipal Credit Income Fund
(Exact name of registrant as specified in charter)
500 Davis Center Suite 1004 Evanston, IL 60201
(Address of principal executive offices) (Zip code)
Karen Jacoppo-Wood, Ultimus Fund Solutions, LLC.
225 Pictoria Drive Suite 450, Cincinnati, OH 45246
(Name and address of agent for service)
Registrant's telephone number, including area code: 513-577-1693
Date of fiscal year end: 1/31
Date of reporting period: 1/31/24
Item 1. Reports to Stockholders.
 |
| LIND CAPITAL PARTNERS MUNICIPAL CREDIT INCOME FUND |
| (Symbol: LCPMX) |
| Annual Report |
| January 31, 2024 |
| 1-833-615-3031 |
| www.LCPMX.com |
| Distributed by Ultimus Fund Distributors, LLC |
| Member FINRA |
Portfolio Management Discussion & Analysis (Unaudited)
To the casual observer, the 12-month period ending January 31, 2024, may have appeared to be a stable, mundane period in the high yield municipal market. The Bloomberg Barclay’s Municipal High Yield Index (“the Index”) posted a respectable +4.08% return. However, this would ignore the seesaw path the market followed getting there. Throughout the year, the municipal market largely tracked the path of the U.S. Treasury market. Investors were fixated on the Federal Reserve’s war on inflation and predicting the probability that the Fed could successfully maneuver a “soft landing,” by cooling inflation and avoiding tipping the U.S. economy into a severe recession. For most of the year, persistent inflation seemed to convince investors that rates would be “higher for longer.” With intermittent bouts of volatility, the U.S. Treasury rates steadily marched higher, and the 10-year U.S. Treasury yield approached 5.0% by mid-October. Commensurately, the Index was down (5.8%) through the end of October. However, as the Fed signaled an end to its rate hiking cycle, investor sentiment seemingly turned on a dime during the last two months of the year, fueling a rally across equity and fixed income asset classes. The 10-year U.S. Treasury yield ended the calendar year at 3.87%, and the Index posted a historic two-month return of +10.99% during November and December. For reference, the S&P 500 was also up +12.55% over the same period. The torrid performance of the high yield municipal market came to a halt in January 2024 and the Index returned (0.46%) for the month, despite a historically supportive environment of low new issue supply and heavy coupon and principal reinvestment.
Over the last twelve months, the municipal market has been tethered to U.S. Treasury volatility due to the lack of direction from underlying market fundamentals. On the demand side, retail investors continued to lack conviction, perhaps kept on the sidelines by attractive short-term money market rates. For the calendar year 2023, all municipal funds and ETFs experienced over $27 billion of outflows, piling on to 2022 losses. High yield municipal funds experienced modest inflows of $1.1 billion, a long way from recouping over $20 billion hemorrhaged in the prior year. As the page turned to 2024, municipal investors have shown a glimmer of confidence, returning $3.6 billion of inflows to municipal mutual funds and ETFs during January, which includes $1.9 billion into high yield municipal funds. Tepid demand was balanced by muted new-issue supply. For much of the year, primary issuance lagged prior year by 15-20%, providing a natural support level for the market. Borrowers continued to postpone bond issuance due to uncertainty in the capital markets and high financing costs. However, the normal fourth quarter seasonality combined with renewed confidence in rate stability sparked a flurry of issuance. By the end of calendar year 2023, new issue volume exceeded prior year by 8%. As normally expected for the month of January, the first month of 2024 has seen limited new issue supply. However, we would not be surprised if underwriters’ calendars begin to build in the first few months of the year.
1
Portfolio Management Discussion & Analysis (Continued) (Unaudited)
For the 12-months ending January 31, 2024, the Fund outperformed the Index, with a total return of +4.22% versus +4.08%. The following factors contributed positively to Fund performance throughout the year:
| ● | Individual credit selection outperformance, with several individual holdings posting +10-20% total return over the period. |
| ● | Outperformance in the Economic Development, Senior Living, and Charter School sectors. |
| ● | In aggregate, high coupon income more than offset modest price declines. |
| ● | Strong relative outperformance vs. the Index during the January correction. |
For the 12-months ending January 31, 2024 detractors from performance included:
| ● | Tax-loss harvesting on select holdings created realized losses. |
| ● | Divestiture of underperforming Higher Education credit, avoiding heightened default risk. |
| ● | The Fund’s strategy to intentionally underweight “bellwether” credits such as Puerto Rico and Tobacco Securitization bonds caused underperformance relative to the Index during the market rally in November and December 2023. |
| ● | Several individual credits underperformed due to market illiquidity and lack of price discovery. However, we believe the pricing does not represent underlying credit strength and we maintain favorable views on long-term price recovery. |
Effects of derivatives and leverage on Fund performance:
| ● | None. The Fund intentionally does not utilize derivatives or leverage. |
Throughout the 12-month period, there was no material change to the Fund’s investment strategy. Within our target sectors, we continued to manage underlying credit risks through modest allocation shifts and focus on individual credit selection. For example, we continued to reduce portfolio exposure to Senior Living borrowers that are heavily exposed to Skilled Nursing and Assisted Living services. Labor market challenges continue to pressure operators who rely on these higher acuity levels of care. We have shifted exposure toward Senior Living borrowers who focus more on independent living services and are impacted less by nursing labor challenges. Our research team has spent significant time over the past twelve months focusing on our Higher Education sector exposure. Secular headwinds present challenges for certain colleges and universities, particularly small private liberal arts colleges with declining enrollment trends. Individual credit selection is critical and, as such, we made a strategic divestiture of a struggling Higher Education holding to avoid heightened default risk. However, we also strongly believe that there are opportunities to identify quality borrowers at discounted prices amidst headline risks surrounding the sector. To that end, the overall portfolio allocation to Higher Education increased modestly over the last twelve months.
2
Portfolio Management Discussion & Analysis (Continued) (Unaudited)
The current rate environment also presented an attractive opportunity to harvest tax losses. We engaged in several sale transactions to realize losses for the Fund. These losses will be carried forward to offset any realized gains in future years. Importantly, these tax loss sales also freed up additional capital to participate in higher yielding opportunities. By “swapping” into credits of similar quality, we were able to increase the book yield of the Fund without taking on additional credit risk.
Given our constructive view on fundamental credit and the continued availability of historically attractive rates, we believe it is an extremely attractive time to be investing in the high yield municipal market. Over the past twelve months, the weighted-average yield-to-worst on all portfolio purchases was 7.04%. We continue to see ample opportunity to purchase quality, undervalued credits within our target sectors. We are particularly interested to see how the supply and demand fundamentals shift in the coming year. On one hand, retail investors could return to the market en masse and provide strong support for the market. However, borrowers may also continue to gain confidence in the capital markets and drive a resurgence of new-issue supply, which would present a true test to investor appetite. With the Fund available to Registered Investment Advisors on both the Fidelity and Schwab custodial platforms, we have seen increased interest and allocations to the strategy and expect the Fund to continue to benefit from increased demand. With those factors in mind, we believe the historically attractive opportunity will persist in the high yield municipal market and the Fund is well situated to capitalize on the opportunity.
3
Portfolio Management Discussion & Analysis (Continued) (Unaudited)
Consider the investment objectives, risks, and charges and expenses of the fund carefully before investing. The prospectus contains this and other information about the fund and may be obtained by calling 888-615-3031. The prospectus should be read carefully before investing. The fund is distributed by Ultimus Fund Distributors, LLC. Lind Capital Partners and Ultimus Fund Distributors, LLC are not affiliated.
Important Risk Information
Performance data quoted represents past performance. Past performance does not guarantee future results. The investment return and principal value of an investment will fluctuate so that an investor’s shares, when redeemed, may be worth more or less than their original cost. Current performance may be lower or higher than the performance data quoted. For performance current to the most recent month end, please call 888-615-3031.
Investment involves risk, including loss of principal. There is no guarantee that the fund will achieve its investment objectives.
An investment in the fund is appropriate for investors who can bear the risks associated with the limited liquidity of the fund’s shares and should be viewed as a long-term investment. Investors will not be able to redeem shares daily because the fund is a closed-end fund operating as an interval fund. The fund’s shares are not traded on an active market and there is currently no secondary market for the shares, nor does the fund expect a secondary market in the shares to develop.
Fixed income investments are affected by a number of risks, including fluctuation in interest rates, credit risk, and prepayment risk. In general, as prevailing interest rates rise, fixed income prices will fall. Credit risk is the risk that issuers and counter parties will not make payments on securities and other investments held by the fund, resulting in losses to the fund. Generally, the longer the maturity and the lower the credit quality of a security, the more sensitive it is to credit risk. The fund invests in high yield securities, also known as “high yield” or “junk bonds.” High yield securities provide greater income and opportunity for gain but entail greater risk of loss of principal.
The fund is subject to municipal bond risk, which is the risk that the fund may be affected significantly by the economic, regulatory or political developments affecting the ability of obligors of municipal bonds to pay interest or repay principal. While the fund intends to invest in municipal bond free from federal income tax, income from municipal bonds held by the fund could be declared taxable because of, among other things, unfavorable changes in tax laws, adverse interpretations by the Internal Revenue Service or state tax authorities, or noncompliant conduct of a bond issuer or other obligated party. Investments in taxable municipal bonds and certain derivatives utilized by the fund may cause the fund to have taxable investment income.
There is a risk that a particular investment may be difficult to purchase or sell and that the fund may be unable to sell illiquid investments at an advantageous time or price or achieve its desired level of exposure to a certain sector. Illiquid securities may trade at a discount from comparable, more liquid investments. The fund is non-diversified, which means it may be invested in a limited number of issuers and susceptible to any economic, political and regulatory events than a more diversified fund. The fund is newly organized and has no operating or trading history.
Glossary of Terms:
Yield to Worst: A measure of the lowest possible yield that can be received on a bond without defaulting, taking into consideration contractual call provisions.
17924178-UFD-02232024
4
Lind Capital Partners Municipal Credit Income Fund
PORTFOLIO REVIEW (Unaudited)
January 31, 2024
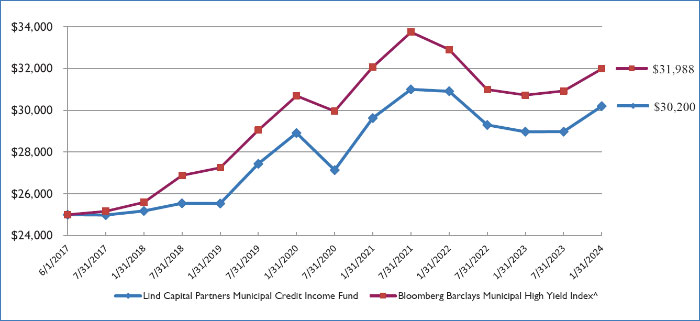
The Fund’s performance figures(*) for the periods ended January 31, 2024, compared to its benchmark:
| Annualized | |||
| 1 Year** | 5 Year** | Since Inception** | |
| Lind Capital Partners Municipal Credit Income Fund | 4.22% | 3.41% | 2.91% |
| Bloomberg Barclays Municipal High Yield Index^ | 4.08% | 3.26% | 3.81% |
| * | The performance data quoted here represents past performance. The performance comparison includes reinvestment of all dividends and capital gain distributions. Total returns would have been lower had the Adviser not waived its fees or reimbursed other expenses. Current performance may be lower or higher than the performance data quoted above. Investment return and principal value will fluctuate, so that shares, when redeemed, may be worth more or less than their original cost. The returns shown do not reflect the deduction of taxes that a shareholder would pay on Fund distributions or on the redemptions of Fund shares. Past performance is no guarantee of future results. Per the fee table in the prospectus dated May 1, 2023 the Fund’s total annual operating expenses are 3.01%. For performance information current to the most recent month-end, please call toll-free 1-833-615-3031 or visit www.LCPMX.com. |
| ** | The Fund acquired all of the assets and liabilities of Backcountry Investment Partners 3 LP (the “Predecessor Fund”) in a tax free reorganization on February 2, 2022. In connection with this acquisition, shares of the Predecessor Fund were exchanged for shares of the Fund. The Fund’s investment objective, policies and guidelines are in all material respects, equivalent to the Predecessor Fund’s investment objectives, policies and guidelines. The Predecessor Fund commenced operations on June 1, 2017. Updated performance information will be available at no cost by calling 1-833-615-3031 or visiting the Fund’s website at www.LCPMX.com. |
| ^ | Bloomberg Barclays Municipal High Yield Index covers the USD-denominated long-term tax exempt bond market. The index has four main sectors: state and local general obligation bonds, revenue bonds, insured bonds and prerefunded bonds. You cannot invest directly in an index and unmanaged index returns do not reflect any fees, expenses or sales charges. |
Comparison of the Change in Value of a $25,000 Investment
| Portfolio Composition+ as of January 31, 2024: | ||||
| Municipal Bonds | ||||
| Wisconsin | 13.5 | % | ||
| New Jersey | 8.8 | % | ||
| Pennsylvania | 7.4 | % | ||
| Texas | 7.3 | % | ||
| Michigan | 6.3 | % | ||
| Indiana | 5.6 | % | ||
| Arizona | 5.6 | % | ||
| Florida | 4.9 | % | ||
| Vermont | 4.6 | % | ||
| Colorado | 3.8 | % | ||
| Other/Short-Term Investments | 32.2 | % | ||
| 100.0 | % | |||
+ Based on Total Net Assets as of January 31, 2024
Please refer to the Schedule of Investments in this report for a detailed listing of the Fund’s holdings.
5
| LIND CAPITAL PARTNERS MUNICIPAL CREDIT INCOME FUND |
| SCHEDULE OF INVESTMENTS |
| January 31, 2024 |
| Principal | Coupon Rate | |||||||||||
| Amount ($) | (%) | Maturity | Fair Value | |||||||||
| MUNICIPAL BONDS — 95.5% | ||||||||||||
| ALABAMA — 1.1% | ||||||||||||
| 250,000 | Pell City Square Cooperative District | 7.0000 | 04/01/44 | $ | 261,007 | |||||||
| ARIZONA — 5.6% | ||||||||||||
| 100,000 | Arizona Industrial Development Authority | 4.5000 | 07/15/29 | 93,860 | ||||||||
| 1,210,000 | Arizona Industrial Development Authority | 5.6250 | 10/01/49 | 1,002,906 | ||||||||
| 150,000 | Industrial Development Authority of the County of Pima | 5.7500 | 05/01/50 | 146,024 | ||||||||
| 100,000 | Industrial Development Authority of the County of Pima | 6.8750 | 11/15/52 | 102,736 | ||||||||
| 1,345,526 | ||||||||||||
| COLORADO — 3.8% | ||||||||||||
| 750,000 | Colorado Health Facilities Authority | 8.0000 | 08/01/43 | 745,609 | ||||||||
| 165,000 | Fiddlers Business Improvement District | 5.5500 | 12/01/47 | 168,210 | ||||||||
| 913,819 | ||||||||||||
| FLORIDA — 4.9% | ||||||||||||
| 340,000 | Capital Trust Agency, Inc. | 6.0000 | 07/01/42 | 268,709 | ||||||||
| 200,000 | Capital Trust Agency, Inc. | 5.0000 | 12/15/50 | 171,616 | ||||||||
| 600,000 | Capital Trust Agency, Inc. | 6.3750 | 05/01/53 | 607,233 | ||||||||
| 93,212 | Collier County Industrial Development Authority | 8.2500 | 05/15/49 | 2,983 | ||||||||
| 405,000 | Highlands County Health Facilities Authority(a) | 6.0000 | 04/01/38 | 117,450 | ||||||||
| 1,167,991 | ||||||||||||
| GEORGIA — 2.1% | ||||||||||||
| 700,000 | Fulton County Residential Care Facilities for the | 4.0000 | 04/01/56 | 495,364 | ||||||||
| ILLINOIS — 2.8% | ||||||||||||
| 100,000 | City of Evanston IL | 4.3750 | 04/01/41 | 76,066 | ||||||||
| 150,000 | City of Evanston IL | 4.6250 | 04/01/51 | 107,439 | ||||||||
| 150,000 | Illinois Finance Authority | 5.0000 | 05/15/41 | 130,340 | ||||||||
| 400,000 | Illinois Finance Authority | 5.0000 | 05/15/51 | 323,768 | ||||||||
| 637,613 | ||||||||||||
| INDIANA — 5.6% | ||||||||||||
| 1,530,000 | City of Anderson IN | 6.0000 | 10/01/42 | 1,351,096 | ||||||||
| IOWA — 1.1% | ||||||||||||
| 290,000 | Iowa Higher Education Loan Authority | 5.5000 | 11/01/51 | 264,312 | ||||||||
See accompanying notes which are an integral part of these financial statements.
6
| LIND CAPITAL PARTNERS MUNICIPAL CREDIT INCOME FUND |
| SCHEDULE OF INVESTMENTS (Continued) |
| January 31, 2024 |
| Principal | Coupon Rate | |||||||||||
| Amount ($) | (%) | Maturity | Fair Value | |||||||||
| MUNICIPAL BONDS — 95.5% (Continued) | ||||||||||||
| KENTUCKY — 3.3% | ||||||||||||
| 425,000 | Kentucky Economic Development Finance Authority | 5.5000 | 11/15/27 | $ | 398,171 | |||||||
| 335,000 | Kentucky Economic Development Finance Authority | 6.0000 | 11/15/36 | 284,540 | ||||||||
| 115,000 | Kentucky Economic Development Finance Authority | 6.2500 | 11/15/46 | 90,158 | ||||||||
| 772,869 | ||||||||||||
| LOUISIANA — 0.7% | ||||||||||||
| 200,000 | Louisiana Public Facilities Authority | 5.2500 | 06/01/51 | 166,665 | ||||||||
| MICHIGAN — 6.3% | ||||||||||||
| 725,000 | Grand Rapids Economic Development Corporation | 5.5000 | 04/01/39 | 569,454 | ||||||||
| 435,000 | Grand Rapids Economic Development Corporation | 5.7500 | 04/01/49 | 320,002 | ||||||||
| 400,000 | Michigan Finance Authority | 5.0000 | 05/01/36 | 357,926 | ||||||||
| 300,000 | Michigan Finance Authority | 5.0000 | 05/01/46 | 237,339 | ||||||||
| 1,484,721 | ||||||||||||
| MINNESOTA — 1.2% | ||||||||||||
| 330,000 | City of Blaine MN | 6.1250 | 07/01/45 | 214,500 | ||||||||
| 125,000 | City of Blaine MN | 6.1250 | 07/01/50 | 81,250 | ||||||||
| 295,750 | ||||||||||||
| MONTANA — 0.3% | ||||||||||||
| 100,000 | County of Gallatin MT | 4.0000 | 10/15/51 | 75,045 | ||||||||
| NEBRASKA — 2.7% | ||||||||||||
| 625,000 | Douglas County Sanitary & Improvement District No | 7.1250 | 10/15/43 | 625,685 | ||||||||
| NEW HAMPSHIRE — 0.5% | ||||||||||||
| 50,000 | New Hampshire Business Finance Authority | 5.6250 | 07/01/46 | 45,694 | ||||||||
| 85,000 | New Hampshire Business Finance Authority | 5.7500 | 07/01/54 | 77,108 | ||||||||
| 122,802 | ||||||||||||
| NEW JERSEY — 8.8% | ||||||||||||
| 2,715,000 | Middlesex County Improvement Authority(a) | 5.0000 | 01/01/32 | 1,729,455 | ||||||||
| 425,000 | New Jersey Economic Development Authority | 5.7500 | 07/01/47 | 353,633 | ||||||||
| 2,083,088 | ||||||||||||
| NEW YORK — 1.0% | ||||||||||||
| 300,000 | Ulster County Capital Resource Corporation | 5.2500 | 09/15/42 | 236,615 | ||||||||
See accompanying notes which are an integral part of these financial statements.
7
| LIND CAPITAL PARTNERS MUNICIPAL CREDIT INCOME FUND |
| SCHEDULE OF INVESTMENTS (Continued) |
| January 31, 2024 |
| Principal | Coupon Rate | |||||||||||
| Amount ($) | (%) | Maturity | Fair Value | |||||||||
| MUNICIPAL BONDS — 95.5% (Continued) | ||||||||||||
| OHIO — 2.9% | ||||||||||||
| 150,000 | County of Hardin OH | 5.5000 | 05/01/50 | $ | 137,911 | |||||||
| 225,000 | County of Montgomery OH(a) | 6.2500 | 04/01/49 | 65,250 | ||||||||
| 200,000 | County of Washington OH | 6.7500 | 12/01/52 | 212,611 | ||||||||
| 250,000 | Ohio Housing Finance Agency | 6.2500 | 03/01/26 | 252,658 | ||||||||
| 668,430 | ||||||||||||
| OKLAHOMA — 1.8% | ||||||||||||
| 440,000 | Oklahoma County Finance Authority | 6.1250 | 07/01/48 | 433,129 | ||||||||
| PENNSYLVANIA — 7.4% | ||||||||||||
| 375,000 | Lehigh County General Purpose Authority | 7.0000 | 06/01/53 | 392,724 | ||||||||
| 150,000 | Philadelphia Authority for Industrial Development | 5.6250 | 08/01/36 | 153,340 | ||||||||
| 250,000 | Philadelphia Authority for Industrial Development | 6.3750 | 06/01/40 | 250,082 | ||||||||
| 950,000 | Philadelphia Authority for Industrial Development | 6.5000 | 06/01/45 | 950,248 | ||||||||
| 1,746,394 | ||||||||||||
| PUERTO RICO — 0.0%(b) | ||||||||||||
| 6,000 | Puerto Rico Sales Tax Financing Corp Sales Tax | 4.5360 | 07/01/53 | 5,694 | ||||||||
| SOUTH CAROLINA — 2.4% | ||||||||||||
| 50,000 | South Carolina Jobs-Economic Development Authority | 5.0000 | 11/01/42 | 47,379 | ||||||||
| 500,000 | South Carolina Jobs-Economic Development Authority | 7.7500 | 11/15/58 | 518,996 | ||||||||
| 566,375 | ||||||||||||
| TENNESSEE — 1.2% | ||||||||||||
| 265,000 | Shelby County Health Educational & Housing | 5.5000 | 10/01/39 | 208,583 | ||||||||
| 100,000 | Shelby County Health Educational & Housing | 5.7500 | 10/01/54 | 71,052 | ||||||||
| 279,635 | ||||||||||||
| TEXAS — 7.3% | ||||||||||||
| 40,000 | Arlington Higher Education Finance Corporation | 6.3750 | 02/15/52 | 37,269 | ||||||||
| 35,000 | New Hope Cultural Education Facilities Finance | 5.7500 | 07/15/52 | 33,039 | ||||||||
| 170,000 | Newark Higher Education Finance Corporation | 5.7500 | 08/15/45 | 173,133 | ||||||||
| 800,000 | Port Beaumont Navigation District | 8.0000 | 02/01/39 | 775,633 | ||||||||
| 140,000 | San Antonio Education Facilities Corporation | 5.0000 | 10/01/31 | 132,557 | ||||||||
| 215,000 | San Antonio Education Facilities Corporation | 5.0000 | 10/01/41 | 179,216 | ||||||||
| 475,000 | San Antonio Education Facilities Corporation | 5.0000 | 10/01/51 | 368,508 | ||||||||
| 1,699,355 | ||||||||||||
See accompanying notes which are an integral part of these financial statements.
8
| LIND CAPITAL PARTNERS MUNICIPAL CREDIT INCOME FUND |
| SCHEDULE OF INVESTMENTS (Continued) |
| January 31, 2024 |
| Principal | Coupon Rate | |||||||||||
| Amount ($) | (%) | Maturity | Fair Value | |||||||||
| MUNICIPAL BONDS — 95.5% (Continued) | ||||||||||||
| UTAH — 1.0% | ||||||||||||
| 235,000 | Utah Infrastructure Agency | 5.0000 | 10/15/46 | $ | 235,171 | |||||||
| VERMONT — 4.6% | ||||||||||||
| 775,000 | East Central Vermont Telecommunications District | 6.1250 | 12/01/40 | 776,964 | ||||||||
| 175,000 | East Central Vermont Telecommunications District | 5.6000 | 12/01/43 | 165,697 | ||||||||
| 120,000 | East Central Vermont Telecommunications District | 6.8750 | 12/01/46 | 126,322 | ||||||||
| 1,068,983 | ||||||||||||
| VIRGINIA — 1.6% | ||||||||||||
| 55,000 | James City County Economic Development Authority | 6.8750 | 12/01/58 | 59,078 | ||||||||
| 175,000 | Peninsula Town Center Community Development | 5.0000 | 09/01/45 | 167,443 | ||||||||
| 120,000 | Virginia Beach Development Authority | 7.0000 | 09/01/53 | 130,248 | ||||||||
| 356,769 | ||||||||||||
| WISCONSIN — 13.5% | ||||||||||||
| 100,000 | Public Finance Authority | 4.6500 | 12/01/35 | 83,714 | ||||||||
| 325,000 | Public Finance Authority | 5.0000 | 04/01/47 | 278,070 | ||||||||
| 515,254 | Public Finance Authority | 5.7500 | 12/01/48 | 429,402 | ||||||||
| 300,000 | Public Finance Authority | 7.5000 | 12/01/52 | 305,958 | ||||||||
| 100,000 | Public Finance Authority | 6.8750 | 07/01/53 | 102,882 | ||||||||
| 610,000 | Public Finance Authority | 5.7500 | 05/01/54 | 498,356 | ||||||||
| 675,000 | Public Finance Authority | 5.0000 | 01/01/55 | 535,526 | ||||||||
| 500,000 | Public Finance Authority | 5.0000 | 04/01/57 | 408,202 | ||||||||
| 250,000 | Wisconsin Health & Educational Facilities | 5.0000 | 08/01/37 | 200,240 | ||||||||
| 225,000 | Wisconsin Health & Educational Facilities | 7.0000 | 07/01/43 | 169,472 | ||||||||
| 225,000 | Wisconsin Health & Educational Facilities | 5.0000 | 07/01/53 | 163,966 | ||||||||
| 3,175,788 | ||||||||||||
| TOTAL MUNICIPAL BONDS (Cost $23,705,788) | 22,535,691 | |||||||||||
See accompanying notes which are an integral part of these financial statements.
9
| LIND CAPITAL PARTNERS MUNICIPAL CREDIT INCOME FUND |
| SCHEDULE OF INVESTMENTS (Continued) |
| January 31, 2024 |
| Shares | Fair Value | |||||||
| SHORT-TERM INVESTMENTS — 1.7% | ||||||||
| MONEY MARKET FUNDS - 1.7% | ||||||||
| 401,780 | Federated Institutional Tax-Free Cash Trust, 4.25% (Cost $401,780)(c) | $ | 401,780 | |||||
| TOTAL INVESTMENTS - 97.2% (Cost $24,107,568) | $ | 22,937,471 | ||||||
| OTHER ASSETS IN EXCESS OF LIABILITIES- 2.8% | 655,702 | |||||||
| NET ASSETS - 100.0% | $ | 23,593,173 | ||||||
| (a) | Bonds in default. |
| (b) | Percentage rounds to less than 0.1%. |
| (c) | Rate disclosed is the seven day effective yield as of January 31, 2024. |
See accompanying notes which are an integral part of these financial statements.
10
| Lind Capital Partners Municipal Credit Income Fund |
| STATEMENT OF ASSETS AND LIABILITIES |
| January 31, 2024 |
| ASSETS | ||||
| Investment securities: | ||||
| At cost | $ | 24,107,568 | ||
| At fair value | $ | 22,937,471 | ||
| Interest receivable | 709,718 | |||
| Receivable for Fund shares sold | 9,467 | |||
| Due from Adviser | 19,869 | |||
| Prepaid expenses | 17,584 | |||
| TOTAL ASSETS | 23,694,109 | |||
| LIABILITIES | ||||
| Distribution payable | 31,187 | |||
| Payable to related parties | 33,307 | |||
| Other accrued expenses | 36,442 | |||
| TOTAL LIABILITIES | 100,936 | |||
| NET ASSETS | $ | 23,593,173 | ||
| Net Assets Consist Of: | ||||
| Paid in capital | $ | 25,238,574 | ||
| Accumulated deficit | (1,645,401 | ) | ||
| NET ASSETS | $ | 23,593,173 | ||
| Net Asset Value Per Share: | ||||
| Shares: | ||||
| Net Assets | $ | 23,593,173 | ||
| Shares of beneficial interest outstanding ($0 par value. unlimited shares authorized) | 2,690,294 | |||
| Net asset value (Net Assets ÷ Shares Outstanding), offering price and redemption price per share | $ | 8.77 |
See accompanying notes which are an integral part of these financial statements.
11
| Lind Capital Partners Municipal Credit Income Fund |
| STATEMENT OF OPERATIONS |
| For the Year Ended January 31, 2024 |
| INVESTMENT INCOME | ||||
| Interest | $ | 1,560,902 | ||
| TOTAL INVESTMENT INCOME | 1,560,902 | |||
| EXPENSES | ||||
| Investment advisory fees | 197,978 | |||
| Administrative services fees | 121,498 | |||
| Transfer agent fees | 63,206 | |||
| Chief compliance officer fees | 43,484 | |||
| Legal fees | 32,796 | |||
| Trustees fees and expenses | 30,478 | |||
| Audit fees | 22,986 | |||
| Printing | 13,476 | |||
| Registration fees | 11,709 | |||
| Custodian fees | 5,000 | |||
| Insurance expense | 2,755 | |||
| Other expenses | 4,406 | |||
| TOTAL EXPENSES | 549,772 | |||
| Less: Fees waived/reimbursed by the Adviser | (302,063 | ) | ||
| NET EXPENSES | 247,709 | |||
| NET INVESTMENT INCOME | 1,313,193 | |||
| REALIZED AND UNREALIZED GAIN (LOSS) FROM INVESTMENTS | ||||
| Net realized loss from investments | (398,063 | ) | ||
| Net change in unrealized appreciation on investments | 77,423 | |||
| NET REALIZED AND UNREALIZED LOSS FROM INVESTMENTS | (320,640 | ) | ||
| NET INCREASE IN NET ASSETS RESULTING FROM OPERATIONS | $ | 992,553 |
See accompanying notes which are an integral part of these financial statements.
12
| Lind Capital Partners Municipal Credit Income Fund |
| STATEMENTS OF CHANGES IN NET ASSETS |
| Year Ended | Period Ended | |||||||
| January 31, 2024 | January 31, 2023 (a) | |||||||
| FROM OPERATIONS | ||||||||
| Net investment income | $ | 1,313,193 | $ | 767,270 | ||||
| Net realized loss from investments | (398,063 | ) | (154,839 | ) | ||||
| Net change in unrealized appreciation (depreciation) on investments | 77,423 | (1,903,409 | ) | |||||
| Net increase (decrease) in net assets resulting from operations | 992,553 | (1,290,978 | ) | |||||
| DISTRIBUTIONS TO SHAREHOLDERS | ||||||||
| Total distribution paid: | (1,284,017 | ) | (718,848 | ) | ||||
| Decrease in net assets from distributions to shareholders | (1,284,017 | ) | (718,848 | ) | ||||
| FROM SHARES OF BENEFICIAL INTEREST | ||||||||
| Proceeds from shares sold | 8,307,446 | 20,040,709 | ||||||
| Reinvestment of distributions to shareholders | 914,998 | 590,072 | ||||||
| Payments for shares redeemed | (1,564,793 | ) | (2,493,969 | ) | ||||
| Net increase in net assets from shares of beneficial interest | 7,657,651 | 18,136,812 | ||||||
| TOTAL INCREASE IN NET ASSETS | 7,366,187 | 16,126,986 | ||||||
| NET ASSETS | ||||||||
| Beginning of Period | 16,226,986 | 100,000 | ||||||
| End of Period | $ | 23,593,173 | $ | 16,226,986 | ||||
| SHARE ACTIVITY | ||||||||
| Shares Sold | 953,885 | 2,009,080 | ||||||
| Shares Reinvested | 105,155 | 65,281 | ||||||
| Shares Redeemed | (179,910 | ) | (273,197 | ) | ||||
| Net increase from share activity | 879,130 | 1,801,164 | ||||||
| (a) | Commencement of operations was February 2, 2022 |
See accompanying notes which are an integral part of these financial statements.
13
| Lind Capital Partners Municipal Credit Income Fund |
| FINANCIAL HIGHLIGHTS |
Per Share Data and Ratios for a Share of Beneficial Interest Outstanding Throughout the Year/Period Presented
| Year Ended | Period Ended | |||||||
| January 31, | January 31, | |||||||
| 2024 | 2023 (a) | |||||||
| Net asset value, beginning of year/period | $ | 8.96 | $ | 10.00 | ||||
| Activity from investment operations: | ||||||||
| Net investment income (b) | 0.58 | 0.41 | ||||||
| Net realized and unrealized loss on investments | (0.22 | ) | (1.06 | ) | ||||
| Total from investment operations | 0.36 | (0.65 | ) | |||||
| Less distributions from: | ||||||||
| Net investment income | (0.55 | ) | (0.38 | ) | ||||
| Net realized gains | — | (0.01 | ) | |||||
| Total distributions | (0.55 | ) | (0.39 | ) | ||||
| Net asset value, end of year/period | $ | 8.77 | $ | 8.96 | ||||
| Total return (c) | 4.22 | % | (6.51 | )% (d) | ||||
| Net assets, end of year/period (000s) | $ | 23,593 | $ | 16,227 | ||||
| Ratio of gross expenses to average net assets | 2.77 | % | 3.00 | % (e) | ||||
| Ratio of net expenses to average net assets | 1.25 | % | 1.25 | % (e) | ||||
| Ratio of net investment income to average net assets | 6.63 | % | 4.54 | % (e) | ||||
| Portfolio Turnover Rate | 10 | % | 30 | % (d) | ||||
| (a) | Lind Capital Partners Municipal Credit Income Fund Commencement of operations was February 2, 2022. |
| (b) | Per share amounts calculated using the average shares method, which more appropriately presents the per share data for the year/period. |
| (c) | Total return is calculated assuming a purchase of shares at net asset value on the first day and a sale at net asset value on the last day of the period. Distributions are assumed, for the purpose of this calculation, to be reinvested at the ex-dividend date net asset value per share on their respective payment dates. Had the Adviser not waived its fees and reimbursed expenses, total return would have been lower. |
| (d) | Not annualized. |
| (e) | Annualized. |
See accompanying notes which are an integral part of these financial statements.
14
Lind Capital Partners Municipal Credit Income Fund
NOTES TO FINANCIAL STATEMENTS
January 31, 2024
| 1. | ORGANIZATION |
Lind Capital Partners Municipal Credit Income Fund (the “Fund”) was organized as a Delaware statutory trust on May 13, 2021 and is registered under the Investment Company Act of 1940, as amended, (the “1940 Act”), as a non-diversified, closed-end management investment company that operates as an interval fund with a continuous offering of Fund shares. The investment objective of the Fund is to generate high current income from investments in municipal securities exempt from federal income tax and capital preservation. Additional return via capital appreciation is a secondary investment objective of the Fund.
| 2. | SUMMARY OF SIGNIFICANT ACCOUNTING POLICIES |
The following is a summary of significant accounting policies followed by the Fund in preparation of its financial statements. These policies are in conformity with accounting principles generally accepted in the United States of America (“GAAP”). The preparation of financial statements requires management to make estimates and assumptions that affect the reported amounts of assets and liabilities and disclosure of contingent assets and liabilities at the date of the financial statements and the reported amounts of increases and decreases in net assets from operations during the reporting period. Actual results could differ from those estimates. The Fund is an investment company and accordingly follows the investment company accounting and reporting guidance of the Financial Accounting Standards Board (FASB) Accounting Standard Codification Topic 946 “Financial Services – Investment Companies”.
Security Valuation – Pursuant to the valuation procedures approved by the Board of Trustees of the Trust (the “Board”) pursuant to Rule 2a-5 under the 1940 Act, the Trust relies on certain security pricing services to provide the current market value of securities. Securities listed on an exchange are valued at the last reported sale price at the close of the regular trading session of the primary exchange on the business day the value is being determined, or in the case of securities listed on NASDAQ at the NASDAQ Official Closing Price. In the absence of a sale such securities shall be valued at the mean between the current bid and ask prices on the day of valuation. Debt securities not traded on an exchange may be valued at prices supplied by a pricing agent(s) based on broker or dealer supplied valuations or matrix pricing, a method of valuing securities by reference to the value of other securities with similar characteristics, such as rating, interest rate and maturity. The independent pricing service does not distinguish between smaller-sized bond positions known as “odd lots” and larger institutional-sized bond positions known as “round lots”. The Funds may fair value a particular bond if the adviser does not believe that the round lot value provided by the independent pricing service reflects fair value of the Funds’ holding. Short-term debt obligations having 60 days or less remaining until maturity, at time of purchase, may be valued at amortized cost.
When the Fund uses fair valuation to determine the value of a portfolio security or other asset for purposes of calculating its net asset value (“NAV”), such investments will not be priced on the basis of quotes from the primary market in which they are traded, but rather may be priced by the valuation designee pursuant to Rule 2a-5. Fair valuation may require subjective determinations about the value of a security. Although the Fund’s policy is intended to result in a calculation of the Fund’s NAV that fairly reflects security values as of the time of pricing, the Fund cannot ensure that fair values determined by the Board or persons acting at its direction will accurately reflect the price that the Fund could obtain for a security if it were to dispose of that security as of the time of pricing (for instance, in a forced or distressed sale). The prices used by the Fund may differ from the value that would be realized if the securities were sold.
There is no single standard for determining fair value of a security. Rather, the valuation designee’s fair value calculations will involve significant professional judgment in the application of both observable and unobservable attributes, and as a result, the fair value determined for a security may differ from its actual realizable value or future fair value. As part of its due diligence, the Valuation Designee will attempt to obtain current information on an ongoing basis from market sources or issuers to value all fair valued securities.
The Fund utilizes various methods to measure the fair value of its investments on a recurring basis. GAAP establishes a hierarchy that prioritizes inputs to valuation methods. The three levels of input are:
Level 1 – Unadjusted quoted prices in active markets for identical assets and liabilities that the Fund has the ability to access.
15
Lind Capital Partners Municipal Credit Income Fund
NOTES TO FINANCIAL STATEMENTS (Continued)
January 31, 2024
Level 2 – Observable inputs other than quoted prices included in Level 1 that are observable for the asset or liability, either directly or indirectly. These inputs may include quoted prices for the identical instrument on an inactive market, prices for similar instruments, interest rates, prepayment speeds, credit risk, yield curves, default rates and similar data.
Level 3 – Unobservable inputs for the asset or liability, to the extent relevant observable inputs are not available, representing the Fund’s own assumptions about the assumptions a market participant would use in valuing the asset or liability, and would be based on the best information available.
The availability of observable inputs can vary from security to security and is affected by a wide variety of factors, including, for example, the type of security, whether the security is new and not yet established in the marketplace, the liquidity of markets, and other characteristics particular to the security. To the extent that valuation is based on models or inputs that are less observable or unobservable in the market, the determination of fair value requires more judgment. Accordingly, the degree of judgment exercised in determining fair value is greatest for instruments categorized in Level 3.
The inputs used to measure fair value may fall into different levels of the fair value hierarchy. In such cases, for disclosure purposes, the level in the fair value hierarchy within which the fair value measurement falls in its entirety, is determined based on the lowest level input that is significant to the fair value measurement in its entirety.
The inputs or methodology used for valuing securities are not necessarily an indication of the risk associated with investing in those securities. The following tables summarize the inputs used as of January 31, 2024 for the Fund’s assets measured at fair value:
| Assets* | Level I | Level 2 | Level 3 | Total | ||||||||||||
| Municipal Bonds | $ | — | $ | 22,535,691 | $ | — | $ | 22,535,691 | ||||||||
| Short-Term Investments | 401,780 | — | — | 401,780 | ||||||||||||
| Total | $ | 401,780 | $ | 22,535,691 | $ | — | $ | 22,937,471 | ||||||||
| * | Refer to the Schedule of Investments for state classifications. |
The Fund did not hold any Level 3 securities.
Security Transactions and Investment Income – Investment security transactions are accounted for on a trade date basis. Cost is determined and gains and losses are based upon the specific identification method for both financial statement and federal income tax purposes. Dividend income is recorded on the ex-dividend date and interest income is recorded on the accrual basis. Purchase discounts and premiums on securities are accreted and amortized over the life of the respective securities using the effective interest method or where applicable, the first call date of the security.
Federal Income Taxes – The Fund intends to continue to comply with the requirements of Subchapter M of the Internal Revenue Code applicable to regulated investment companies and will distribute all of its taxable income, if any, to shareholders. Accordingly, no provision for Federal income taxes is required in the financial statements.
The Fund recognizes the tax benefits of uncertain tax positions only when the position is “more likely than not” to be sustained assuming examination by tax authorities. Management has analyzed the Fund’s tax positions and has concluded that no liability for unrecognized tax benefits should be recorded related to uncertain tax positions taken on returns filed for the open tax year ended January 31, 2023 or expected to be taken in the Fund’s January 31, 2024 year-end tax returns.
The Fund recognizes interest and penalties, if any, related to unrecognized tax benefits as income tax expense in the Statement of Operations. During the year, the Fund did not incur any interest or penalties.
Distributions to Shareholders – Distributions from investment income are declared and recorded on a daily basis and paid monthly. Distributions from net realized capital gains, if any, are declared and paid annually and are recorded on the ex-dividend date. The character of income and gains to be distributed is determined in accordance with income tax regulations, which may differ from GAAP. These “book/tax” differences are considered either temporary (e.g., deferred losses) or permanent in nature. To the extent these differences are permanent in nature, such amounts are reclassified within the composition of net assets based on their federal tax-basis treatment; temporary differences do not require reclassification. All
16
Lind Capital Partners Municipal Credit Income Fund
NOTES TO FINANCIAL STATEMENTS (Continued)
January 31, 2024
or a portion of a distribution may consist of return of capital, shareholders should not assume that the source of a distribution is net income.
Indemnification – The Fund indemnifies its officers and Trustees for certain liabilities that may arise from the performance of their duties to the Fund. Additionally, in the normal course of business, the Fund enters into contracts that contain a variety of representations and warranties and which provide general indemnities. The Fund’s maximum exposure under these arrangements is unknown, as this would involve future claims that may be made against the Fund that have not yet occurred. However, based on experience, the Fund expects the risk of loss due to these warranties and indemnities to be remote.
| 3. | PRINCIPAL INVESTMENT RISKS |
Credit Risk – the risk that the Fund could lose money if the issuer, guarantor, or insurers of a fixed-income security, or the counterparty to a derivative considered primarily speculative regarding the issuer’s continuing ability to make principal and interest payments and may be more volatile than higher-rated securities of similar maturity. Changes in the actual or perceived creditworthiness of an issuer, or a downgrade or default affecting any of the Fund’s securities could affect the Fund’s performance. Generally, the longer the maturity and the lower the credit quality of a security, the more sensitive it is to credit risk.
Municipal Bond Risk – the risk that a Fund may be affected significantly by the economic, regulatory, or political developments affecting the ability of obligors of Municipal Bonds to pay interest or repay principal. The values of Municipal Bonds held by the Fund may be adversely affected by local political and economic conditions and developments. The Fund may make significant investments in a particular segment of the municipal bond market or in the debt of issuers located in the same state or territory. Adverse conditions in such industry or location could have a correspondingly adverse effect on the financial condition of issuers. These conditions may cause the value of the Fund’s shares to fluctuate more than the values of shares of funds that invest in a greater variety of investments. The amount of public information available about municipal bonds is generally less than for certain corporate equities or bonds, meaning that the investment performance of the Fund may be more dependent on the analytical abilities of the Fund’s Adviser than funds that invest in stock or other corporate investments.
Interest Rate Risk – the risk that fixed-income securities will decline in value because of an increase in interest rates. The values of debt instruments, including Municipal Bonds, usually rise and fall in response to changes in interest rates. Declining interest rates generally increase the value of existing debt instruments, and rising interest rates generally decrease the value of existing debt instruments. Securities with floating interest rates generally are less sensitive to interest rate changes but may decline in value if their interest rates do not rise as much, or as quickly, as interest rates in general. Conversely, floating rate instruments will not generally increase in value if interest rates decline. Changes in interest rates will also affect the amount of interest income the fund earns on its floating rate investments.
High Yield Risk – Lower-quality bonds, known as “high yield” or “junk” bonds, present greater risk than bonds of higher quality, including an increased risk of default. Such bonds are considered predominantly speculative and may be questionable as to principal and interest payments. An economic downturn or period of rising interest rates could adversely affect the market for these bonds and reduce the Fund’s ability to sell its bonds. The lack of a liquid market for these bonds could decrease the Fund’s share price. Unrated municipal bonds determined by the Fund’s Adviser to be of comparable quality to rated municipal bonds which the Fund may purchase may pay a higher interest rate than such rated municipal bonds and be subject to a greater risk of illiquidity or price changes. Less public information is typically available about unrated municipal bonds or issuers than rated bonds or issuers.
Liquidity Risk – the risk that a particular investment may be difficult to purchase or sell and that the Fund may be unable to sell illiquid investments at an advantageous time or price or achieve its desired level of exposure to a certain sector. Liquidity risk may result from the lack of an active market, reduced number and capacity of traditional market participants to make a market in fixed income securities. Inventories of municipal bonds held by brokers and dealers have decreased in recent years, lessening their ability to make a market in these securities. This reduction in market making capacity has the potential to decrease the Fund’s ability to buy or sell bonds, and increase bond price volatility and trading costs, particularly during periods of economic or market stress. In addition, recent federal banking regulations may cause certain dealers to reduce their inventories of municipal bonds, which may further decrease the Fund’s ability to buy or sell bonds. As a result, the Fund may be forced to
17
Lind Capital Partners Municipal Credit Income Fund
NOTES TO FINANCIAL STATEMENTS (Continued)
January 31, 2024
accept a lower price to sell a security, to sell other securities to raise cash, or to give up an investment opportunity, any of which could have a negative effect on performance. If the Fund needed to sell large blocks of bonds to raise cash (such as to meet heavy shareholder redemptions), those sales could further reduce the bonds’ prices and hurt performance. The Fund may invest in securities which are, or which become, illiquid. Illiquid securities may trade at a discount from comparable, more liquid investments, and may be subject to wide fluctuations in market value. Also, the Fund may not be able to dispose readily of illiquid securities when that would be beneficial at a favorable time or price or at prices approximating those at which the Fund currently values them. Further, the lack of an established secondary market for illiquid securities may make it more difficult to value such securities, which may negatively affect the price the Fund would receive upon disposition of such securities.
| 4. | INVESTMENT ADVISORY AGREEMENT AND TRANSACTIONS WITH RELATED PARTIES |
Advisory Fees – Lind Capital Partners, LLC (“Lind”) serves as the Fund’s investment adviser (the “Adviser”). Pursuant to an investment advisory agreement with the Trust, on behalf of the Fund, the Adviser, under the oversight of the Board, directs the daily operations of the Fund and supervises the performance of administrative and professional services provided by others. As compensation for these services and the related expenses borne by the Adviser, the Fund has agreed to pay the Adviser as compensation under the Investment Management Agreement (the “Management Fee”). The management fee is calculated and payable monthly in arrears at the annual rate of 1.00% of the Fund’s average daily net assets.
The Adviser and the Fund have entered into an expense limitation and reimbursement agreement (the “Expense Limitation Agreement”) under which the Adviser has agreed contractually to waive its fees and to pay or absorb the ordinary operating expenses of the Fund (excluding brokerage costs, taxes, interest, borrowing costs such as interest and dividend expenses on securities sold short, Acquired Fund fees and expenses, extraordinary expenses such as litigation and merger or reorganization costs, and other expenses not incurred in the ordinary course of such Fund’s business), to the extent that they exceed 1.25% per annum of the Fund’s average daily net assets of the Fund (the “Expense Limitation”). In consideration of the Adviser’s agreement to limit the Fund’s expenses, the Fund has agreed to repay the Adviser in the amount of any fees waived and Fund expenses paid or absorbed, subject to the limitations that: (1) the reimbursement for fees and expenses will be made only if payable not more than three years from when they were incurred; and (2) the reimbursement may not be made if it would cause the Expense Limitation (at the time of waiver/reimbursement or recapture) to be exceeded. The expense limitation will be in effect through May 31, 2025. During the year ended January 31, 2024, the Adviser waived $302,063. As of January 31, 2024 the cumulative expenses subject to recapture amounted to $645,602, of which $302,063 expires January 31, 2027, $296,039 expires January 31, 2026, and organizational costs of $47,500 expires September 30, 2024.
Ultimus Fund Distributors, LLC (the “Distributor”) acts as the Fund’s distributor and principal underwriter in a continuous public offering of the Fund shares. During the year ended January 31, 2024, the Distributor received $0 in underwriting commissions.
In addition, certain affiliates of the Distributor provide services to the Fund as follows:
Ultimus Fund Solutions, LLC (“UFS”), an affiliate of the Distributor, provides administration, fund accounting, and transfer agent services to the Trust. Pursuant to an administrative servicing agreement with UFS, the Fund pays UFS customary fees based on aggregate net assets of the Fund as described in the servicing agreement for providing administration, fund accounting, and transfer agency services to the Fund. Certain officers of the Trust are also officers of UFS and are not paid any fees directly by the Fund for serving in such capacities.
Northern Lights Compliance Services, LLC (“NLCS”) – NLCS, an affiliate of UFS and the Distributor, provides a Chief Compliance Officer to the Fund, as well as related compliance services, pursuant to a consulting agreement between NLCS and the Fund. Under the terms of such agreement, NLCS receives customary fees from the Fund.
Blu Giant, LLC (“Blu Giant”) – Blu Giant, an affiliate of UFS and the Distributor, provides EDGAR conversion and filing services as well as print management services for the Fund on an ad-hoc basis. For the provision of these services, Blu Giant receives customary fees from the Fund.
18
Lind Capital Partners Municipal Credit Income Fund
NOTES TO FINANCIAL STATEMENTS (Continued)
January 31, 2024
| 5. | INVESTMENT TRANSACTIONS |
The cost of purchases and proceeds from the sale of securities, other than short-term securities, for the year ended January 31, 2024, amounted to $9,187,100 and $1,875,608 respectively.
| 6. | AGGREGATE UNREALIZED APPRECIATION AND DEPRECIATION – TAX BASIS |
The identified cost of investments in securities owned by the Fund for federal income tax purposes and its respective gross unrealized appreciation and depreciation at January 31, 2024, was as follows:
| Total Unrealized | ||||||||||||||
| Unrealized | Unrealized | Appreciation/ | ||||||||||||
| Cost | Appreciation | Depreciation | Depreciation | |||||||||||
| $ | 24,037,179 | $ | 567,639 | $ | (1,667,347 | ) | $ | (1,099,708 | ) | |||||
| 7. | DISTRIBUTIONS TO SHAREHOLDERS AND TAX COMPONENTS OF CAPITAL |
The tax character of Fund distributions paid for the period/year ended January 31, 2023 and January 31, 2024 were as follows:
| Fiscal Year Ended | Fiscal Year Ended | |||||||
| January 31, 2024 | January 31, 2023 | |||||||
| Ordinary Income | $ | — | $ | — | ||||
| Tax-exempt Income | 1,284,017 | 706,063 | ||||||
| Long-Term Capital Gain | — | 12,785 | ||||||
| Return of Capital | — | — | ||||||
| $ | 1,284,017 | $ | 718,848 | |||||
As of January 31, 2024, the components of accumulated earnings/ (deficit) on a tax basis were as follows:
| Tax-exempt | Undistributed | Undistributed | Post | Capital Loss | Other | Unrealized | Total | |||||||||||||||||||||||
| Ordinary | Ordinary | Long-Term | October | Carry | Book/Tax | Appreciation/ | Distributable Earnings/ | |||||||||||||||||||||||
| Income | Income | Gains | Loss | Forwards | Differences | (Depreciation) | (Accumulated Deficit) | |||||||||||||||||||||||
| $ | 31,174 | $ | — | $ | — | $ | (222,329 | ) | $ | (323,351 | ) | $ | (31,187 | ) | $ | (1,099,708 | ) | $ | (1,645,401 | ) | ||||||||||
The difference between book basis and tax basis undistributed net investment income, accumulated net realized losses and unrealized depreciation is due to book/tax differences in the treatment bond amortization. The difference between book basis and tax basis undistributed net investment income and other book/tax adjustments is primarily attributable to the adjustments for accrued dividends payable.
Capital losses incurred after October 31 within the fiscal year are deemed to arise on the first business day of the following fiscal year for tax purposes. The Fund incurred and elected to defer such capital losses of $222,329.
At January 31, 2024, the Fund had capital loss carry forwards for federal income tax purposes available to offset future capital gains as follows:
| Short-Term | Long-Term | Total | ||||||||
| $ | 150,688 | $ | 172,663 | $ | 323,351 | |||||
19
Lind Capital Partners Municipal Credit Income Fund
NOTES TO FINANCIAL STATEMENTS (Continued)
January 31, 2024
Permanent book and tax differences, primarily attributable to tax adjustments for the tax gain/loss due to the Fund’s conversion, resulted in reclassifications for the Fund for the fiscal year ended January 31, 2024, as follows:
| Paid | Accumulated | |||||
| Capital | Earnings | |||||
| $ | (655,889 | ) | $ | 655,889 | ||
| 8. | REPURCHASE OFFERS |
The Fund is an “interval fund” and, in order to provide liquidity to shareholders, it intends to conduct quarterly repurchase offers of the outstanding shares at NAV, subject to approval of the Board. In each quarter, such repurchase offers will be at least 5% of its outstanding shares at NAV, pursuant to Rule 23c-3 under the 1940 Act. The Fund currently expects to conduct quarterly repurchase offers for 5% of its outstanding shares under ordinary circumstances. If shareholders tender for repurchase more than 5% of the outstanding Shares (the “Repurchase Offer Amount”), the Fund may, but is not required to, repurchase an additional amount of Shares not to exceed 2% of the outstanding Shares on the Repurchase Request Deadline. If the Fund determines not to repurchase more than the Repurchase Offer Amount, or if shareholders tender Shares in an amount exceeding the Repurchase Offer Amount plus 2% of the outstanding Shares on the Repurchase Request Deadline, the Fund will repurchase Shares pro rata based upon the number of Shares tendered by each shareholder. Repurchase offers and the need to fund repurchase obligations may affect the Fund’s ability to be fully invested or force the Fund to maintain a higher percentage of its assets in liquid investments, which may harm the Fund’s investment performance. Moreover, diminution in the size of the Fund through repurchases may result in untimely sales of portfolio securities (with associated imputed transaction costs, which may be significant), and may limit the ability of the Fund to participate in new investment opportunities or to achieve its investment objectives. The Fund may accumulate cash by holding back (i.e., not reinvesting) payments received in connection with the Fund’s investments.
During the year ended January 31, 2024, the Fund completed four quarterly repurchase offers. In those offers, the Fund offered to repurchase up to 5% of the number of its outstanding shares as of the Repurchase Pricing Dates. The results of those repurchase offers were as follows:
| Repurchase Offer #1 | Repurchase Offer #2 | Repurchase Offer #3 | Repurchase Offer #4 | |||||
| Commencement Date | January 27, 2023 | May 1, 2023 | August 1, 2023 | November 1, 2023 | ||||
| Repurchase Request Deadline | February 24, 2023 | May 26, 2023 | August 25, 2023 | November 27, 2023 | ||||
| Repurchase Pricing Date | February 24, 2023 | May 26, 2023 | August 25, 2023 | November 27, 2023 | ||||
| Net Asset Value as of Repurchase | ||||||||
| Offer Date | $8.76 | $8.70 | $8.57 | $8.69 | ||||
| Amount Repurchased | $172,419 | None | None | $1,392,324 | ||||
| Percentage of Outstanding | ||||||||
| Shares Repurchased | 1.07% | 0.00% | 0.00% | 6.03% |
| 9. | SUBSEQUENT EVENTS |
Subsequent events after the date of the Statement of Assets and Liabilities have been evaluated through the date the financial statements were issued. Management has determined that the below events or transactions occurred requiring adjustment or disclosure in the financial statements.
Subsequent to period end the Fund completed a quarterly repurchase offer. The results of this repurchase offer was as follows:
| Repurchase Offer | |||
| Commencement Date | February 1, 2024 | ||
| Repurchase Request Deadline | February 26, 2024 | ||
| Repurchase Pricing Date | February 26, 2024 | ||
| Net Asset Value as of Repurchase Offer Date | $8.78 | ||
| Amount Repurchased | $1,697,326 | ||
| Percentage of Outstanding Shares Repurchased | 7.00% | ||
20

REPORT OF INDEPENDENT REGISTERED PUBLIC ACCOUNTING FIRM
To the Shareholders and Board of Trustees of
Lind Capital Partners Municipal Credit Income Fund
Opinion on the Financial Statements
We have audited the accompanying statement of assets and liabilities, including the schedule of investments, of Lind Capital Partners Municipal Credit Income Fund (the “Fund”) as of January 31, 2024, the related statement of operations for the year then ended, the statements of changes in net assets and financial highlights for the year then ended and for the period from February 2, 2022 (commencement of operations) through January 31, 2023, and the related notes (collectively referred to as the “financial statements”). In our opinion, the financial statements present fairly, in all material respects, the financial position of the Fund as of January 31, 2024, the results of its operations for the year then ended, and the changes in net assets and the financial highlights for the year then ended and for the period from February 2, 2022 (commencement of operations) through January 31, 2023, in conformity with accounting principles generally accepted in the United States of America.
Basis for Opinion
These financial statements are the responsibility of the Fund’s management. Our responsibility is to express an opinion on the Fund’s financial statements based on our audits. We are a public accounting firm registered with the Public Company Accounting Oversight Board (United States) (“PCAOB”) and are required to be independent with respect to the Fund in accordance with the U.S. federal securities laws and the applicable rules and regulations of the Securities and Exchange Commission and the PCAOB.
We conducted our audits in accordance with the standards of the PCAOB. Those standards require that we plan and perform the audit to obtain reasonable assurance about whether the financial statements are free of material misstatement whether due to error or fraud.
Our audits included performing procedures to assess the risks of material misstatement of the financial statements, whether due to error or fraud, and performing procedures that respond to those risks. Such procedures included examining, on a test basis, evidence regarding the amounts and disclosures in the financial statements. Our procedures included confirmation of securities owned as of January 31, 2024, by correspondence with the custodian. Our audits also included evaluating the accounting principles used and significant estimates made by management, as well as evaluating the overall presentation of the financial statements. We believe that our audits provide a reasonable basis for our opinion.
We have served as the Fund’s auditor since 2023.

COHEN & COMPANY, LTD.
Philadelphia, Pennsylvania
March 29, 2024
COHEN & COMPANY, LTD.
800.229.1099 | 866.818.4538 fax | cohencpa.com
Registered with the Public Company Accounting Oversight Board
21
Lind Capital Partners Municipal Credit Income Fund
SUPPLEMENTAL INFORMATION (Unaudited)
January 31, 2024
LIND CAPITAL PARTNERS MUNICIPAL CREDIT INCOME FUND DISCLOSURE REGARDING APPROVAL OF INVESTMENT ADVISORY AGREEMENT
The Board of Trustees (the “Board”), including those Trustees who were determined not to be “interested persons” (the “Independent Trustees”) of Lind Capital Partners Municipal Credit Income Fund (the “Fund”), as such term is defined under Section 2(a)(19) of the Investment Company Act of 1940, as amended, voting separately, reviewed and approved the renewal of the Fund’s Investment Advisory Agreement with Lind Capital Partners, LLC (the “Adviser” or “Lind Capital”) for an additional year (the “Advisory Agreement”). The Board unanimously approved the Advisory Agreement at a meeting held on September 18, 2023, where all Trustees were present (the “Meeting”).
The Trustees, including the Independent Trustees, considered a variety of factors. In assessing these factors and reaching its decisions, the Board considered information furnished for its review throughout the year at regular Board meetings, including the Adviser’s presentation earlier in the Meeting. The Board requested and the Adviser provided information and reports in the materials provided in advance of the Meeting (“Meeting Materials”) relevant to the annual renewal of the Advisory Agreement, including: (i) reports regarding the services and support provided by the Adviser to the Fund and its shareholders; (ii) assessments of the Fund’s investment performance; (iii) periodic commentary on the reasons for the performance; (iv) presentations by the Adviser addressing its investment philosophy, investment strategy, personnel, and operations; (v) compliance and audit reports concerning the Fund and the Adviser; (vi) disclosure information contained in the registration statement of the Fund; and (vii) a memorandum from legal counsel to the Fund that summarized the fiduciary duties and responsibilities of the Board in reviewing and approving the Advisory Agreement, including the material factors set forth above and the types of information included in each factor that should be considered by the Board to make an informed decision.
The Board also requested and received various informational materials including, without limitation: (i) documents containing information about the Adviser, including financial information, a description of personnel and the services provided to the Fund, information on investment advice, performance, summaries of the Fund’s expenses, compliance program, current legal matters, and other general information; (ii) comparative expense and performance information for other mutual funds with strategies similar to the Fund; and (iii) benefits to be realized by the Adviser from its relationship with the Fund. In addition, the Board had an extensive discussion with representatives of the Adviser regarding the matters discussed below.
The nature, extent, and quality of the services provided by the Adviser to the Fund. The Board reviewed the services provided by the Adviser to the Fund, including, without limitation, its investment advisory services since the Fund’s inception; compliance and operational procedures and practices; efforts to promote the Fund and assist in its distribution; key personnel and support staff at the Adviser, who also serve as Fund management for no additional compensation; and management of the Fund’s daily operations. The Board noted the need to conduct credit quality assessments, ongoing credit surveillance, and other analysis on the Fund’s portfolio positions, and the Adviser’s expertise and industry experience in conducting such analysis. After reviewing the foregoing and further information in the Meeting Materials, the Board concluded that the nature, extent, and quality of the services provided by the Adviser to the Fund were satisfactory.
The investment performance of the Fund and the Adviser. The Board compared the performance of the Fund with its benchmark index and peer group for the period ended August 31, 2023. The Board also considered the consistency of the Adviser’s management with the Fund’s investment objective and policies. The Board noted that the Fund had underperformed its benchmark for the year ended August 31, 2023, but had overperformed for the three-year period. The Board further noted that the Fund’s performance for the five-year period was in-line with its
22
Lind Capital Partners Municipal Credit Income Fund
SUPPLEMENTAL INFORMATION (Unaudited) (Continued)
January 31, 2024
benchmark. The Board also noted that the Fund outperformed the peer group’s average performance for the one-, three-, and five-year periods ended August 31, 2023. Following a discussion of the Fund’s investment performance, the Adviser’s experience in managing the strategy, and other factors, the Board concluded that the Fund’s investment performance was satisfactory.
The costs of the services provided and profits realized by the Adviser and its affiliates from their relationship with the Fund. The Board considered: (i) the Adviser’s staffing; (ii) its methods of operating; (iii) the education and experience of its personnel; (iv) its compliance program; (v) its financial condition and the level of commitment to the Fund and, generally, the Adviser’s advisory business; (vi) the asset levels of the Fund; (vii) the overall expenses of the Fund, including the management fee; and (viii) the differences in fees and services to the Adviser’s other accounts with similar investment strategies. The Board also considered its discussion with the Adviser regarding the Expense Limitation Agreement (the “ELA”) and the Adviser’s past fee reductions and expense reimbursements for the Fund. The Board further considered the Adviser’s willingness to continue the ELA through at least May 31, 2025. The Board also considered the benefits for the Adviser in managing the Fund, including promoting the Adviser’s name.
The Board compared the Fund’s advisory fee and overall expense ratio to its respective peer group and the fees charged to the Adviser’s other client accounts with similar investment strategies. In comparing the fees and expense ratios between the Fund and its peer funds, the Board considered the differences in types of funds being compared (e.g., open-end funds versus closed-end funds), the style of investment management, the asset size of the Fund, and the nature of the investment strategies. For the Fund, the Board noted that the 1.00% management fee was higher than the average for the Fund’s peer group, and the 1.25% net expense ratio was in line with the average and median of the Fund’s peer group. The Board considered the Adviser’s statement that the Fund’s peer group included funds with significantly larger net assets, which allowed their management fees and overall expense ratios to be reduced beyond what is currently feasible for the Fund, given its size. After considering the various factors discussed during the Meeting, the Board determined that the Fund’s management fee and net expense ratio were within a reasonable range.
The Board also compared the fees paid by the Fund to those paid by other accounts of the Adviser with similar investment strategies and considered the similarities and differences in the Adviser’s services received by such other accounts compared to those of the Fund. The Board noted that the Adviser does not manage any other pooled investment vehicles but manages separately managed accounts with similar strategies and that the fee structures applicable to its separately managed accounts reflect the differences in the Adviser’s services and related costs. The Board further considered the investment strategy and style used by the Adviser in managing the Fund. Following these comparisons and considerations, and upon further discussion of the preceding, the Board concluded that the advisory fees paid to the Adviser by the Fund are fair and reasonable.
The extent to which economies of scale would be realized as the Fund grows and whether advisory fee levels reflect these economies of scale for the benefit of the Fund’s investors. The Board considered that the Fund’s fee arrangements with the Adviser involve the advisory fee and the ELA. The Board determined that, while the advisory fee remained the same as asset levels increased, the shareholders of the Fund have experienced, and will experience, benefits from the ELA. Following further discussion of the Fund’s asset levels, expectations for asset growth, and level of fees, the Board determined that the fee arrangements with the Adviser are fair and reasonable considering the nature and quality of services it provides.
The profits to be realized by the Adviser and its affiliates from the relationship with the Fund. The Board reviewed the information provided by the Adviser regarding its profitability in managing the Fund. It noted that currently the Fund is not profitable to the Adviser, but that it is committed to maintaining and growing the Fund’s
23
Lind Capital Partners Municipal Credit Income Fund
SUPPLEMENTAL INFORMATION (Unaudited) (Continued)
January 31, 2024
assets. Based on the information provided by the Adviser, the Board concluded that the Adviser’s relationship with the Fund is reasonable.
After reviewing the above factors and other factors, such as the Adviser’s trading practices and possible conflicts of interest, the Board determined that it had received enough information from the Adviser to evaluate the terms of the Advisory Agreement. After considering all the information presented to the Board at this Meeting and prior meetings, the Board unanimously concluded that the approval of the renewal of the Advisory Agreement was in the best interests of the Fund and its shareholders. The Board did not identify any information that was most relevant to its consideration to approve the Advisory Agreement, and each Trustee may have afforded different weights to the various factors.
24
Lind Capital Partners Municipal Credit Income Fund
SUPPLEMENTAL INFORMATION (Unaudited)
January 31, 2024
Information Regarding Trustees
| Name and Year of Birth | Position with the Fund | Term of Office and Length of Time Served | Principal Occupation(s) and Other Directorships/Trusteeships During Past Five Years | Number of Portfolios in Fund Complex Overseen by Trustee |
| J. Robert Lind Year of Birth: 1961 | Interested Trustee and President | Since 2021 | Managing Director, Lind Capital Partners, LLC (2009 - Present). | 1 |
| Richard H. Adler Year of Birth: 1954 | Independent Trustee | Since 2021 | President/CEO, Red Arrow Capital, LLC (2014 – Present). | 1 |
| Thomas J. Schmidt Year of Birth: 1963 | Independent Trustee and Chairman | Since 2021 | Principal, Tom Schmidt & Associates Consulting, LLC (2015-Present); Trustee, 360 Funds (2018-Present); FNEX Ventures (2018-2020). | 1 |
Information Regarding Officers
| Name and Year of Birth | Position with the Fund | Length of Time Served | Principal Occupation(s) During Past Five Years |
| Erik Naviloff Year of Birth: 1968 | Treasurer | Since 2021 | Vice President – Fund Administration, Ultimus Fund Solutions, LLC (2011 – Present). |
| Karen Jacoppo-Wood Year of Birth: 1966 | Secretary | Since 2023 | Senior Vice President and Associate General Counsel of Ultimus Fund Solutions, LLC (2022 – present); Managing Director and Managing Counsel of State Street Bank and Trust Company (2019 – 2022) (Vice President and Managing Counsel from 2014 – 2019). |
| Jared Lahman Year of Birth: 1986 | Chief Compliance Officer | Since 2024 | Compliance Officer/ Assistant Vice President, NLCS (2023-Present), Senior Compliance Analyst, Northern Lights Compliance, LLC (2019-2023); Manager of Fund Accounting, Gemini Fund Services, LLC (2016-2018). |
| Deryk Jones Year of Birth: 1988 | Anti-Money Laundering Compliance Officer | Since 2021 | Compliance Analyst, Northern Lights Compliance Services, LLC (2018 – Present. |
The Funds’ SAI includes additional information about the Trustees and is available free of charge, upon request, by calling toll-free at 1-833-615-3031.
25
PRIVACY NOTICE
Lind Capital Partners
| FACTS | WHAT DOES LIND CAPITAL PARTNERS DO WITH YOUR PERSONAL INFORMATION? |
| Why? | Financial companies choose how they share your personal information. Federal law gives consumers the right to limit some, but not all sharing. Federal law also requires us to tell you how we collect, share, and protect your personal information. Please read this notice carefully to understand what we do. |
| What? | The types of personal information we collect and share depend on the product or service that you have with us. This information can include:
● Social Security number and wire transfer instructions
● account transactions and transaction history
● investment experience and purchase history
When you are no longer our customer, we continue to share your information as described in this notice. |
| How? | All financial companies need to share customers’ personal information to run their everyday business. In the section below, we list the reasons financial companies can share their customers’ personal information; the reasons Lind Capital Parrtners chooses to share; and whether you can limit this sharing. |
| Reasons we can share your personal information: | Does Lind Capital Partners share information? | Can you limit this sharing? |
| For our everyday business purposes - such as to process your transactions, maintain your account(s), respond to court orders and legal investigations, or report to credit bureaus. | YES | NO |
| For our marketing purposes - to offer our products and services to you. | NO | We don’t share |
| For joint marketing with other financial companies. | NO | We don’t share |
| For our affiliates’ everyday business purposes -information about your transactions and records. | NO | We don’t share |
| For our affiliates’ everyday business purposes -information about your credit worthiness. | NO | We don’t share |
| For nonaffiliates to market to you | NO | We don’t share |
| QUESTIONS? | Call 1-312-361-3446 |
26
PRIVACY NOTICE
Lind Capital Partners
| What we do: | |
| How does Lind Capital Partners protect my personal information? | To protect your personal information from unauthorized access and use, we use security measures that comply with federal law. These measures include computer safeguards and secured files and buildings.
Our service providers are held accountable for adhering to strict policies and procedures to prevent any misuse of your nonpublic personal information. |
| How does Lind Capital Partners collect my personal information? | We collect your personal information, for example, when you
● open an account or deposit money
● direct us to buy securities or direct us to sell your securities
● seek advice about your investments
We also collect your personal information from others, such as credit bureaus, affiliates, or other companies. |
| Why can’t I limit all sharing? | Federal law gives you the right to limit only:
● sharing for affiliates’ everyday business purposes – information about your creditworthiness.
● affiliates from using your information to market to you.
● sharing for nonaffiliates to market to you.
State laws and individual companies may give you additional rights to limit sharing. |
| Definitions | |
| Affiliates | Companies related by common ownership or control. They can be financial and nonfinancial companies.
● Lind Capital Partners does not share with our affiliates. |
| Nonaffiliates | Companies not related by common ownership or control. They can be financial and nonfinancial companies.
● Lind Capital Partners does not share with nonaffiliates so they can market to you. |
| Joint marketing | A formal agreement between nonaffiliated financial companies that together market financial products or services to you.
● Lind Capital Partners isn’t joint market. |
27
How to Obtain Proxy Voting Information
Information regarding how the Fund votes proxies relating to portfolio securities during the most recent 12-month period ending June 30th as well as a description of the policies and procedures that the Fund used to determine how to vote proxies is available without charge, upon request, by calling 1-833-615-3031 or by referring to the Securities and Exchange Commission’s (“SEC”) website at http://www.sec.gov.
How to Obtain 1st and 3rd Fiscal Quarter Portfolio Holdings
The Fund files its complete schedule of portfolio holdings with the SEC for the first and third quarters of each fiscal year as an exhibit to its reports on Form N-PORT, within sixty days after the end of the period. Form N-PORT reports are available on the SEC’s website at http://www.sec.gov. The information on Form N-PORT is available without charge, upon request, by calling 1-833-615-3031.
| Investment Adviser |
| Lind Capital Partners, LLC |
| 500 Davis Center, Suite 1004 |
| Evanston, Illinois 60201 |
| Administrator |
| Ultimus Fund Solutions, LLC |
| 225 Pictoria Drive, Suite 450 |
| Cincinnati, OH 45246 |
| Lind-AR24 |
Item 2. Code of Ethics.
(a) As of the end of the period covered by this report, the registrant has adopted a code of ethics that applies to the registrant's principal executive officer, principal financial officer, principal accounting officer or controller, or persons performing similar functions, regardless of whether these individuals are employed by the registrant or a third party.
(b) For purposes of this item, “code of ethics” means written standards that are reasonably designed to deter wrongdoing and to promote:
| (1) | Honest and ethical conduct, including the ethical handling of actual or apparent conflicts of interest between personal and professional relationships; |
| (2) | Full, fair, accurate, timely, and understandable disclosure in reports and documents that a registrant files with, or submits to, the Commission and in other public communications made by the registrant; |
| (3) | Compliance with applicable governmental laws, rules, and regulations; |
| (4) | The prompt internal reporting of violations of the code to an appropriate person or persons identified in the code; and |
| (5) | Accountability for adherence to the code. |
(c) Amendments: During the period covered by the report, there have not been any amendments to the provisions of the code of ethics.
(d) Waivers: During the period covered by the report, the registrant has not granted any express or implicit waivers from the provisions of the code of ethics.
(e) The Code of Ethics is not posted on Registrant’ website.
(f) A copy of the Code of Ethics is attached as an exhibit.
Item 3. Audit Committee Financial Expert.
(a) The Registrant’s board of trustees has determined that Richard H. Adler is an audit committee financial expert, as defined in Item 3 of Form N-CSR. Mr.Adler is independent for purposes of this Item.
Item 4. Principal Accountant Fees and Services.
| (a) | Audit Fees |
2024 - $20,000
2023 - $17,000
| (b) | Audit-Related Fees |
2024- $0
2023- $0
| (c) | Tax Fees |
2024 - $3,000
2023 - $3,000
Preparation of Federal & State income tax returns, assistance with calculation of required income, capital gain and excise distributions and preparation of Federal excise tax returns.
| (d) | All Other Fees |
2024 - $0
2023 - $0
| (e) | (1) Audit Committee’s Pre-Approval Policies |
The registrant’s Audit Committee is required to pre-approve all audit services and, when appropriate, any non-audit services (including audit-related, tax and all other services) to the registrant. The registrant’s Audit Committee also is required to pre-approve, when appropriate, any non-audit services (including audit-related, tax and all other services) to its adviser, or any entity controlling, controlled by or under common control with the adviser that provides ongoing services to the registrant, to the extent that the services may be determined to have an impact on the operations or financial reporting of the registrant. Services are reviewed on an engagement by engagement basis by the Audit Committee.
| (2) | Percentages of Services Approved by the Audit Committee |
2024 2023
Audit-Related Fees: 0.00% 0.00%
Tax Fees: 0.00% 0.00%
All Other Fees: 0.00% 0.00%
| (f) | During the audit of registrant's financial statements for the most recent fiscal year, less than 50 percent of the hours expended on the principal accountant's engagement were attributed to work performed by persons other than the principal accountant's full-time, permanent employees. |
| (g) | The aggregate non-audit fees billed by the registrant's accountant for services rendered to the registrant, and rendered to the registrant's investment adviser (not including any sub-adviser whose role is primarily portfolio management and is subcontracted with or overseen by another investment adviser), and any entity controlling, controlled by, or under common control with the adviser that provides ongoing services to the registrant: |
2024 - $3,000
2023 - $3,000
(h) The registrant's audit committee has considered whether the provision of non-audit services to the registrant's investment adviser (not including any sub-adviser whose role is primarily portfolio management and is subcontracted with or overseen by another investment adviser), and any entity controlling, controlled by, or under common control with the investment adviser that provides ongoing services to the registrant, that were not pre-approved pursuant to paragraph (c)(7)(ii) of Rule 2-01 of Regulation S-X, is compatible with maintaining the principal accountant's independence.
Item 5. Audit Committee of Listed Companies. Not applicable
Item 6. Schedule of Investments. Schedule of investments in securities of unaffiliated issuers is included under Item 1.
Item 7. Disclosure of Proxy Voting Policies and Procedures for Closed-End Funds.
The Board has adopted Proxy Voting Policies and Procedures (“Policies”) on behalf of the Fund, which delegate the responsibility for voting proxies to the Adviser, subject to the Board’s continuing oversight. The Policies require that the Adviser elect to vote or not to vote proxies received in a manner consistent with the best interests of the Fund and shareholders. The Policies also require the Adviser to present to the Board, at least annually, the Adviser’s Proxy Policies and a record of each proxy voted or not voted by the Adviser on behalf of the Fund, including a report on the resolution of all proxies identified by the Adviser involving a conflict of interest.
Where a proxy proposal raises a material conflict between the interests of the Adviser, any affiliated person(s) of the Adviser, the Distributor or any affiliated person of the Distributor, or any affiliated person of the Fund and the Fund’s or its shareholder’s interests, the Adviser will resolve the conflict by voting in accordance with the policy guidelines or at the Fund’s directive using the recommendation of an independent third party. If the third party’s recommendations are not received in a timely fashion, the Adviser will abstain from voting.
Although it is uncommon given the fixed income nature of our investment strategy, Lind has the authority to vote proxies for the Fund. Proxies for high yield municipal bonds, often occur in restructures and workouts, if any. We vote the proxies in a way that we believe is consistent with our fiduciary duty to the Fund and that will cause the Fund’s securities to increase the most or decline the least in value. Lind does not have, per se, proxy vote guidelines as proxies for municipal securities are often unique and are not standardized. Consideration is provided to both long and short-term
implications of the proposal to be voted upon when considering the vote that is in the best interest of the Fund.
Procedure
Lind goal is to act in the best interest of the Fund and its shareholders. Given the nature of the Fund’s investments, Lind does not have a formal proxy vote guideline or policy and procedure. We generally vote with management on standard matters (i.e., officers or directors, auditor, etc.). We separately evaluate other matters on a case-by-case basis. Lind Capital Partners will comply with the Fund’s policies and procedures related to the Fund’s Form N-PX filing requirements and maintains all records related to proxy ballots, including:
a. Date received.
b. Reconciliation to number of bonds in the Fund
c. Date voted and how we voted (typically, on line)
d. Records are maintained consistent with our general books and records: For 5 years from the end of the fiscal year the record was created.
Form N-PX: On an annual basis, following the end of the 12-month period ending June 30, the Adviser will furnish to the administrator of its Fund clients a full record detailing how the Firm voted all proxies for the prior 12-month period.
Item 8. Portfolio Managers of Closed-End Management Investment Companies.
J. Robert Lind is a founding member of the Adviser and the portfolio manager primarily responsible for managing the Fund’s assets. Mr. Lind has 38 years of experience in the municipal bond market. Mr. Lind has an B.A. in History from Kenyon College and a MBA in Finance and Accounting from the University of Chicago.
Anthony Chun, CFA is primarily responsible for credit research and portfolio management of the Fund. Mr. Chun has 10 years of experience in the municipal bond market and corporate finance. Mr. Chun has B.A. in Economics from Kenyon College and is a CFA Charter holder. Jon Lind is primarily responsible for trading, execution and portfolio management of the Fund. Mr. Lind has 11 years of experience in the municipal bond market. Mr.Lind has a B.A. in Political Science from Miami University (OH).
As of January 31, 2024, the Portfolio Manager, was responsible for the management of the following types of accounts in addition to the Fund:
| Other Accounts By Type | Total Number of Accounts by Account Type | Total Assets By Account Type | Number of Accounts Subject to a Performance Based Fee | Total Assets Subject to a Performance Based Fee |
| Other Accounts | 29 | $88M | 0 | 0 |
Compensation of the Portfolio Managers
Mr.Lind is a principal of the Adviser and as such is compensated through distributions that are based primarily on the profits and losses of the Adviser. Mr. Chun and Mr. Jon Lind are compensated through salary, bonus, and the Adviser’s equity plan.
As of January 31, 2024, the Portfolio Manager’s ownership of the Fund was as follows:
Portfolio Manager | Dollar Range of Shares Owned |
| J. Robert Lind | 500,001-1,000,000 |
| Anthony Chun | 0 |
Item 9. Purchases of Equity Securities by Closed-End Funds. Not applicable
Item 10. Submission of Matters to a Vote of Security Holders. None
Item 11. Controls and Procedures.
(a) Based on an evaluation of the Registrant’s disclosure controls and procedures as of a date within 90 days of filing date of this Form N-CSR, the principal executive officer and principal financial officer of the Registrant have concluded that the disclosure controls and procedures of the Registrant are reasonably designed to ensure that the information required in filings on Form N-CSR is recorded, processed, summarized, and reported by the filing date, including that information required to be disclosed is accumulated and communicated to the Registrant’s management, including the Registrant’s principal executive officer and principal financial officer, as appropriate to allow timely decisions regarding required disclosure.
(b) There were no significant changes in the Registrant’s internal control over financial reporting that occurred during the Registrant’s during the period that have materially affected, or are reasonably likely to materially affect, the Registrant’s internal control over financial reporting.
Item 12. Disclosure of securities lending activities for closed-end management investment companies.
| (a) | Not applicable. |
| (b) | Not applicable. |
Item 13. Exhibits.
(a)(1) Code of Ethics filed herewith.
(a)(3) Not applicable.
SIGNATURES
Pursuant to the requirements of the Securities Exchange Act of 1934 and the Investment Company Act of 1940, the registrant has duly caused this report to be signed on its behalf by the undersigned, thereunto duly authorized.
(Registrant) Lind Capital Partners Municipal Credit Income Fund
By (Signature and Title)
/s/ J.Robert Lind
J. Robert Lind, Principal Executive Officer/President
Date 4/5/2024
Pursuant to the requirements of the Securities Exchange Act of 1934 and the Investment Company Act of 1940, this report has been signed below by the following persons on behalf of the registrant and in the capacities and on the dates indicated.
By (Signature and Title)
/s/ Erik Naviloff
Erik Naviloff, Principal Financial Officer/Treasurer
Date 4/5/2024