
1 SIGNA Sports United N.V. Reports H1 FY23 Results Strategic realignment and cost initiatives of up to €100 million implemented H1 FY23 net revenue of €441 million, YoY reported change of -2% Subdued demand and market overstock weighing on financial results and liquidity • Active Customers of 6.1 million, representing a decrease of (-15)% YoY • Net Revenue of €441 million in H1 FY23 down (-2)% YoY, Q2 FY23 Net revenue decreased (-23)% YoY • Gross profit of €117 million in H1 FY23 and €44 million in Q2 FY23 • Adj. EBITDA decreased to (€97) million in H1 FY23 and (€59) million in Q2 FY23 • Secured €150 million commitment from major indirect shareholder to fund the operations of the business into FY25 Berlin, Germany (June 28, 2023) – SIGNA Sports United N.V. (“SSU” or the “Company”), a NYSE- listed specialist sports e-commerce company with businesses in bike, tennis, outdoor, and teamsports, today issued a trading update for the second quarter of fiscal year 2023 ended March 31, 2023 and H1 FY2023. Q2 FY23 includes full contribution of businesses acquired in FY22, WiggleCRC and Tennis Express (acquisitions closed on December 14 and December 31, 2021, respectively). The operating environment in the first half of FY23 was a continuation of the disruptions introduced in Q4 of FY22. Although economic indicators across core markets have begun to improve slightly since the beginning of the year but demand remains below FY22 levels and pre-pandemic levels. On the supply side, stock levels across the industry remain severely elevated as market participants aim to clear excess inventory, resulting in a meaningful compression of gross margins and negative cash flows. Stephan Zoll, CEO of SSU, said, “The first half of our fiscal year has been marked by challenging conditions across the sports retail industry. While macro headwinds and oversupply in the market have pressured our financial results, we have remained focused on positioning our business for success as operating conditions normalize. In response to the demand outlook in the near-term, we have conducted a comprehensive strategic repositioning of the business with the aim of enabling a return to profitable growth and positive cash flow. In addition, I am pleased to welcome key hires across our Bike and Tennis segments with the experience and industry insight needed to deliver the next chapter of SSU’s growth story. Though our results in H1 FY23 have suffered as the market navigates another period of disruption, I am confident that the worst distortions are behind us and we remain fully aligned behind our renewed operating approach with a clear course toward long-term value creation”
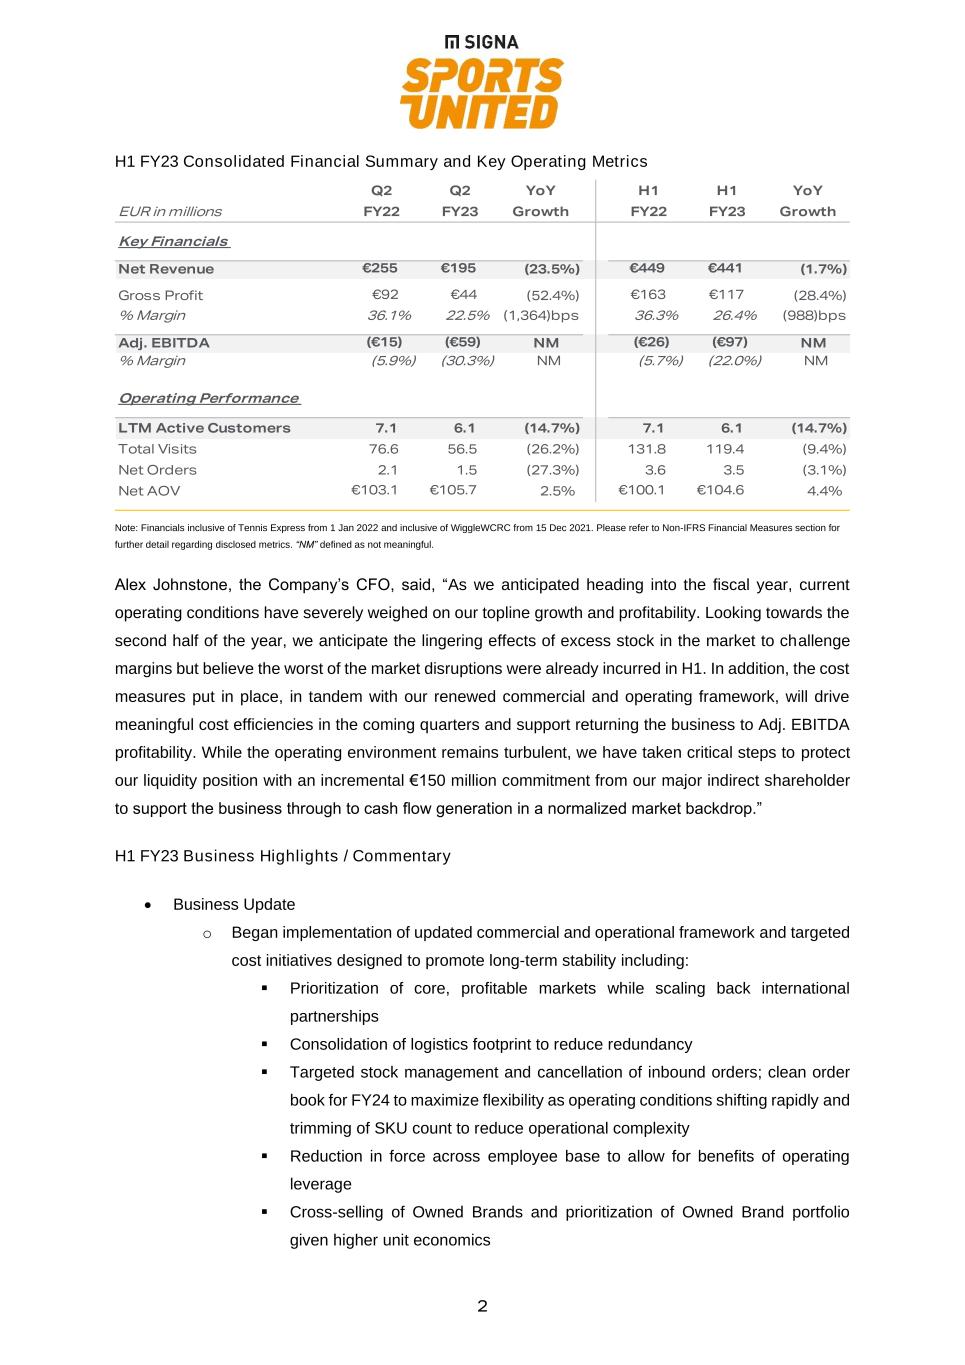
2 H1 FY23 Consolidated Financial Summary and Key Operating Metrics Note: Financials inclusive of Tennis Express from 1 Jan 2022 and inclusive of WiggleWCRC from 15 Dec 2021. Please refer to Non-IFRS Financial Measures section for further detail regarding disclosed metrics. “NM” defined as not meaningful. Alex Johnstone, the Company’s CFO, said, “As we anticipated heading into the fiscal year, current operating conditions have severely weighed on our topline growth and profitability. Looking towards the second half of the year, we anticipate the lingering effects of excess stock in the market to challenge margins but believe the worst of the market disruptions were already incurred in H1. In addition, the cost measures put in place, in tandem with our renewed commercial and operating framework, will drive meaningful cost efficiencies in the coming quarters and support returning the business to Adj. EBITDA profitability. While the operating environment remains turbulent, we have taken critical steps to protect our liquidity position with an incremental €150 million commitment from our major indirect shareholder to support the business through to cash flow generation in a normalized market backdrop.” H1 FY23 Business Highlights / Commentary • Business Update o Began implementation of updated commercial and operational framework and targeted cost initiatives designed to promote long-term stability including: ▪ Prioritization of core, profitable markets while scaling back international partnerships ▪ Consolidation of logistics footprint to reduce redundancy ▪ Targeted stock management and cancellation of inbound orders; clean order book for FY24 to maximize flexibility as operating conditions shifting rapidly and trimming of SKU count to reduce operational complexity ▪ Reduction in force across employee base to allow for benefits of operating leverage ▪ Cross-selling of Owned Brands and prioritization of Owned Brand portfolio given higher unit economics Q2 Q2 YoY H1 H1 YoY EUR in millions FY22 FY23 Growth FY22 FY23 Growth Key Financials Net Revenue €255 €195 (23.5%) €449 €441 (1.7%) Gross Profit €92 €44 (52.4%) €163 €117 (28.4%) % Margin 36.1% 22.5% (1,364)bps 36.3% 26.4% (988)bps Adj. EBITDA (€15) (€59) NM (€26) (€97) NM % Margin (5.9%) (30.3%) NM (5.7%) (22.0%) NM Operating Performance LTM Active Customers 7.1 6.1 (14.7%) 7.1 6.1 (14.7%) Total Visits 76.6 56.5 (26.2%) 131.8 119.4 (9.4%) Net Orders 2.1 1.5 (27.3%) 3.6 3.5 (3.1%) Net AOV €103.1 €105.7 2.5% €100.1 €104.6 4.4%
3 o Roadmap outlined to achieve approximately 100M EUR of run-rate EBITDA savings by FY25 o Strengthening of liquidity position with 150M EUR equity commitment to fund the operational and investment requirements of the business into FY25 • Key Performance Indicators (KPIs) o (-15%) YoY decline in Active Customers vs. +143% pre-Covid (Q2 FY19) on a reported basis to 6.1 million Active Customers in H1 FY2023, led by acquisitions at the time and focused marketing spend to drive conversion o (-26%) YoY decline in visits for Q2 FY23 and (-9%) YoY for H1 FY23 due as demand has contracted sharply on a year-over-year basis o Net Orders decreased by (-27%) YoY in Q2 and (-3%) YoY in H1 FY23 driven by the traffic decrease, in challenging operating environment o 2% YoY Net AOV increase in Q2 FY23 and 4% YoY for H1 FY23 a result of improved product mix in H1 FY23 following severe shortage of full-bike stock in FY22 o Q2 FY23 Core KPIs remain meaningfully above pre-pandemic levels with PF growth vs. pre-Covid (Q2 FY19) in Active Customers (+18%), conversion (+84 bps) and AOV (+7%) • Financial Update o (-1.7%) YoY Net revenue decline in H1 FY23, Q2 FY23 YoY decline of (-23%) as consumer sentiment continued to lag pre-pandemic levels. Though supply chain pressures eased in H1 FY23, market oversupply and tightening macroeconomic conditions have weakened consumer demand, particularly in non-core markets o Gross margin contraction of (-1,364bps) YoY in Q2 FY23 and (-988bps) YoY in H1 FY23 a result of targeted inventory management to counteract the severe oversupply across the market and right-size stock position for level of market demand o Significant cash outflows in H1 FY23 driven primarily by weakened operating performance as well as elevated payables resulting from meaningful stock inbounds at YE FY22 o On June 26, 2023, obtained €150 million hard financing commitment from SIGNA Holding GmbH to fund the Company’s operational and investment requirements into FY25

4 Outlook & Guidance Management announces FY23 guidance to reflect ongoing market dislocation and sustained demand contraction into H2 FY23 before any potential improvement anticipated in FY24. • FY23 Guidance o Net revenue: (9)% – (11)% YoY decline o Adjusted EBITDA margin: (16)% – (18)% o Free cash flow: (€250) - (€270) million In line with expectations going into FY23, SSU performance has been severely impacted by macroeconomic headwinds and market overstock. Management anticipates a continuation of challenging operating conditions into H2 FY23 with some improvement expected by management in Q4. As the Company looks beyond the near-term turbulence, Management reiterates its conviction that the measures enacted as part of the strategic realignment process provide the business with a clear pathway to profitable long-term growth as conditions allow. The financial impact anticipated from our renewed approach include: o Changes in our commercial model that will result in lower sales, but at a higher contribution o Focus on lean operating processes to accelerate cost savings from FY24; on track with various cost reduction measures o Transaction synergies to start accruing from FY24 along with IT re-platforming, logistics consolidation, seeking procurement benefits With near-term market disruption putting strain on suppliers and retailers across the sports retail industry, the Company anticipates opportunities for inorganic growth in the coming quarters. With a market leading position, SSU is closely monitoring the M&A pipeline with a continued focus on accretive M&A to broaden reach and enhance our Owned Brand portfolio. The Company continues to believe in the strength of the underlying global trends of health and fitness, e-mobility and e-commerce and is committed to delivering long-term value with a differentiated proposition. Conference Call Information SSU’s management will host a conference call today at 8:30 a.m. Eastern Time to discuss the results. Interested parties will be able to access the conference call by dialling 1-855-979-6654 (in the United States) or +1-646-664-1960 (outside of the United States), along with access code 424915. The conference call will be simulcast and archived on SSU’s website at https://investor.signa- sportsunited.com/.
5 Non-IFRS Financial Measures The press release includes certain non-IFRS financial measures (including on a forward-looking basis). These non-IFRS measures are an addition, and not a substitute for or superior to, measures of financial performance prepared in accordance with IFRS and should not be considered as an alternative to net income, operating income or any other performance measures derived in accordance with IFRS. Please see for our definitions of our non-IFRS measures below. SSU believes that these non-IFRS measures of financial results (including on a forward-looking basis) provide useful supplemental information to investors about SSU. SSU’s management uses forward- looking non-IFRS measures to evaluate SSU’s projected financials and operating performance. However, there are a number of limitations related to the use of these non-IFRS measures and their nearest IFRS equivalents, including that they exclude significant expenses that are required by IFRS to be recorded in SSU’s financial measures. In addition, other companies may calculate non-IFRS measures differently, or may use other measures to calculate their financial performance, and therefore, SSU’s non-IFRS measures may not be directly comparable to similarly titled measures of other companies. Additionally, to the extent that forward looking non-IFRS financial measures are provided, they are presented on a non-IFRS basis without reconciliations of such forward-looking non-IFRS measures due to the inherent difficulty in forecasting and quantifying certain amounts that are necessary for such reconciliations. Totals have been calculated on the basis of non-rounded euro amounts and may differ from a calculation based on the reported million euro amounts. Liquidity In addition to the €130 million hard financing commitment which SIGNA Sports United N.V. (the “Company”) received from SIGNA Holding GmbH (“SIGNA Holding”), an affiliate of the Company’s largest shareholder SIGNA International Sports Holding GmbH (“SISH”) on February 6, 2023 SIGNA Holding and the Company have entered into an additional equity commitment letter on June 26, 2023 with commitments by SIGNA Holding to provide the Company with additional liquidity of €150 million until September 30, 2025. The parties shall mutually agree on detailed financing terms substantially on the basis of the outstanding and newly issued convertible bonds, subject to amendments to the terms. The Company is confident the €150 million of liquidity commitments will be sufficient to fund its operational and investment related funding requirements into FY25. The current market conditions have, and continue to, weigh heavily on our financial results and liquidity position. Additional factors may further accelerate our need for additional financing, including if revenues are lower than expected, or if our costs and expenses on a go-forward basis are higher than expected or if we are unable to extend loan repayment terms on loans maturing within the next 12 months;

6 furthermore, our operating plan may change as a result of many factors, including those currently unknown to us, and we may need to seek additional funds sooner than planned, in each case, through public or private equity, debt financings or other sources. Notwithstanding the hard financing commitments obtained from SIGNA Holding, the Company is working to extend the terms or refinance its revolving credit facility of € 100 million which falls due in May 2024. A failure to extend the terms or refinance the Company’s existing revolving credit facility by May 2024 could have a material adverse effect on our business, financial condition, results of operations and prospects, raise substantial doubt about the Company’s continuation as a going concern and ultimately cause our business to fail and liquidate with little or no return to investors. Forward-Looking Statements These forward-looking statements include, but are not limited to, statements regarding future events, the estimated or anticipated future results and benefits of SSU following the business combination, future opportunities for SSU, future planned products and services, business strategy and plans, objectives of management for future operations of SSU, market size and growth opportunities, competitive position, technological and market trends, and other statements that are not historical facts. Forward-looking statements are generally accompanied by words such as believe,” “may,” “will,” “estimate,” “continue,” “anticipate,” “intend,” “expect,” “should,” “could,” “would,” “plan,” “predict,” “potential,” “seem,” “seek,” “future,” “outlook,” “suggests,” “targets,” “projects,” “forecast” and similar expressions that predict or indicate future events or trends or that are not statements of historical matters. These forward-looking statements are provided for illustrative purposes only and are not intended to serve as, and must not be relied on, by any investor as a guarantee, an assurance, a prediction or a definitive statement of fact or probability. Actual events and circumstances are difficult or impossible to predict and will differ from assumptions. All forward-looking statements are based upon estimates and forecasts and reflect the views, assumptions, expectations, and opinions of the Company, which are all subject to change due to various factors including, without limitation, changes in general economic conditions as a result of the war in Ukraine, significant inflation, higher financing costs, an increase in energy costs, a negative consumer sentiment and COVID-19. Any such estimates, assumptions, expectations, forecasts, views or opinions, whether or not identified in this document, should be regarded as indicative, preliminary and for illustrative purposes only and should not be relied upon as being necessarily indicative of future results. Forward-looking statements appear in a number of places in this press release and include, but are not limited to, statements regarding our intent, belief or current expectations. Forward-looking statements are based on our management’s beliefs and assumptions and on information currently available to our management. Such statements are subject to risks and uncertainties, and actual results may differ materially from those expressed or implied in the forward-looking statements due to various factors. The forward-looking statements in this press release may include, without limitations, statements about:
7 • our liquidity and losses from operations and projected cash flows and related impact on our ability to continue as a going concern; • our future financial condition and operating results; • our ability to remain in compliance with financial covenants under our financing arrangements; • our ability to extend, renew or refinance our existing debt; • our growth, expansion and acquisition prospects and strategies, the success of such strategies, and the benefits we believe can be derived from such strategies; • our ability to effectively manage our inventory and inventory reserves; • impairments of our goodwill or other intangible assets; • changes in consumer spending patterns and overall levels of consumer spending; • our ability to further upgrade our information technology systems and infrastructure, including our accounting processes and functions, and other risks associated with the systems that operate our online retail operations; • our ability to continue to remedy weaknesses in our internal controls; • costs as a result of operating as a public company; • our assumptions regarding interest rates and inflation; • changes affecting currency exchange rates; • continuing business disruptions arising from the on-going war in Ukraine and in the aftermath of the coronavirus pandemic; • our financial condition and ability to obtain financing in the future to implement our business strategy and fund capital expenditures, acquisitions and other general corporate activities; • estimated future capital expenditures needed to preserve our capital base; • changes in general economic conditions in the Federal Republic of Germany (“Germany”), and the European Union and the Unites States of America, including changes in the unemployment rate, the level of energy and consumer prices, wage levels, etc.; • the further development of online sports markets, in particular the levels of acceptance of internet retailing; • our behavior on mobile devices and our ability to attract mobile internet traffic and convert such traffic into purchases of our goods; • our ability to offer our customers an inspirational and attractive online purchasing experience; • demographic changes, in particular with respect to Germany; • changes in our competitive environment and in our competition level; • the occurrence of accidents, terrorist attacks, natural disasters, fires, environmental damage, or systemic delivery failures; • our inability to attract and retain qualified personnel, consultants and collaborators; • political changes; • changes in laws and regulations; • our expectations relating to dividend payments and forecasts of our ability to make such payments; and

8 • other factors discussed in “Item 3. Key Information — D. Risk Factors” in our 20-F filing as of February 7, 2023 and Exhibit 99.4 in our 6-K filing as of June 28, 2023. Forward-looking statements are subject to known and unknown risks and uncertainties and are based on potentially inaccurate assumptions that could cause actual results to differ materially from those expected or implied by the forward-looking statements. Actual results could differ materially from those anticipated in forward-looking statements for many reasons, including the factors described in “Item 3. Key Information—D. Risk Factors” in our 20-F filing as of February 7, 2023 and Exhibit 99.4 in our 6-K filing as of June 28, 2023 and our ability to continue as a going concern. Accordingly, you should not rely on these forward-looking statements, which speak only as of the date of this press release. You should, however, review the factors and risks we describe in the reports we will file from time to time with the SEC after the date of this press release. In addition, statements such as “we believe” and similar statements reflect our beliefs and opinions on the relevant subject. These statements are based on information available to us as of the date of this press release. And while we believe that information provides a reasonable basis for these statements, that information may be limited or incomplete. Our statements should not be read to indicate that we have conducted an exhaustive inquiry into, or review of, all relevant information. These statements are inherently uncertain, and you are cautioned not to rely unduly on these statements. Although we believe the expectations reflected in the forward-looking statements were reasonable at the time made, we cannot guarantee future results, level of activity, performance or achievements. Moreover, neither we nor any other person assumes responsibility for the accuracy or completeness of any of these forward-looking statements. You should carefully consider the cautionary statements contained or referred to in this section in connection with the forward-looking statements contained in this press release and any subsequent written or oral forward-looking statements that may be issued by us or persons acting on our behalf. Definitions Gross Profit: Net revenues less cost of materials adjusted to exclude extraordinary write-offs. Active Customers: Customers with one or more purchases within the last 12 months, irrespective of cancellations or returns. Total Visits: Number of visits including mobile and website. Cut-off at 30 minutes of inactivity and at date change. Not cut off at channel change during session. Net Orders: Orders post cancellations and full returns. Net AOV: Total online revenue (excluding sales partners) divided by net orders (post cancellations and full returns).
9 Contacts SSU Investor Contact Jeremy Nelle j.nelle@signa-sportsunited.com +1 203 546 0154 SSU Media Contact Jeremy Nelle j.nelle@signa-sportsunited.com +1 203 546 0154 About SIGNA Sports United: SIGNA Sports United (SSU) is a NYSE-listed specialist sports e-commerce company with headquarters in Berlin. It has businesses operating within bike, tennis, outdoor, and team sports. SSU has more than 80 online sites and partners with 500 shops serving over 6 million customers worldwide. It includes Tennis-Point, WiggleCRC, Fahrrad.de, Bikester, Probikeshop, Campz, Addnature, TennisPro and Outfitter. Further information: www.signa-sportsunited.com.

10 Reconciliations (in EUR millions) Unaudited interim condensed consolidated statements of operations (in EUR millions) H1 H1 FY22 FY23 Net Loss (€196.4) (€180.5) Income tax expense / benefit €8.0 €3.0 Earnings before tax (EBT) (€204.4) (€183.5) Interest €2.6 (€13.1) Depreciation and amortization (€21.5) (€27.6) EBITDA (€185.4) (€142.8) Impairment loss – €0.2 Other net finance (income) / costs (€10.8) €0.3 Result from investments accounted for at equity €0.6 €0.8 Total EBITDA Adjustments €169.8 €44.5 Transaction related charges €0.7 – Reorganization and restructuring costs €126.9 €30.0 Consulting fees €31.3 €13.2 Share-based compensation €9.1 €3.2 Other items not directly related to current operations €1.8 (€1.9) Adj. EBITDA (€25.8) (€96.9) H1 H1 YoY 2022 2023 Growth Net Revenue €449.1 €441.4 (1.7%) Own Work Capitalized 2.2 2.3 5.2% Other Operating Income 2.6 5.5 NM Total Revenue and Other Income €453.9 €449.3 (1.0%) Cost of Materials (286.0) (324.7) 13.5% Personnel Expense (61.8) (76.1) 23.2% Other Operating Expenses (131.9) (145.4) 10.2% EBITDA Adjustments (169.8) (44.5) (73.8%) Depreciation & Amortization (21.5) (27.9) 29.5% Operating Loss (€217.1) (€169.3) (22.0%) Share of results of associates (0.6) (0.8) 27.7% Finance income 17.0 6.8 (60.3%) Finance costs (3.6) (20.2) NM Pre-Tax Income (€204.4) (€183.5) (10.2%) Income Taxes 8.0 3.0 (62.8%) Result from continuing operations (€196.4) (€180.5) (8.1%)
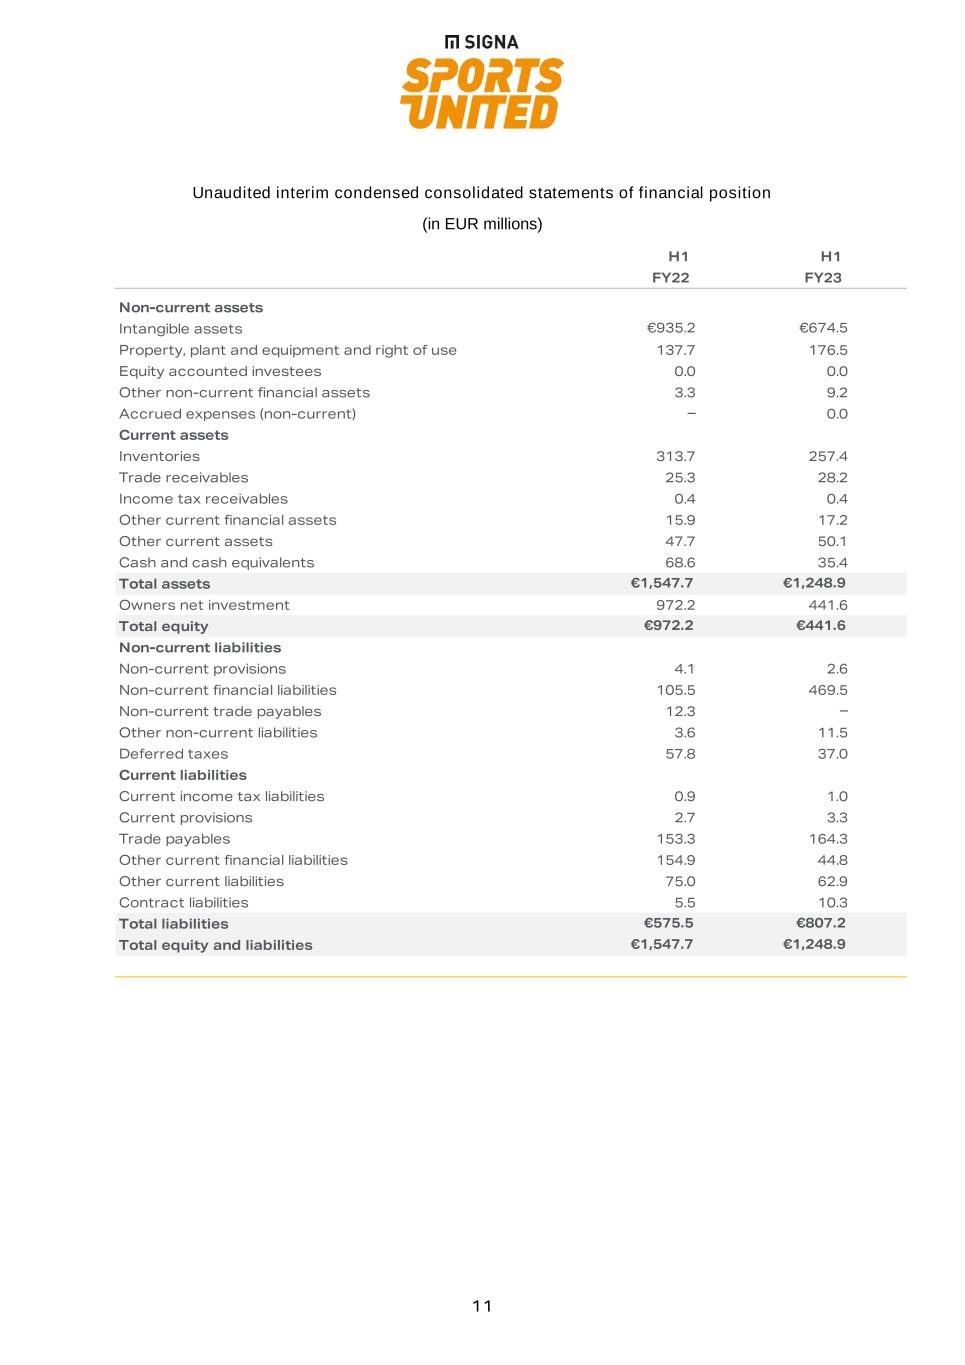
11 Unaudited interim condensed consolidated statements of financial position (in EUR millions) H1 H1 FY22 FY23 Non-current assets Intangible assets €935.2 €674.5 Property, plant and equipment and right of use 137.7 176.5 Equity accounted investees 0.0 0.0 Other non-current financial assets 3.3 9.2 Accrued expenses (non-current) – 0.0 Current assets Inventories 313.7 257.4 Trade receivables 25.3 28.2 Income tax receivables 0.4 0.4 Other current financial assets 15.9 17.2 Other current assets 47.7 50.1 Cash and cash equivalents 68.6 35.4 Total assets €1,547.7 €1,248.9 Owners net investment 972.2 441.6 Total equity €972.2 €441.6 Non-current liabilities Non-current provisions 4.1 2.6 Non-current financial liabilities 105.5 469.5 Non-current trade payables 12.3 – Other non-current liabilities 3.6 11.5 Deferred taxes 57.8 37.0 Current liabilities Current income tax liabilities 0.9 1.0 Current provisions 2.7 3.3 Trade payables 153.3 164.3 Other current financial liabilities 154.9 44.8 Other current liabilities 75.0 62.9 Contract liabilities 5.5 10.3 Total liabilities €575.5 €807.2 Total equity and liabilities €1,547.7 €1,248.9

12 Unaudited interim condensed consolidated statements of cash flows (in EUR millions) H1 H1 FY22 FY23 NET CASH FLOW FROM OPERATING ACTIVITIES Loss before taxes from continuing operations (€204.4) (€183.5) Loss before taxes from discontinued operations (€5.3) €0.5 Loss before taxes for the total operations (€209.7) (€183.0) Adjustments to reconcile losses before taxes to net cash from operating activities Depreciation, amortization and impairment €21.5 €27.9 (Income) loss from investments accouted for using the equity method €0.6 €0.8 Net finance costs (income) (€13.4) €13.4 Equity-based compensation expense €10.0 €3.0 Other non-cash income and expenses (€1.7) (€1.5) Listing expenses (IFRS 2 service charge) €121.9 – Change in other non-current assets €3.0 (€0.5) Change in other non-current liabilities €5.6 €4.8 Change in: Inventories (€44.7) €39.7 Trade receivables €3.3 (€3.2) Other current financial assets €5.6 €3.4 Other current assets (€5.3) €1.2 Current provisions (€2.2) €2.3 Trade payables €0.6 (€30.6) Other current financial liabilities €0.0 (€1.7) Other current liabilities (€44.3) (€12.7) Contract liabilities (€0.9) €1.1 Cash flow used in continuing operating activities (€144.7) (€136.2) Cash flow used in discontinued operating activities, net (€3.3) €1.1 Net cash flow used in operating activities (€148.0) (€135.1) NET CASH FLOW FROM INVESTING ACTIVITIES Purchase of intangible assets and property, plant and equipment (€20.4) (€16.7) Acquisition of subsidiaries, net of cash acquired (€169.9) – Cash flow used in continuing investing activities (€190.2) (€16.7) Cash flow used in discontinued investing activities, net (€0.3) (€0.0) Net cash flow used in investing activities (€190.6) (€16.7) NET CASH FLOW FROM FINANCING ACTIVITIES Proceeds from capital contributions €402.7 – Proceeds from the issue of convertible loans – 100.0 Repayments of financial liabilities to related parties – (0.0) Proceeds from financial liabilities to related parties – 62.0 Proceeds from financial liabilities to financial institutions 26.1 0.4 Repayment of financial liabilities to financial institutions (77.5) (0.8) Transaction costs related to the lisiting (€10.3) – Proceeds from the recapitalization 23.6 – Acquisition of NCI – (1.2) Repayment of other loans (0.7) – Payments for lease liabilities (6.2) (8.4) Interest paid (1.2) (6.9) Cash flow from continuing financing activities €356.6 €145.1 Cash flow used in discontinued financing activities, net (€0.2) (€0.4) Net cash flow from financing activities €356.4 €144.6 Effect of exchange rate changes on cash and cash equivalents – (0.4) Net increase (decrease) in cash and cash equivalents €17.8 (€7.5)