UNITED STATES
SECURITIES AND EXCHANGE COMMISSION
Washington, D.C. 20549
FORM N-CSR
Certified Shareholder Report of
Registered Management Investment Companies
Investment Company Act File Number: 811-23738
Capital Group Fixed Income ETF Trust
(Exact Name of Registrant as Specified in Charter)
6455 Irvine Center Drive
Irvine, California 92618
(Address of Principal Executive Offices)
Registrant's telephone number, including area code: (949) 975-5000
Date of fiscal year end: December 31
Date of reporting period: December 31, 2022
Troy S. Tanner
Capital Group Fixed Income ETF Trust
6455 Irvine Center Drive
Irvine, California 92618
(Name and Address of Agent for Service)
ITEM 1 – Reports to Stockholders
Capital Group Fixed Income ETF Trust
Annual report |  |

Fixed income
for a variety of
investor goals
The funds within Capital Group Fixed Income ETF Trust seek to pursue a variety of objectives for investors and are offered by Capital Group, home of American Funds®. For over 90 years, Capital Group has invested with a long-term focus based on thorough research and attention to risk.
Figures shown are past results and are not predictive of results in future periods. Current and future results may be lower or higher than those shown. Prices and returns will vary, so investors may lose money. Investing for short periods makes losses more likely. For current information and month-end results, visit capitalgroup.com. Market price returns are determined using the official closing price of the fund’s shares and do not represent the returns you would receive if you traded shares at other times.
Here are the average annual total returns on a $1,000 investment for periods ended December 31, 2022:
| Cumulative | ||||||||||
| Fund inception date | Since fund inception | Gross expense ratio | ||||||||
| Capital Group Core Plus Income ETF | 2/22/22 | 0.34 | % | |||||||
| Net asset value | –9.59 | % | ||||||||
| Market price | –9.39 | |||||||||
| Capital Group Municipal Income ETF | 10/25/22 | 0.27 | ||||||||
| Net asset value | 4.92 | |||||||||
| Market price | 5.24 | |||||||||
| Capital Group U.S. Multi-Sector Income ETF | 10/25/22 | 0.39 | ||||||||
| Net asset value | 3.63 | |||||||||
| Market price | 3.83 | |||||||||
| Capital Group Short Duration Income ETF | 10/25/22 | 0.25 | ||||||||
| Net asset value | 1.73 | |||||||||
| Market price | 2.01 | |||||||||
Capital Group exchange-traded funds (ETFs) are actively managed and do not seek to replicate a specific index. ETFs are bought and sold through an exchange at the then current market price, not net asset value (NAV), and are not individually redeemed from the fund. Shares may trade at a premium or discount to their NAV when traded on an exchange. Brokerage commissions will reduce returns. There can be no guarantee that an active market for ETFs will develop or be maintained, or that the ETF’s listing will continue or remain unchanged.
ETF market price returns since inception are calculated using NAV for the period until market price became available (generally a few days after inception).
As nondiversified funds, Capital Group ETFs have the ability to invest a larger percentage of assets in securities of individual issuers than a diversified fund. As a result, a single issuer could adversely affect a fund’s results more than if the fund invested a smaller percentage of assets in securities of that issuer. Refer to the applicable prospectus for details.
The expense ratio is as of the fund’s prospectus available at the time of publication. The expense ratio is estimated.
Investments are not FDIC-insured, nor are they deposits of or guaranteed by a bank or any other entity, so they may lose value.
Contents
| 1 | Letter to investors |
| 3 | Fund reviews |
| 7 | Funds’ 30-day yields |
| Investment portfolios | |
| 8 | Capital Group Core Plus Income ETF |
| 21 | Capital Group Municipal Income ETF |
| 28 | Capital Group U.S. Multi-Sector Income ETF |
| 37 | Capital Group Short Duration Income ETF |
| 46 | Financial statements |
| 73 | Board of trustees and other officers |
Fellow investors:
We are pleased to present this annual report for Capital Group Fixed Income ETF Trust, which includes Capital Group Core Plus Income ETF (ticker: CGCP), Capital Group Municipal Income ETF (ticker: CGMU), Capital Group U.S. Multi-Sector Income ETF (ticker: CGMS) and Capital Group Short Duration Income ETF (ticker:CGSD). It covers the period from the funds’ inceptions to December 31, 2022, the conclusion of the funds’ fiscal year.
Bond market overview
Last year was one of the most challenging on record for fixed income markets. Although economic growth in the U.S. and much of the rest of the world remained positive, developed economies experienced the highest levels of inflation in decades, deeply impacting financial markets. Central banks around the world took aggressive action to raise rates in an effort to control rising prices. As bond yields rose in response, prices fell —leading to losses across all major sectors.
In the U.S., a strong labor market alongside high and rising inflation led the U.S. Federal Reserve to raise its policy rate target sharply from 0–0.25% to 4.25–4.5% by the end of the year. The impact on bond yields was dramatic. The 10-year Treasury yield ended 2021 at 1.51% and peaked at 4.24% in October 2022, the highest since 2008 and an increase of 2.73%. It ultimately came back down to 3.88% by the end of the year, for a full-year change of 2.37%. For shorter term bonds, yields rose even more. Two- and five-year Treasuries ended the year at 4.43% and 4.01%, an increase of 3.70% and 2.75%, respectively, from when the year began. This characterizes a flattening of the yield curve, where short-term bond yields are rising faster than longer term bond yields. Much of the curve ended the year inverted, with short-term yields higher than longer term yields.
When bond yields rise, prices feel a negative impact. As a result, the sharp move upward in yields drove negative bond results across virtually all fixed income sectors. Returns for the Bloomberg U.S. Aggregate Index1 (the U.S. bond market “benchmark”) and the Bloomberg Global Aggregate Index2 were –13.01% and –16.25%, respectively. Amid heightened inflation, the Bloomberg U.S. Treasury Inflation-Protected Securities Index3 outpaced the broader market, with a return of –11.85%. Mortgage bonds also had a difficult year due to detrimental supply and demand dynamics, with the Bloomberg U.S. Mortgage Backed Securities Index4 returning –11.81%.
Within U.S. credit sectors, investment-grade bonds were among the weakest, as the Bloomberg U.S. Corporate Investment Grade Index5 posted a return of –15.76%. These higher quality corporate bonds were hit both by rising interest rates and higher risk premiums, characterized by their spreads to Treasuries widening 38 basis points. High-yield corporates did moderately better, as the Bloomberg U.S. Corporate High-Yield Index6 returned –11.19% due largely to its relative lower interest rate exposure and higher starting yields. That stronger result occurred despite an even broader 186-basis-point spread widening. In emerging markets debt, local currency bonds outpaced dollar-denominated bonds, with returns of
| 1 | Bloomberg U.S. Aggregate Index represents the U.S. investment-grade fixed-rate bond market. This index is unmanaged, and its results include reinvested dividends and/or distributions but do not reflect the effect of sales charges, commissions, account fees, expenses or U.S. federal income taxes. |
| 2 | Bloomberg Global Aggregate Index represents the global investment-grade fixed income markets. |
| 3 | Bloomberg U.S. Treasury Inflation-Protected Securities (TIPS) Index consists of investment-grade, fixed-rate, publicly placed, dollar-denominated and non-convertible inflation-protected securities issued by the U.S. Treasury that have at least one year remaining to maturity, and have at least $250 million par amount outstanding. |
| 4 | Bloomberg U.S. Mortgage Backed Securities Index is a market-value-weighted index that covers the mortgage-backed pass-through securities of Ginnie Mae (GNMA), Fannie Mae (FNMA), and Freddie Mac (FHLMC). |
| 5 | Bloomberg U.S. Corporate Investment Grade Index represents the universe of investment-grade, publicly issued U.S. corporate and specified foreign debentures and secured notes that meet the specified maturity, liquidity, and quality requirements. |
| 6 | Bloomberg U.S. Corporate High Yield Index covers the universe of fixed-rate, non-investment-grade debt. |
Past results are not predictive of results in future periods.
| Capital Group Fixed Income ETF Trust | 1 |
–11.69% for the JPM GBI-EM Global Diversified Index7 and –17.78% for the JPM EMBI Global Diversified Index.8
Turning to the municipal bond market, the selloff in municipal bonds in 2022 sent yields to 15-year highs. However, strong state reserve levels — the highest in more than 40 years — and the longer lag time for lower tax revenue and other negative recessionary impacts to flow to munis compared to corporate credit and high-yield bonds helped the Bloomberg Municipal Bond Index9 see smaller losses. The index’s return was –8.53% in 2022.
Inside the funds
When presented with one of the most challenging years in bond market history, CGCP — the fixed income ETF that launched in February — found opportunities in a higher rate environment, while pursuing some resilience in line with a core-plus approach. The fund focused investments on high-conviction interest rate and credit strategies, consisting largely of high-quality assets such as U.S. Treasuries and investment-grade bonds. Although its return was negative, the fund outpaced its benchmark since inception.
CGSD, CGMS and CGMU launched in October and pursue a range of objectives. Each fund outpaced their respective benchmarks during their short histories. CGSD saw opportunities in shorter duration asset-backed securities which managers felt provided attractive yields without structurally more interest rate or duration risk. In CGMS, managers were selective in high yield and credit sectors as macroeconomic risks tilted to the downside and suggested a more cautious approach. Meanwhile, CGMU focused on flexibility to take advantage of any weaknesses that could arise in select municipal credit sectors.
Looking ahead
Entering the year, interest rate markets appear to be more pessimistic than credit and equity markets in terms of outlook. We expect the Fed to end its interest rate hikes sometime in the first half of 2023, with its policy rate peaking near 5%. How quickly the central bank will pivot to rate cuts depends in large part on policymakers’ view of whether inflation is contained and also whether a recession hits. While we do not have a strong view on recession timing or depth, signals from the yield curve and other indicators lead us to believe that a recession is more likely than average in 2023.
Looking at these interest rate and yield curve indicators leads us to remain cautious on credit. Managers across the funds maintained a largely defensive posture entering the year. This includes hedging broad high-yield corporate bond market risk. Across credit sectors, managers intend to invest selectively in idiosyncratic opportunities unearthed by our research analysts.
Broadly speaking, managers are optimistic on bond market prospects in 2023, particularly compared to what investors experienced in 2022. The year begins with major bond sector yields near or above the highest levels since 2010. That provides strong income potential contributing to total return. It also creates a thicker cushion against potential bond price losses if yields drift higher than markets anticipate or if credit deteriorates and risk premiums rise. Unlike the sharp rate hikes we saw last year, by the end of 2023 markets anticipate cuts could be employed, which historically have provided a tailwind to bond returns.
While managers believe the uncertain fixed income environment may present opportunities, macroeconomic headwinds reinforce the need for active interest rate risk management and selectivity within credit sectors. Managers will continue to employ abundant resources to identify attractively valued opportunities to pursue the funds’ investment objectives.
Cordially,

David A. Hoag
President, Capital Group Core Plus Income ETF

Courtney K. Wolf
President, Capital Group Municipal Income ETF

Damien J. McCann
President, Capital Group U.S. Multi-Sector Income ETF

Vincent J. Gonzales
President, Capital Group Short Duration Income ETF
February 14, 2023
For current information about the fund, visit capitalgroup.com.
| 7 | J.P. Morgan Government Bond Index - Emerging Markets (GBI-EM) Global Diversified: JP Morgan Government Bond Index – Emerging Markets Global Diversified covers the universe of regularly traded, liquid fixed-rate, domestic currency emerging market government bonds to which international investors can gain exposure. |
| 8 | J.P. Morgan Emerging Markets Bond Index (EMBI) Global Diversified: The J.P. Morgan Emerging Market Bond Index (EMBI) Global Diversified is a uniquely weighted emerging market debt benchmark that tracks total returns for U.S. dollar-denominated bonds issued by emerging market sovereign and quasi-sovereign entities. |
| 9 | Bloomberg Municipal Bond Index is a market-value-weighted index designed to represent the long-term investment-grade tax-exempt bond market. This index is unmanaged, and its results include reinvested distributions but do not reflect the effect of sales charges, commissions, account fees, expenses or U.S. federal income taxes. |
Past results are not predictive of results in future periods.
| 2 | Capital Group Fixed Income ETF Trust |
Capital Group Core Plus Income ETF
Capital Group Core Plus Income ETF seeks to provide current income and maximum total return, consistent with preservation of capital.
The fund registered a total return of –9.59% on a net asset value (NAV) basis and –9.39% on a market price basis for inception (February 22, 2022) to fiscal year-end date. The fund’s benchmark index, the Bloomberg U.S. Aggregate Index, a market value-weighted index that represents the U.S. investment-grade fixed-rate bond market, posted a –9.61% decrease. For the fiscal year, the fund paid an average monthly dividend of more than 6 cents a share.
By the end of 2022, managers positioned CGCP to benefit should financial conditions tighten further by taking advantage of what they believe are attractive valuations in some sectors to hedge their base-case positioning should market conditions evolve unexpectedly. The fund was also underweight duration at the end of 2022 as yields are below the level the managers view as fair pricing. Managers believe inflation has peaked but will remain elevated and anticipate market expectations coalescing around tighter-than-expected monetary policy.
The portfolio has a sizeable allocation to credit to pursue its income objective. However, given the outsized macroeconomic risks, managers are more cautious with their credit exposure — particularly overall investment in the sector and quality — compared to an allocation in an environment with less perceived risk. Within the credit markets, at the end of 2022, managers saw more attractive valuations and idiosyncratic opportunities in the high-yield and securitized credit sectors compared to investment-grade credit and emerging market debt.
How a hypothetical $10,000 investment has grown
since fund’s inception on February 22, 2022 (with all distributions reinvested)

The results shown are before taxes on fund distributions and sale of fund shares.
Results at a glance
For periods ended December 31, 2022, with all distributions reinvested
| Cumulative total returns | ||||
| Lifetime (since 2/22/22) | ||||
| Capital Group Core Plus Income ETF | ||||
| Net asset value | –9.59 | % | ||
| Market price* | –9.39 | |||
| Bloomberg U.S. Aggregate Index† | –9.61 | |||
| * | ETF market price results since inception are calculated using NAV for the period until market price became available (generally a few days after inception). |
| † | Source: Bloomberg Index Services Ltd. Bloomberg U.S. Aggregate Index represents the U.S. investment-grade fixed-rate bond market. The market index is unmanaged and, therefore, has no expenses. Investors cannot invest directly in an index. |
Past results are not predictive of results in future periods.
| Capital Group Fixed Income ETF Trust | 3 |
Capital Group Municipal Income ETF
Capital Group Municipal Income ETF seeks to provide a high level of current income exempt from regular federal income tax, consistent with the preservation of capital.
The fund registered a total return of 4.92% on a net asset value (NAV) basis and 5.24% on a market price basis for inception (October 25, 2022) to fiscal year-end date, surpassing the 3.90% total return of the fund’s benchmark index, the 85%/15% Bloomberg 1-15 Year Blend (1-17 Year) Municipal Bond Index/Bloomberg 1-15 Year Blend (1-17 Year) High Yield Municipal Bond Index, which blends the Bloomberg 1-15 Year Blend (1-17) Municipal Bond Index with the Bloomberg 1-15 Year Blend (1-17) High Yield Municipal Bond Index by weighting their cumulative total returns at 85% and 15%, respectively. The blend is rebalanced monthly. Bloomberg 1-15 Year Blend (1-17) Municipal Bond Index consists of a broad selection of investment-grade general obligation and revenue bonds of maturities ranging from one year to 17 years. Bloomberg 1-15 Year Blend (1-17) High Yield Municipal Bond Index consists of a broad selection of below-investment-grade general obligation and revenue bonds of maturities ranging from one year to 17 years.
At the end of 2022, managers saw significant opportunity in the municipal housing sector and in select, attractively valued opportunities in waste/pollution facilities. Managers were less attracted to state general obligation debt. Given the heightened macroeconomic risks that may lead to wider spreads in the future, managers remain focused on higher-quality credit. The fund’s holdings had a longer average duration compared to the benchmark, reflecting managers’ belief that the Fed was nearing the end of its rate hike cycle, as well as what managers felt were attractive yields in the muni market.
Results at a glance
For periods ended December 31, 2022, with all distributions reinvested
| Cumulative total returns | ||||
| Lifetime (since 10/25/22) | ||||
| Capital Group Municipal Income ETF | ||||
| Net asset value | 4.92 | % | ||
| Market price* | 5.24 | |||
| 85%/15% Bloomberg 1-15 Year Blend (1-17 Year) Municipal Bond Index/ Bloomberg 1-15 Year Blend (1-17 Year) High Yield Municipal Bond Index† | 3.90 | |||
| * | ETF market price results since inception are calculated using NAV for the period until market price became available (generally a few days after inception). |
| † | Source: Bloomberg Index Services Ltd. 85%/15% Bloomberg 1-15 Year Blend (1-17) Municipal Bond Index/Bloomberg 1-15 Year Blend (1-17) High Yield Municipal Bond Index blends the Bloomberg 1-15 Year Blend (1-17) Municipal Bond Index with the Bloomberg 1-15 Year Blend (1-17) High Yield Municipal Bond Index by weighting their cumulative total returns at 85% and 15%, respectively. The blend is rebalanced monthly. Bloomberg 1-15 Year Blend (1-17) Municipal Bond Index consists of a broad selection of investment-grade general obligation and revenue bonds of maturities ranging from one year to 17 years. Bloomberg 1-15 Year Blend (1-17) High Yield Municipal Bond Index consists of a broad selection of below-investment-grade general obligation and revenue bonds of maturities ranging from one year to 17 years. The indexes are unmanaged, and results include reinvested distributions but do not reflect the effect of sales charges, commissions, account fees, expenses or U.S. federal income taxes. |
Past results are not predictive of results in future periods.
| 4 | Capital Group Fixed Income ETF Trust |
Capital Group U.S. Multi-Sector Income ETF
Capital Group U.S. Multi-Sector Income ETF seeks to provide a high level of current income. Its secondary investment objective is capital appreciation.
The fund registered a total return of 3.63% on a net asset value (NAV) basis and 3.83% on a market price basis for inception (October 25, 2022) to fiscal year-end date, surpassing the 3.59% total return of the fund’s benchmark index, the Bloomberg U.S. Aggregate Index, a market value-weighted index that represents the U.S. investment-grade fixed-rate bond market.
At the end of 2022, portfolio managers preferred higher quality bonds as macroeconomic risks seemed weighted toward the downside. Securitized credit was a high conviction within the portfolio as pockets of the market were attractive from a relative valuation perspective.
Results at a glance
For periods ended December 31, 2022, with all distributions reinvested
| Cumulative total returns | ||||
| Lifetime (since 10/25/22) | ||||
| Capital Group U.S. Multi-Sector Income ETF | ||||
| Net asset value | 3.63 | % | ||
| Market price* | 3.83 | |||
| Bloomberg U.S. Aggregate Index† | 3.59 | |||
| * | ETF market price results since inception are calculated using NAV for the period until market price became available (generally a few days after inception). |
| † | Source: Bloomberg Index Services Ltd. Bloomberg U.S. Aggregate Index represents the U.S. investment-grade fixed-rate bond market. The market index is unmanaged and, therefore, has no expenses. Investors cannot invest directly in an index. |
Past results are not predictive of results in future periods.
| Capital Group Fixed Income ETF Trust | 5 |
Capital Group Short Duration Income ETF
Capital Group Short Duration Income ETF seeks to provide current income, consistent with a short duration profile as described in the prospectus and with the preservation of capital.
The fund registered a total return of 1.73% on a net asset value (NAV) basis and 2.01% on a market price basis for inception (October 25, 2022) to fiscal year-end date surpassing the 1.05% increase of the fund’s benchmark index, the Bloomberg U.S. Government /Credit (1-3 years) Index, which is a market-value weighted index that tracks the total return results of fixed-rate, publicly placed, dollar-denominated obligations issued by the U.S. Treasury, U.S. government agencies, quasi-federal corporations, corporate or foreign debt guaranteed by the U.S. government, and U.S. corporate and foreign debentures and secured notes that meet specified maturity, liquidity and quality requirements, with maturities of one to three years.
At the end of 2022, the average duration of the fund’s holdings was less than two years, as three-month, six-month and one-year maturities offered the highest yields along the yield curve. The fund’s positioning reflected managers’ belief that yields would continue to steepen along shorter maturities. The fund was most heavily invested in investment grade corporate bonds. In the securitized sector, the fund was mostly invested in mortgage-backed securities and asset-backed securities.
Results at a glance
For periods ended December 31, 2022, with all distributions reinvested
| Cumulative total returns | ||||
| Lifetime (since 10/25/22) | ||||
| Capital Group Short Duration Income ETF | ||||
| Net asset value | 1.73 | % | ||
| Market price* | 2.01 | |||
| Bloomberg U.S. Government/Credit (1-3 years) Index† | 1.05 | |||
| * | ETF market price results since inception are calculated using NAV for the period until market price became available (generally a few days after inception). |
| † | Source: Bloomberg Index Services Ltd. Bloomberg 1-3 Year U.S. Government/Credit Index is a market-value weighted index that tracks the total return results of fixed-rate, publicly placed, dollar-denominated obligations issued by the U.S. Treasury, U.S. government agencies, quasi-federal corporations, corporate or foreign debt guaranteed by the U.S. government, and U.S. corporate and foreign debentures and secured notes that meet specified maturity, liquidity and quality requirements, with maturities of one to three years. This index is unmanaged, and its results include reinvested distributions but do not reflect the effect of sales charges, commissions, account fees, expenses or U.S. federal income taxes. |
Past results are not predictive of results in future periods.
| 6 | Capital Group Fixed Income ETF Trust |
Funds’ 30-day yields
Below is a summary of each fund’s 30-day yield as of December 31, 2022. Each fund’s 30-day yield is calculated in accordance with the U.S. Securities and Exchange Commission (SEC) formula. The SEC yield reflects the rate at which each fund is earning income on its current portfolio of securities. Accordingly, the funds’ SEC yields may differ.
| Fund inception date | 30 day SEC yield as of 12/31/22 | |||||
| Capital Group Core Plus Income ETF | 2/22/22 | 4.79 | % | |||
| Capital Group Municipal Income ETF | 10/25/22 | 3.37 | ||||
| Capital Group U.S. Multi-Sector Income ETF | 10/25/22 | 6.26 | ||||
| Capital Group Short Duration Income ETF | 10/25/22 | 4.04 | ||||
Past results are not predictive of results in future periods.
| Capital Group Fixed Income ETF Trust | 7 |
Capital Group Core Plus Income ETF
| Investment portfolio December 31, 2022 | |
| Portfolio by type of security | Percent of net assets |
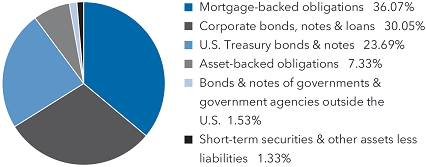
| Portfolio quality summary* | Percent of net assets | |||
| U.S. Treasury and agency† | 23.69 | % | ||
| AAA/Aaa | 31.21 | |||
| AA/Aa | 6.02 | |||
| A/A | 8.93 | |||
| BBB/Baa | 14.14 | |||
| Below investment grade | 14.68 | |||
| Short-term securities & other assets less liabilities | 1.33 | |||
| * | Bond ratings, which typically range from AAA/Aaa (highest) to D (lowest), are assigned by credit rating agencies such as Standard & Poor’s, Moody’s and/or Fitch as an indication of an issuer’s creditworthiness. In assigning a credit rating to a security, the fund looks specifically to the ratings assigned to the issuer of the security by Standard & Poor’s, Moody’s and/or Fitch. If agency ratings differ, the security will be considered to have received the highest of those ratings, consistent with the fund’s investment policies. The ratings are not covered by the Report of Independent Registered Public Accounting Firm. |
| † | These securities are guaranteed by the full faith and credit of the U.S. government. |
| Bonds, notes & other debt instruments 98.67% | Principal amount (000) | Value (000) | ||||||
| Mortgage-backed obligations 36.07% | ||||||||
| Federal agency mortgage-backed obligations 29.55% | ||||||||
| Fannie Mae Pool #FS0647 3.00% 2/1/20521 | USD | 4,344 | $ | 3,877 | ||||
| Fannie Mae Pool #FS0893 3.00% 2/1/20521 | 861 | 757 | ||||||
| Fannie Mae Pool #FS1030 3.00% 3/1/20521 | 944 | 830 | ||||||
| Fannie Mae Pool #BV3117 3.00% 3/1/20521 | 800 | 703 | ||||||
| Fannie Mae Pool #BV2954 3.00% 3/1/20521 | 750 | 662 | ||||||
| Fannie Mae Pool #FS1405 3.00% 4/1/20521 | 824 | 724 | ||||||
| Fannie Mae Pool #BU8933 3.00% 4/1/20521 | 774 | 680 | ||||||
| Fannie Mae Pool #CB3361 3.00% 4/1/20521 | 766 | 674 | ||||||
| Fannie Mae Pool #CB3586 3.00% 5/1/20521 | 2,801 | 2,462 | ||||||
| Fannie Mae Pool #BW1128 3.00% 6/1/20521 | 1,000 | 879 | ||||||
| Fannie Mae Pool #CB3890 3.00% 6/1/20521 | 743 | 653 | ||||||
| Fannie Mae Pool #BV7903 3.50% 8/1/20521 | 2,000 | 1,820 | ||||||
| Fannie Mae Pool #BW7610 3.50% 8/1/20521 | 1,000 | 910 | ||||||
| Fannie Mae Pool #BW9184 4.00% 9/1/20521 | 4,000 | 3,756 | ||||||
| Fannie Mae Pool #MA4732 4.00% 9/1/20521 | 2,500 | 2,347 | ||||||
| Fannie Mae Pool #BW1201 5.00% 9/1/20521 | 1,740 | 1,718 | ||||||
| Fannie Mae Pool #MA4784 4.50% 10/1/20521 | 1,723 | 1,660 | ||||||
| Fannie Mae Pool #BW1226 4.50% 10/1/20521 | 1,577 | 1,520 | ||||||
| Fannie Mae Pool #MA4785 5.00% 10/1/20521 | 2,400 | 2,369 | ||||||
| Fannie Mae Pool #CB5380 5.00% 10/1/20521 | 1,598 | 1,578 | ||||||
| Fannie Mae Pool #MA4803 3.50% 11/1/20521 | 300 | 273 | ||||||
| Fannie Mae Pool #MA4804 4.00% 11/1/20521 | 2,915 | 2,737 | ||||||
| Fannie Mae Pool #MA4805 4.50% 11/1/20521 | 3,331 | 3,209 | ||||||
| Fannie Mae Pool #BX1342 4.50% 11/1/20521 | 2,476 | 2,386 | ||||||
| Fannie Mae Pool #MA4806 5.00% 11/1/20521 | 2,373 | 2,343 | ||||||
| Fannie Mae Pool #BX1274 5.50% 11/1/20521 | 100 | 100 | ||||||
| Fannie Mae Pool #MA4839 4.00% 12/1/20521 | 3,000 | 2,817 | ||||||
| Fannie Mae Pool #MA4841 5.00% 12/1/20521 | 848 | 837 | ||||||
| Freddie Mac Pool #QC3826 3.00% 7/1/20511 | 1,000 | 879 | ||||||
| Freddie Mac Pool #QD5662 3.00% 1/1/20521 | 1,000 | 879 | ||||||
| Freddie Mac Pool #QD7819 3.00% 2/1/20521 | 869 | 764 | ||||||
| Freddie Mac Pool #QD7918 3.00% 3/1/20521 | 880 | 773 | ||||||
| 8 | Capital Group Fixed Income ETF Trust |
Capital Group Core Plus Income ETF (continued)
| Bonds, notes & other debt instruments (continued) | Principal amount (000) | Value (000) | ||||||
| Mortgage-backed obligations (continued) | ||||||||
| Federal agency mortgage-backed obligations (continued) | ||||||||
| Freddie Mac Pool #QD8673 3.00% 3/1/20521 | USD | 847 | $ | 744 | ||||
| Freddie Mac Pool #SD8206 3.00% 4/1/20521 | 941 | 827 | ||||||
| Freddie Mac Pool #SD1156 3.00% 4/1/20521 | 924 | 813 | ||||||
| Freddie Mac Pool #RA7130 3.00% 4/1/20521 | 869 | 766 | ||||||
| Freddie Mac Pool #QE2315 3.00% 4/1/20521 | 500 | 440 | ||||||
| Freddie Mac Pool #QE2503 3.00% 5/1/20521 | 1,000 | 879 | ||||||
| Freddie Mac Pool #SD1121 3.50% 6/1/20521 | 8,980 | 8,171 | ||||||
| Freddie Mac Pool #QE5066 3.50% 6/1/20521 | 1,000 | 910 | ||||||
| Freddie Mac Pool #QE4383 4.00% 6/1/20521 | 800 | 751 | ||||||
| Freddie Mac Pool #QE7503 3.50% 8/1/20521 | 600 | 546 | ||||||
| Freddie Mac Pool #QE8253 4.50% 8/1/20521 | 400 | 385 | ||||||
| Freddie Mac Pool #QF1489 4.00% 10/1/20521 | 2,000 | 1,878 | ||||||
| Freddie Mac Pool #SD8256 4.00% 10/1/20521 | 1,900 | 1,784 | ||||||
| Freddie Mac Pool #QF1925 4.00% 10/1/20521 | 650 | 610 | ||||||
| Freddie Mac Pool #SD8257 4.50% 10/1/20521 | 6,571 | 6,331 | ||||||
| Freddie Mac Pool #SD8275 4.50% 12/1/20521 | 1,992 | 1,919 | ||||||
| Freddie Mac Pool #QF4182 5.00% 12/1/20521 | 1,592 | 1,572 | ||||||
| Freddie Mac Pool #SD8276 5.00% 12/1/20521 | 907 | 896 | ||||||
| Freddie Mac Pool #SD8286 4.00% 1/1/20531 | 6,000 | 5,634 | ||||||
| Freddie Mac Pool #SD8288 5.00% 1/1/20531 | 1,000 | 987 | ||||||
| Government National Mortgage Assn. 3.50% 1/1/20531 | 5,435 | 4,994 | ||||||
| Uniform Mortgage-Backed Security 2.50% 1/1/20531,2 | 4,200 | 3,557 | ||||||
| Uniform Mortgage-Backed Security 4.50% 1/1/20531,2 | 15,300 | 14,727 | ||||||
| Uniform Mortgage-Backed Security 5.00% 1/1/20531,2 | 5,600 | 5,519 | ||||||
| Uniform Mortgage-Backed Security 5.50% 1/1/20531,2 | 12,100 | 12,134 | ||||||
| Uniform Mortgage-Backed Security 3.00% 2/1/20531,2 | 2,500 | 2,197 | ||||||
| Uniform Mortgage-Backed Security 3.50% 2/1/20531,2 | 2,000 | 1,818 | ||||||
| Uniform Mortgage-Backed Security 4.00% 2/1/20531,2 | 2,000 | 1,876 | ||||||
| Uniform Mortgage-Backed Security 4.50% 2/1/20531,2 | 1,200 | 1,155 | ||||||
| Uniform Mortgage-Backed Security 5.00% 2/1/20531,2 | 1,000 | 985 | ||||||
| 134,381 | ||||||||
| Commercial mortgage-backed securities 5.26% | ||||||||
| 3650R Commercial Mortgage Trust, Series 2022-PF2, Class B, 5.289% 11/15/20551 | 1,690 | 1,494 | ||||||
| Bank Commercial Mortgage Trust, Series 2019-BN19, Class B, 3.647% 8/15/20611 | 1,000 | 811 | ||||||
| Bank Commercial Mortgage Trust, Series 2019-BN24, Class B, 3.455% 11/15/20621 | 1,033 | 829 | ||||||
| Bank Commercial Mortgage Trust, Series 2022-BNK40, Class AS, 3.394% 3/15/20641,3 | 250 | 208 | ||||||
| Bank Commercial Mortgage Trust, Series 2022-BNK40, Class B, 3.394% 3/15/20641,3 | 273 | 208 | ||||||
| Barclays Commercial Mortgage Securities, LLC, Series 2022-C18, Class C, 6.148% 12/15/20551 | 1,355 | 1,167 | ||||||
| Benchmark Mortgage Trust, Series 2020-B21, Class AS, 2.2543% 12/17/20531 | 250 | 194 | ||||||
| Benchmark Mortgage Trust, Series 2022-B35, Class C, 4.445% 5/15/20551,3 | 2,005 | 1,573 | ||||||
| Boca Commercial Mortgage Trust, Series 2022-BOCA, Class A, (1-month USD CME Term SOFR + 1.7696%) 6.105% 5/15/20391,3,4 | 623 | 612 | ||||||
| Boca Commercial Mortgage Trust, Series 2022-BOCA, Class B, (1-month USD CME Term SOFR + 2.3191%) 6.655% 5/15/20391,3,4 | 317 | 306 | ||||||
| BX Trust, Series 2022-CSMO, Class A, (1-month USD CME Term SOFR + 2.115%) 6.450% 6/15/20271,3,4 | 716 | 712 | ||||||
| BX Trust, Series 2021-SDMF, Class D, (1-month USD-LIBOR + 1.387%) 5.705% 9/15/20341,3,4 | 500 | 470 | ||||||
| BX Trust, Series 2021-ARIA, Class B, (1-month USD-LIBOR + 1.297%) 5.615% 10/15/20361,4 | 2,976 | 2,799 | ||||||
| BX Trust, Series 2022-IND, Class D, (1-month USD CME Term SOFR + 2.839%) 7.175% 4/15/20371,3,4 | 147 | 139 | ||||||
| BX Trust, Series 2022-PSB, Class A, (1-month USD CME Term SOFR + 2.451%) 6.787% 8/15/20391,3,4 | 760 | 760 | ||||||
| BX Trust, Series 2022-GPA, Class B, (1-month USD CME Term SOFR + 2.664%) 7.00% 10/15/20391,3,4 | 982 | 976 | ||||||
| BX Trust, Series 2022-GPA, Class C, (1-month USD CME Term SOFR + 3.213%) 7.549% 10/15/20391,3,4 | 622 | 617 | ||||||
| BX Trust, Series 2022-GPA, Class D, (1-month USD CME Term SOFR + 4.061%) 8.397% 10/15/20391,3,4 | 169 | 168 | ||||||
| Capital Group Fixed Income ETF Trust | 9 |
Capital Group Core Plus Income ETF (continued)
| Bonds, notes & other debt instruments (continued) | Principal amount (000) | Value (000) | ||||||
| Mortgage-backed obligations (continued) | ||||||||
| Commercial mortgage-backed securities (continued) | ||||||||
| BXSC Commercial Mortgage Trust, Series 2022-WSS, Class B, (1-month USD CME Term SOFR + 2.092%) 6.428% 3/15/20351,4 | USD | 2,985 | $ | 2,894 | ||||
| BXSC Commercial Mortgage Trust, Series 2022-WSS, Class D, (1-month USD CME Term SOFR + 3.188%) 7.524% 3/15/20351,3,4 | 249 | 238 | ||||||
| Citigroup Commercial Mortgage Trust, Series 2015-GC27, Class C, 4.418% 2/10/20481,3 | 448 | 406 | ||||||
| Extended Stay America Trust, Series 2021-ESH, Class D, (1-month USD-LIBOR + 2.25%) 6.568% 7/15/20381,3,4 | 488 | 468 | ||||||
| Great Wolf Trust, Series 2019-WOLF, Class A, (1-month USD-LIBOR + 1.034%) 5.352% 12/15/20361,4 | 730 | 710 | ||||||
| ILPT Commercial Mortgage Trust, Series 2022-LPF2, Class B, (1-month USD CME Term SOFR + 2.744%) 7.080% 10/15/20391,3,4 | 409 | 408 | ||||||
| ILPT Commercial Mortgage Trust, Series 2022-LPF2, Class C, (1-month USD CME Term SOFR + 3.493%) 7.829% 10/15/20391,3,4 | 545 | 540 | ||||||
| Morgan Stanley Bank of America Merrill Lynch Trust, Series 2015-C20, Class B, 4.16% 2/15/20481 | 2,000 | 1,869 | ||||||
| Morgan Stanley Capital I Trust, Series 2019-L3, Class B, 3.659% 11/15/20521,3 | 750 | 611 | ||||||
| Wells Fargo Commercial Mortgage Trust, Series 2015-LC22, Class C, 4.550% 9/15/20581,3 | 130 | 117 | ||||||
| WMRK Commercial Mortgage Trust, Series 2022-WMRK, Class A, (1-month USD CME Term SOFR + 2.789%) 7.125% 11/15/20271,4 | 1,646 | 1,644 | ||||||
| 23,948 | ||||||||
| Collateralized mortgage-backed obligations (privately originated) 1.26% | ||||||||
| Cascade Funding Mortgage Trust, Series 2020-HB4, Class M3, 2.720% 12/26/20301,3,4 | 500 | 465 | ||||||
| Connecticut Avenue Securities, Series 2022-R03, Class 1M1, (30-day Average USD-SOFR + 2.10%) 6.028% 3/25/20421,3,4 | 286 | 284 | ||||||
| Freddie Mac Structured Agency Credit Risk Debt Notes, Series 2021-DNA6, Class M2, (30-day Average USD-SOFR + 1.50%) 5.428% 10/25/20411,3,4 | 793 | 754 | ||||||
| Freddie Mac Structured Agency Credit Risk Debt Notes, Series 2022-DNA3, Class M1A, (30-day Average USD-SOFR + 2.00%) 5.928% 4/25/20421,3,4 | 535 | 532 | ||||||
| Freddie Mac Structured Agency Credit Risk Debt Notes, Series 2020-DNA3, Class B1, (1-month USD-LIBOR + 5.10%) 9.489% 6/27/20501,3,4 | 1,100 | 1,147 | ||||||
| Legacy Mortgage Asset Trust, Series 2022-GS1, Class A1, 4.00% 2/25/2061 (7.00% on 4/25/2025)1,4,5 | 1,818 | 1,684 | ||||||
| Progress Residential Trust, Series 2021-SFR4, Class F, 3.407% 5/17/20381,4 | 1,000 | 853 | ||||||
| 5,719 | ||||||||
| Total mortgage-backed obligations | 164,048 | |||||||
| Corporate bonds, notes & loans 30.05% Financials 5.73% | ||||||||
| Advisor Group Holdings, LLC 6.25% 3/1/20284 | 925 | 852 | ||||||
| AerCap Ireland Capital DAC 1.75% 1/30/2026 | 150 | 132 | ||||||
| AerCap Ireland Capital DAC 3.30% 1/30/2032 | 1,300 | 1,020 | ||||||
| AerCap Ireland Capital DAC 3.85% 10/29/2041 | 1,025 | 728 | ||||||
| AG TTMT Escrow Issuer, LLC 8.625% 9/30/20274 | 200 | 202 | ||||||
| AIA Group, Ltd. 3.375% 4/7/2030 | 450 | 396 | ||||||
| American Express Co. 2.55% 3/4/2027 | 150 | 137 | ||||||
| American Express Co. 4.05% 5/3/2029 | 450 | 430 | ||||||
| American Express Co. 4.42% 8/3/2033 (USD-SOFR + 1.76% on 8/3/2032)5 | 791 | 750 | ||||||
| American International Group, Inc. 4.375% 6/30/2050 | 250 | 213 | ||||||
| Bangkok Bank PCL 3.733% 9/25/2034 (5-year UST Yield Curve Rate T Note Constant Maturity + 1.90% on 9/25/2029)5 | 450 | 377 | ||||||
| Bank of America Corp. 4.948% 7/22/2028 (USD-SOFR + 2.04% on 7/22/2027)5 | 750 | 734 | ||||||
| Bank of America Corp. 2.972% 2/4/2033 (USD-SOFR + 1.33% on 2/4/2032)5 | 450 | 364 | ||||||
| Bank of America Corp. 4.571% 4/27/2033 (USD-SOFR + 1.83% on 4/27/2032)5 | 650 | 596 | ||||||
| Bank of America Corp. 5.015% 7/22/2033 (USD-SOFR + 2.16% on 7/22/2032)5 | 801 | 763 | ||||||
| Bank of Montreal 2.65% 3/8/2027 | 350 | 320 | ||||||
| Bank of Nova Scotia 2.45% 2/2/2032 | 125 | 101 | ||||||
| Berkshire Hathaway, Inc. 3.85% 3/15/2052 | 400 | 321 | ||||||
| BNP Paribas SA 2.591% 1/20/2028 (USD-SOFR + 1.228% on 1/20/2027)4,5 | 200 | 176 | ||||||
| Charles Schwab Corp. 2.45% 3/3/2027 | 100 | 91 | ||||||
| Citigroup, Inc. 3.057% 1/25/2033 (USD-SOFR + 1.351% on 1/25/2032)5 | 115 | 93 | ||||||
| 10 | Capital Group Fixed Income ETF Trust |
Capital Group Core Plus Income ETF (continued)
| Bonds, notes & other debt instruments (continued) | Principal amount (000) | Value (000) | ||||||
| Corporate bonds, notes & loans (continued) | ||||||||
| Financials (continued) | ||||||||
| Citigroup, Inc. 4.91% 5/24/2033 (USD-SOFR + 2.086% on 5/24/2032)5 | USD | 106 | $ | 100 | ||||
| Citigroup, Inc. 6.27% 11/17/2033 (USD-SOFR + 2.338% on 11/17/2032)5 | 1,044 | 1,080 | ||||||
| CME Group, Inc. 2.65% 3/15/2032 | 150 | 126 | ||||||
| Coinbase Global, Inc. 3.625% 10/1/20314 | 350 | 169 | ||||||
| Compass Diversified Holdings 5.25% 4/15/20294 | 1,145 | 981 | ||||||
| Compass Diversified Holdings 5.00% 1/15/20324 | 295 | 235 | ||||||
| Corebridge Financial, Inc. 3.85% 4/5/20294 | 299 | 273 | ||||||
| Corebridge Financial, Inc. 3.90% 4/5/20324 | 361 | 316 | ||||||
| Corebridge Financial, Inc. 4.35% 4/5/20424 | 98 | 81 | ||||||
| Corebridge Financial, Inc. 4.40% 4/5/20524 | 1,197 | 955 | ||||||
| Credit Suisse Group AG 9.016% 11/15/2033 (USD-SOFR + 5.02% on 11/15/2032)4,5 | 250 | 257 | ||||||
| Danske Bank AS 4.298% 4/1/2028 (1-year UST Yield Curve Rate T Note Constant Maturity + 1.75% on 4/1/2027)4,5 | 275 | 253 | ||||||
| Discover Financial Services 6.70% 11/29/2032 | 125 | 127 | ||||||
| Goldman Sachs Group, Inc. 1.757% 1/24/2025 (USD-SOFR + 0.73% on 1/24/2024)5 | 40 | 38 | ||||||
| Goldman Sachs Group, Inc. 3.102% 2/24/2033 (USD-SOFR + 1.41% on 2/24/2032)5 | 455 | 371 | ||||||
| Goldman Sachs Group, Inc. 3.436% 2/24/2043 (USD-SOFR + 1.632% on 2/24/2042)5 | 385 | 284 | ||||||
| HSBC Holdings PLC 5.402% 8/11/2033 (USD-SOFR + 2.87% on 8/11/2032)5 | 925 | 859 | ||||||
| ING Groep NV 4.017% 3/28/2028 (USD-SOFR + 1.83% on 3/28/2027)5 | 375 | 351 | ||||||
| ING Groep NV 4.252% 3/28/2033 (USD-SOFR + 2.07% on 3/28/2032)5 | 249 | 220 | ||||||
| Intercontinental Exchange, Inc. 4.35% 6/15/2029 | 500 | 484 | ||||||
| Intercontinental Exchange, Inc. 4.60% 3/15/2033 | 328 | 314 | ||||||
| Intercontinental Exchange, Inc. 4.95% 6/15/2052 | 682 | 635 | ||||||
| Iron Mountain Information Management Services, Inc. 5.00% 7/15/20324 | 500 | 416 | ||||||
| JPMorgan Chase & Co. 4.851% 7/25/2028 (USD-SOFR + 1.99% on 7/25/2027)5 | 338 | 330 | ||||||
| JPMorgan Chase & Co. 2.963% 1/25/2033 (USD-SOFR + 1.26% on 1/25/2032)5 | 190 | 155 | ||||||
| JPMorgan Chase & Co. 4.586% 4/26/2033 (USD-SOFR + 1.80% on 4/26/2032)5 | 72 | 67 | ||||||
| JPMorgan Chase & Co. 4.912% 7/25/2033 (USD-SOFR + 2.08% on 7/25/2032)5 | 1,710 | 1,633 | ||||||
| Kasikornbank PCL HK 3.343% 10/2/2031 (5-year UST Yield Curve Rate T Note Constant Maturity + 1.70% on 10/2/2026)5 | 500 | 441 | ||||||
| Marsh & McLennan Companies, Inc. 2.375% 12/15/2031 | 100 | 81 | ||||||
| Morgan Stanley 4.679% 7/17/2026 (USD-SOFR + 1.669% on 7/17/2025)5 | 330 | 325 | ||||||
| Morgan Stanley 4.21% 4/20/2028 (USD-SOFR + 1.61% on 4/20/2027)5 | 371 | 353 | ||||||
| Morgan Stanley 2.943% 1/21/2033 (USD-SOFR + 1.29% on 1/21/2032)5 | 195 | 158 | ||||||
| Morgan Stanley 4.889% 7/20/2033 (USD-SOFR + 2.077% on 7/20/2032)5 | 225 | 212 | ||||||
| Morgan Stanley 5.297% 4/20/2037 (USD-SOFR + 2.62% on 4/20/2032)5 | 269 | 247 | ||||||
| Navient Corp. 6.125% 3/25/2024 | 82 | 81 | ||||||
| Navient Corp. 5.50% 3/15/2029 | 500 | 409 | ||||||
| Navient Corp. 5.625% 8/1/2033 | 950 | 679 | ||||||
| New York Life Global Funding 0.85% 1/15/20264 | 125 | 111 | ||||||
| Progressive Corp. 3.00% 3/15/2032 | 350 | 305 | ||||||
| Royal Bank of Canada 6.00% 11/1/2027 | 555 | 580 | ||||||
| Toronto-Dominion Bank 2.00% 9/10/2031 | 90 | 71 | ||||||
| Wells Fargo & Company 3.908% 4/25/2026 (USD-SOFR + 1.32% on 4/25/2025)5 | 469 | 456 | ||||||
| Wells Fargo & Company 4.808% 7/25/2028 (USD-SOFR + 1.98% on 7/25/2027)5 | 1,050 | 1,027 | ||||||
| Wells Fargo & Company 3.35% 3/2/2033 (USD-SOFR + 1.50% on 3/2/2032)5 | 30 | 25 | ||||||
| Wells Fargo & Company 4.89% 7/25/2033 (USD-SOFR + 4.897% on 7/25/2032)5 | 420 | 400 | ||||||
| Wells Fargo & Company 4.611% 4/25/2053 (USD-SOFR + 2.13% on 4/25/2052)5 | 241 | 205 | ||||||
| 26,072 | ||||||||
| Communication services 4.36% | ||||||||
| AT&T, Inc. 2.55% 12/1/2033 | 250 | 193 | ||||||
| AT&T, Inc. 3.50% 9/15/2053 | 1,775 | 1,206 | ||||||
| CCO Holdings, LLC 4.75% 3/1/20304 | 450 | 389 | ||||||
| CCO Holdings, LLC 4.75% 2/1/20324 | 914 | 743 | ||||||
| CCO Holdings, LLC 4.50% 5/1/2032 | 100 | 80 | ||||||
| CCO Holdings, LLC 4.50% 6/1/20334 | 200 | 154 | ||||||
| CCO Holdings, LLC 4.25% 1/15/20344 | 1,850 | 1,369 | ||||||
| CCO Holdings, LLC and CCO Holdings Capital Corp. 4.40% 4/1/2033 | 200 | 172 | ||||||
| Charter Communications Operating, LLC 3.90% 6/1/2052 | 1,800 | 1,137 | ||||||
| Comcast Corp. 1.50% 2/15/2031 | 100 | 78 | ||||||
| Comcast Corp. 2.80% 1/15/2051 | 1,200 | 763 | ||||||
| Capital Group Fixed Income ETF Trust | 11 |
Capital Group Core Plus Income ETF (continued)
| Bonds, notes & other debt instruments (continued) | Principal amount (000) | Value (000) | ||||||
| Corporate bonds, notes & loans (continued) | ||||||||
| Communication services (continued) | ||||||||
| DISH Network Corp. 11.75% 11/15/20274 | USD | 500 | $ | 515 | ||||
| Frontier Communications Corp. 5.00% 5/1/20284 | 611 | 534 | ||||||
| Gray Escrow II, Inc. 5.375% 11/15/20314 | 575 | 415 | ||||||
| Meta Platforms, Inc. 3.85% 8/15/2032 | 1,100 | 971 | ||||||
| Meta Platforms, Inc. 4.45% 8/15/2052 | 775 | 620 | ||||||
| Midas OpCo Holdings, LLC 5.625% 8/15/20294 | 100 | 83 | ||||||
| Netflix, Inc. 4.875% 4/15/2028 | 1,007 | 975 | ||||||
| Netflix, Inc. 4.875% 6/15/20304 | 840 | 785 | ||||||
| News Corp. 3.875% 5/15/20294 | 144 | 125 | ||||||
| News Corp. 5.125% 2/15/20324 | 930 | 848 | ||||||
| Sirius XM Radio, Inc. 4.00% 7/15/20284 | 430 | 375 | ||||||
| Sirius XM Radio, Inc. 3.875% 9/1/20314 | 682 | 533 | ||||||
| T-Mobile US, Inc. 2.55% 2/15/2031 | 975 | 799 | ||||||
| T-Mobile US, Inc. 2.875% 2/15/2031 | 538 | 445 | ||||||
| T-Mobile US, Inc. 3.40% 10/15/2052 | 925 | 626 | ||||||
| Univision Communications, Inc. 4.50% 5/1/20294 | 1,950 | 1,634 | ||||||
| Verizon Communications, Inc. 1.75% 1/20/2031 | 400 | 311 | ||||||
| Verizon Communications, Inc. 2.55% 3/21/2031 | 220 | 181 | ||||||
| Verizon Communications, Inc. 3.875% 3/1/2052 | 1,225 | 935 | ||||||
| VZ Secured Financing BV 5.00% 1/15/20324 | 200 | 163 | ||||||
| WarnerMedia Holdings, Inc. 4.279% 3/15/20324 | 841 | 695 | ||||||
| WarnerMedia Holdings, Inc. 5.05% 3/15/20424 | 440 | 338 | ||||||
| WarnerMedia Holdings, Inc. 5.141% 3/15/20524 | 847 | 619 | ||||||
| 19,809 | ||||||||
| Energy 4.04% | ||||||||
| Apache Corp. 5.25% 2/1/2042 | 300 | 247 | ||||||
| Apache Corp. 5.35% 7/1/2049 | 700 | 567 | ||||||
| Ascent Resources Utica Holdings, LLC 7.00% 11/1/20264 | 250 | 243 | ||||||
| BP Capital Markets America, Inc. 2.721% 1/12/2032 | 500 | 418 | ||||||
| Cheniere Energy Partners, LP 4.00% 3/1/2031 | 500 | 426 | ||||||
| Cheniere Energy, Inc. 4.625% 10/15/2028 | 175 | 159 | ||||||
| Chesapeake Energy Corp. 5.875% 2/1/20294 | 350 | 332 | ||||||
| Chesapeake Energy Corp. 6.75% 4/15/20294 | 661 | 644 | ||||||
| Chevron Corp. 1.995% 5/11/2027 | 250 | 225 | ||||||
| CNX Resources Corp. 7.25% 3/14/20274 | 175 | 174 | ||||||
| CNX Resources Corp. 7.375% 1/15/20314 | 185 | 178 | ||||||
| ConocoPhillips 3.80% 3/15/2052 | 250 | 198 | ||||||
| Continental Resources, Inc. 2.875% 4/1/20324 | 75 | 56 | ||||||
| Energy Transfer Operating, LP 3.75% 5/15/2030 | 150 | 133 | ||||||
| Energy Transfer Partners, LP 6.25% 4/15/2049 | 675 | 631 | ||||||
| Enterprise Products Operating, LLC 3.30% 2/15/2053 | 60 | 40 | ||||||
| EQM Midstream Partners, LP 6.00% 7/1/20254 | 430 | 416 | ||||||
| EQM Midstream Partners, LP 4.75% 1/15/20314 | 1,175 | 963 | ||||||
| EQT Corp. 3.90% 10/1/2027 | 75 | 69 | ||||||
| Exxon Mobil Corp. 2.61% 10/15/2030 | 400 | 350 | ||||||
| Exxon Mobil Corp. 3.452% 4/15/2051 | 350 | 265 | ||||||
| Genesis Energy, LP 8.00% 1/15/2027 | 725 | 686 | ||||||
| Harvest Midstream I, LP 7.50% 9/1/20284 | 75 | 72 | ||||||
| Hilcorp Energy I, LP 6.00% 4/15/20304 | 135 | 120 | ||||||
| Hilcorp Energy I, LP 6.25% 4/15/20324 | 625 | 540 | ||||||
| Kinder Morgan, Inc. 3.60% 2/15/2051 | 825 | 572 | ||||||
| MPLX, LP 2.65% 8/15/2030 | 75 | 61 | ||||||
| MPLX, LP 4.95% 9/1/2032 | 481 | 452 | ||||||
| MV24 Capital BV 6.748% 6/1/2034 | 343 | 314 | ||||||
| New Fortress Energy, Inc. 6.50% 9/30/20264 | 200 | 186 | ||||||
| NGL Energy Operating, LLC 7.50% 2/1/20264 | 1,260 | 1,124 | ||||||
| Oasis Petroleum, Inc. 6.375% 6/1/20264 | 710 | 693 | ||||||
| Occidental Petroleum Corp. 6.125% 1/1/2031 | 300 | 303 | ||||||
| Occidental Petroleum Corp. 6.60% 3/15/2046 | 1,050 | 1,083 | ||||||
| ONEOK, Inc. 4.00% 7/13/2027 | 50 | 47 | ||||||
| ONEOK, Inc. 6.35% 1/15/2031 | 40 | 41 | ||||||
| 12 | Capital Group Fixed Income ETF Trust |
Capital Group Core Plus Income ETF (continued)
| Bonds, notes & other debt instruments (continued) | Principal amount (000) | Value (000) | ||||||
| Corporate bonds, notes & loans (continued) | ||||||||
| Energy (continued) | ||||||||
| ONEOK, Inc. 4.50% 3/15/2050 | USD | 75 | $ | 56 | ||||
| ONEOK, Inc. 7.15% 1/15/2051 | 150 | 153 | ||||||
| Petrobras Global Finance Co. 5.60% 1/3/2031 | 611 | 582 | ||||||
| Petróleos Mexicanos 6.49% 1/23/2027 | 1,275 | 1,165 | ||||||
| Petróleos Mexicanos 8.75% 6/2/2029 | 754 | 708 | ||||||
| Petróleos Mexicanos 6.70% 2/16/2032 | 254 | 200 | ||||||
| Qatar Petroleum 2.25% 7/12/20314 | 275 | 228 | ||||||
| Shell International Finance BV 2.75% 4/6/2030 | 75 | 66 | ||||||
| Shell International Finance BV 3.00% 11/26/2051 | 1,375 | 938 | ||||||
| Southwestern Energy Co. 4.75% 2/1/2032 | 725 | 621 | ||||||
| Sunoco, LP 4.50% 4/30/2030 | 150 | 130 | ||||||
| Venture Global Calcasieu Pass, LLC 4.125% 8/15/20314 | 250 | 213 | ||||||
| Weatherford International, Ltd. 6.50% 9/15/20284 | 100 | 98 | ||||||
| Weatherford International, Ltd. 8.625% 4/30/20304 | 125 | 120 | ||||||
| Williams Companies, Inc. 2.60% 3/15/2031 | 55 | 45 | ||||||
| 18,351 | ||||||||
| Health care 2.67% | ||||||||
| AmerisourceBergen Corp. 2.70% 3/15/2031 | 125 | 104 | ||||||
| Amgen, Inc. 4.05% 8/18/2029 | 625 | 585 | ||||||
| Amgen, Inc. 4.20% 3/1/2033 | 675 | 627 | ||||||
| Amgen, Inc. 4.875% 3/1/2053 | 275 | 245 | ||||||
| Anthem, Inc. 4.10% 5/15/2032 | 423 | 395 | ||||||
| Anthem, Inc. 4.55% 5/15/2052 | 203 | 177 | ||||||
| Bausch Health Companies, Inc. 6.125% 2/1/20274 | 75 | 52 | ||||||
| Bausch Health Companies, Inc. 5.25% 2/15/20314 | 110 | 53 | ||||||
| Baxter International, Inc. 2.539% 2/1/2032 | 70 | 56 | ||||||
| Becton, Dickinson and Company 4.298% 8/22/2032 | 525 | 493 | ||||||
| Centene Corp. 2.45% 7/15/2028 | 655 | 554 | ||||||
| Centene Corp. 2.625% 8/1/2031 | 1,575 | 1,241 | ||||||
| Community Health Systems, Inc. 5.25% 5/15/20304 | 75 | 57 | ||||||
| CVS Health Corp. 1.875% 2/28/2031 | 50 | 39 | ||||||
| GE Healthcare Holding, LLC 5.905% 11/22/20324 | 650 | 676 | ||||||
| GE Healthcare Holding, LLC 6.377% 11/22/20524 | 125 | 134 | ||||||
| HCA, Inc. 3.625% 3/15/20324 | 79 | 67 | ||||||
| HCA, Inc. 4.625% 3/15/20524 | 122 | 96 | ||||||
| Humana, Inc. 3.70% 3/23/2029 | 152 | 139 | ||||||
| Merck & Co., Inc. 1.70% 6/10/2027 | 50 | 44 | ||||||
| Molina Healthcare, Inc. 3.875% 5/15/20324 | 800 | 665 | ||||||
| Mozart Debt Merger Sub, Inc. 5.25% 10/1/20294 | 75 | 60 | ||||||
| Owens & Minor, Inc. 6.25% 4/1/20304 | 415 | 357 | ||||||
| Roche Holdings, Inc. 2.076% 12/13/20314 | 200 | 163 | ||||||
| Tenet Healthcare Corp. 4.875% 1/1/20264 | 300 | 284 | ||||||
| Tenet Healthcare Corp. 4.375% 1/15/20304 | 625 | 542 | ||||||
| Teva Pharmaceutical Finance Co. BV 3.15% 10/1/2026 | 1,717 | 1,505 | ||||||
| Teva Pharmaceutical Finance Co. BV 6.75% 3/1/2028 | 100 | 98 | ||||||
| Teva Pharmaceutical Finance Co. BV 5.125% 5/9/2029 | 1,192 | 1,063 | ||||||
| UnitedHealth Group, Inc. 5.30% 2/15/2030 | 325 | 336 | ||||||
| UnitedHealth Group, Inc. 4.20% 5/15/2032 | 230 | 219 | ||||||
| UnitedHealth Group, Inc. 5.35% 2/15/2033 | 363 | 376 | ||||||
| UnitedHealth Group, Inc. 4.75% 5/15/2052 | 255 | 237 | ||||||
| UnitedHealth Group, Inc. 5.875% 2/15/2053 | 200 | 217 | ||||||
| Zoetis, Inc. 5.60% 11/16/2032 | 200 | 208 | ||||||
| 12,164 | ||||||||
| Consumer discretionary 2.45% | ||||||||
| Allied Universal Holdco, LLC 4.625% 6/1/20284 | 650 | 538 | ||||||
| Amazon.com, Inc. 2.10% 5/12/2031 | 100 | 82 | ||||||
| Amazon.com, Inc. 3.60% 4/13/2032 | 600 | 551 | ||||||
| Amazon.com, Inc. 3.95% 4/13/2052 | 400 | 333 | ||||||
| AutoNation, Inc. 3.85% 3/1/2032 | 300 | 240 | ||||||
| Bayerische Motoren Werke AG 3.45% 4/1/20274 | 200 | 189 | ||||||
| Capital Group Fixed Income ETF Trust | 13 |
Capital Group Core Plus Income ETF (continued)
| Bonds, notes & other debt instruments (continued) | Principal amount (000) | Value (000) | ||||||
| Corporate bonds, notes & loans (continued) | ||||||||
| Consumer discretionary (continued) | ||||||||
| Bayerische Motoren Werke AG 1.95% 8/12/20314 | USD | 50 | $ | 39 | ||||
| Bayerische Motoren Werke AG 3.70% 4/1/20324 | 125 | 112 | ||||||
| Daimler Trucks Finance North America, LLC 3.65% 4/7/20274 | 350 | 328 | ||||||
| Daimler Trucks Finance North America, LLC 2.50% 12/14/20314 | 150 | 117 | ||||||
| Fertitta Entertainment, Inc. 4.625% 1/15/20294 | 350 | 297 | ||||||
| Fertitta Entertainment, Inc. 6.75% 1/15/20304 | 425 | 344 | ||||||
| Ford Motor Co. 2.30% 2/10/2025 | 700 | 640 | ||||||
| Ford Motor Co. 3.25% 2/12/2032 | 100 | 75 | ||||||
| Ford Motor Credit Company, LLC 5.125% 6/16/2025 | 483 | 465 | ||||||
| Ford Motor Credit Company, LLC 4.95% 5/28/2027 | 570 | 533 | ||||||
| General Motors Financial Co. 2.35% 2/26/2027 | 75 | 66 | ||||||
| Hanesbrands, Inc. 4.625% 5/15/20244 | 272 | 264 | ||||||
| Home Depot, Inc. 1.375% 3/15/2031 | 125 | 97 | ||||||
| Hyundai Capital America 1.65% 9/17/20264 | 100 | 88 | ||||||
| International Game Technology PLC 5.25% 1/15/20294 | 400 | 373 | ||||||
| Lowe’s Companies, Inc. 4.25% 4/1/2052 | 81 | 65 | ||||||
| Lowe’s Companies, Inc. 5.625% 4/15/2053 | 400 | 385 | ||||||
| Macy’s Retail Holdings, LLC 5.875% 3/15/20304 | 50 | 43 | ||||||
| Marriott International, Inc. 2.75% 10/15/2033 | 800 | 613 | ||||||
| McDonald’s Corp. 4.60% 9/9/2032 | 180 | 176 | ||||||
| McDonald’s Corp. 5.15% 9/9/2052 | 1,165 | 1,124 | ||||||
| Party City Holdings, Inc. 8.75% 2/15/20264 | 461 | 134 | ||||||
| Royal Caribbean Cruises, Ltd. 5.375% 7/15/20274 | 350 | 284 | ||||||
| Royal Caribbean Cruises, Ltd. 3.70% 3/15/2028 | 750 | 552 | ||||||
| Royal Caribbean Cruises, Ltd. 8.25% 1/15/20294 | 500 | 503 | ||||||
| Scientific Games Holdings, LP 6.625% 3/1/20304 | 875 | 740 | ||||||
| Sonic Automotive, Inc. 4.875% 11/15/20314 | 200 | 157 | ||||||
| Stellantis Finance US, Inc. 1.711% 1/29/20274 | 600 | 516 | ||||||
| Wheel Pros, Inc. 6.50% 5/15/20294 | 275 | 98 | ||||||
| 11,161 | ||||||||
| Industrials 2.40% | ||||||||
| Allegiant Travel Co. 7.25% 8/15/20274 | 276 | 263 | ||||||
| Ashtead Capital, Inc. 5.50% 8/11/20324 | 1,100 | 1,055 | ||||||
| Boeing Company 2.75% 2/1/2026 | 115 | 107 | ||||||
| Boeing Company 3.625% 2/1/2031 | 1,992 | 1,750 | ||||||
| Boeing Company 5.805% 5/1/2050 | 855 | 797 | ||||||
| Bombardier, Inc. 7.125% 6/15/20264 | 220 | 214 | ||||||
| Bombardier, Inc. 7.875% 4/15/20274 | 1,195 | 1,162 | ||||||
| Canadian Pacific Railway, Ltd. 3.10% 12/2/2051 | 1,125 | 762 | ||||||
| Carrier Global Corp. 2.722% 2/15/2030 | 100 | 84 | ||||||
| CoreLogic, Inc. 4.50% 5/1/20284 | 300 | 231 | ||||||
| CSX Corp. 2.50% 5/15/2051 | 550 | 337 | ||||||
| Eaton Corp. 4.15% 3/15/2033 | 266 | 248 | ||||||
| Eaton Corp. 4.70% 8/23/2052 | 107 | 97 | ||||||
| Lockheed Martin Corp. 5.10% 11/15/2027 | 228 | 233 | ||||||
| Lockheed Martin Corp. 5.25% 1/15/2033 | 271 | 280 | ||||||
| Lockheed Martin Corp. 5.70% 11/15/2054 | 212 | 223 | ||||||
| Maxar Technologies, Inc. 7.75% 6/15/20274 | 475 | 494 | ||||||
| Mileage Plus Holdings, LLC 6.50% 6/20/20274 | 54 | 54 | ||||||
| Raytheon Technologies Corp. 2.375% 3/15/2032 | 80 | 65 | ||||||
| Raytheon Technologies Corp. 2.82% 9/1/2051 | 925 | 603 | ||||||
| Spirit AeroSystems, Inc. 9.375% 11/30/20294 | 683 | 720 | ||||||
| TransDigm, Inc. 4.625% 1/15/2029 | 400 | 352 | ||||||
| Union Pacific Corp. 2.80% 2/14/2032 | 300 | 260 | ||||||
| Union Pacific Corp. 2.95% 3/10/2052 | 650 | 443 | ||||||
| United Airlines, Inc. 4.625% 4/15/20294 | 100 | 87 | ||||||
| 10,921 | ||||||||
| 14 | Capital Group Fixed Income ETF Trust |
Capital Group Core Plus Income ETF (continued)
| Bonds, notes & other debt instruments (continued) | Principal amount (000) | Value (000) | ||||||
| Corporate bonds, notes & loans (continued) | ||||||||
| Utilities 2.13% | ||||||||
| AES Panama Generation Holdings SRL 4.375% 5/31/20304 | USD | 200 | $ | 174 | ||||
| Alabama Power Co. 3.94% 9/1/2032 | 525 | 484 | ||||||
| Consumers Energy Co. 3.60% 8/15/2032 | 315 | 288 | ||||||
| Consumers Energy Co. 3.10% 8/15/2050 | 195 | 137 | ||||||
| Consumers Energy Co. 3.50% 8/1/2051 | 80 | 61 | ||||||
| Consumers Energy Co. 2.65% 8/15/2052 | 505 | 320 | ||||||
| Duke Energy Corp. 5.00% 8/15/2052 | 275 | 246 | ||||||
| Duke Energy Florida, LLC 5.95% 11/15/2052 | 125 | 134 | ||||||
| Edison International 6.95% 11/15/2029 | 150 | 157 | ||||||
| Entergy Louisiana, LLC 4.75% 9/15/2052 | 200 | 181 | ||||||
| FirstEnergy Corp. 2.65% 3/1/2030 | 1,055 | 862 | ||||||
| Florida Power & Light Company 2.875% 12/4/2051 | 150 | 101 | ||||||
| MidAmerican Energy Holdings Co. 2.70% 8/1/2052 | 50 | 32 | ||||||
| Northern States Power Co. 2.60% 6/1/2051 | 50 | 32 | ||||||
| Northern States Power Co. 4.50% 6/1/2052 | 350 | 319 | ||||||
| Oncor Electric Delivery Company, LLC 4.55% 9/15/20324 | 625 | 614 | ||||||
| Oncor Electric Delivery Company, LLC 2.70% 11/15/2051 | 175 | 115 | ||||||
| Pacific Gas and Electric Co. 3.15% 1/1/2026 | 40 | 37 | ||||||
| Pacific Gas and Electric Co. 4.65% 8/1/2028 | 100 | 92 | ||||||
| Pacific Gas and Electric Co. 4.55% 7/1/2030 | 755 | 686 | ||||||
| Pacific Gas and Electric Co. 3.25% 6/1/2031 | 200 | 163 | ||||||
| Pacific Gas and Electric Co. 3.50% 8/1/2050 | 2,100 | 1,312 | ||||||
| PG&E Corp. 5.25% 7/1/2030 | 550 | 501 | ||||||
| Southern California Edison Co. 2.75% 2/1/2032 | 1,065 | 895 | ||||||
| Southern California Edison Co. 3.45% 2/1/2052 | 1,015 | 727 | ||||||
| Union Electric Co. 3.90% 4/1/2052 | 275 | 223 | ||||||
| Virginia Electric and Power Co. 2.40% 3/30/2032 | 50 | 41 | ||||||
| Virginia Electric and Power Co. 2.45% 12/15/2050 | 81 | 48 | ||||||
| WEC Energy Group, Inc. 5.15% 10/1/2027 | 175 | 177 | ||||||
| Xcel Energy, Inc. 2.35% 11/15/2031 | 40 | 32 | ||||||
| Xcel Energy, Inc. 4.60% 6/1/2032 | 500 | 479 | ||||||
| 9,670 | ||||||||
| Consumer staples 1.79% | ||||||||
| 7-Eleven, Inc. 1.80% 2/10/20314 | 725 | 555 | ||||||
| Altria Group, Inc. 3.40% 5/6/2030 | 100 | 86 | ||||||
| Altria Group, Inc. 3.70% 2/4/2051 | 890 | 561 | ||||||
| Anheuser-Busch InBev NV 4.50% 6/1/2050 | 1,095 | 964 | ||||||
| British American Tobacco PLC 2.259% 3/25/2028 | 100 | 83 | ||||||
| British American Tobacco PLC 4.742% 3/16/2032 | 250 | 222 | ||||||
| British American Tobacco PLC 4.758% 9/6/2049 | 887 | 646 | ||||||
| British American Tobacco PLC 3.984% 9/25/2050 | 375 | 247 | ||||||
| British American Tobacco PLC 5.65% 3/16/2052 | 604 | 500 | ||||||
| Conagra Brands, Inc. 5.40% 11/1/2048 | 525 | 488 | ||||||
| Constellation Brands, Inc. 4.35% 5/9/2027 | 326 | 318 | ||||||
| Constellation Brands, Inc. 4.75% 5/9/2032 | 173 | 167 | ||||||
| Imperial Tobacco Finance PLC 6.125% 7/27/20274 | 200 | 199 | ||||||
| Keurig Dr Pepper, Inc. 3.20% 5/1/2030 | 40 | 35 | ||||||
| Kraft Heinz Company 5.50% 6/1/2050 | 75 | 72 | ||||||
| Kronos Acquisition Holdings, Inc. 5.00% 12/31/20264 | 250 | 217 | ||||||
| PepsiCo, Inc. 1.95% 10/21/2031 | 50 | 40 | ||||||
| Philip Morris International, Inc. 5.125% 11/17/2027 | 615 | 621 | ||||||
| Philip Morris International, Inc. 5.625% 11/17/2029 | 335 | 341 | ||||||
| Philip Morris International, Inc. 5.75% 11/7/2032 | 600 | 613 | ||||||
| Post Holdings, Inc. 4.625% 4/15/20304 | 200 | 173 | ||||||
| Post Holdings, Inc. 4.50% 9/15/20314 | 1,136 | 957 | ||||||
| TreeHouse Foods, Inc. 4.00% 9/1/2028 | 50 | 43 | ||||||
| 8,148 | ||||||||
| Capital Group Fixed Income ETF Trust | 15 |
Capital Group Core Plus Income ETF (continued)
| Bonds, notes & other debt instruments (continued) | Principal amount (000) | Value (000) | ||||||
| Corporate bonds, notes & loans (continued) | ||||||||
| Materials 1.76% | ||||||||
| Anglo American Capital PLC 2.25% 3/17/20284 | USD | 200 | $ | 169 | ||||
| Anglo American Capital PLC 4.75% 3/16/20524 | 200 | 167 | ||||||
| Ball Corp. 6.875% 3/15/2028 | 640 | 658 | ||||||
| Braskem Idesa SAPI 6.99% 2/20/2032 | 200 | 143 | ||||||
| Celanese US Holdings, LLC 6.379% 7/15/2032 | 125 | 119 | ||||||
| Cleveland-Cliffs, Inc. 4.875% 3/1/20314 | 300 | 265 | ||||||
| Dow Chemical Co. 3.60% 11/15/2050 | 40 | 29 | ||||||
| First Quantum Minerals, Ltd. 6.875% 10/15/20274 | 1,050 | 987 | ||||||
| FXI Holdings, Inc. 12.25% 11/15/20264 | 700 | 581 | ||||||
| Glencore Funding, LLC 2.625% 9/23/20314 | 200 | 160 | ||||||
| International Flavors & Fragrances, Inc. 2.30% 11/1/20304 | 230 | 183 | ||||||
| International Flavors & Fragrances, Inc. 3.468% 12/1/20504 | 950 | 647 | ||||||
| LABL, Inc. 5.875% 11/1/20284 | 75 | 65 | ||||||
| LSB Industries, Inc. 6.25% 10/15/20284 | 100 | 92 | ||||||
| LYB International Finance III, LLC 3.625% 4/1/2051 | 75 | 51 | ||||||
| Methanex Corp. 5.25% 12/15/2029 | 550 | 489 | ||||||
| Nova Chemicals Corp. 4.25% 5/15/20294 | 1,325 | 1,085 | ||||||
| Nutrien, Ltd. 5.90% 11/7/2024 | 220 | 223 | ||||||
| SCIH Salt Holdings, Inc. 4.875% 5/1/20284 | 492 | 423 | ||||||
| Sherwin-Williams Company 2.90% 3/15/2052 | 1,085 | 680 | ||||||
| South32 Treasury (USA), Ltd. 4.35% 4/14/20324 | 209 | 179 | ||||||
| Yara International ASA 7.378% 11/14/20324 | 586 | 613 | ||||||
| 8,008 | ||||||||
| Information technology 1.47% | ||||||||
| Analog Devices, Inc. 1.70% 10/1/2028 | 25 | 21 | ||||||
| Analog Devices, Inc. 2.95% 10/1/2051 | 583 | 396 | ||||||
| Apple, Inc. 3.35% 8/8/2032 | 350 | 319 | ||||||
| Apple, Inc. 2.65% 2/8/2051 | 900 | 598 | ||||||
| Apple, Inc. 2.70% 8/5/2051 | 435 | 289 | ||||||
| Apple, Inc. 3.95% 8/8/2052 | 364 | 311 | ||||||
| Block, Inc. 3.50% 6/1/2031 | 100 | 80 | ||||||
| Broadcom, Inc. 4.00% 4/15/20294 | 46 | 42 | ||||||
| Broadcom, Inc. 4.15% 4/15/20324 | 908 | 799 | ||||||
| Broadcom, Inc. 2.60% 2/15/20334 | 200 | 151 | ||||||
| Broadcom, Inc. 3.469% 4/15/20344 | 450 | 360 | ||||||
| Broadcom, Inc. 3.137% 11/15/20354 | 156 | 115 | ||||||
| Broadcom, Inc. 3.187% 11/15/20364 | 450 | 325 | ||||||
| Broadcom, Inc. 4.926% 5/15/20374 | 700 | 613 | ||||||
| Entegris Escrow Corp. 4.75% 4/15/20294 | 445 | 407 | ||||||
| Mastercard, Inc. 2.00% 11/18/2031 | 80 | 64 | ||||||
| Oracle Corp. 2.875% 3/25/2031 | 186 | 155 | ||||||
| Sabre GLBL, Inc. 11.25% 12/15/20274 | 300 | 309 | ||||||
| salesforce.com, inc. 2.90% 7/15/2051 | 1,200 | 792 | ||||||
| ServiceNow, Inc. 1.40% 9/1/2030 | 100 | 77 | ||||||
| Tibco Software Inc, Term Loan A, (3-month USD CME Term SOFR + 4.50%) 9.180% 9/29/20283,6 | 500 | 445 | ||||||
| 6,668 | ||||||||
| Real estate 1.25% | ||||||||
| American Tower Corp. 2.30% 9/15/2031 | 80 | 62 | ||||||
| American Tower Corp. 4.05% 3/15/2032 | 229 | 205 | ||||||
| American Tower Corp. 2.95% 1/15/2051 | 675 | 421 | ||||||
| Equinix, Inc. 2.15% 7/15/2030 | 350 | 279 | ||||||
| Equinix, Inc. 2.50% 5/15/2031 | 400 | 322 | ||||||
| Equinix, Inc. 3.40% 2/15/2052 | 460 | 315 | ||||||
| Howard Hughes Corp. 4.375% 2/1/20314 | 375 | 304 | ||||||
| Iron Mountain, Inc. 4.50% 2/15/20314 | 900 | 742 | ||||||
| Kennedy-Wilson Holdings, Inc. 4.75% 3/1/2029 | 575 | 457 | ||||||
| Kennedy-Wilson Holdings, Inc. 4.75% 2/1/2030 | 975 | 745 | ||||||
| Kennedy-Wilson Holdings, Inc. 5.00% 3/1/2031 | 200 | 151 | ||||||
| Sun Communities Operating, LP 2.70% 7/15/2031 | 40 | 32 | ||||||
| 16 | Capital Group Fixed Income ETF Trust |
Capital Group Core Plus Income ETF (continued)
| Bonds, notes & other debt instruments (continued) | Principal amount (000) | Value (000) | ||||||
| Corporate bonds, notes & loans (continued) | ||||||||
| Real estate (continued) | ||||||||
| Sun Communities Operating, LP 4.20% 4/15/2032 | USD | 649 | $ | 573 | ||||
| VICI Properties, LP 3.875% 2/15/20294 | 75 | 66 | ||||||
| VICI Properties, LP 4.125% 8/15/20304 | 250 | 219 | ||||||
| VICI Properties, LP 5.125% 5/15/2032 | 875 | 812 | ||||||
| 5,705 | ||||||||
| Total corporate bonds, notes & loans | 136,677 | |||||||
| U.S. Treasury bonds & notes 23.69% | ||||||||
| U.S. Treasury 17.64% | ||||||||
| U.S. Treasury 4.25% 10/15/2025 | 8,150 | 8,146 | ||||||
| U.S. Treasury 4.50% 11/15/2025 | 5,200 | 5,233 | ||||||
| U.S. Treasury 4.00% 12/15/2025 | 24,400 | 24,247 | ||||||
| U.S. Treasury 4.125% 9/30/2027 | 5,375 | 5,396 | ||||||
| U.S. Treasury 4.125% 10/31/2027 | 5,690 | 5,712 | ||||||
| U.S. Treasury 3.875% 11/30/2027 | 6,700 | 6,664 | ||||||
| U.S. Treasury 2.75% 8/15/2032 | 6,138 | 5,588 | ||||||
| U.S. Treasury 4.125% 11/5/2032 | 5,798 | 5,913 | ||||||
| U.S. Treasury 4.00% 11/15/20427 | 13,630 | 13,355 | ||||||
| 80,254 | ||||||||
| U.S. Treasury inflation-protected securities 6.05% | ||||||||
| U.S. Treasury Inflation-Protected Security 1.625% 10/15/20278 | 17,201 | 17,178 | ||||||
| U.S. Treasury Inflation-Protected Security 0.125% 1/15/20327,8 | 11,818 | 10,339 | ||||||
| 27,517 | ||||||||
| Total U.S. Treasury bonds & notes | 107,771 | |||||||
| Asset-backed obligations 7.33% | ||||||||
| AGL CLO, Ltd., Series 2022-18A, Class B, (3-month USD CME Term SOFR + 2.00%) 5.988% 4/21/20311,3,4 | 1,500 | 1,480 | ||||||
| ALM Loan Funding, Series 2020-1A, Class A2, (3-month USD-LIBOR + 1.85%) 5.929% 10/15/20291,3,4 | 500 | 488 | ||||||
| American Credit Acceptance Receivables Trust, Series 2022-3, Class C, 4.86% 10/13/20281,4 | 701 | 683 | ||||||
| American Credit Acceptance Receivables Trust, Series 2022-2, Class F, 7.74% 2/13/20291,4 | 1,647 | 1,474 | ||||||
| Avis Budget Rental Car Funding AESOP, LLC, Series 2022-5, Class B, 7.09% 4/20/20271,4 | 2,394 | 2,385 | ||||||
| Brex Commercial Charge Card Master Trust, Series 2022-1, Class A, 4.63% 7/15/20251,4 | 1,000 | 969 | ||||||
| CF Hippolyta, LLC, Series 2020-1, Class B1, 2.28% 7/15/20601,4 | 490 | 429 | ||||||
| CFG Investments, Ltd., Series 2021-1, Class B, 5.82% 5/20/20321,4 | 750 | 714 | ||||||
| CPS Auto Receivables Trust, Series 2022-B, Class A, 2.88% 6/15/20261,4 | 460 | 451 | ||||||
| CPS Auto Receivables Trust, Series 2022-B, Class D, 5.19% 8/15/20281,4 | 1,250 | 1,188 | ||||||
| Credit Acceptance Auto Loan Trust, Series 2022-1A, Class C, 5.70% 10/15/20321,4 | 1,000 | 967 | ||||||
| Credit Acceptance Auto Loan Trust, Series 2022-1A, Class D, 6.63% 12/15/20321,4 | 1,000 | 959 | ||||||
| Exeter Automobile Receivables Trust, Series 2022-2A, Class A3, 2.80% 11/17/20251 | 268 | 265 | ||||||
| Exeter Automobile Receivables Trust, Series 2022-2A, Class D, 4.56% 7/17/20281 | 117 | 110 | ||||||
| Exeter Automobile Receivables Trust, Series 2022-2A, Class E, 6.34% 10/15/20291,4 | 1,443 | 1,256 | ||||||
| Exeter Automobile Receivables Trust, Series 2022-3A, Class E, 8.17% 1/15/20301,4 | 2,000 | 1,945 | ||||||
| Exeter Automobile Receivables Trust, Series 2022-5, Class E, 10.45% 4/15/20301,4 | 3,000 | 2,953 | ||||||
| Exeter Automobile Receivables Trust, Series 2022-6, Class E, 11.61% 6/17/20301,4 | 4,000 | 4,047 | ||||||
| FirstKey Homes Trust, Series 2022-SFR2, Class S, 5.197% 5/17/20391,4 | 456 | 420 | ||||||
| Hertz Vehicle Financing III, LLC, Series 2022-2A, Class C, 2.95% 6/26/20281,4 | 300 | 248 | ||||||
| Mission Lane Credit Card Master Trust, Series 2022-B, Class B, 10.42% 1/15/20281,9 | 465 | 465 | ||||||
| Mission Lane Credit Card Master Trust, Series 2022-B, Class D, 14.45% 1/15/20281,9 | 3,500 | 3,499 | ||||||
| Research-Driven Pagaya Motor Asset Trust I, Series 2022-3, Class A, 5.38% 11/25/20301,4 | 1,193 | 1,163 | ||||||
| Research-Driven Pagaya Motor Asset Trust I, Series 2022-3, Class B, 6.58% 11/25/20301,4 | 337 | 315 | ||||||
| Santander Drive Auto Receivables Trust, Series 2022-7, Class C, 6.69% 3/17/20311 | 796 | 813 | ||||||
| Capital Group Fixed Income ETF Trust | 17 |
Capital Group Core Plus Income ETF (continued)
| Bonds, notes & other debt instruments (continued) | Principal amount (000) | Value (000) | ||||||
| Asset-backed obligations (continued) | ||||||||
| SMB Private Education Loan Trust, Series 2022-A, Class D, 4.75% 11/16/20541,4 | USD | 208 | $ | 189 | ||||
| SMB Private Education Loan Trust, Series 2022-D, Class D, 7.23% 10/15/20581,4 | 2,000 | 1,967 | ||||||
| Westlake Automobile Receivables Trust, Series 2022-2A, Class D, 5.48% 9/15/20271,4 | 1,562 | 1,493 | ||||||
| 33,335 | ||||||||
| Bonds & notes of governments & government agencies outside the U.S. 1.53% | ||||||||
| Abu Dhabi (Emirate of) 1.70% 3/2/20314 | 300 | 248 | ||||||
| Angola (Republic of) 8.75% 4/14/20324 | 800 | 695 | ||||||
| Argentine Republic 0.50% 7/9/2030 (0.75% on 7/9/2023)5 | 1,100 | 299 | ||||||
| Chile (Republic of) 2.45% 1/31/2031 | 400 | 333 | ||||||
| Chile (Republic of) 4.34% 3/7/2042 | 200 | 170 | ||||||
| Colombia (Republic of) 8.00% 4/20/2033 | 280 | 281 | ||||||
| Dominican Republic 4.50% 1/30/20304 | 500 | 428 | ||||||
| Egypt (Arab Republic of) 8.75% 9/30/2051 | 1,839 | 1,242 | ||||||
| Export-Import Bank of India 2.25% 1/13/20314 | 250 | 198 | ||||||
| Mongolia (State of) 4.45% 7/7/2031 | 500 | 390 | ||||||
| Panama (Republic of) 2.252% 9/29/2032 | 1,000 | 744 | ||||||
| South Africa (Republic of) 5.875% 4/20/2032 | 1,003 | 908 | ||||||
| United Mexican States 4.50% 4/22/2029 | 450 | 430 | ||||||
| United Mexican States 4.875% 5/19/2033 | 620 | 570 | ||||||
| 6,936 | ||||||||
| Total bonds, notes & other debt instruments (cost: $460,080,000) | 448,767 | |||||||
| Short-term securities 10.96% | Shares | |||||||
| Money market investments 10.96% | ||||||||
| Capital Group Central Cash Fund 4.31%10,11 | 498,858 | 49,881 | ||||||
| Total short-term securities (cost: $49,878,000) | 49,881 | |||||||
| Total investment securities 109.63% (cost: $509,958,000) | 498,648 | |||||||
| Other assets less liabilities (9.63)% | (43,820 | ) | ||||||
| Net assets 100.00% | $ | 454,828 | ||||||
Futures contracts
| Contracts | Type | Number of contracts | Expiration | Notional amount (000) | Value and unrealized appreciation (depreciation) at 12/31/2022 (000) | |||||||||||
| 2 Year U.S. Treasury Note Futures | Long | 152 | March 2023 | USD | 31,172 | $ | 37 | |||||||||
| 5 Year U.S. Treasury Note Futures | Long | 156 | March 2023 | 16,837 | (97 | ) | ||||||||||
| 10 Year U.S. Treasury Note Futures | Long | 118 | March 2023 | 13,251 | (194 | ) | ||||||||||
| 10 Year U.S. Treasury Note Futures | Short | 412 | March 2023 | (48,732 | ) | 382 | ||||||||||
| 30 Year Ultra U.S. Treasury Bond Futures | Short | 9 | March 2023 | (1,209 | ) | (3 | ) | |||||||||
| 30 Year U.S. Treasury Bond Futures | Long | 57 | March 2023 | 7,145 | (90 | ) | ||||||||||
| $ | 35 | |||||||||||||||
| 18 | Capital Group Fixed Income ETF Trust |
Capital Group Core Plus Income ETF (continued)
Swap contracts
Interest rate swaps
Centrally cleared interest rate swaps
| Receive | Pay | Notional | Value at | Upfront premium | Unrealized appreciation | |||||||||||||||||||
| Rate | Payment frequency | Rate | Payment frequency | Expiration date | amount (000) | 12/31/2022 (000) | paid (000) | at 12/31/2022 (000) | ||||||||||||||||
| SOFR | Annual | 2.121% | Annual | 3/28/2024 | USD5,700 | $185 | $ — | $185 | ||||||||||||||||
Bilateral interest rate swaps
| Receive | Pay | Notional | Value at | Upfront premium | Unrealized depreciation | |||||||||||||||||||||||||
| Rate | Payment frequency | Rate | Payment frequency | Counterparty | Expiration date | amount (000) | 12/31/2022 (000) | paid (000) | at 12/31/2022 (000) | |||||||||||||||||||||
| 12.54% | At maturity | BZDIOVER | At maturity | Barclays Bank PLC | 1/2/2026 | BRL19,454 | $(1 | ) | $— | $(1 | ) | |||||||||||||||||||
Credit default swaps
Centrally cleared credit default swaps on credit indices — buy protection
| Reference index | Financing rate paid | Payment frequency | Expiration date | Notional amount (000) | Value at 12/31/2022 (000) | Upfront premium received (000) | Unrealized appreciation at 12/31/2022 (000) | |||||||||||||||||||
| CDX.NA.IG.39 | 1.00% | Quarterly | 12/20/2027 | $10,400 | $(86 | ) | $(89 | ) | $3 | |||||||||||||||||
Investments in affiliates11
| Value of affiliate at 2/22/202212 (000) | Additions (000) | Reductions (000) | Net realized loss (000) | Net unrealized appreciation (000) | Value of affiliate at 12/31/2022 (000) | Dividend income (000) | ||||||||||||||||||||||
| Short-term securities 10.96% | ||||||||||||||||||||||||||||
| Money market investments 10.96% | ||||||||||||||||||||||||||||
| Capital Group Central Cash Fund 4.31%10 | $ | — | $ | 236,670 | $ | 186,792 | $ | — | 13 | $ | 3 | $ | 49,881 | $ | 1,249 | |||||||||||||
| 1 | Principal payments may be made periodically. Therefore, the effective maturity date may be earlier than the stated maturity date. |
| 2 | Purchased on a TBA basis. |
| 3 | Coupon rate may change periodically. Reference rate and spread are as of the most recent information available. Some coupon rates are determined by the issuer or agent based on current market conditions; therefore, the reference rate and spread are not available. |
| 4 | Acquired in a transaction exempt from registration under Rule 144A or, for commercial paper, Section 4(a)(2) of the Securities Act of 1933. May be resold in the U.S. in transactions exempt from registration, normally to qualified institutional buyers. The total value of all such securities was $97,533,000, which represented 21.44% of the net assets of the fund. |
| 5 | Step bond; coupon rate may change at a later date. |
| 6 | Loan participations and assignments; may be subject to legal or contractual restrictions on resale. The total value of all such loans was $445,000, which represented 0.10% of the net assets of the fund. |
| 7 | All or a portion of this security was pledged as collateral. The total value of pledged collateral was $1,273,000, which represented .28% of the net assets of the fund. |
| 8 | Index-linked bond whose principal amount moves with a government price index. |
| 9 | Value determined using significant unobservable inputs. |
| 10 | Rate represents the seven-day yield at December 31, 2022. |
| 11 | Part of the same “group of investment companies” as the fund as defined under the Investment Company Act of 1940, as amended. |
| 12 | Commencement of operations. |
| 13 | Amount less than one thousand. |
| Capital Group Fixed Income ETF Trust | 19 |
Capital Group Core Plus Income ETF (continued)
Key to abbreviations
Assn. = Association
BRL = Brazilian reais
BZDIOVER = Overnight Brazilian Interbank Deposit Rate
CLO = Collateralized Loan Obligations
CME = CME Group
DAC = Designated Activity Company
LIBOR = London Interbank Offered Rate
SOFR = Secured Overnight Financing Rate
TBA = To-be-announced
USD = U.S. dollars
Refer to the notes to financial statements.
| 20 | Capital Group Fixed Income ETF Trust |
Capital Group Municipal Income ETF
Investment portfolio December 31, 2022
| Portfolio quality summary* | Percent of net assets | |||
| AAA/Aaa | 8.20 | % | ||
| AA/Aa | 32.95 | |||
| A/A | 20.71 | |||
| BBB/Baa | 11.83 | |||
| Below investment grade | 12.29 | |||
| Short-term securities & other assets less liabilities | 14.02 | |||
| * | Bond ratings, which typically range from AAA/Aaa (highest) to D (lowest), are assigned by credit rating agencies such as Standard & Poor’s, Moody’s and/or Fitch as an indication of an issuer’s creditworthiness. In assigning a credit rating to a security, the fund looks specifically to the ratings assigned to the issuer of the security by Standard & Poor’s, Moody’s and/or Fitch. If agency ratings differ, the security will be considered to have received the highest of those ratings, consistent with the fund’s investment policies. The ratings are not covered by the Report of Independent Registered Public Accounting Firm. |
| Bonds, notes & other debt instruments 85.98% | Principal amount (000) | Value (000) | ||||||
| Alabama 2.59% | ||||||||
| Black Belt Energy Gas Dist., Gas Project Rev. Bonds, Series 2022-B-1, 5.25% 2/1/2053 (put 6/1/2029) | USD | 600 | $ | 626 | ||||
| Black Belt Energy Gas Dist., Gas Supply Prepay Rev. Bonds (Project No. 4), Series 2019-A, 4.00% 12/1/2049 (put 12/1/2025) | 500 | 495 | ||||||
| Black Belt Energy Gas Dist., Gas Supply Rev. Bonds, Series 2022-F, 5.50% 11/1/2053 (put 12/1/2028) | 750 | 787 | ||||||
| 1,908 | ||||||||
| Arizona 1.00% | ||||||||
| County of Maricopa, Industrial Dev. Auth., Solid Waste Disposal Rev. Bonds (Waste Management, Inc. Project), Series 2001, AMT, 3.375% 12/1/2031 (put 6/3/2024) | 750 | 736 | ||||||
| California 5.41% | ||||||||
| Escondido Union High School Dist., G.O. Bonds, 2008 Election, Series 2009-A, Assured Guaranty insured, 0% 8/1/2028 | 500 | 418 | ||||||
| G.O. Rev. Ref. Bonds, Series 2019, 5.00% 4/1/2032 | 500 | 596 | ||||||
| Infrastructure and Econ. Dev. Bank, Rev. Bonds (WFCS Portfolio Projects), Series 2021-A-1, 5.00% 1/1/20561 | 500 | 372 | ||||||
| City of Los Angeles, Dept. of Airports, Los Angeles International Airport, Rev. Bonds, Series 2019-D, AMT, 5.00% 5/15/2026 | 495 | 520 | ||||||
| Monrovia Unified School Dist., G.O. Bonds, 1997 Election, Series 2001-B, National insured, 0% 8/1/2032 | 750 | 524 | ||||||
| City and County of San Francisco, Airport Commission, San Francisco International Airport, Rev. Ref. Bonds, Series 2019-A-2, AMT, 5.00% 5/1/2044 | 500 | 512 | ||||||
| Statewide Communities Dev. Auth., Student Housing Rev. Ref. Bonds (CHF-Irvine, LLC - University of California, Irvine East Campus Apartments, Phase I Ref. and Phase IV-B), Series 2021, BAM insured, 5.00% 5/15/2027 | 500 | 541 | ||||||
| Stockton Unified School Dist., G.O. Bonds, Capital Appreciation Bonds, 2008 Election, Series 2011-D, Assured Guaranty Municipal insured, 0% 8/1/2033 | 725 | 496 | ||||||
| 3,979 | ||||||||
| Colorado 2.58% | ||||||||
| City and County of Denver, Airport System Rev. Bonds, Series 2022-A, AMT, 5.00% 11/15/2028 | 500 | 537 | ||||||
| E-470 Public Highway Auth., Rev. Bonds, Capital Appreciation Bonds, Series 2004-A, National insured, 0% 9/1/2027 | 500 | 432 | ||||||
| Town of Parker, Cottonwood Highlands Metropolitan Dist. No. 1, Limited Tax G.O. Bonds (Convertible to Unlimited Tax), Series 2019-A, 5.00% 12/1/2049 | 500 | 441 | ||||||
| Regional Transportation Dist., Private Activity Bonds (Denver Transit Partners Eagle P3 Project), Series 2020-A, 4.00% 7/15/2033 | 500 | 488 | ||||||
| 1,898 | ||||||||
| Capital Group Fixed Income ETF Trust | 21 |
Capital Group Municipal Income ETF (continued)
| Bonds, notes & other debt instruments (continued) | Principal amount (000) | Value (000) | ||||||
| Connecticut 0.68% | ||||||||
| Housing Fin. Auth., Housing Mortgage Fin. Program Bonds, Series 2018-E-1, 4.25% 5/15/2042 | USD | 500 | $ | 503 | ||||
| Delaware 0.61% | ||||||||
| Econ. Dev. Auth., Charter School Rev. Bonds (First State Montessori Academy, Inc. Project), Series 2019-A, 4.00% 8/1/2029 | 460 | 451 | ||||||
| District of Columbia 0.99% | ||||||||
| Metropolitan Area Transit Auth., Dedicated Rev. Bonds, Series 2020-A, 4.00% 7/15/2020 | 750 | 727 | ||||||
| Florida 1.28% | ||||||||
| Capital Trust Agcy., Senior Rev. Bonds (Educational Growth Fund, LLC Charter School Portfolio Projects), Series 2021-A-1, 3.375% 7/1/20311 | 500 | 443 | ||||||
| Housing Fin. Corp., Homeowner Mortgage Rev. Bonds, Series 2018-1, 4.00% 7/1/2049 | 500 | 500 | ||||||
| 943 | ||||||||
| Georgia 3.30% | ||||||||
| Main Street Natural Gas, Inc., Gas Supply Rev. Bonds, Series 2021-C, 4.00% 5/1/2052 (put 12/1/2028) | 695 | 679 | ||||||
| Main Street Natural Gas, Inc., Gas Supply Rev. Bonds, Series 2021-A, 4.00% 7/1/2052 (put 9/1/2027) | 500 | 496 | ||||||
| Municipal Electric Auth., Project One Bonds, Series 2020-A, 5.00% 1/1/2027 | 620 | 659 | ||||||
| Private Colleges and Universities Auth., Rev. Bonds (Emory University), Series 2022-A, 5.00% 9/1/2032 | 500 | 599 | ||||||
| 2,433 | ||||||||
| Guam 0.68% | ||||||||
| Limited Obligation Bonds (Section 30), Series 2016-A, 5.00% 12/1/2046 | 500 | 501 | ||||||
| Illinois 8.16% | ||||||||
| City of Chicago, Board of Education, Unlimited Tax G.O. Rev. Ref. Bonds (Dedicated Rev.), Series 2018-A, Assured Guaranty Municipal insured, 5.00% 12/1/2030 | 500 | 511 | ||||||
| City of Chicago, G.O. Bonds, Series 2021-A, 4.00% 1/1/2035 | 500 | 470 | ||||||
| City of Chicago, Water Rev. Bonds, Series 2000, 5.00% 11/1/2028 | 500 | 521 | ||||||
| Fin. Auth., Rev. Bonds (Advocate Health Care Network), Series 2008-A, 4.00% 11/1/2030 | 500 | 506 | ||||||
| Fin. Auth., Rev. Bonds (Rush University Medical Center Obligated Group), Series 2015-A, 4.00% 11/15/2039 | 500 | 457 | ||||||
| Fin. Auth., Solid Waste Disposal Rev. Bonds (Waste Management, Inc. Project), Series 2019, AMT, 0.40% 11/1/2044 (put 11/1/2023) | 500 | 501 | ||||||
| G.O. Bonds, Series 2016, 4.00% 6/1/2033 | 1,060 | 996 | ||||||
| Metropolitan Pier and Exposition Auth., McCormick Place Expansion Project Bonds, Capital Appreciation Bonds, Series 2002-A, Assured Guaranty Municipal insured, 0% 6/15/2030 | 1,055 | 788 | ||||||
| Sales Tax Securitization Corp., Sales Tax Securitization Bonds, Series 2020-A, BAM insured, 5.00% 1/1/2029 | 510 | 552 | ||||||
| Sports Facs. Auth., Sports Facs. Rev. Ref. Bonds (State Tax Supported), Series 2019, BAM insured, 5.00% 6/15/2029 | 665 | 704 | ||||||
| 6,006 | ||||||||
| Indiana 2.28% | ||||||||
| Fin. Auth., Environmental Improvement Rev. Bonds (Fulcrum Centerpoint, LLC Project), Series 2022-A, AMT, 4.50% 12/15/2046 (put 12/1/2023) | 750 | 750 | ||||||
| Fin. Auth., Environmental Improvement Rev. Ref. Bonds (U.S. Steel Corp. Project), Series 2021-A, 4.125% 12/1/2026 | 500 | 489 | ||||||
| Fin. Auth., Midwestern Disaster Relief Rev. Bonds (Ohio Valley Electric Corp. Project), Series 2012-B, 3.00% 11/1/2030 | 500 | 443 | ||||||
| 1,682 | ||||||||
| 22 | Capital Group Fixed Income ETF Trust |
Capital Group Municipal Income ETF (continued)
| Bonds, notes & other debt instruments (continued) | Principal amount (000) | Value (000) | ||||||
| Iowa 0.65% | ||||||||
| Fin. Auth., Midwestern Disaster Area Rev. Ref. Bonds (Iowa Fertilizer Co. Project), Series 2022, 4.00% 12/1/2050 (put 12/1/2032) | USD | 500 | $ | 479 | ||||
| Kansas 0.74% | ||||||||
| Dev. Fin. Auth., Hospital Rev. Bonds (Advent Health Obligated Group), Series 2021-B, 5.00% 11/15/2054 (put 11/15/2028) | 500 | 542 | ||||||
| Kentucky 0.66% | ||||||||
| Public Energy Auth., Gas Supply Rev. Bonds, Series 2022-A-1, 4.00% 8/1/2052 (put 8/1/2030) | 500 | 485 | ||||||
| Maryland 1.84% | ||||||||
| County of Montgomery, Rev. Ref. Bonds (Dept. of Liquor Control), Series 2019-A, 4.00% 6/15/2037 | 750 | 785 | ||||||
| Dept. of Transportation, Consolidated Transportation Bonds, Series 2021-A, 2.00% 10/1/2034 | 700 | 570 | ||||||
| 1,355 | ||||||||
| Massachusetts 0.71% | ||||||||
| Educational Fncg. Auth., Education Loan Rev. Bonds, Series 2019-B, AMT, 5.00% 7/1/2026 | 500 | 525 | ||||||
| Michigan 1.42% | ||||||||
| Fin. Auth., Hospital Rev. and Rev. Ref. Bonds (Trinity Health Credit Group), Series 2019-A, 5.00% 12/1/2041 | 500 | 522 | ||||||
| Fin. Auth., Tobacco Settlement Asset-Backed Bonds, Series 2020-A-1, 5.00% 6/1/2033 | 500 | 523 | ||||||
| 1,045 | ||||||||
| Minnesota 0.66% | ||||||||
| Housing Fin. Agcy., Residential Housing Fin. Bonds, Series 2021-H, 3.00% 7/1/2052 | 500 | 484 | ||||||
| Missouri 0.69% | ||||||||
| Housing Dev. Commission, Single Family Mortgage Rev. Bonds (First Place Homeownership Loan Program), Series 2020-C, 3.50% 11/1/2050 | 515 | 509 | ||||||
| Nevada 3.24% | ||||||||
| Dept. of Business and Industry, Solid Waste Disposal Rev. Bonds (Republic Services, Inc. Project), Series 2001, AMT, 3.75% 12/1/2026 (put 6/1/2023)1 | 700 | 699 | ||||||
| County of Clark, Limited Tax G.O. Park Improvement Bonds, Series 2018, 5.00% 12/1/2031 | 600 | 671 | ||||||
| Las Vegas Valley Water Dist., Limited Tax G.O. Water Improvement Bonds, Series 2022-A, 4.00% 6/1/2035 | 500 | 519 | ||||||
| City of North Las Vegas, Special Improvement Dist. No. 65 (Northern Beltway Commercial Area), Local Improvement Bonds, Series 2017, 4.00% 12/1/20271 | 505 | 496 | ||||||
| 2,385 | ||||||||
| Capital Group Fixed Income ETF Trust | 23 |
Capital Group Municipal Income ETF (continued)
| Bonds, notes & other debt instruments (continued) | Principal amount (000) | Value (000) | ||||||
| New Jersey 4.25% | ||||||||
| Econ. Dev. Auth., Special Fac. Rev. Bonds (Continental Airlines, Inc. Project), Series 1999, AMT, 5.25% 9/15/2029 | USD | 500 | $ | 498 | ||||
| Health Care Facs. Fncg. Auth., Rev. Ref. Bonds (Hackensack Meridian Health Obligated Group Issue), Series 2017-A, 5.00% 7/1/2032 | 500 | 541 | ||||||
| Health Care Facs. Fncg. Auth., Rev. Ref. Bonds (RWJ Barnabas Health Obligated Group Issue), Series 2016-A, 5.00% 7/1/2033 | 500 | 531 | ||||||
| Housing and Mortgage Fin. Agcy., Single Family Housing Rev. Bonds, Series 2020-E, 3.50% 4/1/2051 | 500 | 493 | ||||||
| Transportation Trust Fund Auth., Transportation System Bonds, Series 2019-A, 5.00% 12/15/2027 | 500 | 539 | ||||||
| Transportation Trust Fund Auth., Transportation System Bonds, Series 2018-A, 5.00% 12/15/2036 | 500 | 524 | ||||||
| 3,126 | ||||||||
| New York 9.85% | ||||||||
| Build NYC Resource Corp., Rev. Bonds (East Harlem Scholars Academy Charter School Project), Series 2022, 5.00% 6/1/20321 | 250 | 250 | ||||||
| Environmental Facs. Corp., Solid Waste Disposal Rev. Bonds (Casella Waste Systems, Inc. Project), Series 2014-R-2, AMT, 3.125% 12/1/2044 (put 6/1/2026)1 | 500 | 470 | ||||||
| Metropolitan Transportation Auth., Transportation Rev. Ref. Green Bonds, Series 2017-C-1, 5.00% 11/15/2028 | 805 | 836 | ||||||
| Mortgage Agcy., Homeowner Mortgage Rev. Bonds, Series 213, 4.25% 10/1/2047 | 500 | 503 | ||||||
| New York City G.O. Bonds, Series 2022-A-1, 5.00% 9/1/2034 | 500 | 577 | ||||||
| New York City Municipal Water Fin. Auth., Water and Sewer System Second General Resolution Rev. Bonds, Series 2020-CC-1, 4.00% 6/15/2037 | 750 | 743 | ||||||
| New York City Transitional Fin. Auth., Future Tax Secured Bonds, Series 2015-E-1, 5.00% 2/1/2030 | 500 | 521 | ||||||
| Port Auth., Consolidated Bonds, Series 178, AMT, 5.00% 12/1/2025 | 560 | 567 | ||||||
| Thruway Auth., Personal Income Tax Rev. Bonds, Series 2021-A-1, 5.00% 3/15/2029 | 500 | 567 | ||||||
| Transportation Dev. Corp., Special Fac. Rev. Bonds (American Airlines, Inc. John F. Kennedy International Airport Project), Series 2021, AMT, 2.25% 8/1/2026 | 500 | 462 | ||||||
| Transportation Dev. Corp., Special Fac. Rev. Bonds (Terminal Four John F. Kennedy International Airport Project), Series 2020-C, 5.00% 12/1/2034 | 500 | 531 | ||||||
| Transportation Dev. Corp., Special Facs. Rev. Bonds (Delta Air Lines, Inc. LaGuardia Airport Terminals C & D Redev. Project), Series 2018, AMT, 5.00% 1/1/2033 | 500 | 506 | ||||||
| Triborough Bridge and Tunnel Auth., Payroll Mobility Tax Green Bonds (MTA Bridges and Tunnels), Series 2022-E-1, 5.00% 11/15/2027 | 650 | 717 | ||||||
| 7,250 | ||||||||
| North Carolina 1.41% | ||||||||
| City of Charlotte, Charlotte Douglas International Airport, Airport Rev. Bonds, Series 2019-B, AMT, 5.00% 7/1/2030 | 500 | 539 | ||||||
| Housing Fin. Agcy., Home Ownership Rev. Ref. Bonds, Series 42, 4.00% 1/1/2050 | 500 | 501 | ||||||
| 1,040 | ||||||||
| Ohio 2.01% | ||||||||
| Buckeye Tobacco Settlement Fncg. Auth., Tobacco Settlement Asset-Backed Rev. Ref. Bonds, Series 2020-B-2, 5.00% 6/1/2055 | 500 | 435 | ||||||
| County of Cuyahoga, Metropolitan Housing Auth., Multifamily Housing Rev. Bonds (Wade Park Apartments), Series 2022, 4.75% 12/1/2027 (put 12/1/2025) | 460 | 473 | ||||||
| County of Franklin, Hospital Facs. Rev. Ref. Bonds (Nationwide Children’s Hospital), Series 2016-C, 5.00% 11/1/2031 | 500 | 573 | ||||||
| 1,481 | ||||||||
| 24 | Capital Group Fixed Income ETF Trust |
Capital Group Municipal Income ETF (continued)
| Bonds, notes & other debt instruments (continued) | Principal amount (000) | Value (000) | ||||||
| Pennsylvania 6.23% | ||||||||
| City of Allentown, Neighborhood Improvement Zone Dev. Auth., Tax Rev. Bonds (City Center Ref. Project), Series 2017, 5.00% 5/1/20421 | USD | 500 | $ | 473 | ||||
| Econ. Dev. Fncg. Auth., Private Activity Rev. Bonds (The Penndot Major Bridges Package One Project), Series 2022, AMT, 5.00% 12/31/2030 | 700 | 750 | ||||||
| Econ. Dev. Fncg. Auth., Private Activity Rev. Bonds (The Pennsylvania Rapid Bridge Replacement Project), Series 2015, AMT, 5.00% 12/31/2034 | 500 | 506 | ||||||
| Econ. Dev. Fncg. Auth., Solid Waste Disposal Rev. Bonds (Republic Services, Inc. Project), Series 2014, AMT, 2.60% 6/1/2044 (put 2022) | 750 | 750 | ||||||
| Higher Educational Facs. Auth., Health System Rev. Bonds (University of Pennsylvania Health System), Series 2015, 5.00% 8/15/2026 | 500 | 528 | ||||||
| Philadelphia School Dist., G.O. Bonds, Series 2019-A, National insured, 5.00% 9/1/2026 | 500 | 532 | ||||||
| Turnpike Commission, Turnpike Rev. Bonds, Series 2019-A, 5.00% 12/1/2027 | 500 | 547 | ||||||
| County of Westmoreland, Industrial Dev. Auth., Health System Rev. Bonds (Excela Health Project), Series 2020-A, 4.00% 7/1/2026 | 500 | 504 | ||||||
| 4,590 | ||||||||
| Puerto Rico 2.95% | ||||||||
| Aqueduct and Sewer Auth., Rev. Ref. Bonds, Series 2021-B, 4.00% 7/1/20421 | 500 | 402 | ||||||
| Electric Power Auth., Power Rev. Ref. Bonds, Series 2007-UU, Assured Guaranty Municipal insured, (3-month USD-LIBOR x 0.67 + 0.52%) 0.67% 7/1/2029 | 500 | 450 | ||||||
| G.O. Restructured Bonds, Series 2022-A-1, 4.00% 7/1/2033 | 500 | 435 | ||||||
| G.O. Restructured Bonds, Series 2022-A-1, 4.00% 7/1/2037 | 500 | 410 | ||||||
| Sales Tax Fncg. Corp., Sales Tax Rev. Restructured Bonds, Series 2018-A-1, 4.50% 7/1/2034 | 500 | 473 | ||||||
| 2,170 | ||||||||
| South Carolina 0.71% | ||||||||
| Public Service Auth., Rev. Ref. Obligations (Santee Cooper), Series 2016-A, 5.00% 12/1/2029 | 500 | 526 | ||||||
| Tennessee 1.69% | ||||||||
| Housing Dev. Agcy., Residential Fin. Program Bonds, Series 2017-2A, AMT, 4.00% 1/1/2042 | 500 | 496 | ||||||
| Tennessee Energy Acquisition Corp., Gas Project Rev. Bonds, Series 2018, 4.00% 11/1/2049 | 750 | 745 | ||||||
| 1,241 | ||||||||
| Texas 6.43% | ||||||||
| Central Texas Regional Mobility Auth., Rev. Bonds, Series 2021-B, 5.00% 1/1/2032 | 500 | 553 | ||||||
| County of Harris, Toll Road Rev. and Rev. Ref. Bonds, Series 2018-A, 5.00% 8/15/2030 | 500 | 554 | ||||||
| Hays Consolidated Independent School Dist., Unlimited Tax School Building Bonds, Series 2022, 5.00% 2/15/2035 | 635 | 718 | ||||||
| Laredo Unified School Dist., Unlimited Tax School Building Bonds, Series 2018, 5.00% 8/1/2034 | 750 | 821 | ||||||
| Lower Colorado River Auth., Rev. Ref. Bonds, Series 2022, Assured Guaranty Municipal insured, 5.00% 5/15/2026 | 500 | 536 | ||||||
| North Texas Tollway Auth., System Rev. and Rev. Ref. Bonds, Series 2021-B, 4.00% 1/1/2036 | 500 | 506 | ||||||
| Board of Regents of the Texas State University System, Rev. Fncg. System Rev. and Rev. Ref. Bonds, Series 2019-A, 5.00% 3/15/2033 | 500 | 550 | ||||||
| Waco Education Fin. Corp., Rev. Bonds (Baylor University Issue), Series 2021, 4.00% 3/1/2040 | 500 | 498 | ||||||
| 4,736 | ||||||||
| Utah 0.73% | ||||||||
| Salt Lake City, Airport Rev. Bonds (Salt Lake City International Airport), Series 2018-A, AMT, 5.00% 7/1/2028 | 500 | 535 | ||||||
| Capital Group Fixed Income ETF Trust | 25 |
Capital Group Municipal Income ETF (continued)
| Bonds, notes & other debt instruments (continued) | Principal amount (000) | Value (000) | ||||||
| Vermont 0.66% | ||||||||
| Econ. Dev. Auth., Solid Waste Disposal Rev. Bonds (Casella Waste Systems, Inc. Project), Series 2013, AMT, 4.625% 4/1/2036 (put 4/3/2028)1 | USD | 500 | $ | 487 | ||||
| Virgin Islands 0.70% | ||||||||
| Matching Fund Special Purpose Securitization Corp., Matching Fund Securitization Bonds, Series 2022-A, 5.00% 10/1/2026 | 500 | 514 | ||||||
| Virginia 0.61% | ||||||||
| County of Charles City, Econ. Dev. Auth., Solid Waste Disposal Rev. Bonds (Waste Management, Inc. Project), Series 2004-A, 2.875% 2/1/2029 | 500 | 452 | ||||||
| Washington 4.20% | ||||||||
| G.O. Bonds, Series 2020-A, 5.00% 8/1/2039 | 650 | 708 | ||||||
| Health Care Facs. Auth., Rev. Bonds (Multicare Health System), Series 2015-B, 5.00% 8/15/2025 | 500 | 522 | ||||||
| Housing Fin. Commission, Municipal Certs., Series 2021-1, 3.50% 12/20/2035 | 489 | 431 | ||||||
| Housing Fin. Commission, Single Family Program Bonds, Series 2018-1-N, 4.00% 12/1/2048 | 470 | 471 | ||||||
| County of King, Convention Center Public Facs. Dist., Lodging Tax Green Notes, Series 2021, 4.00% 7/1/2031 | 500 | 458 | ||||||
| Port of Seattle, Industrial Dev. Corp., Special Facs. Rev. Ref. Bonds (Delta Air Lines, Inc. Project), Series 2012, AMT, 5.00% 4/1/2030 | 500 | 500 | ||||||
| 3,090 | ||||||||
| West Virginia 0.68% | ||||||||
| Econ. Dev. Auth., Solid Waste Disposal Facs. Rev. Bonds (Arch Resources Project), Series 2020, AMT, 5.00% 7/1/2045 (put 7/1/2025) | 500 | 499 | ||||||
| Wisconsin 2.70% | ||||||||
| Public Fin. Auth., Project Rev. Bonds (CFP3 - Eastern Michigan University Student Housing Project), Series 2022-A-1, BAM insured, 5.00% 7/1/2030 | 700 | 770 | ||||||
| Public Fin. Auth., Retirement Community Rev. Bonds (Lifespace Communities, Inc.), Series 2020-A, 4.00% 11/15/2041 | 500 | 494 | ||||||
| Public Fin. Auth., Rev. Ref. Bonds (Celanese Corp.), Series 2016-C, AMT, 4.30% 11/1/2030 | 750 | 721 | ||||||
| 1,985 | ||||||||
| Total bonds, notes & other debt instruments (cost: $62,150,000) | 63,298 | |||||||
| Short-term securities 6.66% | ||||||||
| Municipals 6.66% | ||||||||
| State of Arizona, City of Phoenix, Industrial Dev. Auth., Health Care Facs. Rev. Bonds (Mayo Clinic), Series 2014-B, 3.50% 11/15/2052 | 400 | 400 | ||||||
| State of Ohio, Hospital Rev. Bonds (Cleveland Clinic Health System Obligated Group), Series 2008-B-4, 3.52% 1/1/2043 | 1,000 | 1,000 | ||||||
| State of Michigan, Regents of the University of Michigan, General Rev. Bonds, Series 2008-A, 3.50% 4/1/2038 | 2,000 | 2,000 | ||||||
| State of Michigan, Strategic Fund, Demand Limited Obligation Rev. Bonds (Air Products and Chemicals, Inc. Project), Series 2007, 3.56% 12/1/2042 | 1,500 | 1,500 | ||||||
| 4,900 | ||||||||
| Total short-term securities (cost: $4,900,000) | 4,900 | |||||||
| Total investment securities 92.64% (cost: $67,050,000) | 68,198 | |||||||
| Other assets less liabilities 7.36% | 5,418 | |||||||
| Net assets 100.00% | $ | 73,616 | ||||||
| 26 | Capital Group Fixed Income ETF Trust |
Capital Group Municipal Income ETF (continued)
| 1 | Acquired in a transaction exempt from registration under Rule 144A or, for commercial paper, Section 4(a)(2) of the Securities Act of 1933. May be resold in the U.S. in transactions exempt from registration, normally to qualified institutional buyers. The total value of all such securities was $4,092,000, which represented 5.56% of the net assets of the fund. |
Key to abbreviations
Agcy. = Agency
AMT = Alternative Minimum Tax
Auth. = Authority
Dept. = Department
Dev. = Development
Dist. = District
Econ. = Economic
Fac. = Facility
Facs. = Facilities
Fin. = Finance
Fncg. = Financing
G.O. = General Obligation
LIBOR = London Interbank Offered Rate
Redev. = Redevelopment
Ref. = Refunding
Rev. = Revenue
Refer to the notes to financial statements.
| Capital Group Fixed Income ETF Trust | 27 |
Capital Group U.S. Multi-Sector Income ETF
Investment portfolio December 31, 2022
| Portfolio by type of security | Percent of net assets |

| Portfolio quality summary* | Percent of net assets | |||
| U.S. Treasury and agency† | .74 | % | ||
| AAA/Aaa | 3.40 | |||
| AA/Aa | 10.89 | |||
| A/A | 15.00 | |||
| BBB/Baa | 22.45 | |||
| Below investment grade | 41.31 | |||
| Short-term securities & other assets less liabilities | 6.21 | |||
| * | Bond ratings, which typically range from AAA/Aaa (highest) to D (lowest), are assigned by credit rating agencies such as Standard & Poor’s, Moody’s and/or Fitch as an indication of an issuer’s creditworthiness. In assigning a credit rating to a security, the fund looks specifically to the ratings assigned to the issuer of the security by Standard & Poor’s, Moody’s and/or Fitch. If agency ratings differ, the security will be considered to have received the highest of those ratings, consistent with the fund’s investment policies. The ratings are not covered by the Report of Independent Registered Public Accounting Firm. |
| † | These securities are guaranteed by the full faith and credit of the U.S. government. |
| Bonds, notes & other debt instruments 93.79% | Principal amount (000) | Value (000) | ||||||
| Corporate bonds, notes & loans 75.06% | ||||||||
| Financials 13.47% | ||||||||
| AerCap Ireland Capital DAC 3.85% 10/29/2041 | USD | 535 | $ | 380 | ||||
| AG TTMT Escrow Issuer, LLC 8.625% 9/30/20271 | 290 | 293 | ||||||
| Alliant Holdings Intermediate, LLC 4.25% 10/15/20271 | 125 | 112 | ||||||
| Alliant Holdings Intermediate, LLC 6.75% 10/15/20271 | 285 | 257 | ||||||
| American Express Co. 4.42% 8/3/2033 (USD-SOFR + 1.76% on 8/3/2032)2 | 245 | 232 | ||||||
| American International Group, Inc. 4.375% 6/30/2050 | 160 | 136 | ||||||
| AmWINS Group, Inc. 4.875% 6/30/20291 | 195 | 166 | ||||||
| Aretec Escrow Issuer, Inc. 7.50% 4/1/20291 | 180 | 149 | ||||||
| AssuredPartners, Inc. 5.625% 1/15/20291 | 155 | 128 | ||||||
| Bangkok Bank PCL 3.733% 9/25/2034 (5-year UST Yield Curve Rate T Note Constant Maturity + 1.90% on 9/25/2029)2 | 250 | 209 | ||||||
| Bank of America Corp. 4.948% 7/22/2028 (USD-SOFR + 2.04% on 7/22/2027)2 | 400 | 391 | ||||||
| Bank of America Corp. 4.571% 4/27/2033 (USD-SOFR + 1.83% on 4/27/2032)2 | 260 | 239 | ||||||
| Bank of America Corp. 5.015% 7/22/2033 (USD-SOFR + 2.16% on 7/22/2032)2 | 110 | 105 | ||||||
| Charles Schwab Corp. 2.45% 3/3/2027 | 195 | 178 | ||||||
| Citigroup, Inc. 4.91% 5/24/2033 (USD-SOFR + 2.086% on 5/24/2032)2 | 200 | 188 | ||||||
| Citigroup, Inc. 6.27% 11/17/2033 (USD-SOFR + 2.338% on 11/17/2032)2 | 234 | 242 | ||||||
| Coinbase Global, Inc. 3.625% 10/1/20311 | 125 | 60 | ||||||
| Compass Diversified Holdings 5.25% 4/15/20291 | 435 | 373 | ||||||
| Corebridge Financial, Inc. 3.90% 4/5/20321 | 225 | 197 | ||||||
| Corebridge Financial, Inc. 4.40% 4/5/20521 | 195 | 156 | ||||||
| Credit Suisse Group AG 4.194% 4/1/2031 (USD-SOFR + 3.73% on 4/1/2030)1,2 | 295 | 230 | ||||||
| Deutsche Bank AG 2.552% 1/7/2028 (USD-SOFR + 1.318% on 1/7/2027)2 | 235 | 200 | ||||||
| Discover Financial Services 6.70% 11/29/2032 | 60 | 61 | ||||||
| Goldman Sachs Group, Inc. 3.102% 2/24/2033 (USD-SOFR + 1.41% on 2/24/2032)2 | 515 | 420 | ||||||
| HSBC Holdings PLC 2.804% 5/24/2032 (USD-SOFR + 1.187% on 5/24/2031)2 | 380 | 295 | ||||||
| HUB International, Ltd. 7.00% 5/1/20261 | 135 | 132 | ||||||
| HUB International, Ltd. 5.625% 12/1/20291 | 105 | 92 | ||||||
| Intercontinental Exchange, Inc. 3.00% 6/15/2050 | 385 | 261 | ||||||
| Iron Mountain Information Management Services, Inc. 5.00% 7/15/20321 | 280 | 233 | ||||||
| JPMorgan Chase & Co. 4.851% 7/25/2028 (USD-SOFR + 1.99% on 7/25/2027)2 | 100 | 98 | ||||||
| JPMorgan Chase & Co. 1.953% 2/4/2032 (USD-SOFR + 1.065% on 2/4/2031)2 | 150 | 115 | ||||||
| 28 | Capital Group Fixed Income ETF Trust |
Capital Group U.S. Multi-Sector Income ETF (continued)
| Bonds, notes & other debt instruments (continued) | Principal amount (000) | Value (000) | ||||||
| Corporate bonds, notes & loans (continued) | ||||||||
| Financials (continued) | ||||||||
| JPMorgan Chase & Co. 4.586% 4/26/2033 (USD-SOFR + 1.80% on 4/26/2032)2 | USD | 345 | $ | 320 | ||||
| JPMorgan Chase & Co. 4.912% 7/25/2033 (USD-SOFR + 2.08% on 7/25/2032)2 | 250 | 239 | ||||||
| Kasikornbank PCL HK 3.343% 10/2/2031 (5-year UST Yield Curve Rate T Note Constant Maturity + 1.70% on 10/2/2026)2 | 200 | 176 | ||||||
| LPL Holdings, Inc. 4.00% 3/15/20291 | 210 | 183 | ||||||
| Morgan Stanley 4.679% 7/17/2026 (USD-SOFR + 1.669% on 7/17/2025)2 | 130 | 128 | ||||||
| Morgan Stanley 4.889% 7/20/2033 (USD-SOFR + 2.077% on 7/20/2032)2 | 325 | 306 | ||||||
| MSCI, Inc. 3.25% 8/15/20331 | 265 | 205 | ||||||
| National Financial Partners Corp. 6.875% 8/15/20281 | 260 | 215 | ||||||
| Navient Corp. 5.625% 8/1/2033 | 300 | 214 | ||||||
| Oxford Finance, LLC 6.375% 2/1/20271 | 135 | 126 | ||||||
| PNC Financial Services Group, Inc. 6.037% 10/28/2033 (USD-SOFR Index + 2.14% on 10/28/2032)2 | 63 | 66 | ||||||
| Power Financial Corp., Ltd. 3.35% 5/16/2031 | 250 | 208 | ||||||
| Royal Bank of Canada 6.00% 11/1/2027 | 124 | 129 | ||||||
| Ryan Specialty Group, LLC 4.375% 2/1/20301 | 160 | 139 | ||||||
| State Street Corp. 5.82% 11/4/2028 (USD-SOFR + 1.715% on 11/4/2027)2 | 36 | 37 | ||||||
| Wells Fargo & Company 4.89% 7/25/2033 (USD-SOFR + 4.897% on 7/25/2032)2 | 545 | 519 | ||||||
| 9,538 | ||||||||
| Energy 10.25% | ||||||||
| Apache Corp. 5.25% 2/1/2042 | 175 | 144 | ||||||
| Apache Corp. 5.35% 7/1/2049 | 100 | 81 | ||||||
| Ascent Resources Utica Holdings, LLC 5.875% 6/30/20291 | 200 | 179 | ||||||
| Bonanza Creek Energy, Inc. 5.00% 10/15/20261 | 153 | 140 | ||||||
| BP Capital Markets America, Inc. 1.749% 8/10/2030 | 195 | 156 | ||||||
| California Resources Corp. 7.125% 2/1/20261 | 165 | 159 | ||||||
| Callon Petroleum Co. 7.50% 6/15/20301 | 130 | 119 | ||||||
| Canadian Natural Resources, Ltd. 2.95% 7/15/2030 | 70 | 59 | ||||||
| Cheniere Energy Partners, LP 3.25% 1/31/2032 | 245 | 195 | ||||||
| Cheniere Energy, Inc. 4.625% 10/15/2028 | 185 | 168 | ||||||
| Chesapeake Energy Corp. 5.875% 2/1/20291 | 215 | 204 | ||||||
| Chevron Corp. 1.995% 5/11/2027 | 230 | 207 | ||||||
| CNX Resources Corp. 7.375% 1/15/20311 | 225 | 216 | ||||||
| Comstock Resources, Inc. 5.875% 1/15/20301 | 205 | 177 | ||||||
| Crestwood Midstream Partners, LP 8.00% 4/1/20291 | 75 | 75 | ||||||
| Energy Transfer Partners, LP 6.25% 4/15/2049 | 234 | 219 | ||||||
| EQM Midstream Partners, LP 4.75% 1/15/20311 | 370 | 303 | ||||||
| EQT Corp. 3.625% 5/15/20311 | 80 | 68 | ||||||
| Exxon Mobil Corp. 2.61% 10/15/2030 | 175 | 153 | ||||||
| Exxon Mobil Corp. 3.452% 4/15/2051 | 325 | 246 | ||||||
| Genesis Energy, LP 8.00% 1/15/2027 | 220 | 208 | ||||||
| Harvest Midstream I, LP 7.50% 9/1/20281 | 100 | 96 | ||||||
| Hilcorp Energy I, LP 6.25% 4/15/20321 | 250 | 216 | ||||||
| Kinder Morgan, Inc. 4.80% 2/1/2033 | 200 | 186 | ||||||
| Kinder Morgan, Inc. 5.45% 8/1/2052 | 70 | 63 | ||||||
| Leviathan Bond, Ltd. 6.75% 6/30/20301 | 155 | 147 | ||||||
| MPLX, LP 4.95% 9/1/2032 | 270 | 254 | ||||||
| MPLX, LP 4.95% 3/14/2052 | 165 | 136 | ||||||
| New Fortress Energy, Inc. 6.50% 9/30/20261 | 270 | 251 | ||||||
| NGL Energy Operating, LLC 7.50% 2/1/20261 | 275 | 245 | ||||||
| NGL Energy Partners, LP 7.50% 11/1/2023 | 65 | 63 | ||||||
| Northern Oil and Gas, Inc. 8.125% 3/1/20281 | 222 | 213 | ||||||
| Occidental Petroleum Corp. 6.625% 9/1/2030 | 125 | 129 | ||||||
| Occidental Petroleum Corp. 6.125% 1/1/2031 | 150 | 152 | ||||||
| Occidental Petroleum Corp. 6.60% 3/15/2046 | 100 | 103 | ||||||
| Petróleos Mexicanos 6.49% 1/23/2027 | 150 | 137 | ||||||
| Range Resources Corp. 4.75% 2/15/20301 | 215 | 190 | ||||||
| Shell International Finance BV 3.00% 11/26/2051 | 340 | 232 | ||||||
| Southwestern Energy Co. 4.75% 2/1/2032 | 350 | 300 | ||||||
| Sunoco, LP 4.50% 5/15/2029 | 205 | 180 | ||||||
| Total Capital International 3.13% 5/29/2050 | 135 | 96 | ||||||
| Capital Group Fixed Income ETF Trust | 29 |
Capital Group U.S. Multi-Sector Income ETF (continued)
| Bonds, notes & other debt instruments (continued) | Principal amount (000) | Value (000) | ||||||
| Corporate bonds, notes & loans (continued) | ||||||||
| Energy (continued) | ||||||||
| Venture Global Calcasieu Pass, LLC 4.125% 8/15/20311 | USD | 100 | $ | 85 | ||||
| Western Gas Partners, LP 4.50% 3/1/2028 | 155 | 143 | ||||||
| Williams Companies, Inc. 4.65% 8/15/2032 | 175 | 163 | ||||||
| 7,256 | ||||||||
| Communication services 8.42% | ||||||||
| AT&T, Inc. 2.25% 2/1/2032 | 165 | 130 | ||||||
| AT&T, Inc. 3.50% 9/15/2053 | 180 | 122 | ||||||
| AT&T, Inc. 3.55% 9/15/2055 | 190 | 128 | ||||||
| CCO Holdings, LLC 4.50% 6/1/20331 | 250 | 192 | ||||||
| CCO Holdings, LLC 4.25% 1/15/20341 | 525 | 388 | ||||||
| Charter Communications Operating, LLC 2.30% 2/1/2032 | 135 | 100 | ||||||
| Charter Communications Operating, LLC 3.70% 4/1/2051 | 375 | 229 | ||||||
| Comcast Corp. 1.50% 2/15/2031 | 215 | 168 | ||||||
| DISH Network Corp. 11.75% 11/15/20271 | 245 | 253 | ||||||
| Frontier Communications Corp. 5.00% 5/1/20281 | 220 | 192 | ||||||
| Gray Escrow II, Inc. 5.375% 11/15/20311 | 223 | 161 | ||||||
| Lamar Media Corp. 3.625% 1/15/2031 | 230 | 190 | ||||||
| Meta Platforms, Inc. 3.85% 8/15/2032 | 415 | 366 | ||||||
| Meta Platforms, Inc. 4.45% 8/15/2052 | 345 | 276 | ||||||
| Netflix, Inc. 4.875% 4/15/2028 | 315 | 305 | ||||||
| Netflix, Inc. 5.875% 11/15/2028 | 120 | 122 | ||||||
| Netflix, Inc. 5.375% 11/15/20291 | 90 | 87 | ||||||
| News Corp. 3.875% 5/15/20291 | 320 | 278 | ||||||
| Nexstar Escrow Corp. 5.625% 7/15/20271 | 155 | 143 | ||||||
| Sirius XM Radio, Inc. 3.875% 9/1/20311 | 385 | 301 | ||||||
| Sprint Corp. 6.875% 11/15/2028 | 195 | 203 | ||||||
| Tencent Holdings, Ltd. 3.24% 6/3/2050 | 200 | 127 | ||||||
| T-Mobile US, Inc. 2.55% 2/15/2031 | 350 | 287 | ||||||
| T-Mobile US, Inc. 3.40% 10/15/2052 | 130 | 88 | ||||||
| Univision Communications, Inc. 4.50% 5/1/20291 | 370 | 310 | ||||||
| Verizon Communications, Inc. 2.355% 3/15/2032 | 280 | 223 | ||||||
| Verizon Communications, Inc. 2.875% 11/20/2050 | 80 | 51 | ||||||
| Verizon Communications, Inc. 3.55% 3/22/2051 | 160 | 115 | ||||||
| Warner Music Group 3.875% 7/15/20301 | 140 | 121 | ||||||
| WarnerMedia Holdings, Inc. 4.279% 3/15/20321 | 160 | 132 | ||||||
| WarnerMedia Holdings, Inc. 5.141% 3/15/20521 | 240 | 175 | ||||||
| 5,963 | ||||||||
| Consumer discretionary 8.00% | ||||||||
| Allied Universal Holdco, LLC 4.625% 6/1/20281 | 320 | 265 | ||||||
| Amazon.com, Inc. 4.70% 12/1/2032 | 155 | 154 | ||||||
| Asbury Automotive Group, Inc. 4.625% 11/15/20291 | 180 | 152 | ||||||
| Bath & Body Works, Inc. 6.875% 11/1/2035 | 230 | 205 | ||||||
| Boyd Gaming Corp. 4.75% 12/1/2027 | 145 | 135 | ||||||
| Boyne USA, Inc. 4.75% 5/15/20291 | 175 | 155 | ||||||
| Caesars Entertainment, Inc. 4.625% 10/15/20291 | 190 | 155 | ||||||
| Caesars Resort Collection, LLC 5.75% 7/1/20251 | 105 | 103 | ||||||
| CDI Escrow Issuer, Inc. 5.75% 4/1/20301 | 195 | 175 | ||||||
| Cedar Fair, LP 5.50% 5/1/20251 | 100 | 99 | ||||||
| Fertitta Entertainment, Inc. 4.625% 1/15/20291 | 75 | 64 | ||||||
| Fertitta Entertainment, Inc. 6.75% 1/15/20301 | 150 | 121 | ||||||
| First Student Bidco, Inc. 4.00% 7/31/20291 | 210 | 174 | ||||||
| Ford Motor Co. 6.10% 8/19/2032 | 175 | 162 | ||||||
| Ford Motor Credit Company, LLC 3.815% 11/2/2027 | 360 | 317 | ||||||
| Hanesbrands, Inc. 4.875% 5/15/20261 | 225 | 201 | ||||||
| Hilton Worldwide Holdings, Inc. 4.00% 5/1/20311 | 225 | 189 | ||||||
| Home Depot, Inc. 2.375% 3/15/2051 | 130 | 78 | ||||||
| International Game Technology PLC 5.25% 1/15/20291 | 230 | 215 | ||||||
| Lowe’s Companies, Inc. 5.625% 4/15/2053 | 50 | 48 | ||||||
| Marriott International, Inc. 3.50% 10/15/2032 | 110 | 92 | ||||||
| McDonald’s Corp. 4.60% 9/9/2032 | 190 | 186 | ||||||
| 30 | Capital Group Fixed Income ETF Trust |
Capital Group U.S. Multi-Sector Income ETF (continued)
| Bonds, notes & other debt instruments (continued) | Principal amount (000) | Value (000) | ||||||
| Corporate bonds, notes & loans (continued) | ||||||||
| Consumer discretionary (continued) | ||||||||
| McDonald’s Corp. 5.15% 9/9/2052 | USD | 125 | $ | 121 | ||||
| Mohegan Gaming & Entertainment 8.00% 2/1/20261 | 96 | 90 | ||||||
| Party City Holdings, Inc. 8.75% 2/15/20261 | 230 | 67 | ||||||
| Royal Caribbean Cruises, Ltd. 4.25% 7/1/20261 | 285 | 231 | ||||||
| Royal Caribbean Cruises, Ltd. 5.50% 4/1/20281 | 90 | 72 | ||||||
| Royal Caribbean Cruises, Ltd. 8.25% 1/15/20291 | 125 | 126 | ||||||
| Sands China, Ltd. 3.75% 8/8/20312 | 200 | 158 | ||||||
| Scientific Games Holdings, LP 6.625% 3/1/20301 | 240 | 203 | ||||||
| Sonic Automotive, Inc. 4.625% 11/15/20291 | 229 | 184 | ||||||
| Stellantis Finance US, Inc. 2.691% 9/15/20311 | 305 | 233 | ||||||
| Vail Resorts, Inc. 6.25% 5/15/20251 | 90 | 90 | ||||||
| WASH Multifamily Acquisition, Inc. 5.75% 4/15/20261 | 235 | 222 | ||||||
| Wheel Pros, Inc. 6.50% 5/15/20291 | 100 | 35 | ||||||
| Wheel Pros, Inc., Term Loan, (3-month USD-LIBOR + 4.50%) 8.825% 5/11/20283,4 | 100 | 68 | ||||||
| Wyndham Worldwide Corp. 4.375% 8/15/20281 | 105 | 94 | ||||||
| Wynn Las Vegas, LLC 4.25% 5/30/20231 | 125 | 123 | ||||||
| Wynn Resorts Finance, LLC 5.125% 10/1/20291 | 120 | 103 | ||||||
| 5,665 | ||||||||
| Health care 6.43% | ||||||||
| AmerisourceBergen Corp. 2.70% 3/15/2031 | 160 | 133 | ||||||
| Amgen, Inc. 4.20% 3/1/2033 | 260 | 241 | ||||||
| Amgen, Inc. 3.00% 1/15/2052 | 200 | 129 | ||||||
| Avantor Funding, Inc. 3.875% 11/1/20291 | 275 | 231 | ||||||
| Bausch Health Companies, Inc. 5.00% 2/15/20291 | 125 | 60 | ||||||
| Bausch Health Companies, Inc. 5.25% 2/15/20311 | 170 | 83 | ||||||
| Baxter International, Inc. 2.539% 2/1/2032 | 270 | 215 | ||||||
| Becton, Dickinson and Company 4.298% 8/22/2032 | 100 | 94 | ||||||
| Catalent Pharma Solutions, Inc. 3.125% 2/15/20291 | 27 | 22 | ||||||
| Catalent Pharma Solutions, Inc. 3.50% 4/1/20301 | 260 | 206 | ||||||
| Centene Corp. 2.45% 7/15/2028 | 240 | 203 | ||||||
| Centene Corp. 2.50% 3/1/2031 | 495 | 388 | ||||||
| Charles River Laboratories International, Inc. 3.75% 3/15/20291 | 160 | 142 | ||||||
| GE Healthcare Holding, LLC 5.905% 11/22/20321 | 150 | 156 | ||||||
| GE Healthcare Holding, LLC 6.377% 11/22/20521 | 100 | 107 | ||||||
| HCA, Inc. 2.375% 7/15/2031 | 150 | 117 | ||||||
| HealthEquity, Inc. 4.50% 10/1/20291 | 100 | 88 | ||||||
| Molina Healthcare, Inc. 3.875% 5/15/20321 | 235 | 195 | ||||||
| Mozart Debt Merger Sub, Inc. 5.25% 10/1/20291 | 205 | 163 | ||||||
| Radiology Partners, Inc. 9.25% 2/1/20281 | 125 | 70 | ||||||
| Surgery Center Holdings 10.00% 4/15/20271 | 29 | 30 | ||||||
| Tenet Healthcare Corp. 6.125% 10/1/20281 | 125 | 112 | ||||||
| Tenet Healthcare Corp. 4.375% 1/15/20301 | 155 | 134 | ||||||
| Teva Pharmaceutical Finance Co. BV 3.15% 10/1/2026 | 250 | 219 | ||||||
| Teva Pharmaceutical Finance Co. BV 6.75% 3/1/2028 | 255 | 249 | ||||||
| Teva Pharmaceutical Finance Co. BV 5.125% 5/9/2029 | 200 | 178 | ||||||
| Thermo Fisher Scientific, Inc. 4.95% 11/21/2032 | 51 | 52 | ||||||
| UnitedHealth Group, Inc. 5.30% 2/15/2030 | 75 | 77 | ||||||
| UnitedHealth Group, Inc. 5.35% 2/15/2033 | 105 | 109 | ||||||
| UnitedHealth Group, Inc. 2.90% 5/15/2050 | 130 | 89 | ||||||
| UnitedHealth Group, Inc. 5.875% 2/15/2053 | 35 | 38 | ||||||
| Valeant Pharmaceuticals International, Inc. 5.50% 11/1/20251 | 200 | 170 | ||||||
| Zoetis, Inc. 5.60% 11/16/2032 | 50 | 52 | ||||||
| 4,552 | ||||||||
| Industrials 6.28% | ||||||||
| Allegiant Travel Co. 7.25% 8/15/20271 | 125 | 119 | ||||||
| Ashtead Capital, Inc. 5.50% 8/11/20321 | 200 | 192 | ||||||
| Boeing Company 3.625% 2/1/2031 | 200 | 176 | ||||||
| Boeing Company 5.705% 5/1/2040 | 80 | 77 | ||||||
| Boeing Company 5.805% 5/1/2050 | 205 | 191 | ||||||
| Bombardier, Inc. 7.125% 6/15/20261 | 130 | 126 | ||||||
| Capital Group Fixed Income ETF Trust | 31 |
Capital Group U.S. Multi-Sector Income ETF (continued)
| Bonds, notes & other debt instruments (continued) | Principal amount (000) | Value (000) | ||||||
| Corporate bonds, notes & loans (continued) | ||||||||
| Industrials (continued) | ||||||||
| Bombardier, Inc. 7.875% 4/15/20271 | USD | 215 | $ | 209 | ||||
| Burlington Northern Santa Fe, LLC 2.875% 6/15/2052 | 225 | 151 | ||||||
| BWX Technologies, Inc. 4.125% 4/15/20291 | 150 | 131 | ||||||
| Canadian Pacific Railway, Ltd. 3.10% 12/2/2051 | 200 | 135 | ||||||
| Clarivate Science Holdings Corp. 3.875% 7/1/20281 | 140 | 121 | ||||||
| CoreLogic, Inc. 4.50% 5/1/20281 | 140 | 108 | ||||||
| CSX Corp. 2.50% 5/15/2051 | 220 | 135 | ||||||
| Dun & Bradstreet Corp. 5.00% 12/15/20291 | 130 | 111 | ||||||
| Eaton Corp. 4.15% 3/15/2033 | 95 | 89 | ||||||
| Harsco Corp. 5.75% 7/31/20271 | 155 | 123 | ||||||
| Lima Metro Line 2 Finance, Ltd. 5.875% 7/5/2034 | 95 | 92 | ||||||
| Lockheed Martin Corp. 5.25% 1/15/2033 | 191 | 197 | ||||||
| Norfolk Southern Corp. 3.05% 5/15/2050 | 175 | 118 | ||||||
| Raytheon Technologies Corp. 2.82% 9/1/2051 | 240 | 157 | ||||||
| Republic Services, Inc. 1.45% 2/15/2031 | 150 | 116 | ||||||
| Sensata Technologies Holding BV 4.00% 4/15/20291 | 225 | 194 | ||||||
| Spirit AeroSystems, Inc. 4.60% 6/15/2028 | 70 | 57 | ||||||
| Spirit AeroSystems, Inc. 9.375% 11/30/20291 | 182 | 192 | ||||||
| Stericycle, Inc. 3.875% 1/15/20291 | 175 | 153 | ||||||
| TransDigm, Inc. 6.25% 3/15/20261 | 135 | 133 | ||||||
| TransDigm, Inc. 4.625% 1/15/2029 | 100 | 88 | ||||||
| Triumph Group, Inc. 6.25% 9/15/20241 | 95 | 90 | ||||||
| Uber Technologies, Inc. 8.00% 11/1/20261 | 155 | 156 | ||||||
| Union Pacific Corp. 2.95% 3/10/2052 | 395 | 269 | ||||||
| United Rentals, Inc. 5.25% 1/15/2030 | 160 | 151 | ||||||
| WESCO Distribution, Inc. 7.25% 6/15/20281 | 90 | 91 | ||||||
| 4,448 | ||||||||
| Utilities 5.26% | ||||||||
| Alabama Power Co. 3.94% 9/1/2032 | 120 | 111 | ||||||
| CenterPoint Energy, Inc. 2.90% 7/1/2050 | 240 | 163 | ||||||
| Consumers Energy Co. 3.60% 8/15/2032 | 75 | 69 | ||||||
| Consumers Energy Co. 2.65% 8/15/2052 | 190 | 120 | ||||||
| DTE Electric Co. 2.625% 3/1/2031 | 215 | 183 | ||||||
| Duke Energy Carolinas, LLC 2.45% 8/15/2029 | 75 | 65 | ||||||
| Duke Energy Corp. 5.00% 8/15/2052 | 70 | 63 | ||||||
| Duke Energy Florida, LLC 5.95% 11/15/2052 | 175 | 187 | ||||||
| Edison International 4.125% 3/15/2028 | 65 | 60 | ||||||
| Edison International 6.95% 11/15/2029 | 95 | 99 | ||||||
| Entergy Louisiana, LLC 2.90% 3/15/2051 | 250 | 161 | ||||||
| FirstEnergy Corp. 2.65% 3/1/2030 | 195 | 159 | ||||||
| FirstEnergy Transmission, LLC 4.35% 1/15/20251 | 150 | 146 | ||||||
| Florida Power & Light Company 2.875% 12/4/2051 | 120 | 81 | ||||||
| NextEra Energy Capital Holdings, Inc. 2.25% 6/1/2030 | 130 | 107 | ||||||
| Oncor Electric Delivery Company, LLC 2.70% 11/15/2051 | 305 | 201 | ||||||
| Pacific Gas and Electric Co. 3.30% 12/1/2027 | 240 | 212 | ||||||
| Pacific Gas and Electric Co. 3.25% 6/1/2031 | 270 | 220 | ||||||
| Pacific Gas and Electric Co. 3.30% 8/1/2040 | 135 | 92 | ||||||
| Pacific Gas and Electric Co. 3.50% 8/1/2050 | 180 | 113 | ||||||
| PG&E Corp. 5.25% 7/1/2030 | 155 | 141 | ||||||
| Southern California Edison Co. 4.70% 6/1/2027 | 80 | 78 | ||||||
| Southern California Edison Co. 2.50% 6/1/2031 | 190 | 157 | ||||||
| Southern California Edison Co. 2.95% 2/1/2051 | 305 | 197 | ||||||
| Venture Global Calcasieu Pass, LLC 3.875% 8/15/20291 | 180 | 158 | ||||||
| Virginia Electric and Power Co. 2.30% 11/15/2031 | 220 | 178 | ||||||
| Xcel Energy, Inc. 3.40% 6/1/2030 | 230 | 206 | ||||||
| 3,727 | ||||||||
| 32 | Capital Group Fixed Income ETF Trust |
Capital Group U.S. Multi-Sector Income ETF (continued)
| Bonds, notes & other debt instruments (continued) | Principal amount (000) | Value (000) | ||||||
| Corporate bonds, notes & loans (continued) | ||||||||
| Consumer staples 5.19% | ||||||||
| 7-Eleven, Inc. 1.80% 2/10/20311 | USD | 180 | $ | 138 | ||||
| 7-Eleven, Inc. 2.80% 2/10/20511 | 70 | 43 | ||||||
| Altria Group, Inc. 3.70% 2/4/2051 | 560 | 353 | ||||||
| Anheuser-Busch InBev NV 5.55% 1/23/2049 | 150 | 149 | ||||||
| Anheuser-Busch InBev NV 4.50% 6/1/2050 | 250 | 220 | ||||||
| B&G Foods, Inc. 5.25% 4/1/2025 | 220 | 193 | ||||||
| British American Tobacco PLC 3.984% 9/25/2050 | 380 | 250 | ||||||
| Central Garden & Pet Co. 4.125% 4/30/20311 | 205 | 170 | ||||||
| Conagra Brands, Inc. 5.40% 11/1/2048 | 170 | 158 | ||||||
| Constellation Brands, Inc. 2.25% 8/1/2031 | 205 | 163 | ||||||
| Darling Ingredients, Inc. 6.00% 6/15/20301 | 175 | 171 | ||||||
| Ingles Markets, Inc. 4.00% 6/15/20311 | 60 | 51 | ||||||
| Kraft Heinz Company 4.375% 6/1/2046 | 100 | 82 | ||||||
| Kroger Co. 3.95% 1/15/2050 | 110 | 86 | ||||||
| Kronos Acquisition Holdings, Inc. 7.00% 12/31/20271 | 230 | 190 | ||||||
| Performance Food Group, Inc. 4.25% 8/1/20291 | 245 | 213 | ||||||
| Philip Morris International, Inc. 5.125% 11/17/2027 | 160 | 162 | ||||||
| Philip Morris International, Inc. 5.625% 11/17/2029 | 122 | 124 | ||||||
| Philip Morris International, Inc. 5.75% 11/7/2032 | 150 | 153 | ||||||
| Post Holdings, Inc. 4.625% 4/15/20301 | 335 | 290 | ||||||
| Prestige Brands International, Inc. 3.75% 4/1/20311 | 170 | 140 | ||||||
| Simmons Foods, Inc. 4.625% 3/1/20291 | 220 | 179 | ||||||
| 3,678 | ||||||||
| Materials 5.07% | ||||||||
| Allegheny Technologies, Inc. 4.875% 10/1/2029 | 155 | 137 | ||||||
| Axalta Coating Systems, LLC 4.75% 6/15/20271 | 150 | 139 | ||||||
| Ball Corp. 6.875% 3/15/2028 | 325 | 334 | ||||||
| Braskem Idesa SAPI 6.99% 2/20/2032 | 250 | 179 | ||||||
| CAN-PACK SA 3.875% 11/15/20291 | 200 | 158 | ||||||
| Celanese US Holdings, LLC 6.379% 7/15/2032 | 85 | 81 | ||||||
| Element Solutions, Inc. 3.875% 9/1/20281 | 155 | 132 | ||||||
| First Quantum Minerals, Ltd. 6.875% 10/15/20271 | 250 | 235 | ||||||
| FXI Holdings, Inc. 12.25% 11/15/20261 | 230 | 191 | ||||||
| International Flavors & Fragrances, Inc. 3.468% 12/1/20501 | 255 | 174 | ||||||
| Methanex Corp. 5.125% 10/15/2027 | 80 | 74 | ||||||
| Mineral Resources, Ltd. 8.50% 5/1/20301 | 135 | 137 | ||||||
| Nova Chemicals Corp. 4.25% 5/15/20291 | 55 | 45 | ||||||
| Novelis Corp. 3.875% 8/15/20311 | 155 | 127 | ||||||
| Nutrien, Ltd. 5.90% 11/7/2024 | 42 | 43 | ||||||
| SCIH Salt Holdings, Inc. 4.875% 5/1/20281 | 210 | 181 | ||||||
| SCIH Salt Holdings, Inc. 6.625% 5/1/20291 | 170 | 137 | ||||||
| Scotts Miracle-Gro Co. 4.375% 2/1/2032 | 145 | 109 | ||||||
| Sealed Air Corp. 4.00% 12/1/20271 | 100 | 91 | ||||||
| Sherwin-Williams Company 2.90% 3/15/2052 | 225 | 141 | ||||||
| Summit Materials, LLC 5.25% 1/15/20291 | 100 | 93 | ||||||
| Valvoline, Inc. 3.625% 6/15/20311 | 210 | 173 | ||||||
| Venator Finance SARL 9.50% 7/1/20251 | 95 | 69 | ||||||
| Warrior Met Coal, Inc. 7.875% 12/1/20281 | 195 | 192 | ||||||
| Yara International ASA 7.378% 11/14/20321 | 206 | 215 | ||||||
| 3,587 | ||||||||
| Information technology 4.09% | ||||||||
| Almonde, Inc., Term Loan B, (3-month USD-LIBOR + 3.50%) 6.871% 6/13/20243,4 | 35 | 31 | ||||||
| Almonde, Inc., Term Loan, (3-month USD-LIBOR + 7.25%) 10.621% 6/13/20253,4 | 50 | 38 | ||||||
| Analog Devices, Inc. 2.10% 10/1/2031 | 285 | 231 | ||||||
| Apple, Inc. 3.35% 8/8/2032 | 150 | 137 | ||||||
| Apple, Inc. 2.40% 8/20/2050 | 100 | 63 | ||||||
| Apple, Inc. 2.65% 2/8/2051 | 265 | 176 | ||||||
| Block, Inc. 3.50% 6/1/2031 | 125 | 100 | ||||||
| Booz Allen Hamilton, Inc. 4.00% 7/1/20291 | 165 | 145 | ||||||
| Broadcom, Inc. 2.60% 2/15/20331 | 215 | 162 | ||||||
| Capital Group Fixed Income ETF Trust | 33 |
Capital Group U.S. Multi-Sector Income ETF (continued)
| Bonds, notes & other debt instruments (continued) | Principal amount (000) | Value (000) | ||||||
| Corporate bonds, notes & loans (continued) | ||||||||
| Information technology (continued) | ||||||||
| Broadcom, Inc. 4.926% 5/15/20371 | USD | 275 | $ | 241 | ||||
| CDK Global, Inc. 7.25% 6/15/20291 | 130 | 127 | ||||||
| Diebold Nixdorf, Inc. 9.375% 7/15/20251 | 51 | 36 | ||||||
| Finastra, Ltd., Term Loan B, (3-month EUR-EURIBOR + 3.00%) 4.00% 6/13/20243,4 | EUR | 25 | 23 | |||||
| Gartner, Inc. 3.75% 10/1/20301 | USD | 125 | 108 | |||||
| Mastercard, Inc. 1.90% 3/15/2031 | 200 | 163 | ||||||
| MoneyGram International, Inc. 5.375% 8/1/20261 | 180 | 183 | ||||||
| PayPal Holdings, Inc. 4.40% 6/1/2032 | 100 | 94 | ||||||
| PayPal Holdings, Inc. 5.05% 6/1/2052 | 210 | 191 | ||||||
| Sabre GLBL, Inc. 11.25% 12/15/20271 | 100 | 103 | ||||||
| salesforce.com, inc. 2.90% 7/15/2051 | 270 | 178 | ||||||
| ServiceNow, Inc. 1.40% 9/1/2030 | 245 | 188 | ||||||
| Tibco Software Inc, Term Loan A, (3-month USD CME Term SOFR + 4.50%) 9.180% 9/29/20283,4 | 200 | 178 | ||||||
| 2,896 | ||||||||
| Real estate 2.60% | ||||||||
| American Tower Corp. 2.95% 1/15/2051 | 315 | 196 | ||||||
| Anywhere Real Estate Group, LLC 5.25% 4/15/20301 | 185 | 135 | ||||||
| Equinix, Inc. 2.50% 5/15/2031 | 245 | 197 | ||||||
| Howard Hughes Corp. 4.375% 2/1/20311 | 190 | 154 | ||||||
| Kennedy-Wilson Holdings, Inc. 4.75% 2/1/2030 | 300 | 229 | ||||||
| Ladder Capital Finance Holdings LLLP 4.75% 6/15/20291 | 140 | 113 | ||||||
| Medical Properties Trust, Inc. 3.50% 3/15/2031 | 235 | 162 | ||||||
| Park Intermediate Holdings, LLC 4.875% 5/15/20291 | 240 | 204 | ||||||
| Sun Communities Operating, LP 4.20% 4/15/2032 | 200 | 177 | ||||||
| VICI Properties, LP 5.125% 5/15/2032 | 250 | 232 | ||||||
| WeWork Companies, LLC 5.00% 7/10/20251 | 125 | 42 | ||||||
| 1,841 | ||||||||
| Total corporate bonds, notes & loans | 53,151 | |||||||
| Mortgage-backed obligations 9.44% | ||||||||
| Commercial mortgage-backed securities 8.25% | ||||||||
| 3650R Commercial Mortgage Trust, Series 2022-PF2, Class B, 5.289% 11/15/20555 | 634 | 561 | ||||||
| Bank Commercial Mortgage Trust, Series 2022-BNK44, Class B, 5.746% 11/15/20325 | 556 | 524 | ||||||
| Bank Commercial Mortgage Trust, Series 2022-BNK44, Class C, 5.746% 11/15/20325 | 500 | 410 | ||||||
| Barclays Commercial Mortgage Securities, LLC, Series 2022-C18, Class C, 6.148% 12/15/20555 | 508 | 438 | ||||||
| BX Trust, Series 2022-PSB, Class A, (1-month USD CME Term SOFR + 2.451%) 6.787% 8/15/20391,5 | 494 | 494 | ||||||
| BX Trust, Series 2022-PSB, Class C, (1-month USD CME Term SOFR + 3.697%) 8.033% 8/15/20391,5 | 247 | 246 | ||||||
| BX Trust, Series 2020-VIV4, Class A, 2.843% 3/9/20441,5 | 500 | 406 | ||||||
| Great Wolf Trust, Series 2019-WOLF, Class A, (1-month USD-LIBOR + 1.034%) 5.352% 12/15/20361,5 | 243 | 236 | ||||||
| Multifamily Connecticut Avenue Securities, Series 2020-1, Class M10, (1-month USD-LIBOR + 3.75%) 8.139% 3/25/20501,5 | 1,360 | 1,261 | ||||||
| Wells Fargo Commercial Mortgage Trust, Series 2018-C46, Class B, 4.633% 8/15/20515 | 967 | 854 | ||||||
| WMRK Commercial Mortgage Trust, Series 2022-WMRK, Class A, (1-month USD CME Term SOFR + 2.789%) 7.125% 11/15/20271,5 | 412 | 412 | ||||||
| 5,842 | ||||||||
| 34 | Capital Group Fixed Income ETF Trust |
Capital Group U.S. Multi-Sector Income ETF (continued)
| Bonds, notes & other debt instruments (continued) | Principal amount (000) | Value (000) | ||||||||||
| Mortgage-backed obligations (continued) | ||||||||||||
| Collateralized mortgage-backed obligations (privately originated) 1.19% | ||||||||||||
| Freddie Mac Structured Agency Credit Risk Debt Notes, Series 2020-DNA2, Class M2, (1-month USD-LIBOR + 1.85%) 6.239% 2/25/20501,5 | USD | 429 | $ | 428 | ||||||||
| Freddie Mac Structured Agency Credit Risk Debt Notes, Series 2020-DNA4, Class B1, (1-month USD-LIBOR + 6.00%) 10.389% 8/25/20501,5 | 389 | 415 | ||||||||||
| 843 | ||||||||||||
| Total mortgage-backed obligations | 6,685 | |||||||||||
| Asset-backed obligations 8.55% | ||||||||||||
| Avis Budget Rental Car Funding AESOP, LLC, Series 2022-5, Class B, 7.09% 4/20/20271,5 | 553 | 551 | ||||||||||
| CF Hippolyta, LLC, Series 2020-1, Class A1, 1.69% 7/15/20601,5 | 681 | 609 | ||||||||||
| Drive Auto Receivables Trust, Series 2021-3, Class B, 1.11% 5/15/20265 | 500 | 486 | ||||||||||
| Exeter Automobile Receivables Trust, Series 2019-3, Class E, 4.00% 8/17/20261,5 | 810 | 775 | ||||||||||
| Exeter Automobile Receivables Trust, Series 2022-6, Class E, 11.61% 6/17/20301,5 | 1,500 | 1,518 | ||||||||||
| Mission Lane Credit Card Master Trust, Series 2022-B, Class C, 12.09% 1/15/20285,6 | 1,000 | 1,000 | ||||||||||
| PPM CLO, Ltd., Series 2022-6, Class B, (3-month USD CME Term SOFR + 3.60%) 3.60% 1/20/20311,5 | 467 | 465 | ||||||||||
| Santander Drive Auto Receivables Trust, Series 2022-7, Class C, 6.69% 3/17/20315 | 149 | 152 | ||||||||||
| Stratus CLO, Series 2022-3, Class B, (3-month USD CME Term SOFR + 3.05%) 7.127% 10/20/20311,5 | 500 | 499 | ||||||||||
| 6,055 | ||||||||||||
| U.S. Treasury bonds & notes 0.74% | ||||||||||||
| U.S. Treasury 0.74% | ||||||||||||
| U.S. Treasury 2.75% 8/15/2032 | 200 | 182 | ||||||||||
| U.S. Treasury 3.375% 8/15/2042 | 385 | 344 | ||||||||||
| 526 | ||||||||||||
| Total bonds, notes & other debt instruments (cost: $65,556,000) | 66,417 | |||||||||||
| Short-term securities 4.18% | Weighted average yield at acquisition | |||||||||||
| Federal agency bills and notes 2.47% | ||||||||||||
| Federal Home Loan Bank 1/3/2023 | 3.956 | % | 350 | 350 | ||||||||
| Federal Home Loan Bank 1/10/2023 | 3.935 | 700 | 699 | |||||||||
| Federal Home Loan Bank 1/11/2023 | 4.190 | 500 | 500 | |||||||||
| Federal Home Loan Bank 1/13/2023 | 4.137 | 200 | 200 | |||||||||
| 1,749 | ||||||||||||
| Commercial paper 1.68% | ||||||||||||
| Proctor & Gamble 2/21/20231 | 4.360 | 1,200 | 1,192 | |||||||||
| Shares | ||||||||||||
| Money market investments 0.03% | ||||||||||||
| Capital Group Central Cash Fund 4.31%7,8 | 206 | 20 | ||||||||||
| Total short-term securities (cost: $2,962,000) | 2,961 | |||||||||||
| Total investment securities 97.97% (cost: $68,518,000) | 69,378 | |||||||||||
| Other assets less liabilities 2.03% | 1,437 | |||||||||||
| Net assets 100.00% | $ | 70,815 | ||||||||||
| Capital Group Fixed Income ETF Trust | 35 |
Capital Group U.S. Multi-Sector Income ETF (continued)
Swap contracts
Interest rate swaps
Centrally cleared interest rate swaps
| Upfront | Unrealized | |||||||||||||||||||||||||
Receive | Pay | Notional | Value at | premium | appreciation | |||||||||||||||||||||
| Payment | Payment | Expiration | amount | 12/31/2022 | paid | at 12/31/2022 | ||||||||||||||||||||
| Rate | frequency | Rate | frequency | date | (000) | (000) | (000) | (000) | ||||||||||||||||||
| 4.446% | Annual | SOFR | Annual | 1/4/2025 | USD | 7,800 | $ | — | $ | — | $ | — | ||||||||||||||
| 3.7505% | Annual | SOFR | Annual | 1/4/2028 | 4,900 | — | — | — | ||||||||||||||||||
| SOFR | Annual | 3.5145% | Annual | 1/3/2033 | 9,700 | 34 | — | 34 | ||||||||||||||||||
| 3.4645% | Annual | SOFR | Annual | 1/4/2043 | 800 | — | — | — | ||||||||||||||||||
| SOFR | Annual | 3.167 | Annual | 1/3/2053 | 3,900 | 33 | — | 33 | ||||||||||||||||||
| $ | 67 | $ | — | $ | 67 | |||||||||||||||||||||
Credit default swaps
Centrally cleared credit default swaps on credit indices — sell protection
| Financing rate received | Payment frequency | Reference index | Expiration date | Notional amount (000) | Value at 12/31/2022 (000) | Upfront premium paid (000) | Unrealized appreciation at 12/31/2022 (000) | ||||||||||||||||
| 5.00% | Quarterly | CDX.NA.HY.38 | 6/20/2027 | $1,485 | $31 | $11 | $20 | ||||||||||||||||
Investments in affiliates8
| Value of affiliate at 10/25/20229 (000) | Additions (000) | Reductions (000) | Net realized gain (000) | Net unrealized appreciation (000) | Value of affiliate at 12/31/2022 (000) | Dividend income (000) | ||||||||||||||||||||||
| Short-term securities 0.03% | ||||||||||||||||||||||||||||
| Money market investments 0.03% | ||||||||||||||||||||||||||||
| Capital Group Central Cash Fund 4.31%7 | $ | — | $ | 28,822 | $ | 28,803 | $ | 1 | $ | — | 10 | $ | 20 | $ | 28 | |||||||||||||
| 1 | Acquired in a transaction exempt from registration under Rule 144A or, for commercial paper, Section 4(a)(2) of the Securities Act of 1933. May be resold in the U.S. in transactions exempt from registration, normally to qualified institutional buyers. The total value of all such securities was $33,059,000, which represented 46.68% of the net assets of the fund. |
| 2 | Step bond; coupon rate may change at a later date. |
| 3 | Loan participations and assignments; may be subject to legal or contractual restrictions on resale. The total value of all such loans was $338,000, which represented 0.47% of the net assets of the fund. |
| 4 | Coupon rate may change periodically. Reference rate and spread are as of the most recent information available. Some coupon rates are determined by the issuer or agent based on current market conditions; therefore, the reference rate and spread are not available. |
| 5 | Principal payments may be made periodically. Therefore, the effective maturity date may be earlier than the stated maturity date. |
| 6 | Value determined using significant unobservable inputs. |
| 7 | Rate represents the seven-day yield at December 31, 2022. |
| 8 | Part of the same “group of investment companies” as the fund as defined under the Investment Company Act of 1940, as amended. |
| 9 | Commencement of operations. |
| 10 | Amount less than one thousand. |
Key to abbreviations
CDI = CREST Depository Interest
CLO = Collateralized Loan Obligations
CME = CME Group
DAC = Designated Activity Company
EUR = Euros
EURIBOR = Euro Interbank Offered Rate
LIBOR = London Interbank Offered Rate
SOFR = Secured Overnight Financing Rate
USD = U.S. dollars
Refer to the notes to financial statements.
| 36 | Capital Group Fixed Income ETF Trust |
Capital Group Short Duration Income ETF
Investment portfolio December 31, 2022
| Portfolio by type of security | Percent of net assets |
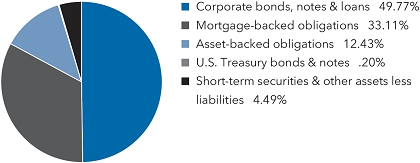
| Portfolio quality summary* | Percent of net assets | |||
| U.S. Treasury and agency† | .20 | % | ||
| AAA/Aaa | 39.73 | |||
| AA/Aa | 13.73 | |||
| A/A | 20.71 | |||
| BBB/Baa | 21.14 | |||
| Short-term securities & other assets less liabilities | 4.49 | |||
| * | Bond ratings, which typically range from AAA/Aaa (highest) to D (lowest), are assigned by credit rating agencies such as Standard & Poor’s, Moody’s and/or Fitch as an indication of an issuer’s creditworthiness. In assigning a credit rating to a security, the fund looks specifically to the ratings assigned to the issuer of the security by Standard & Poor’s, Moody’s and/or Fitch. If agency ratings differ, the security will be considered to have received the highest of those ratings, consistent with the fund’s investment policies. The ratings are not covered by the Report of Independent Registered Public Accounting Firm. |
| † | These securities are guaranteed by the full faith and credit of the U.S. government. |
| Bonds, notes & other debt instruments 95.51% | Principal amount (000) | Value (000) | ||||||
| Corporate bonds, notes & loans 49.77% | ||||||||
| Financials 15.01% | ||||||||
| ACE INA Holdings Inc. 3.35% 5/15/2024 | USD | 50 | $ | 49 | ||||
| AerCap Ireland Capital DAC 1.75% 10/29/2024 | 395 | 363 | ||||||
| Allstate Corp. 0.75% 12/15/2025 | 195 | 173 | ||||||
| American Express Co. 3.375% 5/3/2024 | 150 | 147 | ||||||
| American Express Co. 2.50% 7/30/2024 | 100 | 96 | ||||||
| American Express Co. 2.25% 3/4/2025 | 60 | 57 | ||||||
| American International Group, Inc. 2.50% 6/30/2025 | 290 | 273 | ||||||
| Aon Global, Ltd. 3.875% 12/15/2025 | 99 | 97 | ||||||
| Australia & New Zealand Banking Group, Ltd. 5.088% 12/8/2025 | 415 | 417 | ||||||
| Bank of America Corp. 1.319% 10/24/2024 (USD-SOFR + 0.74% on 10/24/2023)1 | 540 | 518 | ||||||
| Bank of America Corp. 0.976% 4/22/2025 (USD-SOFR + 0.69% on 4/22/2024)1 | 107 | 100 | ||||||
| Bank of America Corp. 0.981% 9/25/2025 (USD-SOFR + 0.91% on 9/25/2024)1 | 420 | 387 | ||||||
| Bank of America Corp. 4.948% 7/22/2028 (USD-SOFR + 2.04% on 7/22/2027)1 | 150 | 147 | ||||||
| Bank of New York Mellon Corp., 4.414% 7/24/2026 (USD-SOFR + 1.345% on 7/24/2025)1 | 100 | 99 | ||||||
| Berkshire Hathaway, Inc. 3.125% 3/15/2026 | 50 | 48 | ||||||
| BNP Paribas 3.375% 1/9/20252 | 200 | 193 | ||||||
| Capital One Financial Corp. 3.75% 4/24/2024 | 5 | 5 | ||||||
| Capital One Financial Corp. 3.20% 2/5/2025 | 65 | 62 | ||||||
| Capital One Financial Corp. 4.25% 4/30/2025 | 125 | 123 | ||||||
| Charles Schwab Corp. 0.90% 3/11/2026 | 35 | 31 | ||||||
| Citigroup, Inc. 3.30% 4/27/2025 | 50 | 48 | ||||||
| Citigroup, Inc. 0.981% 5/1/2025 (USD-SOFR + 0.669% on 5/1/2024)1 | 1,020 | 956 | ||||||
| Corebridge Financial, Inc. 3.50% 4/4/20252 | 320 | 307 | ||||||
| Credit Suisse AG (New York Branch) 0.495% 2/2/2024 | 315 | 291 | ||||||
| Deutsche Bank AG 2.222% 9/18/2024 (USD-SOFR + 2.159% on 9/18/2023)1 | 150 | 145 | ||||||
| Goldman Sachs Group, Inc. 5.70% 11/1/2024 | 70 | 71 | ||||||
| Goldman Sachs Group, Inc. 3.50% 4/1/2025 | 405 | 390 | ||||||
| Groupe BPCE SA 1.625% 1/14/20252 | 250 | 233 | ||||||
| Intercontinental Exchange, Inc. 3.65% 5/23/2025 | 115 | 112 | ||||||
| Intercontinental Exchange, Inc. 4.00% 9/15/2027 | 125 | 121 | ||||||
| JPMorgan Chase & Co. 0.653% 9/16/2024 (3-month USD CME Term SOFR + 0.60% on 9/16/2023)1 | 965 | 931 | ||||||
| Capital Group Fixed Income ETF Trust | 37 |
Capital Group Short Duration Income ETF (continued)
| Bonds, notes & other debt instruments (continued) | Principal amount (000) | Value (000) | ||||||
| Corporate bonds, notes & loans (continued) | ||||||||
| Financials (continued) | ||||||||
| JPMorgan Chase & Co. 0.824% 6/1/2025 (USD-SOFR + 0.54% on 6/1/2024)1 | USD | 375 | $ | 350 | ||||
| JPMorgan Chase & Co. 1.561% 12/10/2025 (USD-SOFR + 0.605% on 12/10/2024)1 | 250 | 232 | ||||||
| JPMorgan Chase & Co. 5.546% 12/15/2025 (USD-SOFR + 1.07% on 12/15/2024)1 | 200 | 200 | ||||||
| Lloyds Banking Group PLC 3.87% 7/9/2025 (1-year UST Yield Curve Rate T Note Constant Maturity + 3.50% on 7/9/2024)1 | 200 | 194 | ||||||
| Marsh & McLennan Companies, Inc. 3.875% 3/15/2024 | 590 | 582 | ||||||
| Metropolitan Life Global Funding I 3.60% 1/11/20242 | 240 | 236 | ||||||
| Morgan Stanley 0.79% 5/30/2025 (USD-SOFR + 0.525% on 5/30/2024)1 | 800 | 744 | ||||||
| Morgan Stanley 1.164% 10/21/2025 (USD-SOFR + 0.56% on 10/21/2024)1 | 365 | 336 | ||||||
| Morgan Stanley, Series F, 3.875% 4/29/2024 | 75 | 74 | ||||||
| New York Life Global Funding 0.95% 6/24/20252 | 265 | 240 | ||||||
| PNC Financial Services Group, Inc. 5.671% 10/28/2025 (USD-SOFR + 1.09% on 10/28/2024)1 | 230 | 233 | ||||||
| PRICOA Global Funding I 1.15% 12/6/20242 | 458 | 424 | ||||||
| Royal Bank of Canada 5.66% 10/25/2024 | 310 | 314 | ||||||
| State Street Corp. 5.82% 11/4/2028 (USD-SOFR + 1.715% on 11/4/2027)1 | 7 | 7 | ||||||
| Toronto-Dominion Bank 0.55% 3/4/2024 | 250 | 237 | ||||||
| Toronto-Dominion Bank 0.75% 9/11/2025 | 225 | 201 | ||||||
| U.S. Bancorp 1.45% 5/12/2025 | 588 | 546 | ||||||
| Wells Fargo & Company 0.805% 5/19/2025 (USD-SOFR + 0.51% on 5/19/2024)1 | 400 | 375 | ||||||
| Wells Fargo & Company 2.406% 10/30/2025 (3-month USD-LIBOR + 0.825% on 10/30/2024)1 | 200 | 189 | ||||||
| Wells Fargo & Company 4.808% 7/25/2028 (USD-SOFR + 1.98% on 7/25/2027)1 | 150 | 147 | ||||||
| Westpac Banking Corp. 3.735% 8/26/2025 | 125 | 122 | ||||||
| Willis North America, Inc. 3.60% 5/15/2024 | 464 | 452 | ||||||
| 13,425 | ||||||||
| Health care 5.51% | ||||||||
| AbbVie, Inc. 2.60% 11/21/2024 | 820 | 785 | ||||||
| AmerisourceBergen Corp. 3.25% 3/1/2025 | 210 | 202 | ||||||
| Amgen, Inc. 3.625% 5/22/2024 | 65 | 64 | ||||||
| Amgen, Inc. 1.90% 2/21/2025 | 340 | 319 | ||||||
| Anthem, Inc. 2.375% 1/15/2025 | 85 | 81 | ||||||
| AstraZeneca Finance, LLC 0.70% 5/28/2024 | 70 | 66 | ||||||
| Baxter International, Inc. 1.322% 11/29/2024 | 135 | 126 | ||||||
| Becton, Dickinson and Company 3.363% 6/6/2024 | 105 | 103 | ||||||
| Becton, Dickinson and Company 3.734% 12/15/2024 | 60 | 59 | ||||||
| Boston Scientific Corp. 3.45% 3/1/2024 | 40 | 39 | ||||||
| Boston Scientific Corp. 1.90% 6/1/2025 | 85 | 79 | ||||||
| Bristol-Myers Squibb Company 2.90% 7/26/2024 | 25 | 24 | ||||||
| CVS Health Corp. 2.625% 8/15/2024 | 325 | 312 | ||||||
| DH Europe Finance II SARL 2.20% 11/15/2024 | 30 | 29 | ||||||
| Elevance Health, Inc. 3.35% 12/1/2024 | 145 | 141 | ||||||
| Eli Lilly and Company 2.75% 6/1/2025 | 205 | 196 | ||||||
| GE Healthcare Holding, LLC 5.55% 11/15/20242 | 100 | 100 | ||||||
| Gilead Sciences, Inc. 3.70% 4/1/2024 | 160 | 157 | ||||||
| HCA, Inc. 5.375% 2/1/2025 | 535 | 535 | ||||||
| Humana, Inc. 3.85% 10/1/2024 | 340 | 333 | ||||||
| Johnson & Johnson 0.55% 9/1/2025 | 180 | 163 | ||||||
| Laboratory Corporation of America Holdings 3.60% 2/1/2025 | 270 | 262 | ||||||
| Merck & Co., Inc. 2.75% 2/10/2025 | 125 | 120 | ||||||
| Novartis Capital Corp. 3.40% 5/6/2024 | 55 | 54 | ||||||
| Roche Holdings, Inc. 2.314% 3/10/20272 | 200 | 182 | ||||||
| Thermo Fisher Scientific, Inc. 1.215% 10/18/2024 | 185 | 174 | ||||||
| UnitedHealth Group, Inc. 5.15% 10/15/2025 | 125 | 127 | ||||||
| UnitedHealth Group, Inc. 5.25% 2/15/2028 | 75 | 77 | ||||||
| Zoetis, Inc. 5.40% 11/14/2025 | 25 | 25 | ||||||
| 4,934 | ||||||||
| 38 | Capital Group Fixed Income ETF Trust |
Capital Group Short Duration Income ETF (continued)
| Bonds, notes & other debt instruments (continued) | Principal amount (000) | Value (000) | ||||||
| Corporate bonds, notes & loans (continued) | ||||||||
| Communication services 4.83% | ||||||||
| AT&T, Inc. 0.90% 3/25/2024 | USD | 780 | $ | 741 | ||||
| CCO Holdings, LLC and CCO Holdings Capital Corp. 4.50% 2/1/2024 | 220 | 217 | ||||||
| Charter Communications Operating, LLC 4.908% 7/23/2025 | 435 | 427 | ||||||
| Comcast Corp. 3.70% 4/15/2024 | 250 | 246 | ||||||
| Comcast Corp. 3.375% 2/15/2025 | 280 | 272 | ||||||
| Comcast Corp. 5.25% 11/7/2025 | 150 | 152 | ||||||
| Netflix, Inc. 5.875% 2/15/2025 | 500 | 507 | ||||||
| T-Mobile US, Inc. 3.50% 4/15/2025 | 675 | 650 | ||||||
| Verizon Communications Inc. 3.50% 11/1/2024 | 195 | 190 | ||||||
| Verizon Communications, Inc. 0.75% 3/22/2024 | 220 | 209 | ||||||
| Verizon Communications, Inc. 3.376% 2/15/2025 | 65 | 63 | ||||||
| WarnerMedia Holdings, Inc. 3.528% 3/15/20242 | 495 | 480 | ||||||
| WarnerMedia Holdings, Inc. 3.788% 3/15/20252 | 175 | 167 | ||||||
| 4,321 | ||||||||
| Utilities 4.81% | ||||||||
| Alabama Power Co. 3.55% 12/1/2023 | 65 | 64 | ||||||
| CenterPoint Energy, Inc. 2.40% 9/1/2026 | 65 | 60 | ||||||
| DTE Electric Co. 3.65% 3/15/2024 | 470 | 462 | ||||||
| Duke Energy Corp. 5.00% 12/8/2025 | 125 | 125 | ||||||
| Edison International 4.70% 8/15/2025 | 320 | 313 | ||||||
| Entergy Louisiana, LLC 0.95% 10/1/2024 | 645 | 601 | ||||||
| Florida Power & Light Company 3.25% 6/1/2024 | 125 | 122 | ||||||
| Florida Power & Light Company 3.125% 12/1/2025 | 155 | 150 | ||||||
| Jersey Central Power & Light Co. 4.70% 4/1/20242 | 310 | 306 | ||||||
| Jersey Central Power & Light Co. 4.30% 1/15/20262 | 190 | 184 | ||||||
| NiSource, Inc. 0.95% 8/15/2025 | 130 | 117 | ||||||
| Oncor Electric Delivery Company, LLC 2.75% 6/1/2024 | 440 | 426 | ||||||
| Pacific Gas and Electric Co. 3.75% 2/15/2024 | 220 | 216 | ||||||
| Pacific Gas and Electric Co. 3.45% 7/1/2025 | 335 | 317 | ||||||
| Public Service Electric and Gas Co. 3.25% 9/1/2023 | 95 | 94 | ||||||
| Public Service Electric and Gas Co. 3.00% 5/15/2025 | 140 | 134 | ||||||
| Southern California Edison Co. 4.20% 6/1/2025 | 255 | 251 | ||||||
| Southern California Edison Co. 5.85% 11/1/2027 | 35 | 36 | ||||||
| Southwestern Public Service Co. 3.30% 6/15/2024 | 130 | 127 | ||||||
| Virginia Electric and Power Co. 3.10% 5/15/2025 | 210 | 202 | ||||||
| 4,307 | ||||||||
| Consumer staples 3.97% | ||||||||
| 7-Eleven, Inc. 0.80% 2/10/20242 | 395 | 376 | ||||||
| Altria Group, Inc. 2.35% 5/6/2025 | 45 | 42 | ||||||
| British American Tobacco PLC 3.222% 8/15/2024 | 135 | 130 | ||||||
| Conagra Brands, Inc. 4.30% 5/1/2024 | 635 | 627 | ||||||
| Constellation Brands, Inc. 4.35% 5/9/2027 | 150 | 146 | ||||||
| General Mills, Inc. 5.241% 11/18/2025 | 60 | 60 | ||||||
| Mondelez International, Inc. 1.50% 5/4/2025 | 255 | 236 | ||||||
| Nestle Holdings, Inc. 4.00% 9/12/20252 | 205 | 202 | ||||||
| PepsiCo, Inc. 2.75% 4/30/2025 | 265 | 254 | ||||||
| Philip Morris International, Inc. 2.875% 5/1/2024 | 40 | 39 | ||||||
| Philip Morris International, Inc. 5.125% 11/15/2024 | 225 | 226 | ||||||
| Philip Morris International, Inc. 1.50% 5/1/2025 | 160 | 148 | ||||||
| Philip Morris International, Inc. 5.00% 11/17/2025 | 245 | 246 | ||||||
| Philip Morris International, Inc. 5.125% 11/17/2027 | 88 | 89 | ||||||
| Procter & Gamble Company 0.55% 10/29/2025 | 340 | 305 | ||||||
| Reynolds American, Inc. 4.45% 6/12/2025 | 400 | 392 | ||||||
| Wal-Mart Stores, Inc. 3.90% 9/9/2025 | 30 | 30 | ||||||
| 3,548 | ||||||||
| Capital Group Fixed Income ETF Trust | 39 |
Capital Group Short Duration Income ETF (continued)
| Bonds, notes & other debt instruments (continued) | Principal amount (000) | Value (000) | ||||||
| Corporate bonds, notes & loans (continued) | ||||||||
| Industrials 3.87% | ||||||||
| Boeing Company 2.80% 3/1/2024 | USD | 125 | $ | 121 | ||||
| Boeing Company 4.875% 5/1/2025 | 565 | 561 | ||||||
| Boeing Company 2.196% 2/4/2026 | 125 | 114 | ||||||
| Burlington Northern Santa Fe, LLC 3.40% 9/1/2024 | 125 | 122 | ||||||
| Canadian Pacific Railway, Ltd. 1.35% 12/2/2024 | 405 | 378 | ||||||
| Carrier Global Corp. 2.242% 2/15/2025 | 270 | 255 | ||||||
| CSX Corp. 3.40% 8/1/2024 | 300 | 293 | ||||||
| Eaton Corp. 6.50% 6/1/2025 | 65 | 67 | ||||||
| General Dynamics Corp. 3.25% 4/1/2025 | 95 | 92 | ||||||
| Honeywell International, Inc. 1.35% 6/1/2025 | 280 | 259 | ||||||
| Lockheed Martin Corp. 4.95% 10/15/2025 | 205 | 207 | ||||||
| Norfolk Southern Corp. 3.85% 1/15/2024 | 50 | 49 | ||||||
| Northrop Grumman Corp. 2.93% 1/15/2025 | 325 | 312 | ||||||
| Union Pacific Corp. 3.646% 2/15/2024 | 95 | 94 | ||||||
| Union Pacific Corp. 3.25% 1/15/2025 | 135 | 131 | ||||||
| United Technologies Corp. 3.95% 8/16/2025 | 415 | 406 | ||||||
| 3,461 | ||||||||
| Information technology 3.23% | ||||||||
| Adobe, Inc. 1.90% 2/1/2025 | 65 | 61 | ||||||
| Analog Devices, Inc. 2.95% 4/1/2025 | 160 | 154 | ||||||
| Apple, Inc. 2.50% 2/9/2025 | 125 | 120 | ||||||
| Apple, Inc. 0.55% 8/20/2025 | 415 | 375 | ||||||
| Broadcom Corp. 3.625% 1/15/2024 | 155 | 152 | ||||||
| Broadcom Corp. 3.125% 1/15/2025 | 165 | 159 | ||||||
| Broadcom, Inc. 3.625% 10/15/2024 | 202 | 197 | ||||||
| Broadcom, Inc. 3.15% 11/15/2025 | 180 | 171 | ||||||
| Global Payments, Inc. 1.50% 11/15/2024 | 65 | 60 | ||||||
| Global Payments, Inc. 2.65% 2/15/2025 | 265 | 250 | ||||||
| Mastercard, Inc. 3.375% 4/1/2024 | 100 | 98 | ||||||
| Microsoft Corp. 2.875% 2/6/2024 | 45 | 44 | ||||||
| Microsoft Corp. 2.70% 2/12/2025 | 360 | 346 | ||||||
| Oracle Corp. 2.40% 9/15/2023 | 125 | 123 | ||||||
| Oracle Corp. 3.40% 7/8/2024 | 115 | 112 | ||||||
| Oracle Corp. 2.50% 4/1/2025 | 385 | 363 | ||||||
| salesforce.com, inc. 0.625% 7/15/2024 | 5 | 5 | ||||||
| Visa, Inc. 3.15% 12/14/2025 | 105 | 101 | ||||||
| 2,891 | ||||||||
| Energy 2.88% | ||||||||
| Baker Hughes Holdings, LLC 1.231% 12/15/2023 | 50 | 48 | ||||||
| BP Capital Markets America, Inc. 3.796% 9/21/2025 | 55 | 54 | ||||||
| Canadian Natural Resources, Ltd. 3.80% 4/15/2024 | 270 | 265 | ||||||
| Canadian Natural Resources, Ltd. 2.05% 7/15/2025 | 50 | 47 | ||||||
| Chevron Corp. 2.895% 3/3/2024 | 45 | 44 | ||||||
| Chevron USA, Inc. 0.687% 8/12/2025 | 345 | 312 | ||||||
| ConocoPhillips Co. 2.125% 3/8/2024 | 200 | 193 | ||||||
| Continental Resources, Inc. 3.80% 6/1/2024 | 70 | 68 | ||||||
| Energy Transfer Operating, LP 5.875% 1/15/2024 | 125 | 125 | ||||||
| Energy Transfer, LP 3.90% 5/15/2024 | 325 | 317 | ||||||
| EQT Corp. 6.125% 2/1/20251 | 75 | 75 | ||||||
| Exxon Mobil Corp. 2.0019% 8/16/2024 | 130 | 125 | ||||||
| Exxon Mobil Corp. 2.992% 3/19/2025 | 330 | 318 | ||||||
| MPLX LP 4.875% 12/1/2024 | 185 | 184 | ||||||
| ONEOK, Inc. 2.75% 9/1/2024 | 65 | 62 | ||||||
| Shell International Finance BV 3.25% 5/11/2025 | 230 | 223 | ||||||
| Total Capital International 3.75% 4/10/2024 | 45 | 44 | ||||||
| Total Capital International 2.434% 1/10/2025 | 75 | 72 | ||||||
| 2,576 | ||||||||
| 40 | Capital Group Fixed Income ETF Trust |
Capital Group Short Duration Income ETF (continued)
| Bonds, notes & other debt instruments (continued) | Principal amount (000) | Value (000) | ||||||
| Corporate bonds, notes & loans (continued) | ||||||||
| Consumer discretionary 2.84% | ||||||||
| Amazon.com, Inc. 0.80% 6/3/2025 | USD | 210 | $ | 192 | ||||
| Amazon.com, Inc. 4.60% 12/1/2025 | 50 | 50 | ||||||
| Bayerische Motoren Werke AG 3.80% 4/6/20232 | 65 | 65 | ||||||
| Bayerische Motoren Werke AG 3.90% 4/9/20252 | 205 | 201 | ||||||
| General Motors Financial Co. 1.20% 10/15/2024 | 500 | 463 | ||||||
| General Motors Financial Co. 2.75% 6/20/2025 | 5 | 4 | ||||||
| Home Depot, Inc. 3.75% 2/15/2024 | 125 | 124 | ||||||
| Home Depot, Inc. 2.70% 4/15/2025 | 45 | 43 | ||||||
| Home Depot, Inc. 4.00% 9/15/2025 | 60 | 59 | ||||||
| Hyundai Capital America 1.80% 10/15/20252 | 65 | 58 | ||||||
| Lowe’s Companies, Inc. 4.40% 9/8/2025 | 80 | 79 | ||||||
| Marriott International, Inc. 3.60% 4/15/2024 | 270 | 265 | ||||||
| Marriott International, Inc. 5.75% 5/1/2025 | 195 | 197 | ||||||
| McDonald’s Corp. 3.50% 7/1/2027 | 100 | 95 | ||||||
| Mercedes-Benz Finance North America, LLC 5.50% 11/27/20242 | 150 | 151 | ||||||
| Toyota Motor Credit Corp. 0.50% 6/18/2024 | 525 | 493 | ||||||
| 2,539 | ||||||||
| Real estate 1.85% | ||||||||
| American Tower Corp. 5.00% 2/15/2024 | 305 | 304 | ||||||
| Corporate Office Properties, LP 2.25% 3/15/2026 | 65 | 57 | ||||||
| Equinix, Inc. 2.625% 11/18/2024 | 185 | 176 | ||||||
| Equinix, Inc. 1.00% 9/15/2025 | 374 | 335 | ||||||
| Public Storage 0.875% 2/15/2026 | 90 | 80 | ||||||
| Scentre Group 3.50% 2/12/20252 | 315 | 302 | ||||||
| Sun Communities Operating, LP 2.30% 11/1/2028 | 25 | 21 | ||||||
| VICI Properties, LP 4.625% 6/15/20252 | 395 | 379 | ||||||
| 1,654 | ||||||||
| Materials 0.97% | ||||||||
| Anglo American Capital PLC 3.625% 9/11/20242 | 205 | 198 | ||||||
| Dow Chemical Co. 4.55% 11/30/2025 | 65 | 65 | ||||||
| Glencore Funding, LLC 1.625% 4/27/20262 | 65 | 57 | ||||||
| International Flavors & Fragrances, Inc. 1.23% 10/1/20252 | 285 | 252 | ||||||
| Linde, Inc. 4.70% 12/5/2025 | 40 | 40 | ||||||
| LYB International Finance III, LLC 1.25% 10/1/2025 | 85 | 76 | ||||||
| Nutrien, Ltd. 5.95% 11/7/2025 | 29 | 30 | ||||||
| Sherwin-Williams Company 4.05% 8/8/2024 | 155 | 153 | ||||||
| 871 | ||||||||
| Total corporate bonds, notes & loans | 44,527 | |||||||
| Mortgage-backed obligations 33.11% | ||||||||
| Federal agency mortgage-backed obligations 14.52% | ||||||||
| Uniform Mortgage-Backed Security 5.00% 3/1/20533,4 | 6,500 | 6,401 | ||||||
| Uniform Mortgage-Backed Security 6.00% 3/1/20533,4 | 6,500 | 6,585 | ||||||
| 12,986 | ||||||||
| Commercial mortgage-backed securities 13.46% | ||||||||
| BX Commercial Mortgage Trust 2019-XL, Class A, (1-month USD-LIBOR + 0.92%) 5.370% 10/15/20362,3 | 151 | 149 | ||||||
| BX Trust, Series 2021-VOLT, Class B, (1-month USD-LIBOR + 0.95%) 5.268% 9/15/20362,3 | 189 | 179 | ||||||
| BX Trust, Series 2022-PSB, Class A, (1-month USD CME Term SOFR + 2.451%) 6.787% 8/15/20392,3 | 198 | 197 | ||||||
| BX Trust, Series 2022-PSB, Class C, (1-month USD CME Term SOFR + 3.697%) 8.033% 8/15/20392,3 | 198 | 197 | ||||||
| Citigroup Commercial Mortgage Trust, Series 2013-CG15, Class A4, 4.371% 9/10/20463 | 830 | 822 | ||||||
| Citigroup Commercial Mortgage Trust, Series 2014-GC25, Class A4, 3.635% 10/10/20473 | 325 | 313 | ||||||
| Citigroup Commercial Mortgage Trust, Series 2016-GC37, Class A4, 3.314% 4/10/20493 | 270 | 252 | ||||||
| Commercial Mortgage Trust, Series 2014-CR20, Class A4, 3.59% 11/10/20473 | 500 | 482 | ||||||
| Commercial Mortgage Trust, Series 2015-PC1, Class A5, 3.902% 7/10/20503 | 445 | 427 | ||||||
| Capital Group Fixed Income ETF Trust | 41 |
Capital Group Short Duration Income ETF (continued)
| Bonds, notes & other debt instruments (continued) | Principal amount (000) | Value (000) | ||||||
| Mortgage-backed obligations (continued) | ||||||||
| Commercial mortgage-backed securities (continued) | ||||||||
| GS Mortgage Securities Trust, Series 2018-HULA, Class A, 5.238% 7/15/20252,3 | USD | 457 | $ | 446 | ||||
| GS Mortgage Securities Trust, Series 2014-GC24, Class A5, 3.931% 9/10/20473 | 808 | 781 | ||||||
| ILPT Commercial Mortgage Trust, Series 2022-LPF2, Class A, (1-month USD CME Term SOFR + 2.245%) 6.581% 10/15/20392,3 | 200 | 200 | ||||||
| INTOWN Mortgage Trust, Series 2022-STAY, Class A, (1-month USD CME Term SOFR + 2.489%) 6.283% 8/15/20393 | 200 | 199 | ||||||
| JPMorgan Chase Commercial Mortgage Securities Trust, Series 2013-C16, Class A4, 4.166% 12/15/20463 | 395 | 389 | ||||||
| LUXE Commercial Mortgage Trust, Series 21-TRIP, Class C, (1-month USD-LIBOR + 1.75%) 6.068% 10/15/20382,3 | 250 | 233 | ||||||
| Morgan Stanley Bank of America Merrill Lynch Trust, Series 2013-C11, Class A4, 4.198% 8/15/20463 | 200 | 197 | ||||||
| Morgan Stanley Bank of America Merrill Lynch Trust, Series 2013-C13, Class A-4, 4.039% 11/15/20463 | 200 | 196 | ||||||
| Morgan Stanley Bank of America Merrill Lynch Trust, Series 2014-C17, Class A5, 3.741% 8/15/20473 | 880 | 853 | ||||||
| Morgan Stanley Bank of America Merrill Lynch Trust, Series 2014-C18, Class AS, 4.110% 10/15/20473 | 592 | 565 | ||||||
| Morgan Stanley Bank of America Merrill Lynch Trust, Series 2015-C21, Class A4, 3.338% 3/15/20483 | 200 | 190 | ||||||
| Morgan Stanley Bank of America Merrill Lynch Trust, Series 2015-C25, Class A-4, 3.372% 10/15/20483 | 305 | 289 | ||||||
| Morgan Stanley Capital I Trust, Series 2015-UBS8, Class AS, 4.114% 12/15/20483 | 550 | 505 | ||||||
| Wells Fargo Commercial Mortgage Trust, Series 2015-C27, Class A5, 3.451% 2/15/20483 | 755 | 719 | ||||||
| Wells Fargo Commercial Mortgage Trust, Series 2014-LC16, Class A5, 3.817% 8/15/20503 | 500 | 486 | ||||||
| Wells Fargo Commercial Mortgage Trust, Series 2015-NXS-2, Class A-5, 3.767% 7/15/20583 | 715 | 681 | ||||||
| Wells Fargo Commercial Mortgage Trust, Series 2016-C33, Class A4, 3.426% 3/15/20593 | 541 | 508 | ||||||
| WF-RBS Commercial Mortgage Trust, Series 2014-C19, Class A5, 4.101% 3/15/20473 | 520 | 509 | ||||||
| WF-RBS Commercial Mortgage Trust, Series 2014-C19, Class B, 4.723% 3/15/20473 | 615 | 588 | ||||||
| WF-RBS Commercial Mortgage Trust, Series 2014-C22, Class A4, 3.488% 9/15/20573 | 297 | 287 | ||||||
| WMRK Commercial Mortgage Trust, Series 2022-WMRK, Class A, (1-month USD CME Term SOFR + 2.789%) 7.125% 11/15/20272,3 | 206 | 206 | ||||||
| 12,045 | ||||||||
| Collateralized mortgage-backed obligations (privately originated) 5.13% | ||||||||
| BRAVO Residential Funding Trust, Series 2020-RPL1, Class A1, 2.50% 5/26/20592,3 | 122 | 115 | ||||||
| CIM Trust, Series 2018-R3, Class A1, 5.00% 12/25/20572,3 | 120 | 117 | ||||||
| Connecticut Avenue Securities, Series 2014-C04, Class 1M2, (1-month USD-LIBOR + 4.90%) 9.289% 11/25/20243 | 197 | 202 | ||||||
| Connecticut Avenue Securities, Series 2016-C02, Class 1M2, (1-month USD-LIBOR + 6.00%) 10.389% 9/25/20283 | 185 | 192 | ||||||
| Freddie Mac Structured Agency Credit Risk Debt Notes, Series 2015-DNA1, Class M3, (1-month USD-LIBOR + 3.30%) 7.689% 10/25/20273 | 113 | 114 | ||||||
| Freddie Mac Structured Agency Credit Risk Debt Notes, Series 2015-DNA3, Class M3, (1-month USD-LIBOR + 4.70%) 9.089% 4/25/20283 | 96 | 100 | ||||||
| Freddie Mac Structured Agency Credit Risk Debt Notes, Series 2016-DNA1, Class M3, (1-month USD-LIBOR + 5.55%) 9.939% 7/25/20283 | 278 | 291 | ||||||
| Freddie Mac Structured Agency Credit Risk Debt Notes, Series 2016-DNA3, Class M3, (1-month USD-LIBOR + 5.00%) 9.389% 12/25/20283 | 212 | 219 | ||||||
| Freddie Mac Structured Agency Credit Risk Debt Notes, Series 2022-DNA4, Class M1A, (30-day Average USD-SOFR + 2.20%) 6.128% 5/25/20422,3 | 246 | 245 | ||||||
| Freddie Mac Structured Agency Credit Risk Debt Notes, Series 2022-DNA5, Class M1A, (30-day Average USD-SOFR + 2.95%) 6.878% 6/25/20422,3 | 62 | 63 | ||||||
| Freddie Mac Structured Agency Credit Risk Debt Notes, Series 2020-DNA2, Class M2, (1-month USD-LIBOR + 1.85%) 6.239% 2/25/20502,3 | 245 | 245 | ||||||
| Imperial Fund, LLC, Series 2022-NQM7, Class A1, 7.369% 11/25/2067 (8.369% on 11/25/2026)1,2,3 | 349 | 359 | ||||||
| Mill City Mortgage Trust, Series 2019-GS2, Class A1, 2.750% 8/25/20592,3 | 441 | 414 | ||||||
| 42 | Capital Group Fixed Income ETF Trust |
Capital Group Short Duration Income ETF (continued)
| Bonds, notes & other debt instruments (continued) | Principal amount (000) | Value (000) | ||||||
| Mortgage-backed obligations (continued) | ||||||||
| Collateralized mortgage-backed obligations (privately originated) (continued) | ||||||||
| Mill City Mortgage Trust, Series 2019-1, Class A1, 3.250% 10/25/20692,3 | USD | 194 | $ | 184 | ||||
| New Residential Mortgage Loan Trust, Series 2019-RPL3, Class A1, 2.750% 7/25/20592,3 | 51 | 48 | ||||||
| NewRez Warehouse Securitization Trust, Series 2021-1, Class B, (1-month USD-LIBOR + 0.90%) 5.289% 5/25/20552,3 | 500 | 491 | ||||||
| Towd Point Mortgage Trust, Series 2017-1, Class A1, 2.750% 10/25/20562,3 | 145 | 143 | ||||||
| Towd Point Mortgage Trust, Series 2017-2, Class A4, 3.316% 4/25/20572,3 | 341 | 328 | ||||||
| Towd Point Mortgage Trust, Series 2017-3, Class A1, 2.750% 7/25/20572,3 | 507 | 495 | ||||||
| Towd Point Mortgage Trust, Series 2017-6, Class A1, 2.750% 10/25/20572,3 | 231 | 221 | ||||||
| 4,586 | ||||||||
| Total mortgage-backed obligations | 29,617 | |||||||
| Asset-backed obligations 12.43% | ||||||||
| Aesop Funding, LLC, Series 2020-2, Class A, 2.02% 2/20/20272,3 | 350 | 318 | ||||||
| American Credit Acceptance Receivables Trust, Series 2022-4, Class A, 6.20% 5/13/20262,3 | 154 | 154 | ||||||
| American Express Credit Account Master Trust, Series 2022-4, Class A, 4.95% 10/15/20273 | 171 | 172 | ||||||
| Avis Budget Rental Car Funding AESOP, LLC, Series 2022-5, Class A, 6.12% 4/20/20272,3 | 118 | 118 | ||||||
| BA Credit Card Trust, Series 2022-A2, Class A2, 5.00% 4/17/20283 | 238 | 241 | ||||||
| Capital One Multi-Asset Execution Trust, Series 2022-A3, Class A, 4.95% 10/15/20273 | 181 | 183 | ||||||
| CarMaxAuto Owner Trust, Series 2022-4, Class A2A, 5.34% 12/15/20253 | 145 | 145 | ||||||
| CF Hippolyta, LLC, Series 2020-1, Class A1, 1.69% 7/15/20602,3 | 454 | 406 | ||||||
| CPS Auto Receivables Trust, Series 2021-B, Class C, 1.23% 3/15/20272,3 | 520 | 505 | ||||||
| Discover Card Execution Note Trust, Series 2022-4, Class A, 5.03% 10/15/20273 | 176 | 178 | ||||||
| Drive Auto Receivables Trust, Series 2021-1, Class B, 0.65% 7/15/20253 | 10 | 10 | ||||||
| DriveTime Auto Owner Trust, Series 2020-3A, Class C, 1.47% 6/15/20262,3 | 400 | 387 | ||||||
| DriveTime Auto Owner Trust, Series 2021-2A, Class B, 0.81% 1/15/20272,3 | 200 | 196 | ||||||
| Dryden Senior Loan Fund, CLO, Series 2018-57, Class A, (3-month USD-LIBOR + 1.01%) 5.616% 5/15/20312,3 | 300 | 296 | ||||||
| Enterprise Fleet Financing, LLC, Series 2022-4, Class A2, 5.76% 10/22/20292,3 | 230 | 231 | ||||||
| Exeter Automobile Receivables Trust, Series 2022-6, Class A2, 5.73% 11/17/20253 | 44 | 44 | ||||||
| Exeter Automobile Receivables Trust, Series 2021-2, Class C, 0.98% 6/15/20263 | 561 | 539 | ||||||
| Exeter Automobile Receivables Trust, Series 2022-6, Class B, 6.03% 8/16/20273 | 77 | 77 | ||||||
| Exeter Automobile Receivables Trust, Series 2022-6, Class C, 6.32% 5/15/20283 | 193 | 193 | ||||||
| FirstKey Homes Trust, Series 2020-SFR2, Class D, 1.968% 10/19/20372,3 | 325 | 285 | ||||||
| Flagship Credit Auto Trust, Series 2022-4, Class A2, 6.15% 9/15/20262,3 | 196 | 197 | ||||||
| Global SC Finance VII SRL, Series 2020-2A, Class A, 2.26% 11/19/20402,3 | 226 | 201 | ||||||
| Global SC Finance VII SRL, Series 2021-2A, Class A, 1.95% 8/17/20412,3 | 257 | 223 | ||||||
| GM Financial Revolving Receivables Trust, Series 2022-1, Class A, 5.91% 10/11/20352,3 | 135 | 138 | ||||||
| Hertz Vehicle Financing III, LLC, Series 2021-1A, Class A, 1.21% 12/26/20252,3 | 200 | 185 | ||||||
| Hertz Vehicle Financing III, LLC, Series 2022-1A, Class A, 1.99% 6/25/20262,3 | 350 | 322 | ||||||
| Madison Park Funding, Ltd., CLO, Series 2021-50A, Class A, (3-month USD-LIBOR + 1.14%) 5.367% 4/19/20342,3 | 300 | 293 | ||||||
| Neuberger Berman CLO, Ltd., Series 2017-25, Class AR, (3-month USD-LIBOR + 0.93%) 5.124% 10/18/20292,3 | 500 | 494 | ||||||
| Palmer Square Loan Funding, CLO, Series 2021-3, Class A1, (3-month USD-LIBOR + 0.80%) 5.043% 7/20/20292,3 | 304 | 300 | ||||||
| Palmer Square, Ltd., Series 2013-2A, Class A1A3, (3-month USD-LIBOR + 1.00%) 5.079% 10/17/20312,3 | 250 | 246 | ||||||
| PPM CLO, Ltd., Series 2022-6, Class A, (3-month USD CME Term SOFR + 2.45%) 2.450% 1/20/20312,3 | 298 | 298 | ||||||
| RRAM, CLO, Series 2018-3, Class A1R2, (3-month USD-LIBOR + 1.09%) 5.169% 1/15/20302,3 | 300 | 297 | ||||||
| Santander Drive Auto Receivables Trust, Series 2021-2, Class C, 0.90% 6/15/20263 | 200 | 195 | ||||||
| Santander Drive Auto Receivables Trust, Series 2022-7, Class A3, 5.75% 4/15/20273 | 84 | 85 | ||||||
| Santander Drive Auto Receivables Trust, Series 2022-7, Class B, 5.95% 1/17/20283 | 33 | 33 | ||||||
| Santander Drive Auto Receivables Trust, Series 2022-1, Class C, 2.56% 4/17/20283 | 200 | 191 | ||||||
| Sound Point CLO, Ltd., Series 2013-3R, Class A, (3-month USD-LIBOR + 1.15%) 5.344% 4/18/20312,3 | 300 | 293 | ||||||
| Stratus Static CLO, Ltd., Series 2021-2, Class A, (3-month USD-LIBOR + 0.90%) 5.143% 12/28/20292,3 | 267 | 263 | ||||||
| Capital Group Fixed Income ETF Trust | 43 |
Capital Group Short Duration Income ETF (continued)
| Bonds, notes & other debt instruments (continued) | Principal amount (000) | Value (000) | ||||||
| Asset-backed obligations (continued) | ||||||||
| Stratus Static CLO, Ltd., Series 2022-3, Class A, (3-month USD CME Term SOFR + 2.15%) 6.678% 10/20/20312,3 | USD | 250 | $ | 250 | ||||
| TAL Advantage V, LLC, Series 2020-1A, Class A, 2.05% 9/20/20452,3 | 382 | 336 | ||||||
| Textainer Marine Containers, Ltd., Series 2021-2A, Class A, 2.23% 4/20/20462,3 | 282 | 240 | ||||||
| Toyota Auto Loan Extended Note Trust, Series 2019-1, Class A, 2.56% 11/25/20312,3 | 250 | 241 | ||||||
| Triton Container Finance VIII, LLC, Series 2020-1, Class A, 2.11% 9/20/20452,3 | 404 | 347 | ||||||
| Verizon Master Trust, Series 2022-7, Class A1A, 5.23% 11/22/2027 (5.98% on 11/20/2024)1,3 | 339 | 341 | ||||||
| Westlake Automobile Receivables Trust, Series 2022-3, Class C, 5.49% 7/15/20262,3 | 140 | 140 | ||||||
| Wind River CLO, Ltd., Series 2014-2, Class AR, (3-month USD-LIBOR + 1.14%) 5.219% 1/15/20312,3 | 300 | 294 | ||||||
| 11,121 | ||||||||
| U.S. Treasury bonds & notes 0.20% | ||||||||
| U.S. Treasury 0.20% | ||||||||
| U.S. Treasury 4.50% 11/30/20245 | 180 | 180 | ||||||
| Total bonds, notes & other debt instruments (cost: $85,254,000) | 85,445 | |||||||
| Short-term securities 14.70% | Shares | |||||||
| Money market investments 14.70% | ||||||||
| Capital Group Central Cash Fund 4.31%6,7 | 131,478 | 13,146 | ||||||
| Total short-term securities (cost: $13,147,000) | 13,146 | |||||||
| Total investment securities 110.21% (cost: $98,401,000) | 98,591 | |||||||
| Other assets less liabilities (10.21)% | (9,133 | ) | ||||||
| Net assets 100.00% | $ | 89,458 | ||||||
Swap contracts
Interest rate swaps
Centrally cleared interest rate swaps
| Unrealized | ||||||||||||||||||||||||||
| Upfront | (depreciation) | |||||||||||||||||||||||||
| Receive | Pay | Notional | Value at | premium | appreciation | |||||||||||||||||||||
| Payment | Payment | Expiration | amount | 12/31/2022 | paid | at 12/31/2022 | ||||||||||||||||||||
| Rate | frequency | Rate | frequency | date | (000) | (000) | (000) | (000) | ||||||||||||||||||
| 4.4365% | Annual | SOFR | Annual | 12/29/2024 | USD | 19,500 | $ | (11 | ) | $ | — | $ | (11 | ) | ||||||||||||
| SOFR | Annual | 4.4605% | Annual | 1/4/2025 | 4,500 | — | — | — | ||||||||||||||||||
| SOFR | Annual | 3.252 | Annual | 12/27/2032 | 4,200 | 73 | — | 73 | ||||||||||||||||||
| SOFR | Annual | 3.433 | Annual | 12/28/2032 | 530 | 5 | — | 5 | ||||||||||||||||||
| $ | 67 | $ | — | $ | 67 | |||||||||||||||||||||
Investments in affiliates7
| Value of affiliate at 10/25/20228 (000) | Additions (000) | Reductions (000) | Net realized gain (000) | Net unrealized depreciation (000) | Value of affiliate at 12/31/2022 (000) | Dividend income (000) | ||||||||||||||||||||||
| Short-term securities 14.70% | ||||||||||||||||||||||||||||
| Money market investments 14.70% | ||||||||||||||||||||||||||||
| Capital Group Central Cash Fund 4.31%6 | $ | — | $ | 40,979 | $ | 27,832 | $ | — | 9 | $ | (1 | ) | �� | $ | 13,146 | $ | 46 | |||||||||||
| 44 | Capital Group Fixed Income ETF Trust |
Capital Group Short Duration Income ETF (continued)
| 1 | Step bond; coupon rate may change at a later date. |
| 2 | Acquired in a transaction exempt from registration under Rule 144A or, for commercial paper, Section 4(a)(2) of the Securities Act of 1933. May be resold in the U.S. in transactions exempt from registration, normally to qualified institutional buyers. The total value of all such securities was $19,062,000, which represented 21.31% of the net assets of the fund. |
| 3 | Principal payments may be made periodically. Therefore, the effective maturity date may be earlier than the stated maturity date. |
| 4 | Purchased on a TBA basis. |
| 5 | All or a portion of this security was pledged as collateral. The total value of pledged collateral was $180,000, which represented .20% of the net assets of the fund. |
| 6 | Rate represents the seven-day yield at December 31, 2022. |
| 7 | Part of the same “group of investment companies” as the fund as defined under the Investment Company Act of 1940, as amended. |
| 8 | Commencement of operations. |
| 9 | Amount less than one thousand. |
Key to abbreviations
BA = Banker’s acceptances
CLO = Collateralized Loan Obligations
CME = CME Group
DAC = Designated Activity Company
LIBOR = London Interbank Offered Rate
SOFR = Secured Overnight Financing Rate
TBA = To-be-announced
USD = U.S. dollars
Refer to the notes to financial statements.
| Capital Group Fixed Income ETF Trust | 45 |
Financial statements
| Statements of assets and liabilities | |
| at December 31, 2022 | (dollars and shares in thousands, except per-share amount) |
| Core Plus Income ETF | Municipal Income ETF | U.S. Multi-Sector Income ETF | Short Duration Income ETF | |||||||||||||
| Assets: | ||||||||||||||||
| Investment securities, at value: | ||||||||||||||||
| Unaffiliated issuers | $ | 448,767 | $ | 68,198 | $ | 69,358 | $ | 85,445 | ||||||||
| Affiliated issuers | 49,881 | — | 20 | 13,146 | ||||||||||||
| Cash | — | 1,530 | — | 184 | ||||||||||||
| Cash collateral pledged for futures contracts | — | — | 307 | — | ||||||||||||
| Cash collateral pledged for swap contracts | — | — | 894 | 35 | ||||||||||||
| Cash denominated in currencies other than U.S. dollars | — | * | — | — | * | — | ||||||||||
| Receivables for: | ||||||||||||||||
| Sales of investments | 5,117 | — | 1,504 | 18,107 | ||||||||||||
| Sales of fund’s shares | — | 7,840 | — | 7,582 | ||||||||||||
| Dividends and interest | 3,226 | 676 | 834 | 437 | ||||||||||||
| Variation margin on futures contracts | 901 | — | — | — | ||||||||||||
| Variation margin on centrally cleared swap contracts | 199 | — | 50 | — | * | |||||||||||
| 508,091 | 78,244 | 72,967 | 124,936 | |||||||||||||
| Liabilities: | ||||||||||||||||
| Bilateral interest rate swaps, at value | 1 | — | — | — | ||||||||||||
| Payables for: | ||||||||||||||||
| Purchases of investments | 50,007 | 4,410 | 1,486 | 35,200 | ||||||||||||
| Dividends on fund’s shares | 1,744 | 205 | 391 | 267 | ||||||||||||
| Investment advisory services | 116 | 13 | 21 | 11 | ||||||||||||
| Variation margin on futures contract | 934 | — | — | — | ||||||||||||
| Variation margin on centrally cleared swap contracts | 202 | — | — | — | ||||||||||||
| Bank overdraft | 259 | — | 254 | — | ||||||||||||
| 53,263 | 4,628 | 2,152 | 35,478 | |||||||||||||
| Net assets at December 31, 2022 | $ | 454,828 | $ | 73,616 | $ | 70,815 | $ | 89,458 | ||||||||
| Net assets consist of: | ||||||||||||||||
| Capital paid in on shares of beneficial interest | 482,652 | 72,460 | 69,849 | 89,240 | ||||||||||||
| Total (accumulated loss) distributable earnings | (27,824 | ) | 1,156 | 966 | 218 | |||||||||||
| Net assets at December 31, 2022 | $ | 454,828 | $ | 73,616 | $ | 70,815 | $ | 89,458 | ||||||||
| Shares of beneficial interest issued and outstanding (no stated par value) — unlimited shares authorized | ||||||||||||||||
| Net assets | $ | 454,828 | $ | 73,616 | $ | 70,815 | $ | 89,458 | ||||||||
| Shares outstanding | 20,464 | 2,820 | 2,760 | 3,540 | ||||||||||||
| Net asset value per share | $ | 22.23 | $ | 26.11 | $ | 25.66 | $ | 25.27 | ||||||||
| Investment securities, at cost: | ||||||||||||||||
| Unaffiliated issuers | $ | 460,080 | $ | 67,050 | $ | 68,498 | $ | 85,254 | ||||||||
| Affiliated issuers | 49,878 | — | 20 | 13,147 | ||||||||||||
| Cash denominated in currencies other than U.S. dollars, at cost | — | * | — | — | * | — | ||||||||||
| * | Amount less than one thousand. |
Refer to the notes to financial statements.
| 46 | Capital Group Fixed Income ETF Trust |
Financial statements (continued)
| Statements of operations | |
| for the period ended December 31, 2022 | (dollars in thousands) |
| Core Plus Income ETF1 | Municipal Income ETF2 | U.S. Multi-Sector Income ETF2 | Short Duration Income ETF2 | |||||||||||||
| Investment income: | ||||||||||||||||
| Income (net of non-U.S. taxes3): | ||||||||||||||||
| Interest from unaffiliated issuers | $ | 8,458 | $ | 317 | $ | 672 | $ | 362 | ||||||||
| Dividends from affiliated issuers | 1,249 | — | 28 | 46 | ||||||||||||
| 9,707 | 317 | 700 | 408 | |||||||||||||
| Fees and expenses: | ||||||||||||||||
| Investment advisory services | 721 | 22 | 42 | 21 | ||||||||||||
| Net investment income | 8,986 | 295 | 658 | 387 | ||||||||||||
| Net realized loss and unrealized (depreciation) appreciation: | ||||||||||||||||
| Net realized (loss) gain3 on: | ||||||||||||||||
| Investments in: | ||||||||||||||||
| Unaffiliated issuers | (14,732 | ) | 75 | 11 | (15 | ) | ||||||||||
| Affiliated issuers | — | 4 | — | 1 | — | 4 | ||||||||||
| Futures contracts | (2,147 | ) | (76 | ) | 33 | 44 | ||||||||||
| Forward currency contracts | (532 | ) | — | — | — | |||||||||||
| Swap contracts | (37 | ) | — | (60 | ) | (79 | ) | |||||||||
| (17,448 | ) | (1 | ) | (15 | ) | (50 | ) | |||||||||
| Net unrealized (depreciation) appreciation3 on: | ||||||||||||||||
| Investments in: | ||||||||||||||||
| Unaffiliated issuers | (11,313 | ) | 1,148 | 860 | 191 | |||||||||||
| Affiliated issuers | 3 | — | — | 4 | (1 | ) | ||||||||||
| Futures contracts | 35 | — | — | — | ||||||||||||
| Swap contracts | 187 | — | 87 | 67 | ||||||||||||
| Currency translations | — | 4 | — | (1 | ) | — | ||||||||||
| (11,088 | ) | 1,148 | 946 | 257 | ||||||||||||
| Net realized loss and unrealized (depreciation) appreciation | (28,536 | ) | 1,147 | 931 | 207 | |||||||||||
| Net (decrease) increase in net assets resulting from operations | $ | (19,550 | ) | $ | 1,442 | $ | 1,589 | $ | 594 | |||||||
| 1 | For the period February 22, 2022, commencement of operations, to December 31, 2022. |
| 2 | For the period October 25, 2022, commencement of operations, to December 31, 2022. |
| 3 | Additional information related to non-U.S. taxes is included in the notes to financial statements. |
| 4 | Amount less than one thousand. |
Refer to the notes to financial statements.
| Capital Group Fixed Income ETF Trust | 47 |
Financial statements (continued)
| Statements of changes in net assets | (dollars in thousands) |
| Core Plus Income ETF | Municipal Income ETF | U.S. Multi-Sector Income ETF | Short Duration Income ETF | |||||||||||||
| Period ended December 31, 2022* | Period ended December 31, 2022† | Period ended December 31, 2022† | Period ended December 31, 2022† | |||||||||||||
| Operations: | ||||||||||||||||
| Net investment income | $ | 8,986 | $ | 295 | $ | 658 | $ | 387 | ||||||||
| Net realized loss | (17,448 | ) | (1 | ) | (15 | ) | (50 | ) | ||||||||
| Net unrealized (depreciation) appreciation | (11,088 | ) | 1,148 | 946 | 257 | |||||||||||
| Total (decrease) increase in net assets resulting from operations | (19,550 | ) | 1,442 | 1,589 | 594 | |||||||||||
| Distributions paid to shareholders | (8,274 | ) | (286 | ) | (623 | ) | (376 | ) | ||||||||
| Net capital share transactions | 482,652 | 72,460 | 69,849 | 89,240 | ||||||||||||
| Total increase in net assets | 454,828 | 73,616 | 70,815 | 89,458 | ||||||||||||
| Net assets: | ||||||||||||||||
| Beginning of period | — | — | — | — | ||||||||||||
| End of period | $ | 454,828 | $ | 73,616 | $ | 70,815 | $ | 89,458 | ||||||||
| * | For the period February 22, 2022, commencement of operations, to December 31, 2022. |
| † | For the period October 25, 2022, commencement of operations, to December 31, 2022. |
Refer to the notes to financial statements.
| 48 | Capital Group Fixed Income ETF Trust |
Notes to financial statements
1. Organization
Capital Group Fixed Income ETF Trust (the “series”) is registered under the Investment Company Act of 1940, as amended (the “1940 Act”), as an open-end management investment company. The series was organized on January 12, 2021, as a Delaware statutory trust. The series consists of four non-diversified exchange-traded funds: Capital Group Core Plus Income ETF (“Core Plus Income ETF”), Capital Group Municipal Income ETF (“Municipal Income ETF”), Capital Group U.S. Multi-Sector Income ETF (“U.S. Multi-Sector Income ETF”), and Capital Group Short Duration Income ETF (“Short Duration Income ETF”) (each a “fund”, or collectively, the “funds”). The funds’ fiscal year end is December 31.
The investment objective(s) for each fund are as follows:
Core Plus Income ETF — To provide current income and maximum total return, consistent with preservation of capital.
Municipal Income ETF — To provide a high level of current income exempt from regular federal income tax, consistent with the preservation of capital.
U.S. Multi-Sector Income ETF — To provide a high level of current income. The secondary objective is to provide capital appreciation.
Short Duration Income ETF — To provide current income, consistent with a short duration profile and with the preservation of capital.
2. Significant accounting policies
Each fund is an investment company that applies the accounting and reporting guidance issued in Topic 946 by the U.S. Financial Accounting Standards Board. Each fund’s financial statements have been prepared to comply with U.S. generally accepted accounting principles (“U.S. GAAP”). These principles require the funds’ investment adviser to make estimates and assumptions that affect reported amounts and disclosures. Actual results could differ from those estimates. Subsequent events, if any, have been evaluated through the date of issuance in the preparation of the financial statements. The funds follow the significant accounting policies described in this section, as well as the valuation policies described in the next section on valuation.
Security transactions and related investment income — Security transactions are recorded by the funds as of the date the trades are executed with brokers. Realized gains and losses from security transactions are determined based on the specific identified cost of the securities. In the event a security is purchased with a delayed payment date, the funds will segregate liquid assets sufficient to meet their payment obligations. Dividend income is recognized on the ex-dividend date and interest income is recognized on an accrual basis. Market discounts, premiums and original issue discounts on fixed-income securities are amortized daily over the expected life of the security.
Distributions paid to shareholders — Income dividends and capital gain distributions are recorded on each fund’s ex-dividend date.
Currency translation — Assets and liabilities, including investment securities, denominated in currencies other than U.S. dollars are translated into U.S. dollars at the exchange rates supplied by one or more pricing vendors on the valuation date. Purchases and sales of investment securities and income and expenses are translated into U.S. dollars at the exchange rates on the dates of such transactions. The effects of changes in exchange rates on investment securities are included with the net realized gain or loss and net unrealized appreciation or depreciation on investments in each fund’s statement of operations. The realized gain or loss and unrealized appreciation or depreciation resulting from all other transactions denominated in currencies other than U.S. dollars are disclosed separately.
3. Valuation
Capital Research and Management Company (“CRMC”), the funds’ investment adviser, values each fund’s investments at fair value as defined by accounting principles generally accepted in the United States of America. The net asset value per share of each fund is calculated once daily as of the close of regular trading on the New York Stock Exchange, normally 4 p.m. New York time, each day the New York Stock Exchange is open.
Methods and inputs — The funds’ investment adviser uses the following methods and inputs to establish the fair value of each fund’s assets and liabilities. Use of particular methods and inputs may vary over time based on availability and relevance as market and economic conditions evolve.
| Capital Group Fixed Income ETF Trust | 49 |
Equity securities, including depositary receipts, are generally valued at the official closing price of, or the last reported sale price on, the exchange or market on which such securities are traded, as of the close of business on the day the securities are being valued or, lacking any sales, at the last available bid price. Prices for each security are taken from the principal exchange or market on which the security trades.
Fixed-income securities, including short-term securities, are generally valued at evaluated prices obtained from third-party pricing vendors. Vendors value such securities based on one or more of the inputs described in the following table. The table provides examples of inputs that are commonly relevant for valuing particular classes of fixed-income securities in which the funds are authorized to invest. However, these classifications are not exclusive, and any of the inputs may be used to value any other class of fixed-income security.
| Fixed-income class | Examples of standard inputs | |
| All | Benchmark yields, transactions, bids, offers, quotations from dealers and trading systems, new issues, spreads and other relationships observed in the markets among comparable securities; and proprietary pricing models such as yield measures calculated using factors such as cash flows, financial or collateral performance and other reference data (collectively referred to as “standard inputs”) | |
| Corporate bonds, notes & loans; convertible securities | Standard inputs and underlying equity of the issuer | |
| Bonds & notes of governments & government agencies | Standard inputs and interest rate volatilities | |
| Mortgage-backed; asset-backed obligations | Standard inputs and cash flows, prepayment information, default rates, delinquency and loss assumptions, collateral characteristics, credit enhancements and specific deal information | |
| Municipal securities | Standard inputs and, for certain distressed securities, cash flows or liquidation values using a net present value calculation based on inputs that include, but are not limited to, financial statements and debt contracts |
Securities with both fixed-income and equity characteristics, or equity securities traded principally among fixed-income dealers, are generally valued in the manner described for either equity or fixed-income securities, depending on which method is deemed most appropriate by the funds’ investment adviser. The Capital Group Central Cash Fund (“CCF”), a fund within the Capital Group Central Fund Series (“Central Funds“), is valued based upon a floating net asset value, which fluctuates with changes in the value of CCF’s portfolio securities. The underlying securities are valued based on the policies and procedures in CCF’s statement of additional information. Exchange-traded futures are generally valued at the official settlement price of the exchange or market on which such instruments are traded, as of the close of business on the day the futures are being valued. Forward currency contracts are valued based on the spot and forward exchange rates obtained from one or more pricing vendors. Swaps are generally valued using evaluated prices obtained from third-party pricing vendors who calculate these values based on market inputs that may include the yields of the indices referenced in the instrument and the relevant curve, dealer quotes, default probabilities and recovery rates, other reference data, and terms of the contract.
Securities and other assets for which representative market quotations are not readily available or are considered unreliable by the funds’ investment adviser are fair valued as determined in good faith under fair value guidelines adopted by the funds’ investment adviser and approved by each fund’s board of trustees as further described. The investment adviser follows fair valuation guidelines, consistent with U.S. Securities and Exchange Commission rules and guidance, to consider relevant principles and factors when making fair value determinations. The investment adviser considers relevant indications of value that are reasonably and timely available to it in determining the fair value to be assigned to a particular security, such as the type and cost of the security, contractual or legal restrictions on resale of the security, relevant financial or business developments of the issuer, actively traded similar or related securities, dealer or broker quotes, conversion or exchange rights on the security, related corporate actions, significant events occurring after the close of trading in the security, and changes in overall market conditions. In addition, the closing prices of equity securities that trade in markets outside U.S. time zones may be adjusted to reflect significant events that occur after the close of local trading but before the net asset value of each fund is determined. Fair valuations of investments that are not actively trading involve judgment and may differ materially from valuations that would have been used had greater market activity occurred.
Processes and structure — Each fund’s board of trustees has designated the funds’ investment adviser to make fair value determinations, subject to board oversight. The investment adviser has established a Joint Fair Valuation Committee (the “Fair Valuation Committee”) to administer, implement and oversee the fair valuation process, and to make fair value decisions. The Fair Valuation Committee regularly reviews its own fair value decisions, as well as decisions made under its standing instructions to the investment adviser’s valuation team. The Fair Valuation Committee reviews changes in fair value measurements from period to period and may, as deemed appropriate, update the fair valuation guidelines to better reflect the results of back testing and address new or evolving issues. The Fair Valuation Committee reports any changes to the fair valuation guidelines to the board of trustees. Each fund’s board and audit committee also regularly review reports that describe fair value determinations and methods.
| 50 | Capital Group Fixed Income ETF Trust |
The funds’ investment adviser has also established a Fixed-Income Pricing Review Group to administer and oversee the fixed-income valuation process, including the use of fixed-income pricing vendors. This group regularly reviews pricing vendor information and market data. Pricing decisions, processes and controls over security valuation are also subject to additional internal reviews facilitated by the investment adviser’s global risk management group.
Classifications — The funds’ investment adviser classifies each fund’s assets and liabilities into three levels based on the inputs used to value the assets or liabilities. Level 1 values are based on quoted prices in active markets for identical securities. Level 2 values are based on significant observable market inputs, such as quoted prices for similar securities and quoted prices in inactive markets. Certain securities trading outside the U.S. may transfer between Level 1 and Level 2 due to valuation adjustments resulting from significant market movements following the close of local trading. Level 3 values are based on significant unobservable inputs that reflect the investment adviser’s determination of assumptions that market participants might reasonably use in valuing the securities. The valuation levels are not necessarily an indication of the risk or liquidity associated with the underlying investment. For example, U.S. government securities are reflected as Level 2 because the inputs used to determine fair value may not always be quoted prices in an active market. The following tables present the funds’ valuation levels as of December 31, 2022 (dollars in thousands):
Core Plus Income ETF
| Investment securities | ||||||||||||||||
| Level 1 | Level 2 | Level 3 | Total | |||||||||||||
| Assets: | ||||||||||||||||
| Bonds, notes & other debt instruments: | ||||||||||||||||
| Mortgage-backed obligations | $ | — | $ | 164,048 | $ | — | $ | 164,048 | ||||||||
| Corporate bonds, notes & loans | — | 136,677 | — | 136,677 | ||||||||||||
| U.S. Treasury bonds & notes | — | 107,771 | — | 107,771 | ||||||||||||
| Asset-backed obligations | — | 29,371 | 3,964 | 33,335 | ||||||||||||
| Bonds & notes of governments & government agencies outside the U.S. | — | 6,936 | — | 6,936 | ||||||||||||
| Short-term securities | 49,881 | — | — | 49,881 | ||||||||||||
| Total | $ | 49,881 | $ | 444,803 | $ | 3,964 | $ | 498,648 | ||||||||
| Other investments* | ||||||||||||||||
| Level 1 | Level 2 | Level 3 | Total | |||||||||||||
| Assets: | ||||||||||||||||
| Unrealized appreciation on futures contracts | $ | 419 | $ | — | $ | — | $ | 419 | ||||||||
| Unrealized appreciation on centrally cleared interest rate swaps | — | 185 | — | 185 | ||||||||||||
| Unrealized appreciation on credit default swaps | — | 3 | — | 3 | ||||||||||||
| Liabilities: | ||||||||||||||||
| Unrealized depreciation on futures contracts | (384 | ) | — | — | (384 | ) | ||||||||||
| Unrealized depreciation on bilateral interest rate swaps | — | (1 | ) | — | (1 | ) | ||||||||||
| Total | $ | 35 | $ | 187 | $ | — | $ | 222 | ||||||||
| * | Futures contracts, interest rate swaps and credit default swaps are not included in the investment portfolio. |
Municipal Income ETF
As of December 31, 2022, all of the fund’s investment securities were classified as Level 2.
U.S. Multi-Sector Income ETF
| Investment securities | ||||||||||||||||
| Level 1 | Level 2 | Level 3 | Total | |||||||||||||
| Assets: | ||||||||||||||||
| Bonds, notes & other debt instruments: | ||||||||||||||||
| Corporate bonds, notes & loans | $ | — | $ | 53,151 | $ | — | $ | 53,151 | ||||||||
| Mortgage-backed obligations | — | 6,685 | — | 6,685 | ||||||||||||
| Asset-backed obligations | — | 5,055 | 1,000 | 6,055 | ||||||||||||
| U.S. Treasury bonds & notes | — | 526 | — | 526 | ||||||||||||
| Short-term securities | 20 | 2,941 | — | 2,961 | ||||||||||||
| Total | $ | 20 | $ | 68,358 | $ | 1,000 | $ | 69,378 | ||||||||
| Capital Group Fixed Income ETF Trust | 51 |
| Other investments* | ||||||||||||||||
| Level 1 | Level 2 | Level 3 | Total | |||||||||||||
| Assets: | ||||||||||||||||
| Unrealized appreciation on centrally cleared interest rate swaps | $ | — | $ | 67 | $ | — | $ | 67 | ||||||||
| Unrealized appreciation on credit default swaps | — | 20 | — | 20 | ||||||||||||
| Total | $ | — | $ | 87 | $ | — | $ | 87 | ||||||||
| * | Interest rate swaps and credit default swaps are not included in the investment portfolio. |
The following table reconciles the valuation of the fund’s Level 3 investment securities and related transactions for the period ended December 31, 2022 (dollars in thousands):
| Beginning value at 10/25/2022 | Transfers into Level 3* | Purchases | Sales | Net realized gain | Unrealized appreciation† | Transfers out of Level 3* | Ending value at 12/31/2022 | |||||||||||||||||||||||||
| Investment securities | $ | — | $ | — | $ | 1,000 | $ | — | $ | — | $ | — | $ | — | $ | 1,000 | ||||||||||||||||
| Net unrealized appreciation during the period on Level 3 investment securities held at December 31, 2022 | $ | — | ||||||||||||||||||||||||||||||
| * | Transfers into or out of Level 3 are based on the beginning market value of the quarter in which they occurred. These transfers are the result of changes in the availability of pricing sources and/or in the observability of significant inputs used in valuing the securities. |
| † | Net unrealized appreciation is included in the related amounts on investments in the fund’s statement of operations. |
Unobservable inputs — Valuation of the fund’s Level 3 securities is based on significant unobservable inputs that reflect the investment adviser’s determination of assumptions that market participants might reasonably use in valuing the securities. The following table provides additional information used by the fund’s investment adviser to fair value the fund’s Level 3 securities (dollars in thousands):
| Value at 12/31/2022 (000) | Valuation techniques | Unobservable inputs | Range (if applicable) | Weighted average* | Impact to valuation from an increase in input† | |||||||
| Bonds, notes & other debt instruments | $ 1,000 | Transaction | Transaction price | N/A | N/A | N/A |
| * | Weighted average is by relative fair value. |
| † | This column represents the directional change in fair value of the Level 3 securities that would result in an increase from the corresponding input. Significant increases and decreases in these inputs in isolation could result in significantly higher or lower fair value measurements. |
Short Duration Income ETF
| Investment securities | ||||||||||||||||
| Level 1 | Level 2 | Level 3 | Total | |||||||||||||
| Assets: | ||||||||||||||||
| Bonds, notes & other debt instruments: | ||||||||||||||||
| Corporate bonds, notes & loans | $ | — | $ | 44,527 | $ | — | $ | 44,527 | ||||||||
| Mortgage-backed obligations | — | 29,617 | — | 29,617 | ||||||||||||
| Asset-backed obligations | — | 11,121 | — | 11,121 | ||||||||||||
| U.S. Treasury bonds & notes | — | 180 | — | 180 | ||||||||||||
| Short-term securities | 13,146 | — | — | 13,146 | ||||||||||||
| Total | $ | 13,146 | $ | 85,445 | $ | — | $ | 98,591 | ||||||||
| Other investments* | ||||||||||||||||
| Level 1 | Level 2 | Level 3 | Total | |||||||||||||
| Assets: | ||||||||||||||||
| Unrealized appreciation on centrally cleared interest rate swaps | $ | — | $ | 78 | $ | — | $ | 78 | ||||||||
| Liabilities: | ||||||||||||||||
| Unrealized depreciation on centrally cleared interest rate swaps | — | (11 | ) | — | (11 | ) | ||||||||||
| Total | $ | — | $ | 67 | $ | — | $ | 67 | ||||||||
| * | Interest rate swaps are not included in the investment portfolio. |
| 52 | Capital Group Fixed Income ETF Trust |
4. Risk factors
Investing in each fund may involve certain risks including, but not limited to, those described below.
Market conditions — The prices of, and the income generated by, the securities held by a fund may decline due to various factors, including events or conditions affecting the general economy or particular industries or companies; overall market changes; local, regional or global political, social or economic instability; governmental, governmental agency or central bank responses to economic conditions; and currency exchange rate, interest rate and commodity price fluctuations.
Economies and financial markets throughout the world are highly interconnected. Events (including public health emergencies, such as the spread of infectious disease) and other circumstances in one country or region could have impacts on global economies or markets. As a result, whether or not a fund invests in securities of issuers located in or with significant exposure to the countries affected, the value and liquidity of a fund’s investments may be negatively affected by developments in other countries and regions.
Issuer risks — The prices of, and the income generated by, securities held by a fund may decline in response to various factors directly related to the issuers of such securities, including reduced demand for an issuer’s goods or services, poor management performance, major litigation, investigations or other controversies related to the issuer, changes in the issuer’s financial condition or credit rating, changes in government regulations affecting the issuer or its competitive environment and strategic initiatives and the market response to any such initiatives.
Investing in municipal securities — Municipal securities are debt obligations that are exempt from federal, state and/or local income taxes. The yield and/or value of a fund’s investments in municipal securities may be adversely affected by events tied to the municipal securities markets, which can be very volatile and significantly impacted by unfavorable legislative or political developments and negative changes in the financial conditions of municipal securities issuers and the economy. To the extent a fund invests in obligations of a municipal issuer, the volatility, credit quality and performance of a fund may be adversely impacted by local political and economic conditions of the issuer. For example, a credit rating downgrade, bond default or bankruptcy involving an issuer within a particular state or territory could affect the market values and marketability of many or all municipal obligations of that state or territory. Income from municipal securities held by a fund could also be declared taxable because of changes in tax laws or interpretations by taxing authorities or as a result of noncompliant conduct of a municipal issuer. Additionally, the relative amount of publicly available information about municipal securities is generally less than that for corporate securities.
Alternative minimum tax — A fund may invest in securities that may be subject to federal alternative minimum tax. Therefore, while a fund’s distributions from tax-exempt securities are not subject to regular federal income tax, a portion or all of the distributions may be included in determining a shareholder’s federal alternative minimum tax.
Investing in debt instruments — The prices of, and the income generated by, bonds and other debt securities held by a fund may be affected by factors such as the interest rates, maturities and credit quality of these securities.
Rising interest rates will generally cause the prices of bonds and other debt securities to fall. Also, when interest rates rise, issuers are less likely to refinance existing debt securities, causing the average life of such securities to extend. A general rise in interest rates may cause investors to sell debt securities on a large scale, which could also adversely affect the price and liquidity of debt securities and could also result in increased redemptions from a fund. Falling interest rates may cause an issuer to redeem, call or refinance a debt security before its stated maturity, which may result in a fund failing to recoup the full amount of its initial investment and having to reinvest the proceeds in lower yielding securities. Longer maturity debt securities generally have greater sensitivity to changes in interest rates and may be subject to greater price fluctuations than shorter maturity debt securities.
Bonds and other debt securities are also subject to credit risk, which is the possibility that the credit strength of an issuer or guarantor will weaken or be perceived to be weaker, and/or an issuer of a debt security will fail to make timely payments of principal or interest and the security will go into default. Changes in actual or perceived creditworthiness may occur quickly. A downgrade or default affecting any of a fund’s securities could cause the net asset value of a fund’s shares to decrease. Lower quality debt securities generally have higher rates of interest and may be subject to greater price fluctuations than higher quality debt securities.
| Capital Group Fixed Income ETF Trust | 53 |
Liquidity risk — Certain fund holdings may be or may become difficult or impossible to sell, particularly during times of market turmoil. Liquidity may be impacted by the lack of an active market for a holding, legal or contractual restrictions on resale, or the reduced number and capacity of market participants to make a market in such holding. Market prices for less liquid or illiquid holdings may be volatile or difficult to determine, and reduced liquidity may have an adverse impact on the market price of such holdings. Additionally, the sale of less liquid or illiquid holdings may involve substantial delays (including delays in settlement) and additional costs and a fund may be unable to sell such holdings when necessary to meet its liquidity needs, or to try to limit losses, or may be forced to sell at a loss.
Credit and liquidity support — Changes in the credit quality of banks and financial institutions providing credit and liquidity support features with respect to securities held by a fund could cause the values of these securities to decline.
Investing in lower rated debt instruments — Lower rated bonds and other lower rated debt securities generally have higher rates of interest and involve greater risk of default or price declines due to changes in the issuer’s creditworthiness than those of higher quality debt securities. The market prices of these securities may fluctuate more than the prices of higher quality debt securities and may decline significantly in periods of general economic difficulty. These risks may be increased with respect to investments in junk bonds.
Investing in similar municipal bonds — Investing significantly in municipal obligations of multiple issuers in the same state or backed by revenues of similar types of projects or industries may make a fund more susceptible to certain economic, political or regulatory occurrences. As a result, a fund has greater risk of volatility, and greater risk of loss, from these investments.
Investing in mortgage-related and other asset-backed securities — Mortgage-related securities, such as mortgage-backed securities, and other asset-backed securities, include debt obligations that represent interests in pools of mortgages or other income-bearing assets, such as consumer loans or receivables. While such securities are subject to the risks associated with investments in debt instruments generally (for example, credit, extension and interest rate risks), they are also subject to other and different risks. Mortgage-backed and other asset-backed securities are subject to changes in the payment patterns of borrowers of the underlying debt, potentially increasing the volatility of the securities and a fund’s net asset value. When interest rates fall, borrowers are more likely to refinance or prepay their debt before its stated maturity. This may result in a fund having to reinvest the proceeds in lower yielding securities, effectively reducing a fund’s income. Conversely, if interest rates rise and borrowers repay their debt more slowly than expected, the time in which the mortgage-backed and other asset-backed securities are paid off could be extended, reducing a fund’s cash available for reinvestment in higher yielding securities. Mortgage-backed securities are also subject to the risk that underlying borrowers will be unable to meet their obligations and the value of property that secures the mortgages may decline in value and be insufficient, upon foreclosure, to repay the associated loans. Investments in asset-backed securities are subject to similar risks.
Investing in securities backed by the U.S. government — Securities backed by the U.S. Treasury or the full faith and credit of the U.S. government are guaranteed only as to the timely payment of interest and principal when held to maturity. Accordingly, the current market values for these securities will fluctuate with changes in interest rates and the credit rating of the U.S. government. Securities issued by U.S. government-sponsored entities and federal agencies and instrumentalities that are not backed by the full faith and credit of the U.S. government are neither issued nor guaranteed by the U.S. government. U.S. government securities are subject to market risk, interest rate risk and credit risk.
Investing in inflation-linked bonds — The values of inflation-linked bonds generally fluctuate in response to changes in real interest rates —i.e., rates of interest after factoring in inflation. A rise in real interest rates may cause the prices of inflation-linked securities to fall, while a decline in real interest rates may cause the prices to increase. Inflation-linked bonds may experience greater losses than other debt securities with similar durations when real interest rates rise faster than nominal interest rates. There can be no assurance that the value of an inflation-linked security will be directly correlated to changes in interest rates; for example, if interest rates rise for reasons other than inflation, the increase may not be reflected in the security’s inflation measure.
Investing in inflation-linked bonds may also reduce a fund’s distributable income during periods of deflation. If prices for goods and services decline throughout the economy, the principal and income on inflation-linked securities may decline and result in losses to a fund.
Investing in future delivery contracts — A fund may enter into contracts, such as to-be-announced contracts and mortgage dollar rolls, that involve the fund selling mortgage-related securities and simultaneously contracting to repurchase similar securities for delivery at a future date at a predetermined price. This can increase a fund’s market exposure, and the market price of the securities that a fund contracts to repurchase could drop below their purchase price. While a fund can preserve and generate capital through the use of such contracts by, for example, realizing the difference between the sale price and the future purchase price, the income generated by the fund may be reduced by engaging in such transactions. In addition, these transactions increase the turnover rate of a fund.
| 54 | Capital Group Fixed Income ETF Trust |
Investing in derivatives — The use of derivatives involves a variety of risks, which may be different from, or greater than, the risks associated with investing in traditional securities, such as stocks and bonds. Changes in the value of a derivative may not correlate perfectly with, and may be more sensitive to market events than, the underlying asset, rate or index, and a derivative instrument may cause a fund to lose significantly more than its initial investment. Derivatives may be difficult to value, difficult for a fund to buy or sell at an opportune time or price and difficult, or even impossible, to terminate or otherwise offset. A fund’s use of derivatives may result in losses to the fund, and investing in derivatives may reduce the fund’s returns and increase the fund’s price volatility. A fund’s counterparty to a derivative transaction (including, if applicable, the fund’s clearing broker, the derivatives exchange or the clearinghouse) may be unable or unwilling to honor its financial obligations in respect of the transaction. In certain cases, a fund may be hindered or delayed in exercising remedies against or closing out derivative instruments with a counterparty, which may result in additional losses. Derivatives are also subject to operational risk (such as documentation issues, settlement issues and systems failures) and legal risk (such as insufficient documentation, insufficient capacity or authority of a counterparty, and issues with the legality or enforceability of a contract).
Exposure to country, region, industry or sector — Subject to each fund’s investment limitations, a fund may have significant exposure to a particular country, region, industry or sector. Such exposure may cause the fund to be more impacted by risks relating to and developments affecting the country, region, industry or sector, and thus its net asset value may be more volatile, than a fund without such levels of exposure. For example, if a fund has significant exposure in a particular country, then social, economic, regulatory or other issues that negatively affect that country may have a greater impact on the fund than on a fund that is more geographically diversified.
Investing outside the U.S. — Securities of issuers domiciled outside the U.S., or with significant operations or revenues outside the U.S., may lose value because of adverse political, social, economic or market developments in the countries or regions in which the issuers operate or generate revenue. These securities may also lose value due to changes in foreign currency exchange rates against the U.S. dollar and/or currencies of other countries. Issuers of these securities may be more susceptible to actions of foreign governments, which could adversely impact the value of these securities. Securities markets in certain countries may be more volatile and/or less liquid than those in the U.S. Investments outside the U.S. may also be subject to different accounting practices and different regulatory, legal, auditing, financial reporting and recordkeeping standards and practices, and may be more difficult to value, than those in the U.S. In addition, the value of investments outside the U.S. may be reduced by foreign taxes. Further, there may be increased risks of delayed settlement of securities purchased or sold by a fund, which could impact the liquidity of the fund’s portfolio.
Investing in emerging markets — Investing in emerging markets may involve risks in addition to and greater than those generally associated with investing in the securities markets of developed countries. For instance, emerging market countries tend to have less developed political, economic and legal systems than those in developed countries. Accordingly, the governments of these countries may be less stable and more likely to intervene in the market economy in a manner that could adversely affect the prices of securities. Information regarding issuers in emerging markets may be limited, incomplete or inaccurate, and such issuers may not be subject to regulatory, accounting, auditing, and financial reporting and recordkeeping standards comparable to those to which issuers in more developed markets are subject. A fund’s rights with respect to its investments in emerging markets, if any, will generally be governed by local law, which may make it difficult or impossible for a fund to pursue legal remedies or to obtain and enforce judgments in local courts. In addition, the economies of these countries may be dependent on relatively few industries, may have limited access to capital and may be more susceptible to changes in local and global trade conditions and downturns in the world economy. Securities markets in these countries can also be relatively small and have substantially lower trading volumes. As a result, securities issued in these countries may be more volatile and less liquid, and may be more difficult to value, than securities issued in countries with more developed economies and/or markets. Less certainty with respect to security valuations may lead to additional challenges and risks in calculating a fund’s net asset value. Additionally, emerging markets are more likely to experience problems with the clearing and settling of trades and the holding of securities by banks, agents and depositories that are less established than those in developed countries.
Currency — The prices of, and the income generated by, many debt securities held by a fund may also be affected by changes in relative currency values. If the U.S. dollar appreciates against foreign currencies, the value in U.S. dollars of a fund’s securities denominated in such currencies would generally fall and vice versa.
| Capital Group Fixed Income ETF Trust | 55 |
Interest rate risk — The values and liquidity of the securities held by a fund may be affected by changing interest rates. For example, the values of these securities may decline when interest rates rise and increase when interest rates fall. Longer maturity debt securities generally have greater sensitivity to changes in interest rates and may be subject to greater price fluctuations than shorter maturity debt securities. A fund may invest in variable and floating rate securities. When a fund holds variable or floating rate securities, a decrease in market interest rates will adversely affect the income received from such securities and the net asset value of the fund’s shares. Although the values of such securities are generally less sensitive to interest rate changes than those of other debt securities, the value of variable and floating rate securities may decline if their interest rates do not rise as quickly, or as much, as market interest rates. Conversely, floating rate securities will not generally increase in value if interest rates decline. During periods of extremely low short-term interest rates, a fund may not be able to maintain a positive yield and, in relatively low interest rate environments, there are heightened risks associated with rising interest rates.
Portfolio turnover — A fund may engage in frequent and active trading of its portfolio securities. Higher portfolio turnover may involve correspondingly greater transaction costs in the form of dealer spreads, brokerage commissions and other transaction costs on the sale of securities and on reinvestment in other securities. The sale of portfolio securities may also result in the realization of net capital gains, which are taxable when distributed to shareholders, unless the shareholder is exempt from taxation or the shareholder’s account is tax-favored. These costs and tax effects may adversely affect a fund’s returns to shareholders. A fund’s portfolio turnover rate may vary from year to year, as well as within a year.
Market trading — The funds’ shares are listed for trading on an exchange and are bought and sold on the secondary market at market prices. The market prices of fund shares are expected to fluctuate, in some cases materially, in response to changes in a fund’s net asset value (“NAV”), the intraday value of a fund’s holdings, and supply and demand for a fund’s shares. The existence of significant market volatility, disruptions to creations and redemptions, or potential lack of an active trading market for fund shares (including through a trading halt), among other factors, may result in the shares trading significantly above (at a premium) or below (at a discount) to the fund’s NAV and bid-ask spreads may widen. Purchasing a fund’s shares when its market price is at a premium or selling a fund’s shares when its market price is at a discount, may result in paying more than, or receiving less than, NAV, respectively.
Foreign securities held by a fund may be traded in markets that close at a different time than the exchange on which the fund’s shares are listed. Liquidity in those securities may be reduced after the applicable closing times. Accordingly, during the time when a fund’s exchange is open but after the applicable market closing, fixing or settlement times, bid-ask spreads on the fund’s exchange and the corresponding premium or discount to the fund’s NAV may widen.
Authorized participant concentration — Only authorized participants may engage in creation or redemption transactions directly with a fund, and none of them is obligated to do so. A fund has a limited number of institutions that may act as authorized participants. If authorized participants exit the business or are unable to or elect not to engage in creation or redemption transactions, and no other authorized participant engages in such function, fund shares may trade at a premium or discount to NAV and/or at wider intraday bid-ask spreads and possibly face trading halts or delisting.
Nondiversification — As nondiversified funds, each fund has the ability to invest a larger percentage of its assets in the securities of a smaller number of issuers than a diversified fund. As a result, poor performance by a single issuer could adversely affect fund performance more than if each fund were invested in a larger number of issuers. Each fund’s share price can be expected to fluctuate more than might be the case if the fund were more broadly diversified.
Cash transactions — Each fund currently expects to effect at least part of its creations and redemptions for cash rather than in-kind securities. When a fund effects redemptions partly or wholly for cash, rather than in-kind, the fund may have to sell portfolio securities at inopportune times in order to obtain the cash needed to meet redemption orders. If a fund realizes gains on these sales, the fund generally will be required to recognize a gain it might not otherwise have recognized, or to recognize such gain sooner than would otherwise be required if it were to distribute portfolio securities in-kind. This strategy may cause shareholders to be subject to tax from distributions to which they would not otherwise be subject. The use of cash creations and redemptions may also cause a fund’s shares to trade in the market at wider bid-ask spreads or greater premiums or discounts to the fund’s NAV. As a result of such cash transactions, a fund could incur brokerage costs which, to the extent not offset by transaction fees that are payable by an authorized participant, may reduce the fund’s NAV.
Management — The investment adviser to the funds actively manages the funds’ investments. Consequently, the funds are subject to the risk that the methods and analyses, including models, tools and data, employed by the investment adviser in this process may be flawed or incorrect and may not produce the desired results. This could cause the funds to lose value or their investment results to lag relevant benchmarks or other funds with similar objectives.
| 56 | Capital Group Fixed Income ETF Trust |
5. Certain investment techniques
Index-linked bonds — Some of the funds have invested in index-linked bonds, which are fixed-income securities whose principal value is periodically adjusted to a government price index. Over the life of an index-linked bond, interest is paid on the adjusted principal value. Increases or decreases in the principal value of index-linked bonds are recorded as interest income in the fund’s statement of operations.
Mortgage dollar rolls — Some of the funds have entered into mortgage dollar roll transactions in which the fund sells a mortgage-backed security a counterparty and simultaneously enters into an agreement with the same counterparty to buy back a similar security on a specific future date at a predetermined price. Mortgage dollar rolls are accounted for as purchase and sale transactions. Portfolio turnover rates excluding and including mortgage dollar rolls are presented at the end of the fund’s financial highlights table.
Futures contracts — Some of the funds have entered into futures contracts, which provide for the future sale by one party and purchase by another party of a specified amount of a specific financial instrument for a specified price, date, time and place designated at the time the contract is made. Futures contracts are used to strategically manage the fund’s interest rate sensitivity by increasing or decreasing the duration of the fund or a portion of the fund’s portfolio.
Upon entering into futures contracts, and to maintain the fund’s open positions in futures contracts, the fund is required to deposit with a futures broker, known as a futures commission merchant (“FCM“), in a segregated account in the name of the FCM an amount of cash, U.S. government securities or other liquid securities, known as initial margin. The margin required for a particular futures contract is set by the exchange on which the contract is traded to serve as collateral, and may be significantly modified from time to time by the exchange during the term of the contract.
On a daily basis, each fund pays or receives variation margin based on the increase or decrease in the value of the futures contracts and records variation margin on futures contracts in the statement of assets and liabilities. Futures contracts may involve a risk of loss in excess of the variation margin shown on the fund’s statement of assets and liabilities. Each fund records realized gains or losses at the time the futures contract is closed or expires. Net realized gains or losses and net unrealized appreciation or depreciation from futures contracts are recorded in the fund’s statement of operations.
Forward currency contracts — Some of the funds have entered into forward currency contracts, which represent agreements to exchange currencies on specific future dates at predetermined rates. The fund’s investment adviser uses forward currency contracts to manage the fund’s exposure to changes in exchange rates. Upon entering into these contracts, risks may arise from the potential inability of counterparties to meet the terms of their contracts and from possible movements in exchange rates.
On a daily basis, the funds’ investment adviser values forward currency contracts and records unrealized appreciation or depreciation for open forward currency contracts in each fund’s statement of assets and liabilities. Realized gains or losses are recorded at the time the forward currency contract is closed or offset by another contract with the same broker for the same settlement date and currency.
Closed forward currency contracts that have not reached their settlement date are included in the respective receivables or payables for closed forward currency contracts in each fund’s statement of assets and liabilities. Net realized gains or losses from closed forward currency contracts and net unrealized appreciation or depreciation from open forward currency contracts are recorded in each fund’s statement of operations.
Swap contracts — Some of the funds have entered into swap agreements, which are two-party contracts entered into primarily by institutional investors for a specified time period. In a typical swap transaction, two parties agree to exchange the returns earned or realized from one or more underlying assets or rates of return. Swap agreements can be traded on a swap execution facility (SEF) and cleared through a central clearinghouse (cleared), traded over-the-counter (OTC) and cleared, or traded bilaterally and not cleared. Because clearing interposes a central clearinghouse as the ultimate counterparty to each participant’s swap, and margin is required to be exchanged under the rules of the clearinghouse, central clearing is intended to decrease (but not eliminate) counterparty risk relative to uncleared bilateral swaps. To the extent the funds enter into bilaterally negotiated swap transactions, the funds will enter into swap agreements only with counterparties that meet certain credit standards and subject to agreed collateralized procedures. The term of a swap can be days, months or years and certain swaps may be less liquid than others.
Upon entering into a centrally cleared swap contract, the funds are required to deposit cash, U.S. government securities or other liquid securities, which is known as initial margin. Generally, the initial margin required for a particular swap is set and held as collateral by the clearinghouse on which the contract is cleared. The amount of initial margin required may be significantly modified from time to time by the clearinghouse during the term of the contract.
| Capital Group Fixed Income ETF Trust | 57 |
On a daily basis, interest accruals related to the exchange of future payments are recorded as a receivable and payable in the funds’ statement of assets and liabilities for centrally cleared swaps and as unrealized appreciation or depreciation in the funds’ statement of assets and liabilities for bilateral swaps. For centrally cleared swaps, the fund also pays or receives a variation margin based on the increase or decrease in the value of the swaps, including accrued interest as applicable, and records variation margin in the statement of assets and liabilities. The funds record realized gains and losses on both the net accrued interest and any gain or loss recognized at the time the swap is closed or expires. Net realized gains or losses, as well as any net unrealized appreciation or depreciation, from swaps are recorded in the fund’s statement of operations. Swap agreements can take different forms. Some of the funds entered into the following types of swap agreements:
Interest rate swaps — Some of the funds have entered into interest rate swaps, which seek to manage the interest rate sensitivity of the fund by increasing or decreasing the duration of the fund or a portion of the funds’ portfolio. An interest rate swap is an agreement between two parties to exchange or swap payments based on changes in an interest rate or rates. Typically, one interest rate is fixed and the other is variable based on a designated short-term interest rate such as the Secured Overnight Financing Rate (SOFR), prime rate or other benchmark. In other types of interest rate swaps, known as basis swaps, the parties agree to swap variable interest rates based on different designated short-term interest rates. Interest rate swaps generally do not involve the delivery of securities or other principal amounts. Rather, cash payments are exchanged by the parties based on the application of the designated interest rates to a notional amount, which is the predetermined dollar principal of the trade upon which payment obligations are computed. Accordingly, the funds’ current obligation or right under the swap agreement is generally equal to the net amount to be paid or received under the swap agreement based on the relative value of the position held by each party.
Credit default swap indices — The fund has entered into centrally cleared credit default swap indices, including CDX and iTraxx indices (collectively referred to as “CDSIs”), in order to assume exposure to a diversified portfolio of credits or to hedge against existing credit risks. A CDSI is based on a portfolio of credit default swaps with similar characteristics, such as credit default swaps on high-yield bonds. In a typical CDSI transaction, one party (the protection buyer) is obligated to pay the other party (the protection seller) a stream of periodic payments over the term of the contract. If a credit event, such as a default or restructuring, occurs with respect to any of the underlying reference obligations, the protection seller must pay the protection buyer the loss on those credits.
The fund may enter into a CDSI transaction as either protection buyer or protection seller. If the fund is a protection buyer, it would pay the counterparty a periodic stream of payments over the term of the contract and would not recover any of those payments if no credit events were to occur with respect to any of the underlying reference obligations. However, if a credit event did occur, the fund, as a protection buyer, would have the right to deliver the referenced debt obligations or a specified amount of cash, depending on the terms of the applicable agreement, and to receive the par value of such debt obligations from the counterparty protection seller. As a protection seller, the fund would receive fixed payments throughout the term of the contract if no credit events were to occur with respect to any of the underlying reference obligations. If a credit event were to occur, however, the value of any deliverable obligation received by the fund, coupled with the periodic payments previously received by the fund, may be less than the full notional value that the fund, as a protection seller, pays to the counterparty protection buyer, effectively resulting in a loss of value to the fund. Furthermore, as a protection seller, the fund would effectively add leverage to its portfolio because it would have investment exposure to the notional amount of the swap transaction.
The following table presents the average month-end notional amounts of futures contracts, forward currency contracts, interest rate swaps and credit default swaps while held for each fund (dollars in thousands):
| Futures contracts | Forward currency contracts | Interest rate swaps | Credit default swaps | |||||||||
| Core Plus Income ETF | $138,340 | $4,631 | * | $25,154 | $6,750 | |||||||
| Municipal Income ETF | 2,034 | * | Not applicable | Not applicable | Not applicable | |||||||
| U.S. Multi-Sector Income ETF | 23,629 | * | Not applicable | 22,850 | 1,485 | |||||||
| Short Duration Income ETF | 15,266 | * | Not applicable | 19,665 | Not applicable | |||||||
| * | No contracts were held at the end of the reporting period; amount represents the average month-end notional amount of contracts while they were held. |
| 58 | Capital Group Fixed Income ETF Trust |
The following tables identify the location and fair value amounts on each fund’s statement of assets and liabilities and the effect on each fund’s statement of operations resulting from each fund’s use of futures contracts, forward currency contracts, interest rate swaps and credit default swaps as of, or for the period ended, December 31, 2022 (dollars in thousands):
Core Plus Income ETF
| Assets | Liabilities | |||||||||||||
| Contracts | Risk type | Location on statement of assets and liabilities | Value | Location on statement of assets and liabilities | Value | |||||||||
| Futures | Interest | Unrealized appreciation* | $ | 419 | Unrealized depreciation* | $ | 384 | |||||||
| Swap (centrally cleared) | Interest | Unrealized appreciation* | 185 | Unrealized depreciation* | — | |||||||||
| Swap (bilateral) | Interest | Bilateral interest rate swaps, at value | — | Bilateral interest rate swaps, at value | 1 | |||||||||
| Swap (centrally cleared) | Credit | Unrealized appreciation* | 3 | Unrealized depreciation* | — | |||||||||
| $ | 607 | $ | 385 | |||||||||||
| Net realized (loss) gain | Net unrealized appreciation | |||||||||||||
| Contracts | Risk type | Location on statement of operations | Value | Location on statement of operations | Value | |||||||||
| Futures | Interest | Net realized loss on futures contracts | $ | (2,147 | ) | Net unrealized appreciation on futures contracts | $ | 35 | ||||||
| Forward currency | Currency | Net realized gain on forward currency contracts | (532 | ) | Net unrealized appreciation on forward currency contracts | — | ||||||||
| Swap | Interest | Net realized loss on swap contracts | (94 | ) | Net unrealized appreciation on swap contracts | 184 | ||||||||
| Swap | Credit | Net realized gain on swap contracts | 57 | Net unrealized appreciation on swap contracts | 3 | |||||||||
| $ | (2,716 | ) | $ | 222 | ||||||||||
| Municipal Income ETF | ||||||||||||||
| Net realized loss | Net unrealized appreciation | |||||||||||||
| Contracts | Risk type | Location on statement of operations | Value | Location on statement of operations | Value | |||||||||
| Futures | Interest | Net realized loss on futures contracts | $ | (76 | ) | Net unrealized appreciation on futures contracts | $ | — | ||||||
| $ | (76 | ) | $ | — | ||||||||||
| U.S. Multi-Sector Income ETF | ||||||||||||||
| Assets | Liabilities | |||||||||||||
| Contracts | Risk type | Location on statement of assets and liabilities | Value | Location on statement of assets and liabilities | Value | |||||||||
| Swap (centrally cleared) | Interest | Unrealized appreciation* | $ | 67 | Unrealized depreciation* | $ | — | |||||||
| Swap (centrally cleared) | Credit | Unrealized appreciation* | 20 | Unrealized depreciation* | — | |||||||||
| $ | 87 | $ | — | |||||||||||
| Capital Group Fixed Income ETF Trust | 59 |
| Net realized gain (loss) | Net unrealized appreciation | |||||||||||||
| Contracts | Risk type | Location on statement of operations | Value | Location on statement of operations | Value | |||||||||
| Futures | Interest | Net realized gain on futures contracts | $ | 33 | Net unrealized appreciation on futures contracts | $ | — | |||||||
| Swap | Interest | Net realized loss on swap contracts | (60 | ) | Net unrealized appreciation on swap contracts | 67 | ||||||||
| Swap | Credit | Net realized gain on swap contracts | — | Net unrealized appreciation on swap contracts | 20 | |||||||||
| $ | (27 | ) | $ | 87 | ||||||||||
| Short Duration Income ETF | ||||||||||||||
| Assets | Liabilities | |||||||||||||
| Contracts | Risk type | Location on statement of assets and liabilities | Value | Location on statement of assets and liabilities | Value | |||||||||
| Swap (centrally cleared) | Interest | Unrealized appreciation* | $ | 78 | Unrealized depreciation* | $ | 11 | |||||||
| $ | 78 | $ | 11 | |||||||||||
| Net realized gain (loss) | Net unrealized appreciation | |||||||||||||
| Contracts | Risk type | Location on statement of operations | Value | Location on statement of operations | Value | |||||||||
| Futures | Interest | Net realized gain on futures contracts | $ | 44 | Net unrealized appreciation on futures contracts | $ | — | |||||||
| Swap | Interest | Net realized loss on swap contracts | (79 | ) | Net unrealized appreciation on swap contracts | 67 | ||||||||
| $ | (35 | ) | $ | 67 | ||||||||||
| * | Includes cumulative appreciation/depreciation on futures contracts, centrally cleared interest rate swaps and/or centrally cleared credit default swaps as reported in the applicable tables following each fund’s investment portfolio. Only current day’s variation margin is reported within each fund’s statement of assets and liabilities. |
Collateral — Some funds either receive or pledge highly liquid assets, such as cash or U.S. government securities, as collateral due to their use of futures contracts, forward currency contracts, interest rate swaps, credit default swaps and/or future delivery contracts. For futures contracts centrally cleared interest rate swaps and centrally cleared credit default swaps, the program calls for each participating fund to pledge collateral for initial and variation margin by contract. For forward currency contracts and bilateral interest rate swaps, the program calls for each participating fund to either receive or pledge collateral based on the net gain or loss on unsettled contracts by counter-party. For future delivery contracts, the program calls for each participating fund to either receive or pledge collateral based on the net gain or loss on unsettled contracts by certain counterparties. The purpose of the collateral is to cover potential losses that could occur in the event that either party cannot meet its contractual obligation. Non-cash collateral pledged by each participating fund, if any, is disclosed in each fund’s investment portfolio, and cash collateral pledged by each participating fund, if any, is held in a segregated account with the fund’s custodian, which is reflected as pledged cash collateral in each fund’s statement of assets and liabilities.
Rights of offset — Funds that hold forward currency contracts and/or bilateral interest rate swaps have enforceable master netting agreements with certain counterparties, where amounts payable by each party to the other in the same currency (with the same settlement date and with the same counterparty) are settled net of each party’s payment obligation. If an early termination date occurs under these agreements following an event of default or termination event, all obligations of each party to its counterparty are settled net through a single payment in a single currency (“close-out netting”). For financial reporting purposes, the funds do not offset financial assets and financial liabilities that are subject to these master netting arrangements in the statements of assets and liabilities.
| 60 | Capital Group Fixed Income ETF Trust |
The following table presents each fund’s forward currency contracts and/or bilateral interest rate swaps by counterparty that are subject to master netting agreements but that are not offset in the funds’ statement of assets and liabilities. The net amount column shows the impact of offsetting on the funds’ statement of assets and liabilities as of December 31, 2022, if close-out netting was exercised (dollars in thousands):
Core Plus Income ETF
| Gross amounts recognized in the | Gross amounts not offset in the statement of assets and liabilities and subject to a master netting agreement | |||||||||||||||||||
| Counterparty | statement of assets and liabilities | Available to offset | Non-cash collateral | Cash collateral | Net amount | |||||||||||||||
| Liabilities: | ||||||||||||||||||||
| Barclays Bank PLC | $ | 1 | $ | — | $ | — | $ | — | $ | 1 | ||||||||||
6. Taxation and distributions
Federal income taxation — Each fund complies with the requirements under Subchapter M of the Internal Revenue Code applicable to regulated investment companies and intends to distribute substantially all of its net taxable income and net capital gains each year. The funds are not subject to income taxes to the extent such distributions are made. Therefore, no federal income tax provision is required.
As of and during the period ended December 31, 2022, none of the funds had a liability for any unrecognized tax benefits. Each fund recognizes interest and penalties, if any, related to unrecognized tax benefits as income tax expense in their respective statements of operations. During the period, none of the funds incurred any significant interest or penalties.
Each fund’s tax returns are generally not subject to examination by federal, state and, if applicable, non-U.S. tax authorities after the expiration of each jurisdiction’s statute of limitations, which is typically three years after the date of filing but can be extended in certain jurisdictions.
Non-U.S. taxation — Dividend and interest income, if any, are recorded net of non-U.S. taxes paid. The funds may file withholding tax reclaims in certain jurisdictions to recover a portion of amounts previously withheld. These reclaims are recorded when the amount is known and there are no significant uncertainties on collectability. Gains realized by the funds on the sale of securities in certain countries, if any, may be subject to non-U.S. taxes. If applicable, the funds record an estimated deferred tax liability based on unrealized gains to provide for potential non-U.S. taxes payable upon the sale of these securities.
Distributions — Distributions determined on a tax basis may differ from net investment income and net realized gains for financial reporting purposes. These differences are due primarily to different treatment for items such as currency gains and losses; short-term capital gains and losses; capital losses related to sales of certain securities within 30 days of purchase; cost of investments sold; paydowns on fixed-income securities; net capital losses and income on certain investments. The fiscal year in which amounts are distributed may differ from the year in which the net investment income and net realized gains are recorded by the funds for financial reporting purposes.
Additional tax basis disclosures for each fund as of December 31, 2022, were as follows (dollars in thousands):
| Core Plus Income ETF | Municipal Income ETF | U.S. Multi-Sector Income ETF | Short Duration Income ETF | |||||||||||||
| Undistributed tax-exempt income | $ | — | $ | 214 | $ | — | $ | — | ||||||||
| Undistributed ordinary income | 1,880 | — | 436 | 258 | ||||||||||||
| Capital loss carryforward* | (16,682 | ) | (1 | ) | (5 | ) | (2 | ) | ||||||||
| Gross unrealized appreciation on investments | 3,204 | 1,291 | 1,300 | 283 | ||||||||||||
| Gross unrealized depreciation on investments | (14,366 | ) | (143 | ) | (374 | ) | (54 | ) | ||||||||
| Net unrealized (depreciation) appreciation on investments | (11,162 | ) | 1,148 | 926 | 229 | |||||||||||
| Cost of investments | 510,031 | 67,050 | 68,539 | 98,428 | ||||||||||||
| * | Each fund’s capital loss carryforward will be used to offset any capital gains realized by the fund in future years. Funds with a capital loss carryforward will not make distributions from capital gains while a capital loss carryforward remains. |
| Capital Group Fixed Income ETF Trust | 61 |
Distributions paid by each fund from commencement of operations to December 31, 2022, were characterized for tax purposes as follows (dollars in thousands):
| Year ended December 31, 2022 | ||||||||||||||||
| Fund | Ordinary income | Tax-exempt income | Long-term capital gains | Total distributions paid | ||||||||||||
| Core Plus Income ETF | $ | 8,274 | $ | — | $ | — | $ | 8,274 | ||||||||
| Municipal Income ETF | — | 286 | — | 286 | ||||||||||||
| U.S. Multi-Sector Income ETF | 623 | — | — | 623 | ||||||||||||
| Short Duration Income ETF | 376 | — | — | 376 | ||||||||||||
7. Fees and transactions
CRMC, the funds’ investment adviser, is the parent company of American Funds Distributors, Inc.® (“AFD”), the principal underwriter of the fund’s’ shares. CRMC and AFD are considered related parties to the funds.
Investment advisory services – Each fund has an investment advisory and service agreement with CRMC that provides for monthly fees, accrued daily. These fees are based on an annual rate of daily net assets as follows:
| Fund | Annual rate | |||
| Core Plus Income ETF | 0.34 | % | ||
| Municipal Income ETF | 0.27 | |||
| U.S. Multi-Sector Income ETF | 0.39 | |||
| Short Duration Income ETF | 0.25 | |||
Under the terms of the agreements, in addition to providing investment advisory services, the investment adviser and its affiliates provide certain administrative services to help assist third parties providing non-distribution services to the funds’ shareholders. These services include providing in-depth information on each fund and market developments that impact each fund’s investments. The agreement provides that the investment adviser will pay all ordinary operating expenses of each fund other than management fees, interest expenses, taxes, acquired fund fees and expenses, costs of holding shareholder meetings, legal fees and expenses relating to arbitration or litigation, payments under each fund’s plan of distribution (if any) and other non-routine or extraordinary expenses. Additionally, each fund will be responsible for its non-operating expenses, including brokerage commissions and fees and expenses associated with the fund’s securities lending program, if applicable.
Transfer agency and administration services – Each fund has entered into a transfer agency and service agreement and an administration agreement with State Street Bank and Trust Company (“State Street”). Under the terms of the transfer agency agreement, State Street (or an agent, including an affiliate) acts as transfer agent and dividend disbursing agent for each fund. Under the terms of the administration agreement, State Street provides necessary administrative, legal, tax and accounting, regulatory and financial reporting services for the maintenance and operations of each fund. The investment adviser bears the costs of services under these agreements.
Affiliated officers and trustees – Officers and certain trustees of each fund are or may be considered to be affiliated with CRMC and AFD. No affiliated officers or trustees received any compensation directly from any of the funds.
Investment in CCF — Each fund holds shares of CCF, an institutional prime money market fund managed by CRMC. CCF invests in high-quality, short-term money market instruments. CCF is used as the primary investment vehicle for each fund’s short-term investments. CCF shares are only available for purchase by CRMC, its affiliates, and other funds managed by CRMC. CCF shares are not available to the public. CRMC does not receive an investment advisory services fee from CCF.
Security transactions with related funds — Each fund may purchase from, or sell securities to, other CRMC-managed funds (or funds managed by certain affiliates of CRMC) under procedures adopted by each fund’s board of trustees. The funds involved in such transactions are considered related by virtue of having a common investment adviser (or affiliated investment advisers), common trustees and/or common officers. When such transactions occur, each transaction is executed at the current market price of the security and no brokerage commissions or fees are paid in accordance with Rule 17a-7 of the 1940 Act. None of the funds engaged in any such purchase or sale transactions with any related funds during the period ended December 31, 2022.
| 62 | Capital Group Fixed Income ETF Trust |
Interfund lending — Pursuant to an exemptive order issued by the SEC, the fund, along with other CRMC-managed funds (or funds managed by certain affiliates of CRMC), may participate in an interfund lending program. The program provides an alternate credit facility that permits the funds to lend or borrow cash for temporary purposes directly to or from one another, subject to the conditions of the exemptive order. The fund did not lend or borrow cash through the interfund lending program at any time during the period ended December 31, 2022.
8. Indemnifications
Each fund’s organizational documents provide board members and officers with indemnification against certain liabilities or expenses in connection with the performance of their duties to the fund. In the normal course of business, each fund may also enter into contracts that provide general indemnifications. Each fund’s maximum exposure under these arrangements is unknown since it is dependent on future claims that may be made against each fund. The risk of material loss from such claims is considered remote. Insurance policies are also available to each fund’s board members and officers.
9. Capital share transactions
Each fund issues and redeems shares at NAV only with certain authorized participants in large increments known as creation units. Purchases of creation units are made by tendering a basket of designated securities and cash to a fund, and redemption proceeds are paid with a basket of securities from a fund’s portfolio with a balancing cash component to equate the market value of the basket of securities delivered or redeemed to the NAV per creation unit on the transaction date. The funds may issue creation units to authorized participants in advance of the delivery and settlement of all or a portion of the designated securities. When this occurs, the authorized participant provides cash collateral in an amount equal to 105% of the daily marked to market value of the securities that have not yet been delivered to the fund. Cash may be substituted equivalent to the value of certain securities generally when they are not available in sufficient quantity for delivery. Realized gains or losses resulting from redemptions of shares in-kind are reflected separately in each fund’s statement of operations.
Each fund’s shares are available in smaller increments to investors in the secondary market at market prices and may be subject to commissions. Authorized participants pay a transaction fee to the shareholder servicing agent when purchasing and redeeming creation units of a fund. The transaction fee is used to defray the costs associated with the issuance and redemption of creation units. In addition, for cash creation unit transactions, a variable fee for creation transactions and redemption transactions may be charged to the authorized participant to cover certain brokerage, tax, foreign exchange, execution, market impact and other costs and expenses related to the execution of trades. Variable fees, if any, are included in capital share transactions in each fund’s statement of changes in net assets.
| Capital Group Fixed Income ETF Trust | 63 |
Capital share transactions in each fund were as follows (dollars and shares in thousands):
Core Plus Income ETF
| Sales | Reinvestments of distributions | Repurchases | Net increase | |||||||||||||||||||||||||||||
| Amount | Shares | Amount | Shares | Amount | Shares | Amount | Shares | |||||||||||||||||||||||||
| For the period February 22, 2022*, through December 31, 2022 | ||||||||||||||||||||||||||||||||
| $ | 482,652 | 20,464 | $ | — | — | $ | — | — | $ | 482,652 | 20,464 | |||||||||||||||||||||
| Municipal Income ETF | ||||||||||||||||||||||||||||||||
| Sales | Reinvestments of distributions | Repurchases | Net increase | |||||||||||||||||||||||||||||
| Amount | Shares | Amount | Shares | Amount | Shares | Amount | Shares | |||||||||||||||||||||||||
| For the period October 25, 2022*, through December 31, 2022 | ||||||||||||||||||||||||||||||||
| $ | 72,460 | 2,820 | $ | — | — | $ | — | — | $ | 72,460 | 2,820 | |||||||||||||||||||||
| U.S. Multi-Sector Income ETF | ||||||||||||||||||||||||||||||||
| Sales | Reinvestments of distributions | Repurchases | Net increase | |||||||||||||||||||||||||||||
| Amount | Shares | Amount | Shares | Amount | Shares | Amount | Shares | |||||||||||||||||||||||||
| For the period October 25, 2022*, through December 31, 2022 | ||||||||||||||||||||||||||||||||
| $ | 69,849 | 2,760 | $ | — | — | $ | — | — | $ | 69,849 | 2,760 | |||||||||||||||||||||
| Short Duration Income ETF | ||||||||||||||||||||||||||||||||
| Sales | Reinvestments of distributions | Repurchases | Net increase | |||||||||||||||||||||||||||||
| Amount | Shares | Amount | Shares | Amount | Shares | Amount | Shares | |||||||||||||||||||||||||
| For the period October 25, 2022*, through December 31, 2022 | ||||||||||||||||||||||||||||||||
| $ | 89,240 | 3,540 | $ | — | — | $ | — | — | $ | 89,240 | 3,540 | |||||||||||||||||||||
| * | Commencement of operations. |
| 64 | Capital Group Fixed Income ETF Trust |
10. Investment transactions
The following table presents purchases and sales of investments, excluding in-kind transactions, short-term securities and U.S. government obligations, if any, during the period ended December 31, 2022 (dollars in thousands):
| Fund | Purchases | Sales | ||||||
| Core Plus Income ETF | $ | 119,313 | $ | 12,842 | ||||
| Municipal Income ETF | 54,719 | 225 | ||||||
| U.S. Multi-Sector Income ETF | 29,729 | 2,449 | ||||||
| Short Duration Income ETF | 27,634 | 349 | ||||||
The following table presents the value of securities received and delivered in-kind from the authorized participants to support creation and redemption transactions, if any, during the period ended December 31, 2022 (dollars in thousands):
| Fund | In-kind creations | In-kind redemptions | ||||||
| Core Plus Income ETF | $ | 366,036 | $ | — | ||||
| Municipal Income ETF | 6,877 | — | ||||||
| U.S. Multi-Sector Income ETF | 36,934 | — | ||||||
| Short Duration Income ETF | 43,185 | — | ||||||
| Capital Group Fixed Income ETF Trust | 65 |
Financial highlights
| (Loss) income from investment operations1 | Dividends and distributions | |||||||||||||||||||||||||||||||||||||||||||||||
| Year ended | Net asset value, beginning of year | Net investment income | Net (losses) gains on securities (both realized and unrealized) | Total from investment operations | Dividends (from net investment income) | Distributions (from capital gains) | Total dividends and distributions | Net asset value, end of year | Total return2 | Net assets, end of year (in millions) | Ratio of expenses to average net assets3 | Ratio of net income to average net assets | ||||||||||||||||||||||||||||||||||||
| Core Plus Income ETF | ||||||||||||||||||||||||||||||||||||||||||||||||
| 12/31/20224,5 | $ | 25.30 | $ | .83 | $ | (3.24 | ) | $ | (2.41 | ) | $ | (.66 | ) | $ | — | $ | (.66 | ) | $ | 22.23 | (9.59 | )% | $ | 455 | .34 | %6 | 4.24 | %6 | ||||||||||||||||||||
| Municipal Income ETF | ||||||||||||||||||||||||||||||||||||||||||||||||
| 12/31/20224,7 | $ | 25.00 | $ | .17 | $ | 1.07 | $ | 1.24 | $ | (.13 | ) | $ | — | $ | (.13 | ) | $ | 26.11 | 4.92 | % | $ | 74 | .05 | %2 | .67 | %2 | ||||||||||||||||||||||
| U.S. Multi-Sector Income ETF | ||||||||||||||||||||||||||||||||||||||||||||||||
| 12/31/20224,7 | $ | 25.00 | $ | .29 | $ | .62 | $ | .91 | $ | (.25 | ) | $ | — | $ | (.25 | ) | $ | 25.66 | 3.63 | % | $ | 71 | .07 | %2 | 1.13 | %2 | ||||||||||||||||||||||
| Short Duration Income ETF | ||||||||||||||||||||||||||||||||||||||||||||||||
| 12/31/20224,7 | $ | 25.00 | $ | .22 | $ | .21 | $ | .43 | $ | (.16 | ) | $ | — | $ | (.16 | ) | $ | 25.27 | 1.73 | % | $ | 89 | .05 | %2 | .87 | %2 | ||||||||||||||||||||||
| Portfolio turnover rate excluding mortgage dollar roll transactions8,9 | Period ended December 31, 20222,4 | |
| Core Plus Income ETF5 | 172% | |
| Municipal Income ETF7 | 1 | |
| U.S. Multi-Sector Income ETF7 | 6 | |
| Short Duration Income ETF 7 | 1 | |
| Portfolio turnover rate including mortgage dollar roll transactions8,9 | Period ended December 31, 20222,4 | |
| Core Plus Income ETF5 | 446% | |
| Short Duration Income ETF 7 | 55 |
| 1 | Based on average shares outstanding. |
| 2 | Not annualized. |
| 3 | Ratios do not include expenses of any Central Funds. The fund indirectly bears its proportionate share of the expenses of any Central Funds. |
| 4 | Based on operations for a period that is less than a full year. |
| 5 | For the period February 22, 2022, commencement of operations, through December 31, 2022. |
| 6 | Annualized. |
| 7 | For the period October 25, 2022, commencement of operations, through December 31, 2022. |
| 8 | Rates do not include each fund’s portfolio activity with respect to any Central Funds. |
| 9 | Refer to Note 5 for more information on mortgage dollar rolls. Refer to the notes to financial statements. |
| 66 | Capital Group Fixed Income ETF Trust |
Report of Independent Registered Public Accounting Firm
To the Board of Trustees of Capital Group Fixed Income ETF Trust and Shareholders of Capital Group Core Plus Income ETF, Capital Group Municipal Income ETF, Capital Group U.S. Multi-Sector Income ETF and Capital Group Short Duration Income ETF
Opinions on the Financial Statements
We have audited the accompanying statements of assets and liabilities, including the investment portfolios, of each of the funds indicated in the table below (constituting Capital Group Fixed Income ETF Trust, hereafter collectively referred to as the “Funds”) as of December 31, 2022, the related statements of operations and of changes in net assets for each of the periods indicated in the table below, including the related notes, and the financial highlights for each of the periods indicated in the table below (collectively referred to as the “financial statements”). In our opinion, the financial statements present fairly, in all material respects, the financial position of each of the Funds as of December 31, 2022, the results of each of their operations, the changes in each of their net assets, and each of the financial highlights for each of the periods indicated in the table below in conformity with accounting principles generally accepted in the United States of America.
| Fund | Statement of operations | Statement of changes in net assets | Financial highlights |
| Capital Group Core Plus Income ETF | For the period February 22, 2022 (commencement of operations) through December 31, 2022. | ||
| Capital Group Municipal Income ETF | For the period October 25, 2022 (commencement of operations) through December 31, 2022. | ||
| Capital Group U.S. Multi-Sector Income ETF | |||
| Capital Group Short Duration Income ETF | |||
Basis for Opinions
These financial statements are the responsibility of the Funds’ management. Our responsibility is to express an opinion on the Funds’ financial statements based on our audits. We are a public accounting firm registered with the Public Company Accounting Oversight Board (United States) (PCAOB) and are required to be independent with respect to the Funds in accordance with the U.S. federal securities laws and the applicable rules and regulations of the Securities and Exchange Commission and the PCAOB.
We conducted our audits of these financial statements in accordance with the standards of the PCAOB. Those standards require that we plan and perform the audit to obtain reasonable assurance about whether the financial statements are free of material misstatement, whether due to error or fraud.
Our audits included performing procedures to assess the risks of material misstatement of the financial statements, whether due to error or fraud, and performing procedures that respond to those risks. Such procedures included examining, on a test basis, evidence regarding the amounts and disclosures in the financial statements. Our audits also included evaluating the accounting principles used and significant estimates made by management, as well as evaluating the overall presentation of the financial statements. Our procedures included confirmation of securities owned as of December 31, 2022 by correspondence with the custodian, transfer agent and brokers; when replies were not received from brokers, we performed other auditing procedures. We believe that our audits provide a reasonable basis for our opinions.
/s/ PricewaterhouseCoopers LLP
Los Angeles, California
February 14, 2023
We have served as the auditor of one or more investment companies in The Capital Group Companies Investment Company Complex since 1934.
| Capital Group Fixed Income ETF Trust | 67 |
| Expense example | unaudited |
As a fund shareholder, you incur ongoing costs, including investment advisory services fees and other expenses. This example is intended to help you understand your ongoing costs (in dollars) of investing in the fund so you can compare these costs with the ongoing costs of investing in other mutual funds. The example is based on an investment of $1,000 invested at the beginning of the period and held for the entire period.
Actual expenses:
The first line in the table below provides information about actual account values and actual expenses. You may use the information in this line, together with the amount you invested, to estimate the expenses that you paid over the period. Simply divide your account value by $1,000 (for example, an $8,600 account value divided by $1,000 = 8.6), then multiply the result by the number in the first line under the heading titled “Expenses paid during period” to estimate the expenses you paid on your account during this period.
Hypothetical example for comparison purposes:
The second line in the table below provides information about hypothetical account values and hypothetical expenses based on the actual expense ratio for the share class and an assumed rate of return of 5.00% per year before expenses, which is not the actual return of the share class. The hypothetical account values and expenses may not be used to estimate the actual ending account balance or expenses you paid for the period. You may use this information to compare the ongoing costs of investing in the fund and other funds. To do so, compare this 5.00% hypothetical example with the 5.00% hypothetical examples that appear in the shareholder reports of the other funds.
Notes:
Note that the expenses shown in the tables on the following pages are meant to highlight your ongoing costs only and do not reflect any transactional costs, such as sales charges (loads). Therefore, the second line of each share class in the tables is useful in comparing ongoing costs only and will not help you determine the relative total costs of owning different funds. In addition, if these transactional costs were included, your costs would have been higher.
| Beginning account value | Ending account value 12/31/2022 | Expenses paid during period | Annualized expense ratio | |||||||||||||
| Core Plus Income ETF | ||||||||||||||||
| Actual return | $ | 1,000.00 | $ | 978.00 | $ | 1.69 | * | .34 | % | |||||||
| Assumed 5% return | 1,000.00 | 1,023.49 | 1.73 | * | .34 | |||||||||||
| Municipal Income ETF | ||||||||||||||||
| Actual return | $ | 1,000.00 | $ | 1,049.20 | $ | .51 | † | .27 | %† | |||||||
| Assumed 5% return | 1,000.00 | 1,023.84 | 1.38 | † | .27 | † | ||||||||||
| U.S. Multi-Sector Income ETF | ||||||||||||||||
| Actual return | $ | 1,000.00 | $ | 1,036.30 | $ | .73 | † | .39 | %† | |||||||
| Assumed 5% return | 1,000.00 | 1,023.24 | 1.99 | † | .39 | † | ||||||||||
| Short Duration Income ETF | ||||||||||||||||
| Actual return | $ | 1,000.00 | $ | 1,017.30 | $ | .46 | † | .25 | %† | |||||||
| Assumed 5% return | 1,000.00 | 1,023.95 | 1.28 | † | .25 | † | ||||||||||
| * | The “expenses paid during period” are equal to the “annualized expense ratio,��� multiplied by the average account value over the period, multiplied by the number of days in the period, and divided by 365 (to reflect the one-half year period). |
| † | The period for the “annualized expense ratio” and “actual return” line is based on the number of days from October 25, 2022, commencement of operations, through December 31, 2022, and accordingly, is not representative of a full period. The “assumed 5% return” line is based on 184 days. |
| 68 | Capital Group Fixed Income ETF Trust |
| Tax information | unaudited |
We are required to advise you of the federal tax status of certain distributions received by shareholders during the fiscal year. Each fund hereby designates the following amounts for the funds’ fiscal year ended December 31, 2022:
| Capital Group Core Plus Income ETF | Capital Group Municipal Income ETF | Capital Group U.S. Multi-Sector Income ETF | Capital Group Short Duration Income ETF | |||||||||||||
| Section 163(j) interest dividends | 100 | % | — | 100 | % | $ | 365,000 | |||||||||
| Exempt interest dividends | — | $ | 286,000 | — | — | |||||||||||
| U.S. government income that may be exempt from state taxation | $ | 1,075,000 | — | $ | 24,000 | $ | 16,000 | |||||||||
Individual shareholders should refer to their Form 1099 or other tax information, which was mailed in January 2023, to determine the calendar year amounts to be included on their 2022 tax returns. Shareholders should consult their tax advisors.
| Capital Group Fixed Income ETF Trust | 69 |
| Liquidity Risk Management Program | unaudited |
The series has adopted a liquidity risk management program (the “program”). The series’ board has designated Capital Research and Management Company (“CRMC”) as the administrator of the program. Personnel of CRMC or its affiliates conduct the day-to-day operation of the program pursuant to policies and procedures administered by the Capital Group Liquidity Risk Management Committee.
Under the program, CRMC manages each fund’s liquidity risk, which is the risk that the fund could not meet shareholder redemption requests without significant dilution of remaining shareholders’ interests in the fund. This risk is managed by monitoring the degree of liquidity of each fund’s investments, limiting the amount of each fund’s illiquid investments, and utilizing various risk management tools and facilities available to each fund for meeting shareholder redemptions, among other means. CRMC’s process of determining the degree of liquidity of each fund’s investments is supported by one or more third-party liquidity assessment vendors.
The series’ board reviewed a report prepared by CRMC regarding the operation and effectiveness of the program for the period October 1, 2021, through September 30, 2022. No significant liquidity events impacting any of the funds were noted in the report. In addition, CRMC provided its assessment that the program had been effective in managing each fund’s liquidity risk.
| 70 | Capital Group Fixed Income ETF Trust |
This page was intentionally left blank.
| Capital Group Fixed Income ETF Trust | 71 |
This page was intentionally left blank.
| 72 | Capital Group Fixed Income ETF Trust |
Board of trustees and other officers
Independent trustees1
| Name and year of birth | Year first elected a trustee of the series/fund2 | Principal occupation(s) during past five years | Number of portfolios in fund complex overseen by trustee | Other directorships3 held by trustee | ||||
| Vanessa C. L. Chang, 1952 Chair of the Board (Independent and Non-Executive) | 2021 | Former Director, EL & EL Investments (real estate) | 22 | Edison International/Southern California Edison; Transocean Ltd. (offshore drilling contractor) | ||||
| Jennifer C. Feikin, 1968 | 2021 | Business Advisor; previously held positions at Google, AOL, 20th Century Fox and McKinsey & Company; Trustee, The Nature Conservancy of Utah; former Trustee, The Nature Conservancy of California; former Director, First Descents | 97 | Hertz Global Holdings, Inc. | ||||
| Pablo R. González Guajardo, 1967 | 2021 | CEO, Kimberly-Clark de México, SAB de CV | 22 | América Móvil, SAB de CV (telecommunications company); Grupo Sanborns, SAB de CV (retail stores and restaurants); Kimberly-Clark de México, SAB de CV (consumer staples) | ||||
| Leslie Stone Heisz, 1961 | 2021 | Former Managing Director, Lazard (retired, 2010); Director, Kaiser Permanente (California public benefit corporation); former Lecturer, UCLA Anderson School of Management | 97 | Edwards Lifesciences; Public Storage | ||||
| William D. Jones, 1955 | 2021 | Managing Member, CityLink LLC (investing and consulting); former President and CEO, CityLink Investment Corporation (acquires, develops and manages real estate ventures in urban communities) | 23 | Biogen Inc. |
Interested trustee4,5
| Name, year of birth and position with fund | Year first elected a trustee or officer of the series/fund2 | Principal occupation(s) during past five years and positions held with affiliated entities or the principal underwriter of the fund | Number of portfolios in fund complex overseen by trustee3 | Other directorships3 held by trustee | ||||
| William L. Robbins, 1968 | 2021 | Partner — Capital International Investors, Capital Research and Management Company; Partner — Capital International Investors, Capital Bank and Trust Company6; Chair and Director, Capital Group International, Inc.6 | 13 | None |
The fund’s statement of additional information includes further details about fund trustees and is available without charge upon request by calling American Funds Service Company at (800) 421-4225 or by visiting the Capital Group website at capitalgroup.com. The address for all trustees and officers of the fund is 6455 Irvine Center Drive, Irvine, CA 92618, Attention: Secretary.
Refer to page 75 for footnotes.
| Capital Group Fixed Income ETF Trust | 73 |
Other officers5
| Name, year of birth and position with fund | Year first elected an officer of the series/fund2 | Principal occupation(s) during past five years and positions held with affiliated entities or the principal underwriter of the fund | ||
| Vincent J. Gonzales, 1984 President | CGSD 2022 | Partner — Capital Fixed Income Investors, Capital Research and Management Company | ||
| David A. Hoag, 1965 President | CGCP 2021 | Partner — Capital World Investors, Capital Research and Management Company; Partner — Capital Fixed Income Investors, Capital Bank and Trust Company6 | ||
| Damien J. McCann, 1977 President Senior Vice President | CGMS 2022 CGCP 2021 | Partner — Capital Fixed Income Investors, Capital Research and Management Company | ||
| Courtney K. Wolf, 1982 President | CGMU 2022 | Partner — Capital Fixed Income Investors, Capital Research and Management Company; Director, The Capital Group Companies, Inc.6 | ||
| Walt Burkley, 1966 Principal Executive Officer | 2021 | Senior Vice President and Senior Counsel — Fund Business Management Group, Capital Research and Management Company; Director, Capital Research Company6; Director, Capital Research and Management Company | ||
| Michael W. Stockton, 1967 Executive Vice President | 2021 | Senior Vice President — Fund Business Management Group, Capital Research and Management Company | ||
| Steven D. Lotwin, 1969 Senior Vice President | CGSD 2022 | Partner — Capital Fixed Income Investors, Capital Research and Management Company; Director, Capital Research and Management Company | ||
| Mark Marinella, 1958 Senior Vice President | CGMU 2022 | Partner — Capital Fixed Income Investors, Capital Research and Management Company | ||
| Jerome Solomon, 1963 Senior Vice President | CGMU 2022 | Partner — Capital Fixed Income Investors, Capital Research and Management Company | ||
| Scott Sykes, 1971 Senior Vice President | CGMS 2022 | Partner — Capital Fixed Income Investors, Capital Research and Management Company | ||
| Ritchie Tuazon, 1978 Senior Vice President | CGCP 2021 | Partner — Capital Fixed Income Investors, Capital Research and Management Company | ||
| Erik A. Vayntrub, 1984 Senior Vice President | 2021 | Senior Vice President and Senior Counsel — Fund Business Management Group, Capital Research and Management Company; Secretary, Capital Management Services, Inc.6 | ||
| Shannon Ward, 1964 Senior Vice President | CGMS 2022 | Partner — Capital Fixed Income Investors, Capital Research and Management Company | ||
| Xavier Goss, 1980 Vice President | CGCP 2021 CGMS 2022 | Vice President — Capital Fixed Income Investors, Capital Research and Management Company | ||
| Jennifer L. Butler, 1966 Secretary | 2021 | Assistant Vice President — Fund Business Management Group, Capital Research and Management Company | ||
| Troy S. Tanner, 1983 Treasurer | 2021 | Vice President — Investment Operations, Capital Research and Management Company | ||
| Susan K. Countess, 1966 Assistant Secretary | 2021 | Associate — Fund Business Management Group, Capital Research and Management Company |
| 74 | Capital Group Fixed Income ETF Trust |
Other officers5 (continued)
| Name, year of birth and position with fund | Year first elected an officer of the series/fund2 | Principal occupation(s) during past five years and positions held with affiliated entities or the principal underwriter of the fund | ||
| Michael R. Tom, 1988 Assistant Secretary | 2021 | Associate — Fund Business Management Group, Capital Research and Management Company | ||
| Sandra Chuon, 1972 Assistant Treasurer | 2021 | Vice President — Investment Operations, Capital Research and Management Company | ||
| Gregory F. Niland, 1971 Assistant Treasurer | 2021 | Vice President — Investment Operations, Capital Research and Management Company |
| 1 | The term independent trustee refers to a trustee who is not an “interested person” of the fund within the meaning of the Investment Company Act of 1940. |
| 2 | Trustees and officers of the fund serve until their resignation, removal or retirement. |
| 3 | This includes all directorships/trusteeships (other than those in the American Funds or other funds managed by Capital Research and Management Company or its affiliates) that are held by each trustee as a trustee or director of a public company or a registered investment company. |
| 4 | The term interested trustee refers to a trustee who is an “interested person” within the meaning of the Investment Company Act of 1940, on the basis of their affiliation with the fund’s investment adviser, Capital Research and Management Company, or affiliated entities (including the fund’s principal underwriter). |
| 5 | All of the trustees and/or officers listed are officers and/or directors/trustees of one or more of the other funds for which Capital Research and Management Company serves as investment adviser. |
| 6 | Company affiliated with Capital Research and Management Company. |
Key:
CGCP = Capital Group Core Plus Income ETF
CGMU = Capital Group Municipal Income ETF
CGMS = Capital Group U.S. Multi-Sector Income ETF
CGSD = Capital Group Short Duration Income ETF
| Capital Group Fixed Income ETF Trust | 75 |
Office of the fund
6455 Irvine Center Drive
Irvine, CA 92618-4518
Investment adviser
Capital Research and Management Company
333 South Hope Street
Los Angeles, CA 90071-1406
Transfer agent for shareholder accounts
State Street Bank and Trust Company
One Lincoln Street
Boston, MA 02111-2900
Custodian of assets
State Street Bank and Trust Company
One Lincoln Street
Boston, MA 02111-2900
Counsel
Dechert LLP
One Bush Street, Suite 1600
San Francisco, CA 94104-4446
Independent registered public accounting firm
PricewaterhouseCoopers LLP
601 South Figueroa Street
Los Angeles, CA 90017-3874
Principal underwriter
American Funds Distributors, Inc.
333 South Hope Street
Los Angeles, CA 90071-1406
| 76 | Capital Group Fixed Income ETF Trust |
Investors should carefully consider investment objectives, risks, charges and expenses. This and other important information is contained in the fund prospectus and summary prospectus, which can be obtained from your financial professional and should be read carefully before investing. You may also call (800) 421-4225 or visit the Capital Group website at capitalgroup.com.
“Proxy Voting Procedures and Principles” — which describes our procedures and principles for voting portfolio securities — is available at capitalgroup.com/etf. Each fund files its proxy voting record with the U.S. Securities and Exchange Commission (SEC) for the 12 months ended June 30 by August 31. The proxy voting record is available free of charge on the SEC website at sec.gov and on our website.
If used as sales material after March 31, 2023, this report must be accompanied by a statistical update for the most recently completed calendar quarter.
Capital Group Fixed Income ETF Trust
For CGCP, CGMS and CGSD, the use of derivatives involves a variety of risks, which may be different from, or greater than, the risks associated with investing in traditional securities, such as stocks and bonds.
For CGCP, CGMU and CGMS, lower rated bonds are subject to greater fluctuations in value and risk of loss of income and principal than higher rated bonds.
For CGCP, CGMU, CGMS and CGSD, the return of principal for bond funds and for funds with significant underlying bond holdings is not guaranteed. Fund shares are subject to the same interest rate, inflation and credit risks associated with the underlying bond holdings.
For CGMU, income from municipal bonds may be subject to state or local income taxes and/or the federal alternative minimum tax. Certain other income, as well as capital gain distributions, may be taxable.
For CGCP, CGMS and CGSD, investing outside the United States involves risks, such as currency fluctuations, periods of illiquidity and price volatility. These risks may be heightened in connection with investments in developing countries.
All Capital Group trademarks mentioned are owned by The Capital Group Companies, Inc., an affiliated company or fund. All other company and product names mentioned are the property of their respective companies.
Bloomberg Index Services Limited. BLOOMBERG® is a trademark and service mark of Bloomberg Finance L.P. and its affiliates (collectively “Bloomberg”). Bloomberg or Bloomberg’s licensors own all proprietary rights in the Bloomberg Indices. Neither Bloomberg nor Bloomberg’s licensors approves or endorses this material, or guarantees the accuracy or completeness of any information herein, or makes any warranty, express or implied, as to the results to be obtained therefrom and, to the maximum extent allowed by law, neither shall have any liability or responsibility for injury or damages arising in connection therewith.
American Funds Distributors, Inc., member FINRA.
This content, developed by Capital Group, home of American Funds, should not be used as a primary basis for investment decisions and is not intended to serve as impartial investment or fiduciary advice.

ITEM 2 – Code of Ethics
The Registrant has adopted a Code of Ethics that applies to its Principal Executive Officer and Principal Financial Officer. The Registrant undertakes to provide to any person without charge, upon request, a copy of the Code of Ethics. Such request can be made by calling 800/421-4225 or to the Secretary of the Registrant, 6455 Irvine Center Drive, Irvine, California 92618.
ITEM 3 – Audit Committee Financial Expert
The Registrant’s board has determined that Leslie Stone Heisz, a member of the Registrant’s audit committee, is an “audit committee financial expert” and "independent," as such terms are defined in this Item. This designation will not increase the designee’s duties, obligations or liability as compared to his or her duties, obligations and liability as a member of the audit committee and of the board, nor will it reduce the responsibility of the other audit committee members. There may be other individuals who, through education or experience, would qualify as "audit committee financial experts" if the board had designated them as such. Most importantly, the board believes each member of the audit committee contributes significantly to the effective oversight of the Registrant’s financial statements and condition.
ITEM 4 – Principal Accountant Fees and Services
| CGFIT | ||
| Registrant: | ||
| a) Audit Fees: | ||
| Audit | 2021 | None |
| 2022 | 16,000 | |
| b) Audit-Related Fees: | ||
| 2021 | None | |
| 2022 | None | |
| c) Tax Fees: | ||
| 2021 | None | |
| 2022 | None | |
| The tax fees consist of professional services relating to the preparation of the Registrant’s tax returns. | ||
| d) All Other Fees: | ||
| 2021 | None | |
| 2022 | None | |
| Adviser and affiliates (includes only fees for non-audit services billed to the adviser and affiliates for engagements that relate directly to the operations and financial reporting of the Registrant and were subject to the pre-approval policies described below): | ||
| a) Audit Fees: | ||
| Not Applicable | ||
| b) Audit-Related Fees: | ||
| 2021 | None | |
| 2022 | None | |
| The audit-related fees consist of assurance and related services relating to the examination of the Registrant’s transfer agent, principal underwriter and investment adviser conducted in accordance with Statement on Standards for Attestation Engagements Number 18 issued by the American Institute of Certified Public Accountants. | ||
| c) Tax Fees: | ||
| 2021 | None | |
| 2022 | None | |
| The tax fees consist of consulting services relating to the Registrant’s investments. | ||
| d) All Other Fees: | ||
| 2021 | None | |
| 2022 | None | |
| The other fees consist of subscription services related to an accounting research tool. | ||
| All audit and permissible non-audit services that the Registrant’s audit committee considers compatible with maintaining the independent registered public accounting firm’s independence are required to be pre-approved by the committee. The pre-approval requirement will extend to all non-audit services provided to the Registrant, the investment adviser, and any entity controlling, controlled by, or under common control with the investment adviser that provides ongoing services to the Registrant, if the engagement relates directly to the operations and financial reporting of the Registrant. The committee will not delegate its responsibility to pre-approve these services to the investment adviser. The committee may delegate to one or more committee members the authority to review and pre-approve audit and permissible non-audit services. Actions taken under any such delegation will be reported to the full committee at its next meeting. The pre-approval requirement is waived with respect to non-audit services if certain conditions are met. The pre-approval requirement was not waived for any of the non-audit services listed above provided to the Registrant, adviser and affiliates. | ||
| Aggregate non-audit fees paid to the Registrant’s auditors, including fees for all services billed to the Registrant, adviser and affiliates that provide ongoing services to the Registrant, were $0 for fiscal year 2021 and $0 for fiscal year 2022. The non-audit services represented by these amounts were brought to the attention of the committee and considered to be compatible with maintaining the auditors’ independence. |
ITEM 5 – Audit Committee of Listed Registrants
Not applicable to this Registrant, insofar as the Registrant is not a listed issuer as defined in Rule 10A-3 under the Securities Exchange Act of 1934.
ITEM 6 – Schedule of Investments
Not applicable, insofar as the schedule is included as part of the report to shareholders filed under Item 1 of this Form.
ITEM 7 – Disclosure of Proxy Voting Policies and Procedures for Closed-End Management Investment Companies
Not applicable to this Registrant, insofar as the Registrant is not a closed-end management investment company.
ITEM 8 – Portfolio Managers of Closed-End Management Investment Companies
Not applicable to this Registrant, insofar as the Registrant is not a closed-end management investment company.
ITEM 9 – Purchases of Equity Securities by Closed-End Management Investment Company and Affiliated Purchasers
Not applicable to this Registrant, insofar as the Registrant is not a closed-end management investment company.
ITEM 10 – Submission of Matters to a Vote of Security Holders
There have been no material changes to the procedures by which shareholders may recommend nominees to the Registrant’s board of trustees since the Registrant last submitted a proxy statement to its shareholders. The procedures are as follows. The Registrant has a nominating and governance committee comprised solely of persons who are not considered ‘‘interested persons’’ of the Registrant within the meaning of the Investment Company Act of 1940, as amended. The committee periodically reviews such issues as the board’s composition, responsibilities, committees, compensation and other relevant issues, and recommends any appropriate changes to the full board of trustees. While the committee normally is able to identify from its own resources an ample number of qualified candidates, it will consider shareholder suggestions of persons to be considered as nominees to fill future vacancies on the board. Such suggestions must be sent in writing to the nominating and governance committee of the Registrant, c/o the Registrant’s Secretary, and must be accompanied by complete biographical and occupational data on the prospective nominee, along with a written consent of the prospective nominee for consideration of his or her name by the nominating and governance committee.
ITEM 11 – Controls and Procedures
| (a) | The Registrant’s Principal Executive Officer and Principal Financial Officer have concluded, based on their evaluation of the Registrant’s disclosure controls and procedures (as such term is defined in Rule 30a-3 under the Investment Company Act of 1940), that such controls and procedures are adequate and reasonably designed to achieve the purposes described in paragraph (c) of such rule. |
| (b) | There were no changes in the Registrant’s internal controls over financial reporting (as defined in Rule 30a-3(d) under the Investment Company Act of 1940) that occurred during the Registrant’s semi-annual period covered by this report that has materially affected, or is reasonably likely to materially affect, the Registrant’s internal control over financial reporting.
|
ITEM 12 – Exhibits
| (a)(1) | The Code of Ethics that is the subject of the disclosure required by Item 2 is attached as an exhibit hereto. |
| (a)(2) | The certifications required by Rule 30a-2 of the Investment Company Act of 1940 and Sections 302 and 906 of the Sarbanes-Oxley Act of 2002 are attached as exhibits hereto. |
SIGNATURES
Pursuant to the requirements of the Securities Exchange Act of 1934 and the Investment Company Act of 1940, the Registrant has duly caused this report to be signed on its behalf by the undersigned, thereunto duly authorized.
| CAPITAL GROUP FIXED INCOME ETF TRUST | |
| By __/s/ Walter R. Burkley________________ | |
Walter R. Burkley, Principal Executive Officer | |
| Date: February 28, 2023 |
Pursuant to the requirements of the Securities Exchange Act of 1934 and the Investment Company Act of 1940, this report has been signed below by the following persons on behalf of the Registrant and in the capacities and on the dates indicated.
| By _ /s/ Walter R. Burkley_____________ |
Walter R. Burkley, Principal Executive Officer |
| Date: February 28, 2023 |
| By ___/s/ Troy S. Tanner__________________ |
Troy S. Tanner, Treasurer and Principal Financial Officer |
| Date: February 28, 2023 |