UNITED STATES
SECURITIES AND EXCHANGE COMMISSION
Washington, D.C. 20549
FORM N-CSR
Certified Shareholder Report of
Registered Management Investment Companies
Investment Company Act File Number: 811-23738
Capital Group Fixed Income ETF Trust
(Exact Name of Registrant as Specified in Charter)
6455 Irvine Center Drive
Irvine, California 92618
(Address of Principal Executive Offices)
Registrant's telephone number, including area code: (949) 975-5000
Date of fiscal year end: December 31
Date of reporting period: December 31, 2023
Troy S. Tanner
Capital Group Fixed Income ETF Trust
6455 Irvine Center Drive
Irvine, California 92618
(Name and Address of Agent for Service)
ITEM 1 – Reports to Stockholders
Capital Group Fixed Income ETF Trust
Annual report |

Fixed income
for a variety of
investor goals
The Securities and Exchange Commission has adopted new regulations that will change the content and design of annual and semi-annual shareholder reports beginning in July 2024. Certain types of information, including investment portfolio and financial statements, will not be included in the shareholder reports but will be available online, delivered free of charge upon request, and filed on a semi-annual basis on Form N-CSR.
If you would like to receive shareholder reports and other communications from the fund electronically, you may update your mailing preferences with your financial intermediary or enroll in e-delivery at capitalgroup.com (for accounts held directly with the fund).
The funds within Capital Group Fixed Income ETF Trust seek to pursue a variety of objectives for investors and are offered by Capital Group, home of American Funds®. For over 90 years, Capital Group has invested with a long-term focus based on thorough research and attention to risk.
Figures shown are past results and are not predictive of results in future periods. Current and future results may be lower or higher than those shown. Prices and returns will vary, so investors may lose money. Investing for short periods makes losses more likely. For current information and month-end results, refer to capitalgroup.com. Market price returns are determined using the official closing price of the fund’s shares and do not represent the returns you would receive if you traded shares at other times.
Here are the total returns on a $1,000 investment with all distributions reinvested for periods ended December 31, 2023:
| Fund inception date | 1 year | Since inception | 30-day SEC yield | Gross expense ratio* | ||||||||||||||
| CGCB — Capital Group Core Bond ETF | 9/26/23 | 4.48 | % | 0.27 | % | |||||||||||||
| Net asset value | — | 6.56 | % | |||||||||||||||
| Market price | — | 6.84 | ||||||||||||||||
| CGCP — Capital Group Core Plus Income ETF | 2/22/22 | 5.48 | 0.34 | |||||||||||||||
| Net asset value | 7.25 | % | –1.65 | |||||||||||||||
| Market price | 7.19 | –1.56 | ||||||||||||||||
| CGMU — Capital Group Municipal Income ETF | 10/25/22 | 3.44 | 0.27 | |||||||||||||||
| Net asset value | 6.78 | 10.07 | ||||||||||||||||
| Market price | 6.76 | 10.34 | ||||||||||||||||
| CGSD — Capital Group Short Duration Income ETF | 10/25/22 | 5.08 | 0.25 | |||||||||||||||
| Net asset value | 5.14 | 5.85 | ||||||||||||||||
| Market price | 5.01 | 5.98 | ||||||||||||||||
| CGSM — Capital Group Short Duration Municipal Income ETF | 9/26/23 | 3.23 | 0.25 | |||||||||||||||
| Net asset value | — | 4.00 | ||||||||||||||||
| Market price | — | 4.24 | ||||||||||||||||
| CGMS — Capital Group U.S. Multi-Sector Income ETF | 10/25/22 | �� | 6.43 | 0.39 | ||||||||||||||
| Net asset value | 11.39 | 12.90 | ||||||||||||||||
| Market price | 11.49 | 13.17 | ||||||||||||||||
Capital Group exchange-traded funds (ETFs) are actively managed and do not seek to replicate a specific index. ETF shares are bought and sold through an exchange at the then current market price, not net asset value (NAV), and are not individually redeemed from the fund. Shares may trade at a premium or discount to their NAV when traded on an exchange. Brokerage commissions will reduce returns. There can be no guarantee that an active market for ETFs will develop or be maintained, or that the ETF’s listing will continue or remain unchanged.
ETF market price returns since inception are calculated using NAV for the period until market price became available (generally a few days after inception).
Since inception returns are cumulative for ETFs with less than one year of history and average annual for ETFs with more than one year of history.
As nondiversified funds, Capital Group ETFs have the ability to invest a larger percentage of assets in securities of individual issuers than a diversified fund. As a result, a single issuer could adversely affect a fund’s results more than if the fund invested a smaller percentage of assets in securities of that issuer. Refer to the applicable prospectus for details.
| * | The total annual fund operating expense ratios were as of each fund’s prospectus dated March 1, 2024 (unaudited). The expense ratios for CGCB and CGSM are estimated. |
Investments are not FDIC-insured, nor are they deposits of or guaranteed by a bank or any other entity, so they may lose value.
Contents
We are pleased to present this annual report for Capital Group Core Bond ETF (ticker: CGCB), Capital Group Core Plus Income ETF (ticker: CGCP), Capital Group Municipal Income ETF (ticker: CGMU), Capital Group Short Duration Income ETF (ticker: CGSD) and Capital Group Short Duration Municipal Income ETF (ticker: CGSM) and Capital Group U.S. Multi-Sector Income ETF (ticker: CGMS). This report covers the fiscal year ending December 31, 2023. For CGCB and CGSM, the commentary in this report for those funds reflect the funds’ inception date (9/26/23) to fiscal year-end period.
Bond market overview
After experiencing one of the most difficult markets in 40 years in 2022, fixed income markets bounced back modestly in 2023. However, for much of 2023, bond markets were volatile amid continued central bank interest rate hikes as global central banks sought to dampen elevated inflationary pressures. These central banks, particularly the U.S. Federal Reserve (the Fed), were able to use higher interest rate policies to reduce inflationary pressures without seemingly pushing the global economy into recession. By the end of 2023, the Fed had indicated that they had likely reached the end of interest rate hikes and could reduce rates in 2024, which helped propel bond prices higher during the fourth quarter.
In the U.S., the Fed raised benchmark interest rates during the first seven months of 2023, albeit at a more modest pace than in the previous year. At the end of 2023, the target range for the Federal funds rate was 5.25% to 5.50%, or 1% higher than the end of 2022. The 10-year Treasury yield ended 2023 at 3.88%, the same level it ended the previous year after peaking at 4.98% in October 2023, which was the highest yield in more than 15 years. Short-term bond yields from 1-month to 1-year maturities rose during the year, but 2- through 7-year bond yields declined modestly. The yield curve remained inverted during 2023, meaning shorter term bond yields were higher than longer term bond yields. There were periods of more extreme yield curve inversion during the middle of the year, yet as Fed interest rate hikes appeared to be closer to ending, 2- to 7-year yields declined more than longer maturities. This resulted in a modestly steeper portion of the curve for maturities of two or more years. Overall, short-term bond yields remained higher than long-term yields at the end of 2023.
Returns for the Bloomberg U.S. Aggregate Index — the broad-based U.S. bond market benchmark — and the Bloomberg Global Aggregate Index1 were 5.53% and 5.72%, respectively. These gains marked a turnaround from sharp losses in 2022. Looking at short-term investment-grade securities, the Bloomberg U.S. Government/Credit (1-3 Years) Index2 rose 4.61%. As inflation tapered throughout the year, the Bloomberg U.S. Treasury Inflation-Protected Securities Index3 lagged the benchmark with a return of 3.90%. Mortgage bonds bounced back despite tepid housing demand and supply, with the Bloomberg U.S. Mortgage Backed Securities Index4 returning 5.05%.
Within U.S. credit sectors, investment-grade bonds outpaced the broader market and the Bloomberg U.S. Corporate Investment Grade Index5 posted a return of 8.52%.
| 1 | Bloomberg Global Aggregate Index represents the global investment-grade fixed income markets. |
| 2 | Bloomberg 1-3 Year U.S. Government/Credit Index is a market-value weighted index that tracks the total return results of fixed-rate, publicly placed, dollar-denominated obligations issued by the U.S. Treasury, U.S. government agencies, quasi-federal corporations, corporate or foreign debt guaranteed by the U.S. government, and U.S. corporate and foreign debentures and secured notes that meet specified maturity, liquidity and quality requirements, with maturities of one to three years. |
| 3 | Bloomberg U.S. Treasury Inflation-Protected Securities (TIPS) Index consists of investment-grade, fixed-rate, publicly placed, dollar-denominated and non-convertible inflation-protected securities issued by the U.S. Treasury that have at least one year remaining to maturity, and have at least $250 million par amount outstanding. |
| 4 | Bloomberg U.S. Mortgage Backed Securities Index is a market-value-weighted index that covers the mortgage-backed pass-through securities of Ginnie Mae (GNMA), Fannie Mae (FNMA), and Freddie Mac (FHLMC). |
| 5 | Bloomberg U.S. Corporate Investment Grade Index represents the universe of investment-grade, publicly issued U.S. corporate and specified foreign debentures and secured notes that meet the specified maturity, liquidity, and quality requirements. |
Past results are not predictive of results in future periods.
| Capital Group Fixed Income ETF Trust | 1 |
High-yield corporate bonds registered strong returns, with the Bloomberg U.S. Corporate High Yield 2% Issuer Capped Index6 climbing 13.44% for the year.
Turning to the municipal bond market, strong state reserve levels and the U.S. economy seemingly staving off recession helped the Bloomberg Municipal Bond Index7 outpace the taxable fixed income market. The index rose 6.40% in 2023. Shorter maturity municipal bonds lagged with the Bloomberg Municipal Short 1-5 Years Index8 returning 3.58% in 2023.
Inside the funds
Since inception (9/26/23) through the end of the fiscal year (12/31/23), CGCB returned 6.84% on a market price basis and 6.56% on a net asset value (NAV) basis. The fund outpaced its benchmark, the Bloomberg U.S. Aggregate Index, on a market price basis, but lagged on a net asset value basis. CGCB’s yield curve positioning detracted from results relative to the fund’s benchmark, but was counterbalanced by sector/industry selection, largely a result of greater-than-benchmark investment in the securitized credit and investment-grade corporates sectors.
CGCP outpaced its benchmark, the Bloomberg U.S. Aggregate Index, returning 7.19% on a market price basis and 7.25% on a NAV basis in 2023. The fund’s overweight to credit, particularly high yield, and strong security selection across sectors drove much of the contributions to results relative to the benchmark. The fund’s relative underweight duration position for much of the year was further additive to results as yields rose significantly before peaking in October. Meanwhile, CGCP’s positioning for yield curve steepening, intended to help balance procyclical positioning in credit, detracted from relative results as the curve did not steepen as much as the market anticipated in 2023.
CGMU returned 6.76% on a market price basis and 6.78% on a NAV basis in 2023, outpacing its benchmark, the 85%/15% Bloomberg 1-15 Year Blend (1-17 Year) Municipal Bond Index/Bloomberg 1-15 Year Blend (1-17 Year) High Yield Municipal Bond Index9. Security selection and curve positioning were key drivers of excess returns in 2023. Investment choices and yield curve positioning within the corporates sector were particularly additive. In contrast, duration positioning was a modest detractor from relative results. Housing and utility duration positioning — or the maturity of the investments in these sectors — were drags on returns compared to the benchmark.
CGSD rose 5.01% and 5.14% on a market price and NAV basis, respectively for the year. Credit sectors and duration positioning contributed to results, while yield curve positioning detracted. All credit sectors contributed to absolute results for the year, and diversification benefitted the fund. Within credit sectors, a diversified mix of asset-backed securities (ABS) contributed the most to absolute results followed by investment-grade industrial corporate bonds. Non-agency CMBS and residential MBS also added strongly to absolute results. Short maturity investment-grade corporate bonds had positive returns and CGSD’s allocation to this sector benefitted the fund. Industrials were the largest driver of results followed by financials. Throughout the year, CGSD managers positioned the portfolio in anticipation of yield curve steepening, which detracted from returns.
Over the fund’s brief lifetime (9/26/23 through 12/31/23), CGSM registered a 4.24% return on a market price basis and 4.00% on a net asset value (NAV) basis, which outpaced its benchmark, the Bloomberg Municipal Short 1-5 Years Index. Security selection and duration positioning were among the contributors to relative returns, while yield curve positioning in the general obligation sector was a notable detractor.
In 2023, CGMS posted an 11.49% return on a market price basis and an 11.39% on a NAV basis. The fund’s results surpassed that of its benchmark index, the Bloomberg U.S. Aggregate Index and its secondary benchmark, the Bloomberg Custom Multi-Sector Composite Index10.
| 6 | Bloomberg U.S. Corporate High Yield Index covers the universe of fixed-rate, non-investment-grade debt. |
| 7 | Bloomberg Municipal Bond Index is a market-value-weighted index designed to represent the long-term investment-grade tax-exempt bond market. This index is unmanaged, and its results include reinvested distributions but do not reflect the effect of sales charges, commissions, account fees, expenses or U.S. federal income taxes. |
| 8 | Bloomberg Municipal Short 1-5 Years Index is a market-value-weighted index that includes investment-grade tax-exempt bonds with maturities of one to five years. |
| 9 | 85%/15% Bloomberg 1-15 Year Blend (1-17) Municipal Bond Index/Bloomberg 1-15 Year Blend (1-17) High Yield Municipal Bond Index blends the Bloomberg 1-15 Year Blend (1-17) Municipal Bond Index with the Bloomberg 1-15 Year Blend (1-17) High Yield Municipal Bond Index by weighting their cumulative total returns at 85% and 15%, respectively. The blend is rebalanced monthly. Bloomberg 1-15 Year Blend (1-17) Municipal Bond Index consists of a broad selection of investment-grade general obligation and revenue bonds of maturities ranging from one year to 17 years. Bloomberg 1-15 Year Blend (1-17) High Yield Municipal Bond Index consists of a broad selection of below-investment-grade general obligation and revenue bonds of maturities ranging from one year to 17 years. |
| 10 | Bloomberg Custom Multi-Sector Composite Index reflect the results of the Custom US CMBS ex AAA/US HY 2% Cap/ US ABS ex AAA/ US Corp Index from 06/01/2022 through 09/30/2023 and the Custom US CMBS Non-Agency ex AAA/US HY 2% Cap/ US ABS ex AAA/US Corp Index, thereafter. Bloomberg U.S. Corporate High Yield 2% Issuer Capped Index covers the universe of fixed-rate, non-investment-grade debt. The index limits the maximum exposure of any one issuer to 2%. Bloomberg U.S. Corporate Investment Grade Index represents the universe of investment-grade publicly issued U.S. corporate and specified foreign debentures and secured notes that meet the specified maturity, liquidity, and quality requirements. Bloomberg CMBS Non-Agency ex AAA Index represents the universe of U.S. commercial mortgage-backed securities, excluding issuers with credit ratings of AAA, the highest credit quality rating. Bloomberg Non-Agency CMBS ex AAA Index represents the universe of U.S. commercial mortgage-backed securities, excluding agency and issuers with credit ratings of AAA, the highest credit quality rating. Bloomberg ABS ex AAA Index represents the universe of U.S. asset-backed securities, excluding issuers with credit ratings of AAA, the highest credit quality rating. |
Past results are not predictive of results in future periods.
| 2 | Capital Group Fixed Income ETF Trust |
Security selection was the primary driver of results compared to the secondary benchmark, especially in investment-grade corporates and securitized credit sectors. Sector/industry positioning detracted from relative returns, driven by CGMS’s lower investment in high-yield corporates and the fund’s allocation to cash & money market instruments in an up-market environment.
Looking ahead
With inflation falling and a cooling economy, bond investors may be feeling some relief: The Fed may finally be done lifting interest rates. Bonds could be one of the more attractive areas of financial markets in 2024 as yields across the bond market are near 20-year highs.
In previous economic cycles, an inverted yield curve, where shorter maturity bond yields are higher than longer maturity bond yields, would have been a harbinger of an imminent recession. Nearly 18 months after this cycle’s initial yield curve inversion, the U.S. economy has yet to enter recession. However, given the significant monetary policy intervention over the past 15 years, a surprisingly resilient U.S. consumer post-COVID and a limited timeframe to determine the impact of higher rates across several industries, it may be too early to tell whether the Fed has pulled off a “soft landing”, meaning slowing economic activity will reaccelerate rather than resulting in recession.
Whether the U.S. economy goes into recession or experiences a soft landing, fixed income portfolio managers believe positioning funds for yield curve normalization or steepening, where long-term Treasury yields are higher than short-term yields, may be appropriate. Managers think there’s a low probability of inflation reaccelerating which would make further Fed rate increases unlikely. Conversely, should economic data show broad deterioration, the Fed could consider lowering rates.
No matter whether the Fed holds rates at current levels in 2024 or even reduces rates, it’s important to note the end of a rate increase cycle has historically been an attractive time to own longer duration securities. Duration, which measures a bond’s sensitivity to interest rates, is a hallmark of bonds with longer maturities. As 2024 progresses, managers will be mindful of opportunities to add duration to portfolios.
Within securitized credit and corporates sectors, portfolio managers believe an active approach may be key to uncovering attractively valued opportunities, especially as some areas within these sectors can see conditions change quickly. Strong balance sheets and low refinancing needs make investment-grade corporate bonds a potential area of opportunity should economic growth remain modest in 2024. Similarly, managers think agency mortgage-backed securities (MBS) could bring an appealing risk-return profile given higher starting yields and their implicit government backing. However, managers feel the attractiveness of agency MBS is valuation sensitive and their active management may help uncover value if the market environment changes quickly.
High-yield bonds (those rated BB/Ba and lower by debt ratings agencies) could offer healthy income potential. Despite the rapid increase in rates during recent years, bond market investors have priced in only modest increases in high-yield corporate debt default rates in 2024. In the high-yield corporate debt sector, most issuers’ existing debt will not reach maturity until 2026 or beyond. Given higher interest rates, many companies with higher debt loads have turned to private credit for their more immediate funding needs. With this backdrop, portfolio managers believe selectivity will be key.
In municipal bonds, fundamentals appear solid despite an uncertain environment. State reserves are ample due to climbing corporate income and sales taxes along with greater household incomes. With the potential for a slower economic growth environment, managers remain cautious in 2024, with some maintaining a more defensive portfolio to potentially safeguard against any macroeconomic headwinds that may arise.
Cordially,

Chitrang Purani
President, Capital Group Core Bond ETF

David A. Hoag
President, Capital Group Core Plus Income ETF

Courtney K. Wolf
President, Capital Group Municipal Income ETF

Vincent J. Gonzales
President, Capital Group Short Duration Income ETF

Vikas Malhotra
President, Capital Group Short Duration Municipal Income ETF

Damien J. McCann
President, Capital Group U.S. Multi-Sector Income ETF
February 14, 2024
For current information about the fund, refer to capitalgroup.com.
Past results are not predictive of results in future periods.
| Capital Group Fixed Income ETF Trust | 3 |
Capital Group Core Bond ETF seeks to provide as high a level of current income as is consistent with the preservation of capital.
CGCB returned 6.84% on a market price bases and 6.56% on a net asset value (NAV) basis from inception (September 26, 2023) to the end of the fiscal year (December 31, 2023). The fund’s benchmark, the Bloomberg U.S. Aggregate Index, increased 6.63% over the same period. For the inception to fiscal year-end period, the fund paid a monthly dividend totaling approximately 25 cents a share.
Sector selection contributed positively to returns in excess of the fund’s benchmark, while curve positioning and security selection detracted from relative results. CGCB’s greater-than-benchmark investment in investment-grade corporate debt and securitized assets, particularly agency mortgage-backed securities (MBS), were the largest contributors to returns from a sector selection perspective. Meanwhile, selection within agency MBS resulted in the largest detraction from returns.
CGCB managers continue to seek high quality investments across a variety of bond sectors to pursue the fund’s investment objective. Given the market backdrop, managers are seeking a higher quality and balanced approach. The fund was about neutral duration relative to the benchmark at the end of the fiscal year. Managers believe the Fed may reduce interest rates in 2024, which has historically been a boon to longer-duration bonds and makes interest rate exposure relatively attractive over the medium term. However, managers expect market volatility will create opportunities to profit from shorter term duration positioning and will adjust accordingly. Managers see value in positioning along the yield curve, holding higher-than-benchmark exposure to shorter maturities (from two- to seven-year), which should benefit from expected Fed cuts in 2024. Managers have a lower exposure relative to the benchmark on the long end of the curve, from the 10-year to 30-year portion, which is less likely to benefit from rate cuts and could be negatively affected by elevated U.S. Treasury issuance to fund sustained high government deficits. Managers believe securitized assets, including agency MBS, offer a high-quality profile and minimal credit risk with attractive valuations relative to other sectors. The room for upside given valuations in corporate bonds appears to be limited, but we are leaning into security selection to unearth compelling opportunities.
Results at a glance
For periods ended December 31, 2023, with all distributions reinvested
| Cumulative total returns | ||||
| Lifetime (since 9/26/23) | ||||
| Capital Group Core Bond ETF | ||||
| Net asset value | 6.56 | % | ||
| Market price* | 6.84 | |||
| Bloomberg U.S. Aggregate Index† | 6.63 | |||
| * | ETF market price results since inception are calculated using NAV for the period until market price became available (generally a few days after inception). |
| † | Source: Bloomberg Index Services Ltd. Bloomberg U.S. Aggregate Index represents the U.S. investment-grade fixed-rate bond market. The market index is unmanaged and, therefore, has no expenses. Investors cannot invest directly in an index. |
Past results are not predictive of results in future periods.
| 4 | Capital Group Fixed Income ETF Trust |
Capital Group Core Plus Income ETF
Capital Group Core Plus Income ETF seeks to provide current income and maximum total return, consistent with preservation of capital.
The fund registered a total return of 7.19% on a market price basis and 7.25% on a NAV basis in 2023. The fund’s benchmark index, the Bloomberg U.S. Aggregate Index, a market value-weighted index that represents the U.S. investment-grade fixed-rate bond market, posted a 5.53% increase. For the fiscal year, the fund paid a monthly dividend totaling almost $1.13 a share.
CGCP’s investment in credit, particularly sector allocation and security selection, was additive to relative results in 2023. Managers’ security selection in investment-grade corporate, securitized credit (asset-backed securities and commercial mortgage-backed securities) and emerging markets debt benefitted the fund. Additionally, the fund’s active duration positioning contributed to results compared to the index. Meanwhile, CGCP’s managers positioned the portfolio for yield curve steepening in 2023 and, overall, the cost of carrying that position detracted from relative returns. Managers implemented this positioning to potentially provide some ballast in the portfolio should rates normalized or had a recession materialized.
CGCP’s portfolio managers are taking a balanced approach to portfolio construction across credit and interest rates with a goal of generating strong results in an environment of continued economic growth, while having positions in the portfolio that could help protect on the downside should a recession occur in the future. One example of more defensive-positioning is CGCP’s overweight position in agency mortgage-backed securities (MBS). Portfolio managers also see opportunities within securitized credit industries, such as automobile asset-backed securities and commercial mortgage-backed securities (CMBS), due to attractive valuations and favorable fundamentals. With the significant decline in interest rates in the fourth quarter, managers reduced duration to move back to an underweight position compared the benchmark. At the end of the fiscal year, managers maintained positioning for a steeper yield curve which they expect could do well across multiple scenarios. CGCP’s managers believe the yield curve may normalize, or steepen, from its current inverted posture. If the Fed were to cut rates, this positioning could provide ballast in the portfolio in the case of a risk-off (when investors prefer less growth-oriented investments) or recessionary environment or should interest rates rise significantly.
How a hypothetical $10,000 investment has grown
since fund’s inception on February 22, 2022 (with all distributions reinvested)
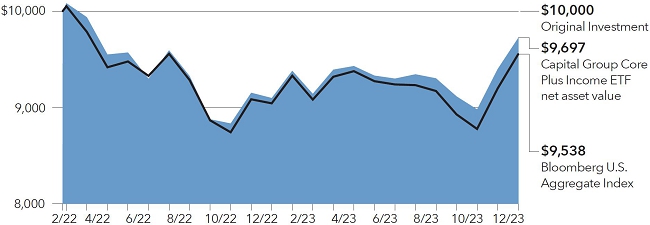
The results shown are before taxes on fund distributions and sale of fund shares.
| Capital Group Fixed Income ETF Trust | 5 |
Capital Group Core Plus Income ETF (continued)
Results at a glance
For periods ended December 31, 2023, with all distributions reinvested
| Cumulative total returns | Average annual | |||||||
| 1 Year | Lifetime (since 2/22/22) | |||||||
| Capital Group Core Plus Income ETF | ||||||||
| Net asset value | 7.25 | % | –1.65 | % | ||||
| Market price* | 7.19 | –1.56 | ||||||
| Bloomberg U.S. Aggregate Index† | 5.53 | –2.52 | ||||||
| * | ETF market price results since inception are calculated using NAV for the period until market price became available (generally a few days after inception). |
| † | Source: Bloomberg Index Services Ltd. Bloomberg U.S. Aggregate Index represents the U.S. investment-grade fixed-rate bond market. The market index is unmanaged and, therefore, has no expenses. Investors cannot invest directly in an index. |
Past results are not predictive of results in future periods.
| 6 | Capital Group Fixed Income ETF Trust |
Capital Group Municipal Income ETF
Capital Group Municipal Income ETF seeks to provide a high level of current income exempt from regular federal income tax, consistent with the preservation of capital.
CGMU returned of 6.76% on a market price basis and 6.78% at NAV for fiscal 2023. These returns outpaced the 5.57% total return of the fund’s benchmark index, the 85%/15% Bloomberg 1-15 Year Blend (1-17 Year) Municipal Bond Index/Bloomberg 1-15 Year Blend (1-17 Year) High Yield Municipal Bond Index. For the fiscal year, the fund paid a monthly dividend totaling approximately 84 cents a share.
Security selection and yield curve positioning were the largest contributors to results in 2023 compared to the benchmark. Corporates and general obligation issues were the two areas that managers added the most value from investment choice. The fund’s overweight position compared to the benchmark in long-term bonds in the 20- and 30-year maturities range were particularly additive to comparative results as these maturities experienced the largest decline in yields. Meanwhile, the fund’s duration positioning was a modest drag on relative returns, with duration positioning in housing sector bonds providing a notable headwind.
Despite the rally in bonds at the end of 2023, CGMU portfolio managers believe still-attractive tax-equivalent yields, solid credit fundamentals and investors moving out of cash and cash-like investments could help support strong demand for municipal bonds in 2024. On the heels of the Fed signaling the end of rate hikes in late 2023, managers are constructive on the potential for rate cuts by the Fed in 2024. As a result, CGMU maintained a longer than benchmark duration position. At the sector level, managers feel municipal single-family housing presents compelling valuations. In this area, bonds in the highest AAA-rated and AA-rated tranches offer similar yields to lower quality segments of the market. Managers are also finding what they believe are attractive opportunities in the tax-allocation and tax-assessment segments of the market.
How a hypothetical $10,000 investment has grown
since fund’s inception on October 25, 2022 (with all distributions reinvested)
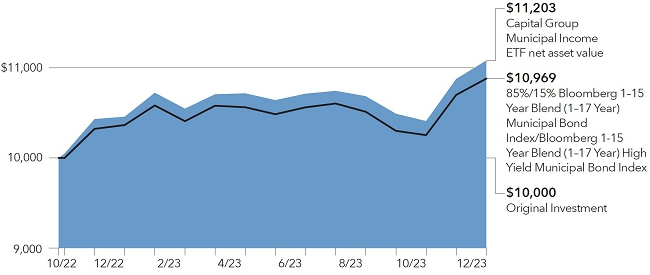
The results shown are before taxes on fund distributions and sale of fund shares.
| Capital Group Fixed Income ETF Trust | 7 |
Capital Group Municipal Income ETF (continued)
Results at a glance
For periods ended December 31, 2023, with all distributions reinvested
| Cumulative total returns | Average annual | |||||||
| 1 Year | Lifetime (since 10/25/22) | |||||||
| Capital Group Municipal Income ETF | ||||||||
| Net asset value | 6.78 | % | 10.07 | % | ||||
| Market price* | 6.76 | 10.34 | ||||||
| 85%/15% Bloomberg 1-15 Year Blend (1-17 Year) Municipal Bond Index/Bloomberg 1-15 Year Blend (1-17 Year) High Yield Municipal Bond Index† | 5.57 | 8.13 | ||||||
| * | ETF market price results since inception are calculated using NAV for the period until market price became available (generally a few days after inception). |
| † | Source: Bloomberg Index Services Ltd. 85%/15% Bloomberg 1-15 Year Blend (1-17) Municipal Bond Index/Bloomberg 1-15 Year Blend (1-17) High Yield Municipal Bond Index blends the Bloomberg 1-15 Year Blend (1-17) Municipal Bond Index with the Bloomberg 1-15 Year Blend (1-17) High Yield Municipal Bond Index by weighting their cumulative total returns at 85% and 15%, respectively. The blend is rebalanced monthly. Bloomberg 1-15 Year Blend (1-17) Municipal Bond Index consists of a broad selection of investment-grade general obligation and revenue bonds of maturities ranging from one year to 17 years. Bloomberg 1-15 Year Blend (1-17) High Yield Municipal Bond Index consists of a broad selection of below-investment-grade general obligation and revenue bonds of maturities ranging from one year to 17 years. The indexes are unmanaged, and results include reinvested distributions but do not reflect the effect of sales charges, commissions, account fees, expenses or U.S. federal income taxes. |
Past results are not predictive of results in future periods.
| 8 | Capital Group Fixed Income ETF Trust |
Capital Group Short Duration Income ETF
Capital Group Short Duration Income ETF seeks to provide current income, consistent with a short duration profile as described in the prospectus and with the preservation of capital.
In 2023, the fund recorded a total return of 5.01% on a market price basis and 5.14% on a net asset value (NAV), which surpassed the 4.61% increase of the fund’s benchmark index, the Bloomberg U.S. Government /Credit (1-3 years) Index. For the fiscal year, the fund paid a monthly dividend totaling almost $1.13 a share.
Credit sectors contributed most to absolute results, with asset-backed securities (ABS) and investment-grade industrial corporate bonds in particular driving returns. Auto-backed ABS was a significant contributor along with a mix of other ABS sectors including credit cards, shipping containers and personal and business loans. Short maturity investment-grade bonds had positive returns; industrials, financials and utilities bonds all contributed to 2023 returns. Managers maintained their view that the yield curve may steepen from the deep inversion points seen in mid-February and over the summer. The fund was long the front end of the yield curve (six-month, two-year and five-year maturities) and short the long end of the curve (10-year). Even though the curve was less inverted than the start of the year, curve positioning detracted. Additionally, a small position in Treasuries were a slight drag on relative returns.
At the end of 2023, the portfolio consisted of roughly 50% securitized credit and 50% investment-grade corporates, with a minimal allocation to Treasuries and cash & money market instruments. Portfolio managers continue to seek attractively valued investments in these sectors due to high yields – relative to the past decade – offered by high-quality issuers (those with investment-grade credit ratings of BBB/Baa & above). In investment-grade corporates, there is continued emphasis on idiosyncratic credit opportunities driven by fundamental research with a focus on yield. Managers have recently invested more in large money-center banks’ debt as spreads remained wide relative to other sectors. In securitized credit, the fund is diversified across the various areas of the market such as ABS, commercial mortgage-backed securities (CMBS), non-agency residential MBS and agency MBS. Outside of credit investments, the fund remains positioned to potentially benefit from a steepening of the U.S. Treasury yield curve. Given the current level of inversion, and a more dovish stance from the Federal Reserve (Fed), managers believe the curve will steepen rather than flatten. The curve inversion is one of the longest on record. Interest rate volatility remained elevated as market expectations of higher-for-longer rates quickly shifted to a focus on potential interest rate cuts and more accommodative policy. On the back of the large rally in rates from mid-October through December, managers reduced the fund’s duration from 2.3 years to 1.9 years. Managers will continue to monitor the market and may add to duration if yields move higher in the short term.
How a hypothetical $10,000 investment has grown
since fund’s inception on October 25, 2022 (with all distributions reinvested)
![]()
The results shown are before taxes on fund distributions and sale of fund shares.
| Capital Group Fixed Income ETF Trust | 9 |
Capital Group Short Duration Income ETF (continued)
Results at a glance
For periods ended December 31, 2023, with all distributions reinvested
| Cumulative total returns | Average annual | |||||||
| 1 Year | Lifetime (since 10/25/22) | |||||||
| Capital Group Short Duration Income ETF | ||||||||
| Net asset value | 5.14 | % | 5.85 | % | ||||
| Market price* | 5.01 | 5.98 | ||||||
| Bloomberg U.S. Government/Credit (1-3 years) Index† | 4.61 | 4.80 | ||||||
| * | ETF market price results since inception are calculated using NAV for the period until market price became available (generally a few days after inception). |
| † | Source: Bloomberg Index Services Ltd. Bloomberg 1-3 Year U.S. Government/Credit Index is a market-value weighted index that tracks the total return results of fixed-rate, publicly placed, dollar-denominated obligations issued by the U.S. Treasury, U.S. government agencies, quasi-federal corporations, corporate or foreign debt guaranteed by the U.S. government, and U.S. corporate and foreign debentures and secured notes that meet specified maturity, liquidity and quality requirements, with maturities of one to three years. This index is unmanaged, and its results include reinvested distributions but do not reflect the effect of sales charges, commissions, account fees, expenses or U.S. federal income taxes. |
Past results are not predictive of results in future periods.
| 10 | Capital Group Fixed Income ETF Trust |
Capital Group Short Duration Municipal Income ETF
Capital Group Short Duration Municipal Income ETF seeks to provide current income exempt from regular federal income tax, consistent with a short duration profile as described in the prospectus and with the preservation of capital.
In the inception (September 26, 2023) to fiscal year-end (December 31, 2023) period, the fund recorded a total return of 4.24% on a market price basis and 4.00% on a net asset value (NAV), which outpaced the 3.31% increase of the fund’s benchmark index, the Bloomberg Municipal Short 1-5 Years Index. For the fiscal year, the fund paid a monthly dividend totaling almost $0.22 a share.
Security selection and duration positioning were the two main drivers of excess returns for the period, with valuation/other factors a very modest relative detractor. Security selection in the education sector helped returns compared to the index as well as duration positioning in housing sector holdings. From an overall sector level, duration positioning and yield curve positioning in the general obligation sector was a notable detractor from relative returns.
CGSM’s managers believe the inverted municipal bond yield curve may offer compelling yield opportunities with less potential interest rate risk than longer duration strategies. Compared to the benchmark, CGSM had a longer relative duration position at the end of the fiscal year, as managers feel the Fed may reduce interest rates in 2024, which would benefit longer duration bonds.
Managers maintained a portfolio that was well-diversified across sectors at the end of the fiscal year. The fund had meaningfully less general obligation and escrowed (bonds issued to pay off an older bond’s payments until it matures) debt compared to the benchmark, while housing and corporates are areas of emphasis relative to the benchmark. Attractive valuations compared to other areas of the municipal market led housing to drive this above-benchmark investment The fund has flexibility to invest in municipal bonds subject to the alternative minimum tax (AMT) and managers are evaluating opportunities in this area in 2024, as some of these bonds look attractively valued compared to non-AMT bonds from the same issuer. Similarly, CGSM managers have employed the fund’s ability to invest in high-yield municipal bonds (bonds rated BB/Ba & below) to pursue the fund’s income objective.
Results at a glance
For periods ended December 31, 2023, with all distributions reinvested
| Cumulative total returns | ||||
| Lifetime (since 9/26/23) | ||||
| Capital Group Short Duration Municipal Income ETF | ||||
| Net asset value | 4.00 | % | ||
| Market price* | 4.24 | |||
| Bloomberg Municipal Short 1-5 Years Index† | 3.31 | |||
| * | ETF market price results since inception are calculated using NAV for the period until market price became available (generally a few days after inception). |
| † | Source: Bloomberg Index Services Ltd. Bloomberg Municipal Short 1-5 Years Index is a market-value-weighted index that includes investment-grade tax-exempt bonds with maturities of one to five years. This index is unmanaged, and its results include reinvested distributions but do not reflect the effect of sales charges, commissions, account fees, expenses or U.S. federal income taxes. |
Past results are not predictive of results in future periods.
| Capital Group Fixed Income ETF Trust | 11 |
Capital Group U.S. Multi-Sector Income ETF
Capital Group U.S. Multi-Sector Income ETF seeks to provide a high level of current income. Its secondary investment objective is capital appreciation.
The fund registered a total return of 11.49% on a market price basis and 11.39% on a NAV basis in 2023 surpassing the 5.53% total return of the fund’s benchmark index, the Bloomberg U.S. Aggregate Index, and the 9.98% total return of the Bloomberg Custom Multi-Sector Index, the fund’s secondary benchmark. For the fiscal year, the fund paid a monthly dividend totaling approximately $1.58 a share.
In 2023, security selection drove returns compared to the secondary benchmark, while sector and industry allocation decisions detracted from relative results. Investment selection in the securitized credit sector was the largest driver of excess returns, but this was partially offset by CGMS’s greater than secondary benchmark allocation. Security selection across the fund’s investment grade corporate holdings was also a meaningful contributor to returns relative to the secondary benchmark. The fund’s roughly neutral weighting to the sector relative to its secondary benchmark was also modestly additive to comparative returns. Less investment in high-yield corporate debt than the secondary benchmark was the largest detractor to total returns.
CGMS managers maintain a preference for higher-quality bonds as on a relative basis, investment-grade corporates, asset-backed securities (ABS) and commercial mortgage-backed securities (CMBS) are attractive. The high-yield market continues to trend up in quality as lower-quality issuers migrate to levered-loan and private credit markets. Portfolio managers maintain diversified exposure across numerous deeply researched investments. finding attractive opportunities among select high-yield issuers in the cable, pharmaceutical, automotive, media, aerospace, technology and energy sectors.
How a hypothetical $10,000 investment has grown
since fund’s inception on October 25, 2022 (with all distributions reinvested)
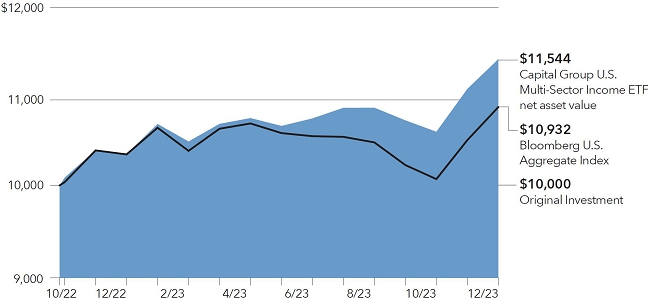
The results shown are before taxes on fund distributions and sale of fund shares.
| 12 | Capital Group Fixed Income ETF Trust |
Capital Group U.S. Multi-Sector Income ETF (continued)
Results at a glance
For periods ended December 31, 2023, with all distributions reinvested
| Cumulative total returns | Average annual | |||||||
| 1 Year | Lifetime (since 10/25/22) | |||||||
| Capital Group U.S. Multi-Sector Income ETF | ||||||||
| Net asset value | 11.39 | % | 12.90 | % | ||||
| Market price1 | 11.49 | 13.17 | ||||||
| Bloomberg U.S. Aggregate Index2 | 5.53 | 7.82 | ||||||
| Bloomberg Custom Multi-Sector Index3 | 9.98 | 11.21 | ||||||
| 1 | ETF market price results since inception are calculated using NAV for the period until market price became available (generally a few days after inception). |
| 2 | Source: Bloomberg Index Services Ltd. Bloomberg U.S. Aggregate Index represents the U.S. investment-grade fixed-rate bond market. The market index is unmanaged and, therefore, has no expenses. Investors cannot invest directly in an index. |
| 3 | Source: Bloomberg Index Services Ltd. Bloomberg Custom Multi-Sector Composite Index reflect the results of the Custom US CMBS ex AAA/US HY 2% Cap/ US ABS ex AAA/ US Corp Index from 06/01/2022 through 09/30/2023 and the Custom US CMBS Non-Agency ex AAA/US HY 2% Cap/ US ABS ex AAA/US Corp Index, thereafter. Bloomberg U.S. Corporate High Yield 2% Issuer Capped Index covers the universe of fixed-rate, non-investment-grade debt. The index limits the maximum exposure of any one issuer to 2%. Bloomberg U.S. Corporate Investment Grade Index represents the universe of investment-grade publicly issued U.S. corporate and specified foreign debentures and secured notes that meet the specified maturity, liquidity, and quality requirements. Bloomberg CMBS Non-Agency ex AAA Index represents the universe of U.S. commercial mortgage-backed securities, excluding issuers with credit ratings of AAA, the highest credit quality rating. Bloomberg Non-Agency CMBS ex AAA Index represents the universe of U.S. commercial mortgage-backed securities, excluding agency and issuers with credit ratings of AAA, the highest credit quality rating. Bloomberg ABS ex AAA Index represents the universe of U.S. asset-backed securities, excluding issuers with credit ratings of AAA, the highest credit quality rating. |
Past results are not predictive of results in future periods.
| Capital Group Fixed Income ETF Trust | 13 |
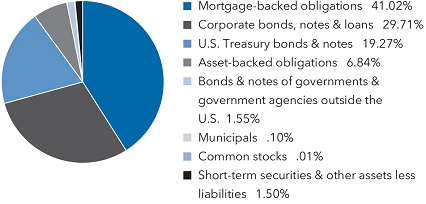
Investment portfolio December 31, 2023
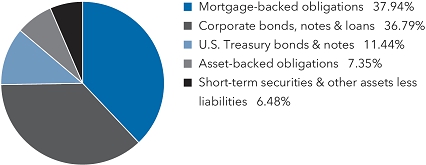
| Portfolio by type of security | Percent of net assets |
| Portfolio quality summary* | Percent of net assets | |||
| U.S. Treasury and agency† | 11.44 | % | ||
| AAA/Aaa | 41.60 | |||
| AA/Aa | 6.28 | |||
| A/A | 20.63 | |||
| BBB/Baa | 13.57 | |||
| Short-term securities & other assets less liabilities | 6.48 | |||
| * | Bond ratings, which typically range from AAA/Aaa (highest) to D (lowest), are assigned by credit rating agencies such as Standard & Poor’s, Moody’s and/or Fitch as an indication of an issuer’s creditworthiness. In assigning a credit rating to a security, the fund looks specifically to the ratings assigned to the issuer of the security by Standard & Poor’s, Moody’s and/or Fitch. If agency ratings differ, the security will be considered to have received the highest of those ratings, consistent with the fund’s investment policies. The ratings are not covered by the Report of Independent Registered Public Accounting Firm. |
| † | These securities are guaranteed by the full faith and credit of the U.S. government. |
| Bonds, notes & other debt instruments 93.52% | Principal amount (000) | Value (000) | ||||||
| Mortgage-backed obligations 37.94% | ||||||||
| Federal agency mortgage-backed obligations 34.72% | ||||||||
| Fannie Mae Pool #MA4562 2.00% 3/1/20521 | USD | 658 | $ | 538 | ||||
| Fannie Mae Pool #MA4623 2.50% 6/1/20521 | 1,181 | 1,005 | ||||||
| Fannie Mae Pool #MA4743 2.50% 8/1/20521 | 1,806 | 1,537 | ||||||
| Fannie Mae Pool #MA4768 2.50% 9/1/20521 | 2,348 | 1,998 | ||||||
| Fannie Mae Pool #MA4731 3.50% 9/1/20521 | 284 | 260 | ||||||
| Fannie Mae Pool #MA5071 5.00% 7/1/20531 | 1,529 | 1,513 | ||||||
| Fannie Mae Pool #MA5137 5.00% 9/1/20531 | 211 | 209 | ||||||
| Fannie Mae Pool #MA5163 4.50% 10/1/20531 | 1,026 | 995 | ||||||
| Freddie Mac Pool #SD8204 2.00% 4/1/20521 | 3,175 | 2,597 | ||||||
| Freddie Mac Pool #SD8234 2.50% 8/1/20521 | 165 | 140 | ||||||
| Freddie Mac Pool #SD8237 4.00% 8/1/20521 | 837 | 792 | ||||||
| Freddie Mac Pool #SD8242 3.00% 9/1/20521 | 2,696 | 2,387 | ||||||
| Freddie Mac Pool #SD8324 5.50% 5/1/20531 | 1,099 | 1,103 | ||||||
| Freddie Mac Pool #SD8388 3.50% 10/1/20531 | 1,034 | 949 | ||||||
| Freddie Mac Seasoned Loan Structured Transaction Trust, Series 20-3, Class AC, 2.00% 11/25/20301 | 274 | 237 | ||||||
| Freddie Mac Seasoned Loan Structured Transaction Trust, Series 21-1, Class AC, 2.25% 5/26/20311 | 274 | 242 | ||||||
| Freddie Mac Seasoned Loan Structured Transaction Trust, Series 21-2, Class AD, 2.00% 7/25/20311 | 294 | 255 | ||||||
| Freddie Mac Seasoned Loan Structured Transaction Trust, Series 20-2, Class AC, 2.00% 9/27/20601 | 278 | 241 | ||||||
| Uniform Mortgage-Backed Security 2.50% 1/1/20541,2 | 2,135 | 1,817 | ||||||
| Uniform Mortgage-Backed Security 3.00% 1/1/20541,2 | 2,620 | 2,318 | ||||||
| Uniform Mortgage-Backed Security 3.50% 1/1/20541,2 | 3,385 | 3,106 | ||||||
| Uniform Mortgage-Backed Security 4.00% 1/1/20541,2 | 2,950 | 2,790 | ||||||
| Uniform Mortgage-Backed Security 4.50% 1/1/20541,2 | 1,855 | 1,798 | ||||||
| Uniform Mortgage-Backed Security 5.00% 1/1/20541,2 | 220 | 218 | ||||||
| Uniform Mortgage-Backed Security 6.00% 1/1/20541,2 | 1,665 | 1,691 | ||||||
| Uniform Mortgage-Backed Security 6.50% 1/1/20541,2 | 1,675 | 1,717 | ||||||
| Uniform Mortgage-Backed Security 7.00% 1/1/20541,2 | 1,040 | 1,073 | ||||||
| 33,526 | ||||||||
| 14 | Capital Group Fixed Income ETF Trust |
Capital Group Core Bond ETF (continued)
| Bonds, notes & other debt instruments (continued) | Principal amount (000) | Value (000) | ||||||
| Mortgage-backed obligations (continued) | ||||||||
| Collateralized mortgage-backed obligations (privately originated) 2.03% | ||||||||
| Connecticut Avenue Securities Trust, Series 2022-R07, Class 1M1, (30-day Average USD-SOFR + 2.95%) 8.287% 6/25/20421,3 | USD | 115 | $ | 118 | ||||
| Connecticut Avenue Securities Trust, Series 2023-R01, Class 1M1, (30-day Average USD-SOFR + 2.40%) 7.737% 12/25/20421,3 | 300 | 306 | ||||||
| Connecticut Avenue Securities Trust, Series 2023-R04, Class 1M1, (30-day Average USD-SOFR + 2.30%) 7.637% 5/25/20431,3 | 449 | 459 | ||||||
| JPMorgan Mortgage Trust, Series 2017-1, Class B2, 3.45% 1/25/20471,3 | 449 | 403 | ||||||
| Legacy Mortgage Asset Trust, Series 2020-GS4, Class A1, 3.25% 2/25/20601,3 | 435 | 435 | ||||||
| Progress Residential Trust, Series 2023-SFR1, Class A, 4.30% 3/17/20401,3 | 249 | 239 | ||||||
| 1,960 | ||||||||
| Commercial mortgage-backed securities 1.19% | ||||||||
| AMSR Trust, Series 2023-SFR2, Class A, 3.95% 6/17/20401,3 | 160 | 151 | ||||||
| Bank Commercial Mortgage Trust, Series 2019-BN19, Class A3, 3.183% 8/15/20611 | 35 | 31 | ||||||
| Benchmark Mortgage Trust, Series 2018-B2, Class A5, 3.882% 2/15/20511 | 38 | 36 | ||||||
| Benchmark Mortgage Trust, Series 2022-B35, Class A5, 4.444% 5/15/20551 | 175 | 162 | ||||||
| Commercial Mortgage Trust, Series 2015-3BP, Class A, 3.178% 2/10/20351,3 | 225 | 214 | ||||||
| FS Commercial Trust, Series 2023-4SZN, Class A, 7.066% 11/10/20391,3 | 121 | 126 | ||||||
| MSWF Commercial Mortgage Trust, Series 2023-2, Class A5, 6.014% 12/15/20561 | 94 | 101 | ||||||
| MSWF Commercial Mortgage Trust, Series 2023-2, Class AS, 6.491% 12/15/20561 | 83 | 89 | ||||||
| SFO Commercial Mortgage Trust, Series 2021-555, Class A, (1-month USD CME Term SOFR + 1.264%) 6.63% 5/15/2038 (1-month USD CME Term SOFR + 1.514% on 5/15/2026)1,3,4 | 250 | 235 | ||||||
| 1,145 | ||||||||
| Total mortgage-backed obligations | 36,631 | |||||||
| Corporate bonds, notes & loans 36.79% | ||||||||
| Financials 22.14% | ||||||||
| American Express Co. 6.338% 10/30/2026 (USD-SOFR + 1.33% on 10/30/2025)4 | 149 | 152 | ||||||
| American International Group, Inc. 5.125% 3/27/2033 | 85 | 86 | ||||||
| Bank of America Corp. 2.551% 2/4/2028 (USD-SOFR + 1.05% on 2/4/2027)4 | 1,056 | 979 | ||||||
| Bank of America Corp. 3.974% 2/7/2030 (3-month USD CME Term SOFR + 1.472% on 2/7/2029)4 | 722 | 684 | ||||||
| Bank of New York Mellon Corp. 5.834% 10/25/2033 (USD-SOFR + 2.074% on 10/25/2032)4 | 256 | 272 | ||||||
| Bank of Nova Scotia (The) 5.25% 6/12/2028 | 279 | 283 | ||||||
| Blackstone Holdings Finance Co., LLC 6.20% 4/22/20333 | 96 | 103 | ||||||
| BNP Paribas SA 2.591% 1/20/2028 (USD-SOFR + 1.228% on 1/20/2027)3,4 | 535 | 495 | ||||||
| BPCE SA 2.045% 10/19/2027 (USD-SOFR + 1.087% on 10/19/2026)3,4 | 768 | 698 | ||||||
| CaixaBank, SA 6.208% 1/18/2029 (USD-SOFR + 2.70% on 1/18/2028)3,4 | 715 | 730 | ||||||
| Canadian Imperial Bank of Commerce 3.60% 4/7/2032 | 120 | 109 | ||||||
| Charles Schwab Corp. (The) 5.643% 5/19/2029 (USD-SOFR + 2.21% on 5/19/2028)4 | 195 | 200 | ||||||
| Charles Schwab Corp. (The) 6.196% 11/17/2029 (USD-SOFR + 1.878% on 11/17/2028)4 | 71 | 75 | ||||||
| Citigroup, Inc. 4.412% 3/31/2031 (USD-SOFR + 3.914% on 3/31/2030)4 | 560 | 536 | ||||||
| Danske Bank AS 4.298% 4/1/2028 (1-year UST Yield Curve Rate T Note Constant Maturity + 1.75% on 4/1/2027)3,4 | 520 | 504 | ||||||
| Deutsche Bank AG 2.311% 11/16/2027 (USD-SOFR + 1.219% on 11/16/2026)4 | 407 | 372 | ||||||
| Deutsche Bank AG 6.819% 11/20/2029 (USD-SOFR + 2.51% on 11/20/2028)4 | 197 | 208 | ||||||
| DNB Bank ASA 1.535% 5/25/2027 (5-year UST Yield Curve Rate T Note Constant Maturity + 0.72% on 5/25/2026)3,4 | 826 | 754 | ||||||
| Fifth Third Bancorp 6.339% 7/27/2029 (USD-SOFR + 2.34% on 7/27/2028)4 | 252 | 262 | ||||||
| Five Corners Funding Trust III 5.791% 2/15/20333 | 186 | 198 | ||||||
| Goldman Sachs Group, Inc. 4.223% 5/1/2029 (3-month USD CME Term SOFR + 1.563% on 5/1/2028)4 | 673 | 651 | ||||||
| HSBC Holdings PLC 4.583% 6/19/2029 (3-month USD CME Term SOFR + 1.796% on 6/19/2028)4 | 550 | 534 | ||||||
| Intercontinental Exchange, Inc. 4.60% 3/15/2033 | 67 | 67 | ||||||
| JPMorgan Chase & Co. 6.07% 10/22/2027 (USD-SOFR + 1.33% on 10/22/2026)4 | 164 | 169 | ||||||
| JPMorgan Chase & Co. 4.203% 7/23/2029 (3-month USD CME Term SOFR + 1.522% on 7/23/2028)4 | 1,073 | 1,043 | ||||||
| Capital Group Fixed Income ETF Trust | 15 |
Capital Group Core Bond ETF (continued)
| Bonds, notes & other debt instruments (continued) | Principal amount (000) | Value (000) | ||||||
| Corporate bonds, notes & loans (continued) | ||||||||
| Financials (continued) | ||||||||
| KBC Groep NV 5.796% 1/19/2029 (1-year UST Yield Curve Rate T Note Constant Maturity + 2.10% on 1/19/2028)3,4 | USD | 620 | $ | 631 | ||||
| Lloyds Banking Group PLC 5.871% 3/6/2029 (1-year UST Yield Curve Rate T Note Constant Maturity + 1.70% on 3/6/2028)4 | 466 | 478 | ||||||
| Metropolitan Life Global Funding I 5.15% 3/28/20333 | 338 | 344 | ||||||
| Mitsubishi UFJ Financial Group, Inc. 5.422% 2/22/2029 (1-year UST Yield Curve Rate T Note Constant Maturity + 1.38% on 2/22/2028)4 | 896 | 913 | ||||||
| Mizuho Financial Group, Inc. 1.234% 5/22/2027 (1-year UST Yield Curve Rate T Note Constant Maturity + 0.67% on 5/22/2026)4 | 676 | 616 | ||||||
| Morgan Stanley 5.123% 2/1/2029 (USD-SOFR + 1.73% on 2/1/2028)4 | 1,402 | 1,409 | ||||||
| Nasdaq, Inc. 5.35% 6/28/2028 | 287 | 296 | ||||||
| NatWest Group PLC 5.076% 1/27/2030 (3-month USD-LIBOR + 1.905% on 1/27/2029)4 | 653 | 644 | ||||||
| New York Life Global Funding 4.55% 1/28/20333 | 127 | 125 | ||||||
| Northwestern Mutual Life Insurance Co. (The) 4.90% 6/12/20283 | 219 | 220 | ||||||
| PNC Financial Services Group, Inc. 6.615% 10/20/2027 (USD-SOFR + 1.73% on 10/20/2026)4 | 108 | 112 | ||||||
| PNC Financial Services Group, Inc. 5.582% 6/12/2029 (USD-SOFR + 1.841% on 6/12/2028)4 | 431 | 441 | ||||||
| Royal Bank of Canada 5.20% 8/1/2028 | 276 | 282 | ||||||
| State Street Corp. 5.159% 5/18/2034 (USD-SOFR + 1.89% on 5/18/2033)4 | 147 | 148 | ||||||
| Sumitomo Mitsui Financial Group, Inc. 1.902% 9/17/2028 | 622 | 545 | ||||||
| Svenska Handelsbanken AB 5.50% 6/15/20283 | 645 | 657 | ||||||
| Toronto-Dominion Bank (The) 5.523% 7/17/2028 | 279 | 287 | ||||||
| U.S. Bancorp 4.653% 2/1/2029 (USD-SOFR + 1.23% on 2/1/2028)4 | 514 | 506 | ||||||
| UBS Group AG 9.016% 11/15/2033 (USD-SOFR + 5.02% on 11/15/2032)3,4 | 763 | 939 | ||||||
| Wells Fargo & Co. 5.574% 7/25/2029 (USD-SOFR + 1.74% on 7/25/2028)4 | 1,434 | 1,465 | ||||||
| Westpac Banking Corp. 4.11% 7/24/2034 (5-year UST Yield Curve Rate T Note Constant Maturity + 2.00% on 7/24/2029)4 | 174 | 159 | ||||||
| 21,381 | ||||||||
| Health care 3.10% | ||||||||
| Amgen, Inc. 5.25% 3/2/2033 | 605 | 621 | ||||||
| Baxter International, Inc. 2.272% 12/1/2028 | 782 | 700 | ||||||
| Cencora, Inc. 2.70% 3/15/2031 | 123 | 108 | ||||||
| Centene Corp. 2.45% 7/15/2028 | 315 | 281 | ||||||
| CVS Health Corp. 4.30% 3/25/2028 | 642 | 632 | ||||||
| Elevance Health, Inc. 4.75% 2/15/2033 | 75 | 75 | ||||||
| Eli Lilly and Co. 4.70% 2/27/2033 | 73 | 75 | ||||||
| GE HealthCare Technologies, Inc. 5.857% 3/15/2030 | 303 | 318 | ||||||
| Pfizer Investment Enterprises Pte., Ltd. 4.75% 5/19/2033 | 181 | 181 | ||||||
| 2,991 | ||||||||
| Communication services 2.54% | ||||||||
| AT&T, Inc. 4.30% 2/15/2030 | 727 | 712 | ||||||
| Charter Communications Operating, LLC 6.384% 10/23/2035 | 431 | 438 | ||||||
| Netflix, Inc. 4.875% 4/15/2028 | 253 | 256 | ||||||
| T-Mobile USA, Inc. 3.875% 4/15/2030 | 552 | 524 | ||||||
| Verizon Communications, Inc. 4.329% 9/21/2028 | 533 | 528 | ||||||
| 2,458 | ||||||||
| Utilities 2.24% | ||||||||
| Edison International 4.125% 3/15/2028 | 393 | 380 | ||||||
| FirstEnergy Corp. 2.65% 3/1/2030 | 342 | 296 | ||||||
| Georgia Power Co. 4.95% 5/17/2033 | 303 | 306 | ||||||
| Pacific Gas and Electric Co. 4.55% 7/1/2030 | 924 | 881 | ||||||
| Southern California Edison Co. 2.95% 2/1/2051 | 322 | 219 | ||||||
| Xcel Energy, Inc. 5.45% 8/15/2033 | 83 | 85 | ||||||
| 2,167 | ||||||||
| 16 | Capital Group Fixed Income ETF Trust |
Capital Group Core Bond ETF (continued)
| Bonds, notes & other debt instruments (continued) | Principal amount (000) | Value (000) | ||||||
| Corporate bonds, notes & loans (continued) | ||||||||
| Energy 2.15% | ||||||||
| Columbia Pipelines Operating Co., LLC 5.927% 8/15/20303 | USD | 155 | $ | 160 | ||||
| Enbridge, Inc. 6.20% 11/15/2030 | 506 | 542 | ||||||
| Energy Transfer, LP 6.40% 12/1/2030 | 306 | 328 | ||||||
| EQT Corp. 5.70% 4/1/2028 | 223 | 226 | ||||||
| Kinder Morgan, Inc. 7.75% 1/15/2032 | 136 | 155 | ||||||
| ONEOK, Inc. 5.65% 11/1/2028 | 639 | 662 | ||||||
| 2,073 | ||||||||
| Consumer staples 1.38% | ||||||||
| BAT Capital Corp. 6.343% 8/2/2030 | 636 | 668 | ||||||
| Constellation Brands, Inc. 2.875% 5/1/2030 | 126 | 113 | ||||||
| Philip Morris International, Inc. 5.625% 11/17/2029 | 530 | 556 | ||||||
| 1,337 | ||||||||
| Industrials 0.90% | ||||||||
| Boeing Co. 5.04% 5/1/2027 | 702 | 709 | ||||||
| Carrier Global Corp. 2.722% 2/15/2030 | 9 | 8 | ||||||
| Carrier Global Corp. 2.70% 2/15/2031 | 6 | 5 | ||||||
| Carrier Global Corp. 5.90% 3/15/20343 | 139 | 150 | ||||||
| 872 | ||||||||
| Consumer discretionary 0.84% | ||||||||
| Daimler Trucks Finance North America, LLC 2.375% 12/14/20283 | 211 | 188 | ||||||
| Ford Motor Co. 3.25% 2/12/2032 | 235 | 196 | ||||||
| Hyundai Capital America 6.25% 11/3/20253 | 417 | 423 | ||||||
| 807 | ||||||||
| Real estate 0.82% | ||||||||
| Equinix, Inc. 3.20% 11/18/2029 | 232 | 213 | ||||||
| Prologis, LP 4.75% 6/15/2033 | 123 | 125 | ||||||
| Public Storage Operating Co. 5.125% 1/15/2029 | 220 | 227 | ||||||
| VICI Properties, LP 4.95% 2/15/2030 | 231 | 225 | ||||||
| 790 | ||||||||
| Information technology 0.68% | ||||||||
| Analog Devices, Inc. 2.10% 10/1/2031 | 79 | 68 | ||||||
| Broadcom, Inc. 3.469% 4/15/20343 | 371 | 323 | ||||||
| ServiceNow, Inc. 1.40% 9/1/2030 | 320 | 263 | ||||||
| 654 | ||||||||
| Total corporate bonds, notes & loans | 35,530 | |||||||
| U.S. Treasury bonds & notes 11.44% | ||||||||
| U.S. Treasury 11.44% | ||||||||
| U.S. Treasury 4.875% 10/31/2028 | 596 | 622 | ||||||
| U.S. Treasury 4.375% 11/30/2030 | 865 | 890 | ||||||
| U.S. Treasury 4.50% 11/15/2033 | 425 | 447 | ||||||
| U.S. Treasury 4.375% 8/15/2043 | 1,290 | 1,319 | ||||||
| U.S. Treasury 4.75% 11/15/2043 | 2,046 | 2,199 | ||||||
| U.S. Treasury 4.125% 8/15/20535 | 3,350 | 3,395 | ||||||
| U.S. Treasury 4.75% 11/15/2053 | 1,935 | 2,176 | ||||||
| 11,048 | ||||||||
| Asset-backed obligations 7.35% | ||||||||
| ACHV ABS Trust, Series 2023-3PL, Class B, 7.17% 8/19/20301,3 | 300 | 300 | ||||||
| ACHV ABS Trust, Series 2023-4CP, Class A, 6.81% 11/25/20301,3 | 84 | 85 | ||||||
| Affirm Asset Securitization Trust, Series 2022-X1, Class A, 1.75% 2/15/20271,3 | 122 | 120 | ||||||
| Affirm, Inc., Series 2023-B, Class A, 6.82% 9/15/20281,3 | 150 | 152 | ||||||
| Affirm, Inc., Series 2023-X1, Class A, 7.11% 11/15/20281,3 | 100 | 100 | ||||||
| Ally Auto Receivables Trust, Series 2023, Class A2, 6.15% 1/17/20341,3 | 135 | 135 | ||||||
| Apidos CLO, Ltd., Series 2015-23, Class AR, (3-month USD CME Term SOFR + 1.482%) 6.875% 4/15/20331,3 | 275 | 275 | ||||||
| Capital Group Fixed Income ETF Trust | 17 |
Capital Group Core Bond ETF (continued)
| Bonds, notes & other debt instruments (continued) | Principal amount (000) | Value (000) | ||||||
| Asset-backed obligations (continued) | ||||||||
| Avis Budget Rental Car Funding (AESOP), LLC, Series 2020-1A, Class A, 2.33% 8/20/20261,3 | USD | 100 | $ | 96 | ||||
| Avis Budget Rental Car Funding (AESOP), LLC, Series 2023-8, Class A, 6.02% 2/20/20301,3 | 150 | 155 | ||||||
| Bain Capital Credit CLO, Ltd., Series 2017-2, Class AR2, (3-month USD CME Term SOFR + 1.442%) 6.82% 7/25/20341,3 | 275 | 275 | ||||||
| Bankers Healthcare Group Securitization Trust, Series 2021-A, Class A, 1.42% 11/17/20331,3 | 211 | 199 | ||||||
| Bankers Healthcare Group Securitization Trust, Series 2022-A, Class A, 1.71% 2/20/20351,3 | 122 | 119 | ||||||
| Bridgecrest Lending Auto Securitization Trust, Series 2023-1, Class A3, 6.51% 11/15/20271 | 79 | 80 | ||||||
| Carvana Auto Receivables Trust, Series 2023-N4, Class A, 6.42% 1/10/20281,3 | 218 | 219 | ||||||
| CF Hippolyta, LLC, Series 2020-1, Class A1, 1.69% 7/15/20601,3 | 90 | 83 | ||||||
| CF Hippolyta, LLC, Series 2021-1, Class A1, 1.53% 3/15/20611,3 | 150 | 134 | ||||||
| Citizens Auto Receivables Trust, Series 2023-2, Class A4, 5.74% 10/15/20301,3 | 150 | 153 | ||||||
| CLI Funding VI, LLC, Series 2020-3A, Class A, 2.07% 10/18/20451,3 | 138 | 124 | ||||||
| CLI Funding VIII, LLC, Series 2022-1, Class A, 2.72% 1/18/20471,3 | 201 | 178 | ||||||
| CPS Auto Receivables Trust, Series 2023-C, Class A, 6.13% 9/15/20261,3 | 126 | 126 | ||||||
| CPS Auto Receivables Trust, Series 2023-A, Class B, 5.47% 11/16/20261,3 | 150 | 149 | ||||||
| CPS Auto Trust, Series 2023-D, Class A, 6.40% 6/15/20271,3 | 89 | 90 | ||||||
| Dryden Senior Loan Fund, CLO, Series 2021-93, Class A1A, (3-month USD CME Term SOFR + 1.342%) 6.735% 1/15/20341,3 | 275 | 275 | ||||||
| Exeter Automobile Receivables Trust, Series 2023-5, Class A3, 6.32% 3/15/20271 | 34 | 34 | ||||||
| Exeter Automobile Receivables Trust, Series 2023-5, Class B, 6.58% 4/17/20281 | 101 | 102 | ||||||
| First National Master Note Trust, Series 2023-2, Class A, 5.77% 9/17/20291 | 150 | 153 | ||||||
| Ford Credit Auto Owner Trust, Series 2023-B, Class A4, 5.06% 2/15/20291 | 100 | 101 | ||||||
| Ford Credit Auto Owner Trust, Series 2023-1, Class A, 4.85% 8/15/20351,3 | 150 | 151 | ||||||
| Global SC Finance V SRL, Series 2020-1A, Class A, 2.17% 10/17/20401,3 | 159 | 147 | ||||||
| Global SC Finance VII SRL, Series 2020-2A, Class A, 2.26% 11/19/20401,3 | 161 | 148 | ||||||
| Global SC Finance VII SRL, Series 2021-1A, Class A, 1.86% 4/17/20411,3 | 179 | 160 | ||||||
| GLS Auto Receivables Trust, Series 2023-4, Class A3, 6.42% 6/15/20271,3 | 96 | 97 | ||||||
| GM Financial Revolving Receivables Trust, Series 2023-2, Class A, 5.77% 8/11/20361,3 | 312 | 326 | ||||||
| Hertz Vehicle Financing III, LLC, Series 2021-2A, Class A, 1.68% 12/27/20271,3 | 250 | 227 | ||||||
| Hertz Vehicle Financing III, LLC, Series 2021-2A, Class B, 2.12% 12/27/20271,3 | 150 | 136 | ||||||
| Hertz Vehicle Financing III, LLC, Series 2023-4, Class A, 6.15% 3/25/20301,3 | 150 | 156 | ||||||
| LAD Auto Receivables Trust, Series 2023-4, Class A3, 6.10% 12/15/20271,3 | 33 | 33 | ||||||
| LAD Auto Receivables Trust, Series 2023-2, Class A3, 5.42% 2/15/20281,3 | 250 | 250 | ||||||
| Mercedes-Benz Auto Receivables Trust, Series 2023-2, Class A3, 5.95% 11/15/20281 | 75 | 77 | ||||||
| PFS Financing Corp., Series 2022-D, Class B, 4.90% 8/16/20271,3 | 100 | 98 | ||||||
| PFS Financing Corp., Series 2023-A, Class A, 5.80% 3/15/20281,3 | 150 | 152 | ||||||
| TAL Advantage V, LLC, Series 2020-1A, Class A, 2.05% 9/20/20451,3 | 329 | 299 | ||||||
| TICP CLO, Ltd., Series 2018-12, Class AR, (3-month USD CME Term SOFR + 1.432%) 6.825% 7/15/20341,3 | 275 | 275 | ||||||
| TIF Funding II, LLC, Series 2021-1A, Class A, 1.65% 2/20/20461,3 | 335 | 288 | ||||||
| Westlake Automobile Receivables Trust, Series 2023-4, Class A3, 6.24% 7/15/20271,3 | 62 | 63 | ||||||
| 7,095 | ||||||||
| Total bonds, notes & other debt instruments (cost: $87,343,000) | 90,304 | |||||||
| Short-term securities 16.85% | Shares | |||||||
| Money market investments 16.85% | ||||||||
| Capital Group Central Cash Fund 5.44%6,7 | 162,772 | 16,276 | ||||||
| Total short-term securities (cost: $16,278,000) | 16,276 | |||||||
| Total investment securities 110.37% (cost: $103,621,000) | 106,580 | |||||||
| Other assets less liabilities (10.37)% | (10,015 | ) | ||||||
| Net assets 100.00% | $ | 96,565 | ||||||
| 18 | Capital Group Fixed Income ETF Trust |
Capital Group Core Bond ETF (continued)
Futures contracts
| Contracts | Type | Number of contracts | Expiration date | Notional amount (000) | Value and unrealized appreciation (depreciation) at 12/31/2023 (000) | |||||||||||
| 2 Year U.S. Treasury Note Futures | Long | 19 | 3/28/2024 | USD | 3,912 | $ | — | 8 | ||||||||
Swap contracts
Interest rate swaps
Centrally cleared interest rate swaps
| Upfront | Unrealized | ||||||||||||||||||||||||
| premium | appreciation | ||||||||||||||||||||||||
| Receive | Pay | Notional | Value at | paid | (depreciation) | ||||||||||||||||||||
| Payment | Payment | Expiration | amount | 12/31/2023 | (received) | at 12/31/2023 | |||||||||||||||||||
| Rate | frequency | Rate | frequency | date | (000) | (000) | (000) | (000) | |||||||||||||||||
| 5.0135% | Annual | SOFR | Annual | 9/28/2025 | USD 5,300 | $ | 69 | $ | — | $ | 69 | ||||||||||||||
| 4.9295% | Annual | SOFR | Annual | 10/30/2025 | 3,750 | 49 | — | 49 | |||||||||||||||||
| 4.9225% | Annual | SOFR | Annual | 11/1/2025 | 2,900 | 38 | — | 38 | |||||||||||||||||
| 4.695% | Annual | SOFR | Annual | 11/24/2025 | 1,850 | 18 | — | 18 | |||||||||||||||||
| 4.525% | Annual | SOFR | Annual | 12/13/2025 | 1,700 | 13 | — | 13 | |||||||||||||||||
| 4.152% | Annual | SOFR | Annual | 12/18/2025 | 400 | — | 8 | — | — | 8 | |||||||||||||||
| SOFR | Annual | 4.2365% | Annual | 12/21/2025 | 2,300 | (6 | ) | — | (6 | ) | |||||||||||||||
| 4.129% | Annual | SOFR | Annual | 12/26/2025 | 1,600 | 1 | — | 1 | |||||||||||||||||
| 4.8815% | Annual | SOFR | Annual | 10/23/2026 | 750 | 21 | — | 21 | |||||||||||||||||
| 4.707% | Annual | SOFR | Annual | 10/23/2028 | 370 | 19 | — | 19 | |||||||||||||||||
| 4.5465% | Annual | SOFR | Annual | 10/19/2030 | 775 | 50 | — | 50 | |||||||||||||||||
| 4.074% | Annual | SOFR | Annual | 11/27/2030 | 1,000 | 36 | — | 36 | |||||||||||||||||
| SOFR | Annual | 3.762 | Annual | 12/11/2030 | 640 | (11 | ) | — | (11 | ) | |||||||||||||||
| 3.8815% | Annual | SOFR | Annual | 12/13/2030 | 700 | 17 | — | 17 | |||||||||||||||||
| SOFR | Annual | 3.78 | Annual | 12/15/2033 | 1,725 | (45 | ) | — | (45 | ) | |||||||||||||||
| 4.5145% | Annual | SOFR | Annual | 10/19/2038 | 580 | 68 | — | 68 | |||||||||||||||||
| 3.482% | Annual | SOFR | Annual | 1/2/2039 | 750 | (1 | ) | — | (1 | ) | |||||||||||||||
| 4.5535% | Annual | SOFR | Annual | 10/23/2043 | 870 | 133 | — | 133 | |||||||||||||||||
| 3.588% | Annual | SOFR | Annual | 12/11/2053 | 460 | 24 | — | 24 | |||||||||||||||||
| $ | 493 | $ | — | $ | 493 | ||||||||||||||||||||
Credit default swaps
Centrally cleared credit default swaps on credit indices — sell protection
| Financing rate received | Payment frequency | Reference index | Expiration date | Notional amount (000) | Value at 12/31/2023 (000) | Upfront premium paid (received) (000) | Unrealized appreciation (depreciation) at 12/31/2023 (000) | |||||||||||
| 1% | Quarterly | CDX.NA.IG.41 | 12/20/2028 | USD 575 | $11 | $4 | $7 | |||||||||||
Investments in affiliates7
| Value at 9/26/20239 (000) | Additions (000) | Reductions (000) | Net realized gain (loss) (000) | Net unrealized appreciation (depreciation) (000) | Value at 12/31/2023 (000) | Dividend or interest income (000) | ||||||||||||||||||||||
| Short-term securities 16.85% | ||||||||||||||||||||||||||||
| Money market investments 16.85% | ||||||||||||||||||||||||||||
| Capital Group Central Cash Fund 5.44%6 | $ | — | $ | 39,371 | $ | 23,093 | $ | — | 8 | $ | (2 | ) | $ | 16,276 | $ | 104 | ||||||||||||
| Capital Group Fixed Income ETF Trust | 19 |
Capital Group Core Bond ETF (continued)
| 1 | Principal payments may be made periodically. Therefore, the effective maturity date may be earlier than the stated maturity date. |
| 2 | Purchased on a TBA basis. |
| 3 | Acquired in a transaction exempt from registration under Rule 144A or, for commercial paper, Section 4(a)(2) of the Securities Act of 1933. May be resold in the U.S. in transactions exempt from registration, normally to qualified institutional buyers. The total value of all such securities was $16,876,000, which represented 17.48% of the net assets of the fund. |
| 4 | Step bond; coupon rate may change at a later date. |
| 5 | All or a portion of this security was pledged as collateral. The total value of pledged collateral was $474,000, which represented .49% of the net assets of the fund. |
| 6 | Rate represents the seven-day yield at December 31, 2023. |
| 7 | Part of the same “group of investment companies” as the fund as defined under the Investment Company Act of 1940, as amended. |
| 8 | Amount less than one thousand. |
| 9 | Commencement of operations. |
Key to abbreviation(s)
CLO = Collateralized Loan Obligations
CME = CME Group
LIBOR = London Interbank Offered Rate
SOFR = Secured Overnight Financing Rate
TBA = To-be-announced
USD = U.S. dollars
Refer to the notes to financial statements.
| 20 | Capital Group Fixed Income ETF Trust |
Capital Group Core Plus Income ETF
Investment portfolio December 31, 2023
| Portfolio by type of security | Percent of net assets |
| Portfolio quality summary* | Percent of net assets | |||
| U.S. Treasury and agency† | 19.27 | % | ||
| AAA/Aaa | 31.46 | |||
| AA/Aa | 5.43 | |||
| A/A | 10.41 | |||
| BBB/Baa | 16.96 | |||
| Below investment grade | 14.96 | |||
| Unrated | .01 | |||
| Short-term securities & other assets less liabilities | 1.50 | |||
| * | Bond ratings, which typically range from AAA/Aaa (highest) to D (lowest), are assigned by credit rating agencies such as Standard & Poor’s, Moody’s and/or Fitch as an indication of an issuer’s creditworthiness. In assigning a credit rating to a security, the fund looks specifically to the ratings assigned to the issuer of the security by Standard & Poor’s, Moody’s and/or Fitch. If agency ratings differ, the security will be considered to have received the highest of those ratings, consistent with the fund’s investment policies. Securities in the “unrated” category (above) have not been rated by a rating agency; however, the investment adviser performs its own credit analysis and assigns comparable ratings that are used for compliance with the fund’s investment policies. The ratings are not covered by the Report of Independent Registered Public Accounting Firm. |
| † | These securities are guaranteed by the full faith and credit of the U.S. government. |
| Bonds, notes & other debt instruments 98.49% | Principal amount (000) | Value (000) | ||||||
| Mortgage-backed obligations 41.02% | ||||||||
| Federal agency mortgage-backed obligations 30.47% | ||||||||
| Fannie Mae Pool #FS0647 3.00% 2/1/20521 | USD | 3,960 | $ | 3,574 | ||||
| Fannie Mae Pool #FS0893 3.00% 2/1/20521 | 809 | 716 | ||||||
| Fannie Mae Pool #FS1030 3.00% 3/1/20521 | 892 | 790 | ||||||
| Fannie Mae Pool #BV3117 3.00% 3/1/20521 | 750 | 664 | ||||||
| Fannie Mae Pool #BV2954 3.00% 3/1/20521 | 736 | 652 | ||||||
| Fannie Mae Pool #FS1405 3.00% 4/1/20521 | 768 | 680 | ||||||
| Fannie Mae Pool #BU8933 3.00% 4/1/20521 | 757 | 670 | ||||||
| Fannie Mae Pool #CB3361 3.00% 4/1/20521 | 724 | 646 | ||||||
| Fannie Mae Pool #CB3586 3.00% 5/1/20521 | 2,680 | 2,372 | ||||||
| Fannie Mae Pool #MA4919 5.50% 2/1/20531 | 1,609 | 1,617 | ||||||
| Fannie Mae Pool #MA5010 5.50% 5/1/20531 | 274 | 275 | ||||||
| Fannie Mae Pool #MA5072 5.50% 7/1/20531 | 2,055 | 2,065 | ||||||
| Fannie Mae Pool #MA5165 5.50% 10/1/20531 | 480 | 482 | ||||||
| Freddie Mac Pool #QC3826 3.00% 7/1/20511 | 978 | 866 | ||||||
| Freddie Mac Pool #QD5662 3.00% 1/1/20521 | 977 | 865 | ||||||
| Freddie Mac Pool #QD7819 3.00% 2/1/20521 | 852 | 754 | ||||||
| Freddie Mac Pool #QD7918 3.00% 3/1/20521 | 862 | 763 | ||||||
| Freddie Mac Pool #QD8673 3.00% 3/1/20521 | 806 | 713 | ||||||
| Freddie Mac Pool #SD8206 3.00% 4/1/20521 | 890 | 788 | ||||||
| Freddie Mac Pool #SD1156 3.00% 4/1/20521 | 882 | 780 | ||||||
| Freddie Mac Pool #RA7130 3.00% 4/1/20521 | 837 | 741 | ||||||
| Freddie Mac Pool #QE5301 3.50% 5/1/20521 | 707 | 648 | ||||||
| Freddie Mac Pool #QE8663 3.50% 5/1/20521 | 555 | 509 | ||||||
| Freddie Mac Pool #SD8214 3.50% 5/1/20521 | 36 | 33 | ||||||
| Freddie Mac Pool #QE4383 4.00% 6/1/20521 | 787 | 744 | ||||||
| Freddie Mac Pool #SD8331 5.50% 6/1/20531 | 3,935 | 3,952 | ||||||
| Capital Group Fixed Income ETF Trust | 21 |
Capital Group Core Plus Income ETF (continued)
| Bonds, notes & other debt instruments (continued) | Principal amount (000) | Value (000) | ||||||
| Mortgage-backed obligations (continued) | ||||||||
| Federal agency mortgage-backed obligations (continued) | ||||||||
| Freddie Mac Pool #SD8342 5.50% 6/1/20531 | USD | 2,217 | $ | 2,226 | ||||
| Freddie Mac Pool #SD8362 5.50% 9/1/20531 | 1,393 | 1,399 | ||||||
| Freddie Mac Pool #SD8367 5.50% 10/1/20531 | 1,763 | 1,771 | ||||||
| Freddie Mac Pool #SD8372 5.50% 11/1/20531 | 6,175 | 6,201 | ||||||
| Government National Mortgage Assn. Pool #MA8266 3.50% 9/20/20521 | 5,435 | 5,060 | ||||||
| Uniform Mortgage-Backed Security 2.00% 1/1/20541,2 | 24,310 | 19,874 | ||||||
| Uniform Mortgage-Backed Security 2.50% 1/1/20541,2 | 50,170 | 42,688 | ||||||
| Uniform Mortgage-Backed Security 3.00% 1/1/20541,2 | 31,889 | 28,213 | ||||||
| Uniform Mortgage-Backed Security 3.50% 1/1/20541,2 | 14,873 | 13,646 | ||||||
| Uniform Mortgage-Backed Security 4.00% 1/1/20541,2 | 43,291 | 40,949 | ||||||
| Uniform Mortgage-Backed Security 4.50% 1/1/20541,2 | 68,884 | 66,780 | ||||||
| Uniform Mortgage-Backed Security 5.00% 1/1/20541,2 | 60,362 | 59,725 | ||||||
| Uniform Mortgage-Backed Security 5.50% 1/1/20541,2 | 34,074 | 34,223 | ||||||
| Uniform Mortgage-Backed Security 6.00% 1/1/20541,2 | 25,190 | 25,580 | ||||||
| Uniform Mortgage-Backed Security 6.50% 1/1/20541,2 | 36,960 | 37,880 | ||||||
| Uniform Mortgage-Backed Security 7.00% 1/1/20541,2 | 8,600 | 8,872 | ||||||
| Uniform Mortgage-Backed Security 3.50% 2/1/20541,2 | 30,193 | 27,726 | ||||||
| Uniform Mortgage-Backed Security 6.00% 2/1/20541,2 | 26,250 | 26,655 | ||||||
| 476,827 | ||||||||
| Commercial mortgage-backed securities 9.51% | ||||||||
| 3650R Commercial Mortgage Trust, Series 2022-PF2, Class B, 5.29% 11/15/20551 | 1,690 | 1,493 | ||||||
| Bank Commercial Mortgage Trust, Series 2023-BNK45, Class B, 6.148% 2/15/20561 | 1,873 | 1,902 | ||||||
| Bank Commercial Mortgage Trust, Series 2023-BNK45, Class C, 6.279% 2/15/20561 | 512 | 472 | ||||||
| Bank Commercial Mortgage Trust, Series 2023-5YR1, Class AS, 6.411% 3/15/20561 | 3,787 | 3,868 | ||||||
| Bank Commercial Mortgage Trust, Series 2023-5YR1, Class B, 6.411% 3/15/20561 | 2,641 | 2,545 | ||||||
| Bank Commercial Mortgage Trust, Series 2023-5YR2, Class C, 7.164% 7/15/20281 | 2,288 | 2,191 | ||||||
| Bank Commercial Mortgage Trust, Series 2023-BNK46, Class B, 6.773% 8/15/20561 | 4,200 | 4,416 | ||||||
| Bank Commercial Mortgage Trust, Series 2023-BNK46, Class C, 6.773% 8/15/20561 | 2,960 | 2,794 | ||||||
| Bank Commercial Mortgage Trust, Series 2023-5YR3, Class C, 7.315% 9/15/20561 | 2,818 | 2,733 | ||||||
| Bank Commercial Mortgage Trust, Series 2023-5YR4, Class B, 7.785% 12/15/20561 | 2,989 | 3,132 | ||||||
| Bank Commercial Mortgage Trust, Series 2019-BN19, Class B, 3.647% 8/15/20611 | 1,000 | 729 | ||||||
| Bank Commercial Mortgage Trust, Series 2019-BN24, Class B, 3.455% 11/15/20621 | 1,033 | 831 | ||||||
| Bank Commercial Mortgage Trust, Series 2022-BNK40, Class B, 3.393% 3/15/20641,3 | 273 | 213 | ||||||
| Bank Commercial Mortgage Trust, Series 2022-BNK40, Class AS, 3.393% 3/15/20641,3 | 250 | 210 | ||||||
| Barclays Commercial Mortgage Securities, LLC, Series 2018-TALL, Class A, ((1-month USD CME Term SOFR + 0.047%) + 0.872%) 6.281% 3/15/20371,4 | 427 | 397 | ||||||
| Barclays Commercial Mortgage Securities, LLC, Series 2022-C18, Class C, 6.149% 12/15/20551 | 1,355 | 1,200 | ||||||
| Barclays Commercial Mortgage Securities, LLC, Series 2023-C19, Class B, 6.333% 4/15/20561 | 948 | 953 | ||||||
| Barclays Commercial Mortgage Securities, LLC, Series 2023-C19, Class C, 6.385% 4/15/20561 | 1,253 | 1,129 | ||||||
| Barclays Commercial Mortgage Securities, LLC, Series 2023-C20, Class C, 6.608% 7/15/20561 | 1,882 | 1,753 | ||||||
| Benchmark Mortgage Trust, Series 2020-B21, Class AS, 2.2543% 12/17/20531 | 250 | 197 | ||||||
| Benchmark Mortgage Trust, Series 2022-B35, Class C, 4.444% 5/15/20551,3 | 2,005 | 1,414 | ||||||
| Benchmark Mortgage Trust, Series 2023-V2, Class B, 6.769% 5/15/20501 | 4,994 | 5,080 | ||||||
| Benchmark Mortgage Trust, Series 2023-V2, Class C, 6.769% 5/15/20551 | 3,464 | 3,326 | ||||||
| Benchmark Mortgage Trust, Series 2023-B38, Class B, 6.245% 4/15/20561 | 4,994 | 5,038 | ||||||
| Benchmark Mortgage Trust, Series 2023-B38, Class C, 6.245% 4/15/20561 | 2,996 | 2,548 | ||||||
| Benchmark Mortgage Trust, Series 2023-V3, Class B, 6.924% 7/15/20561 | 1,499 | 1,529 | ||||||
| Benchmark Mortgage Trust, Series 2023-V3, Class C, 7.173% 7/15/20561 | 2,644 | 2,560 | ||||||
| BMO Mortgage Trust, Series 2023-C4, Class B, 5.39647% 2/15/20561 | 711 | 662 | ||||||
| BMO Mortgage Trust, Series 2023-C5, Class B, 6.476% 6/15/20561 | 1,873 | 1,940 | ||||||
| BMO Mortgage Trust, Series 2023-C5, Class C, 6.627% 6/15/20561 | 998 | 955 | ||||||
| BMO Mortgage Trust, Series 2023-5C1, Class B, 6.96% 8/15/20561 | 3,505 | 3,572 | ||||||
| BMO Mortgage Trust, Series 2023-5C1, Class C, 7.118% 8/15/20561 | 1,075 | 1,036 | ||||||
| BMO Mortgage Trust, Series 2023-C6, Class B, 6.636% 9/15/20561 | 1,550 | 1,606 | ||||||
| BOCA Commercial Mortgage Trust, Series 2022-BOCA, Class A, (1-month USD CME Term SOFR + 1.77%) 7.131% 5/15/20391,3,4 | 623 | 620 | ||||||
| 22 | Capital Group Fixed Income ETF Trust |
Capital Group Core Plus Income ETF (continued)
| Bonds, notes & other debt instruments (continued) | Principal amount (000) | Value (000) | ||||||
| Mortgage-backed obligations (continued) | ||||||||
| Commercial mortgage-backed securities (continued) | ||||||||
| BOCA Commercial Mortgage Trust, Series 2022-BOCA, Class B, (1-month USD CME Term SOFR + 2.319%) 7.681% 5/15/20391,3,4 | USD | 317 | $ | 315 | ||||
| BX Trust, Series 2022-CSMO, Class A, (1-month USD CME Term SOFR + 2.115%) 7.477% 6/15/20271,3,4 | 716 | 719 | ||||||
| BX Trust, Series 2021-SDMF, Class D, (1-month USD CME Term SOFR + 1.501%) 6.863% 9/15/20341,3,4 | 480 | 461 | ||||||
| BX Trust, Series 2021-VOLT, Class D, (1-month USD CME Term SOFR + 1.764%) 7.126% 9/15/20361,4 | 2,480 | 2,388 | ||||||
| BX Trust, Series 2021-VOLT, Class E, (1-month USD CME Term SOFR + 2.114%) 7.476% 9/15/20361,4 | 4,000 | 3,833 | ||||||
| BX Trust, Series 2021-ARIA, Class B, (1-month USD CME Term SOFR + 1.411%) 6.773% 10/15/20361,4 | 2,976 | 2,884 | ||||||
| BX Trust, Series 2022-IND, Class D, (1-month USD CME Term SOFR + 2.839%) 8.201% 4/15/20371,3,4 | 121 | 120 | ||||||
| BX Trust, Series 2022-AHP, Class A, (1-month USD CME Term SOFR + 0.99%) 6.352% 2/15/20391,4 | 4,887 | 4,801 | ||||||
| BX Trust, Series 2022-PSB, Class A, (1-month USD CME Term SOFR + 2.451%) 7.813% 8/15/20391,3,4 | 681 | 684 | ||||||
| BX Trust, Series 2023-VLT2, Class C, (1-month USD CME Term SOFR + 4.176%) 9.538% 6/15/20401,4 | 2,500 | 2,514 | ||||||
| BX Trust, Series 2023-VLT2, Class D, (1-month USD CME Term SOFR + 4.774%) 10.136% 6/15/20401,4 | 6,000 | 6,032 | ||||||
| BX Trust, Series 2022-GPA, Class B, (1-month USD CME Term SOFR + 2.664%) 8.022% 10/15/20391,3,4 | 982 | 985 | ||||||
| BX Trust, Series 2022-GPA, Class C, (1-month USD CME Term SOFR + 3.213%) 8.572% 10/15/20391,3,4 | 622 | 624 | ||||||
| BX Trust, Series 2022-GPA, Class D, (1-month USD CME Term SOFR + 4.061%) 9.422% 10/15/20391,3,4 | 169 | 170 | ||||||
| BX Trust, Series 2020-VIV2, Class C, 3.542% 3/9/20441,4 | 2,000 | 1,714 | ||||||
| BX Trust, Series 2020-VIV3, Class B, 3.544% 3/9/20441,4 | 989 | 868 | ||||||
| BXSC Commercial Mortgage Trust, Series 2022-WSS, Class B, (1-month USD CME Term SOFR + 2.092%) 7.454% 3/15/20351,4 | 2,985 | 2,956 | ||||||
| BXSC Commercial Mortgage Trust, Series 2022-WSS, Class D, (1-month USD CME Term SOFR + 3.188%) 8.55% 3/15/20351,3,4 | 249 | 245 | ||||||
| CENT Trust 2023-CITY, Series 2023-CITY, Class B, (1-month USD CME Term SOFR + 3.15%) 8.512% 9/15/20281,4 | 3,354 | 3,379 | ||||||
| Citigroup Commercial Mortgage Trust, Series 2023-SMRT, Class D, 5.852% 6/10/20281,4 | 3,950 | 3,813 | ||||||
| Citigroup Commercial Mortgage Trust, Series 2023-SMRT, Class C, 5.852% 6/10/20281,4 | 1,225 | 1,207 | ||||||
| Citigroup Commercial Mortgage Trust, Series 2015-GC27, Class C, 4.419% 2/10/20481,3 | 448 | 414 | ||||||
| Citigroup Commercial Mortgage Trust, Series 2020-GC46, Class B, 3.15% 2/15/20531 | 840 | 635 | ||||||
| DATA 2023-CNTR Mortgage Trust, Series 2023-CNTR, Class D, 5.728% 8/12/20431,4 | 3,984 | 3,448 | ||||||
| DC Commercial Mortgage Trust, Series 2023-DC, Class D, 7.14% 9/10/20401,4 | 5,155 | 4,991 | ||||||
| Extended Stay America Trust, Series 2021-ESH, Class D, (1-month USD CME Term SOFR + 2.364%) 7.726% 7/15/20381,3,4 | 467 | 459 | ||||||
| FIVE Mortgage Trust, Series 2023-V1, Class B, 6.404% 2/10/20561 | 1,982 | 1,984 | ||||||
| FIVE Mortgage Trust, Series 2023-V1, Class C, 6.404% 2/10/20561 | 973 | 917 | ||||||
| Great Wolf Trust, Series 2019-WOLF, Class A, (1-month USD CME Term SOFR + 1.238% on 12/15/2023)1,4,5 | 730 | 728 | ||||||
| Morgan Stanley Bank of America Merrill Lynch Trust, Series 2015-C20, Class B, 4.16% 2/15/20481 | 2,000 | 1,902 | ||||||
| Morgan Stanley Capital I Trust, Series 2019-L3, Class B, 3.65% 11/15/20521,3 | 750 | 611 | ||||||
| MSFW Commercial Mortgage Trust, Series 2023-1, Class B, 6.683% 5/15/20331 | 1,642 | 1,713 | ||||||
| MSFW Commercial Mortgage Trust, Series 2023-1, Class C, 6.683% 5/15/20331 | 1,698 | 1,604 | ||||||
| Multifamily Connecticut Avenue Securities, Series 2020-1, Class M10, (30-day Average USD-SOFR + 3.864%) 9.202% 3/25/20501,4 | 2,992 | 2,900 | ||||||
| Multifamily Connecticut Avenue Securities, Series 2023-01, Class M7, (30-day Average USD-SOFR + 4.00%) 9.337% 11/25/20531,4 | 1,655 | 1,680 | ||||||
| Multifamily Connecticut Avenue Securities, Series 2023-01, Class M10, (30-day Average USD-SOFR + 6.50%) 11.837% 11/25/20531,4 | 2,699 | 2,773 | ||||||
| Multifamily Structured Credit Risk, Series 21-MN1, Class M2, (30-day Average USD-SOFR + 3.75%) 9.087% 1/25/20511,4 | 910 | 874 | ||||||
| ORL Trust, Series 2023-GLKS, Class C, (1-month USD CME Term SOFR + 3.651%) 8.974% 10/15/20281,4 | 4,914 | 4,926 | ||||||
| Capital Group Fixed Income ETF Trust | 23 |
Capital Group Core Plus Income ETF (continued)
| Bonds, notes & other debt instruments (continued) | Principal amount (000) | Value (000) | ||||||
| Mortgage-backed obligations (continued) | ||||||||
| Commercial mortgage-backed securities (continued) | ||||||||
| ORL Trust, Series 2023-GLKS, Class D, (1-month USD CME Term SOFR + 4.301%) 9.624% 10/15/20281,4 | USD | 6,283 | $ | 6,302 | ||||
| Wells Fargo Commercial Mortgage Trust, Series 2015-LC22, Class C, 4.545% 9/15/20581,3 | 130 | 120 | ||||||
| WMRK Commercial Mortgage Trust, Series 2022-WMRK, Class A, (1-month USD CME Term SOFR + 2.789%) 8.151% 11/15/20271,4 | 1,646 | 1,650 | ||||||
| WSTN Trust, Series 2023-MAUI, Class C, 7.69% 8/5/20271,4 | 594 | 588 | ||||||
| WSTN Trust, Series 2023-MAUI, Class D, 8.455% 8/5/20271,4 | 1,820 | 1,807 | ||||||
| 148,782 | ||||||||
| Collateralized mortgage-backed obligations (privately originated) 1.04% | ||||||||
| Cascade Funding Mortgage Trust, Series 2023-HB12, Class M1, 4.25% 4/25/20331,4 | 1,425 | 1,306 | ||||||
| Connecticut Avenue Securities Trust, Series 2022-R03, Class 1M1, (30-day Average USD-SOFR + 2.10%) 7.437% 3/25/20421,3,4 | 233 | 236 | ||||||
| Connecticut Avenue Securities Trust, Series 2023-R04, Class 1M2, (30-day Average USD-SOFR + 3.55%) 8.887% 5/25/20431,4 | 813 | 867 | ||||||
| Freddie Mac Structured Agency Credit Risk Debt Notes, Series 2021-DNA6, Class M2, (30-day Average USD-SOFR + 1.50%) 6.837% 10/25/20411,3,4 | 793 | 787 | ||||||
| Freddie Mac Structured Agency Credit Risk Debt Notes, Series 2022-DNA3, Class M1A, (30-day Average USD-SOFR + 2.00%) 7.337% 4/25/20421,3,4 | 417 | 421 | ||||||
| Freddie Mac Structured Agency Credit Risk Debt Notes, Series 2020-DNA3, Class B1, (30-day Average USD-SOFR + 5.214%) 10.552% 6/27/20501,3,4 | 7,322 | 8,031 | ||||||
| Freddie Mac Structured Agency Credit Risk Debt Notes, Series 2020-DNA5, Class B2, (30-day Average USD-SOFR + 11.50%) 16.821% 10/25/20501,4 | 1,900 | 2,545 | ||||||
| Legacy Mortgage Asset Trust, Series 2020-GS3, Class A1, 6.25% 5/25/2060 (7.25% on 4/25/2024)1,4,5 | 559 | 559 | ||||||
| Legacy Mortgage Asset Trust, Series 2022-GS1, Class A1, 4.00% 2/25/2061 (7.00% on 4/25/2025)1,4,5 | 1,588 | 1,579 | ||||||
| 16,331 | ||||||||
| Total mortgage-backed obligations | 641,940 | |||||||
| Corporate bonds, notes & loans 29.71% | ||||||||
| Financials 6.38% | ||||||||
| AerCap Ireland Capital DAC 1.75% 1/30/2026 | 150 | 139 | ||||||
| AerCap Ireland Capital DAC 5.75% 6/6/2028 | 486 | 498 | ||||||
| AerCap Ireland Capital DAC 3.00% 10/29/2028 | 140 | 128 | ||||||
| AerCap Ireland Capital DAC 3.30% 1/30/2032 | 1,524 | 1,327 | ||||||
| AerCap Ireland Capital DAC 3.85% 10/29/2041 | 2,435 | 1,964 | ||||||
| AG Issuer, LLC 6.25% 3/1/20284 | 1,375 | 1,368 | ||||||
| AG TTMT Escrow Issuer, LLC 8.625% 9/30/20274 | 675 | 710 | ||||||
| Alpha Bank SA 4.25% 2/13/2030 (5-year EUR Mid-Swap + 4.504% on 2/13/2025)5 | EUR | 715 | 773 | |||||
| Alpha Bank SA 4.25% 6/11/2031 (5-year EUR Mid-Swap + 5.823% on 6/11/2026)5 | 105 | 113 | ||||||
| American Express Co. 5.043% 5/1/2034 (USD-SOFR + 1.835% on 5/1/2033)5 | USD | 200 | 200 | |||||
| American International Group, Inc. 5.125% 3/27/2033 | 1,569 | 1,593 | ||||||
| Aon Corp. 5.35% 2/28/2033 | 443 | 455 | ||||||
| Aon Corp. 3.90% 2/28/2052 | 807 | 642 | ||||||
| Aretec Group, Inc. 7.50% 4/1/20294 | 300 | 270 | ||||||
| Aretec Group, Inc. 10.00% 8/15/20304 | 840 | 894 | ||||||
| Bangkok Bank Public Co., Ltd. 3.733% 9/25/2034 (5-year UST Yield Curve Rate T Note Constant Maturity + 1.90% on 9/25/2029)5 | 450 | 400 | ||||||
| Bank of America Corp. 4.948% 7/22/2028 (USD-SOFR + 2.04% on 7/22/2027)5 | 750 | 750 | ||||||
| Bank of America Corp. 5.288% 4/25/2034 (USD-SOFR + 1.91% on 4/25/2033)5 | 3,230 | 3,239 | ||||||
| Bank of America Corp. 5.872% 9/15/2034 (USD-SOFR + 1.84% on 9/15/2033)5 | 954 | 999 | ||||||
| Bank of East Asia, Ltd. 4.875% 4/22/2032 (5-year UST Yield Curve Rate T Note Constant Maturity + 2.30% on 4/22/2027)5 | 650 | 589 | ||||||
| Bank of Montreal 2.65% 3/8/2027 | 350 | 330 | ||||||
| BBVA Bancomer, SA 8.45% 6/29/2038 (5-year UST Yield Curve Rate T Note Constant Maturity + 4.661% on 6/29/2033)4,5 | 1,055 | 1,126 | ||||||
| Berkshire Hathaway Finance Corp. 3.85% 3/15/2052 | 400 | 335 | ||||||
| Block, Inc. 3.50% 6/1/2031 | 867 | 771 | ||||||
| BNP Paribas SA 2.591% 1/20/2028 (USD-SOFR + 1.228% on 1/20/2027)4,5 | 200 | 185 | ||||||
| CaixaBank, SA 6.208% 1/18/2029 (USD-SOFR + 2.70% on 1/18/2028)4,5 | 225 | 230 | ||||||
| 24 | Capital Group Fixed Income ETF Trust |
Capital Group Core Plus Income ETF (continued)
| Bonds, notes & other debt instruments (continued) | Principal amount (000) | Value (000) | ||||||
| Corporate bonds, notes & loans (continued) | ||||||||
| Financials (continued) | ||||||||
| CaixaBank, SA 6.84% 9/13/2034 (USD-SOFR + 2.77% on 9/13/2033)4,5 | USD | 1,200 | $ | 1,268 | ||||
| Capital One Financial Corp. 6.377% 6/8/2034 (USD-SOFR + 2.86% on 6/8/2033)5 | 1,450 | 1,493 | ||||||
| Charles Schwab Corp. (The) 2.45% 3/3/2027 | 98 | 91 | ||||||
| Charles Schwab Corp. (The) 5.853% 5/19/2034 (USD-SOFR + 2.50% on 5/19/2033)5 | 1,217 | 1,257 | ||||||
| Citigroup, Inc. 3.057% 1/25/2033 (USD-SOFR + 1.351% on 1/25/2032)5 | 840 | 717 | ||||||
| Citigroup, Inc. 6.27% 11/17/2033 (USD-SOFR + 2.338% on 11/17/2032)5 | 1,754 | 1,878 | ||||||
| Citigroup, Inc. 6.174% 5/25/2034 (USD-SOFR + 2.661% on 5/25/2033)5 | 1,330 | 1,377 | ||||||
| CME Group, Inc. 2.65% 3/15/2032 | 150 | 133 | ||||||
| Coinbase Global, Inc. 3.625% 10/1/20314 | 350 | 271 | ||||||
| Compass Group Diversified Holdings, LLC 5.25% 4/15/20294 | 3,349 | 3,167 | ||||||
| Compass Group Diversified Holdings, LLC 5.00% 1/15/20324 | 675 | 613 | ||||||
| Corebridge Financial, Inc. 3.90% 4/5/2032 | 741 | 670 | ||||||
| Corebridge Financial, Inc. 4.35% 4/5/2042 | 98 | 83 | ||||||
| Corebridge Financial, Inc. 4.40% 4/5/2052 | 2,097 | 1,762 | ||||||
| Danske Bank AS 4.298% 4/1/2028 (1-year UST Yield Curve Rate T Note Constant Maturity + 1.75% on 4/1/2027)4,5 | 600 | 582 | ||||||
| Deutsche Bank AG 7.146% 7/13/2027 (USD-SOFR + 2.52% on 7/13/2026)5 | 1,138 | 1,182 | ||||||
| Deutsche Bank AG 6.72% 1/18/2029 (USD-SOFR + 3.18% on 1/18/2028)5 | 1,025 | 1,074 | ||||||
| Deutsche Bank AG 6.819% 11/20/2029 (USD-SOFR + 2.51% on 11/20/2028)5 | 1,750 | 1,844 | ||||||
| Discover Financial Services 6.70% 11/29/2032 | 64 | 67 | ||||||
| Discover Financial Services 7.964% 11/2/2034 (USD-SOFR Index + 3.37% on 11/2/2033)5 | 1,000 | 1,113 | ||||||
| Goldman Sachs Group, Inc. 1.757% 1/24/2025 (USD-SOFR + 0.73% on 1/24/2024)5 | 40 | 40 | ||||||
| Goldman Sachs Group, Inc. 3.102% 2/24/2033 (USD-SOFR + 1.41% on 2/24/2032)5 | 1,017 | 873 | ||||||
| Goldman Sachs Group, Inc. 3.436% 2/24/2043 (USD-SOFR + 1.632% on 2/24/2042)5 | 3,843 | 3,004 | ||||||
| GTCR W-2 Merger Sub, LLC 7.50% 1/15/20314 | 850 | 899 | ||||||
| HSBC Holdings PLC 5.402% 8/11/2033 (USD-SOFR + 2.87% on 8/11/2032)5 | 1,125 | 1,130 | ||||||
| HSBC Holdings PLC 6.254% 3/9/2034 (USD-SOFR + 2.39% on 3/9/2033)5 | 1,500 | 1,595 | ||||||
| HSBC Holdings PLC 6.332% 3/9/2044 (USD-SOFR + 2.65% on 3/9/2043)5 | 2,869 | 3,096 | ||||||
| HUB International, Ltd. 5.625% 12/1/20294 | 300 | 287 | ||||||
| HUB International, Ltd. 7.25% 6/15/20304 | 1,700 | 1,797 | ||||||
| ING Groep NV 4.017% 3/28/2028 (USD-SOFR + 1.83% on 3/28/2027)5 | 375 | 364 | ||||||
| Intercontinental Exchange, Inc. 4.35% 6/15/2029 | 500 | 499 | ||||||
| Intercontinental Exchange, Inc. 4.60% 3/15/2033 | 428 | 426 | ||||||
| Intercontinental Exchange, Inc. 3.00% 6/15/2050 | 355 | 254 | ||||||
| JPMorgan Chase & Co. 4.851% 7/25/2028 (USD-SOFR + 1.99% on 7/25/2027)5 | 338 | 338 | ||||||
| JPMorgan Chase & Co. 1.953% 2/4/2032 (USD-SOFR + 1.065% on 2/4/2031)5 | 1,654 | 1,345 | ||||||
| JPMorgan Chase & Co. 5.35% 6/1/2034 (USD-SOFR + 1.845% on 6/1/2033)5 | 1,175 | 1,192 | ||||||
| Kasikornbank PCL (Hong Kong Branch) 3.343% 10/2/2031 (5-year UST Yield Curve Rate T Note Constant Maturity + 1.70% on 10/2/2026)5 | 950 | 874 | ||||||
| KBC Groep NV 5.796% 1/19/2029 (1-year UST Yield Curve Rate T Note Constant Maturity + 2.10% on 1/19/2028)4,5 | 200 | 204 | ||||||
| Mastercard, Inc. 4.85% 3/9/2033 | 65 | 67 | ||||||
| MetLife, Inc. 5.375% 7/15/2033 | 300 | 313 | ||||||
| Metropolitan Life Global Funding I 5.15% 3/28/20334 | 787 | 801 | ||||||
| Morgan Stanley 4.21% 4/20/2028 (USD-SOFR + 1.61% on 4/20/2027)5 | 471 | 461 | ||||||
| Morgan Stanley 5.123% 2/1/2029 (USD-SOFR + 1.73% on 2/1/2028)5 | 325 | 327 | ||||||
| Morgan Stanley 5.164% 4/20/2029 (USD-SOFR + 1.59% on 4/20/2028)5 | 160 | 161 | ||||||
| Morgan Stanley 4.889% 7/20/2033 (USD-SOFR + 2.077% on 7/20/2032)5 | 445 | 434 | ||||||
| Morgan Stanley 5.25% 4/21/2034 (USD-SOFR + 1.87% on 4/21/2033)5 | 2,400 | 2,401 | ||||||
| Morgan Stanley 5.424% 7/21/2034 (USD-SOFR + 1.88% on 7/21/2033)5 | 2,513 | 2,552 | ||||||
| Nasdaq, Inc. 5.95% 8/15/2053 | 1,985 | 2,136 | ||||||
| Nasdaq, Inc. 6.10% 6/28/2063 | 1,341 | 1,451 | ||||||
| Navient Corp. 5.50% 3/15/2029 | 870 | 803 | ||||||
| Navient Corp. 9.375% 7/25/2030 | 650 | 682 | ||||||
| Navient Corp. 11.50% 3/15/2031 | 1,850 | 2,028 | ||||||
| Navient Corp. 5.625% 8/1/2033 | 3,223 | 2,649 | ||||||
| New York Life Global Funding 0.85% 1/15/20264 | 125 | 116 | ||||||
| New York Life Global Funding 4.55% 1/28/20334 | 683 | 674 | ||||||
| NFP Corp. 6.875% 8/15/20284 | 155 | 158 | ||||||
| PNC Financial Services Group, Inc. 5.939% 8/18/2034 (USD-SOFR + 1.946% on 8/18/2033)5 | 23 | 24 | ||||||
| Capital Group Fixed Income ETF Trust | 25 |
Capital Group Core Plus Income ETF (continued)
| Bonds, notes & other debt instruments (continued) | Principal amount (000) | Value (000) | ||||||
| Corporate bonds, notes & loans (continued) | ||||||||
| Financials (continued) | ||||||||
| PNC Financial Services Group, Inc. 6.875% 10/20/2034 (USD-SOFR + 2.284% on 10/20/2033)5 | USD | 3,724 | $ | 4,136 | ||||
| Progressive Corp. 3.00% 3/15/2032 | 350 | 312 | ||||||
| State Street Corp. 4.821% 1/26/2034 (USD-SOFR + 1.567% on 1/26/2033)5 | 1,640 | 1,615 | ||||||
| State Street Corp. 5.159% 5/18/2034 (USD-SOFR + 1.89% on 5/18/2033)5 | 478 | 482 | ||||||
| Toronto-Dominion Bank (The) 2.00% 9/10/2031 | 90 | 75 | ||||||
| Truist Financial Corp. 5.867% 6/8/2034 (USD-SOFR + 2.361% on 6/8/2033)5 | 1,180 | 1,205 | ||||||
| U.S. Bancorp 4.839% 2/1/2034 (USD-SOFR + 1.60% on 2/1/2033)5 | 1,730 | 1,658 | ||||||
| U.S. Bancorp 5.836% 6/12/2034 (USD-SOFR + 2.26% on 6/10/2033)5 | 367 | 379 | ||||||
| UBS Group AG 3.091% 5/14/2032 (USD-SOFR + 1.73% on 5/14/2031)4,5 | 1,650 | 1,406 | ||||||
| UBS Group AG 6.301% 9/22/2034 (1-year UST Yield Curve Rate T Note Constant Maturity + 2.00% on 9/22/2033)4,5 | 1,600 | 1,695 | ||||||
| Wells Fargo & Co. 3.908% 4/25/2026 (USD-SOFR + 1.32% on 4/25/2025)5 | 469 | 460 | ||||||
| Wells Fargo & Co. 4.808% 7/25/2028 (USD-SOFR + 1.98% on 7/25/2027)5 | 1,050 | 1,043 | ||||||
| Wells Fargo & Co. 5.389% 4/24/2034 (USD-SOFR + 2.02% on 4/24/2033)5 | 2,945 | 2,959 | ||||||
| Wells Fargo & Co. 5.557% 7/25/2034 (USD-SOFR + 1.99% on 7/25/2033)5 | 24 | 24 | ||||||
| Wells Fargo & Co. 6.491% 10/23/2034 (USD-SOFR + 2.06% on 10/23/2033)5 | 4,149 | 4,516 | ||||||
| Wells Fargo & Co. 4.611% 4/25/2053 (USD-SOFR + 2.13% on 4/25/2052)5 | 790 | 711 | ||||||
| 99,801 | ||||||||
| Energy 4.48% | ||||||||
| Apache Corp. 5.10% 9/1/2040 | 350 | 300 | ||||||
| Apache Corp. 5.25% 2/1/2042 | 500 | 419 | ||||||
| Apache Corp. 5.35% 7/1/2049 | 965 | 804 | ||||||
| Ascent Resources Utica Holdings, LLC 7.00% 11/1/20264 | 250 | 252 | ||||||
| Borr IHC, Ltd. 10.00% 11/15/20284 | 835 | 873 | ||||||
| Borr IHC, Ltd. 10.375% 11/15/20304 | 900 | 932 | ||||||
| BP Capital Markets America, Inc. 4.893% 9/11/2033 | 400 | 407 | ||||||
| Cheniere Energy Partners, LP 4.00% 3/1/2031 | 789 | 718 | ||||||
| Cheniere Energy Partners, LP 5.95% 6/30/20334 | 1,600 | 1,645 | ||||||
| Cheniere Energy, Inc. 4.625% 10/15/2028 | 175 | 171 | ||||||
| Chesapeake Energy Corp. 5.875% 2/1/20294 | 750 | 736 | ||||||
| Chesapeake Energy Corp. 6.75% 4/15/20294 | 761 | 769 | ||||||
| Chord Energy Corp. 6.375% 6/1/20264 | 350 | 350 | ||||||
| Civitas Resources, Inc. 8.375% 7/1/20284 | 1,325 | 1,385 | ||||||
| Civitas Resources, Inc. 8.625% 11/1/20304 | 925 | 982 | ||||||
| Civitas Resources, Inc. 8.75% 7/1/20314 | 775 | 826 | ||||||
| CNX Resources Corp. 7.25% 3/14/20274 | 399 | 403 | ||||||
| CNX Resources Corp. 7.375% 1/15/20314 | 185 | 186 | ||||||
| Columbia Pipelines Holding Co., LLC 6.544% 11/15/20534 | 955 | 1,053 | ||||||
| Columbia Pipelines Operating Co., LLC 5.927% 8/15/20304 | 321 | 332 | ||||||
| Columbia Pipelines Operating Co., LLC 6.036% 11/15/20334 | 462 | 484 | ||||||
| Columbia Pipelines Operating Co., LLC 6.497% 8/15/20434 | 232 | 249 | ||||||
| Comstock Resources, Inc. 5.875% 1/15/20304 | 2,757 | 2,395 | ||||||
| ConocoPhillips Co. 3.80% 3/15/2052 | 2,700 | 2,184 | ||||||
| ConocoPhillips Co. 5.30% 5/15/2053 | 773 | 795 | ||||||
| ConocoPhillips Co. 5.55% 3/15/2054 | 880 | 935 | ||||||
| Crescent Energy Finance, LLC 9.25% 2/15/20284 | 773 | 803 | ||||||
| Ecopetrol SA 4.625% 11/2/2031 | 10 | 9 | ||||||
| Ecopetrol SA 8.875% 1/13/2033 | 1,900 | 2,067 | ||||||
| Enbridge, Inc. 6.70% 11/15/2053 | 1,994 | 2,322 | ||||||
| Energy Transfer, LP 6.40% 12/1/2030 | 688 | 736 | ||||||
| Energy Transfer, LP 6.55% 12/1/2033 | 1,582 | 1,719 | ||||||
| EQM Midstream Partners, LP 6.00% 7/1/20254 | 430 | 430 | ||||||
| EQM Midstream Partners, LP 4.75% 1/15/20314 | 2,194 | 2,045 | ||||||
| Exxon Mobil Corp. 2.61% 10/15/2030 | 400 | 358 | ||||||
| Exxon Mobil Corp. 3.452% 4/15/2051 | 2,055 | 1,614 | ||||||
| Genesis Energy, LP 8.25% 1/15/2029 | 350 | 360 | ||||||
| Harvest Midstream I, LP 7.50% 9/1/20284 | 75 | 75 | ||||||
| Hilcorp Energy I, LP 6.00% 4/15/20304 | 135 | 131 | ||||||
| Hilcorp Energy I, LP 6.25% 4/15/20324 | 875 | 843 | ||||||
| Hilcorp Energy I, LP 8.375% 11/1/20334 | 785 | 833 | ||||||
| 26 | Capital Group Fixed Income ETF Trust |
Capital Group Core Plus Income ETF (continued)
| Bonds, notes & other debt instruments (continued) | Principal amount (000) | Value (000) | ||||||
| Corporate bonds, notes & loans (continued) | ||||||||
| Energy (continued) | ||||||||
| Kinder Morgan, Inc. 5.20% 6/1/2033 | USD | 253 | $ | 252 | ||||
| Kinder Morgan, Inc. 3.60% 2/15/2051 | 2,155 | 1,543 | ||||||
| Kinder Morgan, Inc. 5.45% 8/1/2052 | 145 | 139 | ||||||
| Kinetik Holdings, LP 6.625% 12/15/20284 | 740 | 754 | ||||||
| MPLX, LP 2.65% 8/15/2030 | 75 | 65 | ||||||
| MPLX, LP 4.95% 9/1/2032 | 1,228 | 1,202 | ||||||
| MPLX, LP 4.95% 3/14/2052 | 1,330 | 1,186 | ||||||
| MPLX, LP 5.65% 3/1/2053 | 2,368 | 2,343 | ||||||
| MV24 Capital BV 6.748% 6/1/2034 | 524 | 491 | ||||||
| New Fortress Energy, Inc. 6.50% 9/30/20264 | 2,316 | 2,226 | ||||||
| NGL Energy Operating, LLC 7.50% 2/1/20264 | 2,160 | 2,183 | ||||||
| Noble Finance II, LLC 8.00% 4/15/20304 | 150 | 156 | ||||||
| Northern Oil and Gas, Inc. 8.75% 6/15/20314 | 635 | 662 | ||||||
| Occidental Petroleum Corp. 6.125% 1/1/2031 | 415 | 431 | ||||||
| Occidental Petroleum Corp. 6.60% 3/15/2046 | 1,875 | 2,033 | ||||||
| ONEOK, Inc. 4.00% 7/13/2027 | 50 | 49 | ||||||
| ONEOK, Inc. 5.80% 11/1/2030 | 236 | 246 | ||||||
| ONEOK, Inc. 6.35% 1/15/2031 | 40 | 43 | ||||||
| ONEOK, Inc. 6.05% 9/1/2033 | 1,757 | 1,862 | ||||||
| ONEOK, Inc. 4.50% 3/15/2050 | 75 | 63 | ||||||
| ONEOK, Inc. 7.15% 1/15/2051 | 150 | 173 | ||||||
| ONEOK, Inc. 6.625% 9/1/2053 | 1,067 | 1,195 | ||||||
| Permian Resources Operating, LLC 9.875% 7/15/20314 | 820 | 912 | ||||||
| Permian Resources Operating, LLC 7.00% 1/15/20324 | 285 | 294 | ||||||
| Petrobras Global Finance BV 5.60% 1/3/2031 | 611 | 609 | ||||||
| Petroleos Mexicanos 6.49% 1/23/2027 | 1,275 | 1,197 | ||||||
| Seadrill Finance, Ltd. 8.375% 8/1/20304 | 210 | 219 | ||||||
| Shell International Finance BV 2.75% 4/6/2030 | 75 | 69 | ||||||
| Shell International Finance BV 3.00% 11/26/2051 | 3,817 | 2,722 | ||||||
| Southwestern Energy Co. 4.75% 2/1/2032 | 2,281 | 2,113 | ||||||
| Sunoco, LP 4.50% 4/30/2030 | 150 | 139 | ||||||
| Transocean Aquila, Ltd. 8.00% 9/30/20284 | 440 | 447 | ||||||
| Transocean, Inc. 8.00% 2/1/20274 | 800 | 781 | ||||||
| Transocean, Inc. 8.75% 2/15/20304 | 645 | 674 | ||||||
| Transocean, Inc. 6.80% 3/15/2038 | 1,530 | 1,229 | ||||||
| Venture Global Calcasieu Pass, LLC 6.25% 1/15/20304 | 1,249 | 1,244 | ||||||
| Venture Global Calcasieu Pass, LLC 4.125% 8/15/20314 | 1,794 | 1,583 | ||||||
| Venture Global LNG, Inc. 8.125% 6/1/20284 | 750 | 758 | ||||||
| Venture Global LNG, Inc. 8.375% 6/1/20314 | 465 | 465 | ||||||
| Weatherford International, Ltd. 6.50% 9/15/20284 | 250 | 259 | ||||||
| Weatherford International, Ltd. 8.625% 4/30/20304 | 125 | 131 | ||||||
| Williams Companies, Inc. 2.60% 3/15/2031 | 55 | 47 | ||||||
| 70,119 | ||||||||
| Health care 3.07% | ||||||||
| Amgen, Inc. 5.25% 3/2/2030 | 623 | 641 | ||||||
| Amgen, Inc. 4.20% 3/1/2033 | 1,265 | 1,204 | ||||||
| Amgen, Inc. 5.25% 3/2/2033 | 1,395 | 1,431 | ||||||
| Amgen, Inc. 4.875% 3/1/2053 | 275 | 257 | ||||||
| Amgen, Inc. 5.65% 3/2/2053 | 5,794 | 6,100 | ||||||
| Amgen, Inc. 5.75% 3/2/2063 | 1,080 | 1,134 | ||||||
| Bausch Health Companies, Inc. 6.125% 2/1/20274 | 75 | 51 | ||||||
| Bausch Health Companies, Inc. 5.25% 2/15/20314 | 110 | 48 | ||||||
| Baxter International, Inc. 2.539% 2/1/2032 | 822 | 690 | ||||||
| Baxter International, Inc. 3.132% 12/1/2051 | 2,531 | 1,743 | ||||||
| Bayer US Finance, LLC 6.50% 11/21/20334 | 1,853 | 1,916 | ||||||
| Bayer US Finance, LLC 6.875% 11/21/20534 | 1,148 | 1,224 | ||||||
| Centene Corp. 2.45% 7/15/2028 | 1,415 | 1,261 | ||||||
| Centene Corp. 2.625% 8/1/2031 | 2,645 | 2,198 | ||||||
| CHS / Community Health Systems, Inc. 5.25% 5/15/20304 | 75 | 63 | ||||||
| CVS Health Corp. 1.875% 2/28/2031 | 50 | 41 | ||||||
| CVS Health Corp. 5.25% 2/21/2033 | 910 | 931 | ||||||
| Capital Group Fixed Income ETF Trust | 27 |
Capital Group Core Plus Income ETF (continued)
| Bonds, notes & other debt instruments (continued) | Principal amount (000) | Value (000) | ||||||
| Corporate bonds, notes & loans (continued) | ||||||||
| Health care (continued) | ||||||||
| CVS Health Corp. 5.875% 6/1/2053 | USD | 2,863 | $ | 3,015 | ||||
| CVS Health Corp. 6.00% 6/1/2063 | 581 | 617 | ||||||
| Elevance Health, Inc. 4.10% 5/15/2032 | 423 | 404 | ||||||
| Elevance Health, Inc. 4.75% 2/15/2033 | 261 | 261 | ||||||
| Elevance Health, Inc. 4.55% 5/15/2052 | 203 | 185 | ||||||
| HCA, Inc. 3.625% 3/15/2032 | 79 | 71 | ||||||
| Merck & Co., Inc. 1.70% 6/10/2027 | 50 | 46 | ||||||
| Molina Healthcare, Inc. 3.875% 11/15/20304 | 414 | 373 | ||||||
| Molina Healthcare, Inc. 3.875% 5/15/20324 | 2,765 | 2,419 | ||||||
| Owens & Minor, Inc. 6.25% 4/1/20304 | 1,265 | 1,209 | ||||||
| Pfizer Investment Enterprises Pte., Ltd. 4.75% 5/19/2033 | 801 | 803 | ||||||
| Pfizer Investment Enterprises Pte., Ltd. 5.11% 5/19/2043 | 1,500 | 1,496 | ||||||
| Pfizer Investment Enterprises Pte., Ltd. 5.30% 5/19/2053 | 3,048 | 3,114 | ||||||
| Radiology Partners, Inc., Term Loan, (1-month USD CME Term SOFR + 4.25%) 10.179% 7/9/20253,6 | 40 | 32 | ||||||
| Roche Holdings, Inc. 2.076% 12/13/20314 | 600 | 505 | ||||||
| RP Escrow Issuer, LLC 5.25% 12/15/20254 | 660 | 529 | ||||||
| Tenet Healthcare Corp. 4.875% 1/1/2026 | 300 | 297 | ||||||
| Tenet Healthcare Corp. 4.375% 1/15/2030 | 525 | 487 | ||||||
| Tenet Healthcare Corp. 6.75% 5/15/20314 | 200 | 205 | ||||||
| Teva Pharmaceutical Finance Netherlands III BV 3.15% 10/1/2026 | 2,027 | 1,878 | ||||||
| Teva Pharmaceutical Finance Netherlands III BV 4.75% 5/9/2027 | 1,200 | 1,150 | ||||||
| Teva Pharmaceutical Finance Netherlands III BV 6.75% 3/1/2028 | 482 | 493 | ||||||
| Teva Pharmaceutical Finance Netherlands III BV 5.125% 5/9/2029 | 3,221 | 3,080 | ||||||
| Teva Pharmaceutical Finance Netherlands III BV 7.875% 9/15/2029 | 700 | 755 | ||||||
| Teva Pharmaceutical Finance Netherlands III BV 8.125% 9/15/2031 | 1,389 | 1,517 | ||||||
| Teva Pharmaceutical Finance Netherlands III BV 4.10% 10/1/2046 | 1,768 | 1,199 | ||||||
| Thermo Fisher Scientific, Inc. 5.20% 1/31/2034 | 385 | 403 | ||||||
| UnitedHealth Group, Inc. 4.20% 5/15/2032 | 230 | 225 | ||||||
| UnitedHealth Group, Inc. 4.75% 5/15/2052 | 355 | 342 | ||||||
| 48,043 | ||||||||
| Communication services 2.72% | ||||||||
| AT&T, Inc. 2.55% 12/1/2033 | 2,050 | 1,672 | ||||||
| AT&T, Inc. 5.40% 2/15/2034 | 150 | 155 | ||||||
| AT&T, Inc. 3.55% 9/15/2055 | 400 | 288 | ||||||
| CCO Holdings, LLC 4.75% 2/1/20324 | 1,314 | 1,160 | ||||||
| CCO Holdings, LLC 4.50% 5/1/2032 | 300 | 257 | ||||||
| CCO Holdings, LLC 4.50% 6/1/20334 | 1,355 | 1,148 | ||||||
| CCO Holdings, LLC 4.25% 1/15/20344 | 3,817 | 3,107 | ||||||
| Charter Communications Operating, LLC 4.40% 4/1/2033 | 210 | 194 | ||||||
| Charter Communications Operating, LLC 3.70% 4/1/2051 | 2,855 | 1,860 | ||||||
| Charter Communications Operating, LLC 3.90% 6/1/2052 | 4,150 | 2,795 | ||||||
| Charter Communications Operating, LLC 5.25% 4/1/2053 | 4,275 | 3,586 | ||||||
| Comcast Corp. 4.80% 5/15/2033 | 42 | 43 | ||||||
| Comcast Corp. 2.887% 11/1/2051 | 2,625 | 1,777 | ||||||
| Comcast Corp. 5.35% 5/15/2053 | 2,240 | 2,319 | ||||||
| Comcast Corp. 5.50% 5/15/2064 | 250 | 263 | ||||||
| DISH DBS Corp. 5.875% 11/15/2024 | 248 | 233 | ||||||
| DISH Network Corp. 11.75% 11/15/20274 | 1,350 | 1,410 | ||||||
| Frontier Communications Holdings, LLC 5.00% 5/1/20284 | 711 | 658 | ||||||
| Gray Escrow II, Inc. 5.375% 11/15/20314 | 2,675 | 2,021 | ||||||
| Gray Television, Inc. 4.75% 10/15/20304 | 180 | 136 | ||||||
| Meta Platforms, Inc. 3.85% 8/15/2032 | 1,100 | 1,047 | ||||||
| Meta Platforms, Inc. 4.45% 8/15/2052 | 775 | 713 | ||||||
| Midas OpCo Holdings, LLC 5.625% 8/15/20294 | 100 | 92 | ||||||
| Netflix, Inc. 4.875% 4/15/2028 | 1,385 | 1,404 | ||||||
| Netflix, Inc. 5.875% 11/15/2028 | 20 | 21 | ||||||
| News Corp. 3.875% 5/15/20294 | 369 | 340 | ||||||
| Sirius XM Radio, Inc. 4.00% 7/15/20284 | 64 | 59 | ||||||
| Sirius XM Radio, Inc. 3.875% 9/1/20314 | 2,139 | 1,833 | ||||||
| Tencent Holdings, Ltd. 3.24% 6/3/20504 | 960 | 641 | ||||||
| 28 | Capital Group Fixed Income ETF Trust |
Capital Group Core Plus Income ETF (continued)
| Bonds, notes & other debt instruments (continued) | Principal amount (000) | Value (000) | ||||||
| Corporate bonds, notes & loans (continued) | ||||||||
| Communication services (continued) | ||||||||
| T-Mobile USA, Inc. 5.05% 7/15/2033 | USD | 471 | $ | 475 | ||||
| T-Mobile USA, Inc. 3.40% 10/15/2052 | 2,945 | 2,147 | ||||||
| T-Mobile USA, Inc. 5.75% 1/15/2054 | 752 | 796 | ||||||
| T-Mobile USA, Inc. 6.00% 6/15/2054 | 880 | 966 | ||||||
| Univision Communications, Inc. 8.00% 8/15/20284 | 430 | 444 | ||||||
| Univision Communications, Inc. 4.50% 5/1/20294 | 3,950 | 3,529 | ||||||
| Univision Communications, Inc. 7.375% 6/30/20304 | 1,200 | 1,198 | ||||||
| Verizon Communications, Inc. 1.75% 1/20/2031 | 400 | 329 | ||||||
| Verizon Communications, Inc. 2.55% 3/21/2031 | 97 | 84 | ||||||
| Verizon Communications, Inc. 2.875% 11/20/2050 | 482 | 328 | ||||||
| Verizon Communications, Inc. 3.55% 3/22/2051 | 200 | 154 | ||||||
| Verizon Communications, Inc. 3.875% 3/1/2052 | 1,132 | 918 | ||||||
| 42,600 | ||||||||
| Industrials 2.58% | ||||||||
| Boeing Co. 2.75% 2/1/2026 | 115 | 110 | ||||||
| Boeing Co. 3.625% 2/1/2031 | 1,992 | 1,851 | ||||||
| Boeing Co. 3.60% 5/1/2034 | 2,788 | 2,465 | ||||||
| Boeing Co. 5.805% 5/1/2050 | 4,340 | 4,497 | ||||||
| Boeing Co. 5.93% 5/1/2060 | 450 | 467 | ||||||
| Bombardier, Inc. 7.125% 6/15/20264 | 194 | 193 | ||||||
| Bombardier, Inc. 7.875% 4/15/20274 | 1,392 | 1,394 | ||||||
| Bombardier, Inc. 6.00% 2/15/20284 | 871 | 850 | ||||||
| Bombardier, Inc. 7.50% 2/1/20294 | 590 | 600 | ||||||
| Bombardier, Inc. 8.75% 11/15/20304 | 350 | 373 | ||||||
| Burlington Northern Santa Fe, LLC 5.20% 4/15/2054 | 2,035 | 2,120 | ||||||
| Canadian Pacific Railway Co. 3.10% 12/2/2051 | 3,335 | 2,412 | ||||||
| Carrier Global Corp. 2.722% 2/15/2030 | 346 | 310 | ||||||
| Carrier Global Corp. 2.70% 2/15/2031 | 246 | 215 | ||||||
| Carrier Global Corp. 5.90% 3/15/20344 | 1,335 | 1,444 | ||||||
| Carrier Global Corp. 3.577% 4/5/2050 | 576 | 451 | ||||||
| Carrier Global Corp. 6.20% 3/15/20544 | 1,457 | 1,686 | ||||||
| Clean Harbors, Inc. 6.375% 2/1/20314 | 73 | 74 | ||||||
| CoreLogic, Inc. 4.50% 5/1/20284 | 300 | 263 | ||||||
| Icahn Enterprises, LP 4.75% 9/15/2024 | 380 | 378 | ||||||
| Icahn Enterprises, LP 6.375% 12/15/2025 | 250 | 246 | ||||||
| Icahn Enterprises, LP 9.75% 1/15/20294 | 1,250 | 1,277 | ||||||
| Lockheed Martin Corp. 5.70% 11/15/2054 | 212 | 239 | ||||||
| Mileage Plus Holdings, LLC 6.50% 6/20/20274 | 42 | 42 | ||||||
| Norfolk Southern Corp. 4.45% 3/1/2033 | 78 | 77 | ||||||
| Norfolk Southern Corp. 5.35% 8/1/2054 | 2,519 | 2,622 | ||||||
| Regal Rexnord Corp. 6.30% 2/15/20304 | 975 | 1,001 | ||||||
| Regal Rexnord Corp. 6.40% 4/15/20334 | 947 | 988 | ||||||
| Ritchie Bros. Holdings, Inc. 6.75% 3/15/20284 | 244 | 251 | ||||||
| Ritchie Bros. Holdings, Inc. 7.75% 3/15/20314 | 280 | 299 | ||||||
| RTX Corp. 6.10% 3/15/2034 | 777 | 844 | ||||||
| RTX Corp. 2.82% 9/1/2051 | 925 | 612 | ||||||
| RTX Corp. 5.375% 2/27/2053 | 2,017 | 2,051 | ||||||
| RTX Corp. 6.40% 3/15/2054 | 1,007 | 1,167 | ||||||
| Spirit AeroSystems, Inc. 9.375% 11/30/20294 | 1,583 | 1,734 | ||||||
| Spirit AeroSystems, Inc. 9.75% 11/15/20304 | 575 | 619 | ||||||
| TransDigm, Inc. 6.75% 8/15/20284 | 115 | 118 | ||||||
| TransDigm, Inc. 4.625% 1/15/2029 | 838 | 787 | ||||||
| Triumph Group, Inc. 9.00% 3/15/20284 | 742 | 790 | ||||||
| Union Pacific Corp. 2.80% 2/14/2032 | 409 | 363 | ||||||
| Union Pacific Corp. 2.95% 3/10/2052 | 1,885 | 1,339 | ||||||
| Union Pacific Corp. 4.95% 5/15/2053 | 675 | 690 | ||||||
| United Airlines, Inc. 4.625% 4/15/20294 | 100 | 94 | ||||||
| 40,403 | ||||||||
| Capital Group Fixed Income ETF Trust | 29 |
Capital Group Core Plus Income ETF (continued)
| Bonds, notes & other debt instruments (continued) | Principal amount (000) | Value (000) | ||||||
| Corporate bonds, notes & loans (continued) | ||||||||
| Consumer discretionary 2.54% | ||||||||
| Advance Auto Parts, Inc. 3.90% 4/15/2030 | USD | 550 | $ | 494 | ||||
| Advance Auto Parts, Inc. 3.50% 3/15/2032 | 1,200 | 994 | ||||||
| Alibaba Group Holding, Ltd. 2.125% 2/9/2031 | 1,590 | 1,318 | ||||||
| Allied Universal Holdco, LLC 4.625% 6/1/20284 | 2,242 | 2,041 | ||||||
| Amazon.com, Inc. 2.10% 5/12/2031 | 100 | 86 | ||||||
| Amazon.com, Inc. 3.60% 4/13/2032 | 600 | 572 | ||||||
| Amazon.com, Inc. 3.95% 4/13/2052 | 400 | 350 | ||||||
| Atlas LuxCo 4 SARL 4.625% 6/1/20284 | 470 | 430 | ||||||
| AutoNation, Inc. 3.85% 3/1/2032 | 300 | 267 | ||||||
| Carnival Corp. 5.75% 3/1/20274 | 1,250 | 1,220 | ||||||
| Carnival Corp. 6.00% 5/1/20294 | 2,205 | 2,123 | ||||||
| Carnival Corp. 7.00% 8/15/20294 | 520 | 543 | ||||||
| Carnival Corp. 10.50% 6/1/20304 | 540 | 591 | ||||||
| Daimler Trucks Finance North America, LLC 3.65% 4/7/20274 | 350 | 337 | ||||||
| Fertitta Entertainment, LLC 4.625% 1/15/20294 | 350 | 318 | ||||||
| Fertitta Entertainment, LLC 6.75% 1/15/20304 | 600 | 527 | ||||||
| Ford Motor Co. 3.25% 2/12/2032 | 790 | 657 | ||||||
| Ford Motor Co. 4.75% 1/15/2043 | 495 | 409 | ||||||
| Ford Motor Co. 5.291% 12/8/2046 | 1,066 | 940 | ||||||
| Ford Motor Credit Co., LLC 2.30% 2/10/2025 | 980 | 943 | ||||||
| Ford Motor Credit Co., LLC 5.125% 6/16/2025 | 837 | 827 | ||||||
| Ford Motor Credit Co., LLC 6.95% 6/10/2026 | 600 | 616 | ||||||
| Ford Motor Credit Co., LLC 2.70% 8/10/2026 | 1,475 | 1,367 | ||||||
| Ford Motor Credit Co., LLC 4.95% 5/28/2027 | 1,065 | 1,040 | ||||||
| Ford Motor Credit Co., LLC 5.113% 5/3/2029 | 50 | 49 | ||||||
| Ford Motor Credit Co., LLC 7.20% 6/10/2030 | 2,650 | 2,825 | ||||||
| Ford Motor Credit Co., LLC 7.122% 11/7/2033 | 278 | 300 | ||||||
| General Motors Financial Co., Inc. 2.35% 2/26/2027 | 75 | 69 | ||||||
| Hanesbrands, Inc. 9.00% 2/15/20314 | 1,744 | 1,711 | ||||||
| Hanesbrands, Inc., Term Loan B, (3-month USD CME Term SOFR + 3.75%) 9.106% 3/8/20303,6 | 254 | 254 | ||||||
| Home Depot, Inc. 1.375% 3/15/2031 | 125 | 102 | ||||||
| Hyundai Capital America 1.65% 9/17/20264 | 100 | 91 | ||||||
| International Game Technology PLC 5.25% 1/15/20294 | 650 | 637 | ||||||
| LCM Investments Holdings II, LLC 4.875% 5/1/20294 | 1,235 | 1,149 | ||||||
| LCM Investments Holdings II, LLC 8.25% 8/1/20314 | 1,180 | 1,233 | ||||||
| Lithia Motors, Inc. 3.875% 6/1/20294 | 58 | 52 | ||||||
| Lithia Motors, Inc. 4.375% 1/15/20314 | 650 | 592 | ||||||
| Macy’s Retail Holdings, LLC 5.875% 3/15/20304 | 50 | 48 | ||||||
| Marriott Ownership Resorts, Inc. 4.50% 6/15/20294 | 973 | 859 | ||||||
| Party City Holdings, Inc. 12.00% 12/31/20284 | 130 | 127 | ||||||
| RHP Hotel Properties, LP 7.25% 7/15/20284 | 317 | 330 | ||||||
| Royal Caribbean Cruises, Ltd. 5.375% 7/15/20274 | 650 | 644 | ||||||
| Royal Caribbean Cruises, Ltd. 3.70% 3/15/2028 | 1,510 | 1,393 | ||||||
| Royal Caribbean Cruises, Ltd. 5.50% 4/1/20284 | 706 | 697 | ||||||
| Royal Caribbean Cruises, Ltd. 8.25% 1/15/20294 | 800 | 851 | ||||||
| Scientific Games Holdings, LP 6.625% 3/1/20304 | 975 | 923 | ||||||
| Sonic Automotive, Inc. 4.625% 11/15/20294 | 485 | 442 | ||||||
| Sonic Automotive, Inc. 4.875% 11/15/20314 | 4,163 | 3,715 | ||||||
| Tapestry, Inc. 7.85% 11/27/2033 | 885 | 945 | ||||||
| Wynn Resorts Finance, LLC 5.125% 10/1/20294 | 457 | 432 | ||||||
| Wynn Resorts Finance, LLC 7.125% 2/15/20314 | 314 | 327 | ||||||
| 39,807 | ||||||||
| Utilities 2.04% | ||||||||
| Aegea Finance SARL 9.00% 1/20/20314 | 605 | 644 | ||||||
| AES Panama Generation Holdings SRL 4.375% 5/31/20304 | 196 | 165 | ||||||
| Alabama Power Co. 3.94% 9/1/2032 | 525 | 501 | ||||||
| Alabama Power Co. 5.85% 11/15/2033 | 300 | 323 | ||||||
| Consumers Energy Co. 3.60% 8/15/2032 | 415 | 385 | ||||||
| Consumers Energy Co. 4.625% 5/15/2033 | 625 | 624 | ||||||
| Duke Energy Corp. 4.50% 8/15/2032 | 860 | 833 | ||||||
| 30 | Capital Group Fixed Income ETF Trust |
Capital Group Core Plus Income ETF (continued)
| Bonds, notes & other debt instruments (continued) | Principal amount (000) | Value (000) | ||||||
| Corporate bonds, notes & loans (continued) | ||||||||
| Utilities (continued) | ||||||||
| Duke Energy Corp. 6.10% 9/15/2053 | USD | 300 | $ | 326 | ||||
| Edison International 6.95% 11/15/2029 | 310 | 337 | ||||||
| Electricité de France SA 9.125% junior subordinated perpetual bonds (5-year UST Yield Curve Rate T Note Constant Maturity + 5.411% on 6/15/2033)4,5 | 1,000 | 1,119 | ||||||
| Entergy Louisiana, LLC 4.75% 9/15/2052 | 200 | 184 | ||||||
| FirstEnergy Corp. 2.65% 3/1/2030 | 1,840 | 1,592 | ||||||
| FirstEnergy Corp. 2.25% 9/1/2030 | 585 | 493 | ||||||
| FirstEnergy Corp. 3.40% 3/1/2050 | 761 | 537 | ||||||
| Florida Power & Light Co. 5.30% 4/1/2053 | 60 | 63 | ||||||
| NiSource, Inc. 5.40% 6/30/2033 | 250 | 258 | ||||||
| Northern States Power Co. 2.60% 6/1/2051 | 50 | 33 | ||||||
| Oncor Electric Delivery Co., LLC 4.55% 9/15/2032 | 625 | 620 | ||||||
| Oncor Electric Delivery Co., LLC 2.70% 11/15/2051 | 175 | 116 | ||||||
| Pacific Gas and Electric Co. 3.15% 1/1/2026 | 40 | 38 | ||||||
| Pacific Gas and Electric Co. 4.65% 8/1/2028 | 450 | 433 | ||||||
| Pacific Gas and Electric Co. 4.55% 7/1/2030 | 755 | 720 | ||||||
| Pacific Gas and Electric Co. 3.25% 6/1/2031 | 200 | 173 | ||||||
| Pacific Gas and Electric Co. 5.90% 6/15/2032 | 250 | 255 | ||||||
| Pacific Gas and Electric Co. 6.40% 6/15/2033 | 1,700 | 1,790 | ||||||
| Pacific Gas and Electric Co. 3.50% 8/1/2050 | 8,145 | 5,640 | ||||||
| Pacific Gas and Electric Co. 6.75% 1/15/2053 | 2,930 | 3,195 | ||||||
| PacifiCorp 5.35% 12/1/2053 | 1,225 | 1,180 | ||||||
| PacifiCorp 5.50% 5/15/2054 | 300 | 295 | ||||||
| PG&E Corp. 5.25% 7/1/2030 | 996 | 962 | ||||||
| Public Service Company of Colorado 3.20% 3/1/2050 | 1,505 | 1,082 | ||||||
| Public Service Company of Colorado 2.70% 1/15/2051 | 402 | 254 | ||||||
| Public Service Company of Colorado 5.25% 4/1/2053 | 593 | 592 | ||||||
| Southern California Edison Co. 2.75% 2/1/2032 | 864 | 744 | ||||||
| Southern California Edison Co. 2.95% 2/1/2051 | 1,520 | 1,033 | ||||||
| Southern California Edison Co. 3.45% 2/1/2052 | 3,615 | 2,642 | ||||||
| Talen Energy Supply, LLC 8.625% 6/1/20304 | 1,567 | 1,666 | ||||||
| Xcel Energy, Inc. 4.60% 6/1/2032 | 75 | 73 | ||||||
| 31,920 | ||||||||
| Materials 1.79% | ||||||||
| Anglo American Capital PLC 2.25% 3/17/20284 | 200 | 178 | ||||||
| Anglo American Capital PLC 4.75% 3/16/20524 | 200 | 172 | ||||||
| Ball Corp. 6.875% 3/15/2028 | 890 | 925 | ||||||
| Ball Corp. 6.00% 6/15/2029 | 200 | 204 | ||||||
| BHP Billiton Finance (USA), Ltd. 4.90% 2/28/2033 | 314 | 321 | ||||||
| BHP Billiton Finance (USA), Ltd. 5.25% 9/8/2033 | 1,146 | 1,189 | ||||||
| BHP Billiton Finance (USA), Ltd. 5.50% 9/8/2053 | 1,227 | 1,340 | ||||||
| Braskem Idesa SAPI 6.99% 2/20/2032 | 200 | 117 | ||||||
| Braskem Netherlands Finance BV 8.75% 1/12/20314 | 1,280 | 1,192 | ||||||
| Braskem Netherlands Finance BV 7.25% 2/13/2033 | 1,345 | 1,134 | ||||||
| Braskem Netherlands Finance BV 7.25% 2/13/20334 | 475 | 400 | ||||||
| Celanese US Holdings, LLC 6.35% 11/15/2028 | 1,044 | 1,096 | ||||||
| Celanese US Holdings, LLC 6.55% 11/15/2030 | 799 | 846 | ||||||
| Celanese US Holdings, LLC 6.379% 7/15/2032 | 539 | 570 | ||||||
| Celanese US Holdings, LLC 6.70% 11/15/2033 | 807 | 876 | ||||||
| Cleveland-Cliffs, Inc. 4.875% 3/1/20314 | 300 | 272 | ||||||
| CSN Resources SA 8.875% 12/5/20304 | 1,700 | 1,773 | ||||||
| Dow Chemical Co. (The) 3.60% 11/15/2050 | 40 | 31 | ||||||
| EIDP, Inc. 4.80% 5/15/2033 | 695 | 703 | ||||||
| First Quantum Minerals, Ltd. 6.875% 10/15/20274 | 2,700 | 2,298 | ||||||
| FXI Holdings, Inc. 12.25% 11/15/20264 | 2,500 | 2,231 | ||||||
| International Flavors & Fragrances, Inc. 2.30% 11/1/20304 | 230 | 190 | ||||||
| International Flavors & Fragrances, Inc. 3.468% 12/1/20504 | 2,535 | 1,736 | ||||||
| LABL, Inc. 5.875% 11/1/20284 | 75 | 68 | ||||||
| LABL, Inc. 9.50% 11/1/20284 | 328 | 332 | ||||||
| LSB Industries, Inc. 6.25% 10/15/20284 | 248 | 236 | ||||||
| Mauser Packaging Solutions Holding Co. 7.875% 8/15/20264 | 696 | 709 | ||||||
| Capital Group Fixed Income ETF Trust | 31 |
Capital Group Core Plus Income ETF (continued)
| Bonds, notes & other debt instruments (continued) | Principal amount (000) | Value (000) | ||||||
| Corporate bonds, notes & loans (continued) | ||||||||
| Materials (continued) | ||||||||
| Mineral Resources, Ltd. 9.25% 10/1/20284 | USD | 1,030 | $ | 1,097 | ||||
| NOVA Chemicals Corp. 8.50% 11/15/20284 | 490 | 514 | ||||||
| NOVA Chemicals Corp. 4.25% 5/15/20294 | 1,360 | 1,147 | ||||||
| OCI NV 6.70% 3/16/20334 | 699 | 715 | ||||||
| Olympus Water US Holding Corp. 9.75% 11/15/20284 | 750 | 797 | ||||||
| Sasol Financing USA, LLC 8.75% 5/3/20294 | 1,065 | 1,088 | ||||||
| SCIH Salt Holdings, Inc. 4.875% 5/1/20284 | 742 | 695 | ||||||
| Sealed Air Corp. 6.125% 2/1/20284 | 607 | 613 | ||||||
| South32 Treasury, Ltd. 4.35% 4/14/20324 | 192 | 173 | ||||||
| 27,978 | ||||||||
| Real estate 1.67% | ||||||||
| Boston Properties, LP 2.55% 4/1/2032 | 1,481 | 1,181 | ||||||
| Boston Properties, LP 2.45% 10/1/2033 | 1,755 | 1,337 | ||||||
| Boston Properties, LP 6.50% 1/15/2034 | 1,776 | 1,876 | ||||||
| Crown Castle, Inc. 5.00% 1/11/2028 | 140 | 140 | ||||||
| Crown Castle, Inc. 5.80% 3/1/2034 | 928 | 961 | ||||||
| Equinix, Inc. 2.15% 7/15/2030 | 350 | 297 | ||||||
| Equinix, Inc. 2.50% 5/15/2031 | 400 | 340 | ||||||
| Equinix, Inc. 3.40% 2/15/2052 | 700 | 513 | ||||||
| Howard Hughes Corp. (The) 4.375% 2/1/20314 | 1,175 | 1,021 | ||||||
| Hudson Pacific Properties, LP 3.25% 1/15/2030 | 805 | 592 | ||||||
| Kennedy-Wilson, Inc. 4.75% 3/1/2029 | 1,325 | 1,108 | ||||||
| Kennedy-Wilson, Inc. 4.75% 2/1/2030 | 1,917 | 1,556 | ||||||
| Kennedy-Wilson, Inc. 5.00% 3/1/2031 | 2,350 | 1,869 | ||||||
| Prologis, LP 5.125% 1/15/2034 | 1,475 | 1,524 | ||||||
| Prologis, LP 5.25% 6/15/2053 | 514 | 537 | ||||||
| Public Storage Operating Co. 5.10% 8/1/2033 | 1,092 | 1,131 | ||||||
| Public Storage Operating Co. 5.35% 8/1/2053 | 1,162 | 1,215 | ||||||
| Service Properties Trust 4.75% 10/1/2026 | 1,375 | 1,285 | ||||||
| Service Properties Trust 3.95% 1/15/2028 | 970 | 796 | ||||||
| Service Properties Trust 4.95% 10/1/2029 | 800 | 663 | ||||||
| Service Properties Trust 4.375% 2/15/2030 | 1,893 | 1,472 | ||||||
| Service Properties Trust 8.625% 11/15/20314 | 2,245 | 2,353 | ||||||
| Sun Communities Operating, LP 2.70% 7/15/2031 | 40 | 33 | ||||||
| Sun Communities Operating, LP 4.20% 4/15/2032 | 649 | 593 | ||||||
| VICI Properties, LP 3.875% 2/15/20294 | 75 | 69 | ||||||
| VICI Properties, LP 4.125% 8/15/20304 | 250 | 228 | ||||||
| VICI Properties, LP 5.125% 5/15/2032 | 1,430 | 1,396 | ||||||
| 26,086 | ||||||||
| Consumer staples 1.54% | ||||||||
| 7-Eleven, Inc. 1.80% 2/10/20314 | 975 | 793 | ||||||
| 7-Eleven, Inc. 2.80% 2/10/20514 | 2,519 | 1,623 | ||||||
| Altria Group, Inc. 3.70% 2/4/2051 | 568 | 400 | ||||||
| B&G Foods, Inc. 5.25% 9/15/2027 | 400 | 364 | ||||||
| BAT Capital Corp. 2.259% 3/25/2028 | 100 | 90 | ||||||
| BAT Capital Corp. 4.742% 3/16/2032 | 250 | 240 | ||||||
| BAT Capital Corp. 6.421% 8/2/2033 | 573 | 600 | ||||||
| BAT Capital Corp. 4.758% 9/6/2049 | 1,351 | 1,073 | ||||||
| BAT Capital Corp. 3.984% 9/25/2050 | 2,582 | 1,821 | ||||||
| BAT Capital Corp. 5.65% 3/16/2052 | 929 | 840 | ||||||
| BAT Capital Corp. 7.081% 8/2/2053 | 4,900 | 5,243 | ||||||
| Constellation Brands, Inc. 4.35% 5/9/2027 | 326 | 323 | ||||||
| Constellation Brands, Inc. 4.75% 5/9/2032 | 1,483 | 1,478 | ||||||
| Constellation Brands, Inc. 4.90% 5/1/2033 | 636 | 640 | ||||||
| Coty, Inc. 6.625% 7/15/20304 | 490 | 504 | ||||||
| J. M. Smucker Co. (The) 6.20% 11/15/2033 | 372 | 406 | ||||||
| J. M. Smucker Co. (The) 6.50% 11/15/2043 | 96 | 107 | ||||||
| J. M. Smucker Co. (The) 6.50% 11/15/2053 | 269 | 311 | ||||||
| Keurig Dr Pepper, Inc. 3.20% 5/1/2030 | 40 | 37 | ||||||
| Kronos Acquisition Holdings, Inc. 5.00% 12/31/20264 | 250 | 244 | ||||||
| 32 | Capital Group Fixed Income ETF Trust |
Capital Group Core Plus Income ETF (continued)
| Bonds, notes & other debt instruments (continued) | Principal amount (000) | Value (000) | ||||||
| Corporate bonds, notes & loans (continued) | ||||||||
| Consumer staples (continued) | ||||||||
| Minerva Luxembourg SA 8.875% 9/13/20334 | USD | 930 | $ | 985 | ||||
| Philip Morris International, Inc. 5.625% 11/17/2029 | 335 | 351 | ||||||
| Philip Morris International, Inc. 5.75% 11/7/2032 | 1,297 | 1,362 | ||||||
| Philip Morris International, Inc. 5.375% 2/15/2033 | 300 | 308 | ||||||
| Philip Morris International, Inc. 5.625% 9/7/2033 | 1,900 | 1,985 | ||||||
| Post Holdings, Inc. 4.625% 4/15/20304 | 450 | 414 | ||||||
| Target Corp. 4.80% 1/15/2053 | 1,592 | 1,582 | ||||||
| 24,124 | ||||||||
| Information technology 0.90% | ||||||||
| Analog Devices, Inc. 1.70% 10/1/2028 | 25 | 22 | ||||||
| Analog Devices, Inc. 2.95% 10/1/2051 | 1,053 | 754 | ||||||
| Broadcom, Inc. 3.469% 4/15/20344 | 69 | 60 | ||||||
| Broadcom, Inc. 3.187% 11/15/20364 | 450 | 365 | ||||||
| Broadcom, Inc. 4.926% 5/15/20374 | 3,276 | 3,173 | ||||||
| Cloud Software Group, Inc. 6.50% 3/31/20294 | 530 | 505 | ||||||
| Cloud Software Group, Inc. 9.00% 9/30/20294 | 2,745 | 2,612 | ||||||
| CommScope, Inc. 4.75% 9/1/20294 | 400 | 269 | ||||||
| Entegris Escrow Corp. 4.75% 4/15/20294 | 445 | 429 | ||||||
| Finastra USA, Inc., Term Loan B, (3-month USD CME Term SOFR + 7.25%) 12.713% 9/13/20293,6,7 | 273 | 269 | ||||||
| Finastra USA, Inc., Term Loan, (3-month USD CME Term SOFR + 7.25%) 12.61% 9/13/20293,6,7 | 7 | 7 | ||||||
| NCR Atleos Corp. 9.50% 4/1/20294 | 900 | 957 | ||||||
| Oracle Corp. 3.60% 4/1/2050 | 1,299 | 963 | ||||||
| Oracle Corp. 3.95% 3/25/2051 | 450 | 353 | ||||||
| Oracle Corp. 5.55% 2/6/2053 | 824 | 825 | ||||||
| SK hynix, Inc. 6.50% 1/17/2033 | 890 | 940 | ||||||
| SK hynix, Inc. 6.50% 1/17/20334 | 210 | 222 | ||||||
| Tibco Software, Inc., Term Loan A, (3-month USD CME Term SOFR + 4.50%) 9.948% 9/29/20283,6 | 496 | 486 | ||||||
| Wolfspeed, Inc. 9.875% 6/23/2030 (10.875% on 6/23/2026)5,7,8 | 800 | 814 | ||||||
| 14,025 | ||||||||
| Total corporate bonds, notes & loans | 464,906 | |||||||
| U.S. Treasury bonds & notes 19.27% | ||||||||
| U.S. Treasury 18.15% | ||||||||
| U.S. Treasury 4.625% 6/30/2025 | 6,050 | 6,065 | ||||||
| U.S. Treasury 5.00% 8/31/2025 | 13,050 | 13,173 | ||||||
| U.S. Treasury 5.00% 9/30/2025 | 12,910 | 13,043 | ||||||
| U.S. Treasury 5.00% 10/31/2025 | 38,625 | 39,071 | ||||||
| U.S. Treasury 4.875% 11/30/2025 | 26,200 | 26,477 | ||||||
| U.S. Treasury 4.25% 12/31/2025 | 19,500 | 19,498 | ||||||
| U.S. Treasury 4.125% 6/15/2026 | 11,140 | 11,142 | ||||||
| U.S. Treasury 4.125% 9/30/2027 | 3,375 | 3,398 | ||||||
| U.S. Treasury 2.875% 8/15/2028 | 720 | 689 | ||||||
| U.S. Treasury 4.375% 8/31/20289 | 14,750 | 15,068 | ||||||
| U.S. Treasury 4.625% 9/30/2028 | 9,258 | 9,559 | ||||||
| U.S. Treasury 4.875% 10/31/2028 | 22,675 | 23,673 | ||||||
| U.S. Treasury 4.375% 11/30/2028 | 27,670 | 28,322 | ||||||
| U.S. Treasury 3.75% 12/31/2028 | 9,200 | 9,159 | ||||||
| U.S. Treasury 4.00% 7/31/2030 | 200 | 201 | ||||||
| U.S. Treasury 4.125% 8/31/2030 | 1,000 | 1,013 | ||||||
| U.S. Treasury 4.625% 9/30/2030 | 1,865 | 1,945 | ||||||
| U.S. Treasury 4.375% 11/30/2030 | 1,000 | 1,029 | ||||||
| U.S. Treasury 4.50% 11/15/2033 | 18,698 | 19,640 | ||||||
| U.S. Treasury 4.375% 8/15/20439 | 14,064 | 14,383 | ||||||
| U.S. Treasury 4.75% 11/15/2043 | 14,240 | 15,302 | ||||||
| U.S. Treasury 3.625% 5/15/2053 | 2,777 | 2,575 | ||||||
| U.S. Treasury 4.125% 8/15/2053 | 9,484 | 9,612 | ||||||
| 284,037 | ||||||||
| Capital Group Fixed Income ETF Trust | 33 |
Capital Group Core Plus Income ETF (continued)
| Bonds, notes & other debt instruments (continued) | Principal amount (000) | Value (000) | ||||||
| U.S. Treasury bonds & notes (continued) | ||||||||
| U.S. Treasury inflation-protected securities 1.12% | ||||||||
| U.S. Treasury Inflation-Protected Security 1.625% 10/15/202710 | USD | 17,761 | $ | 17,631 | ||||
| Total U.S. Treasury bonds & notes | 301,668 | |||||||
| Asset-backed obligations 6.84% | ||||||||
| ACHV ABS Trust, Series 2023-2PL, Class B, 6.88% 5/20/20301,4 | 318 | 319 | ||||||
| Affirm, Inc., Series 2023-B, Class D, 8.78% 9/15/20281,4 | 995 | 1,013 | ||||||
| Affirm, Inc., Series 2023-B, Class E, 11.32% 9/15/20281,4 | 1,447 | 1,476 | ||||||
| AGL CLO, Ltd., Series 2022-18A, Class B, (3-month USD CME Term SOFR + 2.00%) 7.412% 4/21/20311,3,4 | 1,500 | 1,503 | ||||||
| ALM Loan Funding, Series 2020-1A, Class A2, (3-month USD CME Term SOFR + 2.112%) 7.505% 10/15/20291,3,4 | 500 | 501 | ||||||
| American Credit Acceptance Receivables Trust, Series 2022-3, Class C, 4.86% 10/13/20281,4 | 701 | 696 | ||||||
| Avis Budget Rental Car Funding (AESOP), LLC, Series 2022-5, Class B, 7.09% 4/20/20271,4 | 2,394 | 2,441 | ||||||
| Avis Budget Rental Car Funding (AESOP), LLC, Series 2023-5, Class C, 6.85% 4/20/20281,4 | 3,333 | 3,343 | ||||||
| Avis Budget Rental Car Funding (AESOP), LLC, Series 2023-4A, Class B, 6.32% 6/20/20291,4 | 2,369 | 2,404 | ||||||
| Avis Budget Rental Car Funding (AESOP), LLC, Series 2023-4A, Class C, 7.24% 6/20/20291,4 | 890 | 911 | ||||||
| Avis Budget Rental Car Funding (AESOP), LLC, Series 2023-6, Class C, 7.03% 12/20/20291,4 | 4,000 | 4,044 | ||||||
| Brex Commercial Charge Card Master Trust, Series 2022-1, Class A, 4.63% 7/15/20251,4 | 1,000 | 991 | ||||||
| CF Hippolyta, LLC, Series 2020-1, Class B1, 2.28% 7/15/20601,4 | 486 | 445 | ||||||
| CFG Investments, Ltd., Series 2023-1, Class A, 8.56% 7/25/20341,4 | 1,530 | 1,549 | ||||||
| CPS Auto Receivables Trust, Series 2022-B, Class A, 2.88% 6/15/20261,4 | 102 | 102 | ||||||
| CPS Auto Receivables Trust, Series 2022-B, Class D, 5.19% 8/15/20281,4 | 1,250 | 1,223 | ||||||
| Credit Acceptance Auto Loan Trust, Series 2022-1A, Class C, 5.70% 10/15/20321,4 | 1,000 | 977 | ||||||
| Credit Acceptance Auto Loan Trust, Series 2022-1A, Class D, 6.63% 12/15/20321,4 | 1,000 | 978 | ||||||
| Exeter Automobile Receivables Trust, Series 2022-2A, Class D, 4.56% 7/17/20281 | 26 | 25 | ||||||
| Exeter Automobile Receivables Trust, Series 2023-2, Class E, 9.75% 11/15/20301,4 | 848 | 878 | ||||||
| Exeter Automobile Receivables Trust, Series 2023-3, Class E, 9.98% 1/15/20311,4 | 1,022 | 1,059 | ||||||
| Exeter Automobile Receivables Trust, Series 2023-4, Class E, 9.57% 2/18/20311,4 | 3,010 | 3,091 | ||||||
| Exeter Automobile Receivables Trust, Series 2023-5, Class E, 9.58% 6/16/20311,4 | 5,403 | 5,568 | ||||||
| Flagship Credit Auto Trust, Series 2023-3, Class E, 9.74% 6/17/20301,4 | 446 | 442 | ||||||
| Ford Credit Floorplan Master Owner Trust, Series 2023-1, Class D, 6.62% 5/15/20281,4 | 2,335 | 2,328 | ||||||
| GLS Auto Receivables Trust, Series 2023-3, Class E, 9.27% 8/15/20301,4 | 950 | 969 | ||||||
| GLS Auto Receivables Trust, Series 2023-4, Class E, 9.72% 8/15/20301,4 | 1,900 | 1,951 | ||||||
| Hertz Vehicle Financing III, LLC, Series 2023-1, Class C, 6.91% 6/25/20271,4 | 2,200 | 2,206 | ||||||
| Hertz Vehicle Financing III, LLC, Series 2023-1, Class 1D, 9.13% 6/25/20271,4 | 672 | 676 | ||||||
| Hertz Vehicle Financing III, LLC, Series 2023-3, Class D, 9.43% 2/25/20281,4 | 2,553 | 2,587 | ||||||
| Hertz Vehicle Financing III, LLC, Series 2022-2A, Class C, 2.95% 6/26/20281,4 | 300 | 268 | ||||||
| Hertz Vehicle Financing III, LLC, Series 2022-2, Class D, 5.16% 6/26/20281,4 | 2,389 | 2,148 | ||||||
| Hertz Vehicle Financing III, LLC, Series 2022-5, Class D, 6.78% 9/25/20281,4 | 1,792 | 1,686 | ||||||
| Hertz Vehicle Financing III, LLC, Series 2023-2, Class C, 7.13% 9/25/20291,4 | 2,167 | 2,209 | ||||||
| Hertz Vehicle Financing III, LLC, Series 2023-4, Class C, 7.51% 3/25/20301,4 | 3,950 | 4,104 | ||||||
| Hertz Vehicle Financing III, LLC, Series 2023-4, Class D, 9.44% 3/25/20301,4 | 2,496 | 2,560 | ||||||
| Hertz Vehicle Financing, LLC, Series 2021-2, Class D, 4.34% 12/27/20271,4 | 5,000 | 4,478 | ||||||
| LAD Auto Receivables Trust, Series 2023-1, Class C, 6.18% 12/15/20271,4 | 1,368 | 1,376 | ||||||
| Mission Lane Credit Card Master Trust, Series 2022-B, Class B, 10.42% 1/15/20281,7,8 | 465 | 470 | ||||||
| Mission Lane Credit Card Master Trust, Series 2022-B, Class D, 14.45% 1/15/20281,7,8 | 3,500 | 3,549 | ||||||
| Mission Lane Credit Card Master Trust, Series 2023-A, Class B, 8.15% 7/17/20281,4 | 2,459 | 2,462 | ||||||
| Mission Lane Credit Card Master Trust, Series 2023-A, Class C, 10.03% 7/17/20281,4 | 5,600 | 5,653 | ||||||
| Mission Lane Credit Card Master Trust, Series 2023-B, Class D, 12.43% 11/15/20281,4 | 5,000 | 5,069 | ||||||
| Mission Lane Credit Card Master Trust, Series 2023-B, Class E, 0.162% 11/15/20281,4 | 5,000 | 5,050 | ||||||
| OnDeck Asset Securitization Trust, LLC, Series 2023-1A, Class B, 8.25% 8/19/20301,4 | 1,364 | 1,377 | ||||||
| Prestige Auto Receivables Trust, Series 2023-1, Class D, 6.33% 4/16/20291,4 | 1,912 | 1,905 | ||||||
| Research-Driven Pagaya Motor Asset Trust I, Series 2022-3, Class A, 5.38% 11/25/20301,4 | 692 | 685 | ||||||
| 34 | Capital Group Fixed Income ETF Trust |
Capital Group Core Plus Income ETF (continued)
| Bonds, notes & other debt instruments (continued) | Principal amount (000) | Value (000) | ||||||
| Asset-backed obligations (continued) | ||||||||
| Research-Driven Pagaya Motor Asset Trust I, Series 2022-3, Class B, 6.58% 11/25/20301,4 | USD | 337 | $ | 332 | ||||
| Santander Drive Auto Receivables Trust, Series 2022-7, Class C, 6.69% 3/17/20311 | 796 | 812 | ||||||
| SMB Private Education Loan Trust, Series 2021-A, Class D1, 3.86% 1/15/20531,4 | 2,184 | 1,967 | ||||||
| SMB Private Education Loan Trust, Series 2021-A, Class D2, 3.86% 1/15/20531,4 | 1,111 | 1,001 | ||||||
| SMB Private Education Loan Trust, Series 2023-A, Class B, 5.88% 1/15/20531,4 | 2,490 | 2,464 | ||||||
| SMB Private Education Loan Trust, Series 2022-A, Class D, 4.75% 11/16/20541,4 | 208 | 195 | ||||||
| SMB Private Education Loan Trust, Series 2023-B, Class D, 7.56% 10/16/20561,4 | 5,000 | 4,984 | ||||||
| SMB Private Education Loan Trust, Series 2022-D, Class D, 7.23% 10/15/20581,4 | 2,000 | 2,005 | ||||||
| Westlake Automobile Receivables Trust, Series 2022-2A, Class D, 5.48% 9/15/20271,4 | 1,562 | 1,549 | ||||||
| 107,054 | ||||||||
| Bonds & notes of governments & government agencies outside the U.S. 1.55% | ||||||||
| Abu Dhabi (Emirate of) 1.70% 3/2/20314 | 300 | 255 | ||||||
| Angola (Republic of) 8.75% 4/14/2032 | 1,100 | 970 | ||||||
| Angola (Republic of) 8.75% 4/14/20324 | 800 | 706 | ||||||
| Argentine Republic 0.75% 7/9/2030 (1.75% on 7/9/2027)5 | 1,100 | 444 | ||||||
| Chile (Republic of) 2.45% 1/31/2031 | 400 | 349 | ||||||
| Chile (Republic of) 4.34% 3/7/2042 | 200 | 179 | ||||||
| Colombia (Republic of) 8.00% 4/20/2033 | 280 | 306 | ||||||
| Colombia (Republic of) 7.50% 2/2/2034 | 3,195 | 3,380 | ||||||
| Colombia (Republic of) 8.00% 11/14/2035 | 675 | 740 | ||||||
| Dominican Republic 4.50% 1/30/20304 | 500 | 462 | ||||||
| Dominican Republic 5.875% 1/30/2060 | 2,380 | 2,065 | ||||||
| Egypt (Arab Republic of) 8.75% 9/30/2051 | 2,239 | 1,422 | ||||||
| Export-Import Bank of India 2.25% 1/13/20314 | 250 | 210 | ||||||
| Honduras (Republic of) 5.625% 6/24/2030 | 1,740 | 1,555 | ||||||
| Mongolia (State of) 4.45% 7/7/2031 | 500 | 420 | ||||||
| Oman (Sultanate of) 7.00% 1/25/2051 | 980 | 1,060 | ||||||
| Oman (Sultanate of) 7.00% 1/25/20514 | 500 | 541 | ||||||
| Panama (Republic of) 2.252% 9/29/2032 | 1,200 | 878 | ||||||
| Panama (Republic of) 6.875% 1/31/2036 | 1,475 | 1,475 | ||||||
| Panama (Republic of) 4.50% 4/16/2050 | 200 | 139 | ||||||
| Panama (Republic of) 6.853% 3/28/2054 | 1,550 | 1,454 | ||||||
| Panama (Republic of) 4.50% 4/1/2056 | 550 | 371 | ||||||
| Senegal (Republic of) 6.75% 3/13/2048 | 2,141 | 1,689 | ||||||
| South Africa (Republic of) 5.875% 4/20/2032 | 1,003 | 953 | ||||||
| United Mexican States 4.50% 4/22/2029 | 450 | 444 | ||||||
| United Mexican States 4.75% 4/27/2032 | 860 | 830 | ||||||
| United Mexican States 6.338% 5/4/2053 | 985 | 1,005 | ||||||
| 24,302 | ||||||||
| Municipals 0.10% | ||||||||
| Texas 0.10% | ||||||||
| Brazoria County Industrial Dev. Corp., Solid Waste Disposal Facs. Rev. Bonds (Aleon Renewable Metals, LLC Project), Series 2023, AMT, 12.00% 6/1/20434 | 1,575 | 1,587 | ||||||
| Total bonds, notes & other debt instruments (cost: $1,504,054,000) | 1,541,457 | |||||||
| Common stocks 0.01% | Shares | |||||||
| Consumer discretionary 0.01% | ||||||||
| Party City Holdco, Inc.8 | 7,446 | 170 | ||||||
| Party City Holdco, Inc.4,8 | 74 | 2 | ||||||
| 172 | ||||||||
| Total common stocks (cost: $63,000) | 172 | |||||||
| Capital Group Fixed Income ETF Trust | 35 |
Capital Group Core Plus Income ETF (continued)
| Short-term securities 26.97% | Shares | Value (000) | ||||||
| Money market investments 26.97% | ||||||||
| Capital Group Central Cash Fund 5.44%11,12 | 4,220,941 | $ | 422,052 | |||||
| Total short-term securities (cost: $422,075,000) | 422,052 | |||||||
| Total investment securities 125.47% (cost: $1,926,192,000) | 1,963,681 | |||||||
| Other assets less liabilities (25.47)% | (398,631 | ) | ||||||
| Net assets 100.00% | $ | 1,565,050 | ||||||
Futures contracts
| Contracts | Type | Number of contracts | Expiration date | Notional amount (000) | Value and unrealized appreciation (depreciation) at 12/31/2023 (000) | |||||||||||
| 2 Year U.S. Treasury Note Futures | Long | 1,630 | 3/28/2024 | USD | 335,640 | $ | 2,797 | |||||||||
| 5 Year U.S. Treasury Note Futures | Long | 448 | 3/28/2024 | 48,731 | 451 | |||||||||||
| 10 Year U.S. Treasury Note Futures | Long | 1,041 | 3/19/2024 | 117,519 | 3,163 | |||||||||||
| 10 Year Ultra U.S. Treasury Note Futures | Short | 776 | 3/19/2024 | (91,580 | ) | (4,125 | ) | |||||||||
| 30 Year U.S. Treasury Bond Futures | Long | 242 | 3/19/2024 | 30,235 | 1,499 | |||||||||||
| 30 Year Ultra U.S. Treasury Bond Futures | Short | 422 | 3/19/2024 | (56,377 | ) | (4,476 | ) | |||||||||
| $ | (691 | ) | ||||||||||||||
Forward currency contracts
| Contract amount | Unrealized appreciation depreciation | ||||||||||||||
| Currency purchased (000) | Currency sold (000) | Counterparty | Settlement date | at 12/31/2023 (000) | |||||||||||
| USD | 200 | EUR | 216 | Bank of America | 1/8/2024 | $ | (5 | ) | |||||||
| USD | 245 | EUR | 264 | Standard Chartered Bank | 1/8/2024 | (7 | ) | ||||||||
| USD | 365 | EUR | 394 | HSBC Bank USA | 1/8/2024 | (9 | ) | ||||||||
| $ | (21 | ) | |||||||||||||
Swap contracts
Interest rate swaps
Centrally cleared interest rate swaps
| Receive | Pay | Notional | Value at | Upfront premium paid | Unrealized appreciation (depreciation) | |||||||||||||||||||
| Rate | Payment frequency | Rate | Payment frequency | Expiration date | amount (000) | 12/31/2023 (000) | (received) (000) | at 12/31/2023 (000) | ||||||||||||||||
| SOFR | Annual | 2.121% | Annual | 3/28/2024 | USD5,700 | $ | 46 | $ | — | $ | 46 | |||||||||||||
| 5.0145% | Annual | SOFR | Annual | 10/27/2025 | 275,000 | 3,952 | — | 3,952 | ||||||||||||||||
| SOFR | Annual | 3.3885% | Annual | 4/18/2028 | 35,000 | 267 | — | 267 | ||||||||||||||||
| 4.175% | Annual | SOFR | Annual | 11/21/2028 | 140,000 | 3,981 | — | 3,981 | ||||||||||||||||
| SOFR | Annual | 3.1585 | Annual | 1/18/2033 | 43,000 | 1,017 | — | 1,017 | ||||||||||||||||
| SOFR | Annual | 3.2205 | Annual | 4/18/2033 | 58,000 | 1,130 | — | 1,130 | ||||||||||||||||
| 4.133% | Annual | SOFR | Annual | 11/20/2043 | 16,000 | 1,495 | — | 1,495 | ||||||||||||||||
| SOFR | Annual | 3.959 | Annual | 11/21/2053 | 10,000 | (1,190 | ) | — | (1,190 | ) | ||||||||||||||
| $ | 10,698 | $ | — | $ | 10,698 | |||||||||||||||||||
| 36 | Capital Group Fixed Income ETF Trust |
Capital Group Core Plus Income ETF (continued)
Swap contracts (continued)
Interest rate swaps (continued)
Bilateral interest rate swaps
| Receive | Pay | Notional | Value at | Upfront premium paid | Unrealized appreciation (depreciation) | ||||||||||||||||||||
| Rate | Payment frequency | Rate | Payment frequency | Counterparty | Expiration date | amount (000) | 12/31/2023 (000) | (received) (000) | at 12/31/2023 (000) | ||||||||||||||||
| 12.54% | At maturity | BZDIOVER | At maturity | Barclays Bank PLC | 1/2/2026 | BRL19,454 | $ | 225 | $ | — | $ | 225 | |||||||||||||
Investments in affiliates12
| Value at 1/1/2023 (000) | Additions (000) | Reductions (000) | Net realized gain (loss) (000) | Net unrealized appreciation (depreciation) (000) | Value at 12/31/2023 (000) | Dividend or interest income (000) | ||||||||||||||||||||||
| Short-term securities 26.97% | ||||||||||||||||||||||||||||
| Money market investments 26.97% | ||||||||||||||||||||||||||||
| Capital Group Central Cash Fund 5.44%11 | $ | 49,881 | $ | 723,798 | $ | 351,593 | $ | (8 | ) | $ | (26 | ) | $ | 422,052 | $ | 12,157 | ||||||||||||
Restricted securities7
| Acquisition date(s) | Cost (000) | Value (000) | Percent of net assets | |||||||||||
| Mission Lane Credit Card Master Trust, Series 2022-B, Class D, 14.45% 1/15/20281,8 | 12/6/2022 | $ | 3,500 | $ | 3,549 | .23 | % | |||||||
| Mission Lane Credit Card Master Trust, Series 2022-B, Class B, 10.42% 1/15/20281,8 | 12/6/2022 | 465 | 470 | .03 | ||||||||||
| Wolfspeed, Inc. 9.875% 6/23/2030 (10.875% on 6/23/2026)5,8 | 6/23/2023 | 770 | 814 | .06 | ||||||||||
| Finastra USA, Inc., Term Loan B, (3-month USD CME Term SOFR + 7.25%) 12.713% 9/13/20293,6 | 9/12/2023 | 268 | 269 | .02 | ||||||||||
| Finastra USA, Inc., Term Loan, (3-month USD CME Term SOFR + 7.25%) 12.61% 9/13/20293,6 | 9/12/2023 | 7 | 7 | .00 | ||||||||||
| $ | 5,010 | $ | 5,109 | .34 | % | |||||||||
| 1 | Principal payments may be made periodically. Therefore, the effective maturity date may be earlier than the stated maturity date. |
| 2 | Purchased on a TBA basis. |
| 3 | Coupon rate may change periodically. Reference rate and spread are as of the most recent information available. Some coupon rates are determined by the issuer or agent based on current market conditions; therefore, the reference rate and spread are not available. |
| 4 | Acquired in a transaction exempt from registration under Rule 144A or, for commercial paper, Section 4(a)(2) of the Securities Act of 1933. May be resold in the U.S. in transactions exempt from registration, normally to qualified institutional buyers. The total value of all such securities was $351,072,000, which represented 22.43% of the net assets of the fund. |
| 5 | Step bond; coupon rate may change at a later date. |
| 6 | Loan participations and assignments; may be subject to legal or contractual restrictions on resale. The total value of all such loans was $1,048,000, which represented 0.07% of the net assets of the fund. |
| 7 | Restricted security, other than Rule 144A securities or commercial paper issued pursuant to Section 4(a)(2) of the Securities Act of 1933. The total value of all such restricted securities was $5,109,000, which represented 0.34% of the net assets of the fund. |
| 8 | Value determined using significant unobservable inputs. |
| 9 | All or a portion of this security was pledged as collateral. The total value of pledged collateral was $7,037,000, which represented .45% of the net assets of the fund. |
| 10 | Index-linked bond whose principal amount moves with a government price index. |
| 11 | Rate represents the seven-day yield at December 31, 2023. |
| 12 | Part of the same “group of investment companies” as the fund as defined under the Investment Company Act of 1940, as amended. |
| Capital Group Fixed Income ETF Trust | 37 |
Capital Group Core Plus Income ETF (continued)
Key to abbreviation(s)
AMT = Alternative Minimum Tax
Assn. = Association
BRL = Brazilian reais
BZDIOVER = Overnight Brazilian Interbank Deposit Rate
CLO = Collateralized Loan Obligations
CME = CME Group
DAC = Designated Activity Company
Dev. = Development
EUR = Euros
Facs. = Facilities
Rev. = Revenue
SOFR = Secured Overnight Financing Rate
TBA = To-be-announced
USD = U.S. dollars
Refer to the notes to financial statements.
| 38 | Capital Group Fixed Income ETF Trust |
Capital Group Municipal Income ETF
Investment portfolio December 31, 2023
| Portfolio quality summary* | Percent of net assets | |||
| AAA/Aaa | 16.98 | % | ||
| AA/Aa | 35.66 | |||
| A/A | 18.70 | |||
| BBB/Baa | 10.48 | |||
| Below investment grade | 11.47 | |||
| Short-term securities & other assets less liabilities | 6.71 | |||
| * | Bond ratings, which typically range from AAA/Aaa (highest) to D (lowest), are assigned by credit rating agencies such as Standard & Poor’s, Moody’s and/or Fitch as an indication of an issuer’s creditworthiness. In assigning a credit rating to a security, the fund looks specifically to the ratings assigned to the issuer of the security by Standard & Poor’s, Moody’s and/or Fitch. If agency ratings differ, the security will be considered to have received the highest of those ratings, consistent with the fund’s investment policies. The ratings are not covered by the Report of Independent Registered Public Accounting Firm. |
| Bonds, notes & other debt instruments 93.29% | Principal amount (000) | Value (000) | ||||||
| Alabama 2.59% | ||||||||
| Black Belt Energy Gas Dist., Gas Project Rev. Bonds, Series 2022-B-1, 5.25% 2/1/2053 (put 6/1/2029) | USD | 600 | $ | 641 | ||||
| Black Belt Energy Gas Dist., Gas Project Rev. Bonds, Series 2023-C, 5.50% 10/1/2054 (put 6/1/2032) | 1,000 | 1,106 | ||||||
| Black Belt Energy Gas Dist., Gas Project Rev. Bonds (Project No. 8), Series 2022-A, 4.00% 12/1/2052 (put 12/1/2029) | 1,250 | 1,233 | ||||||
| Black Belt Energy Gas Dist., Gas Project Rev. Ref. Bonds, Series 2023-D-1, 5.50% 6/1/2049 (put 2/1/2029) | 550 | 589 | ||||||
| Black Belt Energy Gas Dist., Gas Supply Prepay Rev. Bonds (Project No. 4), Series 2019-A, 4.00% 12/1/2049 (put 12/1/2025) | 500 | 501 | ||||||
| Black Belt Energy Gas Dist., Gas Supply Rev. Bonds, Series 2021-A, 4.00% 6/1/2051 (put 12/1/2031) | 2,000 | 2,015 | ||||||
| Black Belt Energy Gas Dist., Gas Supply Rev. Bonds, Series 2022-F, 5.50% 11/1/2053 (put 12/1/2028) | 750 | 801 | ||||||
| Black Belt Energy Gas Dist., Gas Supply Rev. Bonds, Series 2023-B, 5.25% 12/1/2053 (put 12/1/2026) | 1,885 | 2,052 | ||||||
| Energy Southeast, Energy Supply Rev. Bonds (A Cooperative Dist.), Series 2023-A-1, 5.50% 11/1/2053 (put 1/1/2031) | 2,010 | 2,202 | ||||||
| County of Jefferson, Sewer Rev. Warrants, Series 2013-D, 6.50% 10/1/2053 | 1,000 | 1,050 | ||||||
| Southeast Energy Auth., Commodity Supply Rev. Bonds (Project No. 2), Series 2021-B-1, 4.00% 12/1/2051 (put 12/1/2031) | 500 | 500 | ||||||
| Board of Trustees of the University of Alabama, General Rev. Bonds, Series 2014-B, 4.00% 7/1/2031 | 625 | 678 | ||||||
| 13,368 | ||||||||
| Alaska 0.29% | ||||||||
| International Airport System, Rev. Ref. Bonds, Series 2021-C, AMT, 5.00% 10/1/2026 | 1,455 | 1,522 | ||||||
| Arizona 1.89% | ||||||||
| Industrial Dev. Auth., Charter School Rev. Bonds (Equitable School Revolving Fund), Series 2023-A, 5.00% 11/1/2028 | 450 | 488 | ||||||
| Industrial Dev. Auth., Charter School Social Rev. Bonds (Equitable School Revolving Fund), Series 2021-A, 4.00% 11/1/2040 | 500 | 504 | ||||||
| Industrial Dev. Auth., Education Rev. Bonds (Academies of Math & Science Projects), Series 2019, 4.00% 7/1/20291 | 200 | 195 | ||||||
| Industrial Dev. Auth., Education Rev. Bonds (Pinecrest Academy of Northern Nevada Project), Series 2022-A, 4.50% 7/15/20291 | 1,000 | 948 | ||||||
| Industrial Dev. Auth., Education Rev. Bonds (Somerset Academy of Las Vegas - Aliante and Skye Canyon Campus Projects), Series 2021-A, 3.00% 12/15/20311 | 235 | 207 | ||||||
| Industrial Dev. Auth., Education Rev. Ref. Bonds (Doral Academy of Northern Nevada Project), Series 2021-A, 4.00% 7/15/20291 | 200 | 193 | ||||||
| Industrial Dev. Auth., Education Rev. Ref. Bonds (Doral Academy of Northern Nevada Project), Series 2021-A, 4.00% 7/15/20301 | 200 | 192 | ||||||
| Industrial Dev. Auth., Municipal Certs., Series 2019-2, Class A, 3.625% 5/20/2033 | 694 | 657 | ||||||
| Capital Group Fixed Income ETF Trust | 39 |
Capital Group Municipal Income ETF (continued)
| Bonds, notes & other debt instruments (continued) | Principal amount (000) | Value (000) | ||||||
| Arizona (continued) | ||||||||
| County of Maricopa, Industrial Dev. Auth., Facs. Rev. Bonds (Commercial Metals Co. Project), Series 2022, AMT, 4.00% 10/15/20471 | USD | 500 | $ | 437 | ||||
| County of Maricopa, Industrial Dev. Auth., Solid Waste Disposal Rev. Bonds (Waste Management, Inc. Project), Series 2001, AMT, 3.375% 12/1/2031 (put 6/3/2024) | 750 | 747 | ||||||
| County of Maricopa, Pollution Control Rev. Ref. Bonds (El Paso Electric Co. Palo Verde Project), Series 2009-A, 3.60% 2/1/2040 | 750 | 686 | ||||||
| Maricopa County Pollution Control Corp., Pollution Control Rev. Ref. Bonds (Palo Verde Project), Series 2009-B, 3.60% 4/1/2040 | 490 | 448 | ||||||
| Maricopa County Pollution Control Corp., Pollution Control Rev. Ref. Bonds (Southern California Edison Co.), Series 2000-A, 2.40% 6/1/2035 | 1,500 | 1,224 | ||||||
| Maricopa County Pollution Control Corp., Pollution Control Rev. Ref. Bonds (Southern California Edison Co.), Series 2000-B, 2.40% 6/1/2035 | 820 | 669 | ||||||
| Transportation Board, Highway Rev. and Rev. Ref. Bonds, Series 2023, 5.00% 7/1/2026 | 1,000 | 1,060 | ||||||
| Board of Regents of the University of Arizona, System Rev. Bonds, Series 2019-A, 5.00% 6/1/2042 | 1,000 | 1,088 | ||||||
| 9,743 | ||||||||
| Arkansas 0.06% | ||||||||
| Dev. Fin. Auth., Industrial Dev. Rev. Bonds (Big River Steel Project), Series 2019, AMT, 4.50% 9/1/20491 | 315 | 314 | ||||||
| California 10.08% | ||||||||
| Community Choice Fncg. Auth., Clean Energy Project Rev. Green Bonds, Series 2021-B-1, 4.00% 2/1/2052 (put 8/1/2031) | 1,000 | 1,007 | ||||||
| Community Choice Fncg. Auth., Clean Energy Project Rev. Green Bonds, Series 2023-B-1, 5.00% 7/1/2053 (put 8/1/2029) | 700 | 744 | ||||||
| Community Choice Fncg. Auth., Clean Energy Project Rev. Green Bonds, Series 2023-E-1, 5.00% 2/1/2054 (put 3/1/2031) | 850 | 918 | ||||||
| Community Choice Fncg. Auth., Clean Energy Project Rev. Green Bonds, Series 2023-F, 5.50% 10/1/2054 (put 11/1/2030) | 900 | 999 | ||||||
| Community Choice Fncg. Auth., Clean Energy Project Rev. Green Bonds, Series 2023-G, 5.25% 11/1/2054 (put 4/1/2030) | 1,000 | 1,083 | ||||||
| CSCDA Community Improvement Auth., Essential Housing Social Rev. Bonds (Millennium South Bay - Hawthorne), Series 2021-A-1, 3.375% 7/1/20431 | 750 | 603 | ||||||
| Davis Joint Unified School Dist., G.O Bonds, 2018 Election, Series 2020, BAM insured, 3.00% 8/1/2034 | 750 | 737 | ||||||
| Educational Facs. Auth., Rev. Bonds (Saint Mary’s College of California), Series 2023-A, 5.00% 10/1/2038 | 525 | 560 | ||||||
| Escondido Union High School Dist., G.O. Bonds, Capital Appreciation Bonds, 2008 Election, Series 2009-A, Assured Guaranty insured, 0% 8/1/2028 | 500 | 439 | ||||||
| Freddie Mac, Multi Family Certs., Series 2023, 4.00% 1/25/20402 | 547 | 495 | ||||||
| Freddie Mac, Multi Family Mortgage Green Bonds, Series 2023, Class ACA, 2.25% 9/25/2037 | 1,247 | 1,007 | ||||||
| Fremont Unified School Dist., G.O. Bonds, 2014 Election, Series 2021-D, 3.00% 8/1/2033 | 1,600 | 1,598 | ||||||
| G.O. Bonds, Series 2017, 4.00% 11/1/2026 | 800 | 833 | ||||||
| G.O. Rev. Ref. Bonds, Series 2019, 5.00% 4/1/2032 | 500 | 602 | ||||||
| G.O. Rev. Ref. Bonds, Series 2015-C, 5.00% 8/1/2033 | 2,000 | 2,044 | ||||||
| G.O. Rev. Ref. Bonds, Series 2019, 3.00% 10/1/2037 | 500 | 473 | ||||||
| Glendale Community College Dist., G.O. Rev. Ref. Bonds, Capital Appreciation Bonds, 2016 Election, Series 2020-B, 0% 8/1/2032 | 500 | 377 | ||||||
| Glendale Community College Dist., G.O. Rev. Ref. Bonds, Capital Appreciation Bonds, 2016 Election, Series 2020-B, 0% 8/1/2036 | 1,000 | 637 | ||||||
| Golden State Tobacco Securitization Corp., Enhanced Tobacco Settlement Asset-Backed Bonds, Capital Appreciation Bonds, Series 2005-A, Assured Guaranty Municipal insured, 0% 6/1/2025 (escrowed to maturity) | 1,000 | 961 | ||||||
| Health Facs. Fncg. Auth., Rev. Bonds (Cedars-Sinai Medical Center), Series 2021-A, 3.00% 8/15/2051 | 500 | 408 | ||||||
| Health Facs. Fncg. Auth., Rev. Bonds (Children’s Hospital of Orange County), Series 2021-A, 3.00% 11/1/2038 | 635 | 582 | ||||||
| 40 | Capital Group Fixed Income ETF Trust |
Capital Group Municipal Income ETF (continued)
| Bonds, notes & other debt instruments (continued) | Principal amount (000) | Value (000) | ||||||
| California (continued) | ||||||||
| Health Facs. Fncg. Auth., Rev. Bonds (Providence Health & Services), Series 2014-A, 5.00% 10/1/2024 | USD | 580 | $ | 587 | ||||
| Housing Fin. Agcy., Municipal Certs., Series 2021-A-1, 3.50% 11/20/2035 | 480 | 467 | ||||||
| Housing Fin. Agcy., Municipal Certs., Series 2023-1, Class A, 4.375% 9/20/2036 | 1,793 | 1,801 | ||||||
| Infrastructure and Econ. Dev. Bank, Rev. Bonds (WFCS Portfolio Projects), Series 2021-A-1, 5.00% 1/1/20561 | 500 | 387 | ||||||
| City of Long Beach, Harbor Rev. Bonds, Series 2015-C, AMT, 5.00% 5/15/2026 | 720 | 738 | ||||||
| City of Los Angeles, Dept. of Airports, Los Angeles International Airport, Rev. Bonds, Series 2019-D, AMT, 5.00% 5/15/2026 | 495 | 515 | ||||||
| City of Los Angeles, Dept. of Airports, Los Angeles International Airport, Rev. Bonds, Series 2018-A, AMT, 5.00% 5/15/2037 | 1,000 | 1,061 | ||||||
| City of Los Angeles, Dept. of Airports, Los Angeles International Airport, Rev. Bonds, Series 2019-F, AMT, 5.00% 5/15/2039 | 1,000 | 1,062 | ||||||
| City of Los Angeles, Dept. of Airports, Los Angeles International Airport, Rev. Bonds, Series 2018-A, AMT, 4.00% 5/15/2048 | 1,000 | 979 | ||||||
| City of Los Angeles, Dept. of Water and Power, Power System Rev. Bonds, Series 2022-C, 5.00% 7/1/2042 | 1,000 | 1,145 | ||||||
| Monrovia Unified School Dist., G.O. Bonds, Capital Appreciation Bonds, 1997 Election, Series 2001-B, National insured, 0% 8/1/2032 | 750 | 574 | ||||||
| Municipal Fin. Auth., Rev. Ref. Bonds (Biola University), Series 2017, 5.00% 10/1/2030 | 500 | 532 | ||||||
| Municipal Fin. Auth., Solid Waste Disposal Rev. Bonds (Waste Management, Inc. Project), Series 2019-A, AMT, 2.40% 10/1/2044 (put 10/1/2029) | 1,420 | 1,317 | ||||||
| Municipal Fin. Auth., Special Fac. Rev. Bonds (United Airlines, Inc. Los Angeles International Airport Project), Series 2019, AMT, 4.00% 7/15/2029 | 1,000 | 984 | ||||||
| Newport-Mesa Unified School Dist., G.O. Bonds, Capital Appreciation Bonds, 2005 Election, Series 2011, National insured, 0% 8/1/2033 | 700 | 540 | ||||||
| Northern California Energy Auth., Commodity Supply Rev. Bonds, Series 2018, 4.00% 7/1/2049 (put 7/1/2024) | 2,000 | 2,002 | ||||||
| Oakland Unified School Dist., G.O. Bonds, 2012 Election, Series 2019-A, Assured Guaranty Municipal insured, 4.00% 8/1/2034 | 1,000 | 1,040 | ||||||
| Oakland Unified School Dist., G.O. Bonds, 2020 Election, Series 2021-A, 5.00% 8/1/2035 | 1,495 | 1,761 | ||||||
| County of Orange, Community Facs. Dist. No. 2023-1 (Rienda Phase 2B), Special Tax Bonds, Series 2023-A, 5.50% 8/15/2038 | 450 | 477 | ||||||
| Public Fin. Auth., Rev. Ref. Bonds (Sharp Healthcare), Series 2024-A, 5.00% 8/1/2030 | 1,020 | 1,187 | ||||||
| Public Works Board, Lease Rev. Green Bonds (Dept. of General Services, Sacramento Region New Natural Resources Headquarters), Series 2021-C, 4.00% 11/1/2041 | 1,000 | 1,037 | ||||||
| Public Works Board, Lease Rev. Ref. Bonds (Various Capital Projects), Series 2023-C, 5.00% 9/1/2035 | 1,050 | 1,288 | ||||||
| Public Works Board, Lease Rev. Ref. Bonds (Various Capital Projects), Series 2021-B, 4.00% 5/1/2041 | 1,405 | 1,454 | ||||||
| Rialto Unified School Dist., G.O. Bonds, 2022 Election, Series 2023, BAM insured, 0% 8/1/2028 | 115 | 99 | ||||||
| Rialto Unified School Dist., G.O. Bonds, 2022 Election, Series 2023, BAM insured, 0% 8/1/2029 | 140 | 117 | ||||||
| Rowland Unified School Dist., G.O. Bonds, 2006 Election, Capital Appreciation Bonds, Series 2009-B, 0% 8/1/2034 | 500 | 339 | ||||||
| San Diego Unified School Dist., G.O. Dedicated Unlimited Ad Valorem Property Tax Bonds, 2008 Election, Series 2012-E, 0% 7/1/2034 | 750 | 537 | ||||||
| San Diego Unified School Dist., G.O. Dedicated Unlimited Ad Valorem Property Tax Green Bonds, 2018 Election, Series 2023-G-3, 4.00% 7/1/2053 | 1,000 | 1,001 | ||||||
| City and County of San Francisco, Airport Commission, San Francisco International Airport, Rev. Ref. Bonds, Series 2019-A-2, AMT, 5.00% 5/1/2044 | 500 | 523 | ||||||
| City and County of San Francisco, Community Facs. Dist. No. 2016-1 (Treasure Island), Improvement Area No. 2, Special Tax Bonds, Series 2023-A, 5.00% 9/1/20331 | 800 | 849 | ||||||
| City and County of San Francisco, Community Facs. Dist. No. 2016-1 (Treasure Island), Improvement Area No. 2, Special Tax Bonds, Series 2023-A, 5.00% 9/1/20381 | 710 | 725 | ||||||
| Capital Group Fixed Income ETF Trust | 41 |
Capital Group Municipal Income ETF (continued)
| Bonds, notes & other debt instruments (continued) | Principal amount (000) | Value (000) | ||||||
| California (continued) | ||||||||
| City and County of San Francisco, Special Tax Dist. No. 2020-1 (Mission Rock Facs. and Services), Shoreline Special Tax Bonds, Series 2023-C, 5.25% 9/1/20381 | USD | 875 | $ | 921 | ||||
| San Jacinto Unified School Dist., G.O. Bonds, 2016 Election, Series 2022, 4.00% 8/1/2043 | 1,105 | 1,145 | ||||||
| City of San Jose, Airport Rev. Ref. Bonds, Series 2017-A, AMT, 5.00% 3/1/2041 | 1,500 | 1,537 | ||||||
| City of San Jose, Multi Family Housing Rev. Bonds (Parkmoor), Series 2023-F-2, 5.00% 6/1/2027 (put 6/1/2026) | 215 | 224 | ||||||
| Statewide Communities Dev. Auth., Student Housing Rev. Ref. Bonds (CHF-Irvine, LLC - University of California, Irvine East Campus Apartments, Phase I Ref. and Phase IV-B), Series 2021, BAM insured, 5.00% 5/15/2027 | 500 | 533 | ||||||
| Stockton Unified School Dist., G.O. Bonds, 2018 Election, Series 2021-B, Assured Guaranty Municipal insured, 4.00% 8/1/2034 | 1,300 | 1,425 | ||||||
| Stockton Unified School Dist., G.O. Bonds, Capital Appreciation Bonds, 2008 Election, Series 2011-D, Assured Guaranty Municipal insured, 0% 8/1/2033 | 1,000 | 734 | ||||||
| City of Vernon, Electric System Rev. Bonds, Series 2021-A, 5.00% 4/1/2025 | 750 | 761 | ||||||
| Whittier Union High School Dist., G.O. Rev. Ref. Bonds, Capital Appreciation Bonds, Series 2016, 0% 8/1/2032 | 750 | 573 | ||||||
| 52,085 | ||||||||
| Colorado 2.52% | ||||||||
| County of Adams, The Village at Dry Creek Metropolitan Dist. No. 2, Limited Tax G.O. and Special Rev. Bonds, Series 2019, 4.375% 12/1/2044 | 500 | 445 | ||||||
| City of Brighton, Brighton Crossing Metropolitan Dist. No. 6, Limited Tax G.O. Bonds, Series 2020-A, 5.00% 12/1/2035 | 530 | 510 | ||||||
| City and County of Denver, Airport System Rev. Bonds, Series 2022-A, AMT, 5.00% 11/15/2028 | 1,250 | 1,360 | ||||||
| City and County of Denver, Airport System Rev. Bonds, Series 2018-A, AMT, 5.00% 12/1/2034 | 1,145 | 1,321 | ||||||
| City and County of Denver, Broadway Park North Metropolitan Dist. No. 2, Limited Tax G.O. Rev. Ref. and Improvement Bonds, Series 2020, 5.00% 12/1/20401 | 835 | 806 | ||||||
| City and County of Denver, School Dist. No. 1, G.O. Rev. Ref. Bonds, Series 2021-B, 4.00% 12/1/2027 | 1,500 | 1,590 | ||||||
| E-470 Public Highway Auth., Rev. Bonds, Capital Appreciation Bonds, Series 2004-A, National insured, 0% 9/1/2027 | 500 | 449 | ||||||
| Health Facs. Auth., Rev. Ref. Bonds (Covenant Retirement Communities, Inc.), Series 2015-A, 5.00% 12/1/2035 | 500 | 504 | ||||||
| Housing and Fin. Auth., Multi Family Housing Rev. Bonds (Wintergreen Ridge Apartments Project), Series 2023, 4.00% 5/1/2041 (put 5/1/2025) | 275 | 276 | ||||||
| Housing and Fin. Auth., Single Family Mortgage Bonds, Series 2023-I, Class III, 6.00% 5/1/2053 | 1,000 | 1,107 | ||||||
| City of Lone Tree, Rampart Range Metropolitan Dist. No. 5, Limited Tax Supported and Special Rev. Bonds, Series 2021, 4.00% 12/1/2036 | 500 | 424 | ||||||
| Town of Parker, Cottonwood Highlands Metropolitan Dist. No. 1, Limited Tax G.O. Bonds (Convertible to Unlimited Tax), Series 2019-A, 5.00% 12/1/2049 | 500 | 468 | ||||||
| Regional Transportation Dist., Private Activity Bonds (Denver Transit Partners Eagle P3 Project), Series 2020-A, 4.00% 7/15/2033 | 500 | 522 | ||||||
| Town of Superior, STC Metropolitan Dist. No. 2, Limited Tax G.O. and Special Rev. Ref. and Improvement Bonds, Series 2019-A, 4.00% 12/1/2029 | 500 | 468 | ||||||
| Talon Pointe Metropolitan Dist., G.O. Rev. Ref. and Improvement Bonds, Series 2019-A, 5.25% 12/1/2039 | 955 | 795 | ||||||
| Regents of the University of Colorado, University Enterprise Rev. Ref. Bonds, Series 2017-A-2, 4.00% 6/1/2039 | 1,500 | 1,529 | ||||||
| Town of Windsor, Great Western Metropolitan Dist. No. 5, Limited Tax G.O. Rev. Ref. Bonds, Series 2020, 4.75% 12/1/2050 | 500 | 444 | ||||||
| 13,018 | ||||||||
| 42 | Capital Group Fixed Income ETF Trust |
Capital Group Municipal Income ETF (continued)
| Bonds, notes & other debt instruments (continued) | Principal amount (000) | Value (000) | ||||||
| Connecticut 0.64% | ||||||||
| Health and Educational Facs. Auth., Rev. Bonds (Connecticut Children’s Medical Center Issue), Series 2023-E, 5.00% 7/15/2038 | USD | 555 | $ | 609 | ||||
| Housing Fin. Auth., Housing Mortgage Fin. Program Bonds, Series 2018-E-1, 4.25% 5/15/2042 | 365 | 366 | ||||||
| Mohegan Tribe of Indians, Gaming Auth., Priority Distribution Payment Rev. Ref. Bonds, Series 2015-C, 5.75% 2/1/20251 | 500 | 502 | ||||||
| Mohegan Tribe of Indians, Gaming Auth., Priority Distribution Payment Rev. Ref. Bonds, Series 2015-C, 6.25% 2/1/20301 | 1,000 | 1,021 | ||||||
| Mohegan Tribe of Indians, Gaming Auth., Priority Distribution Payment Rev. Ref. Bonds, Series 2015-A, 6.75% 2/1/20451 | 311 | 311 | ||||||
| City of Stamford, Harbor Point Infrastructure Improvement Dist., Special Obligation Rev. Ref. Bonds (Harbor Point Project), Series 2017, 5.00% 4/1/20391 | 500 | 506 | ||||||
| 3,315 | ||||||||
| Delaware 0.24% | ||||||||
| Econ. Dev. Auth., Charter School Rev. Bonds (First State Montessori Academy, Inc. Project), Series 2019-A, 4.00% 8/1/2029 | 400 | 400 | ||||||
| G.O. Bonds, Series 2021, 2.00% 2/1/2036 | 1,000 | 840 | ||||||
| 1,240 | ||||||||
| District of Columbia 2.09% | ||||||||
| Hospital Rev. Ref. Bonds (Children’s Hospital Obligated Group Issue), Series 2015, 5.00% 7/15/2044 | 1,000 | 1,016 | ||||||
| Income Tax Secured Rev. Bonds, Series 2020-C, 5.00% 5/1/2037 | 980 | 1,113 | ||||||
| Metropolitan Area Transit Auth., Dedicated Rev. Bonds, Series 2020-A, 4.00% 7/15/2020 | 750 | 766 | ||||||
| Metropolitan Area Transit Auth., Dedicated Rev. Bonds, Series 2020-A, 5.00% 7/15/2045 | 1,500 | 1,633 | ||||||
| Metropolitan Area Transit Auth., Dedicated Rev. Green Bonds, Series 2021-A, 4.00% 7/15/2034 | 1,030 | 1,112 | ||||||
| Metropolitan Area Transit Auth., Dedicated Rev. Green Bonds, Series 2021-A, 4.00% 7/15/2043 | 1,000 | 1,011 | ||||||
| Metropolitan Washington DC Airports Auth., Airport System Rev. Ref. Bonds, Series 2016-A, AMT, 5.00% 10/1/2032 | 1,000 | 1,037 | ||||||
| Metropolitan Washington DC Airports Auth., Airport System Rev. Ref. Bonds, Series 2016-A, AMT, 5.00% 10/1/2035 | 1,000 | 1,034 | ||||||
| Metropolitan Washington DC Airports Auth., Airport System Rev. Ref. Bonds, Series 2023-A, AMT, 5.25% 10/1/2043 | 1,000 | 1,100 | ||||||
| Rev. Bonds (Friendship Public Charter School, Inc. Issue), Series 2016-A, 5.00% 6/1/2041 | 1,000 | 1,003 | ||||||
| 10,825 | ||||||||
| Florida 3.13% | ||||||||
| County of Broward, Housing Fin. Auth., Multi Family Housing Rev. Bonds (Pinnacle 441 Phase 2), Series 2023, 4.05% 9/1/2056 (put 3/1/2026) | 480 | 486 | ||||||
| Capital Trust Agcy., Educational Facs. Rev. Bonds (Renaissance Charter School), Series 2017-A, 4.375% 6/15/20271 | 290 | 286 | ||||||
| Capital Trust Agcy., Educational Facs. Rev. Bonds (Viera Charter Schools, Inc. Project), Series 2017-A, 4.00% 10/15/20291 | 400 | 387 | ||||||
| Capital Trust Agcy., Housing Rev. Bonds (Council Towers Apartments Project), Series 2020-A, 5.00% 2/1/2024 | 450 | 451 | ||||||
| Capital Trust Agcy., Senior Rev. Bonds (Educational Growth Fund, LLC Charter School Portfolio Projects), Series 2021-A-1, 3.375% 7/1/20311 | 500 | 474 | ||||||
| Dev. Fin. Corp., Educational Facs. Rev. Bonds (Mater Academy Projects), Series 2022-A, 5.00% 6/15/2036 | 1,325 | 1,372 | ||||||
| Dev. Fin. Corp., Educational Facs. Rev. Bonds (Renaissance Charter School, Inc. Projects), Series 2023-A, 6.50% 6/15/20381 | 1,000 | 1,083 | ||||||
| Dev. Fin. Corp., Solid Waste Disposal Rev. Bonds (Waste Pro USA, Inc. Project), Series 2021, AMT, 3.00% 6/1/2032 | 1,500 | 1,205 | ||||||
| Dev. Fin. Corp., Solid Waste Disposal Rev. Bonds (Waste Pro USA, Inc. Project), Series 2023, AMT, 6.125% 7/1/2032 (put 7/1/2026)1 | 500 | 504 | ||||||
| Capital Group Fixed Income ETF Trust | 43 |
Capital Group Municipal Income ETF (continued)
| Bonds, notes & other debt instruments (continued) | Principal amount (000) | Value (000) | ||||||
| Florida (continued) | ||||||||
| Greater Orlando Aviation Auth., Airport Facs. Rev. Bonds, Series 202-A, AMT, 5.00% 10/1/2029 | USD | 1,350 | $ | 1,491 | ||||
| County of Hillsborough, Aviation Auth., Tampa International Airport Rev. Bonds, Series 2022-B, 5.00% 10/1/2027 | 1,250 | 1,363 | ||||||
| Housing Fin. Corp., Homeowner Mortgage Rev. Bonds, Series 2018-1, 4.00% 7/1/2049 | 365 | 364 | ||||||
| Housing Fin. Corp., Homeowner Mortgage Rev. Bonds, Series 2023-3, 5.75% 1/1/2054 | 600 | 660 | ||||||
| Housing Fin. Corp., Homeowner Mortgage Rev. Bonds, Series 2023-5, 6.25% 1/1/2054 | 900 | 1,015 | ||||||
| Housing Fin. Corp., Homeowner Mortgage Rev. Bonds, Series 2023-1, 5.25% 7/1/2054 | 500 | 527 | ||||||
| Lee Memorial Health System, Hospital Rev. and Rev. Ref. Bonds, Series 2019-A-1, 4.00% 4/1/2037 | 1,000 | 1,012 | ||||||
| City of Miami, Midtown Miami Community Dev. Dist., Special Assessment and Rev. Ref. Bonds (Infrastructure Project), Series 2014-B, 5.00% 5/1/2029 | 620 | 620 | ||||||
| County of Miami-Dade, Housing Fin. Auth., Multi Family Housing Rev. Bonds (Cutler Vista), Series 2023, 5.00% 3/1/2027 (put 9/1/2025) | 555 | 569 | ||||||
| County of Miami-Dade, Housing Fin. Auth., Multi Family Housing Rev. Bonds (Emerald Dunes), Series 2023-B, 4.05% 9/1/2026 (put 9/1/2025) | 500 | 505 | ||||||
| County of Miami-Dade, Sawyers Landing Community Dev. Dist., Special Assessment Rev. Bonds, Series 2021, 3.25% 5/1/2026 | 1,075 | 1,027 | ||||||
| County of Miami-Dade, Sawyers Landing Community Dev. Dist., Special Assessment Rev. Bonds, Series 2021, 4.125% 5/1/2041 | 250 | 199 | ||||||
| Municipal Power Agcy., Rev. Ref. Bonds (St. Lucie Project), Series 2021-B, 5.00% 10/1/2030 | 535 | 590 | ||||||
| 16,190 | ||||||||
| Georgia 1.75% | ||||||||
| City of Atlanta, Airport General Rev. Ref. Bonds, Series 2023-G, AMT, 5.00% 7/1/2026 | 355 | 370 | ||||||
| City of Atlanta, Airport Passenger Fac. Charge and General Rev. Bonds, Series 2019-D, AMT, 4.00% 7/1/2040 | 500 | 502 | ||||||
| Augusta Dev. Auth., Rev. Bonds (AU Health System, Inc. Project), Series 2018, 4.00% 7/1/2038 | 460 | 464 | ||||||
| G.O. Bonds, Series 2022-A, 5.00% 7/1/2036 | 575 | 686 | ||||||
| Main Street Natural Gas, Inc., Gas Supply Rev. Bonds, Series 2021-C, 4.00% 5/1/2052 (put 12/1/2028) | 695 | 700 | ||||||
| Main Street Natural Gas, Inc., Gas Supply Rev. Bonds, Series 2021-A, 4.00% 7/1/2052 (put 9/1/2027) | 2,750 | 2,767 | ||||||
| Main Street Natural Gas, Inc., Gas Supply Rev. Bonds, Series 2023-B, 5.00% 7/1/2053 (put 3/1/2030) | 1,010 | 1,078 | ||||||
| Main Street Natural Gas, Inc., Gas Supply Rev. Bonds, Series 2023-C, 5.00% 9/1/2053 (put 12/1/2029) | 1,140 | 1,220 | ||||||
| Municipal Electric Auth., Project One Bonds, Series 2020-A, 5.00% 1/1/2027 | 620 | 658 | ||||||
| Private Colleges and Universities Auth., Rev. Bonds (Emory University), Series 2022-A, 5.00% 9/1/2032 | 500 | 608 | ||||||
| 9,053 | ||||||||
| Guam 0.56% | ||||||||
| Business Privilege Tax Rev. Ref. Bonds, Series 2021-F, 5.00% 1/1/2029 | 1,250 | 1,336 | ||||||
| Business Privilege Tax Rev. Ref. Bonds, Series 2021-F, 4.00% 1/1/2036 | 550 | 557 | ||||||
| Limited Obligation Bonds (Section 30), Series 2016-A, 5.00% 12/1/2046 | 1,000 | 1,000 | ||||||
| 2,893 | ||||||||
| Hawaii 1.58% | ||||||||
| Airports System Rev. Bonds, Series 2018-A, AMT, 5.00% 7/1/2029 | 500 | 540 | ||||||
| Airports System Rev. Bonds, Series 2020-A, AMT, 4.00% 7/1/2035 | 500 | 513 | ||||||
| Airports System Rev. Bonds, Series 2018-A, AMT, 5.00% 7/1/2035 | 1,965 | 2,093 | ||||||
| Dept. of Budget and Fin., Special Purpose Rev. Ref. Bonds (Hawaiian Electric Co., Inc.), Series 2019, 3.20% 7/1/2039 | 500 | 335 | ||||||
| G.O. Bonds, Series 2016-FG, 4.00% 10/1/2033 | 2,000 | 2,051 | ||||||
| 44 | Capital Group Fixed Income ETF Trust |
Capital Group Municipal Income ETF (continued)
| Bonds, notes & other debt instruments (continued) | Principal amount (000) | Value (000) | ||||||
| Hawaii (continued) | ||||||||
| Harbor System Rev. Bonds, Series 2020-A, AMT, 5.00% 7/1/2028 | USD | 1,000 | $ | 1,081 | ||||
| City and County of Honolulu, G.O. Bonds, Series 2021-A, 4.00% 7/1/2041 | 500 | 512 | ||||||
| City and County of Honolulu, G.O. Bonds (Honolulu Rail Transit Project), Series 2023-C, 3.00% 7/1/2034 | 1,030 | 1,040 | ||||||
| 8,165 | ||||||||
| Illinois 7.75% | ||||||||
| Build Illinois Bonds, Sales Tax Rev. Bonds, Series 2021-A, 3.00% 6/15/2032 | 500 | 469 | ||||||
| City of Chicago, Board of Education, Capital Improvement Tax Bonds (Dedicated Rev.), Series 2023, 5.25% 4/1/2036 | 250 | 277 | ||||||
| City of Chicago, Board of Education, Unlimited Tax G.O. Bonds (Dedicated Rev.), Series 2021-A, 5.00% 12/1/2033 | 1,350 | 1,428 | ||||||
| City of Chicago, Board of Education, Unlimited Tax G.O. Bonds (Dedicated Rev.), Series 2021-A, 5.00% 12/1/2037 | 1,000 | 1,035 | ||||||
| City of Chicago, Board of Education, Unlimited Tax G.O. Bonds (Dedicated Rev.), Series 2021-A, 5.00% 12/1/2040 | 1,500 | 1,528 | ||||||
| City of Chicago, Board of Education, Unlimited Tax G.O. Bonds (Dedicated Rev.), Series 2018-D, 5.00% 12/1/2046 | 500 | 499 | ||||||
| City of Chicago, Board of Education, Unlimited Tax G.O. Rev. Ref. Bonds (Dedicated Rev.), Series 2017-D, 5.00% 12/1/2026 | 1,250 | 1,291 | ||||||
| City of Chicago, Board of Education, Unlimited Tax G.O. Rev. Ref. Bonds (Dedicated Rev.), Series 2018-A, Assured Guaranty Municipal insured, 5.00% 12/1/2030 | 500 | 517 | ||||||
| City of Chicago, Board of Education, Unlimited Tax G.O. Rev. Ref. Bonds (Dedicated Rev.), Series 2018-A, Assured Guaranty Municipal insured, 5.00% 12/1/2035 | 1,250 | 1,277 | ||||||
| City of Chicago, Board of Education, Unlimited Tax G.O. Rev. Ref. Bonds (Dedicated Rev.), Series 2022-A, 4.00% 12/1/2047 | 500 | 435 | ||||||
| City of Chicago, Board of Education, Unlimited Tax G.O. Rev. Ref. Bonds (Dedicated Rev.), Capital Appreciation Bonds, Series 1998-B-1, National insured, 0% 12/1/2027 | 1,040 | 895 | ||||||
| City of Chicago, Chicago Midway Airport, Rev. Ref. Bonds, Series 2023-C, AMT, 5.00% 1/1/2028 | 1,130 | 1,200 | ||||||
| City of Chicago, G.O Bonds (City Colleges of Chicago Capital Improvement Project), Capital Appreciation Bonds, Series 1999, National insured, 0% 1/1/2026 (escrowed to maturity) | 500 | 471 | ||||||
| City of Chicago, G.O. Bonds, Series 2021-A, 4.00% 1/1/2035 | 500 | 502 | ||||||
| City of Chicago, G.O. Project and Rev. Ref. Bonds, Series 2017-A, 6.00% 1/1/2038 | 1,500 | 1,576 | ||||||
| City of Chicago, G.O. Rev. Ref. Bonds, Series 2020-A, 5.00% 1/1/2027 | 800 | 838 | ||||||
| City of Chicago, School Reform Board of Trustees of the Board of Education, Unlimited Tax G.O. Bonds (Dedicated Tax Rev.), Capital Appreciation Bonds, Series 1999-A, National insured, 0% 12/1/2025 | 500 | 464 | ||||||
| City of Chicago, Transit Auth., Capital Grant Receipts Rev. Ref. Bonds (Federal Transit Administration Section 5337 State of Good Repair Formula Funds), Series 2017, 5.00% 6/1/2026 | 775 | 807 | ||||||
| City of Chicago, Wastewater Transmission Rev. Ref. Bonds, Series 2008-C, 5.00% 1/1/2025 | 1,000 | 1,017 | ||||||
| City of Chicago, Wastewater Transmission Rev. Ref. Bonds, Capital Appreciation Bonds, Series 1998-A, National insured, 0% 1/1/2026 | 1,000 | 935 | ||||||
| City of Chicago, Water Rev. Bonds, Series 2000, 5.00% 11/1/2028 | 1,000 | 1,051 | ||||||
| City of Chicago, Water Rev. Ref. Bonds, Series 2023-B, Assured Guaranty Municipal insured, 5.00% 11/1/2039 | 500 | 569 | ||||||
| Fin. Auth., Rev. Bonds (Advocate Health Care Network), Series 2008-A, 4.00% 11/1/2030 | 415 | 425 | ||||||
| Fin. Auth., Rev. Bonds (OSF Healthcare System), Series 2015-A, 4.00% 11/15/2033 | 1,000 | 1,003 | ||||||
| Fin. Auth., Rev. Bonds (OSF Healthcare System), Series 2020-B-2, 5.00% 5/15/2050 (put 11/15/2026) | 2,000 | 2,082 | ||||||
| Fin. Auth., Rev. Bonds (Rush University Medical Center Obligated Group), Series 2015-A, 4.00% 11/15/2039 | 500 | 478 | ||||||
| Fin. Auth., Rev. Bonds (The Carle Foundation), Series 2021-A, 4.00% 8/15/2038 | 1,000 | 1,025 | ||||||
| Fin. Auth., Rev. Ref. Bonds (OSF Healthcare System), Series 2015-A, 5.00% 11/15/2035 | 500 | 509 | ||||||
| Fin. Auth., Solid Waste Disposal Rev. Bonds (Waste Management, Inc. Project), Series 2023, AMT, 4.60% 10/1/2053 (put 10/1/2026) | 1,565 | 1,583 | ||||||
| Capital Group Fixed Income ETF Trust | 45 |
Capital Group Municipal Income ETF (continued)
| Bonds, notes & other debt instruments (continued) | Principal amount (000) | Value (000) | ||||||
| Illinois (continued) | ||||||||
| Fin. Auth., Solid Waste Disposal Rev. Green Bonds (LRS Holdings, LLC Project), Series 2023-A, AMT, 7.25% 9/1/2052 (put 9/1/2030)1 | USD | 500 | $ | 524 | ||||
| Fin. Auth., Student Housing Rev. Bonds (CHF-Cook, LLC - Northeastern Illinois University Project), Series 2015-A, 5.00% 7/1/2047 | 500 | 410 | ||||||
| G.O. Bonds, Series 2014, 5.00% 5/1/2026 | 1,000 | 1,004 | ||||||
| G.O. Bonds, Series 2016, 4.00% 6/1/2033 | 1,060 | 1,076 | ||||||
| Housing Dev. Auth., Multi Family Housing Rev. Bonds (6900 Crandon), Series 2023, 5.00% 2/1/2027 (put 2/1/2026) | 700 | 721 | ||||||
| Housing Dev. Auth., Multi Family Housing Rev. Bonds (South Shore HHDC), Series 2023, 5.00% 2/1/2027 (put 2/1/2026) | 650 | 669 | ||||||
| Housing Dev. Auth., Rev. Bonds, Series 2022-A, 3.50% 4/1/2052 | 890 | 876 | ||||||
| Housing Dev. Auth., Rev. Bonds, Series 2023-N, 6.25% 4/1/2054 | 1,000 | 1,109 | ||||||
| Metropolitan Pier and Exposition Auth., McCormick Place Expansion Project Bonds, Capital Appreciation Bonds, Series 2002-A, Assured Guaranty Municipal insured, 0% 6/15/2030 | 1,055 | 859 | ||||||
| Metropolitan Pier and Exposition Auth., McCormick Place Expansion Project Bonds, Capital Appreciation Bonds, Series 2002-A, National insured, 0% 6/15/2032 | 925 | 699 | ||||||
| Metropolitan Pier and Exposition Auth., McCormick Place Expansion Project Rev. Ref. Bonds, Series 2022-A, 3.00% 6/15/2024 | 1,000 | 996 | ||||||
| Metropolitan Pier and Exposition Auth., McCormick Place Expansion Project Rev. Ref. Bonds, Capital Appreciation Bonds, Series 2010-B-1, Assured Guaranty Municipal insured, 0% 6/15/2027 | 1,000 | 897 | ||||||
| Sales Tax Securitization Corp., Sales Tax Rev. Ref. Bonds, Series 2017-A, 5.00% 1/1/2024 | 1,500 | 1,500 | ||||||
| Sales Tax Securitization Corp., Sales Tax Securitization Bonds, Series 2020-A, BAM insured, 5.00% 1/1/2029 | 510 | 567 | ||||||
| Sports Facs. Auth., Sports Facs. Rev. Ref. Bonds (State Tax Supported), Series 2019, BAM insured, 5.00% 6/15/2029 | 665 | 716 | ||||||
| Toll Highway Auth., Toll Highway Rev. Bonds, Series 2023-A, 5.00% 1/1/2042 | 600 | 681 | ||||||
| Toll Highway Auth., Toll Highway Rev. Ref. Bonds, Series 2024-A, 5.00% 1/1/2037 | 450 | 539 | ||||||
| 40,029 | ||||||||
| Indiana 1.79% | ||||||||
| Fin. Auth., Environmental Improvement Rev. Ref. Bonds (U.S. Steel Corp. Project), Series 2021-A, 4.125% 12/1/2026 | 1,250 | 1,235 | ||||||
| Fin. Auth., Hospital Rev. Ref. Bonds (Indiana University Health), Series 2023-B-1, 5.00% 10/1/2062 (put 7/1/2028) | 755 | 819 | ||||||
| Fin. Auth., Midwestern Disaster Relief Rev. Bonds (Ohio Valley Electric Corp. Project), Series 2012-B, 3.00% 11/1/2030 | 655 | 616 | ||||||
| Fin. Auth., Pollution Control Rev. Bonds (Ohio Valley Electric Corp. Project), Series 2010-A, 3.00% 11/1/2030 | 1,000 | 940 | ||||||
| Fin. Auth., State Revolving Fund Program Green Bonds, Series 2021-B, 5.00% 2/1/2029 | 1,000 | 1,128 | ||||||
| Fin. Auth., Wastewater Utility Rev. Ref. Bonds (CWA Auth. Project), Series 2016-B, 3.00% 10/1/2046 | 1,065 | 855 | ||||||
| City of Franklin, Econ. Dev. Rev. Ref. Bonds (Otterbein Homes Obligated Group), Series 2019-B, 5.00% 7/1/2027 | 400 | 416 | ||||||
| Housing and Community Dev. Auth., Single Family Mortgage Rev. Bonds, Series 2020-A, 3.75% 1/1/2049 | 1,000 | 994 | ||||||
| Housing and Community Dev. Auth., Single Family Mortgage Rev. Bonds, Series 2023-A-1, 5.75% 7/1/2053 | 420 | 450 | ||||||
| City of Whiting, Environmental Facs. Rev. Bonds (BP Products North America, Inc. Project), Series 2015, AMT, 4.40% 11/1/2045 (put 6/10/2031) | 1,000 | 1,029 | ||||||
| City of Whiting, Environmental Facs. Rev. Bonds (BP Products North America, Inc. Project), Series 2016-A, AMT, 4.40% 3/1/2046 (put 6/10/2031) | 250 | 256 | ||||||
| City of Whiting, Environmental Facs. Rev. Ref. Bonds (BP Products North America, Inc. Project), Series 2019-A, AMT, 5.00% 2044 (put 6/15/2026) | 500 | 509 | ||||||
| 9,247 | ||||||||
| 46 | Capital Group Fixed Income ETF Trust |
Capital Group Municipal Income ETF (continued)
| Bonds, notes & other debt instruments (continued) | Principal amount (000) | Value (000) | ||||||
| Iowa 0.60% | ||||||||
| Fin. Auth., Midwestern Disaster Area Rev. Ref. Bonds (Iowa Fertilizer Co. Project), Series 2022, 4.00% 12/1/2050 (put 12/1/2032) | USD | 500 | $ | 508 | ||||
| Fin. Auth., Midwestern Disaster Area Rev. Ref. Bonds (Iowa Fertilizer Co. Project), Series 2022, 5.00% 12/1/2050 (put 12/1/2042) | 1,000 | 1,044 | ||||||
| Fin. Auth., Multi Family Housing Rev. Bonds (AHEPA 192-IV Apartments Projects), Series 2023, 5.00% 11/1/2026 (put 11/1/2025) | 650 | 665 | ||||||
| PEFA, Inc., Gas Project Rev. Bonds, Series 2019, 5.00% 9/1/2049 (put 9/1/2026) | 500 | 512 | ||||||
| Student Loan Liquidity Corp., Student Loan Rev. Bonds, Series 2023-B, AMT, 5.00% 12/1/2029 | 350 | 378 | ||||||
| 3,107 | ||||||||
| Kansas 0.11% | ||||||||
| Dev. Fin. Auth., Hospital Rev. Bonds (Advent Health Obligated Group), Series 2021-B, 5.00% 11/15/2054 (put 11/15/2028) | 500 | 547 | ||||||
| Kentucky 1.23% | ||||||||
| City of Ashland, Medical Center Rev. Bonds (Ashland Hospital Corp. - King’s Daughters Medical Center Project), Series 2016-A, 5.00% 2/1/2040 | 500 | 507 | ||||||
| City of Henderson, Exempt Facs. Rev. Bonds (Pratt Paper, LLC Project), Series 2022-B, AMT, 3.70% 1/1/20321 | 1,500 | 1,441 | ||||||
| Housing Corp., Multi Family Housing Rev. Bonds (Beecher Terrace Phase IV Project), Series 2023, 5.00% 9/1/2043 (put 9/1/2026) | 165 | 170 | ||||||
| Public Energy Auth., Gas Supply Rev. Bonds, Series 2019-C-1, 4.00% 2/1/2050 (put 2/1/2028) | 500 | 501 | ||||||
| Public Energy Auth., Gas Supply Rev. Bonds, Series 2022-A-1, 4.00% 8/1/2052 (put 8/1/2030) | 500 | 502 | ||||||
| Public Energy Auth., Gas Supply Rev. Ref. Bonds, Series 2023-A-1, 5.25% 4/1/2054 (put 2/1/2032) | 2,050 | 2,236 | ||||||
| County of Trimble, Environmental Facs. Rev. Bonds (Louisville Gas and Electric Co. Project), Series 2023-A, AMT, 4.70% 6/1/2054 (put 6/1/2027)3 | 1,000 | 1,016 | ||||||
| 6,373 | ||||||||
| Louisiana 0.68% | ||||||||
| Housing Corp., Single Family Mortgage Rev. Bonds (Home Ownership Program), Series 2023-A, 5.75% 6/1/2054 | 400 | 437 | ||||||
| Local Government Environmental Facs. and Community Dev. Auth., Rev. Bonds (Louisiana Insurance Guaranty Assn. Project), Series 2022-B, 5.00% 8/15/2027 | 1,000 | 1,066 | ||||||
| Local Government Environmental Facs. and Community Dev. Auth., Rev. Ref. Bonds (East Baton Rouge Sewerage Commission Projects), Series 2023, 5.00% 2/1/2041 | 400 | 445 | ||||||
| Public Facs. Auth., Hospital Rev. Bonds (Louisiana Children’s Medical Center Project), Series 2015-A-3, 5.00% 6/1/2045 (put 6/1/2028) | 365 | 392 | ||||||
| Public Facs. Auth., Solid Waste Disposal Fac. Rev. Bonds (Elementus Materials, LLC Project), Series 2023, AMT, 5.00% 1/1/2043 (put 11/1/2025)1 | 1,135 | 1,157 | ||||||
| 3,497 | ||||||||
| Maine 0.38% | ||||||||
| Fin. Auth., Solid Waste Disposal Rev. Bonds (Casella Waste Systems, Inc. Project), Series 2015-R-2, AMT, 4.375% 8/1/2035 (put 8/1/2025)1 | 1,500 | 1,486 | ||||||
| Fin. Auth., Solid Waste Disposal Rev. Bonds (Casella Waste Systems, Inc. Project), Series 2015, AMT, 5.125% 8/1/2035 (put 8/1/2025)1 | 500 | 501 | ||||||
| 1,987 | ||||||||
| Capital Group Fixed Income ETF Trust | 47 |
Capital Group Municipal Income ETF (continued)
| Bonds, notes & other debt instruments (continued) | Principal amount (000) | Value (000) | ||||||
| Maryland 1.31% | ||||||||
| Community Dev. Administration, Dept. of Housing and Community Dev., Residential Rev. Bonds, Series 2023-A, 5.50% 9/1/2053 | USD | 1,095 | $ | 1,186 | ||||
| G.O. Bonds, State and Local Facs. Loan of 2022, Series 2022-A-3, 5.00% 6/1/2036 | 1,000 | 1,189 | ||||||
| G.O. Bonds, State and Local Facs. Loan of 2020, Series 2020-A-1, 5.00% 3/15/2032 | 1,205 | 1,393 | ||||||
| County of Montgomery, Rev. Ref. Bonds (Dept. of Liquor Control), Series 2019-A, 4.00% 6/15/2037 | 750 | 783 | ||||||
| Dept. of Transportation, Consolidated Transportation Bonds, Series 2021-A, 2.00% 10/1/2034 | 735 | 628 | ||||||
| Dept. of Transportation, Consolidated Transportation Rev. Ref. Bonds, Series 2022-B, 5.00% 12/1/2027 | 1,435 | 1,580 | ||||||
| 6,759 | ||||||||
| Massachusetts 0.94% | ||||||||
| Clean Water Trust, Revolving Fund Green Bonds, Series 2023-B, 5.00% 2/1/2024 | 1,435 | 1,438 | ||||||
| Clean Water Trust, Revolving Fund Rev. Ref. Green Bonds, Series 2023-2B, 5.00% 2/1/2040 | 1,000 | 1,163 | ||||||
| Dev. Fin. Agcy., Rev. Bonds (Mass General Brigham, Inc.), Series 2020-A-2, 4.00% 7/1/2041 | 1,000 | 1,008 | ||||||
| Dev. Fin. Agcy., Rev. Bonds (Partners Healthcare System Issue), Series 2017-S, 4.00% 7/1/2035 | 500 | 513 | ||||||
| Educational Fncg. Auth., Education Loan Rev. Bonds, Series 2019-B, AMT, 5.00% 7/1/2026 | 500 | 517 | ||||||
| Educational Fncg. Auth., Education Loan Rev. Bonds, Series 2023-B, AMT, 4.25% 7/1/2044 | 235 | 236 | ||||||
| 4,875 | ||||||||
| Michigan 1.57% | ||||||||
| Building Auth., Rev. Bonds (Facs. Program), Series 2021-I, 4.00% 10/15/2041 | 500 | 517 | ||||||
| Fin. Auth., Hospital Rev. and Rev. Ref. Bonds (Trinity Health Credit Group), Series 2019-A, 5.00% 12/1/2041 | 500 | 535 | ||||||
| Fin. Auth., Tobacco Settlement Asset-Backed Bonds, Series 2020-A-1, 5.00% 6/1/2033 | 500 | 551 | ||||||
| Fin. Auth., Tobacco Settlement Asset-Backed Bonds, Series 2020-A-1, 4.00% 6/1/2035 | 1,000 | 1,032 | ||||||
| Great Lakes Water Auth., Sewage Disposal System Rev. Ref. Bonds, Series 2018-B, 5.00% 7/1/2028 | 1,000 | 1,105 | ||||||
| Great Lakes Water Auth., Water Supply System Rev. Ref. Bonds, Series 2016-B, 5.00% 7/1/2046 | 500 | 513 | ||||||
| Housing Dev. Auth., Single Family Mortgage Rev. Bonds, Series 2023-A, 5.50% 12/1/2053 | 445 | 482 | ||||||
| Housing Dev. Auth., Single Family Mortgage Rev. Bonds, Series 2023-B, 5.75% 6/1/2054 | 1,055 | 1,143 | ||||||
| Roseville Community Schools, G.O. Rev. Ref. Bonds, Series 2015, 5.00% 5/1/2032 (preref. 5/1/2025) | 410 | 422 | ||||||
| Strategic Fund, Limited Obligation Rev. Bonds (I-75 Improvement Project), Series 2018, AMT, 5.00% 12/31/2028 | 550 | 586 | ||||||
| Strategic Fund, Limited Obligation Rev. Green Bonds (Graphic Packaging International, LLC Coated Recycled Board Machine Project), Series 2021, AMT, 4.00% 10/1/2061 (put 10/1/2026) | 1,250 | 1,234 | ||||||
| 8,120 | ||||||||
| Minnesota 1.18% | ||||||||
| G.O. Bonds, Various Purpose Rev. Ref. Bonds, Series 2023-D, 5.00% 8/1/2033 1,735 2,133 Higher Education Supplemental Loan Auth., Rev. Bonds, Series 2023, AMT, 4.00% 11/1/2042 | 850 | 851 | ||||||
| Housing Fin. Agcy., Residential Housing Fin. Bonds, Series 2020-I, 3.00% 1/1/2051 | 1,725 | 1,681 | ||||||
| Housing Fin. Agcy., Residential Housing Fin. Bonds, Series 2021-H, 3.00% 7/1/2052 | 1,490 | 1,445 | ||||||
| 6,110 | ||||||||
| 48 | Capital Group Fixed Income ETF Trust |
Capital Group Municipal Income ETF (continued)
| Bonds, notes & other debt instruments (continued) | Principal amount (000) | Value (000) | ||||||
| Missouri 0.84% | ||||||||
| Health and Educational Facs. Auth., Health Facs. Rev. Bonds, (Bethesda Health Group, Inc.), Series 2021, 4.00% 8/1/2029 | USD | 385 | $ | 361 | ||||
| Health and Educational Facs. Auth., Health Facs. Rev. Bonds (BJC Health System), Series 2021-A, 4.00% 7/1/2035 | 1,315 | 1,406 | ||||||
| Housing Dev. Commission, Single Family Mortgage Rev. Bonds (First Place Homeownership Loan Program), Series 2020-C, 3.50% 11/1/2050 | 445 | 440 | ||||||
| Housing Dev. Commission, Single Family Mortgage Rev. Bonds (First Place Homeownership Loan Program), Series 2023-B, 5.50% 5/1/2053 | 1,250 | 1,354 | ||||||
| City of Kansas City, Planned Industrial Expansion Auth., Multi Family Housing Rev. Bonds (The Depot on Old Santa Fe), Series 2023, 5.00% 7/1/2045 (put 7/1/2027) | 750 | 786 | ||||||
| 4,347 | ||||||||
| Montana 0.13% | ||||||||
| City of Forsyth, Pollution Control Rev. Ref. Bonds (Northwestern Corp. Colstrip Project), Series 2023, 3.875% 7/1/2028 | 650 | 664 | ||||||
| Nebraska 0.31% | ||||||||
| Central Plains Energy Project, Gas Project Rev. Bonds (Project No. 4), Series 2023-A-1, 5.00% 5/1/2054 (put 11/1/2029) | 1,115 | 1,183 | ||||||
| Investment Fin. Auth., Single Family Housing Rev. Bonds, Series 2020-A, 2.35% 9/1/2035 | 500 | 429 | ||||||
| 1,612 | ||||||||
| Nevada 2.51% | ||||||||
| Dept. of Business and Industry, Lease Rev. Bonds (Somerset Academy), Series 2018-A, 4.50% 12/15/20291 | 420 | 414 | ||||||
| County of Clark, Airport System Rev. Notes, Series 2021-B, AMT, 5.00% 7/1/2024 | 1,000 | 1,007 | ||||||
| County of Clark, Limited Tax G.O. Park Improvement Bonds, Series 2018, 5.00% 12/1/2031 | 600 | 664 | ||||||
| County of Clark, Limited Tax G.O. Stadium Improvement Bonds, Series 2018-A, 5.00% 6/1/2033 | 515 | 564 | ||||||
| County of Clark, Limited Tax G.O. Stadium Improvement Bonds, Series 2018-A, 5.00% 6/1/2043 | 1,500 | 1,589 | ||||||
| Highway Rev. Improvement and Rev. Ref. Bonds (Motor Vehicle Fuel Tax), Series 2016, 5.00% 12/1/2025 | 2,000 | 2,091 | ||||||
| City of Las Vegas, Special Improvement Dist. No. 817 (Summerlin Village 29), Local Improvement Bonds, Series 2023, 5.50% 6/1/2038 | 375 | 389 | ||||||
| City of Las Vegas, Special Improvement Dist. No. 612 (Skye Hills), Local Improvement Bonds, Series 2020, 3.75% 6/1/2042 | 975 | 765 | ||||||
| Las Vegas Convention and Visitors Auth., Convention Center Expansion and Renovation Rev. Bonds, Series 2022-B, 5.00% 7/1/2038 | 1,000 | 1,136 | ||||||
| Las Vegas Convention and Visitors Auth., Convention Center Expansion and Renovation Rev. Bonds, Series 2023-A, 5.00% 7/1/2038 | 350 | 403 | ||||||
| Las Vegas Valley Water Dist., Limited Tax G.O. Water Bonds, Series 2023-A, 5.00% 6/1/2044 | 1,000 | 1,124 | ||||||
| Las Vegas Valley Water Dist., Limited Tax G.O. Water Improvement and Rev. Ref. Bonds, Series 2016-A, 5.00% 6/1/2036 | 1,700 | 1,767 | ||||||
| Las Vegas Valley Water Dist., Limited Tax G.O. Water Improvement Bonds, Series 2022-A, 4.00% 6/1/2035 | 500 | 539 | ||||||
| City of North Las Vegas, Special Improvement Dist. No. 65 (Northern Beltway Commercial Area), Local Improvement Bonds, Series 2017, 4.00% 12/1/20271 | 505 | 502 | ||||||
| 12,954 | ||||||||
| New Hampshire 0.36% | ||||||||
| Health and Education Facs. Auth., Education Loan Rev. Bonds (New Hampshire Higher Education Loan Corp. Issue), Series 2023-B, AMT, 5.00% 11/1/2043 | 510 | 557 | ||||||
| Housing Fin. Auth., Single Family Mortgage Rev. Bonds, Series 2023-B, 6.00% 1/1/2055 | 200 | 218 | ||||||
| National Fin. Auth., Municipal Certs., Series 2022-2, Class A, 4.00% 10/20/2036 | 541 | 532 | ||||||
| National Fin. Auth., Municipal Certs., Series 2023-2, Class A, 3.875% 1/20/2038 | 548 | 531 | ||||||
| 1,838 | ||||||||
| Capital Group Fixed Income ETF Trust | 49 |
Capital Group Municipal Income ETF (continued)
| Bonds, notes & other debt instruments (continued) | Principal amount (000) | Value (000) | ||||||
| New Jersey 2.18% | ||||||||
| Econ. Dev. Auth., Special Fac. Rev. Bonds (Continental Airlines, Inc. Project), Series 1999, AMT, 5.25% 9/15/2029 | USD | 500 | $ | 501 | ||||
| Health Care Facs. Fncg. Auth., Rev. Ref. Bonds (Hackensack Meridian Health Obligated Group Issue), Series 2017-A, 5.00% 7/1/2032 | 500 | 538 | ||||||
| Health Care Facs. Fncg. Auth., Rev. Ref. Bonds (RWJ Barnabas Health Obligated Group Issue), Series 2016-A, 5.00% 7/1/2033 | 610 | 645 | ||||||
| Higher Education Student Assistance Auth., Student Loan Rev. Bonds, Series 2019-B, AMT, 3.25% 12/1/2039 | 395 | 380 | ||||||
| Higher Education Student Assistance Auth., Student Loan Rev. Ref. Bonds, Series 2023-B, AMT, 4.00% 12/1/2044 | 900 | 900 | ||||||
| Housing and Mortgage Fin. Agcy., Single Family Housing Rev. Bonds, Series 2020-E, 3.50% 4/1/2051 | 425 | 419 | ||||||
| Housing and Mortgage Fin. Agcy., Single Family Housing Rev. Bonds, Series 2020-H, 3.00% 10/1/2052 | 2,500 | 2,414 | ||||||
| Housing and Mortgage Fin. Agcy., Single Family Housing Rev. Bonds, Series 2023-J, 5.50% 4/1/2053 | 1,000 | 1,083 | ||||||
| Tobacco Settlement Fncg. Corp., Tobacco Settlement Bonds, Series 2018-A, 5.00% 6/1/2024 | 1,150 | 1,157 | ||||||
| Transportation Trust Fund Auth., Transportation Program Bonds, Series 2023-AA, 5.00% 6/15/2035 | 600 | 705 | ||||||
| Transportation Trust Fund Auth., Transportation Program Bonds, Series 2023-BB, 5.00% 6/15/2037 | 600 | 700 | ||||||
| Transportation Trust Fund Auth., Transportation System Bonds, Series 2019-A, 5.00% 12/15/2027 | 500 | 546 | ||||||
| Transportation Trust Fund Auth., Transportation System Bonds, Series 2018-A, 5.00% 12/15/2036 | 500 | 544 | ||||||
| Transportation Trust Fund Auth., Transportation System Bonds, Capital Appreciation Bonds, Series 2006-C, AMBAC insured, 0% 12/15/2028 | 455 | 390 | ||||||
| Transportation Trust Fund Auth., Transportation System Bonds, Capital Appreciation Bonds, Series 2006-C, AMBAC insured, 0% 12/15/2035 | 550 | 369 | ||||||
| 11,291 | ||||||||
| New Mexico 0.57% | ||||||||
| City of Farmington, Pollution Control Rev. Ref. Bonds (Public Service Co. of San Juan and Four Corners Projects), Series 2016-B, 2.15% 4/1/2033 | 1,750 | 1,450 | ||||||
| Hospital Equipment Loan Council, Hospital System Rev. Bonds (Presbyterian Healthcare Services), Series 2017-A, 4.00% 8/1/2037 | 500 | 509 | ||||||
| Mortgage Fin. Auth., Single Family Mortgage Program Bonds, Series 2020-A, Class I, 3.50% 1/1/2051 | 1,000 | 989 | ||||||
| 2,948 | ||||||||
| New York 8.40% | ||||||||
| Brooklyn Arena Local Dev. Corp., PILOT Rev. Ref. Bonds (Barclays Center), Series 2016-A, Assured Guaranty Municipal insured, 5.00% 7/15/2042 | 500 | 502 | ||||||
| Build NYC Resource Corp., Rev. Bonds (East Harlem Scholars Academy Charter School Project), Series 2022, 5.00% 6/1/20321 | 250 | 257 | ||||||
| Build NYC Resource Corp., Rev. Ref. Bonds (Albert Einstein School of Medicine, Inc. Project), Series 2015, 5.50% 9/1/20451 | 500 | 500 | ||||||
| Dormitory Auth., State Personal Income Tax Rev. Bonds (General Purpose), Series 2020-A, 4.00% 3/15/2037 | 1,000 | 1,063 | ||||||
| Dormitory Auth., State Personal Income Tax Rev. Bonds (General Purpose), Series 2021-E, 4.00% 3/15/2042 | 1,110 | 1,125 | ||||||
| Dormitory Auth., State Personal Income Tax Rev. Bonds (General Purpose), Series 2021-A, 5.00% 3/15/2044 | 1,000 | 1,100 | ||||||
| Dormitory Auth., State Sales Tax Rev. Bonds, Series 2018-E, 5.00% 3/15/2039 | 755 | 814 | ||||||
| Energy Research and Dev. Auth., Pollution Control Rev. Bonds (New York State Electric & Gas Corp. Project), Series 2004-C, 4.00% 4/1/2034 | 120 | 124 | ||||||
| Environmental Facs. Corp., Solid Waste Disposal Rev. Bonds (Casella Waste Systems, Inc. Project), Series 2014-R-2, AMT, 3.125% 12/1/2044 (put 6/1/2026)1 | 500 | 480 | ||||||
| Housing Fin. Agcy., Affordable Housing Rev. Green Bonds, Series 2023-A-2, 3.60% 11/1/2062 (put 5/1/2027) | 720 | 723 | ||||||
| 50 | Capital Group Fixed Income ETF Trust |
Capital Group Municipal Income ETF (continued)
| Bonds, notes & other debt instruments (continued) | Principal amount (000) | Value (000) | ||||||
| New York (continued) | ||||||||
| Liberty Dev. Corp., Liberty Rev. Ref. Green Bonds (4 World Trade Center Project), Series 2021-A, 2.875% 11/15/2046 | USD | 995 | $ | 760 | ||||
| Metropolitan Transportation Auth., Transportation Rev. Ref. Bonds, Series 2017-D, 5.00% 11/15/2035 | 600 | 646 | ||||||
| Metropolitan Transportation Auth., Transportation Rev. Ref. Green Bonds, Series 2017-C-1, 5.00% 11/15/2028 | 805 | 876 | ||||||
| County of Monroe, Industrial Dev. Agcy., Multi Family Housing Rev. Bonds (Andrews Terrace Community Partners, L.P. Project), Series 2023-B-1, 5.00% 7/1/2028 (put 7/1/2026) | 1,175 | 1,237 | ||||||
| Mortgage Agcy., Homeowner Mortgage Rev. Bonds, Series 213, 4.25% 10/1/2047 | 380 | 381 | ||||||
| New York City G.O. Bonds, Series 2023-F-1, 5.00% 8/1/2025 | 110 | 114 | ||||||
| New York City G.O. Bonds, Series 2023-1, 5.00% 8/1/2036 | 565 | 679 | ||||||
| New York City Health and Hospitals Corp., Health System Bonds, Series 2020-A, 3.00% 2/15/2026 | 1,440 | 1,448 | ||||||
| New York City Housing Dev. Corp., Multi Family Housing Rev. Bonds (Sustainable Dev. Bonds), Series 2020-A-1-B, 2.05% 11/1/2031 | 530 | 462 | ||||||
| New York City Housing Dev. Corp., Multi Family Housing Rev. Green Bonds (Sustainable Dev. Bonds), Series 2021-F-1, 2.40% 11/1/2046 | 500 | 352 | ||||||
| New York City Municipal Water Fin. Auth., Water and Sewer System Second General Resolution Rev. Bonds, Series 2020-CC-1, 4.00% 6/15/2037 | 750 | 785 | ||||||
| New York City Municipal Water Fin. Auth., Water and Sewer System Second General Resolution Rev. Bonds, Series 2020-DD-3, 4.00% 6/15/2042 | 1,170 | 1,187 | ||||||
| New York City Municipal Water Fin. Auth., Water and Sewer System Second General Resolution Rev. Bonds, Series 2023-CC, 4.10% 6/15/2053 | 1,000 | 1,000 | ||||||
| New York City Transitional Fin. Auth., Future Tax Secured Bonds, Series 2015-E-1, 5.00% 2/1/2030 | 500 | 511 | ||||||
| New York City Transitional Fin. Auth., Future Tax Secured Bonds, Series 2016-B-1, 5.00% 11/1/2034 | 500 | 519 | ||||||
| New York City Transitional Fin. Auth., Future Tax Secured Bonds, Series 2021-C-1, 4.00% 5/1/2035 | 500 | 540 | ||||||
| New York City Transitional Fin. Auth., Future Tax Secured Bonds, Series 2024-D, 5.00% 11/1/2038 | 1,000 | 1,192 | ||||||
| New York City Transitional Fin. Auth., Future Tax Secured Bonds, Fiscal 2020, Series 2020-A-2, 5.00% 5/1/2039 | 530 | 579 | ||||||
| Port Auth., Consolidated Bonds, Series 221, AMT, 4.00% 7/15/2038 | 900 | 905 | ||||||
| Port Auth., Consolidated Bonds, Series 221, AMT, 4.00% 7/15/2039 | 1,120 | 1,121 | ||||||
| County of Rockland, Industrial Dev. Agcy., Multi Family Housing Rev. Bonds (Rockland Gardens Project), Series 2023, 4.65% 5/1/2027 (put 5/1/2025) | 600 | 605 | ||||||
| Thruway Auth., General Rev. Bonds, Series 2021-O, 4.00% 1/1/2040 | 1,000 | 1,024 | ||||||
| Thruway Auth., Personal Income Tax Rev. Bonds, Series 2021-A-1, 5.00% 3/15/2029 | 500 | 566 | ||||||
| Thruway Auth., Personal Income Tax Rev. Bonds, Series 2021-A-1, 4.00% 3/15/2036 | 1,125 | 1,200 | ||||||
| Thruway Auth., Personal Income Tax Rev. Bonds, Series 2022-A-1, 5.00% 3/15/2041 | 1,010 | 1,156 | ||||||
| Thruway Auth., Personal Income Tax Rev. Bonds, Series 2021-A-1, 3.00% 3/15/2048 | 500 | 407 | ||||||
| Transportation Dev. Corp., Special Fac. Rev. Bonds (American Airlines, Inc. John F. Kennedy International Airport Project), Series 2021, AMT, 2.25% 8/1/2026 | 820 | 784 | ||||||
| Transportation Dev. Corp., Special Fac. Rev. Bonds (Terminal Four John F. Kennedy International Airport Project), Series 2020-A, AMT, 5.00% 12/1/2024 | 1,250 | 1,261 | ||||||
| Transportation Dev. Corp., Special Fac. Rev. Bonds (Terminal Four John F. Kennedy International Airport Project), Series 2020-C, 5.00% 12/1/2034 | 500 | 550 | ||||||
| Transportation Dev. Corp., Special Fac. Rev. Bonds (Terminal Four John F. Kennedy International Airport Project), Series 2022, AMT, 5.00% 12/1/2041 | 750 | 795 | ||||||
| Transportation Dev. Corp., Special Fac. Rev. Ref. Bonds (American Airlines, Inc. John F. Kennedy International Airport Project), Series 2016, AMT, 5.00% 8/1/2026 | 385 | 385 | ||||||
| Transportation Dev. Corp., Special Facs. Rev. Bonds (Delta Air Lines, Inc. LaGuardia Airport Terminals C & D Redev. Project), Series 2018, AMT, 5.00% 1/1/2029 | 500 | 516 | ||||||
| Transportation Dev. Corp., Special Facs. Rev. Bonds (Delta Air Lines, Inc. LaGuardia Airport Terminals C & D Redev. Project), Series 2020, AMT, 4.00% 10/1/2030 | 1,500 | 1,475 | ||||||
| Transportation Dev. Corp., Special Facs. Rev. Bonds (Delta Air Lines, Inc. LaGuardia Airport Terminals C & D Redev. Project), Series 2018, AMT, 5.00% 1/1/2033 | 1,500 | 1,532 | ||||||
| Transportation Dev. Corp., Special Facs. Rev. Bonds (Delta Air Lines, Inc. LaGuardia Airport Terminals C & D Redev. Project), Series 2023, AMT, 6.00% 4/1/2035 | 2,000 | 2,232 | ||||||
| Capital Group Fixed Income ETF Trust | 51 |
Capital Group Municipal Income ETF (continued)
| Bonds, notes & other debt instruments (continued) | Principal amount (000) | Value (000) | ||||||
| New York (continued) | ||||||||
| Transportation Dev. Corp., Special Facs. Rev. Green Bonds (John F. Kennedy International Airport New Terminal One Project), Series 2023, AMT, Assured Guaranty Municipal insured, 5.50% 6/30/2042 | USD | 1,000 | $ | 1,110 | ||||
| Triborough Bridge and Tunnel Auth., General Rev. Bonds (MTA Bridges and Tunnels), Series 2023-B-1, 5.00% 11/15/2040 | 1,000 | 1,158 | ||||||
| Triborough Bridge and Tunnel Auth., Payroll Mobility Tax Rev. Ref. Green Bonds (MTA Bridges and Tunnels), Series 2023-A, 5.00% 11/15/2034 | 550 | 672 | ||||||
| Urban Dev. Corp., State Personal Income Tax Rev. Bonds (General Purpose), Series 2020-C, 4.00% 3/15/2037 | 1,000 | 1,049 | ||||||
| Urban Dev. Corp., State Personal Income Tax Rev. Bonds (General Purpose), Series 2020-E, 4.00% 3/15/2038 | 1,500 | 1,567 | ||||||
| Urban Dev. Corp., State Personal Income Tax Rev. Bonds (General Purpose), Series 2020-E, 3.00% 3/15/2047 | 500 | 408 | ||||||
| Utility Debt Securitization Auth., Restructuring Bonds, Series 2023-TE-1, 5.00% 12/15/2041 | 840 | 989 | ||||||
| 43,423 | ||||||||
| North Carolina 0.74% | ||||||||
| City of Charlotte, Charlotte Douglas International Airport, Airport Rev. Bonds, Series 2019-B, AMT, 5.00% 7/1/2030 | 500 | 549 | ||||||
| City of Charlotte, Charlotte Douglas International Airport, Airport Rev. Bonds, Series 2023-A, AMT, 5.00% 7/1/2048 | 500 | 558 | ||||||
| Educational Assistance Auth., Student Loan Rev. Bonds, Series 2023-A, AMT, 5.00% 6/1/2043 | 135 | 140 | ||||||
| Housing Fin. Agcy., Home Ownership Rev. Bonds, Series 50, 5.50% 1/1/2054 | 700 | 758 | ||||||
| Housing Fin. Agcy., Home Ownership Rev. Ref. Bonds, Series 42, 4.00% 1/1/2050 | 425 | 425 | ||||||
| Turnpike Auth., Monroe Expressway System, Appropriation Rev. Ref. Bonds, Series 2021, 5.00% 7/1/2028 | 1,000 | 1,114 | ||||||
| Turnpike Auth., Triangle Expressway System, Appropriation Rev. Bonds, Capital Appreciation Bonds, Series 2019, 0% 1/1/2043 | 560 | 259 | ||||||
| 3,803 | ||||||||
| North Dakota 0.50% | ||||||||
| Housing Fin. Agcy., Housing Fin. Program Bonds (Home Mortgage Fin. Program), Series 2021-A, 3.00% 1/1/2052 | 1,255 | 1,222 | ||||||
| Housing Fin. Agcy., Housing Fin. Program Bonds (Home Mortgage Fin. Program), Series 2023-A, 5.75% 7/1/2053 | 700 | 751 | ||||||
| Housing Fin. Agcy., Housing Fin. Program Bonds (Home Mortgage Fin. Program), Series 2023-D, 5.75% 1/1/2054 | 115 | 124 | ||||||
| County of Ward, Health Care Facs. Rev. Bonds (Trinity Obligated Group), Series 2017-C, 5.00% 6/1/2038 | 500 | 465 | ||||||
| 2,562 | ||||||||
| Ohio 2.15% | ||||||||
| Air Quality Dev. Auth., Air Quality Dev. Rev. Ref. Bonds (Duke Energy Corp. Project), Series 2022-B, AMT, 4.25% 11/1/2039 (put 6/1/2027) | 940 | 959 | ||||||
| Air Quality Dev. Auth., Air Quality Rev. Ref. Bonds (Ohio Valley Electric Corp. Project), Series 2019-A, 3.25% 9/1/2029 | 500 | 484 | ||||||
| Buckeye Tobacco Settlement Fncg. Auth., Tobacco Settlement Asset-Backed Rev. Ref. Bonds, Series 2020-A-2, Class 1, 5.00% 6/1/2033 | 750 | 821 | ||||||
| Buckeye Tobacco Settlement Fncg. Auth., Tobacco Settlement Asset-Backed Rev. Ref. Bonds, Series 2020-A-2, 4.00% 6/1/2048 | 1,000 | 925 | ||||||
| Cleveland-Cuyahoga Port Auth., Tax Increment Fncg. Rev. and Rev. Ref. Bonds (Flats East Bank Project), Series 2021-A, 4.00% 12/1/20551 | 250 | 206 | ||||||
| Columbus-Franklin County Fin. Auth., Multi Family Housing Rev. Bonds (Dering Family Homes Project), Series 2023, 5.00% 7/1/2045 (put 2/1/2027) | 800 | 833 | ||||||
| County of Cuyahoga, Metropolitan Housing Auth., Multi Family Housing Rev. Bonds (Wade Park Apartments), Series 2022, 4.75% 12/1/2027 (put 12/1/2025) | 460 | 469 | ||||||
| County of Franklin, Hospital Facs. Rev. Ref. Bonds (Nationwide Children’s Hospital), Series 2016-C, 5.00% 11/1/2031 | 540 | 623 | ||||||
| 52 | Capital Group Fixed Income ETF Trust |
Capital Group Municipal Income ETF (continued)
| Bonds, notes & other debt instruments (continued) | Principal amount (000) | Value (000) | ||||||
| Ohio (continued) | ||||||||
| County of Franklin, Hospital Facs. Rev. Ref. Bonds (Nationwide Children’s Hospital), Series 2016-C, 4.00% 11/1/2040 | USD | 1,000 | $ | 1,005 | ||||
| Housing Fin. Agcy., Multi Family Housing Rev. Bonds (Robert Cassidy Manor Project), Series 2023, 5.00% 4/1/2026 (put 4/1/2025) | 475 | 483 | ||||||
| Housing Fin. Agcy., Residential Mortgage Rev. Bonds (Mortgage-Backed Securities Program), Series 2023-A, 5.50% 3/1/2053 | 1,000 | 1,067 | ||||||
| Ohio State University, General Receipts Green Bonds (Multiyear Debt Issuance Program II), Series 2023-B, 5.00% 12/1/2034 | 1,250 | 1,505 | ||||||
| Southern Ohio Port Auth., Exempt Fac. Rev. Bonds (PureCycle Project), Series 2020-A, AMT, 6.25% 12/1/20251 | 750 | 560 | ||||||
| Southern Ohio Port Auth., Exempt Fac. Rev. Bonds (PureCycle Project), Series 2020-A, AMT, 7.00% 12/1/20421 | 500 | 395 | ||||||
| County of Warren, Healthcare Facs., Rev. Ref. Bonds (Otterbein Homes Obligated Group), Series 2019-A, 5.00% 7/1/2027 | 740 | 770 | ||||||
| 11,105 | ||||||||
| Oklahoma 0.17% | ||||||||
| Housing Fin. Agcy., Single Family Mortgage Rev. Bonds (Homeownership Loan Program), Series 2023-C, 6.00% 3/1/2054 | 780 | 868 | ||||||
| Oregon 0.75% | ||||||||
| G.O. Bonds, Series 2021-A, 5.00% 5/1/2026 | 1,050 | 1,110 | ||||||
| G.O. Bonds (Article XI-Q State Projects), Series 2023-A, 5.00% 5/1/2034 | 500 | 608 | ||||||
| G.O. Bonds (Higher Education), Series 2015-O, 5.00% 8/1/2030 (preref. 8/1/2025) | 1,820 | 1,886 | ||||||
| G.O. Bonds (Veteran’s Welfare Bonds Series 111), Series 2023-E, 5.50% 12/1/2053 | 260 | 281 | ||||||
| 3,885 | ||||||||
| Pennsylvania 2.84% | ||||||||
| City of Allentown, Neighborhood Improvement Zone Dev. Auth., Tax Rev. Bonds (City Center Ref. Project), Series 2017, 5.00% 5/1/20421 | 500 | 496 | ||||||
| County of Cumberland, Municipal Auth., Rev. Bonds (Penn State Health), Series 2019, 5.00% 11/1/2027 | 500 | 538 | ||||||
| Econ Dev. Fncg. Auth., Rev. Bonds (Presbyterian Senior Living Project), Series 2023-B-2, 5.25% 7/1/2038 | 800 | 832 | ||||||
| Econ. Dev. Fncg. Auth., Private Activity Rev. Bonds (The Penndot Major Bridges Package One Project), Series 2022, AMT, 5.00% 12/31/2030 | 700 | 767 | ||||||
| Econ. Dev. Fncg. Auth., Private Activity Rev. Bonds (The Penndot Major Bridges Package One Project), Series 2022, AMT, 5.25% 6/30/2035 | 1,000 | 1,125 | ||||||
| Econ. Dev. Fncg. Auth., Private Activity Rev. Bonds (The Pennsylvania Rapid Bridge Replacement Project), Series 2015, AMT, 5.00% 12/31/2034 | 500 | 513 | ||||||
| Econ. Dev. Fncg. Auth., Solid Waste Disposal Rev. Bonds (Waste Management, Inc. Project), Series 2021-A-2, AMT, 4.60% 10/1/2046 (put 10/1/2026) | 1,000 | 1,011 | ||||||
| Econ. Dev. Fncg. Auth., UPMC Rev. Bonds, Series 2020-A, 4.00% 4/15/2039 | 500 | 507 | ||||||
| Erie County School Dist., Limited Tax G.O. Bonds, Series 2019-A, Assured Guaranty Municipal insured, 5.00% 4/1/2031 | 525 | 582 | ||||||
| G.O. Bonds, Series 2016, Assured Guaranty Municipal insured, 5.00% 9/15/2026 | 560 | 597 | ||||||
| G.O. Rev. Ref. Bonds, Series 2017-1, 5.00% 1/1/2024 | 1,005 | 1,005 | ||||||
| Higher Education Assistance Agcy., Education Loan Rev. Bonds, Series 2023-B, AMT, 4.00% 6/1/2044 | 335 | 333 | ||||||
| Higher Educational Facs. Auth., Health System Rev. Bonds (University of Pennsylvania Health System), Series 2015, 5.00% 8/15/2026 | 500 | 516 | ||||||
| Housing Fin. Agcy., Single Family Mortgage Rev. Bonds, Series 2023-141-A, 5.75% 10/1/2053 | 795 | 853 | ||||||
| County of Lancaster, Hospital Auth., Health Center Rev. Bonds (Masonic Villages Project), Series 2023, 5.125% 11/1/2038 | 360 | 384 | ||||||
| Capital Group Fixed Income ETF Trust | 53 |
Capital Group Municipal Income ETF (continued)
| Bonds, notes & other debt instruments (continued) | Principal amount (000) | Value (000) | ||||||
| Pennsylvania (continued) | ||||||||
| County of Montgomery, Industrial Dev. Auth., Exempt Facs. Rev. Ref. Bonds (Constellation Energy Generation, LLC Project), Series 2023-C, 4.10% 6/1/2029 | USD | 600 | $ | 615 | ||||
| City of Philadelphia, Industrial Dev. Auth., Hospital Rev. Bonds (The Children’s Hospital of Philadelphia Project), Series 2017, 5.00% 7/1/2034 | 980 | 1,044 | ||||||
| Philadelphia School Dist., G.O. Bonds, Series 2019-A, National insured, 5.00% 9/1/2026 | 500 | 528 | ||||||
| Philadelphia School Dist., G.O. Bonds, Series 2016-F, 5.00% 9/1/2028 | 250 | 262 | ||||||
| Philadelphia School Dist., G.O. Green Bonds, Series 2023-B, 5.25% 9/1/2038 | 1,000 | 1,145 | ||||||
| Turnpike Commission, Turnpike Rev. Bonds, Series 2019-A, 5.00% 12/1/2027 | 500 | 543 | ||||||
| County of Westmoreland, Industrial Dev. Auth., Health System Rev. Bonds (Excela Health Project), Series 2020-A, 4.00% 7/1/2026 | 500 | 505 | ||||||
| 14,701 | ||||||||
| Puerto Rico 1.86% | ||||||||
| Aqueduct and Sewer Auth., Rev. Ref. Bonds, Series 2021-B, 5.00% 7/1/20331 | 500 | 508 | ||||||
| Aqueduct and Sewer Auth., Rev. Ref. Bonds, Series 2020-A, 5.00% 7/1/20351 | 500 | 506 | ||||||
| Aqueduct and Sewer Auth., Rev. Ref. Bonds, Series 2022-A, 5.00% 7/1/20371 | 1,000 | 1,007 | ||||||
| Aqueduct and Sewer Auth., Rev. Ref. Bonds, Series 2021-B, 4.00% 7/1/20421 | 500 | 443 | ||||||
| Electric Power Auth., Power Rev. Ref. Bonds, Series 2007-UU, Assured Guaranty Municipal insured, (3-month USD CME Term SOFR x 0.67 + 0.52%) 4.227% 7/1/2029 | 500 | 465 | ||||||
| G.O. Restructured Bonds, Series 2022-A-1, 4.00% 7/1/2033 | 1,500 | 1,472 | ||||||
| G.O. Restructured Bonds, Series 2022-A-1, 4.00% 7/1/2037 | 1,500 | 1,436 | ||||||
| G.O. Restructured Bonds, Series 2022-A-1, 4.00% 7/1/2046 | 1,000 | 895 | ||||||
| Industrial, Tourist, Educational, Medical and Environmental Control Facs. Fncg. Auth., Hospital Rev. and Rev. Ref. Bonds (Hospital Auxilio Mutuo Obligated Group Project), Series 2021, 5.00% 7/1/2033 | 435 | 481 | ||||||
| Industrial, Tourist, Educational, Medical and Environmental Control Facs. Fncg. Auth., Hospital Rev. and Rev. Ref. Bonds (Hospital Auxilio Mutuo Obligated Group Project), Series 2021, 4.00% 7/1/2041 | 455 | 430 | ||||||
| Sales Tax Fncg. Corp., Sales Tax Rev. Restructured Bonds, Series 2019-A-2, 4.329% 7/1/2040 | 1,000 | 995 | ||||||
| Sales Tax Fncg. Corp., Sales Tax Rev. Restructured Bonds, Series 2019-A-2, 4.329% 7/1/2040 | 500 | 498 | ||||||
| Sales Tax Fncg. Corp., Sales Tax Rev. Restructured Bonds, Capital Appreciation Bonds, Series 2018-A-1, 0% 7/1/2046 | 1,500 | 472 | ||||||
| 9,608 | ||||||||
| Rhode Island 0.10% | ||||||||
| Tobacco Settlement Fin. Corp., Tobacco Settlement Asset-Backed Bonds, Series 2015-A, 5.00% 6/1/2026 | 500 | 510 | ||||||
| South Carolina 1.00% | ||||||||
| County of Dorchester, Summers Corner Improvement Dist., Assessment Rev. Bonds, Series 2023, 4.50% 10/1/2033 | 210 | 210 | ||||||
| City of Greenville, Housing Auth., Multi Family Housing Rev. Bonds (Cherokee Landing Apartments Project) Series 2023, 5.00% 7/1/2027 (put 7/1/2026) | 800 | 830 | ||||||
| Jobs-Econ. Dev. Auth., Environmental Improvement Rev. Ref. Bonds (International Paper Company Project), Series 2023-A, AMT, 4.00% 4/1/2033 (put 4/1/2026) | 500 | 498 | ||||||
| Patriots Energy Group Fncg. Agcy., Gas Supply Rev. Bonds, Series 2023-B-1, 5.25% 2/1/2054 (put 3/1/2031) | 1,000 | 1,090 | ||||||
| Public Service Auth., Rev. Ref. Obligations, Series 2016-A, 5.00% 12/1/2038 | 1,465 | 1,494 | ||||||
| Public Service Auth., Rev. Ref. Obligations (Santee Cooper), Series 2016-A, 5.00% 12/1/2029 | 500 | 521 | ||||||
| Public Service Auth., Rev. Ref. Obligations (Santee Cooper), Series 2016-A, 5.00% 12/1/2033 | 500 | 517 | ||||||
| 5,160 | ||||||||
| 54 | Capital Group Fixed Income ETF Trust |
Capital Group Municipal Income ETF (continued)
| Bonds, notes & other debt instruments (continued) | Principal amount (000) | Value (000) | ||||||
| South Dakota 0.13% | ||||||||
| Housing Dev. Auth., Homeownership Mortgage Bonds, Series 2023-G, 6.25% 5/1/2055 | USD | 600 | $ | 665 | ||||
| Tennessee 1.48% | ||||||||
| Housing Dev. Agcy., Residential Fin. Program Bonds, Series 2017-2A, AMT, 4.00% 1/1/2042 | 425 | 422 | ||||||
| Housing Dev. Agcy., Residential Fin. Program Bonds, Series 2019-1, 4.25% 1/1/2050 | 1,380 | 1,383 | ||||||
| Housing Dev. Agcy., Residential Fin. Program Bonds, Series 2023-3A, 6.25% 1/1/2054 | 790 | 874 | ||||||
| Knoxville Community Dev. Corp., Collateralized Multi Family Housing Bonds (Grosvenor Square Project), Series 2022, 4.00% 12/1/2027 (put 6/1/2026) | 1,115 | 1,128 | ||||||
| Knoxville Community Dev. Corp., Collateralized Multi Family Housing Bonds (Willow Place Project), Series 2023, 3.75% 12/1/2027 (put 6/1/2026) | 700 | 705 | ||||||
| Tenergy Corp., Gas Supply Rev. Bonds, Series 2021-A, 4.00% 12/1/2051 (put 9/1/2028) | 1,000 | 1,003 | ||||||
| Tennessee Energy Acquisition Corp., Gas Project Rev. Bonds, Series 2018, 4.00% 11/1/2049 | 1,000 | 1,004 | ||||||
| County of Williamson Industrial Dev. Board, Multi Family Housing Rev. Bonds (Wood Duck Court Apartments), Series 2023, 5.00% 5/1/2042 (put 5/1/2027) | 1,095 | 1,145 | ||||||
| 7,664 | ||||||||
| Texas 12.70% | ||||||||
| Affordable Housing Corp., Multi Family Housing Rev. Bonds (Juniper Creek Apartments Project), Series 2023, 3.75% 7/1/2044 (put 7/1/2026) | 405 | 407 | ||||||
| Affordable Housing Corp., Multi Family Housing Rev. Bonds (Norman Commons), Series 2023, 3.625% 1/1/2045 (put 1/1/2027) | 140 | 141 | ||||||
| Alamo Community College Dist., Limited Tax Bonds, Series 2021, 5.00% 8/15/2026 | 2,150 | 2,287 | ||||||
| City of Arlington, Special Tax Rev. Bonds, Series 2021-B, 5.00% 8/15/2024 | 800 | 810 | ||||||
| Aubrey Independent School Dist., Unlimited Tax School Building Bonds, Series 2022, 4.00% 2/15/2047 | 1,250 | 1,269 | ||||||
| Austin Community College Dist., Limited Tax Bonds, Series 2023, 5.00% 8/1/2039 | 1,000 | 1,142 | ||||||
| City of Austin, Airport System Rev. Bonds, Series 2019-B, AMT, 5.00% 11/15/2033 | 1,000 | 1,090 | ||||||
| City of Austin, Certs. Of Obligation, Series 2020, 5.00% 9/1/2025 | 1,000 | 1,038 | ||||||
| City of Austin, Electric Utility System Rev. Ref. Bonds, Series 2015-A, 5.00% 11/15/2031 | 1,000 | 1,032 | ||||||
| Boerne Independent School Dist., Unlimited Tax School Building Rev. Ref. Bonds, Series 2023, 3.125% 2/1/2053 (put 2/1/2027) | 500 | 501 | ||||||
| Brazoria County Industrial Dev. Corp., Solid Waste Disposal Facs. Rev. Bonds (Aleon Renewable Metals, LLC Project), Series 2023, AMT, 12.00% 6/1/20431 | 500 | 504 | ||||||
| Cameron County Housing Fin. Corp., Multi Family Housing Rev. Bonds (Sunland Country Apartments), Series 2021, 3.95% 2/1/2024 | 445 | 445 | ||||||
| Central Texas Regional Mobility Auth., Rev. Bonds, Series 2021-B, 5.00% 1/1/2032 | 500 | 569 | ||||||
| Clear Creek Independent School Dist., Unlimited Tax Rev. Ref. Bonds, Series 2016, 3.00% 2/15/2033 | 1,000 | 973 | ||||||
| Clifton Higher Education Fin. Corp., Education Rev. Bonds (Idea Public Schools), Series 2018, 5.00% 8/15/2027 | 1,000 | 1,082 | ||||||
| Clifton Higher Education Fin. Corp., Education Rev. Bonds (Valor Education), Series 2023-A, 5.75% 6/15/20381 | 500 | 502 | ||||||
| College Student Loan G.O. Bonds, Series 2019, AMT, 5.00% 8/1/2027 | 1,000 | 1,067 | ||||||
| City of Dallas, Special Tax Rev. Bonds (Kay Bailey Hutchison Convention Center Dallas Venue Project), Series 2023, 6.00% 8/15/2053 (put 8/15/2028)1 | 850 | 864 | ||||||
| City of Dallas, Waterworks and Sewer System Rev. Ref. Bonds, Series 2015-A, 4.00% 10/1/2033 | 500 | 505 | ||||||
| City of Dallas, Waterworks and Sewer System Rev. Ref. Bonds, Series 2020-C, 5.00% 10/1/2038 | 1,440 | 1,624 | ||||||
| Dallas Independent School Dist., Unlimited Tax School Building Bonds, Series 2019-B, 3.00% 2/15/2034 | 1,000 | 983 | ||||||
| Dallas Independent School Dist., Unlimited Tax School Building Rev. Ref. Bonds, Series 2014-A, 5.00% 8/15/2029 (preref. 8/15/2024) | 2,000 | 2,025 | ||||||
| City of Dallas Housing Fin. Corp., Multi Family Housing Rev. Notes (Estates at Ferguson), Series 2023, 5.00% 7/1/2042 (put 7/1/2027) | 420 | 441 | ||||||
| City of Garland, Electric Utility System Rev. Ref. Bonds, Series 2023, 5.00% 3/1/2025 | 485 | 496 | ||||||
| Gulf Coast Industrial Dev. Auth., Solid Waste Disposal Rev. Bonds (CITGO Petroleum Corp. Project), Series 1995, AMT, 4.875% 5/1/2025 | 1,000 | 1,000 | ||||||
| County of Harris, Toll Road Rev. and Rev. Ref. Bonds, Series 2018-A, 5.00% 8/15/2030 | 610 | 672 | ||||||
| Capital Group Fixed Income ETF Trust | 55 |
Capital Group Municipal Income ETF (continued)
| Bonds, notes & other debt instruments (continued) | Principal amount (000) | Value (000) | ||||||
| Texas (continued) | ||||||||
| County of Harris, Toll Road Rev. Ref. Bonds, Series 2021, 4.00% 8/15/2045 | USD | 500 | $ | 502 | ||||
| Hays Consolidated Independent School Dist., Unlimited Tax School Building Bonds, Series 2022, 5.00% 2/15/2035 | 635 | 737 | ||||||
| Dept. of Housing and Community Affairs, Multi Family Housing Rev. Notes (Aspen Park), Series 2023, 5.00% 3/1/2041 (put 3/1/2026) | 595 | 605 | ||||||
| Dept. of Housing and Community Affairs, Residential Mortgage Rev. Bonds, Series 2022-B, 5.75% 1/1/2053 | 2,000 | 2,153 | ||||||
| Dept. of Housing and Community Affairs, Single Family Mortgage Rev. Bonds, Series 2023-C, 6.00% 3/1/2054 | 545 | 605 | ||||||
| City of Houston, Airport System Facs. Rev. Bonds (United Airlines, Inc. Terminal Improvement Projects), Series 2021-A, AMT, 4.00% 7/1/2041 | 1,500 | 1,341 | ||||||
| City of Houston, Airport System Rev. Ref. Bonds, Series 2021-A, AMT, 5.00% 7/1/2029 | 500 | 547 | ||||||
| City of Houston, Airport System Rev. Ref. Bonds, Series 2023-B, Assured Guaranty Municipal insured, AMT, 5.00% 7/1/2031 | 1,820 | 2,033 | ||||||
| City of Houston, Airport System Rev. Ref. Bonds, Series 2021-A, AMT, 4.00% 7/1/2037 | 1,085 | 1,101 | ||||||
| City of Houston, Airport System Special Facs. Rev. Ref. Bonds (United Airlines, Inc. Terminal E Project), Series 2014, AMT, 4.75% 7/1/2024 | 500 | 500 | ||||||
| City of Houston, Airport System Special Facs. Rev. Ref. Bonds (United Airlines, Inc. Terminal E Project), Series 2014, AMT, 5.00% 7/1/2029 | 1,000 | 1,000 | ||||||
| City of Houston, Airport System Special Facs. Rev. Ref. Bonds (United Airlines, Inc. Terminal Improvement Projects), Series 2020-A, AMT, 5.00% 7/1/2027 | 500 | 503 | ||||||
| City of Houston, Combined Utility System Rev. and Rev. Ref. Bonds, Series 2016-B, 5.00% 11/15/2034 | 500 | 525 | ||||||
| Houston Housing Fin. Corp., Multi Family Housing Rev. Notes (Summerdale Apartments), Series 2023, 5.00% 8/1/2041 (put 8/1/2026) | 500 | 515 | ||||||
| Houston Independent School Dist., Limited Tax Schoolhouse Bonds, Series 2018, 5.00% 2/15/2030 | 500 | 552 | ||||||
| Las Varas Public Fac. Corp., Multi Family Housing Rev. Bonds (Palo Alto Apartments), Series 2022, 3.10% 11/1/2025 (put 11/1/2024) | 1,000 | 990 | ||||||
| Lazy Nine Municipal Utility Dist. No. 1A, Unlimited Tax Bonds, Series 2023, 5.625% 9/1/2042 | 500 | 536 | ||||||
| Love Field Airport Modernization Corp., Special Facs. Rev. Bonds, Series 2012, AMT, 5.00% 11/1/2028 | 1,355 | 1,355 | ||||||
| Lower Colorado River Auth., Rev. Ref. Bonds, Series 2022, Assured Guaranty Municipal insured, 5.00% 5/15/2026 | 535 | 565 | ||||||
| Lower Colorado River Auth., Rev. Ref. Bonds, Series 2023-B, 5.00% 5/15/2039 (put 5/15/2028) | 1,340 | 1,429 | ||||||
| County of Matagorda, Navigation Dist. No. 1, Pollution Control Rev. Ref. Bonds (Central Power and Light Co. Project), Series 1996, AMT, 4.25% 5/1/2030 | 200 | 201 | ||||||
| Medina Valley Independent School Dist., Unlimited Tax School Building Bonds, Series 2023, 4.00% 2/15/2053 | 1,000 | 995 | ||||||
| Mission Econ. Dev. Corp., Solid Waste Disposal Rev. Bonds (Waste Management, Inc. Project), Series 2020-A, AMT, 4.5% 5/1/2046 (put 3/1/2024) | 1,315 | 1,315 | ||||||
| Municipal Gas Acquisition and Supply Corp. IV, Gas Supply Rev. Bonds, Series 2023-A, 5.50% 1/1/2054 (put 1/1/2030) | 900 | 971 | ||||||
| Municipal Gas Acquisition and Supply Corp. IV, Gas Supply Rev. Bonds, Series 2023-B, 5.50% 1/1/2054 (put 1/1/2034) | 1,000 | 1,112 | ||||||
| North Fort Bend Water Auth., Water System Rev. and Rev. Ref. Bonds, Series 2021, BAM insured, 5.00% 12/15/2027 | 500 | 545 | ||||||
| North Texas Municipal Water Dist., Water System Rev. Ref. and Improvement Bonds, Series 2021, 3.00% 9/1/2036 | 420 | 394 | ||||||
| North Texas Tollway Auth., System Rev. and Rev. Ref. Bonds, Series 2021-B, 4.00% 1/1/2035 | 1,100 | 1,158 | ||||||
| North Texas Tollway Auth., System Rev. and Rev. Ref. Bonds, Series 2021-B, 4.00% 1/1/2036 | 500 | 522 | ||||||
| Odessa Housing Fin. Corp., Multi Family Housing Rev. Bonds (Cove in Odessa Apartments), Series 2021, 0.37% 3/1/2024 (put 9/1/2023) | 1,250 | 1,250 | ||||||
| City of San Antonio, Electric and Gas Systems Rev. Ref. Bonds, Series 2017, 5.00% 2/1/2033 | 1,500 | 1,594 | ||||||
| City of San Antonio, Water System Rev. and Rev. Ref. Bonds, Series 2023-A, 5.00% 5/15/2040 | 1,000 | 1,147 | ||||||
| 56 | Capital Group Fixed Income ETF Trust |
Capital Group Municipal Income ETF (continued)
| Bonds, notes & other debt instruments (continued) | Principal amount (000) | Value (000) | ||||||
| Texas (continued) | ||||||||
| Sherman Independent School Dist., Unlimited Tax School Building Bonds, Series 2023-B, 5.00% 2/15/2040 | USD | 500 | $ | 577 | ||||
| Southwest Independent School Dist., Unlimited Tax School Building Bonds, Series 2023, 5.00% 2/1/2041 | 1,500 | 1,686 | ||||||
| Surface Transportation Corp., Private Activity Rev. Ref. Bonds (NTE Mobility Partners Segments 3 LLC), Series 2023, AMT, 5.50% 6/30/2040 | 1,500 | 1,615 | ||||||
| Tarrant County Cultural Education Facs. Fin. Corp., Rev. Bonds (Christus Health), Series 2018-B, 5.00% 7/1/2036 | 1,270 | 1,370 | ||||||
| Board of Regents of the Texas State University System, Rev. Fncg. System Rev. and Rev. Ref. Bonds, Series 2019-A, 5.00% 3/15/2033 | 500 | 557 | ||||||
| Board of Regents of the University of Houston System, Consolidated Rev. and Rev. Ref. Bonds, Series 2017-C, 5.00% 2/15/2026 | 1,590 | 1,670 | ||||||
| Waco Education Fin. Corp., Rev. Bonds (Baylor University Issue), Series 2021, 4.00% 3/1/2040 | 500 | 506 | ||||||
| Water Dev. Board, State Water Implementation Rev. Fund, Rev. Bonds (Master Trust), Series 2020, 5.00% 4/15/2025 | 1,075 | 1,106 | ||||||
| Water Dev. Board, State Water Implementation Rev. Fund, Rev. Bonds (Master Trust), Series 2020, 5.00% 10/15/2025 | 1,045 | 1,089 | ||||||
| Water Dev. Board, State Water Implementation Rev. Fund, Rev. Bonds (Master Trust), Series 2018-B, 5.00% 10/15/2032 | 1,330 | 1,475 | ||||||
| Water Dev. Board, State Water Implementation Rev. Fund, Rev. Bonds (Master Trust), Series 2023-A, 5.00% 10/15/2035 | 1,000 | 1,209 | ||||||
| 65,627 | ||||||||
| United States 0.07% | ||||||||
| Freddie Mac, Multi Family Certs., Series 2023, 0.897% 6/25/20351,2 | 2,732 | 169 | ||||||
| Freddie Mac, Multi Family Mortgage Green Bonds, Series 2023, Class A, 2.99% 4/25/20432 | 250 | 210 | ||||||
| 379 | ||||||||
| Utah 0.85% | ||||||||
| Housing Corp., Single Family Mortgage Bonds, Series 2023-A, 6.00% 7/1/2053 | 950 | 1,038 | ||||||
| Housing Corp., Single Family Mortgage Bonds, Series 2024-A, 6.50% 1/1/2054 | 270 | 301 | ||||||
| MIDA Mountain Village Public Infrastructure Dist., Special Assessment Rev. Bonds (Mountain Village Assessment Area #2), Series 2021, 4.00% 8/1/20271 | 500 | 487 | ||||||
| MIDA Mountain Village Public Infrastructure Dist., Special Assessment Rev. Bonds (Mountain Village Assessment Area No. 2), Series 2021, 4.00% 8/1/20291 | 1,000 | 960 | ||||||
| Salt Lake City, Airport Rev. Bonds (Salt Lake City International Airport), Series 2018-A, AMT, 5.00% 7/1/2028 | 1,500 | 1,616 | ||||||
| 4,402 | ||||||||
| Vermont 0.19% | ||||||||
| Econ. Dev. Auth., Solid Waste Disposal Rev. Bonds (Casella Waste Systems, Inc. Project), Series 2013, AMT, 4.625% 4/1/2036 (put 4/3/2028)1 | 500 | 496 | ||||||
| Student Assistance Corp., Education Loan Rev. Bonds, Series 2023-A, AMT, 4.00% 6/15/2041 | 480 | 471 | ||||||
| 967 | ||||||||
| Virgin Islands 0.29% | ||||||||
| Matching Fund Special Purpose Securitization Corp., Matching Fund Securitization Bonds, Series 2022-A, 5.00% 10/1/2026 | 500 | 506 | ||||||
| Matching Fund Special Purpose Securitization Corp., Matching Fund Securitization Bonds, Series 2022-A, 5.00% 10/1/2039 | 1,000 | 1,006 | ||||||
| 1,512 | ||||||||
| Capital Group Fixed Income ETF Trust | 57 |
Capital Group Municipal Income ETF (continued)
| Bonds, notes & other debt instruments (continued) | Principal amount (000) | Value (000) | ||||||
| Virginia 1.50% | ||||||||
| County of Arlington, Industrial Dev. Auth., Multifamily Housing Rev. Bonds (Park Shirlington Apartments), Series 2023-A, 5.00% 1/1/2026 | USD | 150 | $ | 155 | ||||
| County of Charles City, Econ. Dev. Auth., Solid Waste Disposal Rev. Bonds (Waste Management, Inc. Project), Series 2004-A, 2.875% 2/1/2029 | 500 | 470 | ||||||
| College Building Auth., Educational Facs. Rev. Bonds (21st Century College and Equipment Programs), Series 2019-A, 4.00% 2/1/2034 | 1,000 | 1,059 | ||||||
| County of Fairfax, Redev. and Housing Auth., Multi Family Housing Rev. Bonds (Dominion Square North Project), Series 2023, 5.00% 1/1/2045 (put 1/1/2028) | 250 | 265 | ||||||
| Town of Farmville, Industrial Dev. Auth., Educational Facs. Rev. and Rev. Ref. Bonds (Longwood University Student Housing Project), Series 2018-A, 5.00% 1/1/2032 | 500 | 519 | ||||||
| Town of Farmville, Industrial Dev. Auth., Educational Facs. Rev. Ref. Bonds (Longwood University Student Housing Project), Series 2018-A, 5.00% 1/1/2043 | 500 | 500 | ||||||
| County of Isle of Wight, Econ. Dev. Auth., Health System Rev. Bonds (Riverside Health System), Series 2023, 5.25% 7/1/2043 | 410 | 459 | ||||||
| County of James City, Econ. Dev. Auth., Residential Care Fac. Rev. Bonds (Williamsburg Landing), Series 2024-C-3, 5.25% 12/1/2027 | 400 | 403 | ||||||
| City of Norfolk, G.O. Capital Rev. Ref. Bonds, Series 2014-C, 4.00% 8/1/2025 (preref. 8/1/2028) | 500 | 510 | ||||||
| City of Norfolk, Redev. and Housing Auth., Multi Family Housing Rev. Bonds (Braywood Manor Apartments), Series 2023, 5.00% 5/1/2043 (put 5/1/2026) | 100 | 103 | ||||||
| Small Business Fncg. Auth., Rev. Bonds (National Senior Campuses, Inc. Obligated Group), Series 2020-A, 5.00% 1/1/2024 | 750 | 750 | ||||||
| Small Business Fncg. Auth., Rev. Bonds (National Senior Campuses, Inc. Obligated Group), Series 2020-A, 5.00% 1/1/2026 | 940 | 962 | ||||||
| Small Business Fncg. Auth., Rev. Ref. Bonds (Elizabeth River Crossings Opco, LLC Project), Series 2022, AMT, 4.00% 7/1/2029 | 500 | 508 | ||||||
| Virginia Beach Dev. Auth., Residential Care Fac. Rev. Bonds (Westminster-Canterbury on Chesapeake Bay), Series 2023-B-3, 5.375% 9/1/2039 | 1,075 | 1,103 | ||||||
| 7,766 | ||||||||
| Washington 3.53% | ||||||||
| Central Puget Sound Regional Transit Auth., Sales Tax Improvement and Rev. Ref. Green | ||||||||
| Bonds, Series 2015-S-1, 5.00% 11/1/2036 (preref. 11/1/2025) | 1,000 | 1,041 | ||||||
| G.O. Bonds, Series 2020-C, 5.00% 2/1/2030 | 1,035 | 1,192 | ||||||
| G.O. Bonds, Series 2020-A, 5.00% 8/1/2039 | 650 | 715 | ||||||
| G.O. Bonds, Series 2021-A-2, 5.00% 8/1/2039 | 1,300 | 1,455 | ||||||
| G.O. Bonds, Series 2023-A, 5.00% 8/1/2044 | 1,185 | 1,344 | ||||||
| Health Care Facs. Auth., Rev. Bonds (CommonSpirit Health), Series 2019-B-1, 5.00% 8/1/2049 (put 8/1/2024) | 1,000 | 1,001 | ||||||
| Health Care Facs. Auth., Rev. Bonds (Multicare Health System), Series 2015-B, 5.00% 8/15/2025 | 500 | 513 | ||||||
| Health Care Facs. Auth., Rev. Bonds (Providence St. Joseph Health), Series 2014-C, 5.00% 10/1/2044 | 500 | 503 | ||||||
| Health Care Facs. Auth., Rev. Bonds (Seattle Cancer Care Alliance), Series 2021, 4.00% 12/1/20401 | 1,000 | 990 | ||||||
| Health Care Facs. Auth., Rev. Bonds (Virginia Mason Medical Center), Series 2017, 5.00% 8/15/2037 | 355 | 363 | ||||||
| Housing Fin. Commission, Multi Family Housing Rev. Bonds (Ardea at Totem Lake Apartments Project), Series 2023, 5.00% 12/1/2043 (put 2/1/2027) | 800 | 831 | ||||||
| Housing Fin. Commission, Municipal Certs., Series 2021-1, 3.50% 12/20/2035 | 481 | 459 | ||||||
| Housing Fin. Commission, Municipal Certs., Series 2023-1, 1.448% 4/20/2037 | 1,713 | 191 | ||||||
| Housing Fin. Commission, Municipal Certs., Series 2023-1, 3.375% 4/20/2037 | 1,423 | 1,288 | ||||||
| Housing Fin. Commission, Nonprofit Housing Rev. and Rev. Ref. Bonds, (Emerald Heights Project), Series 2023-B-1, 4.75% 7/1/2027 | 40 | 40 | ||||||
| Housing Fin. Commission, Single Family Program Bonds, Series 2018-1-N, 4.00% 12/1/2048 | 375 | 374 | ||||||
| Housing Fin. Commission, Single Family Program Bonds, Series 2020-2-N, 3.00% 12/1/2050 | 560 | 546 | ||||||
| County of King, Convention Center Public Facs. Dist., Lodging Tax Green Notes, Series 2021, 4.00% 7/1/2031 | 750 | 748 | ||||||
| County of King, Unlimited Tax G.O. Bonds, Series 2023, 5.00% 12/1/2042 | 1,500 | 1,735 | ||||||
| 58 | Capital Group Fixed Income ETF Trust |
Capital Group Municipal Income ETF (continued)
| Bonds, notes & other debt instruments (continued) | Principal amount (000) | Value (000) | ||||||
| Washington (continued) | ||||||||
| Mercer Island School Dist. No. 400, Unlimited Tax G.O. Bonds, Series 2015, 3.00% 12/1/2024 | USD | 750 | $ | 749 | ||||
| Pasco School Dist. No. 1, Unlimited Tax G.O. Improvement and Rev. Ref. Bonds, Series 2023, 4.25% 12/1/2042 | 1,000 | 1,045 | ||||||
| Port of Seattle, Industrial Dev. Corp., Special Facs. Rev. Ref. Bonds (Delta Air Lines, Inc. Project), Series 2012, AMT, 5.00% 4/1/2030 | 500 | 500 | ||||||
| Various Purpose G.O. Rev. Ref. Bonds, Series 2021-A-1, 5.00% 8/1/2035 | 530 | 609 | ||||||
| 18,232 | ||||||||
| West Virginia 0.45% | ||||||||
| Econ. Dev. Auth., Solid Waste Disposal Facs. Rev. Bonds (Arch Resources Project), Series 2021, AMT, 4.125% 7/1/2045 (put 7/1/2025) | 500 | 497 | ||||||
| Econ. Dev. Auth., Solid Waste Disposal Facs. Rev. Bonds (Arch Resources Project), Series 2020, AMT, 5.00% 7/1/2045 (put 7/1/2025) | 500 | 502 | ||||||
| Econ. Dev. Auth., Solid Waste Disposal Facs. Rev. Ref. Bonds (Kentucky Power Co. - Mitchell Project), Series 2014-A, AMT, 4.70% 4/1/2036 (put 6/17/2026) | 400 | 402 | ||||||
| Hospital Fin. Auth., Hospital Rev. Ref. and Improvement Rev. Bonds (Vandalia Health Group), Series 2023-B, 6.00% 9/1/2048 | 800 | 914 | ||||||
| 2,315 | ||||||||
| Wisconsin 1.73% | ||||||||
| Environmental Improvement Fund, Rev. Bonds, Series 2017-A, 5.00% 6/1/2032 (preref. 6/1/2025) | 1,000 | 1,032 | ||||||
| G.O. Bonds, Series 2020, 5.00% 5/1/2034 | 1,130 | 1,278 | ||||||
| Health and Educational Facs. Auth., Rev. Bonds (Advocate Aurora Health Care Credit Group), Series 2018-C-3, 5.00% 8/15/2054 (put 6/24/2026) | 655 | 684 | ||||||
| Health and Educational Facs. Auth., Rev. Bonds (Ascension Health Alliance Senior Credit Group), Series 2013-B-1, 4.00% 11/15/2043 | 750 | 734 | ||||||
| Health and Educational Facs. Auth., Rev. Bonds (Hope Christian Schools Obligated Group), Series 2021, 3.00% 12/1/2031 | 450 | 380 | ||||||
| Health and Educational Facs. Auth., Rev. Ref. Bonds (ProHealth Care, Inc. Obligated Group), Series 2015, 5.00% 8/15/2039 | 1,000 | 1,000 | ||||||
| Public Fin. Auth., Air Cargo Rev. Bonds (AFCO Obligated Group), Series 2023, AMT, 5.00% 7/1/2025 | 265 | 268 | ||||||
| Public Fin. Auth., Project Rev. Bonds (CFP3 - Eastern Michigan University Student Housing Project), Series 2022-A-1, BAM insured, 5.00% 7/1/2030 | 700 | 791 | ||||||
| Public Fin. Auth., Retirement Community Rev. Bonds (Lifespace Communities, Inc.), Series 2020-A, 4.00% 11/15/2037 | 600 | 579 | ||||||
| Public Fin. Auth., Retirement Community Rev. Bonds (Lifespace Communities, Inc.), Series 2020-A, 5.00% 11/15/2041 | 500 | 516 | ||||||
| Public Fin. Auth., Rev. Ref. Bonds (Celanese Corp.), Series 2016-C, AMT, 4.30% 11/1/2030 | 775 | 754 | ||||||
| Public Fin. Auth., Special Rev. Bonds (Candela Project), Series 2023, 6.125% 12/15/20291 | 500 | 499 | ||||||
| Public Fin. Auth., Student Housing Rev. Bonds (CHF-Manoa, LLC UH Residences for Graduate Students), Series 2023-A, 5.25% 7/1/20381 | 415 | 429 | ||||||
| 8,944 | ||||||||
| Total bonds, notes & other debt instruments (cost: $466,012,000) | 482,134 | |||||||
| Capital Group Fixed Income ETF Trust | 59 |
Capital Group Municipal Income ETF (continued)
| Short-term securities 6.57% | Principal amount (000) | Value (000) | ||||||
| Municipals 6.57% | ||||||||
| State of Arizona, City of Phoenix, Industrial Dev. Auth., Solid Waste Disposal Rev. Ref. Bonds (Republic Services, Inc. Project), Series 2013, AMT, 4.90% 12/1/2035 (put 02/01/2024) | USD | 1,250 | $ | 1,250 | ||||
| State of Kentucky, Econ. Dev. Fin. Auth., Healthcare Facs. Rev. Ref. Bonds (Republic Services, Inc. Project), Series 2010-A, AMT, 4.50% 4/1/2031 (put 3/1/2024) | 1,000 | 1,000 | ||||||
| State of Louisiana, Public Facs. Auth., Rev. Bonds (Air Products and Chemicals Project), Series 2008-A, 4.05% 8/1/2043 | 7,515 | 7,515 | ||||||
| State of Mississippi, Business Fin. Corp., Gulf Opportunity Zone Industrial Dev. Rev. Bonds (Chevron U.S.A., Inc. Project), Series 2007-D, 3.95% 12/1/2030 | 1,500 | 1,500 | ||||||
| State of Mississippi, Business Fin. Corp., Gulf Opportunity Zone Industrial Dev. Rev. Bonds (Chevron U.S.A., Inc. Project), Series 2011-F, 3.95% 11/1/2035 | 1,000 | 1,000 | ||||||
| State of Missouri, Health and Educational Facs. Auth., Demand Educational Facs. Rev. Bonds (Washington University), Series 2003-B, 3.85% 2/15/2033 | 1,000 | 1,000 | ||||||
| State of Nevada, Dept. of Business and Industry, Rev. Bonds (Brightline West Passenger Rail Project), Series 2020-A, AMT, 3.70% 1/1/2050 (put 1/31/2024)1 | 200 | 200 | ||||||
| State of New York, New York City Transitional Fin. Auth., Future Tax Secured Bonds, Series 2015-E-4, 4.00% 2/1/2045 | 2,500 | 2,500 | ||||||
| State of New York, New York City Transitional Fin. Auth., Future Tax Secured Bonds, Series 2016-A-4, 4.00% 8/1/2041 | 2,100 | 2,100 | ||||||
| State of New York, Triborough Bridge and Tunnel Auth., General Rev. Bonds, Series 2001-C, 4.10% 1/1/2032 | 5,000 | 5,000 | ||||||
| State of Pennsylvania, Econ. Dev. Fncg. Auth., Solid Waste Disposal Rev. Bonds (Republic Services, Inc. Project), Series 2014, AMT, 4.30% 6/1/2044 (put 10/2/2023) | 750 | 750 | ||||||
| State of Pennsylvania, Econ. Dev. Fncg. Auth., Solid Waste Disposal Rev. Bonds (Waste Management, Inc. Project), Series 2013, AMT, 4.875% 8/1/2045 (put 2/1/2024) | 650 | 650 | ||||||
| State of Tennessee, City of Clarksville, Public Building Auth., Pooled Fncg. Rev. Bonds, Series 2003, Bank of America LOC, 4.08% 1/1/2033 | 800 | 800 | ||||||
| State of Tennessee, County of Montgomery, Public Building Auth., Pooled Fncg. Rev. Bonds (Tennessee County Loan Pool), Series 2002, Bank of America LOC, 4.09% 4/1/2032 | 2,000 | 2,000 | ||||||
| State of Texas, Harris County Industrial Dev. Corp., Pollution Control Rev. Bonds (Exxon Project), Series 1984-A, 3.95% 3/1/2024 | 4,500 | 4,500 | ||||||
| State of Virginia, College Building Auth., Educational Facs. Rev. Bonds (University of Richmond Project), Series 2006, 3.90% 11/1/2036 | 2,200 | 2,200 | ||||||
| 33,965 | ||||||||
| Total short-term securities (cost: $33,965,000) | 33,965 | |||||||
| Total investment securities 99.86% (cost: $499,977,000) | 516,099 | |||||||
| Other assets less liabilities 0.14% | 714 | |||||||
| Net assets 100.00% | $ | 516,813 | ||||||
| 60 | Capital Group Fixed Income ETF Trust |
Capital Group Municipal Income ETF (continued)
Futures contracts
| Contracts | Type | Number of contracts | Expiration date | Notional amount (000) | Value and unrealized appreciation (depreciation) at 12/31/2023 (000) | |||||||||||
| 2 Year U.S. Treasury Note Futures | Long | 310 | 3/28/2024 | USD | 63,833 | $ | 448 | |||||||||
| 10 Year Ultra U.S. Treasury Note Futures | Short | 134 | 3/19/2024 | (15,814 | ) | (514 | ) | |||||||||
| $ | (66 | ) | ||||||||||||||
| 1 | Acquired in a transaction exempt from registration under Rule 144A or, for commercial paper, Section 4(a)(2) of the Securities Act of 1933. May be resold in the U.S. in transactions exempt from registration, normally to qualified institutional buyers. The total value of all such securities was $29,334,000, which represented 5.68% of the net assets of the fund. |
| 2 | Coupon rate may change periodically. Reference rate and spread are as of the most recent information available. Some coupon rates are determined by the issuer or agent based on current market conditions; therefore, the reference rate and spread are not available. |
| 3 | Step bond; coupon rate may change at a later date. |
Key to abbreviation(s)
Agcy. = Agency
AMT = Alternative Minimum Tax
Assn. = Association
Auth. = Authority
Certs. = Certificates
CME = CME Group
Dept. = Department
Dev. = Development
Dist. = District
Econ. = Economic
Fac. = Facility
Facs. = Facilities
Fin. = Finance
Fncg. = Financing
G.O. = General Obligation
preref. = Prerefunded
Redev. = Redevelopment
Ref. = Refunding
Rev. = Revenue
SOFR = Secured Overnight Financing Rate
USD = U.S. dollars
Refer to the notes to financial statements.
| Capital Group Fixed Income ETF Trust | 61 |
Capital Group Short Duration Income ETF
Investment portfolio December 31, 2023
| Portfolio by type of security | Percent of net assets |
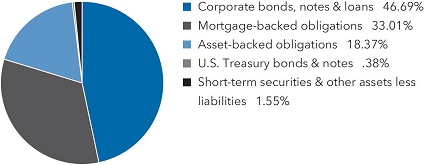
| Portfolio quality summary* | Percent of net assets | |||
| U.S. Treasury and agency† | .38 | % | ||
| AAA/Aaa | 39.22 | |||
| AA/Aa | 13.19 | |||
| A/A | 23.13 | |||
| BBB/Baa | 22.46 | |||
| Below investment grade | .07 | |||
| Short-term securities & other assets less liabilities | 1.55 | |||
| * | Bond ratings, which typically range from AAA/Aaa (highest) to D (lowest), are assigned by credit rating agencies such as Standard & Poor’s, Moody’s and/or Fitch as an indication of an issuer’s creditworthiness. In assigning a credit rating to a security, the fund looks specifically to the ratings assigned to the issuer of the security by Standard & Poor’s, Moody’s and/or Fitch. If agency ratings differ, the security will be considered to have received the highest of those ratings, consistent with the fund’s investment policies. The ratings are not covered by the Report of Independent Registered Public Accounting Firm. |
| † | These securities are guaranteed by the full faith and credit of the U.S. government. |
| Bonds, notes & other debt instruments 98.45% | Principal amount (000) | Value (000) | ||||||
| Corporate bonds, notes & loans 46.69% | ||||||||
| Financials 19.31% | ||||||||
| AerCap Ireland Capital DAC 1.75% 10/29/2024 | USD | 995 | $ | 961 | ||||
| AerCap Ireland Capital DAC 5.75% 6/6/2028 | 350 | 359 | ||||||
| AIB Group PLC 6.608% 9/13/2029 (USD-SOFR + 2.33% on 9/13/2028)1,2 | 300 | 316 | ||||||
| American Express Co. 3.375% 5/3/2024 | 360 | 357 | ||||||
| American Express Co. 2.50% 7/30/2024 | 300 | 295 | ||||||
| American Express Co. 2.25% 3/4/2025 | 825 | 799 | ||||||
| American Express Co. 6.338% 10/30/2026 (USD-SOFR + 1.33% on 10/30/2025)2 | 289 | 295 | ||||||
| Aon Global, Ltd. 3.875% 12/15/2025 | 843 | 826 | ||||||
| Bank of America Corp. 0.976% 4/22/2025 (USD-SOFR + 0.69% on 4/22/2024)2 | 717 | 706 | ||||||
| Bank of America Corp. 0.981% 9/25/2025 (USD-SOFR + 0.91% on 9/25/2024)2 | 3,905 | 3,770 | ||||||
| Bank of America Corp. 1.319% 6/19/2026 (USD-SOFR + 1.15% on 6/19/2025)2 | 1,318 | 1,241 | ||||||
| Bank of America Corp. 5.08% 1/20/2027 (USD-SOFR + 1.29% on 1/20/2026)2 | 600 | 599 | ||||||
| Bank of America Corp. 4.948% 7/22/2028 (USD-SOFR + 2.04% on 7/22/2027)2 | 350 | 350 | ||||||
| Bank of America Corp. 5.202% 4/25/2029 (USD-SOFR + 1.63% on 4/25/2028)2 | 650 | 654 | ||||||
| Bank of New York Mellon Corp. 4.414% 7/24/2026 (USD-SOFR + 1.345% on 7/24/2025)2 | 505 | 500 | ||||||
| Bank of Nova Scotia (The) 4.75% 2/2/2026 | 300 | 299 | ||||||
| Barclays PLC 6.49% 9/13/2029 (USD-SOFR + 2.22% on 9/13/2028)2 | 700 | 730 | ||||||
| BNP Paribas SA 3.375% 1/9/20251 | 355 | 348 | ||||||
| BPCE SA 1.625% 1/14/20251 | 400 | 386 | ||||||
| BPCE SA 6.612% 10/19/2027 (USD-SOFR + 1.98% on 10/19/2026)1,2 | 1,100 | 1,133 | ||||||
| CaixaBank, SA 6.684% 9/13/2027 (USD-SOFR + 2.08% on 9/13/2026)1,2 | 400 | 410 | ||||||
| Capital One Financial Corp. 3.75% 4/24/2024 | 5 | 5 | ||||||
| Capital One Financial Corp. 3.20% 2/5/2025 | 470 | 459 | ||||||
| Capital One Financial Corp. 4.25% 4/30/2025 | 755 | 744 | ||||||
| Charles Schwab Corp. (The) 5.875% 8/24/2026 | 225 | 231 | ||||||
| Charles Schwab Corp. (The) 5.643% 5/19/2029 (USD-SOFR + 2.21% on 5/19/2028)2 | 115 | 118 | ||||||
| Citibank, NA 5.803% 9/29/2028 | 1,500 | 1,567 | ||||||
| Citigroup, Inc. 0.981% 5/1/2025 (USD-SOFR + 0.669% on 5/1/2024)2 | 2,850 | 2,802 | ||||||
| Citigroup, Inc. 1.281% 11/3/2025 (USD-SOFR + 0.528% on 11/3/2024)2 | 525 | 505 | ||||||
| Corebridge Financial, Inc. 3.50% 4/4/2025 | 638 | 623 | ||||||
| Deutsche Bank AG 7.146% 7/13/2027 (USD-SOFR + 2.52% on 7/13/2026)2 | 150 | 156 | ||||||
| 62 | Capital Group Fixed Income ETF Trust |
Capital Group Short Duration Income ETF (continued)
| Bonds, notes & other debt instruments (continued) | Principal amount (000) | Value (000) | ||||||
| Corporate bonds, notes & loans (continued) | ||||||||
| Financials (continued) | ||||||||
| Deutsche Bank AG 6.819% 11/20/2029 (USD-SOFR + 2.51% on 11/20/2028)2 | USD | 400 | $ | 421 | ||||
| Fifth Third Bancorp 6.339% 7/27/2029 (USD-SOFR + 2.34% on 7/27/2028)2 | 95 | 99 | ||||||
| Global Payments, Inc. 2.65% 2/15/2025 | 865 | 839 | ||||||
| Goldman Sachs Group, Inc. 5.70% 11/1/2024 | 2,115 | 2,121 | ||||||
| Goldman Sachs Group, Inc. 3.50% 4/1/2025 | 2,251 | 2,202 | ||||||
| Goldman Sachs Group, Inc. 6.484% 10/24/2029 (USD-SOFR + 1.77% on 10/24/2028)2 | 425 | 451 | ||||||
| HSBC Holdings PLC 5.887% 8/14/2027 (USD-SOFR + 1.57% on 8/14/2026)2 | 1,750 | 1,775 | ||||||
| HSBC Holdings PLC 6.161% 3/9/2029 (USD-SOFR + 1.97% on 3/9/2028)2 | 425 | 439 | ||||||
| HSBC USA, Inc. 5.625% 3/17/2025 | 1,132 | 1,138 | ||||||
| ING Groep NV 6.083% 9/11/2027 (USD-SOFR + 1.56% on 9/11/2026)2 | 300 | 306 | ||||||
| Intercontinental Exchange, Inc. 3.65% 5/23/2025 | 420 | 412 | ||||||
| Intercontinental Exchange, Inc. 4.00% 9/15/2027 | 125 | 123 | ||||||
| JPMorgan Chase & Co. 0.824% 6/1/2025 (USD-SOFR + 0.54% on 6/1/2024)2 | 2,350 | 2,300 | ||||||
| JPMorgan Chase & Co. 1.561% 12/10/2025 (USD-SOFR + 0.605% on 12/10/2024)2 | 3,295 | 3,173 | ||||||
| JPMorgan Chase & Co. 4.08% 4/26/2026 (USD-SOFR + 1.32% on 4/26/2025)2 | 2,272 | 2,236 | ||||||
| JPMorgan Chase & Co. 5.299% 7/24/2029 (USD-SOFR + 1.45% on 7/24/2028)2 | 250 | 254 | ||||||
| JPMorgan Chase & Co. 6.087% 10/23/2029 (USD-SOFR + 1.57% on 10/23/2028)2 | 400 | 421 | ||||||
| Lloyds Banking Group PLC 3.87% 7/9/2025 (1-year UST Yield Curve Rate T Note Constant Maturity + 3.50% on 7/9/2024)2 | 400 | 396 | ||||||
| Lloyds Banking Group PLC 5.985% 8/7/2027 (1-year UST Yield Curve Rate T Note Constant Maturity + 1.48% on 8/7/2026)2 | 600 | 611 | ||||||
| Marsh & McLennan Companies, Inc. 3.875% 3/15/2024 | 1,298 | 1,293 | ||||||
| Metropolitan Life Global Funding I 3.60% 1/11/20241 | 240 | 240 | ||||||
| Morgan Stanley 0.79% 5/30/2025 (USD-SOFR + 0.525% on 5/30/2024)2 | 1,500 | 1,467 | ||||||
| Morgan Stanley 1.164% 10/21/2025 (USD-SOFR + 0.56% on 10/21/2024)2 | 2,994 | 2,882 | ||||||
| Morgan Stanley 4.754% 4/21/2026 | 350 | 350 | ||||||
| Morgan Stanley 5.164% 4/20/2029 (USD-SOFR + 1.59% on 4/20/2028)2 | 125 | 126 | ||||||
| Morgan Stanley 5.449% 7/20/2029 (USD-SOFR + 1.63% on 7/20/2028)2 | 475 | 484 | ||||||
| Morgan Stanley 6.407% 11/1/2029 (USD-SOFR + 1.83% on 11/1/2028)2 | 305 | 324 | ||||||
| Morgan Stanley, Series F, 3.875% 4/29/2024 | 75 | 75 | ||||||
| Nasdaq, Inc. 5.65% 6/28/2025 | 675 | 682 | ||||||
| PNC Financial Services Group, Inc. 5.671% 10/28/2025 (USD-SOFR + 1.09% on 10/28/2024)2 | 788 | 788 | ||||||
| PNC Financial Services Group, Inc. 4.758% 1/26/2027 (USD-SOFR + 1.085% on 1/26/2026)2 | 650 | 645 | ||||||
| PNC Financial Services Group, Inc. 6.615% 10/20/2027 (USD-SOFR + 1.73% on 10/20/2026)2 | 660 | 685 | ||||||
| PNC Financial Services Group, Inc. 5.582% 6/12/2029 (USD-SOFR + 1.841% on 6/12/2028)2 | 108 | 110 | ||||||
| PRICOA Global Funding I 1.15% 12/6/20241 | 1,088 | 1,047 | ||||||
| Royal Bank of Canada 5.66% 10/25/2024 | 310 | 311 | ||||||
| Royal Bank of Canada 4.95% 4/25/2025 | 300 | 300 | ||||||
| Royal Bank of Canada 4.875% 1/12/2026 | 530 | 532 | ||||||
| State Street Corp. 5.82% 11/4/2028 (USD-SOFR + 1.715% on 11/4/2027)2 | 7 | 7 | ||||||
| Sumitomo Mitsui Financial Group, Inc. 5.716% 9/14/2028 | 475 | 492 | ||||||
| Swedbank AB 6.136% 9/12/20261 | 850 | 867 | ||||||
| Toronto-Dominion Bank (The) 0.55% 3/4/2024 | 250 | 248 | ||||||
| Toronto-Dominion Bank (The) 0.75% 9/11/2025 | 875 | 817 | ||||||
| Truist Financial Corp. 6.047% 6/8/2027 (USD-SOFR + 2.05% on 6/8/2026)2 | 780 | 794 | ||||||
| Truist Financial Corp. 7.161% 10/30/2029 (USD-SOFR + 2.446% on 10/30/2028)2 | 32 | 35 | ||||||
| U.S. Bancorp 1.45% 5/12/2025 | 1,133 | 1,079 | ||||||
| UBS Group AG 6.246% 9/22/2029 (1-year UST Yield Curve Rate T Note Constant Maturity + 1.80% on 9/22/2028)1,2 | 350 | 365 | ||||||
| Wells Fargo & Co. 0.805% 5/19/2025 (USD-SOFR + 0.51% on 5/19/2024)2 | 430 | 422 | ||||||
| Wells Fargo & Co. 2.406% 10/30/2025 (3-month USD CME Term SOFR + 1.087% on 10/30/2024)2 | 1,260 | 1,226 | ||||||
| Wells Fargo & Co. 4.808% 7/25/2028 (USD-SOFR + 1.98% on 7/25/2027)2 | 150 | 149 | ||||||
| Wells Fargo & Co. 5.574% 7/25/2029 (USD-SOFR + 1.74% on 7/25/2028)2 | 550 | 562 | ||||||
| Wells Fargo & Co. 6.303% 10/23/2029 (USD-SOFR + 1.79% on 10/23/2028)2 | 750 | 791 | ||||||
| Wells Fargo Bank, N.A. 5.45% 8/7/2026 | 800 | 813 | ||||||
| Willis North America, Inc. 3.60% 5/15/2024 | 914 | 906 | ||||||
| 64,175 | ||||||||
| Capital Group Fixed Income ETF Trust | 63 |
Capital Group Short Duration Income ETF (continued)
| Bonds, notes & other debt instruments (continued) | Principal amount (000) | Value (000) | ||||||
| Corporate bonds, notes & loans (continued) | ||||||||
| Utilities 5.24% | ||||||||
| CenterPoint Energy Houston Electric, LLC 5.20% 10/1/2028 | USD | 250 | $ | 258 | ||||
| CenterPoint Energy, Inc. 5.25% 8/10/2026 | 425 | 429 | ||||||
| Consumers Energy Co. 4.90% 2/15/2029 | 300 | 306 | ||||||
| DTE Electric Co. 3.65% 3/15/2024 | 117 | 116 | ||||||
| Duke Energy Corp. 5.00% 12/8/2025 | 330 | 331 | ||||||
| Edison International 4.70% 8/15/2025 | 2,270 | 2,243 | ||||||
| Edison International 5.25% 11/15/2028 | 250 | 252 | ||||||
| Entergy Louisiana, LLC 0.95% 10/1/2024 | 1,480 | 1,432 | ||||||
| Eversource Energy 5.95% 2/1/2029 | 275 | 288 | ||||||
| Florida Power & Light Co. 3.25% 6/1/2024 | 125 | 124 | ||||||
| Florida Power & Light Co. 3.125% 12/1/2025 | 240 | 233 | ||||||
| Florida Power & Light Co. 4.45% 5/15/2026 | 200 | 200 | ||||||
| Florida Power & Light Co. 5.05% 4/1/2028 | 200 | 205 | ||||||
| Georgia Power Co. 4.65% 5/16/2028 | 400 | 403 | ||||||
| Jersey Central Power & Light Co. 4.70% 4/1/20241 | 835 | 832 | ||||||
| Jersey Central Power & Light Co. 4.30% 1/15/20261 | 2,292 | 2,244 | ||||||
| NiSource, Inc. 0.95% 8/15/2025 | 240 | 224 | ||||||
| Oncor Electric Delivery Co., LLC 2.75% 6/1/2024 | 855 | 845 | ||||||
| Pacific Gas and Electric Co. 3.75% 2/15/2024 | 220 | 219 | ||||||
| Pacific Gas and Electric Co. 3.45% 7/1/2025 | 3,380 | 3,273 | ||||||
| Pacific Gas and Electric Co. 6.10% 1/15/2029 | 232 | 240 | ||||||
| Public Service Electric and Gas Co. 3.00% 5/15/2025 | 360 | 352 | ||||||
| Southern California Edison Co. 4.20% 6/1/2025 | 1,115 | 1,103 | ||||||
| Southern California Edison Co. 4.90% 6/1/2026 | 150 | 151 | ||||||
| Southern California Edison Co. 5.85% 11/1/2027 | 105 | 110 | ||||||
| Southwestern Public Service Co. 3.30% 6/15/2024 | 130 | 129 | ||||||
| Virginia Electric & Power 3.45% 2/15/2024 | 20 | 20 | ||||||
| Virginia Electric & Power 3.10% 5/15/2025 | 530 | 517 | ||||||
| WEC Energy Group, Inc. 5.60% 9/12/2026 | 325 | 331 | ||||||
| 17,410 | ||||||||
| Health care 4.67% | ||||||||
| AbbVie, Inc. 2.60% 11/21/2024 | 1,630 | 1,593 | ||||||
| Amgen, Inc. 3.625% 5/22/2024 | 65 | 64 | ||||||
| Amgen, Inc. 1.90% 2/21/2025 | 870 | 840 | ||||||
| Amgen, Inc. 5.507% 3/2/2026 | 885 | 885 | ||||||
| Amgen, Inc. 5.15% 3/2/2028 | 562 | 576 | ||||||
| AstraZeneca Finance, LLC 0.70% 5/28/2024 | 70 | 69 | ||||||
| Baxter International, Inc. 1.322% 11/29/2024 | 2,527 | 2,435 | ||||||
| Bayer US Finance, LLC 6.25% 1/21/20291 | 320 | 327 | ||||||
| Becton, Dickinson and Co. 3.363% 6/6/2024 | 290 | 287 | ||||||
| Becton, Dickinson and Co. 3.734% 12/15/2024 | 420 | 414 | ||||||
| Boston Scientific Corp. 3.45% 3/1/2024 | 240 | 239 | ||||||
| Boston Scientific Corp. 1.90% 6/1/2025 | 750 | 718 | ||||||
| CVS Health Corp. 2.625% 8/15/2024 | 350 | 344 | ||||||
| CVS Health Corp. 5.00% 2/20/2026 | 500 | 502 | ||||||
| CVS Health Corp. 5.00% 1/30/2029 | 210 | 214 | ||||||
| Elevance Health, Inc. 3.35% 12/1/2024 | 245 | 241 | ||||||
| Elevance Health, Inc. 2.375% 1/15/2025 | 540 | 525 | ||||||
| GE HealthCare Technologies, Inc. 5.55% 11/15/2024 | 380 | 380 | ||||||
| Gilead Sciences, Inc. 3.70% 4/1/2024 | 310 | 309 | ||||||
| HCA, Inc. 5.375% 2/1/2025 | 1,460 | 1,459 | ||||||
| HCA, Inc. 5.20% 6/1/2028 | 120 | 121 | ||||||
| Humana, Inc. 3.85% 10/1/2024 | 1,080 | 1,067 | ||||||
| Laboratory Corporation of America Holdings 3.60% 2/1/2025 | 730 | 718 | ||||||
| Novartis Capital Corp. 3.40% 5/6/2024 | 55 | 55 | ||||||
| Pfizer Investment Enterprises Pte., Ltd. 4.45% 5/19/2026 | 400 | 399 | ||||||
| Thermo Fisher Scientific, Inc. 1.215% 10/18/2024 | 400 | 387 | ||||||
| UnitedHealth Group, Inc. 5.15% 10/15/2025 | 370 | 374 | ||||||
| 15,542 | ||||||||
| 64 | Capital Group Fixed Income ETF Trust |
Capital Group Short Duration Income ETF (continued)
| Bonds, notes & other debt instruments (continued) | Principal amount (000) | Value (000) | ||||||
| Corporate bonds, notes & loans (continued) | ||||||||
| Communication services 3.28% | ||||||||
| AT&T, Inc. 0.90% 3/25/2024 | USD | 1,480 | $ | 1,464 | ||||
| Charter Communications Operating, LLC 4.50% 2/1/2024 | 620 | 619 | ||||||
| Charter Communications Operating, LLC 4.908% 7/23/2025 | 2,755 | 2,730 | ||||||
| Charter Communications Operating, LLC 6.15% 11/10/2026 | 750 | 767 | ||||||
| Comcast Corp. 5.25% 11/7/2025 | 210 | 212 | ||||||
| Netflix, Inc. 5.875% 2/15/2025 | 1,265 | 1,276 | ||||||
| T-Mobile USA, Inc. 3.50% 4/15/2025 | 1,370 | 1,342 | ||||||
| T-Mobile USA, Inc. 4.80% 7/15/2028 | 175 | 177 | ||||||
| Verizon Communications, Inc. 3.50% 11/1/2024 | 195 | 192 | ||||||
| Verizon Communications, Inc. 3.376% 2/15/2025 | 572 | 562 | ||||||
| WarnerMedia Holdings, Inc. 3.528% 3/15/2024 | 1,195 | 1,182 | ||||||
| WarnerMedia Holdings, Inc. 3.788% 3/15/2025 | 390 | 382 | ||||||
| 10,905 | ||||||||
| Industrials 3.10% | ||||||||
| Boeing Co. 2.80% 3/1/2024 | 125 | 124 | ||||||
| Boeing Co. 4.875% 5/1/2025 | 2,065 | 2,056 | ||||||
| Boeing Co. 2.196% 2/4/2026 | 1,485 | 1,403 | ||||||
| Burlington Northern Santa Fe, LLC 3.40% 9/1/2024 | 225 | 222 | ||||||
| Canadian Pacific Railway Co. 1.35% 12/2/2024 | 1,057 | 1,020 | ||||||
| Carrier Global Corp. 2.242% 2/15/2025 | 685 | 664 | ||||||
| Carrier Global Corp. 5.80% 11/30/20251 | 1,050 | 1,064 | ||||||
| CSX Corp. 3.40% 8/1/2024 | 607 | 600 | ||||||
| Eaton Corp. 6.50% 6/1/2025 | 65 | 66 | ||||||
| Ingersoll-Rand, Inc. 5.40% 8/14/2028 | 260 | 268 | ||||||
| L3Harris Technologies, Inc. 5.40% 1/15/2027 | 350 | 357 | ||||||
| Lockheed Martin Corp. 4.95% 10/15/2025 | 440 | 444 | ||||||
| Northrop Grumman Corp. 2.93% 1/15/2025 | 665 | 650 | ||||||
| RTX Corp. 3.95% 8/16/2025 | 500 | 493 | ||||||
| RTX Corp. 5.75% 11/8/2026 | 450 | 463 | ||||||
| RTX Corp. 5.75% 1/15/2029 | 300 | 314 | ||||||
| Union Pacific Corp. 3.646% 2/15/2024 | 95 | 95 | ||||||
| 10,303 | ||||||||
| Energy 2.57% | ||||||||
| Canadian Natural Resources, Ltd. 3.80% 4/15/2024 | 530 | 527 | ||||||
| Canadian Natural Resources, Ltd. 2.05% 7/15/2025 | 586 | 559 | ||||||
| Chevron Corp. 2.895% 3/3/2024 | 45 | 45 | ||||||
| Chevron USA, Inc. 0.687% 8/12/2025 | 400 | 376 | ||||||
| Columbia Pipelines Holding Co., LLC 6.042% 8/15/20281 | 350 | 361 | ||||||
| ConocoPhillips Co. 2.125% 3/8/2024 | 200 | 199 | ||||||
| Continental Resources, Inc. 3.80% 6/1/2024 | 70 | 69 | ||||||
| Enbridge, Inc. 5.90% 11/15/2026 | 450 | 462 | ||||||
| Enbridge, Inc. 6.00% 11/15/2028 | 300 | 315 | ||||||
| Energy Transfer, LP 5.875% 1/15/2024 | 125 | 125 | ||||||
| Energy Transfer, LP 3.90% 5/15/2024 | 945 | 938 | ||||||
| Energy Transfer, LP 6.10% 12/1/2028 | 438 | 461 | ||||||
| EQT Corp. 6.12% 2/1/20252 | 732 | 736 | ||||||
| Exxon Mobil Corp. 2.002% 8/16/2024 | 130 | 128 | ||||||
| Exxon Mobil Corp. 2.992% 3/19/2025 | 485 | 475 | ||||||
| MPLX, LP 4.875% 12/1/2024 | 636 | 633 | ||||||
| ONEOK, Inc. 2.75% 9/1/2024 | 165 | 162 | ||||||
| ONEOK, Inc. 5.55% 11/1/2026 | 490 | 499 | ||||||
| ONEOK, Inc. 5.65% 11/1/2028 | 620 | 642 | ||||||
| Shell International Finance BV 3.25% 5/11/2025 | 515 | 505 | ||||||
| TotalEnergies Capital International SA 3.75% 4/10/2024 | 45 | 45 | ||||||
| Williams Companies, Inc. 5.30% 8/15/2028 | 275 | 282 | ||||||
| 8,544 | ||||||||
| Capital Group Fixed Income ETF Trust | 65 |
Capital Group Short Duration Income ETF (continued)
| Bonds, notes & other debt instruments (continued) | Principal amount (000) | Value (000) | ||||||
| Corporate bonds, notes & loans (continued) | ||||||||
| Consumer staples 2.50% | ||||||||
| 7-Eleven, Inc. 0.80% 2/10/20241 | USD | 395 | $ | 393 | ||||
| Altria Group, Inc. 2.35% 5/6/2025 | 800 | 772 | ||||||
| Anheuser-Busch Companies, LLC 3.65% 2/1/2026 | 246 | 241 | ||||||
| BAT Capital Corp. 3.222% 8/15/2024 | 1,140 | 1,122 | ||||||
| BAT International Finance PLC 5.931% 2/2/2029 | 300 | 312 | ||||||
| Conagra Brands, Inc. 4.30% 5/1/2024 | 1,430 | 1,423 | ||||||
| Constellation Brands, Inc. 5.00% 2/2/2026 | 300 | 299 | ||||||
| Constellation Brands, Inc. 4.35% 5/9/2027 | 290 | 288 | ||||||
| J. M. Smucker Co. (The) 5.90% 11/15/2028 | 289 | 304 | ||||||
| Philip Morris International, Inc. 2.875% 5/1/2024 | 40 | 40 | ||||||
| Philip Morris International, Inc. 5.125% 11/15/2024 | 370 | 370 | ||||||
| Philip Morris International, Inc. 5.00% 11/17/2025 | 915 | 919 | ||||||
| Philip Morris International, Inc. 4.875% 2/13/2026 | 475 | 477 | ||||||
| Philip Morris International, Inc. 5.25% 9/7/2028 | 250 | 257 | ||||||
| Reynolds American, Inc. 4.45% 6/12/2025 | 1,110 | 1,098 | ||||||
| 8,315 | ||||||||
| Consumer discretionary 2.01% | ||||||||
| Ford Motor Credit Co., LLC 5.125% 6/16/2025 | 2,000 | 1,976 | ||||||
| Ford Motor Credit Co., LLC 6.95% 6/10/2026 | 675 | 693 | ||||||
| Ford Motor Credit Co., LLC 6.798% 11/7/2028 | 200 | 209 | ||||||
| General Motors Financial Co., Inc. 1.20% 10/15/2024 | 900 | 869 | ||||||
| General Motors Financial Co., Inc. 2.75% 6/20/2025 | 60 | 58 | ||||||
| General Motors Financial Co., Inc. 5.40% 4/6/2026 | 300 | 302 | ||||||
| Hyundai Capital America 1.80% 10/15/20251 | 590 | 555 | ||||||
| Hyundai Capital America 5.50% 3/30/20261 | 350 | 352 | ||||||
| Hyundai Capital America 6.10% 9/21/20281 | 275 | 286 | ||||||
| Hyundai Capital America 6.50% 1/16/20291 | 53 | 56 | ||||||
| Marriott International, Inc. 3.60% 4/15/2024 | 770 | 766 | ||||||
| Marriott International, Inc. 5.55% 10/15/2028 | 250 | 258 | ||||||
| Toyota Motor Credit Corp. 0.50% 6/18/2024 | 325 | 317 | ||||||
| 6,697 | ||||||||
| Information technology 1.42% | ||||||||
| Apple, Inc. 0.55% 8/20/2025 | 495 | 466 | ||||||
| Broadcom Corp. 3.625% 1/15/2024 | 155 | 155 | ||||||
| Broadcom Corp. 3.125% 1/15/2025 | 245 | 240 | ||||||
| Broadcom, Inc. 3.625% 10/15/2024 | 222 | 219 | ||||||
| Broadcom, Inc. 3.15% 11/15/2025 | 660 | 639 | ||||||
| Hewlett Packard Enterprise Co. 5.90% 10/1/2024 | 914 | 916 | ||||||
| Oracle Corp. 3.40% 7/8/2024 | 615 | 608 | ||||||
| Oracle Corp. 2.50% 4/1/2025 | 1,520 | 1,470 | ||||||
| 4,713 | ||||||||
| Materials 1.30% | ||||||||
| Anglo American Capital PLC 3.625% 9/11/20241 | 1,035 | 1,019 | ||||||
| BHP Billiton Finance (USA), Ltd. 4.875% 2/27/2026 | 375 | 377 | ||||||
| BHP Billiton Finance (USA), Ltd. 5.10% 9/8/2028 | 250 | 257 | ||||||
| Celanese US Holdings, LLC 6.35% 11/15/2028 | 436 | 458 | ||||||
| Dow Chemical Co. (The) 4.55% 11/30/2025 | 65 | 64 | ||||||
| Glencore Funding, LLC 1.625% 4/27/20261 | 365 | 338 | ||||||
| International Flavors & Fragrances, Inc. 1.23% 10/1/20251 | 1,095 | 1,014 | ||||||
| LYB International Finance III, LLC 1.25% 10/1/2025 | 220 | 206 | ||||||
| Nutrien, Ltd. 5.95% 11/7/2025 | 29 | 29 | ||||||
| Nutrien, Ltd. 4.90% 3/27/2028 | 189 | 191 | ||||||
| Sherwin-Williams Co. 4.05% 8/8/2024 | 370 | 367 | ||||||
| 4,320 | ||||||||
| 66 | Capital Group Fixed Income ETF Trust |
Capital Group Short Duration Income ETF (continued)
| Bonds, notes & other debt instruments (continued) | Principal amount (000) | Value (000) | ||||||
| Corporate bonds, notes & loans (continued) | ||||||||
| Real estate 1.29% | ||||||||
| Corporate Office Properties, LP 2.25% 3/15/2026 | USD | 265 | $ | 247 | ||||
| Equinix, Inc. 2.625% 11/18/2024 | 1,385 | 1,350 | ||||||
| Equinix, Inc. 1.00% 9/15/2025 | 949 | 886 | ||||||
| Prologis, LP 4.875% 6/15/2028 | 246 | 249 | ||||||
| Public Storage Operating Co. 0.875% 2/15/2026 | 95 | 88 | ||||||
| Scentre Group Trust 1 3.50% 2/12/20251 | 640 | 627 | ||||||
| VICI Properties, LP 4.625% 6/15/20251 | 855 | 840 | ||||||
| 4,287 | ||||||||
| Total corporate bonds, notes & loans | 155,211 | |||||||
| Mortgage-backed obligations 33.01% | ||||||||
| Federal agency mortgage-backed obligations 13.45% | ||||||||
| Fannie Mae Pool #MA5139 6.00% 9/1/20533 | 12,571 | 12,767 | ||||||
| Uniform Mortgage-Backed Security 5.00% 1/1/20543,4 | 15,700 | 15,535 | ||||||
| Uniform Mortgage-Backed Security 6.00% 1/1/20543,4 | 1,000 | 1,016 | ||||||
| Uniform Mortgage-Backed Security 6.50% 1/1/20543,4 | 15,000 | 15,373 | ||||||
| 44,691 | ||||||||
| Commercial mortgage-backed securities 10.56% | ||||||||
| Banc of America Commercial Mortgage, Inc., Series 2015-UBS7, Class A4, 3.705% 9/15/20483 | 260 | 250 | ||||||
| Bank Commercial Mortgage Trust, Series 2017-BNK4, Class A3, 3.362% 5/15/20503 | 819 | 781 | ||||||
| Bank Commercial Mortgage Trust, Series 2017-BNK4, Class A4, 3.625% 5/15/20503 | 1,127 | 1,065 | ||||||
| Bank Commercial Mortgage Trust, Series 2023-5YR1, Class A3, 6.26% 3/15/20563 | 495 | 514 | ||||||
| Bank Commercial Mortgage Trust, Series 2019-BN18, Class A4, 3.584% 5/15/20623 | 414 | 372 | ||||||
| Bank of America Merrill Lynch Large Loan, Inc., Series 2015-200P, Class A, 3.218% 4/14/20331,3 | 1,000 | 956 | ||||||
| Barclays Commercial Mortgage Securities, LLC, Series 2018-TALL, Class A, ((1-month USD CME Term SOFR + 0.047%) + 0.872%) 6.281% 3/15/20371,3 | 241 | 224 | ||||||
| Benchmark Mortgage Trust, Series 2018-B2, Class A5, 3.882% 2/15/20513 | 305 | 287 | ||||||
| Benchmark Mortgage Trust, Series 2018-B3, Class A5, 4.025% 4/10/20513 | 410 | 389 | ||||||
| Benchmark Mortgage Trust, Series 2018-B3, Class AS, 4.195% 4/10/20513 | 800 | 734 | ||||||
| BMO Mortgage Trust, Series 2023-5C1, Class A3, 6.534% 8/15/20563 | 621 | 655 | ||||||
| BOCA Commercial Mortgage Trust, Series 2022-BOCA, Class A, (1-month USD CME Term SOFR + 1.77%) 7.131% 5/15/20391,3 | 500 | 498 | ||||||
| BX Commercial Mortgage Trust, Series 2019-XL, Class A, (1-month USD CME Term SOFR + 1.034%) 6.396% 10/15/20361,3 | 67 | 67 | ||||||
| BX Trust, Series 2021-VOLT, Class B, (1-month USD CME Term SOFR + 1.064%) 6.426% 9/15/20361,3 | 189 | 184 | ||||||
| BX Trust, Series 2021-ACNT, Class A, (1-month USD CME Term SOFR + 0.964%) 6.326% 11/15/20381,3 | 500 | 493 | ||||||
| BX Trust, Series 2022-AHP, Class A, (1-month USD CME Term SOFR + 0.99%) 6.352% 2/15/20391,3 | 483 | 474 | ||||||
| BX Trust, Series 2022-PSB, Class A, (1-month USD CME Term SOFR + 2.451%) 7.813% 8/15/20391,3 | 177 | 178 | ||||||
| BX Trust, Series 2022-PSB, Class C, (1-month USD CME Term SOFR + 3.697%) 9.059% 8/15/20391,3 | 177 | 177 | ||||||
| BXP Trust, Series 2017-GM, Class A, 3.379% 6/13/20391,3 | 887 | 825 | ||||||
| Citigroup Commercial Mortgage Trust, Series 2023-PRM3, Class A, 6.36% 7/10/20281,3 | 750 | 772 | ||||||
| Citigroup Commercial Mortgage Trust, Series 2023-SMRT, Class A, 5.82% 6/10/20281,3 | 361 | 366 | ||||||
| Citigroup Commercial Mortgage Trust, Series 2014-GC23, Class A4, 3.622% 7/10/20473 | 850 | 838 | ||||||
| Citigroup Commercial Mortgage Trust, Series 2014-GC25, Class A4, 3.635% 10/10/20473 | 325 | 319 | ||||||
| Citigroup Commercial Mortgage Trust, Series 2016-GC37, Class A4, 3.31% 4/10/20493 | 270 | 257 | ||||||
| Commercial Mortgage Trust, Series 2015-3BP, Class A, 3.178% 2/10/20351,3 | 500 | 475 | ||||||
| Commercial Mortgage Trust, Series 2014-CR15, Class A4, 4.074% 2/10/20473 | 686 | 685 | ||||||
| Commercial Mortgage Trust, Series 2014-CR14, Class AM, 4.526% 2/10/20473 | 749 | 718 | ||||||
| Commercial Mortgage Trust, Series 2014-CR16, Class A4, 4.051% 4/10/20473 | 775 | 769 | ||||||
| Commercial Mortgage Trust, Series 2014-CR20, Class A4, 3.59% 11/10/20473 | 500 | 490 | ||||||
| Commercial Mortgage Trust, Series 2015-PC1, Class A5, 3.902% 7/10/20503 | 445 | 433 | ||||||
| DC Commercial Mortgage Trust, Series 2023-DC, Class A, 6.314% 9/10/20401,3 | 490 | 506 | ||||||
| FIVE Mortgage Trust, Series 2023-V1, Class A3, 5.668% 2/10/20563 | 1,216 | 1,237 | ||||||
| Capital Group Fixed Income ETF Trust | 67 |
Capital Group Short Duration Income ETF (continued)
| Bonds, notes & other debt instruments (continued) | Principal amount (000) | Value (000) | ||||||
| Mortgage-backed obligations (continued) | ||||||||
| Commercial mortgage-backed securities (continued) | ||||||||
| Fontainebleau Miami Beach Trust, CMO, Series 2019-FBLU, Class A, 3.144% 12/10/20361,3 | USD | 995 | $ | 964 | ||||
| FS Commercial Trust, Series 2023-4SZN, Class A, 7.066% 11/10/20391,3 | 808 | 841 | ||||||
| GS Mortgage Securities Trust, Series 2018-HULA, Class A, (1-month USD CME Term SOFR + 1.223%) 6.396% 7/15/20251,3 | 457 | 454 | ||||||
| GS Mortgage Securities Trust, Series 2014-GC24, Class A5, 3.931% 9/10/20473 | 1,257 | 1,234 | ||||||
| Intown 2022-Stay Mortgage Trust, Series 2022-STAY, Class A, (1-month USD CME Term SOFR + 2.489%) 7.812% 8/15/20393 | 200 | 201 | ||||||
| LUXE Commercial Mortgage Trust, Series 21-TRIP, Class C, (1-month USD CME Term SOFR + 1.864%) 7.23% 10/15/20381,3 | 250 | 247 | ||||||
| Manhattan West Mortgage Trust, Series 2020-1MW, Class A, 2.13% 9/10/20391,3 | 857 | 758 | ||||||
| Morgan Stanley Bank of America Merrill Lynch Trust, Series 2014-C17, Class A5, 3.741% 8/15/20473 | 930 | 917 | ||||||
| Morgan Stanley Bank of America Merrill Lynch Trust, Series 2014-C18, Class AS, 4.11% 10/15/20473 | 592 | 576 | ||||||
| Morgan Stanley Bank of America Merrill Lynch Trust, Series 2015-C21, Class A4, 3.338% 3/15/20483 | 200 | 194 | ||||||
| Morgan Stanley Bank of America Merrill Lynch Trust, Series 2015-C22, Class AS, 3.561% 4/15/20483 | 500 | 476 | ||||||
| Morgan Stanley Bank of America Merrill Lynch Trust, Series 2015-C24, Class AS, 4.036% 5/15/20483 | 500 | 477 | ||||||
| Morgan Stanley Bank of America Merrill Lynch Trust, Series 2015-C25, Class A-4, 3.372% 10/15/20483 | 305 | 295 | ||||||
| Morgan Stanley Capital I Trust, Series 2015-UBS8, Class AS, 4.114% 12/15/20483 | 550 | 515 | ||||||
| Multifamily Connecticut Avenue Securities, Series 2023-01, Class M7, (30-day Average USD-SOFR + 4.00%) 9.337% 11/25/20531,3 | 207 | 210 | ||||||
| SFO Commercial Mortgage Trust, Series 2021-555, Class A, (1-month USD CME Term SOFR + 1.264%) 6.63% 5/15/2038 (1-month USD CME Term SOFR + 1.514% on 5/15/2026)1,2,3 | 1,000 | 938 | ||||||
| SFO Commercial Mortgage Trust, Series 2021-555, Class B, (1-month USD CME Term SOFR + 1.614%) 6.976% 5/15/20381,3 | 362 | 329 | ||||||
| SG Commercial Mortgage Securities Trust, Series 2016-C5, Class A3, 2.779% 10/10/20483 | 872 | 829 | ||||||
| StorageMart Commercial Mortgage Trust, Series 2022-MINI, Class A, (1-month USD CME Term SOFR + 1.00%) 6.362% 1/15/20391,3 | 500 | 490 | ||||||
| Wells Fargo Commercial Mortgage Trust, Series 2015-C27, Class A5, 3.451% 2/15/20483 | 755 | 730 | ||||||
| Wells Fargo Commercial Mortgage Trust, Series 2015-C28, Class AS, 3.872% 5/15/20483 | 500 | 473 | ||||||
| Wells Fargo Commercial Mortgage Trust, Series 2015-C29, Class AS, 4.013% 6/15/20483 | 500 | 481 | ||||||
| Wells Fargo Commercial Mortgage Trust, Series 2014-LC16, Class A5, 3.817% 8/15/20503 | 500 | 493 | ||||||
| Wells Fargo Commercial Mortgage Trust, Series 2015-NXS-2, Class A-5, 3.767% 7/15/20583 | 1,565 | 1,508 | ||||||
| Wells Fargo Commercial Mortgage Trust, Series 2016-C33, Class A4, 3.426% 3/15/20593 | 541 | 517 | ||||||
| WF-RBS Commercial Mortgage Trust, Series 2014-C19, Class A5, 4.101% 3/15/20473 | 404 | 402 | ||||||
| WF-RBS Commercial Mortgage Trust, Series 2014-C19, Class B, 4.723% 3/15/20473 | 615 | 609 | ||||||
| WF-RBS Commercial Mortgage Trust, Series 2014-C25, Class A5, 3.631% 11/15/20473 | 852 | 833 | ||||||
| WF-RBS Commercial Mortgage Trust, Series 2014-C22, Class A4, 3.488% 9/15/20573 | 665 | 656 | ||||||
| WMRK Commercial Mortgage Trust, Series 2022-WMRK, Class A, (1-month USD CME Term SOFR + 2.789%) 8.151% 11/15/20271,3 | 206 | 206 | ||||||
| WSTN Trust, Series 2023-MAUI, Class B, 7.018% 7/5/20371,3 | 173 | 172 | ||||||
| WSTN Trust, Series 2023-MAUI, Class C, 7.69% 8/5/20271,3 | 100 | 99 | ||||||
| 35,112 | ||||||||
| 68 | Capital Group Fixed Income ETF Trust |
Capital Group Short Duration Income ETF (continued)
| Bonds, notes & other debt instruments (continued) | Principal amount (000) | Value (000) | ||||||
| Mortgage-backed obligations (continued) | ||||||||
| Collateralized mortgage-backed obligations (privately originated) 9.00% | ||||||||
| Arroyo Mortgage Trust, Series 2019-1, Class A1, 3.805% 1/25/20491,3 | USD | 103 | $ | 98 | ||||
| Arroyo Mortgage Trust, Series 2019-2, Class A3, 3.80% 4/25/20491,3 | 435 | 412 | ||||||
| Arroyo Mortgage Trust, Series 2022-1, Class A1A, 2.495% 12/25/2056 (3.495% on 2/25/2026)1,2,3 | 343 | 318 | ||||||
| BRAVO Residential Funding Trust, Series 2020-RPL1, Class A1, 2.50% 5/26/20591,3 | 92 | 88 | ||||||
| Cascade Funding Mortgage Trust, Series 2023-HB12, Class A, 4.25% 7/25/20261,3 | 713 | 693 | ||||||
| CIM Trust, Series 2018-R3, Class A1, 5.00% 12/25/20571,3 | 74 | 73 | ||||||
| COLT Funding, LLC, Series 2023-1, Class A1, 6.048% 4/25/2068 (7.048% on 4/1/2027)1,2,3 | 1,239 | 1,244 | ||||||
| Connecticut Avenue Securities Trust, Series 2014-C01, Class M2, (30-day Average USD-SOFR + 4.514%) 9.852% 1/25/20243 | 1,533 | 1,538 | ||||||
| Connecticut Avenue Securities Trust, Series 2014-C02A, Class 1M2, (30-day Average USD-SOFR + 2.714%) 8.052% 5/25/20243 | 1,517 | 1,528 | ||||||
| Connecticut Avenue Securities Trust, Series 2014-C04, Class 1M2, (30-day Average USD-SOFR + 5.014%) 10.352% 11/25/20243 | 168 | 173 | ||||||
| Connecticut Avenue Securities Trust, Series 2015-C01, Class 1M2, (30-day Average USD-SOFR + 4.414%) 9.752% 2/25/20253 | 562 | 579 | ||||||
| Connecticut Avenue Securities Trust, Series 2016-C02, Class 1M2, (30-day Average USD-SOFR + 6.114%) 11.452% 9/25/20283 | 122 | 127 | ||||||
| Connecticut Avenue Securities Trust, Series 2023-R01, Class 1M1, (30-day Average USD-SOFR + 2.40%) 7.737% 12/25/20421,3 | 1,371 | 1,398 | ||||||
| Connecticut Avenue Securities Trust, Series 2023-R05, Class 1M1, (30-day Average USD-SOFR + 1.90%) 7.237% 6/25/20431,3 | 477 | 480 | ||||||
| Connecticut Avenue Securities Trust, Series 2023-R06, Class 1M1, (30-day Average USD-SOFR + 1.70%) 7.037% 7/25/20431,3 | 518 | 521 | ||||||
| Freddie Mac Structured Agency Credit Risk Debt Notes, Series 2015-DNA1, Class M3, (30-day Average USD-SOFR + 3.414%) 8.752% 10/25/20273 | 53 | 53 | ||||||
| Freddie Mac Structured Agency Credit Risk Debt Notes, Series 2015-DNA3, Class M3, (30-day Average USD-SOFR + 4.814%) 10.152% 4/25/20283 | 74 | 78 | ||||||
| Freddie Mac Structured Agency Credit Risk Debt Notes, Series 2016-DNA1, Class M3, (30-day Average USD-SOFR + 5.664%) 11.002% 7/25/20283 | 221 | 234 | ||||||
| Freddie Mac Structured Agency Credit Risk Debt Notes, Series 2016-DNA3, Class M3, (30-day Average USD-SOFR + 5.114%) 10.452% 12/25/20283 | 172 | 183 | ||||||
| Freddie Mac Structured Agency Credit Risk Debt Notes, Series 2022-DNA4, Class M1A, (30-day Average USD-SOFR + 2.20%) 7.537% 5/25/20421,3 | 193 | 196 | ||||||
| Freddie Mac Structured Agency Credit Risk Debt Notes, Series 2022-DNA5, Class M1A, (30-day Average USD-SOFR + 2.95%) 8.287% 6/25/20421,3 | 735 | 755 | ||||||
| Freddie Mac Structured Agency Credit Risk Debt Notes, Series 2020-DNA1, Class M2, (30-day Average USD-SOFR + 1.814%) 7.152% 1/25/20501,3 | 324 | 325 | ||||||
| Freddie Mac Structured Agency Credit Risk Debt Notes, Series 2020-DNA2, Class M2, (30-day Average USD-SOFR + 1.964%) 7.302% 2/25/20501,3 | 186 | 188 | ||||||
| Freddie Mac Structured Agency Credit Risk Debt Notes, Series 2020-DNA3, Class B1, (30-day Average USD-SOFR + 5.214%) 10.552% 6/27/20501,3 | 338 | 371 | ||||||
| Freddie Mac Structured Agency Credit Risk Debt Notes, Series 2020-DNA5, Class M2, (30-day Average USD-SOFR + 2.80%) 8.121% 10/25/20501,3 | 155 | 157 | ||||||
| Imperial Fund Mortgage Trust, Series 2022-NQM7, Class A1, 7.369% 11/25/2067 (8.369% on 11/1/2026)1,2,3 | 574 | 585 | ||||||
| Imperial Fund Mortgage Trust, Series 2023-NQM1, Class A1, 5.941% 2/25/2068 (6.941% on 1/1/2027)1,2,3 | 1,871 | 1,868 | ||||||
| Legacy Mortgage Asset Trust, Series 2020-GS4, Class A1, 3.25% 2/25/20601,3 | 1,304 | 1,304 | ||||||
| Legacy Mortgage Asset Trust, Series 2020-GS3, Class A1, 6.25% 5/25/2060 (7.25% on 4/25/2024)1,2,3 | 1,118 | 1,118 | ||||||
| Mill City Mortgage Trust, Series 2019-GS2, Class A1, 2.75% 8/25/20591,3 | 353 | 335 | ||||||
| Mill City Mortgage Trust, Series 2019-1, Class A1, 3.25% 10/25/20691,3 | 159 | 153 | ||||||
| New Residential Mortgage Loan Trust, Series 2019-RPL3, Class A1, 2.75% 7/25/20591,3 | 731 | 691 | ||||||
| New Residential Mortgage Loan Trust, Series 2020-RPL1, Class A1, 2.75% 11/25/20591,3 | 266 | 250 | ||||||
| NewRez Warehouse Securitization Trust, Series 2021-1, Class B, (1-month USD CME Term SOFR + 1.014%) 6.37% 5/25/20551,3 | 1,300 | 1,299 | ||||||
| Onslow Bay Financial Mortgage Loan Trust, Series 2022-NQM9, Class A1A, 6.45% 9/25/2062 (7.45% on 11/1/2026)1,2,3 | 883 | 893 | ||||||
| Onslow Bay Financial Mortgage Loan Trust, Series 2023-NQM1, Class A1, 6.12% 11/25/2062 (7.12% on 12/1/2026)1,2,3 | 589 | 593 | ||||||
| Capital Group Fixed Income ETF Trust | 69 |
Capital Group Short Duration Income ETF (continued)
| Bonds, notes & other debt instruments (continued) | Principal amount (000) | Value (000) | ||||||
| Mortgage-backed obligations (continued) | ||||||||
| Collateralized mortgage-backed obligations (privately originated) (continued) | ||||||||
| Onslow Bay Financial Mortgage Loan Trust, Series 2023-NQM4, Class A1, 6.113% 3/25/2063 (7.113% on 5/1/2027)1,2,3 | USD | 661 | $ | 666 | ||||
| Progress Residential Trust, Series 2022-SFR3, Class A, 3.20% 4/17/20391,3 | 494 | 463 | ||||||
| Towd Point Mortgage Trust, Series 2015-4, Class M2, 3.75% 4/25/20551,3 | 103 | 101 | ||||||
| Towd Point Mortgage Trust, Series 2016-2, Class M1, 3.00% 8/25/20551,3 | 450 | 434 | ||||||
| Towd Point Mortgage Trust, Series 2017-1, Class A1, 2.75% 10/25/20561,3 | 28 | 28 | ||||||
| Towd Point Mortgage Trust, Series 2017-1, Class A2, 3.50% 10/25/20561,3 | 300 | 293 | ||||||
| Towd Point Mortgage Trust, Series 2017-2, Class A4, 3.493% 4/25/20571,3 | 661 | 641 | ||||||
| Towd Point Mortgage Trust, Series 2017-3, Class A1, 2.75% 7/25/20571,3 | 275 | 271 | ||||||
| Towd Point Mortgage Trust, Series 2017-6, Class A1, 2.75% 10/25/20571,3 | 534 | 513 | ||||||
| Towd Point Mortgage Trust, Series 2018-1, Class A1, 3.00% 1/25/20581,3 | 439 | 427 | ||||||
| Towd Point Mortgage Trust, Series 2019-1, Class A1, 3.75% 3/25/20581,3 | 523 | 501 | ||||||
| Towd Point Mortgage Trust, Series 2019-2, Class A1, 3.746% 12/25/20581,3 | 520 | 499 | ||||||
| Towd Point Mortgage Trust, Series 2023-1, Class A1, 3.75% 1/25/20631,3 | 1,162 | 1,104 | ||||||
| Tricon Residential Trust, Series 2023-SFR1, Class A, 5.10% 7/17/20401,3 | 372 | 368 | ||||||
| Tricon Residential Trust, Series 2023-SFR2, Class A, 5.00% 12/17/20281,3 | 905 | 893 | ||||||
| Verus Securitization Trust, Series 2023-1, Class A1, 5.85% 12/25/2067 (6.85% on 1/1/2027)1,2,3 | 642 | 642 | ||||||
| Verus Securitization Trust, Series 2023-3, Class A1, 5.93% 3/25/2068 (6.93% on 4/1/2027)1,2,3 | 283 | 283 | ||||||
| Verus Securitization Trust, Series 2023-5, Class A5, 6.476% 6/25/2068 (7.476% on 6/1/2027)1,2,3 | 876 | 885 | ||||||
| 29,911 | ||||||||
| Total mortgage-backed obligations | 109,714 | |||||||
| Asset-backed obligations 18.37% | ||||||||
| ACHV ABS Trust, Series 2023-3PL, Class A, 6.60% 8/19/20301,3 | 42 | 42 | ||||||
| Affirm Asset Securitization Trust, Series 2022-X1, Class A, 1.75% 2/15/20271,3 | 391 | 385 | ||||||
| Affirm Asset Securitization Trust, Series 2023-A, Class A, 6.61% 1/18/20281,3 | 597 | 601 | ||||||
| Affirm, Inc., Series 2023-B, Class A, 6.82% 9/15/20281,3 | 457 | 464 | ||||||
| Affirm, Inc., Series 2023-X1, Class A, 7.11% 11/15/20281,3 | 400 | 401 | ||||||
| AGL CLO, Ltd., Series 2023-24, Class A1, (3-month USD CME Term SOFR + 2.00%) 7.378% 7/25/20361,3 | 464 | 467 | ||||||
| Ally Auto Receivables Trust, Series 2023, Class A2, 6.15% 1/17/20341,3 | 688 | 689 | ||||||
| American Credit Acceptance Receivables Trust, Series 2022-4, Class A, 6.20% 5/13/20261,3 | 12 | 12 | ||||||
| American Money Management Corp., CLO, Series 2016-18, Class AR, (3-month USD CME Term SOFR + 1.362%) 6.741% 5/26/20311,3 | 198 | 198 | ||||||
| Avis Budget Rental Car Funding (AESOP), LLC, Series 2020-2, Class A, 2.02% 2/20/20271,3 | 350 | 327 | ||||||
| Avis Budget Rental Car Funding (AESOP), LLC, Series 2022-5, Class A, 6.12% 4/20/20271,3 | 118 | 120 | ||||||
| Avis Budget Rental Car Funding (AESOP), LLC, Series 2023-2, Class A, 5.20% 10/20/20271,3 | 779 | 781 | ||||||
| Avis Budget Rental Car Funding (AESOP), LLC, Series 2023-2, Class B, 6.03% 10/20/20271,3 | 290 | 292 | ||||||
| Avis Budget Rental Car Funding (AESOP), LLC, Series 2023-3A, Class A, 5.44% 2/22/20281,3 | 396 | 400 | ||||||
| Avis Budget Rental Car Funding (AESOP), LLC, Series 2023-5, Class A, 5.78% 4/20/20281,3 | 259 | 263 | ||||||
| Bank of America Credit Card Trust, Series 2023-A2, Class A2, 4.98% 11/15/20283 | 2,342 | 2,371 | ||||||
| Bankers Healthcare Group Securitization Trust, Series 2021-A, Class A, 1.42% 11/17/20331,3 | 588 | 554 | ||||||
| Birch Grove CLO, Ltd., Series 2023-6, Class A1, (3-month USD CME Term SOFR + 2.20%) 7.489% 7/20/20351,3 | 494 | 496 | ||||||
| Carvana Auto Receivables Trust, Series 2023-N3, Class A, 6.41% 9/10/20271,3 | 515 | 517 | ||||||
| Carvana Auto Receivables Trust, Series 2023-P3, Class A3, 5.82% 8/10/20281,3 | 206 | 209 | ||||||
| CF Hippolyta, LLC, Series 2020-1, Class A1, 1.69% 7/15/20601,3 | 1,349 | 1,248 | ||||||
| CF Hippolyta, LLC, Series 2021-1, Class A1, 1.53% 3/15/20611,3 | 1,079 | 966 | ||||||
| Chesapeake Funding II, LLC, Series 2023-2, Class A1, 6.16% 10/15/20351,3 | 498 | 503 | ||||||
| Citibank Credit Card Issuance Trust, Series 2023-A1, Class A1, 5.23% 12/8/20273 | 926 | 934 | ||||||
| 70 | Capital Group Fixed Income ETF Trust |
Capital Group Short Duration Income ETF (continued)
| Bonds, notes & other debt instruments (continued) | Principal amount (000) | Value (000) | ||||||
| Asset-backed obligations (continued) | ||||||||
| Citizens Auto Receivables Trust, Series 2023-2, Class A3, 5.83% 2/15/20281,3 | USD | 572 | $ | 580 | ||||
| Citizens Auto Receivables Trust, Series 2023-2, Class A4, 5.74% 10/15/20301,3 | 680 | 695 | ||||||
| CLI Funding VI, LLC, Series 2020-2A, Class A, 2.03% 9/15/20451,3 | 404 | 362 | ||||||
| CLI Funding VIII, LLC, Series 2022-1, Class A, 2.72% 1/18/20471,3 | 1,123 | 994 | ||||||
| CPS Auto Receivables Trust, Series 2023-A, Class A, 5.54% 3/16/20261,3 | 247 | 247 | ||||||
| CPS Auto Receivables Trust, Series 2023-A, Class B, 5.47% 11/16/20261,3 | 656 | 653 | ||||||
| CPS Auto Receivables Trust, Series 2021-B, Class C, 1.23% 3/15/20271,3 | 110 | 109 | ||||||
| CPS Auto Receivables Trust, Series 2023-C, Class B, 5.98% 6/15/20271,3 | 918 | 924 | ||||||
| CPS Auto Receivables Trust, Series 2023-A, Class C, 5.54% 4/16/20291,3 | 933 | 925 | ||||||
| CPS Auto Receivables Trust, Series 2023-C, Class C, 6.27% 10/15/20291,3 | 465 | 469 | ||||||
| DriveTime Auto Owner Trust, Series 2020-3A, Class C, 1.47% 6/15/20261,3 | 121 | 120 | ||||||
| DriveTime Auto Owner Trust, Series 2021-1A, Class D, 1.16% 11/16/20261,3 | 920 | 880 | ||||||
| DriveTime Auto Owner Trust, Series 2023-1, Class C, 5.55% 10/16/20281,3 | 1,063 | 1,054 | ||||||
| Dryden Senior Loan Fund, CLO, Series 2017-47A, Class A1R, (3-month USD CME Term SOFR + 1.242%) 6.635% 4/15/20281,3 | 300 | 300 | ||||||
| Dryden Senior Loan Fund, CLO, Series 2015-37, Class AR, (3-month USD CME Term SOFR + 1.362%) 6.755% 1/15/20311,3 | 252 | 252 | ||||||
| Dryden Senior Loan Fund, CLO, Series 2018-57, Class A, (3-month USD CME Term SOFR + 1.272%) 6.651% 5/15/20311,3 | 290 | 290 | ||||||
| Elmwood CLO 18, Ltd., Series 2022-5, Class AR, (3-month USD CME Term SOFR + 1.65%) 7.053% 7/17/20331,3 | 1,000 | 1,001 | ||||||
| Exeter Automobile Receivables Trust, Series 2022-6, Class A2, 5.73% 11/17/20253 | 2 | 2 | ||||||
| Exeter Automobile Receivables Trust, Series 2021-2, Class C, 0.98% 6/15/20263 | 216 | 214 | ||||||
| Exeter Automobile Receivables Trust, Series 2022-6, Class B, 6.03% 8/16/20273 | 77 | 77 | ||||||
| Exeter Automobile Receivables Trust, Series 2023-3, Class B, 6.11% 9/15/20273 | 307 | 308 | ||||||
| Exeter Automobile Receivables Trust, Series 2023-4, Class B, 6.31% 10/15/20273 | 797 | 803 | ||||||
| Exeter Automobile Receivables Trust, Series 2023-1, Class C, 5.82% 2/15/20283 | 1,000 | 997 | ||||||
| Exeter Automobile Receivables Trust, Series 2022-6, Class C, 6.32% 5/15/20283 | 193 | 194 | ||||||
| Exeter Automobile Receivables Trust, Series 2023-4, Class C, 6.51% 8/15/20283 | 797 | 807 | ||||||
| Exeter Automobile Receivables Trust, Series 2023-1, Class D, 6.69% 6/15/20293 | 240 | 242 | ||||||
| First National Master Note Trust, Series 2023-1, Class A, 5.13% 4/16/20293 | 592 | 594 | ||||||
| First National Master Note Trust, Series 2023-2, Class A, 5.77% 9/17/20293 | 668 | 683 | ||||||
| FirstKey Homes Trust, Series 2022-SFR2, Class A, 4.145% 5/17/20391,3 | 497 | 477 | ||||||
| Flagship Credit Auto Trust, Series 2022-4, Class A2, 6.15% 9/15/20261,3 | 104 | 105 | ||||||
| Flagship Credit Auto Trust, Series 2023-3, Class A3, 5.44% 4/17/20281,3 | 141 | 141 | ||||||
| Flagship Credit Auto Trust, Series 2023-3, Class B, 5.64% 7/16/20291,3 | 399 | 402 | ||||||
| Global SC Finance VII SRL, Series 2020-2A, Class A, 2.26% 11/19/20401,3 | 434 | 399 | ||||||
| Global SC Finance VII SRL, Series 2021-2A, Class A, 1.95% 8/17/20411,3 | 974 | 875 | ||||||
| GLS Auto Receivables Trust, Series 2023-4, Class A2, 6.40% 12/15/20261,3 | 1,000 | 1,004 | ||||||
| GLS Auto Receivables Trust, Series 2023-3, Class B, 5.89% 1/18/20281,3 | 1,000 | 1,005 | ||||||
| GLS Auto Receivables Trust, Series 2023-3, Class C, 6.01% 5/15/20291,3 | 151 | 153 | ||||||
| GM Financial Revolving Receivables Trust, Series 2023-2, Class A, 5.77% 8/11/20361,3 | 773 | 807 | ||||||
| GoldenTree Loan Opportunities X, Ltd., Series 2015-10, Class AR, (3-month USD CME Term SOFR + 1.382%) 6.797% 7/20/20311,3 | 766 | 766 | ||||||
| GoldenTree Loan Opportunities XI, Ltd., CLO, Series 2015-11A, Class AR2, (3-month USD CME Term SOFR + 1.332%) 6.727% 1/18/20311,3 | 146 | 146 | ||||||
| GT Loan Financing, Ltd., Series 2013-1, Class AR, (3-month USD CME Term SOFR + 1.362%) 6.752% 7/28/20311,3 | 441 | 441 | ||||||
| HalseyPoint CLO II, Ltd., Series 2020-2A, Class A1, (3-month USD CME Term SOFR + 2.122%) 7.537% 7/20/20311,3 | 223 | 223 | ||||||
| Hertz Vehicle Financing III, LLC, Series 2022-1A, Class A, 1.99% 6/25/20261,3 | 350 | 335 | ||||||
| Hertz Vehicle Financing III, LLC, Series 2023-1, Class A, 5.49% 6/25/20271,3 | 1,000 | 1,005 | ||||||
| Hertz Vehicle Financing III, LLC, Series 2023-1, Class 1D, 9.13% 6/25/20271,3 | 250 | 252 | ||||||
| Hertz Vehicle Financing III, LLC, Series 2022-2, Class D, 5.16% 6/26/20281,3 | 250 | 225 | ||||||
| Juniper Valley Park CLO, Ltd., Series 2023-1, Class A1, (3-month USD CME Term SOFR + 1.85%) 7.266% 7/20/20351,3 | 797 | 800 | ||||||
| LAD Auto Receivables Trust, Series 2023-1, Class A2, 5.68% 10/15/20261,3 | 524 | 523 | ||||||
| LAD Auto Receivables Trust, Series 2023-1, Class C, 6.18% 12/15/20271,3 | 273 | 275 | ||||||
| LAD Auto Receivables Trust, Series 2023-3, Class A4, 5.95% 3/15/20281,3 | 318 | 322 | ||||||
| LAD Auto Receivables Trust, Series 2023-3, Class B, 6.09% 6/15/20281,3 | 721 | 732 | ||||||
| LAD Auto Receivables Trust, Series 2023-3, Class C, 6.43% 12/15/20281,3 | 608 | 620 | ||||||
| LCM, LP, Series 2027, Class A1, (3-month USD CME Term SOFR + 1.342%) 6.735% 7/16/20311,3 | 709 | 709 | ||||||
| Capital Group Fixed Income ETF Trust | 71 |
Capital Group Short Duration Income ETF (continued)
| Bonds, notes & other debt instruments (continued) | Principal amount (000) | Value (000) | ||||||
| Asset-backed obligations (continued) | ||||||||
| Madison Park Funding, Ltd., CLO, Series 2021-50A, Class A, (3-month USD CME Term SOFR + 1.402%) 6.798% 4/19/20341,3 | USD | 300 | $ | 300 | ||||
| Neuberger Berman CLO, Ltd., Series 2017-25, Class AR, (3-month USD CME Term SOFR + 1.192%) 6.587% 10/18/20291,3 | 482 | 481 | ||||||
| OCP CLO, Ltd., Series 2018-15A, Class A1, (3-month USD CME Term SOFR + 1.362%) 6.777% 7/20/20311,3 | 173 | 173 | ||||||
| Palmer Square Loan Funding, CLO, Series 2021-3, Class A1, (3-month USD CME Term SOFR + 1.062%) 6.477% 7/20/20291,3 | 644 | 642 | ||||||
| Palmer Square Loan Funding, CLO, Series 2022-4, Class A1, (3-month USD-CME Term SOFR + 1.75%) 7.148% 7/24/20311,3 | 588 | 589 | ||||||
| Palmer Square Loan Funding, CLO, Series 2022-4, Class A2, (3-month USD CME Term SOFR + 2.35%) 7.698% 7/24/20311,3 | 889 | 890 | ||||||
| Palmer Square, Ltd., Series 2013-2A, Class A1A3, (3-month USD CME Term SOFR + 1.262%) 6.664% 10/17/20311,3 | 250 | 250 | ||||||
| PFS Financing Corp., Series 2023-A, Class A, 5.80% 3/15/20281,3 | 2,000 | 2,031 | ||||||
| PFS Financing Corp., Series 2023-B, Class A, 5.27% 5/15/20281,3 | 610 | 613 | ||||||
| Prestige Auto Receivables Trust, Series 2023-1, Class A2, 5.88% 3/16/20261,3 | 573 | 573 | ||||||
| Santander Drive Auto Receivables Trust, Series 2023-1, Class A2, 5.36% 5/15/20263 | 294 | 294 | ||||||
| Santander Drive Auto Receivables Trust, Series 2021-2, Class C, 0.90% 6/15/20263 | 27 | 27 | ||||||
| Santander Drive Auto Receivables Trust, Series 2020-3, Class D, 1.64% 11/16/20263 | 424 | 416 | ||||||
| Santander Drive Auto Receivables Trust, Series 2022-7, Class A3, 5.75% 4/15/20273 | 84 | 84 | ||||||
| Santander Drive Auto Receivables Trust, Series 2022-7, Class B, 5.95% 1/17/20283 | 33 | 33 | ||||||
| Santander Drive Auto Receivables Trust, Series 2023-6, Class A3, 5.93% 7/17/20283 | 351 | 357 | ||||||
| SMB Private Education Loan Trust, Series 2023-C, Class A1B, (30-day Average USD-SOFR + 1.55%) 6.888% 11/15/20521,3 | 268 | 269 | ||||||
| Sound Point CLO, Ltd., Series 2017-3A, Class A1R, (3-month USD CME Term SOFR + 1.242%) 6.657% 10/20/20301,3 | 392 | 391 | ||||||
| Sound Point CLO, Ltd., Series 2013-3R, Class A, (3-month USD CME Term SOFR + 1.412%) 6.807% 4/18/20311,3 | 300 | 299 | ||||||
| Stratus Static CLO, Ltd., Series 2021-2, Class A, (3-month USD CME Term SOFR + 1.162%) 6.577% 12/28/20291,3 | 211 | 211 | ||||||
| Stratus Static CLO, Ltd., Series 2022-3, Class A, (3-month USD CME Term SOFR + 2.15%) 7.566% 10/20/20311,3 | 201 | 201 | ||||||
| Sycamore Tree CLO, Ltd., Series 2023-3, Class A1, (3-month USD CME Term SOFR + 2.20%) 7.616% 8/16/20271,3 | 500 | 500 | ||||||
| Synchrony Card Issuance Trust, Series 2023-A, Class A, 5.54% 7/15/20293 | 884 | 901 | ||||||
| Synchrony Card Issuance Trust, Series 2023-A2, Class A, 5.74% 10/15/20293 | 498 | 511 | ||||||
| TAL Advantage V, LLC, Series 2020-1A, Class A, 2.05% 9/20/20451,3 | 1,034 | 940 | ||||||
| Teachers Insurance and Annuity Association of AME, CLO, Series 2016-1, Class AR, (3-month USD CME Term SOFR + 1.462%) 6.877% 7/20/20311,3 | 239 | 239 | ||||||
| Textainer Marine Containers, Ltd., Series 2021-1A, Class A, 1.68% 2/20/20461,3 | 893 | 784 | ||||||
| Textainer Marine Containers, Ltd., Series 2021-2A, Class A, 2.23% 4/20/20461,3 | 625 | 559 | ||||||
| TIF Funding II, LLC, Series 2021-1A, Class A, 1.65% 2/20/20461,3 | 1,077 | 927 | ||||||
| Trestles CLO, Ltd., Series 2023-6, Class A, (3-month USD CME Term SOFR + 1.70%) 7.08% 1/25/20361,3 | 800 | 800 | ||||||
| Triton Container Finance VIII, LLC, Series 2020-1, Class A, 2.11% 9/20/20451,3 | 1,086 | 966 | ||||||
| TSTAT 2022-1, Ltd., Series 2022-1, Class A2R, (3-month USD CME Term SOFR + 1.90%) 7.28% 7/20/20311,3 | 468 | 469 | ||||||
| TSTAT 2022-1, Ltd., Series 2022-1, Class BR, (3-month USD CME Term SOFR + 2.35%) 7.73% 7/20/20311,3 | 500 | 501 | ||||||
| TSTAT 2022-1, Ltd., Series 2022-1, Class CR, (3-month USD CME Term SOFR + 2.85%) 8.23% 7/20/20311,3 | 500 | 502 | ||||||
| Valley Stream Park CLO, Ltd., Series 2022-1, Class AR, (3-month USD CME Term SOFR + 1.63%) 7.046% 10/20/20341,3 | 1,000 | 1,000 | ||||||
| Wellfleet CLO, Ltd., Series 2017-3A, Class A1, (3-month USD CME Term SOFR + 1.412%) 6.814% 1/17/20311,3 | 220 | 220 | ||||||
| Westlake Automobile Receivables Trust, Series 2022-3, Class C, 5.49% 7/15/20261,3 | 140 | 140 | ||||||
| Westlake Automobile Receivables Trust, Series 2023-1, Class B, 5.41% 1/18/20281,3 | 212 | 211 | ||||||
| Westlake Automobile Receivables Trust, Series 2023-1, Class C, 5.74% 8/15/20281,3 | 412 | 411 | ||||||
| Westlake Automobile Receivables Trust, Series 2023-3, Class C, 6.02% 9/15/20281,3 | 597 | 599 | ||||||
| 61,062 | ||||||||
| 72 | Capital Group Fixed Income ETF Trust |
Capital Group Short Duration Income ETF (continued)
| Bonds, notes & other debt instruments (continued) | Principal amount (000) | Value (000) | ||||||
| U.S. Treasury bonds & notes 0.38% | ||||||||
| U.S. Treasury 0.38% | ||||||||
| U.S. Treasury 4.375% 8/15/20265 | USD | 1,000 | $ | 1,007 | ||||
| U.S. Treasury 4.625% 11/15/2026 | 250 | 254 | ||||||
| 1,261 | ||||||||
| Total bonds, notes & other debt instruments (cost: $324,194,000) | 327,248 | |||||||
| Short-term securities 9.14% | Shares | |||||||
| Money market investments 9.14% | ||||||||
| Capital Group Central Cash Fund 5.44%6,7 | 303,661 | 30,363 | ||||||
| Total short-term securities (cost: $30,365,000) | 30,363 | |||||||
| Total investment securities 107.59% (cost: $354,559,000) | 357,611 | |||||||
| Other assets less liabilities (7.59)% | (25,214 | ) | ||||||
| Net assets 100.00% | $ | 332,397 | ||||||
Futures contracts
| Contracts | Type | Number of contracts | Expiration date | Notional amount (000) | Value and unrealized appreciation (depreciation) at 12/31/2023 (000) | |||||||||||
| 2 Year U.S. Treasury Note Futures | Long | 248 | 3/28/2024 | USD | 51,067 | $ | 342 | |||||||||
| 5 Year U.S. Treasury Note Futures | Long | 83 | 3/28/2024 | 9,028 | 207 | |||||||||||
| 30 Year U.S. Treasury Bond Futures | Short | 25 | 3/19/2024 | (3,124 | ) | (240 | ) | |||||||||
| $ | 309 | |||||||||||||||
Swap contracts
Interest rate swaps
Centrally cleared interest rate swaps
| Receive | Pay | Notional | Value at | Upfront premium paid | Unrealized appreciation (depreciation) | |||||||||||||||||||
| Rate | Payment frequency | Rate | Payment frequency | Expiration date | amount (000) | 12/31/2023 (000) | (received) (000) | at 12/31/2023 (000) | ||||||||||||||||
| 4.75908% | Annual | SOFR | Annual | 11/9/2025 | USD | 58,500 | $ | 617 | $ | — | $ | 617 | ||||||||||||
| 4.7575% | Annual | SOFR | Annual | 11/9/2025 | 52,700 | 554 | — | 554 | ||||||||||||||||
| 4.74674% | Annual | SOFR | Annual | 11/9/2025 | 37,100 | 383 | — | 383 | ||||||||||||||||
| SOFR | Annual | 4.1195% | Annual | 11/16/2033 | 34,900 | (1,891 | ) | — | (1,891 | ) | ||||||||||||||
| $ | (337 | ) | $ | — | $ | (337 | ) | |||||||||||||||||
| Capital Group Fixed Income ETF Trust | 73 |
Capital Group Short Duration Income ETF (continued)
Investments in affiliates7
| Value at 1/1/2023 (000) | Additions (000) | Reductions (000) | Net realized gain (loss) (000) | Net unrealized appreciation (depreciation) (000) | Value at 12/31/2023 (000) | Dividend or interest income (000) | ||||||||||||||||||||||
| Short-term securities 9.14% | ||||||||||||||||||||||||||||
| Money market investments 9.14% | ||||||||||||||||||||||||||||
| Capital Group Central Cash Fund 5.44%6 | $ | 13,146 | $ | 173,319 | $ | 156,100 | $ | (1 | ) | $ | (1 | ) | $ | 30,363 | $ | 952 | ||||||||||||
| 1 | Acquired in a transaction exempt from registration under Rule 144A or, for commercial paper, Section 4(a)(2) of the Securities Act of 1933. May be resold in the U.S. in transactions exempt from registration, normally to qualified institutional buyers. The total value of all such securities was $102,954,000, which represented 30.97% of the net assets of the fund. |
| 2 | Step bond; coupon rate may change at a later date. |
| 3 | Principal payments may be made periodically. Therefore, the effective maturity date may be earlier than the stated maturity date. |
| 4 | Purchased on a TBA basis. |
| 5 | All or a portion of this security was pledged as collateral. The total value of pledged collateral was $528,000, which represented .16% of the net assets of the fund. |
| 6 | Rate represents the seven-day yield at December 31, 2023. |
| 7 | Part of the same “group of investment companies” as the fund as defined under the Investment Company Act of 1940, as amended. |
Key to abbreviation(s)
CLO = Collateralized Loan Obligations
CME = CME Group
CMO = Collateralized Mortgage Obligations
DAC = Designated Activity Company
SOFR = Secured Overnight Financing Rate
TBA = To-be-announced
USD = U.S. dollars
Refer to the notes to financial statements.
| 74 | Capital Group Fixed Income ETF Trust |
Capital Group Short Duration Municipal Income ETF
Investment portfolio December 31, 2023
| Portfolio quality summary* | Percent of net assets | |||
| AAA/Aaa | 18.68 | % | ||
| AA/Aa | 30.36 | |||
| A/A | 23.08 | |||
| BBB/Baa | 11.97 | |||
| Below investment grade | 9.37 | |||
| Short-term securities & other assets less liabilities | 6.54 | |||
| * | Bond ratings, which typically range from AAA/Aaa (highest) to D (lowest), are assigned by credit rating agencies such as Standard & Poor’s, Moody’s and/or Fitch as an indication of an issuer’s creditworthiness. In assigning a credit rating to a security, the fund looks specifically to the ratings assigned to the issuer of the security by Standard & Poor’s, Moody’s and/or Fitch. If agency ratings differ, the security will be considered to have received the highest of those ratings, consistent with the fund’s investment policies. The ratings are not covered by the Report of Independent Registered Public Accounting Firm. |
| Bonds, notes & other debt instruments 93.46% | Principal amount (000) | Value (000) | ||||||
| Alabama 1.67% | ||||||||
| Black Belt Energy Gas Dist., Gas Project Rev. Bonds (Project No. 7), Series 2021-C-1, 4.00% 10/1/2052 (put 12/1/2026) | USD | 250 | $ | 251 | ||||
| Southeast Energy Auth., Commodity Supply Rev. Bonds (Project No. 4), Series 2022-B-1, 5.00% 5/1/2053 (put 8/1/2028) | 500 | 523 | ||||||
| 774 | ||||||||
| Arizona 2.00% | ||||||||
| Deer Valley Unified School Dist. No. 97, School Improvement Bonds (Project of 2013), Series 2019-E, 5.00% 7/1/2025 | 500 | 516 | ||||||
| Industrial Dev. Auth., Charter School Rev. Bonds (Equitable School Revolving Fund), Series 2023-A, 5.00% 11/1/2028 | 200 | 217 | ||||||
| Industrial Dev. Auth., Education Rev. Bonds (Academies of Math & Science Projects), Series 2019, 4.00% 7/1/20291 | 200 | 195 | ||||||
| 928 | ||||||||
| California 9.47% | ||||||||
| Educational Facs. Auth., Rev. Bonds (Saint Mary’s College of California), Series 2023-A, 5.25% 10/1/2030 | 400 | 441 | ||||||
| Foothill/Eastern Transportation Corridor Agcy., Toll Road Rev. Bonds, Capital Appreciation Bonds, Series 1995-A, 0% 1/1/2025 (escrowed to maturity) | 500 | 486 | ||||||
| G.O. Rev. Ref. Bonds, Series 2023-B, 5.00% 9/1/2028 | 500 | 559 | ||||||
| Municipal Fin. Auth., Senior Living Rev. Bonds (Mt. San Antonio Gardens Project), Series 2022-B-1, 2.75% 11/15/2027 | 260 | 258 | ||||||
| Municipal Fin. Auth., Solid Waste Disposal Rev. Bonds (Waste Management, Inc. Project), Series 2020-B, AMT, 4.80% 11/1/2041 (put 6/2/2025) | 100 | 101 | ||||||
| Oakland Unified School Dist., G.O. Rev. Ref. Bonds, Series 2016, 5.00% 8/1/2025 | 500 | 517 | ||||||
| County of Orange, Community Facs. Dist. No. 2023-1 (Rienda Phase 2B), Special Tax Bonds, Series 2023-A, 5.00% 8/15/2027 | 145 | 154 | ||||||
| County of Orange, Community Facs. Dist. No. 2023-1 (Rienda Phase 2B), Special Tax Bonds, Series 2023-A, 5.00% 8/15/2028 | 190 | 205 | ||||||
| Public Works Board, Lease Rev. Ref. Bonds (Various Capital Projects), Series 2023-C, 5.00% 9/1/2025 | 1,000 | 1,038 | ||||||
| City of San Diego, Housing Auth., Multi Family Housing Rev. Bonds, Series 2023-B, 5.00% 5/1/2057 (put 11/1/2026) | 350 | 367 | ||||||
| Statewide Communities Dev. Auth., Rev. Bonds (American Baptist Homes of the West), Series 2015, 5.00% 10/1/2026 | 260 | 266 | ||||||
| 4,392 | ||||||||
| Capital Group Fixed Income ETF Trust | 75 |
Capital Group Short Duration Municipal Income ETF (continued)
| Bonds, notes & other debt instruments (continued) | Principal amount (000) | Value (000) | ||||||
| Colorado 3.14% | ||||||||
| County of Adams, The Village at Dry Creek Metropolitan Dist. No. 2, Limited Tax G.O. and Special Rev. Bonds, Series 2019, 4.375% 12/1/2044 | USD | 500 | $ | 445 | ||||
| Town of Johnstown, Thompson Crossing Metropolitan Dist. No. 4, Limited Tax G.O. Rev. Ref. and Improvement Bonds (Convertible to Unlimited Tax), Series 2019, 3.50% 12/1/2029 | 520 | 488 | ||||||
| Town of Superior, STC Metropolitan Dist. No. 2, Limited Tax G.O. and Special Rev. Ref. and Improvement Bonds, Series 2019-A, 3.00% 12/1/2025 | 555 | 526 | ||||||
| 1,459 | ||||||||
| Connecticut 1.61% | ||||||||
| Housing Fin. Auth., Housing Mortgage Fin. Program Bonds, Series 2019-B-1, 4.00% 5/15/2049 | 745 | 746 | ||||||
| District of Columbia 1.16% | ||||||||
| Metropolitan Washington DC Airports Auth., Airport System Rev. Ref. Bonds, Series 2022-A, AMT, 5.00% 10/1/2025 | 525 | 540 | ||||||
| Florida 6.44% | ||||||||
| County of Broward, Airport System Rev. Ref. Bonds, Series 2012-P-1, AMT, 5.00% 10/1/2024 | 500 | 501 | ||||||
| Capital Trust Agcy., Housing Rev. Bonds (Council Towers Apartments Project), Series 2020-A, 5.00% 2/1/2024 | 650 | 652 | ||||||
| Housing Fin. Corp., Homeowner Mortgage Rev. Bonds, Series 2023-5, 6.25% 1/1/2054 | 250 | 282 | ||||||
| City of Miami, Midtown Miami Community Dev. Dist., Special Assessment and Rev. Ref. Bonds (Infrastructure Project), Series 2014-B, 5.00% 5/1/2029 | 500 | 500 | ||||||
| City of Pompano Beach, Rev. Bonds (John Knox Village Project), Series 2021-B-2, 1.45% 1/1/2027 | 500 | 456 | ||||||
| City of Wildwood, Village Community Dev. Dist. No. 13, Special Assessment Rev. Bonds, Series 2019, 2.625% 5/1/2024 | 125 | 124 | ||||||
| Windward at Lakewood Ranch Community Dev. Dist., Capital Improvement Rev. Bonds (Phase 2 Project), Series 2022, 3.25% 5/1/2027 | 495 | 471 | ||||||
| 2,986 | ||||||||
| Georgia 2.11% | ||||||||
| Geo. L. Smith II Georgia World Congress Center Auth., Convention Center Hotel First Tier Rev. Bonds, Series 2021-A, 2.375% 1/1/2031 | 500 | 446 | ||||||
| Main Street Natural Gas, Inc., Gas Supply Rev. Bonds, Series 2023-B, 5.00% 7/1/2053 (put 3/1/2030) | 500 | 533 | ||||||
| 979 | ||||||||
| Hawaii 1.12% | ||||||||
| City and County of Honolulu, G.O. Bonds, Series 2015-B, 5.00% 10/1/2025 | 500 | 520 | ||||||
| Illinois 5.02% | ||||||||
| City of Chicago, Board of Education, Unlimited Tax G.O. Rev. Ref. Bonds (Dedicated Rev.), Series 2017-D, 5.00% 12/1/2026 | 250 | 258 | ||||||
| City of Chicago, G.O. Rev. Ref. Bonds, Series 2020-A, 5.00% 1/1/2027 | 250 | 262 | ||||||
| City of Chicago, Transit Auth., Capital Grant Receipts Rev. Ref. Bonds (Federal Transit Administration Section 5337 State of Good Repair Formula Funds), Series 2017, 5.00% 6/1/2024 | 345 | 347 | ||||||
| 76 | Capital Group Fixed Income ETF Trust |
Capital Group Short Duration Municipal Income ETF (continued)
| Bonds, notes & other debt instruments (continued) | Principal amount (000) | Value (000) | ||||||
| Illinois (continued) | ||||||||
| G.O. Rev. Ref. Bonds, Series 2022-B, 5.00% 3/1/2026 | USD | 500 | $ | 520 | ||||
| Metropolitan Pier and Exposition Auth., McCormick Place Expansion Project Rev. Ref. Bonds, Series 2022-A, 3.00% 6/15/2025 | 500 | 495 | ||||||
| Metropolitan Pier and Exposition Auth., McCormick Place Expansion Project Rev. Ref. Bonds, Capital Appreciation Bonds, Series 2010-B-1, Assured Guaranty Municipal insured, 0% 6/15/2027 | 500 | 449 | ||||||
| 2,331 | ||||||||
| Iowa 3.86% | ||||||||
| Fin. Auth., Multi Family Housing Rev. Bonds (AHEPA 192-IV Apartments Projects), Series 2023, 5.00% 11/1/2026 (put 11/1/2025) | 400 | 409 | ||||||
| Fin. Auth., Single Family Mortgage Bonds (Mortgage-Backed Securities Program), Series 2019-A, 4.00% 7/1/2047 | 820 | 821 | ||||||
| Fin. Auth., Single Family Mortgage Bonds (Mortgage-Backed Securities Program), Series 2019-D, 3.50% 1/1/2049 | 570 | 562 | ||||||
| 1,792 | ||||||||
| Kentucky 2.16% | ||||||||
| Public Energy Auth., Gas Supply Rev. Bonds, Series 2019-C-1, 4.00% 2/1/2050 (put 2/1/2028) | 1,000 | 1,003 | ||||||
| Louisiana 3.42% | ||||||||
| Aviation Board, General Airport Rev. Bonds (North Terminal Project), Series 2015-B, AMT, 5.00% 1/1/2027 | 500 | 504 | ||||||
| Louisiana Stadium and Exposition Dist., Rev. Bonds, Series 2023-A, 5.00% 7/1/2032 | 500 | 582 | ||||||
| Public Facs. Auth., Solid Waste Disposal Rev. Bonds (Waste Pro USA, Inc. Project), Series 2023-R-2, AMT, 6.50% 10/1/2053 (put 10/1/2028)1 | 500 | 503 | ||||||
| 1,589 | ||||||||
| Maryland 1.08% | ||||||||
| City of Gaithersburg, Econ. Dev. Project Rev. and Rev. Ref. Bonds (Asbury Maryland Obligated Group), Series 2018-A, 4.50% 1/1/2025 | 500 | 499 | ||||||
| Massachusetts 1.12% | ||||||||
| Water Resources Auth., General Rev. Bonds, Series 2007-B, 5.25% 8/1/2025 | 500 | 520 | ||||||
| Minnesota 2.35% | ||||||||
| County of Hennepin, Housing and Redev. Auth., Multi Family Housing Rev. Bonds (Labor Retreat Project), Series 2023, 4.65% 10/1/2026 (put 10/1/2024) | 170 | 170 | ||||||
| Housing Fin. Agcy., Residential Housing Fin. Bonds, Series 2022-C, 3.50% 7/1/2052 | 935 | 921 | ||||||
| 1,091 | ||||||||
| Nevada 1.91% | ||||||||
| Clark County School Dist., Limited Tax G.O. Building Bonds, Series 2020-A, Assured Guaranty Municipal insured, 5.00% 6/15/2026 | 500 | 528 | ||||||
| City of Las Vegas, Special Improvement Dist. No. 817 (Summerlin Village 29), Local Improvement Bonds, Series 2023, 5.00% 6/1/2028 | 345 | 359 | ||||||
| 887 | ||||||||
| New Hampshire 0.76% | ||||||||
| Health and Education Facs. Auth., Education Loan Rev. Bonds (New Hampshire Higher Education Loan Corp. Issue), Series 2023-B, AMT, 5.00% 11/1/2043 | 325 | 355 | ||||||
| Capital Group Fixed Income ETF Trust | 77 |
Capital Group Short Duration Municipal Income ETF (continued)
| Bonds, notes & other debt instruments (continued) | Principal amount (000) | Value (000) | ||||||
| New Jersey 1.23% | ||||||||
| Higher Education Student Assistance Auth., Student Loan Rev. Bonds, Series 2022-B, AMT, 5.00% 12/1/2024 | USD | 105 | $ | 106 | ||||
| Higher Education Student Assistance Auth., Student Loan Rev. Ref. Bonds, Series 2021-B, AMT, 2.50% 12/1/2040 | 500 | 466 | ||||||
| 572 | ||||||||
| New Mexico 0.53% | ||||||||
| Mortgage Fin. Auth., Single Family Mortgage Program Bonds, Series 2020-A, Class I, 3.50% 1/1/2051 | 250 | 247 | ||||||
| New York 2.32% | ||||||||
| Metropolitan Transportation Auth., Transportation Rev. Ref. Green Bonds, Series 2017-C-1, 5.00% 11/15/2025 | 500 | 519 | ||||||
| Port Auth., Consolidated Bonds, Series 185, AMT, 5.00% 9/1/2025 | 550 | 557 | ||||||
| 1,076 | ||||||||
| North Carolina 2.15% | ||||||||
| City of Asheville, Housing Auth., Multi Family Housing Rev. Bonds (Vanderbilt Apartments), Series 2023, 5.00% 11/1/2026 (put 11/1/2025) | 515 | 528 | ||||||
| Housing Fin. Agcy., Home Ownership Rev. Bonds, Series 44, 2.05% 1/1/2028 | 500 | 468 | ||||||
| 996 | ||||||||
| North Dakota 1.08% | ||||||||
| Housing Fin. Agcy., Housing Fin. Program Bonds (Home Mortgage Fin. Program), Series 2019-C, 4.00% 1/1/2050 | 500 | 501 | ||||||
| Ohio 2.15% | ||||||||
| Air Quality Dev. Auth., Air Quality Dev. Rev. Ref. Bonds (Duke Energy Corp. Project), Series 2022-B, AMT, 4.25% 11/1/2039 (put 6/1/2027) | 500 | 510 | ||||||
| Housing Fin. Agcy., Residential Mortgage Rev. Bonds (Mortgage-Backed Securities Program), Series 2022-A, 3.25% 9/1/2052 | 500 | 489 | ||||||
| 999 | ||||||||
| Oregon 0.89% | ||||||||
| Housing and Community Services Dept., Housing Dev. Rev. Bonds (The Susan Emmons Apartments Project), Series 2021-S-2, 4.35% 6/1/2024 | 410 | 411 | ||||||
| Pennsylvania 1.63% | ||||||||
| Econ. Dev. Fncg. Auth., Solid Waste Disposal Rev. Bonds (Waste Management, Inc. Project), Series 2021-A-2, AMT, 4.60% 10/1/2046 (put 10/1/2026) | 750 | 758 | ||||||
| Puerto Rico 1.10% | ||||||||
| Industrial, Tourist, Educational, Medical and Environmental Control Facs. Fncg. Auth., Hospital Rev. and Rev. Ref. Bonds (Hospital Auxilio Mutuo Obligated Group Project), Series 2021, 5.00% 7/1/2029 | 470 | 510 | ||||||
| Tennessee 3.83% | ||||||||
| Housing Dev. Agcy., Residential Fin. Program Bonds, Series 2023-3A, 6.25% 1/1/2054 | 85 | 94 | ||||||
| Metropolitan Dev. and Housing Agcy., Tennessee Tax Increment Rev. Bonds (Fifth & Broadway Dev. Project), Series 2018, 4.50% 6/1/20281 | 300 | 302 | ||||||
| Metropolitan Government of Nashville and Davidson County, G.O. Improvement Bonds, Series 2015-C, 5.00% 7/1/2032 (preref. 7/1/2025) | 850 | 878 | ||||||
| Tenergy Corp., Gas Supply Rev. Bonds, Series 2021-A, 4.00% 12/1/2051 (put 9/1/2028) | 500 | 501 | ||||||
| 1,775 | ||||||||
| 78 | Capital Group Fixed Income ETF Trust |
Capital Group Short Duration Municipal Income ETF (continued)
| Bonds, notes & other debt instruments (continued) | Principal amount (000) | Value (000) | ||||||
| Texas 15.32% | ||||||||
| Affordable Housing Corp., Multi Family Housing Rev. Bonds (Juniper Creek Apartments Project), Series 2023, 3.75% 7/1/2044 (put 7/1/2026) | USD | 500 | $ | 502 | ||||
| Central Texas Regional Mobility Auth., Rev. Bond Anticipation Notes, Series 2021-C, 5.00% 1/1/2027 | 500 | 518 | ||||||
| County of Collin, Unlimited Tax Road and Rev. Ref. Bonds, Series 2016, 4.00% 2/15/2027 | 500 | 512 | ||||||
| Cypress-Fairbanks Independent School Dist., Unlimited Tax School Building Bonds, Series 2019-A, 5.00% 2/15/2025 | 500 | 512 | ||||||
| City of Dallas, Special Tax Rev. Bonds (Kay Bailey Hutchison Convention Center Dallas Venue Project), Series 2023, 6.00% 8/15/2053 (put 8/15/2028)1 | 400 | 407 | ||||||
| Frisco Independent School Dist., Unlimited Tax School Building and Rev. Ref. Bonds, Capital Appreciation Bonds, Series 1999, 0% 8/15/2027 | 500 | 452 | ||||||
| County of Harris, Toll Road Rev. Ref. Bonds, Series 2023-A, 5.00% 8/15/2028 | 500 | 556 | ||||||
| City of Houston, Airport System Special Facs. Rev. Ref. Bonds (United Airlines, Inc. Terminal Improvement Projects), Series 2020-C, AMT, 5.00% 7/15/2027 | 500 | 503 | ||||||
| Humble Independent School Dist., Unlimited Tax School Building Bonds, Series 2022, 5.00% 2/15/2028 | 640 | 705 | ||||||
| Love Field Airport Modernization Corp., Special Facs. Rev. Bonds, Series 2012, AMT, 5.00% 11/1/2028 | 500 | 500 | ||||||
| Municipal Gas Acquisition and Supply Corp. IV, Gas Supply Rev. Bonds, Series 2023-A, 5.50% 1/1/2054 (put 1/1/2030) | 250 | 270 | ||||||
| City of San Antonio, Electric and Gas Systems Rev. Ref. Bonds, Series 2019, 4.00% 2/1/2027 | 600 | 623 | ||||||
| Board of Regents of Texas A&M University System, Rev. Fncg. System Bonds, Series 2016-D, 5.00% 5/15/2026 | 500 | 529 | ||||||
| Board of Regents of the University of Texas System, Rev. Fncg. System Rev. Ref. Bonds, Series 2014-B, 5.00% 8/15/2025 | 500 | 518 | ||||||
| 7,107 | ||||||||
| Utah 1.18% | ||||||||
| Salt Lake City, Airport Rev. Bonds (Salt Lake City International Airport), Series 2023-A, AMT, 5.00% 7/1/2029 | 500 | 546 | ||||||
| Virginia 9.22% | ||||||||
| County of Fairfax, Industrial Dev. Auth., Health Care Rev. Bonds (Inova Health System Project), Series 2016-A, 5.00% 5/15/2026 | 700 | 738 | ||||||
| County of James City, Econ. Dev. Auth., Residential Care Fac. Rev. Bonds (Williamsburg Landing), Series 2024-C-2, 5.50% 12/1/2028 | 365 | 367 | ||||||
| Public Building Auth., Public Facs. Rev. Bonds, Series 2015-B, AMT, 5.00% 8/1/2028 | 800 | 871 | ||||||
| Small Business Fncg. Auth., Rev. Bonds (National Senior Campuses, Inc. Obligated Group), Series 2020-A, 5.00% 1/1/2025 | 855 | 864 | ||||||
| Small Business Fncg. Auth., Rev. Bonds (National Senior Campuses, Inc. Obligated Group), Series 2020-A, 5.00% 1/1/2027 | 500 | 518 | ||||||
| Small Business Fncg. Auth., Rev. Ref. Bonds (Elizabeth River Crossings Opco, LLC Project), Series 2022, AMT, 4.00% 7/1/2029 | 500 | 508 | ||||||
| Virginia Beach Dev. Auth., Residential Care Fac. Rev. Bonds (Westminster-Canterbury on Chesapeake Bay), Series 2023-B-3, 5.375% 9/1/2039 | 400 | 411 | ||||||
| 4,277 | ||||||||
| Wisconsin 0.43% | ||||||||
| Public Fin. Auth., Special Rev. Bonds (Candela Project), Series 2023, 6.125% 12/15/20291 | 200 | 199 | ||||||
| Total bonds, notes & other debt instruments (cost: $42,158,000) | 43,365 | |||||||
| Capital Group Fixed Income ETF Trust | 79 |
Capital Group Short Duration Municipal Income ETF (continued)
| Short-term securities 6.05% | Principal amount (000) | Value (000) | ||||||
| Municipals 6.05% | ||||||||
| State of Arizona, Industrial Dev. Auth., Hospital Rev. Ref. Bonds (Phoenix Children’s Hospital), Series 2019-B, 4.00% 2/1/2048 | USD | 355 | $ | 355 | ||||
| State of California, City and County of San Francisco, Community Facs. Dist. No. 2016-1 (Treasure Island), Improvement Area No. 2, Special Tax Bonds, Series 2023-A, 5.00% 9/1/20241 | 250 | 252 | ||||||
| State of Illinois, Fin. Auth., Demand Rev. Bonds (University of Chicago Medical Center), Series 2011-A, 4.00% 8/1/2044 | 500 | 500 | ||||||
| State of Ohio, County of Franklin, Rev. Bonds (CHE Trinity Health Credit Group), Series 2013, 4.30% 12/1/2046 (put 2/01/2024) | 550 | 550 | ||||||
| State of Ohio, Hospital Rev. Bonds (Cleveland Clinic Health System Obligated Group), Series 2013-B-3, 3.85% 1/1/2039 | 200 | 200 | ||||||
| State of Pennsylvania, Econ. Dev. Fncg. Auth., Solid Waste Disposal Rev. Bonds (Republic Services, Inc. Project), Series 2014, AMT, 4.30% 6/1/2044 (put 10/2/2023) | 750 | 750 | ||||||
| State of Texas, Harris County Industrial Dev. Corp., Pollution Control Rev. Bonds (Exxon Project), Series 1984-A, 3.95% 3/1/2024 | 200 | 200 | ||||||
| 2,807 | ||||||||
| Total short-term securities (cost: $2,807,000) | 2,807 | |||||||
| Total investment securities 99.51% (cost: $44,965,000) | 46,172 | |||||||
| Other assets less liabilities 0.49% | 228 | |||||||
| Net assets 100.00% | $ | 46,400 | ||||||
Futures contracts
| Contracts | Type | Number of contracts | Expiration date | Notional amount (000) | Value and unrealized appreciation (depreciation) at 12/31/2023 (000) | |||||||||||
| 2 Year U.S. Treasury Note Futures | Long | 9 | 3/28/2024 | USD1,853 | $ | 16 | ||||||||||
| 10 Year Ultra U.S. Treasury Note Futures | Short | 4 | 3/19/2024 | (472 | ) | (19 | ) | |||||||||
| $ | (3 | ) | ||||||||||||||
| 1 | Acquired in a transaction exempt from registration under Rule 144A or, for commercial paper, Section 4(a)(2) of the Securities Act of 1933. May be resold in the U.S. in transactions exempt from registration, normally to qualified institutional buyers. The total value of all such securities was $1,858,000, which represented 4.00% of the net assets of the fund. |
Key to abbreviation(s)
Agcy. = Agency
AMT = Alternative Minimum Tax
Auth. = Authority
Dept. = Department
Dev. = Development
Dist. = District
Econ. = Economic
Fac. = Facility
Facs. = Facilities
Fin. = Finance
Fncg. = Financing
G.O. = General Obligation
preref. = Prerefunded
Redev. = Redevelopment
Ref. = Refunding
Rev. = Revenue
USD = U.S. dollars
Refer to the notes to financial statements.
| 80 | Capital Group Fixed Income ETF Trust |
Capital Group U.S. Multi-Sector Income ETF
Investment portfolio December 31, 2023
| Portfolio by type of security | Percent of net assets |
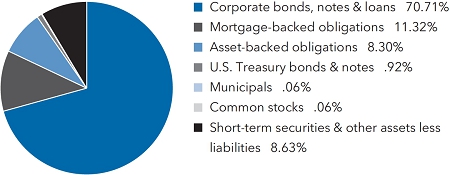
| Portfolio quality summary* | Percent of net assets | |||
| U.S. Treasury and agency† | .92 | % | ||
| AAA/Aaa | 1.25 | |||
| AA/Aa | 6.78 | |||
| A/A | 15.08 | |||
| BBB/Baa | 25.24 | |||
| Below investment grade | 42.04 | |||
| Unrated | .06 | |||
| Short-term securities & other assets less liabilities | 8.63 | |||
| * | Bond ratings, which typically range from AAA/Aaa (highest) to D (lowest), are assigned by credit rating agencies such as Standard & Poor’s, Moody’s and/or Fitch as an indication of an issuer’s creditworthiness. In assigning a credit rating to a security, the fund looks specifically to the ratings assigned to the issuer of the security by Standard & Poor’s, Moody’s and/or Fitch. If agency ratings differ, the security will be considered to have received the highest of those ratings, consistent with the fund’s investment policies. Securities in the “unrated” category (above) have not been rated by a rating agency; however, the investment adviser performs its own credit analysis and assigns comparable ratings that are used for compliance with the fund’s investment policies. The ratings are not covered by the Report of Independent Registered Public Accounting Firm. |
| † | These securities are guaranteed by the full faith and credit of the U.S. government. |
| Bonds, notes & other debt instruments 91.31% | Principal amount (000) | Value (000) | ||||||
| Corporate bonds, notes & loans 70.71% | ||||||||
| Financials 13.45% | ||||||||
| AerCap Ireland Capital DAC 3.30% 1/30/2032 | USD | 250 | $ | 218 | ||||
| AerCap Ireland Capital DAC 3.85% 10/29/2041 | 1,635 | 1,319 | ||||||
| AG Issuer, LLC 6.25% 3/1/20281 | 81 | 81 | ||||||
| AG TTMT Escrow Issuer, LLC 8.625% 9/30/20271 | 740 | 779 | ||||||
| Alliant Holdings Intermediate, LLC 6.75% 10/15/20271 | 760 | 758 | ||||||
| Alliant Holdings Intermediate, LLC 7.00% 1/15/20311 | 540 | 570 | ||||||
| Alpha Bank SA 4.25% 2/13/2030 (5-year EUR Mid-Swap + 4.504% on 2/13/2025)2 | EUR | 625 | 676 | |||||
| Alpha Bank SA 4.25% 6/11/2031 (5-year EUR Mid-Swap + 5.823% on 6/11/2026)2 | 100 | 108 | ||||||
| American International Group, Inc. 5.125% 3/27/2033 | USD | 581 | 590 | |||||
| AmWINS Group, Inc. 4.875% 6/30/20291 | 575 | 526 | ||||||
| Aon Corp. 5.35% 2/28/2033 | 212 | 217 | ||||||
| Aretec Group, Inc. 7.50% 4/1/20291 | 855 | 771 | ||||||
| Aretec Group, Inc. 10.00% 8/15/20301 | 360 | 383 | ||||||
| AssuredPartners, Inc. 5.625% 1/15/20291 | 530 | 495 | ||||||
| Bangkok Bank Public Co., Ltd. 3.733% 9/25/2034 (5-year UST Yield Curve Rate T Note Constant Maturity + 1.90% on 9/25/2029)2 | 699 | 622 | ||||||
| Bank of America Corp. 4.948% 7/22/2028 (USD-SOFR + 2.04% on 7/22/2027)2 | 400 | 400 | ||||||
| Bank of America Corp. 5.202% 4/25/2029 (USD-SOFR + 1.63% on 4/25/2028)2 | 275 | 277 | ||||||
| Bank of America Corp. 5.872% 9/15/2034 (USD-SOFR + 1.84% on 9/15/2033)2 | 875 | 916 | ||||||
| Bank of East Asia, Ltd. 4.875% 4/22/2032 (5-year UST Yield Curve Rate T Note Constant Maturity + 2.30% on 4/22/2027)2 | 250 | 226 | ||||||
| Block, Inc. 3.50% 6/1/2031 | 625 | 556 | ||||||
| CaixaBank, SA 6.208% 1/18/2029 (USD-SOFR + 2.70% on 1/18/2028)1,2 | 315 | 322 | ||||||
| CaixaBank, SA 6.84% 9/13/2034 (USD-SOFR + 2.77% on 9/13/2033)1,2 | 525 | 555 | ||||||
| Capital One Financial Corp. 5.468% 2/1/2029 (USD-SOFR + 2.08% on 2/1/2028)2 | 54 | 54 | ||||||
| Capital One Financial Corp. 6.377% 6/8/2034 (USD-SOFR + 2.86% on 6/8/2033)2 | 635 | 654 | ||||||
| Charles Schwab Corp. (The) 2.45% 3/3/2027 | 245 | 228 | ||||||
| Charles Schwab Corp. (The) 5.853% 5/19/2034 (USD-SOFR + 2.50% on 5/19/2033)2 | 617 | 637 | ||||||
| Citigroup, Inc. 6.27% 11/17/2033 (USD-SOFR + 2.338% on 11/17/2032)2 | 491 | 526 | ||||||
| Capital Group Fixed Income ETF Trust | 81 |
Capital Group U.S. Multi-Sector Income ETF (continued)
| Bonds, notes & other debt instruments (continued) | Principal amount (000) | Value (000) | ||||||
| Corporate bonds, notes & loans (continued) | ||||||||
| Financials (continued) | ||||||||
| Citigroup, Inc. 6.174% 5/25/2034 (USD-SOFR + 2.661% on 5/25/2033)2 | USD | 1,075 | $ | 1,113 | ||||
| Coinbase Global, Inc. 3.375% 10/1/20281 | 271 | 229 | ||||||
| Coinbase Global, Inc. 3.625% 10/1/20311 | 650 | 503 | ||||||
| Compass Group Diversified Holdings, LLC 5.25% 4/15/20291 | 1,450 | 1,371 | ||||||
| Compass Group Diversified Holdings, LLC 5.00% 1/15/20321 | 310 | 281 | ||||||
| Corebridge Financial, Inc. 3.90% 4/5/2032 | 250 | 226 | ||||||
| Corebridge Financial, Inc. 4.40% 4/5/2052 | 395 | 332 | ||||||
| Deutsche Bank AG 7.146% 7/13/2027 (USD-SOFR + 2.52% on 7/13/2026)2 | 250 | 260 | ||||||
| Deutsche Bank AG 2.552% 1/7/2028 (USD-SOFR + 1.318% on 1/7/2027)2 | 335 | 308 | ||||||
| Deutsche Bank AG 6.72% 1/18/2029 (USD-SOFR + 3.18% on 1/18/2028)2 | 155 | 162 | ||||||
| Deutsche Bank AG 6.819% 11/20/2029 (USD-SOFR + 2.51% on 11/20/2028)2 | 700 | 737 | ||||||
| Discover Financial Services 6.70% 11/29/2032 | 78 | 82 | ||||||
| Discover Financial Services 7.964% 11/2/2034 (USD-SOFR Index + 3.37% on 11/2/2033)2 | 500 | 556 | ||||||
| Fifth Third Bancorp 6.339% 7/27/2029 (USD-SOFR + 2.34% on 7/27/2028)2 | 65 | 68 | ||||||
| Goldman Sachs Group, Inc. 3.102% 2/24/2033 (USD-SOFR + 1.41% on 2/24/2032)2 | 2,063 | 1,771 | ||||||
| GTCR W-2 Merger Sub, LLC 7.50% 1/15/20311 | 975 | 1,031 | ||||||
| Hightower Holding, LLC 6.75% 4/15/20291 | 325 | 295 | ||||||
| HSBC Holdings PLC 2.804% 5/24/2032 (USD-SOFR + 1.187% on 5/24/2031)2 | 1,555 | 1,299 | ||||||
| HSBC Holdings PLC 6.254% 3/9/2034 (USD-SOFR + 2.39% on 3/9/2033)2 | 25 | 27 | ||||||
| HSBC Holdings PLC 6.332% 3/9/2044 (USD-SOFR + 2.65% on 3/9/2043)2 | 1,614 | 1,742 | ||||||
| HUB International, Ltd. 7.00% 5/1/20261 | 500 | 502 | ||||||
| HUB International, Ltd. 5.625% 12/1/20291 | 250 | 239 | ||||||
| HUB International, Ltd. 7.25% 6/15/20301 | 616 | 651 | ||||||
| HUB International, Ltd., Term Loan B, (3-month USD CME Term SOFR + 4.25%) 9.662% 6/20/20303,4 | 49 | 49 | ||||||
| Huntington Bancshares, Inc. 6.208% 8/21/2029 (USD-SOFR + 2.02% on 8/21/2028)2 | 475 | 490 | ||||||
| Iron Mountain Information Management Services, Inc. 5.00% 7/15/20321 | 580 | 533 | ||||||
| JPMorgan Chase & Co. 4.851% 7/25/2028 (USD-SOFR + 1.99% on 7/25/2027)2 | 150 | 150 | ||||||
| JPMorgan Chase & Co. 6.254% 10/23/2034 (USD-SOFR + 1.81% on 10/23/2033)2 | 774 | 839 | ||||||
| JPMorgan Chase & Co. 3.328% 4/22/2052 (USD-SOFR + 1.58% on 4/22/2051)2 | 910 | 680 | ||||||
| Kasikornbank PCL (Hong Kong Branch) 3.343% 10/2/2031 (5-year UST Yield Curve Rate T Note Constant Maturity + 1.70% on 10/2/2026)2 | 400 | 368 | ||||||
| KBC Groep NV 5.796% 1/19/2029 (1-year UST Yield Curve Rate T Note Constant Maturity + 2.10% on 1/19/2028)1,2 | 200 | 204 | ||||||
| LPL Holdings, Inc. 4.00% 3/15/20291 | 385 | 357 | ||||||
| Marsh & McLennan Companies, Inc. 5.70% 9/15/2053 | 215 | 234 | ||||||
| MetLife, Inc. 5.375% 7/15/2033 | 296 | 309 | ||||||
| Metropolitan Life Global Funding I 5.15% 3/28/20331 | 350 | 356 | ||||||
| Morgan Stanley 5.123% 2/1/2029 (USD-SOFR + 1.73% on 2/1/2028)2 | 150 | 151 | ||||||
| Morgan Stanley 5.164% 4/20/2029 (USD-SOFR + 1.59% on 4/20/2028)2 | 130 | 131 | ||||||
| Morgan Stanley 1.794% 2/13/2032 (USD-SOFR + 1.034% on 2/13/2031)2 | 450 | 360 | ||||||
| Morgan Stanley 4.889% 7/20/2033 (USD-SOFR + 2.077% on 7/20/2032)2 | 419 | 409 | ||||||
| Morgan Stanley 5.25% 4/21/2034 (USD-SOFR + 1.87% on 4/21/2033)2 | 775 | 775 | ||||||
| Morgan Stanley 5.424% 7/21/2034 (USD-SOFR + 1.88% on 7/21/2033)2 | 1,604 | 1,629 | ||||||
| Nasdaq, Inc. 5.35% 6/28/2028 | 31 | 32 | ||||||
| Nasdaq, Inc. 5.55% 2/15/2034 | 500 | 520 | ||||||
| Nasdaq, Inc. 5.95% 8/15/2053 | 785 | 845 | ||||||
| Nasdaq, Inc. 6.10% 6/28/2063 | 504 | 545 | ||||||
| Navient Corp. 9.375% 7/25/2030 | 400 | 419 | ||||||
| Navient Corp. 11.50% 3/15/2031 | 575 | 630 | ||||||
| Navient Corp. 5.625% 8/1/2033 | 1,550 | 1,274 | ||||||
| New York Life Global Funding 4.55% 1/28/20331 | 46 | 45 | ||||||
| NFP Corp. 6.875% 8/15/20281 | 405 | 412 | ||||||
| Osaic Holdings, Inc. 10.75% 8/1/20271 | 250 | 254 | ||||||
| Oxford Finance, LLC 6.375% 2/1/20271 | 135 | 128 | ||||||
| PayPal Holdings, Inc. 5.05% 6/1/2052 | 170 | 172 | ||||||
| PNC Financial Services Group, Inc. 6.037% 10/28/2033 (USD-SOFR + 2.14% on 10/28/2032)2 | 202 | 211 | ||||||
| PNC Financial Services Group, Inc. 5.939% 8/18/2034 (USD-SOFR + 1.946% on 8/18/2033)2 | 523 | 544 | ||||||
| PNC Financial Services Group, Inc. 6.875% 10/20/2034 (USD-SOFR + 2.284% on 10/20/2033)2 | 1,204 | 1,337 | ||||||
| 82 | Capital Group Fixed Income ETF Trust |
Capital Group U.S. Multi-Sector Income ETF (continued)
| Bonds, notes & other debt instruments (continued) | Principal amount (000) | Value (000) | ||||||
| Corporate bonds, notes & loans (continued) | ||||||||
| Financials (continued) | ||||||||
| Power Finance Corp., Ltd. 3.35% 5/16/2031 | USD | 250 | $ | 220 | ||||
| Royal Bank of Canada 5.00% 2/1/2033 | 79 | 80 | ||||||
| Ryan Specialty Group, LLC 4.375% 2/1/20301 | 445 | 413 | ||||||
| State Street Corp. 4.821% 1/26/2034 (USD-SOFR + 1.567% on 1/26/2033)2 | 348 | 343 | ||||||
| State Street Corp. 5.159% 5/18/2034 (USD-SOFR + 1.89% on 5/18/2033)2 | 416 | 419 | ||||||
| Sumitomo Mitsui Financial Group, Inc. 5.808% 9/14/2033 | 525 | 561 | ||||||
| Truist Financial Corp. 7.161% 10/30/2029 (USD-SOFR + 2.446% on 10/30/2028)2 | 40 | 43 | ||||||
| Truist Financial Corp. 5.867% 6/8/2034 (USD-SOFR + 2.361% on 6/8/2033)2 | 727 | 742 | ||||||
| U.S. Bancorp 4.653% 2/1/2029 (USD-SOFR + 1.23% on 2/1/2028)2 | 125 | 123 | ||||||
| U.S. Bancorp 4.839% 2/1/2034 (USD-SOFR + 1.60% on 2/1/2033)2 | 225 | 216 | ||||||
| U.S. Bancorp 5.836% 6/12/2034 (USD-SOFR + 2.26% on 6/10/2033)2 | 208 | 215 | ||||||
| UBS Group AG 4.194% 4/1/2031 (USD-SOFR + 3.73% on 4/1/2030)1,2 | 535 | 499 | ||||||
| UBS Group AG 6.301% 9/22/2034 (1-year UST Yield Curve Rate T Note Constant Maturity + 2.00% on 9/22/2033)1,2 | 800 | 847 | ||||||
| USI, Inc. 7.50% 1/15/20321 | 270 | 277 | ||||||
| Wells Fargo & Co. 5.389% 4/24/2034 (USD-SOFR + 2.02% on 4/24/2033)2 | 725 | 729 | ||||||
| Wells Fargo & Co. 5.557% 7/25/2034 (USD-SOFR + 1.99% on 7/25/2033)2 | 700 | 713 | ||||||
| Wells Fargo & Co. 6.491% 10/23/2034 (USD-SOFR + 2.06% on 10/23/2033)2 | 1,816 | 1,977 | ||||||
| 51,058 | ||||||||
| Energy 12.14% | ||||||||
| Apache Corp. 5.10% 9/1/2040 | 75 | 64 | ||||||
| Apache Corp. 5.25% 2/1/2042 | 500 | 419 | ||||||
| Ascent Resources Utica Holdings, LLC 5.875% 6/30/20291 | 1,100 | 1,025 | ||||||
| Borr IHC, Ltd. 10.00% 11/15/20281 | 802 | 838 | ||||||
| Borr IHC, Ltd. 10.375% 11/15/20301 | 450 | 466 | ||||||
| BP Capital Markets America, Inc. 4.893% 9/11/2033 | 600 | 611 | ||||||
| California Resources Corp. 7.125% 2/1/20261 | 240 | 244 | ||||||
| Callon Petroleum Co. 7.50% 6/15/20301 | 1,090 | 1,100 | ||||||
| Cheniere Energy Partners, LP 3.25% 1/31/2032 | 545 | 465 | ||||||
| Cheniere Energy Partners, LP 5.95% 6/30/20331 | 370 | 380 | ||||||
| Cheniere Energy, Inc. 4.625% 10/15/2028 | 395 | 386 | ||||||
| Chesapeake Energy Corp. 5.875% 2/1/20291 | 855 | 839 | ||||||
| CITGO Petroleum Corp. 8.375% 1/15/20291 | 255 | 262 | ||||||
| Civitas Resources, Inc. 5.00% 10/15/20261 | 255 | 248 | ||||||
| Civitas Resources, Inc. 8.375% 7/1/20281 | 625 | 653 | ||||||
| Civitas Resources, Inc. 8.625% 11/1/20301 | 335 | 356 | ||||||
| Civitas Resources, Inc. 8.75% 7/1/20311 | 1,025 | 1,092 | ||||||
| CNX Resources Corp. 7.375% 1/15/20311 | 914 | 921 | ||||||
| Columbia Pipelines Holding Co., LLC 6.544% 11/15/20531 | 754 | 831 | ||||||
| Columbia Pipelines Operating Co., LLC 5.927% 8/15/20301 | 104 | 108 | ||||||
| Columbia Pipelines Operating Co., LLC 6.036% 11/15/20331 | 209 | 219 | ||||||
| Columbia Pipelines Operating Co., LLC 6.497% 8/15/20431 | 77 | 83 | ||||||
| Comstock Resources, Inc. 6.75% 3/1/20291 | 490 | 449 | ||||||
| Comstock Resources, Inc. 5.875% 1/15/20301 | 1,170 | 1,016 | ||||||
| ConocoPhillips Co. 5.30% 5/15/2053 | 325 | 334 | ||||||
| ConocoPhillips Co. 5.55% 3/15/2054 | 952 | 1,012 | ||||||
| Crescent Energy Finance, LLC 9.25% 2/15/20281 | 676 | 702 | ||||||
| DT Midstream, Inc. 4.375% 6/15/20311 | 450 | 406 | ||||||
| Ecopetrol SA 8.875% 1/13/2033 | 635 | 691 | ||||||
| Enbridge, Inc. 6.70% 11/15/2053 | 949 | 1,105 | ||||||
| Energy Transfer, LP 6.40% 12/1/2030 | 92 | 98 | ||||||
| Energy Transfer, LP 6.55% 12/1/2033 | 1,349 | 1,466 | ||||||
| EQM Midstream Partners, LP 4.75% 1/15/20311 | 945 | 881 | ||||||
| Exxon Mobil Corp. 2.61% 10/15/2030 | 675 | 604 | ||||||
| Exxon Mobil Corp. 3.452% 4/15/2051 | 1,200 | 943 | ||||||
| Genesis Energy, LP 8.00% 1/15/2027 | 270 | 275 | ||||||
| Genesis Energy, LP 8.25% 1/15/2029 | 545 | 561 | ||||||
| Genesis Energy, LP 8.875% 4/15/2030 | 620 | 642 | ||||||
| Harvest Midstream I, LP 7.50% 9/1/20281 | 525 | 522 | ||||||
| Hilcorp Energy I, LP 6.25% 4/15/20321 | 705 | 679 | ||||||
| Hilcorp Energy I, LP 8.375% 11/1/20331 | 875 | 928 | ||||||
| Capital Group Fixed Income ETF Trust | 83 |
Capital Group U.S. Multi-Sector Income ETF (continued)
| Bonds, notes & other debt instruments (continued) | Principal amount (000) | Value (000) | ||||||
| Corporate bonds, notes & loans (continued) | ||||||||
| Energy (continued) | ||||||||
| Kinder Morgan, Inc. 4.80% 2/1/2033 | USD | 575 | $ | 554 | ||||
| Kinder Morgan, Inc. 5.20% 6/1/2033 | 50 | 50 | ||||||
| Kinder Morgan, Inc. 5.45% 8/1/2052 | 595 | 570 | ||||||
| Kinetik Holdings, LP 6.625% 12/15/20281 | 370 | 377 | ||||||
| Leviathan Bond, Ltd. 6.75% 6/30/20301 | 605 | 554 | ||||||
| MPLX, LP 4.95% 9/1/2032 | 675 | 661 | ||||||
| MPLX, LP 5.00% 3/1/2033 | 75 | 74 | ||||||
| MPLX, LP 4.95% 3/14/2052 | 1,240 | 1,105 | ||||||
| Nabors Industries, Inc. 7.375% 5/15/20271 | 600 | 588 | ||||||
| Nabors Industries, Inc. 9.125% 1/31/20301 | 685 | 688 | ||||||
| New Fortress Energy, Inc. 6.50% 9/30/20261 | 1,595 | 1,533 | ||||||
| NGL Energy Operating, LLC 7.50% 2/1/20261 | 1,280 | 1,294 | ||||||
| Noble Finance II, LLC 8.00% 4/15/20301 | 125 | 130 | ||||||
| Northern Oil and Gas, Inc. 8.125% 3/1/20281 | 797 | 808 | ||||||
| Northern Oil and Gas, Inc. 8.75% 6/15/20311 | 90 | 94 | ||||||
| Occidental Petroleum Corp. 6.625% 9/1/2030 | 275 | 293 | ||||||
| Occidental Petroleum Corp. 6.125% 1/1/2031 | 550 | 572 | ||||||
| Occidental Petroleum Corp. 6.60% 3/15/2046 | 430 | 466 | ||||||
| ONEOK, Inc. 5.55% 11/1/2026 | 5 | 5 | ||||||
| ONEOK, Inc. 5.65% 11/1/2028 | 31 | 32 | ||||||
| ONEOK, Inc. 5.80% 11/1/2030 | 74 | 77 | ||||||
| ONEOK, Inc. 6.05% 9/1/2033 | 549 | 582 | ||||||
| ONEOK, Inc. 6.625% 9/1/2053 | 482 | 540 | ||||||
| Permian Resources Operating, LLC 6.875% 4/1/20271 | 15 | 15 | ||||||
| Permian Resources Operating, LLC 8.00% 4/15/20271 | 52 | 54 | ||||||
| Permian Resources Operating, LLC 5.875% 7/1/20291 | 430 | 420 | ||||||
| Permian Resources Operating, LLC 9.875% 7/15/20311 | 705 | 784 | ||||||
| Permian Resources Operating, LLC 7.00% 1/15/20321 | 475 | 490 | ||||||
| Petroleos Mexicanos 6.49% 1/23/2027 | 150 | 141 | ||||||
| Range Resources Corp. 4.75% 2/15/20301 | 440 | 407 | ||||||
| Shell International Finance BV 3.00% 11/26/2051 | 200 | 143 | ||||||
| Southwestern Energy Co. 4.75% 2/1/2032 | 285 | 264 | ||||||
| Sunoco, LP 4.50% 5/15/2029 | 570 | 530 | ||||||
| Superior Plus, LP 4.50% 3/15/20291 | 50 | 46 | ||||||
| TotalEnergies Capital International SA 3.127% 5/29/2050 | 885 | 650 | ||||||
| Transocean Aquila, Ltd. 8.00% 9/30/20281 | 325 | 330 | ||||||
| Transocean Poseidon, Ltd. 6.875% 2/1/20271 | 183 | 183 | ||||||
| Transocean Titan Financing, Ltd. 8.375% 2/1/20281 | 292 | 303 | ||||||
| Transocean, Inc. 8.00% 2/1/20271 | 420 | 410 | ||||||
| Transocean, Inc. 8.75% 2/15/20301 | 515 | 538 | ||||||
| Transocean, Inc. 6.80% 3/15/2038 | 500 | 402 | ||||||
| Venture Global Calcasieu Pass, LLC 6.25% 1/15/20301 | 474 | 472 | ||||||
| Venture Global Calcasieu Pass, LLC 4.125% 8/15/20311 | 700 | 618 | ||||||
| Venture Global LNG, Inc. 8.125% 6/1/20281 | 250 | 253 | ||||||
| Venture Global LNG, Inc. 8.375% 6/1/20311 | 260 | 260 | ||||||
| Vital Energy, Inc. 10.125% 1/15/2028 | 205 | 211 | ||||||
| Vital Energy, Inc. 9.75% 10/15/2030 | 660 | 685 | ||||||
| Western Midstream Operating, LP 4.50% 3/1/2028 | 380 | 368 | ||||||
| Western Midstream Operating, LP 6.15% 4/1/2033 | 203 | 211 | ||||||
| Williams Companies, Inc. 4.65% 8/15/2032 | 325 | 317 | ||||||
| 46,076 | ||||||||
| Consumer discretionary 7.66% | ||||||||
| Advance Auto Parts, Inc. 3.90% 4/15/2030 | 921 | 827 | ||||||
| Advance Auto Parts, Inc. 3.50% 3/15/2032 | 766 | 634 | ||||||
| Alibaba Group Holding, Ltd. 2.125% 2/9/2031 | 300 | 249 | ||||||
| Allied Universal Holdco, LLC 9.75% 7/15/20271 | 300 | 294 | ||||||
| Allied Universal Holdco, LLC 4.625% 6/1/20281 | 1,420 | 1,293 | ||||||
| Allwyn Entertainment Financing (UK) PLC 7.875% 4/30/20291 | 225 | 230 | ||||||
| Amazon.com, Inc. 4.70% 12/1/2032 | 335 | 344 | ||||||
| Asbury Automotive Group, Inc. 4.625% 11/15/20291 | 845 | 783 | ||||||
| Atlas LuxCo 4 SARL 4.625% 6/1/20281 | 300 | 274 | ||||||
| 84 | Capital Group Fixed Income ETF Trust |
Capital Group U.S. Multi-Sector Income ETF (continued)
| Bonds, notes & other debt instruments (continued) | Principal amount (000) | Value (000) | ||||||
| Corporate bonds, notes & loans (continued) | ||||||||
| Consumer discretionary (continued) | ||||||||
| Bath & Body Works, Inc. 6.875% 11/1/2035 | USD | 1,110 | $ | 1,125 | ||||
| Bath & Body Works, Inc. 6.75% 7/1/2036 | 100 | 101 | ||||||
| Boyd Gaming Corp. 4.75% 12/1/2027 | 595 | 574 | ||||||
| Boyne USA, Inc. 4.75% 5/15/20291 | 530 | 499 | ||||||
| Caesars Entertainment, Inc. 7.00% 2/15/20301 | 125 | 128 | ||||||
| Caesars Resort Collection, LLC 5.75% 7/1/20251 | 387 | 387 | ||||||
| Carnival Corp. 5.75% 3/1/20271 | 725 | 708 | ||||||
| Carnival Corp. 6.00% 5/1/20291 | 1,488 | 1,433 | ||||||
| Carnival Corp. 7.00% 8/15/20291 | 375 | 392 | ||||||
| Carnival Corp. 10.50% 6/1/20301 | 187 | 205 | ||||||
| Cedar Fair, LP 5.50% 5/1/20251 | 260 | 259 | ||||||
| Clarios Global, LP 8.50% 5/15/20271 | 351 | 353 | ||||||
| Fertitta Entertainment, LLC 4.625% 1/15/20291 | 325 | 295 | ||||||
| First Student Bidco, Inc. 4.00% 7/31/20291 | 165 | 143 | ||||||
| Ford Motor Co. 7.45% 7/16/2031 | 250 | 273 | ||||||
| Ford Motor Co. 6.10% 8/19/2032 | 1,000 | 1,009 | ||||||
| Ford Motor Co. 4.75% 1/15/2043 | 414 | 342 | ||||||
| Ford Motor Co. 5.291% 12/8/2046 | 661 | 583 | ||||||
| Ford Motor Credit Co., LLC 2.70% 8/10/2026 | 100 | 93 | ||||||
| Ford Motor Credit Co., LLC 4.95% 5/28/2027 | 350 | 342 | ||||||
| Ford Motor Credit Co., LLC 3.815% 11/2/2027 | 607 | 567 | ||||||
| Ford Motor Credit Co., LLC 6.798% 11/7/2028 | 300 | 314 | ||||||
| Ford Motor Credit Co., LLC 7.20% 6/10/2030 | 100 | 107 | ||||||
| Ford Motor Credit Co., LLC 7.122% 11/7/2033 | 100 | 108 | ||||||
| Hanesbrands, Inc. 9.00% 2/15/20311 | 1,207 | 1,184 | ||||||
| Hanesbrands, Inc., Term Loan B, (3-month USD CME Term SOFR + 3.75%) 9.106% 3/8/20303,4 | 78 | 78 | ||||||
| Hilton Domestic Operating Co., Inc. 4.00% 5/1/20311 | 459 | 421 | ||||||
| Home Depot, Inc. 1.375% 3/15/2031 | 280 | 229 | ||||||
| Home Depot, Inc. 3.25% 4/15/2032 | 154 | 142 | ||||||
| Hyundai Capital America 6.50% 1/16/20291 | 17 | 18 | ||||||
| International Game Technology PLC 5.25% 1/15/20291 | 755 | 740 | ||||||
| LCM Investments Holdings II, LLC 4.875% 5/1/20291 | 575 | 535 | ||||||
| LCM Investments Holdings II, LLC 8.25% 8/1/20311 | 545 | 569 | ||||||
| Levi Strauss & Co. 3.50% 3/1/20311 | 250 | 217 | ||||||
| Light and Wonder International, Inc. 7.50% 9/1/20311 | 355 | 371 | ||||||
| Lithia Motors, Inc. 3.875% 6/1/20291 | 625 | 565 | ||||||
| Marriott Ownership Resorts, Inc. 4.50% 6/15/20291 | 585 | 516 | ||||||
| McDonald’s Corp. 5.15% 9/9/2052 | 75 | 76 | ||||||
| Party City Holdings, Inc. 12.00% 12/31/20281 | 65 | 63 | ||||||
| RHP Hotel Properties, LP 7.25% 7/15/20281 | 79 | 82 | ||||||
| Royal Caribbean Cruises, Ltd. 4.25% 7/1/20261 | 565 | 546 | ||||||
| Royal Caribbean Cruises, Ltd. 3.70% 3/15/2028 | 531 | 490 | ||||||
| Royal Caribbean Cruises, Ltd. 5.50% 4/1/20281 | 665 | 657 | ||||||
| Royal Caribbean Cruises, Ltd. 8.25% 1/15/20291 | 650 | 691 | ||||||
| Royal Caribbean Cruises, Ltd. 7.25% 1/15/20301 | 76 | 79 | ||||||
| Sands China, Ltd. 3.75% 8/8/20312 | 575 | 482 | ||||||
| Scientific Games Holdings, LP 6.625% 3/1/20301 | 113 | 107 | ||||||
| Sonic Automotive, Inc. 4.625% 11/15/20291 | 614 | 560 | ||||||
| Sonic Automotive, Inc. 4.875% 11/15/20311 | 891 | 795 | ||||||
| Tapestry, Inc. 7.85% 11/27/2033 | 551 | 588 | ||||||
| Vail Resorts, Inc. 6.25% 5/15/20251 | 90 | 90 | ||||||
| Valvoline, Inc. 3.625% 6/15/20311 | 996 | 852 | ||||||
| WASH Multifamily Acquisition, Inc. 5.75% 4/15/20261 | 315 | 303 | ||||||
| Wyndham Hotels & Resorts, Inc. 4.375% 8/15/20281 | 663 | 620 | ||||||
| Wynn Resorts Finance, LLC 5.125% 10/1/20291 | 1,020 | 964 | ||||||
| Wynn Resorts Finance, LLC 7.125% 2/15/20311 | 176 | 183 | ||||||
| 29,081 | ||||||||
| Capital Group Fixed Income ETF Trust | 85 |
Capital Group U.S. Multi-Sector Income ETF (continued)
| Bonds, notes & other debt instruments (continued) | Principal amount (000) | Value (000) | ||||||
| Corporate bonds, notes & loans (continued) | ||||||||
| Health care 6.40% | ||||||||
| AdaptHealth, LLC 6.125% 8/1/20281 | USD | 65 | $ | 56 | ||||
| AdaptHealth, LLC 4.625% 8/1/20291 | 246 | 190 | ||||||
| AdaptHealth, LLC 5.125% 3/1/20301 | 439 | 343 | ||||||
| Amgen, Inc. 5.25% 3/2/2030 | 161 | 166 | ||||||
| Amgen, Inc. 4.20% 3/1/2033 | 740 | 704 | ||||||
| Amgen, Inc. 5.25% 3/2/2033 | 818 | 839 | ||||||
| Amgen, Inc. 3.00% 1/15/2052 | 1,275 | 891 | ||||||
| Amgen, Inc. 5.65% 3/2/2053 | 1,356 | 1,428 | ||||||
| Amgen, Inc. 5.75% 3/2/2063 | 175 | 184 | ||||||
| Avantor Funding, Inc. 3.875% 11/1/20291 | 341 | 310 | ||||||
| Bausch Health Americas, Inc. 8.50% 1/31/20271 | 115 | 63 | ||||||
| Bausch Health Companies, Inc. 5.50% 11/1/20251 | 425 | 389 | ||||||
| Bausch Health Companies, Inc. 5.00% 2/15/20291 | 125 | 54 | ||||||
| Bausch Health Companies, Inc. 5.25% 2/15/20311 | 235 | 103 | ||||||
| Baxter International, Inc. 2.272% 12/1/2028 | 100 | 90 | ||||||
| Baxter International, Inc. 2.539% 2/1/2032 | 942 | 790 | ||||||
| Baxter International, Inc. 3.132% 12/1/2051 | 475 | 327 | ||||||
| Bayer US Finance, LLC 6.50% 11/21/20331 | 1,104 | 1,142 | ||||||
| Bayer US Finance, LLC 6.875% 11/21/20531 | 275 | 293 | ||||||
| Bristol-Myers Squibb Co. 6.25% 11/15/2053 | 275 | 315 | ||||||
| Bristol-Myers Squibb Co. 6.40% 11/15/2063 | 175 | 203 | ||||||
| Catalent Pharma Solutions, Inc. 3.50% 4/1/20301 | 310 | 270 | ||||||
| Catalent Pharma Solutions, Inc., Term Loan B4, (1-month USD CME Term SOFR + 3.50%) 8.36% 2/22/20283,4 | 217 | 217 | ||||||
| Centene Corp. 2.45% 7/15/2028 | 415 | 370 | ||||||
| Centene Corp. 2.50% 3/1/2031 | 1,145 | 956 | ||||||
| Charles River Laboratories International, Inc. 3.75% 3/15/20291 | 399 | 366 | ||||||
| CHS / Community Health Systems, Inc. 5.625% 3/15/20271 | 325 | 302 | ||||||
| CVS Health Corp. 5.25% 2/21/2033 | 126 | 129 | ||||||
| CVS Health Corp. 5.30% 6/1/2033 | 550 | 565 | ||||||
| CVS Health Corp. 5.875% 6/1/2053 | 436 | 459 | ||||||
| CVS Health Corp. 6.00% 6/1/2063 | 363 | 386 | ||||||
| Eli Lilly and Co. 4.70% 2/27/2033 | 38 | 39 | ||||||
| Fortrea Holdings, Inc. 7.50% 7/1/20301 | 90 | 93 | ||||||
| Fortrea Holdings, Inc., Term Loan B, (3-month USD CME Term SOFR + 3.75%) 9.106% 7/1/20303,4 | 25 | 25 | ||||||
| Gilead Sciences, Inc. 5.25% 10/15/2033 | 239 | 249 | ||||||
| Grifols SA 4.75% 10/15/20281 | 200 | 182 | ||||||
| HCA, Inc. 2.375% 7/15/2031 | 545 | 449 | ||||||
| Medline Borrower, LP 5.25% 10/1/20291 | 906 | 855 | ||||||
| Merck & Co., Inc. 5.15% 5/17/2063 | 175 | 183 | ||||||
| Molina Healthcare, Inc. 3.875% 11/15/20301 | 325 | 292 | ||||||
| Molina Healthcare, Inc. 3.875% 5/15/20321 | 1,372 | 1,200 | ||||||
| Owens & Minor, Inc. 6.25% 4/1/20301 | 335 | 320 | ||||||
| Pfizer Investment Enterprises Pte., Ltd. 4.75% 5/19/2033 | 465 | 466 | ||||||
| Pfizer Investment Enterprises Pte., Ltd. 5.11% 5/19/2043 | 100 | 100 | ||||||
| Pfizer Investment Enterprises Pte., Ltd. 5.30% 5/19/2053 | 1,053 | 1,076 | ||||||
| Radiology Partners, Inc. 9.25% 2/1/20281 | 722 | 371 | ||||||
| Radiology Partners, Inc., Term Loan, (1-month USD CME Term SOFR + 4.25%) 10.179% 7/9/20253,4 | 100 | 81 | ||||||
| RP Escrow Issuer, LLC 5.25% 12/15/20251 | 460 | 369 | ||||||
| Surgery Center Holdings, Inc. 10.00% 4/15/20271 | 79 | 80 | ||||||
| Tenet Healthcare Corp. 6.125% 10/1/2028 | 275 | 274 | ||||||
| Tenet Healthcare Corp. 6.75% 5/15/20311 | 275 | 281 | ||||||
| Teva Pharmaceutical Finance Netherlands III BV 3.15% 10/1/2026 | 200 | 185 | ||||||
| Teva Pharmaceutical Finance Netherlands III BV 6.75% 3/1/2028 | 780 | 798 | ||||||
| Teva Pharmaceutical Finance Netherlands III BV 5.125% 5/9/2029 | 1,405 | 1,343 | ||||||
| Teva Pharmaceutical Finance Netherlands III BV 7.875% 9/15/2029 | 775 | 836 | ||||||
| Teva Pharmaceutical Finance Netherlands III BV 8.125% 9/15/2031 | 622 | 679 | ||||||
| 86 | Capital Group Fixed Income ETF Trust |
Capital Group U.S. Multi-Sector Income ETF (continued)
| Bonds, notes & other debt instruments (continued) | Principal amount (000) | Value (000) | ||||||
| Corporate bonds, notes & loans (continued) | ||||||||
| Health care (continued) | ||||||||
| Teva Pharmaceutical Finance Netherlands III BV 4.10% 10/1/2046 | USD | 446 | $ | 303 | ||||
| Thermo Fisher Scientific, Inc. 5.20% 1/31/2034 | 111 | 116 | ||||||
| UnitedHealth Group, Inc. 2.90% 5/15/2050 | 180 | 126 | ||||||
| 24,271 | ||||||||
| Industrials 6.14% | ||||||||
| American Airlines, Inc. 8.50% 5/15/20291 | 525 | 555 | ||||||
| Boeing Co. 5.15% 5/1/2030 | 1,250 | 1,273 | ||||||
| Boeing Co. 3.625% 2/1/2031 | 200 | 186 | ||||||
| Boeing Co. 3.60% 5/1/2034 | 100 | 88 | ||||||
| Boeing Co. 5.705% 5/1/2040 | 480 | 497 | ||||||
| Boeing Co. 5.93% 5/1/2060 | 680 | 705 | ||||||
| Bombardier, Inc. 7.125% 6/15/20261 | 218 | 217 | ||||||
| Bombardier, Inc. 7.875% 4/15/20271 | 601 | 602 | ||||||
| Bombardier, Inc. 6.00% 2/15/20281 | 300 | 293 | ||||||
| Bombardier, Inc. 7.50% 2/1/20291 | 825 | 839 | ||||||
| Bombardier, Inc. 8.75% 11/15/20301 | 849 | 905 | ||||||
| Burlington Northern Santa Fe, LLC 5.20% 4/15/2054 | 960 | 1,000 | ||||||
| BWX Technologies, Inc. 4.125% 4/15/20291 | 325 | 297 | ||||||
| Canadian National Railway Co. 6.125% 11/1/2053 | 126 | 151 | ||||||
| Canadian Pacific Railway Co. 3.10% 12/2/2051 | 150 | 109 | ||||||
| Carrier Global Corp. 2.722% 2/15/2030 | 68 | 61 | ||||||
| Carrier Global Corp. 2.70% 2/15/2031 | 68 | 59 | ||||||
| Carrier Global Corp. 5.90% 3/15/20341 | 315 | 341 | ||||||
| Carrier Global Corp. 3.577% 4/5/2050 | 155 | 121 | ||||||
| Carrier Global Corp. 6.20% 3/15/20541 | 402 | 465 | ||||||
| Clarivate Science Holdings Corp. 3.875% 7/1/20281 | 340 | 321 | ||||||
| Clean Harbors, Inc. 6.375% 2/1/20311 | 45 | 46 | ||||||
| CoreLogic, Inc. 4.50% 5/1/20281 | 720 | 631 | ||||||
| Covanta Holding Corp. 4.875% 12/1/20291 | 140 | 122 | ||||||
| CSX Corp. 2.50% 5/15/2051 | 220 | 142 | ||||||
| Dun & Bradstreet Corp. (The) 5.00% 12/15/20291 | 330 | 308 | ||||||
| Enviri Corp. 5.75% 7/31/20271 | 155 | 145 | ||||||
| Icahn Enterprises, LP 4.75% 9/15/2024 | 271 | 270 | ||||||
| Icahn Enterprises, LP 6.375% 12/15/2025 | 210 | 206 | ||||||
| Icahn Enterprises, LP 6.25% 5/15/2026 | 519 | 496 | ||||||
| Icahn Enterprises, LP 9.75% 1/15/20291 | 425 | 434 | ||||||
| Lima Metro Line 2 Finance, Ltd. 5.875% 7/5/2034 | 138 | 136 | ||||||
| Moog, Inc. 4.25% 12/9/20271 | 166 | 157 | ||||||
| Norfolk Southern Corp. 5.05% 8/1/2030 | 57 | 58 | ||||||
| Norfolk Southern Corp. 4.45% 3/1/2033 | 15 | 15 | ||||||
| Norfolk Southern Corp. 5.35% 8/1/2054 | 983 | 1,023 | ||||||
| PM General Purchaser, LLC 9.50% 10/1/20281 | 230 | 234 | ||||||
| Regal Rexnord Corp. 6.30% 2/15/20301 | 563 | 578 | ||||||
| Regal Rexnord Corp. 6.40% 4/15/20331 | 805 | 840 | ||||||
| Ritchie Bros. Holdings, Inc. 6.75% 3/15/20281 | 160 | 165 | ||||||
| Ritchie Bros. Holdings, Inc. 7.75% 3/15/20311 | 508 | 542 | ||||||
| RTX Corp. 5.15% 2/27/2033 | 250 | 255 | ||||||
| RTX Corp. 6.10% 3/15/2034 | 269 | 292 | ||||||
| RTX Corp. 6.40% 3/15/2054 | 561 | 650 | ||||||
| Sensata Technologies BV 4.00% 4/15/20291 | 750 | 698 | ||||||
| Spirit AeroSystems, Inc. 4.60% 6/15/2028 | 597 | 529 | ||||||
| Spirit AeroSystems, Inc. 9.375% 11/30/20291 | 640 | 701 | ||||||
| Spirit AeroSystems, Inc. 9.75% 11/15/20301 | 285 | 307 | ||||||
| SRS Distribution, Inc. 6.125% 7/1/20291 | 75 | 71 | ||||||
| Stericycle, Inc. 3.875% 1/15/20291 | 465 | 422 | ||||||
| TK Elevator Holdco GmbH 7.625% 7/15/20281 | 300 | 295 | ||||||
| TransDigm, Inc. 6.25% 3/15/20261 | 445 | 445 | ||||||
| TransDigm, Inc. 6.75% 8/15/20281 | 350 | 359 | ||||||
| TransDigm, Inc. 4.625% 1/15/2029 | 475 | 446 | ||||||
| Triumph Group, Inc. 9.00% 3/15/20281 | 735 | 782 | ||||||
| Uber Technologies, Inc. 8.00% 11/1/20261 | 345 | 352 | ||||||
| Capital Group Fixed Income ETF Trust | 87 |
Capital Group U.S. Multi-Sector Income ETF (continued)
| Bonds, notes & other debt instruments (continued) | Principal amount (000) | Value (000) | ||||||
| Corporate bonds, notes & loans (continued) | ||||||||
| Industrials (continued) | ||||||||
| Union Pacific Corp. 2.95% 3/10/2052 | USD | 308 | $ | 219 | ||||
| United Rentals (North America), Inc. 5.25% 1/15/2030 | 385 | 380 | ||||||
| WESCO Distribution, Inc. 7.25% 6/15/20281 | 435 | 447 | ||||||
| 23,283 | ||||||||
| Communication services 5.83% | ||||||||
| AT&T, Inc. 2.25% 2/1/2032 | 165 | 137 | ||||||
| AT&T, Inc. 3.50% 9/15/2053 | 600 | 436 | ||||||
| AT&T, Inc. 3.55% 9/15/2055 | 240 | 173 | ||||||
| CCO Holdings, LLC 4.25% 2/1/20311 | 420 | 368 | ||||||
| CCO Holdings, LLC 4.75% 2/1/20321 | 275 | 243 | ||||||
| CCO Holdings, LLC 4.50% 5/1/2032 | 105 | 90 | ||||||
| CCO Holdings, LLC 4.50% 6/1/20331 | 750 | 636 | ||||||
| CCO Holdings, LLC 4.25% 1/15/20341 | 1,385 | 1,127 | ||||||
| Charter Communications Operating, LLC 2.30% 2/1/2032 | 510 | 406 | ||||||
| Charter Communications Operating, LLC 4.40% 4/1/2033 | 75 | 69 | ||||||
| Charter Communications Operating, LLC 3.70% 4/1/2051 | 1,970 | 1,283 | ||||||
| Charter Communications Operating, LLC 5.25% 4/1/2053 | 875 | 734 | ||||||
| Comcast Corp. 4.80% 5/15/2033 | 325 | 329 | ||||||
| Comcast Corp. 2.887% 11/1/2051 | 900 | 609 | ||||||
| Comcast Corp. 5.35% 5/15/2053 | 400 | 414 | ||||||
| Connect Finco SARL 6.75% 10/1/20261 | 430 | 428 | ||||||
| DIRECTV Financing, LLC 5.875% 8/15/20271 | 625 | 588 | ||||||
| DISH DBS Corp. 5.875% 11/15/2024 | 805 | 756 | ||||||
| DISH DBS Corp. 7.75% 7/1/2026 | 125 | 87 | ||||||
| DISH Network Corp. 11.75% 11/15/20271 | 710 | 742 | ||||||
| Frontier Communications Holdings, LLC 6.75% 5/1/20291 | 690 | 618 | ||||||
| Frontier Communications Holdings, LLC 5.875% 11/1/2029 | 675 | 571 | ||||||
| Gray Escrow II, Inc. 5.375% 11/15/20311 | 1,171 | 885 | ||||||
| Gray Television, Inc. 5.875% 7/15/20261 | 25 | 24 | ||||||
| Gray Television, Inc. 4.75% 10/15/20301 | 452 | 341 | ||||||
| Lamar Media Corp. 3.625% 1/15/2031 | 821 | 730 | ||||||
| Meta Platforms, Inc. 3.85% 8/15/2032 | 415 | 395 | ||||||
| Meta Platforms, Inc. 4.45% 8/15/2052 | 345 | 317 | ||||||
| Netflix, Inc. 4.875% 4/15/2028 | 345 | 350 | ||||||
| Netflix, Inc. 5.875% 11/15/2028 | 12 | 13 | ||||||
| Netflix, Inc. 5.375% 11/15/20291 | 167 | 173 | ||||||
| News Corp. 3.875% 5/15/20291 | 280 | 258 | ||||||
| Nexstar Media, Inc. 4.75% 11/1/20281 | 900 | 830 | ||||||
| Sirius XM Radio, Inc. 4.00% 7/15/20281 | 175 | 162 | ||||||
| Sirius XM Radio, Inc. 4.125% 7/1/20301 | 245 | 219 | ||||||
| Sirius XM Radio, Inc. 3.875% 9/1/20311 | 1,360 | 1,165 | ||||||
| Tencent Holdings, Ltd. 3.24% 6/3/2050 | 665 | 444 | ||||||
| Tencent Holdings, Ltd. 3.24% 6/3/20501 | 165 | 110 | ||||||
| Tencent Holdings, Ltd. 3.84% 4/22/2051 | 310 | 232 | ||||||
| T-Mobile USA, Inc. 2.55% 2/15/2031 | 100 | 86 | ||||||
| T-Mobile USA, Inc. 5.05% 7/15/2033 | 37 | 37 | ||||||
| T-Mobile USA, Inc. 5.75% 1/15/2034 | 400 | 424 | ||||||
| T-Mobile USA, Inc. 3.40% 10/15/2052 | 100 | 73 | ||||||
| T-Mobile USA, Inc. 6.00% 6/15/2054 | 522 | 573 | ||||||
| Univision Communications, Inc. 8.00% 8/15/20281 | 115 | 119 | ||||||
| Univision Communications, Inc. 4.50% 5/1/20291 | 1,095 | 978 | ||||||
| Univision Communications, Inc. 7.375% 6/30/20301 | 1,350 | 1,348 | ||||||
| Verizon Communications, Inc. 1.75% 1/20/2031 | 150 | 123 | ||||||
| Verizon Communications, Inc. 3.55% 3/22/2051 | 310 | 239 | ||||||
| Verizon Communications, Inc. 3.875% 3/1/2052 | 24 | 19 | ||||||
| WMG Acquisition Corp. 3.875% 7/15/20301 | 687 | 622 | ||||||
| 22,133 | ||||||||
| 88 | Capital Group Fixed Income ETF Trust |
Capital Group U.S. Multi-Sector Income ETF (continued)
| Bonds, notes & other debt instruments (continued) | Principal amount (000) | Value (000) | ||||||
| Corporate bonds, notes & loans (continued) | ||||||||
| Materials 4.92% | ||||||||
| Ardagh Metal Packaging Finance PLC 4.00% 9/1/20291 | USD | 800 | $ | 678 | ||||
| ATI, Inc. 4.875% 10/1/2029 | 335 | 313 | ||||||
| ATI, Inc. 7.25% 8/15/2030 | 124 | 129 | ||||||
| Axalta Coating Systems Dutch Holding B BV 7.25% 2/15/20311 | 150 | 157 | ||||||
| Axalta Coating Systems, LLC 4.75% 6/15/20271 | 425 | 413 | ||||||
| Ball Corp. 6.875% 3/15/2028 | 240 | 249 | ||||||
| Ball Corp. 6.00% 6/15/2029 | 225 | 230 | ||||||
| BHP Billiton Finance (USA), Ltd. 4.90% 2/28/2033 | 36 | 37 | ||||||
| BHP Billiton Finance (USA), Ltd. 5.25% 9/8/2033 | 616 | 639 | ||||||
| BHP Billiton Finance (USA), Ltd. 5.50% 9/8/2053 | 686 | 749 | ||||||
| Braskem Idesa SAPI 6.99% 2/20/2032 | 475 | 279 | ||||||
| Braskem Netherlands Finance BV 8.75% 1/12/20311 | 575 | 535 | ||||||
| Braskem Netherlands Finance BV 7.25% 2/13/20331 | 750 | 632 | ||||||
| CAN-PACK Spolka Akcyjna 3.875% 11/15/20291 | 400 | 343 | ||||||
| Celanese US Holdings, LLC 6.35% 11/15/2028 | 131 | 138 | ||||||
| Celanese US Holdings, LLC 6.55% 11/15/2030 | 267 | 283 | ||||||
| Celanese US Holdings, LLC 6.379% 7/15/2032 | 460 | 487 | ||||||
| Celanese US Holdings, LLC 6.70% 11/15/2033 | 340 | 369 | ||||||
| CSN Resources SA 8.875% 12/5/20301 | 755 | 787 | ||||||
| EIDP, Inc. 4.80% 5/15/2033 | 349 | 353 | ||||||
| Element Solutions, Inc. 3.875% 9/1/20281 | 410 | 378 | ||||||
| First Quantum Minerals, Ltd. 6.875% 10/15/20271 | 770 | 655 | ||||||
| FXI Holdings, Inc. 12.25% 11/15/20261 | 745 | 665 | ||||||
| International Flavors & Fragrances, Inc. 3.468% 12/1/20501 | 905 | 620 | ||||||
| LABL, Inc. 9.50% 11/1/20281 | 526 | 532 | ||||||
| LSB Industries, Inc. 6.25% 10/15/20281 | 602 | 572 | ||||||
| Mineral Resources, Ltd. 8.125% 5/1/20271 | 420 | 427 | ||||||
| Mineral Resources, Ltd. 9.25% 10/1/20281 | 270 | 288 | ||||||
| NOVA Chemicals Corp. 8.50% 11/15/20281 | 865 | 908 | ||||||
| NOVA Chemicals Corp. 4.25% 5/15/20291 | 255 | 215 | ||||||
| Novelis Corp. 3.875% 8/15/20311 | 530 | 468 | ||||||
| OCI NV 6.70% 3/16/20331 | 605 | 618 | ||||||
| Olympus Water US Holding Corp. 9.75% 11/15/20281 | 535 | 569 | ||||||
| Sasol Financing USA, LLC 8.75% 5/3/20291 | 550 | 562 | ||||||
| SCIH Salt Holdings, Inc. 4.875% 5/1/20281 | 50 | 47 | ||||||
| SCIH Salt Holdings, Inc. 6.625% 5/1/20291 | 250 | 234 | ||||||
| Scotts Miracle-Gro Co. 4.375% 2/1/2032 | 85 | 72 | ||||||
| Sealed Air Corp. 4.00% 12/1/20271 | 250 | 235 | ||||||
| Sealed Air Corp. 6.125% 2/1/20281 | 856 | 864 | ||||||
| Summit Materials, LLC 5.25% 1/15/20291 | 308 | 298 | ||||||
| Summit Materials, LLC 7.25% 1/15/20311 | 421 | 444 | ||||||
| Trivium Packaging Finance BV 8.50% 8/15/20271 | 413 | 405 | ||||||
| Tronox, Inc. 4.625% 3/15/20291 | 654 | 580 | ||||||
| Venator Finance SARL, Term Loan, (USD-SOFR + 10.00%) 8.00% PIK and 2.00% Cash 10/10/20283,4,5 | 13 | 13 | ||||||
| Venator Finance SARL, Term Loan, (USD-SOFR + 10.00%) 8.00% PIK and 2.00% Cash 10/10/20283,4,5 | 1 | 1 | ||||||
| Warrior Met Coal, Inc. 7.875% 12/1/20281 | 185 | 184 | ||||||
| 18,654 | ||||||||
| Utilities 4.32% | ||||||||
| Aegea Finance SARL 9.00% 1/20/20311 | 598 | 636 | ||||||
| Alabama Power Co. 3.94% 9/1/2032 | 151 | 144 | ||||||
| Alabama Power Co. 5.85% 11/15/2033 | 160 | 172 | ||||||
| CenterPoint Energy Houston Electric, LLC 2.90% 7/1/2050 | 190 | 133 | ||||||
| Consumers Energy Co. 3.60% 8/15/2032 | 75 | 70 | ||||||
| Consumers Energy Co. 4.625% 5/15/2033 | 125 | 125 | ||||||
| Duke Energy Carolinas, LLC 2.45% 8/15/2029 | 75 | 67 | ||||||
| Duke Energy Carolinas, LLC 5.35% 1/15/2053 | 275 | 282 | ||||||
| Duke Energy Corp. 4.50% 8/15/2032 | 229 | 222 | ||||||
| Duke Energy Corp. 6.10% 9/15/2053 | 300 | 326 | ||||||
| Duke Energy Florida, LLC 5.875% 11/15/2033 | 90 | 97 | ||||||
| Capital Group Fixed Income ETF Trust | 89 |
Capital Group U.S. Multi-Sector Income ETF (continued)
| Bonds, notes & other debt instruments (continued) | Principal amount (000) | Value (000) | ||||||
| Corporate bonds, notes & loans (continued) | ||||||||
| Utilities (continued) | ||||||||
| Edison International 4.125% 3/15/2028 | USD | 65 | $ | 63 | ||||
| Edison International 6.95% 11/15/2029 | 95 | 103 | ||||||
| Electricité de France SA 9.125% junior subordinated perpetual bonds (5-year UST Yield Curve Rate T Note Constant Maturity + 5.411% on 6/15/2033)1,2 | 200 | 224 | ||||||
| Entergy Louisiana, LLC 2.90% 3/15/2051 | 495 | 331 | ||||||
| FirstEnergy Corp. 2.65% 3/1/2030 | 1,520 | 1,315 | ||||||
| FirstEnergy Corp. 2.25% 9/1/2030 | 555 | 468 | ||||||
| FirstEnergy Corp. 3.40% 3/1/2050 | 550 | 388 | ||||||
| FirstEnergy Transmission, LLC 4.35% 1/15/20251 | 200 | 197 | ||||||
| Georgia Power Co. 4.95% 5/17/2033 | 225 | 227 | ||||||
| NextEra Energy Capital Holdings, Inc. 2.25% 6/1/2030 | 130 | 111 | ||||||
| Oncor Electric Delivery Co., LLC 5.65% 11/15/20331 | 100 | 107 | ||||||
| Oncor Electric Delivery Co., LLC 2.70% 11/15/2051 | 355 | 235 | ||||||
| Pacific Gas and Electric Co. 3.00% 6/15/2028 | 220 | 201 | ||||||
| Pacific Gas and Electric Co. 4.55% 7/1/2030 | 74 | 70 | ||||||
| Pacific Gas and Electric Co. 3.25% 6/1/2031 | 420 | 364 | ||||||
| Pacific Gas and Electric Co. 5.90% 6/15/2032 | 565 | 575 | ||||||
| Pacific Gas and Electric Co. 6.15% 1/15/2033 | 225 | 233 | ||||||
| Pacific Gas and Electric Co. 6.40% 6/15/2033 | 225 | 237 | ||||||
| Pacific Gas and Electric Co. 3.30% 8/1/2040 | 135 | 99 | ||||||
| Pacific Gas and Electric Co. 3.50% 8/1/2050 | 1,465 | 1,014 | ||||||
| PacifiCorp 4.15% 2/15/2050 | 100 | 81 | ||||||
| PacifiCorp 3.30% 3/15/2051 | 325 | 226 | ||||||
| PacifiCorp 2.90% 6/15/2052 | 28 | 18 | ||||||
| PacifiCorp 5.35% 12/1/2053 | 600 | 578 | ||||||
| PacifiCorp 5.50% 5/15/2054 | 525 | 516 | ||||||
| PG&E Corp. 5.25% 7/1/2030 | 1,255 | 1,212 | ||||||
| Public Service Company of Colorado 3.20% 3/1/2050 | 525 | 377 | ||||||
| Public Service Company of Colorado 2.70% 1/15/2051 | 688 | 434 | ||||||
| Public Service Company of Colorado 5.25% 4/1/2053 | 75 | 75 | ||||||
| Southern California Edison Co. 5.65% 10/1/2028 | 300 | 313 | ||||||
| Southern California Edison Co. 2.50% 6/1/2031 | 255 | 219 | ||||||
| Southern California Edison Co. 3.65% 2/1/2050 | 1,247 | 967 | ||||||
| Southern California Edison Co. 2.95% 2/1/2051 | 380 | 258 | ||||||
| Talen Energy Supply, LLC 8.625% 6/1/20301 | 815 | 867 | ||||||
| Talen Energy Supply, LLC, Term Loan B, (3-month USD CME Term SOFR + 4.50%) 9.869% 5/17/20303,4 | 65 | 65 | ||||||
| Venture Global Calcasieu Pass, LLC 3.875% 8/15/20291 | 605 | 550 | ||||||
| Virginia Electric & Power 2.30% 11/15/2031 | 155 | 130 | ||||||
| Xcel Energy, Inc. 4.60% 6/1/2032 | 50 | 49 | ||||||
| Xcel Energy, Inc. 5.45% 8/15/2033 | 600 | 619 | ||||||
| 16,390 | ||||||||
| Real estate 4.05% | ||||||||
| Anywhere Real Estate Group, LLC 5.25% 4/15/20301 | 375 | 280 | ||||||
| Boston Properties, LP 2.55% 4/1/2032 | 272 | 217 | ||||||
| Boston Properties, LP 2.45% 10/1/2033 | 527 | 402 | ||||||
| Boston Properties, LP 6.50% 1/15/2034 | 495 | 523 | ||||||
| Brookfield Property REIT, Inc. 5.75% 5/15/20261 | 200 | 194 | ||||||
| Crown Castle, Inc. 5.00% 1/11/2028 | 82 | 82 | ||||||
| Crown Castle, Inc. 5.80% 3/1/2034 | 702 | 727 | ||||||
| Equinix, Inc. 2.50% 5/15/2031 | 295 | 251 | ||||||
| Highwoods Realty, LP 7.65% 2/1/2034 | 336 | 363 | ||||||
| Howard Hughes Corp. (The) 5.375% 8/1/20281 | 5 | 5 | ||||||
| Howard Hughes Corp. (The) 4.125% 2/1/20291 | 20 | 18 | ||||||
| Howard Hughes Corp. (The) 4.375% 2/1/20311 | 1,266 | 1,100 | ||||||
| Hudson Pacific Properties, LP 4.65% 4/1/2029 | 95 | 77 | ||||||
| Hudson Pacific Properties, LP 3.25% 1/15/2030 | 442 | 325 | ||||||
| Kennedy-Wilson, Inc. 4.75% 3/1/2029 | 75 | 63 | ||||||
| Kennedy-Wilson, Inc. 4.75% 2/1/2030 | 1,500 | 1,218 | ||||||
| Kennedy-Wilson, Inc. 5.00% 3/1/2031 | 1,075 | 855 | ||||||
| Kilroy Realty, LP 2.65% 11/15/2033 | 378 | 287 | ||||||
| 90 | Capital Group Fixed Income ETF Trust |
Capital Group U.S. Multi-Sector Income ETF (continued)
| Bonds, notes & other debt instruments (continued) | Principal amount (000) | Value (000) | ||||||
| Corporate bonds, notes & loans (continued) | ||||||||
| Real estate (continued) | ||||||||
| Ladder Capital Finance Holdings LLLP 4.25% 2/1/20271 | USD | 16 | $ | 15 | ||||
| Ladder Capital Finance Holdings LLLP 4.75% 6/15/20291 | 825 | 745 | ||||||
| MPT Operating Partnership, LP 5.00% 10/15/2027 | 250 | 204 | ||||||
| MPT Operating Partnership, LP 3.50% 3/15/2031 | 1,195 | 749 | ||||||
| Park Intermediate Holdings, LLC 4.875% 5/15/20291 | 883 | 818 | ||||||
| Prologis, LP 4.75% 6/15/2033 | 235 | 238 | ||||||
| Prologis, LP 5.125% 1/15/2034 | 210 | 217 | ||||||
| Public Storage Operating Co. 5.10% 8/1/2033 | 598 | 619 | ||||||
| Public Storage Operating Co. 5.35% 8/1/2053 | 643 | 672 | ||||||
| RHP Hotel Properties, LP 4.50% 2/15/20291 | 275 | 256 | ||||||
| Service Properties Trust 4.75% 10/1/2026 | 50 | 47 | ||||||
| Service Properties Trust 4.95% 2/15/2027 | 41 | 37 | ||||||
| Service Properties Trust 3.95% 1/15/2028 | 340 | 279 | ||||||
| Service Properties Trust 4.95% 10/1/2029 | 1,129 | 936 | ||||||
| Service Properties Trust 4.375% 2/15/2030 | 690 | 536 | ||||||
| Service Properties Trust 8.625% 11/15/20311 | 782 | 820 | ||||||
| Sun Communities Operating, LP 4.20% 4/15/2032 | 300 | 274 | ||||||
| VICI Properties, LP 5.125% 5/15/2032 | 891 | 869 | ||||||
| WeWork Companies, LLC 5.00% Cash and 6.00% PIK 8/15/20271,5 | 113 | 24 | ||||||
| WeWork Companies, LLC 7.00% Cash and 8.00% PIK 8/15/20271,5 | 90 | 31 | ||||||
| 15,373 | ||||||||
| Consumer staples 4.00% | ||||||||
| 7-Eleven, Inc. 1.80% 2/10/20311 | 491 | 399 | ||||||
| 7-Eleven, Inc. 2.80% 2/10/20511 | 395 | 254 | ||||||
| Altria Group, Inc. 3.70% 2/4/2051 | 651 | 459 | ||||||
| Anheuser-Busch InBev Worldwide, Inc. 5.55% 1/23/2049 | 100 | 108 | ||||||
| B&G Foods, Inc. 5.25% 4/1/2025 | 15 | 15 | ||||||
| B&G Foods, Inc. 5.25% 9/15/2027 | 150 | 136 | ||||||
| B&G Foods, Inc. 8.00% 9/15/20281 | 590 | 620 | ||||||
| BAT Capital Corp. 6.421% 8/2/2033 | 307 | 321 | ||||||
| BAT Capital Corp. 3.984% 9/25/2050 | 1,485 | 1,047 | ||||||
| BAT Capital Corp. 7.081% 8/2/2053 | 1,728 | 1,849 | ||||||
| Central Garden & Pet Co. 4.125% 4/30/20311 | 555 | 491 | ||||||
| Constellation Brands, Inc. 2.25% 8/1/2031 | 730 | 614 | ||||||
| Constellation Brands, Inc. 4.75% 5/9/2032 | 93 | 93 | ||||||
| Constellation Brands, Inc. 4.90% 5/1/2033 | 20 | 20 | ||||||
| Coty, Inc. 6.625% 7/15/20301 | 455 | 468 | ||||||
| Darling Ingredients, Inc. 6.00% 6/15/20301 | 650 | 651 | ||||||
| Energizer Holdings, Inc. 4.375% 3/31/20291 | 513 | 460 | ||||||
| Ingles Markets, Inc. 4.00% 6/15/20311 | 510 | 451 | ||||||
| J. M. Smucker Co. (The) 6.20% 11/15/2033 | 224 | 244 | ||||||
| J. M. Smucker Co. (The) 6.50% 11/15/2043 | 132 | 147 | ||||||
| J. M. Smucker Co. (The) 6.50% 11/15/2053 | 290 | 335 | ||||||
| Kronos Acquisition Holdings, Inc. 5.00% 12/31/20261 | 50 | 49 | ||||||
| Kronos Acquisition Holdings, Inc. 7.00% 12/31/20271 | 210 | 201 | ||||||
| Minerva Luxembourg SA 8.875% 9/13/20331 | 772 | 818 | ||||||
| Performance Food Group, Inc. 4.25% 8/1/20291 | 166 | 152 | ||||||
| Philip Morris International, Inc. 5.75% 11/7/2032 | 625 | 656 | ||||||
| Philip Morris International, Inc. 5.375% 2/15/2033 | 1,100 | 1,129 | ||||||
| Philip Morris International, Inc. 5.625% 9/7/2033 | 586 | 612 | ||||||
| Post Holdings, Inc. 4.625% 4/15/20301 | 860 | 792 | ||||||
| Prestige Brands, Inc. 3.75% 4/1/20311 | 445 | 390 | ||||||
| Simmons Foods, Inc. 4.625% 3/1/20291 | 350 | 303 | ||||||
| Target Corp. 4.80% 1/15/2053 | 410 | 407 | ||||||
| TreeHouse Foods, Inc. 4.00% 9/1/2028 | 205 | 182 | ||||||
| US Foods, Inc. 4.625% 6/1/20301 | 45 | 42 | ||||||
| Walmart, Inc. 4.10% 4/15/2033 | 250 | 248 | ||||||
| 15,163 | ||||||||
| Capital Group Fixed Income ETF Trust | 91 |
Capital Group U.S. Multi-Sector Income ETF (continued)
| Bonds, notes & other debt instruments (continued) | Principal amount (000) | Value (000) | ||||||
| Corporate bonds, notes & loans (continued) | ||||||||
| Information technology 1.80% | ||||||||
| Broadcom, Inc. 2.60% 2/15/20331 | USD | 116 | $ | 96 | ||||
| Broadcom, Inc. 3.469% 4/15/20341 | 1,405 | 1,223 | ||||||
| Broadcom, Inc. 4.926% 5/15/20371 | 275 | 266 | ||||||
| Cloud Software Group, Inc. 6.50% 3/31/20291 | 775 | 739 | ||||||
| Cloud Software Group, Inc. 9.00% 9/30/20291 | 1,222 | 1,163 | ||||||
| CommScope Technologies, LLC 6.00% 6/15/20251 | 196 | 160 | ||||||
| CommScope, Inc. 6.00% 3/1/20261 | 63 | 56 | ||||||
| CommScope, Inc. 8.25% 3/1/20271 | 98 | 52 | ||||||
| CommScope, Inc. 7.125% 7/1/20281 | 55 | 26 | ||||||
| CommScope, Inc. 4.75% 9/1/20291 | 100 | 67 | ||||||
| CommScope, Inc., Term Loan B, (3-month USD CME Term SOFR + 3.25%) 8.72% 4/6/20263,4 | 60 | 54 | ||||||
| Diebold Nixdorf, Inc., Term Loan, (3-month USD CME Term SOFR + 7.00%) 12.86% 10/2/20281,3,4 | 192 | 198 | ||||||
| Finastra USA, Inc., Term Loan B, (3-month USD CME Term SOFR + 7.25%) 12.713% 9/13/20293,4,6 | 273 | 269 | ||||||
| Finastra USA, Inc., Term Loan, (3-month USD CME Term SOFR + 7.25%) 12.61% 9/13/20293,4,6 | 7 | 7 | ||||||
| Gartner, Inc. 3.75% 10/1/20301 | 403 | 357 | ||||||
| NCR Atleos Corp. 9.50% 4/1/20291 | 700 | 744 | ||||||
| Oracle Corp. 5.55% 2/6/2053 | 750 | 751 | ||||||
| ServiceNow, Inc. 1.40% 9/1/2030 | 120 | 99 | ||||||
| SK hynix, Inc. 6.50% 1/17/2033 | 200 | 211 | ||||||
| Tibco Software, Inc., Term Loan A, (3-month USD CME Term SOFR + 4.50%) 9.948% 9/29/20283,4 | 198 | 194 | ||||||
| Wolfspeed, Inc. 9.875% 6/23/2030 (10.875% on 6/23/2026)2,6,7 | 110 | 112 | ||||||
| 6,844 | ||||||||
| Total corporate bonds, notes & loans | 268,326 | |||||||
| Mortgage-backed obligations 11.32% | ||||||||
| Commercial mortgage-backed securities 10.18% | ||||||||
| 3650R Commercial Mortgage Trust, Series 2022-PF2, Class B, 5.29% 11/15/20558 | 634 | 560 | ||||||
| Bank Commercial Mortgage Trust, Series 2022-BNK44, Class B, 5.745% 11/15/20328 | 556 | 523 | ||||||
| Bank Commercial Mortgage Trust, Series 2022-BNK44, Class C, 5.745% 11/15/20328 | 500 | 420 | ||||||
| Bank Commercial Mortgage Trust, Series 2023-BNK45, Class B, 6.148% 2/15/20568 | 375 | 381 | ||||||
| Bank Commercial Mortgage Trust, Series 2023-BNK45, Class C, 6.279% 2/15/20568 | 102 | 94 | ||||||
| Bank Commercial Mortgage Trust, Series 2023-5YR1, Class B, 6.411% 3/15/20568 | 745 | 718 | ||||||
| Bank Commercial Mortgage Trust, Series 2023-5YR2, Class AS, 7.14% 6/15/20288 | 267 | 279 | ||||||
| Bank Commercial Mortgage Trust, Series 2023-5YR2, Class C, 7.164% 7/15/20288 | 458 | 439 | ||||||
| Bank Commercial Mortgage Trust, Series 2023-BNK46, Class B, 6.773% 8/15/20568 | 712 | 749 | ||||||
| Bank Commercial Mortgage Trust, Series 2023-BNK46, Class C, 6.773% 8/15/20568 | 493 | 465 | ||||||
| Bank Commercial Mortgage Trust, Series 2023-5YR4, Class B, 7.785% 12/15/20568 | 598 | 627 | ||||||
| Barclays Commercial Mortgage Securities, LLC, Series 2018-TALL, Class A, ((1-month USD CME Term SOFR + 0.047%) + 0.872%) 6.281% 3/15/20371,8 | 100 | 93 | ||||||
| Barclays Commercial Mortgage Securities, LLC, Series 2022-C18, Class C, 6.149% 12/15/20558 | 1,008 | 892 | ||||||
| Barclays Commercial Mortgage Securities, LLC, Series 2023-C19, Class AS, 6.07% 4/15/20568 | 148 | 151 | ||||||
| Barclays Commercial Mortgage Securities, LLC, Series 2023-C19, Class B, 6.333% 4/15/20568 | 150 | 151 | ||||||
| Barclays Commercial Mortgage Securities, LLC, Series 2023-C19, Class C, 6.385% 4/15/20568 | 198 | 178 | ||||||
| Barclays Commercial Mortgage Securities, LLC, Series 2023-C20, Class C, 6.608% 7/15/20568 | 470 | 438 | ||||||
| Benchmark Mortgage Trust, Series 2023-V2, Class B, 6.769% 5/15/20508 | 999 | 1,016 | ||||||
| Benchmark Mortgage Trust, Series 2023-V2, Class C, 6.769% 5/15/20558 | 742 | 712 | ||||||
| Benchmark Mortgage Trust, Series 2023-B38, Class AM, 6.12% 4/15/20568 | 226 | 231 | ||||||
| Benchmark Mortgage Trust, Series 2023-B38, Class C, 6.245% 4/15/20568 | 499 | 424 | ||||||
| Benchmark Mortgage Trust, Series 2023-B38, Class B, 6.245% 4/15/20568 | 499 | 503 | ||||||
| Benchmark Mortgage Trust, Series 2023-V3, Class B, 6.924% 7/15/20568 | 500 | 510 | ||||||
| Benchmark Mortgage Trust, Series 2023-V3, Class C, 7.173% 7/15/20568 | 881 | 853 | ||||||
| Benchmark Mortgage Trust, Series 2023-B40, Class B, 6.58% 12/15/20568 | 893 | 932 | ||||||
| 92 | Capital Group Fixed Income ETF Trust |
Capital Group U.S. Multi-Sector Income ETF (continued)
| Bonds, notes & other debt instruments (continued) | Principal amount (000) | Value (000) | ||||||
| Mortgage-backed obligations (continued) | ||||||||
| Commercial mortgage-backed securities (continued) | ||||||||
| BMO Mortgage Trust, Series 2023-C5, Class B, 6.476% 6/15/20568 | USD | 312 | $ | 323 | ||||
| BMO Mortgage Trust, Series 2023-C5, Class C, 6.627% 6/15/20568 | 166 | 159 | ||||||
| BMO Mortgage Trust, Series 2023-5C1, Class B, 6.96% 8/15/20568 | 1,052 | 1,072 | ||||||
| BMO Mortgage Trust, Series 2023-5C1, Class C, 7.118% 8/15/20568 | 403 | 388 | ||||||
| BMO Mortgage Trust, Series 2023-C6, Class B, 6.636% 9/15/20568 | 520 | 539 | ||||||
| BX Trust, Series 2021-VOLT, Class D, (1-month USD CME Term SOFR + 1.764%) 7.126% 9/15/20361,8 | 280 | 270 | ||||||
| BX Trust, Series 2021-VOLT, Class E, (1-month USD CME Term SOFR + 2.114%) 7.476% 9/15/20361,8 | 710 | 680 | ||||||
| BX Trust, Series 2022-AHP, Class A, (1-month USD CME Term SOFR + 0.99%) 6.352% 2/15/20391,8 | 769 | 755 | ||||||
| BX Trust, Series 2022-PSB, Class A, (1-month USD CME Term SOFR + 2.451%) 7.813% 8/15/20391,8 | 443 | 445 | ||||||
| BX Trust, Series 2022-PSB, Class C, (1-month USD CME Term SOFR + 3.697%) 9.059% 8/15/20391,8 | 221 | 222 | ||||||
| BX Trust, Series 2023-VLT2, Class D, (1-month USD CME Term SOFR + 4.774%) 10.136% 6/15/20401,8 | 1,500 | 1,508 | ||||||
| BX Trust, Series 2020-VIV4, Class A, 2.843% 3/9/20441,8 | 500 | 429 | ||||||
| BX Trust, Series 2020-VIV3, Class B, 3.544% 3/9/20441,8 | 495 | 434 | ||||||
| BX Trust, Series 2020-VIV2, Class C, 3.542% 3/9/20441,8 | 500 | 429 | ||||||
| CENT Trust 2023-CITY, Series 2023-CITY, Class B, (1-month USD CME Term SOFR + 3.15%) 8.512% 9/15/20281,8 | 958 | 965 | ||||||
| Citigroup Commercial Mortgage Trust, Series 2023-SMRT, Class D, 5.852% 6/10/20281,8 | 1,129 | 1,090 | ||||||
| Citigroup Commercial Mortgage Trust, Series 2023-SMRT, Class C, 5.852% 6/10/20281,8 | 245 | 241 | ||||||
| Citigroup Commercial Mortgage Trust, Series 2020-GC46, Class B, 3.15% 2/15/20538 | 140 | 106 | ||||||
| DATA 2023-CNTR Mortgage Trust, Series 2023-CNTR, Class D, 5.728% 8/12/20431,8 | 664 | 575 | ||||||
| DC Commercial Mortgage Trust, Series 2023-DC, Class D, 7.14% 9/10/20401,8 | 1,546 | 1,497 | ||||||
| FIVE Mortgage Trust, Series 2023-V1, Class B, 6.404% 2/10/20568 | 495 | 495 | ||||||
| FIVE Mortgage Trust, Series 2023-V1, Class C, 6.404% 2/10/20568 | 195 | 184 | ||||||
| Great Wolf Trust, Series 2019-WOLF, Class A, (1-month USD CME Term SOFR + 1.238% on 12/15/2023)1,2,8 | 243 | 242 | ||||||
| Morgan Stanley Bank of America Merrill Lynch Trust, Series 2015-C22, Class AS, 3.561% 4/15/20488 | 483 | 460 | ||||||
| Morgan Stanley Bank of America Merrill Lynch Trust, Series 2015-C24, Class AS, 4.036% 5/15/20488 | 508 | 485 | ||||||
| MSFW Commercial Mortgage Trust, Series 2023-1, Class B, 6.683% 5/15/20338 | 410 | 428 | ||||||
| MSFW Commercial Mortgage Trust, Series 2023-1, Class C, 6.683% 5/15/20338 | 283 | 267 | ||||||
| Multifamily Connecticut Avenue Securities, Series 2020-1, Class M10, (30-day Average USD-SOFR + 3.864%) 9.202% 3/25/20501,8 | 1,356 | 1,315 | ||||||
| Multifamily Connecticut Avenue Securities, Series 2023-01, Class M7, (30-day Average USD-SOFR + 4.00%) 9.337% 11/25/20531,8 | 1,510 | 1,533 | ||||||
| Multifamily Connecticut Avenue Securities, Series 2023-01, Class M10, (30-day Average USD-SOFR + 6.50%) 11.837% 11/25/20531,8 | 2,519 | 2,588 | ||||||
| ORL Trust, Series 2023-GLKS, Class C, (1-month USD CME Term SOFR + 3.651%) 8.974% 10/15/20281,8 | 983 | 985 | ||||||
| ORL Trust, Series 2023-GLKS, Class D, (1-month USD CME Term SOFR + 4.301%) 9.624% 10/15/20281,8 | 1,795 | 1,800 | ||||||
| Wells Fargo Commercial Mortgage Trust, Series 2015-C28, Class AS, 3.872% 5/15/20488 | 481 | 455 | ||||||
| Wells Fargo Commercial Mortgage Trust, Series 2015-C29, Class AS, 4.013% 6/15/20488 | 995 | 957 | ||||||
| Wells Fargo Commercial Mortgage Trust, Series 2018-C46, Class B, 4.633% 8/15/20518 | 967 | 843 | ||||||
| WMRK Commercial Mortgage Trust, Series 2022-WMRK, Class A, (1-month USD CME Term SOFR + 2.789%) 8.151% 11/15/20271,8 | 412 | 413 | ||||||
| WSTN Trust, Series 2023-MAUI, Class B, 7.018% 7/5/20371,8 | 260 | 259 | ||||||
| WSTN Trust, Series 2023-MAUI, Class C, 7.69% 8/5/20271,8 | 148 | 146 | ||||||
| WSTN Trust, Series 2023-MAUI, Class D, 8.455% 8/5/20271,8 | 321 | 319 | ||||||
| 38,640 | ||||||||
| Capital Group Fixed Income ETF Trust | 93 |
Capital Group U.S. Multi-Sector Income ETF (continued)
| Bonds, notes & other debt instruments (continued) | Principal amount (000) | Value (000) | ||||||
| Mortgage-backed obligations (continued) | ||||||||
| Collateralized mortgage-backed obligations (privately originated) 1.14% | ||||||||
| Cascade Funding Mortgage Trust, Series 2023-HB12, Class M1, 4.25% 4/25/20331,8 | USD | 224 | $ | 205 | ||||
| Cascade Funding Mortgage Trust, Series 2023-HB12, Class A, 4.25% 7/25/20261,8 | 65 | 63 | ||||||
| Connecticut Avenue Securities Trust, Series 2023-R01, Class 1M1, (30-day Average USD-SOFR + 2.40%) 7.737% 12/25/20421,8 | 858 | 875 | ||||||
| Connecticut Avenue Securities Trust, Series 2023-R04, Class 1M2, (30-day Average USD-SOFR + 3.55%) 8.887% 5/25/20431,8 | 285 | 304 | ||||||
| Freddie Mac Structured Agency Credit Risk Debt Notes, Series 2020-DNA2, Class M2, (30-day Average USD-SOFR + 1.964%) 7.302% 2/25/20501,8 | 325 | 330 | ||||||
| Freddie Mac Structured Agency Credit Risk Debt Notes, Series 2020-DNA3, Class B1, (30-day Average USD-SOFR + 5.214%) 10.552% 6/27/20501,8 | 1,014 | 1,111 | ||||||
| Freddie Mac Structured Agency Credit Risk Debt Notes, Series 2020-DNA4, Class B1, (30-day Average USD-SOFR + 6.114%) 11.452% 8/25/20501,8 | 334 | 376 | ||||||
| NewRez Warehouse Securitization Trust, Series 2021-1, Class B, (1-month USD CME Term SOFR + 1.014%) 6.37% 5/25/20551,8 | 867 | 866 | ||||||
| Tricon Residential Trust, Series 2023-SFR1, Class C, 5.10% 7/17/20401,8 | 100 | 97 | ||||||
| Tricon Residential Trust, Series 2023-SFR1, Class E, 7.977% 7/17/20401,8 | 100 | 103 | ||||||
| 4,330 | ||||||||
| Total mortgage-backed obligations | 42,970 | |||||||
| Asset-backed obligations 8.30% | ||||||||
| ACHV ABS Trust, Series 2023-2PL, Class B, 6.88% 5/20/20301,8 | 100 | 100 | ||||||
| American Credit Acceptance Receivables Trust, Series 2023-2, Class D, 6.47% 8/13/20291,8 | 347 | 346 | ||||||
| Avis Budget Rental Car Funding (AESOP), LLC, Series 2022-5, Class B, 7.09% 4/20/20271,8 | 553 | 564 | ||||||
| Avis Budget Rental Car Funding (AESOP), LLC, Series 2023-3A, Class B, 6.12% 2/22/20281,8 | 100 | 101 | ||||||
| Avis Budget Rental Car Funding (AESOP), LLC, Series 2023-3A, Class C, 7.05% 2/22/20281,8 | 187 | 189 | ||||||
| Babson CLO, Ltd., Series 2021-1, Class D, (3-month USD CME Term SOFR + 3.162%) 8.54% 4/25/20341,8 | 1,000 | 970 | ||||||
| CFG Investments, Ltd., Series 2023-1, Class A, 8.56% 7/25/20341,8 | 395 | 400 | ||||||
| Credit Acceptance Auto Loan Trust, Series 2023-3, Class B, 7.09% 10/17/20331,8 | 118 | 120 | ||||||
| Credit Acceptance Auto Loan Trust, Series 2023-3, Class C, 7.62% 12/15/20331,8 | 136 | 138 | ||||||
| Drive Auto Receivables Trust, Series 2021-3, Class B, 1.11% 5/15/20268 | 25 | 25 | ||||||
| DriveTime Auto Owner Trust, Series 2023-3, Class C, 6.40% 5/15/20291,8 | 260 | 263 | ||||||
| DriveTime Auto Owner Trust, Series 2023-3, Class D, 7.12% 5/15/20291,8 | 269 | 274 | ||||||
| Dryden Senior Loan Fund, CLO, Series 2020-78, Class D, (3-month USD CME Term SOFR + 3.262%) 8.664% 4/17/20331,8 | 2,000 | 1,975 | ||||||
| Exeter Automobile Receivables Trust, Series 2019-3, Class E, 4.00% 8/17/20261,8 | 810 | 804 | ||||||
| Exeter Automobile Receivables Trust, Series 2023-2, Class E, 9.75% 11/15/20301,8 | 212 | 219 | ||||||
| Exeter Automobile Receivables Trust, Series 2023-3, Class E, 9.98% 1/15/20311,8 | 1,014 | 1,051 | ||||||
| Exeter Automobile Receivables Trust, Series 2023-4, Class E, 9.57% 2/18/20311,8 | 1,100 | 1,130 | ||||||
| Exeter Automobile Receivables Trust, Series 2023-5, Class E, 9.58% 6/16/20311,8 | 1,351 | 1,392 | ||||||
| Flagship Credit Auto Trust, Series 2023-3, Class C, 6.01% 7/16/20291,8 | 49 | 49 | ||||||
| Flagship Credit Auto Trust, Series 2023-3, Class D, 6.58% 8/15/20291,8 | 25 | 25 | ||||||
| Flagship Credit Auto Trust, Series 2023-3, Class E, 9.74% 6/17/20301,8 | 297 | 294 | ||||||
| Ford Credit Floorplan Master Owner Trust, Series 2023-1, Class D, 6.62% 5/15/20281,8 | 584 | 582 | ||||||
| Fortress Credit BSL, Ltd., CLO, Series 2023-1, Class B1, (3-month USD CME Term SOFR + 3.00%) 8.412% 4/23/20361,8 | 250 | 251 | ||||||
| GLS Auto Receivables Trust, Series 2023-3, Class C, 6.01% 5/15/20291,8 | 75 | 76 | ||||||
| GLS Auto Receivables Trust, Series 2023-3, Class D, 6.44% 5/15/20291,8 | 68 | 68 | ||||||
| GLS Auto Receivables Trust, Series 2023-3, Class E, 9.27% 8/15/20301,8 | 950 | 969 | ||||||
| GLS Auto Receivables Trust, Series 2023-4, Class E, 9.72% 8/15/20301,8 | 1,010 | 1,037 | ||||||
| Hertz Vehicle Financing III, LLC, Series 2023-3, Class B, 6.53% 2/25/20281,8 | 203 | 207 | ||||||
| Hertz Vehicle Financing III, LLC, Series 2023-3, Class C, 7.26% 2/25/20281,8 | 300 | 305 | ||||||
| Hertz Vehicle Financing III, LLC, Series 2023-3, Class D, 9.43% 2/25/20281,8 | 472 | 478 | ||||||
| Hertz Vehicle Financing III, LLC, Series 2022-2, Class D, 5.16% 6/26/20281,8 | 478 | 430 | ||||||
| Hertz Vehicle Financing III, LLC, Series 2022-5, Class D, 6.78% 9/25/20281,8 | 500 | 470 | ||||||
| Hertz Vehicle Financing III, LLC, Series 2023-4, Class B, 6.73% 3/25/20301,8 | 233 | 241 | ||||||
| Hertz Vehicle Financing III, LLC, Series 2023-4, Class C, 7.51% 3/25/20301,8 | 1,136 | 1,180 | ||||||
| 94 | Capital Group Fixed Income ETF Trust |
Capital Group U.S. Multi-Sector Income ETF (continued)
| Bonds, notes & other debt instruments (continued) | Principal amount (000) | Value (000) | ||||||
| Asset-backed obligations (continued) | ||||||||
| Hertz Vehicle Financing III, LLC, Series 2023-4, Class D, 9.44% 3/25/20301,8 | USD | 462 | $ | 474 | ||||
| LAD Auto Receivables Trust, Series 2023-1, Class C, 6.18% 12/15/20271,8 | 273 | 274 | ||||||
| Mission Lane Credit Card Master Trust, Series 2022-B, Class C, 12.09% 1/15/20286,7,8 | 1,000 | 1,017 | ||||||
| Mission Lane Credit Card Master Trust, Series 2023-A, Class B, 8.15% 7/17/20281,8 | 615 | 616 | ||||||
| Mission Lane Credit Card Master Trust, Series 2023-A, Class C, 10.03% 7/17/20281,8 | 1,100 | 1,110 | ||||||
| Mission Lane Credit Card Master Trust, Series 2023-B, Class C, 10.44% 11/15/20281,8 | 6,312 | 6,386 | ||||||
| OnDeck Asset Securitization Trust, LLC, Series 2023-1A, Class B, 8.25% 8/19/20301,8 | 273 | 276 | ||||||
| Orion CLO, Ltd., Series 2023-1, Class C, (3-month USD CME Term SOFR + 3.25%) 8.681% 10/25/20361,8 | 467 | 468 | ||||||
| Orion CLO, Ltd., Series 2023-1, Class D, (3-month USD CME Term SOFR + 5.15%) 10.584% 10/25/20361,8 | 378 | 380 | ||||||
| Palmer Square Loan Funding, CLO, Series 2023-1, Class C, (3-month USD CME Term SOFR + 4.75%) 9.862% 7/20/20311,8 | 250 | 252 | ||||||
| Prestige Auto Receivables Trust, Series 2023-1, Class D, 6.33% 4/16/20291,8 | 273 | 272 | ||||||
| RAD CLO, Ltd., Series 2023-20, Class D, (3-month USD CME Term SOFR + 5.00%) 10.406% 7/20/20361,8 | 250 | 251 | ||||||
| Santander Drive Auto Receivables Trust, Series 2022-7, Class C, 6.69% 3/17/20318 | 149 | 152 | ||||||
| SMB Private Education Loan Trust, Series 2023-C, Class A1A, 5.67% 11/15/20521,8 | 153 | 154 | ||||||
| SMB Private Education Loan Trust, Series 2021-A, Class D1, 3.86% 1/15/20531,8 | 350 | 315 | ||||||
| SMB Private Education Loan Trust, Series 2021-A, Class D2, 3.86% 1/15/20531,8 | 167 | 150 | ||||||
| SMB Private Education Loan Trust, Series 2023-A, Class B, 5.88% 1/15/20531,8 | 415 | 411 | ||||||
| SMB Private Education Loan Trust, Series 2023-B, Class D, 7.56% 10/16/20561,8 | 1,000 | 997 | ||||||
| Stratus Static CLO, Ltd., Series 2022-3, Class B, (3-month USD CME Term SOFR + 3.05%) 8.466% 10/20/20311,8 | 500 | 501 | ||||||
| Westlake Automobile Receivables Trust, Series 2023-3, Class C, 6.02% 9/15/20281,8 | 209 | 210 | ||||||
| Westlake Automobile Receivables Trust, Series 2023-3, Class D, 6.47% 3/15/20291,8 | 116 | 116 | ||||||
| 31,505 | ||||||||
| U.S. Treasury bonds & notes 0.92% | ||||||||
| U.S. Treasury 0.92% | ||||||||
| U.S. Treasury 4.25% 12/31/2025 | 2,000 | 2,000 | ||||||
| U.S. Treasury 4.625% 9/30/2028 | 171 | 176 | ||||||
| U.S. Treasury 4.875% 10/31/20289 | 1,000 | 1,044 | ||||||
| U.S. Treasury 4.50% 11/15/2033 | 250 | 263 | ||||||
| 3,483 | ||||||||
| Municipals 0.06% | ||||||||
| Texas 0.06% | ||||||||
| Brazoria County Industrial Dev. Corp., Solid Waste Disposal Facs. Rev. Bonds (Aleon Renewable Metals, LLC Project), Series 2023, AMT, 12.00% 6/1/20431 | 200 | 202 | ||||||
| Total bonds, notes & other debt instruments (cost: $333,860,000) | 346,486 | |||||||
| Common stocks 0.06% | Shares | |||||||
| Information technology 0.02% | ||||||||
| Diebold Nixdorf, Inc.1 | 3,082 | 89 | ||||||
| Consumer discretionary 0.02% | ||||||||
| Party City Holdco, Inc.7 | 3,715 | 85 | ||||||
| Party City Holdco, Inc.1,7 | 37 | 1 | ||||||
| 86 | ||||||||
| Materials 0.02% | ||||||||
| Venator Materials PLC7,10 | 12,424,627 | 64 | ||||||
| Total common stocks (cost: $273,000) | 239 | |||||||
| Capital Group Fixed Income ETF Trust | 95 |
Capital Group U.S. Multi-Sector Income ETF (continued)
| Short-term securities 7.16% | Shares | Value (000) | ||||||
| Money market investments 7.16% | ||||||||
| Capital Group Central Cash Fund 5.44%11,12 | 271,702 | $ | 27,167 | |||||
| Total short-term securities (cost: $27,170,000) | 27,167 | |||||||
| Total investment securities 98.53% (cost: $361,303,000) | 373,892 | |||||||
| Other assets less liabilities 1.47% | 5,597 | |||||||
| Net assets 100.00% | $ | 379,489 | ||||||
Forward currency contracts
| Contract amount | Unrealized appreciation depreciation | |||||||||||||
| Currency purchased (000) | Currency sold (000) | Counterparty | Settlement date | at 12/31/2023 (000) | ||||||||||
| USD | 160 | EUR | 172 | Bank of America | 1/8/2024 | $ | (4 | ) | ||||||
| USD | 220 | EUR | 237 | Standard Chartered Bank | 1/8/2024 | (6 | ) | |||||||
| USD | 335 | EUR | 362 | HSBC Bank USA | 1/8/2024 | (8 | ) | |||||||
| $ | (18 | ) | ||||||||||||
Swap contracts
Interest rate swaps
Centrally cleared interest rate swaps
| Upfront premium | Unrealized appreciation | |||||||||||||||||||||||||
| Receive | Pay | Notional | Value at | paid | (depreciation) | |||||||||||||||||||||
| Payment | Payment | Expiration | amount | 12/31/2023 | (received) | at 12/31/2023 | ||||||||||||||||||||
| Rate | frequency | Rate | frequency | date | (000) | (000) | (000) | (000) | ||||||||||||||||||
| 5.0615% | Annual | SOFR | Annual | 9/29/2025 | USD | 39,000 | $ | 537 | $ | — | $ | 537 | ||||||||||||||
| 4.834% | Annual | SOFR | Annual | 10/19/2026 | 13,500 | 363 | — | 363 | ||||||||||||||||||
| 4.692% | Annual | SOFR | Annual | 9/29/2028 | 16,200 | 804 | — | 804 | ||||||||||||||||||
| 4.1495% | Annual | SOFR | Annual | 11/27/2028 | 3,500 | 96 | — | 96 | ||||||||||||||||||
| 3.6875% | Annual | SOFR | Annual | 12/15/2028 | 2,900 | 20 | — | 20 | ||||||||||||||||||
| 4.6415% | Annual | SOFR | Annual | 9/29/2033 | 19,500 | 1,882 | — | 1,882 | ||||||||||||||||||
| 4.407% | Annual | SOFR | Annual | 11/3/2033 | 3,000 | 233 | — | 233 | ||||||||||||||||||
| SOFR | Annual | 3.456% | Annual | 1/2/2034 | 55,000 | 39 | — | 39 | ||||||||||||||||||
| 4.5965% | Annual | SOFR | Annual | 11/2/2038 | 2,300 | 291 | — | 291 | ||||||||||||||||||
| 4.5595% | Annual | SOFR | Annual | 11/2/2043 | 1,500 | 231 | — | 231 | ||||||||||||||||||
| SOFR | Annual | 3.7685 | Annual | 12/11/2043 | 500 | (21 | ) | — | (21 | ) | ||||||||||||||||
| SOFR | Annual | 3.364 | Annual | 5/15/2049 | 10,700 | 41 | — | 41 | ||||||||||||||||||
| SOFR | Annual | 3.268 | Annual | 5/15/2049 | 750 | — | 13 | — | — | 13 | ||||||||||||||||
| 4.392% | Annual | SOFR | Annual | 9/29/2053 | 4,400 | 883 | — | 883 | ||||||||||||||||||
| SOFR | Annual | 3.2845 | Annual | 1/2/2054 | 11,700 | 50 | — | 50 | ||||||||||||||||||
| $ | 5,449 | $ | — | $ | 5,449 | |||||||||||||||||||||
| 96 | Capital Group Fixed Income ETF Trust |
Capital Group U.S. Multi-Sector Income ETF (continued)
Investments in affiliates12
| Value at 1/1/2023 (000) | Additions (000) | Reductions (000) | Net realized gain (loss) (000) | Net unrealized appreciation (depreciation) (000) | Value at 12/31/2023 (000) | Dividend or interest income (000) | ||||||||||||||||||||||
| Short-term securities 7.16% | ||||||||||||||||||||||||||||
| Money market investments 7.16% | ||||||||||||||||||||||||||||
| Capital Group Central Cash Fund 5.44%11 | $ | 20 | $ | 112,621 | $ | 85,471 | $ | — | 13 | $ | (3 | ) | $ | 27,167 | $ | 250 | ||||||||||||
Restricted securities6
| Acquisition date(s) | Cost (000) | Value (000) | Percent of net assets | |||||||||||
| Mission Lane Credit Card Master Trust, Series 2022-B, Class C, 12.09% 1/15/20287,8 | 12/6/2022 | $ | 1,000 | $ | 1,017 | .27 | % | |||||||
| Wolfspeed, Inc. 9.875% 6/23/2030 (10.875% on 6/23/2026)2,7 | 6/23/2023 | 106 | 112 | .03 | ||||||||||
| Finastra USA, Inc., Term Loan B, (3-month USD CME Term SOFR + 7.25%) 12.713% 9/13/20293,4 | 9/12/2023 | 268 | 269 | .07 | ||||||||||
| Finastra USA, Inc., Term Loan, (3-month USD CME Term SOFR + 7.25%) 12.61% 9/13/20293,4 | 9/12/2023 | 7 | 7 | .01 | ||||||||||
| $ | 1,381 | $ | 1,405 | .38 | % | |||||||||
| 1 | Acquired in a transaction exempt from registration under Rule 144A or, for commercial paper, Section 4(a)(2) of the Securities Act of 1933. May be resold in the U.S. in transactions exempt from registration, normally to qualified institutional buyers. The total value of all such securities was $181,846,000, which represented 47.92% of the net assets of the fund. |
| 2 | Step bond; coupon rate may change at a later date. |
| 3 | Loan participations and assignments; may be subject to legal or contractual restrictions on resale. The total value of all such loans was $1,251,000, which represented 0.32% of the net assets of the fund. |
| 4 | Coupon rate may change periodically. Reference rate and spread are as of the most recent information available. Some coupon rates are determined by the issuer or agent based on current market conditions; therefore, the reference rate and spread are not available. |
| 5 | Payment in kind; the issuer has the option of paying additional securities in lieu of cash. Payment methods and rates are as of the most recent payment when available. |
| 6 | Restricted security, other than Rule 144A securities or commercial paper issued pursuant to Section 4(a)(2) of the Securities Act of 1933. The total value of all such restricted securities was $1,405,000, which represented 0.38% of the net assets of the fund. |
| 7 | Value determined using significant unobservable inputs. |
| 8 | Principal payments may be made periodically. Therefore, the effective maturity date may be earlier than the stated maturity date. |
| 9 | All or a portion of this security was pledged as collateral. The total value of pledged collateral was $600,000, which represented .16% of the net assets of the fund. |
| 10 | Security did not produce income during the last 12 months. |
| 11 | Rate represents the seven-day yield at December 31, 2023. |
| 12 | Part of the same “group of investment companies” as the fund as defined under the Investment Company Act of 1940, as amended. |
| 13 | Amount less than one thousand. |
Key to abbreviation(s)
AMT = Alternative Minimum Tax
CLO = Collateralized Loan Obligations
CME = CME Group
DAC = Designated Activity Company
Dev. = Development
EUR = Euros
Facs. = Facilities
REIT = Real Estate Investment Trust
Rev. = Revenue
SOFR = Secured Overnight Financing Rate
USD = U.S. dollars
Refer to the notes to financial statements.
| Capital Group Fixed Income ETF Trust | 97 |
| Statements of assets and liabilities | |
| at December 31, 2023 | (dollars and shares in thousands, except per-share amount) |
| Core Bond ETF | Core Plus Income ETF | Municipal Income ETF | ||||||||||
| Assets: | ||||||||||||
| Investment securities, at value: | ||||||||||||
| Unaffiliated issuers | $ | 90,304 | $ | 1,541,629 | $ | 516,099 | ||||||
| Affiliated issuers | 16,276 | 422,052 | — | |||||||||
| Cash | 49 | 75 | 477 | |||||||||
| Cash collateral pledged for futures contracts | — | — | 490 | |||||||||
| Cash collateral pledged for swap contracts | — | 1 | — | |||||||||
| Cash denominated in currencies other than U.S. dollars | — | — | * | — | ||||||||
| Bilateral swaps, at value | — | 225 | — | |||||||||
| Receivables for: | ||||||||||||
| Sales of investments | 1,028 | 52,505 | — | |||||||||
| Sales of fund’s shares | 11,084 | 48,967 | 1,622 | |||||||||
| Dividends and interest | 695 | 11,932 | 5,525 | |||||||||
| Variation margin on futures contracts | 24 | 3,824 | 51 | |||||||||
| Variation margin on centrally cleared swap contracts | — | 3,281 | — | |||||||||
| 119,460 | 2,084,491 | 524,264 | ||||||||||
| Liabilities: | ||||||||||||
| Unrealized depreciation on open forward currency contracts | — | 21 | — | |||||||||
| Payables for: | ||||||||||||
| Purchases of investments | 22,531 | 503,841 | 5,490 | |||||||||
| Dividends on fund’s shares | 325 | 8,617 | 1,853 | |||||||||
| Investment advisory services | 12 | 404 | 108 | |||||||||
| Variation margin on futures contract | 24 | 3,361 | — | |||||||||
| Variation margin on centrally cleared swap contracts | 3 | 3,197 | — | |||||||||
| 22,895 | 519,441 | 7,451 | ||||||||||
| Commitments and contingencies† | ||||||||||||
| Net assets at December 31, 2023 | $ | 96,565 | $ | 1,565,050 | $ | 516,813 | ||||||
| Net assets consist of: | ||||||||||||
| Capital paid in on shares of beneficial interest | $ | 93,345 | $ | 1,565,087 | $ | 501,249 | ||||||
| Total distributable earnings (accumulated loss) | 3,220 | (37 | ) | 15,564 | ||||||||
| Net assets at December 31, 2023 | $ | 96,565 | $ | 1,565,050 | $ | 516,813 | ||||||
| Shares of beneficial interest issued and outstanding (no stated par value) — unlimited shares authorized | ||||||||||||
| Net assets | $ | 96,565 | $ | 1,565,050 | $ | 516,813 | ||||||
| Shares outstanding | 3,660 | 69,064 | 19,140 | |||||||||
| Net asset value per share | $ | 26.38 | $ | 22.66 | $ | 27.00 | ||||||
| Investment securities, at cost: | ||||||||||||
| Unaffiliated issuers | $ | 87,343 | $ | 1,504,117 | $ | 499,977 | ||||||
| Affiliated issuers | 16,278 | 422,075 | — | |||||||||
| Cash denominated in currencies other than U.S. dollars, at cost | — | — | * | — | ||||||||
Refer to the end of the statements of assets and liabilities for footnote.
Refer to the notes to financial statements.
| 98 | Capital Group Fixed Income ETF Trust |
Financial statements (continued)
| Statements of assets and liabilities | |
| at December 31, 2023 (continued) | (dollars and shares in thousands, except per-share amount) |
| Short Duration Income ETF | Short Duration Municipal Income ETF | U.S. Multi-Sector Income ETF | ||||||||||
| Assets: | ||||||||||||
| Investment securities, at value: | ||||||||||||
| Unaffiliated issuers | $ | 327,248 | $ | 46,172 | $ | 346,725 | ||||||
| Affiliated issuers | 30,363 | — | 27,167 | |||||||||
| Cash | 118 | 176 | 632 | |||||||||
| Cash collateral pledged for futures contracts | 284 | 50 | — | |||||||||
| Cash collateral pledged for swap contracts | 930 | — | 2,153 | |||||||||
| Cash denominated in currencies other than U.S. dollars | — | — | — | * | ||||||||
| Bilateral swaps, at value | — | — | — | |||||||||
| Receivables for: | ||||||||||||
| Sales of investments | 12,894 | — | 4 | |||||||||
| Sales of fund’s shares | 9,148 | — | 9,689 | |||||||||
| Dividends and interest | 2,108 | 561 | 4,613 | |||||||||
| Variation margin on futures contracts | 43 | 14 | — | |||||||||
| Variation margin on centrally cleared swap contracts | 70 | — | 110 | |||||||||
| 383,206 | 46,973 | 391,093 | ||||||||||
| Liabilities: | ||||||||||||
| Unrealized depreciation on open forward currency contracts | — | — | 18 | |||||||||
| Payables for: | ||||||||||||
| Purchases of investments | 49,099 | 365 | 9,113 | |||||||||
| Dividends on fund’s shares | 1,644 | 186 | 2,364 | |||||||||
| Investment advisory services | 66 | 10 | 109 | |||||||||
| Variation margin on futures contract | — | 12 | — | |||||||||
| Variation margin on centrally cleared swap contracts | — | — | — | |||||||||
| 50,809 | 573 | 11,604 | ||||||||||
| Commitments and contingencies† | ||||||||||||
| Net assets at December 31, 2023 | $ | 332,397 | $ | 46,400 | $ | 379,489 | ||||||
| Net assets consist of: | ||||||||||||
| Capital paid in on shares of beneficial interest | $ | 331,273 | $ | 45,214 | $ | 366,693 | ||||||
| Total distributable earnings (accumulated loss) | 1,124 | 1,186 | 12,796 | |||||||||
| Net assets at December 31, 2023 | $ | 332,397 | $ | 46,400 | $ | 379,489 | ||||||
| Shares of beneficial interest issued and outstanding (no stated par value) — unlimited shares authorized | ||||||||||||
| Net assets | $ | 332,397 | $ | 46,400 | $ | 379,489 | ||||||
| Shares outstanding | 13,080 | 1,800 | 14,100 | |||||||||
| Net asset value per share | $ | 25.41 | $ | 25.78 | $ | 26.91 | ||||||
| Investment securities, at cost: | ||||||||||||
| Unaffiliated issuers | $ | 324,194 | $ | 44,965 | $ | 334,133 | ||||||
| Affiliated issuers | 30,365 | — | 27,170 | |||||||||
| Cash denominated in currencies other than U.S. dollars, at cost | — | — | — | * | ||||||||
| * | Amount less than one thousand. |
| † | Refer to Note 5 for further information on unfunded commitments. |
Refer to the notes to financial statements.
| Capital Group Fixed Income ETF Trust | 99 |
Financial statements (continued)
| Statements of operations | |
| for the year ended December 31, 2023 | (dollars in thousands) |
| Core Bond ETF1 | Core Plus Income ETF | Municipal Income ETF | ||||||||||
| Investment income: | ||||||||||||
| Income (net of non-U.S. taxes2): | ||||||||||||
| Interest from unaffiliated issuers | $ | 795 | $ | 52,735 | $ | 8,222 | ||||||
| Dividends from affiliated issuers | 104 | 12,157 | — | |||||||||
| 899 | 64,892 | 8,222 | ||||||||||
| Fees and expenses: | ||||||||||||
| Investment advisory services | 34 | 2,988 | 552 | |||||||||
| Other | — | — | 2 | |||||||||
| Total fees and expenses | 34 | 2,988 | 554 | |||||||||
| Net investment income | 865 | 61,904 | 7,668 | |||||||||
| Net realized gain (loss) and unrealized appreciation (depreciation): | ||||||||||||
| Net realized gain (loss)2 on: | ||||||||||||
| Investments in: | ||||||||||||
| Unaffiliated issuers | 43 | (19,180 | ) | (509 | ) | |||||||
| Affiliated issuers | — | 3 | (8 | ) | — | |||||||
| In-kind redemptions | — | — | 111 | |||||||||
| Futures contracts | (10 | ) | (8,565 | ) | (215 | ) | ||||||
| Swap contracts | (531 | ) | (15,815 | ) | — | |||||||
| Currency transactions | — | — | — | |||||||||
| (498 | ) | (43,568 | ) | (613 | ) | |||||||
| Net unrealized appreciation (depreciation)2 on: | ||||||||||||
| Investments in: | ||||||||||||
| Unaffiliated issuers | 2,961 | 48,825 | 14,974 | |||||||||
| Affiliated issuers | (2 | ) | (26 | ) | — | |||||||
| Futures contracts | — | 3 | (725 | ) | (66 | ) | ||||||
| Forward currency contracts | — | (21 | ) | — | ||||||||
| Swap contracts | 500 | 10,736 | — | |||||||||
| Currency translations | — | 1 | — | |||||||||
| 3,459 | 58,790 | 14,908 | ||||||||||
| Net realized gain (loss) and unrealized appreciation (depreciation) | 2,961 | 15,222 | 14,295 | |||||||||
| Net increase (decrease) in net assets resulting from operations | $ | 3,826 | $ | 77,126 | $ | 21,963 | ||||||
Refer to the end of the statements of operations for footnotes.
Refer to the notes to financial statements.
| 100 | Capital Group Fixed Income ETF Trust |
Financial statements (continued)
| Statements of operations | |
| for the year ended December 31, 2023 (continued) | (dollars in thousands) |
| Short Duration Income ETF | Short Duration Municipal Income ETF1 | U.S. Multi-Sector Income ETF | ||||||||||
| Investment income: | ||||||||||||
| Income (net of non-U.S. taxes2): | ||||||||||||
| Interest from unaffiliated issuers | $ | 12,651 | $ | 390 | $ | 13,330 | ||||||
| Dividends from affiliated issuers | 952 | — | 250 | |||||||||
| 13,603 | 390 | 13,580 | ||||||||||
| Fees and expenses: | ||||||||||||
| Investment advisory services | 597 | 25 | 638 | |||||||||
| Other | — | — | — | |||||||||
| Total fees and expenses | 597 | 25 | 638 | |||||||||
| Net investment income | 13,006 | 365 | 12,942 | |||||||||
| Net realized gain (loss) and unrealized appreciation (depreciation): | ||||||||||||
| Net realized gain (loss)2 on: | ||||||||||||
| Investments in: | ||||||||||||
| Unaffiliated issuers | (411 | ) | (12 | ) | (119 | ) | ||||||
| Affiliated issuers | (1 | ) | — | —3 | ||||||||
| In-kind redemptions | — | — | — | |||||||||
| Futures contracts | (1,550 | ) | (3 | ) | 996 | |||||||
| Swap contracts | (1,555 | ) | — | (7,940 | ) | |||||||
| Currency transactions | — | — | (1 | ) | ||||||||
| (3,517 | ) | (15 | ) | (7,064 | ) | |||||||
| Net unrealized appreciation (depreciation)2 on: | ||||||||||||
| Investments in: | ||||||||||||
| Unaffiliated issuers | 2,863 | 1,207 | 11,732 | |||||||||
| Affiliated issuers | (1 | ) | — | (3 | ) | |||||||
| Futures contracts | 309 | (3 | ) | — | ||||||||
| Forward currency contracts | — | — | (18 | ) | ||||||||
| Swap contracts | (404 | ) | — | 5,362 | ||||||||
| Currency translations | — | — | 1 | |||||||||
| 2,767 | 1,204 | 17,074 | ||||||||||
| Net realized gain (loss) and unrealized appreciation (depreciation) | (750 | ) | 1,189 | 10,010 | ||||||||
| Net increase (decrease) in net assets resulting from operations | $ | 12,256 | $ | 1,554 | $ | 22,952 | ||||||
| 1 | For the period September 26, 2023, commencement of operations, through December 31, 2023. |
| 2 | Additional information related to non-U.S. taxes is included in the notes to financial statements. |
| 3 | Amount less than one thousand. |
Refer to the notes to financial statements.
| Capital Group Fixed Income ETF Trust | 101 |
Financial statements (continued)
| Statements of changes in net assets | (dollars in thousands) |
| Core Bond ETF | Core Plus Income ETF | Municipal Income ETF | ||||||||||||||||||
| Period ended December 31, 20231 | Year ended December 31, 2023 | Period ended December 31, 20222 | Year ended December 31, 2023 | Period ended December 31, 20223 | ||||||||||||||||
| Operations: | ||||||||||||||||||||
| Net investment income | $ | 865 | $ | 61,904 | $ | 8,986 | $ | 7,668 | $ | 295 | ||||||||||
| Net realized gain (loss) | (498 | ) | (43,568 | ) | (17,448 | ) | (613 | ) | (1 | ) | ||||||||||
| Net unrealized appreciation (depreciation) | 3,459 | 58,790 | (11,088 | ) | 14,908 | 1,148 | ||||||||||||||
| Net increase (decrease) in net assets resulting from operations | 3,826 | 77,126 | (19,550 | ) | 21,963 | 1,442 | ||||||||||||||
| Distributions paid to shareholders | (606 | ) | (49,339 | ) | (8,274 | ) | (7,433 | ) | (286 | ) | ||||||||||
| Net capital share transactions | 93,345 | 1,082,435 | 482,652 | 428,667 | 72,460 | |||||||||||||||
| Total increase (decrease) in net assets | 96,565 | 1,110,222 | 454,828 | 443,197 | 73,616 | |||||||||||||||
| Net assets: | ||||||||||||||||||||
| Beginning of period | — | 454,828 | — | 73,616 | — | |||||||||||||||
| End of period | $ | 96,565 | $ | 1,565,050 | $ | 454,828 | $ | 516,813 | $ | 73,616 | ||||||||||
| Short Duration Income ETF | Short Duration Municipal Income ETF | U.S. Multi-Sector Income ETF | ||||||||||||||||||
| Year ended December 31, 2023 | Period ended December 31, 20223 | Period ended December 31, 20231 | Year ended December 31, 2023 | Period ended December 31, 20223 | ||||||||||||||||
| Operations: | ||||||||||||||||||||
| Net investment income | $ | 13,006 | $ | 387 | $ | 365 | $ | 12,942 | $ | 658 | ||||||||||
| Net realized gain (loss) | (3,517 | ) | (50 | ) | (15 | ) | (7,064 | ) | (15 | ) | ||||||||||
| Net unrealized appreciation (depreciation) | 2,767 | 257 | 1,204 | 17,074 | 946 | |||||||||||||||
| Net increase (decrease) in net assets resulting from operations | 12,256 | 594 | 1,554 | 22,952 | 1,589 | |||||||||||||||
| Distributions paid to shareholders | (11,350 | ) | (376 | ) | (368 | ) | (11,122 | ) | (623 | ) | ||||||||||
| Net capital share transactions | 242,033 | 89,240 | 45,214 | 296,844 | 69,849 | |||||||||||||||
| Total increase (decrease) in net assets | 242,939 | 89,458 | 46,400 | 308,674 | 70,815 | |||||||||||||||
| Net assets: | ||||||||||||||||||||
| Beginning of period | 89,458 | — | — | 70,815 | — | |||||||||||||||
| End of period | $ | 332,397 | $ | 89,458 | $ | 46,400 | $ | 379,489 | $ | 70,815 | ||||||||||
| 1 | For the period September 26, 2023, commencement of operations, through December 31, 2023. |
| 2 | For the period February 22, 2022, commencement of operations, through December 31, 2022. |
| 3 | For the period October 25, 2022, commencement of operations, through December 31, 2022. |
Refer to the notes to financial statements.
| 102 | Capital Group Fixed Income ETF Trust |
Notes to financial statements
1. Organization
Capital Group Fixed Income ETF Trust (the “series”) is registered under the Investment Company Act of 1940, as amended (the “1940 Act”), as an open-end management investment company. The series was organized on January 12, 2021, as a Delaware statutory trust. The series consists of four nondiversified exchange-traded funds: Capital Group Core Bond ETF (“Core Bond ETF”), Capital Group Core Plus Income ETF (“Core Plus Income ETF”), Capital Group Municipal Income ETF (“Municipal Income ETF”), Capital Group Short Duration Income ETF (“Short Duration Income ETF”), Capital Group Short Duration Municipal Income ETF (“Short Duration Municipal Income ETF”), and Capital Group U.S. Multi-Sector Income ETF (“U.S. Multi-Sector Income ETF”) (each a “fund”, or collectively, the “funds”). The funds’ fiscal year end is December 31.
The investment objective(s) for each fund are as follows:
Core Bond ETF — To provide as high a level of current income as is consistent with the preservation of capital.
Core Plus Income ETF — To provide current income and maximum total return, consistent with preservation of capital.
Municipal Income ETF — To provide a high level of current income exempt from regular federal income tax, consistent with the preservation of capital.
Short Duration Income ETF — To provide current income, consistent with a short duration profile and with the preservation of capital.
Short Duration Municipal Income ETF — To provide current income exempt from regular federal income tax, consistent with a short duration profile and with the preservation of capital.
U.S. Multi-Sector Income ETF — To provide a high level of current income. The secondary objective is to provide capital appreciation.
2. Significant accounting policies
Each fund is an investment company that applies the accounting and reporting guidance issued in Topic 946 by the U.S. Financial Accounting Standards Board. Each fund’s financial statements have been prepared to comply with U.S. generally accepted accounting principles (“U.S. GAAP”). These principles require the funds’ investment adviser to make estimates and assumptions that affect reported amounts and disclosures. Actual results could differ from those estimates. Subsequent events, if any, have been evaluated through the date of issuance in the preparation of the financial statements. The funds follow the significant accounting policies described in this section, as well as the valuation policies described in the next section on valuation.
Security transactions and related investment income — Security transactions are recorded by the funds as of the date the trades are executed with brokers. Realized gains and losses from security transactions are determined based on the specific identified cost of the securities. In the event a security is purchased with a delayed payment date, the funds will segregate liquid assets sufficient to meet their payment obligations. Dividend income is recognized on the ex-dividend date and interest income is recognized on an accrual basis. Market discounts, premiums and original issue discounts on fixed-income securities are amortized daily over the expected life of the security.
Distributions paid to shareholders — Income dividends and capital gain distributions are recorded on each fund’s ex-dividend date.
Currency translation — Assets and liabilities, including investment securities, denominated in currencies other than U.S. dollars are translated into U.S. dollars at the exchange rates supplied by one or more pricing vendors on the valuation date. Purchases and sales of investment securities and income and expenses are translated into U.S. dollars at the exchange rates on the dates of such transactions. The effects of changes in exchange rates on investment securities are included with the net realized gain or loss and net unrealized appreciation or depreciation on investments in each fund’s statement of operations. The realized gain or loss and unrealized appreciation or depreciation resulting from all other transactions denominated in currencies other than U.S. dollars are disclosed separately.
3. Valuation
Capital Research and Management Company (“CRMC”), the funds’ investment adviser, values each fund’s investments at fair value as defined by U.S. GAAP. The net asset value per share of each fund is calculated once daily as of the close of regular trading on the New York Stock Exchange, normally 4 p.m. New York time, each day the New York Stock Exchange is open.
| Capital Group Fixed Income ETF Trust | 103 |
Methods and inputs — The funds’ investment adviser uses the following methods and inputs to establish the fair value of each fund’s assets and liabilities. Use of particular methods and inputs may vary over time based on availability and relevance as market and economic conditions evolve.
Equity securities, including depositary receipts, are generally valued at the official closing price of, or the last reported sale price on, the exchange or market on which such securities are traded, as of the close of business on the day the securities are being valued or, lacking any sales, at the last available bid price. Prices for each security are taken from the principal exchange or market on which the security trades.
Fixed-income securities, including short-term securities, are generally valued at evaluated prices obtained from third-party pricing vendors. Vendors value such securities based on one or more of the inputs described in the following table. The table provides examples of inputs that are commonly relevant for valuing particular classes of fixed-income securities in which the funds are authorized to invest. However, these classifications are not exclusive, and any of the inputs may be used to value any other class of fixed-income security.
| Fixed-income class | Examples of standard inputs |
| All | Benchmark yields, transactions, bids, offers, quotations from dealers and trading systems, new issues, spreads and other relationships observed in the markets among comparable securities; and proprietary pricing models such as yield measures calculated using factors such as cash flows, financial or collateral performance and other reference data (collectively referred to as “standard inputs”) |
| Corporate bonds, notes & loans; convertible securities | Standard inputs and underlying equity of the issuer |
| Bonds & notes of governments & government agencies | Standard inputs and interest rate volatilities |
| Mortgage-backed; asset-backed obligations | Standard inputs and cash flows, prepayment information, default rates, delinquency and loss assumptions, collateral characteristics, credit enhancements and specific deal information |
| Municipal securities | Standard inputs and, for certain distressed securities, cash flows or liquidation values using a net present value calculation based on inputs that include, but are not limited to, financial statements and debt contracts |
Securities with both fixed-income and equity characteristics, or equity securities traded principally among fixed-income dealers, are generally valued in the manner described for either equity or fixed-income securities, depending on which method is deemed most appropriate by each funds’ investment adviser. The Capital Group Central Cash Fund (“CCF”), a fund within the Capital Group Central Fund Series (“Central Funds”), is valued based upon a floating net asset value, which fluctuates with changes in the value of CCF’s portfolio securities. The underlying securities are valued based on the policies and procedures in CCF’s statement of additional information. Exchange-traded futures are generally valued at the official settlement price of the exchange or market on which such instruments are traded, as of the close of business on the day the futures are being valued. Forward currency contracts are valued based on the spot and forward exchange rates obtained from a third-party pricing vendor. Swaps are generally valued using evaluated prices obtained from third-party pricing vendors who calculate these values based on market inputs that may include the yields of the indices referenced in the instrument and the relevant curve, dealer quotes, default probabilities and recovery rates, other reference data, and terms of the contract.
Securities and other assets for which representative market quotations are not readily available or are considered unreliable by each funds’ investment adviser are fair valued as determined in good faith under fair valuation guidelines adopted by each funds’ investment adviser and approved by the board of trustees as further described. The investment adviser follows fair valuation guidelines, consistent with U.S. Securities and Exchange Commission rules and guidance, to consider relevant principles and factors when making fair value determinations. The investment adviser considers relevant indications of value that are reasonably and timely available to it in determining the fair value to be assigned to a particular security, such as the type and cost of the security, restrictions on resale of the security, relevant financial or business developments of the issuer, actively traded similar or related securities, dealer or broker quotes, conversion or exchange rights on the security, related corporate actions, significant events occurring after the close of trading in the security, and changes in overall market conditions. In addition, the closing prices of equity securities that trade in markets outside U.S. time zones may be adjusted to reflect significant events that occur after the close of local trading but before the net asset value of each fund is determined. Fair valuations of investments that are not actively trading involve judgment and may differ materially from valuations that would have been used had greater market activity occurred.
| 104 | Capital Group Fixed Income ETF Trust |
Processes and structure — Each fund’s board of trustees has designated each funds’ investment adviser to make fair value determinations, subject to board oversight. The investment adviser has established a Joint Fair Valuation Committee (the “Committee”) to administer, implement and oversee the fair valuation process and to make fair value decisions. The Committee regularly reviews its own fair value decisions, as well as decisions made under its standing instructions to the investment adviser’s valuation team. The Committee reviews changes in fair value measurements from period to period, pricing vendor information and market data, and may, as deemed appropriate, update the fair valuation guidelines to better reflect the results of back testing and address new or evolving issues. Pricing decisions, processes and controls over security valuation are also subject to additional internal reviews facilitated by the investment adviser’s global risk management group. The Committee reports changes to the fair valuation guidelines to the board of trustees. Each fund’s board and audit committee also regularly review reports that describe fair value determinations and methods.
Classifications — Each funds’ investment adviser classifies each fund’s assets and liabilities into three levels based on the inputs used to value the assets or liabilities. Level 1 values are based on quoted prices in active markets for identical securities. Level 2 values are based on significant observable market inputs, such as quoted prices for similar securities and quoted prices in inactive markets. Certain securities trading outside the U.S. may transfer between Level 1 and Level 2 due to valuation adjustments resulting from significant market movements following the close of local trading. Level 3 values are based on significant unobservable inputs that reflect the investment adviser’s determination of assumptions that market participants might reasonably use in valuing the securities. The valuation levels are not necessarily an indication of the risk or liquidity associated with the underlying investment. For example, U.S. government securities are reflected as Level 2 because the inputs used to determine fair value may not always be quoted prices in an active market. The following tables present each funds’ valuation levels as of December 31, 2023 (dollars in thousands):
Core Bond ETF
| Investment securities | ||||||||||||||||
| Level 1 | Level 2 | Level 3 | Total | |||||||||||||
| Assets: | ||||||||||||||||
| Bonds, notes & other debt instruments: | ||||||||||||||||
| Mortgage-backed obligations | $ | — | $ | 36,631 | $ | — | $ | 36,631 | ||||||||
| Corporate bonds, notes & loans | — | 35,530 | — | 35,530 | ||||||||||||
| U.S. Treasury bonds & notes | — | 11,048 | — | 11,048 | ||||||||||||
| Asset-backed obligations | — | 7,095 | — | 7,095 | ||||||||||||
| Short-term securities | 16,276 | — | — | 16,276 | ||||||||||||
| Total | $ | 16,276 | $ | 90,304 | $ | — | $ | 106,580 | ||||||||
| Other investments* | ||||||||||||||||
| Level 1 | Level 2 | Level 3 | Total | |||||||||||||
| Assets: | ||||||||||||||||
| Unrealized appreciation on centrally cleared interest rate swaps | $ | — | $ | 556 | $ | — | $ | 556 | ||||||||
| Unrealized appreciation on credit default swaps | — | 7 | — | 7 | ||||||||||||
| Liabilities: | ||||||||||||||||
| Unrealized depreciation on futures contracts | — | † | — | — | — | † | ||||||||||
| Unrealized depreciation on centrally cleared interest rate swaps | — | (63 | ) | — | (63 | ) | ||||||||||
| Total | $ | — | $ | 500 | $ | — | $ | 500 | ||||||||
| * | Interest rate swaps, credit default swaps and futures contracts are not included in the investment portfolio. |
| † | Amount less than one thousand. |
| Capital Group Fixed Income ETF Trust | 105 |
Core Plus Income ETF
| Investment securities | ||||||||||||||||
| Level 1 | Level 2 | Level 3 | Total | |||||||||||||
| Assets: | ||||||||||||||||
| Bonds, notes & other debt instruments: | ||||||||||||||||
| Mortgage-backed obligations | $ | — | $ | 641,940 | $ | — | $ | 641,940 | ||||||||
| Corporate bonds, notes & loans | — | 464,092 | 814 | 464,906 | ||||||||||||
| U.S. Treasury bonds & notes | — | 301,668 | — | 301,668 | ||||||||||||
| Asset-backed obligations | — | 103,035 | 4,019 | 107,054 | ||||||||||||
| Bonds & notes of governments & government agencies outside the U.S. | — | 24,302 | — | 24,302 | ||||||||||||
| Municipals | — | 1,587 | — | 1,587 | ||||||||||||
| Common stocks | — | — | 172 | 172 | ||||||||||||
| Short-term securities | 422,052 | — | — | 422,052 | ||||||||||||
| Total | $ | 422,052 | $ | 1,536,624 | $ | 5,005 | $ | 1,963,681 | ||||||||
| Other investments* | ||||||||||||||||
| Level 1 | Level 2 | Level 3 | Total | |||||||||||||
| Assets: | ||||||||||||||||
| Unrealized appreciation on futures contracts | $ | 7,910 | $ | — | $ | — | $ | 7,910 | ||||||||
| Unrealized appreciation on centrally cleared interest rate swaps | — | 11,888 | — | 11,888 | ||||||||||||
| Unrealized appreciation on bilateral interest rate swaps | — | 225 | — | 225 | ||||||||||||
| Liabilities: | ||||||||||||||||
| Unrealized depreciation on futures contracts | (8,601 | ) | — | — | (8,601 | ) | ||||||||||
| Unrealized depreciation on open forward currency contracts | — | (21 | ) | — | (21 | ) | ||||||||||
| Unrealized depreciation on centrally cleared interest rate swaps | — | (1,190 | ) | — | (1,190 | ) | ||||||||||
| Total | $ | (691 | ) | $ | 10,902 | $ | — | $ | 10,211 | |||||||
| * | Futures contracts, forward currency contracts and interest rate swaps are not included in the investment portfolio. |
Municipal Income ETF
| Investment securities | ||||||||||||||||
| Level 1 | Level 2 | Level 3 | Total | |||||||||||||
| Assets: | ||||||||||||||||
| Bonds, notes & other debt instruments: | ||||||||||||||||
| Municipals | $ | — | $ | 482,134 | $ | — | $ | 482,134 | ||||||||
| Short-term securities | — | 33,965 | — | 33,965 | ||||||||||||
| Total | $ | — | $ | 516,099 | $ | — | $ | 516,099 | ||||||||
| Other investments* | ||||||||||||||||
| Level 1 | Level 2 | Level 3 | Total | |||||||||||||
| Assets: | ||||||||||||||||
| Unrealized appreciation on futures contracts | $ | 448 | $ | — | $ | — | $ | 448 | ||||||||
| Liabilities: | ||||||||||||||||
| Unrealized depreciation on futures contracts | (514 | ) | — | — | (514 | ) | ||||||||||
| Total | $ | (66 | ) | $ | — | $ | — | $ | (66 | ) | ||||||
| * | Futures contracts are not included in the investment portfolio. |
| 106 | Capital Group Fixed Income ETF Trust |
Short Duration Income ETF
| Investment securities | ||||||||||||||||
| Level 1 | Level 2 | Level 3 | Total | |||||||||||||
| Assets: | ||||||||||||||||
| Bonds, notes & other debt instruments: | ||||||||||||||||
| Corporate bonds, notes & loans | $ | — | $ | 155,211 | $ | — | $ | 155,211 | ||||||||
| Mortgage-backed obligations | — | 109,714 | — | 109,714 | ||||||||||||
| Asset-backed obligations | — | 61,062 | — | 61,062 | ||||||||||||
| U.S. Treasury bonds & notes | — | 1,261 | — | 1,261 | ||||||||||||
| Short-term securities | 30,363 | — | — | 30,363 | ||||||||||||
| Total | $ | 30,363 | $ | 327,248 | $ | — | $ | 357,611 | ||||||||
| Other investments* | ||||||||||||||||
| Level 1 | Level 2 | Level 3 | Total | |||||||||||||
| Assets: | ||||||||||||||||
| Unrealized appreciation on futures contracts | $ | 549 | $ | — | $ | — | $ | 549 | ||||||||
| Unrealized appreciation on centrally cleared interest rate swaps | — | 1,554 | — | 1,554 | ||||||||||||
| Liabilities: | ||||||||||||||||
| Unrealized depreciation on futures contracts | (240 | ) | — | — | (240 | ) | ||||||||||
| Unrealized depreciation on centrally cleared interest rate swaps | — | (1,891 | ) | — | (1,891 | ) | ||||||||||
| Total | $ | 309 | $ | (337 | ) | $ | — | $ | (28 | ) | ||||||
| * | Futures contracts and interest rate swaps are not included in the investment portfolio. |
Short Duration Municipal Income ETF
| Investment securities | ||||||||||||||||
| Level 1 | Level 2 | Level 3 | Total | |||||||||||||
| Assets: | ||||||||||||||||
| Bonds, notes & other debt instruments: | ||||||||||||||||
| Municipals | $ | — | $ | 43,365 | $ | — | $ | 43,365 | ||||||||
| Short-term securities | — | 2,807 | — | 2,807 | ||||||||||||
| Total | $ | — | $ | 46,172 | $ | — | $ | 46,172 | ||||||||
| Other investments* | ||||||||||||||||
| Level 1 | Level 2 | Level 3 | Total | |||||||||||||
| Assets: | ||||||||||||||||
| Unrealized appreciation on futures contracts | $ | 16 | $ | — | $ | — | $ | 16 | ||||||||
| Liabilities: | ||||||||||||||||
| Unrealized depreciation on futures contracts | (19 | ) | — | — | (19 | ) | ||||||||||
| Total | $ | (3 | ) | $ | — | $ | — | $ | (3 | ) | ||||||
| * | Futures contracts are not included in the investment portfolio. |
U.S. Multi-Sector Income ETF
| Investment securities | ||||||||||||||||
| Level 1 | Level 2 | Level 3 | Total | |||||||||||||
| Assets: | ||||||||||||||||
| Bonds, notes & other debt instruments: | ||||||||||||||||
| Corporate bonds, notes & loans | $ | — | $ | 268,214 | $ | 112 | $ | 268,326 | ||||||||
| Mortgage-backed obligations | — | 42,970 | — | 42,970 | ||||||||||||
| Asset-backed obligations | — | 30,488 | 1,017 | 31,505 | ||||||||||||
| U.S. Treasury bonds & notes | — | 3,483 | — | 3,483 | ||||||||||||
| Municipals | — | 202 | — | 202 | ||||||||||||
| Common stocks | 89 | — | 150 | 239 | ||||||||||||
| Short-term securities | 27,167 | — | — | 27,167 | ||||||||||||
| Total | $ | 27,256 | $ | 345,357 | $ | 1,279 | $ | 373,892 | ||||||||
| Capital Group Fixed Income ETF Trust | 107 |
| Other investments* | ||||||||||||||||
| Level 1 | Level 2 | Level 3 | Total | |||||||||||||
| Assets: | ||||||||||||||||
| Unrealized appreciation on open forward currency contracts | $ | — | $ | (18 | ) | $ | — | $ | (18 | ) | ||||||
| Unrealized appreciation on centrally cleared interest rate swaps | — | 5,470 | — | 5,470 | ||||||||||||
| Liabilities: | ||||||||||||||||
| Unrealized depreciation on centrally cleared interest rate swaps | — | (21 | ) | — | (21 | ) | ||||||||||
| Total | $ | — | $ | 5,431 | $ | — | $ | 5,431 | ||||||||
| * | Forward currency contracts and interest rate swaps are not included in the investment portfolio. |
4. Risk factors
Investing in each fund may involve certain risks including, but not limited to, those described below (as applicable).
Market conditions — The prices of, and the income generated by, the securities held by a fund may decline due to various factors, including events or conditions affecting the general economy or particular industries or companies; overall market changes; local, regional or global political, social or economic instability; governmental, governmental agency or central bank responses to economic conditions; changes in inflation rates; and currency exchange rate, interest rate and commodity price fluctuations.
Economies and financial markets throughout the world are highly interconnected. Events (including public health emergencies, such as the spread of infectious disease), bank failures and other circumstances in one country or region could have impacts on global economies or markets. As a result, whether or not a fund invests in securities of issuers located in or with significant exposure to the countries affected, the value and liquidity of a fund’s investments may be negatively affected by developments in other countries and regions.
Issuer risks — The prices of, and the income generated by, securities held by a fund may decline in response to various factors directly related to the issuers of such securities, including reduced demand for an issuer’s goods or services, poor management performance, major litigation, investigations or other controversies related to the issuer, changes in the issuer’s financial condition or credit rating, changes in government regulations affecting the issuer or its competitive environment and strategic initiatives and the market response to any such initiatives. An individual security may also be affected by factors relating to the industry or sector of the issuer or the securities markets as a whole, and conversely an industry or sector or the securities markets may be affected by a change in financial condition or other event affecting a single issuer.
Investing in debt instruments — The prices of, and the income generated by, bonds and other debt securities held by a fund may be affected by factors such as the interest rates, maturities and credit quality of these securities.
Rising interest rates will generally cause the prices of bonds and other debt securities to fall. Also, when interest rates rise, issuers of callable debt securities that may be prepaid at any time, such as mortgage- or other asset-backed securities, are less likely to refinance existing debt securities, causing the average life of such securities to extend. A general change in interest rates may cause investors to sell debt securities on a large scale, which could also adversely affect the price and liquidity of debt securities and could also result in increased redemptions from a fund. Falling interest rates may cause an issuer to redeem, call or refinance a debt security before its stated maturity, which may result in a fund having to reinvest the proceeds in lower yielding securities. Longer maturity debt securities generally have greater sensitivity to changes in interest rates and may be subject to greater price fluctuations than shorter maturity debt securities.
Bonds and other debt securities are also subject to credit risk, which is the possibility that the credit strength of an issuer or guarantor will weaken or be perceived to be weaker, and/or an issuer of a debt security will fail to make timely payments of principal or interest and the security will go into default. Changes in actual or perceived creditworthiness may occur quickly. A downgrade or default affecting any of a fund’s securities could cause the net asset value of a fund’s shares to decrease. Lower quality debt securities generally have higher rates of interest and may be subject to greater price fluctuations than higher quality debt securities.
| 108 | Capital Group Fixed Income ETF Trust |
Liquidity risk — Certain fund holdings may be or may become difficult or impossible to sell, particularly during times of market turmoil. Liquidity may be impacted by the lack of an active market for a holding, legal or contractual restrictions on resale, or the reduced number and capacity of market participants to make a market in such holding. Market prices for less liquid or illiquid holdings may be volatile or difficult to determine, and reduced liquidity may have an adverse impact on the market price of such holdings. Additionally, the sale of less liquid or illiquid holdings may involve substantial delays (including delays in settlement) and additional costs and a fund may be unable to sell such holdings when necessary to meet its liquidity needs or to try to limit losses, or may be forced to sell at a loss. Depending on market conditions, reduced liquidity of fund holdings may also cause a fund’s shares to trade in the market at wider bid-ask spreads or greater premiums or discounts to the fund’s NAV.
Credit and liquidity support — Changes in the credit quality of banks and financial institutions providing credit and liquidity support features with respect to securities held by a fund could cause the values of these securities to decline.
Investing in lower rated debt instruments — Lower rated bonds and other lower rated debt securities generally have higher rates of interest and involve greater risk of default or price declines due to changes in the issuer’s creditworthiness than those of higher quality debt securities. The market prices of these securities may fluctuate more than the prices of higher quality debt securities and may decline significantly in periods of general economic difficulty. These risks may be increased with respect to investments in junk bonds.
Investing in mortgage-related and other asset-backed securities — Mortgage-related securities, such as mortgage-backed securities, and other asset-backed securities, include debt obligations that represent interests in pools of mortgages or other income-bearing assets, such as consumer loans or receivables. While such securities are subject to the risks associated with investments in debt instruments generally (for example, credit, extension and interest rate risks), they are also subject to other and different risks. Mortgage-backed and other asset-backed securities are subject to changes in the payment patterns of borrowers of the underlying debt, potentially increasing the volatility of the securities and a fund’s net asset value. When interest rates fall, borrowers are more likely to refinance or prepay their debt before its stated maturity. This may result in a fund having to reinvest the proceeds in lower yielding securities, effectively reducing a fund’s income. Conversely, if interest rates rise and borrowers repay their debt more slowly than expected, the time in which the mortgage-backed and other asset-backed securities are paid off could be extended, reducing a fund’s cash available for reinvestment in higher yielding securities. Mortgage-backed securities are also subject to the risk that underlying borrowers will be unable to meet their obligations and the value of property that secures the mortgages may decline in value and be insufficient, upon foreclosure, to repay the associated loans. Investments in asset-backed securities are subject to similar risks.
Investing in securities backed by the U.S. government — Securities backed by the U.S. Treasury or the full faith and credit of the U.S. government are guaranteed only as to the timely payment of interest and principal when held to maturity. Accordingly, the current market values for these securities will fluctuate with changes in interest rates and the credit rating of the U.S. government. Notwithstanding that these securities are backed by the full faith and credit of the U.S. government, circumstances could arise that would prevent or delay the payment of interest or principal on these securities, which could adversely affect their value and cause the fund to suffer losses. Such an event could lead to significant disruptions in U.S. and global markets. Securities issued by U.S. government-sponsored entities and federal agencies and instrumentalities that are not backed by the full faith and credit of the U.S. government are neither issued nor guaranteed by the U.S. government. U.S. government securities are subject to market risk, interest rate risk and credit risk.
Investing in inflation-linked bonds — The values of inflation-linked bonds generally fluctuate in response to changes in real interest rates —i.e., rates of interest after factoring in inflation. A rise in real interest rates may cause the prices of inflation-linked securities to fall, while a decline in real interest rates may cause the prices to increase. Inflation-linked bonds may experience greater losses than other debt securities with similar durations when real interest rates rise faster than nominal interest rates. There can be no assurance that the value of an inflation-linked security will be directly correlated to changes in interest rates; for example, if interest rates rise for reasons other than inflation, the increase may not be reflected in the security’s inflation measure. Investing in inflation-linked bonds may also reduce a fund’s distributable income during periods of deflation. If prices for goods and services decline throughout the economy, the principal and income on inflation-linked securities may decline and result in losses to a fund.
Investing in future delivery contracts — A fund may enter into contracts, such as to-be-announced contracts and mortgage dollar rolls, that involve the fund selling mortgage-related securities and simultaneously contracting to repurchase similar securities for delivery at a future date at a predetermined price. This can increase a fund’s market exposure, and the market price of the securities that a fund contracts to repurchase could drop below their purchase price. While a fund can preserve and generate capital through the use of such contracts by, for example, realizing the difference between the sale price and the future purchase price, the income generated by the fund may be reduced by engaging in such transactions. In addition, these transactions increase the turnover rate of a fund.
| Capital Group Fixed Income ETF Trust | 109 |
Investing in futures contracts — In addition to the risks generally associated with investing in derivative instruments, futures contracts are subject to the creditworthiness of the clearing organizations, exchanges and futures commission merchants with which the fund transacts. Additionally, although futures require only a small initial investment in the form of a deposit of initial margin, the amount of a potential loss on a futures contract could greatly exceed the initial amount invested. While futures contracts are generally liquid instruments, under certain market conditions futures may be deemed to be illiquid. For example, a fund may be temporarily prohibited from closing out its position in a futures contract if intraday price change limits or limits on trading volume imposed by the applicable futures exchange are triggered. If a fund is unable to close out a position on a futures contract, the fund would remain subject to the risk of adverse price movements until the fund is able to close out the futures position. The ability of a fund to successfully utilize futures contracts may depend in part upon the ability of the fund’s investment adviser to accurately forecast interest rates and other economic factors and to assess and predict the impact of such economic factors on the futures in which the fund invests. If the investment adviser incorrectly forecasts economic developments or incorrectly predicts the impact of such developments on the futures in which it invests, the fund could suffer losses.
Investing in derivatives — The use of derivatives involves a variety of risks, which may be different from, or greater than, the risks associated with investing in traditional securities, such as stocks and bonds. Changes in the value of a derivative may not correlate perfectly with, and may be more sensitive to market events than, the underlying asset, rate or index, and a derivative instrument may cause a fund to lose significantly more than its initial investment. Derivatives may be difficult to value, difficult for a fund to buy or sell at an opportune time or price and difficult, or even impossible, to terminate or otherwise offset. A fund’s use of derivatives may result in losses to the fund, and investing in derivatives may reduce the fund’s returns and increase the fund’s price volatility. A fund’s counterparty to a derivative transaction (including, if applicable, the fund’s clearing broker, the derivatives exchange or the clearinghouse) may be unable or unwilling to honor its financial obligations in respect of the transaction. In certain cases, a fund may be hindered or delayed in exercising remedies against or closing out derivative instruments with a counterparty, which may result in additional losses. Derivatives are also subject to operational risk (such as documentation issues, settlement issues and systems failures) and legal risk (such as insufficient documentation, insufficient capacity or authority of a counterparty, and issues with the legality or enforceability of a contract).
Exposure to country, region, industry or sector — Subject to each fund’s investment limitations, a fund may have significant exposure to a particular country, region, industry or sector. Such exposure may cause the fund to be more impacted by risks relating to and developments affecting the country, region, industry or sector, and thus its net asset value may be more volatile, than a fund without such levels of exposure. For example, if a fund has significant exposure in a particular country, then social, economic, regulatory or other issues that negatively affect that country may have a greater impact on the fund than on a fund that is more geographically diversified.
Investing outside the U.S. — Securities of issuers domiciled outside the U.S. or with significant operations or revenues outside the U.S., and securities tied economically to countries outside the U.S. may lose value because of adverse political, social, economic or market developments in the countries or regions in which the issuers are domiciled, operate or generate revenue or to which the securities are tied economically. These securities may also lose value due to changes in foreign currency exchange rates against the U.S. dollar and/or currencies of other countries. Issuers of these securities may be more susceptible to actions of foreign governments, which could adversely impact the value of these securities. Securities markets in certain countries may be more volatile and/or less liquid than those in the U.S. Investments outside the U.S. may also be subject to different accounting practices and different regulatory, legal, auditing, financial reporting and recordkeeping standards and practices, and may be more difficult to value, than those in the U.S. In addition, the value of investments outside the U.S. may be reduced by foreign taxes. Further, there may be increased risks of delayed settlement of securities purchased or sold by a fund, which could impact the liquidity of the fund’s portfolio.
| 110 | Capital Group Fixed Income ETF Trust |
Investing in emerging markets — Investing in emerging markets may involve risks in addition to and greater than those generally associated with investing in the securities markets of developed countries. For instance, emerging market countries tend to have less developed political, economic and legal systems than those in developed countries. Accordingly, the governments of these countries may be less stable and more likely to intervene in the market economy in a manner that could adversely affect the prices of securities. Information regarding issuers in emerging markets may be limited, incomplete or inaccurate, and such issuers may not be subject to regulatory, accounting, auditing, and financial reporting and recordkeeping standards comparable to those to which issuers in more developed markets are subject. A fund’s rights with respect to its investments in emerging markets, if any, will generally be governed by local law, which may make it difficult or impossible for a fund to pursue legal remedies or to obtain and enforce judgments in local courts. In addition, the economies of these countries may be dependent on relatively few industries, may have limited access to capital and may be more susceptible to changes in local and global trade conditions and downturns in the world economy. Securities markets in these countries can also be relatively small and have substantially lower trading volumes. As a result, securities issued in these countries may be more volatile and less liquid, more vulnerable to market manipulation, and more difficult to value, than securities issued in countries with more developed economies and/or markets. Less certainty with respect to security valuations may lead to additional challenges and risks in calculating a fund’s net asset value. Additionally, emerging markets are more likely to experience problems with the clearing and settling of trades and the holding of securities by banks, agents and depositories that are less established than those in developed countries.
Currency — The prices of, and the income generated by, many debt securities held by a fund may also be affected by changes in relative currency values. If the U.S. dollar appreciates against foreign currencies, the value in U.S. dollars of a fund’s securities denominated in such currencies would generally fall and vice versa.
Investing in municipal securities — Municipal securities are debt obligations that are exempt from federal, state and/or local income taxes. The yield and/or value of a fund’s investments in municipal securities may be adversely affected by events tied to the municipal securities markets, which can be very volatile and significantly impacted by unfavorable legislative or political developments and negative changes in the financial conditions of municipal securities issuers and the economy. To the extent a fund invests in obligations of a municipal issuer, the volatility, credit quality and performance of a fund may be adversely impacted by local political and economic conditions of the issuer. For example, a credit rating downgrade, bond default or bankruptcy involving an issuer within a particular state or territory could affect the market values and marketability of many or all municipal obligations of that state or territory. Income from municipal securities held by a fund could also be declared taxable because of changes in tax laws or interpretations by taxing authorities or as a result of noncompliant conduct of a municipal issuer. Additionally, the relative amount of publicly available information about municipal securities is generally less than that for corporate securities.
Investing in similar municipal bonds — Investing significantly in municipal obligations of multiple issuers in the same state or backed by revenues of similar types of projects or industries may make a fund more susceptible to certain economic, political or regulatory occurrences. As a result, a fund has greater risk of volatility, and greater risk of loss, from these investments.
Insured municipal bonds – A fund may invest in municipal bonds that are insured generally as to the timely payment of interest and repayment of principal. Insurance that covers a municipal bond does not guarantee the market value of the bond or the prices of a fund’s shares. Market conditions or changes to ratings criteria could adversely impact the ratings of municipal bond insurers. If the credit rating of the insurer were downgraded or withdrawn by rating agencies, this could have an adverse effect upon the credit rating of the insured bond and, therefore, its market value, despite the quality of the underlying issuer.
Alternative minimum tax — A fund may invest in securities that may be subject to federal alternative minimum tax. Therefore, while a fund’s distributions from tax-exempt securities are not subject to regular federal income tax, a portion or all of the distributions may be included in determining a shareholder’s federal alternative minimum tax.
Interest rate risk — The values and liquidity of the securities held by a fund may be affected by changing interest rates. For example, the values of these securities may decline when interest rates rise and increase when interest rates fall. Longer maturity debt securities generally have greater sensitivity to changes in interest rates and may be subject to greater price fluctuations than shorter maturity debt securities. A fund may invest in variable and floating rate securities. When a fund holds variable or floating rate securities, a decrease in market interest rates will adversely affect the income received from such securities and the net asset value of the fund’s shares. Although the values of such securities are generally less sensitive to interest rate changes than those of other debt securities, the value of variable and floating rate securities may decline if their interest rates do not rise as quickly, or as much, as market interest rates. Conversely, floating rate securities will not generally increase in value if interest rates decline. During periods of extremely low short-term interest rates, a fund may not be able to maintain a positive yield or total return and, in relatively low interest rate environments, there are heightened risks associated with rising interest rates.
| Capital Group Fixed Income ETF Trust | 111 |
Portfolio turnover — A fund may engage in frequent and active trading of its portfolio securities. Higher portfolio turnover may involve correspondingly greater transaction costs in the form of dealer spreads, brokerage commissions and other transaction costs on the sale of securities and on reinvestment in other securities. The sale of portfolio securities may also result in the realization of net capital gains, which are taxable when distributed to shareholders, unless the shareholder is exempt from taxation or the shareholder’s account is tax-favored. These costs and tax effects may adversely affect a fund’s returns to shareholders. A fund’s portfolio turnover rate may vary from year to year, as well as within a year.
Market trading — The funds’ shares are listed for trading on an exchange and are bought and sold on the secondary market at market prices. The market prices of fund shares are expected to fluctuate, in some cases materially, in response to changes in a fund’s net asset value (“NAV”), the intraday value of a fund’s holdings, and supply and demand for a fund’s shares. The existence of significant market volatility, disruptions to creations and redemptions, or potential lack of an active trading market for fund shares and/or for the holdings of a fund (including through a trading halt), among other factors, may result in the shares trading significantly above (at a premium) or below (at a discount) to the fund’s NAV and bid-ask spreads may widen. A bid-ask spread is the “spread” or difference between what investors are willing to pay for fund shares (the “bid” price) and the price at which the investors are willing to sell fund shares (the “ask” price). Purchasing a fund’s shares when its market price is at a premium or selling a fund’s shares when its market price is at a discount, may result in paying more than, or receiving less than, NAV, respectively.
Foreign securities held by a fund may be traded in markets that close at a different time than the exchange on which the fund’s shares are listed. Liquidity in those securities may be reduced after the applicable closing times. Accordingly, during the time when a fund’s exchange is open but after the applicable market closing, fixing or settlement times, bid-ask spreads on the fund’s exchange and the corresponding premium or discount to the fund’s NAV may widen.
Authorized participant concentration — Only authorized participants may engage in creation or redemption transactions directly with a fund, and none of them is obligated to do so. A fund has a limited number of institutions that may act as authorized participants. If authorized participants exit the business or are unable to or elect not to engage in creation or redemption transactions, and no other authorized participant engages in such function, fund shares may trade at a premium or discount to NAV and/or at wider intraday bid-ask spreads and possibly face trading halts or delisting.
Nondiversification — As nondiversified funds, each fund has the ability to invest a larger percentage of its assets in the securities of a smaller number of issuers than a diversified fund. As a result, poor performance by a single issuer could adversely affect fund performance more than if each fund were invested in a larger number of issuers. Each fund’s share price can be expected to fluctuate more than might be the case if the fund were more broadly diversified.
Cash transactions — Each fund currently expects to effect at least part of its creations and redemptions for cash rather than in-kind securities. When a fund effects redemptions partly or wholly for cash, rather than in-kind, the fund may have to sell portfolio securities at inopportune times in order to obtain the cash needed to meet redemption orders. If a fund realizes gains on these sales, the fund generally will be required to recognize a gain it might not otherwise have recognized, or to recognize such gain sooner than would otherwise be required if it were to distribute portfolio securities in-kind. This strategy may cause shareholders to be subject to tax from distributions to which they would not otherwise be subject. The use of cash creations and redemptions may also cause a fund’s shares to trade in the market at wider bid-ask spreads or greater premiums or discounts to the fund’s NAV. As a result of such cash transactions, a fund could incur brokerage costs which, to the extent not offset by transaction fees that are payable by an authorized participant, may reduce the fund’s NAV.
Management — The investment adviser to the funds actively manages the funds’ investments. Consequently, the funds are subject to the risk that the methods and analyses, including models, tools and data, employed by the investment adviser in this process may be flawed or incorrect and may not produce the desired results. This could cause the funds to lose value or their investment results to lag relevant benchmarks or other funds with similar objectives.
5. Certain investment techniques
Index-linked bonds — Some of the funds have invested in index-linked bonds, which are fixed-income securities whose principal value is periodically adjusted to a government price index. Over the life of an index-linked bond, interest is paid on the adjusted principal value. Increases or decreases in the principal value of index-linked bonds are recorded as interest income in the fund’s statement of operations.
| 112 | Capital Group Fixed Income ETF Trust |
Mortgage dollar rolls — Some of the funds have entered into mortgage dollar roll transactions of TBA securities in which the fund sells a TBA mortgage-backed security to a counterparty and simultaneously enters into an agreement with the same counterparty to buy back a similar TBA security on a specific future date at a predetermined price. Mortgage dollar rolls are accounted for as purchase and sale transactions and may result in an increase to the fund’s portfolio turnover rate. Portfolio turnover rates excluding and including mortgage dollar rolls are presented at the end of the fund’s financial highlights table.
Loan transactions — Some of the funds have entered into loan transactions in which the fund acquires a loan either through an agent, by assignment from another holder, or as a participation interest in another holder’s portion of a loan. The loan is often administered by a financial institution that acts as agent for the holders of the loan, and the fund may be required to receive approval from the agent and/or borrower prior to the sale of the investment. The loan’s interest rate and maturity date may change based on the terms of the loan, including potential early payments of principal.
Unfunded commitments — Capital Group Core Plus Income ETF and Capital Group U.S. Multi-Sector Income ETF have participated in transactions that involve unfunded commitments, which may obligate each fund to purchase new or additional bonds and/or purchase additional shares of the applicable issuer if certain contingencies are met. As of December 31, 2023, the maximum exposure from these unfunded commitments for Capital Group Core Plus Income ETF and Capital Group U.S. Multi-Sector Income ETF was $21,000 each, respectively, which would represent less than 0.01% of the net assets of each fund should such commitments become due.
Futures contracts — Some of the funds have entered into futures contracts, which provide for the future sale by one party and purchase by another party of a specified amount of a specific financial instrument for a specified price, date, time and place designated at the time the contract is made. Futures contracts are used to strategically manage the fund’s interest rate sensitivity by increasing or decreasing the duration of the fund or a portion of the fund’s portfolio.
Upon entering into futures contracts, and to maintain the fund’s open positions in futures contracts, the fund is required to deposit with a futures broker, known as a futures commission merchant (“FCM”), in a segregated account in the name of the FCM an amount of cash, U.S. government securities or other liquid securities, known as initial margin. The margin required for a particular futures contract is set by the exchange on which the contract is traded to serve as collateral, and may be significantly modified from time to time by the exchange during the term of the contract.
On a daily basis, each fund pays or receives variation margin based on the increase or decrease in the value of the futures contracts and records variation margin on futures contracts in the statement of assets and liabilities. Futures contracts may involve a risk of loss in excess of the variation margin shown on the fund’s statement of assets and liabilities. Each fund records realized gains or losses at the time the futures contract is closed or expires. Net realized gains or losses and net unrealized appreciation or depreciation from futures contracts are recorded in the fund’s statement of operations.
Forward currency contracts — Some of the funds have entered into forward currency contracts, which represent agreements to exchange currencies on specific future dates at predetermined rates. The fund’s investment adviser uses forward currency contracts to manage the fund’s exposure to changes in exchange rates. Upon entering into these contracts, risks may arise from the potential inability of counterparties to meet the terms of their contracts and from possible movements in exchange rates.
On a daily basis, the funds’ investment adviser values forward currency contracts and records unrealized appreciation or depreciation for open forward currency contracts in each fund’s statement of assets and liabilities. Realized gains or losses are recorded at the time the forward currency contract is closed or offset by another contract with the same broker for the same settlement date and currency.
Closed forward currency contracts that have not reached their settlement date are included in the respective receivables or payables for closed forward currency contracts in each fund’s statement of assets and liabilities. Net realized gains or losses from closed forward currency contracts and net unrealized appreciation or depreciation from open forward currency contracts are recorded in each fund’s statement of operations.
Swap contracts — Some of the funds have entered into swap agreements, which are two-party contracts entered into primarily by institutional investors for a specified time period. In a typical swap transaction, two parties agree to exchange the returns earned or realized from one or more underlying assets or rates of return. Swap agreements can be traded on a swap execution facility (SEF) and cleared through a central clearinghouse (cleared), traded over-the-counter (OTC) and cleared, or traded bilaterally and not cleared. Because clearing interposes a central clearinghouse as the ultimate counterparty to each participant’s swap, and margin is required to be exchanged under the rules of the clearinghouse, central clearing is intended to decrease (but not eliminate) counterparty risk relative to uncleared bilateral swaps. To the extent the funds enter into bilaterally negotiated swap transactions, the funds will enter into swap agreements only with counterparties that meet certain credit standards and subject to agreed collateralized procedures. The term of a swap can be days, months or years and certain swaps may be less liquid than others.
| Capital Group Fixed Income ETF Trust | 113 |
Upon entering into a centrally cleared swap contract, the funds are required to deposit cash, U.S. government securities or other liquid securities, which is known as initial margin. Generally, the initial margin required for a particular swap is set and held as collateral by the clearinghouse on which the contract is cleared. The amount of initial margin required may be significantly modified from time to time by the clearinghouse during the term of the contract.
On a daily basis, interest accruals related to the exchange of future payments are recorded as a receivable and payable in the funds’ statement of assets and liabilities for centrally cleared swaps and as unrealized appreciation or depreciation in the funds’ statement of assets and liabilities for bilateral swaps. For centrally cleared swaps, the fund also pays or receives a variation margin based on the increase or decrease in the value of the swaps, including accrued interest as applicable, and records variation margin in the statement of assets and liabilities. The funds record realized gains and losses on both the net accrued interest and any gain or loss recognized at the time the swap is closed or expires. Net realized gains or losses, as well as any net unrealized appreciation or depreciation, from swaps are recorded in the fund’s statement of operations.
Swap agreements can take different forms. Some of the funds have entered into the following types of swap agreements:
Interest rate swaps — Some of the funds have entered into interest rate swaps, which seek to manage the interest rate sensitivity of the fund by increasing or decreasing the duration of the fund or a portion of the funds’ portfolio. An interest rate swap is an agreement between two parties to exchange or swap payments based on changes in an interest rate or rates. Typically, one interest rate is fixed and the other is variable based on a designated short-term interest rate such as the Secured Overnight Financing Rate (SOFR), prime rate or other benchmark. In other types of interest rate swaps, known as basis swaps, the parties agree to swap variable interest rates based on different designated short-term interest rates. Interest rate swaps generally do not involve the delivery of securities or other principal amounts. Rather, cash payments are exchanged by the parties based on the application of the designated interest rates to a notional amount, which is the predetermined dollar principal of the trade upon which payment obligations are computed. Accordingly, the funds’ current obligation or right under the swap agreement is generally equal to the net amount to be paid or received under the swap agreement based on the relative value of the position held by each party.
Credit default swap indices — Some of the funds have entered into centrally cleared credit default swap indices, including CDX and iTraxx indices (collectively referred to as “CDSIs”), in order to assume exposure to a diversified portfolio of credits or to hedge against existing credit risks. A CDSI is based on a portfolio of credit default swaps with similar characteristics, such as credit default swaps on high-yield bonds. In a typical CDSI transaction, one party (the protection buyer) is obligated to pay the other party (the protection seller) a stream of periodic payments over the term of the contract. If a credit event, such as a default or restructuring, occurs with respect to any of the underlying reference obligations, the protection seller must pay the protection buyer the loss on those credits.
The funds may enter into a CDSI transaction as either protection buyer or protection seller. If the funds are protected buyers, they would pay the counterparty a periodic stream of payments over the term of the contract and would not recover any of those payments if no credit events were to occur with respect to any of the underlying reference obligations. However, if a credit event did occur, the funds, as protection buyers, would have the right to deliver the referenced debt obligations or a specified amount of cash, depending on the terms of the applicable agreement, and to receive the par value of such debt obligations from the counterparty protection seller. As protection sellers, the funds would receive fixed payments throughout the term of the contract if no credit events were to occur with respect to any of the underlying reference obligations. If a credit event were to occur, however, the value of any deliverable obligation received by the funds, coupled with the periodic payments previously received by the funds, may be less than the full notional value that the funds, as protection sellers, pays to the counterparty protection buyer, effectively resulting in a loss of value to the funds. Furthermore, as protection sellers, the funds would effectively add leverage to its portfolio because it would have investment exposure to the notional amount of the swap transaction.
| 114 | Capital Group Fixed Income ETF Trust |
The following table presents the average month-end notional amounts of futures contracts, interest rate swaps and credit default swaps while held for each fund (dollars in thousands):
| Futures contracts | Forward currency contracts | Interest rate swaps | Credit default swaps | ||||||||||
| Core Bond ETF | $ | 3,912 | Not applicable | $ | 23,340 | $575 | |||||||
| Core Plus Income ETF | 616,921 | $874 | 328,320 | 10,400 | |||||||||
| Municipal Income ETF | 29,849 | Not applicable | Not applicable | Not applicable | |||||||||
| Short Duration Income ETF | 137,023 | Not applicable | 183,200 | Not applicable | |||||||||
| Short Duration Municipal Income ETF | 1,844 | Not applicable | Not applicable | Not applicable | |||||||||
| U.S. Multi-Sector Income ETF | 65,069 | 771 | 155,750 | 9,299 | |||||||||
The following tables identify the location and fair value amounts on each fund’s statement of assets and liabilities and the effect on each fund’s statement of operations resulting from each fund’s use of futures contracts, forward currency contracts, interest rate swaps and credit default swaps as of, or for the year ended, December 31, 2023 (dollars in thousands):
Core Bond ETF
| Assets | Liabilities | |||||||||||||
| Contracts | Risk type | Location on statement of assets and liabilities | Value | Location on statement of assets and liabilities | Value | |||||||||
| Futures | Interest | Unrealized appreciation* | $ | — | † | Unrealized depreciation* | $ | — | ||||||
| Swap (centrally cleared) | Interest | Unrealized appreciation* | 556 | Unrealized depreciation* | 63 | |||||||||
| Swap (centrally cleared) | Credit | Unrealized appreciation* | 7 | Unrealized depreciation* | — | |||||||||
| $ | 563 | $ | 63 | |||||||||||
| Net realized gain (loss) | Net unrealized appreciation (depreciation) | |||||||||||||
| Contracts | Risk type | Location on statement of operations | Value | Location on statement of operations | Value | |||||||||
| Futures | Interest | Net realized loss on futures contracts | $ | (10 | ) | Net unrealized depreciation on futures contracts | $ | — | ||||||
| Swap | Interest | Net realized loss on swap contracts | (531 | ) | Net unrealized appreciation on swap contracts | 493 | ||||||||
| Swap | Credit | Net realized gain on swap contracts | — | Net unrealized appreciation on swap contracts | 7 | |||||||||
| $ | (541 | ) | $ | 500 | ||||||||||
Core Plus Income ETF
| Assets | Liabilities | |||||||||||||
| Contracts | Risk type | Location on statement of assets and liabilities | Value | Location on statement of assets and liabilities | Value | |||||||||
| Futures | Interest | Unrealized appreciation* | $ | 7,910 | Unrealized depreciation* | $ | 8,601 | |||||||
| Forward currency | Currency | Unrealized appreciation on open forward currency contracts | — | Unrealized depreciation on open forward currency contracts | 21 | |||||||||
| Swap (centrally cleared) | Interest | Unrealized appreciation* | 11,888 | Unrealized depreciation* | 1,190 | |||||||||
| Swap (bilateral) | Interest | Bilateral swaps, at value | 225 | Bilateral swaps, at value | — | |||||||||
| $ | 20,023 | $ | 9,812 | |||||||||||
Refer to the end of the tables for footnotes.
| Capital Group Fixed Income ETF Trust | 115 |
| Net realized gain (loss) | Net unrealized appreciation (depreciation) | |||||||||||||
| Contracts | Risk type | Location on statement of operations | Value | Location on statement of operations | Value | |||||||||
| Futures | Interest | Net realized loss on futures contracts | $ | (8,565 | ) | Net unrealized depreciation on futures contracts | $ | (725 | ) | |||||
| Forward currency | Currency | Net realized gain on forward currency contracts | — | Net unrealized depreciation forward currency contracts | (21 | ) | ||||||||
| Swap | Interest | Net realized loss on swap contracts | (15,815 | ) | Net unrealized appreciation on swap contracts | 10,739 | ||||||||
| Swap | Credit | Net realized gain on swap contracts | — | Net unrealized depreciation on swap contracts | (3 | ) | ||||||||
| $ | (24,380 | ) | $ | 9,990 | ||||||||||
Municipal Income ETF
| Assets | Liabilities | |||||||||||||
| Contracts | Risk type | Location on statement of assets and liabilities | Value | Location on statement of assets and liabilities | Value | |||||||||
| Futures | Interest | Unrealized appreciation* | $ | 448 | Unrealized depreciation* | $ | 514 | |||||||
| Net realized gain (loss) | Net unrealized appreciation (depreciation) | |||||||||||||
| Contracts | Risk type | Location on statement of operations | Value | Location on statement of operations | Value | |||||||||
| Futures | Interest | Net realized loss on futures contracts | $ | (215 | ) | Net unrealized depreciation on futures contracts | $ | (66 | ) | |||||
Short Duration Income ETF
| Assets | Liabilities | |||||||||||||
| Contracts | Risk type | Location on statement of assets and liabilities | Value | Location on statement of assets and liabilities | Value | |||||||||
| Futures | Interest | Unrealized appreciation* | $ | 549 | Unrealized depreciation* | $ | 240 | |||||||
| Swap (centrally cleared) | Interest | Unrealized appreciation* | 1,554 | Unrealized depreciation* | 1,891 | |||||||||
| $ | 2,103 | $ | 2,131 | |||||||||||
| Net realized gain (loss) | Net unrealized appreciation (depreciation) | |||||||||||||
| Contracts | Risk type | Location on statement of operations | Value | Location on statement of operations | Value | |||||||||
| Futures | Interest | Net realized loss on futures contracts | $ | (1,550 | ) | Net unrealized appreciation on futures contracts | $ | 309 | ||||||
| Swap | Interest | Net realized loss on swap contracts | (1,555 | ) | Net unrealized depreciation on swap contracts | (404 | ) | |||||||
| $ | (3,105 | ) | $ | (95 | ) | |||||||||
Refer to the end of the tables for footnotes.
| 116 | Capital Group Fixed Income ETF Trust |
Short Duration Municipal Income ETF
| Assets | Liabilities | |||||||||||||
| Contracts | Risk type | Location on statement of assets and liabilities | Value | Location on statement of assets and liabilities | Value | |||||||||
| Futures | Interest | Unrealized appreciation* | $ | 16 | Unrealized depreciation* | $ | 19 | |||||||
| Net realized gain (loss) | Net unrealized appreciation (depreciation) | |||||||||||||
| Contracts | Risk type | Location on statement of operations | Value | Location on statement of operations | Value | |||||||||
| Futures | Interest | Net realized loss on futures contracts | $ | (3 | ) | Net unrealized depreciation on futures contracts | $ | (3 | ) | |||||
U.S. Multi-Sector Income ETF
| Assets | Liabilities | |||||||||||||
| Contracts | Risk type | Location on statement of assets and liabilities | Value | Location on statement of assets and liabilities | Value | |||||||||
| Forward currency | Currency | Unrealized appreciation on open forward currency contracts | $ | — | Unrealized depreciation on open forward currency contracts | $ | 18 | |||||||
| Swap (centrally cleared) | Interest | Unrealized appreciation* | 5,470 | Unrealized depreciation* | 21 | |||||||||
| $ | 5,470 | $ | 39 | |||||||||||
| Net realized gain (loss) | Net unrealized appreciation (depreciation) | |||||||||||||
| Contracts | Risk type | Location on statement of operations | Value | Location on statement of operations | Value | |||||||||
| Futures | Interest | Net realized gain on futures contracts | $ | 996 | Net unrealized depreciation on futures contracts | $ | — | |||||||
| Forward currency | Currency | Net realized gain on forward currency contracts | — | Net unrealized depreciation forward currency contracts | (18 | ) | ||||||||
| Swap | Interest | Net realized loss on swap contracts | (7,940 | ) | Net unrealized appreciation on swap contracts | 5,382 | ||||||||
| Swap | Credit | Net realized gain on swap contracts | — | Net unrealized depreciation on swap contracts | (20 | ) | ||||||||
| $ | (6,944 | ) | $ | 5,344 | ||||||||||
| * | Includes cumulative appreciation/depreciation on futures contracts, centrally cleared interest rate swaps and/or centrally cleared credit default swaps as reported in the applicable tables following each fund’s investment portfolio. Only current day’s variation margin is reported within each fund’s statement of assets and liabilities. |
| † | Amount less than one thousand. |
Collateral — Some funds either receive or pledge highly liquid assets, such as cash or U.S. government securities, as collateral due to their use of futures contracts, forward currency contracts, interest rate swaps, credit default swaps and/or future delivery contracts. For futures contracts, centrally cleared interest rate swaps and centrally cleared credit default swaps, the program calls for each participating fund to pledge collateral for initial and variation margin by contract. For forward currency contracts and bilateral sawps, the program calls for each participating fund to either receive or pledge collateral based on the net gain or loss on unsettled contracts by counterparty. For future delivery contracts, the program calls for each participating fund to either receive or pledge collateral based on the net gain or loss on unsettled contracts by certain counterparties. The purpose of the collateral is to cover potential losses that could occur in the event that either party cannot meet its contractual obligation. Non-cash collateral pledged by each participating fund, if any, is disclosed in each fund’s investment portfolio, and cash collateral pledged by each participating fund, if any, is held in a segregated account with the fund’s custodian, which is reflected as pledged cash collateral in each fund’s statement of assets and liabilities.
| Capital Group Fixed Income ETF Trust | 117 |
Rights of offset — Funds that hold forward currency contracts and/or bilateral interest rate swaps have enforceable master netting agreements with certain counterparties, where amounts payable by each party to the other in the same currency (with the same settlement date and with the same counterparty) are settled net of each party’s payment obligation. If an early termination date occurs under these agreements following an event of default or termination event, all obligations of each party to its counterparty are settled net through a single payment in a single currency (“close-out netting”). For financial reporting purposes, the funds do not offset financial assets and financial liabilities that are subject to these master netting arrangements in the statements of assets and liabilities.
The following table presents each fund’s forward currency contracts and bilateral interest rate swaps by counterparty that are subject to master netting agreements but that are not offset in the funds’ statement of assets and liabilities. The net amount column shows the impact of offsetting on the funds’ statement of assets and liabilities as of December 31, 2023, if close-out netting was exercised (dollars in thousands):
Core Plus Income ETF
| Gross amounts recognized in the | Gross amounts not offset in the statement of assets and liabilities and subject to a master netting agreement | |||||||||||||||||||
| Counterparty | statement of assets and liabilities | Available to offset | Non-cash collateral* | Cash collateral* | Net amount | |||||||||||||||
| Assets: | ||||||||||||||||||||
| Barclays Bank PLC | $ | 225 | $ | — | $ | — | $ | — | $ | 225 | ||||||||||
| Liabilities: | ||||||||||||||||||||
| Bank of America | $ | 5 | $ | — | $ | — | $ | — | $ | 5 | ||||||||||
| HSBC Bank USA | 9 | — | — | — | 9 | |||||||||||||||
| Standard Chartered Bank | 7 | — | — | — | 7 | |||||||||||||||
| Total | $ | 21 | $ | — | $ | — | $ | — | $ | 21 | ||||||||||
U.S. Multi-Sector Income ETF
| Gross amounts recognized in the | Gross amounts not offset in the statement of assets and liabilities and subject to a master netting agreement | |||||||||||||||||||
| Counterparty | statement of assets and liabilities | Available to offset | Non-cash collateral* | Cash collateral* | Net amount | |||||||||||||||
| Liabilities: | ||||||||||||||||||||
| Bank of America | $ | 4 | $ | — | $ | — | $ | — | $ | 4 | ||||||||||
| HSBC Bank USA | 8 | — | — | — | 8 | |||||||||||||||
| Standard Chartered Bank | 6 | — | — | — | 6 | |||||||||||||||
| Total | $ | 18 | $ | — | $ | — | $ | — | $ | 18 | ||||||||||
| * | Collateral is shown on a settlement basis. |
6. Taxation and distributions
Federal income taxation — Each fund complies with the requirements under Subchapter M of the Internal Revenue Code applicable to regulated investment companies and intends to distribute substantially all of its net taxable income and net capital gains each year. The funds are not subject to income taxes to the extent such distributions are made. Therefore, no federal income tax provision is required.
As of and during the year ended December 31, 2023, none of the funds had a liability for any unrecognized tax benefits. Each fund recognizes interest and penalties, if any, related to unrecognized tax benefits as income tax expense in their respective statements of operations. During the year, none of the funds incurred any significant interest or penalties.
Each fund’s tax returns are generally not subject to examination by federal, state and, if applicable, non-U.S. tax authorities after the expiration of each jurisdiction’s statute of limitations, which is typically three years after the date of filing but can be extended in certain jurisdictions.
| 118 | Capital Group Fixed Income ETF Trust |
Non-U.S. taxation — Dividend and interest income, if any, are recorded net of non-U.S. taxes paid. The funds may file withholding tax reclaims in certain jurisdictions to recover a portion of amounts previously withheld. These reclaims are recorded when the amount is known and there are no significant uncertainties on collectability. Gains realized by the funds on the sale of securities in certain countries, if any, may be subject to non-U.S. taxes. The funds generally record an estimated deferred tax liability based on unrealized gains to provide for potential non-U.S. taxes payable upon the sale of these securities.
Distributions — Distributions determined on a tax basis may differ from net investment income and net realized gains for financial reporting purposes. These differences are due primarily to different treatment for items such as currency gains and losses; short-term capital gains and losses; capital losses related to sales of certain securities within 30 days of purchase; cost of investments sold; paydowns on fixed-income securities; net capital losses; amortization of premiums and discounts and income on certain investments. The fiscal year in which amounts are distributed may differ from the year in which the net investment income and net realized gains are recorded by the funds for financial reporting purposes. The funds may also designate a portion of the amount paid to redeeming shareholders as a distribution for tax purposes.
Additional tax basis disclosures for each fund as of December 31, 2023, were as follows (dollars in thousands):
| Core Bond ETF | Core Plus Income ETF | Municipal Income ETF | Short Duration Income ETF | Short Duration Municipal Income ETF | U.S. Multi-Sector Income ETF | |||||||||||||||||||
| Undistributed tax-exempt income | $ | — | $ | — | $ | 2,078 | $ | — | $ | 183 | $ | — | ||||||||||||
| Undistributed ordinary income | 329 | 8,618 | — | 1,623 | — | 3,034 | ||||||||||||||||||
| Capital loss carryforward* | (238 | ) | (47,201 | ) | (803 | ) | (1,570 | ) | (18 | ) | (5,895 | ) | ||||||||||||
| Gross unrealized appreciation on investments | 3,527 | 55,947 | 16,386 | 5,131 | 1,207 | 18,772 | ||||||||||||||||||
| Gross unrealized depreciation on investments | (73 | ) | (7,552 | ) | (243 | ) | (2,415 | ) | — | (739 | ) | |||||||||||||
| Net unrealized appreciation (depreciation) on investments | 3,454 | 48,395 | 16,143 | 2,716 | 1,207 | 18,033 | ||||||||||||||||||
| Cost of investments | 103,626 | 1,925,498 | 499,891 | 354,868 | 44,962 | 361,290 | ||||||||||||||||||
| Reclassification from total accumulated loss to capital paid in on shares of beneficial interest | — | — | 122 | — | — | — | ||||||||||||||||||
| * | Each fund’s capital loss carryforward will be used to offset any capital gains realized by the fund in future years. Funds with a capital loss carryforward will not make distributions from capital gains while a capital loss carryforward remains. |
Distributions paid by each fund were characterized for tax purposes as follows (dollars in thousands):
| Year ended December 31, 2023 | Year ended December 31, 2022 | |||||||||||||||||||||||||||||||
| Fund | Ordinary income | Tax-exempt income | Long-term capital gains | Total distributions paid | Ordinary income | Tax-exempt income | Long-term capital gains | Total distributions paid | ||||||||||||||||||||||||
| Core Bond ETF | $ | 606 | 1 | $ | — | $ | — | $ | 606 | 1 | $ | — | $ | — | $ | — | $ | — | ||||||||||||||
| Core Plus Income ETF | 49,339 | — | — | 49,339 | 8,274 | 2 | — | — | 8,274 | 2 | ||||||||||||||||||||||
| Municipal Income ETF | — | 7,433 | — | 7,433 | — | 286 | 3 | — | 286 | 3 | ||||||||||||||||||||||
| Short Duration Income ETF | 11,350 | — | — | 11,350 | 376 | 3 | — | — | 376 | 3 | ||||||||||||||||||||||
| Short Duration Municipal Income ETF | — | 368 | 1 | — | 368 | 1 | — | — | — | — | ||||||||||||||||||||||
| U.S. Multi-Sector Income ETF | 11,122 | — | — | 11,122 | 623 | 3 | — | — | 623 | 3 | ||||||||||||||||||||||
| 1 | For the period September 26, 2023, commencement of operations to December 31, 2023. |
| 2 | For the period February 22, 2022, commencement of operations, to December 31, 2022. |
| 3 | For the period October 25, 2022, commencement of operations, to December 31, 2022. |
7. Fees and transactions
CRMC, the funds’ investment adviser, is the parent company of American Funds Distributors, Inc.® (“AFD”), the principal underwriter of the fund’s’ shares. CRMC and AFD are considered related parties to the funds.
| Capital Group Fixed Income ETF Trust | 119 |
Investment advisory services – Each fund has an investment advisory and service agreement with CRMC that provides for monthly fees, accrued daily. These fees are based on an annual rate of daily net assets as follows:
| Fund | Annual rate | |||
| Core Bond ETF | 0.27 | % | ||
| Core Plus Income ETF | 0.34 | |||
| Municipal Income ETF | 0.27 | |||
| Short Duration Income ETF | 0.25 | |||
| Short Duration Municipal Income ETF | 0.25 | |||
| U.S. Multi-Sector Income ETF | 0.39 | |||
Under the terms of the agreements, in addition to providing investment advisory services, the investment adviser and its affiliates provide certain administrative services to help assist third parties providing non-distribution services to the funds’ shareholders. These services include providing in-depth information on each fund and market developments that impact each fund’s investments. The agreement provides that the investment adviser will pay all ordinary operating expenses of each fund other than management fees, interest expenses, taxes, acquired fund fees and expenses, costs of holding shareholder meetings, legal fees and expenses relating to arbitration or litigation, payments under each fund’s plan of distribution (if any) and other non-routine or extraordinary expenses. Additionally, each fund will be responsible for its non-operating expenses, including brokerage commissions and fees and expenses associated with the fund’s securities lending program, if applicable.
Transfer agency and administration services – Each fund has entered into a transfer agency and service agreement and an administration agreement with State Street Bank and Trust Company (“State Street”). Under the terms of the transfer agency agreement, State Street (or an agent, including an affiliate) acts as transfer agent and dividend disbursing agent for each fund. Under the terms of the administration agreement, State Street provides necessary administrative, legal, tax and accounting, regulatory and financial reporting services for the maintenance and operations of each fund. The investment adviser bears the costs of services under these agreements.
Affiliated officers and trustees – Officers and certain trustees of each fund are or may be considered to be affiliated with CRMC and AFD. No affiliated officers or trustees received any compensation directly from any of the funds.
Investment in CCF — Each fund holds shares of CCF, an institutional prime money market fund managed by CRMC. CCF invests in high-quality, short-term money market instruments. CCF is used as the primary investment vehicle for each fund’s short-term investments. CCF shares are only available for purchase by CRMC, its affiliates, and other funds managed by CRMC. CCF shares are not available to the public. CRMC does not receive an investment advisory services fee from CCF.
Security transactions with related funds — Each fund may purchase from, or sell securities to, other CRMC-managed funds (or funds managed by certain affiliates of CRMC) under procedures adopted by each fund’s board of trustees. The funds involved in such transactions are considered related by virtue of having a common investment adviser (or affiliated investment advisers), common trustees and/or common officers. When such transactions occur, each transaction is executed at the current market price of the security and no brokerage commissions or fees are paid in accordance with Rule 17a-7 of the 1940 Act.
The following table presents purchase and sale transactions between each fund and related funds, and net realized gain or loss from such sales, if any, as of December 31, 2023 (dollars in thousands):
| Fund | Purchases | Sales | Net realized loss | |||||||||
| Municipal Income ETF | $ | — | $ | 1,751 | $ | (17 | ) | |||||
Interfund lending — Pursuant to an exemptive order issued by the SEC, the funds, along with other CRMC-managed funds (or funds managed by certain affiliates of CRMC), may participate in an interfund lending program. The program provides an alternate credit facility that permits the funds to lend or borrow cash for temporary purposes directly to or from one another, subject to the conditions of the exemptive order. None of the funds lent or borrowed cash through the interfund lending program at any time during the year ended December 31, 2023.
| 120 | Capital Group Fixed Income ETF Trust |
8. Indemnifications
Each fund’s organizational documents provide board members and officers with indemnification against certain liabilities or expenses in connection with the performance of their duties to the fund. In the normal course of business, each fund may also enter into contracts that provide general indemnifications. Each fund’s maximum exposure under these arrangements is unknown since it is dependent on future claims that may be made against each fund. The risk of material loss from such claims is considered remote. Insurance policies are also available to each fund’s board members and officers.
9. Capital share transactions
Each fund issues and redeems shares at NAV only with certain authorized participants in large increments known as creation units. Purchases of creation units are made by tendering a basket of designated securities and cash to a fund, and redemption proceeds are paid with a basket of securities from a fund’s portfolio with a balancing cash component to equate the market value of the basket of securities delivered or redeemed to the NAV per creation unit on the transaction date. The funds may issue creation units to authorized participants in advance of the delivery and settlement of all or a portion of the designated securities. When this occurs, the authorized participant provides cash collateral in an amount equal to 105% of the daily marked to market value of the securities that have not yet been delivered to the fund. Cash may be substituted equivalent to the value of certain securities generally when they are not available in sufficient quantity for delivery. Realized gains or losses resulting from redemptions of shares in-kind, if any, are reflected separately in each fund’s statement of operations.
Each fund’s shares are available in smaller increments to investors in the secondary market at market prices and may be subject to commissions. Authorized participants pay a transaction fee to the shareholder servicing agent when purchasing and redeeming creation units of a fund. The transaction fee is used to defray the costs associated with the issuance and redemption of creation units. In addition, for cash creation unit transactions, a variable fee for creation transactions and redemption transactions may be charged to the authorized participant to cover certain brokerage, tax, foreign exchange, execution, market impact and other costs and expenses related to the execution of trades. Variable fees, if any, are included in capital share transactions in each fund’s statement of changes in net assets.
Capital share transactions in each fund were as follows (dollars and shares in thousands):
Core Bond ETF
| Sales | Reinvestments of distributions | Repurchases | Net increase (decrease) | |||||||||||||||||||||||||||
| Amount | Shares | Amount | Shares | Amount | Shares | Amount | Shares | |||||||||||||||||||||||
| For the period September 26, 2023*, through December 31, 2023 | ||||||||||||||||||||||||||||||
| $ | 93,345 | 3,660 | $ | — | — | $ | — | — | $ | 93,345 | 3,660 | |||||||||||||||||||
Core Plus Income ETF
| Sales | Reinvestments of distributions | Repurchases | Net increase (decrease) | |||||||||||||||||||||||||||
| Amount | Shares | Amount | Shares | Amount | Shares | Amount | Shares | |||||||||||||||||||||||
| Year ended December 31, 2023 | ||||||||||||||||||||||||||||||
| $ | 1,082,435 | 48,600 | $ | — | — | $ | — | — | $ | 1,082,435 | 48,600 | |||||||||||||||||||
| For the period February 22, 2022*, through December 31, 2022 | ||||||||||||||||||||||||||||||
| $ | 482,652 | 20,464 | $ | — | — | $ | — | — | $ | 482,652 | 20,464 | |||||||||||||||||||
Refer to end of tables for footnote.
| Capital Group Fixed Income ETF Trust | 121 |
Municipal Income ETF
| Sales | Reinvestments of distributions | Repurchases | Net increase (decrease) | |||||||||||||||||||||||||||
| Amount | Shares | Amount | Shares | Amount | Shares | Amount | Shares | |||||||||||||||||||||||
| Year ended December 31, 2023 | ||||||||||||||||||||||||||||||
| $ | 430,271 | 16,380 | $ | — | — | $ | (1,604 | ) | (60 | ) | $ | 428,667 | 16,320 | |||||||||||||||||
| For the period October 25, 2022*, through December 31, 2022 | ||||||||||||||||||||||||||||||
| $ | 72,460 | 2,820 | $ | — | — | $ | — | — | $ | 72,460 | 2,820 | |||||||||||||||||||
Short Duration Income ETF
| Sales | Reinvestments of distributions | Repurchases | Net increase (decrease) | |||||||||||||||||||||||||||
| Amount | Shares | Amount | Shares | Amount | Shares | Amount | Shares | |||||||||||||||||||||||
| Year ended December 31, 2023 | ||||||||||||||||||||||||||||||
| $ | 242,033 | 9,540 | $ | — | — | $ | — | — | $ | 242,033 | 9,540 | |||||||||||||||||||
| For the period October 25, 2022*, through December 31, 2022 | ||||||||||||||||||||||||||||||
| $ | 89,240 | 3,540 | $ | — | — | $ | — | — | $ | 89,240 | 3,540 | |||||||||||||||||||
Short Duration Municipal Income ETF
| Sales | Reinvestments of distributions | Repurchases | Net increase (decrease) | |||||||||||||||||||||||||||
| Amount | Shares | Amount | Shares | Amount | Shares | Amount | Shares | |||||||||||||||||||||||
| For the period September 26, 2023*, through December 31, 2023 | ||||||||||||||||||||||||||||||
| $ | 45,214 | 1,800 | $ | — | — | $ | — | — | $ | 45,214 | 1,800 | |||||||||||||||||||
U.S. Multi-Sector Income ETF
| Sales | Reinvestments of distributions | Repurchases | Net increase (decrease) | |||||||||||||||||||||||||||
| Amount | Shares | Amount | Shares | Amount | Shares | Amount | Shares | |||||||||||||||||||||||
| Year ended December 31, 2023 | ||||||||||||||||||||||||||||||
| $ | 296,844 | 11,340 | $ | — | — | $ | — | — | $ | 296,844 | 11,340 | |||||||||||||||||||
| For the period October 25, 2022*, through December 31, 2022 | ||||||||||||||||||||||||||||||
| $ | 69,849 | 2,760 | $ | — | — | $ | — | — | $ | 69,849 | 2,760 | |||||||||||||||||||
| * | Commencement of operations. |
| 122 | Capital Group Fixed Income ETF Trust |
10. Investment transactions
The following table presents purchases and sales of investments, excluding in-kind transactions, short-term securities and U.S. government obligations, if any, during the year ended December 31, 2023 (dollars in thousands):
| Fund | Purchases | Sales | ||||||
| Core Bond ETF | $ | 35,297 | $ | 5,971 | ||||
| Core Plus Income ETF | 497,755 | 655,756 | ||||||
| Municipal Income ETF | 395,591 | 35,233 | ||||||
| Short Duration Income ETF | 217,852 | 121,009 | ||||||
| Short Duration Municipal Income ETF | 51,868 | 12,776 | ||||||
| U.S. Multi-Sector Income ETF | 145,873 | 69,876 | ||||||
The following table presents the value of securities received and delivered in-kind from the authorized participants to support creation and redemption transactions, if any, during the year ended December 31, 2023 (dollars in thousands):
| Fund | In-kind creations | In-kind redemptions | ||||||
| Core Bond ETF | $ | 41,563 | $ | — | ||||
| Core Plus Income ETF | 834,529 | — | ||||||
| Municipal Income ETF | 34,583 | 1,477 | ||||||
| Short Duration Income ETF | 122,240 | — | ||||||
| Short Duration Municipal Income ETF | 2,876 | — | ||||||
| U.S. Multi-Sector Income ETF | 191,218 | — | ||||||
The following table presents additional information for each fund for the year ended December 31, 2023 (dollars in thousands):
| Fund | Non-U.S. taxes paid on interest income | |||
| Core Bond ETF | $ | — | ||
| Core Plus Income ETF | 2 | |||
| Municipal Income ETF | — | |||
| Short Duration Income ETF | — | |||
| Short Duration Municipal Income ETF | — | |||
| U.S. Multi-Sector Income ETF | — | |||
| Capital Group Fixed Income ETF Trust | 123 |
Financial highlights
| Income (loss) from investment operations1 | Dividends and distributions | |||||||||||||||||||||||||||||||||||||||||||||||
| Year ended | Net asset value, beginning of year | Net investment income | Net gains (losses) on securities (both realized and unrealized) | Total from investment operations | Dividends (from net investment income) | Distributions (from capital gains) | Total dividends and distributions | Net asset value, end of year | Total return | Net assets, end of year (in millions) | Ratio of expenses to average net assets2 | Ratio of net income to average net assets | ||||||||||||||||||||||||||||||||||||
| Core Bond ETF | ||||||||||||||||||||||||||||||||||||||||||||||||
| 12/31/20233,4 | $ | 25.00 | $ | .45 | $ | 1.18 | $ | 1.63 | $ | (.25 | ) | $ | — | $ | (.25 | ) | $ | 26.38 | 6.56 | %5 | $ | 97 | .27 | %6 | 6.77 | %6 | ||||||||||||||||||||||
| Core Plus Income ETF | ||||||||||||||||||||||||||||||||||||||||||||||||
| 12/31/2023 | $ | 22.23 | $ | 1.55 | $ | .01 | $ | 1.56 | $ | (1.13 | ) | $ | — | $ | (1.13 | ) | $ | 22.66 | 7.25 | % | $ | 1,565 | .34 | % | 7.04 | % | ||||||||||||||||||||||
| 12/31/20223,7 | 25.30 | .83 | (3.24 | ) | (2.41 | ) | (.66 | ) | — | (.66 | ) | 22.23 | (9.59 | )5 | 455 | .34 | 6 | 4.24 | 6 | |||||||||||||||||||||||||||||
| Municipal Income ETF | ||||||||||||||||||||||||||||||||||||||||||||||||
| 12/31/2023 | $ | 26.11 | $ | .98 | $ | .75 | $ | 1.73 | $ | (.84 | ) | $ | — | $ | (.84 | ) | $ | 27.00 | 6.78 | % | $ | 517 | .27 | % | 3.75 | % | ||||||||||||||||||||||
| 12/31/20223,8 | 25.00 | .17 | 1.07 | 1.24 | (.13 | ) | — | (.13 | ) | 26.11 | 4.92 | 5 | 74 | .05 | 5 | .67 | 5 | |||||||||||||||||||||||||||||||
| Short Duration Income ETF | ||||||||||||||||||||||||||||||||||||||||||||||||
| 12/31/2023 | $ | 25.27 | $ | 1.37 | $ | (.10 | ) | $ | 1.27 | $ | (1.13 | ) | $ | — | $ | (1.13 | ) | $ | 25.41 | 5.14 | % | $ | 332 | .25 | % | 5.45 | % | |||||||||||||||||||||
| 12/31/20223,8 | 25.00 | .22 | .21 | .43 | (.16 | ) | — | (.16 | ) | 25.27 | 1.73 | 5 | 89 | .05 | 5 | .87 | 5 | |||||||||||||||||||||||||||||||
| Short Duration Municipal Income ETF | ||||||||||||||||||||||||||||||||||||||||||||||||
| 12/31/20233,4 | $ | 25.00 | $ | .24 | $ | .76 | $ | 1.00 | $ | (.22 | ) | $ | — | $ | (.22 | ) | $ | 25.78 | 4.00 | %5 | $ | 46 | .25 | %6 | 3.62 | %6 | ||||||||||||||||||||||
| U.S. Multi-Sector Income ETF | ||||||||||||||||||||||||||||||||||||||||||||||||
| 12/31/2023 | $ | 25.66 | $ | 2.05 | $ | .78 | $ | 2.83 | $ | (1.58 | ) | $ | — | $ | (1.58 | ) | $ | 26.91 | 11.39 | % | $ | 379 | .39 | % | 7.91 | % | ||||||||||||||||||||||
| 12/31/20223,8 | 25.00 | .29 | .62 | .91 | (.25 | ) | — | (.25 | ) | 25.66 | 3.63 | 5 | 71 | .07 | 5 | 1.13 | 5 | |||||||||||||||||||||||||||||||
| Portfolio turnover rate excluding mortgage dollar roll transactions9,10 | Year ended December 31, 2023 | Period ended December 31, 20223,5 | ||||||
| Core Bond ETF | 13 | %4 | — | |||||
| Core Plus Income ETF | 76 | 172 | 7 | |||||
| Short Duration Income ETF | 56 | 1 | 8 | |||||
| Portfolio turnover rate including mortgage dollar roll transactions, if any9,10 | Year ended December 31, 2023 | Period ended December 31, 20223,5 | ||||||
| Core Bond ETF | 26 | %4 | — | |||||
| Core Plus Income ETF | 581 | 446 | 7 | |||||
| Municipal Income ETF | 19 | 1 | 8 | |||||
| Short Duration Income ETF | 203 | 55 | 8 | |||||
| Short Duration Municipal Income ETF | 37 | 4 | — | |||||
| U.S. Multi-Sector Income ETF | 43 | 6 | 8 | |||||
| 1 | Based on average shares outstanding. |
| 2 | Ratios do not include expenses of any Central Funds. Each fund indirectly bears its proportionate share of the expenses of any Central Funds. |
| 3 | Based on operations for a period that is less than a full year. |
| 4 | For the period September 26, 2023, commencement of operations, through December 31, 2023. |
| 5 | Not annualized. |
| 6 | Annualized. |
| 7 | For the period February 22, 2022, commencement of operations, through December 31, 2022. |
| 8 | For the period October 25, 2022, commencement of operations, through December 31, 2022. |
| 9 | Rates do not include each fund’s portfolio activity with respect to any Central Funds. |
| 10 | Refer to Note 5 for more information on mortgage dollar rolls. Refer to the notes to financial statements. |
| 124 | Capital Group Fixed Income ETF Trust |
Report of Independent Registered Public Accounting Firm
To the Board of Trustees of Capital Group Fixed Income ETF Trust and Shareholders of Capital Group Core Plus Income ETF, Capital Group Municipal Income ETF, Capital Group U.S. Multi-Sector Income ETF, Capital Group Short Duration Income ETF, Capital Group Core Bond ETF, and Capital Group Short Duration Municipal Income ETF
Opinions on the Financial Statements
We have audited the accompanying statements of assets and liabilities, including the investment portfolios, of each of the funds listed in the table below (constituting Capital Group Fixed Income ETF Trust, hereafter collectively referred to as the “Funds”) as of December 31, 2023, the related statements of operations and of changes in net assets for each of the periods indicated in the table below, including the related notes, and the financial highlights for each of the periods indicated in the table below (collectively referred to as the “financial statements”). In our opinion, the financial statements present fairly, in all material respects, the financial position of each of the Funds as of December 31, 2023, the results of each of their operations, the changes in each of their net assets, and each of the financial highlights for each of the periods indicated in the table below, in conformity with accounting principles generally accepted in the United States of America.
| Fund | Statement of operations | Statement of changes in net assets | Financial highlights |
| Capital Group Core Plus Income ETF | For the year ended December 31, 2023. | For the year ended December 31, 2023, and for the period February 22, 2022 (commencement of operations) through December 31, 2022. | |
| Capital Group Municipal Income ETF | For the year ended December 31, 2023. | For the year ended December 31, 2023, and for the period October 25, 2022 (commencement of operations) through December 31, 2022. | |
| Capital Group U.S. Multi-Sector Income ETF | |||
| Capital Group Short Duration Income ETF | |||
| Capital Group Core Bond ETF | For the period September 26, 2023 (commencement of operations) through December 31, 2023. | ||
| Capital Group Short Duration Municipal Income ETF | |||
Basis for Opinions
These financial statements are the responsibility of the Funds’ management. Our responsibility is to express an opinion on the Funds’ financial statements based on our audits. We are a public accounting firm registered with the Public Company Accounting Oversight Board (United States) (PCAOB) and are required to be independent with respect to the Funds in accordance with the U.S. federal securities laws and the applicable rules and regulations of the Securities and Exchange Commission and the PCAOB.
We conducted our audits of these financial statements in accordance with the standards of the PCAOB. Those standards require that we plan and perform the audit to obtain reasonable assurance about whether the financial statements are free of material misstatement, whether due to error or fraud.
Our audits included performing procedures to assess the risks of material misstatement of the financial statements, whether due to error or fraud, and performing procedures that respond to those risks. Such procedures included examining, on a test basis, evidence regarding the amounts and disclosures in the financial statements. Our audits also included evaluating the accounting principles used and significant estimates made by management, as well as evaluating the overall presentation of the financial statements. Our procedures included confirmation of securities owned as of December 31, 2023 by correspondence with the custodian, transfer agent and brokers; when replies were not received from brokers, we performed other auditing procedures. We believe that our audits provide a reasonable basis for our opinions.
/s/ PricewaterhouseCoopers LLP
Los Angeles, California
February 14, 2024
We have served as the auditor of one or more investment companies in The Capital Group group of investment companies since 1934.
| Capital Group Fixed Income ETF Trust | 125 |
| Expense example | unaudited |
As a fund shareholder, you incur ongoing costs, including investment advisory services fees and other expenses. This example is intended to help you understand your ongoing costs (in dollars) of investing in the fund so you can compare these costs with the ongoing costs of investing in other mutual funds. The example is based on an investment of $1,000 invested at the beginning of the period and held for the entire period (July 1, 2023, through December 31, 2023).
Actual expenses:
The first line in the table below provides information about actual account values and actual expenses. You may use the information in this line, together with the amount you invested, to estimate the expenses that you paid over the period. Simply divide your account value by $1,000 (for example, an $8,600 account value divided by $1,000 = 8.6), then multiply the result by the number in the first line under the heading titled “Expenses paid during period” to estimate the expenses you paid on your account during this period.
Hypothetical example for comparison purposes:
The second line in the table below provides information about hypothetical account values and hypothetical expenses based on the actual expense ratio for the share class and an assumed rate of return of 5.00% per year before expenses, which is not the actual return of the share class. The hypothetical account values and expenses may not be used to estimate the actual ending account balance or expenses you paid for the period. You may use this information to compare the ongoing costs of investing in the fund and other funds. To do so, compare this 5.00% hypothetical example with the 5.00% hypothetical examples that appear in the shareholder reports of the other funds.
Notes:
Note that the expenses shown in the tables on the following pages are meant to highlight your ongoing costs only and do not reflect any transactional costs, such as sales charges (loads). Therefore, the second line of each share class in the tables is useful in comparing ongoing costs only and will not help you determine the relative total costs of owning different funds. In addition, if these transactional costs were included, your costs would have been higher.
| Beginning account value 7/1/2023 | Ending account value 12/31/2023 | Expenses paid during period | Annualized expense ratio | |||||||||||||
| Core Bond ETF | ||||||||||||||||
| Actual return | $ | 1,000.00 | $ | 1,065.60 | $ | .73 | † | .27 | %† | |||||||
| Assumed 5% return | 1,000.00 | 1,023.84 | 1.38 | † | .27 | † | ||||||||||
| Core Plus Income ETF | ||||||||||||||||
| Actual return | $ | 1,000.00 | $ | 1,048.80 | $ | 1.76 | * | .34 | % | |||||||
| Assumed 5% return | 1,000.00 | 1,023.49 | 1.73 | * | .34 | |||||||||||
| Municipal Income ETF | ||||||||||||||||
| Actual return | $ | 1,000.00 | $ | 1,039.50 | $ | 1.39 | * | .27 | % | |||||||
| Assumed 5% return | 1,000.00 | 1,023.84 | 1.38 | * | .27 | |||||||||||
| Short Duration Income ETF | ||||||||||||||||
| Actual return | $ | 1,000.00 | $ | 1,039.40 | $ | 1.29 | * | .25 | % | |||||||
| Assumed 5% return | 1,000.00 | 1,023.95 | 1.28 | * | .25 | |||||||||||
| Short Duration Municipal Income ETF | ||||||||||||||||
| Actual return | $ | 1,000.00 | $ | 1,040.00 | $ | .67 | † | .25 | %† | |||||||
| Assumed 5% return | 1,000.00 | 1,023.95 | 1.28 | † | .25 | † | ||||||||||
| U.S. Multi-Sector Income ETF | ||||||||||||||||
| Actual return | $ | 1,000.00 | $ | 1,069.70 | $ | 2.03 | * | .39 | % | |||||||
| Assumed 5% return | 1,000.00 | 1,023.24 | 1.99 | * | .39 | |||||||||||
| † | The period for the “annualized expense ratio” and “actual return” line is based on the number of days from September 26, 2023, commencement of operations, through December 31, 2023, and accordingly, is not representative of a full period. The “assumed 5% return” line is based on 184 days. |
| * | The “expenses paid during period” are equal to the “annualized expense ratio,” multiplied by the average account value over the period, multiplied by the number of days in the period, and divided by 365 (to reflect the one-half year period). |
| 126 | Capital Group Fixed Income ETF Trust |
| Tax information | unaudited |
We are required to advise you of the federal tax status of certain distributions received by shareholders during the fiscal year. Each fund hereby designates the following amounts for the funds’ fiscal year ended December 31, 2023:
| Capital Group Core Bond ETF | Capital Group Core Plus Income ETF | Capital Group Municipal Income ETF | Capital Group Short Duration Income ETF | Capital Group Short Duration Municipal Income ETF | Capital Group U.S. Multi-Sector Income ETF | |||||||||||||||||||
| Section 163(j) interest dividends | 100 | % | $ | 47,748,000 | — | 100 | % | — | $ | 10,890,000 | ||||||||||||||
| Exempt interest dividends | — | — | $ | 7,917,000 | — | $ | 390,000 | — | ||||||||||||||||
| U.S. government income that may be exempt from state taxation | $ | 96,000 | $ | 9,826,000 | — | $ | 411,000 | — | $ | 153,000 | ||||||||||||||
Individual shareholders should refer to their Form 1099 or other tax information, which was mailed in January 2024, to determine the calendar year amounts to be included on their 2023 tax returns. Shareholders should consult their tax advisors.
| Capital Group Fixed Income ETF Trust | 127 |
| Liquidity Risk Management Program | unaudited |
The series has adopted a liquidity risk management program (the “program”). The series’ board has designated Capital Research and Management Company (“CRMC”) as the administrator of the program. Personnel of CRMC or its affiliates conduct the day-to-day operation of the program pursuant to policies and procedures administered by the Capital Group Liquidity Risk Management Committee.
Under the program, CRMC manages each fund’s liquidity risk, which is the risk that the fund could not meet shareholder redemption requests without significant dilution of remaining shareholders’ interests in the fund. This risk is managed by monitoring the degree of liquidity of each fund’s investments, limiting the amount of each fund’s illiquid investments, and utilizing various risk management tools and facilities available to each fund for meeting shareholder redemptions, among other means. CRMC’s process of determining the degree of liquidity of each fund’s investments is supported by one or more third-party liquidity assessment vendors.
The series’ board reviewed a report prepared by CRMC regarding the operation and effectiveness of the program for the period October 1, 2022, through September 30, 2023. No significant liquidity events impacting any of the funds were noted in the report. In addition, CRMC provided its assessment that the program had been effective in managing each fund’s liquidity risk.
| 128 | Capital Group Fixed Income ETF Trust |
Board of trustees and other officers
Independent trustees1
| Name and year of birth | Year first elected a trustee of the series/fund2 | Principal occupation(s) during past five years | Number of portfolios in fund complex overseen by trustee | Other directorships3 held by trustee | ||||
| Vanessa C. L. Chang, 1952 Chair of the Board (Independent and Non-Executive) | 2021 | Former Director, EL & EL Investments (real estate) | 21 | Edison International/Southern California Edison; Transocean Ltd. (offshore drilling contractor) | ||||
| Jennifer C. Feikin, 1968 | 2021 | Business Advisor; previously held positions at Google, AOL, 20th Century Fox and McKinsey & Company; Trustee, The Nature Conservancy of Utah; former Trustee, The Nature Conservancy of California; former Director, First Descents | 102 | Hertz Global Holdings, Inc. | ||||
| Pablo R. González Guajardo, 1967 | 2021 | CEO, Kimberly-Clark de México, SAB de CV | 23 | América Móvil, SAB de CV (telecommunications company); Kimberly-Clark de México, SAB de CV (consumer staples) | ||||
| Leslie Stone Heisz, 1961 | 2021 | Former Managing Director, Lazard (retired, 2010); Director, Kaiser Permanente (California public benefit corporation); former Lecturer, UCLA Anderson School of Management | 102 | Edwards Lifesciences; Public Storage, Inc. | ||||
| William D. Jones, 1955 | 2021 | Managing Member, CityLink LLC (investing and consulting); former President and CEO, CityLink Investment Corporation (acquires, develops and manages real estate ventures in urban communities) | 24 | None |
Interested trustee4,5
| Name, year of birth and position with fund | Year first elected a trustee or officer of the series/fund2 | Principal occupation(s) during past five years and positions held with affiliated entities or the principal underwriter of the fund | Number of portfolios in fund complex overseen by trustee | Other directorships3 held by trustee | ||||
| William L. Robbins, 1968 | 2021 | Partner — Capital International Investors, Capital Research and Management Company; Partner — Capital International Investors, Capital Bank and Trust Company6; Chair and Director, Capital Group International, Inc.6 | 20 | None |
The fund’s statement of additional information includes further details about fund trustees and is available without charge upon request by calling American Funds Service Company at (800) 421-4225 or by refering to the Capital Group website at capitalgroup.com. The address for all trustees and officers of the fund is 6455 Irvine Center Drive, Irvine, CA 92618, Attention: Secretary.
Refer to page 131 for footnotes.
| Capital Group Fixed Income ETF Trust | 129 |
Other officers5
| Name, year of birth and position with fund | Year first elected an officer of the series/fund2 | Principal occupation(s) during past five years and positions held with affiliated entities or the principal underwriter of the fund | ||
| Vincent J. Gonzales, 1984 President | CGSD 2022 | Partner — Capital Fixed Income Investors, Capital Research and Management Company; Partner — Capital Fixed Income Investors, Capital Bank and Trust Company6 | ||
| David A. Hoag, 1965 President | CGCP 2021 | Partner — Capital Fixed Income Investors, Capital Research and Management Company | ||
| Vikas Malhotra, 1983 President | CGSM 2023 | Vice President — Capital Fixed Income Investors, Capital Research and Management Company | ||
| Damien J. McCann, 1977 President Senior Vice President | CGMS 2022 CGCP 2021 | Partner — Capital Fixed Income Investors, Capital Research and Management Company | ||
| Chitrang Purani, 1977 President | CGCB 2023 | Vice President — Capital Fixed Income Investors, Capital Research and Management Company | ||
| Courtney K. Wolf, 1982 President | CGMU 2022 | Partner — Capital Fixed Income Investors, Capital Research and Management Company; Director, The Capital Group Companies, Inc.6 | ||
| Walt Burkley, 1966 Principal Executive Officer | 2021 | Senior Vice President and General Counsel — Fund Business Management Group, Capital Research and Management Company; General Counsel and Secretary, The Capital Group Companies, Inc.6; Director, Capital Research Company6; Director, Capital Research and Management Company | ||
| Michael W. Stockton, 1967 Executive Vice President | 2021 | Senior Vice President — Fund Business Management Group, Capital Research and Management Company | ||
| Pramod Atluri, 1976 Senior Vice President | CGCB 2023 | Partner — Capital Fixed Income Investors, Capital Research and Management Company; Partner — Capital Fixed Income Investors, Capital Bank and Trust Company6; Director, Capital Research and Management Company | ||
| Oliver V. Edmonds, 1978 Senior Vice President | CGCB 2023 | Partner — Capital Fixed Income Investors, Capital Research and Management Company | ||
| Steven D. Lotwin, 1969 Senior Vice President | CGSD 2022 | Partner — Capital Fixed Income Investors, Capital Research and Management Company; Director, Capital Research and Management Company | ||
| Mark Marinella, 1958 Senior Vice President | CGMU 2022 CGSM 2023 | Partner — Capital Fixed Income Investors, Capital Research and Management Company | ||
| John R. Queen, 1965 Senior Vice President | CGCP 2023 | Partner — Capital Fixed Income Investors, Capital Research and Management Company; Partner — Capital Fixed Income Investors, Capital Bank and Trust Company6; Senior Vice President, Capital Group Private Client Services, Inc.6 | ||
| Jerome Solomon, 1963 Senior Vice President | CGMU 2022 | Partner — Capital Fixed Income Investors, Capital Research and Management Company |
Refer to page 131 for footnotes.
| 130 | Capital Group Fixed Income ETF Trust |
Other officers5 (continued)
| Name, year of birth and position with fund | Year first elected an officer of the series/fund2 | Principal occupation(s) during past five years and positions held with affiliated entities or the principal underwriter of the fund | ||
| Scott Sykes, 1971 Senior Vice President | CGMS 2022 | Partner — Capital Fixed Income Investors, Capital Research and Management Company | ||
| Erik A. Vayntrub, 1984 Senior Vice President | 2021 | Senior Vice President and Senior Counsel — Fund Business Management Group, Capital Research and Management Company; Secretary, Capital Management Services, Inc.6 | ||
| Shannon Ward, 1964 Senior Vice President | CGMS 2022 | Partner — Capital Fixed Income Investors, Capital Research and Management Company | ||
| Xavier Goss, 1980 Vice President | CGCP 2021 CGMS 2022 | Vice President — Capital Fixed Income Investors, Capital Research and Management Company | ||
| Michael R. Tom, 1988 Secretary | 2021 | Associate — Fund Business Management Group, Capital Research and Management Company | ||
| Troy S. Tanner, 1983 Treasurer | 2021 | Vice President — Investment Operations, Capital Research and Management Company | ||
| Jennifer L. Butler, 1966 Assistant Secretary | 2021 | Assistant Vice President — Fund Business Management Group, Capital Research and Management Company | ||
| Susan K. Countess, 1966 Assistant Secretary | 2021 | Associate — Fund Business Management Group, Capital Research and Management Company | ||
| Sandra Chuon, 1972 Assistant Treasurer | 2021 | Vice President — Investment Operations, Capital Research and Management Company | ||
| Gregory F. Niland, 1971 Assistant Treasurer | 2021 | Vice President — Investment Operations, Capital Research and Management Company |
| 1 | The term independent trustee refers to a trustee who is not an “interested person” of the fund within the meaning of the Investment Company Act of 1940. |
| 2 | Trustees and officers of the fund serve until their resignation, removal or retirement. |
| 3 | This includes all directorships/trusteeships (other than those in the American Funds or other funds managed by Capital Research and Management Company or its affiliates) that are held by each trustee as a trustee or director of a public company or a registered investment company. |
| 4 | The term interested trustee refers to a trustee who is an “interested person” within the meaning of the Investment Company Act of 1940, on the basis of their affiliation with the fund’s investment adviser, Capital Research and Management Company, or affiliated entities (including the fund’s principal underwriter). |
| 5 | All of the trustees and/or officers listed are officers and/or directors/trustees of one or more of the other funds for which Capital Research and Management Company serves as investment adviser. |
| 6 | Company affiliated with Capital Research and Management Company. |
Key:
CGCB = Capital Group Core Bond Income ETF
CGCP = Capital Group Core Plus Income ETF
CGMU = Capital Group Municipal Income ETF
CGSD = Capital Group Short Duration Income ETF
CGSM = Capital Group Short Duration Municipal Income ETF
CGMS = Capital Group U.S. Multi-Sector Income ETF
| Capital Group Fixed Income ETF Trust | 131 |
Office of the fund
6455 Irvine Center Drive Irvine,
CA 92618-4518
Investment adviser
Capital Research and Management Company
333 South Hope Street
Los Angeles, CA 90071-1406
Transfer agent for shareholder accounts
State Street Bank and Trust Company
One Lincoln Street
Boston, MA 02111-2900
Custodian of assets
State Street Bank and Trust Company
One Lincoln Street
Boston, MA 02111-2900
Counsel
Dechert LLP
One Bush Street, Suite 1600
San Francisco, CA 94104-4446
Independent registered public accounting firm
PricewaterhouseCoopers LLP
601 South Figueroa Street
Los Angeles, CA 90017-3874
Principal underwriter
American Funds Distributors, Inc.
333 South Hope Street
Los Angeles, CA 90071-1406
| 132 | Capital Group Fixed Income ETF Trust |
Investors should carefully consider investment objectives, risks, charges and expenses. This and other important information is contained in the fund prospectus and summary prospectus, which can be obtained from your financial professional and should be read carefully before investing. You may also call (800) 421-4225 or refer to the Capital Group website at capitalgroup.com.
“Proxy Voting Procedures and Principles” — which describes our procedures and principles for voting portfolio securities — is available at capitalgroup.com/etf. Each fund files its proxy voting record with the U.S. Securities and Exchange Commission (SEC) for the 12 months ended June 30 by August 31. The proxy voting record is available free of charge on the SEC website at sec.gov and on our website.
If used as sales material after March 31, 2024, this report must be accompanied by a statistical update for the most recently completed calendar quarter.
Capital Group Fixed Income ETF Trust
For CGCP, CGMS and CGSD, The use of derivatives involves a variety of risks, which may be different from, or greater than, the risks associated with investing in traditional securities, such as stocks and bonds.
For CGCP, CGMU and CGMS, Lower rated bonds are subject to greater fluctuations in value and risk of loss of income and principal than higher rated bonds.
For CGCP, CGMU, CGMS and CGSD, The return of principal for bond funds and for funds with significant underlying bond holdings is not guaranteed. Fund shares are subject to the same interest rate, inflation and credit risks associated with the underlying bond holdings.
For CGMU, Income from municipal bonds may be subject to state or local income taxes and/or the federal alternative minimum tax. Certain other income, as well as capital gain distributions, may be taxable.
For CGCP, CGMS and CGSD, Investing outside the United States involves risks, such as currency fluctuations, periods of illiquidity and price volatility. These risks may be heightened in connection with investments in developing countries.
All Capital Group trademarks mentioned are owned by The Capital Group Companies, Inc., an affiliated company or fund. All other company and product names mentioned are the property of their respective companies.
Bloomberg Index Services Limited. BLOOMBERG® is a trademark and service mark of Bloomberg Finance L.P. and its affiliates (collectively “Bloomberg”). Bloomberg or Bloomberg’s licensors own all proprietary rights in the Bloomberg Indices. Neither Bloomberg nor Bloomberg’s licensors approves or endorses this material, or guarantees the accuracy or completeness of any information herein, or makes any warranty, express or implied, as to the results to be obtained therefrom and, to the maximum extent allowed by law, neither shall have any liability or responsibility for injury or damages arising in connection therewith.
American Funds Distributors, Inc.
This content, developed by Capital Group, home of American Funds, should not be used as a primary basis for investment decisions and is not intended to serve as impartial investment or fiduciary advice.

ITEM 2 – Code of Ethics
The Registrant has adopted a Code of Ethics that applies to its Principal Executive Officer and Principal Financial Officer. The Registrant undertakes to provide to any person without charge, upon request, a copy of the Code of Ethics. Such request can be made by calling 800/421-4225 or to the Secretary of the Registrant, 6455 Irvine Center Drive, Irvine, California 92618.
ITEM 3 – Audit Committee Financial Expert
The Registrant’s board has determined that Leslie Stone Heisz, a member of the Registrant’s audit committee, is an “audit committee financial expert” and "independent," as such terms are defined in this Item. This designation will not increase the designee’s duties, obligations or liability as compared to his or her duties, obligations and liability as a member of the audit committee and of the board, nor will it reduce the responsibility of the other audit committee members. There may be other individuals who, through education or experience, would qualify as "audit committee financial experts" if the board had designated them as such. Most importantly, the board believes each member of the audit committee contributes significantly to the effective oversight of the Registrant’s financial statements and condition.
ITEM 4 – Principal Accountant Fees and Services
| CGFIT | ||
| Registrant: | ||
| a) Audit Fees: | ||
| Audit | 2022 | 16,000 |
| 2023 | 82,000 | |
| b) Audit-Related Fees: | ||
| 2022 | None | |
| 2023 | None | |
| c) Tax Fees: | ||
| 2022 | None | |
| 2023 | None | |
| The tax fees consist of professional services relating to the preparation of the Registrant’s tax returns. | ||
| d) All Other Fees: | ||
| 2022 | None | |
| 2023 | None | |
| Adviser and affiliates (includes only fees for non-audit services billed to the adviser and affiliates for engagements that relate directly to the operations and financial reporting of the Registrant and were subject to the pre-approval policies described below): | ||
| a) Audit Fees: | ||
| Not Applicable | ||
| b) Audit-Related Fees: | ||
| 2022 | None | |
| 2023 | None | |
| The audit-related fees consist of assurance and related services relating to the examination of the Registrant’s transfer agent, principal underwriter and investment adviser conducted in accordance with Statement on Standards for Attestation Engagements Number 18 issued by the American Institute of Certified Public Accountants. | ||
| c) Tax Fees: | ||
| 2022 | None | |
| 2023 | None | |
| The tax fees consist of consulting services relating to the Registrant’s investments. | ||
| d) All Other Fees: | ||
| 2022 | None | |
| 2023 | None | |
| The other fees consist of subscription services related to an accounting research tool. | ||
| All audit and permissible non-audit services that the Registrant’s audit committee considers compatible with maintaining the independent registered public accounting firm’s independence are required to be pre-approved by the committee. The pre-approval requirement will extend to all non-audit services provided to the Registrant, the investment adviser, and any entity controlling, controlled by, or under common control with the investment adviser that provides ongoing services to the Registrant, if the engagement relates directly to the operations and financial reporting of the Registrant. The committee will not delegate its responsibility to pre-approve these services to the investment adviser. The committee may delegate to one or more committee members the authority to review and pre-approve audit and permissible non-audit services. Actions taken under any such delegation will be reported to the full committee at its next meeting. The pre-approval requirement is waived with respect to non-audit services if certain conditions are met. The pre-approval requirement was not waived for any of the non-audit services listed above provided to the Registrant, adviser and affiliates. | ||
| Aggregate non-audit fees paid to the Registrant’s auditors, including fees for all services billed to the Registrant, adviser and affiliates that provide ongoing services to the Registrant, were $0 for fiscal year 2022 and $0 for fiscal year 2023. The non-audit services represented by these amounts were brought to the attention of the committee and considered to be compatible with maintaining the auditors’ independence. |
ITEM 5 – Audit Committee of Listed Registrants
| (a) | The following individuals are members of the registrant’s separately designated standing audit committee established in accordance with Section 3(a)(58)(A) of the Securities Exchange Act of 1934 (15 U.S.C. 78c(a)(58)(A)): |
Vanessa C. L. Chang
Jennifer C. Feikin
Pablo R. González Guajardo
Leslie Stone Heisz
William D. Jones
| (b) | Not applicable |
ITEM 6 – Schedule of Investments
Not applicable, insofar as the schedule is included as part of the report to shareholders filed under Item 1 of this Form.
ITEM 7 – Disclosure of Proxy Voting Policies and Procedures for Closed-End Management Investment Companies
Not applicable to this Registrant, insofar as the Registrant is not a closed-end management investment company.
ITEM 8 – Portfolio Managers of Closed-End Management Investment Companies
Not applicable to this Registrant, insofar as the Registrant is not a closed-end management investment company.
ITEM 9 – Purchases of Equity Securities by Closed-End Management Investment Company and Affiliated Purchasers
Not applicable to this Registrant, insofar as the Registrant is not a closed-end management investment company.
ITEM 10 – Submission of Matters to a Vote of Security Holders
There have been no material changes to the procedures by which shareholders may recommend nominees to the Registrant’s board of trustees since the Registrant last submitted a proxy statement to its shareholders. The procedures are as follows. The Registrant has a nominating and governance committee comprised solely of persons who are not considered ‘‘interested persons’’ of the Registrant within the meaning of the Investment Company Act of 1940, as amended. The committee periodically reviews such issues as the board’s composition, responsibilities, committees, compensation and other relevant issues, and recommends any appropriate changes to the full board of trustees. While the committee normally is able to identify from its own resources an ample number of qualified candidates, it will consider shareholder suggestions of persons to be considered as nominees to fill future vacancies on the board. Such suggestions must be sent in writing to the nominating and governance committee of the Registrant, c/o the Registrant’s Secretary, and must be accompanied by complete biographical and occupational data on the prospective nominee, along with a written consent of the prospective nominee for consideration of his or her name by the nominating and governance committee.
ITEM 11 – Controls and Procedures
| (a) | The Registrant’s Principal Executive Officer and Principal Financial Officer have concluded, based on their evaluation of the Registrant’s disclosure controls and procedures (as such term is defined in Rule 30a-3 under the Investment Company Act of 1940), that such controls and procedures are adequate and reasonably designed to achieve the purposes described in paragraph (c) of such rule. |
| (b) | There were no changes in the Registrant’s internal controls over financial reporting (as defined in Rule 30a-3(d) under the Investment Company Act of 1940) that occurred during the Registrant’s semi-annual period covered by this report that has materially affected, or is reasonably likely to materially affect, the Registrant’s internal control over financial reporting.
|
ITEM 12 – Exhibits
| (a)(1) | The Code of Ethics that is the subject of the disclosure required by Item 2 is attached as an exhibit hereto. |
| (a)(2) | The certifications required by Rule 30a-2 of the Investment Company Act of 1940 and Sections 302 and 906 of the Sarbanes-Oxley Act of 2002 are attached as exhibits hereto. |
SIGNATURES
Pursuant to the requirements of the Securities Exchange Act of 1934 and the Investment Company Act of 1940, the Registrant has duly caused this report to be signed on its behalf by the undersigned, thereunto duly authorized.
| CAPITAL GROUP FIXED INCOME ETF TRUST | |
| By __/s/ Walter R. Burkley________________ | |
Walter R. Burkley, Principal Executive Officer | |
| Date: February 29, 2024 |
Pursuant to the requirements of the Securities Exchange Act of 1934 and the Investment Company Act of 1940, this report has been signed below by the following persons on behalf of the Registrant and in the capacities and on the dates indicated.
| By _ /s/ Walter R. Burkley_____________ |
Walter R. Burkley, Principal Executive Officer |
| Date: February 29, 2024 |
| By ___/s/ Troy S. Tanner__________________ |
Troy S. Tanner, Treasurer and Principal Financial Officer |
| Date: February 29, 2024 |