UNITED STATES
SECURITIES AND EXCHANGE COMMISSION
Washington, D.C. 20549
FORM N-CSR
CERTIFIED SHAREHOLDER REPORT OF REGISTERED
MANAGEMENT INVESTMENT COMPANIES
Investment Company Act file number 811-23715
OAKTREE DIVERSIFIED INCOME FUND INC.
(Exact name of registrant as specified in charter)
Brookfield Place
250 Vesey Street, 15th Floor
New York, New York 10281-1023
(Address of principal executive offices) (Zip code)
Brian F. Hurley, Esq.
Brookfield Public Securities Group LLC
Brookfield Place
225 Liberty Street, 35th Floor
New York, New York 10281
(Name and address of agent for service)
(855) 777-8001
Registrant's telephone number, including area code
Date of fiscal year end: December 31
Date of reporting period: December 31, 2023
Item 1. Reports to Stockholders.
(a)

2023
ANNUAL REPORT
DECEMBER 31, 2023
Oaktree Diversified Income Fund Inc.
* Please see inside front cover of the report for important information regarding delivery of shareholder reports.
IN PROFILE
Oaktree Fund Advisors, LLC (the "Adviser" or "Oaktree") is an investment adviser registered with the SEC and is also an affiliate and related adviser of Oaktree Capital Management, L.P., an investment adviser registered with the SEC. Oaktree serves as the investment adviser to the Fund. Oaktree was founded in April 1995 and is a leader among global investment managers specializing in alternative investments. Oaktree manages assets across a wide range of investment strategies within four asset classes: Credit, Private Equity, Real Assets, and Listed Equities. As of December 31, 2023, Oaktree had $189 billion in assets under management. Brookfield Public Securities Group LLC ("PSG") serves as the Administrator to the Fund. PSG is an indirect wholly-owned subsidiary of Brookfield Asset Management ULC with $900 billion of assets under management as of December 31, 2023, an unlimited liability company formed under the laws of British Columbia, Canada ("BAM ULC"). Brookfield Corporation, a publicly traded company (NYSE: BN; TSX: BN), holds a 75% interest in BAM ULC, while Brookfield Asset Management Ltd., a publicly traded company (NYSE: BAM; TSX: BAMA) ("Brookfield Asset Management"), holds a 25% interest in BAM ULC. In 2019, Brookfield acquired a majority interest in Oaktree.
Oaktree Diversified Income Fund Inc. (the "Fund") is managed by Oaktree Fund Advisors, LLC. The Fund uses its website as a channel of distribution of material company information. Financial and other material information regarding the Fund is routinely posted on and accessible at https://publicsecurities.brookfield.com/products/us-interval-funds/oaktree-diversified-income-fund?id=192692
As permitted by regulations adopted by the Securities and Exchange Commission, paper copies of the Fund's annual and semi-annual shareholder reports will no longer be sent by mail, unless you specifically request paper copies of the reports. Instead, the reports will be made available on the Fund's website (https://publicsecurities.brookfield.com/en), and you will be notified by mail each time a report is posted and provided with a website link to access the report.
If you already elected to receive shareholder reports electronically, you will not be affected by this change and you need not take any action. You may elect to receive shareholder reports and other communications from the Fund electronically anytime by contacting your financial intermediary (such as a broker, investment adviser, bank or trust company) or, if you are a direct investor, by calling the Fund (toll-free) at 1-855-777-8001 or by sending an e-mail request to the Fund at publicsecurities.enquiries@brookfield.com.
You may elect to receive all future reports in paper free of charge. If you invest through a financial intermediary, you may contact your financial intermediary to request that you continue to receive paper copies of your shareholder reports. If you invest directly with the Fund, you may call 1-855-777-8001 or send an email request to publicsecurities.enquiries@brookfield.com to let the Fund know you wish to continue receiving paper copies of your shareholder reports. Your election to receive reports in paper will apply to all funds held in your account if you invest through your financial intermediary or all funds held within the fund complex if you invest directly with the Fund.
TABLE OF CONTENTS
Letter to Shareholders | 1 | ||||||
Management Discussion of Fund Performance | 3 | ||||||
| Portfolio Characteristics | 6 | ||||||
| Consolidated Schedule of Investments | 7 | ||||||
| Consolidated Statement of Assets and Liabilities | 42 | ||||||
| Consolidated Statement of Operations | 43 | ||||||
| Consolidated Statements of Changes in Net Assets | 44 | ||||||
| Consolidated Statement of Cash Flows | 45 | ||||||
| Consolidated Financial Highlights | 46 | ||||||
| Notes to Consolidated Financial Statements | 47 | ||||||
| Report of Independent Registered Public Accounting Firm | 61 | ||||||
| Tax Information | 62 | ||||||
| Information Concerning Directors and Officers | 63 | ||||||
| Dividend Reinvestment Plan | 66 | ||||||
| Joint Notice of Privacy Policy | 67 | ||||||
This report is for shareholder information. This is not a Prospectus intended for use in the purchase or sale of Fund shares.
NOT FDIC INSURED | MAY LOSE VALUE | NOT BANK GUARANTEED | |||||||||
[THIS PAGE IS INTENTIONALLY LEFT BLANK]
LETTER TO SHAREHOLDERS
Dear Shareholders,
We are pleased to provide the Annual Report for the Oaktree Diversified Income Fund (the "Fund") for the year ended December 31, 2023.
Personal Consumption Expenditure (PCE) inflation continued to ease in the latter half of the year, and the widely anticipated recession did not materialize. As a result, global equity and credit markets delivered strong returns, but with several ups and downs in what was a volatile and eventful year. Market participants grappled with fundamental data and its implications for interest rates across developed markets, especially in the U.S. where expectations for the future path of policy rates evolved drastically.
Looking back to the first half of the year, U.S. regional banking turmoil drove speculations about a potential pause in the Federal Reserve's hiking cycle. However, the central bank maintained its hawkish stance in the face of resilient economic data. Interest rates continued their climb in the second and third quarters, with the the 10-year U.S. Treasury yield peaking in October just under 5%. Meanwhile, the ECB also hiked its deposit rate to an all-time high of 4%. In the fourth quarter, we observed evidence of easing inflation, dovish rhetoric from the Fed, and a growing consensus among investors that the U.S. economy may avoid a recession. As a result, the yield on 10-year U.S. Treasurys fell 45 bps to end the year below 4% and 1-year inflation expectations fell to the Fed's target of 2.0%. Expectations of rate cuts in 2024 also increased — the Summary of Economic Projections from the December FOMC meeting suggested 75 bps of rate cuts in 2024, while futures markets priced in double that amount on September 30, 2023. Against this backdrop, global equities surged 4.9% in December. Fixed income markets also rallied in response to lower rates and tighter credit spreads: global investment grade and high yield bonds returned 3.7% and 3.5%, respectively, outperforming shorter-duration global senior loans, which gained 1.6% at year-end. Notably, this outperformance caused high yield bonds to outperform senior loans for the full year period, a reversal in trend from the first half of the year in which higher rates fueled the performance of floating-rate assets. Overall, it was a great period to be invested in credit, which delivered equity-like returns to investors, with less than commensurate risk.
The Fund's diversified asset mix of both public and private debt provided investors with a net return of 11.76% during the period. High income was generated from the portfolio's nearly 70% allocation to floating-rate debt given interest rates remain above the ten-year average. Collateralized loan obligations (CLOs) were standout performers, especially the BBB- and BB-rated tranches we emphasized. Other structured credit also performed well, including hospitality-related single asset single borrower (SASB) commercial mortgage-backed securities (CMBS). Senior loans and high yield bonds also contributed positively, earning an attractive coupon and benefitting from spread compression both in the U.S. and Europe. Falling rates late in the period were a tailwind for high yield bonds and other fixed rate assets in the portfolio. Steady private credit performance was attributed to strength in a variety of sectors, but consumer discretionary and information technology did particularly well. The portfolio's allocation to global convertibles also benefitted from strength in equity markets during the period, helped by exposures in the U.S., Europe, and Asia. Our emerging markets exposure was modestly negative in what was a volatile period, particularly for Chinese corporates.
Looking ahead to 2024, we remain optimistic about credit delivering equity-like returns. While the high yield market experienced a robust rally at the end of 2023, the asset class remains attractive due to several important factors: high expected return, quality, and convexity. The average yield-to-maturity in the asset class is near 8% — which is well above the ten-year average — and compelling compared to the roughly 5.0% offered in the investment grade bond market. Around half of the asset class is rated BB (the credit rating tier just below investment grade) and only 11% is rated CCC (the lowest tier), compared to 45% and 17%, respectively, a decade ago. This quality advantage partly reflects the increase in the average size of high yield bond issuers in the last decade. Additionally, leverage ratios in the asset class are fairly healthy compared to the pre-pandemic and long-term averages. U.S. high yield bonds also still trade at an average price of 92 cents on the dollar, and their average duration is 3.3 years, roughly half the average duration of investment grade bonds. Thus, high yield bonds should benefit meaningfully from the pull to par in the coming years as bonds mature. Additionally, all fixed rate assets, including high yield bonds, should be better positioned than they were in recent years now that the likelihood of near-term interest rate increases has fallen sharply.
2023 Annual Report
1
LETTER TO SHAREHOLDERS (continued)
We also expect opportunities to continue to emerge as a result of weakness in the banking system. In recent years, banks have had to contend with multiple challenges, including enormous sums of hung bridge debt, weak commercial real estate books, and uncertainty surrounding potential regulatory changes. Thus, banks have often reduced their lending activities, including in the areas they previously dominated. This has created the potential for alternative lenders to gain share in new markets that are uncorrelated or only modestly correlated with traditional corporate lending deals. We believe this should keep our pipeline of private credit opportunities strong. Overall, we believe the portfolio is well-positioned with a yield-to-worst over 11%, an average price in the mid-90s, and less than one year duration. We believe the Fund's emphasis on credit quality and its diversification may help mitigate risk, positioning it to seek long-term income and capital appreciation. We believe that a focus on potential downside risk is as important today as ever, and we are positioning the portfolio so that it will do well even if shocks develop. We believe this approach will prove especially beneficial in today's uncertain environment.
In addition to performance information and additional discussion of factors impacting the Fund, this report provides the Fund's audited financial statements and schedules of investments as of December 31, 2023.
We welcome your questions and comments and encourage you to contact our Investor Relations team at 1-855-777-8001 or visit us at https://publicsecurities.brookfield.com/en for more information.
Thank you for your support.
Sincerely,
|
| ||||||
Brian F. Hurley | David W. Levi, CFA | ||||||
President | Chief Executive Officer | ||||||
Oaktree Diversified Income Fund Inc. | Brookfield Public Securities Group LLC | ||||||


1 Yield reflects yield to worst. Yield to worst is a measure of the lowest possible yield that can be received on a bond that fully operates within the terms of its contract without defaulting.
These views represent the opinions of Oaktree Fund Advisors, LLC and are not intended to predict or depict the performance of any investment. These views are primarily as of the close of business on December 31, 2023, and subject to change based on subsequent developments.
Must be preceded or accompanied by a Prospectus.
Past performance is no guarantee of future results.
Investing involves risk. Principal loss is possible. Real assets includes real estate securities, infrastructure securities and natural resources securities. Property values may fall due to increasing vacancies or declining rents resulting from unanticipated economic, legal, cultural or technological developments. Infrastructure companies may be subject to a variety of factors that may adversely affect their business, including high interest costs, high leverage, regulation costs, economic slowdown, surplus capacity, increased competition, lack of fuel availability and energy conservation policies. Natural resources securities may be affected by numerous factors, including events occurring in nature, inflationary pressures and international politics.
Quasar Distributors, LLC is the distributor of Oaktree Diversified Income Fund Inc.
2
OAKTREE DIVERSIFIED INCOME FUND INC.
MANAGEMENT DISCUSSION OF FUND PERFORMANCE
The Oaktree Diversified Income Fund (the "Fund") Class D shares returned 11.76% for the year ended December 31, 2023 (net of fees). The Fund generated high income from its nearly 70% allocation to floating-rate debt given higher interest rates. Collateralized loan obligations (CLOs) were standout performers, especially the BBB- and BB-rated tranches we emphasized. Other structured credit also performed well, including hospitality-related single asset single borrower (SASB) commercial mortgage-backed securities (CMBS). Senior loans and high yield bonds also contributed positively, earning an attractive coupon and benefitting from spread compression both in the U.S. and Europe. Falling rates late in the year were also a tailwind for high yield bonds and other fixed-rate assets in the portfolio. Steady private credit performance was attributed to strength in a variety of sectors, but consumer discretionary and information technology did particularly well. The portfolio's allocation to global convertibles also benefitted from strength in equity markets during the period, helped by exposures in the U.S., Europe, and Asia. Our emerging markets exposure was modestly negative in what was a volatile period, particularly for Chinese corporates.
The Fund's largest sector allocations at the end of 2023 were software (8.5%), hotels, restaurants & leisure (5.9%), commercial services & supplies (5.4%), and healthcare providers and services (4.4%). At the end of 2023, the Fund's investments had an average yield of 11.15%1 an average price in the mid-90s, and an effective duration of less than one year. We believe this profile reflects significant upside potential for both yield and return, balanced against the risk that interest rates could continue rising.
GLOBAL CREDIT MARKET OVERVIEW
Inflationary pressures eased in 2023, and the widely anticipated recession did not materialize. As a result, global equity and credit markets delivered strong returns, but with several ups and downs in what was a volatile and eventful year. Market participants grappled with fundamental data and its implications for interest rates across developed markets, driving volatility in bond markets as expectations on the future path of policy rates continued to evolve throughout the year. A strong rally in risk assets at the start of the year stumbled in February and March as i) evidence of persistent inflation-biased rates higher and ii) the highly publicized collapse of Silicon Valley Bank and takeover of Credit Suisse led to fears of contagion across the financial system. The regional banking turmoil also drove speculations about a potential pause in the central banks' hiking cycle, which were soon disappointed by their continued hawkish stance amid resilient economic data. Interest rates continued to climb in the second and third quarters, with the ECB hiking its deposit rate to an all-time high of 4% and the 10-year U.S. Treasury yield peaking in October just under 5%. However, evidence of decelerating inflation led the Fed to turn more dovish at the December FOMC meeting, prompting a material rally in interest rates and risk assets through the end of the year amid growing optimism among investors that a soft landing can be achieved. In all, credit markets performed well despite interest rate volatility: Global senior loans and high yield bonds gained 13.5% and 13.0%, respectively, outperforming global investment grade bonds, which returned 9.0%.
OUTLOOK
Looking ahead to 2024, we remain optimistic about credit delivering equity-like returns. We continue to look for opportunities to balance a high current income with the potential for price appreciation across credit asset classes. As we assess relative value opportunities within our core strategies, we are currently favoring high yield bonds relative to senior loans for incremental deployment. Within our alpha strategies, CLOs and private credit continue to offer some of the most attractive risk-adjusted return potential in the portfolio over the next 12 months. Overall, we believe that the Fund is well-positioned heading into the new year and that its focus on credit quality and diversification may help mitigate risk, positioning it to seek long-term income and capital appreciation. We believe that a focus on potential downside risk is as important today as ever, and we are positioning the portfolio so that it will do well even if shocks develop. We believe this approach will prove especially beneficial in today's uncertain environment.
1 Source: Oaktree. Yield reflects yield to worst. Yield to worst is a measure of the lowest possible yield that can be received on a bond that fully operates within the terms of its contract without defaulting.
Past performance is no guarantee of future results.
2023 Annual Report
3
OAKTREE DIVERSIFIED INCOME FUND INC.
AVERAGE ANNUAL TOTAL RETURNS
As of December 31, 2023 | 1 Year | Since Inception* | |||||||||
Class D Shares | 11.76 | % | 1.56 | % | |||||||
S&P/LSTA Leveraged Loan Index | 13.11 | % | 5.72 | % | |||||||
* Class D Shares commenced operations on November 1, 2021.
The graph below illustrates a hypothetical investment of $10,000 in the Fund from the commencement of investment operations on November 1, 2021 to December 31, 2023 compared to the S&P/LSTA Leverage Loan Index.
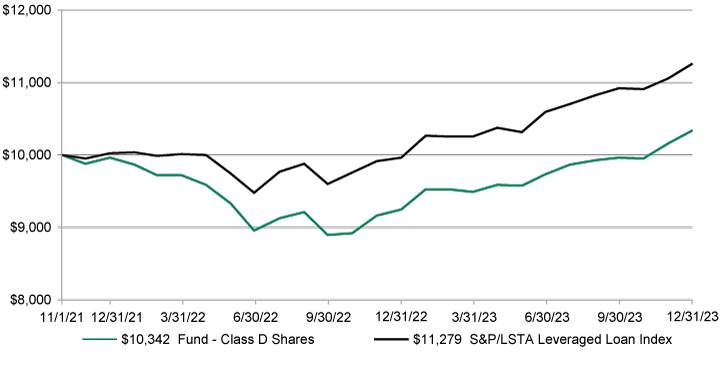
The table and graphs do not reflect the deduction of taxes that a shareholder would pay on fund distributions or the redemption of fund shares.
Disclosure
All returns shown in USD.
S&P/LSTA (Loans Syndications and Trading Association) Leveraged Loan Index tracks the largest leveraged-loan-to-market facilities, considering market weightings, spreads and interest payments.
An index does not reflect any fees, expenses or sales charges. It is not possible to invest directly in an index. Index performance is shown for illustrative purposes only and does not predict or depict the performance of the Fund.
The Fund's portfolio holdings are subject to change without notice. The mention of specific securities is not a recommendation or solicitation for any person to buy, sell or hold any particular security. There is no assurance that the Fund currently holds these securities. Please refer to the Schedule of Investments contained in this report for a full listing of fund holdings.
Performance data quoted represents past performance and is no guarantee of future results. Investment return and principal value of an investment will fluctuate so that an investor's shares, when redeemed, may be worth more or less than their original cost. Current performance may be lower or higher than the performance data quoted. Performance includes the reinvestment of income, dividends and capital gain distributions. To obtain performance
4
OAKTREE DIVERSIFIED INCOME FUND INC.
information current to the most recent month-end, please call 1-855-862-5873. Performance reflects management fees and other fund expenses.
An investor should consider the Fund's investment objectives, risks, charges and expenses carefully before investing.
The Fund is subject to investment risks, including the possible loss of principal invested. Investing involves risk, and principal loss is possible. The Adviser employs an active approach to allocation across multiple credit sectors, but there is no guarantee that such allocation techniques will produce the desired results. General interest rate fluctuations may have a substantial negative impact on the Fund's investments and investment opportunities, and, accordingly, may have a material adverse effect on the Fund's rate of return. The Fund may invest in foreign securities, including, but not limited to, risk related to exchange rate changes, political and economic upheaval, and relatively low market liquidity, all of which are magnified in emerging markets. The Fund intends to invest in illiquid investments which can face significant difficulties and delays associated with such transactions, and the Fund may be unable to sell other illiquid investments when it desires to do so, resulting in the Fund obtaining a lower price or being required to retain the investment. Investments in derivatives involve special risks including correlation, counterparty, liquidity, operational, accounting and tax risks. These risks, in certain cases, may be greater than the risks presented by more traditional investments.
High-yield debt securities rated below investment grade are commonly referred to as "junk bonds" and are considered speculative. Investment by the Fund in lower-rated and non-rated securities presents a greater risk of loss to principal and interest than higher-rated securities. Bank loans (including senior loans) are usually rated below investment grade, and the market for bank loans may be subject to irregular trading activity, wide bid/ask spreads, restrictions on resale, and extended trade settlement periods. The Fund's investments in senior loans may be subject to greater levels of credit risk, call risk, settlement risk and liquidity risk than funds that do not invest in such securities. The Fund may invest in distressed securities of corporate issuers that are the subject of bankruptcy proceedings or otherwise in default as to the repayment of principal and/or interest or in significant risk of being in such default which is speculative and involves significant risk. Distressed Securities frequently do not produce income while they are outstanding and may require the Fund to bear certain extraordinary expenses in order to protect and recover its investment. The Fund may invest in loans that may be "covenant-lite," generally loans that do not have financial maintenance covenants, which can cause the Fund to have fewer rights against a borrower and may have a greater risk of loss on such investments.
The Fund may invest in a variety of mortgage related and other asset-backed securities, which are subject to greater price volatility in relation to interest rate movements. Residential mortgage backed securities (RMBS) may be subject to prepayment risk, meaning that securities may be paid off more quickly than originally anticipated and the Fund will have to invest the proceeds in securities with lower yields. Commercial mortgage backed securities (CMBS) may be subject to extension risk, meaning that the value of CMBS may be adversely affected in rising interest rate environments when payments on underlying mortgages do not occur as anticipated, resulting in the extension of the security's effective maturity and the related increase in interest rate sensitivity of a longer-term instrument. Investments in collateralized loan obligations (CLOs) carry additional risks including, but not limited to: 1) the possibility that distributions from collateral securities will not be adequate to make interest or other payments; 2) the quality of the collateral may decline in value or default; 3) the possibility that the Fund may invest in CLOs that are subordinate to other classes; and 4) the complex structure of the security may produce disputes with the issuer or unexpected investment results.
Short term performance in particular is not a good indication of the Fund's future performance and an investment should not be made based solely on returns.
These views represent the opinions of Oaktree Fund Advisors, LLC and are not intended to predict or depict the performance of any investment. These views are as of the close of business on December 31, 2023 and subject to change based on subsequent developments.
2023 Annual Report
5
OAKTREE DIVERSIFIED INCOME FUND INC.
Portfolio Characteristics (Unaudited)
December 31, 2023
ASSETS BY SECTOR1 | |||||||
Corporate Credit | |||||||
| — Senior Loans (Syndicated) | 29.7 | % | |||||
| — High Yield | 19.0 | % | |||||
| — Emerging Markets | 2.4 | % | |||||
| — Convertible Bonds | 0.6 | % | |||||
| — Investment Grade | 0.0 | % | |||||
Total Corporate Credit | 51.7 | % | |||||
Structured Credit | |||||||
| — Collateralized Loan Obligations | 15.9 | % | |||||
| — Commercial Mortgage-Backed Securities | 3.9 | % | |||||
| — Residential Mortgage-Backed Securities | 2.4 | % | |||||
| — Asset-Backed Securities | 4.0 | % | |||||
Total Structured Credit | 26.2 | % | |||||
Private Credit | |||||||
| — Senior Loans | 18.2 | % | |||||
| — Preferred Stock | 0.8 | % | |||||
| — Common Stock | 0.1 | % | |||||
| — Warrants | 0.0 | % | |||||
Total Private Credit | 19.1 | % | |||||
Money Market Fund | 3.0 | % | |||||
Total | 100.0 | % | |||||
ASSETS BY GEOGRAPHY1 | |||||||
North America | 82.9 | % | |||||
Europe Ex UK | 8.3 | % | |||||
UK | 4.7 | % | |||||
Asia Ex Japan | 2.2 | % | |||||
South America | 1.6 | % | |||||
Africa | 0.3 | % | |||||
Total | 100.0 | % | |||||
1 Percentages are based on total market value of investments.
6
OAKTREE DIVERSIFIED INCOME FUND INC.
Consolidated Schedule of Investments
December 31, 2023
Description | Country | Principal Amount | Value | ||||||||||||
CORPORATE CREDIT – 59.6% | |||||||||||||||
Senior Loans (Syndicated) – 34.1% | |||||||||||||||
Aerospace & Defense – 1.2% | |||||||||||||||
| AI Convoy Luxembourg Sarl, First Lien Tranche B Term Loan 7.08% (3 Month EURIBOR + 3.75%), 01/18/27 (b) | Luxembourg | € | 240,000 | $ | 259,511 | ||||||||||
| Cobham Ultra US Company Borrower LLC, First Lien Tranche B Term Loan 9.36% (6 Month SOFR + 3.50%), 11/16/28 (b) | Luxembourg | $ | 738,811 | 729,944 | |||||||||||
| Dynasty Acquisition Company, Inc., First Lien Tranche B2 Term Loan 9.35% (1 Month SOFR + 4.00%), 08/31/28 (b) | United States | 193,022 | 193,763 | ||||||||||||
| Dynasty Acquisition Company, Inc., First Lien Tranche B1 Term Loan 9.35% (1 Month SOFR + 4.00%), 08/31/38 (b) | United States | 450,385 | 452,113 | ||||||||||||
| Peraton Corp, First Lien Tranche B Term Loan 9.20% (1 Month SOFR + 3.75%), 02/01/28 (b) | United States | 562,928 | 565,039 | ||||||||||||
| TransDigm, First Lien Tranche I Term Loan 8.64% (3 Month SOFR + 3.25%), 08/15/28 (b) | United States | 621,867 | 625,477 | ||||||||||||
Total Aerospace & Defense | 2,825,847 | ||||||||||||||
Automobile Components – 0.2% | |||||||||||||||
| First Brands Group LLC, First Lien Tranche B Term Loan 10.88% (6 Month SOFR + 5.00%), 03/24/27 (b) | United States | 494,911 | 491,817 | ||||||||||||
Automobiles – 0.2% | |||||||||||||||
| MajorDrive Holdings IV LLC, First Lien Tranche B Term Loan 9.65% (3 Month SOFR + 4.00%), 06/01/28 (b) | United States | 497,449 | 496,828 | ||||||||||||
Beverages – 0.7% | |||||||||||||||
| Pegasus Bidco BV, First Lien Tranche B Term Loan 8.03% (3 Month EURIBOR + 4.25%), 07/12/29 (b) | Netherlands | € | 250,000 | 277,337 | |||||||||||
9.63% (3 Month SOFR + 4.25%), 04/20/29 (b) | Netherlands | $ | 495,000 | 496,005 | |||||||||||
| Triton Water Holdings, Inc., First Lien Tranche B Term Loan 8.90% (3 Month SOFR + 3.25%), 03/31/28 (b) | United States | 733,085 | 727,586 | ||||||||||||
Total Beverages | 1,500,928 | ||||||||||||||
Building Products – 0.1% | |||||||||||||||
| Aquiles Spain Bidco SA, First Lien Tranche B Term Loan 8.14% (6 Month EURIBOR + 4.85%), 02/19/29 (b) | Spain | € | 300,000 | 314,556 | |||||||||||
Chemicals – 1.0% | |||||||||||||||
| Ineos Enterprises Holdings II Ltd., First Lien Tranche B Term Loan 7.96% (3 Month EURIBOR + 4.00%), 06/23/30 (b) | United States | 250,000 | 275,771 | ||||||||||||
| INEOS Finance PLC, First Lien Tranche B Term Loan 7.85% (1 Month EURIBOR + 4.00%), 11/03/27 (b) | Luxembourg | 247,403 | 273,365 | ||||||||||||
See Notes to Consolidated Financial Statements.
2023 Annual Report
7
OAKTREE DIVERSIFIED INCOME FUND INC.
Consolidated Schedule of Investments (continued)
December 31, 2023
Description | Country | Principal Amount | Value | ||||||||||||
CORPORATE CREDIT (continued) | |||||||||||||||
| Ineos Quattro Holdings UK Ltd., First Lien Tranche B Term Loan 8.35% (1 Month EURIBOR + 4.50%), 04/03/29 (b) | United States | € | 250,000 | $ | 271,847 | ||||||||||
| SCIH Salt Holdings, Inc., First Lien Tranche B Term Loan 9.44% (1 Month SOFR + 4.00%), 03/16/27 (b) | United States | $ | 904,007 | 906,620 | |||||||||||
| Windsor Holdings III LLC, First Lien Tranche B Term Loan 8.38% (1 Month EURIBOR + 4.50%), 08/01/30 (b) | United States | € | 160,000 | 178,011 | |||||||||||
9.82% (1 Month SOFR + 4.50%), 08/01/30 (b) | United States | $ | 299,250 | 301,868 | |||||||||||
Total Chemicals | 2,207,482 | ||||||||||||||
Commercial Services & Supplies – 2.7% | |||||||||||||||
| Access CIG LLC, First Lien Term Loan 10.39% (3 Month SOFR + 5.00%), 08/15/28 (b) | United States | 947,625 | 950,392 | ||||||||||||
| Allied Universal Holdco LLC, First Lien Tranche B Term Loan 9.20% (1 Month SOFR + 3.75%), 05/12/28 (b) | United States | 822,799 | 820,668 | ||||||||||||
| American Auto Auction Group LLC, Second Lien Term Loan 14.14% (3 Month SOFR + 8.75%), 12/30/28 (b) | United States | 483,000 | 451,605 | ||||||||||||
| Apleona Holding GmbH, First Lien Tranche B Term Loan 8.65% (3 Month EURIBOR + 4.70%), 04/28/28 (b) | Germany | € | 145,000 | 160,823 | |||||||||||
| Atlas Luxco 4 SARL, First Lien Tranche B Term Loan 7.62% (1 Month EURIBOR + 3.75%), 05/12/28 (b) | Luxembourg | 246,843 | 265,315 | ||||||||||||
| Freshworld Holding III GMBH, First Lien Tranche B Term Loan 7.49% (3 Month EURIBOR + 3.75%), 10/02/26 (b) | Germany | 250,000 | 273,211 | ||||||||||||
| Garda World Security Corp., First Lien Tranche B Term Loan 9.75% (3 Month SOFR + 4.25%), 10/30/26 (b) | Canada | $ | 1,000,000 | 1,003,049 | |||||||||||
| Restaurant Technologies, Inc., First Lien Tranche B Term Loan 9.64% (3 Month SOFR + 4.25%), 03/17/29 (b) | United States | 875,282 | 869,155 | ||||||||||||
| TMS International Corp., First Lien Tranche B Term Loan 10.11% (1 Month SOFR + 4.75%), 03/07/30 (b) | United States | 496,250 | 499,972 | ||||||||||||
| Trugreen LP, First Lien Tranche B Term Loan 9.45% (1 Month SOFR + 4.00%), 10/29/27 (b) | United States | 610,575 | 590,884 | ||||||||||||
| USIC Holdings Inc., First Lien Tranche B Term Loan 8.94% (3 Month SOFR + 3.50%), 05/31/28 (b) | United States | 322,351 | 320,417 | ||||||||||||
Total Commercial Services & Supplies | 6,205,491 | ||||||||||||||
Communications Equipment – 0.6% | |||||||||||||||
| Genesys Cloud Services Holdings II LLC, First Lien Tranche B Term Loan 9.46% (1 Month SOFR + 4.00%), 12/01/27 (b) | United States | 745,532 | 749,323 | ||||||||||||
| Sorenson Communications LLC, First Lien Tranche B Term Loan 10.96% (1 Month SOFR + 5.50%), 03/17/26 (b) | United States | 619,399 | 618,111 | ||||||||||||
Total Communications Equipment | 1,367,434 | ||||||||||||||
See Notes to Consolidated Financial Statements.
8
OAKTREE DIVERSIFIED INCOME FUND INC.
Consolidated Schedule of Investments (continued)
December 31, 2023
Description | Country | Principal Amount | Value | ||||||||||||
CORPORATE CREDIT (continued) | |||||||||||||||
Construction & Engineering – 1.1% | |||||||||||||||
| ADB Companies LLC, First Lien Term Loan 12.00% (3 Month SOFR + 6.50%), 12/18/25 (b) (c) | United States | $ | 1,199,966 | $ | 1,172,487 | ||||||||||
| Artera Services LLC, First Lien Term Loan 8.99% (3 Month SOFR + 3.50%), 03/06/25 (b) | United States | 585,461 | 552,804 | ||||||||||||
| Tiger Acquisition LLC, First Lien Tranche B Term Loan 8.70% (1 Month SOFR + 3.25%), 06/01/28 (b) | United States | 736,809 | 734,584 | ||||||||||||
Total Construction & Engineering | 2,459,875 | ||||||||||||||
Consumer Staples Distribution & Retail – 0.1% | |||||||||||||||
| Bellis Acquisition Company PLC, First Lien Tranche B Term Loan 6.06% (6 Month EURIBOR + 2.75%), 02/16/26 (b) | United Kingdom | € | 250,000 | 274,855 | |||||||||||
Containers & Packaging – 1.1% | |||||||||||||||
| Charter Next Generation, Inc., First Lien Tranche B Term Loan 9.21% (1 Month SOFR + 3.75%), 12/01/27 (b) | United States | $ | 994,891 | 1,000,647 | |||||||||||
| Clydesdale Acquisition Holdings, Inc., First Lien Tranche B Term Loan 9.62% (1 Month SOFR + 4.18%), 06/30/29 (b) | United States | 474,037 | 476,703 | ||||||||||||
| Kouti BV, First Lien Tranche B Term Loan 8.53% (3 Month EURIBOR + 4.75%), 08/31/28 (b) | Netherlands | € | 200,000 | 221,963 | |||||||||||
| ProAmpac LLC, First Lien Tranche B Term Loan 9.87% (3 Month SOFR + 4.50%), 09/15/28 (b) | United States | $ | 913,644 | 916,499 | |||||||||||
Total Containers & Packaging | 2,615,812 | ||||||||||||||
Distributors – 0.5% | |||||||||||||||
| American Tire Distributors, Inc., First Lien Tranche B Term Loan 11.91% (3 Month SOFR + 6.25%), 10/08/28 (b) | United States | 434,222 | 365,506 | ||||||||||||
| Dealer Tire Financial LLC, First Lien Tranche B2 Term Loan 9.85% (1 Month SOFR + 4.50%), 12/14/27 (b) | United States | 654,600 | 657,670 | ||||||||||||
Total Distributors | 1,023,176 | ||||||||||||||
Diversified Consumer Services – 2.6% | |||||||||||||||
| AI Aqua Merger Sub, Inc., First Lien Tranche B Term Loan 9.07% (1 Month SOFR + 3.75%), 07/31/28 (b) | United States | 495,082 | 496,078 | ||||||||||||
9.58% (CME Term SOFR 1 Month + 4.25%), 07/31/28 (b) | United States | 400,000 | 402,500 | ||||||||||||
| Houghton Mifflin Harcourt Co., First Lien Tranche B Term Loan 10.70% (1 Month SOFR + 5.25%), 04/04/29 (b) | United States | 344,265 | 338,548 | ||||||||||||
| KUEHG Corp., First Lien Term Loan 10.39% (3 Month SOFR + 5.00%), 05/31/30 (b) | United States | 652,365 | 656,035 | ||||||||||||
| Lakeshore Learning, First Lien Tranche B Term Loan 8.96% (1 Month SOFR + 3.50%), 09/29/28 (b) | United States | 497,462 | 497,619 | ||||||||||||
See Notes to Consolidated Financial Statements.
2023 Annual Report
9
OAKTREE DIVERSIFIED INCOME FUND INC.
Consolidated Schedule of Investments (continued)
December 31, 2023
Description | Country | Principal Amount | Value | ||||||||||||
CORPORATE CREDIT (continued) | |||||||||||||||
| Renaissance Holdings Corp., First Lien Term Loan 10.10% (1 Month SOFR + 4.75%), 06/02/25 (b) | United States | $ | 498,750 | $ | 501,174 | ||||||||||
| University Support Services LLC, First Lien Tranche B Term Loan 8.70% (1 Month SOFR + 3.25%), 09/30/28 (b) | Canada | 2,725,888 | 2,729,636 | ||||||||||||
| Verisure Holding AB, First Lien Tranche B Term Loan 6.97% (3 Month EURIBOR + 3.00%), 03/27/28 (b) | Sweden | € | 250,000 | 274,608 | |||||||||||
Total Diversified Consumer Services | 5,896,198 | ||||||||||||||
Diversified Telecommunication Services – 0.7% | |||||||||||||||
| Altice France SA, First Lien Tranche B Term Loan 8.66% (3 Month EURIBOR + 5.00%), 10/28/27 (b) | Luxembourg | 228,275 | 245,893 | ||||||||||||
| CCI Buyer, Inc., First Lien Tranche B Term Loan 9.39% (3 Month SOFR + 4.00%), 12/31/27 (b) | United States | $ | 742,366 | 741,305 | |||||||||||
| Cincinnati Bell, Inc., First Lien Tranche B2 Term Loan 8.70% (CME Term SOFR 1 Month + 3.25%), 12/29/28 (b) | United States | 525,000 | 521,252 | ||||||||||||
| Numericable U.S. LLC, First Lien Tranche B14-EXT Term Loan 9.46% (3 Month EURIBOR + 5.50%), 08/17/28 (b) | France | € | 199,000 | 197,899 | |||||||||||
Total Diversified Telecommunication Services | 1,706,349 | ||||||||||||||
Electric Utilities – 0.2% | |||||||||||||||
| Lackawanna Energy Center LLC, First Lien Tranche B2 Term Loan 10.32% (1 Month SOFR + 5.00%), 07/20/29 (b) | United States | $ | 409,199 | 405,449 | |||||||||||
Electronic Equipment Instruments & Components – 0.6% | |||||||||||||||
| LTI Holdings, Inc., First Lien Tranche B Term Loan 8.94% (1 Month SOFR + 3.50%), 09/06/25 (b) | United States | 976,804 | 945,263 | ||||||||||||
| Sonicwall US Holdings Inc, First Lien Term Loan 10.40% (CME Term SOFR 1 Month + 5.00%), 05/31/28 (b) | United States | 500,000 | 496,250 | ||||||||||||
Total Electronic Equipment Instruments & Components | 1,441,513 | ||||||||||||||
Entertainment – 0.4% | |||||||||||||||
| City Football Group Ltd., First Lien Tranche B Term Loan 8.46% (1 Month SOFR + 3.00%), 07/21/28 (b) | United Kingdom | 893,680 | 891,075 | ||||||||||||
Financial Services – 0.3% | |||||||||||||||
| Boost Newco Borrower LLC, First Lien Tranche B Term Loan 3.75% (CME Term SOFR 1 Month + 3.00%), 09/21/30 (b) | United States | 575,000 | 578,235 | ||||||||||||
Food Products – 0.4% | |||||||||||||||
| Froneri International Ltd., First Lien Tranche B Term Loan 7.70% (1 Month SOFR + 2.25%), 01/29/27 (b) | United States | 429,773 | 430,762 | ||||||||||||
See Notes to Consolidated Financial Statements.
10
OAKTREE DIVERSIFIED INCOME FUND INC.
Consolidated Schedule of Investments (continued)
December 31, 2023
Description | Country | Principal Amount | Value | ||||||||||||
CORPORATE CREDIT (continued) | |||||||||||||||
| Upfield USA Corp., First Lien Tranche B7 Term Loan 9.93% (CME Term SOFR 1 Month + 4.75%), 01/03/28 (b) | Netherlands | $ | 500,000 | $ | 492,375 | ||||||||||
Total Food Products | 923,137 | ||||||||||||||
Health Care Equipment & Supplies – 0.5% | |||||||||||||||
| Bausch + Lomb Corp., First Lien Tranche B Term Loan 8.76% (1 Month SOFR + 3.25%), 05/05/27 (b) | United States | 895,081 | 887,812 | ||||||||||||
| Medline Borrower LP, First Lien Tranche B Term Loan 8.46% (1 Month SOFR + 3.00%), 09/29/28 (b) | United States | 240,552 | 242,036 | ||||||||||||
Total Health Care Equipment & Supplies | 1,129,848 | ||||||||||||||
Health Care Providers & Services – 2.4% | |||||||||||||||
| Baart Programs, Inc., Second Lien Tranche DD Delay Draw Term Loan 14.15% (3 Month SOFR + 8.50%), 06/11/28 (b) (c) | United States | 584,156 | 514,641 | ||||||||||||
| Baart Programs, Inc., First Lien Tranche DD Delay Draw Term Loan 10.65% (3 Month SOFR + 5.00%), 06/11/27 (b) (c) | United States | 418,690 | 403,198 | ||||||||||||
| CHG Healthcare Services, Inc., First Lien Term Loan 8.71% (1 Month SOFR + 3.25%), 10/31/28 (b) | United States | 497,455 | 498,811 | ||||||||||||
9.06% (3 Month SOFR + 3.75%), 09/29/28 (b) | United States | 500,000 | 501,615 | ||||||||||||
| Covetrus, Inc., First Lien Term Loan 10.39% (3 Month SOFR + 5.00%), 09/20/29 (b) | United States | 908,032 | 908,746 | ||||||||||||
| Electron Bidco, Inc., First Lien Term Loan 8.46% (1 Month SOFR + 3.00%), 10/31/28 (b) | United States | 497,468 | 499,334 | ||||||||||||
| HomeVi SASU, First Lien Tranche B Term Loan 7.71% (3 Month EURIBOR + 4.00%), 10/31/26 (b) | France | € | 250,000 | 256,706 | |||||||||||
| IVC Acquisition Ltd., First Lien Tranche B Term Loan 8.98% (3 Month EURIBOR + 5.00%), 11/17/28 (b) | United Kingdom | 250,000 | 276,246 | ||||||||||||
| Nidda Healthcare Holding GmbH, First Lien Tranche F Term Loan 7.31% (3 Month EURIBOR + 3.50%), 08/21/26 (b) | Germany | 250,000 | 274,846 | ||||||||||||
| Schon Klinik SE, Tranche B Term Loan 4.50%, 11/27/30 | Germany | 115,000 | 126,954 | ||||||||||||
| Southern Veterinary Partners LLC, First Lien Term Loan 9.46% (1 Month SOFR + 4.00%), 10/01/27 (b) | United States | $ | 846,408 | 844,821 | |||||||||||
| Surgery Center Holdings, Term Loan 8.86%, 12/05/30 | United States | 100,000 | 100,532 | ||||||||||||
| Vetstrategy Canada Holdings Inc, Tranche B Term Loan 10.87%, 11/16/28 | United States | 400,000 | 402,165 | ||||||||||||
Total Health Care Providers & Services | 5,608,615 | ||||||||||||||
Health Care Technology – 1.2% | |||||||||||||||
| athenaHealth Group, Inc., First Lien Tranche B Term Loan 8.60% (1 Month SOFR + 3.25%), 02/15/29 (b) | United States | 680,562 | 678,521 | ||||||||||||
See Notes to Consolidated Financial Statements.
2023 Annual Report
11
OAKTREE DIVERSIFIED INCOME FUND INC.
Consolidated Schedule of Investments (continued)
December 31, 2023
Description | Country | Principal Amount | Value | ||||||||||||
CORPORATE CREDIT (continued) | |||||||||||||||
| FinThrive Software Intermediate Holdings, Inc., Second Lien Term Loan 12.21% (1 Month SOFR + 6.75%), 12/17/29 (b) | United States | $ | 2,082,000 | $ | 1,255,966 | ||||||||||
| Polaris Newco LLC, First Lien Tranche B Term Loan 7.87% (1 Month EURIBOR + 4.00%), 06/02/28 (b) | United States | € | 244,375 | 263,427 | |||||||||||
9.46% (1 Month SOFR + 4.00%), 06/02/28 (b) | United States | $ | 550,025 | 543,355 | |||||||||||
Total Health Care Technology | 2,741,269 | ||||||||||||||
Hotels Restaurants & Leisure – 2.1% | |||||||||||||||
| Alterra Mountain Co., First Lien Tranche B Term Loan 8.96% (1 Month SOFR + 3.50%), 08/17/28 (b) | United States | 920,663 | 923,158 | ||||||||||||
| Carnival Corp., First Lien Tranche B Term Loan 8.32% (1 Month SOFR + 3.00%), 08/02/27 (b) | United States | 746,250 | 749,048 | ||||||||||||
| Entain Holdings Gibraltar Ltd., First Lien Tranche B2 Term Loan 8.99% (3 Month SOFR + 3.50%), 10/18/29 (b) | United Kingdom | 263,341 | 264,164 | ||||||||||||
| Flutter Financing BV, First Lien Tranche B Term Loan 8.90% (3 Month SOFR + 3.25%), 07/04/28 (b) | Ireland | 106,557 | 107,060 | ||||||||||||
| Flynn Restaurant Group LP, First Lien Tranche B Term Loan 9.71% (1 Month SOFR + 4.25%), 11/22/28 (b) | United States | 980,000 | 986,125 | ||||||||||||
| Inspire Brands, First Lien Tranche B Term Loan 8.45% (1 Month SOFR + 3.00%), 12/15/27 (b) | United States | 497,468 | 498,888 | ||||||||||||
| Kingpin Intermediate Holdings LLC, First Lien Tranche B Term Loan 8.85% (1 Month SOFR + 3.50%), 02/08/28 (b) | United States | 223,875 | 224,155 | ||||||||||||
| Ontario Gaming GTA LP, First Lien Tranche B Term Loan 9.64% (3 Month SOFR + 4.25%), 07/20/30 (b) | Canada | 375,000 | 377,076 | ||||||||||||
| Whatabrands LLC, First Lien Tranche B Term Loan 8.46% (1 Month SOFR + 3.00%), 08/03/28 (b) | United States | 782,351 | 784,659 | ||||||||||||
Total Hotels Restaurants & Leisure | 4,914,333 | ||||||||||||||
Household Durables – 0.1% | |||||||||||||||
| Hunter Douglas, Inc., First Lien Tranche B Term Loan 8.89% (3 Month SOFR + 3.50%), 02/09/29 (b) | Netherlands | 301,030 | 300,428 | ||||||||||||
Independent Power and Renewable Electricity Producers – 1.4% | |||||||||||||||
| Eastern Power LLC, First Lien Tranche B Term Loan 9.21% (1 Month SOFR + 3.75%), 10/02/25 (b) | United States | 500,000 | 492,850 | ||||||||||||
| Generation Bridge Northeast LLC, First Lien Tranche B Term Loan 9.60% (1 Month SOFR + 4.25%), 08/31/29 (b) | United States | 489,509 | 492,060 | ||||||||||||
| Granite Generation LLC, First Lien Tranche B Term Loan 9.21% (CME Term SOFR 1 Month + 3.75%), 11/09/26 (b) | United States | 750,000 | 749,476 | ||||||||||||
See Notes to Consolidated Financial Statements.
12
OAKTREE DIVERSIFIED INCOME FUND INC.
Consolidated Schedule of Investments (continued)
December 31, 2023
Description | Country | Principal Amount | Value | ||||||||||||
CORPORATE CREDIT (continued) | |||||||||||||||
| Helix Gen Funding LLC, First Lien Tranche B Term Loan 10.10% (3 Month SOFR + 4.75%), 12/31/27 (b) | United States | $ | 233,149 | $ | 234,141 | ||||||||||
| Lackawanna Energy Center LLC, First Lien Tranche C Term Loan 10.32% (1 Month SOFR + 5.00%), 07/20/29 (b) | United States | 88,745 | 87,931 | ||||||||||||
| Parkway Generation LLC, First Lien Tranche B Term Loan 10.18% (3 Month SOFR + 4.75%), 11/06/28 (b) | United States | 678,277 | 653,930 | ||||||||||||
| Parkway Generation LLC, First Lien Tranche C Term Loan 10.18% (3 Month SOFR + 4.75%), 11/06/28 (b) | United States | 89,876 | 86,650 | ||||||||||||
| Talen Energy Supply LLC, First Lien Tranche TLC-EXIT Term Loan 9.88% (3 Month SOFR + 4.50%), 04/20/30 (b) | United States | 123,095 | 123,967 | ||||||||||||
| Talen Energy Supply LLC, First Lien Tranche TLB-EXIT Term Loan 9.88% (3 Month SOFR + 4.50%), 04/20/30 (b) | United States | 350,145 | 352,626 | ||||||||||||
Total Independent Power and Renewable Electricity Producers | 3,273,631 | ||||||||||||||
Insurance – 0.4% | |||||||||||||||
| Asurion LLC, First Lien Tranche B10 Term Loan 9.45% (1 Month SOFR + 4.00%), 08/31/28 (b) | United States | 241,389 | 240,709 | ||||||||||||
| Asurion LLC, Second Lien Tranche B3 Term Loan 10.71% (1 Month SOFR + 5.25%), 01/31/28 (b) | United States | 350,000 | 334,541 | ||||||||||||
| HUB International Ltd., First Lien Tranche B Term Loan 9.66% (3 Month SOFR + 4.25%), 06/08/30 (b) | United States | 374,063 | 376,141 | ||||||||||||
Total Insurance | 951,391 | ||||||||||||||
Interactive Media & Services – 0.7% | |||||||||||||||
| Ancestry.com, Inc., First Lien Term Loan 9.36% (1 Month SOFR + 5.50%), 12/12/33 (b) | United States | 1,637,000 | 1,612,445 | ||||||||||||
Leisure Products – 0.4% | |||||||||||||||
| Gibson Brands, Inc., First Lien Tranche B Term Loan 10.66% (3 Month SOFR + 5.00%), 08/11/28 (b) | United States | 392,000 | 351,493 | ||||||||||||
| Peloton Interactive, First Lien Term Loan 12.48% (6 Month SOFR + 7.00%), 05/17/27 (b) | United States | 641,740 | 646,392 | ||||||||||||
Total Leisure Products | 997,885 | ||||||||||||||
Life Sciences Tools & Services – 0.4% | |||||||||||||||
| Catalent Pharma Solutions, First Lien Tranche B4 Term Loan 8.36% (1 Month SOFR + 3.00%), 02/22/28 (b) | United States | 300,000 | 300,750 | ||||||||||||
| Sotera Health Holdings LLC, First Lien Tranche B Term Loan 9.09% (1 Month SOFR + 3.75%), 12/11/26 (b) | United States | 497,500 | 498,435 | ||||||||||||
Total Life Sciences Tools & Services | 799,185 | ||||||||||||||
See Notes to Consolidated Financial Statements.
2023 Annual Report
13
OAKTREE DIVERSIFIED INCOME FUND INC.
Consolidated Schedule of Investments (continued)
December 31, 2023
Description | Country | Principal Amount | Value | ||||||||||||
CORPORATE CREDIT (continued) | |||||||||||||||
Machinery – 0.4% | |||||||||||||||
| Delachaux Group SA, First Lien Tranche B Term Loan 8.15% (3 Month EURIBOR + 4.25%), 04/16/29 (b) | United States | € | 239,144 | $ | 264,388 | ||||||||||
| Emerald Debt Merger Sub LLC, First Lien Tranche B Term Loan 8.35% (1 Month SOFR + 3.00%), 04/17/30 (b) | United States | $ | 250,373 | 251,547 | |||||||||||
| SPX FLOW, Inc., First Lien Tranche B Term Loan 9.95% (1 Month SOFR + 4.50%), 04/05/29 (b) | United States | 500,000 | 502,292 | ||||||||||||
Total Machinery | 1,018,227 | ||||||||||||||
Media – 1.9% | |||||||||||||||
| Aragorn Parent Corp., First Lien Tranche B Term Loan 9.57% (CME Term SOFR 1 Month + 4.25%), 12/14/28 (b) | United States | 650,111 | 650,316 | ||||||||||||
| Century DE Buyer LLC, First Lien Term Loan 9.58% (CME Term SOFR 1 Month + 4.00%), 09/19/30 (b) | United States | 350,000 | 351,531 | ||||||||||||
| Directv Financing LLC, First Lien Term Loan 10.65% (3 Month SOFR + 5.00%), 08/02/27 (b) | United States | 797,500 | 798,948 | ||||||||||||
| Gray Television, Inc., First Lien Tranche D Term Loan 8.46% (1 Month SOFR + 3.00%), 11/30/28 (b) | United States | 497,462 | 494,781 | ||||||||||||
| McGraw-Hill Education, Inc., First Lien Tranche B Term Loan 10.21% (1 Month SOFR + 4.75%), 07/28/28 (b) | United States | 473,096 | 473,245 | ||||||||||||
| Univision Communications, Inc., First Lien Tranche B Term Loan 9.59% (3 Month SOFR + 4.25%), 06/24/29 (b) | United States | 494,975 | 496,955 | ||||||||||||
| Virgin Media SFA Finance Ltd., First Lien Tranche L Term Loan 8.47% (Daily SONIA + 3.25%), 01/15/27 (b) | United Kingdom | £ | 135,000 | 170,981 | |||||||||||
| Virgin Media, Inc., Term Loan 7.33%, 10/15/31 | United Kingdom | € | 115,000 | 127,166 | |||||||||||
| WideOpenWest Finance, First Lien Tranche B Term Loan 8.39% (3 Month SOFR + 3.00%), 12/31/28 (b) | United States | $ | 746,826 | 694,029 | |||||||||||
Total Media | 4,257,952 | ||||||||||||||
Metals & Mining – 0.5% | |||||||||||||||
| American Rock Salt Company LLC, First Lien Tranche B Term Loan 9.46% (1 Month SOFR + 4.00%), 06/05/28 (b) | United States | 493,671 | 468,062 | ||||||||||||
| Arsenal AIC Parent, First Lien Tranche B Term Loan 9.85% (1 Month SOFR + 4.50%), 08/18/30 (b) | United States | 299,250 | 300,933 | ||||||||||||
| Vibrantz Technologies, Inc., First Lien Tranche B Term Loan 9.81% (3 Month SOFR + 4.25%), 03/30/29 (b) | United States | 470,050 | 451,591 | ||||||||||||
Total Metals & Mining | 1,220,586 | ||||||||||||||
See Notes to Consolidated Financial Statements.
14
OAKTREE DIVERSIFIED INCOME FUND INC.
Consolidated Schedule of Investments (continued)
December 31, 2023
Description | Country | Principal Amount | Value | ||||||||||||
CORPORATE CREDIT (continued) | |||||||||||||||
Oil Gas & Consumable Fuels – 0.4% | |||||||||||||||
| AL NGPL Holdings LLC, First Lien Tranche B Term Loan 8.85% (CME Term SOFR 1 Month + 3.75%), 04/14/28 (b) | United States | $ | 297,406 | $ | 297,965 | ||||||||||
| Freeport LNG Investments LLP, First Lien Tranche B Term Loan 9.09% (3 Month SOFR + 3.50%), 11/17/28 (b) | United States | 674,305 | 674,969 | ||||||||||||
Total Oil Gas & Consumable Fuels | 972,934 | ||||||||||||||
Passenger Airlines – 0.7% | |||||||||||||||
| AAdvantage Loyalty IP Ltd., First Lien Term Loan 10.43% (CME Term SOFR 3 Month + 4.75%), 04/20/28 (b) | United States | 500,000 | 514,415 | ||||||||||||
| Air Canada, First Lien Tranche B Term Loan 9.13% (3 Month SOFR + 3.50%), 08/11/28 (b) | Canada | 541,253 | 543,577 | ||||||||||||
| Mileage Plus Holdings LLC, First Lien Tranche B Term Loan 10.80% (3 Month SOFR + 5.25%), 07/30/27 (b) | United States | 141,400 | 146,450 | ||||||||||||
| United Airlines, Inc., First Lien Tranche B Term Loan 9.21% (1 Month SOFR + 3.75%), 04/21/28 (b) | United States | 389,940 | 391,890 | ||||||||||||
Total Passenger Airlines | 1,596,332 | ||||||||||||||
Pharmaceuticals – 0.4% | |||||||||||||||
| AI Sirona Luxembourg Acquisition Sarl, First Lien Tranche B Term Loan 8.85% (3 Month EURIBOR + 5.00%), 09/29/28 (b) | Czech Republic | € | 250,000 | 276,958 | |||||||||||
| Curium Bidco Sarl, First Lien Tranche B Term Loan 9.89% (3 Month SOFR + 4.50%), 07/31/29 (b) | Luxembourg | $ | 323,375 | 323,579 | |||||||||||
| Pharmanovia Bidco Ltd., First Lien Tranche B Term Loan 7.78% (3 Month EURIBOR + 4.00%), 08/07/26 (b) | United Kingdom | € | 250,000 | 276,462 | |||||||||||
Total Pharmaceuticals | 876,999 | ||||||||||||||
Professional Services – 0.7% | |||||||||||||||
| DTI Holdco, Inc., First Lien Tranche B Term Loan 9.80% (3 Month SOFR + 4.75%), 04/23/29 (b) | United States | $ | 142,639 | 141,340 | |||||||||||
| Element Materials Technology Group US Holdings, Inc., First Lien Tranche DD Delay Draw Term Loan 9.74% (3 Month SOFR + 4.25%), 09/28/29 (b) | United States | 88,191 | 87,640 | ||||||||||||
| Element Materials Technology Group US Holdings, Inc., First Lien Tranche B Term Loan 9.74% (3 Month SOFR + 4.25%), 04/12/29 (b) | United States | 191,081 | 189,887 | ||||||||||||
| Project Alpha Intermediate Holding, Inc., First Lien Tranche B Term Loan 10.09% (1 Month SOFR + 4.75%), 10/18/30 (b) | United States | 350,000 | 352,588 | ||||||||||||
| Skopima Consilio Parent LLC, First Lien Tranche B Term Loan 9.46% (1 Month SOFR + 4.00%), 05/31/28 (b) | United States | 917,573 | 915,852 | ||||||||||||
Total Professional Services | 1,687,307 | ||||||||||||||
See Notes to Consolidated Financial Statements.
2023 Annual Report
15
OAKTREE DIVERSIFIED INCOME FUND INC.
Consolidated Schedule of Investments (continued)
December 31, 2023
Description | Country | Principal Amount | Value | ||||||||||||
CORPORATE CREDIT (continued) | |||||||||||||||
Software – 3.4% | |||||||||||||||
| Capstone Borrower, Inc., First Lien Tranche B Term Loan 9.08% (3 Month SOFR + 3.75%), 06/17/30 (b) | United States | $ | 431,787 | $ | 432,867 | ||||||||||
| Castle US Holding Corp., First Lien Tranche B Term Loan 7.17% (3 Month EURIBOR + 3.75%), 01/29/27 (b) | United States | € | 244,289 | 191,812 | |||||||||||
9.36% (3 Month SOFR + 4.00%), 01/29/27 (b) | United States | $ | 983,228 | 687,276 | |||||||||||
| Claudius Finance Sarl, First Lien Tranche B Incremental Term Loan 3.75% (3 Month EURIBOR + 3.75%), 07/10/28 (b) | Luxembourg | € | 190,000 | 208,988 | |||||||||||
| Epicor Software Corp., First Lien Tranche D Incremental Term Loan 9.10% (1 Month SOFR + 3.75%), 07/30/27 (b) | United States | $ | 500,000 | 505,000 | |||||||||||
| eResearchTechnology, Inc., First Lien Tranche B Term Loan 9.96% (1 Month SOFR + 4.50%), 02/04/27 (b) | United States | 893,838 | 894,047 | ||||||||||||
| I-Logic Technologies Bidco Ltd., First Lien Tranche B Term Loan 7.96% (3 Month EURIBOR + 4.00%), 02/16/28 (b) | United Kingdom | € | 194,501 | 212,196 | |||||||||||
| Instructure Holdings, Inc., First Lien Tranche B Term Loan 8.68% (CME Term SOFR 1 Month + 2.75%), 10/30/28 (b) | United States | $ | 285,000 | 286,781 | |||||||||||
| ION Corporate Solutions Finance Sarl, First Lien Tranche B Term Loan 7.72% (3 Month EURIBOR + 3.75%), 03/13/28 (b) | Luxembourg | € | 250,000 | 274,723 | |||||||||||
| ION Trading Technologies Sarl, First Lien Tranche B Term Loan 8.22% (3 Month EURIBOR + 4.25%), 03/31/28 (b) | Ireland | 250,000 | 267,017 | ||||||||||||
| McAfee Corp., First Lien Tranche B Term Loan 7.85% (3 Month EURIBOR + 3.75%), 02/02/29 (b) | United States | 246,875 | 269,282 | ||||||||||||
9.19% (CME Term SOFR 1 Month + 3.75%), 03/01/29 (b) | United States | $ | 498,734 | 498,009 | |||||||||||
| Mitchell International, Inc., First Lien Tranche B Term Loan 9.40% (3 Month SOFR + 3.75%), 10/02/28 (b) | United States | 558,847 | 559,411 | ||||||||||||
| Planview Parent, Inc., First Lien Term Loan 9.65% (3 Month SOFR + 4.00%), 12/17/27 (b) | United States | 318,968 | 316,954 | ||||||||||||
| Proofpoint, First Lien Tranche B Term Loan 8.71% (1 Month SOFR + 3.25%), 06/09/28 (b) | United States | 497,462 | 498,308 | ||||||||||||
| Quartz Acquireco LLC, First Lien Tranche B Term Loan 8.85% (1 Month SOFR + 3.50%), 06/28/30 (b) | United States | 299,250 | 300,559 | ||||||||||||
| Seine Finance SARL, Tranche B Term Loan 8.50%, 11/15/30 | France | € | 135,000 | 149,732 | |||||||||||
| TIBCO Software, Inc., First Lien Tranche A Term Loan 9.99% (3 Month SOFR + 4.50%), 09/29/28 (b) | United States | $ | 191,376 | 187,115 | |||||||||||
| TIBCO Software, Inc., First Lien Tranche B Term Loan 9.99% (3 Month SOFR + 4.50%), 03/19/29 (b) | United States | 466,286 | 456,641 | ||||||||||||
See Notes to Consolidated Financial Statements.
16
OAKTREE DIVERSIFIED INCOME FUND INC.
Consolidated Schedule of Investments (continued)
December 31, 2023
Description | Country | Principal Amount | Value | ||||||||||||
CORPORATE CREDIT (continued) | |||||||||||||||
| UKG, Inc., Second Lien Term Loan 10.76% (3 Month SOFR + 5.25%), 05/03/27 (b) | United States | $ | 500,000 | $ | 501,920 | ||||||||||
Total Software | 7,698,638 | ||||||||||||||
Specialty Retail – 0.6% | |||||||||||||||
| Global Blue Acquisition BV, First Lien Term Loan 8.96% (3 Month EURIBOR + 5.00%), 12/05/30 (b) | United States | € | 160,000 | 176,632 | |||||||||||
| Great Outdoors Group LLC, First Lien Tranche B2 Term Loan 9.40% (1 Month SOFR + 3.75%), 03/31/28 (b) | United States | $ | 493,687 | 494,303 | |||||||||||
| Harbor Freight Tools USA, Inc., First Lien Tranche B Term Loan 8.21% (1 Month SOFR + 2.75%), 10/19/27 (b) | United States | 487,610 | 487,698 | ||||||||||||
| Motor Fuel Group, First Lien Tranche B5 Term Loan 11.29% (Daily SONIA + 6.00%), 06/21/28 (b) | United States | £ | 250,000 | 313,235 | |||||||||||
Total Specialty Retail | 1,471,868 | ||||||||||||||
Textiles Apparel & Luxury Goods – 0.1% | |||||||||||||||
| Amer Sports Holding Oy, First Lien Tranche B Term Loan 7.65% (3 Month EURIBOR + 4.00%), 03/30/26 (b) | Finland | € | 250,000 | 277,060 | |||||||||||
Transportation Infrastructure – 0.7% | |||||||||||||||
| Apple Bidco LLC, First Lien Tranche B Term Loan 8.85% (CME Term SOFR 1 Month + 4.00%), 09/22/28 (b) | United States | $ | 997,500 | 1,002,178 | |||||||||||
| Brown Group Holding LLC, First Lien Tranche B2 Term Loan 9.13% (3 Month SOFR + 3.75%), 06/30/29 (b) | United States | 497,481 | 499,486 | ||||||||||||
Total Transportation Infrastructure | 1,501,664 | ||||||||||||||
Total Senior Loans (Syndicated) | 78,534,654 | ||||||||||||||
High Yield – 22.0% | |||||||||||||||
Aerospace & Defense – 0.4% | |||||||||||||||
| Bombardier, Inc. 6.00%, 02/15/28 (d) | Canada | 313,000 | 305,325 | ||||||||||||
7.13%, 06/15/26 (d) | Canada | 187,000 | 186,297 | ||||||||||||
8.75%, 11/15/30 (d) | Canada | 155,000 | 165,223 | ||||||||||||
| Spirit AeroSystems, Inc. 9.38%, 11/30/29 (d) | United States | 135,000 | 147,896 | ||||||||||||
9.75%, 11/15/30 (d) | United States | 160,000 | 172,196 | ||||||||||||
Total Aerospace & Defense | 976,937 | ||||||||||||||
Automobile Components – 0.3% | |||||||||||||||
| Dana Financing Luxembourg Sarl 3.00%, 07/15/29 | United States | € | 200,000 | 195,668 | |||||||||||
| IHO Verwaltungs GmbH 8.75%, 05/15/28 (e) (f) (g) | Germany | 200,000 | 241,067 | ||||||||||||
| Renk AG 5.75%, 07/15/25 | Germany | 200,000 | 220,069 | ||||||||||||
Total Automobile Components | 656,804 | ||||||||||||||
See Notes to Consolidated Financial Statements.
2023 Annual Report
17
OAKTREE DIVERSIFIED INCOME FUND INC.
Consolidated Schedule of Investments (continued)
December 31, 2023
Description | Country | Principal Amount | Value | ||||||||||||
CORPORATE CREDIT (continued) | |||||||||||||||
Automobiles – 0.3% | |||||||||||||||
| Ford Motor Company 3.25%, 02/12/32 | United States | $ | 340,000 | $ | 282,921 | ||||||||||
6.10%, 08/19/32 | United States | 305,000 | 307,601 | ||||||||||||
Total Automobiles | 590,522 | ||||||||||||||
Beverages – 0.1% | |||||||||||||||
| Primo Water Holdings, Inc. 3.88%, 10/31/28 | Canada | € | 200,000 | 213,637 | |||||||||||
Chemicals – 0.8% | |||||||||||||||
| INEOS Finance PLC 6.63%, 05/15/28 (e) (g) | Luxembourg | 175,000 | 198,735 | ||||||||||||
| Nufarm Australia Ltd. 5.00%, 01/27/30 (d) | Australia | $ | 445,000 | 413,227 | |||||||||||
| Olympus Water US Holding Corp. 4.25%, 10/01/28 (d) | United States | 280,000 | 252,269 | ||||||||||||
9.75%, 11/15/28 (d) | United States | 380,000 | 403,805 | ||||||||||||
| SK Invictus Intermediate II Sarl 5.00%, 10/30/29 (d) | United States | 225,000 | 195,435 | ||||||||||||
| Windsor Holdings III LLC 8.50%, 06/15/30 (d) | United States | 285,000 | 298,189 | ||||||||||||
Total Chemicals | 1,761,660 | ||||||||||||||
Commercial Services & Supplies – 1.4% | |||||||||||||||
| Allied Universal Holdco LLC 3.63%, 06/01/28 | United States | € | 205,000 | 199,364 | |||||||||||
4.63%, 06/01/28 (d) | United States | $ | 690,000 | 628,063 | |||||||||||
| Aramark International Finance Sarl 3.13%, 04/01/25 | United States | € | 100,000 | 110,150 | |||||||||||
| Iron Mountain, Inc. 5.00%, 07/15/28 (d) | United States | $ | 435,000 | 418,342 | |||||||||||
| LABL, Inc. 5.88%, 11/01/28, (Acquired 11/1/2021 – 11/30/2021, cost $445,921) (d) (l) | United States | 445,000 | 404,016 | ||||||||||||
| Prime Security Services Borrower LLC 6.25%, 01/15/28 (d) | United States | 901,000 | 896,449 | ||||||||||||
| TMS International Corp. 6.25%, 04/15/29 (d) | United States | 330,000 | 272,697 | ||||||||||||
| WASH Multifamily Acquisition, Inc. 5.75%, 04/15/26 (d) | United States | 430,000 | 414,265 | ||||||||||||
Total Commercial Services & Supplies | 3,343,346 | ||||||||||||||
Communications Equipment – 0.1% | |||||||||||||||
| CommScope Technologies LLC 6.00%, 06/15/25 (d) | United States | 260,000 | 212,144 | ||||||||||||
| CommScope, Inc. 4.75%, 09/01/29 (d) | United States | 75,000 | 50,426 | ||||||||||||
6.00%, 03/01/26 (d) | United States | 95,000 | 84,759 | ||||||||||||
Total Communications Equipment | 347,329 | ||||||||||||||
Construction & Engineering – 0.3% | |||||||||||||||
| Great Lakes Dredge & Dock Corp. 5.25%, 06/01/29 (d) | United States | 340,000 | 289,422 | ||||||||||||
| Pike Corp. 5.50%, 09/01/28 (d) | United States | 440,000 | 419,720 | ||||||||||||
Total Construction & Engineering | 709,142 | ||||||||||||||
See Notes to Consolidated Financial Statements.
18
OAKTREE DIVERSIFIED INCOME FUND INC.
Consolidated Schedule of Investments (continued)
December 31, 2023
Description | Country | Principal Amount | Value | ||||||||||||
CORPORATE CREDIT (continued) | |||||||||||||||
Consumer Finance – 0.5% | |||||||||||||||
| FirstCash, Inc. 5.63%, 01/01/30 (d) | United States | $ | 702,000 | $ | 673,235 | ||||||||||
| Ford Motor Credit Company LLC 4.00%, 11/13/30 | United States | 445,000 | 399,623 | ||||||||||||
Total Consumer Finance | 1,072,858 | ||||||||||||||
Containers & Packaging – 0.9% | |||||||||||||||
| Ardagh Packaging Finance PLC 2.13%, 08/15/26 | United States | € | 180,000 | 177,718 | |||||||||||
4.13%, 08/15/26 (d) | United States | $ | 335,000 | 305,971 | |||||||||||
5.25%, 08/15/27 (d) | United States | 260,000 | 202,290 | ||||||||||||
| Fiber Bidco SpA 9.96% (3 Month EURIBOR + 6.00%), 10/25/27 (b) (d) | Italy | € | 100,000 | 112,491 | |||||||||||
| Graham Packaging Company, Inc. 7.13%, 08/15/28 (d) | United States | $ | 285,000 | 256,843 | |||||||||||
| Guala Closures SpA 7.93% (3 Month EURIBOR + 4.00%), 06/29/29 (b) (d) | Italy | € | 250,000 | 280,432 | |||||||||||
| Intelligent Packaging Limited Finco, Inc. 6.00%, 09/15/28 (d) | Canada | $ | 435,000 | 406,320 | |||||||||||
| Silgan Holdings, Inc. 2.25%, 06/01/28 | United States | € | 200,000 | 203,829 | |||||||||||
| Trivium Packaging Finance BV 3.75%, 08/15/26 | Netherlands | 100,000 | 107,254 | ||||||||||||
Total Containers & Packaging | 2,053,148 | ||||||||||||||
Diversified Consumer Services – 0.1% | |||||||||||||||
| Verisure Holding AB 3.88%, 07/15/26 | Sweden | 100,000 | 108,662 | ||||||||||||
| Verisure Midholding AB 5.25%, 02/15/29 | Sweden | 100,000 | 105,704 | ||||||||||||
Total Diversified Consumer Services | 214,366 | ||||||||||||||
Diversified Telecommunication Services – 1.3% | |||||||||||||||
| Altice Financing SA 3.00%, 01/15/28 | Luxembourg | 200,000 | 197,827 | ||||||||||||
| Altice France SA 3.38%, 01/15/28 | France | 100,000 | 87,916 | ||||||||||||
4.13%, 01/15/29 | France | 100,000 | 88,561 | ||||||||||||
| Cogent Communications Group, Inc. 7.00%, 06/15/27 (d) | United States | $ | 340,000 | 342,018 | |||||||||||
| Consolidated Communications, Inc. 6.50%, 10/01/28 (d) | United States | 380,000 | 329,650 | ||||||||||||
| Frontier Communications Holdings LLC 5.00%, 05/01/28 (d) | United States | 290,000 | 268,278 | ||||||||||||
6.75%, 05/01/29 (d) | United States | 155,000 | 138,763 | ||||||||||||
| Iliad Holding SASU 5.63%, 10/15/28 | France | € | 200,000 | 222,267 | |||||||||||
| Iliad SA 5.38%, 02/15/29 (e) (g) | France | 100,000 | 113,541 | ||||||||||||
| Level 3 Financing, Inc. 4.25%, 07/01/28 (d) | United States | $ | 330,000 | 163,683 | |||||||||||
| Lorca Telecom Bondco SA 4.00%, 09/18/27 | Spain | € | 200,000 | 216,097 | |||||||||||
See Notes to Consolidated Financial Statements.
2023 Annual Report
19
OAKTREE DIVERSIFIED INCOME FUND INC.
Consolidated Schedule of Investments (continued)
December 31, 2023
Description | Country | Principal Amount | Value | ||||||||||||
CORPORATE CREDIT (continued) | |||||||||||||||
| Telecom Italia SpA 6.88%, 02/15/28 (e) (g) | Italy | € | 100,000 | $ | 117,851 | ||||||||||
| Telefonica Europe BV 4.38% (5 Year Swap Rate EUR + 4.11%), Perpetual (b) | Spain | 200,000 | 219,588 | ||||||||||||
| TMNL Holding BV 3.75%, 01/15/29 | Netherlands | 195,000 | 204,931 | ||||||||||||
| Ziggo Bond Company BV 3.38%, 02/28/30 | Netherlands | 200,000 | 187,153 | ||||||||||||
Total Diversified Telecommunication Services | 2,898,124 | ||||||||||||||
Electrical Equipment – 0.1% | |||||||||||||||
| APX Group, Inc. 6.75%, 02/15/27 (d) | United States | $ | 290,000 | 289,684 | |||||||||||
Energy Equipment & Services – 0.2% | |||||||||||||||
| Howard Midstream Energy Partners LLC 8.88%, 07/15/28 (d) | United States | 180,000 | 189,117 | ||||||||||||
| Precision Drilling Corp. 7.13%, 01/15/26 (d) | Canada | 223,000 | 223,022 | ||||||||||||
Total Energy Equipment & Services | 412,139 | ||||||||||||||
Entertainment – 0.1% | |||||||||||||||
| Banijay (LOV Banijay SASU) 7.00%, 05/01/29 (e) (g) | France | € | 170,000 | 198,470 | |||||||||||
| Pinewood Finance Company Ltd. 3.25%, 09/30/25 | United Kingdom | £ | 100,000 | 124,243 | |||||||||||
Total Entertainment | 322,713 | ||||||||||||||
Financial Services – 0.9% | |||||||||||||||
| GTCR LLC 8.50%, 01/15/31 | Netherlands | 150,000 | 207,306 | ||||||||||||
| Nationstar Mortgage Holdings, Inc. 5.75%, 11/15/31 (d) | United States | $ | 700,000 | 653,683 | |||||||||||
6.00%, 01/15/27 (d) | United States | 140,000 | 139,094 | ||||||||||||
| NCR Atleos Escrow Corp. 9.50%, 04/01/29 (d) | United States | 415,000 | 441,299 | ||||||||||||
| Worldpay 7.50%, 01/15/31 (d) | United States | 530,000 | 560,407 | ||||||||||||
Total Financial Services | 2,001,789 | ||||||||||||||
Food Products – 0.4% | |||||||||||||||
| B&G Foods, Inc. 8.00%, 09/15/28 (d) | United States | 430,000 | 452,056 | ||||||||||||
| Post Holdings, Inc. 5.63%, 01/15/28 (d) | United States | 430,000 | 426,419 | ||||||||||||
Total Food Products | 878,475 | ||||||||||||||
Gas Utilities – 0.4% | |||||||||||||||
| CQP Holdco LP 5.50%, 06/15/31 (d) | United States | 165,000 | 156,587 | ||||||||||||
7.50%, 12/15/33 (d) | United States | 515,000 | 534,332 | ||||||||||||
| Suburban Propane Partners LP 5.00%, 06/01/31 (d) | United States | 220,000 | 199,777 | ||||||||||||
Total Gas Utilities | 890,696 | ||||||||||||||
See Notes to Consolidated Financial Statements.
20
OAKTREE DIVERSIFIED INCOME FUND INC.
Consolidated Schedule of Investments (continued)
December 31, 2023
Description | Country | Principal Amount | Value | ||||||||||||
CORPORATE CREDIT (continued) | |||||||||||||||
Health Care Equipment & Supplies – 0.2% | |||||||||||||||
| Medline Borrower LP 5.25%, 10/01/29 (d) | United States | $ | 395,000 | $ | 372,847 | ||||||||||
Health Care Providers & Services – 0.4% | |||||||||||||||
| Avantor Funding, Inc. 3.88%, 07/15/28 | United States | € | 100,000 | 108,383 | |||||||||||
| Community Health Systems, Inc. 5.63%, 03/15/27 (d) | United States | $ | 205,000 | 190,741 | |||||||||||
10.88%, 01/15/32 (d) | United States | 260,000 | 272,059 | ||||||||||||
| Nidda Healthcare Holding GmbH 7.50%, 08/21/26 | Germany | € | 100,000 | 113,981 | |||||||||||
| Pediatrix Medical Group, Inc. 5.38%, 02/15/30 (d) | United States | $ | 295,000 | 263,093 | |||||||||||
Total Health Care Providers & Services | 948,257 | ||||||||||||||
Health Care Technology – 0.1% | |||||||||||||||
| MPH Acquisition Holdings LLC 5.50%, 09/01/28 (d) | United States | 160,000 | 143,449 | ||||||||||||
Hotels Restaurants & Leisure – 1.9% | |||||||||||||||
| Accor SA 7.25% (5 Year Swap Rate EUR + 4.11%), Perpetual (b) (e) (g) | France | € | 200,000 | 240,764 | |||||||||||
| Bloomin' Brands, Inc. 5.13%, 04/15/29 (d) | United States | $ | 665,000 | 614,093 | |||||||||||
| Brinker International, Inc. 8.25%, 07/15/30 (d) | United States | 392,000 | 410,451 | ||||||||||||
| Carnival Corp. 5.75%, 03/01/27 (d) | United States | 490,000 | 478,330 | ||||||||||||
10.50%, 06/01/30 (d) | United States | 80,000 | 87,562 | ||||||||||||
| Cirsa Finance International Sarl 7.88%, 07/31/28 (e) (g) | Spain | € | 160,000 | 184,837 | |||||||||||
8.45% (3 Month EURIBOR + 4.50%), 07/31/28 (b) (d) | Spain | 115,000 | 128,981 | ||||||||||||
| Everi Holdings, Inc. 5.00%, 07/15/29 (d) | United States | $ | 345,000 | 313,590 | |||||||||||
| Fertitta Entertainment LLC 6.75%, 01/15/30 (d) | United States | 160,000 | 140,664 | ||||||||||||
| Hilton Grand Vacations Borrower Escrow LLC 5.00%, 06/01/29 (d) | United States | 675,000 | 623,542 | ||||||||||||
| Legends Hospitality Holding Company LLC 5.00%, 02/01/26 (d) | United States | 440,000 | 439,616 | ||||||||||||
| Lottomatica S.P.A. 7.13%, 06/01/28 (e) (g) | Italy | € | 115,000 | 134,206 | |||||||||||
| Six Flags Entertainment Corp 7.25%, 05/15/31 (d) | United States | $ | 425,000 | 426,585 | |||||||||||
| TUI Cruises GmbH 6.50%, 05/15/26 | Germany | € | 200,000 | 218,585 | |||||||||||
Total Hotels Restaurants & Leisure | 4,441,806 | ||||||||||||||
Household Durables – 0.2% | |||||||||||||||
| Shea Homes LP 4.75%, 02/15/28 | United States | $ | 345,000 | 324,729 | |||||||||||
| Weekley Homes LLC 4.88%, 09/15/28 (d) | United States | 185,000 | 172,702 | ||||||||||||
Total Household Durables | 497,431 | ||||||||||||||
See Notes to Consolidated Financial Statements.
2023 Annual Report
21
OAKTREE DIVERSIFIED INCOME FUND INC.
Consolidated Schedule of Investments (continued)
December 31, 2023
Description | Country | Principal Amount | Value | ||||||||||||
CORPORATE CREDIT (continued) | |||||||||||||||
Independent Power and Renewable Electricity Producers – 0.4% | |||||||||||||||
| Calpine Corp. 5.13%, 03/15/28 (d) | United States | $ | 350,000 | $ | 335,791 | ||||||||||
| Talen Energy Supply LLC 8.63%, 06/01/30 (d) | United States | 250,000 | 265,819 | ||||||||||||
| Vistra Operations Company, LLC 7.75%, 10/15/31 (d) | United States | 315,000 | 327,392 | ||||||||||||
Total Independent Power and Renewable Electricity Producers | 929,002 | ||||||||||||||
Insurance – 0.2% | |||||||||||||||
| AssuredPartners, Inc. 5.63%, 01/15/29 (d) | United States | 250,000 | 233,664 | ||||||||||||
| HUB International Ltd. 5.63%, 12/01/29 (d) | United States | 120,000 | 114,628 | ||||||||||||
7.00%, 05/01/26 (d) | United States | 190,000 | 190,955 | ||||||||||||
Total Insurance | 539,247 | ||||||||||||||
Interactive Media & Services – 0.1% | |||||||||||||||
| QVC, Inc. 4.85%, 04/01/24 | United States | 310,000 | 307,137 | ||||||||||||
IT Services – 0.2% | |||||||||||||||
| Ahead DB Holdings LLC 6.63%, 05/01/28 (d) | United States | 340,000 | 296,567 | ||||||||||||
| Engineering – Ingegneria Informatica – SpA 5.88%, 09/30/26 | Italy | € | 200,000 | 216,946 | |||||||||||
Total IT Services | 513,513 | ||||||||||||||
Machinery – 0.8% | |||||||||||||||
| ProFrac Holdings II LLC 12.60% (CME Term SOFR 3 Month + 7.25%), 01/23/29 (b) (c) (d) | United States | $ | 1,316,000 | 1,302,840 | |||||||||||
| SPX FLOW, Inc. 8.75%, 04/01/30 (d) | United States | 453,000 | 453,521 | ||||||||||||
Total Machinery | 1,756,361 | ||||||||||||||
Media – 2.1% | |||||||||||||||
| AMC Networks, Inc. 4.25%, 02/15/29 | United States | 435,000 | 332,343 | ||||||||||||
| America Movil BV 0.00%, 03/02/24 | Mexico | € | 100,000 | 110,937 | |||||||||||
| Cablevision Lightpath LLC 5.63%, 09/15/28 (d) | United States | $ | 415,000 | 327,506 | |||||||||||
| CCO Holdings LLC 4.25%, 01/15/34 (d) | United States | 355,000 | 288,958 | ||||||||||||
4.50%, 06/01/33 (d) | United States | 494,000 | 418,634 | ||||||||||||
4.75%, 03/01/30 (d) | United States | 190,000 | 173,888 | ||||||||||||
6.38%, 09/01/29 (d) | United States | 140,000 | 138,249 | ||||||||||||
| CSC Holdings LLC 4.13%, 12/01/30 (d) | United States | 435,000 | 331,435 | ||||||||||||
| Directv Financing LLC 5.88%, 08/15/27 (d) | United States | 920,000 | 865,165 | ||||||||||||
| DISH DBS Corp. 5.25%, 12/01/26 (d) | United States | 195,000 | 167,432 | ||||||||||||
5.75%, 12/01/28 (d) | United States | 25,000 | 19,987 | ||||||||||||
See Notes to Consolidated Financial Statements.
22
OAKTREE DIVERSIFIED INCOME FUND INC.
Consolidated Schedule of Investments (continued)
December 31, 2023
Description | Country | Principal Amount | Value | ||||||||||||
CORPORATE CREDIT (continued) | |||||||||||||||
| Gray Television, Inc. 4.75%, 10/15/30 (d) | United States | $ | 160,000 | $ | 120,626 | ||||||||||
| Scripps Escrow II, Inc. 5.38%, 01/15/31 (d) | United States | 130,000 | 95,557 | ||||||||||||
| Sirius XM Radio, Inc. 3.88%, 09/01/31 (d) | United States | 630,000 | 539,741 | ||||||||||||
5.50%, 07/01/29 (d) | United States | 214,000 | 207,134 | ||||||||||||
| Telenet Finance Luxembourg Notes Sarl 5.50%, 03/01/28 (d) | Belgium | 200,000 | 187,920 | ||||||||||||
| Virgin Media Secured Finance PLC 4.50%, 08/15/30 (d) | United Kingdom | 305,000 | 271,941 | ||||||||||||
5.25%, 05/15/29 | United Kingdom | £ | 100,000 | 118,935 | |||||||||||
| Virgin Media Vendor Financing Notes III DAC 4.88%, 07/15/28 | United Kingdom | 100,000 | 117,673 | ||||||||||||
Total Media | 4,834,061 | ||||||||||||||
Metals & Mining – 0.4% | |||||||||||||||
| Constellium SE 5.63%, 06/15/28 (d) | United States | $ | 260,000 | 254,043 | |||||||||||
| Mineral Resources Ltd. 8.50%, 05/01/30 (d) | Australia | 300,000 | 313,122 | ||||||||||||
9.25%, 10/01/28 (d) | Australia | 380,000 | 404,708 | ||||||||||||
Total Metals & Mining | 971,873 | ||||||||||||||
Mortgage Real Estate Investment Trusts – 0.3% | |||||||||||||||
| HAT Holdings I LLC 3.38%, 06/15/26 (d) | United States | 415,000 | 390,305 | ||||||||||||
3.75%, 09/15/30 (d) | United States | 150,000 | 126,524 | ||||||||||||
8.00%, 06/15/27 (d) | United States | 155,000 | 161,602 | ||||||||||||
Total Mortgage Real Estate Investment Trusts | 678,431 | ||||||||||||||
Oil Gas & Consumable Fuels – 0.8% | |||||||||||||||
| CITGO Petroleum Corp. 7.00%, 06/15/25 (d) | United States | 360,000 | 359,722 | ||||||||||||
| Civitas Resources, Inc. 8.63%, 11/01/30 (d) | United States | 200,000 | 212,313 | ||||||||||||
| CVR Energy, Inc. 5.25%, 02/15/25 (d) | United States | 305,000 | 304,706 | ||||||||||||
| Venture Global LNG, Inc. 8.13%, 06/01/28 (d) | United States | 255,000 | 257,756 | ||||||||||||
8.38%, 06/01/31 (d) | United States | 260,000 | 260,257 | ||||||||||||
9.50%, 02/01/29 (d) | United States | 335,000 | 354,695 | ||||||||||||
Total Oil Gas & Consumable Fuels | 1,749,449 | ||||||||||||||
Other – 1.0% | |||||||||||||||
| Nidda BondCo GmbH 7.25%, 09/30/25 | Germany | € | 71,616 | 79,063 | |||||||||||
| OWS Cre Funding I LLC 10.33% (1 Month LIBOR + 4.90%), 09/15/24 (b) (d) | United States | $ | 2,345,090 | 2,344,239 | |||||||||||
Total Other | 2,423,302 | ||||||||||||||
Paper & Forest Products – 0.2% | |||||||||||||||
| Mercer International, Inc. 5.50%, 01/15/26 | Germany | 385,000 | 368,973 | ||||||||||||
See Notes to Consolidated Financial Statements.
2023 Annual Report
23
OAKTREE DIVERSIFIED INCOME FUND INC.
Consolidated Schedule of Investments (continued)
December 31, 2023
Description | Country | Principal Amount | Value | ||||||||||||
CORPORATE CREDIT (continued) | |||||||||||||||
| WEPA Hygieneprodukte GmbH 2.88%, 12/15/27 | Germany | € | 125,000 | $ | 129,569 | ||||||||||
Total Paper & Forest Products | 498,542 | ||||||||||||||
Personal Care Products – 0.4% | |||||||||||||||
| BellRing Brands, Inc. 7.00%, 03/15/30 (d) | United States | $ | 365,000 | 378,062 | |||||||||||
| Coty, Inc. 5.00%, 04/15/26 (d) | United States | 113,000 | 111,285 | ||||||||||||
| Edgewell Personal Care Co. 5.50%, 06/01/28 (d) | United States | 355,000 | 348,734 | ||||||||||||
Total Personal Care Products | 838,081 | ||||||||||||||
Pharmaceuticals – 0.3% | |||||||||||||||
| Bausch Health Companies, Inc. 4.88%, 06/01/28 (d) | United States | 240,000 | 144,831 | ||||||||||||
| Cheplapharm Arzneimittel GmbH 4.38%, 01/15/28 | Germany | € | 100,000 | 107,921 | |||||||||||
7.50%, 05/15/30 | Germany | 100,000 | 117,892 | ||||||||||||
8.75% (3 Month EURIBOR + 4.75%), 05/15/30 (b) (d) | Germany | 210,000 | 238,276 | ||||||||||||
Total Pharmaceuticals | 608,920 | ||||||||||||||
Professional Services – 0.2% | |||||||||||||||
| Mooney Group SpA 7.81% (3 Month EURIBOR + 3.88%), 12/17/26 (b) | Italy | 250,000 | 272,026 | ||||||||||||
| Summer BC Holdco B SARL 5.75%, 10/31/26 | Luxembourg | 200,000 | 212,194 | ||||||||||||
Total Professional Services | 484,220 | ||||||||||||||
Real Estate Management & Development – 0.3% | |||||||||||||||
| Five Point Operating Co LP 7.88%, 11/15/25 (d) | United States | $ | 322,000 | 319,083 | |||||||||||
| Hunt Companies, Inc. 5.25%, 04/15/29 (d) | United States | 415,000 | 370,775 | ||||||||||||
| Samhallsbyggnadsbolaget i Norden AB 2.88% (5 Year Swap Rate EUR + 3.22%), Perpetual (b) | Sweden | € | 100,000 | 18,436 | |||||||||||
Total Real Estate Management & Development | 708,294 | ||||||||||||||
Retail Real Estate Investment Trusts – 0.1% | |||||||||||||||
| Necessity Retail REIT, Inc. 4.50%, 09/30/28 (d) | United States | $ | 395,000 | 333,060 | |||||||||||
Software – 1.2% | |||||||||||||||
| Acuris Finance US, Inc. 5.00%, 05/01/28 (d) | United States | 395,000 | 324,275 | ||||||||||||
| Castor SpA 9.18% (3 Month EURIBOR + 5.25%), 02/15/29 (b) (e) (g) | Italy | € | 200,000 | 214,517 | |||||||||||
| Cedacri Mergeco SPA 9.50% (3 Month EURIBOR + 5.50%), 05/15/28 (b) (d) | Italy | 200,000 | 218,582 | ||||||||||||
| Cloud Software Group Holdings, Inc. 6.50%, 03/31/29 (d) | United States | $ | 910,000 | 867,457 | |||||||||||
| ION Trading Technologies Sarl 5.75%, 05/15/28 (d) | Luxembourg | 205,000 | 181,048 | ||||||||||||
See Notes to Consolidated Financial Statements.
24
OAKTREE DIVERSIFIED INCOME FUND INC.
Consolidated Schedule of Investments (continued)
December 31, 2023
Description | Country | Principal Amount | Value | ||||||||||||
CORPORATE CREDIT (continued) | |||||||||||||||
| McAfee Corp. 7.38%, 02/15/30 (d) | United States | $ | 100,000 | $ | 91,459 | ||||||||||
| NCR Corp. 5.13%, 04/15/29 (d) | United States | 600,000 | 571,033 | ||||||||||||
| NCR Voyix Corp. 5.25%, 10/01/30 (d) | United States | 130,000 | 119,553 | ||||||||||||
| Sabre GLBL, Inc. 7.38%, 09/01/25 (d) | United States | 150,000 | 143,222 | ||||||||||||
Total Software | 2,731,146 | ||||||||||||||
Specialty Retail – 0.3% | |||||||||||||||
| Academy Ltd. 6.00%, 11/15/27 (d) | United States | 420,000 | 412,941 | ||||||||||||
| Kepler SpA 9.68% (3 Month EURIBOR + 5.75%), 05/15/29 (b) | Italy | € | 250,000 | 279,230 | |||||||||||
Total Specialty Retail | 692,171 | ||||||||||||||
Textiles Apparel & Luxury Goods – 0.2% | |||||||||||||||
| Afflelou SAS 4.25%, 05/19/26 | France | 200,000 | 220,514 | ||||||||||||
| Crocs, Inc. 4.25%, 03/15/29 (d) | United States | $ | 220,000 | 197,288 | |||||||||||
Total Textiles Apparel & Luxury Goods | 417,802 | ||||||||||||||
Trading Companies & Distributors – 0.9% | |||||||||||||||
| ASP Unifrax Holdings, Inc. 5.25%, 09/30/28 (d) | United States | 450,000 | 325,530 | ||||||||||||
| Equipmentshare.Com Inc. 9.00%, 05/15/28 (d) | United States | 780,000 | 803,478 | ||||||||||||
| Fortress Transportation and Infrastructure Investors LLC 5.50%, 05/01/28 (d) | United States | 320,000 | 307,988 | ||||||||||||
7.88%, 12/01/30 (d) | United States | 344,000 | 358,699 | ||||||||||||
| Loxam SAS 3.75%, 07/15/26 | France | € | 200,000 | 218,808 | |||||||||||
Total Trading Companies & Distributors | 2,014,503 | ||||||||||||||
Wireless Telecommunication Services – 0.2% | |||||||||||||||
| Matterhorn Telecom SA 4.00%, 11/15/27 | Luxembourg | 200,000 | 218,034 | ||||||||||||
| Vodafone Group PLC 3.00% (5 Year Swap Rate EUR + 3.48%), 08/27/80 (b) | United Kingdom | 200,000 | 198,138 | ||||||||||||
Total Wireless Telecommunication Services | 416,172 | ||||||||||||||
Total High Yield | 50,482,446 | ||||||||||||||
Emerging Markets – 2.8% | |||||||||||||||
Chemicals – 0.3% | |||||||||||||||
| Braskem Idesa SAPI 6.99%, 02/20/32 | Mexico | $ | 1,000,000 | 586,336 | |||||||||||
Construction Materials – 0.1% | |||||||||||||||
| Cemex SAB de CV 5.13% (5 Year CMT Rate + 4.53%), Perpetual (b) | Mexico | 200,000 | 189,836 | ||||||||||||
See Notes to Consolidated Financial Statements.
2023 Annual Report
25
OAKTREE DIVERSIFIED INCOME FUND INC.
Consolidated Schedule of Investments (continued)
December 31, 2023
Description | Country | Principal Amount | Value | ||||||||||||
CORPORATE CREDIT (continued) | |||||||||||||||
Diversified Telecommunication Services – 0.3% | |||||||||||||||
| Telecom Argentina SA 8.00%, 07/18/26 | Argentina | $ | 790,000 | $ | 750,326 | ||||||||||
Electric Utilities – 0.1% | |||||||||||||||
| Pampa Energia SA 9.13%, 04/15/29 | Argentina | 140,000 | 137,043 | ||||||||||||
Hotels Restaurants & Leisure – 0.0% | |||||||||||||||
| Grupo Posadas SAB de CV 5.00%, 12/30/27 (f) (h) | Mexico | 20,000 | 16,750 | ||||||||||||
Independent Power and Renewable Electricity Producers – 0.0% | |||||||||||||||
| Genneia SA 8.75%, 09/02/27 (d) | Argentina | 32,000 | 31,701 | ||||||||||||
Metals & Mining – 0.6% | |||||||||||||||
| Vedanta Resources Finance II PLC 13.88%, 01/21/24 | India | 1,600,000 | 1,414,048 | ||||||||||||
Oil Gas & Consumable Fuels – 0.7% | |||||||||||||||
| Canacol Energy Ltd. 5.75%, 11/24/28 | Colombia | 260,000 | 189,862 | ||||||||||||
| Kosmos Energy Ltd. 7.13%, 04/04/26 | Ghana | 200,000 | 190,332 | ||||||||||||
7.50%, 03/01/28 | Ghana | 520,000 | 473,966 | ||||||||||||
| YPF SA 7.00%, 09/30/33 (h) | Argentina | 55,000 | 44,424 | ||||||||||||
9.00%, 06/30/29 (h) | Argentina | 758,000 | 731,055 | ||||||||||||
Total Oil Gas & Consumable Fuels | 1,629,639 | ||||||||||||||
Passenger Airlines – 0.4% | |||||||||||||||
| Azul Secured Finance LLP 10.88%, 05/28/30 (d) | Brazil | 1,130,000 | 935,236 | ||||||||||||
Real Estate Management & Development – 0.3% | |||||||||||||||
| CIFI Holdings Group Company Ltd. 6.00%, 07/16/25 (i) | China | 400,000 | 27,000 | ||||||||||||
6.45%, 11/07/24 (i) | China | 200,000 | 14,250 | ||||||||||||
5.38% (5 Year CMT Rate + 8.57%), Perpetual (b) (i) | China | 450,000 | 23,765 | ||||||||||||
| Country Garden Holdings Company Ltd. 4.80%, 08/06/30 (i) | China | 200,000 | 16,838 | ||||||||||||
7.25%, 04/08/26 (i) | China | 600,000 | 50,640 | ||||||||||||
| RKPF Overseas Ltd. 5.90%, 03/05/25 | China | 500,000 | 264,000 | ||||||||||||
6.00%, 09/04/25 | China | 500,000 | 222,790 | ||||||||||||
| Shimao Group Holdings Ltd. 3.45%, 01/11/31 (i) | China | 400,000 | 17,000 | ||||||||||||
4.60%, 07/13/30 (i) | China | 200,000 | 9,000 | ||||||||||||
5.20%, 01/16/27 (i) | China | 1,210,000 | 48,122 | ||||||||||||
5.60%, 07/15/26 (i) | China | 400,000 | 14,800 | ||||||||||||
6.13%, 02/21/24 (i) | China | 370,000 | 14,800 | ||||||||||||
| Sino-Ocean Land Treasure IV Ltd. 3.25%, 05/05/26 (i) | China | 200,000 | 16,194 | ||||||||||||
4.75%, 08/05/29 (i) | China | 410,000 | 27,675 | ||||||||||||
4.75%, 01/14/30 (i) | China | 400,000 | 30,372 | ||||||||||||
Total Real Estate Management & Development | 797,246 | ||||||||||||||
Total Emerging Markets | 6,488,161 | ||||||||||||||
See Notes to Consolidated Financial Statements.
26
OAKTREE DIVERSIFIED INCOME FUND INC.
Consolidated Schedule of Investments (continued)
December 31, 2023
Description | Country | Principal Amount | Value | ||||||||||||
CORPORATE CREDIT (continued) | |||||||||||||||
Convertible Bonds – 0.7% | |||||||||||||||
Aerospace & Defense – 0.0% | |||||||||||||||
| Safran SA 0.00%, 04/01/28 | France | € | 33,000 | $ | 68,231 | ||||||||||
| Spirit AeroSystems, Inc. 3.25%, 11/01/28 (d) | United States | $ | 6,000 | 7,791 | |||||||||||
Total Aerospace & Defense | 76,022 | ||||||||||||||
Automobiles – 0.0% | |||||||||||||||
| Ford Motor Company 0.00%, 03/15/26 | United States | 31,000 | 31,000 | ||||||||||||
Biotechnology – 0.0% | |||||||||||||||
| BioMarin Pharmaceutical, Inc. 0.60%, 08/01/24 | United States | 12,000 | 11,857 | ||||||||||||
| Exact Sciences Corp. 2.00%, 03/01/30 (d) | United States | 7,000 | 8,432 | ||||||||||||
Total Biotechnology | 20,289 | ||||||||||||||
Broadline Retail – 0.0% | |||||||||||||||
| Etsy, Inc. 0.13%, 10/01/26 | United States | 10,000 | 11,545 | ||||||||||||
0.25%, 06/15/28 | United States | 53,000 | 42,564 | ||||||||||||
Total Broadline Retail | 54,109 | ||||||||||||||
Construction & Engineering – 0.0% | |||||||||||||||
| Fluor Corp. 1.13%, 08/15/29 (d) | United States | 13,000 | 14,186 | ||||||||||||
Consumer Finance – 0.0% | |||||||||||||||
| SoFi Technologies, Inc. 0.00%, 10/15/26 (d) | United States | 22,000 | 18,623 | ||||||||||||
Diversified Telecommunication Services – 0.1% | |||||||||||||||
| Cellnex Telecom SA 0.50%, 07/05/28 | Spain | € | 100,000 | 117,803 | |||||||||||
Entertainment – 0.1% | |||||||||||||||
| Liberty Media Corp. 2.25%, 08/15/27 | United States | $ | 25,000 | 25,486 | |||||||||||
| Live Nation Entertainment, Inc. 3.13%, 01/15/29 (d) | United States | 26,000 | 29,591 | ||||||||||||
| Sea Ltd. 0.25%, 09/15/26 | Singapore | 52,000 | 43,030 | ||||||||||||
2.38%, 12/01/25 | Singapore | 10,000 | 9,580 | ||||||||||||
| Spotify USA, Inc. 0.00%, 03/15/26 | United States | 52,000 | 45,890 | ||||||||||||
Total Entertainment | 153,577 | ||||||||||||||
Financial Services – 0.0% | |||||||||||||||
| Edenred 0.00%, 06/14/28 | France | € | 61,500 | 45,089 | |||||||||||
| Shift4 Payments, Inc. 0.50%, 08/01/27 | United States | $ | 37,000 | 34,665 | |||||||||||
Total Financial Services | 79,754 | ||||||||||||||
See Notes to Consolidated Financial Statements.
2023 Annual Report
27
OAKTREE DIVERSIFIED INCOME FUND INC.
Consolidated Schedule of Investments (continued)
December 31, 2023
Description | Country | Principal Amount | Value | ||||||||||||
CORPORATE CREDIT (continued) | |||||||||||||||
Ground Transportation – 0.0% | |||||||||||||||
| Uber Technologies, Inc. 0.88%, 12/01/28 (d) | United States | $ | 12,000 | $ | 13,110 | ||||||||||
Health Care Equipment & Supplies – 0.1% | |||||||||||||||
| Envista Holdings, Corp. 1.75%, 08/15/28 (d) | United States | 10,000 | 9,150 | ||||||||||||
| Haemonetics Corp. 0.00%, 03/01/26 | United States | 25,000 | 22,375 | ||||||||||||
| LivaNova USA, Inc. 3.00%, 12/15/25 | United States | 23,000 | 24,769 | ||||||||||||
| Merit Medical Systems, Inc. 3.00%, 02/01/29 (d) | United States | 10,000 | 11,115 | ||||||||||||
| NuVasive, Inc. 0.38%, 03/15/25 | United States | 28,000 | 25,830 | ||||||||||||
| Shockwave Medical, Inc. 1.00%, 08/15/28 (d) | United States | 13,000 | 12,721 | ||||||||||||
Total Health Care Equipment & Supplies | 105,960 | ||||||||||||||
Health Care Technology – 0.0% | |||||||||||||||
| Evolent Health, Inc. 3.50%, 12/01/29 (d) | United States | 11,000 | 12,881 | ||||||||||||
Hotel & Resort Real Estate Investment Trusts – 0.0% | |||||||||||||||
| Pebblebrook Hotel Trust 1.75%, 12/15/26 | United States | 14,000 | 12,538 | ||||||||||||
Hotels, Restaurants & Leisure – 0.1% | |||||||||||||||
| Accor SA 0.70%, 12/07/27 (i) | France | € | 61,000 | 32,407 | |||||||||||
| H World Group Ltd. 3.00%, 05/01/26 | China | 8,000 | 8,592 | ||||||||||||
| Just Eat Takeaway.com NV 0.00%, 08/09/25 | United Kingdom | € | 100,000 | 100,574 | |||||||||||
| Marriott Vacations Worldwide Corp. 3.25%, 12/15/27 | United States | $ | 10,000 | 8,895 | |||||||||||
| Shake Shack, Inc. 0.00%, 03/01/28 | United States | 51,000 | 41,861 | ||||||||||||
Total Hotels Restaurants & Leisure | 192,329 | ||||||||||||||
Independent Power and Renewable Electricity Producers – 0.0% | |||||||||||||||
| NRG Energy, Inc. 2.75%, 06/01/48 | United States | $ | 22,000 | 28,380 | |||||||||||
IT Services – 0.1% | |||||||||||||||
| Akamai Technologies, Inc. 0.38%, 09/01/27 | United States | 11,000 | 12,304 | ||||||||||||
| Cloudflare, Inc. 0.00%, 08/15/26 | United States | 107,000 | 96,487 | ||||||||||||
| Perficient, Inc. 0.13%, 11/15/26 | United States | 49,000 | 40,822 | ||||||||||||
Total IT Services | 149,613 | ||||||||||||||
See Notes to Consolidated Financial Statements.
28
OAKTREE DIVERSIFIED INCOME FUND INC.
Consolidated Schedule of Investments (continued)
December 31, 2023
Description | Country | Principal Amount | Value | ||||||||||||
CORPORATE CREDIT (continued) | |||||||||||||||
Media – 0.0% | |||||||||||||||
| Cable One, Inc. 0.00%, 03/15/26 | United States | $ | 48,000 | $ | 40,968 | ||||||||||
Metals & Mining – 0.0% | |||||||||||||||
| First Majestic Silver Corp. 0.38%, 01/15/27 | Canada | 17,000 | 13,282 | ||||||||||||
| MP Materials Corp. 0.25%, 04/01/26 (d) | United States | 29,000 | 25,865 | ||||||||||||
Total Metals & Mining | 39,147 | ||||||||||||||
Multi-Utilities – 0.0% | |||||||||||||||
| Veolia Environnement SA 0.00%, 01/01/25 | France | € | 135,900 | 46,751 | |||||||||||
Passenger Airlines – 0.0% | |||||||||||||||
| JetBlue Airways Corp. 0.50%, 04/01/26 | United States | $ | 8,000 | 5,800 | |||||||||||
Professional Services – 0.0% | |||||||||||||||
| Ceridian HCM Holding, Inc. 0.25%, 03/15/26 | United States | 74,000 | 66,785 | ||||||||||||
Semiconductors & Semiconductor Equipment – 0.0% | |||||||||||||||
| ON Semiconductor Corp. 0.50%, 03/01/29 (d) | United States | 17,000 | 18,148 | ||||||||||||
| SolarEdge Technologies, Inc. 0.00%, 09/15/25 | United States | 5,000 | 4,572 | ||||||||||||
Total Semiconductors & Semiconductor Equipment | 22,720 | ||||||||||||||
Software – 0.1% | |||||||||||||||
| Alarm.com Holdings, Inc. 0.00%, 01/15/26 | United States | 46,000 | 41,032 | ||||||||||||
| Blackline, Inc. 0.00%, 03/15/26 | United States | 47,000 | 41,948 | ||||||||||||
| Envestnet, Inc. 2.63%, 12/01/27 | United States | 30,000 | 29,738 | ||||||||||||
| Nutanix, Inc. 0.25%, 10/01/27 | United States | 52,000 | 54,340 | ||||||||||||
| PagerDuty, Inc. 1.50%, 10/15/28 (d) | United States | 10,000 | 10,888 | ||||||||||||
| Unity Software, Inc. 0.00%, 11/15/26 | United States | 83,000 | 69,388 | ||||||||||||
Total Software | 247,334 | ||||||||||||||
Specialty Retail – 0.1% | |||||||||||||||
| Burlington Stores, Inc. 1.25%, 12/15/27 (d) | United States | 9,000 | 10,175 | ||||||||||||
| Zalando SE 0.05%, 08/06/25 | Germany | € | 100,000 | 102,728 | |||||||||||
Total Specialty Retail | 112,903 | ||||||||||||||
Water Utilities – 0.0% | |||||||||||||||
| American Water Capital Corp. 3.63%, 06/15/26 (d) | United States | $ | 13,000 | 13,046 | |||||||||||
Total Convertible Bonds | 1,675,628 | ||||||||||||||
See Notes to Consolidated Financial Statements.
2023 Annual Report
29
OAKTREE DIVERSIFIED INCOME FUND INC.
Consolidated Schedule of Investments (continued)
December 31, 2023
Description | Country | Principal Amount | Value | ||||||||||||
CORPORATE CREDIT (continued) | |||||||||||||||
Investment Grade – 0.0% | |||||||||||||||
Banks – 0.0% | |||||||||||||||
| Barclays PLC 6.50% (SOFR + 1.88%), 09/13/27 (b) | United Kingdom | $ | 56,000 | $ | 57,593 | ||||||||||
Total Investment Grade | 57,593 | ||||||||||||||
| TOTAL CORPORATE CREDIT (Cost $142,634,077) | 137,238,482 | ||||||||||||||
STRUCTURED CREDIT – 30.2% | |||||||||||||||
Collateralized Loan Obligations – 18.3% | |||||||||||||||
| 37 Capital CLO 11.75%, 2023-1A, Class D (CME Term SOFR 3 Month + 6.36%), 04/15/36 (b) (d) | Cayman Islands | 1,500,000 | 1,525,775 | ||||||||||||
| 13.75%, 2023-2A, Class E (CME Term SOFR 3 Month + 8.38%), 01/15/34 (b) (d) | Cayman Islands | 1,000,000 | 1,008,454 | ||||||||||||
| Anchorage Capital CLO Ltd. 9.38%, 2020-16A, Class DR (CME Term SOFR 3 Month + 3.98%), 01/19/35 (b) (d) | Cayman Islands | 1,500,000 | 1,507,395 | ||||||||||||
| 11.15%, 2023-26A, Class D (CME Term SOFR 3 Month + 5.75%), 07/19/34 (b) (d) | Cayman Islands | 500,000 | 507,515 | ||||||||||||
| 13.00%, 2016-8A, Class ER2 (CME Term SOFR 3 Month + 7.61%), 10/27/34 (b) (d) | Cayman Islands | 1,500,000 | 1,432,652 | ||||||||||||
| 13.01%, 2020-16A, Class ER (CME Term SOFR 3 Month + 7.61%), 01/19/35 (b) (d) | Cayman Islands | 1,000,000 | 966,346 | ||||||||||||
| Anchorage Credit Funding Ltd. 5.02%, 2019-7A, Class SUB1, 04/25/37 (d) | Cayman Islands | 1,000,000 | 483,888 | ||||||||||||
6.85%, 2019-7A, Class E, 04/25/37 (d) | Cayman Islands | 1,000,000 | 890,623 | ||||||||||||
| ARES CLO 9.14%, 2022-64A, Class D (CME Term SOFR 3 Month + 3.75%), 04/15/35 (b) (d) | Cayman Islands | 500,000 | 502,649 | ||||||||||||
| 11.13%, 2023-68A, Class D (CME Term SOFR 3 Month + 5.75%), 04/25/35 (b) (d) | Jersey | 2,000,000 | 2,048,249 | ||||||||||||
| CBAM Ltd. 12.76%, 2017-2A, Class ER (CME Term SOFR 3 Month + 7.36%), 07/17/34 (b) (d) | Cayman Islands | 571,000 | 534,590 | ||||||||||||
| Cerberus Loan Funding LP 9.58%, 2023-3A, Class C (CME Term SOFR 3 Month + 4.15%), 09/13/35 (b) (d) | United States | 1,000,000 | 1,002,779 | ||||||||||||
| Columbia Cent CLO Ltd. 11.81%, 2018-28A, Class D (CME Term SOFR 3 Month + 6.43%), 11/07/30 (b) (d) | Cayman Islands | 1,000,000 | 638,166 | ||||||||||||
| Dryden 27 R Euro CLO 2017 DAC 9.83%, 2017-27X, Class ER (3 Month EURIBOR + 5.86%), 04/15/33 (b) | Ireland | €500,000 | 517,052 | ||||||||||||
| Elevation CLO Ltd. 12.88%, 2021-14A, Class E (CME Term SOFR 3 Month + 7.46%), 10/20/34 (b) (d) | Cayman Islands | $2,000,000 | 1,793,636 | ||||||||||||
| 12.95%, 2021-12A, Class E (CME Term SOFR 3 Month + 7.53%), 04/20/32 (b) (d) | Cayman Islands | 378,000 | 348,767 | ||||||||||||
| Fortress Credit BSL Ltd. 13.56%, 2022-1A, Class E (CME Term SOFR 3 Month + 8.15%), 10/23/34 (b) (d) | Cayman Islands | 500,000 | 470,504 | ||||||||||||
| 13.61%, 2020-1A, Class E (CME Term SOFR 3 Month + 8.19%), 10/20/33 (b) (d) | Cayman Islands | 1,000,000 | 995,197 | ||||||||||||
See Notes to Consolidated Financial Statements.
30
OAKTREE DIVERSIFIED INCOME FUND INC.
Consolidated Schedule of Investments (continued)
December 31, 2023
Description | Country | Principal Amount | Value | ||||||||||||
STRUCTURED CREDIT (continued) | |||||||||||||||
| Gallatin CLO Ltd. 10.74%, 2023-1A, Class D (CME Term SOFR 3 Month + 5.41%), 10/14/35 (b) (d) | Bermuda | $ | 2,000,000 | $ | 1,964,789 | ||||||||||
| Halcyon Loan Advisors Funding Ltd. 0.00%, 2018-2X, Class SUB, 01/22/31 | Cayman Islands | 850,000 | 162,768 | ||||||||||||
| Harvest CLO XXVI 10.09%, 26A, Class E (3 Month EURIBOR + 6.12%), 01/15/34 (b) (d) | Ireland | € | 500,000 | 520,645 | |||||||||||
| ICG US CLO Ltd. 9.28%, 2020-1A, Class DR (CME Term SOFR 3 Month + 3.86%), 01/20/35 (b) (d) | Cayman Islands | $ | 1,000,000 | 953,748 | |||||||||||
| 13.13%, 2020-1A, Class ER (CME Term SOFR 3 Month + 7.71%), 01/20/35 (b) (d) | Cayman Islands | 1,000,000 | 900,992 | ||||||||||||
| Madison Park Funding Ltd. 10.91%, 2023-63A, Class D (CME Term SOFR 3 Month + 5.50%), 04/21/35 (b) (d) | Cayman Islands | 2,000,000 | 2,039,511 | ||||||||||||
| Marble Point CLO Ltd. 12.96%, 2021-4A, Class E (CME Term SOFR 3 Month + 7.55%), 01/22/35 (b) (d) | Cayman Islands | 2,000,000 | 1,784,736 | ||||||||||||
| Monroe Capital MML CLO XIII Ltd. 13.70%, 2022-1A, Class E (CME Term SOFR 3 Month + 8.32%), 02/24/34 (b) (d) | United States | 1,000,000 | 917,599 | ||||||||||||
| Mountain View CLO Ltd. 9.28%, 2023-1A, Class C (CME Term SOFR 3 Month + 3.85%), 09/14/36 (b) (d) | Cayman Islands | 300,000 | 300,511 | ||||||||||||
| 10.93%, 2023-1A, Class D (CME Term SOFR 3 Month + 5.50%), 09/14/36 (b) (d) | Cayman Islands | 300,000 | 299,991 | ||||||||||||
| OAK Hill European Credit Partners V Designated Activity Co. 10.37%, 2016-5A, Class ER (3 Month EURIBOR + 6.37%), 01/21/35 (b) (d) | Ireland | € | 1,750,000 | 1,864,390 | |||||||||||
12.87%, 2016-5A, Class FR (3 Month EURIBOR + 8.87%), 01/21/35 (b) (d) | Ireland | 1,000,000 | 1,034,161 | ||||||||||||
| OZLM XXIII Ltd. 12.94%, 2019-23A, Class ER (CME Term SOFR 3 Month + 7.54%), 04/15/34 (b) (d) | Cayman Islands | $ | 250,000 | 231,926 | |||||||||||
| Palmer Square European CLO 10.36%, 2022-1A, Class E (3 Month EURIBOR + 6.36%), 01/21/35 (b) (d) | Ireland | € | 1,200,000 | 1,269,196 | |||||||||||
12.85%, 2022-1A, Class F (3 Month EURIBOR + 8.85%), 01/21/35 (b) (d) | Ireland | 1,750,000 | 1,809,026 | ||||||||||||
| Penta CLO 10.23%, 2021-10X, Class E (3 Month EURIBOR + 6.23%), 11/20/34 (b) | Ireland | 500,000 | 521,249 | ||||||||||||
| Rockford Tower CLO Ltd. 13.54%, 2022-2A, Class ER (CME Term SOFR 3 Month + 8.12%), 10/20/35 (b) (d) | United States | $ | 750,000 | 734,555 | |||||||||||
| Rockford Tower Europe DAC 9.95%, 2021-1A, Class E (3 Month EURIBOR + 5.96%), 04/20/34 (b) (d) | Ireland | € | 500,000 | 511,004 | |||||||||||
| RR Ltd. 13.65%, 2022-24A, Class DR (CME Term SOFR 3 Month + 8.30%), 01/15/36 (b) (d) | Bermuda | $ | 1,000,000 | 1,005,944 | |||||||||||
| Symphony CLO Ltd. 12.61%, 2012-9A, Class ER2 (CME Term SOFR 3 Month + 7.21%), 07/16/32 (b) (d) | Cayman Islands | 438,000 | 367,662 | ||||||||||||
| Toro European CLO 10.27%, 3X, Class ERR (3 Month EURIBOR + 6.30%), 07/15/34 (b) | Ireland | € | 1,500,000 | 1,554,209 | |||||||||||
| Trimaran Cavu Ltd. 13.03%, 2021-3A, Class E (CME Term SOFR 3 Month + 7.63%), 01/18/35 (b) (d) | Cayman Islands | $ | 1,200,000 | 1,185,347 | |||||||||||
See Notes to Consolidated Financial Statements.
2023 Annual Report
31
OAKTREE DIVERSIFIED INCOME FUND INC.
Consolidated Schedule of Investments (continued)
December 31, 2023
Description | Country | Principal Amount | Value | ||||||||||||
STRUCTURED CREDIT (continued) | |||||||||||||||
| Trinitas CLO XIV Ltd. 13.68%, 2020-14A, Class E (CME Term SOFR 3 Month + 8.30%), 01/25/34 (b) (d) | Cayman Islands | $ | 500,000 | $ | 504,982 | ||||||||||
| Trinitas CLO XVIII Ltd. 9.28%, 2021-18A, Class D (CME Term SOFR 3 Month + 3.86%), 01/20/35 (b) (d) | Cayman Islands | 2,000,000 | 1,948,607 | ||||||||||||
| Venture CLO Ltd. 0.00%, 2020-39X, Class SUB, 04/15/33 | Cayman Islands | 1,350,000 | 590,092 | ||||||||||||
Total Collateralized Loan Obligations | 42,151,877 | ||||||||||||||
Commercial Mortgage-Backed Securities – 4.5% | |||||||||||||||
| ACREC LLC 11.39%, 2023-FL2, Class E (CME Term SOFR 1 Month + 6.03%), 02/19/38 (b) (d) | United States | 107,000 | 106,871 | ||||||||||||
| AREIT Trust 10.73%, 2023-CRE8, Class D (CME Term SOFR 1 Month + 5.37%), 07/17/28 (b) (d) | United States | 109,000 | 108,692 | ||||||||||||
| Banc of America Commercial Mortgage Trust 1.25%, 2015-UBS7, Class XFG, 09/15/48 (d) | United States | 10,000,000 | 191,645 | ||||||||||||
| BBCMS Trust 8.48%, 2018-BXH, Class F (CME Term SOFR 1 Month + 3.12%), 10/15/37 (b) (d) | United States | 270,000 | 258,802 | ||||||||||||
| Benchmark Mortgage Trust 3.10%, 2018-B6, Class E, 10/10/51 (d) | United States | 225,000 | 100,944 | ||||||||||||
| Blackstone UK Student Housing Portfolio 7.55%, 2021-UK5, Class E (Daily SONIA + 2.35%), 05/17/31 (b) | United Kingdom | £ | 236,000 | 287,671 | |||||||||||
| BWAY Mortgage Trust 4.87%, 2022-26BW, Class E, 02/10/44 (d) | United States | $ | 677,000 | 442,053 | |||||||||||
| BX Commercial Mortgage Trust 9.01%, 2019-IMC, Class G (CME Term SOFR 1 Month + 3.65%), 04/15/34 (b) (d) | United States | 1,000,000 | 988,925 | ||||||||||||
| BX Trust 9.51%, 2021-SDMF, Class J (CME Term SOFR 1 Month + 4.15%), 09/15/34 (b) (d) | United States | 450,825 | 417,764 | ||||||||||||
| CD Mortgage Trust 3.30%, 2017-CD4, Class D, 05/10/50 (d) | United States | 305,000 | 192,295 | ||||||||||||
3.35%, 2017-CD5, Class D, 08/15/50 (d) | United States | 489,000 | 357,228 | ||||||||||||
| CGDB Commercial Mortgage Trust 8.47%, 2019-MOB, Class G (CME Term SOFR 1 Month + 3.11%), 11/15/36 (b) (d) | United States | 770,000 | 725,644 | ||||||||||||
| Citigroup Commercial Mortgage Trust 9.18%, 2021-KEYS, Class F (CME Term SOFR 1 Month + 3.81%), 10/15/36 (b) (d) | United States | 741,000 | 710,391 | ||||||||||||
| COMM Mortgage Trust 1.91%, 2016-DC2, Class XF, 02/10/49 (d) | United States | 12,997,292 | 479,976 | ||||||||||||
| CSAIL Commercial Mortgage Trust 4.03%, 2017-CX9, Class D, 09/15/50 (d) | United States | 190,000 | 124,802 | ||||||||||||
| DBGS Mortgage Trust 9.63%, 2021-W52, Class F (CME Term SOFR 1 Month + 4.26%), 10/15/36 (b) (d) | United States | 1,000,000 | 427,900 | ||||||||||||
| European Loan Conduit No 36 DAC 6.54%, 36X, Class D (3 Month EURIBOR + 2.55%), 02/17/30 (b) | Germany | € | 614,445 | 653,862 | |||||||||||
| Hilton USA Trust 4.12%, 2016-SFP, Class C, 11/05/35 (d) | United States | $ | 105,000 | 58,275 | |||||||||||
4.93%, 2016-SFP, Class D, 11/05/35 (c) (d) | United States | 584,000 | 272,728 | ||||||||||||
See Notes to Consolidated Financial Statements.
32
OAKTREE DIVERSIFIED INCOME FUND INC.
Consolidated Schedule of Investments (continued)
December 31, 2023
Description | Country | Principal Amount | Value | ||||||||||||
STRUCTURED CREDIT (continued) | |||||||||||||||
| J.P. Morgan Chase Commercial Mortgage Securities Trust 9.74%, 2021-HTL5, Class F (CME Term SOFR 1 Month + 4.38%), 11/15/38 (b) (d) | United States | $ | 1,084,000 | $ | 1,046,081 | ||||||||||
| Last Mile Logistics 11.00%, 2023-1A, Class D (Daily SONIA + 5.80%), 08/17/33 (b) (d) | United Kingdom | £ | 207,000 | 263,931 | |||||||||||
| Natixis Commercial Mortgage Securities Trust 11.30%, 2022-RRI, Class F (CME Term SOFR 1 Month + 5.94%), 03/15/35 (b) (d) | United States | $ | 525,368 | 522,950 | |||||||||||
| Pearl Finance Conduit 9.24%, 2020-1, Class E (3 Month EURIBOR + 5.25%), 11/17/32 (b) | Ireland | € | 456,922 | 488,932 | |||||||||||
| Taubman Centers Commercial Mortgage Trust 10.13%, 2022-DPM, Class D (CME Term SOFR 1 Month + 4.77%), 05/15/37 (b) (d) | United States | $ | 415,000 | 403,688 | |||||||||||
| VMC Finance LLC 9.97%, 2021-HT1, Class B (CME Term SOFR 1 Month + 4.61%), 01/18/37 (b) (d) | United States | 643,000 | 615,150 | ||||||||||||
Total Commercial Mortgage-Backed Securities | 10,247,200 | ||||||||||||||
Residential Mortgage-Backed Securities – 2.8% | |||||||||||||||
| BRAVO Residential Funding Trust 7.46%, 2023-NQM5, Class M1, 06/25/63 (d) | United States | 183,000 | 185,567 | ||||||||||||
| CHNGE Mortgage Trust 8.43%, 2023-4, Class B1, 09/25/58 (d) | United States | 891,000 | 842,227 | ||||||||||||
| Deephaven Residential Mortgage Trust 4.33%, 2022-2, Class B1, 03/25/67 (d) | United States | 229,000 | 175,878 | ||||||||||||
| GCAT Trust 3.98%, 2022-NQM1, Class B1, 02/25/67 (d) | United States | 476,000 | 333,576 | ||||||||||||
| Imperial Fund Mortgage Trust 4.45%, 2022-NQM3, Class M1, 05/25/67 (d) | United States | 332,000 | 271,094 | ||||||||||||
| MFA Trust 4.26%, 2022-NQM1, Class B1, 12/25/66 (d) | United States | 251,000 | 194,371 | ||||||||||||
| Morgan Stanley Residential Mortgage Loan Trust 7.54%, 2023-NQM1, Class B1, 09/25/68 (d) | United States | 446,000 | 425,132 | ||||||||||||
| PRKCM Trust 7.63%, 2023-AFC1, Class M1, 02/25/58 (d) | United States | 371,000 | 376,502 | ||||||||||||
8.01%, 2023-AFC4, Class B1, 11/25/58 (d) | United States | 293,000 | 288,196 | ||||||||||||
| Progress Residential Trust 5.60%, 2022-SFR3, Class E2, 04/17/39 (d) | United States | 212,000 | 201,452 | ||||||||||||
| PRPM LLC 4.83%, 2021-10, Class A2, 12/31/49 (d) (h) | United States | 1,000,000 | 952,652 | ||||||||||||
| Seasoned Credit Risk Transfer Trust 4.50%, 2022-1, Class M, 11/25/61 (d) | United States | 226,000 | 179,496 | ||||||||||||
| STAR Trust 9.86%, 2022-SFR3, Class F (CME Term SOFR 1 Month + 4.50%), 05/17/24 (b) (d) | United States | 170,000 | 163,072 | ||||||||||||
| Verus Securitization Trust 7.08%, 2023-INV2, Class A3, 08/25/68 (d) (h) | United States | 172,918 | 174,817 | ||||||||||||
7.35%, 2023-INV2, Class M1, 08/25/68 (d) | United States | 187,000 | 186,379 | ||||||||||||
7.96%, 2023-7, Class B1, 10/25/68 (d) | United States | 507,000 | 494,843 | ||||||||||||
8.16%, 2023-INV2, Class B1, 08/25/68 (d) | United States | 100,000 | 97,905 | ||||||||||||
| Western Mortgage Reference Notes 10.69%, 2021-CL2, Class M4 (SOFR30A + 5.35%), 07/25/59 (b) (d) | United States | 830,670 | 841,147 | ||||||||||||
Total Residential Mortgage-Backed Securities | 6,384,306 | ||||||||||||||
See Notes to Consolidated Financial Statements.
2023 Annual Report
33
OAKTREE DIVERSIFIED INCOME FUND INC.
Consolidated Schedule of Investments (continued)
December 31, 2023
Description | Country | Principal Amount | Value | ||||||||||||
STRUCTURED CREDIT (continued) | |||||||||||||||
Asset-Backed Securities – 4.6% | |||||||||||||||
| Adams Outdoor Advertising LP 11.71%, 2023-1, Class C, 07/15/53 (d) | United States | $ | 2,000,000 | $ | 2,040,978 | ||||||||||
| Castlelake Aircraft Securitization Trust 2.74%, 2017-1R, Class A, 08/15/41 (d) | United States | 188,588 | 174,867 | ||||||||||||
| GAIA Aviation Ltd. 7.00%, 2019-1, Class C, 12/15/44 (d) (h) | Cayman Islands | 1,970,222 | 1,008,793 | ||||||||||||
| Horizon Aircraft Finance III Ltd. 3.43%, 2019-2, Class A, 11/15/39 (d) | Cayman Islands | 1,546,260 | 1,228,626 | ||||||||||||
| Horizon Aircraft Finance Ltd. 4.46%, 2018-1, Class A, 12/15/38 (d) | United States | 752,512 | 652,410 | ||||||||||||
| Lunar Aircraft Ltd. 6.41%, 2020-1A, Class C, 02/15/45 (d) | United States | 705,371 | 151,316 | ||||||||||||
| METAL 2017-1 Ltd. 4.58%, 2017-1, Class A, 10/15/42 (d) | United States | 1,407,122 | 853,448 | ||||||||||||
| Pioneer Aircraft Finance Ltd. 3.97%, 2019-1, Class A, 06/15/44 (d) | Cayman Islands | 575,490 | 510,450 | ||||||||||||
| Thunderbolt Aircraft Lease 5.07%, 2018-A, Class B, 09/15/38 (d) (h) | United States | 1,339,286 | 899,058 | ||||||||||||
| Veros Auto Receivables Trust 11.46%, 2023-1, Class D, 08/15/30 (d) | United States | 1,780,000 | 1,826,145 | ||||||||||||
| WAVE Trust 5.68%, 2017-1A, Class B, 11/15/42 (d) | United States | 1,590,272 | 957,029 | ||||||||||||
6.66%, 2017-1A, Class C, 11/15/42 (d) | United States | 1,151,883 | 140,553 | ||||||||||||
| Westlake Automobile Receivables Trust 1.23%, 2021-2A, Class D, 12/15/26 (d) | United States | 164,000 | 156,413 | ||||||||||||
Total Asset-Backed Securities | 10,600,086 | ||||||||||||||
| TOTAL STRUCTURED CREDIT (Cost $72,316,862) | 69,383,469 | ||||||||||||||
PRIVATE CREDIT – 21.9% | |||||||||||||||
Senior Loans – 20.9% | |||||||||||||||
Aerospace & Defense – 0.6% | |||||||||||||||
| Galileo Parent, Inc., First Lien Revolver 12.34% (3 Month SOFR + 7.25%), 05/03/29 (b) (c) (k) | United States | 83,000 | 26,802 | ||||||||||||
| Galileo Parent, Inc., First Lien Term Loan 12.34%, 05/03/30 (c) | United States | 531,668 | 522,523 | ||||||||||||
| WP CPP Holdings, First Lien Term Loan 12.13% (3 Month SOFR + 6.75%), 11/28/29 (b) (c) | United States | 818,000 | 797,550 | ||||||||||||
| WP CPP Holdings, First Lien Revolver 0.00%, 11/28/29 (c) (k) | United States | 90,000 | — | ||||||||||||
Total Aerospace & Defense | 1,346,875 | ||||||||||||||
Automobile Components – 1.1% | |||||||||||||||
| Superior Industries International, Inc., First Lien Tranche B Term Loan 13.33%, 12/15/28 (c) | United States | 2,579,940 | 2,554,141 | ||||||||||||
See Notes to Consolidated Financial Statements.
34
OAKTREE DIVERSIFIED INCOME FUND INC.
Consolidated Schedule of Investments (continued)
December 31, 2023
Description | Country | Principal Amount | Value | ||||||||||||
PRIVATE CREDIT (continued) | |||||||||||||||
Biotechnology – 1.4% | |||||||||||||||
| ADC Therapeutics, Inc., First Lien Tranche A Term Loan 13.04% (3 Month SOFR + 7.50%), 08/15/29 (b) (c) | United States | $ | 1,135,543 | $ | 1,081,605 | ||||||||||
| ADC Therapeutics, Inc., First Lien Tranche B Delay Draw Term Loan 7.50%, 08/15/29 (c) (k) | United States | 520,457 | — | ||||||||||||
| Mesoblast, Inc., First Lien Term Loan 8.00%, 11/19/26 (c) (f) | United States | 1,627,352 | 1,452,412 | ||||||||||||
| Seres Therapeutics, Inc., First Lien Tranche B Delay Draw Term Loan 0.00%, 04/27/29 (c) (k) | United States | 329,000 | — | ||||||||||||
| Seres Therapeutics, Inc., First Lien Tranche DDA2 Delay Draw Term Loan 12.88% (3 Month SOFR + 7.88%), 04/30/29 (b) (c) | United States | 219,000 | 209,539 | ||||||||||||
| Seres Therapeutics, Inc., First Lien Tranche A1 Term Loan 12.88% (3 Month SOFR + 7.88%), 04/30/29 (b) (c) | United States | 585,000 | 559,728 | ||||||||||||
| Seres Therapeutics, Inc., First Lien Tranche C Delay Draw Term Loan 0.00%, 04/30/29 (c) (k) | United States | 329,000 | — | ||||||||||||
Total Biotechnology | 3,303,284 | ||||||||||||||
Commercial Services & Supplies – 1.8% | |||||||||||||||
| Amspec Parent, Inc., First Lien Term Loan 0.00%, 12/05/30 (c) (k) | United States | 226,000 | — | ||||||||||||
11.11% (1 Month SOFR + 5.75%), 12/05/30 (b) (c) | United States | 1,567,000 | 1,527,825 | ||||||||||||
| Amspec Parent, Inc., First Lien Revolver 0.00%, 12/05/29 (c) (k) | United States | 212,000 | — | ||||||||||||
| Kings Buyer LLC, First Lien Revolver 11.99%, 10/29/27 (c) (k) | United States | 310,246 | — | ||||||||||||
| Kings Buyer LLC, First Lien Term Loan 11.99% (3 Month SOFR + 6.50%), 10/29/27 (b) (c) | United States | 2,241,297 | 2,207,678 | ||||||||||||
| NFM & J LP, First Lien Term Loan 0.00%, 11/30/27 (c) (k) | United States | 275,908 | — | ||||||||||||
11.22% (3 Month SOFR + 5.75%), 11/30/27 (b) (c) | United States | 496,636 | 485,573 | ||||||||||||
| NFM & J LP, First Lien Revolver 13.25%, 11/30/27 (c) (k) | United States | 110,363 | 6,344 | ||||||||||||
Total Commercial Services & Supplies | 4,227,420 | ||||||||||||||
Containers & Packaging – 0.7% | |||||||||||||||
| ASP-r-pac Acquisition Company LLC, First Lien Revolver 9.49%, 12/29/27 (c) (k) | United States | 205,745 | — | ||||||||||||
| ASP-r-pac Acquisition Company LLC, First Lien Term Loan 11.63%, 12/29/27 (c) | United States | 1,698,011 | 1,596,130 | ||||||||||||
Total Containers & Packaging | 1,596,130 | ||||||||||||||
See Notes to Consolidated Financial Statements.
2023 Annual Report
35
OAKTREE DIVERSIFIED INCOME FUND INC.
Consolidated Schedule of Investments (continued)
December 31, 2023
Description | Country | Principal Amount | Value | ||||||||||||
PRIVATE CREDIT (continued) | |||||||||||||||
Distributors – 0.8% | |||||||||||||||
| RelaDyne, Second Lien Term Loan 13.17%, 12/23/29 (c) | United States | $ | 1,790,352 | $ | 1,758,125 | ||||||||||
Electrical Equipment – 0.3% | |||||||||||||||
| Inventus Power, Inc., First Lien Revolver 0.00%, 06/30/25 (c) (k) | United States | 94,000 | — | ||||||||||||
| Inventus Power, Inc., First Lien Term Loan 12.59%, 06/30/25 (c) | United States | 824,855 | 806,213 | ||||||||||||
Total Electrical Equipment | 806,213 | ||||||||||||||
Health Care Equipment & Supplies – 1.3% | |||||||||||||||
| Touchstone Acquisition, Inc., First Lien Term Loan 11.43% (3 Month SOFR + 6.00%), 12/29/28 (b) (c) | United States | 2,961,255 | 2,879,820 | ||||||||||||
Health Care Providers & Services – 2.1% | |||||||||||||||
| LSL Holdco LLC, First Lien Incremental Term Loan 11.46%, 01/31/28 (c) | United States | 274,298 | 253,726 | ||||||||||||
| LSL Holdco LLC, First Lien Revolver 10.63%, 01/31/28 (c) (k) | United States | 266,412 | — | ||||||||||||
| LSL Holdco LLC, First Lien Term Loan 11.46%, 01/31/28 (c) | United States | 2,355,749 | 2,179,068 | ||||||||||||
| Petvet Care Centers LLC, First Lien Term Loan 11.32%, 11/15/30 (c) (k) | United States | 2,663,000 | 2,310,293 | ||||||||||||
| Petvet Care Centers LLC, First Lien Revolver 11.32%, 11/15/29 (c) (k) | United States | 307,000 | — | ||||||||||||
Total Health Care Providers & Services | 4,743,087 | ||||||||||||||
Health Care Technology – 1.5% | |||||||||||||||
| Establishment Labs Holdings, Inc., First Lien Tranche C Delay Draw Term Loan 9.00%, 04/21/27 (c) (f) (k) | United States | 184,290 | — | ||||||||||||
| Establishment Labs Holdings, Inc., First Lien Tranche A Term Loan 3.00%, 04/21/27 (c) (f) | United States | 1,223,566 | 1,168,506 | ||||||||||||
| Establishment Labs Holdings, Inc., First Lien Tranche D Delay Draw Term Loan 9.00%, 04/21/27 (c) (f) (k) | United States | 184,290 | — | ||||||||||||
| Establishment Labs Holdings, Inc., First Lien Tranche B Delay Draw Term Loan 9.00%, 04/21/27 (c) (f) | United States | 195,956 | 187,138 | ||||||||||||
| Impel Pharmaceuticals, Inc., First Lien Tranche B Term Loan 16.29% (3 Month SOFR + 10.75%), 09/05/28 (b) (c) | United States | 75,075 | 73,724 | ||||||||||||
| Impel Pharmaceuticals, Inc., First Lien Tranche A Term Loan 16.15%, 03/17/27 (c) | United States | 2,032,135 | 997,778 | ||||||||||||
See Notes to Consolidated Financial Statements.
36
OAKTREE DIVERSIFIED INCOME FUND INC.
Consolidated Schedule of Investments (continued)
December 31, 2023
Description | Country | Principal Amount | Value | ||||||||||||
PRIVATE CREDIT (continued) | |||||||||||||||
| Impel Pharmaceuticals, Inc., First Lien Tranche B Delay Draw Term Loan 16.06%, 03/17/27 (c) (k) | United States | $ | 240,240 | $ | 162,192 | ||||||||||
| Impel Pharmaceuticals, Inc., First Lien Tranche A2 Term Loan 16.28%, 03/17/27 (c) | United States | 60,461 | 59,373 | ||||||||||||
| Next Holdco LLC, First Lien Term Loan 11.32%, 11/08/30 (c) (k) | United States | 1,043,000 | 819,874 | ||||||||||||
| Next Holdco LLC, First Lien Revolver 11.32%, 11/08/29 (c) (k) | United States | 80,000 | — | ||||||||||||
Total Health Care Technology | 3,468,585 | ||||||||||||||
Hotels, Restaurants & Leisure – 2.4% | |||||||||||||||
| Grove Hotel Parcel Owner LLC, First Lien Revolver Facility 0.00%, 06/21/28 (c) (k) | United States | 175,377 | — | ||||||||||||
| Grove Hotel Parcel Owner LLC, First Lien Term Loan 13.43%, 06/21/28 (c) | United States | 1,736,231 | 1,707,410 | ||||||||||||
| Grove Hotel Parcel Owner LLC, First Lien Delay Draw Term Loan 0.00%, 06/21/28 (c) (k) | United States | 350,754 | — | ||||||||||||
| PFNY Holdings LLC, First Lien Delay Draw Term Loan 11.63%, 12/31/26 (c) | United States | 306,252 | 291,277 | ||||||||||||
| PFNY Holdings LLC, First Lien Term Loan 12.51%, 12/31/26 (c) | United States | 3,576,681 | 3,401,781 | ||||||||||||
| PFNY Holdings LLC, First Lien Revolver 12.66%, 12/31/26 (c) | United States | 173,352 | 164,875 | ||||||||||||
Total Hotels, Restaurants & Leisure | 5,565,343 | ||||||||||||||
Insurance – 0.2% | |||||||||||||||
| Ardonagh Midco 3 PLC, First Lien Delay Draw Term Loan 12.39%, 07/14/26 (c) (k) | �� | United States | 1,097,433 | 554,200 | |||||||||||
Metals & Mining – 0.4% | |||||||||||||||
| IAMGOLD Corp., Second Lien Term Loan 13.62%, 05/16/28 (c) | United States | 975,000 | 956,475 | ||||||||||||
Pharmaceuticals – 0.6% | |||||||||||||||
| Bioxcel Therapeutics, Inc., First Lien Tranche B Delay Draw Term Loan 0.00%, 09/30/32 (c) (f) (k) | United States | 563,378 | — | ||||||||||||
10.25%, 04/19/27 (c) (k) | United States | 438,183 | — | ||||||||||||
| Bioxcel Therapeutics, Inc., First Lien Tranche A Delay Draw Term Loan 0.00%, 09/30/32 (c) (f) | United States | 443,052 | 423,380 | ||||||||||||
| Bioxcel Therapeutics, Inc., First Lien Tranche A Term Loan 8.00%, 04/19/27 (c) | United States | 905,404 | 844,290 | ||||||||||||
See Notes to Consolidated Financial Statements.
2023 Annual Report
37
OAKTREE DIVERSIFIED INCOME FUND INC.
Consolidated Schedule of Investments (continued)
December 31, 2023
Description | Country | Principal Amount | Value | ||||||||||||
PRIVATE CREDIT (continued) | |||||||||||||||
| Bioxcel Therapeutics, Inc., First Lien Tranche C Delay Draw Term Loan 0.00%, 09/30/32 (c) (f) (k) | United States | $ | 563,378 | $ | — | ||||||||||
10.25%, 04/19/27 (c) (k) | United States | 375,585 | — | ||||||||||||
Total Pharmaceuticals | 1,267,670 | ||||||||||||||
Software – 5.0% | |||||||||||||||
| Avalara, Inc., First Lien Term Loan 12.60% (3 Month SOFR + 7.25%), 10/19/28 (b) (c) | United States | 2,491,000 | 2,459,863 | ||||||||||||
| Avalara, Inc., First Lien Revolver 0.75%, 10/19/28 (c) (k) | United States | 249,000 | — | ||||||||||||
| Evergreen IX Borrower LLC, First Lien Term Loan 11.39% (3 Month SOFR + 6.00%), 09/29/30 (b) (c) | United States | 1,147,000 | 1,120,390 | ||||||||||||
| Evergreen IX Borrower LLC, First Lien Revolver 11.39%, 09/29/29 (c) (k) | United States | 127,000 | — | ||||||||||||
| Finastra USA, Inc., First Lien Term Loan 12.71% (6 Month SOFR + 7.25%), 09/13/30 (b) (c) | United States | 1,462,000 | 1,450,397 | ||||||||||||
| Finastra USA, Inc., First Lien Revolver 12.57% (1 Month SOFR + 7.25%), 09/13/30 (b) (c) (k) | United States | 143,954 | 31,624 | ||||||||||||
| iCIMS, Inc., First Lien Revolver Facility 11.99%, 08/18/28 (c) (k) | United States | 157,552 | 32,130 | ||||||||||||
| iCIMS, Inc., First Lien Term Loan 8.75%, 08/18/28 (c) | United States | 1,720,993 | 1,657,832 | ||||||||||||
12.63% (3 Month SOFR + 7.25%), 08/18/28 (b) (c) | United States | 253,659 | 246,759 | ||||||||||||
| iCIMS, Inc., First Lien Delay Draw Term Loan 0.00%, 08/18/28 (c) (f) (k) | United States | 351,848 | — | ||||||||||||
| OEConnection LLC, Second Lien Term Loan 12.42%, 09/25/27 (c) | United States | 2,499,000 | 2,461,516 | ||||||||||||
| Pluralsight LLC, First Lien Revolver 13.56% (3 Month SOFR + 8.00%), 04/06/27 (b) (c) (k) | United States | 56,830 | 30,647 | ||||||||||||
| Pluralsight LLC, First Lien Term Loan 13.45% (3 Month SOFR + 8.00%), 04/06/27 (b) (c) | United States | 659,000 | 633,958 | ||||||||||||
| UserZoom Technologies, Inc., First Lien Term Loan 12.77%, 04/05/29 (c) | United States | 1,348,000 | 1,327,780 | ||||||||||||
Total Software | 11,452,896 | ||||||||||||||
Specialty Retail – 0.7% | |||||||||||||||
| MND Holdings III Corp., First Lien Term Loan 12.54%, 05/09/28 (c) | United States | 1,254,695 | 1,267,242 | ||||||||||||
See Notes to Consolidated Financial Statements.
38
OAKTREE DIVERSIFIED INCOME FUND INC.
Consolidated Schedule of Investments (continued)
December 31, 2023
Description | Country | Principal Amount | Value | ||||||||||||
PRIVATE CREDIT (continued) | |||||||||||||||
| MND Holdings III Corp., First Lien Revolver 12.55%, 05/09/28 (c) (k) | United States | $ | 327,000 | $ | 256,572 | ||||||||||
Total Specialty Retail | 1,523,814 | ||||||||||||||
Total Senior Loans | 48,004,078 | ||||||||||||||
Shares | |||||||||||||||
Preferred Stock – 0.9% | |||||||||||||||
Health Care Providers & Services – 0.1% | |||||||||||||||
| Petvet Care Centers LLC – (Acquired 11/15/2023, cost $198,940) (c) (l) | United States | 203,000 | 199,123 | ||||||||||||
Health Care Technology – 0.8% | |||||||||||||||
| athenahealth, Inc. – (Acquired 2/15/2022, cost $1,992,289) (c) (l) | United States | 2,033 | 1,940,294 | ||||||||||||
Total Preferred Stock | 2,139,417 | ||||||||||||||
Common Stock – 0.1% | |||||||||||||||
Distributors – 0.1% | |||||||||||||||
| RelaDyne – (Acquired 12/23/2021, cost $187,703) (c) (l) | United States | 2,000 | 279,120 | ||||||||||||
Total Common Stock | 279,120 | ||||||||||||||
Warrants – 0.0% | |||||||||||||||
Biotechnology – 0.0% | |||||||||||||||
| ADC Therapeutics – (Exercise price: $8.30, Expiration: 08/15/32) – (Acquired 8/15/2022, cost $30,028) (c) (l) | United States | 4,988 | 2,245 | ||||||||||||
| Mesoblast, Inc. – (Exercise Price: $3.70, Expiration: 11/19/28) – (Acquired 1/12/2023, cost $0) (c) (l) | United States | 11,941 | 4,776 | ||||||||||||
| Mesoblast, Inc. – (Exercise Price: $7.26, Expiration: 11/19/28) – (Acquired 12/20/2021, cost $106,354) (c) (l) | United States | 46,443 | 11,611 | ||||||||||||
| Seres Therapeutics, Inc. – (Exercise price: $6.69, Expiration: 04/27/30) – (Acquired 4/27/2023, cost $14,821) (c) (l) | United States | 4,735 | 3,551 | ||||||||||||
Total Biotechnology | 22,183 | ||||||||||||||
Health Care Technology – 0.0% | |||||||||||||||
| Impel Pharmaceuticals, Inc. – (Exercise Price: $0.01, Expiration: 09/05/30) – (Acquired 9/5/2023, cost $0) (c) (l) | United States | 26,745 | 3,036 | ||||||||||||
| Innocoll Pharmaceuticals Ltd. – (Exercise Price: $4.23, Expiration: 01/26/29) – (Acquired 1/26/2022 – 9/1/2022, cost $77,901) (c) (l) | United States | 20,192 | — | ||||||||||||
Total Health Care Technology | 3,036 | ||||||||||||||
Pharmaceuticals – 0.0% | |||||||||||||||
| Bioxcel Therapeutics, Inc. – (Exercise price: $20.04, Expiration: 04/19/29) – (Acquired 4/28/2022, cost $0) (c) (l) | United States | 3,487 | 1,220 | ||||||||||||
Total Warrants | 26,439 | ||||||||||||||
| TOTAL PRIVATE CREDIT (Cost $52,631,347) | 50,449,054 | ||||||||||||||
See Notes to Consolidated Financial Statements.
2023 Annual Report
39
OAKTREE DIVERSIFIED INCOME FUND INC.
Consolidated Schedule of Investments (continued)
December 31, 2023
Description | Country | Shares | Value | ||||||||||||
MONEY MARKET FUND – 3.5% | |||||||||||||||
| First American Government Obligations Fund – Class X, 5.29% (j) | United States | 8,003,117 | $ | 8,003,117 | |||||||||||
| TOTAL MONEY MARKET FUND (Cost $8,003,117) | 8,003,117 | ||||||||||||||
Total Investments – 115.2% (a) (Cost $275,585,403) | 265,074,122 | ||||||||||||||
Liabilities in Excess of Other Assets – (15.2)% | (34,957,324 | ) | |||||||||||||
TOTAL NET ASSETS – 100.0% | $ | 230,116,798 | |||||
The following notes should be read in conjunction with the accompanying Consolidated Schedule of Investments.
(a) These securities are pledged as collateral for the credit facility.
(b) Variable rate security – Interest rate is based on reference rate and spread or based on the underlying assets. Interest rate may also be subject to a cap or floor. Securities that reference SOFR may be subject to a credit spread adjustment, particularly to legacy holdings that reference LIBOR that have transitioned to SOFR as the base lending rate.
(c) These securities are characterized as Level 3 securities within the disclosure hierarchy. Level 3 security values are determined using significant unobservable inputs. As of December 31, 2023, the total value of all such securities was $54,114,948 or 23.5% of net assets.
(d) Security exempt from registration under Rule 144A of the Securities Act of 1933. These securities may be resold in transactions exempt from registration to qualified institutional buyers. As of December 31, 2023, the total value of all such securities was $105,830,215 or 46.0% of net assets.
(e) Regulation S security. These securities may be subject to transfer restrictions as defined by Regulation S. As of December 31, 2023, the total value of all such securities was $1,643,988 or 0.7% of net assets.
(f) Paid in kind security which may pay interest in additional par.
(g) These assets are held in the Oaktree Diversified Income Fund (Cayman) Ltd., a Cayman Islands exempted company and wholly-owned subsidiary of the Fund.
(h) Security is a "step up" bond where the coupon increases or steps up at a predetermined date. Interest rate shown is the rate in effect as of December 31, 2023.
(i) Issuer is currently in default on its regularly scheduled interest payment.
(j) The rate shown represents the seven-day yield as of December 31, 2023.
(k) As of December 31, 2023, the Fund had entered into the following commitments to fund various revolving and delayed draw senior secured and subordinated loans. Such commitments are subject to the satisfaction of certain conditions set forth in the documents governing these loans and there can be no assurance that such conditions will be satisfied. All values are reflected at par.
Company | Investment Type | Total revolving and delayed draw loan commitments (000s) | Less: funded commitments (000s) | Total unfunded commitments (000s) (Note 10) | |||||||||||||||
ADC Therapeutics, Inc. | First Lien Tranche B Delay Draw Term Loan | $ | 520 | $ | — | $ | 520 | ||||||||||||
Amspec Parent, Inc. | First Lien Term Loan | 226 | — | 226 | |||||||||||||||
Amspec Parent, Inc. | First Lien Revolver | 212 | — | 212 | |||||||||||||||
Ardonagh Midco 3 PLC | First Lien Delay Draw Term Loan | 1,097 | 547 | 550 | |||||||||||||||
ASP-r-pac Acquisition Company LLC | First Lien Revolver | 206 | — | 206 | |||||||||||||||
Avalara, Inc. | First Lien Revolver | 249 | — | 249 | |||||||||||||||
Bioxcel Therapeutics, Inc. | First Lien Tranche B Delay Draw Term Loan | 563 | — | 563 | |||||||||||||||
Bioxcel Therapeutics, Inc. | First Lien Tranche C Delay Draw Term Loan | 563 | — | 563 | |||||||||||||||
Bioxcel Therapeutics, Inc. | First Lien Tranche C Delay Draw Term Loan | 376 | — | 376 | |||||||||||||||
Bioxcel Therapeutics, Inc. | First Lien Tranche B Delay Draw Term Loan | 438 | — | 438 | |||||||||||||||
Establishment Labs Holdings, Inc. | First Lien Tranche D Delay Draw Term Loan | 184 | — | 184 | |||||||||||||||
Establishment Labs Holdings, Inc. | First Lien Tranche C Delay Draw Term Loan | 184 | — | 184 | |||||||||||||||
Evergreen IX Borrower LLC | First Lien Revolver | 127 | — | 127 | |||||||||||||||
Finastra USA, Inc. | First Lien Revolver | 144 | 32 | 112 | |||||||||||||||
Galileo Parent, Inc. | First Lien Revolver | 83 | 27 | 56 | |||||||||||||||
See Notes to Consolidated Financial Statements.
40
OAKTREE DIVERSIFIED INCOME FUND INC.
Consolidated Schedule of Investments (continued)
December 31, 2023
Company | Investment Type | Total revolving and delayed draw loan commitments (000s) | Less: funded commitments (000s) | Total unfunded commitments (000s) (Note 10) | |||||||||||||||
Grove Hotel Parcel Owner LLC | First Lien Revolver Facility | $ | 175 | $ | — | $ | 175 | ||||||||||||
Grove Hotel Parcel Owner LLC | First Lien Delay Draw Term Loan | 351 | — | 351 | |||||||||||||||
iCIMS, Inc. | First Lien Revolver Facility | 158 | 34 | 124 | |||||||||||||||
iCIMS, Inc. | First Lien Delay Draw Term Loan | 352 | — | 352 | |||||||||||||||
Impel Pharmaceuticals, Inc. | First Lien Tranche B Delay Draw Term Loan | 240 | 165 | 75 | |||||||||||||||
Inventus Power, Inc. | First Lien Revolver | 94 | — | 94 | |||||||||||||||
Kings Buyer LLC | First Lien Revolver | 310 | — | 310 | |||||||||||||||
LSL Holdco LLC | First Lien Revolver | 266 | — | 266 | |||||||||||||||
MND Holdings III Corp. | First Lien Revolver | 327 | 256 | 71 | |||||||||||||||
Next Holdco LLC | First Lien Term Loan | 213 | — | 213 | |||||||||||||||
Next Holdco LLC | First Lien Revolver | 80 | — | 80 | |||||||||||||||
NFM & J LP | First Lien Revolver | 110 | 6 | 104 | |||||||||||||||
NFM & J LP | First Lien Term Loan | 276 | — | 276 | |||||||||||||||
Petvet Care Centers LLC | First Lien Term Loan | 307 | — | 307 | |||||||||||||||
Petvet Care Centers LLC | First Lien Revolver | 307 | — | 307 | |||||||||||||||
Pluralsight LLC | First Lien Revolver | 41 | 32 | 9 | |||||||||||||||
Seres Therapeutics, Inc. | First Lien Tranche B Delay Draw Term Loan | 329 | — | 329 | |||||||||||||||
Seres Therapeutics, Inc. | First Lien Tranche C Delay Draw Term Loan | 329 | — | 329 | |||||||||||||||
WP CPP Holdings | First Lien Revolver | 90 | — | 90 | |||||||||||||||
$ | 9,527 | $ | 1,099 | $ | 8,428 | ||||||||||||||
(l) Restricted security. Purchased in a private placement transaction; resale to the public may require registration. As of December 31, 2023, the total value of all such securities was $2,848,992 or 1.2% of net assets.
Abbreviations:
CME Chicago Mercantile Exchange
CMT Constant Maturity Treasury Rate
EURIBOR Euro Interbank Offered Rate
LIBOR London Interbank Offered Rates
LLC Limited Liability Corporation
LP Limited Partnership
PIK Payment-in Kind
SOFR Secured Overnight Financial Rate
SOFR30A Secured Overnight Financial Rate 30 Day Average
SONIA Sterling Overnight Index Average
Currencies:
GBP (£) British Pound
EUR (€) Euro
USD ($) US Dollar
Forward Currency Contracts:
As of December 31, 2023, the following forward currency contracts were outstanding:
Settlement | Currency Purchased | Currency Sold | Counterparty | Value/Unrealized | |||||||||||||||||||||||
1/18/2024 | 27,733,325 | USD | 25,930,804 | EUR | State Street Bank & Trust Co. | $ | (917,302 | ) | |||||||||||||||||||
1/18/2024 | 789,453 | EUR | 849,611 | USD | State Street Bank & Trust Co. | 22,646 | |||||||||||||||||||||
1/18/2024 | 1,975,742 | USD | 1,600,459 | GBP | State Street Bank & Trust Co. | (64,521 | ) | ||||||||||||||||||||
1/18/2024 | 316,802 | GBP | 390,447 | USD | State Street Bank & Trust Co. | 13,413 | |||||||||||||||||||||
$ | (945,764 | ) | |||||||||||||||||||||||||
See Notes to Consolidated Financial Statements.
2023 Annual Report
41
OAKTREE DIVERSIFIED INCOME FUND INC.
Consolidated Statement of Assets and Liabilities
December 31, 2023
Assets: | |||||||
Investments in securities, at value (Cost $275,585,403) | $ | 265,074,122 | |||||
Cash | 1,964,480 | ||||||
Foreign currency, at value (Cost $303,265) | 307,485 | ||||||
Interest receivable | 3,748,822 | ||||||
| Receivable for investments sold | 2,307,109 | ||||||
Receivable for fund shares sold | 1,950 | ||||||
Unrealized appreciation on forward currency contracts (Note 3) | 36,059 | ||||||
Unrealized appreciation on unfunded loan commitments | 8,378 | ||||||
Prepaid expenses | 44,939 | ||||||
| Total assets | 273,493,344 | ||||||
Liabilities: | |||||||
Payable for credit facility (Note 6) | 35,000,000 | ||||||
Deferred debt issuance costs, credit facility (Note 6) | (300,000 | ) | |||||
Interest payable for credit facility (Note 6) | 58,837 | ||||||
| Payable for investments purchased | 7,163,170 | ||||||
Unrealized depreciation on forward currency contracts (Note 3) | 981,823 | ||||||
Investment advisory fees payable (Note 4) | 258,600 | ||||||
| Accrued expenses | 214,116 | ||||||
| Total liabilities | 43,376,546 | ||||||
Indemnifications, commitments and contingencies (Note 10) | |||||||
Net Assets | $ | 230,116,798 | |||||
Composition of Net Assets: | |||||||
Paid-in capital | $ | 246,045,868 | |||||
| Accumulated losses | (15,929,070 | ) | |||||
Net Assets | $ | 230,116,798 | |||||
Shares Outstanding and Net Asset Value Per Share: | |||||||
Shares outstanding | 25,902,014 | ||||||
Net asset value per share | $ | 8.88 | |||||
See Notes to Consolidated Financial Statements.
42
OAKTREE DIVERSIFIED INCOME FUND INC.
Consolidated Statement of Operations
For the Year Ended December 31, 2023
Investment Income (Note 2): | |||||||
Interest (net of foreign withholding tax of $258,983) | $ | 22,168,553 | |||||
Total investment income | 22,168,553 | ||||||
Expenses: | |||||||
Investment advisory fees (Note 4) | 2,630,998 | ||||||
Audit and tax services | 335,778 | ||||||
Fund accounting and sub-administration fees | 208,518 | ||||||
Legal fees | 197,709 | ||||||
Directors' fees | 151,469 | ||||||
Reports to shareholders | 68,767 | ||||||
Miscellaneous | 63,399 | ||||||
Transfer agent fees | 60,238 | ||||||
Registration fees | 44,496 | ||||||
Custodian fees | 20,950 | ||||||
Insurance | 16,117 | ||||||
Total operating expenses | 3,798,439 | ||||||
Interest expense and credit facility fees (Note 6) | 1,810,039 | ||||||
| Net expense recoupment (Note 4) | 137,705 | ||||||
Net expenses | 5,746,183 | ||||||
Net investment income | 16,422,370 | ||||||
Net realized gain (loss) on: | |||||||
Investments | (1,418,569 | ) | |||||
Foreign currency translation | 2,433 | ||||||
Forward currency contracts | 463,395 | ||||||
Net realized loss | (952,741 | ) | |||||
Net change in unrealized appreciation (depreciation) on: | |||||||
Investments | 6,262,348 | ||||||
Unfunded loan commitments | 8,378 | ||||||
Foreign currency translation | 37,335 | ||||||
Forward currency contracts | (755,545 | ) | |||||
Net change in unrealized appreciation | 5,552,516 | ||||||
Net realized and unrealized gain | 4,599,775 | ||||||
Net increase in net assets resulting from operations | $ | 21,022,145 | |||||
See Notes to Consolidated Financial Statements.
2023 Annual Report
43
OAKTREE DIVERSIFIED INCOME FUND INC.
Consolidated Statements of Changes in Net Assets
| For the Year Ended December 31, 2023 | For the Year Ended December 31, 2022 | ||||||||||
Increase (Decrease) in Net Assets Resulting from Operations: | |||||||||||
Net investment income | $ | 16,422,370 | $ | 7,982,345 | |||||||
Net realized loss | (952,741 | ) | (1,596,228 | ) | |||||||
Net change in unrealized appreciation (depreciation) | 5,552,516 | (16,855,516 | ) | ||||||||
Net increase (decrease) in net assets resulting from operations | 21,022,145 | (10,469,399 | ) | ||||||||
Distributions to Shareholders: | |||||||||||
Distributable earnings | (15,645,010 | ) | (10,683,466 | ) | |||||||
Total distributions paid | (15,645,010 | ) | (10,683,466 | ) | |||||||
Capital Share Transactions: | |||||||||||
Proceeds from shares sold | 62,173,242 | 12,643,242 | |||||||||
Reinvestment of distributions | 12,613,249 | 10,178,729 | |||||||||
Repurchase of shares (Note 8) | (1,748,478 | ) | (59,881 | ) | |||||||
Net increase in net assets from capital share transactions | 73,038,013 | 22,762,090 | |||||||||
Total increase in net assets | 78,415,148 | 1,609,225 | |||||||||
Net Assets: | |||||||||||
Beginning of year | 151,701,650 | 150,092,425 | |||||||||
End of year | $ | 230,116,798 | $ | 151,701,650 | |||||||
Share Transactions: | |||||||||||
Shares sold | 7,005,201 | 1,414,283 | |||||||||
Shares reinvested | 1,431,970 | 1,158,749 | |||||||||
Shares repurchased (Note 8) | (196,752 | ) | (6,820 | ) | |||||||
Net increase in shares outstanding | 8,240,419 | 2,566,212 | |||||||||
See Notes to Consolidated Financial Statements.
44
OAKTREE DIVERSIFIED INCOME FUND INC.
Consolidated Statement of Cash Flows
For the Year Ended December 31, 2023
Increase (Decrease) in Cash: | |||||||
Cash flows provided by (used for) operating activities: | |||||||
Net increase in net assets resulting from operations | $ | 21,022,145 | |||||
| Adjustments to reconcile net increase in net assets resulting from operations to net cash used for operating activities: | |||||||
Purchases of long-term portfolio investments and principal payups | (134,971,296 | ) | |||||
Proceeds from disposition of long-term portfolio investments and principal paydowns | 50,180,510 | ||||||
Net purchases and sales of short-term portfolio investments | (3,692,184 | ) | |||||
Amortization of deferred debt issuance costs | 143,084 | ||||||
| Increase in receivable for investments sold | (2,307,109 | ) | |||||
Increase in interest receivable | (1,222,502 | ) | |||||
Increase in prepaid expenses | (38,189 | ) | |||||
Increase in interest payable for credit facility | 5,056,609 | ||||||
| Increase in payable for investments purchased | 5,619,477 | ||||||
Increase in investment advisory fees payable | 68,300 | ||||||
| Increase in accrued expenses | 32,755 | ||||||
Net accretion of discount on investments and other adjustments to cost | (1,695,332 | ) | |||||
Net change in unrealized appreciation on investments | (6,262,348 | ) | |||||
Increase in unrealized appreciation on unfunded commitments | (8,378 | ) | |||||
Net change in unrealized depreciation on forward currency contracts | 755,545 | ||||||
Net realized loss on investment transactions | 1,418,569 | ||||||
Net cash used for operating activities | (65,900,344 | ) | |||||
Cash flows provided by financing activities: | |||||||
Proceeds from credit facility | 10,000,000 | ||||||
Proceeds from shares sold | 62,734,772 | ||||||
Distributions paid to shareholders, net of reinvestments | (3,031,761 | ) | |||||
Repurchase of shares | (1,748,478 | ) | |||||
Deferred debt issuance costs paid | (300,000 | ) | |||||
Net cash provided by financing activities | 67,654,533 | ||||||
Net increase in cash | 1,754,189 | ||||||
Cash at beginning of year(1) | 517,776 | ||||||
Cash at end of year(1) | $ | 2,271,965 | |||||
Supplemental Disclosure of Cash Flow Information: | |||||||
Interest payments on the credit facility for the year ended December 31, 2023 totaled $1,610,346. | |||||||
Non-cash financing activities not included consist of reinvestment of distributions for the year ended December 31, 2023 of $12,613,249. | |||||||
(1) Includes foreign currency.
See Notes to Consolidated Financial Statements.
2023 Annual Report
45
OAKTREE DIVERSIFIED INCOME FUND INC.
Consolidated Financial Highlights
Class D | For the Year Ended December 31, 2023 | For the Year Ended December 31, 2022 | For the Period November 1, 20211 through December 31, 2021 | ||||||||||||
Per Share Operating Performance: | |||||||||||||||
Net asset value, beginning of period | $ | 8.59 | $ | 9.94 | $ | 10.00 | |||||||||
Income from Investment Operations: | |||||||||||||||
Net investment income2 | 0.78 | 0.50 | 0.02 | ||||||||||||
Net realized and change in unrealized loss | 0.20 | (1.20 | ) | (0.07 | ) | ||||||||||
Net decrease in net asset value resulting from operations | 0.98 | (0.70 | ) | (0.05 | ) | ||||||||||
Distributions to Shareholders: | |||||||||||||||
From net investment income | (0.69 | ) | (0.65 | ) | (0.01 | ) | |||||||||
Total distributions paid* | (0.69 | ) | (0.65 | ) | (0.01 | ) | |||||||||
Net asset value, end of period | $ | 8.88 | $ | 8.59 | $ | 9.94 | |||||||||
Total Investment Return†3 | 11.76 | % | (7.03 | )%4 | (0.37 | )% | |||||||||
Ratios to Average Net Assets/Supplementary Data: | |||||||||||||||
Net assets, end of period (000s) | $ | 230,117 | $ | 151,702 | $ | 150,092 | |||||||||
Gross operating expenses excluding interest expense5 | 2.03 | % | 1.96 | % | 5.55 | % | |||||||||
Gross operating expenses5 | 3.01 | % | 2.51 | % | 5.55 | % | |||||||||
| Net expenses, including fee waivers and reimbursement or recoupment and excluding interest expense5 | 2.10 | % | 2.10 | % | 2.10 | % | |||||||||
Net expenses, including fee waivers and reimbursement or recoupment and interest expense5 | 3.08 | % | 2.65 | % | 2.10 | % | |||||||||
Net investment income5 | 8.81 | % | 5.64 | % | 1.51 | % | |||||||||
| Net investment income (loss), excluding the effect of fee waivers and reimbursement or recoupment5 | 8.88 | % | 5.50 | % | (1.94 | )% | |||||||||
Portfolio turnover rate3 | 24 | % | 25 | % | 4 | % | |||||||||
The following table sets forth information regarding the Fund's outstanding senior securities as of the end of each of the Fund's last ten iscal years, as applicable.
Fiscal or Period End | Total Amount Outstanding Exclusive or Treasury Securities | Asset Coverage Per Unit6 | Involuntary Liquidating Preference Per Unit | Average Market Value Per Unit (Exclude Bank Loans) | Type of Senior Security | ||||||||||||||||||
December 31, 2023 | $ | 35,000,000 | $ | 7,575 | N/A | N/A | Credit Facility | ||||||||||||||||
December 31, 2022 | 20,000,000 | 8,585 | N/A | N/A | Credit Facility | ||||||||||||||||||
December 31, 20217 | N/A | N/A | N/A | N/A | N/A | ||||||||||||||||||
* Distributions for annual periods determined in accordance with federal income tax regulations.
† Total investment return is computed based upon the net asset value of the Fund's shares and excludes the effects of sales charges or contingent deferred sales charges, if applicable. Distributions are assumed to be reinvested at the net asset value of the Class on the ex-date of the distribution.
1 Commencement of operations.
2 Per share amounts presented are based on average shares outstanding throughout the period indicated.
3 Not annualized for periods less than one year.
4 The total investment return for the year ended December 31, 2022 has been restated to (7.03)% for the correction of a typographical error. The Adviser and Administrator have evaluated the quantitative and qualitative aspects of this error and concluded it is not material to the previously issued consolidated financial statements.
5 Annualized for periods less than one year.
6 Calculated by subtracting the Fund's total liabilities (not including borrowings) from the Fund's total assets and dividing by the total number of senior indebtedness units, where one unit equals $1,000 of senior indebtedness.
7 Commenced operations on November 1, 2021
See Notes to Consolidated Financial Statements.
46
OAKTREE DIVERSIFIED INCOME FUND INC.
Notes to Consolidated Financial Statements
December 31, 2023
1. Organization
Oaktree Diversified Income Fund Inc. (the "Fund") was organized as a corporation under the laws of the State of Maryland on June 29, 2021. The Fund is registered under the Investment Company Act of 1940, as amended (the "1940 Act"), as a diversified, closed-end management investment company that continuously offers its shares of common stock, $0.001 par value per share (the "Common Shares"), and is operated as an "interval fund." The Fund's Class D shares commenced operations on November 1, 2021.
The Fund has two classes of shares: Class D and Class T shares. The Fund had applied for, and was granted, exemptive relief (the "Exemptive Relief") by the Securities and Exchange Commission (the "SEC") that permits the Fund to issue multiple classes of shares and to impose asset-based distribution fees and early-withdrawal fees. Currently, the Fund is only offering Class D shares.
Oaktree Fund Advisors, LLC ("Oaktree" or the "Adviser"), a Delaware limited liability company and a registered investment adviser under the Investment Advisers Act of 1940, as amended, serves as the investment adviser to the Fund. Oaktree was founded in April 1995 and is a leader among global investment managers specializing in alternative investments.
Brookfield Public Securities Group LLC (the "Administrator"), a wholly-owned subsidiary of Brookfield Asset Management Inc. ("Brookfield"), is registered as an investment adviser under the Investment Advisers Act of 1940, as amended, and serves as Administrator to the Fund. In 2019, Brookfield acquired a majority interest in the Adviser.
The Fund's investment objective is to seek current income and attractive total return. The Fund seeks to achieve its investment objective by investing globally in high-conviction opportunities across Oaktree's performing credit platform of high-yield bonds, senior loans, structured credit, emerging markets debt and convertibles, inclusive of both public and private credit sectors. High-yield bonds are also referred to as "below-investment grade rated securities" or "junk bonds," as described in the Fund's Prospectus. The Fund seeks to add value through three sources: (1) providing exposure to asset classes that require specialized expertise; (2) performing well in each asset class through proprietary, bottom-up and credit research; and (3) allocating capital opportunistically among asset classes based on Oaktree's assessment of relative value.
Oaktree Diversified Income Fund (Cayman) Ltd. (the "Subsidiary"), a Cayman Islands exempted company and wholly-owned subsidiary of the Fund, was formed on November 11, 2021. The Subsidiary was established for the purpose of investing in certain Regulation S securities. As a wholly-owned subsidiary of the Fund, the financial results of the Subsidiary are included in the consolidated financial statements and financial highlights of the Fund. All investments held by the Subsidiary are disclosed in the Consolidated Schedule of Investments. The Fund may invest up to 25% of its total assets in the Subsidiary. The net assets of the Subsidiary at December 31, 2023 were $1,648,222, or 0.7% of the Fund's consolidated net assets. The accompanying consolidated financial statements include the accounts of the Subsidiary. All inter-company accounts and transactions have been eliminated in consolidation.
2. Significant Accounting Policies
The preparation of financial statements in conformity with accounting principles generally accepted in the United States of America ("GAAP") requires management to make estimates and assumptions that affect the reported amounts of assets and liabilities and disclosure of contingent assets and liabilities at the date of the financial statements and the reported amounts of increases and decreases in net assets from operations during the reporting period. Actual results could differ from those estimates. The Fund is an investment company and follows accounting and reporting guidance under Financial Accounting Standards Board ("FASB") Accounting Standards Codification ("ASC") Topic 946, Financial Services-Investment Companies.
Valuation of Investments: The Fund's Board of Directors (the "Board") has adopted procedures for the valuation of the Fund's securities. The Adviser oversees the day to day responsibilities for valuation determinations under these procedures. The Board regularly reviews the application of these procedures to the securities in the Fund's portfolio. The Adviser's Valuation Committee is comprised of senior members of the Adviser's management team.
2023 Annual Report
47
OAKTREE DIVERSIFIED INCOME FUND INC.
Notes to Consolidated Financial Statements (continued)
December 31, 2023
The Board has designated the Adviser as the valuation designee pursuant to Rule 2a-5 under the 1940 Act to perform fair value determination relating to any or all Fund investments. The Board oversees the Adviser in its role as the valuation designee in accordance with the requirements of Rule 2a-5 under the 1940 Act.
Investments in equity securities listed or traded on any securities exchange or traded in the over-the-counter market are valued at the last trade price as of the close of business on the valuation date. If the NYSE closes early, then the equity security will be valued at the last traded price before the NYSE close. Prices of foreign equities that are principally traded on certain foreign markets will generally be adjusted daily pursuant to a fair value pricing service approved by the Board in order to reflect an adjustment for the factors occurring after the close of certain foreign markets but before the NYSE close. When fair value pricing is employed, the value of the portfolio securities used to calculate the Fund's net asset value ("NAV") may differ from quoted or official closing prices. Investments in open-end registered investment companies, if any, are valued at the NAV as reported by those investment companies.
Debt securities, including U.S. government securities, listed corporate bonds, other fixed income and asset-backed securities, and unlisted securities and private placement securities, are generally valued at the bid prices furnished by an independent pricing service or, if not valued by an independent pricing service, using bid prices obtained from active and reliable market makers in any such security or a broker-dealer. Valuations from broker-dealers or pricing services consider appropriate factors such as market activity, market activity of comparable securities, yield, estimated default rates, timing of payments, underlying collateral, coupon rate, maturity date, and other factors. Short-term debt securities with remaining maturities of sixty days or less are valued at amortized cost of discount or premium to maturity, unless such valuation, in the judgment of the Adviser's Valuation Committee, does not represent fair value.
Bank Loans, Assignments, and Participations. Loans (including "Senior Loans" (as described below), delayed funding loans and revolving credit facilities) may be fixed-or floating-rate obligations. Loan interests may take the form of direct interests acquired during a primary distribution and may also take the form of assignments of, novations of or participations in a bank loan acquired in secondary markets. Senior floating rate loans may be made to or issued by U.S. or non-U.S. banks or other corporations ("Senior Loans"). Senior Loans include senior floating rate loans and institutionally traded senior floating rate debt obligations issued by asset-backed pools and other issuers, and interests therein. Loan interests may be acquired from U.S. or foreign commercial banks, insurance companies, finance companies or other financial institutions who have made loans or are members of a lending syndicate or from other holders of loan interests.
Senior Loans typically pay interest at rates which are re-determined periodically on the basis of a floating base lending rate (such as the London Inter-Bank Offered Rate, "LIBOR," or a similar reference rate) plus a premium. Senior Loans are typically of below investment grade quality. Senior Loans generally (but not always) hold the most senior position in the capital structure of a borrower and are often secured with collateral. A Senior Loan is typically originated, negotiated and structured by a U.S. or foreign commercial bank, insurance company, finance company or other financial institution (an "Agent") for a lending syndicate of financial institutions ("Lenders"). The Agent typically administers and enforces the Senior Loan on behalf of the other Lenders in the syndicate. In addition, an institution, typically but not always the Agent, holds any collateral on behalf of the Lenders.
Over-the-counter financial derivative instruments, such as forward currency contracts, options contracts, or swap agreements, derive their values from underlying asset prices, indices, reference rates, other inputs or a combination of these factors. These instruments are normally valued on the basis of evaluations provided by independent pricing services or broker dealer quotations. Depending on the instrument and the terms of the transaction, the value of the derivative instruments can be estimated by a pricing service provider using a series of techniques, such as simulation pricing models. The pricing models use issuer details and other inputs that are observed from actively quoted markets such as indices, spreads, interest rates, curves, dividends and exchange rates. Derivatives that use similar valuation techniques and inputs as described above are normally categorized as Level 2 of the fair value hierarchy.
48
OAKTREE DIVERSIFIED INCOME FUND INC.
Notes to Consolidated Financial Statements (continued)
December 31, 2023
Securities for which market prices are not readily available, cannot be determined using the sources described above, or the Adviser's Valuation Committee determines that the quotation or price for a portfolio security provided by a broker-dealer or an independent pricing service is inaccurate will be valued at a fair value determined by the Adviser's Valuation Committee following the procedures adopted by the Adviser under the supervision of the Board. The Adviser's valuation policy establishes parameters for the sources, methodologies, and inputs the Adviser's Valuation Committee uses in determining fair value.
Non-publicly traded debt and equity securities and other securities or instruments for which reliable market quotations are not available are valued by the Adviser using valuation methodologies applied on a consistent basis. These securities may initially be valued at the acquisition price as the best indicator of fair value. The Adviser reviews the significant unobservable inputs, valuations of comparable investments and other similar transactions for investments valued at acquisition price to determine whether another valuation methodology should be utilized. Subsequent valuations will depend on facts and circumstances known as of the valuation date and the application of valuation methodologies further described below. The fair value may also be based on a pending transaction expected to close after the valuation date. These valuation methodologies involve a significant degree of management judgment. Accordingly, valuations do not necessarily represent the amounts which may eventually be realized from sales or other dispositions of investments in the future. Fair values may differ from the values that would have been used had a ready market for the investment existed, and the differences could be material to the consolidated financial statements.
The fair valuation methodology may include or consider the following guidelines, as appropriate: (1) evaluation of all relevant factors, including but not limited to, pricing history, current market level, supply and demand of the respective security; (2) comparison to the values and current pricing of securities that have comparable characteristics; (3) knowledge of historical market information with respect to the security; (4) other factors relevant to the security which would include, but not be limited to, duration, yield, fundamental analytical data, the Treasury yield curve, and credit quality. The fair value may be difficult to determine and thus judgment plays a greater role in the valuation process. Imprecision in estimating fair value can also impact the amount of unrealized appreciation or depreciation recorded for a particular portfolio security and differences in the assumptions used could result in a different determination of fair value, and those differences could be material. For those securities valued by fair valuations, the Adviser's Valuation Committee reviews and affirms the reasonableness of the valuations based on such methodologies and fair valuation determinations on a regular basis after considering all relevant information that is reasonably available. There can be no assurance that the Fund could purchase or sell a portfolio security at the price used to calculate the Fund's NAV.
A three-tier hierarchy has been established to maximize the use of observable market data and minimize the use of unobservable inputs and to establish classification of fair value measurements for disclosure purposes.
Observable inputs are inputs that reflect the assumptions market participants would use in pricing the asset or liability developed based on market data obtained from sources independent of the reporting entity. Unobservable inputs are inputs that reflect the reporting entity's own assumptions about the assumptions market participants would use in pricing the asset or liability developed based on the best information available in the circumstances.
The three-tier hierarchy of inputs is summarized in the three broad levels listed below:
Level 1 — quoted prices in active markets for identical assets or liabilities
Level 2 — quoted prices in markets that are not active or other significant observable inputs (including, but not limited to: quoted prices for similar assets or liabilities, quoted prices based on recently executed transactions, interest rates, credit risk, etc.)
Level 3 — significant unobservable inputs (including the Fund's own assumptions in determining the fair value of assets or liabilities)
2023 Annual Report
49
OAKTREE DIVERSIFIED INCOME FUND INC.
Notes to Consolidated Financial Statements (continued)
December 31, 2023
The following table summarizes the Fund's investments valuation inputs categorized in the disclosure hierarchy as of December 31, 2023:
Level 1 | Level 2 | Level 3 | Total | ||||||||||||||||
Corporate Credit | |||||||||||||||||||
Senior Loans (Syndicated) | $ | — | $ | 76,444,328 | $ | 2,090,326 | $ | 78,534,654 | |||||||||||
High Yield | — | 49,179,606 | 1,302,840 | 50,482,446 | |||||||||||||||
Emerging Markets | — | 6,488,161 | — | 6,488,161 | |||||||||||||||
Convertible Bonds | — | 1,675,628 | — | 1,675,628 | |||||||||||||||
Investment Grade | — | 57,593 | — | 57,593 | |||||||||||||||
Structured Credit | |||||||||||||||||||
Collateralized Loan Obligations | — | 42,151,877 | — | 42,151,877 | |||||||||||||||
| Commercial Mortgage-Backed Securities | — | 9,974,472 | 272,728 | 10,247,200 | |||||||||||||||
Residential Mortgage-Backed Securities | — | 6,384,306 | — | 6,384,306 | |||||||||||||||
| Asset-Backed Securities | — | 10,600,086 | — | 10,600,086 | |||||||||||||||
Private Credit | |||||||||||||||||||
Senior Loans | — | — | 48,004,078 | 48,004,078 | |||||||||||||||
Preferred Stock | — | — | 2,139,417 | 2,139,417 | |||||||||||||||
Common Stock | — | — | 279,120 | 279,120 | |||||||||||||||
Warrants | — | — | 26,439 | 26,439 | |||||||||||||||
Money Market Fund | 8,003,117 | — | — | 8,003,117 | |||||||||||||||
Total | $ | 8,003,117 | $ | 202,956,057 | $ | 54,114,948 | $ | 265,074,122 | |||||||||||
Other Financial Instruments(1) | Level 1 | Level 2 | Level 3 | Total | |||||||||||||||
Assets | |||||||||||||||||||
Unfunded loan commitments | $ | — | $ | — | $ | 8,378 | $ | 8,378 | |||||||||||
Liabilities | |||||||||||||||||||
Forward currency contracts | — | (945,764 | ) | — | (945,764 | ) | |||||||||||||
Total | $ | — | $ | (945,764 | ) | $ | 8,378 | $ | (937,386 | ) | |||||||||
(1) Forward currency contracts and unfunded loan commitments are reflected at the net unrealized appreciation (depreciation) on the instruments.
The Fund used valuation approaches consistent with the income approach and market approach to determine fair value of certain Level 3 assets as of December 31, 2023. The valuation methodologies utilized by the Fund included discounted cash flows analysis, recent transaction analysis, market yield analysis and market comparable analysis and are described below.
The discounted cash flows analysis utilizes a discounted cash flow method that incorporates expected timing and level of cash flows, as well as assumptions in determining growth rates, income and expense projections, discount rates, capital structure, terminal values and other factors. The applicability and weight assigned to the income technique is determined based on the availability of reliable projections and comparable companies and transactions.
The recent transaction analysis utilizes recent or expected future transactions of the investment to determine fair value, to the extent applicable.
The market yield analysis utilizes expected future cash flows, discounted using estimated current market rates. Discounted cash flow calculations may be adjusted to reflect current market conditions and/or the perceived credit risk of the borrowers. Consideration is also given to a borrower's ability to meet principal and interest obligations; this may include an evaluation of collateral or the underlying value of the borrower, utilizing either the market or income techniques.
50
OAKTREE DIVERSIFIED INCOME FUND INC.
Notes to Consolidated Financial Statements (continued)
December 31, 2023
The market comparable analysis utilizes valuations of comparable public companies or transactions and generally seeks to establish the enterprise value of the portfolio company using a market multiple technique. This technique takes into account a specific financial measure (such as earnings before interest, taxes, depreciation and amortization ("EBITDA"), adjusted EBITDA, free cash flow, net operating income, net income, book value or net asset value) believed to be most relevant for the given company. Consideration may also be given to such factors as acquisition price of the security, historical and projected operational and financial results for the portfolio company, the strengths and weaknesses of the portfolio company relative to its comparable companies, industry trends, general economic and market conditions and other factors deemed relevant. The applicability and weight assigned to the market technique is determined based on the availability of reliable projections and comparable companies and transactions.
The Fund may estimate the fair value of privately held warrants using a Black Scholes pricing model, which includes an analysis of various factors and subjective assumptions, including the current stock price (by using an enterprise value analysis as described above), the expected period until exercise, expected volatility of the underlying stock price, expected dividends and the risk-free rate. Changes in the subjective input assumptions can materially affect the fair value estimates.
The fair value of the Fund's credit facility, which qualifies as a financial instrument under ASC Topic 825, Disclosures about Fair Values of Financial Instruments, approximates the carrying amount of $35,000,000 for the credit facility presented in the Consolidated Statement of Assets and Liabilities. As of December 31, 2023, this financial instrument is categorized as Level 2 within the disclosure hierarchy.
The table below shows the significant unobservable valuation inputs that were used by the Adviser's Valuation Committee to fair value the Level 3 investments as of December 31, 2023.
| Value as of December 31, 2023 | Valuation Approach | Valuation Methodology | Unobservable Input | Amount or Range/ (Weighted Average) | Impact to Valuation from an Increase in Input(1) | ||||||||||||||||||||||
Corporate Credit | |||||||||||||||||||||||||||
| Senior Loans (Syndicated) | $ | 2,090,326 | Income Approach | Discounted Cash Flow | Yield (Discount Rate of Cash Flows) | 10.0%-18.0% (12.3%) | Decrease | ||||||||||||||||||||
| High Yield | 1,302,840 | Market Approach | Market Comparables | Recent Transaction Price | $99.0 ($99.0) | Increase | |||||||||||||||||||||
Structured Credit | |||||||||||||||||||||||||||
| Commercial Mortgage-Backed Securities | 272,728 | Market Approach | Market Comparables | Market Quotes | $46.70 ($46.70) | Increase | |||||||||||||||||||||
Private Credit | |||||||||||||||||||||||||||
| Senior Loans | 48,004,078 | Income Approach | Discounted Cash Flow | Yield (Discount Rate of Cash Flows) | 10.0%-27.0% (13.2%) | Decrease | |||||||||||||||||||||
| Preferred Stock | 2,139,417 | Income Approach | Discounted Cash Flow | Yield (Discount Rate of Cash Flows) | 15.0%-17.0% (16.0%) | Decrease | |||||||||||||||||||||
| Common Stock | 279,120 | Market approach | Comparable companies | Earnings Multiple | 6x-8x (7x) | Increase | |||||||||||||||||||||
| Warrants | 26,439 | Other | Black Scholes | Volatility | 80.0%-100.0% (92.6%) | Increase | |||||||||||||||||||||
Total | $ | 54,114,948 | |||||||||||||||||||||||||
(1) The impact represents the expected directional change in the fair value of the Level 3 investments that would result from an increase in the corresponding input. A decrease to the unobservable input would have the opposite effect. Significant changes in these inputs could result in significantly higher or lower fair value measurements.
2023 Annual Report
51
OAKTREE DIVERSIFIED INCOME FUND INC.
Notes to Consolidated Financial Statements (continued)
December 31, 2023
The following is a reconciliation of the assets in which significant unobservable inputs (Level 3) were used in determining fair value:
| Corporate Credit | Structured Credit | Private Credit | Total | ||||||||||||||||
Balance as of December 31, 2022 | $ | 2,216,836 | $ | — | $ | 39,126,978 | $ | 41,343,814 | |||||||||||
Accrued discounts (premiums) | 3,259 | 4,292 | 203,060 | 210,611 | |||||||||||||||
Realized gain (loss) | 3,446 | — | 135,222 | 138,668 | |||||||||||||||
Change in unrealized depreciation | (41,051 | ) | (276,874 | ) | (1,100,612 | ) | (1,418,537 | ) | |||||||||||
Purchases at cost/ corporate actions | 2,264,322 | 545,310 | 17,321,096 | 20,130,728 | |||||||||||||||
Sales proceeds | (1,053,646 | ) | — | (5,236,690 | ) | (6,290,336 | ) | ||||||||||||
Balance as of December 31, 2023 | $ | 3,393,166 | $ | 272,728 | $ | 50,449,054 | $ | 54,114,948 | |||||||||||
| Change in unrealized depreciation for Level 3 assets still held at the reporting date | $ | (41,051 | ) | $ | (276,874 | ) | $ | (1,197,523 | ) | $ | (1,515,448 | ) | |||||||
For further information regarding the security characteristics of the Fund, see the Consolidated Schedule of Investments.
Investment Transactions and Investment Income: Securities transactions are recorded on trade date. Realized gains and losses from securities transactions are calculated on the identified cost basis. Interest income is recorded on the accrual basis. Discounts and premiums on securities are accreted and amortized on a daily basis using the effective yield to maturity and yield to next methods, respectively and might be adjusted based on management's assessment of the collectability of such interest. Dividend income is recorded on the ex-dividend date.
Foreign Currency Transactions: Securities and other assets and liabilities denominated in foreign currencies are translated into U.S. dollar amounts at the date of valuation. Purchases and sales of securities and income and expense items denominated in foreign currencies are translated into U.S. dollar amounts on the respective dates of such transactions. The Fund does not isolate the portion of gains or losses resulting from changes in foreign exchange rates on securities from the fluctuations arising from changes in market prices.
Reported net realized foreign exchange gains or losses arise from sales of securities, currency gains or losses realized between the trade and settlement dates on securities transactions and the difference between the amounts of dividends, interest and foreign withholding taxes recorded on the Fund's books and the U.S. dollar equivalent of the amounts actually received or paid.
Expenses: Expenses directly attributable to the Fund are charged directly to the Fund, while expenses that are attributable to the Fund and other investment companies advised by the Adviser or its affiliates are allocated among the respective investment companies, including the Fund, based either upon relative average net assets, evenly, or a combination of average net assets and evenly.
Certain intermediaries such as banks, broker-dealers, financial advisers or other financial institutions charge a fee for sub-administration, sub-transfer agency and other shareholder services associated with shareholders whose shares are held in omnibus, other group accounts or accounts traded through registered securities clearing agents. The portion of this fee paid by the Fund is included within "Transfer agent fees" in the Consolidated Statement of Operations.
Distributions to Shareholders: The Fund declares and pays dividends quarterly from net investment income. To the extent these distributions exceed net investment income, they may be classified as return of capital. The Fund also pays distributions at least annually from its net realized capital gains, if any. Dividends and distributions are recorded on the ex-dividend date. All common shares have equal dividend and other distribution rights. A notice disclosing the source(s) of a distribution is provided after a payment is made from any source other than net investment income.
52
OAKTREE DIVERSIFIED INCOME FUND INC.
Notes to Consolidated Financial Statements (continued)
December 31, 2023
This notice is available on the Adviser's website at https://www.brookfieldoaktree.com/fund/oaktree-diversified-income-fund-inc. Any such notice is provided only for informational purposes in order to comply with the requirements of Section 19(a) of the 1940 Act and not for tax reporting purposes. The tax composition of the Fund's distributions for each calendar year is reported on IRS Form 1099-DIV.
Dividends from net investment income and distributions from realized gains from investment transactions have been determined in accordance with Federal income tax regulations and may differ from net investment income and realized gains recorded by the Fund for financial reporting purposes. These differences, which could be temporary or permanent in nature, may result in reclassification of distributions; however, net investment income, net realized gains and losses and net assets are not affected.
When Issued, Delayed Delivery Securities and Forward Commitments: The Fund may enter into forward commitments for the purchase or sale of securities, including on a "when issued" or "delayed delivery" basis, in excess of customary settlement periods for the type of security involved. In some cases, a forward commitment may be conditioned upon the occurrence of a subsequent event, such as approval and consummation of a merger, corporate reorganization or debt restructuring (i.e., a when, as and if issued security). When such transactions are negotiated, the price is fixed at the time of the commitment, with payment and delivery taking place in the future, generally a month or more after the date of the commitment. While it will only enter into a forward commitment with the intention of actually acquiring the security, the Fund may sell the security before the settlement date if it is deemed advisable. Securities purchased under a forward commitment are subject to market fluctuation, and no interest (or dividends) accrues to the Fund prior to the settlement date. The Fund will segregate with its custodian cash or liquid securities in an aggregate amount at least equal to the amount of its outstanding forward commitments.
Investments in Real Estate: The Fund may invest a portion of its assets in public and/or private debt investments and other real estate assets or real estate-related securities and obligations. The value of these debt investments and whether and to what extent such investments perform as expected will depend, in part, on the prevailing conditions in the market for real estate investment generally and, in particular, on the value of the underlying real estate asset collateral or real estate-related companies to which such debt investments relate. The real estate industry is cyclical in nature, and a deterioration of real estate fundamentals in the markets in which the Fund invests will have an adverse effect on the performance of the Fund's investments. The value of real estate assets and real estate-related investments can fluctuate for various reasons. Real estate values can be seriously affected by interest rate fluctuations, changes in general and local economic conditions, bank liquidity, the availability of financing, changes in environmental and zoning laws, overbuilding and increased competition, changes in supply and demand fundamentals, an increase in property taxes, casualty or condemnation losses, bankruptcy or financial difficulty of a major tenant, regulatory limitations on rent, increased mortgage defaults and the availability of mortgage funds which may render the sale or refinancing of properties difficult or impracticable. Reductions in value or cash flow could impair the Fund's ability to make distributions to Common Shareholders, adversely impact its ability to effectively achieve its investment objective and reduce overall returns on investments.
Investments in Real Estate Loans: While the Fund intends to invest primarily in "performing" real estate debt securities, real estate loans underlying the securities acquired by the Fund may be non-performing at the time of their acquisition and/or may become non-performing following their acquisition for a wide variety of reasons. Such non-performing real estate loans may require a substantial amount of workout negotiations and/or restructuring, which may entail, among other things, a substantial reduction in the interest rate and a substantial writedown of the principal of such loan. However, even if a restructuring were successfully accomplished, a risk exists that, upon maturity of such real estate loan, replacement "takeout" financing will not be available. Purchases of participations in real estate loans raise many of the same risks as investments in real estate loans and also carry risks of illiquidity and lack of control.
Collateralized Loan Obligations ("CLOs"): The Fund may invest in CLOs and other securitizations, which are generally limited recourse obligations of the issuer ("Securitization Vehicles") payable solely from the underlying assets ("Securitization Assets") of the issuer or proceeds thereof. Holders of equity or other securities issued by
2023 Annual Report
53
OAKTREE DIVERSIFIED INCOME FUND INC.
Notes to Consolidated Financial Statements (continued)
December 31, 2023
Securitization Vehicles must rely solely on distributions on the Securitization Assets or proceeds thereof for payment in respect thereof. Consequently, the Fund will typically not have any direct rights against the issuer of, or the entity that sold, assets underlying the securitization. The Securitization Assets may include, without limitation, broadly syndicated leverage loans, middle-market bank loans, CDO debt tranches, trust preferred securities, insurance surplus notes, asset-backed securities, mortgages, REITs, high-yield bonds, mezzanine debt, second-lien leverage loans, credit default swaps and emerging market debt and corporate bonds, which are subject to liquidity, market value, credit, interest rate, reinvestment and certain other risks.
New Accounting Pronouncements: In June 2022, FASB issued ASU No. 2022-03, Fair Value Measurement (Topic 820): Fair Value Measurement of Equity Securities Subject to Contractual Sale Restrictions. The amendments in this update clarify the guidance in Topic 820 when measuring the fair value of an equity security subject to contractual sale restrictions and introduce new disclosure requirements related to such equity securities. The amendments are effective for fiscal years beginning after December 15, 2023, with early adoption permitted. Management is currently evaluating the impact of this guidance on the Fund's financial statements.
In December 2022, the Financial Accounting Standards Board issued an Accounting Standards Update, ASU 2022-06, Reference Rate Reform (Topic 848) — Deferral of the Sunset Date of Topic 848 ("ASU 2022-06"). ASU 2022-06 is an amendment to ASU 2020-04, which provided optional guidance to ease the potential accounting burden due to the discontinuation of the LIBOR and other interbank-offered based reference rates and which was effective as of March 12, 2020 through December 31, 2022. ASU 2022-06 extends the effective period through December 31, 2024. Management is currently evaluating the impact, if any, of applying ASU 2022-06.
3. Derivative Financial Instruments
The Fund may purchase and sell derivative instruments such as exchange-listed and over-the counter put and call options on securities, financial futures, equity, fixed-income and interest rate indices, and other financial instruments. It may purchase and sell financial futures contracts and options thereon. Moreover, the Fund may enter into various interest rate transactions such as swaps, caps, floors or collars and enter into various currency transactions such as forward currency contracts, currency futures contracts, currency swaps or options on currency or currency futures or credit transactions and credit default swaps. The Fund may also purchase derivative instruments that combine features of several of these instruments. The Fund may invest in, or enter into, derivatives for a variety of reasons including to hedge certain market risks, to provide a substitute for purchasing or selling particular securities or to increase potential income gain.
Forward Currency Contracts: A forward currency contract ("forward contract") is an agreement between two parties to buy or sell a currency at an agreed upon price for settlement at a future date. During the period the forward contract is in existence, changes in the value of the forward contract will fluctuate with changes in the currency exchange rates. The forward contract is marked to market daily and these changes are recorded as an unrealized gain or loss. Gain or loss on the purchase or sale of a forward contract is realized on the settlement date.
The Fund invests in forward contracts to hedge against fluctuations in the value of foreign currencies caused by changes in the prevailing currency exchange rates. The use of forward contracts involves the risk that the counterparties may be unable to meet the terms of their contracts and may be negatively impacted from unanticipated movements in the value of a foreign currency relative to the U.S. dollar.
The average quarterly U.S. dollar value of forward currency contracts to be delivered or received during the year ended December 31, 2023 was $38,842,237, which represents the volume of activity during the year.
Credit Default Swap Agreements: Credit default swap agreements may involve greater risks than if the Fund had invested in the reference obligation directly since, in addition to general market risks, credit default swaps are subject to illiquidity risk, counterparty risk and credit risk. A buyer generally also will lose its investment and recover nothing should no credit event occur and the swap is held to its termination date. If a credit event were to occur, the value of any deliverable obligation received by the seller (if any), coupled with the upfront or periodic payments previously
54
OAKTREE DIVERSIFIED INCOME FUND INC.
Notes to Consolidated Financial Statements (continued)
December 31, 2023
received, may be less than the full notional value it pays to the buyer, resulting in a loss of value to the seller. When the Fund acts as a seller of a credit default swap, it is exposed to many of the same risks of leverage described herein since if an event of default occurs, the seller must pay the buyer the full notional value of the reference obligation.
Although the Fund may seek to realize gains by selling credit default swaps that increase in value, to realize gains on selling credit default swaps, an active secondary market for such instruments must exist or the Fund must otherwise be able to close out these transactions at advantageous times. In addition to the risk of losses described above, if no such secondary market exists or the Fund is otherwise unable to close out these transactions at advantageous times, selling credit default swaps may not be profitable for the Fund.
The Fund did not have any swap contracts outstanding during the year ended December 31, 2023.
The following table sets forth the fair value of the Fund's derivative instruments:
| Derivatives | Consolidated Statement of Assets and Liabilities | Value as of December 31, 2023 | |||||||||
Forward currency contracts | Unrealized appreciation on forward currency contracts | $ | 36,059 | ||||||||
Forward currency contracts | Unrealized depreciation on forward currency contracts | (981,823 | ) | ||||||||
The following table sets forth the effect of derivative instruments on the Consolidated Statement of Operations for the year ended December 31, 2023:
| Derivatives | Location of Gains (Losses) on Derivatives Recognized in Income | Net Realized Gain (Loss) | Net Change in Unrealized Appreciation (Depreciation) | ||||||||||||
Forward currency contracts | Forward currency contracts | $ | 463,395 | $ | (755,545 | ) | |||||||||
The Fund has not offset derivative assets and liabilities or financial assets, including cash, that may be received or paid as part of collateral arrangements. There is no enforceable master netting agreement in place that provides the Fund, in the event of counterparty default, the right to liquidate collateral and the right to offset a counterparty's rights and obligations.
Below is the gross and net information about instruments and transactions eligible for offset in the Consolidated Statement of Assets and Liabilities as well as instruments and transactions subject to an agreement similar to a master netting arrangement:
Collateral | |||||||||||||||||||||||||||
| Gross Amounts | Gross Amounts Offset in the Consolidated Statement of Assets and Liabilities | Net Amounts Presented in the Consolidated Statement of Assets and Liabilities | Non-Cash Collateral (Pledged) Received | Collateral Pledged (Received) | Net Amount | ||||||||||||||||||||||
Assets: | |||||||||||||||||||||||||||
Forward currency contracts | $ | 36,059 | $ | — | $ | 36,059 | $ | — | $ | — | $ | 36,059 | |||||||||||||||
Liabilities: | |||||||||||||||||||||||||||
Forward currency contracts | $ | 981,823 | $ | — | $ | (981,823 | ) | $ | — | $ | — | $ | (981,823 | ) | |||||||||||||
4. Investment Advisory Agreement and Transactions with Related Parties
The Fund has entered into an Investment Advisory Agreement (the "Advisory Agreement") with the Adviser under which the Adviser is responsible for the management of the Fund's portfolio and provides the necessary personnel, facilities, equipment and certain other services necessary to the operations of the Fund. The Advisory Agreement provides that the Fund shall pay the Adviser a monthly fee for its services at an annual rate of 1.25% of the Fund's average daily net assets plus the amount of borrowing for investment purposes ("Managed Assets").
2023 Annual Report
55
OAKTREE DIVERSIFIED INCOME FUND INC.
Notes to Consolidated Financial Statements (continued)
December 31, 2023
Pursuant to an operating expense limitation agreement (the "Expense Limitation Agreement"), the Adviser has contractually agreed to waive all or a portion of its investment advisory fees and/or to reimburse certain expenses of the Fund, including organizational expenses and offering costs, to the extent necessary to maintain the Total Annual Fund Operating Expenses After Fee Waiver and/or Expense Reimbursement (excluding any front-end or contingent deferred sales loads, brokerage commissions and other transactional expenses, acquired fund fees and expenses, interest (including, "Interest Payments on Borrowed Funds"), taxes, and extraordinary expenses, such as litigation; and other expenses not incurred in the ordinary course of the Fund's business) at no more than 2.10% for Class D shares and 2.85% for Class T shares. The Expense Limitation Agreement will continue until at least April 30, 2025 and may not be terminated by the Fund or the Adviser before such time. Thereafter, the Expense Limitation Agreement may only be terminated or amended to increase the expense cap, provided that in the case of a termination by the Adviser, the Adviser will provide the Board with written notice of its intention to terminate the arrangement prior to the expiration of its then current term. Any waivers and/or reimbursements made by the Adviser are subject to recoupment from the Fund for a period not to exceed three years after the occurrence of the waiver and/or reimbursement, provided that the Fund may only make repayments to the Adviser if such repayment does not cause the Fund's expense ratio (after the repayment is taken into account) to exceed the lesser of: (1) the expense cap in place at the time such amounts were waived; and (2) the Fund's current expense cap.
The amount of investment advisory fees waived and/or expenses reimbursed available to be recouped before expiration is $263,482 of which $123,219, $6,577, and $133,686 will expire during the years ending December 31, 2024, December 31, 2025, and December 31, 2026, respectively. For the year ended December 31, 2023, the Adviser recouped previously waived eligible expenses of $137,705 which is reflected on the Fund's Consolidated Statement of Operations.
The Fund has entered into an administration agreement ("Administration Agreement") with the Administrator and a sub-administration agreement with U.S. Bancorp Fund Services, LLC, doing business as U.S. Bank Global Fund Services (the "Sub-Administrator"). The Administrator and the Sub-Administrator perform administrative services necessary for the operation of the Fund, including maintaining certain books and records of the Fund and preparing reports and other documents required by federal, state and other applicable laws and regulations, and providing the Fund with administrative office facilities. The Adviser is responsible for any fees due to the Administrator and the Fund is responsible for any fees due to the Sub-Administrator.
Certain officers and/or directors of the Fund are officers and/or employees of the Administrator.
5. Purchases and Sales of Investments
For the year ended December 31, 2023, purchases and sales of investments (including principal payups and paydowns), excluding short-term securities and U.S. government securities, were $134,971,296 and $50,180,510, respectively.
For the year ended December 31, 2023, there were no purchases and sales of long-term U.S. Government securities.
6. Credit Facility
The Fund has established a Senior Secured Revolving Credit Facility (the "Credit Facility") in the aggregate principal amount of up to $75,000,000 with Sumitomo Mitsui Banking Corporation ("Sumitomo") for investment purposes subject to the limitations of the 1940 Act for borrowings by registered investment companies. The Credit Facility stated maturity date is December 31, 2023. The Fund pays interest in the amount of the Secured Overnight Financing Rate plus 1.25% on the Credit Facility outstanding if the borrowing is a Eurodollar Loan as defined in the Credit Facility agreement, or the highest of (i) Sumitomo prime rate as announced by Sumitomo in New York City, (ii) the sum of (x) the Federal Funds Rate plus (y) 1.00%, and (iii) the sum of (x) the London interbank market with a one (1) month maturity plus (y) 1.00%, ("Base Rate") plus 0.25% if the borrowing is a Base Rate Loan as defined in the Credit Facility agreement on the Credit Facility outstanding. The Fund also pays an unused commitment fee of 0.20% on the Credit Facility that is unused. For the year ended December 31, 2023, the Fund amortized $143,084
56
OAKTREE DIVERSIFIED INCOME FUND INC.
Notes to Consolidated Financial Statements (continued)
December 31, 2023
in deferred debt issuance costs and is included in the interest expense on credit facility line on the Fund's Consolidated Statement of Operations.
On November 14, 2023, the Board approved a two-year extension to the Credit Facility with a new stated maturity date of December 31, 2025. The Fund incurred debt issuance costs of $300,000 related to the extension of the Credit Facility that were recorded as a deferred charge and are being amortized over the two year term of the Credit Facility.
As of December 31, 2023, the Fund had outstanding borrowings of $35,000,000. For the year ended December 31, 2023, the components of interest and unused commitment fees expense, average stated interest rates (i.e., rate in effect plus the spread) and average outstanding balances for the Credit Facility were as follows:
Stated interest expense | $ | 1,564,371 | |||||
Unused commitment fees | 102,584 | ||||||
Amortization of debt issuance costs | 143,084 | ||||||
Total interest expense and credit facility fees | $ | 1,810,039 | |||||
| Average stated interest rate | 6.47 | % | |||||
Average outstanding balance | $ | 24,164,384 | |||||
According to terms of the Credit Facility agreement, the Fund is required to comply with various covenants, reporting requirements and other customary requirements for similar revolving credit facilities, including, without limitation, covenants related to maintaining a ratio of total assets (less total liabilities other than senior securities representing indebtedness) to senior securities representing indebtedness of the Fund of not less than 300%. These covenants are subject to important limitations and exceptions that are described in the documents governing the Credit Facility. As of December 31, 2023, the Fund was in compliance with the terms of the Credit Facility.
7. Capital Shares
The Fund is authorized to issue up to 1,000,000,000 shares of common stock, $0.001 par value per share, 500,000,000 of which have been classified as Class D shares and 500,000,000 of which have been classified as Class T shares (collectively, "Shares" and respectively, "Class D shares" and "Class T shares"). As of December 31, 2023, the Adviser owned 68% of the shares outstanding of Class D shares. The Board may, without any action by the shareholders, amend the Charter from time to time to increase or decrease the aggregate number of shares or the number of shares of any class or series that the Fund has authority to issue under the Charter and the 1940 Act. In addition, the Charter authorizes the Board, without any action by the shareholders, to classify and reclassify any unissued common shares and preferred stock into other classes or series of shares from time to time by setting or changing the terms, preferences, conversion or other rights, voting powers, restrictions, limitations as to distributions, qualifications and terms and conditions of redemption for each class or series. Although the Fund has no present intention of doing so, it could issue a class or series of shares that could delay, defer or prevent a transaction or a change in control of the Fund that might otherwise be in the shareholders' best interests. Under Maryland law, shareholders generally are not liable for the Fund's debts or obligations.
All common shares offered will be, upon issuance, duly authorized, fully paid and nonassessable. Holders of common shares are entitled to receive distributions when authorized by the Board and declared by the Fund out of assets legally available for the payment of distributions. Holders of common shares have no preference, conversion, exchange, sinking fund, redemption or appraisal rights and have no preemptive rights to subscribe for any of the Fund's securities. All common shares have equal distribution, liquidation and other rights. The Fund may offer multiple classes of common shares, which may be subject to differing fees and expenses. Distributions may vary among the classes as a result of the different fee structure of the classes.
8. Repurchase Offers
As a continuously offered, closed-end interval fund, the Fund has adopted a fundamental investment policy to make offers to repurchase Shares in order to provide liquidity to shareholders. No shareholder will have the right to require the Fund to repurchase its Shares, except as permitted by the Fund's Interval Fund structure. No public market for
2023 Annual Report
57
OAKTREE DIVERSIFIED INCOME FUND INC.
Notes to Consolidated Financial Statements (continued)
December 31, 2023
the Shares exists, and none is expected to develop in the future. Consequently, shareholders generally will not be able to liquidate their investment other than as a result of repurchases of their Shares by the Fund, and then only on a limited basis.
The Fund has adopted, pursuant to Rule 23c-3 under the 1940 Act, a fundamental policy, which cannot be changed without shareholder approval, requiring the Fund to offer to repurchase at least 5% and up to 25% of its Shares at NAV on a quarterly basis. Although the policy permits quarterly repurchases of between 5% and 25% of the Fund's outstanding Shares, the Fund currently expects to offer to repurchase at least 5% of the Fund's outstanding Shares at NAV, which is the minimum amount permitted.
During the year ended December 31, 2023, the Fund completed four quarterly repurchase offers in which the Fund offered to repurchase up to 10% of its outstanding shares. The result of the repurchase offers were as follows:
Repurchase Offer #1 | Repurchase Offer #2 | Repurchase Offer #3 | Repurchase Offer #4 | ||||||||||||||||
Commencement Date | January 9, 2023 | April 10, 2023 | July 10, 2023 | October 6, 2023 | |||||||||||||||
Repurchase Request Deadline | February 13, 2023 | May 15, 2023 | August 14, 2023 | November 13, 2023 | |||||||||||||||
Repurchase Pricing Date | February 13, 2023 | May 15, 2023 | August 14, 2023 | November 13, 2023 | |||||||||||||||
Dollar Amount Repurchased | $ | 133,789 | $ | 81,247 | $ | 801,432 | $ | 732,010 | |||||||||||
Shares Repurchased | 15,066 | 9,212 | 89,947 | 82,527 | |||||||||||||||
9. Federal Income Tax Information
The Fund intends to meet the requirements of the Internal Revenue Code of 1986, as amended, applicable to regulated investment companies and to distribute substantially all of its taxable income to its shareholders. Therefore, no federal income or excise tax provision is required. The Fund may incur an excise tax to the extent it has not distributed all of its taxable income on a calendar year basis.
GAAP provides guidance for how uncertain tax positions should be recognized, measured, presented and disclosed in the financial statements. An evaluation of tax positions taken in the course of preparing the Fund's tax returns to determine whether the tax positions are "more-likely-than-not" of being sustained by the taxing authority is required. Tax benefits of positions not deemed to meet the more-likely-than-not threshold would be booked as a tax expense in the current year and recognized as: a liability for unrecognized tax benefits; a reduction of an income tax refund receivable; a reduction of a deferred tax asset; an increase in a deferred tax liability; or a combination thereof. As of December 31, 2023, the Fund has determined that there are no uncertain tax positions or tax liabilities required to be accrued.
The Fund has reviewed the taxable years open for examination (i.e. not barred by the applicable statute of limitations) by taxing authorities of all major jurisdictions, including the Internal Revenue Service. As of December 31, 2023, open taxable periods consisted of the taxable periods ended December 31, 2021, December 31, 2022 and December 31, 2023. No examination of the Fund's tax returns is currently in progress.
Income and capital gain distributions are determined in accordance with federal income tax regulations, which may differ from GAAP.
The federal income tax information referenced below is as of the Fund's most recently completed tax year-end of December 31, 2023.
The tax character of distributions paid for the periods shown below were as follows:
| Year Ended December 31, 2023 | Year Ended December 31, 2022 | ||||||||||
Ordinary income | $ | 15,645,010 | $ | 10,683,466 | |||||||
Total | $ | 15,645,010 | $ | 10,683,466 | |||||||
58
OAKTREE DIVERSIFIED INCOME FUND INC.
Notes to Consolidated Financial Statements (continued)
December 31, 2023
At December 31, 2023, the Fund's most recently completed tax year-end, the components of net assets (excluding paid-in capital) on a tax basis were as follows:
Capital loss carryforwards(1) | $ | (4,395,889 | ) | ||||
| Late year ordinary losses | (1,097,923 | ) | |||||
| Other accumulated gains | 18,656 | ||||||
| Tax basis unrealized depreciation on investments and foreign currency | (10,453,914 | ) | |||||
Total tax basis net accumulated losses | $ | (15,929,070 | ) | ||||
(1) To the extent that future capital gains are offset by capital loss carryforwards, such gains will not be distributed.
The Fund deferred, on a tax basis, late year ordinary losses of $1,097,923.
As of December 31, 2023, the Fund had short-term and long-term capital loss carryforwards of $2,645,116 and $1,750,773, respectively. The capital loss carryforwards will not expire.
Federal Income Tax Basis: The federal income tax basis of the Fund's investments, not including foreign currency translations, at December 31, 2023 was as follows:
| Cost of Investments | Gross Unrealized Appreciation | Gross Unrealized Depreciation | Net Unrealized Depreciation | ||||||||||||
| $ | 275,528,036 | $ | 4,512,189 | $ | (14,966,103 | ) | $ | (10,453,914 | ) | ||||||
Capital Account Reclassifications: Because federal income tax regulations differ in certain respects from GAAP, income and capital gain distributions, if any, determined in accordance with tax regulations may differ from net investment income and realized gains recognized for financial reporting purposes. These differences are primarily due to differing treatments for Section 988 currency. Permanent book and tax differences, if any, will result in reclassifications to paid-in capital or to undistributed capital gains. These reclassifications have no effect on net assets or NAV per share. Any undistributed net income and realized gain remaining at fiscal year end is distributed in the following year.
At December 31, 2023, the Fund's most recently completed tax year-end, the Fund's components of net assets were increased or (decreased) by the amounts shown in the table below:
| Paid-in capital | Accumulated income (losses) | ||||||
| $ | 1,050 | $ | (1,050 | ) | |||
10. Indemnifications, Commitments and Contingencies
Under the Fund's organizational documents, its officers and directors are indemnified against certain liabilities arising out of the performance of their duties to the Fund. In addition, in the normal course of business, the Fund enters into contracts with its vendors and others that provide for indemnification. The Fund's maximum exposure under these arrangements is unknown, since this would involve the resolution of certain claims, as well as future claims that may be made, against the Fund. Thus, an estimate of the financial impact, if any, of these arrangements cannot be made at this time. However, based on experience, the Fund expects the risk of loss due to these warranties and indemnities to be unlikely.
In conjunction with the ownership of senior loans, the Fund is party to certain credit agreements, which may require the Fund to extend additional loans to investee companies. Commitments to extend credit include loan proceeds the Fund is obligated to advance, such as delayed draws or revolving credit arrangements. Commitments generally have fixed expiration dates or other termination clauses. Unrealized gains or losses associated with unfunded commitments are recorded in the consolidated financial statements and reflected as an adjustment to the fair value of the related security in the Consolidated Schedule of Investments. The par amount of the unfunded commitments is not recognized by the Fund until it becomes funded. The Fund uses the same investment criteria in making these
2023 Annual Report
59
OAKTREE DIVERSIFIED INCOME FUND INC.
Notes to Consolidated Financial Statements (continued)
December 31, 2023
commitments as it does in making investments. The unfunded liability associated with these credit agreements is equal to the amount by which the contractual loan commitment exceeds the sum of the amount of funded debt and cash held in escrow, if any.
11. Subsequent Events
GAAP requires recognition in the financial statements of the effects of all subsequent events that provide additional evidence about conditions that existed at the date of the Consolidated Statement of Assets and Liabilities. For non-recognized subsequent events that must be disclosed to keep the financial statements from being misleading, the Fund is required to disclose the nature of the event as well as an estimate of its financial effect, or a statement that such an estimate cannot be made.
The Fund completed a quarterly repurchase offer in which the Fund offered to repurchase up to 10% of its outstanding shares on February 12, 2024. The result of the repurchase offer was as follows:
Repurchase Offer | |||||||
Commencement Date | January 8, 2024 | ||||||
Repurchase Request Deadline | February 12, 2024 | ||||||
Repurchase Pricing Date | February 12, 2024 | ||||||
Dollar Amount Repurchased | $ | 868,825 | |||||
| Shares Repurchased | 96,644 | ||||||
Management has evaluated subsequent events in the preparation of the Fund's financial statements and has determined that there are no additional events that require recognition or disclosure in the financial statements.
60
OAKTREE DIVERSIFIED INCOME FUND INC.
Report of Independent Registered Public Accounting Firm
To the shareholders and the Board of Directors of Oaktree Diversified Income Fund Inc.
Opinion on the Financial Statements and Financial Highlights
We have audited the accompanying the consolidated statement of assets and liabilities of Oaktree Diversified Income Fund Inc. and subsidiary (the "Fund"), including the consolidated schedule of investments, as of December 31, 2023, the related consolidated statements of operations and cash flows for the year then ended, the consolidated statements of changes in net assets for each of the two years in the period then ended, the consolidated financial highlights for the years ended December 31, 2023, 2022, and for the period from November 1, 2021 (commencement of operations) through December 31, 2021, and the related notes to the consolidated financial statements (collectively referred to as the "financial statements"). In our opinion, the financial statements present fairly, in all material respects, the financial position of the Fund as of December 31, 2023, and the results of its operations and its cash flows for the year then ended, the changes in its net assets for each of the two years in the period then ended, and the financial highlights for the years ended December 31, 2023, 2022, and for the period from November 1, 2021 (commencement of operations) through December 31, 2021 in conformity with accounting principles generally accepted in the United States of America.
Basis for Opinion
These financial statements and financial highlights are the responsibility of the Fund's management. Our responsibility is to express an opinion on the Fund's financial statements and financial highlights based on our audits. We are a public accounting firm registered with the Public Company Accounting Oversight Board (United States) (PCAOB) and are required to be independent with respect to the Fund in accordance with the U.S. federal securities laws and the applicable rules and regulations of the Securities and Exchange Commission and the PCAOB.
We conducted our audits in accordance with the standards of the PCAOB. Those standards require that we plan and perform the audit to obtain reasonable assurance about whether the financial statements and financial highlights are free of material misstatement, whether due to error or fraud. The Fund is not required to have, nor were we engaged to perform, an audit of its internal control over financial reporting. As part of our audits we are required to obtain an understanding of internal control over financial reporting but not for the purpose of expressing an opinion on the effectiveness of the Fund's internal control over financial reporting. Accordingly, we express no such opinion.
Our audits included performing procedures to assess the risks of material misstatement of the financial statements and financial highlights, whether due to error or fraud, and performing procedures that respond to those risks. Such procedures included examining, on a test basis, evidence regarding the amounts and disclosures in the financial statements and financial highlights. Our audits also included evaluating the accounting principles used and significant estimates made by management, as well as evaluating the overall presentation of the financial statements and financial highlights. Our procedures included confirmation of securities owned as of December 31, 2023, by correspondence with the custodian, agent banks and brokers; when replies were not received from agent banks and brokers, we performed other auditing procedures. We believe that our audits provide a reasonable basis for our opinion.
Deloitte & Touche LLP
Chicago, Illinois
February 27, 2024
We have served as the auditor of one or more Brookfield Public Securities Group LLC's investment companies since 2011.
2023 Annual Report
61
OAKTREE DIVERSIFIED INCOME FUND INC.
Tax Information (Unaudited)
For the year ended December 31, 2023, certain dividends paid by the Fund may be subject to a maximum tax rate of 23.8%, as provided for by the Tax Cuts and Jobs Act of 2017. The percentage of dividends declared from ordinary income designated as qualified dividend income was 0.00%.
For corporate shareholders, the percent of ordinary income distributions qualifying for the corporate dividends received deduction for the fiscal year ended December 31, 2023 was 0.00%.
The percentage of taxable ordinary income distributions that are designated as short-term capital gain distributions under Internal Revenue Section 871(k)(2)(C) was 0.00%.
62
OAKTREE DIVERSIFIED INCOME FUND INC.
Information Concerning Directors and Officers (Unaudited)
The following tables provide information concerning the directors and officers of the Fund.
Directors of the Fund
| Name, Address and Year of Birth | Position(s) Held with Fund and Term of Office and Length of Time Served | Principal Occupation(s) During Past 5 Years and Other Directorships Held by Director | Number of Portfolios in Fund Complex1 Overseen by Director | ||||||||||||
Independent Trustees | |||||||||||||||
| Edward A. Kuczmarski c/o Brookfield Place, 250 Vesey Street, New York, New York 10281-1023 Born: 1949 | Director and Independent Chair of the Board, Member of the Audit Committee, Member of the Nominating and Compensation Committee Served Since 2021 | Retired. Director/Trustee of several investment companies advised by PSG (2011-Present). | 9 | ||||||||||||
| Stuart A. McFarland c/o Brookfield Place, 250 Vesey Street, New York, New York 10281-1023 Born: 1947 | Director, Member of the Audit Committee, Member of the Nominating and Compensation Committee Served Since 2021 | Managing Partner of Federal City Capital Advisors (1997-2021). Director/Trustee of several investment companies advised by PSG (2006-Present); Director of Drive Shack Inc. (formerly, New Castle Investment Corp.) (2002-June 2023); Lead Independent Director of New America High Income Fund (2013-Present); Director of New Senior Investment Group, Inc. (2014-2021); Director of Steward Partners (2017-2021). | 9 | ||||||||||||
| Heather S. Goldman c/o Brookfield Place, 250 Vesey Street, New York, New York 10281-1023 Born: 1967 | Director, Member of the Audit Committee, Chair of the Nominating and Compensation Committee Served Since 2021 | CFO of My Flex, Inc., an EQBR company (2022-2023). Director/Trustee of several investment companies advised by PSG (2013-Present); Board Director of Gesher USA (2015-Present); Member of the Honorary Board of University Settlement House (2014-Present). | 9 | ||||||||||||
| William H. Wright II c/o Brookfield Place, 250 Vesey Street, New York, New York 10281-1023 Born: 1960 | Director, Chair of the Audit Committee, Member of the Nominating and Compensation Committee Served Since 2021 | Retired. Director/Trustee of several investment companies advised by PSG (2020-Present); Director of Alcentra Capital Corporation (1940 Act BDC) (2018-2019); Advisory Director of Virtus Global Dividend & Income Fund, Virtus Global Multi-Sector Income Fund, Virtus Total Return Fund and Duff & Phelps Select Energy MLP Fund (2013-2019); Director of the Carlyle Group, TCG BDC I, Inc., TCG BDC II, Inc. and Carlyle Secured Lending III (2021-Present). | 9 | ||||||||||||
| Betty Whelchel c/o Brookfield Place, 250 Vesey Street, New York, New York 10281-1023 Born: 1956 | Director, Member of the Audit Committee, Member of the Nominating and Compensation Committee Since January 1, 2024 | US Head of Public Policy: Regulatory Affairs of BNP Paribas (2016-2019). Director/Trustee of several investment companies advised by the Adviser (2024-Present); Trustee of Curtis Institute (2005-2023). | 9 | ||||||||||||
2023 Annual Report
63
OAKTREE DIVERSIFIED INCOME FUND INC.
Information Concerning Directors and Officers (Unaudited) (continued)
| Name, Address and Year of Birth | Position(s) Held with Fund and Term of Office and Length of Time Served | Principal Occupation(s) During Past 5 Years and Other Directorships Held by Director | Number of Portfolios in Fund Complex1 Overseen by Director | ||||||||||||
Interested Director | |||||||||||||||
| David W. Levi c/o Brookfield Place, 250 Vesey Street, New York, New York 10281-1023 Born: 1971 | Director Served Since 2021 | Chief Executive Officer of PSG (2019-Present); Head of Brookfield Oaktree Wealth Solutions (2021-Present); President of the PSG (2016-2019); Managing Partner of Brookfield (2015-Present). Director/Trustee of several investment companies advised by PSG (2017-Present). | 9 | ||||||||||||
64
OAKTREE DIVERSIFIED INCOME FUND INC.
Information Concerning Directors and Officers (Unaudited) (continued)
Officers of the Fund
| Name, Address and Year of Birth | Position(s) Held with Fund | Term of Office and Length of Time Served | Principal Occupation(s) During Past 5 Years | ||||||||||||
| Brian F. Hurley* c/o Brookfield Place, 250 Vesey Street, New York, New York 10281-1023 Born: 1977 | President | Served since 2021 | President of several investment companies advised by the Adviser (2014-Present); General Counsel of the Adviser (2017-Present); Managing Director (2014-Present) of the Adviser; Managing Partner of Brookfield (2016-Present); Director of Brookfield Soundvest Capital Management (2015-2018). | ||||||||||||
| Casey P. Tushaus* c/o Brookfield Place, 250 Vesey Street, New York, New York 10281-1023 Born: 1982 | Treasurer | Served since 2021 | Treasurer of several investment companies advised by the Adviser (2021-Present); Assistant Treasurer of several investment companies advised by the Adviser (2016-2021); Vice President of the Adviser (2014-2021); Director of the Adviser (2021-Present). | ||||||||||||
| Craig A. Ruckman* c/o Brookfield Place 250 Vesey Street, New York, New York 10281-1023 Born: 1977 | Secretary | Served since 2022** | Secretary of several investment companies advised by the Adviser (November 2022-Present); Managing Director of the Adviser (October 2022-Present); Director of Allianz Global Investors U.S. Holdings LLC (2016-2022); Assistant Secretary of 63 funds in the Allianz Global Investors Fund Complex (2017-2020); and Chief Legal Officer of Allianz Global Investors Distributors LLC (2019-2022). | ||||||||||||
| Adam R. Sachs* c/o Brookfield Place, 250 Vesey Street, New York, New York 10281-1023 Born: 1984 | Chief Compliance Officer ("CCO") | Served since 2021 | CCO of several investment companies advised by the Adviser (2017-Present); Director of the Adviser (2017-Present); CCO of Brookfield Investment Management (Canada) Inc. (2017-Present). | ||||||||||||
| Mohamed S. Rasul* c/o Brookfield Place, 250 Vesey Street, New York, New York 10281-1023 Born: 1981 | Assistant Treasurer | Served since 2021 | Assistant Treasurer of several investment companies advised by the Adviser (2016-Present); Vice President of the Adviser (2019-Present); Assistant Vice President of the Adviser (2014-2019). | ||||||||||||
* Interested person as defined by the 1940 Act because of affiliations with Brookfield Public Securities Group LLC, Adviser of the Fund.
** Craig A. Ruckman was appointed by the Board as the Secretary of the Fund on November 17, 2022.
1 The Fund Complex is comprised of Brookfield Investment Funds (six series of underlying portfolios), Brookfield Real Assets Income Fund Inc., Brookfield Infrastructure Income Fund Inc. and Oaktree Diversified Income Fund Inc.
The Fund's Statement of Additional Information includes additional information about the directors, and is available, without charge, upon request by calling 1-855-777-8001.
2023 Annual Report
65
OAKTREE DIVERSIFIED INCOME FUND INC.
Dividend Reinvestment Plan (Unaudited)
The Fund intends to distribute substantially all of its net investment income to shareholders in the form of dividends. The Fund intends to declare and pay distributions quarterly from net investment income. In addition, the Fund intends to distribute any net capital gains earned from the sale of portfolio securities to shareholders no less frequently than annually. Net short-term capital gains may be paid more frequently. Unless Common Shareholders specify otherwise, dividends will be reinvested in Shares of the Fund in accordance with the Fund's dividend reinvestment plan. The Fund may pay distributions from sources that may not be available in the future and that are unrelated to the Fund's performance, such as from offering proceeds and/or borrowings.
The Fund has adopted a Dividend Reinvestment Plan (the "Plan") that provides that, unless Common Shareholders elect to receive their distributions in cash, they will be automatically reinvested by U.S. Bancorp Fund Services, LLC (the "Plan Administrator"), in additional Shares. If Common Shareholders elect to receive distributions in cash, they will receive them paid by check mailed directly to them by the Plan Administrator. The Plan Administrator can be contacted through mail by writing to U.S. Bancorp Fund Services, LLC, P.O. Box 701, Milwaukee, Wisconsin 53201-0701 or by phone at 1-855-862-5873.
Shares received under the Plan will be issued to Common Shareholders at their NAV on the ex-dividend date; there is no sales or other charge for reinvestment. Common Shareholders are free to withdraw from the Plan and elect to receive cash at any time by giving written notice to the Plan Administrator or by contacting the broker or dealer, who will inform the Fund.
The Plan Administrator provides written confirmation of all transactions in the shareholder accounts in the Plan, including information Common Shareholders may need for tax records. Any proxy Common Shareholders receive will include all Shares received under the Plan.
Automatically reinvested dividends and distributions are taxed in the same manner as cash dividends and distributions.
The Fund and the Plan Administrator reserve the right to amend or terminate the Plan. There is no direct service charge to participants in the Plan; however, the Fund reserves the right to amend the Plan to include a service charge payable by the participants. If the Plan is amended to include such service charges, the Plan Administrator will include a notification to registered holders of Shares with the Plan Administrator.
Additional information about the Plan may be obtained from the Plan Administrator.
66
OAKTREE DIVERSIFIED INCOME FUND INC.
Joint Notice of Privacy Policy (Unaudited)
Brookfield Public Securities Group LLC ("PSG"), on its own behalf and on behalf of the funds managed by PSG and its affiliates, recognizes and appreciates the importance of respecting the privacy of our clients and shareholders. Our relationships are based on integrity and trust and we maintain high standards to safeguard your non-public personal information ("Personal Information") at all times. This privacy policy ("Policy") describes the types of Personal Information we collect about you, the steps we take to safeguard that information and the circumstances in which it may be disclosed.
If you hold shares of the Fund through a financial intermediary, such as a broker, investment adviser, bank or trust company, the privacy policy of your financial intermediary will also govern how your Personal Information will be shared with other parties.
WHAT INFORMATION DO WE COLLECT?
We collect the following Personal Information about you:
• Information we receive from you in applications or other forms, correspondence or conversations, including but not limited to name, address, phone number, social security number, assets, income and date of birth.
• Information about transactions with us, our affiliates, or others, including but not limited to account number, balance and payment history, parties to transactions, cost basis information, and other financial information.
• Information we may receive from our due diligence, such as your creditworthiness and your credit history.
WHAT IS OUR PRIVACY POLICY?
We may share your Personal Information with our affiliates in order to provide products or services to you or to support our business needs. We will not disclose your Personal Information to nonaffiliated third parties unless 1) we have received proper consent from you; 2) we are legally permitted to do so; or 3) we reasonably believe, in good faith, that we are legally required to do so. For example, we may disclose your Personal Information with the following in order to assist us with various aspects of conducting our business, to comply with laws or industry regulations, and/or to effect any transaction on your behalf;
• Unaffiliated service providers (e.g. transfer agents, securities broker-dealers, administrators, investment advisors or other firms that assist us in maintaining and supporting financial products and services provided to you);
• Government agencies, other regulatory bodies and law enforcement officials (e.g. for reporting suspicious transactions);
• Other organizations, with your consent or as directed by you; and
• Other organizations, as permitted or required by law (e.g. for fraud protection).
When we share your Personal Information, the information is made available for limited purposes and under controlled circumstances designed to protect your privacy. We require third parties to comply with our standards for security and confidentiality.
HOW DO WE PROTECT CLIENT INFORMATION?
We restrict access to your Personal Information to those persons who require such information to assist us with providing products or services to you. It is our practice to maintain and monitor physical, electronic, and procedural safeguards that comply with federal standards to guard client nonpublic personal information. We regularly train our employees on privacy and information security and on their obligations to protect client information.
CONTACT INFORMATION
For questions concerning our Privacy Policy, please contact our client services representative at 1-855-777-8001.
2023 Annual Report
67
[THIS PAGE IS INTENTIONALLY LEFT BLANK]
[THIS PAGE IS INTENTIONALLY LEFT BLANK]
[THIS PAGE IS INTENTIONALLY LEFT BLANK]
CORPORATE INFORMATION
Investment Adviser
Oaktree Fund Advisors, LLC
333 South Grand Avenue, 28th Floor
Los Angeles, California 90071
www.oaktreefunds.com
Administrator
Brookfield Public Securities Group LLC
Brookfield Place
250 Vesey Street, 15th Floor
New York, New York 10281-1023
www.brookfield.com
Please direct your inquiries to:
Investor Relations
Phone: 1-855-777-8001
E-mail: publicsecurities.enquiries@brookfield.com
Transfer Agent
Shareholder inquiries relating to distributions, address changes and shareholder account information should be directed to the Fund's transfer agent:
U.S. Bancorp Fund Services, LLC
615 East Michigan Street
Milwaukee, Wisconsin 53202
1-855-862-5873
Fund Accounting Agent & Sub-Administrator
U.S. Bancorp Fund Services, LLC
615 East Michigan Street
Milwaukee, Wisconsin 53202
Independent Registered Public Accounting Firm
Deloitte & Touche LLP
111 South Wacker Drive
Chicago, Illinois 60606
Legal Counsel
Paul Hastings LLP
200 Park Avenue
New York, New York 10166
Custodian
U.S. Bank National Association
1555 North RiverCenter Drive, Suite 302
Milwaukee, Wisconsin 53212
Distributor
Quasar Distributors, LLC
111 East Kilbourn Avenue, Suite 2200
Milwaukee, Wisconsin 53202
Directors of the Fund | |||||||
Edward A. Kuczmarski | Chair of Board of Directors | ||||||
William H. Wright II | Chair of Audit Committee | ||||||
Heather S. Goldman | Chair of Nominating and Compensation Committee | ||||||
Stuart A. McFarland | Director | ||||||
Betty Whelchel | Director | ||||||
David W. Levi | Director (Interested) | ||||||
Officers of the Fund
Brian F. Hurley | President | ||||||
Casey P. Tushaus | Treasurer | ||||||
Craig A. Ruckman | Secretary | ||||||
Adam R. Sachs | Chief Compliance Officer | ||||||
Mohamed S. Rasul | Assistant Treasurer | ||||||
The Fund files its complete schedule of portfolio holdings with the SEC for the first and third quarters of each fiscal year on Form N-PORT. The Fund's Forms N-PORT are available on the SEC's website at www.sec.gov.
You may obtain a description of the Fund's proxy voting policies and procedures, information regarding how the Fund voted proxies relating to portfolio securities during the most recent 12-month period ended June 30, without charge, upon request by calling 1-855-777-8001, or go to the SEC's website at www.sec.gov.
Administrator
Brookfield Public Securities Group LLC
Brookfield Place
250 Vesey Street, 15th Floor
New York, New York 10281-1023
1-855-777-8001
www.brookfield.com
Adviser
Oaktree Fund Advisors, LLC
333 South Grand Avenue, 28th Floor
Los Angeles, California 90071
1-213-830-6300
www.oaktreecapital.com
(b) Not applicable.
Item 2. Code of Ethics.
The registrant has adopted a code of ethics that applies to the registrant’s principal executive officer and principal financial officer. The registrant has not made any substantive amendments to its code of ethics during the period covered by this report. The registrant has not granted any waivers from any provisions of the code of ethics during the period covered by this report.
The registrant undertakes to provide to any person without charge, upon request, a copy of its code of ethics by contacting Investor Relations at (855) 777-8001 or by writing to Secretary, Oaktree Diversified Income Fund Inc., Brookfield Place, 250 Vesey Street, 15th Floor, New York, NY 10281-1023.
Item 3. Audit Committee Financial Expert.
The registrant’s Board of Directors has determined that there is at least one audit committee financial expert serving on its audit committee. Stuart A. McFarland, Edward A. Kuczmarski, William H. Wright II and Heather S. Goldman each qualify as “audit committee financial experts” and are considered to be “independent” as each term is defined in Item 3 of Form N-CSR.
Item 4. Principal Accountant Fees and Services.
The registrant has engaged its principal accountant to perform audit services, audit-related services, tax services and other services during the past two fiscal years. “Audit services” refer to performing an audit of the registrant's annual financial statements or services that are normally provided by the accountant in connection with statutory and regulatory filings or engagements for those fiscal years. “Audit-related services” refer to the assurance and related services by the principal accountant that are reasonably related to the performance of the audit. “Tax services” refer to professional services rendered by the principal accountant for tax compliance, tax advice, and tax planning. The following table details the aggregate fees billed or expected to be billed for each of the last two fiscal years for audit fees, audit-related fees, tax fees and other fees by the principal accountant.
| FYE 12/31/2023 | FYE 12/31/2022 | |||||||
| ( a ) Audit Fees | $ | 209,940 | $ | 178,000 | ||||
| ( b ) Audit-Related Fees | $ | 0 | $ | 0 | ||||
| ( c ) Tax Fees | $ | 11,330 | $ | 10,300 | ||||
| ( d ) All Other Fees | $ | 0 | $ | 0 | ||||
(e)(1) The audit committee has adopted pre-approval policies and procedures that require the audit committee to pre-approve all audit and non-audit services of the registrant, including services provided to any entity affiliated with the registrant.
(e)(2) The percentage of fees billed by Deloitte & Touche LLP (“Deloitte”) applicable to non-audit services pursuant to waiver of pre-approval requirement were as follows:
| FYE 12/31/2023 | FYE 12/31/2022 | |||||||
| Audit-Related Fees | 0 | % | 0 | % | ||||
| Tax Fees | 0 | % | 0 | % | ||||
| All Other Fees | 0 | % | 0 | % | ||||
(f) All of the principal accountant’s hours spent on auditing the registrant’s financial statements were attributed to work performed by full-time permanent employees of the principal accountant.
(g) The aggregate fees billed by Deloitte for the fiscal years ended December 31, 2023 and December 31, 2022, for non-audit services rendered to the registrant and the registrant’s investment adviser and administrator were $11,330 and $10,300, respectively. For the fiscal years ended December 31, 2023 and December 31, 2022, these amounts reflect the amounts disclosed above in (b), (c) and (d), plus $0 and $0, respectively, in fees billed to the registrant’s investment adviser for non-audit services that did not relate directly to the operations and financial reporting of the registrant.
(h) The audit committee of the Board of Directors has considered whether the provision of non-audit services that were rendered to the registrant's investment adviser is compatible with maintaining the principal accountant's independence and has concluded that the provision of such non-audit services by the accountant has not compromised the accountant’s independence.
(i) Not applicable
(j) Not applicable
Item 5. Audit Committee of Listed Registrants.
(a) The registrant is an issuer as defined in Rule 10A-3 under the Securities Exchange Act of 1934, (the “Act”) and has a separately-designated standing audit committee established in accordance with Section 3(a)(58)(A) of the Act. The independent members of the committee are as follows: Stuart A. McFarland, Edward A. Kuczmarski, Heather S. Goldman and William H. Wright II. As of January 1, 2024, Betty Whelchel joined the Board of Directors as an Independent Director and is an Independent Member of the Audit Committee.
(b) Not applicable.
Item 6. Investments.
| (a) | Schedule of Investments is included as part of the report to shareholders filed under Item 1 of this Form. |
| (b) | Not Applicable. |
Item 7. Disclosure of Proxy Voting Policies and Procedures for Closed-End Management Investment Companies.
Clients often grant Oaktree Fund Advisors, LLC (“Oaktree”) the authority to vote proxies on their behalf. Proxy statements increasingly contain controversial issues involving shareholder rights and corporate governance, among others, which deserve careful review and consideration. Oaktree has adopted and implemented policies and procedures that are reasonably designed to ensure that proxies are voted in the best interest of investors and clients, in accordance with our fiduciary duties and SEC Rule 206(4)6 under the Advisers Act. Our authority to vote the proxies of our clients is established by the investment management agreements or similar documents.
Oaktree maintains written proxy voting guidelines, which are amended as necessary. The proxy voting guidelines address a broad range of issues, including the selection of directors, executive compensation, proxy contests and tender offer defenses. We generally vote in the manner as noted within the guidelines, unless a different vote is deemed prudent under the specific circumstances, taking into consideration the contractual obligations under any investment management agreement, or other comparable document, and all other relevant facts and circumstances at the time of the vote. It is our policy to perform a detailed review of each proxy statement when considering the voting recommendations of the guidelines.
1. Delegation of Voting Responsibility and Account Set Up
It is the responsibility of the Legal personnel who prepares or reviews an investment management agreement, or other comparable document, to ensure that such agreement, prior to, or at the time of execution, assigns responsibility of voting proxies, whether it be retained by the client or delegated to Oaktree.
There may be certain instances in which Oaktree’s authority to vote proxies may be limited and as such the proxy voting guidelines may not be followed or a vote may not be placed. Such occasions may include, but are not limited to, when (i) the client has mandated that Oaktree vote in accordance with their proxy voting guidelines; or (ii) the client has chosen to participate in a securities lending program that may result in voting authority being lost if a particular security is out on loan on the record date. In the case where a Managed Account client has requested that Oaktree vote proxies in accordance with their guidelines, the Legal personnel reviewing the investment management agreement shall ensure that such guidelines are received from the client prior to funding of the account. Additionally, Oaktree may in its discretion, under certain limited facts and circumstances, abstain from voting proxies on behalf of its clients. Such facts and circumstances are documented and maintained as evidence for abstaining from the proxy vote.
Upon receipt of an investment management agreement, or other comparable document, the Compliance department sends the appropriate proxy voting provisions to the Corporate Actions department. The Corporate Actions department is responsible for preparing the Proxy Account Guidelines Matrix which details the voting responsibility for each Managed Account/Managed Fund and any other relevant details. The Corporate Actions department ensures that, for those Managed Accounts/Managed Funds for which Oaktree has been delegated voting authority, contact is made with the appropriate custodian bank and/or benefit plan trustee in order to receive proxy statements.
2. Voting Procedures
Determination of Vote
Proxies are generally considered by the investment professional responsible for monitoring the security being voted. The Corporate Actions personnel responsible for proxies (with the exception of the Emerging Markets Equities strategy, which handles the proxies relating to their investments) deliver to such investment professional the proxy statement, the proxy voting guidelines and the Proxy Voting Form. The Proxy Voting Form serve as Oaktree’s record of the following information:
| (i) | whether the investment was held as a passive investment or considered a significant holding; |
| (ii) | whether any material conflict of interest existed in connection with the vote (see further discussion below for description of the procedures to be followed in the instance of such occurrence); |
| (iii) | documentation of the vote for each proposal, including any additional document created or utilized, if any, that was material to arriving at such a determination; and |
| (iv) | documentation of the basis and rationale of the vote when the proxy voting guidelines were not followed, including the reasons why such guidelines were not used. |
Once the investment professional has completed his or her analysis, documented the vote, the basis for such vote and signed the form, it should be forwarded to designated Compliance personnel for review. Such personnel ensure that all required documentation has been included, the vote is in accordance with the proxy voting guidelines, or if not, documentation supporting such exception has been created. The information is then sent to Compliance personnel for a final review, which is evidenced in the proxy documentation.
Corporate Actions personnel (with the exception of the Emerging Markets Equities investment strategy, which handles the proxies relating to their investments) then takes the recommended vote from the Proxy Voting Form and submit/transmit such vote(s) online unless the securities are held in physical form. If they are held in physical form, the custodian banks will provide the physical proxy ballots to Oaktree for approval and election. Oaktree will then forward the completed proxy ballots to the agent by mail in a timely manner. Copies of all such documents must be maintained to evidence submission of each proxy vote (see discussion under record- keeping below for additional guidance).
The Emerging Markets Equities investment strategy follows a similar process in which proxies are processed by the relevant Operations personnel and forwarded to the investment professional for consideration. Once the investment professional has completed his or her analysis, documented the vote, the rationale for such vote, and completed the Proxy Voting Form and received approval as necessary, the documentation is forwarded to designated Compliance personnel for review and approval. Once approval is received, the relevant Operations personnel then takes the recommended vote from the approved Proxy Voting Form and submit/transmit such vote(s) online.
Oaktree endeavors, on a best efforts basis, to vote all proxies for which it has proxy voting authority in accordance with the applicable deadlines. Nevertheless, from time to time, proxies may not be voted or are not voted in a timely manner due to various factors, for example receiving proxy notices late or after the cut-off time for voting, not receiving sufficient information regarding proxy matters or certain custodian policies and restrictions.
Conflicts of Interest
Occasions may arise where a person or organization involved in the proxy voting process may have a conflict of interest. A conflict of interest may exist, for example if Oaktree has a business relationship with (or is actively soliciting business from) either the company soliciting the proxy, a third party that has a material interest in the outcome of a proxy vote or that is actively lobbying for a particular outcome of a proxy vote. Any person with knowledge of a personal conflict of interest (e.g. familial relationship with company management) regarding a particular proxy vote must notify Legal or Compliance personnel.
Appropriate members of the Legal and/or Compliance department review such circumstances to determine if a material conflict exists and address any such conflict by: (i) identifying the potential material conflict of interest on the proxy voting form; and (ii) implementing appropriate procedures to address such material conflict of interest. Such procedures may include, but not limited to: (i) having the investment professional remove him or herself from the voting process to be replaced with another research analyst not directly involved; (ii) disclose the conflict to the client and obtain their consent prior to voting; or (iii) a determination that the conflict is not material as neither Oaktree nor Managed Accounts/Managed Funds owns more than 5% of the outstanding class of securities subject to the vote.
3. Tracking Procedures
The Corporate Actions or Trade Support/Operations personnel in each investment strategy in charge of proxies have been delegated the responsibility of communicating with each Managed Account/Managed Fund” custodian bank, prime broker and/or benefit plan trustee to ensure that all proxies are received and for the correct amount of holdings. In addition, such personnel are responsible for ensuring that proxies are responded to in a timely manner and for transmitting appropriate voting instructions to the correct party. Information is documented on a Proxy Tracking Form as follows:
| (i) | Matching proxies received with stock holdings on the record date as indicated on the proxy card to internal holding reports; |
| (ii) | Documenting reasons as to why proxies were not received for any stock holdings; and |
| (iii) | Recording the dates on which votes were submitted for each Managed Account/Managed Fund. |
In addition to the above, Compliance personnel confirms whether the shares subject to the proxy are held by more than one investment strategy. If the position is cross-held, Compliance personnel may instruct coordination of the vote between the various investment strategies where the combined position is material (more than 5% of the outstanding class of securities subject to the vote). The ultimate decision to coordinate voting requires an evaluation of the relevant facts and circumstances with the relevant portfolio managers and Legal personnel.
4. Disclosure to Clients
Oaktree clients that request additional information regarding our proxy voting policies and procedures, or details on how we have voted specific proxies, can forward their written requests to the attention of the Chief Compliance Officer at Oaktree Capital Management, L.P., 333 South Grand Avenue, Los Angeles, California, 90071, or via facsimile at (213) 8306296. Disclosure of this option to clients is made through our Form ADV Part 2A. It is Oaktree’s policy not to release proxy voting information to third parties.
In the event a request is received, the Compliance department will forward such requests from clients to the appropriate Corporate Actions personnel or Trade Support/Operations personnel in charge of proxies to facilitate and maintain the requested information.
5. Recordkeeping
Documentation that Oaktree has voted all proxies for Managed Accounts/Managed Funds for which it has proxy voting authority is maintained by the Corporate Actions or Trade Support/Operations personnel responsible for proxies. Such documentation includes for each proxy voted:
| (i) | The proxy statement; |
| (ii) | Proxy Voting Form indicating voting response, the basis and rationale for such vote, and any documentation or materials used in determining the vote; |
| (iii) | Proxy Tracking Form indicating Managed Accounts/Managed Funds’ names, shares owned on record date, date voted, method of voting; and if Oaktree did not vote for a particular Managed Account/Managed Fund the reasons behind such action; and |
| (iv) | List of client requests for proxy voting information. |
Item 8. Portfolio Managers of Closed-End Management Investment Companies.
Investment Team – Portfolio Managers
Portfolio Managers
Bruce Karsh, Wayne Dahl, Armen Panossian, Danielle Poli, and David Rosenberg manage the Fund. Bruce Karsh is the lead portfolio manager for the Fund. Their professional backgrounds are below.
Bruce Karsh
Co-Founder, Chief Investment Officer and Portfolio Manager
Mr. Karsh is Oaktree’s Co-Chairman and one of the firm’s co-founders. He also is Chief Investment Officer and serves as portfolio manager for Oaktree’s Opportunities, Value Opportunities and Global Credit strategies, including the Oaktree Diversified Income Fund. Prior to co-founding Oaktree, Mr. Karsh was a managing director of TCW Asset Management Company, and the portfolio manager of the Special Credits Funds from 1988 until 1995. Prior to joining TCW, Mr. Karsh worked as Assistant to the Chairman of SunAmerica, Inc. Prior to that, he was an attorney with the law firm of O’Melveny & Myers. Before working at O’Melveny & Myers, Mr. Karsh clerked for the Honorable Anthony M. Kennedy, then of the U.S. Court of Appeals for the Ninth Circuit and retired Associate Justice of the U.S. Supreme Court. Mr. Karsh holds an A.B. degree in economics summa cum laude from Duke University, where he was elected to Phi Beta Kappa. He went on to earn a J.D. from the University of Virginia School of Law, where he served as Notes Editor of the Virginia Law Review and was a member of the Order of the Coif. Mr. Karsh serves on the boards of a number of privately held companies. He is a member of the investment committee of the Broad Foundations. Mr. Karsh is Trustee Emeritus of Duke University, having served as Trustee from 2003 to 2015, and as Chairman of the Board of DUMAC, LLC, the entity that managed Duke’s endowment, from 2005 to 2014.
Wayne Dahl
Managing Director and Co-Portfolio Manager
Mr. Dahl serves as a portfolio manager within our Global Credit and Investment Grade Solutions strategies and is a founding member of the Global Credit Investment Committee. Mr. Dahl joined Oaktree in 2016 from Prosiris Capital Management in New York, where he was the Chief Risk Officer. Prior thereto, Mr. Dahl was Head of Risk Management for Canyon Capital Advisors in Los Angeles for nine years where he developed, implemented and managed the firm’s risk measurement and reporting systems across all investment strategies. Mr. Dahl began his career at Rumson Capital in quantitative research and development focused on the convertible arbitrage strategy. He received his B.A. degree in economics with a minor in mathematics from Brigham Young University and his Master of Science in Mathematics in Finance degree from New York University’s Courant Institute of Mathematical Science.
Armen Panossian
Co-Chief Executive Officer, Head of Performing Credit and Co-Portfolio Manager
Mr. Panossian serves as co-Chief Executive Officer, primarily focused on overseeing the organization and performance of Oaktree’s investment teams. He is also Head of Performing Credit, where his responsibilities include oversight of the firm’s liquid and private credit strategies and as a portfolio manager within the Global Private Debt and Global Credit strategies. Mr. Panossian joined Oaktree’s Global Opportunities group in 2007. In January 2014, he joined the U.S. Senior Loans team to assume co-portfolio management responsibilities and lead the development of Oaktree’s CLO business. He became head of all performing credit in 2019. Mr. Panossian joined Oaktree from Pequot Capital Management, where he worked on their distressed debt strategy. Mr. Panossian holds a B.A. degree in economics with honors and distinction from Stanford University, where he was elected to Phi Beta Kappa; an M.S. degree in health services research from Stanford Medical School; a J.D. degree from Harvard Law School; and an M.B.A. from Harvard Business School. Mr. Panossian serves on the Advisory Board of the Stanford Institute for Economic Policy Research. He is a member of the State Bar of California.
David Rosenberg
Managing Director and Co-Portfolio Manager
Mr. Rosenberg serves as a co-portfolio manager of Oaktree’s U.S. High Yield Bond, Global High Yield Bond and Investment Grade Solutions strategies. He also serves as a co-portfolio manager of the Global Credit strategy and is a founding member of its Investment Committee. Mr. Rosenberg joined Oaktree in 2004 following graduation from the University of Southern California with an M.B.A. in business administration. Before attending graduate school, he served as an associate in the Franchise Systems Finance Group at J.P. Morgan. Mr. Rosenberg also holds an M.P.A. in professional accounting with a concentration in finance and a B.A. degree in business administration from the University of Texas at Austin. He is a Certified Public Accountant (inactive).
Danielle Poli
Managing Director and Co-Portfolio Manager
Ms. Poli is a managing director and portfolio manager within Oaktree’s Global Credit strategy. She is a founding member of the strategy, having helped design its portfolio management processes and having served as a member of the Global Credit Investment Committee since 2017. Ms. Poli has led the expansion of the firm’s multi-asset credit offerings, including a product for Brookfield Oaktree Wealth Solutions which she has co-managed since 2021. In addition, Ms. Poli oversaw Oaktree’s product management activities globally across Credit, Private Equity, Real Assets and Listed Equities from 2019 to 2023. Prior to joining Oaktree in 2014, Ms. Poli earned her M.B.A. at the UCLA Anderson School of Management, where she received the Laurence and Lori Fink Investment Management Fellowship. Prior thereto, she worked at PAAMCO KKR Prisma (formerly PAAMCO) where Ms. Poli helped manage hedge fund portfolios for institutional clients. Ms. Poli holds a B.S. degree in business administration from the University of Southern California and is a CAIA charterholder.
Management of Other Accounts
The table below identifies the number of accounts (other than the Fund) for which the Fund’s portfolio managers have day-to-day management responsibilities and the total assets in such accounts, within each of the following categories: registered investment companies, other pooled investment vehicles, and other accounts. For each category, the number of accounts and total assets in the accounts where fees are based on performance is also indicated as of December 31, 2023.
| Portfolio Manager | Number of Registered Investment Companies Managed and Total Assets for such Accounts* | Beneficial Ownership of Equity Securities in Funds Managed by each Portfolio Manager | Number of Other Pooled Investment Vehicles Managed and Total Assets for such Accounts* | Number of Other Accounts Managed and Total Assets for such Accounts*, ** | ||||
| Bruce Karsh | - | - | 14 / $45,326 | 27 / $9,390 | ||||
| Wayne Dahl | - | - | - | - | ||||
| Armen Panossian | - | - | 10 / $13,516 | 38 / $23,264 | ||||
| Danielle Poli | - | - | - | - | ||||
| David Rosenberg | 1 / $27 | - | 8 / $4,905 | 58 / $19,650 |
* Assets in $ millions
** Represents separate accounts.
Share Ownership
The following table indicates the dollar range of securities of the Registrant owned by the Registrant’s portfolio managers as of December 31, 2023.
| Dollar Range of Securities Owned | ||
| Bruce Karsh | None | |
| Wayne Dahl | None | |
| Armen Panossian | None | |
| Danielle Poli | None | |
| David Rosenberg | None |
Potential Conflicts of Interest
In the course of providing investment management services, Oaktree and all principals, partners, officers, employees of Oaktree, as well as certain consultants and other external service providers, and its affiliates (collectively, “Oaktree Representatives”), likely will come into possession of material, nonpublic information which, if disclosed, might affect an investor’s decision to buy, sell or hold a security. Under applicable law, Oaktree and Oaktree Representatives may be prohibited from improperly disclosing or using such information for their personal benefit or for the benefit of any other person, including the Fund. In addition, certain accounts have acquired, and may in the future acquire, interests in companies that provide services to one or more other accounts. The payment of fees by accounts to a service provider owned in whole or in part by other accounts may give rise to potential conflicts of interest to the extent Oaktree directed or initiated such transaction. If Oaktree believes such instances may give rise to a conflict of interest, Oaktree will address such conflicts based on the facts and circumstances presented by each situation and attempt to employ measures to ensure that the accounts using the company’s services are charged arm’s-length prices for the services they receive. Such measures may include, where appropriate, having the company’s management control the negotiation of fees with the accounts to which services are provided and/or obtaining a “most favored nations” clause so that the accounts will automatically receive the benefit of the most favorable fees charged by the service provider to similarly situated clients. Oaktree and its employees may also receive certain benefits, such as discounts on products or services from companies in which an Oaktree account holds a significant ownership interest.
Conflicts Relating to Brookfield Asset Management. In 2019, Brookfield acquired a majority interest in Oaktree. Oaktree is a wholly owned subsidiary of Brookfield. Together, Brookfield and Oaktree provide investors with one of the most comprehensive offerings of alternative investment products available today. While partnering to leverage one another’s strengths, Oaktree operates as an independent business within the Brookfield family, with its own product offerings and investment, marketing, and support teams. Brookfield and Oaktree have continued to operate their respective investment businesses largely independently, with each remaining under its own brand and led by its own management and investment teams. Brookfield and Oaktree manage their investment team independently of each other pursuant to an information barrier. Oaktree accounts and their portfolio companies sometimes engage in activities and have business relationships that give rise to conflicts (and potential conflicts) of interest between them, on the one hand, and, Brookfield and Brookfield’s clients (together, “Brookfield Accounts”) and their portfolio companies on the other hand. For so long as Brookfield and Oaktree manage their investment teams independently of each other pursuant to an information barrier, Oaktree,
Oaktree accounts and their respective portfolio companies generally will not be treated as affiliates of Brookfield, Brookfield Accounts and their portfolio companies, and conflicts (and potential conflicts) considerations, including in connection with allocation of investment opportunities, investment and trading activities, and agreements, transactions and other arrangements entered into with Oaktree, Oaktree accounts and their portfolio companies, generally will be managed in accordance with disclosures set out in the governing documents and independently.
There is (and in the future will continue to be) overlap in investment strategies and investments pursued by Oaktree and Brookfield. Nevertheless, Oaktree generally does not coordinate or consult with Brookfield with respect to investment decisions of Oaktree accounts. While this absence of coordination and consultation, and the information barrier described above, in some respects serves to mitigate conflicts of interests between Oaktree and Brookfield, these same factors also give rise to certain conflicts and risks in connection with Brookfield’s and Oaktree’s investment activities, and make it more difficult to mitigate, ameliorate or avoid such situations. For example, because neither Brookfield nor Oaktree generally coordinate or consult with the other about investment activities and/or decisions made by the other, and neither Brookfield nor Oaktree is subject to any internal approvals over its respective investment activities and decisions by any person who would have knowledge and/or decision-making control of the investment decisions of the other, Brookfield will pursue investment opportunities for Brookfield Accounts which would also be suitable for Oaktree accounts, but which are not made available to such Oaktree accounts. Brookfield Accounts and Oaktree accounts compete, from time to time, for the same investment opportunities. Such competition could, under certain circumstances, adversely impact the purchase price of investments. Brookfield has no obligation to, and generally will not, share investment opportunities that would also be suitable for the Oaktree accounts, and Oaktree and Oaktree accounts have no rights with respect to any such opportunities.
In addition, Brookfield is not restricted from forming or establishing new Brookfield Accounts, such as additional funds or successor funds, which directly compete with Oaktree accounts for investment opportunities. Brookfield Accounts also are not restricted from pursuing investment opportunities based in whole or in part on information, support and knowledge provided directly or indirectly by Oaktree. For example, Oaktree may provide Brookfield, from time to time, with access to marketing-related support, including, for example, introductions to investor relationships and other marketing facilitation activities. Such Brookfield Accounts could compete with or otherwise conduct their affairs without regard to any adverse impact on Oaktree accounts. In addition, Brookfield Accounts are permitted to make investments suitable for Oaktree accounts without the consent of the Oaktree accounts or Oaktree. From time to time, Brookfield Accounts and Oaktree accounts may purchase or sell an investment from or to each other, as well as jointly pursue investments.
In addition, from time to time, Brookfield Accounts hold interests in investments held by Oaktree accounts (or potential Oaktree account investments) and/or subsequently purchase (or sell) an interest in an investment held by Oaktree accounts (or potential Oaktree account investments). In such situations, Brookfield Accounts could benefit from Oaktree accounts’ activities. Conversely, Oaktree accounts could be adversely impacted by Brookfield’s activities. In addition, as a result of different investment objectives, views and/or interests in investments, Brookfield may manage certain Brookfield Accounts’ investments in particular issuers in a way that is different from Oaktree accounts’ investments in the same issuers (including, for example, by investing in different portions of the issuer’s capital structure, short selling securities, voting securities or exercising rights it holds in a different manner and/or buying or selling its interests at different times than the Oaktree accounts), which could adversely impact Oaktree accounts’ interests. Brookfield and its affiliates may take positions, give advice and provide recommendations that are different from, and potentially contrary to, those which are taken by, given or provided to Oaktree accounts, and are expected to hold interests that potentially are adverse to those held by Oaktree accounts. Brookfield has no obligation or duty to make available for the benefit of Oaktree accounts any information regarding its activities, strategies and/or views.
Brookfield and Oaktree are likely to be deemed to be affiliates of each other for purposes of certain laws and regulations, notwithstanding their operational independence and the existence of an information barrier between them, and from time to time Brookfield Accounts and Oaktree accounts will have positions (which in some cases will be significant) in the same issuers. In those cases Brookfield and Oaktree will frequently need to aggregate their investment holdings, including holdings of Brookfield Accounts and Oaktree accounts, for certain securities law purposes (including trading restrictions under Rule 144 under the Securities Act, reporting obligations under Section 13 of the Exchange Act and reporting and short-swing.
Portfolio Manager Compensation
The compensation structure of the Portfolio Managers is determined by Oaktree in accordance with its own internal policies. All other Portfolio Managers receive a salary that is capped so that a significant portion of their compensation is derived from their bonus, which is a function of Oaktree’s profitability and the Portfolio Manager’s responsibilities and performance, and equity participation as one of the most senior employees. No Portfolio Manager’s compensation is specifically dependent on the performance of the Fund that they manage, on an absolute basis or relative to a specific benchmark. No Portfolio Manager is compensated based on the growth of the Fund’s, or any other clients’, assets except to the extent that such growth contributes to Oaktree’s overall asset growth, which in turn contributes to its overall profitability. Portfolio Managers do not receive a percentage of the revenue earned on any client portfolios, and their compensation is not increased or decreased specifically as a result of any performance fee that may be earned by Oaktree with respect to the funds or accounts they manage.
Item 9. Purchases of Equity Securities by Closed-End Management Investment Company and Affiliated Purchasers.
| Period | (a) Total Number of Shares (or Units) Purchased | (b) Average Price Paid per Share (or Unit) | (c) Total Number of Shares (or Units) Purchased as Part of Publicly Announced Plans or Programs | (d) Maximum Number (or Approximate Dollar Value) of Shares (or Units) that May Yet Be Purchased Under the Plans or Programs | ||||||||||||
| Month #1 (01/01/23-01/31/23) | - | - | - | - | ||||||||||||
| Month #2 (02/01/23-02/28/23)(1) | 15,066 | $ | 8.88 | 15,066 | - | |||||||||||
| Month #3 (03/01/23-03/31/23) | - | - | - | - | ||||||||||||
| Month #4 (04/01/23-04/30/23) | - | - | - | - | ||||||||||||
| Month #5 (05/01/23-05/31/23) (2) | 9,212 | $ | 8.82 | 9,212 | - | |||||||||||
| Month #6 (06/01/23-06/30/23) | - | - | - | - | ||||||||||||
| Month #7 (07/01/23-07/31/23) | - | - | - | - | ||||||||||||
| Month #8 (08/01/23-08/31/23) (3) | 89,947 | $ | 8.91 | 89,947 | - | |||||||||||
| Month #9 (09/01/23-09/30/23) | - | - | - | - | ||||||||||||
| Month #10 (10/01/23-10/31/23) | - | - | - | - | ||||||||||||
| Month #11 (11/01/23-11/30/23)(4) | 82,527 | $ | 8.87 | 82,527 | - | |||||||||||
| Month #12 (12/01/23-12/31/23) | - | - | - | - | ||||||||||||
| Total | 196,752 | - | 196,752 | - | ||||||||||||
| (1) | On January 9, 2023, the Registrant offered to repurchase up to 10.0% of the Registrant’s total outstanding shares as of February 13, 2023 (the “Repurchase Request Deadline”). On the Repurchase Request Deadline, 15,066 shares representing 0.1% of the Registrant’s total outstanding shares were repurchased. |
| (2) | On April 10, 2023, the Registrant offered to repurchase up to 10.0% of the Registrant’s total outstanding shares as of May 15, 2023 (the “Repurchase Request Deadline”). On the Repurchase Request Deadline, 9,212 shares representing 0.0% (rounds to less than 0.05%) of the Registrant’s total outstanding shares were repurchased. |
| (3) | On July 10, 2023, the Registrant offered to repurchase up to 10.0% of the Registrant’s total outstanding shares as of August 14, 2023 (the “Repurchase Request Deadline”). On the Repurchase Request Deadline, 89,947 shares representing 0.4% of the Registrant’s total outstanding shares were repurchased. |
| (4) | On October 6, 2023, the Registrant offered to repurchase up to 10.0% of the Registrant’s total outstanding shares as of November 13, 2023 (the “Repurchase Request Deadline”). On the Repurchase Request Deadline, 82,527 shares representing 0.3% of the Registrant’s total outstanding shares were repurchased. |
Item 10. Submission of Matters to a Vote of Security Holders.
There have been no material changes to the procedures by which shareholders may recommend nominees to the registrant’s Board of Directors.
Item 11. Controls and Procedures.
| (a) | The Registrant’s President/Principal Executive Officer and Treasurer/Principal Financial Officer have reviewed the Registrant's disclosure controls and procedures (as defined in Rule 30a-3(c) under the Investment Company Act of 1940 (the “Act”)) as of a date within 90 days of the filing of this report, as required by Rule 30a-3(b) under the Act and Rules 13a-15(b) or 15d-15(b) under the Securities Exchange Act of 1934. Based on their review, such officers have concluded that the disclosure controls and procedures are effective in ensuring that information required to be disclosed in this report is appropriately recorded, processed, summarized and reported and made known to them by others within the Registrant and by the Registrant’s service provider. |
| (b) | There were no changes in the Registrant's internal control over financial reporting (as defined in Rule 30a-3(d) under the Act) that occurred during the period covered by this report that have materially affected, or are reasonably likely to materially affect, the Registrant's internal control over financial reporting. |
Item 12. Disclosure of Securities Lending Activities for Closed-End Management Investment Companies
The registrant did not engage in securities lending activities during the fiscal year reported on this Form N-CSR.
Item 13. Exhibits.
| (a) | (1) Any code of ethics or amendment thereto, that is the subject of the disclosure required by Item 2, to the extent that the registrant intends to satisfy Item 2 requirements through filing an exhibit. Not Applicable. |
(3) Any written solicitation to purchase securities under Rule 23c-1 under the Act sent or given during the period covered by the report by or on behalf of the registrant to 10 or more persons. Not applicable.
(4) Change in the registrant’s independent public accountant. There was no change in the registrant’s independent public accountant for the period covered by this report.
| (b) | Certifications pursuant to Section 906 of the Sarbanes-Oxley Act of 2002. Furnished herewith. |
| (c) | CONSENT OF INDEPENDENT REGISTERED PUBLIC ACCOUNTING FIRM |
We consent to the incorporation by reference in Registration Statement No. 333-257789 on Form N-2 of our report dated February 27, 2024, relating to the consolidated financial statements and financial highlights of Oaktree Diversified Income Fund Inc. and appearing in the Annual Report on Form N-CSR for the year ended December 31, 2023, and to the references to us under the headings "Financial Highlights" and "Independent Registered Public Accounting Firm" in the Prospectus and “Independent Registered Public Accounting Firm” and “Financial Statements” in the Statement of Additional Information, which are part of such Registration Statement.
| /s/ Deloitte & Touche LLP | |
| Chicago, Illinois | |
| February 27, 2024 |
SIGNATURES
Pursuant to the requirements of the Securities Exchange Act of 1934 and the Investment Company Act of 1940, the registrant has duly caused this report to be signed on its behalf by the undersigned, thereunto duly authorized.
| (Registrant) | Oaktree Diversified Income Fund Inc. |
| By (Signature and Title)* | /s/ Brian F. Hurley |
| Brian F. Hurley, President/Principal Executive Officer |
| Date | March 8, 2024 |
Pursuant to the requirements of the Securities Exchange Act of 1934 and the Investment Company Act of 1940, this report has been signed below by the following persons on behalf of the registrant and in the capacities and on the dates indicated.
| By (Signature and Title) | /s/ Brian F. Hurley |
| Brian F. Hurley, President/Principal Executive Officer |
| Date: | March 8, 2024 |
| By (Signature and Title) | /s/ Casey P. Tushaus |
| Casey P. Tushaus, Treasurer/Principal Financial Officer |
| Date: | March 8, 2024 |