UNITED STATES
SECURITIES AND EXCHANGE COMMISSION
Washington, D.C. 20549
FORM N-CSRS
CERTIFIED SHAREHOLDER REPORT OF REGISTERED MANAGEMENT
INVESTMENT COMPANIES
Investment Company Act File Number 811-23718
Catholic Responsible Investments Funds
(Exact name of registrant as specified in charter)
One Freedom Valley Drive
Oaks, Pennsylvania 19456
(Address of principal executive offices) (Zip code)
Michael Beattie
c/o SEI Investments
One Freedom Valley Drive
Oaks, Pennsylvania 19456 (Name and address of agent for service)
Registrant’s telephone number, including area code: 1-866-348-6466
Date of fiscal year end: October 31, 2022
Date of reporting period: April 30, 2022
| Item 1. | Reports to Stockholders. |
The registrant’s schedules as of the close of the reporting period, pursuant to Rule 30e-1 under the Investment Company Act of 1940, as amended (the “Act”) (17 CFR § 270.30e-1), are attached hereto.
Catholic Responsible Investments
Semi-Annual Report April 30, 2022
CRI Ultra Short Bond Fund Institutional Shares: CRHSX
CRI Short Duration Bond Fund Institutional Shares: CRDSX
CRI Opportunistic Bond Fund Investor Shares: CROVX Institutional Shares: CROSX
CRI Bond Fund Investor Shares: CRBVX Institutional Shares: CRBSX
CRI Equity Index Fund Institutional Shares: CRQSX
CRI Multi-Style US Equity Fund Investor Shares: CRTVX Institutional Shares: CRTSX
CRI International Equity Fund Investor Shares: CRLVX Institutional Shares: CRLSX | CRI Small-Cap Fund Institutional Shares: CRSSX
CRI International Small-Cap Fund Institutional Shares: CRNSX
CRI Magnus 45/55 Fund Investor Shares: CMNVX Institutional Shares: CMNSX
CRI Magnus 60/40 Alpha Plus Fund Investor Shares: CMPVX Institutional Shares: CMPSX
CRI Magnus 60/40 Beta Plus Fund Investor Shares: CMMVX Institutional Shares: CMMSX
CRI Magnus 75/25 Fund Investor Shares: CMUVX Institutional Shares: CMUSX |

Investment Adviser:
Christian Brothers Investment Services
CATHOLIC RESPONSIBLE INVESTMENTS
APRIL 30, 2022 (Unaudited)
| 2 | ||||
| 84 | ||||
| 87 | ||||
| 90 | ||||
| 93 | ||||
| 95 | ||||
| 107 | ||||
| 110 | ||||
The Funds file their complete schedules of investments with the Securities and Exchange Commission (“SEC”) for the first and third quarters of each fiscal year as an exhibit to its reports on Form N-PORT. The Funds’ Form N-PORT reports are available on the SEC’s website at http://www.sec.gov, and may be reviewed and copied at the SEC’s Public Reference Room in Washington, DC. Information on the operation of the Public Reference Room may be obtained by calling 1-800-SEC-0330.
A description of the policies and procedures that the Funds use to determine how to vote proxies relating to fund securities, as well as information relating to how the Fund voted proxies relating to fund securities during the most recent 12-month period ended June 30, is available (i) without charge, upon request, by calling 1- 866-392-2626; and (ii) on the SEC’s website at http://www.sec.gov.
1
CATHOLIC RESPONSIBLE INVESTMENTS ULTRA SHORT BOND FUND
APRIL 30, 2022 (Unaudited)
| SECTOR WEIGHTINGS† |
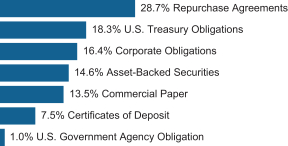
† Percentages are based on total investments.
| ||||||||
REPURCHASE AGREEMENTS — 28.9% |
| |||||||
| Face Amount | Value | |||||||
Gold Triparty Mortgage | $ | 11,300,000 | $ | 11,300,000 | ||||
|
| |||||||
Socgen Triparty | 6,000,000 | 6,000,000 | ||||||
|
| |||||||
Total Repurchase Agreements | ||||||||
(Cost $17,300,000) | 17,300,000 | |||||||
|
| |||||||
| U.S. TREASURY OBLIGATIONS — 18.4% | ||||||||
| Face Amount | Value | |||||||
U.S. Cash Management Bill | ||||||||
0.275%, 05/24/22(A) | $ | 600,000 | $ | 599,892 | ||||
0.150%, 05/10/22(A) | 1,200,000 | 1,199,969 | ||||||
0.125%, 05/03/22(A) | 2,000,000 | 1,999,995 | ||||||
U.S. Treasury Bill | ||||||||
0.300%, 05/17/22(A) | 1,733,600 | 1,733,497 | ||||||
0.065%, 05/19/22(A) | 2,000,000 | 1,999,797 | ||||||
| U.S. TREASURY OBLIGATIONS — continued | ||||||||
| Face Amount | Value | |||||||
U.S. Treasury Bill - WI Post Auction | ||||||||
0.341%, 06/07/22(A) | $ | 1,250,000 | $ | 1,249,458 | ||||
U.S. Treasury Note | ||||||||
0.967%, US Treasury 3 Month Bill Money Market Yield + 0.055%, 10/31/22(B) | 2,200,000 | 2,202,129 | ||||||
|
| |||||||
Total U.S. Treasury Obligations | ||||||||
(Cost $10,983,230) | 10,984,737 | |||||||
|
| |||||||
| CORPORATE OBLIGATIONS — 16.4% | ||||||||
| Face Amount | Value | |||||||
COMMUNICATION SERVICES — 0.3% |
| |||||||
Magallanes | ||||||||
2.057%, SOFRINDX + 1.780%, 03/15/24(B)(C) | $ | 215,000 | $ | 216,962 | ||||
|
| |||||||
CONSUMER DISCRETIONARY — 0.3% |
| |||||||
Starbucks | ||||||||
0.617%, SOFRINDX + 0.420%, 02/14/24(B) | 175,000 | 175,164 | ||||||
|
| |||||||
CONSUMER STAPLES — 0.8% |
| |||||||
Daimler Trucks Finance North America | ||||||||
1.295%, U.S. SOFR + 1.000%, 04/05/24(B)(C) | 175,000 | 175,033 | ||||||
McCormick | ||||||||
2.700%, 08/15/22 | 110,000 | 110,089 | ||||||
Volkswagen Group of America Finance | ||||||||
2.700%, 09/26/22(C) | 200,000 | 199,944 | ||||||
|
| |||||||
| 485,066 | ||||||||
|
| |||||||
ENERGY — 0.4% |
| |||||||
Enbridge | ||||||||
0.835%, SOFRINDX + 0.630%, 02/16/24(B) | 250,000 | 250,308 | ||||||
|
| |||||||
FINANCIALS — 11.4% |
| |||||||
American Express | ||||||||
1.020%, SOFRINDX + 0.720%, 05/03/24(B) | 150,000 | 149,970 | ||||||
Athene Global Funding | ||||||||
3.000%, 07/01/22(C) | 350,000 | 350,563 | ||||||
Bank of Montreal MTN | ||||||||
0.969%, SOFRINDX + 0.710%, 03/08/24(B) | 300,000 | 300,177 | ||||||
Barclays Bank | ||||||||
1.700%, 05/12/22 | 600,000 | 600,114 | ||||||
The accompanying notes are an integral part of the financial statements.
2
CATHOLIC RESPONSIBLE INVESTMENTS ULTRA SHORT BOND FUND
APRIL 30, 2022 (Unaudited)
| CORPORATE OBLIGATIONS — continued | ||||||||
| Face Amount | Value | |||||||
FINANCIALS — continued |
| |||||||
BNP Paribas NY | ||||||||
0.430%, U.S. SOFR + 0.130%, 09/09/22(B) | $ | 650,000 | $ | 649,504 | ||||
BPCE MTN | ||||||||
3.000%, 05/22/22(C) | 350,000 | 350,250 | ||||||
Credit Suisse NY | ||||||||
0.680%, SOFRINDX + 0.380%, 08/09/23(B) | 300,000 | 298,752 | ||||||
Deutsche Bank NY | ||||||||
0.800%, U.S. SOFR + 0.500%, 11/08/23(B) | 225,000 | 223,689 | ||||||
Dexia Credit Local | ||||||||
2.375%, 09/20/22 | 300,000 | 300,626 | ||||||
Equitable Financial Life Global Funding | ||||||||
0.685%, U.S. SOFR + 0.390%, 04/06/23(B)(C) | 450,000 | 449,242 | ||||||
Mitsubishi UFJ Financial Group | ||||||||
2.665%, 07/25/22 | 575,000 | 576,269 | ||||||
Morgan Stanley MTN | ||||||||
3.125%, 01/23/23 | 350,000 | 351,538 | ||||||
2.750%, 05/19/22 | 300,000 | 300,180 | ||||||
NatWest Markets | ||||||||
3.625%, 09/29/22(C) | 500,000 | 502,324 | ||||||
Nordea Bank Abp NY | ||||||||
0.470%, U.S. SOFR + 0.170%, 11/28/22(B) | 250,000 | 249,619 | ||||||
Societe Generale NY | ||||||||
0.460%, U.S. SOFR + 0.160%, 08/08/22(B) | 625,000 | 624,898 | ||||||
Toronto-Dominion Bank MTN | ||||||||
0.536%, U.S. SOFR + 0.240%, 01/06/23(B) | 150,000 | 149,754 | ||||||
UBS | ||||||||
0.558%, U.S. SOFR + 0.320%, 06/01/23(B)(C) | 375,000 | 374,344 | ||||||
|
| |||||||
| 6,801,813 | ||||||||
|
| |||||||
INDUSTRIALS — 0.8% |
| |||||||
ABB Finance USA |
| |||||||
2.875%, 05/08/22 | 300,000 | 300,055 | ||||||
Caterpillar Financial Services MTN | ||||||||
0.466%, U.S. SOFR + 0.170%, 01/10/24(B) | 175,000 | 174,257 | ||||||
|
| |||||||
| 474,312 | ||||||||
|
| |||||||
INFORMATION TECHNOLOGY — 0.3% |
| |||||||
QUALCOMM |
| |||||||
1.969%, ICE LIBOR USD 3 Month + 0.730%, 01/30/23(B) | 194,000 | 194,529 | ||||||
|
| |||||||
| CORPORATE OBLIGATIONS — continued | ||||||||
| Face Amount | Value | |||||||
UTILITIES — 2.1% | ||||||||
Florida Power & Light |
| |||||||
0.436%, SOFRINDX + 0.250%, 05/10/23(B) | $ | 200,000 | $ | 199,419 | ||||
National Rural Utilities Cooperative Finance MTN | ||||||||
0.700%, U.S. SOFR + 0.400%, 08/07/23(B) | 225,000 | 224,704 | ||||||
NextEra Energy Capital Holdings | ||||||||
0.778%, SOFRINDX + 0.540%, 03/01/23(B) | 225,000 | 224,734 | ||||||
0.750%, ICE LIBOR USD 3 Month + 0.270%, 02/22/23(B) | 300,000 | 299,167 | ||||||
Southern | ||||||||
0.556%, U.S. SOFR + 0.370%, 05/10/23(B) | 300,000 | 299,091 | ||||||
|
| |||||||
| 1,247,115 | ||||||||
|
| |||||||
Total Corporate Obligations | ||||||||
(Cost $9,868,536) | 9,845,269 | |||||||
|
| |||||||
| ASSET-BACKED SECURITIES — 14.7% | ||||||||
| Face Amount | Value | |||||||
Automotive — 13.2% |
| |||||||
American Credit Acceptance Receivables Trust, Ser 2020-1, Cl C | ||||||||
2.190%, 03/13/26 (C) | $ | 302,400 | $ | 302,603 | ||||
American Credit Acceptance Receivables Trust, Ser 2020-3, Cl B | ||||||||
1.150%, 08/13/24 (C) | 23,903 | 23,897 | ||||||
American Credit Acceptance Receivables Trust, Ser 2021-1, Cl B | ||||||||
0.610%, 03/13/25 (C) | 278,633 | 278,153 | ||||||
American Credit Acceptance Receivables Trust, Ser 2021-2, Cl A | ||||||||
0.370%, 10/15/24 (C) | 18,741 | 18,713 | ||||||
American Credit Acceptance Receivables Trust, Ser 2021-3, Cl A | ||||||||
0.330%, 06/13/25 (C) | 56,274 | 56,048 | ||||||
American Credit Acceptance Receivables Trust, Ser 2022-2, Cl A | ||||||||
2.660%, 02/13/26 (C) | 195,000 | 195,049 | ||||||
The accompanying notes are an integral part of the financial statements.
3
CATHOLIC RESPONSIBLE INVESTMENTS ULTRA SHORT BOND FUND
APRIL 30, 2022 (Unaudited)
| ASSET-BACKED SECURITIES — continued | ||||||||
| Face Amount | Value | |||||||
AmeriCredit Automobile Receivables Trust, Ser 2019-2, Cl B | ||||||||
2.540%, 07/18/24 | $ | 65,183 | $ | 65,334 | ||||
ARI Fleet Lease Trust, Ser 2020-A, Cl A2 | ||||||||
1.770%, 08/15/28 (C) | 97,730 | 97,771 | ||||||
ARI Fleet Lease Trust, Ser 2021-A, Cl A1 | ||||||||
0.173%, 06/15/22 (C) | 8,089 | 8,085 | ||||||
BMW Vehicle Lease Trust, Ser 2022-1, Cl A1 | ||||||||
0.237%, 01/25/23 | 36,265 | 36,223 | ||||||
Canadian Pacer Auto Receivables Trust, Ser 2019-1A, Cl A3 | ||||||||
2.800%, 10/19/23 (C) | 223,539 | 223,953 | ||||||
CarMax Auto Owner Trust, Ser 2022-1, Cl A1 | ||||||||
0.313%, 02/15/23 | 102,386 | 102,270 | ||||||
CarMax Auto Owner Trust, Ser 2022-2, Cl A2B | ||||||||
1.078%, SOFR30A + 0.600%, 05/15/25 (B) | 60,000 | 60,000 | ||||||
Carvana Auto Receivables Trust, Ser 2021-N2, Cl A1 | ||||||||
0.320%, 03/10/28 | 19,197 | 18,933 | ||||||
Carvana Auto Receivables Trust, Ser 2021-P4, Cl A1 | ||||||||
0.306%, 01/10/23 | 7,656 | 7,654 | ||||||
Chesapeake Funding II, Ser 2019-1A, Cl A1 | ||||||||
2.940%, 04/15/31 (C) | 92,501 | 92,568 | ||||||
CPS Auto Receivables Trust, Ser 2021-A, Cl B | ||||||||
0.610%, 02/18/25 (C) | 194,848 | 194,394 | ||||||
CPS Auto Receivables Trust, Ser 2021-B, Cl A | ||||||||
0.370%, 03/17/25 (C) | 35,972 | 35,827 | ||||||
CPS Auto Receivables Trust, Ser 2021-C, Cl A | ||||||||
0.330%, 07/15/24 (C) | 219,195 | 218,494 | ||||||
Credit Acceptance Auto Loan Trust, Ser 2019-3A, Cl A | ||||||||
2.380%, 11/15/28 (C) | 176,400 | 176,600 | ||||||
Donlen Fleet Lease Funding 2, Ser 2021-2, Cl A1 | ||||||||
0.818%, ICE LIBOR USD 1 Month + 0.330%, 12/11/34 (B)(C) | 189,821 | 189,016 | ||||||
Drive Auto Receivables Trust, Ser 2018-2, Cl D | ||||||||
4.140%, 08/15/24 | 125,909 | 126,406 | ||||||
| ASSET-BACKED SECURITIES — continued | ||||||||
| Face Amount | Value | |||||||
Drive Auto Receivables Trust, Ser 2018-3, Cl D | ||||||||
4.300%, 09/16/24 | $ | 159,336 | $ | 160,153 | ||||
Drive Auto Receivables Trust, Ser 2019-4, Cl C | ||||||||
2.510%, 11/17/25 | 41,350 | 41,388 | ||||||
Drive Auto Receivables Trust, Ser 2020-1, Cl C | ||||||||
2.360%, 03/16/26 | 111,801 | 111,891 | ||||||
Drive Auto Receivables Trust, Ser 2020-2, Cl B | ||||||||
1.420%, 03/17/25 | 56,571 | 56,563 | ||||||
Drive Auto Receivables Trust, Ser 2021-2, Cl A2 | ||||||||
0.360%, 05/15/24 | 44,119 | 44,020 | ||||||
Drive Auto Receivables Trust, Ser 2021-3, Cl A2 | ||||||||
0.520%, 01/15/25 | 243,081 | 241,385 | ||||||
DT Auto Owner Trust, Ser 2019-2A, Cl C | ||||||||
3.180%, 02/18/25 (C) | 38,358 | 38,412 | ||||||
DT Auto Owner Trust, Ser 2021-1A, Cl A | ||||||||
0.350%, 01/15/25 (C) | 67,310 | 67,091 | ||||||
DT Auto Owner Trust, Ser 2021-2A, Cl A | ||||||||
0.410%, 03/17/25 (C) | 103,978 | 103,336 | ||||||
DT Auto Owner Trust, Ser 2021-3A, Cl A | ||||||||
0.330%, 04/15/25 (C) | 172,361 | 170,475 | ||||||
Enterprise Fleet Financing, Ser 2021-3, Cl A1 | ||||||||
0.222%, 11/21/22 (C) | 44,652 | 44,582 | ||||||
Exeter Automobile Receivables Trust, Ser 2020-2A, Cl B | ||||||||
2.080%, 07/15/24 (C) | 26,357 | 26,365 | ||||||
Exeter Automobile Receivables Trust, Ser 2020-2A, Cl C | ||||||||
3.280%, 05/15/25 (C) | 175,000 | 175,783 | ||||||
Exeter Automobile Receivables Trust, Ser 2020-3A, Cl B | ||||||||
0.790%, 09/16/24 | 218,838 | 218,734 | ||||||
Exeter Automobile Receivables Trust, Ser 2021-3A, Cl A2 | ||||||||
0.340%, 01/16/24 | 4,199 | 4,196 | ||||||
Exeter Automobile Receivables Trust, Ser 2021-4A, Cl A2 | ||||||||
0.400%, 04/15/24 | 152,766 | 152,437 | ||||||
Exeter Automobile Receivables Trust, Ser 2022-1A, Cl A2 | ||||||||
1.150%, 06/17/24 | 160,000 | 159,406 | ||||||
The accompanying notes are an integral part of the financial statements.
4
CATHOLIC RESPONSIBLE INVESTMENTS ULTRA SHORT BOND FUND
APRIL 30, 2022 (Unaudited)
| ASSET-BACKED SECURITIES — continued | ||||||||
| Face Amount | Value | |||||||
Exeter Automobile Receivables Trust, Ser 2022-2A, Cl A1 | ||||||||
1.042%, 05/12/23 | $ | 300,000 | $ | 300,027 | ||||
First Investors Auto Owner Trust, Ser 2021-1A, Cl A | ||||||||
0.450%, 03/16/26 (C) | 220,689 | 218,407 | ||||||
Flagship Credit Auto Trust, Ser 2018-4, Cl C | ||||||||
4.110%, 10/15/24 (C) | 85,306 | 85,667 | ||||||
Flagship Credit Auto Trust, Ser 2020-1, Cl A | ||||||||
1.900%, 08/15/24 (C) | 28,037 | 28,043 | ||||||
Flagship Credit Auto Trust, Ser 2020-4, Cl A | ||||||||
0.530%, 04/15/25 (C) | 115,806 | 115,268 | ||||||
Flagship Credit Auto Trust, Ser 2021-1, Cl A | ||||||||
0.310%, 06/16/25 (C) | 282,262 | 279,935 | ||||||
Ford Credit Auto Lease Trust, Ser 2022-A, Cl A1 | ||||||||
1.374%, 05/15/23 | 52,000 | 52,006 | ||||||
Ford Credit Auto Lease Trust, Ser 2022-A, Cl A2B | ||||||||
0.889%, SOFR30A + 0.600%, 10/15/24 (B) | 40,000 | 40,000 | ||||||
Ford Credit Auto Owner Trust, Ser 2022-A, Cl A1 | ||||||||
0.239%, 02/15/23 | 55,964 | 55,916 | ||||||
GLS Auto Receivables Issuer Trust, Ser 2020-4A, Cl B | ||||||||
0.870%, 12/16/24 (C) | 77,533 | 77,303 | ||||||
GLS Auto Receivables Issuer Trust, Ser 2021-1A, Cl A | ||||||||
0.340%, 05/15/24 (C) | 17,282 | 17,270 | ||||||
GM Financial Consumer Automobile Receivables Trust, Ser 2018-3, Cl B | ||||||||
3.270%, 01/16/24 | 125,000 | 125,309 | ||||||
GM Financial Consumer Automobile Receivables Trust, Ser 2022-1, Cl A1 | ||||||||
0.229%, 01/17/23 | 57,125 | 57,076 | ||||||
Honda Auto Receivables Owner Trust, Ser 2020-1, Cl A3 | ||||||||
1.610%, 04/22/24 | 260,697 | — | ||||||
Santander Drive Auto Receivables Trust, Ser 2019-2, Cl C | ||||||||
2.900%, 10/15/24 | 48,074 | 48,112 | ||||||
Santander Drive Auto Receivables Trust, Ser 2019-3, Cl C | ||||||||
2.490%, 10/15/25 | 84,631 | 84,746 | ||||||
| ASSET-BACKED SECURITIES — continued | ||||||||
| Face Amount | Value | |||||||
Santander Drive Auto Receivables Trust, Ser 2020-2, Cl B | ||||||||
0.960%, 11/15/24 | $ | 20,548 | $ | 20,540 | ||||
Santander Drive Auto Receivables Trust, Ser 2020-2, Cl C | ||||||||
1.460%, 09/15/25 | 350,000 | 348,863 | ||||||
Santander Drive Auto Receivables Trust, Ser 2020-3, Cl B | ||||||||
0.690%, 03/17/25 | 113,655 | 113,554 | ||||||
Santander Drive Auto Receivables Trust, Ser 2020-4, Cl B | ||||||||
0.730%, 03/17/25 | 269,989 | 269,552 | ||||||
Santander Drive Auto Receivables Trust, Ser 2021-3, Cl A2 | ||||||||
0.290%, 05/15/24 | 49,821 | 49,819 | ||||||
Santander Retail Auto Lease Trust, Ser 2020-A, Cl A3 | ||||||||
1.740%, 07/20/23 (C) | 84,625 | 84,687 | ||||||
United Auto Credit Securitization Trust, Ser 2021-1, Cl A | ||||||||
0.340%, 07/10/23 (C) | 3,162 | 3,161 | ||||||
United Auto Credit Securitization Trust, Ser 2022-1, Cl A | ||||||||
1.110%, 07/10/24 (C) | 87,327 | 87,006 | ||||||
Volkswagen Auto Lease Trust, Ser 2020-A, Cl A2 | ||||||||
0.270%, 04/20/23 | 67,652 | 67,575 | ||||||
Westlake Automobile Receivables Trust, Ser 2018-3A, Cl D | ||||||||
4.000%, 10/16/23 (C) | 51,221 | 51,350 | ||||||
Westlake Automobile Receivables Trust, Ser 2019-1A, Cl E | ||||||||
4.490%, 07/15/24 (C) | 125,000 | 126,386 | ||||||
Westlake Automobile Receivables Trust, Ser 2019-3A, Cl C | ||||||||
2.490%, 10/15/24 (C) | 105,105 | 105,216 | ||||||
Westlake Automobile Receivables Trust, Ser 2021-1A, Cl A2A | ||||||||
0.390%, 10/15/24 (C) | 55,756 | 55,462 | ||||||
Westlake Automobile Receivables Trust, Ser 2021-3A, Cl A2 | ||||||||
0.570%, 09/16/24 (C) | 294,133 | 291,447 | ||||||
World Omni Auto Receivables Trust, Ser 2022-A, Cl A1 | ||||||||
0.396%, 02/15/23 | 147,504 | 147,294 | ||||||
World Omni Select Auto Trust, Ser 2019-A, Cl A3 | ||||||||
2.000%, 08/15/24 | 120,489 | 120,539 | ||||||
|
| |||||||
| 7,871,744 | ||||||||
|
| |||||||
The accompanying notes are an integral part of the financial statements.
5
CATHOLIC RESPONSIBLE INVESTMENTS ULTRA SHORT BOND FUND
APRIL 30, 2022 (Unaudited)
| ASSET-BACKED SECURITIES — continued | ||||||||
| Face Amount | Value | |||||||
Other Asset-Backed Securites — 1.5% |
| |||||||
CCG Receivables Trust, Ser 2021-2, Cl A1 | ||||||||
0.125%, 10/14/22 (C) | $ | 9,863 | $ | 9,858 | ||||
Cloud Pass-Through Trust, Ser 2019-1A, Cl CLOU | ||||||||
3.554%, 12/05/22 (B)(C) | 1,535 | 1,536 | ||||||
Dell Equipment Finance Trust, Ser 2021-2, Cl A1 | ||||||||
0.182%, 09/22/22 (C) | 41,470 | 41,433 | ||||||
Dllmt, Ser 2021-1A, Cl A1 | ||||||||
0.229%, 10/20/22 (C) | 34,095 | 34,059 | ||||||
DLLST, Ser 2022-1A, Cl A1 | ||||||||
1.560%, 05/22/23 (C) | 285,714 | 285,718 | ||||||
FREED ABS Trust, Ser 2021-3FP, Cl A | ||||||||
0.620%, 11/20/28 (C) | 36,987 | 36,828 | ||||||
FREED ABS Trust, Ser 2022-1FP, Cl A | ||||||||
0.940%, 03/19/29 (C) | 71,975 | 71,387 | ||||||
GreatAmerica Leasing Receivables Funding, Ser 2021-2, Cl A1 | ||||||||
0.149%, 10/17/22 (C) | 150,193 | 150,003 | ||||||
HPEFS Equipment Trust, Ser 2022-1A, Cl A1 | ||||||||
0.427%, 01/20/23 (C) | 165,513 | 165,183 | ||||||
SCF Equipment Leasing, Ser 2022-1A, Cl A1 | ||||||||
0.632%, 03/13/23 (C) | 121,509 | 121,371 | ||||||
|
| |||||||
| 917,376 | ||||||||
|
| |||||||
Total Asset-Backed Securities | ||||||||
(Cost $9,074,899) | 8,789,120 | |||||||
|
| |||||||
| COMMERCIAL PAPER — 13.6% | ||||||||
| Face Amount | Value | |||||||
Banco Santander | ||||||||
1.276%, 08/01/22 | $ | 300,000 | $ | 298,997 | ||||
BASF | ||||||||
1.052%, 06/02/22 | 250,000 | 249,834 | ||||||
BofA Securities | ||||||||
0.985%, 09/01/22 | 450,000 | 447,698 | ||||||
Caisse d’Amortissement de la Dette Sociale | ||||||||
0.922%, 06/22/22 | 525,000 | 524,285 | ||||||
CDP Financial | ||||||||
0.601%, 06/01/22 | 315,000 | 314,784 | ||||||
Commonwealth Bank of Australia | ||||||||
0.190%, 07/18/22 | 675,000 | 673,320 | ||||||
| COMMERCIAL PAPER — continued | ||||||||
| Face Amount | Value | |||||||
Erste Abwicklungsanstalt | ||||||||
0.761%, 06/13/22 | $ | 625,000 | $ | 624,359 | ||||
HSBC USA | ||||||||
0.250%, 06/10/22 | 350,000 | 349,634 | ||||||
Kimberly-Clark | ||||||||
0.350%, 05/03/22 | 1,000,000 | 999,958 | ||||||
Kreditanstalt fuer Wiederaufbau | ||||||||
0.490%, 05/05/22 | 400,000 | 399,971 | ||||||
Macquarie Bank | ||||||||
0.201%, 07/06/22 | 300,000 | 299,352 | ||||||
National Bank of Canada | ||||||||
0.180%, 08/10/22 | 625,000 | 622,675 | ||||||
Province of Alberta Canada | ||||||||
0.180%, 06/02/22 | 300,000 | 299,818 | ||||||
Royal Bank of Canada NY | ||||||||
0.638%, 10/04/22 | 500,000 | 495,831 | ||||||
Skandinaviska Enskilda Banken | ||||||||
0.170%, 06/15/22 | 550,000 | 549,395 | ||||||
Societe Generale | ||||||||
0.902%, 05/31/22 | 250,000 | 249,837 | ||||||
Standard Chartered Bank | ||||||||
0.241%, 10/06/22 | 250,000 | 248,200 | ||||||
Sumitomo Mitsui Trust Bank | ||||||||
0.943%, 06/28/22 | 250,000 | 249,567 | ||||||
Svenska Handelsbanken | ||||||||
0.160%, 05/24/22 | 250,000 | 249,894 | ||||||
|
| |||||||
Total Commercial Paper | ||||||||
(Cost $8,158,347) | 8,147,409 | |||||||
|
| |||||||
| CERTIFICATES OF DEPOSIT — 7.5% | ||||||||
| Face Amount | Value | |||||||
Australia & New Zealand Banking Group | ||||||||
0.240%, 10/07/22 | $ | 600,000 | $ | 599,662 | ||||
Bank of Montreal | ||||||||
0.640%, 10/18/22 | 600,000 | 599,945 | ||||||
Bank of Nova Scotia | ||||||||
0.510%, 06/03/22 | 750,000 | 750,027 | ||||||
BNZ International Funding | ||||||||
0.750%, 09/09/22 | 250,000 | 250,295 | ||||||
Credit Agricole Corporate and Investment Bank | ||||||||
0.190%, 05/16/22 | 500,000 | 500,010 | ||||||
Credit Suisse New York | ||||||||
0.490%, 08/18/22 | 286,000 | 285,850 | ||||||
Macquarie Bank | ||||||||
0.250%, 06/21/22 | 625,000 | 624,951 | ||||||
National Australia Bank | ||||||||
0.220%, 07/25/22 | 600,000 | 599,815 | ||||||
The accompanying notes are an integral part of the financial statements.
6
CATHOLIC RESPONSIBLE INVESTMENTS ULTRA SHORT BOND FUND
APRIL 30, 2022 (Unaudited)
| CERTIFICATES OF DEPOSIT — continued | ||||||||
| Face Amount | Value | |||||||
Westpac Banking | ||||||||
0.180%, 08/10/22 | $ | 300,000 | $ | 299,871 | ||||
|
| |||||||
Total Certificates of Deposit | ||||||||
(Cost $4,510,841) | 4,510,426 | |||||||
|
| |||||||
U.S. GOVERNMENT AGENCY OBLIGATION – 1.0% |
| |||||||
| Face Amount | Value | |||||||
FFCB | ||||||||
0.335%, U.S. SOFR + 0.035%, 07/12/23(B) | $ | 600,000 | $ | 599,985 | ||||
|
| |||||||
Total U.S. Government Agency Obligations | ||||||||
(Cost $599,964) | 599,985 | |||||||
|
| |||||||
Total Investments in Securities— 100.5% |
| |||||||
(Cost $60,495,817) | $ | 60,176,946 | ||||||
|
| |||||||
Percentages are based on Net Assets of $59,880,826.
| (A) | Interest rate represents the security’s effective yield at the time of purchase. |
| (B) | Variable or floating rate security. The rate shown is the effective interest rate as of period end. The rates for certain securities are not based on published reference rates and spreads and are either determined by the issuer or agent based on current market conditions; by using a formula based on the rates of underlying loans; or by adjusting periodically based on prevailing interest rates. |
| (C) | Securities sold within the terms of a private placement memorandum, exempt from registration under section 144A of the Securities Act of 1933, as amended, and maybe sold only to dealers in the program or other “accredited investors”. The total value of these securities at April 30, 2022 was $17,724,272 and represented 29.6% of Net Assets. |
Cl — Class
FFCB — Federal Farm Credit Bank
ICE — Intercontinental Exchange
LIBOR — London Interbank Offered Rate
MTN — Medium Term Note
Ser — Series
SOFR — Secured Overnight Financing Rate
SOFRINDX — Secured Overnight Financing Rate
USD — U.S. Dollar
The following is a list of the inputs used as of April 30, 2022, in valuing the Fund’s investments carried at market value:
| Investments in Securities | Level 1 | Level 2 | Level 3 | Total | ||||||||||||
Repurchase Agreements | $ | — | $ | 17,300,000 | $ | — | $ | 17,300,000 | ||||||||
U.S. Treasury Obligations | 2,202,129 | 8,782,608 | — | 10,984,737 | ||||||||||||
Corporate Obligations | — | 9,845,269 | — | 9,845,269 | ||||||||||||
Asset-Backed Securities | — | 8,789,120 | — | 8,789,120 | ||||||||||||
Commercial Paper | — | 8,147,409 | — | 8,147,409 | ||||||||||||
Certificates of Deposit | — | 4,510,426 | — | 4,510,426 | ||||||||||||
U.S. Government Agency Obligation | — | 599,985 | — | 599,985 | ||||||||||||
Total Investments in Securities | ||||||||||||||||
|
|
|
|
|
|
|
| |||||||||
| $ | 2,202,129 | $ | 57,974,817 | $ | — | $ | 60,176,946 | |||||||||
|
|
|
|
|
|
|
| |||||||||
|
|
|
|
|
|
|
| |||||||||
Amounts designated as “–” are $0.
For more information on valuation inputs, see Note 2 — Significant Accounting Policies in the Notes to Financial Statements.
The accompanying notes are an integral part of the financial statements.
7
CATHOLIC RESPONSIBLE INVESTMENTS SHORT DURATION BOND FUND
APRIL 30, 2022 (Unaudited)
| SECTOR WEIGHTINGS† | ||||
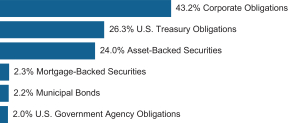
† Percentages are based on total investments.
| SCHEDULE OF INVESTMENTS | ||||||||
| CORPORATE OBLIGATIONS — 42.7% | ||||||||
| Face Amount | Value | |||||||
COMMUNICATION SERVICES — 1.9% |
| |||||||
AT&T | ||||||||
0.000%, 11/27/22(A)(C) | $ | 2,000,000 | $ | 1,973,377 | ||||
Magallanes | ||||||||
3.428%, 03/15/24(A) | 2,625,000 | 2,608,521 | ||||||
Sky | ||||||||
3.125%, 11/26/22(A) | 1,000,000 | 1,004,235 | ||||||
Sprint Spectrum | ||||||||
4.738%, 03/20/25(A) | 1,920,000 | 1,935,110 | ||||||
Time Warner Entertainment | ||||||||
8.375%, 03/15/23 | 2,400,000 | 2,507,834 | ||||||
|
| |||||||
| 10,029,077 | ||||||||
|
| |||||||
CONSUMER DISCRETIONARY — 4.0% |
| |||||||
7-Eleven | ||||||||
0.800%, 02/10/24(A) | 2,525,000 | 2,406,345 | ||||||
DR Horton | ||||||||
2.600%, 10/15/25 | 2,575,000 | 2,466,758 | ||||||
Ford Motor Credit | ||||||||
2.300%, 02/10/25 | 2,500,000 | 2,321,750 | ||||||
General Motors Financial | ||||||||
4.150%, 06/19/23 | 1,975,000 | 1,995,469 | ||||||
Leland Stanford Junior University | ||||||||
6.875%, 02/01/24 | 1,250,000 | 1,328,433 | ||||||
Lennar | ||||||||
4.875%, 12/15/23 | 2,000,000 | 2,033,970 | ||||||
4.750%, 05/30/25 | 1,825,000 | 1,859,906 | ||||||
Marriott International | ||||||||
3.125%, 02/15/23 | 780,000 | 780,080 | ||||||
Mileage Plus Holdings | ||||||||
6.500%, 06/20/27(A) | 1,350,000 | 1,377,000 | ||||||
Mohawk Industries | ||||||||
3.850%, 02/01/23 | 1,200,000 | 1,208,416 | ||||||
Picasso Finance Sub | ||||||||
6.125%, 06/15/25(A) | 1,420,000 | 1,446,625 | ||||||
Ross Stores | ||||||||
3.375%, 09/15/24 | 1,725,000 | 1,719,671 | ||||||
|
| |||||||
| 20,944,423 | ||||||||
|
| |||||||
| CORPORATE OBLIGATIONS — continued | ||||||||||
| Face Amount | Value | |||||||||
CONSUMER STAPLES — 1.4% |
| |||||||||
Baylor Scott & White Holdings | ||||||||||
2.650%, 11/15/26 | $ | 1,500,000 | $ | 1,423,123 | ||||||
Bunge Finance | ||||||||||
1.630%, 08/17/25 | 2,200,000 | 2,046,508 | ||||||||
CVS Pass-Through Trust | ||||||||||
6.036%, 12/10/28 | 2,703,383 | 2,853,160 | ||||||||
Pilgrim’s Pride | ||||||||||
5.875%, 09/30/27(A) | 1,000,000 | 1,007,305 | ||||||||
|
| |||||||||
| 7,330,096 | ||||||||||
|
| |||||||||
ENERGY — 2.2% |
| |||||||||
Cal Dive I-Title XI | ||||||||||
4.930%, 02/01/27 | 749,240 | 776,923 | ||||||||
Continental Resources | ||||||||||
3.800%, 06/01/24 | 1,695,000 | 1,697,847 | ||||||||
2.268%, 11/15/26(A) | 760,000 | 694,283 | ||||||||
Equities | ||||||||||
6.625%, 02/01/25 | 1,250,000 | 1,299,825 | ||||||||
Petroleos Mexicanos | ||||||||||
2.830%, 02/15/24 | 369,000 | 368,784 | ||||||||
2.378%, 04/15/25 | 762,000 | 754,665 | ||||||||
1.950%, 12/20/22 | 630,000 | 629,658 | ||||||||
1.700%, 12/20/22 | 584,000 | 583,046 | ||||||||
Phillips | ||||||||||
66 3.700%, 04/06/23 | 2,250,000 | 2,266,613 | ||||||||
Plains All American Pipeline | ||||||||||
4.650%, 10/15/25 | 2,250,000 | 2,273,425 | ||||||||
|
| |||||||||
| 11,345,069 | ||||||||||
|
| |||||||||
FINANCIALS — 23.9% |
| |||||||||
Abay Leasing 2014 | ||||||||||
2.654%, 11/09/26 | 727,455 | 719,066 | ||||||||
ABN AMRO Bank | ||||||||||
7.750%, 05/15/23(A) | 1,700,000 | 1,757,268 | ||||||||
Ahold Lease Series 2001-A-2 Pass Through Trust | ||||||||||
8.620%, 01/02/25 | 207,743 | 220,066 | ||||||||
American Express | ||||||||||
3.700%, 08/03/23 | 2,400,000 | 2,424,966 | ||||||||
Athene Global Funding | ||||||||||
2.800%, 05/26/23(A) | 1,000,000 | 998,549 | ||||||||
2.514%, 03/08/24(A) | 1,570,000 | 1,531,218 | ||||||||
Bank of America | ||||||||||
3.004%, ICE LIBOR USD 3 MONTH + 0.790%, 12/20/23(B) | 2,075,000 | 2,070,380 | ||||||||
0.810%, U.S. SOFR + 0.740%, 10/24/24(B) | 2,000,000 | 1,920,163 | ||||||||
The accompanying notes are an integral part of the financial statements.
8
CATHOLIC RESPONSIBLE INVESTMENTS SHORT DURATION BOND FUND
APRIL 30, 2022 (Unaudited)
| CORPORATE OBLIGATIONS — continued | ||||||||
| Face Amount | Value | |||||||
FINANCIALS — continued |
| |||||||
Bank of New Zealand | ||||||||
2.000%, 02/21/25(A) | $ | 3,150,000 | $ | 3,017,531 | ||||
Bank One Michigan | ||||||||
8.250%, 11/01/24 | 1,925,000 | 2,117,765 | ||||||
Banque Federative du Credit Mutuel | ||||||||
2.375%, 11/21/24(A) | 2,578,000 | 2,489,961 | ||||||
Barclays | ||||||||
1.007%, US Treas Yield Curve Rate T Note Const Mat 1 Yr + 0.800%, 12/10/24(B) | 2,575,000 | 2,456,887 | ||||||
BGC Partners | ||||||||
5.375%, 07/24/23 | 2,150,000 | 2,184,074 | ||||||
BPCE | ||||||||
4.000%, 04/15/24 | 1,050,000 | 1,060,572 | ||||||
Brighthouse Financial Global Funding MTN | ||||||||
1.200%, 12/15/23(A) | 1,720,000 | 1,658,533 | ||||||
1.000%, 04/12/24(A) | 594,000 | 565,704 | ||||||
Cantor Fitzgerald | ||||||||
6.500%, 06/17/22(A) | 1,458,000 | 1,464,682 | ||||||
Charles Schwab | ||||||||
0.750%, 03/18/24 | 2,665,000 | 2,552,705 | ||||||
Citigroup | ||||||||
3.106%, U.S. SOFR + 2.842%, 04/08/26(B) | 2,232,000 | 2,161,823 | ||||||
Credit Agricole MTN | ||||||||
1.907%, U.S. SOFR + 1.676%, 06/16/26(A)(B) | 2,525,000 | 2,345,584 | ||||||
Credit Suisse Group | ||||||||
2.593%, U.S. SOFR + 1.560%, 09/11/25(A)(B) | 3,050,000 | 2,910,235 | ||||||
Deutsche Bank NY | ||||||||
2.222%, U.S. SOFR + 2.159%, 09/18/24(B) | 2,605,000 | 2,534,409 | ||||||
Durrah MSN | ||||||||
35603 1.684%, 01/22/25 | 1,569,824 | 1,539,845 | ||||||
DY8 Leasing | ||||||||
2.627%, 04/29/26 | 2,372,917 | 2,348,626 | ||||||
DY9 Leasing | ||||||||
2.372%, 03/19/27 | 683,095 | 669,630 | ||||||
Equitable Financial Life Global Funding | ||||||||
1.100%, 11/12/24(A) | 2,670,000 | 2,513,345 | ||||||
Export Lease Ten | ||||||||
1.650%, 05/07/25 | 1,812,922 | 1,776,719 | ||||||
Federation des Caisses Desjardins du Quebec | ||||||||
0.700%, 05/21/24(A) | 1,500,000 | 1,416,584 | ||||||
| CORPORATE OBLIGATIONS — continued | ||||||||
| Face Amount | Value | |||||||
FINANCIALS — continued |
| |||||||
Five Corners Funding Trust | ||||||||
4.419%, 11/15/23(A) | $ | 3,875,000 | $ | 3,926,378 | ||||
GATX Financial 2005-1 Pass Through Trust | ||||||||
5.697%, 01/02/25(A) | 217,960 | 220,541 | ||||||
Goldman Sachs Group MTN | ||||||||
2.905%, ICE LIBOR USD 3 Month + 0.990%, 07/24/23(B) | 3,325,000 | 3,323,139 | ||||||
Harar Leasing | ||||||||
2013 2.582%, 07/02/25 | 1,787,499 | 1,770,741 | ||||||
Helios Leasing II | ||||||||
2.668%, 03/18/25 | 1,490,288 | 1,483,057 | ||||||
HSBC Holdings 4.292%, ICE LIBOR USD 3 Month + | ||||||||
1.348%, 09/12/26(B) | 2,980,000 | 2,963,662 | ||||||
ING Bank | ||||||||
5.800%, 09/25/23(A) | 2,500,000 | 2,571,891 | ||||||
Jackson National Life Global Funding | ||||||||
2.500%, 06/27/22(A) | 2,000,000 | 2,002,580 | ||||||
JPMorgan Chase | ||||||||
1.045%, U.S. SOFR + 0.800%, 11/19/26(B) | 1,500,000 | 1,349,078 | ||||||
Kansas City Southern | ||||||||
3.850%, 11/15/23 | 1,975,000 | 1,989,303 | ||||||
Lulwa | ||||||||
1.831%, 03/26/25 | 1,410,486 | 1,385,480 | ||||||
Macquarie Bank | ||||||||
3.231%, 03/21/25(A) | 1,675,000 | 1,654,271 | ||||||
Massachusetts Mutual Life Insurance | ||||||||
7.625%, 11/15/23(A) | 2,250,000 | 2,365,690 | ||||||
Metropolitan Tower Life Insurance | ||||||||
7.625%, 01/15/24(A) | 2,000,000 | 2,131,999 | ||||||
Mizuho Financial Group | ||||||||
1.241%, U.S. SOFR + 1.252%, 07/10/24(B) | 2,300,000 | 2,241,777 | ||||||
Morgan Stanley | ||||||||
5.000%, 11/24/25 | 3,425,000 | 3,518,126 | ||||||
3.737%, ICE LIBOR USD 3 Month + 0.847%, 04/24/24(B) | 1,000,000 | 1,000,806 | ||||||
MSN 41079 and 41084 | ||||||||
1.631%, 12/14/24 | 922,026 | 905,416 | ||||||
NatWest Group | ||||||||
6.125%, 12/15/22 | 1,200,000 | 1,220,619 | ||||||
6.000%, 12/19/23 | 1,480,000 | 1,520,317 | ||||||
NatWest Markets | ||||||||
3.479%, 03/22/25(A) | 1,585,000 | 1,571,125 | ||||||
The accompanying notes are an integral part of the financial statements.
9
CATHOLIC RESPONSIBLE INVESTMENTS SHORT DURATION BOND FUND
APRIL 30, 2022 (Unaudited)
| CORPORATE OBLIGATIONS — continued | ||||||||
| Face Amount | Value | |||||||
FINANCIALS — continued |
| |||||||
Pershing Road Development | ||||||||
0.923%, ICE LIBOR USD 3 Month + 0.400%, 09/01/26(A)(B) | $ | 1,391,358 | $ | 1,335,703 | ||||
PNC Bank | ||||||||
2.875%, 06/29/22 | 2,418,000 | 2,422,930 | ||||||
Reliance Standard Life Global Funding II | ||||||||
2.150%, 01/21/23(A) | 2,275,000 | 2,263,907 | ||||||
Royal Bank of Canada MTN | ||||||||
1.600%, 01/21/25 | 2,970,000 | 2,820,985 | ||||||
Sandalwood 2013 | ||||||||
2.836%, 07/10/25 | 1,266,326 | 1,263,022 | ||||||
Schneider Electric | ||||||||
2.950%, 09/27/22(A) | 2,175,000 | 2,179,217 | ||||||
Security Benefit Global Funding MTN | ||||||||
1.250%, 05/17/24(A) | 2,800,000 | 2,653,945 | ||||||
State Street | ||||||||
3.100%, 05/15/23 | 2,000,000 | 2,009,301 | ||||||
Swiss Re Treasury US | ||||||||
2.875%, 12/06/22(A) | 1,575,000 | 1,576,628 | ||||||
Toronto-Dominion Bank MTN | ||||||||
2.350%, 03/08/24 | 1,565,000 | 1,542,251 | ||||||
TTX MTN | ||||||||
3.600%, 01/15/25(A) | 2,500,000 | 2,510,728 | ||||||
UBS Group | ||||||||
1.008%, US Treas Yield Curve Rate T Note Const Mat 1 Yr + 0.830%, 07/30/24(A)(B) | 2,500,000 | 2,427,645 | ||||||
Ulani MSN 35940 | ||||||||
2.227%, 05/16/25 | 1,022,396 | 1,010,581 | ||||||
Washington Aircraft 2 DAC | ||||||||
1.396%, ICE LIBOR USD 3 Month + 0.430%, 06/26/24(B) | 1,287,185 | 1,288,610 | ||||||
Wells Fargo MTN | ||||||||
2.406%, U.S. SOFR + 1.087%, 10/30/25(B) | 4,825,000 | 4,636,268 | ||||||
|
| |||||||
| 124,484,607 | ||||||||
|
| |||||||
HEALTH CARE — 0.3% |
| |||||||
Adventist Health System | ||||||||
2.433%, 09/01/24 | 1,415,000 | 1,373,215 | ||||||
|
| |||||||
INDUSTRIALS — 3.5% |
| |||||||
AerCap Ireland Capital DAC | ||||||||
4.875%, 01/16/24 | 1,000,000 | 1,005,746 | ||||||
4.125%, 07/03/23 | 1,925,000 | 1,922,827 | ||||||
| CORPORATE OBLIGATIONS — continued | ||||||||
| Face Amount | Value | |||||||
INDUSTRIALS — continued |
| |||||||
American Airlines Class A Pass Through Trust, Cl A | ||||||||
4.950%, 01/15/23 | $ | 3,084,425 | $ | 3,064,087 | ||||
Burlington Northern and Santa Fe Railway Pass Through Trust, Ser 2006-1 | ||||||||
5.720%, 01/15/24 | 591,393 | 606,153 | ||||||
CNH Industrial | ||||||||
4.500%, 08/15/23 | 2,375,000 | 2,408,607 | ||||||
Delta Air Lines | ||||||||
4.500%, 10/20/25(A) | 2,000,000 | 1,987,226 | ||||||
Georgia-Pacific | ||||||||
3.734%, 07/15/23(A) | 2,100,000 | 2,119,085 | ||||||
Lennox International | ||||||||
3.000%, 11/15/23 | 2,000,000 | 1,988,360 | ||||||
Republic Services | ||||||||
4.750%, 05/15/23 | 900,000 | 913,967 | ||||||
Westinghouse Air Brake Technologies | ||||||||
3.200%, 06/15/25 | 2,250,000 | 2,174,583 | ||||||
|
| |||||||
| 18,190,641 | ||||||||
|
| |||||||
INFORMATION TECHNOLOGY — 2.2% |
| |||||||
Fiserv | ||||||||
3.800%, 10/01/23 | 2,015,000 | 2,034,231 | ||||||
Global Payments | ||||||||
4.000%, 06/01/23 | 2,000,000 | 2,016,165 | ||||||
Infor | ||||||||
1.450%, 07/15/23(A) | 550,000 | 536,974 | ||||||
Microchip Technology | ||||||||
4.250%, 09/01/25 | 1,925,000 | 1,909,921 | ||||||
PayPal Holdings | ||||||||
1.350%, 06/01/23 | 2,250,000 | 2,221,052 | ||||||
TD SYNNEX | ||||||||
1.250%, 08/09/24(A) | 2,655,000 | 2,497,445 | ||||||
|
| |||||||
| 11,215,788 | ||||||||
|
| |||||||
MATERIALS — 1.7% |
| |||||||
Air Liquide Finance | ||||||||
2.250%, 09/27/23(A) | 2,000,000 | 1,981,369 | ||||||
Berry Global | ||||||||
4.875%, 07/15/26(A) | 1,250,000 | 1,242,312 | ||||||
0.950%, 02/15/24 | 1,300,000 | 1,240,649 | ||||||
Graphic Packaging International | ||||||||
0.821%, 04/15/24(A) | 1,025,000 | 967,501 | ||||||
Nutrien | ||||||||
1.900%, 05/13/23 | 1,175,000 | 1,163,158 | ||||||
The accompanying notes are an integral part of the financial statements.
10
CATHOLIC RESPONSIBLE INVESTMENTS SHORT DURATION BOND FUND
APRIL 30, 2022 (Unaudited)
| CORPORATE OBLIGATIONS — continued | ||||||||
| Face Amount | Value | |||||||
MATERIALS — continued |
| |||||||
Union Carbide | ||||||||
7.875%, 04/01/23 | $ | 1,950,000 | $ | 2,022,593 | ||||
|
| |||||||
| 8,617,582 | ||||||||
|
| |||||||
UTILITIES — 1.6% |
| |||||||
National Rural Utilities Cooperative Finance MTN | ||||||||
2.300%, 09/15/22 | 2,825,000 | 2,830,339 | ||||||
NextEra Energy Capital Holdings | ||||||||
2.940%, 03/21/24 | 1,300,000 | 1,290,910 | ||||||
0.650%, 03/01/23 | 1,100,000 | 1,082,730 | ||||||
NorthWestern | ||||||||
1.000%, 03/26/24 | 2,600,000 | 2,456,104 | ||||||
Pacific Gas and Electric | ||||||||
1.347%, SOFRINDX + 1.150%, 11/14/22(B) | 370,000 | 370,309 | ||||||
|
| |||||||
| 8,030,392 | ||||||||
|
| |||||||
Total Corporate Obligations (Cost $229,798,895) | 221,560,890 | |||||||
|
| |||||||
| U.S. TREASURY OBLIGATIONS — 25.9% | ||||||||
| Face Amount | Value | |||||||
U.S. Treasury Notes | ||||||||
2.875%, 04/30/25 | $ | 3,000,000 | $ | 2,999,297 | ||||
2.750%, 07/31/23 | 1,520,000 | 1,527,066 | ||||||
2.750%, 02/28/25 | 7,640,000 | 7,615,827 | ||||||
2.625%, 06/30/23 | 2,575,000 | 2,584,958 | ||||||
2.625%, 03/31/25 | 3,640,000 | 3,614,691 | ||||||
2.375%, 08/15/24 | 6,260,000 | 6,198,867 | ||||||
2.250%, 11/15/24 | 19,350,000 | 19,065,797 | ||||||
2.250%, 12/31/24 | 2,580,000 | 2,540,091 | ||||||
2.125%, 11/30/23 | 2,200,000 | 2,185,906 | ||||||
2.125%, 02/29/24 | 23,775,000 | 23,554,895 | ||||||
2.125%, 05/15/25 | 1,000,000 | 977,773 | ||||||
1.750%, 12/31/24 | 14,145,000 | 13,744,409 | ||||||
1.625%, 10/31/23 | 5,555,000 | 5,483,175 | ||||||
1.375%, 06/30/23 | 10,000,000 | 9,896,094 | ||||||
1.125%, 02/28/25 | 3,780,000 | 3,602,960 | ||||||
0.375%, 12/31/25 | 15,150,000 | 13,813,723 | ||||||
0.250%, 06/30/25 | 16,500,000 | 15,187,090 | ||||||
|
| |||||||
Total U.S. Treasury Obligations (Cost $140,141,878) | 134,592,619 | |||||||
|
| |||||||
| ASSET-BACKED SECURITIES — 23.7% | ||||||||
| Face Amount | Value | |||||||
Automotive — 4.0% |
| |||||||
ARI Fleet Lease Trust, Ser 2022-A, Cl A2 | ||||||||
3.120%, 01/15/31 (A) | $ | 935,000 | $ | 936,385 | ||||
Avis Budget Rental Car Funding AESOP, Ser 2017-2A, Cl A | ||||||||
2.970%, 03/20/24 (A) | 3,050,000 | 3,056,171 | ||||||
Carvana Auto Receivables Trust, Ser 2021-N3, Cl B | ||||||||
0.660%, 06/12/28 | 953,453 | 937,304 | ||||||
GTE Auto Receivables Trust, Ser 2019-1, Cl A3 | ||||||||
2.390%, 08/15/24 (A) | 625,639 | 625,155 | ||||||
Hertz Vehicle Financing, Ser 2021-1A, Cl A | ||||||||
1.210%, 12/26/25 (A) | 2,575,000 | 2,419,925 | ||||||
NextGear Floorplan Master Owner Trust, Ser 2020-1A, Cl A2 | ||||||||
1.550%, 02/15/25 (A) | 2,000,000 | 1,982,326 | ||||||
NextGear Floorplan Master Owner Trust, Ser 2022-1A, Cl A2 | ||||||||
2.800%, 03/15/27 (A) | 2,360,000 | 2,295,138 | ||||||
Santander Drive Auto Receivables Trust, Ser 2021-2, Cl B | ||||||||
0.590%, 09/15/25 | 3,460,000 | 3,421,883 | ||||||
Toyota Auto Receivables Owner Trust, Ser 2022-B, Cl A3 | ||||||||
2.930%, 09/15/26 | 935,000 | 931,704 | ||||||
World Omni Auto Receivables Trust, Ser 2020-C, Cl A3 | ||||||||
0.480%, 11/17/25 | 1,500,000 | 1,473,917 | ||||||
World Omni Select Auto Trust, Ser 2020-A, Cl B | ||||||||
0.840%, 06/15/26 | 2,500,000 | 2,435,069 | ||||||
|
| |||||||
| 20,514,977 | ||||||||
|
| |||||||
Other Asset-Backed Securities — 19.7% |
| |||||||
American Tower Trust #1, Ser 2013-13, Cl 2A |
| |||||||
3.070%, 03/15/48 (A) | 3,265,000 | 3,264,363 | ||||||
Amur Equipment Finance Receivables VII, Ser 2019-1A, Cl A2 | ||||||||
2.630%, 06/20/24 (A) | 435,029 | 435,649 | ||||||
BBCMS Mortgage Trust, Ser 2021-AGW, Cl A | ||||||||
1.804%, ICE LIBOR USD 1 Month + 1.250%, 06/15/36 (A)(B) | 4,130,000 | 4,039,268 | ||||||
Business Jet Securities, Ser 2021-1A, Cl A | ||||||||
2.162%, 04/15/36 (A) | 1,201,409 | 1,105,607 | ||||||
The accompanying notes are an integral part of the financial statements.
11
CATHOLIC RESPONSIBLE INVESTMENTS SHORT DURATION BOND FUND
APRIL 30, 2022 (Unaudited)
| ASSET-BACKED SECURITIES — continued | ||||||||
| Face Amount | Value | |||||||
BX Commercial Mortgage Trust, Ser 2021-VOLT, Cl B | ||||||||
1.504%, ICE LIBOR USD 1 Month + 0.950%, 09/15/36 (A)(B) | $ | 4,250,000 | $ | 4,139,924 | ||||
CHL Mortgage Pass-Through Trust, Ser 2004-29, Cl 1A1 | ||||||||
5.401%, ICE LIBOR USD 1 Month + 0.540%, 02/25/35 (B) | 12,485 | 11,984 | ||||||
COMM Mortgage Trust, Ser 2012-CR5, Cl ASB | ||||||||
2.388%, 12/10/45 | 207,669 | 207,671 | ||||||
COMM Mortgage Trust, Ser 2013-CR11, Cl A4 | ||||||||
4.258%, 08/10/50 | 1,500,000 | 1,517,363 | ||||||
COMM Mortgage Trust, Ser 2013-WWP, Cl A1 | ||||||||
2.499%, 03/10/31 (A) | 403,812 | 404,518 | ||||||
COMM Mortgage Trust, Ser 2014-UBS5, Cl ASB | ||||||||
3.548%, 09/10/47 | 769,585 | 772,093 | ||||||
Community Program Loan Trust, Ser 1987-A, Cl B | ||||||||
4.500%, 10/01/29 | 18,581 | 18,139 | ||||||
CSAIL Commercial Mortgage Trust, Ser 2015-C1, Cl ASB | ||||||||
3.351%, 04/15/50 | 1,348,224 | 1,348,680 | ||||||
CSAIL Commercial Mortgage Trust, Ser 2018-CX11, Cl A3 | ||||||||
4.095%, 04/15/51 | 2,125,000 | 2,139,960 | ||||||
CSMC Trust, Ser 2017-MOON, Cl A | ||||||||
3.197%, 07/10/34 (A) | 2,200,000 | 2,197,230 | ||||||
DBCG Mortgage Trust, Ser 2017-BBG, Cl A | ||||||||
1.255%, ICE LIBOR USD 1 Month + 0.700%, 06/15/34 (A)(B) | 2,225,000 | 2,198,423 | ||||||
DBGS Mortgage Trust, Ser 2018-C1, Cl A1 | ||||||||
3.409%, 10/15/51 | 481,853 | 481,297 | ||||||
DLLST, Ser 2022-1A, Cl A2 | ||||||||
2.790%, 01/22/24 (A) | 810,000 | 809,863 | ||||||
Extended Stay America Trust, Ser 2021-ESH, Cl B | ||||||||
1.935%, ICE LIBOR USD 1 Month + 1.380%, 07/15/38 (A)(B) | 1,093,271 | 1,078,273 | ||||||
FCI Funding, Ser 2021-1A, Cl A | ||||||||
1.130%, 04/15/33 (A) | 788,478 | 780,673 | ||||||
| ASSET-BACKED SECURITIES — continued | ||||||||
| Face Amount | Value | |||||||
FREED ABS Trust, Ser 2021-2, Cl A | ||||||||
0.680%, 06/19/28 (A) | $ | 272,617 | $ | 272,376 | ||||
FREED ABS Trust, Ser 2022-2CP, Cl A | ||||||||
3.030%, 05/18/29 (A) | 3,000,000 | 2,991,063 | ||||||
Golub Capital Partners CLO 24M-R, Ser 2017-24A, Cl AR | ||||||||
1.915%, ICE LIBOR USD 3 Month + 1.600%, 11/05/29 (A)(B) | 2,600,000 | 2,588,378 | ||||||
GS Mortgage Securities II, Ser 2012-BWTR, Cl A | ||||||||
2.954%, 11/05/34 (A) | 3,200,000 | 3,187,284 | ||||||
GSR Mortgage Loan Trust, Ser 2004-9, Cl 3A1 | ||||||||
2.594%, 08/25/34 (B) | 17,446 | 17,523 | ||||||
HPLY Trust, Ser 2019-HIT, Cl A | ||||||||
1.554%, ICE LIBOR USD 1 Month + 1.000%, 11/15/36 (A)(B) | 1,551,804 | 1,516,782 | ||||||
JP Morgan Mortgage Trust, Ser 2006-A2, Cl 4A1 | ||||||||
4.061%, 08/25/34 (B) | 15,127 | 15,675 | ||||||
Life Mortgage Trust, Ser 2021-BMR, Cl A | ||||||||
1.254%, ICE LIBOR USD 1 Month + 0.700%, 03/15/38 (A)(B) | 1,867,643 | 1,828,020 | ||||||
Mariner Finance Issuance Trust, Ser 2020-AA, Cl A | ||||||||
2.190%, 08/21/34 (A) | 3,250,000 | 3,125,368 | ||||||
ME Funding, Ser 2019-1, Cl A2 | ||||||||
6.448%, 07/30/49 (A) | 1,539,563 | 1,547,346 | ||||||
MHC Commercial Mortgage Trust, Ser 2021-MHC, Cl A | ||||||||
1.355%, ICE LIBOR USD 1 Month + 0.801%, 04/15/38 (A)(B) | 4,650,000 | 4,559,681 | ||||||
MMAF Equipment Finance, Ser 2019-A, Cl A3 | ||||||||
2.840%, 11/13/23 (A) | 480,053 | 480,913 | ||||||
Morgan Stanley Bank of America Merrill Lynch Trust, Ser 2015-C20, Cl ASB | ||||||||
3.069%, 02/15/48 | 1,018,916 | 1,015,582 | ||||||
Morgan Stanley Capital I Trust, Ser 2017-CLS, Cl A | ||||||||
1.254%, ICE LIBOR USD 1 Month + 0.700%, 11/15/34 (A)(B) | 1,300,000 | 1,293,459 | ||||||
The accompanying notes are an integral part of the financial statements.
12
CATHOLIC RESPONSIBLE INVESTMENTS SHORT DURATION BOND FUND
APRIL 30, 2022 (Unaudited)
| ASSET-BACKED SECURITIES — continued | ||||||||
| Face Amount | Value | |||||||
Morgan Stanley Capital I Trust, Ser 2017-CLS, Cl B | ||||||||
1.404%, ICE LIBOR USD 1 Month + 0.850%, 11/15/34 (A)(B) | $ | 2,700,000 | $ | 2,683,153 | ||||
Navient Private Education Refi Loan Trust, Ser 2019-GA, Cl A | ||||||||
2.400%, 10/15/68 (A) | 1,531,290 | 1,498,464 | ||||||
Navient Private Education Refi Loan Trust, Ser 2020-HA, Cl A | ||||||||
1.310%, 01/15/69 (A) | 937,582 | 902,552 | ||||||
Navient Private Education Refi Loan Trust, Ser 2021-A, Cl A | ||||||||
0.840%, 05/15/69 (A) | 945,131 | 878,698 | ||||||
NMEF Funding, Ser 2022-A, Cl A2 | ||||||||
2.580%, 10/16/28 (A) | 2,375,000 | 2,331,565 | ||||||
NP SPE II, Ser 2019-1A, Cl A1 | ||||||||
2.574%, 09/20/49 (A) | 1,158,124 | 1,084,472 | ||||||
Octane Receivables Trust, Ser 2021-1A, Cl A | ||||||||
0.930%, 03/22/27 (A) | 1,211,837 | 1,175,994 | ||||||
OnDeck Asset Securitization Trust III, Ser 2021-1A, Cl A | ||||||||
1.590%, 05/17/27 (A) | 1,910,000 | 1,814,698 | ||||||
PFS Financing, Ser 2020-A, Cl A | ||||||||
1.270%, 06/15/25 (A) | 4,000,000 | 3,919,430 | ||||||
SBA Small Business Investment, Ser 2013-10A, Cl 1 | ||||||||
2.351%, 03/10/23 | 635,774 | 631,555 | ||||||
SBA Small Business Investment, Ser 2014-10A, Cl 1 | ||||||||
3.191%, 03/10/24 | 541,558 | 528,710 | ||||||
SBA Small Business Investment, Ser 2014-10B, Cl 1 | ||||||||
3.015%, 09/10/24 | 190,291 | 183,006 | ||||||
SBA Small Business Investment, Ser 2015-10A, Cl 1 | ||||||||
2.517%, 03/10/25 | 1,198,542 | 1,155,349 | ||||||
SBA Small Business Investment, Ser 2015-10B, Cl 1 | ||||||||
2.829%, 09/10/25 | 786,912 | 759,846 | ||||||
SBA Small Business Investment, Ser 2016-10A, Cl 1 | ||||||||
2.507%, 03/10/26 | 1,926,413 | 1,840,285 | ||||||
SBA Small Business Investment, Ser 2016-10B, Cl 1 | ||||||||
2.051%, 09/10/26 | 2,147,235 | 2,024,384 | ||||||
SBA Small Business Investment, Ser 2017-10A, Cl 1 | ||||||||
2.845%, 03/10/27 | 1,298,122 | 1,244,970 | ||||||
| ASSET-BACKED SECURITIES — continued | ||||||||
| Face Amount | Value | |||||||
SBA Small Business Investment, Ser 2019-10B, Cl 1 | ||||||||
2.283%, 09/10/29 | $ | 2,793,968 | $ | 2,649,559 | ||||
SBA Small Business Investment, Ser 2020-10B, Cl 1 | ||||||||
1.034%, 09/10/30 | 3,969,597 | 3,554,778 | ||||||
SBA Tower Trust, Ser 2014-2A, Cl C | ||||||||
3.869%, 10/15/49 (A) | 2,525,000 | 2,535,855 | ||||||
SCF Equipment Leasing, Ser 2020-1A, Cl A3 | ||||||||
1.190%, 10/20/27 (A) | 1,635,295 | 1,617,824 | ||||||
Sequoia Mortgage Trust, Ser 2013-2, Cl A | ||||||||
1.874%, 02/25/43 (B) | 104,317 | 96,430 | ||||||
SMR Mortgage Trust, Ser 2022-IND, Cl A | ||||||||
2.159%, TSFR1M + 1.650%, 02/15/39 (A)(B) | 2,411,476 | 2,382,013 | ||||||
SMRT, Ser 2022-MINI, Cl A | ||||||||
1.522%, TSFR1M + 1.000%, 01/15/39 (A)(B) | 1,035,000 | 1,019,452 | ||||||
SOFI Professional Loan Program Trust, Ser 2021-A, Cl AFX | ||||||||
1.030%, 08/17/43 (A) | 1,510,433 | 1,385,919 | ||||||
Transportation Finance Equipment Trust, Ser 2019-1, Cl A4 | ||||||||
1.880%, 03/25/24 (A) | 3,000,000 | 2,986,348 | ||||||
UBS Commercial Mortgage Trust, Ser 2017-C6, Cl A3 | ||||||||
3.581%, 12/15/50 | 2,550,000 | 2,501,964 | ||||||
United States Small Business Administration, Ser 2005-20F, Cl 1 | ||||||||
4.570%, 06/01/25 | 49,822 | 49,634 | ||||||
United States Small Business Administration, Ser 2020-10E, Cl 1 | ||||||||
0.700%, 09/01/30 | 1,381,038 | 1,263,421 | ||||||
Westgate Resorts, Ser 2020-1A, Cl A | ||||||||
2.713%, 03/20/34 (A) | 1,507,755 | 1,496,223 | ||||||
WFRBS Commercial Mortgage Trust, Ser 2012-C10, Cl A3 | ||||||||
2.875%, 12/15/45 | 2,615,000 | 2,609,384 | ||||||
WFRBS Commercial Mortgage Trust, Ser 2012-C10, Cl ASB | ||||||||
2.453%, 12/15/45 | 54,872 | 54,865 | ||||||
|
| |||||||
| 102,251,228 | ||||||||
|
| |||||||
Total Asset-Backed Securities (Cost $126,528,443) | 122,766,205 | |||||||
|
| |||||||
The accompanying notes are an integral part of the financial statements.
13
CATHOLIC RESPONSIBLE INVESTMENTS SHORT DURATION BOND FUND
APRIL 30, 2022 (Unaudited)
| MORTGAGE-BACKED SECURITIES — 2.3% | ||||||||
| Face Amount | Value | |||||||
Agency Mortgage-Backed Obligation — 2.2% |
| |||||||
FHLB | ||||||||
3.250%, 06/09/23 | $ | 1,520,000 | $ | 1,536,033 | ||||
2.250%, 12/08/23 | 1,280,000 | 1,274,081 | ||||||
FHLMC | ||||||||
5.000%, 07/01/35 | 147,467 | 156,478 | ||||||
0.375%, 05/05/23 | 1,250,000 | 1,227,249 | ||||||
FHLMC, Ser 2019-4911, Cl HG | ||||||||
2.250%, 04/15/49 | 390,844 | 366,005 | ||||||
FHLMC, Ser 2020-5037, Cl NE | ||||||||
2.500%, 05/25/39 | 1,805,126 | 1,718,496 | ||||||
FNMA | ||||||||
5.000%, 03/01/34 | 118,529 | 126,052 | ||||||
4.500%, 08/01/38 | 235,241 | 245,214 | ||||||
4.000%, 03/01/31 | 216,491 | 217,380 | ||||||
3.500%, 11/01/34 | 2,503,587 | 2,512,464 | ||||||
FNMA, Ser 2009-62, Cl WA | ||||||||
5.578%, 08/25/39 (B) | 37,135 | 38,865 | ||||||
FNMA, Ser 2013-9, Cl AE | ||||||||
1.750%, 03/25/39 | 202,621 | 201,016 | ||||||
FNMA, Ser M15, Cl A | ||||||||
2.536%, 10/25/22 (B) | 689,693 | 690,173 | ||||||
GNMA 2.136%, ICE LIBOR USD 1 Month + | ||||||||
1.905%, 06/20/61 (B) | 181,965 | 185,643 | ||||||
GNMA, Ser 131, Cl A | ||||||||
2.200%, 04/16/57 | 199,351 | 198,846 | ||||||
GNMA, Ser 17, Cl AM | ||||||||
3.335%, 06/16/48 (B) | 197,874 | 197,326 | ||||||
GNMA, Ser 2011-57, Cl BA | ||||||||
3.000%, 05/20/40 | 41,068 | 41,054 | ||||||
GNMA, Ser 2017-99, Cl WA | ||||||||
4.784%, 12/20/32 (B) | 405,257 | 416,850 | ||||||
GNMA, Ser 27, Cl A | ||||||||
1.614%, 07/16/39 | 98,847 | 98,585 | ||||||
|
| |||||||
| 11,447,810 | ||||||||
|
| |||||||
Other Mortgage-Backed Obligation — 0.1% |
| |||||||
SBA 1.250%, Prime Rate + - | ||||||||
2.250%, 09/25/28 (B) | 106,367 | 107,839 | ||||||
0.900%, Prime Rate + - 2.600%, 01/25/26 (B) | 124,725 | 125,150 | ||||||
0.890%, Prime Rate + - 2.610%, 05/25/39 (B) | 290,306 | 294,521 | ||||||
|
| |||||||
| 527,510 | ||||||||
|
| |||||||
Total Mortgage-Backed Securities (Cost $12,242,390) | 11,975,320 | |||||||
|
| |||||||
| MUNICIPAL BONDS — 2.1% | ||||||||
| Face Amount | Value | |||||||
California — 0.5% |
| |||||||
City of Union City California, RB | ||||||||
5.920%, 07/01/24 | $ | 2,470,000 | $ | 2,545,750 | ||||
|
| |||||||
Illinois — 0.4% |
| |||||||
Sales Tax Securitization, Ser B, RB |
| |||||||
2.225%, 01/01/24 | 1,800,000 | 1,766,100 | ||||||
|
| |||||||
New Jersey — 0.7% |
| |||||||
New Jersey Economic Development Authority, Ser B, RB | ||||||||
0.000%, 02/15/24 (C) | 2,250,000 | 2,114,726 | ||||||
New Jersey State, Transportation Trust Fund Authority, RB | ||||||||
2.551%, 06/15/23 | 1,750,000 | 1,740,170 | ||||||
|
| |||||||
| 3,854,896 | ||||||||
|
| |||||||
New York — 0.5% |
| |||||||
County of Suffolk New York, Ser C, GO | ||||||||
1.607%, 06/15/25 | 1,800,000 | 1,698,151 | ||||||
Utility Debt Securitization Authority, Ser T, RB | ||||||||
3.435%, 12/15/25 | 1,154,000 | 1,156,287 | ||||||
|
| |||||||
| 2,854,438 | ||||||||
|
| |||||||
Total Municipal Bonds (Cost $11,345,540) | 11,021,184 | |||||||
|
| |||||||
| U.S. GOVERNMENT AGENCY OBLIGATIONS — 2.0% | ||||||||
| Face Amount | Value | |||||||
Export-Import Bank of the United States | ||||||||
2.628%, 11/12/26 | $ | 2,510,231 | $ | 2,478,935 | ||||
1.900%, 07/12/24 | 969,686 | 958,513 | ||||||
United States International Development Finance | ||||||||
2.820%, 03/20/24 | 2,533,333 | 2,532,317 | ||||||
2.290%, 09/15/26 | 1,280,635 | 1,263,726 | ||||||
0.000%, 08/16/24(C) | 3,000,000 | 3,182,198 | ||||||
|
| |||||||
Total U.S. Government Agency Obligations | 10,415,689 | |||||||
|
| |||||||
Total Investments in Securities— 98.7% (Cost $530,656,033) |
| $ | 512,331,907 | |||||
|
| |||||||
The accompanying notes are an integral part of the financial statements.
14
CATHOLIC RESPONSIBLE INVESTMENTS SHORT DURATION BOND FUND
APRIL 30, 2022 (Unaudited)
Percentages are based on Net Assets of $518,976,913.
| (A) | Securities sold within the terms of a private placement memorandum, exempt from registration under section 144A of the Securities Act of 1933, as amended, and maybe sold only to dealers in the program or other “accredited investors”. The total value of these securities at April 30, 2022 was $164,718,376 and represented 31.7% of Net Assets. |
| (B) | Variable or floating rate security. The rate shown is the effective interest rate as of period end. The rates for certain securities are not based on published reference rates and spreads and are either determined by the issuer or agent based on current market conditions; by using a formula based on the rates of underlying loans; or by adjusting periodically based on prevailing interest rates. |
| (C) | Zero coupon security. |
| Cl — Class |
| DAC — Designated Activity Company |
| FHLMC — Federal Home Loan Mortgage Corporation |
| FNMA — Federal National Mortgage Association |
| GNMA — Government National Mortgage Association |
| GO — General Obligation |
| ICE — Intercontinental Exchange |
| LIBOR — London Interbank Offered Rate |
| MTN — Medium Term Note |
| RB — Revenue Bond |
| Ser — Series |
| SOFR — Secured Overnight Financing Rate |
| SOFRINDX — Secured Overnight Financing Rate Index |
| TSFR1M — Term Secured Overnight Financing Rate 1 Month |
| USD — U.S. Dollar |
The following is a list of the inputs used as of April 30, 2022, in valuing the Fund’s investments carried at value:
| Investments in Securities | Level 1 | Level 2 | Level 3 | Total | ||||||||||||
Corporate Obligations | $ | — | $ | 221,560,890 | $ | — | $ | 221,560,890 | ||||||||
U.S. Treasury Obligations | 13,814,694 | 120,777,925 | — | 134,592,619 | ||||||||||||
Asset-Backed Securities | — | 122,766,205 | — | 122,766,205 | ||||||||||||
Mortgage-Backed Securities | — | 11,975,320 | — | 11,975,320 | ||||||||||||
Municipal Bonds | — | 11,021,184 | — | 11,021,184 | ||||||||||||
U.S. Government Agency Obligations | — | 10,415,689 | — | 10,415,689 | ||||||||||||
|
|
|
|
|
|
|
| |||||||||
Total Investments in Securities | $ | 13,814,694 | $ | 498,517,213 | $ | — | $ | 512,331,907 | ||||||||
|
|
|
|
|
|
|
| |||||||||
Amounts designated as “–” are $0.
For more information on valuation inputs, see Note 2 — Significant Accounting Policies in the Notes to Financial Statements.
The accompanying notes are an integral part of the financial statements.
15
CATHOLIC RESPONSIBLE INVESTMENTS OPPORTUNISTIC BOND FUND
APRIL 30, 2022 (Unaudited)
| SECTOR WEIGHTINGS† | ||||
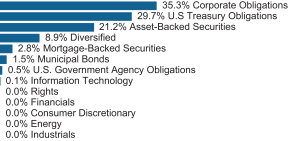
† Percentages are based on total investments.
| SCHEDULE OF INVESTMENTS | ||||||||
| CORPORATE OBLIGATIONS — 34.8% | ||||||||
| Face Amount | Value | |||||||
COMMUNICATION SERVICES — 2.6% |
| |||||||
CCO Holdings | ||||||||
5.000%, 02/01/28(A) | $ | 1,500,000 | $ | 1,428,990 | ||||
CommScope | ||||||||
6.000%, 03/01/26(A) | 1,060,000 | 999,792 | ||||||
Crown Castle Towers | ||||||||
3.663%, 05/15/25(A) | 2,450,000 | 2,417,575 | ||||||
Gray Escrow II | ||||||||
5.375%, 11/15/31(A) | 1,500,000 | 1,292,940 | ||||||
Lumen Technologies | ||||||||
5.125%, 12/15/26(A) | 750,000 | 675,000 | ||||||
Nexstar Media | ||||||||
5.625%, 07/15/27(A) | 1,500,000 | 1,459,695 | ||||||
Sprint Spectrum | ||||||||
5.152%, 03/20/28(A) | 1,465,000 | 1,508,118 | ||||||
Time Warner Entertainment | ||||||||
8.375%, 03/15/23 | 1,500,000 | 1,567,396 | ||||||
T-Mobile USA | ||||||||
3.750%, 04/15/27 | 1,500,000 | 1,460,257 | ||||||
|
| |||||||
| 12,809,763 | ||||||||
|
| |||||||
CONSUMER DISCRETIONARY — 4.2% |
| |||||||
Block Financial | ||||||||
2.500%, 07/15/28 | 1,750,000 | 1,552,983 | ||||||
Elanco Animal Health | ||||||||
6.400%, 08/28/28 | 795,000 | 815,869 | ||||||
General Motors Financial | ||||||||
5.100%, 01/17/24 | 1,080,000 | 1,104,198 | ||||||
4.300%, 07/13/25 | 1,577,000 | 1,582,406 | ||||||
1.407%, U.S. SOFR + 1.200%, 11/17/23(B) | 1,765,000 | 1,767,061 | ||||||
Hilton Domestic Operating | ||||||||
3.750%, 05/01/29(A) | 1,500,000 | 1,359,030 | ||||||
| CORPORATE OBLIGATIONS — continued | ||||||||
| Face Amount | Value | |||||||
CONSUMER DISCRETIONARY — continued |
| |||||||
Howard University | ||||||||
2.416%, 10/01/24 | $ | 1,250,000 | $ | 1,212,692 | ||||
Lennar | ||||||||
5.250%, 06/01/26 | 1,500,000 | 1,549,900 | ||||||
Marriott International | ||||||||
4.650%, 12/01/28 | 1,500,000 | 1,476,226 | ||||||
Mattel | ||||||||
3.375%, 04/01/26(A) | 1,500,000 | 1,458,750 | ||||||
Mileage Plus Holdings | ||||||||
6.500%, 06/20/27(A) | 2,000,000 | 2,040,000 | ||||||
Prime Security Services Borrower | ||||||||
3.375%, 08/31/27(A) | 2,000,000 | 1,711,980 | ||||||
US Foods | ||||||||
6.250%, 04/15/25(A) | 1,500,000 | 1,541,250 | ||||||
XLIT | ||||||||
4.450%, 03/31/25 | 1,400,000 | 1,421,533 | ||||||
|
| |||||||
| 20,593,878 | ||||||||
|
| |||||||
CONSUMER STAPLES — 2.9% |
| |||||||
Albertsons | ||||||||
5.875%, 02/15/28(A) | 1,600,000 | 1,554,000 | ||||||
Barry Callebaut Services | ||||||||
5.500%, 06/15/23(A) | 2,000,000 | 2,032,395 | ||||||
CVS Pass-Through Trust | ||||||||
6.036%, 12/10/28 | 1,740,845 | 1,837,294 | ||||||
Darling Ingredients | ||||||||
5.250%, 04/15/27(A) | 1,000,000 | 1,000,000 | ||||||
Delta Air Lines | ||||||||
4.750%, 10/20/28(A) | 500,000 | 495,971 | ||||||
Ethiopian Leasing 2012 | ||||||||
2.566%, 08/14/26 | 755,571 | 739,430 | ||||||
Ferrellgas | ||||||||
5.375%, 04/01/26(A) | 2,000,000 | 1,810,000 | ||||||
Kraft Heinz Foods | ||||||||
3.000%, 06/01/26 | 1,388,000 | 1,328,197 | ||||||
Pilgrim’s Pride | ||||||||
5.875%, 09/30/27(A) | 1,000,000 | 1,007,305 | ||||||
Williams Scotsman International | ||||||||
4.625%, 08/15/28(A) | 1,800,000 | 1,703,610 | ||||||
YMCA of Greater New York | ||||||||
2.303%, 08/01/26 | 1,000,000 | 944,045 | ||||||
|
| |||||||
| 14,452,247 | ||||||||
|
| |||||||
ENERGY — 1.1% |
| |||||||
Cheniere Energy Partners | ||||||||
4.500%, 10/01/29 | 1,750,000 | 1,675,625 | ||||||
Continental Resources | ||||||||
3.800%, 06/01/24 | 980,000 | 981,646 | ||||||
2.268%, 11/15/26(A) | 500,000 | 456,765 | ||||||
The accompanying notes are an integral part of the financial statements.
16
CATHOLIC RESPONSIBLE INVESTMENTS OPPORTUNISTIC BOND FUND
APRIL 30, 2022 (Unaudited)
| CORPORATE OBLIGATIONS — continued | ||||||||
| Face Amount | Value | |||||||
ENERGY — continued |
| |||||||
Petroleos Mexicanos | ||||||||
7.690%, 01/23/50 | $ | 295,000 | $ | 231,132 | ||||
Southwestern Energy | ||||||||
5.375%, 03/15/30 | 1,500,000 | 1,481,025 | ||||||
Sunoco | ||||||||
4.500%, 05/15/29 | 1,000,000 | 899,230 | ||||||
|
| |||||||
| 5,725,423 | ||||||||
|
| |||||||
FINANCIALS — 16.7% |
| |||||||
AerCap Ireland Capital DAC | ||||||||
3.000%, 10/29/28 | 500,000 | 435,091 | ||||||
Ahold Lease Series 2001-A-2 Pass Through Trust | ||||||||
8.620%, 01/02/25 | 161,001 | 170,551 | ||||||
Allianz | ||||||||
3.200%, US Treas Yield Curve Rate T Note Const Mat 5 Yr + 2.165%(A)(B)(C) | 1,600,000 | 1,299,520 | ||||||
American Tower Trust #1 | ||||||||
3.652%, 03/23/28(A) | 2,125,000 | 2,096,347 | ||||||
Athene Global Funding | ||||||||
2.500%, 03/24/28(A) | 1,750,000 | 1,552,921 | ||||||
0.927%, U.S. SOFR + 0.700%, 05/24/24(A)(B) | 2,060,000 | 2,036,102 | ||||||
Banco Santander | ||||||||
4.750%, US Treas Yield Curve Rate T Note Const Mat 5 Yr + 3.753%(B)(C) | 2,000,000 | 1,766,638 | ||||||
Bank of America MTN | ||||||||
3.559%, ICE LIBOR USD 3 Month + 1.060%, 04/23/27(B) | 1,750,000 | 1,699,195 | ||||||
Bank of Montreal MTN | ||||||||
0.949%, SOFRINDX + 0.680%, 03/10/23(B) | 2,235,000 | 2,237,123 | ||||||
Bank of New Zealand | ||||||||
2.000%, 02/21/25(A) | 2,500,000 | 2,394,866 | ||||||
Bank of Nova Scotia | ||||||||
3.625%, US Treas Yield Curve Rate T Note Const Mat 5 Yr + 2.613%, 10/27/81(B) | 1,000,000 | 799,124 | ||||||
0.827%, SOFRINDX + 0.550%, 09/15/23(B) | 2,530,000 | 2,525,127 | ||||||
Banque Federative du Credit Mutuel | ||||||||
1.604%, 10/04/26(A) | 2,000,000 | 1,798,502 | ||||||
| CORPORATE OBLIGATIONS — continued | ||||||||
| Face Amount | Value | |||||||
FINANCIALS — continued |
| |||||||
BGC Partners | ||||||||
4.375%, 12/15/25 | $ | 1,750,000 | $ | 1,735,607 | ||||
Blue Owl Finance | ||||||||
3.125%, 06/10/31(A) | 845,000 | 678,065 | ||||||
BNP Paribas | ||||||||
4.625%, US Treas Yield Curve Rate T Note Const Mat 5 Yr + 3.340%(A)(B)(C) | 1,250,000 | 1,053,063 | ||||||
Canadian Imperial Bank of Commerce | ||||||||
1.093%, U.S. SOFR + 0.800%, 03/17/23(B) | 1,805,000 | 1,808,056 | ||||||
Cantor Fitzgerald | ||||||||
6.500%, 06/17/22(A) | 1,050,000 | 1,054,812 | ||||||
4.875%, 05/01/24(A) | 1,140,000 | 1,161,023 | ||||||
Capital One Financial | ||||||||
0.956%, U.S. SOFR + 0.690%, 12/06/24(B) | 2,320,000 | 2,311,810 | ||||||
CES MU2 | ||||||||
2.166%, 12/16/26 | 1,035,614 | 1,011,479 | ||||||
Citigroup | ||||||||
3.106%, U.S. SOFR + 2.842%, 04/08/26(B) | 1,000,000 | 968,558 | ||||||
Cloverie for Zurich Insurance MTN | ||||||||
5.625%, ICE LIBOR USD 3 Month + 4.918%, 06/24/46(B) | 1,550,000 | 1,580,269 | ||||||
Commonwealth Bank of Australia | ||||||||
0.696%, U.S. SOFR + 0.400%, 07/07/25(A)(B) | 2,700,000 | 2,676,197 | ||||||
Credit Agricole MTN | ||||||||
1.907%, U.S. SOFR + 1.676%, 06/16/26(A)(B) | 1,000,000 | 928,944 | ||||||
Deutsche Bank MTN | ||||||||
4.296%, USD Swap Semi 30/360 5 Yr Curr + 2.248%, 05/24/28(B) | 1,650,000 | 1,618,890 | ||||||
DY9 Leasing | ||||||||
2.372%, 03/19/27 | 1,486,662 | 1,457,359 | ||||||
Equitable Financial Life Global Funding | ||||||||
1.400%, 07/07/25(A) | 1,000,000 | 932,395 | ||||||
Federation des Caisses Desjardins du Quebec | ||||||||
2.050%, 02/10/25(A) | 1,500,000 | 1,429,731 | ||||||
Fort Benning Family Communities | ||||||||
0.904%, ICE LIBOR USD 1 Month + 0.350%, 01/15/36(A)(B) | 955,800 | 754,944 | ||||||
The accompanying notes are an integral part of the financial statements.
17
CATHOLIC RESPONSIBLE INVESTMENTS OPPORTUNISTIC BOND FUND
APRIL 30, 2022 (Unaudited)
| CORPORATE OBLIGATIONS — continued | ||||||||
| Face Amount | Value | |||||||
FINANCIALS — continued |
| |||||||
GA Global Funding Trust | ||||||||
1.625%, 01/15/26(A) | $ | 1,000,000 | $ | 912,832 | ||||
1.000%, 04/08/24(A) | 1,000,000 | 949,188 | ||||||
Goldman Sachs Group | ||||||||
4.250%, 10/21/25 | 1,750,000 | 1,752,814 | ||||||
3.650%, US Treas Yield Curve Rate T Note Const Mat 5 Yr + 2.915%(B)(C) | 2,000,000 | 1,735,000 | ||||||
Golub Capital BDC | ||||||||
2.500%, 08/24/26 | 960,000 | 856,239 | ||||||
HSBC Holdings | ||||||||
4.292%, ICE LIBOR USD 3 Month + 1.348%, 09/12/26(B) | 1,750,000 | 1,740,405 | ||||||
Jefferies Finance | ||||||||
5.000%, 08/15/28(A) | 875,000 | 796,259 | ||||||
John Hancock Life Insurance | ||||||||
7.375%, 02/15/24(A) | 1,500,000 | 1,598,003 | ||||||
JPMorgan Chase | ||||||||
3.559%, ICE LIBOR USD 3 Month + 0.730%, 04/23/24(B) | 2,000,000 | 2,001,742 | ||||||
Kansas City Southern | ||||||||
3.850%, 11/15/23 | 435,000 | 438,150 | ||||||
Liberty Mutual Insurance | ||||||||
7.875%, 10/15/26(A) | 1,250,000 | 1,435,507 | ||||||
Metropolitan Life Global Funding I MTN 0.866%, U.S. SOFR + 0.570%, 01/13/23(A)(B) | 1,235,000 | 1,236,124 | ||||||
Morgan Stanley MTN 5.000%, 11/24/25 | 1,750,000 | 1,797,583 | ||||||
MSCI 3.250%, 08/15/33(A) | 950,000 | 802,750 | ||||||
National Australia Bank 0.676%, U.S. SOFR + 0.380%, 01/12/25(A)(B) | 1,930,000 | 1,922,063 | ||||||
NatWest Group 6.000%, 12/19/23 | 1,500,000 | 1,540,863 | ||||||
Owl Rock Capital 2.625%, 01/15/27 | 2,580,000 | 2,275,530 | ||||||
Pershing Road Development 0.923%, ICE LIBOR USD 3 Month + 0.400%, 09/01/26(A)(B) | 878,138 | 843,013 | ||||||
Prudential Financial 5.700%, ICE LIBOR USD 3 Month + 2.665%, | 2,115,000 | 2,114,915 | ||||||
| CORPORATE OBLIGATIONS — continued | ||||||||
| Face Amount | Value | |||||||
FINANCIALS — continued |
| |||||||
Prudential Insurance of America 8.300%, 07/01/25(A) | $ | 800,000 | $ | 900,483 | ||||
Reliance Standard Life Global Funding II 2.500%, 10/30/24(A) | 1,000,000 | 973,850 | ||||||
SBA Tower Trust 2.836%, 01/15/25(A) | 2,250,000 | 2,184,436 | ||||||
Societe Generale 5.000%, 01/17/24(A) | 1,500,000 | 1,517,709 | ||||||
Swiss Re Treasury US 2.875%, 12/06/22(A) | 1,725,000 | 1,726,783 | ||||||
Truist Bank 2.636%, US Treas Yield Curve Rate T Note Const Mat 5 Yr + 1.150%, 09/17/29(B) | 2,000,000 | 1,937,110 | ||||||
TTX MTN 3.600%, 01/15/25(A) | 700,000 | 703,004 | ||||||
UBS Group 1.494%, US Treas Yield Curve Rate T Note Const Mat 5 Yr + 0.850%, 08/10/27(A)(B) | 950,000 | 843,515 | ||||||
Ulani MSN 35940 2.227%, 05/16/25 | 331,771 | 327,937 | ||||||
|
| |||||||
| 81,836,116 | ||||||||
|
| |||||||
INDUSTRIALS — 4.3% |
| |||||||
American Airlines Class A Pass Through Trust, Cl A 4.950%, 01/15/23 | 2,553,457 | 2,536,620 | ||||||
Carlisle 3.750%, 11/15/22 | 1,000,000 | 1,001,924 | ||||||
Caterpillar Financial Services MTN 0.357%, U.S. SOFR + 0.150%, 11/17/22(B) | 1,590,000 | 1,588,513 | ||||||
Clean Harbors 5.125%, 07/15/29(A) | 1,500,000 | 1,477,500 | ||||||
Delta Air Lines 4.500%, 10/20/25(A) | 1,500,000 | 1,490,420 | ||||||
JetBlue 2020-1 Class B Pass Through Trust 7.750%, 11/15/28 | 1,565,616 | 1,677,435 | ||||||
Lennox International 3.000%, 11/15/23 | 1,500,000 | 1,491,270 | ||||||
Protective Life Global Funding 1.170%, 07/15/25 | 1,425,000 | 1,313,895 | ||||||
The accompanying notes are an integral part of the financial statements.
18
CATHOLIC RESPONSIBLE INVESTMENTS OPPORTUNISTIC BOND FUND
APRIL 30, 2022 (Unaudited)
| CORPORATE OBLIGATIONS — continued | ||||||||
| Face Amount | Value | |||||||
INDUSTRIALS — continued |
| |||||||
Sensata Technologies 3.750%, 02/15/31(A) | $ | 1,475,000 | $ | 1,247,171 | ||||
Southwest Airlines 5.250%, 05/04/25 | 1,500,000 | 1,551,396 | ||||||
Spirit Airlines Pass Through Trust 2017-1A 3.650%, 02/15/30 | 1,016,908 | 922,507 | ||||||
Union Pacific Railroad 2005 Pass Through Trust 5.082%, 01/02/29 | 317,336 | 330,635 | ||||||
United Rentals North America 4.875%, 01/15/28 | 1,000,000 | 973,060 | ||||||
3.875%, 02/15/31 | 500,000 | 440,900 | ||||||
Vessel Management Services 5.125%, 04/16/35 | 1,083,000 | 1,174,897 | ||||||
Weir Group 2.200%, 05/13/26(A) | 1,000,000 | 905,533 | ||||||
Westinghouse Air Brake Technologies 3.200%, 06/15/25 | 1,075,000 | 1,038,967 | ||||||
|
| |||||||
| 21,162,643 | ||||||||
|
| |||||||
INFORMATION TECHNOLOGY — 1.6% |
| |||||||
Diebold Nixdorf 9.375%, 07/15/25(A) | 970,000 | 849,245 | ||||||
Infor 1.750%, 07/15/25(A) | 1,000,000 | 931,930 | ||||||
Kyndryl Holdings 2.050%, 10/15/26(A) | 1,000,000 | 873,518 | ||||||
Microchip Technology 4.250%, 09/01/25 | 1,500,000 | 1,488,250 | ||||||
Qorvo 4.375%, 10/15/29 | 1,500,000 | 1,393,575 | ||||||
TD SYNNEX 1.250%, 08/09/24(A) | 1,000,000 | 940,657 | ||||||
VMware 4.500%, 05/15/25 | 1,400,000 | 1,419,282 | ||||||
|
| |||||||
| 7,896,457 | ||||||||
|
| |||||||
MATERIALS — 1.0% |
| |||||||
Berry Global 4.875%, 07/15/26(A) | 1,500,000 | 1,490,775 | ||||||
Dow Chemical | ||||||||
7.375%, 03/01/23 | 600,000 | 620,886 | ||||||
International Flavors & Fragrances | ||||||||
1.832%, 10/15/27(A) | 1,500,000 | 1,323,067 | ||||||
Vulcan Materials | ||||||||
4.500%, 04/01/25 | 1,215,000 | 1,245,690 | ||||||
|
| |||||||
| 4,680,418 | ||||||||
|
| |||||||
| CORPORATE OBLIGATIONS — continued | ||||||||
| Face Amount | Value | |||||||
UTILITIES — 0.4% |
| |||||||
NRG Energy | ||||||||
3.875%, 02/15/32(A) | $ 2,000,000 | $ | 1,669,490 | |||||
|
| |||||||
Total Corporate Obligations | 170,826,435 | |||||||
| U.S. TREASURY OBLIGATIONS — 29.3% | ||||||||
| Face Amount | Value | |||||||
U.S. Treasury Notes | ||||||||
0.961%, US Treasury 3 Month Bill Money Market Yield + 0.049%, 01/31/23(B) | $13,180,000 | $ | 13,194,586 | |||||
0.947%, US Treasury 3 Month Bill Money Market Yield + 0.035%, 10/31/23(B) | 20,130,000 | 20,167,051 | ||||||
0.946%, US Treasury 3 Month Bill Money Market Yield + 0.034%, 04/30/23(B) | 3,190,000 | 3,193,872 | ||||||
0.941%, US Treasury 3 Month Bill Money Market Yield + 0.029%, 07/31/23(B) | 4,015,000 | 4,021,356 | ||||||
2.750%, 07/31/23 | 6,500,000 | 6,530,215 | ||||||
2.500%, 04/30/24 | 10,000,000 | 9,961,328 | ||||||
2.500%, 01/31/25 | 2,440,000 | 2,417,220 | ||||||
2.375%, 08/15/24 | 23,350,000 | 23,121,973 | ||||||
1.875%, 02/28/27 | 13,800,000 | 13,156,359 | ||||||
1.875%, 02/15/32 | 30,890,000 | 28,245,044 | ||||||
1.750%, 12/31/24 | 8,000,000 | 7,773,438 | ||||||
1.625%, 10/31/23 | 1,500,000 | 1,480,606 | ||||||
1.125%, 02/28/25 | 600,000 | 571,898 | ||||||
0.250%, 04/15/23 | 10,250,000 | 10,071,826 | ||||||
|
| |||||||
Total U.S. Treasury Obligations | 143,906,772 | |||||||
|
| |||||||
| ASSET-BACKED SECURITIES — 20.9% | ||||||||
| Face Amount | Value | |||||||
Automotive — 2.3% |
| |||||||
Carvana Auto Receivables Trust, Ser 2019-3A, Cl C | ||||||||
2.710%, 10/15/24 (A) | $ | 1,301,411 | $ | 1,302,473 | ||||
The accompanying notes are an integral part of the financial statements.
19
CATHOLIC RESPONSIBLE INVESTMENTS OPPORTUNISTIC BOND FUND
APRIL 30, 2022 (Unaudited)
| ASSET-BACKED SECURITIES — continued | ||||||||
| Face Amount | Value | |||||||
Carvana Auto Receivables Trust, Ser 2021-N2, Cl C | ||||||||
1.070%, 03/10/28 | $ | 1,000,000 | $ | 971,856 | ||||
Flagship Credit Auto Trust, Ser 2019-3, Cl E | ||||||||
3.840%, 12/15/26 (A) | 1,175,000 | 1,143,402 | ||||||
GM Financial Automobile Leasing Trust, Ser 2020-2, Cl C 2.560%, 07/22/24 | 2,260,000 | 2,248,871 | ||||||
GTE Auto Receivables Trust, Ser 2019-1, Cl A3 2.390%, 08/15/24 (A) | 360,945 | 360,666 | ||||||
Hertz Vehicle Financing III, Ser 2022-1A, Cl A 1.990%, 06/25/26 (A) | 1,000,000 | 945,623 | ||||||
Hertz Vehicle Financing, Ser 2021-1A, Cl B 1.560%, 12/26/25 (A) | 1,500,000 | 1,410,284 | ||||||
UNIFY Auto Receivables Trust, Ser 2021-1A, Cl C 1.440%, 04/15/27 (A) | 2,750,000 | 2,620,434 | ||||||
|
| |||||||
| 11,003,609 | ||||||||
|
| |||||||
Other Asset-Backed Securities — 18.6% |
| |||||||
Aligned Data Centers Issuer, Ser 2021-1A, Cl A2 1.937%, 08/15/46 (A) | 1,500,000 | — | ||||||
Amur Equipment Finance Receivables VII, Ser 2019-1A, Cl A2 2.630%, 06/20/24 (A) | 435,029 | 435,649 | ||||||
Aqua Finance Trust, Ser 2021-A, Cl A 1.540%, 07/17/46 (A) | 816,551 | 770,180 | ||||||
Avant Credit Card Master Trust, Ser 2021-1A, Cl A 1.370%, 04/15/27 (A) | 2,000,000 | 1,886,417 | ||||||
Bellemeade Re, Ser 2021-2A, Cl M1B 1.789%, SOFR30A + 1.500%, 06/25/31 (A)(B) | 1,500,000 | 1,464,435 | ||||||
Blackrock Rainier CLO VI, Ser 2021-6A, Cl A 2.763%, ICE LIBOR USD 3 Month + 1.700%, 04/20/33 (A)(B) | 1,500,000 | 1,486,947 | ||||||
Business Jet Securities, Ser 2021-1A, Cl A 2.162%, 04/15/36 (A) | 1,162,654 | 1,069,942 | ||||||
| ASSET-BACKED SECURITIES — continued | ||||||||
| Face Amount | Value | |||||||
BX Commercial Mortgage Trust, Ser 2021-VOLT, Cl C 1.654%, ICE LIBOR USD 1 Month + 1.100%, 09/15/36 (A)(B) | $ | 1,250,000 | $ | 1,207,336 | ||||
Cajun Global, Ser 2021-1, Cl A2 3.931%, 11/20/51 (A) | 1,494,375 | 1,396,120 | ||||||
CFCRE Commercial Mortgage Trust, Ser 2016-C7, Cl A3 3.839%, 12/10/54 | 1,750,000 | 1,738,862 | ||||||
Citigroup Commercial Mortgage Trust, Ser 2014-GC21, Cl AS 4.026%, 05/10/47 | 1,650,000 | — | ||||||
Citigroup Commercial Mortgage Trust, Ser 2014-GC25, Cl A4 3.635%, 10/10/47 | 750,000 | 747,268 | ||||||
CLI Funding VI, Ser 2020-1A, Cl A 2.080%, 09/18/45 (A) | 1,664,500 | 1,525,171 | ||||||
COMM Mortgage Trust, Ser 2020-CBM, Cl A2 2.896%, 02/10/37 (A) | 600,000 | 576,213 | ||||||
Commonbond Student Loan Trust, Ser 2021-AGS, Cl B 1.400%, 03/25/52 (A) | 742,907 | 692,254 | ||||||
CoreVest American Finance Trust, Ser 2020-3, Cl A 1.358%, 08/15/53 (A) | 682,593 | 616,095 | ||||||
Corevest American Finance Trust, Ser 2020-4, Cl A 1.174%, 12/15/52 (A) | 531,549 | 483,344 | ||||||
CSMC Trust, Ser 2017-MOON, Cl A 3.197%, 07/10/34 (A) | 1,500,000 | 1,498,112 | ||||||
DBCG Mortgage Trust, Ser 2017-BBG, Cl A 1.255%, ICE LIBOR USD 1 Month + 0.700%, 06/15/34 (A)(B) | 1,229,614 | 1,214,926 | ||||||
EDvestinU Private Education Loan Issue No. 1, Ser 2019-A, Cl A 3.580%, 11/25/38 (A) | 823,061 | 808,099 | ||||||
EDvestinU Private Education Loan Issue No. 3, Ser 2021-A, Cl A 1.800%, 11/25/45 (A) | 577,296 | 524,832 | ||||||
The accompanying notes are an integral part of the financial statements.
20
CATHOLIC RESPONSIBLE INVESTMENTS OPPORTUNISTIC BOND FUND
APRIL 30, 2022 (Unaudited)
| ASSET-BACKED SECURITIES — continued | ||||||||
| Face Amount | Value | |||||||
Extended Stay America Trust, Ser 2021-ESH, Cl B 1.935%, ICE LIBOR USD 1 Month + 1.380%, 07/15/38 (A)(B) | $ | 447,247 | $ | 441,112 | ||||
FirstKey HomesTrust, Ser 2020-SFR2, Cl A 1.266%, 10/19/37 (A) | 995,520 | 906,826 | ||||||
FREED ABS Trust, Ser 2022-2CP, Cl A 3.030%, 05/18/29 (A) | 2,000,000 | 1,994,042 | ||||||
Golub Capital Partners CLO 24M-R, Ser 2017-24A, Cl AR 1.915%, ICE LIBOR USD 3 Month + 1.600%, 11/05/29 (A)(B) | 1,600,000 | 1,592,848 | ||||||
GS Mortgage Securities Corportation Trust, Ser 2021-IP, Cl A 1.504%, ICE LIBOR USD 1 Month + 0.950%, 10/15/36 (A)(B) | 2,000,000 | 1,958,844 | ||||||
GS Mortgage Securities II, Ser 2012-BWTR, Cl A 2.954%, 11/05/34 (A) | 1,750,000 | 1,743,046 | ||||||
GS Mortgage Securities II, Ser 2013-GC10, Cl A4 2.681%, 02/10/46 | 1,789,673 | 1,791,330 | ||||||
GS Mortgage Securities Trust, Ser 2013-GC12, Cl A3 2.860%, 06/10/46 | 870,000 | 866,871 | ||||||
Guggenheim MM CLO, Ser 2021-3A, Cl A 2.648%, ICE LIBOR USD 3 Month + 1.550%, 01/21/34 (A)(B) | 2,000,000 | 1,976,628 | ||||||
Hardee’s Funding, Ser 2021-1A, Cl A2 2.865%, 06/20/51 (A) | 1,364,688 | 1,205,065 | ||||||
Home Equity Loan Trust, Ser 2006-HSA2, Cl AI3 4.787%, 03/25/36 (B) | 40,889 | 11,919 | ||||||
Hotwire Funding, 2.311%, 11/20/51 (A) | 1,000,000 | 917,322 | ||||||
HPLY Trust, Ser 2019-HIT, Cl B 1.904%, ICE LIBOR USD 1 Month + 1.350%, 11/15/36 (A)(B) | 1,163,853 | 1,143,247 | ||||||
| ASSET-BACKED SECURITIES — continued | ||||||||
| Face Amount | Value | |||||||
Issuer, Ser 2021-1, Cl A2 3.734%, 07/30/51 (A) | $ | 1,691,500 | $ | 1,467,686 | ||||
ITE Rail Fund Levered, Ser 2021-1A, Cl A 2.250%, 02/28/51 (A) | 1,185,509 | 1,074,884 | ||||||
ITE Rail Fund Levered, Ser 2021-3A, Cl A 2.210%, 06/28/51 (A) | 2,411,926 | 2,195,681 | ||||||
Jersey Mike’s Funding, Ser 2019-1A, Cl A2 4.433%, 02/15/50 (A) | 1,645,875 | 1,594,064 | ||||||
JP Morgan Chase Commercial Mortgage Securities Trust, Ser 2013-C10, Cl B 3.674%, 12/15/47 (B) | 3,900,000 | 3,891,124 | ||||||
Laurel Road Prime Student Loan Trust, Ser 2019-A, Cl A2FX 2.730%, 10/25/48 (A) | 553,914 | 548,868 | ||||||
Life Mortgage Trust, Ser 2021-BMR, Cl C 1.654%, ICE LIBOR USD 1 Month + 1.100%, 03/15/38 (A)(B) | 737,228 | 709,131 | ||||||
Maranon Loan Funding, Ser 2021-2RA, Cl A1R 2.734%, ICE LIBOR USD 3 Month + 1.690%, 07/15/33 (A)(B) | 1,750,000 | 1,745,275 | ||||||
Mariner Finance Issuance Trust, Ser 2021-AA, Cl A 1.860%, 03/20/36 (A) | 1,150,000 | 1,034,208 | ||||||
Massachusetts Educational Financing Authority, Ser 2020-A, Cl A 2.300%, 02/25/40 | 887,375 | 870,048 | ||||||
ME Funding, Ser 2019-1, Cl A2 6.448%, 07/30/49 (A) | 1,490,688 | 1,498,224 | ||||||
MHC Commercial Mortgage Trust, Ser 2021-MHC, Cl A 1.355%, ICE LIBOR USD 1 Month + 0.801%, 04/15/38 (A)(B) | 2,500,000 | 2,451,441 | ||||||
Morgan Stanley Bank of America Merrill Lynch Trust, Ser 2013-C9, Cl B 3.708%, 05/15/46 (B) | 1,700,000 | 1,687,089 | ||||||
The accompanying notes are an integral part of the financial statements.
21
CATHOLIC RESPONSIBLE INVESTMENTS OPPORTUNISTIC BOND FUND
APRIL 30, 2022 (Unaudited)
| ASSET-BACKED SECURITIES — continued | ||||||||
| Face Amount | Value | |||||||
Morgan Stanley Capital I Trust, Ser 2017-CLS, Cl A 1.254%, ICE LIBOR USD | $ | 1,200,000 | $ | 1,193,962 | ||||
Morgan Stanley Capital I Trust, Ser 2017-CLS, Cl B 1.404%, ICE LIBOR USD | 640,000 | 636,007 | ||||||
Motel Trust, Ser 2021-MTL6, Cl B 1.754%, ICE LIBOR USD 1 Month + 1.200%, 09/15/38 (A)(B) | 734,145 | 722,253 | ||||||
Navient Private Education Refi Loan Trust, Ser 2019-FA, Cl A2 2.600%, 08/15/68 (A) | 1,204,280 | 1,187,904 | ||||||
Navient Private Education Refi Loan Trust, Ser 2019-GA, Cl A 2.400%, 10/15/68 (A) | 385,230 | 376,972 | ||||||
Newday Funding Master Issuer, Ser 2021-1A, Cl A2 1.320%, U.S. SOFR + 1.100%, 03/15/29 (A)(B) | 2,000,000 | 1,996,646 | ||||||
Octane Receivables Trust, Ser 2021-2A, Cl A 1.210%, 09/20/28 (A) | 796,944 | 773,058 | ||||||
OnDeck Asset Securitization Trust III, Ser 2021-1A, Cl A 1.590%, 05/17/27 (A) | 1,250,000 | 1,187,629 | ||||||
One Market Plaza Trust, Ser 2017-1MKT, Cl A 3.614%, 02/10/32 (A) | 2,372,000 | 2,361,932 | ||||||
PFS Financing, Ser 2020-A, Cl A 1.270%, 06/15/25 (A) | 2,000,000 | 1,959,715 | ||||||
SBA Small Business Investment, Ser 2018-10A, Cl 1 3.187%, 03/10/28 | 642,406 | 625,154 | ||||||
SCF Equipment Leasing, Ser 2020-1A, Cl C 2.600%, 08/21/28 (A) | 1,000,000 | 964,398 | ||||||
Sequoia Mortgage Trust, Ser 2014-4, Cl A6 3.500%, 11/25/44 (A)(B) | 304,210 | 288,568 | ||||||
ServiceMaster Funding, Ser 2020-1, Cl A2I 2.841%, 01/30/51 (A) | 990,000 | 874,712 | ||||||
| ASSET-BACKED SECURITIES — continued | ||||||||
| Face Amount | Value | |||||||
SERVPRO Master Issuer, Ser 2019-1A, Cl A2 3.882%, 10/25/49 (A) | $ | 1,755,000 | $ | 1,685,335 | ||||
SOFI PROFESSIONAL LOAN PROGRAM, Ser 2017-F, Cl A2FX 2.840%, 01/25/41 (A) | 653,439 | 651,540 | ||||||
Summit Issuer, Ser 2020-1A, Cl A2 2.290%, 12/20/50 (A) | 1,250,000 | 1,144,073 | ||||||
TICP CLO XI, Ser 2018-11A, Cl E 7.063%, ICE LIBOR USD 3 MONTH + 6.000%, 10/20/31 (A)(B) | 700,000 | 675,933 | ||||||
Tricon American Homes, Ser 2020-SFR1, Cl A 1.499%, 07/17/38 (A) | 997,962 | 907,523 | ||||||
UBS-Barclays Commercial Mortgage Trust, Ser 2012-C4, Cl A5 2.850%, 12/10/45 | 435,000 | 435,409 | ||||||
United States Small Business Administration, Ser 2004-20C, Cl 1 4.340%, 03/01/24 | 276,191 | 275,100 | ||||||
United States Small Business Administration, Ser 2011-20D, Cl 1 4.050%, 04/01/31 | 463,798 | 457,254 | ||||||
United States Small Business Administration, Ser 2013-20D, Cl 1 2.080%, 04/01/33 | 311,276 | 293,421 | ||||||
VASA Trust, Ser 2021-VASA, Cl A 1.454%, ICE LIBOR USD 1 Month + 0.900%, 07/15/39 (A)(B) | 2,000,000 | 1,954,845 | ||||||
Wells Fargo Commercial Mortgage Trust, Ser 2016-LC24, Cl A4 2.942%, 10/15/49 | 1,500,000 | 1,443,809 | ||||||
Wells Fargo Commercial Mortgage Trust, Ser 2017-C40, Cl A4 3.581%, 10/15/50 | 1,500,000 | 1,470,419 | ||||||
WFRBS Commercial Mortgage Trust, Ser 2013-C15, Cl A4 4.153%, 08/15/46 (B) | 2,000,000 | 2,013,107 | ||||||
WFRBS Commercial Mortgage Trust, Ser 2013-C15, Cl B 4.654%, 08/15/46 (B) | 1,000,000 | 959,418 | ||||||
The accompanying notes are an integral part of the financial statements.
22
CATHOLIC RESPONSIBLE INVESTMENTS OPPORTUNISTIC BOND FUND
APRIL 30, 2022 (Unaudited)
| ASSET-BACKED SECURITIES — continued | ||||||||
| Face Amount | Value | |||||||
WFRBS Commercial Mortgage Trust, Ser 2014-C19, Cl B 4.723%, 03/15/47 (B) | $ | 2,093,258 | $ | 2,066,685 | ||||
World Financial Network Credit Card Master Trust, Ser 2019-B, Cl A 2.490%, 04/15/26 | 2,500,000 | 2,504,411 | ||||||
|
| |||||||
| 91,546,217 | ||||||||
|
| |||||||
Total Asset-Backed Securities | 102,549,826 | |||||||
|
| |||||||
| COMMON STOCK — 8.9% | ||||||||
| Shares | Value | |||||||
DIVERSIFIED — 8.7% |
| |||||||
Accelerate Acquisition | 42,000 | $ | 414,120 | |||||
African Gold Acquisition * | 44,000 | 436,040 | ||||||
Americas Technology Acquisition Corp * | 44,858 | 461,589 | ||||||
Anzu Special Acquisition I * | 89,148 | 886,131 | ||||||
Apollo Strategic Growth | 85,000 | 843,149 | ||||||
Arctos NorthStar Acquisition | 70,000 | 695,800 | ||||||
Ares Acquisition * | 90,000 | 891,000 | ||||||
Arrowroot Acquisition | 85,000 | 842,350 | ||||||
Atlas Crest Investment II * | 60,884 | 600,931 | ||||||
Austerlitz Acquisition II | 23,645 | 234,558 | ||||||
Authentic Equity Acquisition * | 87,451 | 871,012 | ||||||
B Riley Principal 250 Merger * | 7,000 | 69,370 | ||||||
Big Sky Growth Partners * | 6,870 | 68,013 | ||||||
Black Spade Acquisition * | 39,989 | 393,492 | ||||||
BlueRiver Acquisition | 25,245 | 249,895 | ||||||
BOA Acquisition | 50,000 | 498,500 | ||||||
Broadscale Acquisition | 75,000 | 749,250 | ||||||
Carney Technology | 50,000 | 497,500 | ||||||
CC Neuberger Principal Holdings II * | 34,325 | 349,085 | ||||||
CC Neuberger Principal Holdings III * | 45,630 | 453,106 | ||||||
CF Acquisition IV * | 78,100 | 776,314 | ||||||
Churchill Capital V * | 152,067 | 1,521,689 | ||||||
Churchill Capital VI * | 122,801 | 1,218,186 | ||||||
Churchill Capital VII | 122,801 | 1,215,730 | ||||||
Clarim Acquisition * | 88,000 | 870,320 | ||||||
Climate Real Impact Solutions II Acquisition * | 23,674 | 233,899 | ||||||
| COMMON STOCK — continued | ||||||||
| Shares | Value | |||||||
Cohn Robbins Holdings * | 9,706 | $ | 99,487 | |||||
Colonnade Acquisition II | 44,000 | 433,400 | ||||||
Compute Health Acquisition * | 20,000 | 198,200 | ||||||
Constellation Acquisition I | 57,908 | 576,185 | ||||||
Corner Growth Acquisition * | 2,329 | 23,080 | ||||||
D & Z Media Acquisition | 50,000 | 494,000 | ||||||
DILA Capital Acquisition * | 10,000 | 100,600 | ||||||
Edify Acquisition | 55,393 | 547,283 | ||||||
Equity Distribution | 100,350 | 1,002,497 | ||||||
Figure Acquisition I * | 6,871 | 68,229 | ||||||
Fortress Value | 12,766 | 126,830 | ||||||
FTAC Hera Acquisition * | 60,800 | 601,920 | ||||||
Fusion Acquisition II | 44,000 | 432,520 | ||||||
Gaming & Hospitality Acquisition | 44,000 | 435,600 | ||||||
Goal Acquisitions | 42,229 | 423,979 | ||||||
Golden Falcon Acquisition * | 88,000 | 873,840 | ||||||
Gores Holdings VII * | 15,000 | 148,650 | ||||||
Hamilton Lane Alliance | 44,001 | 436,930 | ||||||
Haymaker Acquisition III * | 119,980 | 1,203,399 | ||||||
Health Assurance | 48,172 | 480,275 | ||||||
Hudson Executive | 35,900 | 353,974 | ||||||
Hudson Executive | 50,000 | 493,250 | ||||||
Huttig Building Products * | 4,200 | 44,856 | ||||||
Jack Creek Investment * | 92,804 | 919,688 | ||||||
Jaws Mustang Acquisition * | 51,132 | 509,786 | ||||||
JOFF Fintech Acquisition | 60,000 | 591,000 | ||||||
Kadem Sustainable Impact | 50,450 | 499,455 | ||||||
Kernel Group Holdings | 53,171 | 527,988 | ||||||
Landcadia Holdings IV * | 21,100 | 215,853 | ||||||
Lazard Growth Acquisition I * | 36,058 | 356,253 | ||||||
Live Oak Mobility | 26,662 | 264,895 | ||||||
Marlin Technology * | 15,677 | 155,986 | ||||||
Mason Industrial | 50,000 | 494,000 | ||||||
New Vista Acquisition | 60,152 | 597,911 | ||||||
Newbury Street Acquisition * | 54,000 | 533,520 | ||||||
North Atlantic Acquisition | 58,023 | 583,131 | ||||||
North Mountain Merger * | 36,167 | 365,287 | ||||||
Peridot Acquisition II * | 44,000 | 435,600 | ||||||
Pontem * | 60,000 | 595,200 | ||||||
Powered Brands | 94,026 | 934,618 | ||||||
Priveterra Acquisition * | 50,000 | 495,500 | ||||||
Progress Acquisition | 50,000 | 498,500 | ||||||
The accompanying notes are an integral part of the financial statements.
23
CATHOLIC RESPONSIBLE INVESTMENTS OPPORTUNISTIC BOND FUND
APRIL 30, 2022 (Unaudited)
| COMMON STOCK — continued | ||||||||
| Shares | Value | |||||||
DIVERSIFIED — continued |
| |||||||
Property Solutions | 6,895 | 67,916 | ||||||
PropTech Investment II * | 44,000 | 437,800 | ||||||
Provident Acquisition * | 15,819 | 158,348 | ||||||
Recharge Acquisition * | 64,999 | 654,540 | ||||||
RMG Acquisition III * | 44,773 | 443,253 | ||||||
Ross Acquisition II * | 44,000 | 439,129 | ||||||
ScION Tech Growth I * | 47,026 | 466,028 | ||||||
ScION Tech Growth II | 21,675 | 214,366 | ||||||
SportsTek Acquisition | 65,896 | 652,370 | ||||||
Sustainable Development Acquisition I * | 43,466 | 430,313 | ||||||
Tailwind International Acquisition * | 50,215 | 496,124 | ||||||
TCW Special Purpose Acquisition | 90,000 | 891,900 | ||||||
Tekkorp Digital Acquisition * | 55,342 | 556,187 | ||||||
Thunder Bridge Capital Partners III * | 31,213 | 309,321 | ||||||
Tio Tech A * | 7,000 | 69,510 | ||||||
TZP Strategies Acquisition | 43,132 | 427,869 | ||||||
VectoIQ Acquisition II * | 12,953 | 128,753 | ||||||
Virgin Group Acquisition II * | 27,000 | 270,000 | ||||||
Z-Work Acquisition * | 25,901 | 256,420 | ||||||
|
| |||||||
| 42,884,331 | ||||||||
|
| |||||||
ENERGY — 0.1% | ||||||||
Blueknight Energy Partners | 43,100 | 196,536 | ||||||
|
| |||||||
FINANCIALS — 0.0% | ||||||||
Randolph Bancorp | 247 | 6,506 | ||||||
|
| |||||||
INDUSTRIALS — 0.0% | ||||||||
Cornerstone Building Brands * | 4,658 | 113,608 | ||||||
|
| |||||||
INFORMATION TECHNOLOGY — 0.1% |
| |||||||
Anaplan * | 3,500 | 227,465 | ||||||
Sailpoint Technologies Holdings * | 3,500 | 223,405 | ||||||
|
| |||||||
| 450,870 | ||||||||
|
| |||||||
Total Common Stock | 43,651,851 | |||||||
| MORTGAGE-BACKED SECURITIES — 2.8% | ||||||||
| Face Amount | Value | |||||||
Agency Mortgage-Backed Obligation — 1.2% |
| |||||||
FHLMC | ||||||||
6.000%, 03/01/23 | $ | 677 | $ | 681 | ||||
4.500%, 04/01/25 | 26,633 | 27,236 | ||||||
FHLMC, Ser 2014-4302, Cl AB 1.750%, 11/15/29 | 51,435 | 51,170 | ||||||
| MORTGAGE-BACKED SECURITIES — continued | ||||||||
| Face Amount | Value | |||||||
FHLMC, Ser 2016-4578, Cl CD 3.500%, 06/15/50 (B) | $ | 95,146 | $ | 94,894 | ||||
FHLMC, Ser 2019-4911, Cl HG 2.250%, 04/15/49 | 305,133 | 285,741 | ||||||
FNMA 4.500%, 05/01/31 | 93,682 | 95,613 | ||||||
4.000%, 02/01/45 | 431,300 | 436,622 | ||||||
4.000%, 03/01/31 | 55,925 | 56,154 | ||||||
2.726%, 06/01/23 (B) | 2,062,333 | 2,060,830 | ||||||
FNMA, Ser 2014-92, Cl BD 2.500%, 02/25/44 | 64,818 | 64,141 | ||||||
FREMF Mortgage Trust, Ser 2017-K61, Cl C 3.814%, 12/25/49 (A)(B) | 770,000 | 731,185 | ||||||
GNMA 2.140%, 08/15/23 | 237,688 | 237,321 | ||||||
GNMA, Ser 17, Cl AM 3.335%, 06/16/48 (B) | 175,260 | 174,774 | ||||||
GNMA, Ser 2014-4, Cl EC 2.000%, 03/16/26 | 116,477 | 115,524 | ||||||
GNMA, Ser 2017-153, Cl WA 4.696%, 06/20/36 (B) | 430,130 | 444,201 | ||||||
GNMA, Ser 27, Cl A 1.614%, 07/16/39 | 40,120 | 40,014 | ||||||
GNMA, Ser 51, Cl AB 2.350%, 04/16/57 | 420,589 | 415,659 | ||||||
GNMA, Ser 59, Cl PA 2.750%, 06/16/56 | 592,604 | 560,706 | ||||||
|
| |||||||
| 5,892,466 | ||||||||
|
| |||||||
Non-Agency Mortgage-Backed Obligation — 1.6% |
| |||||||
Connecticut Avenue Securities Trust, Ser 2018-R07, Cl 1M2 3.068%, ICE LIBOR USD 1 MONTH + 2.400%, 04/25/31 (A)(B) | 191,369 | 191,369 | ||||||
CSMC Trust, Ser 2016-NXSR, Cl AS 4.049%, 12/15/49 (B) | 1,455,000 | 1,441,066 | ||||||
GS Mortgage Securities II, Ser GC10, Cl B 3.682%, 02/10/46 (A) | 2,465,000 | 2,460,002 | ||||||
JPMBB Commercial Mortgage Securities Trust, Ser 2014-C26, Cl AS 3.800%, 01/15/48 | 2,089,000 | 2,064,416 | ||||||
Residential Mortgage Loan Trust, Ser 2019-3, Cl A1 2.633%, 09/25/59 (A)(B) | 293,863 | 288,227 | ||||||
The accompanying notes are an integral part of the financial statements.
24
CATHOLIC RESPONSIBLE INVESTMENTS OPPORTUNISTIC BOND FUND
APRIL 30, 2022 (Unaudited)
| MORTGAGE-BACKED SECURITIES — continued | ||||||||
| Face Amount | Value | |||||||
SBA 1.125%, Prime Rate + -2.375%, 04/25/29 (B) | $ | 346,870 | $ | 353,946 | ||||
1.000%, Prime Rate + -2.500%, 04/25/28 (B) | 86,318 | 87,633 | ||||||
0.880%, Prime Rate + -2.620%, 05/25/31 (B) | 139,678 | 141,334 | ||||||
Wells Fargo Commercial Mortgage Trust, Ser 2019-C49, Cl D 3.000%, 03/15/52 (A) | 950,000 | 757,638 | ||||||
|
| |||||||
| 7,785,631 | ||||||||
|
| |||||||
Total Mortgage-Backed Securities | ||||||||
(Cost $14,161,189) | 13,678,097 | |||||||
| MUNICIPAL BONDS — 1.4% | ||||||||
| Face Amount | Value | |||||||
Florida — 0.2% | ||||||||
Sumter Landing Community Development District, RB 3.282%, 10/01/26 | $ | 1,250,000 | $ | 1,234,719 | ||||
Guam — 0.2% | ||||||||
Antonio B Won Pat International Airport Authority, Ser B, RB 3.133%, 10/01/24 | 1,000,000 | 991,141 | ||||||
|
| |||||||
| 991,141 | ||||||||
|
| |||||||
New Jersey — 0.2% | ||||||||
New Jersey State, Transportation Trust Fund Authority, RB 2.551%, 06/15/23 | 1,250,000 | 1,242,979 | ||||||
|
| |||||||
New York — 0.2% | ||||||||
New York State, Transportation Development, RB 1.610%, 12/01/22 | 825,000 | 821,947 | ||||||
|
| |||||||
Ohio — 0.2% | ||||||||
City of Cleveland Ohio Airport System Revenue, Ser A, RB 2.309%, 01/01/24 | 1,000,000 | 986,164 | ||||||
|
| |||||||
Pennsylvania — 0.3% | ||||||||
School District of Philadelphia, GO 3.738%, 09/01/23 | 1,275,000 | 1,279,095 | ||||||
|
| |||||||
| MUNICIPAL BONDS — continued | ||||||||
| Face Amount | Value | |||||||
Texas — 0.1% | ||||||||
Tarrant County Cultural Education Facilities Finance, RB 1.356%, 09/01/24 | $ | 500,000 | $ | 480,244 | ||||
|
| |||||||
Total Municipal Bonds | 7,036,289 | |||||||
|
| |||||||
| U.S. GOVERNMENT AGENCY OBLIGATIONS — 0.5% | ||||||||
| Face Amount | Value | |||||||
Export-Import Bank of the United States 2.702%, 08/20/26 | $ | 1,127,175 | $ | 1,115,780 | ||||
1.900%, 07/12/24 | 487,409 | 481,793 | ||||||
1.822%, 05/03/25 | 554,718 | 543,342 | ||||||
|
| |||||||
Total U.S. Government Agency Obligations | 2,140,915 | |||||||
|
| |||||||
| PREFERRED STOCK — 0.0% | ||||||||
| Shares | Value | |||||||
CONSUMER DISCRETIONARY — 0.0% |
| |||||||
Franchise Group, 7.500%, (C) | 4,450 | $ 110,582 | ||||||
|
| |||||||
Total Preferred Stock | 110,582 | |||||||
|
| |||||||
| RIGHTS — 0.0% | ||||||||
| Number Of Rights | ||||||||
Media General* | 39,120 | $ — | ||||||
|
| |||||||
Total Rights | — | |||||||
|
| |||||||
Total Investments in Securities — 98.6% | $ 483,900,767 | |||||||
|
| |||||||
Percentages are based on Net Assets of $490,671,691.
| * | Non-income producing security. |
| (A) | Securities sold within the terms of a private placement memorandum, exempt from registration under section 144A of the Securities Act of 1933, as amended, and maybe sold only to dealers in the program or other |
The accompanying notes are an integral part of the financial statements.
25
CATHOLIC RESPONSIBLE INVESTMENTS OPPORTUNISTIC BOND FUND
APRIL 30, 2022 (Unaudited)
| “accredited investors”. The total value of these securities at April 30, 2022 was $161,954,245 and represented 33.0% of Net Assets. |
| (B) | Variable or floating rate security. The rate shown is the effective interest rate as of period end. The rates for certain securities are not based on published reference rates and spreads and are either determined by the issuer or agent based on current market conditions; by using a formula based on the rates of underlying loans; or by adjusting periodically based on prevailing interest rates. |
| (C) | Perpetual security with no stated maturity date. |
| Cl — Class |
| CLO — Collateralized Loan Obligation |
| DAC — Designated Activity Company |
| FHLMC — Federal Home Loan Mortgage Corporation |
| FNMA — Federal National Mortgage Association |
| FREMF— Freddie Mac Multi-Family |
| GNMA — Government National Mortgage Association |
| GO — General Obligation |
| ICE — Intercontinental Exchange |
| LIBOR — London Interbank Offered Rate |
| MTN — Medium Term Note |
| RB — Revenue Bond |
| Ser — Series |
| SOFR — Secured Overnight Financing Rate |
| SOFR30A — Secured Overnight Financing Rate 30-day Average |
| SOFRINDX — Secured Overnight Financing Rate Index |
| USD — U.S. Dollar |
The following is a list of the inputs used as of April 30, 2022, in valuing the Fund’s investments carried at value:
| Investments in Securities | Level 1 | Level 2 | Level 3 | Total | ||||||||||||
Corporate Obligations | $ | — | $ | 170,826,435 | $ | — | $ | 170,826,435 | ||||||||
U.S. Treasury Obligations | 23,121,973 | 120,784,799 | — | 143,906,772 | ||||||||||||
Asset-Backed Securities | — | 102,549,826 | — | 102,549,826 | ||||||||||||
Common Stock | 43,651,851 | — | — | 43,651,851 | ||||||||||||
Mortgage-Backed Securities | — | 13,678,097 | — | 13,678,097 | ||||||||||||
Municipal Bonds | — | 7,036,289 | — | 7,036,289 | ||||||||||||
U.S. Government Agency Obligations | — | 2,140,915 | — | 2,140,915 | ||||||||||||
Preferred Stock | — | 110,582 | — | 110,582 | ||||||||||||
Rights | — | — | — | — | ||||||||||||
|
|
|
|
|
|
|
| |||||||||
Total Investments in Securities | $ | 66,773,824 | $ | 417,126,943 | $ | — | $ | 483,900,767 | ||||||||
|
|
|
|
|
|
|
| |||||||||
Amounts designated as “–” are $0.
For more information on valuation inputs, see Note 2 — Significant Accounting Policies in the Notes to Financial Statements.
The accompanying notes are an integral part of the financial statements.
26
CATHOLIC RESPONSIBLE INVESTMENTS BOND FUND
APRIL 30, 2022 (Unaudited)
| SECTOR WEIGHTINGS† | ||||
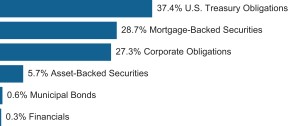
| † | Percentages are based on total investments. Total investments do not include derivatives such as options, futures contracts, forward contracts, and swap contracts, if applicable. |
| SCHEDULE OF INVESTMENTS | ||||||||
| U.S. TREASURY OBLIGATIONS — 36.9% | ||||||||
| Face Amount | Value | |||||||
U.S. Treasury Bond | ||||||||
3.000%, 02/15/49 | $ | 985,000 | $ | 981,614 | ||||
2.500%, 02/15/45 | 30,190,000 | 26,812,494 | ||||||
2.500%, 02/15/46 | 1,775,000 | 1,579,889 | ||||||
2.375%, 11/15/49 | 395,000 | 348,881 | ||||||
2.375%, 05/15/51 | 760,000 | 672,125 | ||||||
2.000%, 11/15/41 | 1,305,000 | 1,082,946 | ||||||
2.000%, 02/15/50 | 4,745,000 | 3,846,601 | ||||||
2.000%, 08/15/51 | 12,840,000 | 10,424,475 | ||||||
1.875%, 02/15/41 | 9,465,000 | 7,748,359 | ||||||
1.875%, 02/15/51 | 290,000 | 228,375 | ||||||
1.875%, 11/15/51 | 74,045,000 | 58,333,577 | ||||||
1.750%, 08/15/41 | 6,400,000 | 5,085,000 | ||||||
1.625%, 11/15/50 | 4,240,000 | 3,131,472 | ||||||
1.375%, 11/15/40 | 2,265,000 | 1,699,635 | ||||||
1.375%, 08/15/50 | 5,080,000 | 3,513,534 | ||||||
1.250%, 05/15/50 | 505,000 | 338,350 | ||||||
1.125%, 05/15/40 | 605,000 | 437,254 | ||||||
1.125%, 08/15/40 | 3,550,000 | 2,552,810 | ||||||
U.S. Treasury Note | ||||||||
2.625%, 02/15/29 | 33,850,000 | 33,192,834 | ||||||
2.375%, 03/31/29 | 10,190,000 | 9,833,350 | ||||||
1.875%, 02/15/32 | 81,135,000 | 74,187,816 | ||||||
1.750%, 12/31/26 | 3,240,000 | 3,074,330 | ||||||
1.625%, 05/15/31 | 21,585,000 | 19,425,657 | ||||||
1.500%, 01/31/27 | 4,325,000 | 4,052,322 | ||||||
1.375%, 10/31/28 | 8,090,000 | 7,336,619 | ||||||
1.375%, 12/31/28 | 4,005,000 | 3,627,341 | ||||||
1.375%, 11/15/31 | 13,115,000 | 11,469,477 | ||||||
1.250%, 11/30/26 | 19,000,000 | 17,643,281 | ||||||
1.250%, 08/15/31 | 9,530,000 | 8,264,297 | ||||||
1.125%, 10/31/26 | 2,805,000 | 2,591,667 | ||||||
1.125%, 02/29/28 | 4,320,000 | 3,901,500 | ||||||
1.125%, 02/15/31 | 3,995,000 | 3,451,774 | ||||||
| U.S. TREASURY OBLIGATIONS — continued | ||||||||
| Face Amount | Value | |||||||
0.875%, 06/30/26 | $ | 19,905,000 | $ | 18,304,047 | ||||
0.875%, 09/30/26 | 107,950,000 | 98,770,033 | ||||||
0.875%, 11/15/30 | 16,029,000 | 13,598,979 | ||||||
0.750%, 03/31/26 | 1,595,000 | 1,466,777 | ||||||
0.750%, 04/30/26 | 14,082,000 | 12,928,486 | ||||||
0.750%, 08/31/26 | 2,607,000 | 2,376,443 | ||||||
0.750%, 01/31/28 | 20,150,000 | 17,811,498 | ||||||
0.625%, 11/30/27 | 8,280,000 | 7,295,456 | ||||||
0.625%, 12/31/27 | 7,560,000 | 6,647,780 | ||||||
0.625%, 08/15/30 | 270,000 | 225,028 | ||||||
0.500%, 04/30/27 | 5,430,000 | 4,820,822 | ||||||
0.500%, 05/31/27 | 1,100,000 | 974,059 | ||||||
0.500%, 08/31/27 | 9,175,000 | 8,073,642 | ||||||
0.375%, 10/31/23 | 7,395,000 | 7,163,617 | ||||||
0.375%, 11/30/25 | 625,000 | 570,996 | ||||||
0.250%, 09/30/25 | 380,000 | 347,210 | ||||||
0.250%, 10/31/25 | 245,000 | 223,361 | ||||||
0.947%, US Treasury 3 Month Bill Money Market Yield + 0.035%, 10/31/23(A) | 37,460,000 | 37,528,948 | ||||||
0.941%, US Treasury 3 Month Bill Money Market Yield + 0.029%, 07/31/23(A) | 39,010,000 | 39,071,750 | ||||||
|
| |||||||
Total U.S. Treasury Obligations | 609,068,588 | |||||||
|
| |||||||
| MORTGAGE-BACKED SECURITIES — 28.3% | ||||||||
| Face Amount | Value | |||||||
Agency Mortgage-Backed Obligation — 22.2% |
| |||||||
FHLMC | ||||||||
7.000%, 11/01/32 | $ | 234,931 | $ | 253,305 | ||||
7.000%, 10/01/32 | 7,523 | 8,167 | ||||||
7.000%, 07/01/32 | 3,221 | 3,546 | ||||||
7.000%, 06/01/32 | 57,371 | 63,095 | ||||||
6.500%, 01/01/38 | 862 | 941 | ||||||
6.500%, 09/01/37 | 22,742 | 24,621 | ||||||
6.500%, 08/01/37 | 2,185 | 2,324 | ||||||
6.500%, 12/01/32 | 63,156 | 68,361 | ||||||
6.500%, 12/01/31 | 2,479 | 2,663 | ||||||
6.000%, 05/01/39 | 45,612 | 49,955 | ||||||
6.000%, 02/01/39 | 17,948 | 19,473 | ||||||
6.000%, 09/01/38 | 11,999 | 13,188 | ||||||
6.000%, 06/01/38 | 3,291 | 3,376 | ||||||
6.000%, 11/01/36 | 6,433 | 6,922 | ||||||
6.000%, 12/01/33 | 12,807 | 14,042 | ||||||
The accompanying notes are an integral part of the financial statements.
27
CATHOLIC RESPONSIBLE INVESTMENTS BOND FUND
APRIL 30, 2022 (Unaudited)
| MORTGAGE-BACKED SECURITIES — continued | ||||||||
| Face Amount | Value | |||||||
6.000%, 01/01/24 | $ | 18,085 | $ | 18,419 | ||||
5.500%, 06/01/37 | 826 | 865 | ||||||
5.500%, 01/01/35 | 75,454 | 80,324 | ||||||
5.000%, 04/01/34 | 9,091 | 9,493 | ||||||
4.500%, 09/01/48 | 685,744 | 703,261 | ||||||
4.500%, 03/01/47 | 961,688 | 996,479 | ||||||
4.500%, 11/01/45 | 372,022 | 386,598 | ||||||
4.500%, 02/01/45 | 1,212,490 | 1,255,147 | ||||||
4.500%, 08/01/44 | 960,941 | 1,001,534 | ||||||
4.500%, 07/01/44 | 324,180 | 336,902 | ||||||
4.500%, 03/01/44 | 12,225 | 12,685 | ||||||
4.500%, 01/01/44 | 102,482 | 106,464 | ||||||
4.500%, 12/01/43 | 100,696 | 104,252 | ||||||
4.500%, 11/01/43 | 13,151 | 13,809 | ||||||
4.500%, 09/01/41 | 299,050 | 312,008 | ||||||
4.500%, 07/01/41 | 12,170 | 12,707 | ||||||
4.500%, 12/01/33 | 23,932 | 24,487 | ||||||
4.500%, 06/01/31 | 23,627 | 24,133 | ||||||
4.500%, 06/01/26 | 5,484 | 5,605 | ||||||
4.500%, 02/01/26 | 7,585 | 7,803 | ||||||
4.000%, 01/01/52 | 1,310,110 | 1,309,069 | ||||||
4.000%, 05/01/46 | 1,532,987 | 1,549,088 | ||||||
4.000%, 07/01/34 | 78,492 | 79,841 | ||||||
4.000%, 10/01/31 | 48,355 | 48,676 | ||||||
3.500%, 04/01/52 | 4,698,795 | 4,571,537 | ||||||
3.500%, 02/01/52 | 1,821,821 | 1,772,613 | ||||||
3.500%, 01/01/52 | 1,743,608 | 1,697,719 | ||||||
3.500%, 04/01/37 | 727,993 | 721,137 | ||||||
3.005%, ICE LIBOR USD 12 MONTH + 1.630%, 05/01/44 (A) | 7,487 | 7,679 | ||||||
3.000%, 11/01/51 | 3,318,323 | 3,144,996 | ||||||
3.000%, 07/01/51 | 1,990,482 | 1,885,826 | ||||||
3.000%, 02/01/50 | 1,559,159 | 1,479,819 | ||||||
3.000%, 04/01/42 | 2,252,225 | 2,159,376 | ||||||
2.893%, ICE LIBOR USD 12 MONTH + 1.650%, 04/01/43 (A) | 51,636 | 53,074 | ||||||
2.751%, ICE LIBOR USD 12 MONTH + 1.622%, 12/01/45 (A) | 363,897 | 372,971 | ||||||
2.500%, 02/01/51 | 4,149,714 | 3,805,425 | ||||||
2.500%, 11/01/50 | 7,611,826 | 6,973,666 | ||||||
2.500%, 10/01/50 | 6,087,111 | 5,582,440 | ||||||
2.500%, 07/01/50 | 8,245,645 | 7,554,345 | ||||||
2.500%, 03/01/37 | 1,427,651 | 1,371,147 | ||||||
2.397%, ICE LIBOR USD 12 MONTH + 1.704%, 04/01/38 (A) | 99,779 | 102,976 | ||||||
2.232%, ICE LIBOR USD 12 MONTH + 1.807%, 10/01/41 (A) | 12,793 | 13,206 | ||||||
| MORTGAGE-BACKED SECURITIES — continued | ||||||||
| Face Amount | Value | |||||||
2.142%, ICE LIBOR USD 12 MONTH + 1.878%, 01/01/42 (A) | $ | 42,436 | $ | 43,857 | ||||
2.127%, ICE LIBOR USD 12 MONTH + 1.758%, 11/01/39 (A) | 107,213 | 111,060 | ||||||
2.115%, ICE LIBOR USD 12 MONTH + 1.791%, 08/01/42 (A) | 3,372 | 3,472 | ||||||
2.094%, ICE LIBOR USD 12 MONTH + 1.651%, 08/01/44 (A) | 486,788 | 497,604 | ||||||
2.012%, ICE LIBOR USD 12 MONTH + 1.630%, 02/01/45 (A) | 18,669 | 18,991 | ||||||
2.000%, 01/01/52 | 1,410,925 | 1,249,146 | ||||||
2.000%, 12/01/50 | 5,923,487 | 5,254,039 | ||||||
2.000%, 11/01/50 | 1,330,301 | 1,180,141 | ||||||
2.000%, 09/01/50 | 3,242,550 | 2,874,526 | ||||||
2.000%, 07/01/50 | 9,772,169 | 8,675,088 | ||||||
2.000%, 02/01/42 | 1,706,584 | 1,532,724 | ||||||
1.987%, ICE LIBOR USD 12 MONTH + 1.630%, 02/01/45 (A) | 146,354 | 148,822 | ||||||
1.906%, ICE LIBOR USD 12 MONTH + 1.630%, 01/01/45 (A) | 383,916 | 390,488 | ||||||
1.892%, ICE LIBOR USD 12 MONTH + 1.607%, 11/01/44 (A) | 770,522 | 788,700 | ||||||
1.880%, ICE LIBOR USD 12 MONTH + 1.630%, 12/01/44 (A) | 38,472 | 39,132 | ||||||
1.880%, ICE LIBOR USD 12 MONTH + 1.630%, 07/01/44 (A) | 55,714 | 57,252 | ||||||
1.876%, ICE LIBOR USD 12 MONTH + 1.610%, 10/01/44 (A) | 45,886 | 47,052 | ||||||
1.876%, ICE LIBOR USD 12 MONTH + 1.613%, 01/01/44 (A) | 28,917 | 29,453 | ||||||
FHLMC STACR REMIC Trust 2021-DNA3, Ser 2021-DNA3, Cl M2 2.389%, SOFR30A + 2.100%, 10/25/33 (A),(B) | 815,000 | 793,573 | ||||||
FHLMC STACR REMIC Trust 2021-DNA6, Ser 2021-DNA6, Cl M2 1.789%, SOFR30A + 1.500%, 10/25/41 (A),(B) | 1,975,000 | 1,903,933 | ||||||
The accompanying notes are an integral part of the financial statements.
28
CATHOLIC RESPONSIBLE INVESTMENTS BOND FUND
APRIL 30, 2022 (Unaudited)
| MORTGAGE-BACKED SECURITIES — continued | ||||||||
| Face Amount | Value | |||||||
FHLMC Structured Pass-Through Certificates, Ser 2002-41, Cl 2A 4.851%, 07/25/32 (A) | $ | 23,538 | $ | 23,489 | ||||
FHLMC Structured Pass-Through Certificates, Ser 2002-48, Cl 1A 4.494%, 07/25/33 (A) | 210,770 | 210,863 | ||||||
FHLMC Structured Pass-Through Certificates, Ser 2002-51, Cl 1A 6.500%, 09/25/43 (A) | 74,084 | 83,145 | ||||||
FHLMC Structured Pass-Through Certificates, Ser 2002-51, Cl 2A 7.500%, 08/25/42 (A) | 4,295 | 4,657 | ||||||
FHLMC Structured Pass-Through Certificates, Ser 2003-54, Cl 3A 7.000%, 02/25/43 | 373,224 | 402,405 | ||||||
FHLMC Structured Pass-Through Certificates, Ser 2003-57, Cl 1A2 7.000%, 07/25/43 | 23,044 | 25,621 | ||||||
FHLMC, Ser 1998-2084, Cl ZC 6.500%, 08/15/28 | 59,941 | 63,575 | ||||||
FHLMC, Ser 2001-2295, Cl BD 6.000%, 03/15/31 | 13,528 | 14,410 | ||||||
FHLMC, Ser 2003-2676, Cl PZ 5.500%, 09/15/33 | 52,334 | 55,323 | ||||||
FHLMC, Ser 2005-2944, Cl OH 5.500%, 03/15/35 | 180,275 | 193,468 | ||||||
FHLMC, Ser 2005-2957, Cl VZ 5.000%, 02/15/35 | 52,398 | 54,883 | ||||||
FHLMC, Ser 2006-3143, Cl BC 5.500%, 02/15/36 | 147,484 | 158,239 | ||||||
FHLMC, Ser 2006-3185, Cl GT 6.000%, 07/15/26 | 54,427 | 56,784 | ||||||
FHLMC, Ser 2007-3330, Cl GZ 5.500%, 06/15/37 | 2,763 | 2,871 | ||||||
FHLMC, Ser 2013-299, Cl F1 1.054%, ICE LIBOR USD 1 MONTH + 0.500%, 01/15/43 (A) | 189,116 | 188,059 | ||||||
| MORTGAGE-BACKED SECURITIES — continued | ||||||||
| Face Amount | Value | |||||||
FHLMC, Ser 2013-4283, Cl EW 4.500%, 12/15/43 (A) | $ | 140,559 | $ | 141,208 | ||||
FHLMC, Ser 2014-4319, Cl MA 4.500%, 03/15/44 (A) | 248,199 | 252,291 | ||||||
FHLMC, Ser 2021-5092, Cl BC 2.500%, 06/25/36 | 580,384 | 574,258 | ||||||
FNMA | ||||||||
7.000%, 12/01/37 | 332 | 362 | ||||||
7.000%, 08/01/32 | 136,626 | 147,444 | ||||||
7.000%, 11/01/29 | 44,167 | 47,184 | ||||||
6.500%, 01/01/49 | 1,595 | 1,731 | ||||||
6.500%, 10/01/39 | 48,952 | 53,118 | ||||||
6.500%, 08/01/39 | 11,614 | 12,716 | ||||||
6.500%, 10/01/38 | 16,601 | 18,084 | ||||||
6.500%, 03/01/38 | 5,910 | 6,291 | ||||||
6.500%, 02/01/38 | 1,005 | 1,096 | ||||||
6.500%, 12/01/37 | 1,246 | 1,360 | ||||||
6.500%, 11/01/37 | 1,180 | 1,285 | ||||||
6.500%, 03/01/35 | 179,367 | 193,135 | ||||||
6.500%, 05/01/33 | 3,111 | 3,311 | ||||||
6.500%, 12/01/32 | 11,399 | 12,263 | ||||||
6.500%, 08/01/32 | 26,414 | 28,165 | ||||||
6.000%, 05/01/38 | 39,577 | 43,767 | ||||||
6.000%, 08/01/37 | 14,713 | 15,801 | ||||||
6.000%, 03/01/37 | 12,376 | 13,512 | ||||||
6.000%, 09/01/36 | 81,587 | 89,298 | ||||||
6.000%, 03/01/36 | 11,140 | 12,184 | ||||||
6.000%, 11/01/35 | 14,588 | 15,907 | ||||||
6.000%, 07/01/35 | 2,689 | 2,889 | ||||||
6.000%, 04/01/35 | 20,724 | 22,488 | ||||||
6.000%, 04/01/34 | 15,305 | 16,636 | ||||||
6.000%, 03/01/34 | 216,797 | 235,138 | ||||||
6.000%, 12/01/33 | 4,082 | 4,467 | ||||||
6.000%, 11/01/33 | 4,296 | 4,707 | ||||||
6.000%, 12/01/32 | 5,270 | 5,687 | ||||||
6.000%, 06/01/23 | 975 | 984 | ||||||
6.000%, 10/01/22 | 120 | 120 | ||||||
5.500%, 02/01/38 | 3,091 | 3,252 | ||||||
5.500%, 04/01/37 | 100,465 | 106,835 | ||||||
5.500%, 09/01/36 | 11,947 | 12,710 | ||||||
5.500%, 10/01/35 | 60,751 | 64,351 | ||||||
5.500%, 04/01/35 | 198,322 | 210,947 | ||||||
5.500%, 11/01/33 | 7,693 | 8,185 | ||||||
5.500%, 06/01/33 | 11,990 | 12,753 | ||||||
5.500%, 11/01/29 | 8,736 | 9,169 | ||||||
5.500%, 01/01/25 | 4,268 | 4,323 | ||||||
5.500%, 05/01/24 | 945 | 959 | ||||||
5.500%, 03/01/24 | 720 | 729 | ||||||
The accompanying notes are an integral part of the financial statements.
29
CATHOLIC RESPONSIBLE INVESTMENTS BOND FUND
APRIL 30, 2022 (Unaudited)
| MORTGAGE-BACKED SECURITIES — continued | ||||||||
| Face Amount | Value | |||||||
5.500%, 01/01/24 | $ | 57 | $ | 56 | ||||
5.500%, 11/01/23 | 39 | 39 | ||||||
5.000%, 03/01/49 | 439,407 | 455,016 | ||||||
5.000%, 12/01/48 | 301,773 | 315,029 | ||||||
5.000%, 08/01/40 | 16,743 | 17,827 | ||||||
5.000%, 09/01/39 | 52,840 | 56,068 | ||||||
5.000%, 09/01/25 | 25,267 | 25,738 | ||||||
5.000%, 04/01/25 | 200 | 204 | ||||||
4.500%, 03/01/52 | 812,416 | 834,585 | ||||||
4.500%, 06/01/48 | 494,982 | 506,768 | ||||||
4.500%, 02/01/46 | 1,054,878 | 1,100,125 | ||||||
4.500%, 02/01/45 | 477,150 | 498,199 | ||||||
4.500%, 10/01/44 | 29,799 | 31,035 | ||||||
4.500%, 09/01/43 | 9,947 | 10,320 | ||||||
4.500%, 01/01/43 | 904,068 | 934,700 | ||||||
4.500%, 07/01/42 | 227,697 | 237,522 | ||||||
4.500%, 12/01/41 | 30,525 | 31,798 | ||||||
4.500%, 11/01/41 | 30,703 | 32,040 | ||||||
4.500%, 09/01/41 | 16,744 | 17,305 | ||||||
4.500%, 08/01/41 | 15,197 | 15,723 | ||||||
4.500%, 05/01/41 | 2,039,228 | 2,123,453 | ||||||
4.500%, 06/01/36 | 25,968 | 27,091 | ||||||
4.500%, 09/01/31 | 19,517 | 19,918 | ||||||
4.500%, 06/01/31 | 16,234 | 16,569 | ||||||
4.500%, 01/01/31 | 58,392 | 59,494 | ||||||
4.500%, 08/01/26 | 97,532 | 99,247 | ||||||
4.500%, 10/01/24 | 27,948 | 28,473 | ||||||
4.000%, 04/01/52 | 1,493,909 | 1,497,364 | ||||||
4.000%, 10/01/51 | 1,720,776 | 1,724,692 | ||||||
4.000%, 04/01/48 | 1,596,547 | 1,605,039 | ||||||
4.000%, 03/01/46 | 3,583,527 | 3,623,252 | ||||||
4.000%, 01/01/37 | 685,562 | 691,676 | ||||||
4.000%, 01/01/35 | 2,272,220 | 2,309,423 | ||||||
4.000%, 10/01/34 | 1,110,832 | 1,115,380 | ||||||
4.000%, 06/01/34 | 1,314,913 | 1,333,303 | ||||||
4.000%, 03/01/34 | 526,481 | 535,152 | ||||||
4.000%, 11/01/33 | 780,414 | 793,171 | ||||||
4.000%, 10/01/32 | 23,989 | 24,087 | ||||||
4.000%, 09/01/31 | 184,660 | 186,776 | ||||||
4.000%, 12/01/30 | 229,161 | 230,102 | ||||||
4.000%, 11/01/30 | 194,117 | 194,915 | ||||||
3.693%, ICE LIBOR USD 12 MONTH + 1.620%, 11/01/48 (A) | 705,553 | 709,488 | ||||||
3.500%, 03/01/52 | 1,924,008 | 1,871,466 | ||||||
3.500%, 01/01/52 | 2,330,279 | 2,267,731 | ||||||
3.500%, 11/01/51 | 1,443,242 | 1,403,760 | ||||||
3.500%, 04/01/37 | 609,867 | 597,828 | ||||||
3.500%, 02/01/31 | 1,140,117 | 1,144,487 | ||||||
3.500%, 12/01/29 | 390,782 | 392,028 | ||||||
3.000%, 03/01/52 | 3,074,794 | 2,912,884 | ||||||
| MORTGAGE-BACKED SECURITIES — continued | ||||||||
| Face Amount | Value | |||||||
3.000%, 11/01/51 | $ | 2,231,020 | $ | 2,117,365 | ||||
3.000%, 10/01/51 | 2,625,051 | 2,487,836 | ||||||
3.000%, 07/01/50 | 1,117,602 | 1,064,603 | ||||||
3.000%, 01/01/31 | 1,438,505 | 1,429,410 | ||||||
2.961%, ICE LIBOR USD 12 MONTH + 1.610%, 10/01/47 (A) | 205,342 | 206,851 | ||||||
2.913%, ICE LIBOR USD 12 MONTH + 1.580%, 09/01/47 (A) | 415,792 | 420,350 | ||||||
2.814%, ICE LIBOR USD 12 MONTH + 1.580%, 04/01/44 (A) | 151,287 | 155,084 | ||||||
2.593%, ICE LIBOR USD 12 MONTH + 1.567%, 05/01/44 (A) | 79,528 | 81,424 | ||||||
2.551%, ICE LIBOR USD 12 MONTH + 1.568%, 05/01/45 (A) | 401,096 | 411,195 | ||||||
2.500%, 02/01/52 | 1,763,776 | 1,615,006 | ||||||
2.500%, 12/01/51 | 7,775,020 | 7,116,197 | ||||||
2.500%, 08/01/51 | 5,322,306 | 4,879,103 | ||||||
2.500%, 05/01/51 | 0 | — | ||||||
2.500%, 02/01/51 | 13,351,922 | 12,213,464 | ||||||
2.500%, 01/01/51 | 1,443,725 | 1,322,150 | ||||||
2.500%, 11/01/50 | 11,546,837 | 10,590,543 | ||||||
2.500%, 10/01/50 | 11,104,922 | 10,177,780 | ||||||
2.500%, 07/01/50 | 14,671,415 | 13,444,739 | ||||||
2.500%, 10/01/41 | 3,105,700 | 2,887,346 | ||||||
2.500%, 05/01/41 | 899,431 | 836,200 | ||||||
2.500%, 08/01/36 | 2,036,551 | 1,952,992 | ||||||
2.500%, 07/01/36 | 1,165,364 | 1,117,626 | ||||||
2.282%, ICE LIBOR USD 12 MONTH + 1.791%, 06/01/38 (A) | 5,747 | 5,987 | ||||||
2.143%, US Treas Yield Curve Rate T Note Const Mat 1 Yr + 2.143%, 08/01/34 (A) | 2,732 | 2,745 | ||||||
2.081%, US Treas Yield Curve Rate T Note Const Mat 1 Yr + 1.999%, 09/01/34 (A) | 996 | 1,033 | ||||||
2.050%, ICE LIBOR USD 12 MONTH + 1.550%, 02/01/44 (A) | 1,442 | 1,437 | ||||||
2.048%, ICE LIBOR USD 12 MONTH + 1.696%, 04/01/44 (A) | 91,764 | 94,348 | ||||||
2.028%, ICE LIBOR USD 12 MONTH + 1.778%, 12/01/39 (A) | 14,008 | 13,949 | ||||||
The accompanying notes are an integral part of the financial statements.
30
CATHOLIC RESPONSIBLE INVESTMENTS BOND FUND
APRIL 30, 2022 (Unaudited)
| MORTGAGE-BACKED SECURITIES — continued | ||||||||
| Face Amount | Value | |||||||
2.000%, 11/01/51 | $ | 0 | $ | — | ||||
2.000%, 10/01/51 | 1,838,927 | 1,629,757 | ||||||
2.000%, 09/01/51 | 1,643,844 | 1,457,247 | ||||||
2.000%, 04/01/51 | 1,408,518 | 1,213,843 | ||||||
2.000%, 02/01/51 | 1,168,469 | 1,035,825 | ||||||
2.000%, 01/01/51 | 5,086,403 | 4,509,333 | ||||||
2.000%, 09/01/50 | 5,052,522 | 4,480,526 | ||||||
2.000%, 09/01/36 | 1,546,876 | 1,452,161 | ||||||
2.000%, 03/01/36 | 0 | — | ||||||
2.000%, 01/01/36 | 1,336,481 | 1,254,733 | ||||||
1.934%, ICE LIBOR USD 12 MONTH + 1.570%, 02/01/44 (A) | 11,304 | 11,516 | ||||||
1.928%, ICE LIBOR USD 12 MONTH + 1.591%, 07/01/44 (A) | 288,219 | 297,247 | ||||||
1.910%, ICE LIBOR USD 12 MONTH + 1.552%, 02/01/44 (A) | 15,332 | 15,608 | ||||||
1.850%, ICE LIBOR USD 12 MONTH + 1.600%, 12/01/44 (A) | 39,036 | 39,900 | ||||||
1.840%, ICE LIBOR USD 12 MONTH + 1.590%, 12/01/44 (A) | 355,570 | 363,238 | ||||||
1.830%, ICE LIBOR USD 12 MONTH + 1.580%, 09/01/44 (A) | 3,465 | 3,556 | ||||||
1.826%, ICE LIBOR USD 12 MONTH + 1.577%, 10/01/44 (A) | 185,277 | 189,808 | ||||||
1.815%, ICE LIBOR USD 12 MONTH + 1.565%, 01/01/44 (A) | 68,190 | 69,600 | ||||||
1.815%, ICE LIBOR USD 12 MONTH + 1.572%, 08/01/43 (A) | 4,177 | 4,280 | ||||||
1.721%, ICE LIBOR USD 12 MONTH + 1.471%, 06/01/35 (A) | 2,966 | 2,965 | ||||||
1.500%, 10/01/50 | 1,757,542 | 1,488,604 | ||||||
FNMA Connecticut Avenue Securities, Ser 2018-C06, Cl 1M2 2.668%, ICE LIBOR USD 1 MONTH + 2.000%, 03/25/31 (A) | 2,235,583 | 2,236,934 | ||||||
FNMA Grantor Trust 2000-T6, Ser 2000-T6, Cl A1 7.500%, 11/25/40 | 18,358 | 18,735 | ||||||
| MORTGAGE-BACKED SECURITIES — continued | ||||||||
| Face Amount | Value | |||||||
FNMA Grantor Trust 2001-T1, Ser 2001-T1, Cl A1 7.500%, 10/25/40 | $ | 138,090 | $ | 146,212 | ||||
FNMA Grantor Trust 2001-T10, Ser 2001-T10, Cl A1 7.000%, 12/25/41 | 105,364 | 112,614 | ||||||
FNMA Grantor Trust 2001-T12, Ser 2001-T12, Cl A1 6.500%, 08/25/41 | 3,716 | 3,944 | ||||||
FNMA Grantor Trust 2001-T3, Ser 2001-T3, Cl A1 7.500%, 11/25/40 | 9,870 | 10,436 | ||||||
FNMA Grantor Trust 2001-T4, Ser 2001-T4, Cl A1 7.500%, 07/25/41 | 43,433 | 47,995 | ||||||
FNMA Grantor Trust 2001-T7, Ser 2001-T7, Cl A1 7.500%, 02/25/41 | 1,913 | 2,130 | ||||||
FNMA Grantor Trust 2001-T8, Ser 2001-T8, Cl A1 7.500%, 07/25/41 | 5,727 | 5,911 | ||||||
FNMA Grantor Trust 2004-T1, Ser 2004-T1, Cl 1A2 6.500%, 01/25/44 | 1,680 | 1,808 | ||||||
FNMA or FHLMC 3.500%, 05/15/51 | 43,549,000 | 42,283,357 | ||||||
3.000%, 05/15/51 | 16,475,000 | 15,551,499 | ||||||
FNMA REMIC Trust 2001-W3, Ser 2001-W3, Cl A 7.000%, 09/25/41 (A) | 94,080 | 96,003 | ||||||
FNMA REMIC Trust 2002-W6, Ser 2002-W6, Cl 2A 7.500%, 06/25/42 (A) | 6,863 | 7,167 | ||||||
FNMA REMIC Trust 2002-W6, Ser 2002-W6, Cl 2A1 7.000%, 06/25/42 (A) | 6,863 | 6,966 | ||||||
FNMA REMIC Trust 2003-W4, Ser 2003-W4, Cl 3A 5.145%, 10/25/42 (A) | 76,051 | 80,857 | ||||||
The accompanying notes are an integral part of the financial statements.
31
CATHOLIC RESPONSIBLE INVESTMENTS BOND FUND
APRIL 30, 2022 (Unaudited)
| MORTGAGE-BACKED SECURITIES — continued | ||||||||
| Face Amount | Value | |||||||
FNMA Trust 2003-W2, Ser 2003-W2, Cl 1A3 7.500%, 07/25/42 | $ | 9,138 | $ | 10,122 | ||||
FNMA Trust 2004-W2, Ser 2004-W2, Cl 2A2 7.000%, 02/25/44 | 17,953 | 19,582 | ||||||
FNMA Trust 2004-W2, Ser 2004-W2, Cl 5A 7.500%, 03/25/44 | 6,960 | 7,594 | ||||||
FNMA, Ser 2001-2, Cl ZK 6.500%, 02/25/31 | 11,170 | 11,908 | ||||||
FNMA, Ser 2001-79, Cl BA 7.000%, 03/25/45 | 15,410 | 16,560 | ||||||
FNMA, Ser 2002-33, Cl A1 7.000%, 06/25/32 | 45,451 | 48,938 | ||||||
FNMA, Ser 2007-21, Cl MT 5.750%, 03/25/37 | 6,810 | 7,111 | ||||||
FNMA, Ser 2009-11, Cl MP 7.000%, 03/25/49 | 7,125 | 7,840 | ||||||
FNMA, Ser 2010-136, Cl BA 3.500%, 12/25/30 | 232,796 | 229,596 | ||||||
FNMA, Ser 2014-1, Cl KF 1.268%, ICE LIBOR USD 1 MONTH + 0.600%, 02/25/44 (A) | 441,388 | 446,707 | ||||||
FREMF 2015-K44 Mortgage Trust, Ser K44, Cl C 3.795%, 01/25/48 (A),(B) | 1,900,000 | 1,839,613 | ||||||
FREMF 2015-K46 Mortgage Trust, Ser K46, Cl C 3.819%, 04/25/48 (A),(B) | 2,560,000 | 2,497,432 | ||||||
FREMF 2015-K47 Mortgage Trust, Ser K47, Cl C 3.708%, 06/25/48 (A),(B) | 1,445,000 | 1,395,787 | ||||||
FREMF 2016-K55 Mortgage Trust, Ser K55, Cl C 4.297%, 04/25/49 (A),(B) | 1,225,000 | 1,194,538 | ||||||
FREMF 2016-K56 Mortgage Trust, Ser K56, Cl C 4.077%, 06/25/49 (A),(B) | 2,555,000 | 2,489,856 | ||||||
FREMF 2016-K57 Mortgage Trust, Ser K57, Cl C 4.052%, 08/25/49 (A),(B) | 3,060,000 | 2,963,705 | ||||||
FREMF 2016-K60 Mortgage Trust, Ser K60, Cl C 3.661%, 12/25/49 (A),(B) | 1,370,000 | 1,310,082 | ||||||
FREMF 2017-K62 Mortgage Trust, Ser K62, Cl C 4.008%, 01/25/50 (A),(B) | 2,286,000 | 2,185,167 | ||||||
FREMF 2017-K69 Mortgage Trust, Ser K69, Cl C 3.854%, 10/25/49 (A),(B) | 2,424,000 | 2,287,889 | ||||||
| MORTGAGE-BACKED SECURITIES — continued | ||||||||
| Face Amount | Value | |||||||
FREMF 2018-K732 Mortgage Trust, Ser K732, Cl C 4.196%, 05/25/25 (A),(B) | $ | 3,050,000 | $ | 2,990,652 | ||||
FREMF 2018-K74 Mortgage Trust, Ser K74, Cl C 4.228%, 02/25/51 (A),(B) | 2,700,000 | 2,595,730 | ||||||
FREMF 2018-K83 Mortgage Trust, Ser K83, Cl C 4.418%, 11/25/51 (A),(B) | 2,750,000 | 2,668,547 | ||||||
FREMF 2018-K85 Mortgage Trust, Ser K85, Cl B 4.464%, 12/25/50 (A),(B) | 2,900,000 | 2,895,499 | ||||||
FREMF 2018-K86 Mortgage Trust, Ser K86, Cl C 4.437%, 11/25/51 (A),(B) | 1,792,000 | 1,753,918 | ||||||
FREMF 2019-K736 Mortgage Trust, Ser K736, Cl B 3.885%, 07/25/26 (A),(B) | 3,000,000 | 2,932,932 | ||||||
FREMF 2019-K89 Mortgage Trust, Ser K89, Cl C 4.433%, 01/25/51 (A),(B) | 5,000,000 | 4,876,406 | ||||||
FREMF 2019-K96 Mortgage Trust, Ser K96, Cl C 3.942%, 08/25/56 (A),(B) | 1,700,000 | 1,588,885 | ||||||
FREMF 2020-K104 Mortgage Trust, Ser K104, Cl C 3.660%, 02/25/52 (A),(B) | 1,200,000 | 1,104,884 | ||||||
FREMF 2020-K737 Mortgage Trust, Ser K737, Cl C 3.416%, 01/25/53 (A),(B) | 545,000 | 515,770 | ||||||
FREMF Mortgage Trust, Ser 2017-K61, Cl C 3.814%, 12/25/49 (A),(B) | 2,160,000 | 2,051,117 | ||||||
GNMA | ||||||||
7.000%, 12/15/29 | 973 | 1,057 | ||||||
6.500%, 05/15/29 | 1,764 | 1,884 | ||||||
4.000%, 04/20/52 | 1,385,000 | 1,392,040 | ||||||
4.000%, 03/20/52 | 1,600,655 | 1,608,791 | ||||||
4.000%, 02/20/52 | 1,622,960 | 1,632,120 | ||||||
4.000%, 01/20/52 | 1,316,671 | 1,323,363 | ||||||
3.500%, 03/20/52 | 1,914,988 | 1,880,026 | ||||||
3.500%, 02/20/52 | 1,420,894 | 1,394,838 | ||||||
3.500%, 01/20/52 | 1,544,281 | 1,515,989 | ||||||
3.500%, 06/20/51 | 1,591,711 | 1,564,704 | ||||||
3.000%, 10/20/51 | 1,946,850 | 1,862,779 | ||||||
3.000%, 07/20/51 | 1,386,213 | 1,328,136 | ||||||
3.000%, 05/20/51 | 1,247,374 | 1,194,329 | ||||||
The accompanying notes are an integral part of the financial statements.
32
CATHOLIC RESPONSIBLE INVESTMENTS BOND FUND
APRIL 30, 2022 (Unaudited)
| MORTGAGE-BACKED SECURITIES — continued | ||||||||
| Face Amount | Value | |||||||
2.500%, 05/20/51 | $ | 843,289 | $ | 786,140 | ||||
2.500%, 03/20/51 | 1,967,195 | 1,833,377 | ||||||
GNMA, Ser 2002-49, Cl ZG 6.000%, 07/20/32 | 436,998 | 436,987 | ||||||
GNMA, Ser 2012-98, Cl BM 4.904%, 08/20/42 (A) | 209,217 | 212,960 | ||||||
GNMA, Ser 2017-H17, Cl FQ 0.502%, ICE LIBOR USD 12 MONTH + 0.270%, 09/20/67 (A) | 2,881,415 | 2,836,380 | ||||||
GNMA, Ser 2017-H22, Cl FH 0.455%, ICE LIBOR USD 12 MONTH + 0.220%, 11/20/67 (A) | 1,879,693 | 1,840,971 | ||||||
GNMA, Ser 2017-H24, Cl FQ 0.567%, ICE LIBOR USD 12 MONTH + 0.200%, 11/20/67 (A) | 1,896,338 | 1,853,292 | ||||||
GNMA, Ser 2018-H04, Cl FK 0.988%, ICE LIBOR USD 12 MONTH + 0.040%, 03/20/68 (A) | 1,771,139 | 1,711,961 | ||||||
GNMA, Ser 2018-H05, Cl CF 1.008%, ICE LIBOR USD 12 MONTH + 0.060%, 03/20/68 (A) | 1,813,337 | 1,753,780 | ||||||
GNMA, Ser 2019-H09, Cl FG 0.631%, ICE LIBOR USD 12 MONTH + 0.350%, 05/20/69 (A) | 785,010 | 774,562 | ||||||
GNMA, Ser 2020-H01, Cl FV 0.892%, ICE LIBOR USD 1 MONTH + 0.650%, 01/20/70 (A) | 7,017,409 | 7,000,285 | ||||||
GNMA, Ser 2022-H04, Cl FG 0.840%, SOFR30A + 0.550%, 02/20/67 (A) | 4,260,499 | 4,215,106 | ||||||
GNMA, Ser 2022-H08, Cl FE 1.017%, SOFR30A + 0.750%, 03/20/72 (A) | 2,883,000 | 2,893,361 | ||||||
| MORTGAGE-BACKED SECURITIES — continued | ||||||||
| Face Amount | Value | |||||||
GNMA, Ser 2022-H09, Cl FA 0.720%, SOFR30A + 0.670%, 04/20/72 (A) | $ | 3,015,000 | $ | 3,032,430 | ||||
Vendee Mortgage Trust 1993-1, Ser 1993-1, Cl ZB 7.250%, 02/15/23 | 3,365 | 3,421 | ||||||
Vendee Mortgage Trust 1995-1, Ser 1995-1, Cl 2 7.793%, 02/15/25 | 3,191 | 3,305 | ||||||
Vendee Mortgage Trust 1995-2, Ser 1995-2C, Cl 3A 8.793%, 06/15/25 | 2,199 | 2,357 | ||||||
Vendee Mortgage Trust 1998-2, Ser 1998-2, Cl 2A 8.613%, 08/15/27 (A) | 634 | 664 | ||||||
|
| |||||||
| 366,066,711 | ||||||||
|
| |||||||
Non-Agency Mortgage-Backed Obligation — 6.1% |
| |||||||
Benchmark 2019-B10 Mortgage Trust, Ser B10, Cl E 3.000%, 03/15/62 (B) | 1,100,000 | 818,201 | ||||||
Benchmark 2020-B16 Mortgage Trust, Ser B16, Cl D 2.500%, 02/15/53 (B) | 4,755,000 | 3,541,567 | ||||||
BIG Commercial Mortgage Trust 2022-BIG, Ser BIG, Cl D 3.548%, TSFR1M + 3.039%, 02/15/39 (A),(B) | 3,800,000 | 3,764,206 | ||||||
CFCRE Commercial Mortgage Trust 2016-C6, Ser C6, Cl D 4.335%, 11/10/49 (A),(B) | 2,250,000 | 1,874,752 | ||||||
Citigroup Commercial Mortgage Trust 2014-GC21, Ser GC21, Cl D 5.109%, 05/10/47 (A),(B) | 3,185,000 | 2,961,303 | ||||||
COMM 2014-CCRE20 Mortgage Trust, Ser CR20, Cl C 4.640%, 11/10/47 (A) | 2,600,000 | 2,537,836 | ||||||
COMM 2015-CCRE24 Mortgage Trust, Ser CR24, Cl D 3.463%, 08/10/48 (A) | 490,000 | 433,886 | ||||||
The accompanying notes are an integral part of the financial statements.
33
CATHOLIC RESPONSIBLE INVESTMENTS BOND FUND
APRIL 30, 2022 (Unaudited)
| MORTGAGE-BACKED SECURITIES — continued | ||||||||
| Face Amount | Value | |||||||
Commercial Mortgage Trust 2022-LPFL, Ser LPFL, Cl C 2.903%, TSFR1M + 2.394%, 03/15/39 (A),(B) | $ | 2,000,000 | $ | 1,984,968 | ||||
Connecticut Avenue Securities Trust 2022-R03, Ser 2022-R03, Cl 1M2 3.789%, SOFR30A + 3.500%, 03/25/42 (A),(B) | 2,850,000 | 2,900,015 | ||||||
Connecticut Avenue Securities Trust, Ser 2018-R07, Cl 1M2 3.068%, ICE LIBOR USD 1 MONTH + | 538,982 | 538,982 | ||||||
CSMC 2014-USA OA, Ser USA, Cl A2 3.953%, 09/15/37 (B) | 1,250,000 | 1,209,414 | ||||||
CSMC 2014-USA OA, Ser USA, Cl C 4.336%, 09/15/37 (B) | 3,140,000 | 2,817,449 | ||||||
CSMC 2021-NQM5 Trust, Ser 2021-NQM5, Cl M1 2.168%, 05/25/66 (A),(B) | 1,135,000 | 997,576 | ||||||
CSMC Trust, Ser 2016-NXSR, Cl AS 4.049%, 12/15/49 (A) | 4,145,000 | 4,105,306 | ||||||
FASST 2021-JR1 A2 2.000%, 04/25/51 | 2,234,502 | 2,125,317 | ||||||
FASST 2021-S2 A2 09/2051 1.750%, 09/25/51 | 2,206,228 | 2,074,972 | ||||||
FASST 21-S1-A2 07/25/2051 1.750%, 07/25/51 | 3,838,014 | 3,620,516 | ||||||
FIN AMER 19-JR2 06/25/69 2.000%, 06/25/69 | 1,772,495 | 1,899,602 | ||||||
FIN AMER 19-JR3 09/25/69 2.000%, 09/25/69 | 1,268,091 | 1,321,643 | ||||||
GS Mortgage Securities II, Ser GC10, Cl B 3.682%, 02/10/46 (B) | 6,785,000 | 6,771,242 | ||||||
GS Mortgage Securities Trust 2017-GS8, Ser GS8, Cl D 2.700%, 11/10/50 (B) | 2,205,000 | 1,808,959 | ||||||
JPMBB Commercial Mortgage Securities Trust 2014-C19, Ser C19, Cl D 4.807%, 04/15/47 (A),(B) | 1,430,000 | 1,361,937 | ||||||
JPMBB Commercial Mortgage Securities Trust 2014-C26, Ser C26, Cl D 4.018%, 01/15/48 (A),(B) | 1,000,000 | 911,098 | ||||||
| MORTGAGE-BACKED SECURITIES — continued | ||||||||
| Face Amount | Value | |||||||
JPMBB Commercial Mortgage Securities Trust 2015-C28, Ser C28, Cl C 4.284%, 10/15/48 (A) | $ | 4,740,000 | $ | 4,489,325 | ||||
JPMBB Commercial Mortgage Securities Trust 2015-C29, Ser C29, Cl C 4.326%, 05/15/48 (A) | 5,000,000 | 4,739,690 | ||||||
JPMBB Commercial Mortgage Securities Trust, Ser 2014-C26, Cl AS 3.800%, 01/15/48 | 5,885,000 | 5,815,743 | ||||||
NCMF Trust 2022-MFP, Ser MFP, Cl E 4.342%, TSFR1M + 3.833%, 03/15/39 (A),(B) | 2,500,000 | 2,486,724 | ||||||
New Residential Mortgage Loan Trust 2021-NQM2R, Ser 2021-NQ2R, Cl M1 2.201%, 10/25/58 (A),(B) | 1,684,000 | 1,607,674 | ||||||
NW RE-REMIC TRUST 2021-FRR1, Ser FRR1, Cl AK88 2.818%, 12/18/51 (A),(B) | 2,500,000 | 2,337,112 | ||||||
OBX 2022-NQM1 Trust, Ser 2022-NQM1, Cl M1 3.504%, 11/25/61 (A),(B) | 900,000 | 813,226 | ||||||
Onslow Bay Mortgage Loan Trust, Ser 2021-NQM4, Cl M1 3.248%, 10/25/61 (B) | 1,530,000 | 1,299,217 | ||||||
Palisades Center Trust 2016-PLSD, Ser PLSD, Cl A 2.713%, 04/13/33 (B) | 3,990,000 | 3,720,434 | ||||||
Residential Mortgage Loan Trust, Ser 2019-3, Cl A1 2.633%, 09/25/59 (A),(B) | 893,345 | 876,211 | ||||||
SFAVE Commercial Mortgage Securities Trust 2015-5AVE, Ser 5AVE, Cl A1 3.872%, 01/05/43 (A),(B) | 2,470,000 | 2,234,409 | ||||||
Shops at Crystals Trust 2016-CSTL, Ser CSTL, Cl C 3.731%, 07/05/36 (A),(B) | 2,500,000 | 2,231,573 | ||||||
SLG Office Trust 2021-OVA, Ser OVA, Cl D 2.851%, 07/15/41 (B) | 3,035,000 | 2,551,895 | ||||||
The accompanying notes are an integral part of the financial statements.
34
CATHOLIC RESPONSIBLE INVESTMENTS BOND FUND
APRIL 30, 2022 (Unaudited)
| MORTGAGE-BACKED SECURITIES — continued | ||||||||
| Face Amount | Value | |||||||
SPGN 2022-TFLM Mortgage Trust, Ser TFLM, Cl D 4.009%, TSFR1M + 3.500%, 02/15/39 (A),(B) | $ | 2,500,000 | $ | 2,450,657 | ||||
Verus Securitization Trust 2021-2, Ser 2021-2, Cl M1 2.187%, 02/25/66 (A),(B) | 2,500,000 | 2,228,907 | ||||||
Verus Securitization Trust 2021-3, Ser 2021-3, Cl M1 2.397%, 06/25/66 (A),(B) | 1,350,000 | 1,203,333 | ||||||
Verus Securitization Trust 2021-4, Ser 2021-4, Cl M1 2.195%, 07/25/66 (A),(B) | 1,215,000 | 1,053,710 | ||||||
Verus Securitization Trust 2021-R3, Ser 2021-R3, Cl M1 2.411%, 04/25/64 (A),(B) | 2,370,000 | 2,255,829 | ||||||
Wells Fargo Commercial Mortgage Trust 2015-C28, Ser C28, Cl D 4.220%, 05/15/48 (A) | 1,450,000 | 1,317,435 | ||||||
Wells Fargo Commercial Mortgage Trust, Ser 2019-C49, Cl D 3.000%, 03/15/52 (B) | 3,100,000 | 2,472,293 | ||||||
|
| |||||||
| 100,566,144 | ||||||||
|
| |||||||
Total Mortgage-Backed Securities | 466,632,855 | |||||||
|
| |||||||
| CORPORATE OBLIGATIONS — 27.0% | ||||||||
| Face Amount | Value | |||||||
COMMUNICATION SERVICES — 4.3% |
| |||||||
Alibaba Group Holding 3.600%, 11/28/24 | $ | 1,755,000 | $ | 1,750,064 | ||||
America Movil 4.375%, 04/22/49 | 1,440,000 | 1,374,307 | ||||||
AT&T | ||||||||
8.750%, 11/15/31 | 790,000 | 1,024,698 | ||||||
4.500%, 03/09/48 | 796,000 | 748,911 | ||||||
4.350%, 06/15/45 | 2,360,000 | 2,145,877 | ||||||
3.650%, 09/15/59 | 2,966,000 | 2,296,029 | ||||||
3.550%, 09/15/55 | 2,029,000 | 1,574,372 | ||||||
3.500%, 09/15/53 | 774,000 | 608,873 | ||||||
2.750%, 06/01/31 | 975,000 | 860,338 | ||||||
CCO Holdings 4.500%, 06/01/33(B) | 1,450,000 | 1,185,839 | ||||||
4.500%, 05/01/32 | 725,000 | 614,220 | ||||||
4.250%, 01/15/34(B) | 1,225,000 | 973,875 | ||||||
| CORPORATE OBLIGATIONS — continued | ||||||||
| Face Amount | Value | |||||||
COMMUNICATION SERVICES — continued |
| |||||||
Charter Communications Operating 6.484%, 10/23/45 | $ | 5,085,000 | $ | 5,135,723 | ||||
5.750%, 04/01/48 | 700,000 | 658,974 | ||||||
5.375%, 05/01/47 | 1,175,000 | 1,053,925 | ||||||
5.250%, 04/01/53 | 800,000 | 701,228 | ||||||
4.400%, 04/01/33 | 375,000 | 342,124 | ||||||
Comcast 4.400%, 08/15/35 | 2,055,000 | 2,043,799 | ||||||
3.450%, 02/01/50 | 765,000 | 631,691 | ||||||
2.800%, 01/15/51 | 190,000 | 140,590 | ||||||
CommScope 6.000%, 03/01/26(B) | 3,435,000 | 3,239,892 | ||||||
Cox Communications 3.850%, 02/01/25(B) | 1,100,000 | 1,099,587 | ||||||
3.500%, 08/15/27(B) | 2,600,000 | 2,525,352 | ||||||
3.350%, 09/15/26(B) | 750,000 | 728,567 | ||||||
Paramount Global 4.950%, 01/15/31 | 1,140,000 | 1,130,170 | ||||||
Prosus 4.987%, 01/19/52(B) | 3,425,000 | 2,691,890 | ||||||
4.850%, 07/06/27(B) | 850,000 | 806,650 | ||||||
4.193%, 01/19/32(B) | 425,000 | 359,129 | ||||||
3.680%, 01/21/30(B) | 2,075,000 | 1,751,484 | ||||||
3.061%, 07/13/31(B) | 4,750,000 | 3,752,950 | ||||||
Rogers Communications 3.800%, 03/15/32(B) | 1,090,000 | 1,009,666 | ||||||
Telecom Italia 5.303%, 05/30/24(B) | 3,500,000 | 3,434,375 | ||||||
Telecom Italia Capital 7.721%, 06/04/38 | 1,970,000 | 1,849,338 | ||||||
7.200%, 07/18/36 | 300,000 | 270,619 | ||||||
Tencent Holdings MTN 3.975%, 04/11/29(B) | 1,690,000 | 1,614,847 | ||||||
Time Warner Cable 6.750%, 06/15/39 | 1,300,000 | 1,389,210 | ||||||
T-Mobile USA 4.500%, 04/15/50 | 775,000 | 708,503 | ||||||
4.375%, 04/15/40 | 425,000 | 392,243 | ||||||
3.875%, 04/15/30 | 3,650,000 | 3,460,595 | ||||||
3.500%, 04/15/31(B) | 925,000 | 819,855 | ||||||
3.375%, 04/15/29(B) | 925,000 | 840,117 | ||||||
2.250%, 02/15/26(B) | 950,000 | 871,625 | ||||||
Verizon Communications 4.400%, 11/01/34 | 2,810,000 | 2,772,159 | ||||||
4.272%, 01/15/36 | 1,300,000 | 1,260,113 | ||||||
3.550%, 03/22/51 | 390,000 | 321,805 | ||||||
2.987%, 10/30/56 | 570,000 | 406,457 | ||||||
2.650%, 11/20/40 | 1,625,000 | 1,232,413 | ||||||
2.100%, 03/22/28 | 440,000 | 394,484 | ||||||
The accompanying notes are an integral part of the financial statements.
35
CATHOLIC RESPONSIBLE INVESTMENTS BOND FUND
APRIL 30, 2022 (Unaudited)
| CORPORATE OBLIGATIONS — continued | ||||||||
| Face Amount | Value | |||||||
COMMUNICATION SERVICES — continued |
| |||||||
Vodafone Group 7.000%, USD Swap Semi 30/360 5 Yr Curr + | $ | 1,650,000 | $ | 1,742,450 | ||||
Walt Disney 6.650%, 11/15/37 | 810,000 | 996,239 | ||||||
|
| |||||||
| 69,738,241 | ||||||||
|
| |||||||
CONSUMER DISCRETIONARY — 1.8% |
| |||||||
Aptiv 3.250%, 03/01/32 | 220,000 | 194,322 | ||||||
Elanco Animal Health 6.400%, 08/28/28 | 1,635,000 | 1,677,919 | ||||||
Ford Motor Credit 5.125%, 06/16/25 | 600,000 | 598,500 | ||||||
4.542%, 08/01/26 | 700,000 | 669,375 | ||||||
4.389%, 01/08/26 | 600,000 | 579,000 | ||||||
4.375%, 08/06/23 | 1,050,000 | 1,050,630 | ||||||
4.140%, 02/15/23 | 900,000 | 897,750 | ||||||
4.134%, 08/04/25 | 675,000 | 648,000 | ||||||
4.063%, 11/01/24 | 2,850,000 | 2,787,763 | ||||||
3.810%, 01/09/24 | 850,000 | 835,125 | ||||||
3.375%, 11/13/25 | 775,000 | 730,488 | ||||||
3.350%, 11/01/22 | 1,250,000 | 1,250,387 | ||||||
General Motors Financial 5.100%, 01/17/24 | 3,505,000 | 3,583,534 | ||||||
3.250%, 01/05/23 | 730,000 | 733,085 | ||||||
1.407%, U.S. SOFR + | 5,805,000 | 5,811,779 | ||||||
Mileage Plus Holdings 6.500%, 06/20/27(B) | 4,780,000 | 4,875,600 | ||||||
Nordstrom 6.950%, 03/15/28 | 1,165,000 | 1,189,675 | ||||||
PayPal Holdings 3.250%, 06/01/50 | 2,575,000 | 2,052,674 | ||||||
RELX Capital 4.000%, 03/18/29 | 650,000 | 642,586 | ||||||
|
| |||||||
| 30,808,192 | ||||||||
|
| |||||||
CONSUMER STAPLES — 0.3% |
| |||||||
Anheuser-Busch Cos LLC / Anheuser-Busch InBev Worldwide Inc 4.900%, 02/01/46 | 575,000 | 568,045 | ||||||
Anheuser-Busch InBev Worldwide 5.550%, 01/23/49 | 450,000 | 482,287 | ||||||
5.450%, 01/23/39 | 1,285,000 | 1,368,119 | ||||||
4.350%, 06/01/40 | 425,000 | 400,605 | ||||||
Coca-Cola 3.450%, 03/25/30 | 475,000 | 463,536 | ||||||
1.650%, 06/01/30 | 875,000 | 742,843 | ||||||
| CORPORATE OBLIGATIONS — continued | ||||||||
| Face Amount | Value | |||||||
CONSUMER STAPLES — continued |
| |||||||
Keurig Dr Pepper 4.417%, 05/25/25 | $ | 80,000 | $ | 81,751 | ||||
Mars 2.375%, 07/16/40(B) | 960,000 | 722,872 | ||||||
|
| |||||||
| 4,830,058 | ||||||||
|
| |||||||
ENERGY — 3.6% |
| |||||||
BP Capital Markets America 3.060%, 06/17/41 | 1,670,000 | 1,363,627 | ||||||
Cameron LNG 3.701%, 01/15/39(B) | 1,285,000 | 1,134,933 | ||||||
ConocoPhillips 4.150%, 11/15/34 | 386,000 | 370,680 | ||||||
Energy Transfer 4.400%, 03/15/27 | 2,490,000 | 2,471,604 | ||||||
2.900%, 05/15/25 | 1,655,000 | 1,598,348 | ||||||
Exxon Mobil 4.227%, 03/19/40 | 1,100,000 | 1,078,776 | ||||||
2.610%, 10/15/30 | 850,000 | 775,792 | ||||||
Kinder Morgan 5.550%, 06/01/45 | 4,400,000 | 4,434,194 | ||||||
5.200%, 03/01/48 | 750,000 | 725,994 | ||||||
4.300%, 06/01/25 | 525,000 | 529,764 | ||||||
Kinder Morgan Energy Partners 5.500%, 03/01/44 | 310,000 | 306,718 | ||||||
4.300%, 05/01/24 | 1,865,000 | 1,886,934 | ||||||
Marathon Petroleum 4.700%, 05/01/25 | 190,000 | 192,931 | ||||||
Midwest Connector Capital 3.900%, 04/01/24(B) | 3,045,000 | 3,028,901 | ||||||
MPLX 5.500%, 02/15/49 | 1,220,000 | 1,195,837 | ||||||
Occidental Petroleum 3.200%, 08/15/26 | 975,000 | 916,500 | ||||||
2.900%, 08/15/24 | 2,900,000 | 2,834,750 | ||||||
Petrobras Global Finance BV 7.250%, 03/17/44 | 725,000 | 723,187 | ||||||
6.750%, 06/03/50 | 2,425,000 | 2,247,684 | ||||||
5.500%, 06/10/51 | 625,000 | 512,888 | ||||||
5.093%, 01/15/30 | 257,000 | 249,290 | ||||||
Petroleos Mexicanos 7.690%, 01/23/50 | 8,055,000 | 6,311,093 | ||||||
6.950%, 01/28/60 | 141,000 | 102,225 | ||||||
6.700%, 02/16/32 | 3,183,000 | 2,742,727 | ||||||
6.625%, 06/15/35 | 1,750,000 | 1,419,250 | ||||||
6.375%, 01/23/45 | 880,000 | 630,617 | ||||||
6.350%, 02/12/48 | 506,000 | 354,200 | ||||||
Rio Oil Finance Trust Series 2014-1 9.250%, 07/06/24(B) | 2,052,555 | 2,137,736 | ||||||
The accompanying notes are an integral part of the financial statements.
36
CATHOLIC RESPONSIBLE INVESTMENTS BOND FUND
APRIL 30, 2022 (Unaudited)
| CORPORATE OBLIGATIONS — continued | ||||||||
| Face Amount | Value | |||||||
ENERGY — continued |
| |||||||
Rio Oil Finance Trust Series 2014-3 9.750%, 01/06/27(B) | $ | 1,376,702 | $ | 1,510,931 | ||||
Rio Oil Finance Trust Series 2018-1 8.200%, 04/06/28(B) | 850,820 | 913,568 | ||||||
TransCanada PipeLines 4.625%, 03/01/34 | 1,010,000 | 999,725 | ||||||
Transcanada Trust 5.875%, ICE LIBOR USD 3 MONTH + 4.640%, 08/15/76(A) | 1,375,000 | 1,375,990 | ||||||
5.625%, ICE LIBOR USD 3 MONTH + 3.528%, 05/20/75(A) | 475,000 | 473,575 | ||||||
5.600%, US Treas Yield Curve Rate T Note Const Mat 5 Yr + 3.986%, 03/07/82(A) | 625,000 | 604,688 | ||||||
5.500%, U.S. SOFR + 4.416%, 09/15/79(A) | 1,725,000 | 1,660,313 | ||||||
5.300%, ICE LIBOR USD 3 MONTH + 3.208%, 03/15/77(A) | 4,650,000 | 4,464,000 | ||||||
Ultrapar International 5.250%, 10/06/26(B) | 1,075,000 | 1,084,406 | ||||||
5.250%, 06/06/29(B) | 429,000 | 416,885 | ||||||
Williams 3.500%, 11/15/30 | 975,000 | 907,410 | ||||||
3.350%, 08/15/22 | 2,725,000 | 2,726,046 | ||||||
|
| |||||||
| 59,414,717 | ||||||||
|
| |||||||
FINANCIALS — 12.6% |
| |||||||
AerCap Ireland Capital DAC 3.300%, 01/30/32 | 1,445,000 | 1,202,797 | ||||||
3.000%, 10/29/28 | 225,000 | 195,791 | ||||||
American International Group 3.900%, 04/01/26 | 720,000 | 717,073 | ||||||
Ares Capital 4.250%, 03/01/25 | 1,370,000 | 1,352,364 | ||||||
Athene Global Funding 0.927%, U.S. SOFR + 0.700%, 05/24/24(A),(B) | 6,890,000 | 6,810,071 | ||||||
Aviation Capital Group 4.125%, 08/01/25(B) | 420,000 | 410,664 | ||||||
Avolon Holdings Funding 4.375%, 05/01/26(B) | 1,220,000 | 1,172,029 | ||||||
Bank of America MTN 4.450%, 03/03/26 | 1,120,000 | 1,122,153 | ||||||
4.250%, 10/22/26 | 1,050,000 | 1,048,568 | ||||||
4.200%, 08/26/24 | 605,000 | 611,742 | ||||||
| CORPORATE OBLIGATIONS — continued | ||||||||
| Face Amount | Value | |||||||
FINANCIALS — continued |
| |||||||
4.183%, 11/25/27 | $ | 2,000,000 | $ | 1,968,054 | ||||
3.846%, US Treas Yield Curve Rate T Note Const Mat 5 Yr + 2.000%, 03/08/37(A) | 1,850,000 | 1,648,164 | ||||||
3.705%, ICE LIBOR USD 3 MONTH + 1.512%, 04/24/28(A) | 1,350,000 | 1,303,316 | ||||||
3.093%, ICE LIBOR USD 3 MONTH + | 1,330,000 | 1,303,513 | ||||||
3.004%, ICE LIBOR USD 3 MONTH + | 2,413,000 | 2,407,627 | ||||||
2.676%, U.S. SOFR + | 1,625,000 | 1,218,400 | ||||||
Bank of Montreal MTN 0.949%, SOFRINDX + | 7,570,000 | 7,577,191 | ||||||
Bank of Nova Scotia 0.827%, SOFRINDX + 0.550%, 09/15/23(A) | 8,255,000 | 8,239,099 | ||||||
Barclays 4.836%, 05/09/28 | 1,225,000 | 1,205,926 | ||||||
4.375%, 09/11/24 | 1,975,000 | 1,984,634 | ||||||
2.894%, US Treas Yield Curve Rate T Note Const Mat 1 Yr + 1.300%, 11/24/32(A) | 1,000,000 | 836,355 | ||||||
1.007%, US Treas Yield Curve Rate T Note Const Mat 1 Yr + 0.800%, 12/10/24(A) | 2,165,000 | 2,065,693 | ||||||
Belrose Funding Trust 2.330%, 08/15/30(B) | 1,680,000 | 1,400,990 | ||||||
BGC Partners 5.375%, 07/24/23 | 3,475,000 | 3,530,073 | ||||||
Blackstone Private Credit Fund 2.625%, 12/15/26(B) | 2,085,000 | 1,829,116 | ||||||
Blue Owl Finance 3.125%, 06/10/31(B) | 2,800,000 | 2,246,842 | ||||||
BNP Paribas MTN 4.625%, 03/13/27(B) | 2,200,000 | 2,181,280 | ||||||
4.375%, 09/28/25(B) | 2,175,000 | 2,159,656 | ||||||
4.375%, 05/12/26(B) | 450,000 | 445,106 | ||||||
4.250%, 10/15/24 | 2,700,000 | 2,721,013 | ||||||
Boston Properties 3.250%, 01/30/31‡ | 1,675,000 | 1,519,905 | ||||||
3.125%, 09/01/23‡ | 1,225,000 | 1,225,955 | ||||||
The accompanying notes are an integral part of the financial statements.
37
CATHOLIC RESPONSIBLE INVESTMENTS BOND FUND
APRIL 30, 2022 (Unaudited)
| CORPORATE OBLIGATIONS — continued | ||||||||
| Face Amount | Value | |||||||
FINANCIALS — continued |
| |||||||
Brookfield Finance 4.850%, 03/29/29 | $ | 1,205,000 | $ | 1,235,842 | ||||
Canadian Imperial Bank of Commerce 1.093%, U.S. SOFR + 0.800%, 03/17/23(A) | 6,225,000 | 6,235,539 | ||||||
Capital One Financial 4.200%, 10/29/25 | 1,600,000 | 1,596,798 | ||||||
3.750%, 04/24/24 | 475,000 | 475,784 | ||||||
3.500%, 06/15/23 | 778,000 | 782,760 | ||||||
0.956%, U.S. SOFR + | 8,150,000 | 8,121,230 | ||||||
Citigroup 8.125%, 07/15/39 | 640,000 | 881,969 | ||||||
6.625%, 06/15/32 | 900,000 | 1,013,119 | ||||||
4.650%, 07/23/48 | 440,000 | 434,930 | ||||||
4.450%, 09/29/27 | 1,685,000 | 1,673,373 | ||||||
4.412%, U.S. SOFR + | 875,000 | 855,513 | ||||||
3.785%, U.S. SOFR + | 1,275,000 | 1,184,787 | ||||||
3.400%, 05/01/26 | 255,000 | 248,710 | ||||||
2.666%, U.S. SOFR + | 1,350,000 | 1,174,367 | ||||||
Commonwealth Bank of Australia 0.696%, U.S. SOFR + | 8,970,000 | 8,890,921 | ||||||
Corporate Office Properties 2.750%, 04/15/31‡ | 900,000 | 764,500 | ||||||
Credit Suisse Group 4.207%, ICE LIBOR USD 3 MONTH + | 900,000 | 901,684 | ||||||
Fairfax Financial Holdings 4.850%, 04/17/28 | 770,000 | 774,387 | ||||||
FS KKR Capital 4.625%, 07/15/24 | 730,000 | 729,858 | ||||||
Goldman Sachs Group MTN 4.017%, ICE LIBOR USD 3 MONTH + | 2,375,000 | 2,173,952 | ||||||
4.000%, 03/03/24 | 1,455,000 | 1,468,622 | ||||||
3.615%, U.S. SOFR + 1.846%, 03/15/28(A) | 4,700,000 | 4,514,608 | ||||||
3.272%, ICE LIBOR USD 3 MONTH + | 845,000 | 831,754 | ||||||
Golub Capital BDC 2.500%, 08/24/26 | 3,530,000 | 3,148,462 | ||||||
| CORPORATE OBLIGATIONS — continued | ||||||||
| Face Amount | Value | |||||||
FINANCIALS — continued |
| |||||||
HSBC Holdings 6.800%, 06/01/38 | $ | 425,000 | $ | 479,427 | ||||
6.500%, 09/15/37 | 2,375,000 | 2,670,818 | ||||||
6.500%, 05/02/36 | 685,000 | 760,833 | ||||||
4.950%, 03/31/30 | 1,250,000 | 1,262,416 | ||||||
4.762%, U.S. SOFR + 2.530%, 03/29/33(A) | 1,700,000 | 1,609,899 | ||||||
4.375%, 11/23/26 | 420,000 | 415,976 | ||||||
4.300%, 03/08/26 | 2,500,000 | 2,504,902 | ||||||
3.950%, ICE LIBOR USD 3 MONTH + | 1,350,000 | 1,355,507 | ||||||
2.848%, U.S. SOFR + 2.387%, 06/04/31(A) | 825,000 | 712,911 | ||||||
2.357%, U.S. SOFR + 1.947%, 08/18/31(A) | 1,200,000 | 997,302 | ||||||
0.976%, U.S. SOFR + 0.708%, 05/24/25(A) | 1,450,000 | 1,359,943 | ||||||
Intercontinental Exchange | ||||||||
2.650%, 09/15/40 | 1,485,000 | 1,146,420 | ||||||
JPMorgan Chase | ||||||||
8.750%, 09/01/30 | 1,095,000 | 1,382,978 | ||||||
7.625%, 10/15/26 | 100,000 | 114,215 | ||||||
4.493%, U.S. SOFR + 3.790%, 03/24/31(A) | 1,450,000 | 1,446,644 | ||||||
4.250%, 10/01/27 | 1,199,000 | 1,191,816 | ||||||
4.125%, 12/15/26 | 500,000 | 497,405 | ||||||
4.032%, ICE LIBOR USD 3 MONTH + 1.460%, 07/24/48(A) | 675,000 | 602,635 | ||||||
4.023%, ICE LIBOR USD 3 MONTH + 1.000%, 12/05/24(A) | 1,515,000 | 1,522,294 | ||||||
3.897%, ICE LIBOR USD 3 MONTH + 1.220%, 01/23/49(A) | 270,000 | 238,802 | ||||||
3.797%, ICE LIBOR USD 3 MONTH + 0.890%, 07/23/24(A) | 2,155,000 | 2,165,104 | ||||||
3.625%, 12/01/27 | 240,000 | 231,969 | ||||||
3.328%, U.S. SOFR + 1.580%, 04/22/52(A) | 790,000 | 632,311 | ||||||
2.956%, U.S. SOFR + 2.515%, 05/13/31(A) | 2,895,000 | 2,547,407 | ||||||
2.522%, U.S. SOFR + 2.040%, 04/22/31(A) | 925,000 | 804,445 | ||||||
Lloyds Banking Group | ||||||||
4.650%, 03/24/26 | 1,300,000 | 1,303,602 | ||||||
4.582%, 12/10/25 | 1,953,000 | 1,955,164 | ||||||
4.500%, 11/04/24 | 525,000 | 529,556 | ||||||
The accompanying notes are an integral part of the financial statements.
38
CATHOLIC RESPONSIBLE INVESTMENTS BOND FUND
APRIL 30, 2022 (Unaudited)
| CORPORATE OBLIGATIONS — continued | ||||||||
| Face Amount | Value | |||||||
FINANCIALS — continued |
| |||||||
Macquarie Group | ||||||||
1.340%, U.S. SOFR + 1.069%, 01/12/27(A),(B) | $ | 710,000 | $ | 630,842 | ||||
Metropolitan Life Global Funding I MTN | ||||||||
0.866%, U.S. SOFR + 0.570%, 01/13/23(A),(B) | 3,755,000 | 3,758,417 | ||||||
Mitsubishi UFJ Financial Group | ||||||||
1.538%, US Treas Yield Curve Rate T Note Const Mat 1 Yr + 0.750%, 07/20/27(A) | 1,840,000 | 1,646,019 | ||||||
Morgan Stanley MTN | ||||||||
4.431%, ICE LIBOR USD 3 MONTH + 1.628%, 01/23/30(A) | 395,000 | 391,223 | ||||||
3.950%, 04/23/27 | 1,890,000 | 1,854,046 | ||||||
3.875%, 04/29/24 | 1,485,000 | 1,494,553 | ||||||
3.217%, U.S. SOFR + 1.485%, 04/22/42(A) | 810,000 | 667,038 | ||||||
3.125%, 01/23/23 | 1,685,000 | 1,692,405 | ||||||
3.125%, 07/27/26 | 115,000 | 110,268 | ||||||
National Australia Bank | ||||||||
0.676%, U.S. SOFR + 0.380%, 01/12/25(A),(B) | 6,760,000 | 6,732,200 | ||||||
NatWest Group | ||||||||
6.125%, 12/15/22 | 1,010,000 | 1,027,354 | ||||||
6.000%, 12/19/23 | 3,450,000 | 3,543,984 | ||||||
4.269%, ICE LIBOR USD 3 MONTH + 1.762%, 03/22/25(A) | 1,640,000 | 1,640,992 | ||||||
1.642%, US Treas Yield Curve Rate T Note Const Mat 1 Yr + 0.900%, 06/14/27(A) | 3,025,000 | 2,691,515 | ||||||
Owl Rock Capital | ||||||||
3.400%, 07/15/26 | 1,000,000 | 922,986 | ||||||
2.875%, 06/11/28 | 1,035,000 | 882,491 | ||||||
2.625%, 01/15/27 | 9,170,000 | 8,087,835 | ||||||
OWS Cre Funding I | ||||||||
5.700%, ICE LIBOR USD 1 MONTH + 4.900%, 09/01/23(A),(B) | 3,500,000 | 3,478,125 | ||||||
Santander Holdings USA | ||||||||
3.244%, 10/05/26 | 2,630,000 | 2,502,740 | ||||||
Spirit Realty | ||||||||
3.400%, 01/15/30‡ | 1,330,000 | 1,209,244 | ||||||
| CORPORATE OBLIGATIONS — continued | ||||||||
| Face Amount | Value | |||||||
FINANCIALS — continued |
| |||||||
Truist Bank | ||||||||
2.636%, US Treas Yield Curve Rate T Note Const Mat 5 Yr + 1.150%, 09/17/29(A) | $ | 2,315,000 | $ | 2,242,205 | ||||
UBS Group | ||||||||
1.494%, US Treas Yield Curve Rate T Note Const Mat 5 Yr + 0.850%, 08/10/27(A),(B) | 430,000 | 381,801 | ||||||
UniCredit MTN | ||||||||
7.296%, USD ICE Swap 11:00 NY 5 Yr + 4.914%, 04/02/34(A),(B) | 2,825,000 | 2,856,188 | ||||||
5.459%, US Treas Yield Curve Rate T Note Const Mat 5 Yr + 4.750%, 06/30/35(A),(B) | 1,600,000 | 1,445,079 | ||||||
Unum Group | ||||||||
6.750%, 12/15/28 | 615,000 | 684,722 | ||||||
Wells Fargo MTN | ||||||||
5.013%, U.S. SOFR + 4.502%, 04/04/51(A) | 2,619,480 | 2,741,173 | ||||||
4.300%, 07/22/27 | 1,950,000 | 1,947,855 | ||||||
4.100%, 06/03/26 | 500,000 | 498,061 | ||||||
3.068%, U.S. SOFR + 2.530%, 04/30/41(A) | 575,000 | 463,235 | ||||||
2.188%, U.S. SOFR + 2.000%, 04/30/26(A) | 565,000 | 533,988 | ||||||
2.164%, ICE LIBOR USD 3 MONTH + 0.750%, 02/11/26(A) | 855,000 | 811,464 | ||||||
|
| |||||||
| 207,787,378 | ||||||||
|
| |||||||
HEALTH CARE — 0.8% |
| |||||||
Aetna | ||||||||
2.800%, 06/15/23 | 1,375,000 | 1,371,456 | ||||||
Cigna | ||||||||
7.875%, 05/15/27 | 764,000 | 894,100 | ||||||
4.125%, 11/15/25 | 425,000 | 429,381 | ||||||
3.750%, 07/15/23 | 848,000 | 855,151 | ||||||
CVS Health | ||||||||
5.050%, 03/25/48 | 3,350,000 | 3,397,816 | ||||||
4.780%, 03/25/38 | 1,525,000 | 1,510,994 | ||||||
4.125%, 04/01/40 | 225,000 | 204,889 | ||||||
3.750%, 04/01/30 | 300,000 | 286,959 | ||||||
3.500%, 07/20/22 | 1,635,000 | 1,636,635 | ||||||
Royalty Pharma | ||||||||
1.750%, 09/02/27 | 975,000 | 854,950 | ||||||
Zoetis | ||||||||
4.500%, 11/13/25 | 1,000,000 | 1,029,106 | ||||||
|
| |||||||
| 12,471,437 | ||||||||
|
| |||||||
The accompanying notes are an integral part of the financial statements.
39
CATHOLIC RESPONSIBLE INVESTMENTS BOND FUND
APRIL 30, 2022 (Unaudited)
| CORPORATE OBLIGATIONS — continued | ||||||||
| Face Amount | Value | |||||||
INDUSTRIALS — 1.0% |
| |||||||
BNSF Railway 2007-1 Pass Through Trust | ||||||||
5.996%, 04/01/24 | $ | 10,932 | $ | 11,284 | ||||
Burlington Northern and Santa Fe Railway 2001-1 Pass Through Trust | ||||||||
6.727%, 07/15/22 | 55,980 | 56,094 | ||||||
Burlington Northern and Santa Fe Railway Pass Through Trust, Ser 2006-1 | ||||||||
5.720%, 01/15/24 | 17,249 | 17,679 | ||||||
Burlington Northern Santa Fe | ||||||||
3.750%, 04/01/24 | 1,750,000 | 1,773,036 | ||||||
Caterpillar Financial Services MTN | ||||||||
0.357%, U.S. SOFR + 0.150%, 11/17/22(A) | 5,180,000 | 5,175,155 | ||||||
Cemex | ||||||||
7.375%, 06/05/27(B) | 1,700,000 | 1,789,590 | ||||||
5.450%, 11/19/29(B) | 475,000 | 456,021 | ||||||
5.200%, 09/17/30(B) | 1,950,000 | 1,837,875 | ||||||
CRH America | ||||||||
3.875%, 05/18/25(B) | 1,175,000 | 1,182,167 | ||||||
CSX Transportation | ||||||||
6.251%, 01/15/23 | 33,358 | 34,073 | ||||||
FedEx | ||||||||
5.250%, 05/15/50 | 1,200,000 | 1,231,128 | ||||||
Union Pacific | ||||||||
3.375%, 02/14/42 | 210,000 | 181,626 | ||||||
3.200%, 05/20/41 | 790,000 | 670,839 | ||||||
2.950%, 01/15/23 | 1,975,000 | 1,982,302 | ||||||
Union Pacific Railroad 2002 Pass Through Trust | ||||||||
6.061%, 01/17/23 | 43,678 | 44,280 | ||||||
Union Pacific Railroad 2003 Pass Through Trust | ||||||||
4.698%, 01/02/24 | 1,912 | 1,941 | ||||||
Union Pacific Railroad 2005 Pass Through Trust | ||||||||
5.082%, 01/02/29 | 35,700 | 37,196 | ||||||
Union Pacific Railroad 2007-3 Pass Through Trust | ||||||||
6.176%, 01/02/31 | 23,285 | 25,722 | ||||||
|
| |||||||
| 16,508,008 | ||||||||
|
| |||||||
INFORMATION TECHNOLOGY — 1.1% |
| |||||||
Apple | ||||||||
2.650%, 02/08/51 | 580,000 | 440,782 | ||||||
2.400%, 08/20/50 | 1,380,000 | 1,001,033 | ||||||
| CORPORATE OBLIGATIONS — continued | ||||||||
| Face Amount | Value | |||||||
INFORMATION TECHNOLOGY — continued |
| |||||||
Arrow Electronics | ||||||||
3.875%, 01/12/28 | $ | 1,677,000 | $ | 1,639,767 | ||||
3.250%, 09/08/24 | 1,585,000 | 1,567,792 | ||||||
Broadcom | ||||||||
4.150%, 11/15/30 | 370,000 | 350,921 | ||||||
4.110%, 09/15/28 | 446,000 | 432,106 | ||||||
3.875%, 01/15/27 | 1,720,000 | 1,677,579 | ||||||
Dell International | ||||||||
8.350%, 07/15/46 | 308,000 | 412,010 | ||||||
6.020%, 06/15/26 | 475,000 | 501,750 | ||||||
3.375%, 12/15/41(B) | 210,000 | 157,753 | ||||||
International Business Machines | ||||||||
2.950%, 05/15/50 | 680,000 | 519,404 | ||||||
Microchip Technology | ||||||||
0.983%, 09/01/24(B) | 1,450,000 | 1,360,890 | ||||||
NXP BV | ||||||||
3.875%, 06/18/26(B) | 210,000 | 206,935 | ||||||
Oracle | ||||||||
3.950%, 03/25/51 | 975,000 | 742,902 | ||||||
3.900%, 05/15/35 | 2,005,000 | 1,735,162 | ||||||
3.600%, 04/01/40 | 420,000 | 326,109 | ||||||
2.950%, 04/01/30 | 1,100,000 | 950,000 | ||||||
2.875%, 03/25/31 | 200,000 | 169,005 | ||||||
VMware | ||||||||
4.650%, 05/15/27 | 1,655,000 | 1,678,837 | ||||||
1.400%, 08/15/26 | 750,000 | 672,820 | ||||||
0.600%, 08/15/23 | 600,000 | 580,676 | ||||||
Western Digital | ||||||||
2.850%, 02/01/29 | 420,000 | 371,991 | ||||||
|
| |||||||
| 17,496,224 | ||||||||
|
| |||||||
MATERIALS — 0.1% |
| |||||||
Dow Chemical | ||||||||
9.400%, 05/15/39 | 212,000 | 315,898 | ||||||
7.375%, 11/01/29 | 682,000 | 814,138 | ||||||
Glencore Funding | ||||||||
1.625%, 09/01/25(B) | 195,000 | 179,366 | ||||||
LYB International Finance III | ||||||||
4.200%, 05/01/50 | 200,000 | 174,820 | ||||||
3.375%, 10/01/40 | 1,060,000 | 863,505 | ||||||
2.250%, 10/01/30 | 150,000 | 127,327 | ||||||
|
| |||||||
| 2,475,054 | ||||||||
|
| |||||||
UTILITIES — 1.4% |
| |||||||
Alabama Power | ||||||||
3.700%, 12/01/47 | 1,550,000 | 1,355,198 | ||||||
Berkshire Hathaway Energy | ||||||||
6.125%, 04/01/36 | 54,000 | 61,394 | ||||||
The accompanying notes are an integral part of the financial statements.
40
CATHOLIC RESPONSIBLE INVESTMENTS BOND FUND
APRIL 30, 2022 (Unaudited)
| CORPORATE OBLIGATIONS — continued | ||||||||
| Face Amount | Value | |||||||
UTILITIES — continued |
| |||||||
CenterPoint Energy Houston Electric | ||||||||
3.350%, 04/01/51 | $ | 940,000 | $ | 806,531 | ||||
CenterPoint Energy Resources | ||||||||
1.750%, 10/01/30 | 1,135,000 | 940,628 | ||||||
Commonwealth Edison | ||||||||
4.000%, 03/01/48 | 485,000 | 450,904 | ||||||
Consolidated Edison of New York | ||||||||
4.450%, 03/15/44 | 2,010,000 | 1,914,759 | ||||||
Dominion Energy | ||||||||
5.750%, ICE LIBOR USD 3 MONTH + 3.057%, 10/01/54(A) | 2,100,000 | 2,094,182 | ||||||
Duke Energy Florida | ||||||||
3.850%, 11/15/42 | 385,000 | 343,467 | ||||||
3.200%, 01/15/27 | 655,000 | 640,813 | ||||||
Enel Finance International | ||||||||
6.800%, 09/15/37(B) | 1,725,000 | 2,077,876 | ||||||
6.000%, 10/07/39(B) | 1,050,000 | 1,161,663 | ||||||
Exelon | ||||||||
3.950%, 06/15/25 | 1,120,000 | 1,129,172 | ||||||
MidAmerican Energy MTN | ||||||||
5.800%, 10/15/36 | 320,000 | 365,127 | ||||||
Pacific Gas and Electric | ||||||||
4.950%, 07/01/50 | 1,215,000 | 1,015,963 | ||||||
PacifiCorp | ||||||||
6.350%, 07/15/38 | 690,000 | 813,937 | ||||||
PECO Energy | ||||||||
4.150%, 10/01/44 | 825,000 | 785,816 | ||||||
3.000%, 09/15/49 | 845,000 | 666,127 | ||||||
Southern | ||||||||
4.000%, US Treas Yield Curve Rate T Note Const Mat 5 Yr + 3.733%, 01/15/51(A) | 2,225,000 | 2,110,524 | ||||||
3.750%, US Treas Yield Curve Rate T Note Const Mat 5 Yr + 2.915%, 09/15/51(A) | 2,325,000 | 2,092,500 | ||||||
Union Electric | ||||||||
3.900%, 04/01/52 | 1,910,000 | 1,743,468 | ||||||
Virginia Electric and Power | ||||||||
4.650%, 08/15/43 | 580,000 | 579,508 | ||||||
|
| |||||||
| 23,149,557 | ||||||||
|
| |||||||
Total Corporate Obligations | 444,678,866 | |||||||
|
| |||||||
| ASSET-BACKED SECURITIES — 5.7% | ||||||||
| Face Amount | Value | |||||||
Automotive — 2.4% |
| |||||||
American Credit Acceptance Receivables Trust 2022-2, Ser 2022-2, Cl D | ||||||||
4.850%, 06/13/28 (B) | $ | 2,220,000 | $ | 2,228,780 | ||||
CAL Receivables 2022-1, Ser 2022-1, Cl B | ||||||||
0.000%, SOFR30A + 4.350%, 10/15/22 (A),(B),(C) | 2,520,000 | 2,469,600 | ||||||
Carmax Auto Owner Trust 2019-2, Ser 2019-2, Cl D | ||||||||
3.410%, 10/15/25 | 1,700,000 | 1,702,720 | ||||||
Carvana Auto Receivables Trust 2019-1, Ser 2019-1A, Cl D | ||||||||
3.880%, 10/15/24 (B) | 3,641,955 | 3,657,744 | ||||||
Carvana Auto Receivables Trust 2019-2, Ser 2019-2A, Cl D | ||||||||
3.280%, 01/15/25 (B) | 3,200,000 | 3,205,929 | ||||||
Credit Acceptance Auto Loan Trust 2020-3, Ser 2020-3A, Cl C | ||||||||
2.280%, 02/15/30 (B) | 1,040,000 | 995,700 | ||||||
Drive Auto Receivables Trust 2018-5, Ser 2018-5, Cl D | ||||||||
4.300%, 04/15/26 | 2,265,844 | 2,283,894 | ||||||
Drive Auto Receivables Trust 2019-3, Ser 2019-3, Cl D | ||||||||
3.180%, 10/15/26 | 4,035,000 | 4,039,390 | ||||||
Drive Auto Receivables Trust 2020-1, Ser 2020-1, Cl D | ||||||||
2.700%, 05/17/27 | 2,230,000 | 2,218,247 | ||||||
Drive Auto Receivables Trust 2020-2, Ser 2020-2, Cl D | ||||||||
3.050%, 05/15/28 | 2,200,000 | 2,190,362 | ||||||
Exeter Automobile Receivables Trust 2022-2, Ser 2022-2A, Cl D | ||||||||
4.560%, 07/17/28 | 2,000,000 | 1,986,333 | ||||||
Flagship Credit Auto Trust, Ser 2019-3, Cl E | ||||||||
3.840%, 12/15/26 (B) | 3,825,000 | 3,722,139 | ||||||
Ford Credit Auto Owner Trust 2021-REV1, Ser 2021-1, Cl D | ||||||||
2.310%, 10/17/33 (B) | 1,500,000 | 1,375,762 | ||||||
Santander Drive Auto Receivables Trust 2019-1, Ser 2019-1, Cl D | ||||||||
3.650%, 04/15/25 | 2,120,824 | 2,130,247 | ||||||
The accompanying notes are an integral part of the financial statements.
41
CATHOLIC RESPONSIBLE INVESTMENTS BOND FUND
APRIL 30, 2022 (Unaudited)
| ASSET-BACKED SECURITIES — continued | ||||||||
| Face Amount | Value | |||||||
Santander Drive Auto Receivables Trust 2019-2, Ser 2019-2, Cl D | ||||||||
3.220%, 07/15/25 | $ | 4,000,000 | $ | 4,007,474 | ||||
Santander Drive Auto Receivables Trust 2020-1, Ser 2020-1, Cl C | ||||||||
4.110%, 12/15/25 | 1,180,000 | 1,190,214 | ||||||
|
| |||||||
| 39,404,535 | ||||||||
|
| |||||||
Other Asset-Backed Securities — 3.3% |
| |||||||
AEP Texas Central Transition Funding III, Ser 2012-1, Cl A3 | ||||||||
2.845%, 03/01/26 | 87,543 | 87,325 | ||||||
Benefit Street Partners CLO V-B, Ser 2018-5BA, Cl B | ||||||||
3.213%, ICE LIBOR USD 3 MONTH + 2.150%, 04/20/31 (A),(B) | 2,750,000 | 2,720,438 | ||||||
CASC 2019-NRM1 | ||||||||
0.000%, 11/25/49 (C) | 1,185,781 | 1,050,579 | ||||||
DRIVEN BRANDS FUNDING, Ser 2019-1A, Cl A2 | ||||||||
4.641%, 04/20/49 (B) | 3,149,213 | 3,087,831 | ||||||
KKR CLO 41, Ser 2022-41A, Cl C 2.942%, TSFR3M + 2.250%, 04/15/35 (A),(B) | 3,500,000 | 3,461,136 | ||||||
Madison Park Funding XXI, Ser 2021-21A, Cl BRR 3.244%, ICE LIBOR USD 3 MONTH + | 1,250,000 | 1,236,935 | ||||||
Navient Student Loan Trust 2016-5, Ser 2016-5A, Cl A 1.918%, ICE LIBOR USD 1 MONTH + | 955,504 | 960,388 | ||||||
Navient Student Loan Trust 2018-2, Ser 2018-2A, Cl A3 1.418%, ICE LIBOR USD 1 MONTH + | 8,539,000 | 8,425,977 | ||||||
Navient Student Loan Trust 2021-1, Ser 2021-1A, Cl A1B 1.268%, ICE LIBOR USD 1 MONTH + | 5,275,036 | 5,229,736 | ||||||
Neuberger Berman Loan Advisers CLO, Ser 2022-47A, Cl C 2.298%, TSFR3M + 2.050%, 04/14/35 (A),(B) | 6,000,000 | 5,933,034 | ||||||
| ASSET-BACKED SECURITIES — continued | ||||||||
| Face Amount | Value | |||||||
Santander Drive Auto Receivables Trust 2020-3, Ser 2020-3, Cl D | ||||||||
1.640%, 11/16/26 | $ | 2,430,000 | $ | 2,372,583 | ||||
SBAP 2004-20K 1 | ||||||||
4.880%, 11/01/24 | 2,921 | 2,940 | ||||||
SBAP 2006-20B 1 | ||||||||
5.350%, 02/01/26 | 1,898 | 1,920 | ||||||
SBAP 2006-20C 1 | ||||||||
5.570%, 03/01/26 | 1,864 | 1,885 | ||||||
SBAP 2007-20C 1 | ||||||||
5.230%, 03/01/27 | 1,800 | 1,812 | ||||||
SLM Student Loan Trust 2004-3, Ser 2014-3A, Cl A 6B 1.734%, ICE LIBOR USD 3 MONTH + 0.550%, 10/25/64 (A),(B) | 6,467,554 | 6,296,312 | ||||||
SLM Student Loan Trust 2009-3, Ser 2009-3, Cl A 1.418%, ICE LIBOR USD 1 MONTH + 0.750%, 01/25/45 (A),(B) | 3,502,906 | 3,460,596 | ||||||
SMB Private Education Loan Trust 2018-A, Ser 2018-A, Cl A2A 3.500%, 02/15/36 (B) | 2,191,731 | 2,177,022 | ||||||
SOUND POINT CLO XXII, Ser 2021-1A, Cl CR 3.313%, ICE LIBOR USD 3 MONTH + 2.250%, 01/20/32 (A),(B) | 3,480,000 | 3,443,999 | ||||||
TICP CLO XI, Ser 2018-11A, Cl E 7.063%, ICE LIBOR USD 3 MONTH + | 2,230,000 | 2,153,330 | ||||||
United States Small Business Administration, Ser 2003-20B, Cl 1 | ||||||||
4.840%, 02/01/23 | 1,162 | 1,170 | ||||||
United States Small Business Administration, Ser 2003-20J, Cl 1 | ||||||||
4.920%, 10/01/23 | 998 | 1,005 | ||||||
United States Small Business Administration, Ser 2003-20K, Cl 1 | ||||||||
4.980%, 11/01/23 | 2,367 | 2,387 | ||||||
United States Small Business Administration, Ser 2004-20L, Cl 1 | ||||||||
4.870%, 12/01/24 | 2,646 | 2,648 | ||||||
The accompanying notes are an integral part of the financial statements.
42
CATHOLIC RESPONSIBLE INVESTMENTS BOND FUND
APRIL 30, 2022 (Unaudited)
| ASSET-BACKED SECURITIES — continued | ||||||||
| Face Amount | Value | |||||||
United States Small Business Administration, Ser 2005-20A, Cl 1 | ||||||||
4.860%, 01/01/25 | $ | 919 | $ | 922 | ||||
United States Small Business Administration, Ser 2005-20E, Cl 1 | ||||||||
4.840%, 05/01/25 | 777 | 779 | ||||||
United States Small Business Administration, Ser 2005-20G, Cl 1 | ||||||||
4.750%, 07/01/25 | 4,067 | 4,065 | ||||||
United States Small Business Administration, Ser 2005-20H, Cl 1 | ||||||||
5.110%, 08/01/25 | 6,791 | 6,830 | ||||||
United States Small Business Administration, Ser 2006-20F, Cl 1 | ||||||||
5.820%, 06/01/26 | 1,164 | 1,171 | ||||||
United States Small Business Administration, Ser 2006-20G, Cl 1 | ||||||||
6.070%, 07/01/26 | 3,490 | 3,540 | ||||||
United States Small Business Administration, Ser 2006-20H, Cl 1 | ||||||||
5.700%, 08/01/26 | 2,045 | 2,095 | ||||||
United States Small Business Administration, Ser 2007-20E, Cl 1 | ||||||||
5.310%, 05/01/27 | 2,750 | 2,791 | ||||||
United States Small Business Administration, Ser 2007-20F, Cl 1 | ||||||||
5.710%, 06/01/27 | 6,163 | 6,288 | ||||||
Wellfleet CLO X, Ser 2021-XA, Cl BR | ||||||||
3.263%, ICE LIBOR USD 3 MONTH + | 2,000,000 | 1,979,908 | ||||||
|
| |||||||
| 54,121,377 | ||||||||
|
| |||||||
Total Asset-Backed Securities | 93,525,912 | |||||||
|
| |||||||
| MUNICIPAL BONDS — 0.5% | ||||||||
| Face Amount | Value | |||||||
California — 0.2% |
| |||||||
Los Angeles Unified School District, Ser RY | ||||||||
6.758%, 07/01/34 | $ | 150,000 | $ | 180,018 | ||||
Regents of the University of California Medical Center Pooled Revenue | ||||||||
4.563%, 05/15/53 | 875,000 | 876,757 | ||||||
State of California | ||||||||
7.500%, 04/01/34 | 1,150,000 | 1,511,179 | ||||||
7.300%, 10/01/39 | 1,075,000 | 1,420,623 | ||||||
|
| |||||||
| 3,988,577 | ||||||||
|
| |||||||
Illinois — 0.2% |
| |||||||
State of Illinois | ||||||||
5.100%, 06/01/33 | 2,750,000 | 2,814,044 | ||||||
|
| |||||||
New Jersey — 0.1% |
| |||||||
New Jersey Turnpike Authority | ||||||||
7.414%, 01/01/40 | 350,000 | 475,302 | ||||||
7.102%, 01/01/41 | 1,350,000 | 1,784,521 | ||||||
|
| |||||||
| 2,259,823 | ||||||||
|
| |||||||
Total Municipal Bonds | 9,062,444 | |||||||
|
| |||||||
| PREFERRED STOCK — 0.3% | ||||||||
| Shares | Value | |||||||
FINANCIALS — 0.3% |
| |||||||
Citigroup Capital XIII, 7.609%, ICE LIBOR USD 3 MONTH + 6.370%, 10/30/40 | 156,815 | $ | 4,251,255 | |||||
|
| |||||||
Total Preferred Stock | 4,251,255 | |||||||
|
| |||||||
Total Investments in Securities— 98.7% |
| $ | 1,627,219,920 | |||||
|
| |||||||
|
| |||||||
Percentages are based on net assets of $1,649,333,383.
The accompanying notes are an integral part of the financial statements.
43
CATHOLIC RESPONSIBLE INVESTMENTS BOND FUND
APRIL 30, 2022 (Unaudited)
A list of the open futures contracts held by the Fund at April 30, 2022, is as follows:
| Type of Contract | Number Contracts | Expiration Date | Notional Amount | Value | Unrealized Depreciation | |||||||||||||||
Long Contracts U.S. Ultra Long Treasury Bond | 86 | Jun-2022 | $ | 15,675,306 | $ | 13,797,625 | $ | (1,877,681 | ) | |||||||||||
|
|
|
|
|
| |||||||||||||||
| ‡ | Real Estate Investment Trust. |
| (A) | Variable or floating rate security. The rate shown is the effective interest rate as of period end. The rates for certain securities are not based on published reference rates and spreads and are either determined by the issuer or agent based on current market conditions; by using a formula based on the rates of underlying loans; or by adjusting periodically based on prevailing interest rates. |
| (B) | Securities sold within the terms of a private placement memorandum, exempt from registration under section 144A of the Securities Act of 1933, as amended, and maybe sold only to dealers in the program or other “accredited investors”. The total value of these securities at April 30, 2022 was $287,970,846 and represented 17.5% of Net Assets. |
| (C) | No interest rate available. |
| Cl — Class |
| CLO — Collateralized Loan Obligation |
| DAC — Designated Activity Company |
| FHLMC — Federal Home Loan Mortgage Corporation |
| FNMA — Federal National Mortgage Association |
| FREMF— Freddie Mac Multi-Family |
| GNMA — Government National Mortgage Association |
| ICE— Intercontinental Exchange |
| LIBOR— London Interbank Offered Rate |
| LLC — Limited Liability Company |
| MTN — Medium Term Note |
| REMIC — Real Estate Mortgage Investment Conduit |
| Ser — Series |
| SOFR — Secured Overnight Financing Rate |
| SOFR30A — Secured Overnight Financing Rate 30-day Average |
| SOFRINDX — Secured Overnight Financing Rate Index |
| STACR — Structured Agency Credit Risk |
| TSFR3M — Term Structured Financing Rate 3 Month Average |
The following is a list of the inputs used as of April 30, 2022 in valuing the Fund’s investments and other financial instruments carried at value:
| Investments in Securities | Level 1 | Level 2 | Level 3 | Total | ||||||||||||
U.S. Treasury Obligations | $ | 141,258,017 | $ | 467,810,571 | $ | – | $ | 609,068,588 | ||||||||
Corporate Obligations | – | 444,678,866 | – | 444,678,866 | ||||||||||||
Mortgage-Backed Securities | – | 466,632,855 | – | 466,632,855 | ||||||||||||
Municipal Bonds | – | 9,062,444 | – | 9,062,444 | ||||||||||||
Asset-Backed Securities | – | 93,525,912 | – | 93,525,912 | ||||||||||||
Preferred Stock | 4,251,255 | – | – | 4,251,255 | ||||||||||||
|
|
|
|
|
|
|
| |||||||||
Total Investments in Securities | $ | 145,509,272 | $ | 1,481,710,648 | $ | – | $ | 1,627,219,920 | ||||||||
|
|
|
|
|
|
|
| |||||||||
| Other Financial Instruments | Level 1 | Level 2 | Level 3 | Total | ||||||||||||||||
Futures Contracts* | ||||||||||||||||||||
Unrealized Depreciation | $ | (1,877,681 | ) | $ | – | $ | – | $ | (1,877,681 | ) | ||||||||||
|
|
|
|
|
|
|
| |||||||||||||
Total Other Financial Instruments | $ | (1,877,681 | ) | $ | – | $ | – | $ | (1,877,681 | ) | ||||||||||
|
| |||||||||||||||||||
|
| |||||||||||||||||||
* Futures contracts are valued at the unrealized depreciation on the instrument.
Amounts designated as “–” are $0 or have been round to $0.
For more information on valuation inputs, see Note 2 — Significant Accounting Policies in the Notes to Financial Statements.
The accompanying notes are an integral part of the financial statements.
44
CATHOLIC RESPONSIBLE INVESTMENTS EQUITY INDEX FUND
APRIL 30, 2022 (Unaudited)
| SECTOR WEIGHTINGS † | ||||
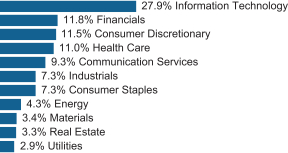
| † | Percentages are based on total investments. Total investments do not include derivatives such as options, futures contracts, forward contracts, and swap contracts, if applicable. |
SCHEDULE OF INVESTMENTS
COMMON STOCK — 99.8% | ||||||||
| Shares | Value | |||||||
COMMUNICATION SERVICES — 9.3% |
| |||||||
Activision Blizzard | 67,715 | $ | 5,119,254 | |||||
Alphabet, Cl A * | 26,821 | 61,210,618 | ||||||
Alphabet, Cl C * | 25,252 | 58,062,681 | ||||||
AT&T | 854,521 | 16,116,266 | ||||||
Charter Communications, Cl A * | 10,778 | 4,618,265 | ||||||
Comcast, Cl A | 396,105 | 15,749,135 | ||||||
DISH Network, Cl A * | 11,336 | 323,189 | ||||||
Electronic Arts | 24,581 | 2,901,787 | ||||||
Fox | 12,742 | 423,544 | ||||||
Fox | 28,386 | 1,017,354 | ||||||
Interpublic Group of | 34,079 | 1,111,657 | ||||||
Lumen Technologies | 81,877 | 823,683 | ||||||
Match Group * | 24,604 | 1,947,407 | ||||||
Meta Platforms, Cl A * | 207,146 | 41,526,559 | ||||||
Netflix * | 38,473 | 7,323,720 | ||||||
News | 34,132 | 677,861 | ||||||
News | 10,637 | 211,783 | ||||||
Omnicom Group | 54,590 | 4,155,937 | ||||||
Paramount Global, Cl B | 53,780 | 1,566,074 | ||||||
Take-Two Interactive Software * | 10,058 | 1,202,031 | ||||||
T-Mobile US * | 64,473 | 7,939,205 | ||||||
Twitter * | 69,479 | 3,405,861 | ||||||
Verizon Communications | 505,195 | 23,390,528 | ||||||
Walt Disney * | 157,768 | 17,611,642 | ||||||
Warner Bros Discovery * | 249,827 | 4,534,360 | ||||||
|
| |||||||
| 282,970,401 | ||||||||
|
| |||||||
| COMMON STOCK — continued | ||||||||
| Shares | Value | |||||||
CONSUMER DISCRETIONARY — 11.5% |
| |||||||
Advance Auto Parts | 5,487 | $ | 1,095,370 | |||||
Amazon.com * | 39,377 | 97,876,653 | ||||||
Aptiv * | 20,826 | 2,215,886 | ||||||
AutoZone * | 1,793 | 3,506,158 | ||||||
Bath & Body Works | 23,027 | 1,217,898 | ||||||
Best Buy | 19,195 | 1,726,206 | ||||||
Booking Holdings * | 3,611 | 7,981,429 | ||||||
BorgWarner | 20,842 | 767,611 | ||||||
CarMax * | 14,061 | 1,206,153 | ||||||
Carnival * | 69,922 | 1,209,651 | ||||||
Chipotle Mexican Grill, Cl A * | 2,406 | 3,502,198 | ||||||
Darden Restaurants | 11,297 | 1,488,154 | ||||||
Dollar General | 20,248 | 4,809,507 | ||||||
Dollar Tree * | 19,530 | 3,172,648 | ||||||
Domino’s Pizza | 3,211 | 1,085,318 | ||||||
DR Horton | 28,316 | 1,970,510 | ||||||
eBay | 54,375 | 2,823,150 | ||||||
Etsy * | 11,040 | 1,028,818 | ||||||
Expedia Group * | 14,554 | 2,543,311 | ||||||
Ford Motor | 342,817 | 4,854,289 | ||||||
Garmin | 13,191 | 1,447,580 | ||||||
General Motors * | 126,116 | 4,781,058 | ||||||
Genuine Parts | 12,377 | 1,609,629 | ||||||
Hasbro | 11,285 | 993,757 | ||||||
Hilton Worldwide Holdings | 24,231 | 3,762,832 | ||||||
Home Depot | 94,392 | 28,355,357 | ||||||
Las Vegas Sands * | 29,871 | 1,058,330 | ||||||
Lennar, Cl A | 23,650 | 1,808,988 | ||||||
LKQ | 23,320 | 1,157,372 | ||||||
Lowe’s | 60,204 | 11,904,137 | ||||||
Marriott International, Cl A | 23,791 | 4,223,378 | ||||||
McDonald’s | 64,891 | 16,168,242 | ||||||
Mohawk Industries * | 4,791 | 675,818 | ||||||
NIKE, Cl B | 111,055 | 13,848,558 | ||||||
Norwegian Cruise Line Holdings * | 32,171 | 644,385 | ||||||
NVR * | 280 | 1,225,339 | ||||||
O’Reilly Automotive * | 5,861 | 3,554,990 | ||||||
Penn National Gaming * | 7,308 | 267,254 | ||||||
Pool | 3,528 | 1,429,616 | ||||||
PulteGroup | 21,961 | 917,091 | ||||||
PVH | 6,066 | 441,483 | ||||||
Ralph Lauren, Cl A | 4,267 | 445,219 | ||||||
Ross Stores | 30,904 | 3,083,292 | ||||||
Starbucks | 102,486 | 7,649,555 | ||||||
Tapestry | 23,910 | 787,117 | ||||||
Target | 42,428 | 9,701,162 | ||||||
Tesla * | 72,802 | 63,393,070 | ||||||
TJX | 104,498 | 6,403,637 | ||||||
Tractor Supply | 9,931 | 2,000,600 | ||||||
Ulta Beauty * | 4,748 | 1,884,006 | ||||||
The accompanying notes are an integral part of the financial statements.
45
CATHOLIC RESPONSIBLE INVESTMENTS EQUITY INDEX FUND
APRIL 30, 2022 (Unaudited)
| COMMON STOCK — continued | ||||||||
| Shares | Value | |||||||
CONSUMER DISCRETIONARY — continued |
| |||||||
Under Armour, Cl A * | 23,735 | $ | 364,570 | |||||
Under Armour, Cl C * | 18,707 | 265,452 | ||||||
VF | 28,170 | 1,464,840 | ||||||
Whirlpool | 5,294 | 960,967 | ||||||
Wynn Resorts * | 9,142 | 644,328 | ||||||
Yum! Brands | 25,463 | 2,979,426 | ||||||
|
| |||||||
| 348,383,353 | ||||||||
|
| |||||||
CONSUMER STAPLES — 7.3% |
| |||||||
Archer-Daniels-Midland | 48,649 | 4,357,004 | ||||||
Brown-Forman, Cl B | 15,973 | 1,077,219 | ||||||
Campbell Soup | 27,587 | 1,302,658 | ||||||
Clorox | 11,775 | 1,689,359 | ||||||
Coca-Cola | 441,928 | 28,552,968 | ||||||
Colgate-Palmolive | 167,660 | 12,918,203 | ||||||
Conagra Brands | 41,510 | 1,449,944 | ||||||
Constellation Brands, Cl A | 14,245 | 3,505,552 | ||||||
Costco Wholesale | 56,245 | 29,906,591 | ||||||
Estee Lauder, Cl A | 48,503 | 12,807,702 | ||||||
General Mills | 69,560 | 4,919,979 | ||||||
Hershey | 23,469 | 5,298,596 | ||||||
Hormel Foods | 146,817 | 7,691,743 | ||||||
J M Smucker | 22,688 | 3,106,668 | ||||||
Kellogg | 23,994 | 1,643,589 | ||||||
Kimberly-Clark | 60,065 | 8,338,824 | ||||||
Kraft Heinz | 61,656 | 2,628,395 | ||||||
Kroger | 58,742 | 3,169,718 | ||||||
Lamb Weston Holdings | 34,736 | 2,296,050 | ||||||
McCormick | 21,636 | 2,175,933 | ||||||
Molson Coors Beverage, Cl B | 20,928 | 1,133,042 | ||||||
Mondelez International, Cl A | 158,628 | 10,228,334 | ||||||
Monster Beverage * | 32,643 | 2,796,852 | ||||||
PepsiCo | 164,400 | 28,229,124 | ||||||
Sysco | 44,518 | 3,805,399 | ||||||
Tyson Foods, Cl A | 26,877 | 2,503,861 | ||||||
Walgreens Boots Alliance | 62,437 | 2,647,329 | ||||||
Walmart | 213,805 | 32,710,027 | ||||||
|
| |||||||
| 222,890,663 | ||||||||
|
| |||||||
ENERGY — 4.3% |
| |||||||
APA | 23,552 | 963,983 | ||||||
Baker Hughes, Cl A | 76,031 | 2,358,482 | ||||||
Chevron | 169,425 | 26,543,815 | ||||||
ConocoPhillips | 114,619 | 10,948,407 | ||||||
Coterra Energy | 228,839 | 6,588,275 | ||||||
Devon Energy | 49,580 | 2,884,068 | ||||||
Diamondback Energy | 14,761 | 1,863,281 | ||||||
EOG Resources | 50,826 | 5,934,444 | ||||||
| COMMON STOCK — continued | ||||||||
| Shares | Value | |||||||
ENERGY — continued |
| |||||||
Exxon Mobil | 371,683 | $ | 31,685,976 | |||||
Halliburton | 77,713 | 2,768,137 | ||||||
Hess | 23,963 | 2,469,866 | ||||||
Kinder Morgan | 169,414 | 3,074,864 | ||||||
Marathon Oil | 54,941 | 1,369,130 | ||||||
Marathon Petroleum | 53,394 | 4,659,160 | ||||||
Occidental Petroleum | 77,087 | 4,246,723 | ||||||
ONEOK | 38,696 | 2,450,618 | ||||||
Phillips 66 | 38,108 | 3,306,250 | ||||||
Pioneer Natural Resources | 19,713 | 4,582,681 | ||||||
Schlumberger | 121,842 | 4,753,056 | ||||||
Valero Energy | 35,573 | 3,965,678 | ||||||
Williams | 105,547 | 3,619,207 | ||||||
|
| |||||||
| 131,036,101 | ||||||||
|
| |||||||
FINANCIALS — 11.8% |
| |||||||
Aflac | 52,844 | 3,026,904 | ||||||
Allstate | 24,911 | 3,152,238 | ||||||
American Express | 54,543 | 9,529,208 | ||||||
American International Group | 72,126 | 4,220,092 | ||||||
Ameriprise Financial | 9,767 | 2,593,041 | ||||||
Aon, Cl A | 19,139 | 5,511,841 | ||||||
Arthur J Gallagher | 18,023 | 3,036,695 | ||||||
Assurant | 5,811 | 1,056,905 | ||||||
Bank of America | 625,669 | 22,323,870 | ||||||
Bank of New York Mellon | 65,995 | 2,775,750 | ||||||
Berkshire Hathaway, Cl B * | 195,588 | 63,141,674 | ||||||
BlackRock, Cl A | 12,410 | 7,752,279 | ||||||
Brown & Brown | 20,300 | 1,258,194 | ||||||
Capital One Financial | 36,991 | 4,609,818 | ||||||
Cboe Global Markets | 9,218 | 1,041,450 | ||||||
Charles Schwab | 146,649 | 9,727,228 | ||||||
Chubb | 37,429 | 7,727,217 | ||||||
Cincinnati Financial | 13,051 | 1,600,836 | ||||||
Citigroup | 172,381 | 8,310,488 | ||||||
Citizens Financial Group | 37,049 | 1,459,731 | ||||||
CME Group, Cl A | 51,119 | 11,212,441 | ||||||
Comerica | 11,457 | 938,328 | ||||||
Discover Financial Services | 25,459 | 2,863,119 | ||||||
Everest Re Group | 3,466 | 952,145 | ||||||
FactSet Research Systems | 3,319 | 1,339,183 | ||||||
Fifth Third Bancorp | 59,326 | 2,226,505 | ||||||
First Republic Bank | 15,527 | 2,316,939 | ||||||
Franklin Resources | 24,460 | 601,471 | ||||||
Globe Life | 8,043 | 788,857 | ||||||
Goldman Sachs Group | 29,524 | 9,019,287 | ||||||
Hartford Financial Services Group | 29,649 | 2,073,354 | ||||||
Huntington Bancshares | 125,651 | 1,652,311 | ||||||
The accompanying notes are an integral part of the financial statements.
46
CATHOLIC RESPONSIBLE INVESTMENTS EQUITY INDEX FUND
APRIL 30, 2022 (Unaudited)
| COMMON STOCK — continued | ||||||||
| Shares | Value | |||||||
FINANCIALS — continued |
| |||||||
Intercontinental Exchange | 48,972 | $ | 5,671,447 | |||||
Invesco | 29,686 | 545,629 | ||||||
JPMorgan Chase | 256,781 | 30,649,380 | ||||||
KeyCorp | 80,867 | 1,561,542 | ||||||
Lincoln National | 14,753 | 887,393 | ||||||
Loews | 17,443 | 1,096,118 | ||||||
M&T Bank | 22,059 | 3,675,912 | ||||||
MarketAxess Holdings | 4,803 | 1,266,119 | ||||||
Marsh & McLennan | 43,869 | 7,093,617 | ||||||
MetLife | 80,729 | 5,302,281 | ||||||
Moody’s | 14,029 | 4,439,898 | ||||||
Morgan Stanley | 146,115 | 11,775,408 | ||||||
MSCI, Cl A | 7,149 | 3,011,516 | ||||||
Nasdaq | 10,208 | 1,606,433 | ||||||
Northern Trust | 18,055 | 1,860,568 | ||||||
PNC Financial Services Group | 36,737 | 6,102,016 | ||||||
Principal Financial Group | 21,339 | 1,454,040 | ||||||
Progressive | 50,824 | 5,456,465 | ||||||
Prudential Financial | 32,820 | 3,561,298 | ||||||
Raymond James Financial | 16,236 | 1,582,360 | ||||||
Regions Financial | 82,780 | 1,715,202 | ||||||
S&P Global | 30,784 | 11,590,176 | ||||||
Signature Bank NY | 5,284 | 1,280,049 | ||||||
State Street | 31,776 | 2,128,039 | ||||||
SVB Financial Group * | 5,118 | 2,495,741 | ||||||
Synchrony Financial | 47,561 | 1,750,720 | ||||||
T Rowe Price Group | 19,517 | 2,401,372 | ||||||
Travelers | 21,334 | 3,649,394 | ||||||
Truist Financial | 115,934 | 5,605,409 | ||||||
US Bancorp | 117,238 | 5,693,077 | ||||||
W R Berkley | 18,345 | 1,219,759 | ||||||
Wells Fargo | 385,235 | 16,807,803 | ||||||
Willis Towers Watson | 10,854 | 2,332,090 | ||||||
Zions Bancorp | 13,609 | 769,044 | ||||||
|
| |||||||
| 357,876,714 | ||||||||
|
| |||||||
HEALTH CARE — 11.0% |
| |||||||
ABIOMED * | 6,203 | 1,777,656 | ||||||
Align Technology * | 7,551 | 2,189,110 | ||||||
AmerisourceBergen, Cl A | 89,060 | 13,473,887 | ||||||
Boston Scientific * | 281,145 | 11,839,016 | ||||||
Cardinal Health | 110,079 | 6,390,086 | ||||||
Cerner | 72,159 | 6,756,969 | ||||||
Cigna | 75,432 | 18,615,109 | ||||||
CVS Health | 258,340 | 24,834,224 | ||||||
DaVita * | 33,248 | 3,603,086 | ||||||
DENTSPLY SIRONA | 58,040 | 2,321,020 | ||||||
Dexcom * | 15,560 | 6,357,505 | ||||||
Edwards Lifesciences * | 117,534 | 12,432,747 | ||||||
Henry Schein * | 42,350 | 3,434,585 | ||||||
| COMMON STOCK — continued | ||||||||
| Shares | Value | |||||||
HEALTH CARE — continued |
| |||||||
Hologic * | 52,151 | $ | 3,754,351 | |||||
Humana | 29,445 | 13,090,069 | ||||||
IDEXX Laboratories * | 15,241 | 6,560,946 | ||||||
Incyte * | 187,158 | 14,029,364 | ||||||
Intuitive Surgical * | 44,764 | 10,712,025 | ||||||
IQVIA Holdings * | 84,486 | 18,417,103 | ||||||
Laboratory Corp of America Holdings | 25,287 | 6,075,960 | ||||||
McKesson | 28,431 | 8,802,522 | ||||||
Medtronic | 240,970 | 25,147,629 | ||||||
Mettler-Toledo International * | 13,814 | 17,647,799 | ||||||
Molina Healthcare * | 15,332 | 4,805,815 | ||||||
Quest Diagnostics | 33,943 | 4,542,931 | ||||||
ResMed | 28,866 | 5,772,334 | ||||||
STERIS | 24,217 | 5,425,819 | ||||||
Stryker | 69,693 | 16,814,133 | ||||||
Teleflex | 12,104 | 3,457,144 | ||||||
Waters * | 44,757 | 13,562,266 | ||||||
West Pharmaceutical Services | 44,415 | 13,993,390 | ||||||
Zimmer Biomet Holdings | 51,780 | 6,252,435 | ||||||
Zoetis, Cl A | 124,859 | 22,131,258 | ||||||
|
| |||||||
| 335,020,293 | ||||||||
|
| |||||||
INDUSTRIALS — 7.3% |
| |||||||
3M | 102,524 | 14,786,011 | ||||||
A O Smith | 11,556 | 675,217 | ||||||
Alaska Air Group * | 10,923 | 594,102 | ||||||
Allegion | 7,769 | 887,531 | ||||||
American Airlines Group * | 56,276 | 1,056,301 | ||||||
AMETEK | 24,095 | 3,042,235 | ||||||
Carrier Global | 81,486 | 3,118,469 | ||||||
Caterpillar | 81,162 | 17,087,847 | ||||||
CH Robinson Worldwide | 11,313 | 1,200,875 | ||||||
Cintas | 7,615 | 3,025,135 | ||||||
Copart * | 18,545 | 2,107,639 | ||||||
CSX | 192,782 | 6,620,134 | ||||||
Cummins | 12,449 | 2,355,226 | ||||||
Deere | 43,078 | 16,264,099 | ||||||
Delta Air Lines * | 55,594 | 2,392,210 | ||||||
Dover | 19,096 | 2,545,497 | ||||||
Eaton | 64,230 | 9,314,635 | ||||||
Emerson Electric | 82,683 | 7,456,353 | ||||||
Equifax | 10,631 | 2,163,621 | ||||||
Expeditors International of Washington | 14,684 | 1,454,744 | ||||||
Fastenal | 69,329 | 3,834,587 | ||||||
FedEx | 21,197 | 4,212,692 | ||||||
Fortive | 34,650 | 1,992,375 | ||||||
The accompanying notes are an integral part of the financial statements.
47
CATHOLIC RESPONSIBLE INVESTMENTS EQUITY INDEX FUND
APRIL 30, 2022 (Unaudited)
| COMMON STOCK — continued | ||||||||
| Shares | Value | |||||||
INDUSTRIALS — continued |
| |||||||
Fortune Brands Home & Security | 8,076 | $ | 575,415 | |||||
Generac Holdings * | 5,494 | 1,205,274 | ||||||
Howmet Aerospace | 157,709 | 5,381,031 | ||||||
IDEX | 6,601 | 1,253,002 | ||||||
Illinois Tool Works | 48,435 | 9,547,023 | ||||||
Ingersoll Rand | 35,443 | 1,558,074 | ||||||
JB Hunt Transport Services | 7,283 | 1,244,301 | ||||||
Johnson Controls International | 104,424 | 6,251,865 | ||||||
Masco | 15,191 | 800,414 | ||||||
Nielsen Holdings | 31,139 | 834,837 | ||||||
Nordson | 4,721 | 1,018,272 | ||||||
Norfolk Southern | 21,106 | 5,442,815 | ||||||
Old Dominion Freight Line | 8,065 | 2,259,168 | ||||||
Otis Worldwide | 56,600 | 4,122,744 | ||||||
PACCAR | 37,667 | 3,128,244 | ||||||
Parker-Hannifin | 15,301 | 4,143,817 | ||||||
Pentair | 14,388 | 730,191 | ||||||
Quanta Services | 12,384 | 1,436,296 | ||||||
Republic Services, Cl A | 18,194 | 2,442,908 | ||||||
Robert Half International | 9,719 | 955,475 | ||||||
Rockwell Automation | 14,409 | 3,640,722 | ||||||
Rollins | 19,670 | 659,732 | ||||||
Snap-on | 4,694 | 997,428 | ||||||
Southwest Airlines * | 62,071 | 2,899,957 | ||||||
Stanley Black & Decker | 16,385 | 1,968,658 | ||||||
Trane Technologies | 27,268 | 3,814,521 | ||||||
TransDigm Group * | 5,270 | 3,134,649 | ||||||
Union Pacific | 57,614 | 13,498,384 | ||||||
United Airlines Holdings * | 34,238 | 1,729,019 | ||||||
United Parcel Service, Cl B | 67,774 | 12,197,964 | ||||||
United Rentals * | 6,290 | 1,990,911 | ||||||
Verisk Analytics, Cl A | 13,980 | 2,852,619 | ||||||
Waste Management | 33,405 | 5,493,118 | ||||||
Westinghouse Air Brake Technologies | 16,285 | 1,464,184 | ||||||
WW Grainger | 4,947 | 2,473,648 | ||||||
Xylem | 15,655 | 1,260,227 | ||||||
|
| |||||||
| 222,594,442 | ||||||||
|
| |||||||
INFORMATION TECHNOLOGY — 27.8% |
| |||||||
Accenture, Cl A | 54,906 | 16,491,566 | ||||||
Adobe * | 41,382 | 16,385,203 | ||||||
Advanced Micro Devices * | 140,047 | 11,976,819 | ||||||
Akamai Technologies * | 14,092 | 1,582,250 | ||||||
Amphenol, Cl A | 51,964 | 3,715,426 | ||||||
Analog Devices | 46,650 | 7,201,827 | ||||||
ANSYS * | 6,573 | 1,812,110 | ||||||
Apple | 1,353,522 | 213,382,743 | ||||||
| COMMON STOCK — continued | ||||||||
| Shares | Value | |||||||
INFORMATION TECHNOLOGY — continued |
| |||||||
Applied Materials | 77,138 | $ | 8,512,178 | |||||
Arista Networks * | 19,480 | 2,251,304 | ||||||
Autodesk * | 17,651 | 3,340,981 | ||||||
Automatic Data Processing | 36,629 | 7,991,715 | ||||||
Broadcom | 38,079 | 21,110,617 | ||||||
Broadridge Financial Solutions | 10,168 | 1,465,514 | ||||||
Cadence Design Systems * | 24,062 | 3,629,753 | ||||||
CDW | 11,805 | 1,926,340 | ||||||
Ceridian HCM Holding * | 11,870 | 666,263 | ||||||
Cisco Systems | 366,450 | 17,948,721 | ||||||
Citrix Systems * | 21,801 | 2,182,280 | ||||||
Cognizant Technology Solutions, Cl A | 45,601 | 3,689,121 | ||||||
DXC Technology * | 18,528 | 531,754 | ||||||
Enphase Energy * | 11,735 | 1,894,029 | ||||||
EPAM Systems * | 3,804 | 1,008,022 | ||||||
F5 * | 5,257 | 880,074 | ||||||
Fidelity National Information Services | 52,827 | 5,237,797 | ||||||
Fiserv * | 51,641 | 5,056,687 | ||||||
FleetCor Technologies * | 7,043 | 1,757,369 | ||||||
Fortinet * | 11,803 | 3,411,185 | ||||||
Gartner * | 7,132 | 2,072,203 | ||||||
Global Payments | 25,208 | 3,452,992 | ||||||
Hewlett Packard Enterprise | 113,619 | 1,750,869 | ||||||
HP | 100,123 | 3,667,506 | ||||||
Intel | 370,766 | 16,161,690 | ||||||
International Business Machines | 77,878 | 10,296,250 | ||||||
Intuit | 24,611 | 10,305,856 | ||||||
IPG Photonics * | 2,093 | 197,747 | ||||||
Jack Henry & Associates | 6,431 | 1,219,189 | ||||||
Juniper Networks | 28,199 | 888,832 | ||||||
Keysight Technologies * | 16,049 | 2,251,193 | ||||||
KLA | 13,164 | 4,202,739 | ||||||
Lam Research | 12,239 | 5,700,437 | ||||||
Mastercard, Cl A | 75,372 | 27,388,677 | ||||||
Microchip Technology | 48,228 | 3,144,466 | ||||||
Micron Technology | 97,146 | 6,624,386 | ||||||
Microsoft | 696,781 | 193,370,663 | ||||||
Monolithic Power Systems | 3,805 | 1,492,473 | ||||||
Motorola Solutions | 14,641 | 3,128,635 | ||||||
NetApp | 19,415 | 1,422,149 | ||||||
NortonLifeLock | 50,548 | 1,265,722 | ||||||
NVIDIA | 217,213 | 40,286,495 | ||||||
NXP Semiconductors | 23,138 | 3,954,284 | ||||||
Oracle | 140,126 | 10,285,248 | ||||||
Paychex | 27,840 | 3,528,163 | ||||||
Paycom Software * | 3,250 | 914,778 | ||||||
PayPal Holdings * | 98,899 | 8,696,189 | ||||||
The accompanying notes are an integral part of the financial statements.
48
CATHOLIC RESPONSIBLE INVESTMENTS EQUITY INDEX FUND
APRIL 30, 2022 (Unaudited)
| COMMON STOCK — continued | ||||||||
| Shares | Value | |||||||
INFORMATION TECHNOLOGY — continued |
| |||||||
PTC * | 9,133 | $ | 1,043,080 | |||||
Qorvo * | 8,557 | 973,615 | ||||||
QUALCOMM | 102,413 | 14,306,072 | ||||||
Roper Technologies | 13,607 | 6,394,201 | ||||||
Salesforce * | 85,006 | 14,955,956 | ||||||
Seagate Technology Holdings | 17,813 | 1,461,379 | ||||||
ServiceNow * | 17,315 | 8,278,302 | ||||||
Skyworks Solutions | 12,711 | 1,440,156 | ||||||
SolarEdge Technologies * | 4,591 | 1,149,632 | ||||||
Synopsys * | 13,239 | 3,796,813 | ||||||
TE Connectivity | 28,300 | 3,531,274 | ||||||
Teledyne Technologies * | 4,089 | 1,764,608 | ||||||
Teradyne | 11,520 | 1,214,899 | ||||||
Texas Instruments | 81,828 | 13,931,217 | ||||||
Trimble * | 21,800 | 1,454,060 | ||||||
Tyler Technologies * | 3,604 | 1,422,535 | ||||||
VeriSign * | 8,363 | 1,494,385 | ||||||
Visa, Cl A | 145,687 | 31,050,270 | ||||||
Western Digital * | 27,047 | 1,435,384 | ||||||
Zebra Technologies, Cl A * | 4,035 | 1,491,578 | ||||||
|
| |||||||
| 847,298,895 | ||||||||
|
| |||||||
MATERIALS — 3.4% |
| |||||||
Air Products and Chemicals | 24,141 | 5,650,684 | ||||||
Albemarle | 10,202 | 1,967,252 | ||||||
Amcor | 133,235 | 1,580,167 | ||||||
Avery Dennison | 7,179 | 1,296,527 | ||||||
Ball | 28,068 | 2,277,999 | ||||||
Celanese, Cl A | 9,409 | 1,382,558 | ||||||
CF Industries Holdings | 18,617 | 1,802,684 | ||||||
Corteva | 102,339 | 5,903,937 | ||||||
Dow | 92,528 | 6,153,112 | ||||||
DuPont de Nemours | 51,865 | 3,419,459 | ||||||
Eastman Chemical | 11,695 | 1,200,726 | ||||||
Ecolab | 22,588 | 3,825,052 | ||||||
FMC | 11,037 | 1,462,844 | ||||||
Freeport-McMoRan | 146,451 | 5,938,588 | ||||||
International Flavors & Fragrances | 22,162 | 2,688,251 | ||||||
International Paper | 33,730 | 1,561,024 | ||||||
Linde | 58,927 | 18,382,867 | ||||||
LyondellBasell Industries, Cl A | 29,452 | 3,122,796 | ||||||
Martin Marietta Materials | 5,434 | 1,924,831 | ||||||
Mosaic | 32,166 | 2,007,802 | ||||||
Newmont | 86,115 | 6,273,478 | ||||||
Nucor | 43,870 | 6,790,199 | ||||||
Packaging Corp of America | 8,222 | 1,325,140 | ||||||
PPG Industries | 21,861 | 2,797,989 | ||||||
Sealed Air | 12,878 | 826,896 | ||||||
| COMMON STOCK — continued | ||||||||
| Shares | Value | |||||||
MATERIALS — continued |
| |||||||
Sherwin-Williams | 30,921 | $ | 8,502,038 | |||||
Vulcan Materials | 11,547 | 1,989,433 | ||||||
Westrock | 23,241 | 1,151,127 | ||||||
|
| |||||||
| 103,205,460 | ||||||||
|
| |||||||
REAL ESTATE — 3.3% | ||||||||
Alexandria Real Estate Equities ‡ | 12,257 | 2,232,735 | ||||||
American Tower ‡ | 43,511 | 10,487,021 | ||||||
AvalonBay Communities ‡ | 12,148 | 2,763,427 | ||||||
Boston Properties ‡ | 12,354 | 1,452,830 | ||||||
Camden Property Trust ‡ | 8,100 | 1,270,809 | ||||||
CBRE Group, Cl A * | 29,068 | 2,413,807 | ||||||
Crown Castle International ‡ | 37,554 | 6,955,376 | ||||||
Digital Realty Trust ‡ | 24,664 | 3,603,904 | ||||||
Duke Realty ‡ | 33,100 | 1,812,225 | ||||||
Equinix | 7,799 | 5,608,105 | ||||||
Equity Residential ‡ | 29,682 | 2,419,083 | ||||||
Essex Property Trust ‡ | 5,665 | 1,865,315 | ||||||
Extra Space Storage ‡ | 13,423 | 2,550,370 | ||||||
Federal Realty Investment Trust ‡ | 6,086 | 712,427 | ||||||
Host Hotels & Resorts ‡ | 62,091 | 1,263,552 | ||||||
Iron Mountain ‡ | 25,160 | 1,351,847 | ||||||
Kimco Realty ‡ | 53,555 | 1,356,548 | ||||||
Mid-America Apartment Communities ‡ | 10,045 | 1,975,651 | ||||||
Prologis ‡ | 124,990 | 20,034,647 | ||||||
Public Storage ‡ | 19,222 | 7,140,973 | ||||||
Realty Income ‡ | 49,130 | 3,407,657 | ||||||
Regency Centers ‡ | 13,387 | 921,427 | ||||||
SBA Communications, Cl A ‡ | 9,401 | 3,263,181 | ||||||
Simon Property Group ‡ | 35,259 | 4,160,562 | ||||||
UDR ‡ | 25,283 | 1,345,308 | ||||||
Vornado Realty Trust ‡ | 30,105 | 1,165,365 | ||||||
Welltower ‡ | 37,812 | 3,433,708 | ||||||
Weyerhaeuser ‡ | 65,069 | 2,682,144 | ||||||
|
| |||||||
| 99,650,004 | ||||||||
|
| |||||||
UTILITIES — 2.8% | ||||||||
American Water Works | 15,722 | 2,422,446 | ||||||
Atmos Energy | 11,523 | 1,306,708 | ||||||
CenterPoint Energy | 54,686 | 1,673,938 | ||||||
CMS Energy | 25,137 | 1,726,660 | ||||||
Consolidated Edison | 51,185 | 4,746,897 | ||||||
Constellation Energy | 28,304 | 1,675,900 | ||||||
Dominion Energy | 119,727 | 9,774,512 | ||||||
Edison International | 32,987 | 2,269,176 | ||||||
Entergy | 17,484 | 2,077,973 | ||||||
The accompanying notes are an integral part of the financial statements.
49
CATHOLIC RESPONSIBLE INVESTMENTS EQUITY INDEX FUND
APRIL 30, 2022 (Unaudited)
| COMMON STOCK — continued | ||||||||
| Shares | Value | |||||||
UTILITIES — continued | ||||||||
Eversource Energy | 29,869 | $ | 2,610,551 | |||||
Exelon | 165,413 | 7,738,020 | ||||||
FirstEnergy | 50,057 | 2,167,969 | ||||||
NextEra Energy | 298,228 | 21,180,153 | ||||||
NRG Energy | 21,278 | 763,880 | ||||||
Pinnacle West Capital | 9,804 | 698,045 | ||||||
Public Service Enterprise Group | 50,746 | 3,534,966 | ||||||
Sempra Energy | 44,300 | 7,148,248 | ||||||
Southern | 174,443 | 12,802,372 | ||||||
|
| |||||||
| 86,318,414 | ||||||||
|
| |||||||
Total Common Stock | 3,037,244,740 | |||||||
|
| |||||||
Total Investments in Securities — 99.8% |
| $ | 3,037,244,740 | |||||
|
| |||||||
Percentages based on Net Assets of $3,042,345,436.
A list of the open futures contracts held by the Fund at April 30, 2022, is as follows:
| Type of Contract | Number Contracts | Expiration Date | Notional Amount | Value | Unrealized Depreciation | |||||||||||||||
| Long Contracts | ||||||||||||||||||||
S&P 500 Index E-MINI | 21 | Jun-2022 | $ | 4,699,425 | $ | 4,333,875 | $ | (365,550 | ) | |||||||||||
|
|
|
|
|
|
|
|
| ||||||||||||
| * | Non-income producing security. |
| ‡ | Real Estate Investment Trust. |
Cl — Class
S&P — Standard & Poor’s
As of April 30, 2022, all of the Fund’s investments in securities were considered Level 1, in accordance with the authoritative guidance of fair value measurement and disclosure under U.S. generally accepted accounting principles.
The following is a list of the inputs used as of April 30, 2022 in valuing the Fund’s other financial instruments carried at value:
Other Financial Instruments | Level 1 | Level 2 | Level 3 | Total | ||||||||||||
Futures Contracts* | ||||||||||||||||
Unrealized Depreciation | $ | (365,550 | ) | $ | – | $ | – | $ | (365,550 | ) | ||||||
|
|
|
|
|
|
|
|
|
|
|
| |||||
Total Other Financial Instruments | $ | (365,550 | ) | $ | – | $ | – | $ | (365,550 | ) | ||||||
|
|
| ||||||||||||||
* Futures contracts are valued at the unrealized appreciation (depreciation) on the instrument.
Amounts designated as “–” are $0 or have been round to $0.
For more information on valuation inputs, see Note 2 — Significant Accounting Policies in the Notes to Financial Statements.
The accompanying notes are an integral part of the financial statements.
50
CATHOLIC RESPONSIBLE INVESTMENTS MULTI-STYLE US EQUITY FUND
APRIL 30, 2022 (Unaudited)
| SECTOR WEIGHTINGS † | ||||
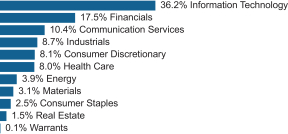
| † | Percentages are based on total investments. |
| SCHEDULE OF INVESTMENTS | ||||||||
| COMMON STOCK — 97.3% | ||||||||
| Shares | Value | |||||||
COMMUNICATION SERVICES — 10.1% |
| |||||||
Alphabet, Cl A * | 1,200 | $ | 2,738,628 | |||||
Alphabet, Cl C * | 12,532 | 28,815,204 | ||||||
Charter Communications, Cl A * | 10,000 | 4,284,900 | ||||||
Comcast, Cl A | 155,000 | 6,162,800 | ||||||
DISH Network, Cl A * | 74,000 | 2,109,740 | ||||||
Electronic Arts | 7,748 | 914,651 | ||||||
Fox | 66,500 | 2,383,360 | ||||||
Fox | 52,000 | 1,728,480 | ||||||
Match Group * | 13,607 | 1,076,994 | ||||||
Meta Platforms, Cl A * | 44,926 | 9,006,315 | ||||||
News | 28,000 | 556,080 | ||||||
T-Mobile US * | 29,000 | 3,571,060 | ||||||
ZoomInfo Technologies, Cl A * | 107,750 | 5,107,350 | ||||||
|
| |||||||
| 68,455,562 | ||||||||
|
| |||||||
CONSUMER DISCRETIONARY — 7.9% |
| |||||||
Airbnb, Cl A * | 39,297 | 6,020,693 | ||||||
Amazon.com * | 7,201 | 17,899,022 | ||||||
Booking Holdings * | 1,200 | 2,652,372 | ||||||
Chegg * | 29,309 | 725,105 | ||||||
Etsy * | 17,236 | 1,606,223 | ||||||
Gap | 74,500 | 925,290 | ||||||
Hilton Worldwide Holdings | 21,905 | 3,401,628 | ||||||
Honda Motor ADR | 81,000 | 2,126,250 | ||||||
Lululemon Athletica * | 13,261 | 4,702,748 | ||||||
NIKE, Cl B | 45,242 | 5,641,677 | ||||||
Qurate Retail * | 110,000 | 463,100 | ||||||
Starbucks | 28,665 | 2,139,556 | ||||||
Tesla * | 4,766 | 4,150,042 | ||||||
Wingstop | 9,944 | 912,461 | ||||||
|
| |||||||
| 53,366,167 | ||||||||
|
| |||||||
| COMMON STOCK — continued | ||||||||
| Shares | Value | |||||||
CONSUMER STAPLES — 2.4% |
| |||||||
Anheuser-Busch InBev ADR | 41,000 | $ | 2,355,450 | |||||
Constellation Brands, Cl A | 20,242 | 4,981,354 | ||||||
Freshpet * | 9,034 | 843,324 | ||||||
Molson Coors Beverage, Cl B | 53,500 | 2,896,490 | ||||||
PepsiCo | 31,629 | 5,431,015 | ||||||
|
| |||||||
| 16,507,633 | ||||||||
|
| |||||||
ENERGY — 3.8% |
| |||||||
ConocoPhillips | 47,000 | 4,489,440 | ||||||
Occidental Petroleum | 175,000 | 9,640,750 | ||||||
Schlumberger | 163,184 | 6,365,808 | ||||||
Williams | 155,000 | 5,314,950 | ||||||
|
| |||||||
| 25,810,948 | ||||||||
|
| |||||||
FINANCIALS — 17.1% |
| |||||||
Aegon | 207,529 | 1,066,699 | ||||||
American Express | 45,738 | 7,990,886 | ||||||
Ares Management, Cl A | 11,759 | 778,681 | ||||||
Bank of America | 80,000 | 2,854,400 | ||||||
Bank of New York Mellon | 113,000 | 4,752,780 | ||||||
Berkshire Hathaway, Cl B * | 25,012 | 8,074,624 | ||||||
Brighthouse Financial * | 15,418 | 791,869 | ||||||
Capital One Financial | 62,000 | 7,726,440 | ||||||
Charles Schwab | 246,149 | 16,327,063 | ||||||
First Republic Bank | 54,288 | 8,100,856 | ||||||
Goldman Sachs Group | 14,000 | 4,276,860 | ||||||
Hamilton Lane, Cl A | 17,623 | 1,208,585 | ||||||
Lincoln National | 10,000 | 601,500 | ||||||
Markel * | 7,551 | 10,218,617 | ||||||
MarketAxess Holdings | 189 | 49,822 | ||||||
Marsh & McLennan | 8,136 | 1,315,591 | ||||||
MetLife | 112,000 | 7,356,160 | ||||||
Moody’s | 25,914 | 8,201,263 | ||||||
S&P Global | 14,700 | 5,534,694 | ||||||
State Street | 40,000 | 2,678,800 | ||||||
Truist Financial | 34,000 | 1,643,900 | ||||||
UBS Group | 67,000 | 1,128,280 | ||||||
US Bancorp | 80,368 | 3,902,670 | ||||||
Wells Fargo | 210,000 | 9,162,300 | ||||||
|
| |||||||
| 115,743,340 | ||||||||
|
| |||||||
HEALTH CARE — 7.8% |
| |||||||
Align Technology * | 7,487 | 2,170,556 | ||||||
Alnylam Pharmaceuticals * | 18,500 | 2,468,455 | ||||||
The accompanying notes are an integral part of the financial statements.
51
CATHOLIC RESPONSIBLE INVESTMENTS MULTI-STYLE US EQUITY FUND
APRIL 30, 2022 (Unaudited)
| COMMON STOCK — continued | ||||||||
| Shares | Value | |||||||
HEALTH CARE— continued |
| |||||||
BioMarin Pharmaceutical * | 35,000 | $ | 2,847,250 | |||||
Boston Scientific * | 85,050 | 3,581,456 | ||||||
Cigna | 44,000 | 10,858,320 | ||||||
CVS Health | 50,000 | 4,806,500 | ||||||
Elanco Animal Health * | 65,759 | 1,664,360 | ||||||
ICON * | 8,691 | 1,965,991 | ||||||
Incyte * | 35,000 | 2,623,600 | ||||||
Medtronic | 96,539 | 10,074,810 | ||||||
Mettler-Toledo International * | 5,033 | 6,429,809 | ||||||
Omnicell * | 11,515 | 1,257,093 | ||||||
Seagen * | 10,747 | 1,407,964 | ||||||
Zimmer Biomet Holdings | 6,100 | 736,575 | ||||||
|
| |||||||
| 52,892,739 | ||||||||
|
| |||||||
INDUSTRIALS — 8.4% |
| |||||||
AMETEK | 43,154 | 5,448,624 | ||||||
Carrier Global | 60,500 | 2,315,335 | ||||||
Equifax | 9,764 | 1,987,169 | ||||||
FedEx | 30,000 | 5,962,200 | ||||||
Fortive | 79,757 | 4,586,028 | ||||||
Fortune Brands Home & Security | 13,012 | 927,105 | ||||||
GXO Logistics * | 121,843 | 7,211,887 | ||||||
Hexcel | 19,784 | 1,075,458 | ||||||
Johnson Controls International | 120,000 | 7,184,400 | ||||||
Mercury Systems * | 15,946 | 889,627 | ||||||
Otis Worldwide | 17,000 | 1,238,280 | ||||||
TransDigm Group * | 16,275 | 9,680,533 | ||||||
TransUnion | 78,380 | 6,859,818 | ||||||
Uber Technologies * | 58,578 | 1,844,035 | ||||||
|
| |||||||
| 57,210,499 | ||||||||
|
| |||||||
INFORMATION TECHNOLOGY — 35.2% |
| |||||||
Adobe * | 27,974 | 11,076,305 | ||||||
Advanced Micro Devices * | 30,247 | 2,586,723 | ||||||
Amphenol, Cl A | 73,146 | 5,229,939 | ||||||
Apple | 170,878 | 26,938,917 | ||||||
Autodesk * | 15,362 | 2,907,719 | ||||||
Avalara * | 48,656 | 3,701,262 | ||||||
Block, Cl A * | 27,086 | 2,696,140 | ||||||
CDW | 8,170 | 1,333,181 | ||||||
Ceridian HCM Holding * | 56,736 | 3,184,592 | ||||||
Cisco Systems | 90,000 | 4,408,200 | ||||||
Cognizant Technology Solutions, Cl A | 57,000 | 4,611,300 | ||||||
Dell Technologies, Cl C | 61,500 | 2,891,115 | ||||||
| COMMON STOCK — continued | ||||||||
| Shares | Value | |||||||
INFORMATION TECHNOLOGY— continued |
| |||||||
Fidelity National Information Services | 56,986 | $ | 5,650,162 | |||||
Fiserv * | 65,000 | 6,364,800 | ||||||
FleetCor Technologies * | 22,204 | 5,540,342 | ||||||
Gartner * | 7,549 | 2,193,362 | ||||||
Global Payments | 40,215 | 5,508,651 | ||||||
HashiCorp, Cl A * | 1,818 | 85,591 | ||||||
Hewlett Packard Enterprise | 225,000 | 3,467,250 | ||||||
HP | 163,680 | 5,995,598 | ||||||
II-VI * | 16,135 | 987,623 | ||||||
Intuit | 14,401 | 6,030,419 | ||||||
Juniper Networks | 84,500 | 2,663,440 | ||||||
KLA | 2,211 | 705,884 | ||||||
Mastercard, Cl A | 26,178 | 9,512,562 | ||||||
Micro Focus International ADR | 62,400 | 290,160 | ||||||
Microchip Technology | 241,029 | 15,715,091 | ||||||
Microsoft | 143,363 | 39,786,100 | ||||||
NVIDIA | 27,481 | 5,096,901 | ||||||
Palo Alto Networks * | 2,310 | 1,296,557 | ||||||
Qualtrics International, Cl A * | 1,321 | 24,491 | ||||||
Roper Technologies | 11,518 | 5,412,539 | ||||||
Salesforce * | 54,289 | 9,551,606 | ||||||
SAP ADR | 37,595 | 3,789,576 | ||||||
ServiceNow * | 1,186 | 567,027 | ||||||
Shift4 Payments, Cl A * | 21,743 | 1,140,638 | ||||||
Synaptics * | 3,764 | 558,728 | ||||||
TE Connectivity | 25,500 | 3,181,890 | ||||||
UiPath, Cl A * | 22,158 | 395,077 | ||||||
Varonis Systems, Cl B * | 26,863 | 1,160,482 | ||||||
Visa, Cl A | 50,232 | 10,705,946 | ||||||
VMware, Cl A * | 49,945 | 5,396,058 | ||||||
Vontier | 199,481 | 5,110,703 | ||||||
Workday, Cl A * | 16,932 | 3,499,844 | ||||||
|
| |||||||
| 238,950,491 | ||||||||
|
| |||||||
MATERIALS — 3.1% |
| |||||||
Air Products and Chemicals | 41,225 | 9,649,536 | ||||||
Celanese, Cl A | 14,000 | 2,057,160 | ||||||
Ecolab | 18,463 | 3,126,524 | ||||||
Linde | 17,788 | 5,549,145 | ||||||
LyondellBasell Industries, Cl A | 3,400 | 360,502 | ||||||
|
| |||||||
| 20,742,867 | ||||||||
|
| |||||||
The accompanying notes are an integral part of the financial statements.
52
CATHOLIC RESPONSIBLE INVESTMENTS MULTI-STYLE US EQUITY FUND
APRIL 30, 2022 (Unaudited)
| COMMON STOCK — continued | ||||||||
| Shares | Value | |||||||
REAL ESTATE — 1.5% |
| |||||||
American Tower ‡ | 34,041 | $ | 8,204,562 | |||||
Equinix | 2,589 | 1,861,698 | ||||||
|
| |||||||
| 10,066,260 | ||||||||
|
| |||||||
Total Common Stock | 659,746,506 | |||||||
|
| |||||||
| WARRANTS — 0.1% | ||||||||
| Number Of Warrants | Value | |||||||
Occidental Petroleum * | 18,875 | $ | 636,843 | |||||
|
| |||||||
Total Warrants | 636,843 | |||||||
|
| |||||||
Total Investments in Securities— 97.4% |
| |||||||
(Cost $683,487,796) | $ | 660,383,349 | ||||||
|
| |||||||
Percentages are based on Net Assets of $677,983,429.
| * | Non-income producing security. |
| ‡ | Real Estate Investment Trust. |
| ADR — American Depositary Receipt |
| Cl — Class |
As of April 30, 2022, all of the Fund’s investments in securities were considered Level 1, in accordance with the authoritative guidance of fair value measurement and disclosure under U.S. generally accepted accounting principles.
For more information on valuation inputs, see Note 2 — Significant Accounting Policies in the Notes to Financial Statements.
The accompanying notes are an integral part of the financial statements.
53
CATHOLIC RESPONSIBLE INVESTMENTS INTERNATIONAL EQUITY FUND
APRIL 30, 2022 (Unaudited)
| SECTOR WEIGHTINGS † | ||||
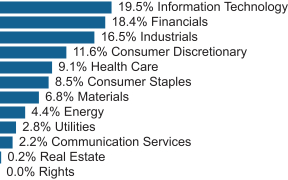
| † | Percentages are based on total investments. |
| SCHEDULE OF INVESTMENTS | ||||||||
| COMMON STOCK — 96.1% | ||||||||
| Shares | Value | |||||||
AUSTRALIA — 0.2% |
| |||||||
Rio Tinto | 26,062 | $ | 2,055,479 | |||||
|
| |||||||
BRAZIL — 0.7% |
| |||||||
Banco do Brasil | 291,400 | 1,953,572 | ||||||
Localiza Rent a Car | 105,100 | 1,130,331 | ||||||
Marfrig Global Foods | 114,000 | 433,468 | ||||||
MercadoLibre * | 847 | 824,665 | ||||||
Petroleo Brasileiro ADR | 108,404 | 1,471,042 | ||||||
Petroleo Brasileiro ADR, Cl A | 134,335 | 1,648,291 | ||||||
SLC Agricola | 30,760 | 330,445 | ||||||
|
| |||||||
| 7,791,814 | ||||||||
|
| |||||||
CANADA — 5.0% |
| |||||||
Air Canada * | 145,100 | 2,554,478 | ||||||
Alimentation Couche-Tard | 134,290 | 6,009,190 | ||||||
Canadian National Railway | 90,559 | 10,705,101 | ||||||
Canadian Pacific Railway | 61,900 | 4,551,264 | ||||||
Canadian Pacific Railway | 228,343 | 16,719,275 | ||||||
Franco-Nevada | 23,300 | 3,541,899 | ||||||
Gildan Activewear | 65,400 | 2,227,504 | ||||||
Northland Power | 46,700 | 1,416,657 | ||||||
Nutrien | 34,800 | 3,437,387 | ||||||
Shopify, Cl A * | 10,403 | 4,440,208 | ||||||
TFI International | 13,000 | 1,051,148 | ||||||
|
| |||||||
| 56,654,111 | ||||||||
|
| |||||||
CHINA — 5.7% |
| |||||||
360 DigiTech ADR | 67,838 | 978,902 | ||||||
Alibaba Group Holding ADR * | 20,256 | 1,966,655 | ||||||
| COMMON STOCK — continued | ||||||||
| Shares | Value | |||||||
CHINA — continued |
| |||||||
Anhui Conch Cement, Cl H | 328,641 | $ | 1,785,135 | |||||
Baidu ADR * | 1,750 | 217,297 | ||||||
Bank of China, Cl H | 3,962,000 | 1,557,078 | ||||||
Bank of Communications, Cl A | 1,262,700 | 970,733 | ||||||
Beijing New Building Materials, Cl A | 174,400 | 760,859 | ||||||
Bosideng International Holdings | 2,436,000 | 1,222,939 | ||||||
China Construction Bank, Cl H | 5,856,921 | 4,137,490 | ||||||
China Everbright Environment Group | 718,000 | 420,891 | ||||||
China Life Insurance, Cl H | – | — | ||||||
China Lumena New Materials *(A) | 15,350 | — | ||||||
China Northern Rare Earth Group High-Tech, Cl A | 56,000 | 265,962 | ||||||
China Petroleum & Chemical ADR | 30,140 | 1,467,818 | ||||||
China Railway Group, Cl H | 1,749,000 | 1,221,789 | ||||||
CITIC | 868,000 | 896,028 | ||||||
Contemporary Amperex Technology, Cl A * | 10,900 | 664,635 | ||||||
COSCO SHIPPING Holdings, Cl H | 1,257,200 | 1,958,768 | ||||||
Daqo New Energy ADR * | 19,548 | 812,610 | ||||||
Dongfeng Motor Group, Cl H | 974,000 | 710,976 | ||||||
East Money Information, Cl A | 198,720 | 680,442 | ||||||
Ganfeng Lithium, Cl H | 29,600 | 355,321 | ||||||
Guangzhou Tinci Materials Technology, Cl A | 26,296 | 294,443 | ||||||
Haier Smart Home, Cl H | 650,400 | 2,306,755 | ||||||
Industrial & Commercial Bank of China, Cl H | 2,734,000 | 1,664,147 | ||||||
JD.com, Cl A * | 11,828 | 382,984 | ||||||
JD.com ADR * | 24,191 | 1,491,617 | ||||||
Jiangxi Copper, Cl H | 475,000 | 743,560 | ||||||
Lenovo Group | 934,000 | 901,802 | ||||||
Li Ning | 1,166,372 | 9,134,804 | ||||||
NARI Technology, Cl A | 136,500 | 654,498 | ||||||
PetroChina, Cl H | 2,972,000 | 1,418,658 | ||||||
PICC Property & Casualty, Cl H | 1,330,000 | 1,356,828 | ||||||
Pop Mart International Group | 148,600 | 675,682 | ||||||
Power Construction Corp of China, Cl A | 415,300 | 482,615 | ||||||
The accompanying notes are an integral part of the financial statements.
54
CATHOLIC RESPONSIBLE INVESTMENTS INTERNATIONAL EQUITY FUND
APRIL 30, 2022 (Unaudited)
| COMMON STOCK — continued | ||||||||
| Shares | Value | |||||||
CHINA — continued |
| |||||||
Shanghai Friendess Electronic Technology, Cl A | 16,877 | $ | 628,432 | |||||
Shenzhou International Group Holdings | 439,100 | 5,990,024 | ||||||
Sinopharm Group, Cl H | 320,400 | 738,243 | ||||||
Tencent Holdings | 223,494 | 10,511,448 | ||||||
Tongwei, Cl A | 183,400 | 1,133,465 | ||||||
Want Want China Holdings | 1,029,000 | 927,776 | ||||||
Zhejiang Expressway, Cl H | 634,000 | 521,688 | ||||||
|
| |||||||
| 65,011,797 | ||||||||
|
| |||||||
COLUMBIA — 0.0% |
| |||||||
Bancolombia ADR | 11,217 | 434,883 | ||||||
|
| |||||||
DENMARK — 1.2% |
| |||||||
AP Moller - Maersk, Cl B | 582 | 1,699,380 | ||||||
Coloplast, Cl B | 14,168 | 1,923,885 | ||||||
DSV | 33,739 | 5,569,907 | ||||||
GN Store Nord | 24,425 | 922,640 | ||||||
Pandora | 15,848 | 1,405,418 | ||||||
Royal Unibrew | 9,357 | 811,680 | ||||||
Vestas Wind Systems | 62,843 | 1,611,765 | ||||||
|
| |||||||
| 13,944,675 | ||||||||
|
| |||||||
FINLAND — 0.1% |
| |||||||
Nordea Bank Abp | 131,293 | 1,319,282 | ||||||
|
| |||||||
FRANCE — 10.7% |
| |||||||
Air Liquide | 34,614 | 5,991,141 | ||||||
Alstom | 359,500 | 7,887,187 | ||||||
AXA | 298,287 | 7,857,308 | ||||||
BNP Paribas | 63,189 | 3,270,754 | ||||||
Capgemini | 19,823 | 4,034,304 | ||||||
Carrefour | 120,963 | 2,555,861 | ||||||
Cie de Saint-Gobain | 61,960 | 3,599,143 | ||||||
Danone | 183,333 | 11,074,159 | ||||||
Dassault Systemes | 55,627 | 2,457,612 | ||||||
Hermes International | 2,813 | 3,458,963 | ||||||
Ipsen | 11,460 | 1,187,208 | ||||||
Kering | 5,469 | 2,912,719 | ||||||
L’Oreal | 14,195 | 5,136,068 | ||||||
LVMH Moet Hennessy Louis Vuitton | 33,268 | 21,404,438 | ||||||
Pernod Ricard | 61,383 | 12,679,919 | ||||||
Publicis Groupe | 22,321 | 1,335,649 | ||||||
Teleperformance | 7,268 | 2,607,173 | ||||||
TotalEnergies | 287,834 | 14,114,991 | ||||||
Valeo | 154,197 | 2,792,675 | ||||||
Vinci | 61,287 | 5,921,998 | ||||||
|
| |||||||
| 122,279,270 | ||||||||
|
| |||||||
| COMMON STOCK — continued | ||||||||
| Shares | Value | |||||||
GERMANY — 3.4% |
| |||||||
Bayerische Motoren Werke | 24,794 | $ | 2,022,014 | |||||
Carl Zeiss Meditec | 18,408 | 2,307,900 | ||||||
CompuGroup Medical & KgaA | 19,138 | 1,024,056 | ||||||
Deutsche Post | 24,659 | 1,046,374 | ||||||
Deutsche Telekom | 100,029 | 1,830,868 | ||||||
GEA Group | 47,891 | 1,867,400 | ||||||
Puma | 17,903 | 1,320,149 | ||||||
RWE | 244,710 | 10,149,563 | ||||||
SAP | 123,649 | 12,502,171 | ||||||
Siemens | 9,996 | 1,212,978 | ||||||
Siemens Healthineers | 56,705 | 3,042,265 | ||||||
|
| |||||||
| 38,325,738 | �� | |||||||
|
| |||||||
GREECE — 0.0% |
| |||||||
FF Group * | 8,921 | 4,517 | ||||||
|
| |||||||
HONG KONG — 1.6% |
| |||||||
AIA Group | 1,762,535 | 17,349,095 | ||||||
China Galaxy Securities, Cl H | 806,500 | 439,043 | ||||||
WH Group | 998,034 | 689,948 | ||||||
|
| |||||||
| 18,478,086 | ||||||||
|
| |||||||
INDIA — 2.4% |
| |||||||
HDFC Bank ADR | 62,762 | 3,465,090 | ||||||
ICICI Bank ADR | 477,687 | 9,095,160 | ||||||
Infosys ADR | 379,012 | 7,530,968 | ||||||
Tata Motors ADR * | 110,550 | 3,118,616 | ||||||
Wipro ADR | 381,531 | 2,457,060 | ||||||
WNS Holdings ADR * | 15,405 | 1,207,290 | ||||||
|
| |||||||
| 26,874,184 | ||||||||
|
| |||||||
INDONESIA — 0.8% |
| |||||||
Bank Central Asia | 3,382,900 | 1,880,000 | ||||||
Bank Mandiri Persero | 1,166,100 | 719,262 | ||||||
Bank Negara Indonesia Persero | 1,803,800 | 1,144,014 | ||||||
Bank Rakyat Indonesia Persero | 12,320,800 | 4,125,445 | ||||||
Indofood Sukses Makmur | 82,200 | 35,737 | ||||||
Telkom Indonesia Persero | 3,219,000 | 1,024,068 | ||||||
|
| |||||||
| 8,928,526 | ||||||||
|
| |||||||
IRELAND — 2.5% |
| |||||||
Bank of Ireland Group | 184,012 | 1,112,758 | ||||||
CRH | 44,263 | 1,761,045 | ||||||
ICON * | 69,397 | 15,698,295 | ||||||
Kingspan Group | 27,483 | 2,574,863 | ||||||
The accompanying notes are an integral part of the financial statements.
55
CATHOLIC RESPONSIBLE INVESTMENTS INTERNATIONAL EQUITY FUND
APRIL 30, 2022 (Unaudited)
| COMMON STOCK — continued | ||||||||
| Shares | Value | |||||||
IRELAND — continued |
| |||||||
Ryanair Holdings ADR * | 89,907 | $ | 7,850,679 | |||||
|
| |||||||
| 28,997,640 | ||||||||
|
| |||||||
ISRAEL — 0.1% |
| |||||||
Nice ADR * | 5,291 | 1,092,115 | ||||||
|
| |||||||
ITALY — 4.1% |
| |||||||
Amplifon | 47,150 | 1,879,469 | ||||||
DiaSorin | 13,790 | 1,809,163 | ||||||
Enel | 2,216,957 | 14,407,722 | ||||||
Ferrari | 69,130 | 14,553,652 | ||||||
UniCredit | 1,524,896 | 13,970,727 | ||||||
|
| |||||||
| 46,620,733 | ||||||||
|
| |||||||
JAPAN — 7.0% |
| |||||||
Daifuku | 22,500 | 1,389,023 | ||||||
Ebara | 48,600 | 2,234,718 | ||||||
FANUC | 82,900 | 12,842,545 | ||||||
GMO Payment Gateway | 10,800 | 910,322 | ||||||
Harmonic Drive Systems | 22,900 | 579,139 | ||||||
Hoya | 42,100 | 4,155,073 | ||||||
Keyence | 32,810 | 13,277,076 | ||||||
Lasertec | 56,500 | 7,763,538 | ||||||
M3 | 39,500 | 1,270,139 | ||||||
Miura | 22,000 | 460,571 | ||||||
Murata Manufacturing | 146,500 | 8,745,700 | ||||||
Nintendo | 11,300 | 5,166,343 | ||||||
Nippon Telegraph & Telephone | 63,500 | 1,883,711 | ||||||
Nomura Research Institute | 48,200 | 1,366,229 | ||||||
Obic | 9,600 | 1,418,266 | ||||||
Renesas Electronics * | 186,500 | 2,010,987 | ||||||
Seven & i Holdings | 52,100 | 2,289,689 | ||||||
Shimano | 12,300 | 2,151,602 | ||||||
Shin-Etsu Chemical | 22,600 | 3,122,823 | ||||||
SoftBank Group | 37,500 | 1,536,453 | ||||||
Sumitomo Mitsui Financial Group | 152,400 | 4,548,132 | ||||||
Sundrug | 36,000 | 833,247 | ||||||
|
| |||||||
| 79,955,326 | ||||||||
|
| |||||||
MALAYSIA — 0.0% |
| |||||||
Kuala Lumpur Kepong | 33,400 | 225,834 | ||||||
Sime Darby Plantation | 161,100 | 193,445 | ||||||
|
| |||||||
| 419,279 | ||||||||
|
| |||||||
MEXICO — 0.7% |
| |||||||
Alfa, Cl A | 460,300 | 309,896 | ||||||
Arca Continental | 89,300 | 567,388 | ||||||
| COMMON STOCK — continued | ||||||||
| Shares | Value | |||||||
MEXICO — continued |
| |||||||
Grupo Financiero Banorte, Cl O | 255,000 | $ | 1,680,550 | |||||
Grupo Mexico | 222,300 | 1,041,216 | ||||||
Wal-Mart de Mexico | 1,188,766 | 4,213,119 | ||||||
|
| |||||||
| 7,812,169 | ||||||||
|
| |||||||
NETHERLANDS — 6.8% |
| |||||||
Adyen * | 5,002 | 8,308,897 | ||||||
Akzo Nobel | 98,797 | 8,555,708 | ||||||
ASM International | 33,444 | 10,000,993 | ||||||
ASML Holding, Cl G | 22,367 | 12,609,844 | ||||||
ASML Holding | 18,699 | 10,584,772 | ||||||
BE Semiconductor Industries | 18,372 | 1,106,281 | ||||||
ING Groep | 686,891 | 6,482,375 | ||||||
Koninklijke DSM | 14,271 | 2,388,478 | ||||||
Koninklijke Philips | 179,322 | 4,660,053 | ||||||
Shell | 488,685 | 13,224,074 | ||||||
|
| |||||||
| 77,921,475 | ||||||||
|
| |||||||
NEW ZEALAND — 0.1% |
| |||||||
Fisher & Paykel Healthcare | 78,823 | 1,090,598 | ||||||
|
| |||||||
NORWAY — 0.3% |
| |||||||
Equinor | 68,443 | 2,336,935 | ||||||
Nordic Semiconductor * | 50,551 | 1,019,264 | ||||||
|
| |||||||
| 3,356,199 | ||||||||
|
| |||||||
POLAND — 0.1% |
| |||||||
Dino Polska * | 23,974 | 1,550,546 | ||||||
|
| |||||||
QATAR — 0.1% |
| |||||||
Industries Qatar QSC | 157,775 | 815,201 | ||||||
Qatar Islamic Bank SAQ | 88,199 | 596,283 | ||||||
|
| |||||||
| 1,411,484 | ||||||||
|
| |||||||
RUSSIA — –% |
| |||||||
Gazprom PJSC ADR (A) | 270,588 | — | ||||||
Gazprom PJSC ADR (A) | 28,025 | — | ||||||
LUKOIL PJSC ADR (A) | 15,962 | — | ||||||
LUKOIL PJSC ADR (A) | 4,815 | — | ||||||
Sberbank of Russia PJSC ADR (A) | 55,964 | — | ||||||
|
| |||||||
| — | ||||||||
|
| |||||||
SAUDI ARABIA — 0.4% |
| |||||||
Al Rajhi Bank | 24,040 | 1,130,628 | ||||||
Leejam Sports JSC | 10,000 | 295,458 | ||||||
SABIC Agri-Nutrients | 12,807 | 556,186 | ||||||
The accompanying notes are an integral part of the financial statements.
56
CATHOLIC RESPONSIBLE INVESTMENTS INTERNATIONAL EQUITY FUND
APRIL 30, 2022 (Unaudited)
| COMMON STOCK — continued | ||||||||
| Shares | Value | |||||||
SAUDI ARABIA — continued |
| |||||||
Sahara International Petrochemical | 50,000 | $ | 760,426 | |||||
Saudi Arabian Mining * | 25,580 | 936,070 | ||||||
Saudi Arabian Oil | 58,218 | 696,419 | ||||||
Saudi Kayan Petrochemical * | 144,991 | 728,261 | ||||||
|
| |||||||
| 5,103,448 | ||||||||
|
| |||||||
SINGAPORE — 0.4% |
| |||||||
DBS Group Holdings | 173,500 | 4,218,134 | ||||||
|
| |||||||
SOUTH AFRICA — 0.7% |
| |||||||
Absa Group | 84,334 | 909,141 | ||||||
Anglo American | 48,130 | 2,175,597 | ||||||
Group | 41,230 | 437,741 | ||||||
Kumba Iron Ore | 21,976 | 730,212 | ||||||
Sasol * | 46,045 | 1,131,119 | ||||||
Shoprite Holdings | 34,996 | 504,901 | ||||||
Sibanye Stillwater | 549,315 | 1,918,583 | ||||||
|
| |||||||
| 7,807,294 | ||||||||
|
| |||||||
SOUTH KOREA — 2.6% |
| |||||||
DB Insurance | 5,217 | 278,033 | ||||||
DL E&C | 8,174 | 384,491 | ||||||
Hana Financial Group | 44,977 | 1,675,192 | ||||||
Hyosung TNC | 1,666 | 536,951 | ||||||
Hyundai Marine & Fire Insurance | 12,717 | 326,887 | ||||||
KB Financial Group ADR | 41,725 | 1,916,012 | ||||||
Kia | 78,572 | 5,132,813 | ||||||
LG | 12,829 | 743,439 | ||||||
LG Electronics | 9,969 | 899,329 | ||||||
LG Innotek | 1,272 | 346,335 | ||||||
LX INTERNATIONAL CORP | 19,991 | 605,899 | ||||||
Mirae Asset Securities | 34,670 | 219,386 | ||||||
NH Investment & Securities | 26,967 | 230,702 | ||||||
POSCO Holdings ADR | 24,482 | 1,388,374 | ||||||
Samsung Electro-Mechanics | 5,134 | 663,035 | ||||||
Samsung Electronics GDR | 5,770 | 7,593,196 | ||||||
Samsung Electronics | 122,077 | 6,474,655 | ||||||
Samsung Securities | 7,461 | 233,351 | ||||||
Seegene | 5,725 | 183,300 | ||||||
Youngone | 10,571 | 398,757 | ||||||
|
| |||||||
| 30,230,137 | ||||||||
|
| |||||||
SPAIN — 4.1% |
| |||||||
Aena SME * | 52,778 | 7,509,820 | ||||||
Amadeus IT Group * | 359,241 | 22,576,077 | ||||||
| COMMON STOCK — continued | ||||||||
| Shares | Value | |||||||
SPAIN — continued |
| |||||||
Banco Bilbao Vizcaya Argentaria | 614,287 | $ | 3,221,325 | |||||
CaixaBank | 2,008,777 | 6,478,860 | ||||||
Iberdrola | 462,202 | 5,305,683 | ||||||
Industria de Diseno Textil | 75,711 | 1,586,322 | ||||||
|
| |||||||
| 46,678,087 | ||||||||
|
| |||||||
SWEDEN — 2.9% |
| |||||||
AAK | 63,539 | 1,106,824 | ||||||
Atlas Copco, Cl A | 179,002 | 8,116,754 | ||||||
Evolution | 105,010 | 10,825,166 | ||||||
Getinge, Cl B | 97,632 | 2,837,471 | ||||||
Nibe Industrier, Cl B | 229,839 | 2,267,651 | ||||||
Swedbank | 426,414 | 6,788,070 | ||||||
Thule Group | 27,518 | 928,838 | ||||||
|
| |||||||
| 32,870,774 | ||||||||
|
| |||||||
SWITZERLAND — 6.3% |
| |||||||
Alcon | 220,734 | 15,751,232 | ||||||
Credit Suisse Group | 612,278 | 4,169,428 | ||||||
Geberit | 3,255 | 1,859,004 | ||||||
Logitech International | 36,877 | 2,403,377 | ||||||
Nestle | 170,863 | 22,045,437 | ||||||
Partners Group Holding | 1,725 | 1,837,104 | ||||||
Sika | 44,945 | 13,761,843 | ||||||
Straumann Holding | 12,550 | 1,485,338 | ||||||
Zurich Insurance Group | 19,172 | 8,744,378 | ||||||
|
| |||||||
| 72,057,141 | ||||||||
|
| |||||||
TAIWAN — 4.2% |
| |||||||
Asustek Computer | 40,000 | 479,955 | ||||||
ChipMOS Technologies | 161,000 | 250,919 | ||||||
CTBC Financial Holding | 480,000 | 471,179 | ||||||
Evergreen Marine Taiwan | 48,000 | 230,084 | ||||||
Formosa Plastics | 112,000 | 396,155 | ||||||
Fubon Financial Holding | 811,000 | 2,030,239 | ||||||
Gigabyte Technology | 167,000 | 597,469 | ||||||
Hon Hai Precision Industry | 655,000 | 2,241,106 | ||||||
King Yuan Electronics | 163,000 | 220,904 | ||||||
Lite-On Technology | 280,000 | 610,752 | ||||||
MediaTek | 161,000 | 4,452,476 | ||||||
Novatek Microelectronics | 69,000 | 908,638 | ||||||
Powertech Technology | 11,000 | 34,398 | ||||||
Realtek Semiconductor | 44,000 | 595,858 | ||||||
Taiwan Semiconductor Manufacturing | 11,000 | 198,178 | ||||||
Taiwan Semiconductor Manufacturing ADR | 319,021 | 29,646,621 | ||||||
Unimicron Technology | 63,000 | 441,379 | ||||||
The accompanying notes are an integral part of the financial statements.
57
CATHOLIC RESPONSIBLE INVESTMENTS INTERNATIONAL EQUITY FUND
APRIL 30, 2022 (Unaudited)
| COMMON STOCK — continued | ||||||||
| Shares | Value | |||||||
TAIWAN — continued |
| |||||||
United Microelectronics ADR | 172,099 | $ | 1,369,908 | |||||
Yang Ming Marine Transport | 404,000 | 1,687,508 | ||||||
Yuanta Financial Holding | 569,000 | 500,159 | ||||||
|
| |||||||
| 47,363,885 | ||||||||
|
| |||||||
THAILAND — 0.5% |
| |||||||
Home Product Center | 1,902,500 | 826,978 | ||||||
Kasikornbank | 459,500 | 2,035,977 | ||||||
Kiatnakin Phatra Bank | 319,100 | 667,916 | ||||||
Krung Thai Bank | 1,499,200 | 660,220 | ||||||
PTT | 711,000 | 772,254 | ||||||
PTT Exploration & Production | 190,400 | 831,813 | ||||||
Thai Union Group, Cl F | 408,800 | 201,310 | ||||||
Tisco Financial Group | 91,700 | 241,783 | ||||||
|
| |||||||
| 6,238,251 | ||||||||
|
| |||||||
TURKEY — 0.1% |
| |||||||
KOC Holding | 84,641 | 227,335 | ||||||
Turk Hava Yollari AO * | 120,794 | 332,776 | ||||||
|
| |||||||
| 560,111 | ||||||||
|
| |||||||
UNITED ARAB EMIRATES — 0.2% |
| |||||||
Abu Dhabi Commercial Bank PJSC | 498,757 | 1,380,143 | ||||||
Fertiglobe | 313,584 | 474,997 | ||||||
|
| |||||||
| 1,855,140 | ||||||||
|
| |||||||
UNITED KINGDOM — 10.2% |
| |||||||
3i Group | 213,418 | 3,508,982 | ||||||
Ashtead Group | 38,241 | 1,980,901 | ||||||
Balfour Beatty | 407,519 | 1,208,549 | ||||||
Barclays | 4,056,293 | 7,442,432 | ||||||
BP | 2,184,892 | 10,456,376 | ||||||
CNH Industrial | 97,071 | 1,384,503 | ||||||
Compass Group | 421,646 | 8,858,994 | ||||||
Dechra Pharmaceuticals | 35,893 | 1,647,735 | ||||||
Experian | 365,939 | 12,749,041 | ||||||
Halma | 47,506 | 1,449,459 | ||||||
Howden Joinery Group | 197,700 | 1,855,335 | ||||||
Intermediate Capital Group | 48,776 | 938,574 | ||||||
JD Sports Fashion | 1,205,247 | 1,992,412 | ||||||
Lloyds Banking Group | 3,935,658 | 2,234,303 | ||||||
Persimmon | 39,633 | 1,034,118 | ||||||
Prudential | 897,512 | 11,173,179 | ||||||
RELX | 329,483 | 9,838,719 | ||||||
Segro ‡ | 121,234 | 2,045,135 | ||||||
SSP Group * | 2,635,352 | 7,972,949 | ||||||
| COMMON STOCK — continued | ||||||||
| Shares | Value | |||||||
UNITED KINGDOM — continued |
| |||||||
St. James’s Place | 40,767 | $ | 661,543 | |||||
Tate & Lyle * | 976,348 | 9,553,832 | ||||||
Taylor Wimpey | 873,595 | 1,369,372 | ||||||
Unilever | 237,695 | 11,039,281 | ||||||
WH Smith * | 249,753 | 4,398,729 | ||||||
|
| |||||||
| 116,794,453 | ||||||||
|
| |||||||
UNITED STATES — 9.9% |
| |||||||
Accenture, Cl A | 41,691 | 12,522,309 | ||||||
Aon, Cl A | 47,215 | 13,597,448 | ||||||
Atlassian, Cl A * | 25,580 | 5,751,151 | ||||||
BRP | 14,200 | 1,156,288 | ||||||
EPAM Systems * | 18,025 | 4,776,445 | ||||||
Ferguson | 81,864 | 10,317,712 | ||||||
Globant * | 4,648 | 1,003,921 | ||||||
JBS | 334,800 | 2,562,279 | ||||||
Lululemon Athletica * | 36,100 | 12,802,143 | ||||||
Mettler-Toledo International * | 9,132 | 11,666,404 | ||||||
ResMed | 68,676 | 13,733,140 | ||||||
Schneider Electric | 80,272 | 11,491,752 | ||||||
STERIS | 50,609 | 11,338,946 | ||||||
|
| |||||||
| 112,719,938 | ||||||||
|
| |||||||
Total Common Stock | 1,096,826,719 | |||||||
|
| |||||||
| PREFERRED STOCK — 0.5% | ||||||||
| Shares | Value | |||||||
GERMANY — 0.5% |
| |||||||
Volkswagen | 38,979 | $ | 6,018,269 | |||||
SOUTH KOREA — 0.0% |
| |||||||
LG Chemical | 240 | 47,300 | ||||||
|
| |||||||
Total Preferred Stock | 6,065,569 | |||||||
|
| |||||||
| RIGHTS — 0.0% | ||||||||
| Number of Rights | Value | |||||||
China Lumena * | 15,350 | $ | — | |||||
|
| |||||||
Total Rights | — | |||||||
|
| |||||||
Total Investments in Securities— 96.6% |
| |||||||
(Cost $1,035,238,108) | $ | 1,102,892,288 | ||||||
|
| |||||||
The accompanying notes are an integral part of the financial statements.
58
CATHOLIC RESPONSIBLE INVESTMENTS INTERNATIONAL EQUITY FUND
APRIL 30, 2022 (Unaudited)
Percentages based on Net Assets of $1,141,765,431.
| * | Non-income producing security. |
| ‡ | Real Estate Investment Trust. |
| (A) | Level 3 security in accordance with fair value hierarchy. |
| ADR — American Depositary Receipt |
| Cl — Class |
| GDR — Global Depositary Receipt |
| PJSC — Public Joint-Stock Company |
The following is a list of the inputs used as of April 30, 2022, in valuing the Fund’s investments carried at value:
| Investments in Securities | Level 1 | Level 2 | Level 3^ | Total | ||||||||||||
| �� | ||||||||||||||||
Common Stock | ||||||||||||||||
Australia | $ | – | $ | 2,055,479 | $ | – | $ | 2,055,479 | ||||||||
Brazil | 7,791,814 | – | – | 7,791,814 | ||||||||||||
Canada | 56,654,111 | – | – | 56,654,111 | ||||||||||||
China | 6,934,900 | 58,076,897 | – | 65,011,797 | ||||||||||||
Columbia | 434,883 | – | – | 434,883 | ||||||||||||
Denmark | 13,944,675 | – | 13,944,675 | |||||||||||||
Finland | 1,319,282 | – | 1,319,282 | |||||||||||||
France | 122,279,270 | – | 122,279,270 | |||||||||||||
Germany | 38,325,738 | – | 38,325,738 | |||||||||||||
Greece | 4,517 | – | – | 4,517 | ||||||||||||
Hong Kong | 18,478,086 | – | 18,478,086 | |||||||||||||
India | 26,874,184 | – | – | 26,874,184 | ||||||||||||
Indonesia | 8,928,526 | – | 8,928,526 | |||||||||||||
Ireland | 23,548,974 | 5,448,666 | – | 28,997,640 | ||||||||||||
Israel | 1,092,115 | – | – | 1,092,115 | ||||||||||||
Italy | 46,620,733 | – | 46,620,733 | |||||||||||||
Japan | 79,955,326 | – | 79,955,326 | |||||||||||||
Malaysia | 419,279 | – | 419,279 | |||||||||||||
Mexico | 7,812,169 | – | – | 7,812,169 | ||||||||||||
Netherlands | 12,609,844 | 65,311,631 | – | 77,921,475 | ||||||||||||
New Zealand | – | 1,090,598 | – | 1,090,598 | ||||||||||||
Norway | 3,356,199 | – | 3,356,199 | |||||||||||||
Poland | 1,550,546 | – | 1,550,546 | |||||||||||||
Qatar | 1,411,484 | – | 1,411,484 | |||||||||||||
Russia | – | –# | – | |||||||||||||
Saudi Arabia | 5,103,448 | – | 5,103,448 | |||||||||||||
Singapore | 4,218,134 | – | 4,218,134 | |||||||||||||
South Africa | 7,807,294 | – | 7,807,294 | |||||||||||||
South Korea | 3,304,386 | 26,925,751 | – | 30,230,137 | ||||||||||||
Spain | 46,678,087 | – | 46,678,087 | |||||||||||||
Sweden | 32,870,774 | – | 32,870,774 | |||||||||||||
Switzerland | 72,057,141 | – | 72,057,141 | |||||||||||||
Taiwan | 31,016,529 | 16,347,356 | – | 47,363,885 | ||||||||||||
Thailand | 6,238,251 | – | 6,238,251 | |||||||||||||
Turkey | 560,111 | – | 560,111 | |||||||||||||
United Arab Emirates | 1,855,140 | – | 1,855,140 | |||||||||||||
| Investments in Securities | Level 1 | Level 2 | Level 3^ | Total | ||||||||||||
United Kingdom | 116,794,453 | – | 116,794,453 | |||||||||||||
United States | 90,910,474 | 21,809,464 | – | 112,719,938 | ||||||||||||
Total Common Stock | 268,988,900 | 827,837,819 | – | 1,096,826,719 | ||||||||||||
Preferred Stock | – | 6,065,569 | – | 6,065,569 | ||||||||||||
Rights | – | – | –# | – | ||||||||||||
Total Investments in Securities | $ | 268,988,900 | $ | 833,903,388 | $ | – | $ | 1,102,892,288 | ||||||||
^ A reconciliation of Level 3 investments, including certain disclosures related to significant inputs used in valuing Level 3 investments is only presented when the Fund has over 1% of Level 3 investments at the end of the period in relation to net assets.
# Security or securities with a market value of $0.
Amounts designated as “–” are $0 or have been round to $0.
For more information on valuation inputs, see Note 2 — Significant Accounting Policies in the Notes to Financial Statements.
The accompanying notes are an integral part of the financial statements.
59
CATHOLIC RESPONSIBLE INVESTMENTS SMALL-CAP FUND
APRIL 30, 2022 (Unaudited)
| SECTOR WEIGHTINGS † | ||||
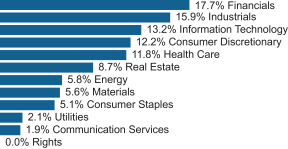
| † | Percent3ages are based on total investments. Total investments do not include derivatives such as options, futures contracts, forward contracts, and swap contracts, if applicable. |
| SCHEDULE OF INVESTMENTS | ||||||||
| COMMON STOCK — 98.5% | ||||||||
| Shares | Value | |||||||
COMMUNICATION SERVICES — 1.8% |
| |||||||
AMC Networks, Cl A * | 15,452 | $ | 504,199 | |||||
ATN International | 5,363 | 211,838 | ||||||
Cars.com * | 32,771 | 364,414 | ||||||
Cinemark Holdings * | 53,248 | 844,513 | ||||||
Cogent Communications Holdings | 21,521 | 1,258,979 | ||||||
Consolidated Communications Holdings * | 38,439 | 228,712 | ||||||
EW Scripps, Cl A * | 27,957 | 460,172 | ||||||
Gannett * | 69,905 | 280,319 | ||||||
Gogo * | 33,000 | 607,530 | ||||||
Loyalty Ventures * | 10,764 | 137,672 | ||||||
Marcus * | 10,631 | 167,226 | ||||||
QuinStreet * | 24,518 | 233,166 | ||||||
Scholastic | 14,812 | 545,822 | ||||||
Shenandoah Telecommunications | 25,707 | 519,281 | ||||||
TechTarget * | 13,086 | 880,819 | ||||||
Telephone and Data Systems | 49,056 | 898,706 | ||||||
Thryv Holdings * | 9,323 | 240,813 | ||||||
|
| |||||||
| 8,384,181 | ||||||||
|
| |||||||
CONSUMER DISCRETIONARY — 12.1% |
| |||||||
Aaron’s | 15,384 | 315,834 | ||||||
Abercrombie & Fitch, Cl A * | 28,181 | 974,499 | ||||||
Academy Sports & Outdoors | 43,409 | 1,621,760 | ||||||
Adtalem Global Education * | 24,337 | 713,318 | ||||||
American Axle & Manufacturing Holdings * | 55,803 | 369,416 | ||||||
| COMMON STOCK — continued | ||||||||
| Shares | Value | |||||||
CONSUMER DISCRETIONARY— continued |
| |||||||
American Public Education * | 9,190 | $ | 178,654 | |||||
America’s Car-Mart * | 2,957 | 239,073 | ||||||
Asbury Automotive Group * | 11,561 | 2,123,871 | ||||||
Bed Bath & Beyond * | 47,196 | 642,338 | ||||||
Big Lots | 15,662 | 483,956 | ||||||
BJ’s Restaurants * | 11,436 | 317,806 | ||||||
Bloomin’ Brands | 40,626 | 893,366 | ||||||
Boot Barn Holdings * | 14,717 | 1,325,413 | ||||||
Brinker International * | 22,266 | 808,924 | ||||||
Buckle | 14,783 | 459,160 | ||||||
Caleres | 20,980 | 481,071 | ||||||
Cato, Cl A | 9,264 | 125,527 | ||||||
Cavco Industries * | 4,338 | 1,024,853 | ||||||
Century Communities | 16,012 | 844,153 | ||||||
Cheesecake Factory | 23,777 | 877,609 | ||||||
Chico’s FAS * | 63,290 | 335,437 | ||||||
Children’s Place * | 7,630 | 353,498 | ||||||
Chuy’s Holdings * | 9,637 | 241,021 | ||||||
Conn’s * | 9,689 | 151,633 | ||||||
Dave & Buster’s Entertainment * | 18,968 | 863,044 | ||||||
Designer Brands, Cl A | 33,744 | 466,342 | ||||||
Dine Brands Global | 8,408 | 602,770 | ||||||
Dorman Products * | 13,936 | 1,375,762 | ||||||
El Pollo Loco Holdings * | 9,506 | 101,239 | ||||||
Ethan Allen Interiors | 10,872 | 258,101 | ||||||
Fossil Group * | 25,951 | 256,396 | ||||||
Genesco * | 7,026 | 435,823 | ||||||
Gentherm * | 16,251 | 1,095,642 | ||||||
G-III Apparel Group * | 24,596 | 651,302 | ||||||
Golden Entertainment * | 9,956 | 477,490 | ||||||
Group 1 Automotive | 8,418 | 1,465,911 | ||||||
Guess? | 19,759 | 443,985 | ||||||
Haverty Furniture | 7,900 | 196,157 | ||||||
Hibbett | 6,975 | 301,180 | ||||||
Installed Building Products | 12,662 | 1,018,911 | ||||||
iRobot * | 13,943 | 706,213 | ||||||
Jack in the Box | 10,316 | 853,752 | ||||||
Kontoor Brands | 25,414 | 1,009,698 | ||||||
La-Z-Boy, Cl Z | 22,379 | 588,120 | ||||||
LCI Industries | 12,370 | 1,203,848 | ||||||
LGI Homes * | 11,530 | 1,080,476 | ||||||
Liquidity Services * | 14,351 | 206,941 | ||||||
LL Flooring Holdings * | 15,338 | 211,818 | ||||||
M * | 15,518 | 687,137 | ||||||
MarineMax * | 10,825 | 442,959 | ||||||
MDC Holdings | 29,634 | 1,093,791 | ||||||
Meritage Homes * | 19,219 | 1,586,528 | ||||||
Monarch Casino & Resort * | 6,420 | 450,363 | ||||||
Monro | 16,405 | 750,201 | ||||||
Motorcar Parts of America * | 9,383 | 142,715 | ||||||
The accompanying notes are an integral part of the financial statements.
60
CATHOLIC RESPONSIBLE INVESTMENTS SMALL-CAP FUND
APRIL 30, 2022 (Unaudited)
| COMMON STOCK — continued | ||||||||
| Shares | Value | |||||||
CONSUMER DISCRETIONARY— continued |
| |||||||
Movado Group | 9,270 | $ | 333,442 | |||||
ODP * | 22,614 | 973,080 | ||||||
Oxford Industries | 8,773 | 786,061 | ||||||
Patrick Industries | 11,225 | 698,756 | ||||||
Perdoceo Education * | 34,188 | 382,222 | ||||||
PetMed Express | 10,249 | 224,453 | ||||||
Red Robin Gourmet Burgers * | 7,658 | 101,009 | ||||||
Rent-A-Center, Cl A | 30,537 | 736,552 | ||||||
Ruth’s Hospitality Group | 15,628 | 327,719 | ||||||
Sally Beauty Holdings * | 56,466 | 853,766 | ||||||
Shake Shack, Cl A * | 19,166 | 1,108,370 | ||||||
Shoe Carnival | 9,027 | 272,525 | ||||||
Shutterstock | 11,480 | 869,266 | ||||||
Signet Jewelers | 26,397 | 1,853,069 | ||||||
Sleep Number * | 11,784 | 477,959 | ||||||
Sonic Automotive, Cl A | 11,025 | 469,114 | ||||||
Sonos * | 65,342 | 1,491,104 | ||||||
Standard Motor Products | 9,366 | 399,741 | ||||||
Steven Madden | 38,959 | 1,599,657 | ||||||
Strategic Education | 11,059 | 714,411 | ||||||
Tupperware Brands * | 29,082 | 511,262 | ||||||
Unifi * | 6,791 | 99,624 | ||||||
Universal Electronics * | 6,401 | 188,830 | ||||||
Vera Bradley * | 12,358 | 76,002 | ||||||
Winnebago Industries | 16,706 | 888,425 | ||||||
Wolverine World Wide | 43,041 | 853,073 | ||||||
WW International * | 27,337 | 267,629 | ||||||
XPEL * | 8,357 | 361,607 | ||||||
Zumiez * | 9,541 | 349,487 | ||||||
|
| |||||||
| 55,195,020 | ||||||||
|
| |||||||
CONSUMER STAPLES — 5.1% |
| |||||||
Andersons | 15,537 | 780,424 | ||||||
B&G Foods | 33,303 | 896,850 | ||||||
Calavo Growers | 8,678 | 314,491 | ||||||
Cal-Maine Foods | 18,454 | 991,533 | ||||||
Celsius Holdings * | 20,155 | 1,048,060 | ||||||
Central Garden & Pet * | 4,742 | 207,652 | ||||||
Central Garden & Pet, Cl A * | 20,843 | 862,483 | ||||||
Chefs’ Warehouse * | 18,216 | 666,706 | ||||||
Coca-Cola Consolidated | 2,397 | 1,058,276 | ||||||
Edgewell Personal Care | 27,849 | 1,062,161 | ||||||
elf Beauty * | 27,727 | 674,598 | ||||||
Fresh Del Monte Produce | 16,278 | 424,042 | ||||||
Hostess Brands, Cl A * | 67,662 | 1,535,251 | ||||||
Inter Parfums | 9,677 | 790,901 | ||||||
J & J Snack Foods | 7,502 | 1,123,049 | ||||||
John B Sanfilippo & Son | 4,924 | 382,299 | ||||||
Medifast | 6,285 | 1,120,993 | ||||||
MGP Ingredients | 6,920 | 632,004 | ||||||
| COMMON STOCK — continued | ||||||||
| Shares | Value | |||||||
CONSUMER STAPLES— continued |
| |||||||
National Beverage * | 13,167 | $ | 580,401 | |||||
PriceSmart | 12,924 | 1,026,812 | ||||||
Seneca Foods, Cl A * | 4,121 | 223,564 | ||||||
Simply Good Foods * | 42,896 | 1,786,618 | ||||||
SpartanNash | 18,458 | 632,740 | ||||||
Tootsie Roll Industries | 9,912 | 347,217 | ||||||
TreeHouse Foods * | 27,314 | 860,391 | ||||||
United Natural Foods * | 30,105 | 1,292,408 | ||||||
USANA Health Sciences * | 6,966 | 534,013 | ||||||
WD-40 | 7,100 | 1,306,258 | ||||||
|
| |||||||
| 23,162,195 | ||||||||
|
| |||||||
ENERGY — 5.7% |
| |||||||
Archrock | 65,668 | 571,968 | ||||||
Bristow Group * | 11,362 | 338,815 | ||||||
Callon Petroleum * | 23,664 | 1,213,253 | ||||||
Civitas Resources | 35,311 | 2,069,931 | ||||||
CONSOL Energy * | 15,497 | 736,882 | ||||||
Core Laboratories | 23,304 | 605,904 | ||||||
DMC Global * | 9,417 | 188,246 | ||||||
Dorian LPG | 13,552 | 199,485 | ||||||
Dril-Quip * | 17,340 | 500,779 | ||||||
Green Plains * | 26,232 | 736,332 | ||||||
Helix Energy Solutions Group * | 69,694 | 286,442 | ||||||
Helmerich & Payne | 51,638 | 2,376,897 | ||||||
Laredo Petroleum * | 7,279 | 518,338 | ||||||
Nabors Industries * | 3,785 | 585,237 | ||||||
Oceaneering International * | 48,936 | 554,445 | ||||||
Oil States International * | 30,089 | 203,402 | ||||||
Par Pacific Holdings * | 22,428 | 329,019 | ||||||
Patterson-UTI Energy | 105,283 | 1,730,853 | ||||||
PBF Energy, Cl A * | 46,974 | 1,365,065 | ||||||
ProPetro Holding * | 41,420 | 585,679 | ||||||
Ranger Oil, Cl A * | 10,399 | 331,208 | ||||||
Renewable Energy Group * | 24,889 | 1,519,722 | ||||||
REX American Resources * | 2,545 | 215,383 | ||||||
RPC * | 34,703 | 358,829 | ||||||
SM Energy | 59,453 | 2,112,365 | ||||||
Southwestern Energy * | 548,095 | 4,110,713 | ||||||
Talos Energy * | 20,000 | 363,400 | ||||||
US Silica Holdings * | 36,504 | 678,244 | ||||||
World Fuel Services | 30,970 | 750,093 | ||||||
|
| |||||||
| 26,136,929 | ||||||||
|
| |||||||
FINANCIALS — 17.5% |
| |||||||
Allegiance Bancshares | 9,240 | 377,546 | ||||||
Ambac Financial Group * | 22,631 | 174,938 | ||||||
American Equity Investment Life Holding | 40,334 | 1,521,398 | ||||||
The accompanying notes are an integral part of the financial statements.
61
CATHOLIC RESPONSIBLE INVESTMENTS SMALL-CAP FUND
APRIL 30, 2022 (Unaudited)
| COMMON STOCK — continued | ||||||||
| Shares | Value | |||||||
FINANCIALS— continued |
| |||||||
Ameris Bancorp | 32,386 | $ | 1,350,496 | |||||
AMERISAFE | 9,496 | 440,140 | ||||||
Apollo Commercial Real Estate Finance ‡ | 64,753 | 779,626 | ||||||
ARMOUR Residential REIT ‡ | 43,722 | 320,919 | ||||||
Assured Guaranty | 34,165 | 1,884,200 | ||||||
Axos Financial * | 26,210 | 992,835 | ||||||
B Riley Financial | 9,348 | 422,156 | ||||||
Banc of California | 26,545 | 478,872 | ||||||
BancFirst | 9,252 | 756,351 | ||||||
Bancorp * | 28,051 | 636,477 | ||||||
BankUnited | 41,919 | 1,573,639 | ||||||
Banner | 16,757 | 899,851 | ||||||
Berkshire Hills Bancorp | 23,775 | 588,193 | ||||||
Blucora * | 23,803 | 482,011 | ||||||
Brightsphere Investment Group | 22,534 | 451,581 | ||||||
Brookline Bancorp | 37,906 | 548,121 | ||||||
Capitol Federal Financial | 63,236 | 608,963 | ||||||
Central Pacific Financial | 13,539 | 327,373 | ||||||
City Holding | 7,389 | 571,761 | ||||||
Columbia Banking System | 38,066 | 1,068,893 | ||||||
Community Bank System | 26,370 | 1,698,228 | ||||||
Customers Bancorp * | 14,792 | 622,299 | ||||||
CVB Financial | 66,313 | 1,526,525 | ||||||
Dime Community Bancshares | 15,975 | 502,254 | ||||||
Donnelley Financial Solutions * | 17,047 | 498,966 | ||||||
Eagle Bancorp | 15,616 | 786,266 | ||||||
eHealth * | 11,609 | 93,452 | ||||||
Ellington Financial ‡ | 28,534 | 461,965 | ||||||
Employers Holdings | 13,666 | 537,620 | ||||||
Encore Capital Group * | 12,806 | 740,315 | ||||||
Enova International * | 18,047 | 674,958 | ||||||
EZCORP, Cl A * | 26,347 | 184,429 | ||||||
FB Financial | 17,421 | 671,231 | ||||||
First Bancorp | 16,894 | 632,849 | ||||||
First BanCorp | 98,824 | 1,344,995 | ||||||
First Commonwealth Financial | 46,034 | 620,538 | ||||||
First Financial Bancorp | 46,039 | 941,498 | ||||||
First Hawaiian | 62,404 | 1,473,358 | ||||||
Flagstar Bancorp | 26,059 | 919,883 | ||||||
Franklin BSP Realty Trust ‡ | 21,511 | 285,236 | ||||||
Genworth Financial, Cl A * | 251,331 | 932,438 | ||||||
Granite Point Mortgage Trust ‡ | 26,277 | 255,675 | ||||||
Green Dot, Cl A * | 26,713 | 707,360 | ||||||
Greenhill | 8,057 | 97,570 | ||||||
| COMMON STOCK — continued | ||||||||
| Shares | Value | |||||||
FINANCIALS— continued |
| |||||||
Hanmi Financial | 14,923 | $ | 345,467 | |||||
HCI Group | 3,892 | 249,438 | ||||||
Heritage Financial | 17,139 | 415,107 | ||||||
Hilltop Holdings | 29,804 | 759,704 | ||||||
HomeStreet | 9,812 | 398,269 | ||||||
Hope Bancorp | 58,811 | 840,997 | ||||||
Horace Mann Educators | 20,293 | 808,676 | ||||||
Independent Bank | 23,150 | 1,786,254 | ||||||
Independent Bank Group | 18,006 | 1,220,807 | ||||||
Invesco Mortgage Capital ‡ | 152,289 | 264,983 | ||||||
James River Group Holdings | 18,288 | 433,608 | ||||||
KKR Real Estate Finance Trust ‡ | 21,900 | 416,100 | ||||||
Lakeland Financial | 12,402 | 903,114 | ||||||
LendingTree * | 6,102 | 484,621 | ||||||
Meta Financial Group | 14,712 | 642,179 | ||||||
Mr Cooper Group * | 36,768 | 1,653,457 | ||||||
National Bank Holdings, Cl A | 14,636 | 534,360 | ||||||
NBT Bancorp | 21,177 | 745,430 | ||||||
New York Mortgage Trust ‡ | 185,286 | 596,621 | ||||||
NMI Holdings, Cl A * | 42,034 | 772,585 | ||||||
Northfield Bancorp | 21,307 | 278,909 | ||||||
Northwest Bancshares | 61,958 | 785,627 | ||||||
OFG Bancorp | 24,248 | 644,512 | ||||||
Pacific Premier Bancorp | 46,198 | 1,448,769 | ||||||
Palomar Holdings * | 12,188 | 663,637 | ||||||
Park National | 7,070 | 833,199 | ||||||
PennyMac Mortgage Investment Trust ‡ | 46,358 | 711,132 | ||||||
Piper Sandler | 7,357 | 845,908 | ||||||
PRA Group * | 21,373 | 898,307 | ||||||
Preferred Bank | 6,597 | 442,791 | ||||||
ProAssurance | 26,372 | 647,960 | ||||||
PROG Holdings * | 15,745 | 416,770 | ||||||
Provident Financial Services | 37,359 | 826,755 | ||||||
Ready Capital ‡ | 33,775 | 492,102 | ||||||
Redwood Trust ‡ | 56,126 | 544,422 | ||||||
Renasant | 27,302 | 813,327 | ||||||
S&T Bancorp | 19,214 | 542,988 | ||||||
Safety Insurance Group | 6,953 | 598,236 | ||||||
Seacoast Banking Corp of Florida | 28,673 | 931,872 | ||||||
Selectquote * | 60,878 | 125,409 | ||||||
ServisFirst Bancshares | 23,887 | 1,918,604 | ||||||
Simmons First National, Cl A | 55,178 | 1,317,099 | ||||||
SiriusPoint * | 42,009 | 263,817 | ||||||
Southside Bancshares | 15,805 | 619,398 | ||||||
Stewart Information Services | 13,137 | 677,869 | ||||||
StoneX Group * | 8,360 | 566,641 | ||||||
Tompkins Financial | 5,810 | 424,130 | ||||||
Triumph Bancorp * | 11,727 | 814,323 | ||||||
The accompanying notes are an integral part of the financial statements.
62
CATHOLIC RESPONSIBLE INVESTMENTS SMALL-CAP FUND
APRIL 30, 2022 (Unaudited)
| COMMON STOCK — continued | ||||||||
| Shares | Value | |||||||
FINANCIALS— continued |
| |||||||
Trupanion * | 17,268 | $ | 1,098,590 | |||||
TrustCo Bank NY | 9,417 | 293,340 | ||||||
Trustmark | 30,215 | 842,394 | ||||||
Two Harbors Investment ‡ | 168,545 | 810,701 | ||||||
United Community Banks | 51,290 | 1,545,881 | ||||||
United Fire Group | 10,535 | 308,570 | ||||||
Universal Insurance Holdings | 13,704 | 172,122 | ||||||
Veritex Holdings | 24,184 | 794,444 | ||||||
Virtus Investment Partners | 3,737 | 662,047 | ||||||
Walker & Dunlop | 14,426 | 1,727,658 | ||||||
Westamerica BanCorp | 13,125 | 773,325 | ||||||
WisdomTree Investments | 54,749 | 319,187 | ||||||
World Acceptance * | 2,249 | 424,409 | ||||||
WSFS Financial | 32,052 | 1,284,324 | ||||||
|
| |||||||
| 79,889,530 | ||||||||
|
| |||||||
HEALTH CARE — 11.7% |
| |||||||
Addus HomeCare * | 8,437 | 711,070 | ||||||
Allscripts Healthcare Solutions * | 62,650 | 1,294,349 | ||||||
AMN Healthcare Services * | 23,911 | 2,337,300 | ||||||
AngioDynamics * | 20,119 | 423,505 | ||||||
Anika Therapeutics * | 10,553 | 227,206 | ||||||
Apollo Medical Holdings * | 19,594 | 714,789 | ||||||
Arcus Biosciences * | 22,009 | 532,838 | ||||||
Artivion * | 21,534 | 436,925 | ||||||
Avanos Medical * | 23,801 | 694,037 | ||||||
Cara Therapeutics * | 25,945 | 226,240 | ||||||
Cardiovascular Systems * | 22,235 | 415,795 | ||||||
Coherus Biosciences * | 38,440 | 347,498 | ||||||
Collegium Pharmaceutical * | 24,314 | 391,455 | ||||||
Computer Programs and Systems * | 7,944 | 253,572 | ||||||
CONMED | 15,067 | 2,003,308 | ||||||
CorVel * | 5,015 | 777,726 | ||||||
Covetrus * | 53,961 | 744,662 | ||||||
Cross Country Healthcare * | 21,703 | 406,714 | ||||||
Cutera * | 8,876 | 482,056 | ||||||
Cytokinetics * | 43,038 | 1,715,925 | ||||||
Eagle Pharmaceuticals * | 7,565 | 333,843 | ||||||
Embecta * | 28,000 | 852,040 | ||||||
Emergent BioSolutions * | 26,479 | 857,390 | ||||||
Enanta Pharmaceuticals * | 9,879 | 636,208 | ||||||
Ensign Group | 26,886 | 2,159,752 | ||||||
Fulgent Genetics * | 11,043 | 606,040 | ||||||
Glaukos * | 24,198 | 1,144,323 | ||||||
Hanger * | 23,715 | 389,875 | ||||||
Harmony Biosciences Holdings * | 13,371 | 602,230 | ||||||
HealthStream * | 12,943 | 247,211 | ||||||
| COMMON STOCK — continued | ||||||||
| Shares | Value | |||||||
HEALTH CARE— continued |
| |||||||
Heska * | 5,780 | $ | 634,875 | |||||
Innoviva * | 39,069 | 666,517 | ||||||
Inogen * | 11,316 | 286,068 | ||||||
Integer Holdings * | 17,078 | 1,283,753 | ||||||
Joint * | 8,711 | 265,860 | ||||||
Lantheus Holdings * | 33,935 | 2,253,623 | ||||||
LeMaitre Vascular | 10,924 | 472,026 | ||||||
Ligand Pharmaceuticals * | 8,980 | 833,883 | ||||||
Meridian Bioscience * | 23,346 | 597,424 | ||||||
Merit Medical Systems * | 25,968 | 1,610,276 | ||||||
Mesa Laboratories | 2,698 | 576,374 | ||||||
ModivCare * | 6,546 | 680,588 | ||||||
Myriad Genetics * | 43,573 | 893,247 | ||||||
Natus Medical * | 17,665 | 587,715 | ||||||
Nektar Therapeutics, Cl A * | 104,145 | 430,119 | ||||||
NeoGenomics * | 66,954 | 632,715 | ||||||
NextGen Healthcare * | 29,952 | 564,595 | ||||||
Omnicell * | 22,289 | 2,433,290 | ||||||
OptimizeRx * | 9,954 | 279,807 | ||||||
OraSure Technologies * | 38,569 | 236,814 | ||||||
Organogenesis Holdings, Cl A * | 47,543 | 306,177 | ||||||
Orthofix Medical * | 9,695 | 300,545 | ||||||
Owens & Minor | 38,373 | 1,361,858 | ||||||
Pacira BioSciences * | 23,899 | 1,782,148 | ||||||
Pennant Group * | 17,157 | 281,203 | ||||||
Phibro Animal Health, Cl A | 16,630 | 299,174 | ||||||
Prestige Consumer Healthcare * | 27,651 | 1,511,404 | ||||||
RadNet * | 26,402 | 514,839 | ||||||
Select Medical Holdings | 59,040 | 1,334,894 | ||||||
Supernus Pharmaceuticals * | 30,478 | 850,336 | ||||||
Surmodics * | 7,895 | 305,221 | ||||||
Tactile Systems Technology * | 12,043 | 203,286 | ||||||
Tivity Health * | 26,213 | 842,224 | ||||||
US Physical Therapy | 7,125 | 739,361 | ||||||
Vanda Pharmaceuticals * | 34,807 | 345,285 | ||||||
Varex Imaging * | 21,376 | 424,314 | ||||||
Vericel * | 25,732 | 733,362 | ||||||
Vir Biotechnology * | 40,162 | 817,297 | ||||||
Xencor * | 34,181 | 853,841 | ||||||
Zimvie * | 12,267 | 276,008 | ||||||
Zynex * | 20,027 | 127,572 | ||||||
|
| |||||||
| 53,395,800 | ||||||||
|
| |||||||
INDUSTRIALS — 15.6% |
| |||||||
AAON | 20,509 | 999,609 | ||||||
AAR * | 16,771 | 787,902 | ||||||
ABM Industries | 32,952 | 1,590,593 | ||||||
AeroVironment * | 11,641 | 935,005 | ||||||
Alamo Group | 4,835 | 611,337 | ||||||
The accompanying notes are an integral part of the financial statements.
63
CATHOLIC RESPONSIBLE INVESTMENTS SMALL-CAP FUND
APRIL 30, 2022 (Unaudited)
| COMMON STOCK — continued | ||||||||
| Shares | Value | |||||||
INDUSTRIALS— continued |
| |||||||
Albany International, Cl A | 16,079 | $ | 1,257,699 | |||||
Allegiant Travel * | 7,610 | 1,180,996 | ||||||
American Woodmark * | 8,132 | 380,984 | ||||||
Apogee Enterprises | 12,147 | 534,468 | ||||||
Applied Industrial Technologies | 19,188 | 2,008,792 | ||||||
ArcBest | 12,483 | 900,773 | ||||||
Arcosa | 23,663 | 1,266,680 | ||||||
Astec Industries | 11,128 | 435,105 | ||||||
Atlas Air Worldwide Holdings * | 13,223 | 911,594 | ||||||
AZZ | 12,063 | 550,555 | ||||||
Barnes Group | 22,829 | 766,598 | ||||||
Boise Cascade | 21,068 | 1,592,319 | ||||||
Brady, Cl A | 23,657 | 1,058,651 | ||||||
CIRCOR International * | 10,247 | 201,354 | ||||||
Comfort Systems USA | 17,931 | 1,513,735 | ||||||
CoreCivic * | 58,745 | 730,200 | ||||||
Deluxe | 20,853 | 564,699 | ||||||
DXP Enterprises * | 8,494 | 200,713 | ||||||
Encore Wire | 10,366 | 1,169,388 | ||||||
Enerpac Tool Group, Cl A | 30,401 | 610,452 | ||||||
EnPro Industries | 10,085 | 940,023 | ||||||
ESCO Technologies | 12,741 | 795,675 | ||||||
Exponent | 25,579 | 2,450,724 | ||||||
Federal Signal | 29,924 | 1,018,314 | ||||||
Forrester Research * | 5,432 | 302,508 | ||||||
Forward Air | 13,201 | 1,280,101 | ||||||
Franklin Electric | 19,089 | 1,335,085 | ||||||
GEO Group *‡ | 59,835 | 390,723 | ||||||
Gibraltar Industries * | 16,180 | 612,251 | ||||||
GMS * | 22,647 | 1,085,924 | ||||||
Granite Construction | 22,387 | 663,775 | ||||||
Greenbrier | 15,905 | 679,303 | ||||||
Griffon | 23,105 | 432,295 | ||||||
Harsco * | 39,263 | 401,268 | ||||||
Hawaiian Holdings * | 25,060 | 425,018 | ||||||
Healthcare Services Group | 36,661 | 626,536 | ||||||
Heartland Express | 22,754 | 314,005 | ||||||
Heidrick & Struggles International | 9,571 | 305,889 | ||||||
Hillenbrand | 36,365 | 1,484,419 | ||||||
HNI | 21,279 | 758,384 | ||||||
Hub Group, Cl A * | 16,604 | 1,115,125 | ||||||
Insteel Industries | 10,468 | 444,053 | ||||||
Interface, Cl A | 30,954 | 392,806 | ||||||
John Bean Technologies | 15,985 | 1,884,472 | ||||||
Kaman | 13,632 | 531,784 | ||||||
KAR Auction Services * | 59,352 | 870,100 | ||||||
Kelly Services, Cl A | 17,704 | 341,510 | ||||||
Korn Ferry | 26,632 | 1,636,270 | ||||||
Lindsay | 5,372 | 726,026 | ||||||
| COMMON STOCK — continued | ||||||||
| Shares | Value | |||||||
INDUSTRIALS— continued |
| |||||||
ManTech International, Cl A | 13,500 | $ | 1,084,590 | |||||
Marten Transport | 29,314 | 509,477 | ||||||
Matson | 20,718 | 1,782,162 | ||||||
Matthews International, Cl A | 15,397 | 458,985 | ||||||
Meritor * | 36,659 | 1,316,425 | ||||||
Moog, Cl A | 14,219 | 1,135,672 | ||||||
Mueller Industries | 29,689 | 1,607,659 | ||||||
MYR Group * | 8,257 | 653,046 | ||||||
NOW * | 56,653 | 617,518 | ||||||
NV5 Global * | 6,000 | 718,800 | ||||||
Park Aerospace | 9,615 | 112,495 | ||||||
PGT Innovations * | 29,297 | 520,608 | ||||||
Pitney Bowes | 91,305 | 481,177 | ||||||
Powell Industries | 4,490 | 86,657 | ||||||
Proto Labs * | 14,249 | 607,150 | ||||||
Quanex Building Products | 16,342 | 314,093 | ||||||
Resideo Technologies * | 73,211 | 1,646,515 | ||||||
Resources Connection | 14,937 | 256,767 | ||||||
SkyWest * | 24,725 | 720,734 | ||||||
SPX * | 22,227 | 931,311 | ||||||
Standex International | 5,977 | 562,077 | ||||||
Tennant | 9,064 | 585,353 | ||||||
Titan International * | 29,107 | 403,423 | ||||||
Triumph Group * | 32,428 | 730,927 | ||||||
TrueBlue * | 17,345 | 443,512 | ||||||
UFP Industries | 31,432 | 2,431,894 | ||||||
UniFirst | 7,438 | 1,281,567 | ||||||
US Ecology * | 15,565 | 746,964 | ||||||
Veritiv * | 7,132 | 1,002,331 | ||||||
Viad * | 10,316 | 337,849 | ||||||
Wabash National | 23,915 | 342,224 | ||||||
|
| |||||||
| 71,434,529 | ||||||||
|
| |||||||
INFORMATION TECHNOLOGY — 13.0% |
| |||||||
8x8 * | 59,613 | 546,651 | ||||||
A10 Networks | 30,000 | 428,400 | ||||||
ADTRAN | 27,788 | 483,233 | ||||||
Advanced Energy Industries | 20,803 | 1,591,846 | ||||||
Agilysys * | 10,208 | 375,757 | ||||||
Alarm.com Holdings * | 23,033 | 1,406,856 | ||||||
Arlo Technologies * | 46,863 | 362,720 | ||||||
Axcelis Technologies * | 16,619 | 904,905 | ||||||
Badger Meter | 15,749 | 1,270,787 | ||||||
Benchmark Electronics | 18,144 | 431,101 | ||||||
Bottomline Technologies DE * | 18,947 | 1,072,779 | ||||||
CalAmp * | 24,842 | 135,886 | ||||||
Cerence * | 20,075 | 592,213 | ||||||
CEVA * | 11,383 | 413,658 | ||||||
Cohu * | 25,576 | 679,299 | ||||||
The accompanying notes are an integral part of the financial statements.
64
CATHOLIC RESPONSIBLE INVESTMENTS SMALL-CAP FUND
APRIL 30, 2022 (Unaudited)
| COMMON STOCK — continued | ||||||||
| Shares | Value | |||||||
INFORMATION TECHNOLOGY— continued |
| |||||||
Comtech Telecommunications | 13,693 | $ | 186,225 | |||||
Consensus Cloud Solutions * | 8,161 | 430,248 | ||||||
Corsair Gaming * | 20,466 | 309,651 | ||||||
CSG Systems International | 15,922 | 978,725 | ||||||
CTS | 16,998 | 601,219 | ||||||
Diebold Nixdorf * | 45,399 | 186,136 | ||||||
Digi International * | 20,395 | 385,873 | ||||||
Diodes * | 22,252 | 1,625,064 | ||||||
Ebix | 12,854 | 383,049 | ||||||
ePlus * | 16,128 | 910,909 | ||||||
EVERTEC | 29,333 | 1,155,720 | ||||||
ExlService Holdings * | 16,300 | 2,219,245 | ||||||
Extreme Networks * | 73,073 | 701,501 | ||||||
Fabrinet * | 19,588 | 1,923,346 | ||||||
FARO Technologies * | 10,389 | 356,239 | ||||||
FormFactor * | 39,019 | 1,487,014 | ||||||
Harmonic * | 58,878 | 488,687 | ||||||
Ichor Holdings * | 15,227 | 443,258 | ||||||
Insight Enterprises * | 18,993 | 1,887,334 | ||||||
InterDigital | 15,036 | 854,797 | ||||||
Itron * | 23,744 | 1,134,488 | ||||||
Knowles * | 52,099 | 964,873 | ||||||
Kulicke & Soffa Industries | 31,730 | 1,472,589 | ||||||
LivePerson * | 33,985 | 768,741 | ||||||
MaxLinear, Cl A * | 35,221 | 1,686,029 | ||||||
Methode Electronics | 21,751 | 970,312 | ||||||
NETGEAR * | 16,867 | 366,014 | ||||||
NetScout Systems * | 37,481 | 1,154,415 | ||||||
OneSpan * | 16,791 | 237,257 | ||||||
Onto Innovation * | 24,289 | 1,727,919 | ||||||
OSI Systems * | 9,599 | 759,281 | ||||||
PC Connection * | 7,148 | 353,755 | ||||||
PDF Solutions * | 14,783 | 343,705 | ||||||
Perficient * | 16,121 | 1,602,589 | ||||||
Photronics * | 30,111 | 451,364 | ||||||
Plantronics * | 23,392 | 932,405 | ||||||
Plexus * | 15,916 | 1,291,424 | ||||||
Progress Software | 21,631 | 1,037,855 | ||||||
Rambus * | 53,545 | 1,333,806 | ||||||
Sanmina * | 35,146 | 1,437,120 | ||||||
ScanSource * | 15,703 | 537,671 | ||||||
SMART Global Holdings * | 23,449 | 531,354 | ||||||
SPS Commerce * | 17,622 | 2,108,120 | ||||||
TTEC Holdings | 9,138 | 674,476 | ||||||
TTM Technologies * | 54,837 | 764,976 | ||||||
Ultra Clean Holdings * | 23,138 | 721,211 | ||||||
Unisys * | 32,805 | 466,159 | ||||||
Veeco Instruments * | 24,669 | 565,413 | ||||||
Viavi Solutions * | 119,586 | 1,714,863 | ||||||
Vonage Holdings * | 123,569 | 2,466,437 | ||||||
| COMMON STOCK — continued | ||||||||
| Shares | Value | |||||||
INFORMATION TECHNOLOGY— continued |
| |||||||
Xperi Holding | 51,160 | $ | 798,096 | |||||
|
| |||||||
| 59,585,048 | ||||||||
|
| |||||||
MATERIALS — 5.5% |
| |||||||
AdvanSix | 14,219 | 633,314 | ||||||
Allegheny Technologies * | 63,461 | 1,724,870 | ||||||
American Vanguard | 13,240 | 283,336 | ||||||
Arconic * | 52,520 | 1,321,403 | ||||||
Balchem | 15,849 | 1,952,597 | ||||||
Carpenter Technology | 23,652 | 903,033 | ||||||
Century Aluminum * | 25,730 | 434,065 | ||||||
Clearwater Paper * | 8,203 | 271,601 | ||||||
Compass Minerals International | 16,948 | 1,002,135 | ||||||
FutureFuel | 12,531 | 119,170 | ||||||
GCP Applied Technologies * | 26,454 | 829,862 | ||||||
Glatfelter | 21,768 | 239,448 | ||||||
Hawkins | 9,187 | 342,491 | ||||||
Haynes International | 6,063 | 236,942 | ||||||
HB Fuller | 25,856 | 1,724,595 | ||||||
Innospec | 12,073 | 1,150,678 | ||||||
Kaiser Aluminum | 7,763 | 749,130 | ||||||
Koppers Holdings | 11,652 | 282,678 | ||||||
Livent * | 80,414 | 1,717,643 | ||||||
Materion | 10,100 | 860,015 | ||||||
Mercer International | 23,456 | 375,531 | ||||||
Myers Industries | 18,669 | 409,411 | ||||||
Neenah | 8,220 | 290,988 | ||||||
O-I Glass, Cl I * | 80,734 | 1,088,294 | ||||||
Olympic Steel | 5,559 | 190,841 | ||||||
Quaker Chemical | 6,572 | 1,069,330 | ||||||
Rayonier Advanced Materials * | 31,126 | 159,677 | ||||||
Stepan | 10,434 | 1,065,416 | ||||||
SunCoke Energy | 40,929 | 340,529 | ||||||
Sylvamo * | 20,399 | 910,815 | ||||||
TimkenSteel * | 22,336 | 461,685 | ||||||
Tredegar | 17,033 | 195,028 | ||||||
Trinseo | 20,497 | 972,583 | ||||||
Warrior Met Coal | 25,386 | 864,901 | ||||||
|
| |||||||
| 25,174,035 | ||||||||
|
| |||||||
REAL ESTATE — 8.5% |
| |||||||
Acadia Realty Trust ‡ | 43,638 | 912,907 | ||||||
Agree Realty ‡ | 34,889 | 2,369,661 | ||||||
Alexander & Baldwin ‡ | 35,496 | 752,515 | ||||||
American Assets Trust ‡ | 25,772 | 943,255 | ||||||
Armada Hoffler Properties ‡ | 32,889 | 445,646 | ||||||
Brandywine Realty Trust ‡ | 83,810 | 978,063 | ||||||
CareTrust REIT ‡ | 48,064 | 779,117 | ||||||
The accompanying notes are an integral part of the financial statements.
65
CATHOLIC RESPONSIBLE INVESTMENTS SMALL-CAP FUND
APRIL 30, 2022 (Unaudited)
| COMMON STOCK — continued | ||||||||
| Shares | Value | |||||||
REAL ESTATE— continued |
| |||||||
Centerspace ‡ | 7,329 | $ | 676,173 | |||||
Chatham Lodging Trust *‡ | 23,821 | 342,070 | ||||||
DiamondRock Hospitality *‡ | 103,174 | 1,095,708 | ||||||
Diversified Healthcare Trust ‡ | 136,623 | 307,402 | ||||||
Douglas Elliman | 38,691 | 234,467 | ||||||
Easterly Government Properties, Cl A ‡ | 42,222 | 804,329 | ||||||
Essential Properties Realty Trust ‡ | 59,502 | 1,428,048 | ||||||
Four Corners Property Trust ‡ | 37,859 | 1,039,608 | ||||||
Franklin Street Properties ‡ | 46,781 | 241,390 | ||||||
Getty Realty ‡ | 19,338 | 520,386 | ||||||
Global Net Lease ‡ | 50,773 | 712,345 | ||||||
Hersha Hospitality Trust, Cl A *‡ | 16,231 | 158,739 | ||||||
Independence Realty Trust ‡ | 108,007 | 2,944,271 | ||||||
Industrial Logistics Properties Trust ‡ | 31,948 | 516,280 | ||||||
Innovative Industrial Properties, Cl A ‡ | 13,078 | 1,890,948 | ||||||
iStar ‡ | 34,988 | 589,198 | ||||||
LTC Properties ‡ | 19,294 | 636,702 | ||||||
LXP Industrial Trust ‡ | 138,420 | 1,737,171 | ||||||
Marcus & Millichap | 12,969 | 580,881 | ||||||
NexPoint Residential Trust ‡ | 11,220 | 1,000,375 | ||||||
Office Properties Income Trust ‡ | 23,659 | 511,508 | ||||||
Orion Office REIT ‡ | 29,736 | 399,057 | ||||||
RE, Cl A | 9,211 | 216,090 | ||||||
Realogy Holdings * | 65,270 | 715,359 | ||||||
Retail Opportunity Investments ‡ | 59,429 | 1,107,162 | ||||||
RPT Realty ‡ | 43,724 | 581,092 | ||||||
Safehold ‡ | 7,215 | 310,606 | ||||||
Saul Centers ‡ | 6,463 | 333,555 | ||||||
Service Properties Trust ‡ | 80,939 | 657,225 | ||||||
SITE Centers ‡ | 91,959 | 1,462,148 | ||||||
St. Joe | 17,494 | 930,856 | ||||||
Summit Hotel Properties *‡ | 52,788 | 521,018 | ||||||
Tanger Factory Outlet Centers ‡ | 55,096 | 888,698 | ||||||
Uniti Group ‡ | 117,766 | 1,459,121 | ||||||
Urban Edge Properties ‡ | 58,493 | 1,093,234 | ||||||
Urstadt Biddle Properties, Cl A ‡ | 16,433 | 285,113 | ||||||
Veris Residential *‡ | 39,233 | 628,120 | ||||||
Washington Real Estate Investment Trust ‡ | 41,464 | 998,868 | ||||||
Whitestone REIT, Cl B ‡ | 22,652 | 275,222 | ||||||
| COMMON STOCK — continued | ||||||||
| Shares | Value | |||||||
REAL ESTATE— continued |
| |||||||
Xenia Hotels & Resorts *‡ | 57,241 | $ | 1,104,179 | |||||
|
| |||||||
| 39,115,886 | ||||||||
|
| |||||||
UTILITIES — 2.0% |
| |||||||
American States Water | 18,782 | 1,477,392 | ||||||
Avista | 34,723 | 1,408,712 | ||||||
California Water Service Group | 26,614 | 1,380,468 | ||||||
Chesapeake Utilities | 8,973 | 1,123,150 | ||||||
Middlesex Water | 9,140 | 813,003 | ||||||
Northwest Natural Holding | 15,184 | 726,251 | ||||||
South Jersey Industries | 56,298 | 1,924,829 | ||||||
Unitil | 8,278 | 422,178 | ||||||
|
| |||||||
| 9,275,983 | ||||||||
|
| |||||||
Total Common Stock (Cost $399,175,601) | 450,749,136 | |||||||
|
| |||||||
| RIGHTS — 0.0% | ||||||||
| Number of Rights | Value | |||||||
Media General * (A) (B) | 20,366 | $ | — | |||||
Progenics Pharmaceuticals * (A) (B) | 61,398 | — | ||||||
Toriba Therapeutics * (B) | 2,044 | — | ||||||
|
| |||||||
| — | ||||||||
|
| |||||||
Total Rights | — | |||||||
|
| |||||||
Total Investments in Securities— 98.5% |
| |||||||
(Cost $399,175,724) | $ | 450,749,136 | ||||||
|
| |||||||
Percentages based on Net Assets of $457,573,418.
A list of the open futures contracts held by the Fund at April 30, 2022, is as follows:
| Type of Contract | Number of Contracts | Expiration Date | Notional Amount | Value | Unrealized Appreciation/ (Depreciation) | |||||
| Long Contracts | ||||||||||
Russell 2000 Index E-MINI | 69 | Jun-2022 | $6,931,020 | $6,421,485 | $(509,535) | |||||
|
|
|
| * | Non-income producing security. |
| ‡ | Real Estate Investment Trust. |
The accompanying notes are an integral part of the financial statements.
66
CATHOLIC RESPONSIBLE INVESTMENTS SMALL-CAP FUND
APRIL 30, 2022 (Unaudited)
| (A) | Level 3 security in accordance with fair value hierarchy. |
| (B) | Expiration date not available. |
| Cl — Class |
The following is a list of the inputs used as of April 30, 2022, in valuing the Fund’s investments and other financial instruments carried at value:
| Investments in Securities | Level 1 | Level 2 | Level 3^ | Total | ||||||||||||
Common Stock | $ | 450,749,136 | $ | – | $ | – | $ | 450,749,136 | ||||||||
Rights | – | – | – # | – | ||||||||||||
Total Investments in Securities | $ | 450,749,136 | $ | – | $ | – | $ | 450,749,136 | ||||||||
| Other Financial Instruments | Level 1 | Level 2 | Level 3 | Total | ||||||||||||
Futures Contracts* | ||||||||||||||||
Unrealized Depreciation | $ | (509,535) | $ | – | $ | – | $ | (509,535) | ||||||||
|
|
|
|
|
|
|
| |||||||||
Total Other Financial Instruments | $ | (509,535) | $ | – | $ | – | $ | (509,535) | ||||||||
|
|
|
|
|
|
|
| |||||||||
^ A reconciliation of Level 3 investments, including certain disclosures related to significant inputs used in valuing Level 3 investments is only presented when the Fund has over 1% of Level 3 investments at the end of the period in relation to net assets.
# Security or securities with a market value of $0.
Amounts designated as “–” are $0 or have been round to $0.
* Futures contracts are valued at the unrealized appreciation (depreciation) on the instrument.
Amounts designated as “–” are $0 or have been round to $0.
For more information on valuation inputs, see Note 2 — Significant Accounting Policies in the Notes to Financial Statements.
The accompanying notes are an integral part of the financial statements.
67
CATHOLIC RESPONSIBLE INVESTMENTS INTERNATIONAL SMALL-CAP FUND
APRIL 30, 2022 (Unaudited)
| SECTOR WEIGHTINGS † | ||||
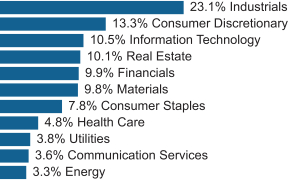
† Percentages are based on total investments.
| SCHEDULE OF INVESTMENTS | ||||||||
| COMMON STOCK — 95.7% | ||||||||
| Shares | Value | |||||||
AUSTRALIA — 6.7% |
| |||||||
Adbri | 28,990 | $ | 59,276 | |||||
ALS | 61,334 | 554,725 | ||||||
Alumina | 362,707 | 454,826 | ||||||
Australian Clinical Labs | 10,497 | 38,031 | ||||||
Bravura Solutions | 301,616 | 401,499 | ||||||
Charter Hall Group ‡ | 14,732 | 159,374 | ||||||
Charter Hall Long Wale REIT ‡ | 40,863 | 154,063 | ||||||
Charter Hall Retail REIT ‡ | 54,487 | 170,684 | ||||||
Coronado Global Resources, Cl CDI | 90,514 | 145,923 | ||||||
Elders | 38,229 | 385,955 | ||||||
Emeco Holdings | 75,097 | 44,362 | ||||||
Grange Resources | 300,656 | 283,428 | ||||||
GUD Holdings | 10,599 | 94,629 | ||||||
Ingenia Communities Group ‡ | 31,545 | 103,396 | ||||||
JB Hi-Fi | 4,661 | 173,108 | ||||||
Lovisa Holdings | 7,175 | 82,794 | ||||||
Myer Holdings | 156,085 | 53,322 | ||||||
Nick Scali | 10,498 | 75,148 | ||||||
Nine Entertainment Holdings | 34,811 | 64,989 | ||||||
NRW Holdings | 48,437 | 66,372 | ||||||
Orora | 244,731 | 688,295 | ||||||
Service Stream * | 50,876 | 31,592 | ||||||
West African Resources * | 257,218 | 245,957 | ||||||
Westgold Resources * | 310,649 | 359,312 | ||||||
|
| |||||||
| 4,891,060 | ||||||||
|
| |||||||
AUSTRIA — 1.7% |
| |||||||
ANDRITZ | 1,000 | 42,676 | ||||||
| COMMON STOCK — continued | ||||||||
| Shares | Value | |||||||
AUSTRIA — continued |
| |||||||
Palfinger | 18,340 | $ | 463,808 | |||||
Porr Ag | 1,756 | 22,276 | ||||||
Schoeller-Bleckmann Oilfield Equipment | 9,960 | 570,872 | ||||||
Semperit Holding | 2,174 | 52,974 | ||||||
Telekom Austria, Cl A | 8,421 | 60,212 | ||||||
|
| |||||||
| 1,212,818 | ||||||||
|
| |||||||
BELGIUM — 0.7% |
| |||||||
Bekaert | 4,918 | 182,982 | ||||||
Telenet Group Holding | 3,692 | 110,041 | ||||||
Tessenderlo Group * | 1,120 | 39,346 | ||||||
Warehouses De Pauw CVA ‡ | 4,804 | 186,564 | ||||||
|
| |||||||
| 518,933 | ||||||||
|
| |||||||
BRAZIL — 0.9% |
| |||||||
Cia de Saneamento do Parana | 45,700 | 183,180 | ||||||
ERO Copper * | 1,645 | 23,773 | ||||||
Jalles Machado | 51,000 | 101,955 | ||||||
Marfrig Global Foods | 28,100 | 106,846 | ||||||
Mills Estruturas e Servicos de Engenharia | 90,500 | 136,329 | ||||||
Portobello | 74,200 | 134,400 | ||||||
|
| |||||||
| 686,483 | ||||||||
|
| |||||||
CANADA — 3.6% |
| |||||||
AGF Management, Cl B | 17,141 | 94,554 | ||||||
ARC Resources | 20,904 | 291,303 | ||||||
Aritzia * | 2,899 | 103,775 | ||||||
Artis Real Estate Investment Trust ‡ | 19,048 | 195,391 | ||||||
BTB Real Estate Investment Trust ‡ | 7,547 | 24,565 | ||||||
Calibre Mining * | 49,746 | 55,271 | ||||||
Canfor * | 16,127 | 308,900 | ||||||
CI Financial | 5,718 | 74,940 | ||||||
Cogeco | 517 | 30,946 | ||||||
Crescent Point Energy | 20,199 | 140,660 | ||||||
Descartes Systems Group * | 1,792 | 111,876 | ||||||
Finning International | 13,310 | 376,373 | ||||||
First Capital Real Estate Investment Trust ‡ | 2,500 | 33,489 | ||||||
Granite Real Estate Investment Trust ‡ | 2,610 | 194,292 | ||||||
Home Capital Group, Cl B | 2,522 | 63,225 | ||||||
Interfor * | 1,441 | 41,289 | ||||||
Killam Apartment Real Estate Investment Trust ‡ | 9,719 | 153,688 | ||||||
North West | 5,635 | 157,977 | ||||||
Pet Valu Holdings | 2,323 | 57,164 | ||||||
The accompanying notes are an integral part of the financial statements.
68
CATHOLIC RESPONSIBLE INVESTMENTS INTERNATIONAL SMALL-CAP FUND
APRIL 30, 2022 (Unaudited)
| COMMON STOCK — continued | ||||||||
| Shares | Value | |||||||
CANADA — continued |
| |||||||
Stelco Holdings | 1,908 | $ | 70,002 | |||||
Western Forest Products | 61,717 | 99,477 | ||||||
|
| |||||||
| 2,679,157 | ||||||||
|
| |||||||
CHINA — 2.6% |
| |||||||
Anhui Expressway, Cl H | 24,000 | 21,095 | ||||||
Beijing Enterprises Holdings | 34,500 | 116,697 | ||||||
China BlueChemical | 216,000 | 74,195 | ||||||
China Modern Dairy Holdings | 1,020,000 | 148,829 | ||||||
China Reinsurance Group, Cl H | 666,000 | 58,173 | ||||||
China Taiping Insurance Holdings | 44,000 | 50,405 | ||||||
China World Trade Center, Cl A | 73,800 | 158,621 | ||||||
China Yongda Automobiles Services Holdings | 31,000 | 28,970 | ||||||
COFCO Joycome Foods | 164,000 | 66,812 | ||||||
FinVolution Group ADR | 5,961 | 22,413 | ||||||
G-bits Network Technology Xiamen, Cl A | 400 | 20,297 | ||||||
Jiutian Chemical Group | 1,709,400 | 112,887 | ||||||
JNBY Design | 27,500 | 29,855 | ||||||
Kerry Logistics Network | 169,523 | 390,172 | ||||||
Maanshan Iron & Steel, Cl H | 106,000 | 41,431 | ||||||
NetDragon Websoft Holdings | 41,000 | 82,678 | ||||||
Newborn Town * | 52,000 | 18,968 | ||||||
S-Enjoy Service Group | 58,000 | 67,313 | ||||||
Shenzhen New Nanshan Holding Group, Cl A * | 60,100 | 42,472 | ||||||
Tongdao Liepin Group * | 19,400 | 36,324 | ||||||
West China Cement | 258,000 | 40,650 | ||||||
Yangzijiang Shipbuilding Holdings | 391,100 | 255,734 | ||||||
Yuexiu Property | 51,600 | 53,764 | ||||||
|
| |||||||
| 1,938,755 | ||||||||
|
| |||||||
DENMARK — 1.2% |
| |||||||
D | 5,761 | 215,192 | ||||||
Dfds * | 9,750 | 378,907 | ||||||
Jyske Bank * | 3,129 | 174,678 | ||||||
Per Aarsleff Holding | 1,900 | 72,921 | ||||||
Ringkjoebing Landbobank | 371 | 45,706 | ||||||
|
| |||||||
| 887,404 | ||||||||
|
| |||||||
EGYPT — 0.1% |
| |||||||
Centamin | 59,485 | 68,390 | ||||||
|
| |||||||
| COMMON STOCK — continued | ||||||||
| Shares | Value | |||||||
FINLAND — 0.5% |
| |||||||
Puuilo * | 13,535 | $ | 93,391 | |||||
Tokmanni Group | 4,455 | 57,918 | ||||||
Uponor | 3,742 | 65,714 | ||||||
Valmet | 6,918 | 185,310 | ||||||
|
| |||||||
| 402,333 | ||||||||
|
| |||||||
FRANCE — 5.3% |
| |||||||
Biosynex | 5,257 | 101,387 | ||||||
Elis | 1,696 | 24,331 | ||||||
Eurobio Scientific * | 2,705 | 51,515 | ||||||
Korian | 5,491 | 115,767 | ||||||
Lagardere | 3,469 | 91,020 | ||||||
LISI | 20,333 | 453,689 | ||||||
Pharmagest Interactive | 285 | 22,856 | ||||||
Rothschild | 25,514 | 1,010,847 | ||||||
SCOR | 7,923 | 222,561 | ||||||
Societe BIC | 3,522 | 210,192 | ||||||
Sopra Steria Group | 6,630 | 1,170,049 | ||||||
Sword Group | 741 | 31,894 | ||||||
Technip Energies | 6,872 | 83,633 | ||||||
Television Francaise 1 | 5,294 | 44,779 | ||||||
Verallia | 2,662 | 72,746 | ||||||
Vicat | 1,545 | 46,704 | ||||||
Virbac | 393 | 158,952 | ||||||
|
| |||||||
| 3,912,922 | ||||||||
|
| |||||||
GERMANY — 2.7% |
| |||||||
Adesso | 571 | 112,023 | ||||||
Atoss Software | 346 | 50,499 | ||||||
Aurubis | 4,680 | 533,689 | ||||||
Cliq Digital | 3,776 | 97,227 | ||||||
flatexDEGIRO * | 20,620 | 351,896 | ||||||
Kloeckner | 11,918 | 154,121 | ||||||
Koenig & Bauer * | 963 | 18,718 | ||||||
METRO * | 8,284 | 72,237 | ||||||
PATRIZIA | 16,003 | 272,394 | ||||||
ProSiebenSat.1 Media | 6,448 | 73,938 | ||||||
Sirius Real Estate | 47,783 | 73,203 | ||||||
Wacker Chemie | 1,187 | 188,393 | ||||||
|
| |||||||
| 1,998,338 | ||||||||
|
| |||||||
GHANA — 0.1% |
| |||||||
Tullow Oil * | 132,597 | 90,518 | ||||||
|
| |||||||
GREECE — 0.0% |
| |||||||
National Bank of Greece * | 9,090 | 35,904 | ||||||
|
| |||||||
HONG KONG — 0.6% |
| |||||||
Perfect Medical Health Management | 76,000 | 44,147 | ||||||
The accompanying notes are an integral part of the financial statements.
69
CATHOLIC RESPONSIBLE INVESTMENTS INTERNATIONAL SMALL-CAP FUND
APRIL 30, 2022 (Unaudited)
| COMMON STOCK — continued | ||||||||
| Shares | Value | |||||||
HONG KONG — continued |
| |||||||
Texhong Textile Group | 67,000 | $ | 80,504 | |||||
Vitasoy International Holdings | 156,000 | 282,557 | ||||||
|
| |||||||
| 407,208 | ||||||||
|
| |||||||
HUNGARY — 0.1% |
| |||||||
Magyar Telekom Telecommunications | 36,018 | 38,981 | ||||||
|
| |||||||
INDIA — 1.6% |
| |||||||
Azure Power Global * | 19,649 | 276,069 | ||||||
MakeMyTrip * | 15,490 | 394,530 | ||||||
WNS Holdings ADR * | 6,244 | 489,342 | ||||||
|
| |||||||
| 1,159,941 | ||||||||
|
| |||||||
INDONESIA — 0.6% |
| |||||||
Astra Agro Lestari | 34,100 | 29,395 | ||||||
First Pacific | 294,000 | 118,530 | ||||||
Golden Agri-Resources | 361,200 | 84,049 | ||||||
Industri Jamu Dan Farmasi Sido Muncul | 1,228,500 | 79,706 | ||||||
Link Net | 243,100 | 77,277 | ||||||
Metrodata Electronics | 741,000 | 36,429 | ||||||
|
| |||||||
| 425,386 | ||||||||
|
| |||||||
IRAQ — 0.1% |
| |||||||
Gulf Keystone Petroleum | 18,316 | 54,483 | ||||||
|
| |||||||
IRELAND — 0.1% |
| |||||||
Origin Enterprises | 8,076 | 37,183 | ||||||
|
| |||||||
ISRAEL — 1.3% |
| |||||||
AudioCodes | 13,610 | 320,924 | ||||||
Bezeq The Israeli Telecommunication | 66,873 | 106,687 | ||||||
Cogeco Communications | 456 | 37,642 | ||||||
Palram Industries 1990 | 2,746 | 38,368 | ||||||
Plus500 | 14,443 | 286,905 | ||||||
ZIM Integrated Shipping Services | 3,209 | 178,517 | ||||||
|
| |||||||
| 969,043 | ||||||||
|
| |||||||
ITALY — 3.4% |
| |||||||
Autogrill * | 123,843 | 921,961 | ||||||
Banco BPM | 60,944 | 190,968 | ||||||
BPER Banca | 47,605 | 79,707 | ||||||
Buzzi Unicem | 4,982 | 92,368 | ||||||
De’ Longhi | 17,886 | 433,817 | ||||||
Digital Bros | 757 | 19,309 | ||||||
doValue | 59,696 | 506,773 | ||||||
| COMMON STOCK — continued | ||||||||
| Shares | Value | |||||||
ITALY — continued |
| |||||||
Hera | 10,841 | $ | 40,442 | |||||
MFE-MediaForEurope, Cl B | 21,735 | 19,911 | ||||||
Piaggio & C | 16,942 | 42,222 | ||||||
Stevanato Group * | 8,953 | 143,248 | ||||||
|
| |||||||
| 2,490,726 | ||||||||
|
| |||||||
JAPAN — 22.6% | ||||||||
77 Bank | 3,500 | 43,096 | ||||||
Advance Residence Investment ‡ | 205 | 564,624 | ||||||
Aichi Bank | 3,100 | 109,567 | ||||||
Ain Holdings | 7,900 | 354,679 | ||||||
Aisan Industry | 4,800 | 25,974 | ||||||
Alps Alpine | 8,000 | 70,915 | ||||||
Ariake Japan | 8,900 | 356,731 | ||||||
Asics | 39,300 | 617,237 | ||||||
Astena Holdings | 8,000 | 26,783 | ||||||
Bell System24 Holdings | 4,400 | 50,689 | ||||||
Belluna | 3,600 | 20,229 | ||||||
Careerlink | 8,000 | 85,726 | ||||||
Cawachi | 4,600 | 72,356 | ||||||
Charm Care | 29,300 | 293,798 | ||||||
Cosmo Energy Holdings | 4,500 | 110,974 | ||||||
Credit Saison | 16,800 | 187,406 | ||||||
Cresco | 1,700 | 24,636 | ||||||
Daihen | 1,800 | 51,625 | ||||||
Daiseki | 7,420 | 266,320 | ||||||
DCM Holdings | 12,000 | 98,750 | ||||||
Dear Life | 8,200 | 32,325 | ||||||
DMG Mori | 60,800 | 762,199 | ||||||
Exedy | 10,500 | 125,418 | ||||||
FIDEA Holdings | 2,500 | 24,805 | ||||||
Fuji Seal International | 31,100 | 411,009 | ||||||
H.U. Group Holdings | 10,400 | 231,778 | ||||||
Hakuto | 3,100 | 54,754 | ||||||
Hanwa | 7,300 | 178,015 | ||||||
Heiwado | 1,600 | 24,038 | ||||||
Hito Communications Holdings | 2,000 | 23,783 | ||||||
Hokkaido Electric Power | 38,100 | 141,834 | ||||||
Horiba | 13,400 | 654,461 | ||||||
IDOM | 4,000 | 20,009 | ||||||
Internet Initiative Japan | 29,000 | 911,208 | ||||||
ISB | 4,100 | 34,401 | ||||||
Itfor | 6,300 | 39,190 | ||||||
Itoham Yonekyu Holdings | 25,000 | 125,762 | ||||||
Iwatani | 12,300 | 490,910 | ||||||
JINUSHI | 5,000 | 73,567 | ||||||
Joshin Denki | 1,600 | 24,525 | ||||||
JSB | 2,000 | 53,464 | ||||||
JSP | 1,500 | 17,460 | ||||||
The accompanying notes are an integral part of the financial statements.
70
CATHOLIC RESPONSIBLE INVESTMENTS INTERNATIONAL SMALL-CAP FUND
APRIL 30, 2022 (Unaudited)
| COMMON STOCK — continued | ||||||||
| Shares | Value | |||||||
JAPAN — continued | ||||||||
Juki | 12,600 | $ | 84,446 | |||||
Juroku Financial Group | 2,900 | 48,722 | ||||||
JVCKenwood | 114,700 | 163,400 | ||||||
Kawasaki Kisen Kaisha | 1,300 | 68,356 | ||||||
KFC Holdings Japan | 1,900 | 41,766 | ||||||
Kintetsu World Express | 5,100 | 121,899 | ||||||
Ki-Star Real Estate | 500 | 20,728 | ||||||
Kobe Steel | 13,800 | 59,679 | ||||||
Komeri | 4,200 | 88,678 | ||||||
Komori | 4,000 | 22,748 | ||||||
KYB | 1,700 | 38,492 | ||||||
Lawson | 3,200 | 117,362 | ||||||
Lintec | 22,800 | 424,100 | ||||||
Mabuchi Motor | 21,300 | 570,979 | ||||||
Macnica Fuji Electronics Holdings | 7,400 | 154,578 | ||||||
Mimasu Semiconductor Industry | 8,000 | 144,010 | ||||||
Mirai ‡ | 493 | 192,237 | ||||||
Mirait Holdings | 2,500 | 35,110 | ||||||
Mitsubishi Logistics | 3,300 | 76,171 | ||||||
Mitsui Chemicals | 2,000 | 46,131 | ||||||
Mitsui-Soko Holdings | 6,100 | 113,809 | ||||||
Nachi-Fujikoshi | 2,400 | 69,565 | ||||||
Nihon Kohden | 4,900 | 119,681 | ||||||
Nippon Sheet Glass * | 33,800 | 102,501 | ||||||
Nippon Shokubai | 2,000 | 80,460 | ||||||
Nippon Steel Trading | 1,300 | 53,173 | ||||||
Nippon Suisan Kaisha | 18,700 | 82,585 | ||||||
Nippon Systemware | 1,100 | 19,648 | ||||||
Nishi-Nippon Financial Holdings | 13,400 | 79,757 | ||||||
Nishio Rent All | 1,100 | 23,755 | ||||||
Nisshinbo Holdings | 44,800 | 336,111 | ||||||
Ogaki Kyoritsu Bank | 2,600 | 38,028 | ||||||
Oita Bank | 1,700 | 24,199 | ||||||
Okamura | 12,100 | 111,355 | ||||||
Onoken | 2,900 | 33,830 | ||||||
OSG | 23,200 | 289,515 | ||||||
Oyo | 3,000 | 45,593 | ||||||
Pacific Metals | 4,000 | 111,675 | ||||||
Remixpoint * | 11,200 | 31,984 | ||||||
Restar Holdings | 1,200 | 18,556 | ||||||
Riken | 1,000 | 18,217 | ||||||
Riken Vitamin | 1,700 | 22,341 | ||||||
Rock Field | 3,800 | 41,539 | ||||||
Sakai Chemical Industry | 4,300 | 60,875 | ||||||
Sakata Seed | 15,700 | 528,699 | ||||||
Sanei Architecture Planning | 3,700 | 47,797 | ||||||
SCREEN Holdings | 600 | 49,656 | ||||||
Sega Sammy Holdings | 64,500 | 1,140,907 | ||||||
| COMMON STOCK — continued | ||||||||
| Shares | Value | |||||||
JAPAN — continued | ||||||||
Seiren | 14,400 | $ | 228,462 | |||||
Seven Bank | 310,100 | 578,043 | ||||||
Shidax * | 10,500 | 29,871 | ||||||
Shikoku Bank | 4,100 | 24,522 | ||||||
Shin Nippon Biomedical Laboratories | 6,900 | 72,374 | ||||||
SKY Perfect JSAT Holdings | 49,700 | 160,864 | ||||||
Star Asia Investment ‡ | 59 | 27,017 | ||||||
Star Mica Holdings | 3,100 | 36,854 | ||||||
Starts | 1,100 | 20,392 | ||||||
Stella Chemifa | 1,200 | 22,403 | ||||||
Sumitomo Seika Chemicals | 700 | 16,447 | ||||||
Taihei Dengyo Kaisha | 2,200 | 45,874 | ||||||
Takaoka Toko | 3,600 | 44,916 | ||||||
Takara Leben | 18,200 | 41,644 | ||||||
Takara Leben Real Estate Investment ‡ | 200 | 186,401 | ||||||
THK | 19,700 | 390,914 | ||||||
Toagosei | 6,500 | 53,361 | ||||||
Tokyotokeiba | 3,800 | 129,616 | ||||||
Tosei | 9,000 | 75,724 | ||||||
Toyo Seikan Group Holdings | 10,100 | 109,353 | ||||||
Trans Genic | 6,500 | 19,832 | ||||||
Transcosmos | 1,700 | 40,281 | ||||||
Uchida Yoko | 1,600 | 60,452 | ||||||
Unitika * | 11,800 | 25,487 | ||||||
Xebio Holdings | 7,300 | 51,455 | ||||||
|
| |||||||
| 16,594,992 | ||||||||
|
| |||||||
LUXEMBOURG — 1.4% |
| |||||||
L’Occitane International | 317,750 | 998,697 | ||||||
|
| |||||||
MALAYSIA — 0.4% |
| |||||||
Bumi Armada * | 1,148,400 | 112,372 | ||||||
Cahya Mata Sarawak | 119,500 | 29,254 | ||||||
Eco World Development Group | 157,500 | 34,603 | ||||||
Frencken Group | 36,100 | 36,630 | ||||||
HAP Seng Consolidated | 22,400 | 38,397 | ||||||
Lotte Chemical Titan Holding | 90,500 | 45,520 | ||||||
TIME dotCom | 26,500 | 27,123 | ||||||
|
| |||||||
| 323,899 | ||||||||
|
| |||||||
MALTA — 0.4% |
| |||||||
Kambi Group * | 3,403 | 54,368 | ||||||
Kindred Group SDR | 30,366 | 266,059 | ||||||
|
| |||||||
| 320,427 | ||||||||
|
| |||||||
The accompanying notes are an integral part of the financial statements.
71
CATHOLIC RESPONSIBLE INVESTMENTS INTERNATIONAL SMALL-CAP FUND
APRIL 30, 2022 (Unaudited)
| COMMON STOCK — continued | ||||||||
| Shares | Value | |||||||
MAURITIUS — 0.1% |
| |||||||
Capital | 71,007 | $ | 87,446 | |||||
|
| |||||||
MEXICO — 0.5% |
| |||||||
Alfa, Cl A | 246,800 | 166,158 | ||||||
Bolsa Mexicana de Valores | 36,800 | 73,659 | ||||||
Controladora Vuela Cia de Aviacion ADR * | 6,238 | 99,309 | ||||||
|
| |||||||
| 339,126 | ||||||||
| �� |
|
| ||||||
NETHERLANDS — 0.8% |
| |||||||
ASR Nederland | 3,818 | 172,586 | ||||||
Boskalis Westminster | 2,072 | 72,078 | ||||||
Eurocommercial Properties ‡ | 4,151 | 100,374 | ||||||
Heijmans | 1,731 | 23,788 | ||||||
Ordina | 24,641 | 112,807 | ||||||
Signify | 902 | 37,894 | ||||||
Van Lanschot Kempen | 2,198 | 56,923 | ||||||
|
| |||||||
| 576,450 | ||||||||
|
| |||||||
NIGERIA — 0.2% |
| |||||||
Airtel Africa | 77,498 | 139,516 | ||||||
|
| |||||||
NORWAY — 3.1% |
| |||||||
2020 Bulkers | 2,368 | 30,669 | ||||||
Belships | 54,188 | 115,810 | ||||||
BW Energy * | 14,333 | 42,016 | ||||||
DNO | 21,809 | 33,690 | ||||||
Hexagon Composites * | 99,700 | 399,024 | ||||||
Norway Royal Salmon * | 38,633 | 1,016,369 | ||||||
Norwegian Air Shuttle * | 37,132 | 52,308 | ||||||
Panoro Energy * | 58,911 | 200,462 | ||||||
PhotoCure * | 19,900 | 246,152 | ||||||
Rana Gruber, Cl A | 19,512 | 122,340 | ||||||
|
| |||||||
| 2,258,840 | ||||||||
|
| |||||||
PHILIPPINES — 0.2% |
| |||||||
DMCI Holdings | 959,700 | 152,881 | ||||||
|
| |||||||
POLAND — 0.0% |
| |||||||
Enea | 16,072 | 34,634 | ||||||
|
| |||||||
SINGAPORE — 0.2% |
| |||||||
Japfa | 92,600 | 40,285 | ||||||
Sasseur Real Estate Investment Trust ‡ | 123,800 | 74,719 | ||||||
Yangzijiang Financial Holding Pte * | 170,400 | 67,252 | ||||||
|
| |||||||
| 182,256 | ||||||||
|
| |||||||
| COMMON STOCK — continued | ||||||||
| Shares | Value | |||||||
SOUTH AFRICA — 0.5% |
| |||||||
Investec | 29,169 | $ | 176,599 | |||||
Murray & Roberts Holdings | – | — | ||||||
Northam Platinum Holdings * | 6,476 | 77,159 | ||||||
Omnia Holdings | 6,963 | 36,698 | ||||||
Royal Bafokeng Platinum | 8,986 | 89,652 | ||||||
|
| |||||||
| 380,108 | ||||||||
|
| |||||||
SOUTH KOREA — 2.5% |
| |||||||
AfreecaTV | 800 | 68,707 | ||||||
Asia Paper Manufacturing | 655 | 22,946 | ||||||
DB HiTek | 3,488 | 184,008 | ||||||
DB Insurance | 2,370 | 126,306 | ||||||
DGB Financial Group | 7,147 | 50,493 | ||||||
Global Standard Technology | 1,259 | 30,434 | ||||||
Hanjin Transportation | 900 | 23,447 | ||||||
Hanwha General Insurance * | 36,995 | 137,876 | ||||||
Humasis | 2,151 | 21,322 | ||||||
JB Financial Group | 17,963 | 127,447 | ||||||
Korea Gas | 7,488 | 243,352 | ||||||
Korea Real Estate Investment & Trust | 126,871 | 219,857 | ||||||
Korean Reinsurance | 3,153 | 24,135 | ||||||
Kyung Dong Navien | 1,391 | 55,974 | ||||||
LF | 5,835 | 89,742 | ||||||
Samchully | 830 | 74,674 | ||||||
Samsung Securities | 939 | 29,368 | ||||||
SaraminHR | 1,428 | 47,416 | ||||||
SD Biosensor | 1,730 | 62,428 | ||||||
Seegene | 952 | 30,481 | ||||||
Seohee Construction | 47,031 | 69,089 | ||||||
Wonik Materials | 1,500 | 43,824 | ||||||
Woongjin Thinkbig | 11,098 | 25,827 | ||||||
Xi S&D | 6,931 | 50,693 | ||||||
|
| |||||||
| 1,859,846 | ||||||||
|
| |||||||
SPAIN — 2.3% |
| |||||||
Fluidra | 13,850 | 375,746 | ||||||
Gestamp Automocion | 17,015 | 55,297 | ||||||
Laboratorios Farmaceuticos Rovi | 4,667 | 318,939 | ||||||
Melia Hotels International * | 109,127 | 905,661 | ||||||
Viscofan | 641 | 35,410 | ||||||
|
| |||||||
| 1,691,053 | ||||||||
|
| |||||||
SWEDEN — 4.3% |
| |||||||
AcadeMedia | 6,472 | 36,682 | ||||||
Betsson, Cl B | 31,641 | 195,066 | ||||||
BioGaia, Cl B | 7,845 | 494,343 | ||||||
Byggmax Group | 2,418 | 18,642 | ||||||
Dometic Group | 28,550 | 245,957 | ||||||
The accompanying notes are an integral part of the financial statements.
72
CATHOLIC RESPONSIBLE INVESTMENTS INTERNATIONAL SMALL-CAP FUND
APRIL 30, 2022 (Unaudited)
| COMMON STOCK — continued | ||||||||
| Shares | Value | |||||||
SWEDEN — continued |
| |||||||
Intrum | 4,778 | $ | 115,884 | |||||
Inwido | 2,655 | 36,901 | ||||||
Lindab International | 6,265 | 146,889 | ||||||
Loomis, Cl B | 36,544 | 916,529 | ||||||
NCC AB, Cl B | 10,762 | 133,311 | ||||||
New Wave Group, Cl B | 5,910 | 103,680 | ||||||
Peab, Cl B | 16,191 | 155,625 | ||||||
Samhallsbyggnadsbolaget i Norden | 29,892 | 94,363 | ||||||
Securitas, Cl B | 3,254 | 38,627 | ||||||
SSAB, Cl B | 39,188 | 231,896 | ||||||
Thule Group | 4,775 | 161,175 | ||||||
|
| |||||||
| 3,125,570 | ||||||||
|
| |||||||
SWITZERLAND — 3.1% |
| |||||||
Bellevue Group | 1,580 | 60,832 | ||||||
Bobst Group | 1,679 | 141,643 | ||||||
Bucher Industries | 1,157 | 419,279 | ||||||
Comet Holding | 682 | 147,714 | ||||||
IWG * | 218,038 | 653,298 | ||||||
Landis+Gyr Group | 8,058 | 450,892 | ||||||
Schweiter Technologies | 377 | 381,439 | ||||||
|
| |||||||
| 2,255,097 | ||||||||
|
| |||||||
TAIWAN — 3.1% |
| |||||||
Advanced International Multitech | 33,000 | 94,215 | ||||||
Anpec Electronics | 13,000 | 81,469 | ||||||
Asia Vital Components | 62,000 | 215,250 | ||||||
Chicony Power Technology | 34,000 | 80,092 | ||||||
China General Plastics | 49,000 | 54,763 | ||||||
Compeq Manufacturing | 43,000 | 65,778 | ||||||
DA CIN Construction | 57,000 | 60,379 | ||||||
Farglory Land Development | 24,000 | 54,421 | ||||||
Fusheng Precision * | 7,000 | 51,729 | ||||||
Gigabyte Technology | 8,000 | 28,621 | ||||||
Global Unichip | 5,000 | 68,367 | ||||||
Grape King Bio | 6,000 | 29,144 | ||||||
Hung Ching Development & Construction | 64,000 | 61,402 | ||||||
Kindom Development | 69,000 | 80,783 | ||||||
Macronix International | 191,000 | 242,970 | ||||||
Micro-Star International | 40,000 | 160,779 | ||||||
Pegavision | 6,000 | 81,933 | ||||||
Scientech | 31,000 | 81,016 | ||||||
Sitronix Technology | 34,000 | 290,784 | ||||||
TA Chen Stainless Pipe | 46,000 | 68,241 | ||||||
Taiwan Navigation | 47,000 | 59,599 | ||||||
Tong Hsing Electronic Industries | 7,000 | 54,076 | ||||||
| COMMON STOCK — continued | ||||||||
| Shares | Value | |||||||
TAIWAN — continued |
| |||||||
Winbond Electronics | 259,000 | $ | 233,342 | |||||
|
| |||||||
| 2,299,153 | ||||||||
|
| |||||||
THAILAND — 0.8% |
| |||||||
AP Thailand NVDR | 830,000 | 285,057 | ||||||
Com7, Cl F | 15,700 | 18,976 | ||||||
Forth | 154,400 | 186,741 | ||||||
SC Asset NVDR | 601,300 | 64,329 | ||||||
|
| |||||||
| 555,103 | ||||||||
|
| |||||||
TURKEY — 0.8% |
| |||||||
Aksa Enerji Uretim, Cl B * | 103,068 | 115,242 | ||||||
Haci Omer Sabanci Holding | 242,242 | 324,518 | ||||||
Logo Yazilim Sanayi Ve Ticaret | 13,836 | 41,924 | ||||||
Sok Marketler Ticaret | 101,370 | 88,690 | ||||||
|
| |||||||
| 570,374 | ||||||||
|
| |||||||
UNITED KINGDOM — 12.1% |
| |||||||
888 Holdings | 8,645 | 20,695 | ||||||
Balfour Beatty | 17,141 | 50,834 | ||||||
Biffa | 284,721 | 1,231,277 | ||||||
Big Yellow Group ‡ | 8,170 | 148,350 | ||||||
Centrica * | 93,962 | 92,996 | ||||||
Clipper Logistics | 86,612 | 941,015 | ||||||
Coats Group | 467,046 | 423,670 | ||||||
Computacenter | 7,045 | 231,626 | ||||||
Craneware | 10,100 | 217,074 | ||||||
CVS Group | 21,395 | 485,939 | ||||||
Dunelm Group | 3,275 | 40,555 | ||||||
Firstgroup * | 67,304 | 95,120 | ||||||
Future | 5,563 | 153,232 | ||||||
Global Ship Lease, Cl A | 2,843 | 63,228 | ||||||
Greggs | 4,366 | 126,630 | ||||||
Halfords Group | 17,483 | 48,419 | ||||||
Harbour Energy | 7,474 | 46,235 | ||||||
Hochschild Mining | 91,716 | 134,134 | ||||||
Howden Joinery Group | 23,379 | 219,402 | ||||||
IMI | 12,282 | 207,092 | ||||||
Investec | 35,125 | 207,853 | ||||||
Kainos Group | 2,537 | 38,635 | ||||||
Man Group | 81,323 | 240,632 | ||||||
Mitie Group | 50,121 | 33,998 | ||||||
Morgan Advanced Materials | 17,420 | 62,713 | ||||||
Ninety One | 6,011 | 19,999 | ||||||
OSB Group | 94,469 | 647,315 | ||||||
Pagegroup | 4,536 | 27,284 | ||||||
Pan African Resources | 106,590 | 29,608 | ||||||
Pets at Home Group | 9,568 | 36,427 | ||||||
Renewi * | 5,525 | 46,809 | ||||||
The accompanying notes are an integral part of the financial statements.
73
CATHOLIC RESPONSIBLE INVESTMENTS INTERNATIONAL SMALL-CAP FUND
APRIL 30, 2022 (Unaudited)
| COMMON STOCK — continued | ||||||||
| Shares | Value | |||||||
UNITED KINGDOM — continued |
| |||||||
Rightmove | 8,254 | $ | 64,009 | |||||
Royal Mail | 39,352 | 166,895 | ||||||
Safestore Holdings ‡ | 46,596 | 711,169 | ||||||
Savills | 74,804 | 1,022,457 | ||||||
Spirent Communications | 6,508 | 19,326 | ||||||
Stagecoach Group * | 43,178 | 56,939 | ||||||
SThree | 18,899 | 88,055 | ||||||
Supermarket Income Reit ‡ | 79,196 | 124,252 | ||||||
TBC Bank Group | 3,030 | 48,122 | ||||||
Team17 Group * | 11,134 | 61,516 | ||||||
Vertu Motors | 41,516 | 27,806 | ||||||
Virgin Money UK | 40,060 | 88,734 | ||||||
Watches of Switzerland Group * | 2,845 | 37,285 | ||||||
|
| |||||||
| 8,885,361 | ||||||||
|
| |||||||
UNITED STATES — 2.4% |
| |||||||
BRP | 2,794 | 227,512 | ||||||
Cognyte Software * | 24,500 | 166,110 | ||||||
Ormat Technologies | 14,550 | 1,136,096 | ||||||
Samsonite International * | 114,300 | 251,110 | ||||||
|
| |||||||
| 1,780,828 | ||||||||
|
| |||||||
Total Common Stock | 70,317,623 | |||||||
|
| |||||||
| PREFERRED STOCK — 0.9% | ||||||||
| Shares | Value | |||||||
GERMANY — 0.4% |
| |||||||
Einhell Germany | 215 | $ | 44,007 | |||||
Schaeffler | 34,361 | 183,966 | ||||||
STO & KGaA | 412 | 86,435 | ||||||
|
| |||||||
| 314,408 | ||||||||
|
| |||||||
BRAZIL — 0.5% |
| |||||||
Cia Energetica de Minas Gerais | 25,500 | 77,496 | ||||||
Cia Paranaense de Energia | 89,600 | 134,431 | ||||||
Unipar Carbocloro | 6,930 | 135,669 | ||||||
|
| |||||||
| 347,596 | ||||||||
|
| |||||||
Total Preferred Stock | 662,004 | |||||||
|
| |||||||
Total Investments in Securities— 96.6% | $ | 70,979,627 | ||||||
|
| |||||||
|
| |||||||
Percentages based on Net Assets of $73,511,533.
| * | Non-income producing security. |
| ‡ | Real Estate Investment Trust. |
ADR — American Depositary Receipt |
Cl — Class |
NVDR — Non-Voting Depositary Receipt |
SDR — Swedish Depositary Receipt |
The accompanying notes are an integral part of the financial statements.
74
CATHOLIC RESPONSIBLE INVESTMENTS INTERNATIONAL SMALL-CAP FUND
APRIL 30, 2022 (Unaudited)
The following is a list of the inputs used as of, April 30, 2022 in valuing the Fund’s investments carried at value:
Investments in Securities | Level 1 | Level 2 | Level 3 | Total | ||||||||||||
Common Stock | ||||||||||||||||
Australia | $ | – | $ | 4,891,060 | $ | – | $ | 4,891,060 | ||||||||
Austria | – | 1,212,818 | – | 1,212,818 | ||||||||||||
Belgium | – | 518,933 | – | 518,933 | ||||||||||||
Brazil | 686,483 | – | – | 686,483 | ||||||||||||
Canada | 2,679,157 | – | – | 2,679,157 | ||||||||||||
China | 22,413 | 1,916,342 | – | 1,938,755 | ||||||||||||
Denmark | – | 887,404 | – | 887,404 | ||||||||||||
Egypt | – | 68,390 | – | 68,390 | ||||||||||||
Finland | – | 402,333 | – | 402,333 | ||||||||||||
France | – | 3,912,922 | – | 3,912,922 | ||||||||||||
Germany | – | 1,998,338 | – | 1,998,338 | ||||||||||||
Ghana | – | 90,518 | – | 90,518 | ||||||||||||
Greece | – | 35,904 | – | 35,904 | ||||||||||||
Hong Kong | – | 407,208 | – | 407,208 | ||||||||||||
Hungary | – | 38,981 | – | 38,981 | ||||||||||||
India | 1,159,941 | – | – | 1,159,941 | ||||||||||||
Indonesia | – | 425,386 | – | 425,386 | ||||||||||||
Iraq | – | 54,483 | – | 54,483 | ||||||||||||
Ireland | – | 37,183 | – | 37,183 | ||||||||||||
Israel | 216,159 | 752,884 | – | 969,043 | ||||||||||||
Italy | 143,248 | 2,347,478 | – | 2,490,726 | ||||||||||||
Japan | – | 16,594,992 | – | 16,594,992 | ||||||||||||
Luxembourg | – | 998,697 | – | 998,697 | ||||||||||||
Malaysia | – | 323,899 | – | 323,899 | ||||||||||||
Malta | – | 320,427 | – | 320,427 | ||||||||||||
Mauritius | – | 87,446 | – | 87,446 | ||||||||||||
Mexico | 339,126 | – | – | 339,126 | ||||||||||||
Netherlands | – | 576,450 | – | 576,450 | ||||||||||||
Nigeria | – | 139,516 | – | 139,516 | ||||||||||||
Norway | – | 2,258,840 | – | 2,258,840 | ||||||||||||
Philippines | – | 152,881 | – | 152,881 | ||||||||||||
Poland | – | 34,634 | – | 34,634 | ||||||||||||
Singapore | 67,252 | 115,004 | – | 182,256 | ||||||||||||
South Africa | – | 380,108 | – | 380,108 | ||||||||||||
South Korea | 21,322 | 1,838,524 | – | 1,859,846 | ||||||||||||
Spain | – | 1,691,053 | – | 1,691,053 | ||||||||||||
Sweden | – | 3,125,570 | – | 3,125,570 | ||||||||||||
Switzerland | – | 2,255,097 | – | 2,255,097 | ||||||||||||
Taiwan | – | 2,299,153 | – | 2,299,153 | ||||||||||||
Thailand | – | 555,103 | – | 555,103 | ||||||||||||
Turkey | – | 570,374 | – | 570,374 | ||||||||||||
United Kingdom | 63,228 | 8,822,133 | – | 8,885,361 | ||||||||||||
United States | 393,622 | 1,387,206 | – | 1,780,828 | ||||||||||||
Total Common Stock | 5,791,951 | 64,525,672 | – | 70,317,623 | ||||||||||||
Preferred Stock | 347,596 | 314,408 | – | 662,004 | ||||||||||||
Total Investments in Securities | $ | 6,139,547 | $ | 64,840,080 | $ | – | $ | 70,979,627 | ||||||||
Amounts designated as “–” are $0 or have been round to $0.
For more information on valuation inputs, see Note 2 — Significant Accounting Policies in the Notes to Financial Statements.
The accompanying notes are an integral part of the financial statements.
75
CATHOLIC RESPONSIBLE INVESTMENTS MAGNUS 45/55 FUND
APRIL 30, 2022 (Unaudited)
| SECTOR WEIGHTINGS † | ||||
| 100.0% Exchange Traded Funds | ||
† Percentages are based on total investments.
SCHEDULE OF INVESTMENTS
EXCHANGE TRADED FUNDS — 99.9% | ||||||||
| Shares | Value | |||||||
Catholic Responsible Investments Bond Fund† | 2,665,698 | $ | 23,911,308 | |||||
Catholic Responsible Investments Equity Index Fund† | 2,101,284 | 18,932,565 | ||||||
Catholic Responsible Investments International Equity Fund† | 815,606 | 6,924,492 | ||||||
Catholic Responsible Investments International Small-Cap Fund† | 202,382 | 1,855,844 | ||||||
Catholic Responsible Investments Multi-Style US Equity Fund† | 644,144 | 5,591,168 | ||||||
Catholic Responsible Investments Opportunistic Bond Fund† | 1,320,018 | 12,526,975 | ||||||
Catholic Responsible Investments Short Duration Bond Fund† | 1,318,267 | 12,721,272 | ||||||
Catholic Responsible Investments Small-Cap Fund† | 410,741 | 3,717,204 | ||||||
|
| |||||||
| 86,180,828 | ||||||||
|
| |||||||
Total Exchange Traded Funds | 86,180,828 | |||||||
|
| |||||||
Total Investments in Securities— 99.9% | $ | 86,180,828 | ||||||
|
| |||||||
|
| |||||||
Percentages are based on Nest Assets of $86,250,133.
† Investment in Affiliated Security.
As of April 30, 2022, all of the Fund’s investments in securities were considered Level 1, in accordance with the authoritative guidance of fair value measurements and disclosure under U.S. generally accepted accounting principles.
For more information on valuation inputs, see Note 2 — Significant Accounting Policies in the Notes to Financial Statements.
The accompanying notes are an integral part of the financial statements.
76
CATHOLIC RESPONSIBLE INVESTMENTS MAGNUS 45/55 FUND
APRIL 30, 2022 (Unaudited)
The following is a summary of the transactions with affiliates for the period ended April 30, 2022:
| Security Description | Value 12/3/2021 | Purchases at Cost/Conversion | Proceeds from Sales | Realized Loss | Change in Unrealized Appreciation/ (Depreciation) | Value 4/30/2022 | Shares | Income | Capital Gains | |||||||||||||||||||||||||||
Catholic Responsible Investments Bond Fund | $ | — | $ | 25,990,881 | $ | (307,944 | ) | $ | (16,128 | ) | $ | (1,755,501 | ) | $ | 23,911,308 | 2,665,698 | $ | 198,738 | $ | — | ||||||||||||||||
Catholic Responsible Investments Equity Index Fund | — | 15,203,464 | (249,155 | ) | (16,200 | ) | 3,994,456 | 18,932,565 | 2,101,284 | 77,742 | — | |||||||||||||||||||||||||
Catholic Responsible Investments International Equity Fund | — | 6,389,581 | (100,782 | ) | (13,166 | ) | 648,859 | 6,924,492 | 815,606 | 14,439 | — | |||||||||||||||||||||||||
Catholic Responsible Investments International Small-Cap Fund | — | 1,654,550 | (25,196 | ) | (2,157 | ) | 228,647 | 1,855,844 | 202,382 | 6,551 | — | |||||||||||||||||||||||||
Catholic Responsible Investments Multi-Style US Equity Fund | — | 5,874,982 | (78,386 | ) | (7,984 | ) | (197,444 | ) | 5,591,168 | 644,144 | 4,396 | — | ||||||||||||||||||||||||
Catholic Responsible Investments Opportunistic Bond Fund | — | 12,664,442 | (153,972 | ) | (4,926 | ) | 21,431 | 12,526,975 | 1,320,018 | 81,139 | — | |||||||||||||||||||||||||
Catholic Responsible Investments Short Duration Bond Fund | — | 13,378,333 | (153,972 | ) | (4,480 | ) | (498,609 | ) | 12,721,272 | 1,318,267 | 64,823 | — | ||||||||||||||||||||||||
Catholic Responsible Investments Small-Cap Fund | — | 2,784,920 | (50,391 | ) | (5,441 | ) | 988,116 | 3,717,204 | 410,741 | 14,586 | — | |||||||||||||||||||||||||
Totals | $ | — | $ | 83,941,153 | $ | (1,119,798 | ) | $ | (70,482 | ) | $ | 3,429,955 | $ | 86,180,828 | $ | 462,414 | $ | — | ||||||||||||||||||
Amounts designated as “–” are $0.
The accompanying notes are an integral part of the financial statements.
77
CATHOLIC RESPONSIBLE INVESTMENTS 60/40 ALPHA PLUS FUND
APRIL 30, 2022 (Unaudited)
| SECTOR WEIGHTINGS† | ||||
| 100.0% Exchange Traded Funds | ||
| † | Percentages are based on total investments. |
SCHEDULE OF INVESTMENTS
EXCHANGE TRADED FUNDS — 100.0% | ||||||||
| Shares | Value | |||||||
Catholic Responsible Investments Bond Fund† | 23,640,167 | $ 212,052,294 | ||||||
Catholic Responsible Investments Equity Index Fund† | 19,304,726 | 173,935,585 | ||||||
Catholic Responsible Investments International Equity Fund† | 13,764,945 | 116,864,384 | ||||||
Catholic Responsible Investments International Small-Cap Fund† | 3,499,785 | 32,093,026 | ||||||
Catholic Responsible Investments Multi-Style US Equity Fund† | 29,792,419 | 258,598,200 | ||||||
Catholic Responsible Investments Opportunistic Bond Fund† | 11,612,871 | 110,206,148 | ||||||
Catholic Responsible Investments Short Duration Bond Fund† | 11,497,534 | 110,951,202 | ||||||
Catholic Responsible Investments Small-Cap Fund† | 6,913,227 | 62,564,708 | ||||||
|
| |||||||
| 1,077,265,547 | ||||||||
|
| |||||||
Total Exchange Traded Funds
(Cost $1,010,903,731) | 1,077,265,547 | |||||||
|
| |||||||
Total Investments in Securities— 100.0% (Cost $1,010,903,731) |
| $1,077,265,547 | ||||||
|
| |||||||
|
| |||||||
Percentages are based on Nest Assets of $1,077,388,167.
† Investment in Affiliated Security.
As of April 30, 2022, all of the Fund’s investments in securities were considered Level 1, in accordance with the authoritative guidance of fair value measurements and disclosure under U.S. generally accepted accounting principles.
For more information on valuation inputs, see Note 2 — Significant Accounting Policies in the Notes to Financial Statements.
The accompanying notes are an integral part of the financial statements.
78
CATHOLIC RESPONSIBLE INVESTMENTS 60/40 APLHA PLUS FUND
APRIL 30, 2022 (Unaudited)
The following is a summary of the transactions with affiliates for the period ended April 30, 2022:
Security Description | Value 12/3/2021 | Purchases at Cost | Proceeds from Sales | Realized Loss | Change in (Depreciation) | Value 4/30/2022 | Shares | Income | Capital Gains | |||||||||||||||||||||||||||
Catholic Responsible Investments Bond Fund | $ — | $ | 224,115,703 | $ | (2,080,960 | ) | $ | (129,934 | ) | $ | (9,852,515 | ) | $ | 212,052,294 | 23,640,167 | $ | 1,766,083 | $ | — | |||||||||||||||||
Catholic Responsible Investments Equity Index Fund | — | 128,378,780 | (1,560,720 | ) | (79,023 | ) | 47,196,548 | 173,935,585 | 19,304,726 | 719,861 | — | |||||||||||||||||||||||||
Catholic Responsible Investments International Equity Fund | — | 98,616,468 | (1,248,576 | ) | (160,535 | ) | 19,657,027 | 116,864,384 | 13,764,945 | 245,491 | — | |||||||||||||||||||||||||
Catholic Responsible Investments International Small-Cap Fund | — | 29,461,916 | (312,144 | ) | (26,376 | ) | 2,969,630 | 32,093,026 | 3,499,785 | 114,461 | — | |||||||||||||||||||||||||
Catholic Responsible Investments Multi-Style US Equity Fund | — | 268,987,986 | (2,497,152 | ) | (220,308 | ) | (7,672,326 | ) | 258,598,200 | 29,792,419 | 205,919 | — | ||||||||||||||||||||||||
Catholic Responsible Investments Opportunistic Bond Fund | — | 108,969,220 | (1,040,480 | ) | (35,992 | ) | 2,313,400 | 110,206,148 | 11,612,871 | 715,550 | — | |||||||||||||||||||||||||
Catholic Responsible Investments Short Duration Bond Fund | — | 115,867,801 | (1,040,481 | ) | (32,885 | ) | (3,843,233 | ) | 110,951,202 | 11,497,534 | 566,704 | — | ||||||||||||||||||||||||
Catholic Responsible Investments Small-Cap Fund | — | 47,651,241 | (624,289 | ) | (55,529 | ) | 15,593,285 | 62,564,708 | 6,913,227 | 248,788 | — | |||||||||||||||||||||||||
Totals | $ | — | $ | 1,022,049,115 | $ | (10,404,802 | ) | $ | (740,582 | ) | $ | 66,361,816 | $ | 1,077,265,547 | $ | 4,582,857 | $ | — | ||||||||||||||||||
Amounts designated as “–” are $0.
The accompanying notes are an integral part of the financial statements.
79
CATHOLIC RESPONSIBLE INVESTMENTS 60/40 Beta Plus Fund
APRIL 30, 2022 (Unaudited)
| SECTOR WEIGHTINGS† |

† Percentages are based on total investments.
| SCHEDULE OF INVESTMENTS |
| |||||||
| EXCHANGE TRADED FUNDS — 100.0% |
| |||||||
| Shares | Value | |||||||
Catholic Responsible Investments Bond Fund† | 7,383,998 | $ | 66,234,466 | |||||
Catholic Responsible Investments Equity Index Fund† | 14,006,317 | 126,196,918 | ||||||
Catholic Responsible Investments International Equity Fund† | 4,139,510 | 35,144,444 | ||||||
Catholic Responsible Investments International Small-Cap Fund† | 1,026,190 | 9,410,166 | ||||||
Catholic Responsible Investments Opportunistic Bond Fund† | 3,654,505 | 34,681,252 | ||||||
Catholic Responsible Investments Short Duration Bond Fund† | 3,649,313 | 35,215,867 | ||||||
Catholic Responsible Investments Small-Cap Fund† | 2,082,663 | 18,848,100 | ||||||
|
| |||||||
| 325,731,213 | ||||||||
|
| |||||||
Total Exchange Traded Funds | ||||||||
(Cost $291,072,587) | 325,731,213 | |||||||
|
| |||||||
Total Investments in Securities— 100.0% |
| |||||||
(Cost $291,072,587) | $ | 325,731,213 | ||||||
|
| |||||||
Percentages are based on Nest Assets of $325,741,433.
† Investment in Affiliated Security.
As of April 30, 2022, all of the Fund’s investments in securities were considered Level 1, in accordance with the authoritative guidance of fair value measurements and disclosure under U.S. generally accepted accounting principles.
For more information on valuation inputs, see Note 2 — Significant Accounting Policies in the Notes to Financial Statements.
The accompanying notes are an integral part of the financial statements.
80
CATHOLIC RESPONSIBLE INVESTMENTS 60/40 Beta Plus Fund
APRIL 30, 2022 (Unaudited)
The following is a summary of the transactions with affiliates for the period ended April 30, 2022:
Security Description | Value 12/3/2021 | Purchases at Cost | Proceeds from Sales | Realized Loss | Change in Unrealized Appreciation/ (Depreciation) | Value 4/30/2022 | Shares | Income | Capital Gains | |||||||||
Catholic Responsible Investments Bond Fund | $ — | $ 72,000,634 | $(1,643,292) | $ (82,848) | $ (4,040,028) | $ 66,234,466 | 7,383,998 | $ 545,962 | $ — | |||||||||
Catholic Responsible Investments Equity Index Fund | — | 99,609,670 | (3,204,420) | (157,105) | 29,948,773 | 126,196,918 | 14,006,317 | 514,269 | — | |||||||||
Catholic Responsible Investments International Equity Fund | — | 31,831,604 | (985,975) | (172,318) | 4,471,133 | 35,144,444 | 4,139,510 | 72,556 | — | |||||||||
Catholic Responsible Investments International Small-Cap Fund | — | 8,755,779 | (246,494) | (29,991) | 930,872 | 9,410,166 | 1,026,190 | 33,017 | — | |||||||||
Catholic Responsible Investments Opportunistic Bond Fund | — | 35,370,875 | (821,646) | (25,079) | 157,102 | 34,681,252 | 3,654,505 | 222,953 | — | |||||||||
Catholic Responsible Investments Short Duration Bond Fund | — | 37,344,572 | (821,646) | (22,144) | (1,284,915) | 35,215,867 | 3,649,313 | 178,137 | — | |||||||||
Catholic Responsible Investments Small-Cap Fund | — | 14,908,568 | (492,988) | (43,169) | 4,475,689 | 18,848,100 | 2,082,663 | 73,719 | — | |||||||||
| ||||||||||||||||||
| Totals | $ — | $299,821,702 | $ (8,216,461) | $(532,654) | $ 34,658,626 | $325,731,213 | $1,640,613 | $ — | ||||||||||
|
| |||||||||||||||||
Amounts designated as “–” are $0.
The accompanying notes are an integral part of the financial statements.
81
CATHOLIC RESPONSIBLE INVESTMENTS MAGNUS 75/25 FUND
APRIL 30, 2022 (Unaudited)
| SECTOR WEIGHTINGS† |

† Percentages are based on total investments.
| SCHEDULE OF INVESTMENTS |
| |||||||
| EXCHANGE TRADED FUNDS — 100.0% |
| |||||||
| Shares | Value | |||||||
Catholic Responsible Investments Bond Fund† | 3,307,006 | $ | 29,663,840 | |||||
Catholic Responsible Investments Equity Index Fund† | 8,843,428 | 79,679,287 | ||||||
Catholic Responsible Investments International Equity Fund† | 3,721,658 | 31,596,877 | ||||||
Catholic Responsible Investments International Small-Cap Fund† | 919,995 | 8,436,350 | ||||||
Catholic Responsible Investments Multi-Style US Equity Fund† | 3,742,615 | 32,485,902 | ||||||
Catholic Responsible Investments Opportunistic Bond Fund† | 1,631,945 | 15,487,154 | ||||||
Catholic Responsible Investments Short Duration Bond Fund† | 1,627,994 | 15,710,143 | ||||||
Catholic Responsible Investments Small-Cap Fund† | 1,893,702 | 17,138,004 | ||||||
|
| |||||||
| 230,197,557 | ||||||||
|
| |||||||
Total Exchange Traded Funds | ||||||||
(Cost $205,577,389) | 230,197,557 | |||||||
|
| |||||||
Total Investments in Securities— 100.0% |
| |||||||
(Cost $205,577,389) | $ | 230,197,557 | ||||||
|
| |||||||
Percentages are based on Nest Assets of $230,273,570.
† Investment in Affiliated Security.
As of April 30, 2022, all of the Fund’s investments in securities were considered Level 1, in accordance with the authoritative guidance of fair value measurements and disclosure under U.S. generally accepted accounting principles.
For more information on valuation inputs, see Note 2 — Significant Accounting Policies in the Notes to Financial Statements.
The accompanying notes are an integral part of the financial statements.
82
CATHOLIC RESPONSIBLE INVESTMENTS MAGNUS 75/25 FUND
APRIL 30, 2022 (Unaudited)
The following is a summary of the transactions with affiliates for the period ended April 30, 2022:
| Security Description | Value 12/3/2021 | Purchases at Cost | Proceeds from Sales | Realized Gain/ (Loss) | Change in (Depreciation) | Value 4/30/2022 | Shares | Income | Capital Gains | |||||||||
Catholic Responsible Investments Bond Fund | $ — | $ 38,576,011 | $ (6,607,983) | $ (102,840) | $ (2,201,348) | $ 29,663,840 | 3,307,006 | $250,244 | $ — | |||||||||
Catholic Responsible Investments Equity Index Fund | — | 77,429,146 | (17,841,554) | 1,615,145 | 18,476,550 | 79,679,287 | 8,843,428 | 335,594 | — | |||||||||
Catholic Responsible Investments International Equity Fund | — | 35,510,051 | (7,929,580) | 7,077 | 4,009,329 | 31,596,877 | 3,721,658 | 67,357 | — | |||||||||
Catholic Responsible Investments International Small-Cap Fund | — | 9,377,448 | (1,982,395) | (14,505) | 1,055,802 | 8,436,350 | 919,995 | 30,866 | — | |||||||||
Catholic Responsible Investments Multi-Style US Equity Fund | — | 40,748,337 | (7,929,580) | 450,953 | (783,808) | 32,485,902 | 3,742,615 | 26,759 | — | |||||||||
Catholic Responsible Investments Opportunistic Bond Fund | — | 18,811,978 | (3,303,992) | (37,111) | 16,279 | 15,487,154 | 1,631,945 | 101,955 | — | |||||||||
Catholic Responsible Investments Short Duration Bond Fund | — | 19,687,049 | (3,303,992) | (48,991) | (623,923) | 15,710,143 | 1,627,994 | 81,381 | — | |||||||||
Catholic Responsible Investments Small-Cap Fund | — | 16,316,732 | (3,964,789) | 114,774 | 4,671,287 | 17,138,004 | 1,893,702 | 70,463 | — | |||||||||
| ||||||||||||||||||
| Totals | $ — | $ 256,456,752 | $ (52,863,865) | $ 1,984,502 | $ 24,620,168 | $230,197,557 | $964,619 | $ — | ||||||||||
|
| |||||||||||||||||
Amounts designated as “–” are $0.
The accompanying notes are an integral part of the financial statements.
83
CATHOLIC RESPONSIBLE INVESTMENTS
APRIL 30, 2022 (Unaudited)
| STATEMENTS OF ASSETS AND LIABILITIES |
| Catholic Responsible Investments Ultra Short Bond Fund | Catholic Responsible Investments Short Duration Bond Fund | Catholic Responsible Investments Opportunistic Bond Fund | Catholic Responsible Investments Bond Fund | |||||||||||||
Assets: | ||||||||||||||||
Investments, at Value (Cost $43,195,817, $530,656,033, $506,991,487 and $1,742,237,874) | $ | 42,876,946 | $ | 512,331,907 | $ | 483,900,767 | $ | 1,627,219,920 | ||||||||
Repurchase Agreements, at Value (Cost $17,300,000, $–, $– and $–) | 17,300,000 | – | – | – | ||||||||||||
Receivable for Capital Shares Sold | 378,690 | – | – | 1,233 | ||||||||||||
Dividend and Interest Receivable | 43,346 | 2,821,701 | 2,180,143 | 7,863,258 | ||||||||||||
Cash and Cash Equivalents | 16,645 | 8,014,233 | 17,143,034 | 102,101,956 | ||||||||||||
Receivable for Investment Securities Sold | – | – | 660,138 | 3,393,098 | ||||||||||||
Cash Pledged as Collateral for Futures Contracts | – | – | – | 572,069 | ||||||||||||
Deferred Offering Costs | 35,362 | 35,362 | 45,171 | 45,274 | ||||||||||||
Other Assets | 145,830 | – | 50 | – | ||||||||||||
Prepaid Expenses | 1,822 | 1,997 | 3,026 | 4,735 | ||||||||||||
|
| |||||||||||||||
Total Assets | 60,798,641 | 523,205,200 | 503,932,329 | 1,741,201,543 | ||||||||||||
|
| |||||||||||||||
Liabilities: | ||||||||||||||||
Payable for Investment Securities Purchased | 890,097 | 4,053,110 | 13,033,223 | 91,061,891 | ||||||||||||
Audit Fees Payable | 6,543 | 6,543 | 7,771 | 8,179 | ||||||||||||
Payable Due to Adviser | 3,493 | 122,213 | 133,976 | 414,761 | ||||||||||||
Chief Compliance Officer Fees Payable | 1,284 | 1,284 | 2,568 | 3,852 | ||||||||||||
Transfer Agent Fee Payable | 1,181 | 2,876 | 3,878 | 6,157 | ||||||||||||
Payable Due to Administrator | 981 | 8,305 | 7,974 | 27,038 | ||||||||||||
Payable for Capital Shares Redeemed | – | 4,458 | 4,458 | 8,917 | ||||||||||||
Shareholder Servicing — Investor Shares | – | – | 16,025 | – | ||||||||||||
Payable for Variation Margin | – | – | – | 69,875 | ||||||||||||
Other Payables | – | – | 16,391 | 147,573 | ||||||||||||
Other Accrued Expenses | 14,236 | 29,498 | 34,374 | 119,917 | ||||||||||||
|
| |||||||||||||||
Total Liabilities | 917,815 | 4,228,287 | 13,260,638 | 91,868,160 | ||||||||||||
|
| |||||||||||||||
Net Assets | $ | 59,880,826 | $ | 518,976,913 | $ | 490,671,691 | $ | 1,649,333,383 | ||||||||
|
| |||||||||||||||
Net Assets Consist of: | ||||||||||||||||
Paid-in Capital | $ | 60,198,625 | $ | 537,568,723 | $ | 516,915,015 | $ | 1,838,369,116 | ||||||||
Total Distributable Loss | (317,799 | ) | (18,591,810 | ) | (26,243,324 | ) | (189,035,733 | ) | ||||||||
|
| |||||||||||||||
Net Assets | $ | 59,880,826 | $ | 518,976,913 | $ | 490,671,691 | $ | 1,649,333,383 | ||||||||
|
| |||||||||||||||
Institutional Shares: | ||||||||||||||||
Net Assets | $ | 59,880,826 | $ | 518,976,913 | $ | 464,942,087 | $ | 1,594,909,668 | ||||||||
Outstanding Shares of Beneficial Interest (Unlimited Authorization - No Par Value) | 5,990,666 | 53,791,295 | 48,987,722 | 177,811,013 | ||||||||||||
Net Asset Value, Offering and Redemption Price Per Share | 10 .00 | 9 .65 | 9 .49 | 8 .97 | ||||||||||||
|
| |||||||||||||||
Investor Shares: | ||||||||||||||||
Net Assets | N/A | N/A | $ | 25,729,604 | $ | 54,423,715 | ||||||||||
Outstanding Shares of Beneficial Interest (Unlimited Authorization - No Par Value) | N/A | N/A | 2,711,116 | 6,068,272 | ||||||||||||
Net Asset Value, Offering and Redemption Price Per Share | N/A | N/A | 9 .49 | 8 .97 | ||||||||||||
|
| |||||||||||||||
Amounts designated as “—” are $0
The accompanying notes are an integral part of the financial statements.
84
CATHOLIC RESPONSIBLE INVESTMENTS
APRIL 30, 2022 (Unaudited)
| STATEMENTS OF ASSETS AND LIABILITIES |
| Catholic Responsible Investments Equity Index Fund | Catholic Responsible Investments Multi-Style US Equity Fund | Catholic Responsible Investments International Equity Fund | Catholic Responsible Investments Small-Cap Fund | Catholic Responsible Investments International Small-Cap Fund | ||||||||||||||||
Assets: | ||||||||||||||||||||
Investments, at Value (Cost $2,030,923,567, $683,487,796, $1,035,238,108, $399,175,724 and $73,267,193) | $ | 3,037,244,740 | $ | 660,383,349 | $ | 1,102,892,288 | $ | 450,749,136 | $ | 70,979,627 | ||||||||||
Foreign Currency, at Value (Cost $—, $—, $2,619,173, $— and $166,198) | – | – | 2,609,067 | – | 166,001 | |||||||||||||||
Cash and Cash Equivalents | 3,790,954 | 17,277,845 | 32,563,113 | 6,448,221 | 2,013,684 | |||||||||||||||
Dividend and Interest Receivable | 1,955,175 | 247,320 | 2,447,308 | 153,905 | 332,843 | |||||||||||||||
Cash Pledged as Collateral for Futures Contracts | 398,546 | – | – | 546,620 | – | |||||||||||||||
Reclaim Receivable | 24,656 | 9,787 | 617,716 | – | 23,353 | |||||||||||||||
Receivable for Capital Shares Sold | 3,384 | – | 900 | 483 | – | |||||||||||||||
Receivable for Investment Securities Sold | – | 736,335 | 9,866,340 | – | 106,857 | |||||||||||||||
Unrealized Appreciation on Spot Currency Contracts | – | – | 3,913 | – | – | |||||||||||||||
Deferred Offering Costs | 35,362 | 45,171 | 45,274 | 35,362 | 35,362 | |||||||||||||||
Prepaid Expenses | 39,363 | 49,530 | 50,061 | 37,763 | 38,013 | |||||||||||||||
|
| |||||||||||||||||||
Total Assets | 3,043,492,180 | 678,749,337 | 1,151,095,980 | 457,971,490 | 73,695,740 | |||||||||||||||
|
| |||||||||||||||||||
Liabilities: | ||||||||||||||||||||
Payable for Capital Shares Redeemed | 594,012 | 6,881 | 5,505 | 2,753 | 1,376 | |||||||||||||||
Payable for Variation Margin | 177,270 | – | – | 184,920 | – | |||||||||||||||
Payable Due to Adviser | 147,506 | 358,476 | 670,529 | 79,258 | 50,356 | |||||||||||||||
Payable Due to Administrator | 52,387 | 11,686 | 19,277 | 7,751 | 1,223 | |||||||||||||||
Transfer Agent Fee Payable | 7,491 | 4,860 | 5,580 | 2,365 | 600 | |||||||||||||||
Audit Fees Payable | 5,724 | 6,541 | 7,771 | 5,724 | 7,356 | |||||||||||||||
Chief Compliance Officer Fees Payable | 1,284 | – | – | 1,284 | 2,568 | |||||||||||||||
Payable for Investment Securities Purchased | – | 245,300 | 7,970,901 | – | 42,180 | |||||||||||||||
Shareholder Servicing — Investor Shares | – | 33,056 | 37,574 | – | – | |||||||||||||||
Unrealized Depreciation on Spot Currency Contracts | – | – | – | – | 647 | |||||||||||||||
Other Payables | – | – | 15,961 | – | – | |||||||||||||||
Other Accrued Expenses | 161,070 | 99,108 | 597,451 | 114,017 | 77,901 | |||||||||||||||
|
| |||||||||||||||||||
Total Liabilities | 1,146,744 | 765,908 | 9,330,549 | 398,072 | 184,207 | |||||||||||||||
|
| |||||||||||||||||||
Net Assets | $ | 3,042,345,436 | $ | 677,983,429 | $ | 1,141,765,431 | $ | 457,573,418 | $ | 73,511,533 | ||||||||||
|
| |||||||||||||||||||
Net Assets Consist of: | ||||||||||||||||||||
Paid-in Capital | $ | 3,376,230,989 | $ | 781,220,039 | $ | 1,341,913,115 | $ | 395,373,163 | $ | 80,157,960 | ||||||||||
Total Distributable Earnings (Loss) | (333,885,553 | ) | (103,236,610 | ) | (200,147,684 | ) | 62,200,255 | (6,646,427 | ) | |||||||||||
|
| |||||||||||||||||||
Net Assets | $ | 3,042,345,436 | $ | 677,983,429 | $ | 1,141,765,431 | $ | 457,573,418 | $ | 73,511,533 | ||||||||||
|
| |||||||||||||||||||
Institutional Shares: | ||||||||||||||||||||
Net Assets | $ | 3,042,345,436 | $ | 631,145,179 | $ | 1,086,560,846 | $ | 457,573,418 | $ | 73,511,533 | ||||||||||
Outstanding Shares of Beneficial Interest (Unlimited Authorization - No Par Value) | 337,797,205 | 72,725,540 | 128,017,303 | 50,547,439 | 8,017,763 | |||||||||||||||
Net Asset Value, Offering and Redemption Price Per Share | 9 .01 | 8 .68 | 8 .49 | 9 .05 | 9 .17 | |||||||||||||||
|
| |||||||||||||||||||
Investor Shares: | ||||||||||||||||||||
Net Assets | N/A | $ | 46,838,250 | $ | 55,204,585 | N/A | N/A | |||||||||||||
Outstanding Shares of Beneficial Interest (Unlimited Authorization - No Par Value) | N/A | 5,397,392 | 6,504,109 | N/A | N/A | |||||||||||||||
Net Asset Value, Offering and Redemption Price Per Share | N/A | 8 .68 | 8 .49 | N/A | N/A | |||||||||||||||
|
| |||||||||||||||||||
Amounts designated as “—” are $0
The accompanying notes are an integral part of the financial statements.
85
CATHOLIC RESPONSIBLE INVESTMENTS
APRIL 30, 2022 (Unaudited)
| STATEMENTS OF ASSETS AND LIABILITIES | |||||||||||||||||||||||||
Catholic 45/55 Fund | Catholic Magnus 60/40 Alpha Plus Fund | Catholic 60/40 Beta Plus Fund | Catholic 75/25 Fund | ||||||||||||||||||||||
|
| ||||||||||||||||||||||||
Assets: | |||||||||||||||||||||||||
Investments, at Value (Cost $82,750,873, $1,010,903,731, $291,072,587 and $205,577,389) | $ | 86,180,828 | $ | 1,077,265,547 | $ | 325,731,213 | $ | 230,197,557 | |||||||||||||||||
Cash and Cash Equivalents | 52,672 | 185,314 | 84,136 | 62,519 | |||||||||||||||||||||
Due from Adviser | 13,803 | – | 11,116 | 14,809 | |||||||||||||||||||||
Dividend and Interest Receivable | 5 | 17 | 8 | 6 | |||||||||||||||||||||
Deferred Offering Costs | 45,384 | 45,274 | 45,274 | 45,274 | |||||||||||||||||||||
Other Assets | 2,618 | 189,682 | 5,288 | 5,036 | |||||||||||||||||||||
Prepaid Expenses | 2,869 | 3,276 | 2,965 | 2,931 | |||||||||||||||||||||
|
| ||||||||||||||||||||||||
Total Assets | 86,298,179 | 1,077,689,110 | 325,880,000 | 230,328,132 | |||||||||||||||||||||
|
| ||||||||||||||||||||||||
Liabilities: | |||||||||||||||||||||||||
Shareholder Servicing — Investor Shares | 26,946 | 269,590 | 90,444 | 26,873 | |||||||||||||||||||||
Audit Fees Payable | 5,724 | 5,724 | 5,724 | 5,724 | |||||||||||||||||||||
Transfer Agent Fee Payable | 1,605 | 1,372 | 2,210 | 1,582 | |||||||||||||||||||||
Chief Compliance Officer Fees Payable | 1,284 | 1,284 | 1,284 | 1,284 | |||||||||||||||||||||
Other Accrued Expenses | 12,487 | 22,973 | 38,905 | 19,099 | |||||||||||||||||||||
|
| ||||||||||||||||||||||||
Total Liabilities | 48,046 | 300,943 | 138,567 | 54,562 | |||||||||||||||||||||
|
| ||||||||||||||||||||||||
Net Assets | $ | 86,250,133 | $ | 1,077,388,167 | $ | 325,741,433 | $ | 230,273,570 | |||||||||||||||||
|
| ||||||||||||||||||||||||
Net Assets Consist of: | |||||||||||||||||||||||||
Paid-in Capital | $ | 82,531,487 | $ | 1,008,359,150 | $ | 290,370,711 | $ | 202,938,633 | |||||||||||||||||
Total Distributable Earnings | 3,718,646 | 69,029,017 | 35,370,722 | 27,334,937 | |||||||||||||||||||||
|
| ||||||||||||||||||||||||
Net Assets | $ | 86,250,133 | $ | 1,077,388,167 | $ | 325,741,433 | $ | 230,273,570 | |||||||||||||||||
|
| ||||||||||||||||||||||||
Institutional Shares: | |||||||||||||||||||||||||
Net Assets | $ | 45,447,785 | $ | 738,478,763 | $ | 188,205,941 | $ | 197,670,857 | |||||||||||||||||
Outstanding Shares of Beneficial Interest (Unlimited Authorization—No Par Value) | 4,978,098 | 82,009,266 | 20,690,412 | 21,990,327 | |||||||||||||||||||||
Net Asset Value, Offering and Redemption Price Per Share | 9 .13 | 9 .00 | 9 .10 | 8 .99 | |||||||||||||||||||||
|
| ||||||||||||||||||||||||
Investor Shares: | |||||||||||||||||||||||||
Net Assets | $ | 40,802,348 | $ | 338,909,404 | $ | 137,535,492 | $ | 32,602,713 | |||||||||||||||||
Outstanding Shares of Beneficial Interest (Unlimited Authorization—No Par Value) | 4,471,494 | 37,657,812 | 15,128,315 | 3,629,429 | |||||||||||||||||||||
Net Asset Value, Offering and Redemption Price Per Share | 9 .12 | 9 .00 | 9 .09 | 8 .98 | |||||||||||||||||||||
|
| ||||||||||||||||||||||||
Amounts designated as “—” are $0
The accompanying notes are an integral part of the financial statements.
86
CATHOLIC RESPONSIBLE INVESTMENTS
FOR THE PERIOD ENDED
APRIL 30, 2022 (Unaudited)
* Commenced operations on December 6, 2021.
The accompanying notes are an integral part of the financial statements.
87
CATHOLIC RESPONSIBLE INVESTMENTS
FOR THE PERIOD ENDED
APRIL 30, 2022 (Unaudited)
| STATEMENTS OF OPERATIONS | ||||||||||||||||||||||||||||||
Catholic Responsible Equity Index Fund* | Catholic Multi-Style US | Catholic Responsible Investments International Equity Fund* | Catholic Responsible Investments Small-Cap Fund* | Catholic Responsible Investments International Small-Cap Fund* | ||||||||||||||||||||||||||
|
| |||||||||||||||||||||||||||||
Investment Income: | ||||||||||||||||||||||||||||||
Dividend Income | $ | 16,225,211 | $ | 2,578,448 | $ | 12,186,356 | $ | 3,938,896 | $ | 1,041,658 | ||||||||||||||||||||
Interest Income | 32,120 | 8,794 | 3,706 | – | – | |||||||||||||||||||||||||
Less: Foreign Taxes Withheld | (4,856 | ) | (4,491 | ) | (1,224,407 | ) | (3,028 | ) | (132,667) | |||||||||||||||||||||
|
| |||||||||||||||||||||||||||||
Total Investment Income | 16,252,475 | 2,582,751 | 10,965,655 | 3,935,868 | 908,991 | |||||||||||||||||||||||||
|
| |||||||||||||||||||||||||||||
Expenses: | ||||||||||||||||||||||||||||||
Investment Advisory Fees | 792,049 | 1,833,240 | 3,726,471 | 402,036 | 293,774 | |||||||||||||||||||||||||
Administration Fees | 261,175 | 60,464 | 99,637 | 39,770 | 6,052 | |||||||||||||||||||||||||
Trustees’ Fees | 4,032 | �� | 12,096 | 12,096 | 4,032 | 8,065 | ||||||||||||||||||||||||
Chief Compliance Officer Fees | 1,284 | 3,852 | 3,852 | 1,284 | 2,568 | |||||||||||||||||||||||||
Shareholder Servicing Fees — Investor Shares | – | 33,056 | 37,577 | – | – | |||||||||||||||||||||||||
Registration Fees | 93,099 | 26,589 | 42,291 | 16,456 | 3,373 | |||||||||||||||||||||||||
Transfer Agent Fees | 18,519 | 16,198 | 18,525 | 9,483 | 6,448 | |||||||||||||||||||||||||
Offering Costs | 15,050 | 21,695 | 21,593 | 15,050 | 15,050 | |||||||||||||||||||||||||
Custodian Fees | 10,870 | 9,159 | 495,975 | 13,458 | 25,881 | |||||||||||||||||||||||||
Printing Fees | 7,505 | 1,802 | 2,987 | 1,199 | 180 | |||||||||||||||||||||||||
Pricing Fees | 7,063 | 1,754 | 4,837 | 2,652 | 4,297 | |||||||||||||||||||||||||
Audit Fees | 5,724 | 6,541 | 7,771 | 5,724 | 7,356 | |||||||||||||||||||||||||
Legal Fees | 4,793 | 14,379 | 14,378 | 4,793 | 9,586 | |||||||||||||||||||||||||
Other Expenses | 44,840 | 8,390 | 10,283 | 48,363 | 7,896 | |||||||||||||||||||||||||
|
| |||||||||||||||||||||||||||||
Total Expenses | 1,266,003 | 2,049,215 | 4,498,273 | 564,300 | 390,526 | |||||||||||||||||||||||||
|
| |||||||||||||||||||||||||||||
Less: | ||||||||||||||||||||||||||||||
Waiver of Investment Advisory Fees | (82,375 | ) | – | (268,654 | ) | – | (38,586) | |||||||||||||||||||||||
|
| |||||||||||||||||||||||||||||
Net Expenses | 1,183,628 | 2,049,215 | 4,229,619 | 564,300 | 351,940 | |||||||||||||||||||||||||
|
| |||||||||||||||||||||||||||||
Net Investment Income | 15,068,847 | 533,536 | 6,736,036 | 3,371,568 | 557,051 | |||||||||||||||||||||||||
|
| |||||||||||||||||||||||||||||
Net Realized Gain (Loss) on Investments | (1,342,462,500 | ) | (80,148,881 | ) | (271,611,995 | ) | 9,962,374 | (4,505,514) | ||||||||||||||||||||||
Net Realized Gain (Loss) on Futures Contracts | 126,262 | – | – | (367,900 | ) | – | ||||||||||||||||||||||||
Net Realized Loss on Foreign Currency Transactions | – | – | (506,036 | ) | (74 | ) | (137,364) | |||||||||||||||||||||||
Net Change in Unrealized Appreciation (Depreciation) on Investments | 1,006,321,173 | (23,104,447 | ) | 67,654,180 | 51,573,412 | (2,287,566) | ||||||||||||||||||||||||
Net Change in Unrealized Depreciation on Futures Contracts | (365,550 | ) | – | – | (509,535 | ) | – | |||||||||||||||||||||||
Net Change in Unrealized Depreciation on Foreign Currency Transactions and Translation of other Assets and Liabilities Denominated in Foreign Currencies | – | – | (77,668 | ) | – | (15,218) | ||||||||||||||||||||||||
|
| |||||||||||||||||||||||||||||
Net Realized and Unrealized Gain (Loss) on Investments and Futures Contracts | (336,380,615 | ) | (103,253,328 | ) | (204,541,519 | ) | 60,658,277 | (6,945,662) | ||||||||||||||||||||||
|
| |||||||||||||||||||||||||||||
Net Increase (Decrease) in Net Assets Resulting from Operations | $ | (321,311,768 | ) | $ | (102,719,792 | ) | $ | (197,805,483 | ) | $ | 64,029,84 | 5 | $ | (6,388,611 | ) | |||||||||||||||
|
| |||||||||||||||||||||||||||||
* Commenced operations on December 6, 2021.
The accompanying notes are an integral part of the financial statements.
88
CATHOLIC RESPONSIBLE INVESTMENTS
FOR THE PERIOD ENDED
APRIL 30, 2022 (Unaudited)
| STATEMENTS OF OPERATIONS | |||||||||||||||||||||||||
Catholic 45/55 Fund* | Catholic 60/40 Alpha | Catholic 60/40 Beta Plus Fund* | Catholic 75/25 Fund* | ||||||||||||||||||||||
|
| ||||||||||||||||||||||||
Investment Income: | |||||||||||||||||||||||||
Dividend Income | $ | 462,414 | $ | 4,582,857 | $ | 1,640,613 | $ | 964,619 | |||||||||||||||||
Interest Income | 7 | 28 | 16 | 10 | |||||||||||||||||||||
|
| ||||||||||||||||||||||||
Total Investment Income | 462,421 | 4,582,885 | 1,640,629 | 964,629 | |||||||||||||||||||||
|
| ||||||||||||||||||||||||
Expenses: | |||||||||||||||||||||||||
Shareholder Servicing Fees — Investor Shares | 26,946 | 269,590 | 90,444 | 26,873 | |||||||||||||||||||||
Trustees’ Fees | 4,032 | 4,032 | 4,032 | 4,032 | |||||||||||||||||||||
Chief Compliance Officer Fees | 1,284 | 1,284 | 1,284 | 1,284 | |||||||||||||||||||||
Offering Costs | 21,593 | 21,593 | 21,593 | 21,593 | |||||||||||||||||||||
Transfer Agent Fees | 12,002 | 13,306 | 12,967 | 12,196 | |||||||||||||||||||||
Audit Fees | 5,724 | 5,724 | 5,724 | 5,724 | |||||||||||||||||||||
Legal Fees | 4,793 | 4,793 | 4,793 | 4,793 | |||||||||||||||||||||
Registration Fees | 3,444 | 22,410 | 27,310 | 10,862 | |||||||||||||||||||||
Pricing Fees | 411 | 1,843 | 730 | 467 | |||||||||||||||||||||
Custodian Fees | 378 | 796 | 2,548 | 687 | |||||||||||||||||||||
Printing Fees | 211 | 1,675 | 1,818 | 649 | |||||||||||||||||||||
Other Expenses | 7,260 | 8,503 | 8,637 | 7,627 | |||||||||||||||||||||
|
| ||||||||||||||||||||||||
Total Expenses | 88,078 | 355,549 | 181,880 | 96,787 | |||||||||||||||||||||
|
| ||||||||||||||||||||||||
Less: | |||||||||||||||||||||||||
Waiver of Investment Advisory Fees | (61,131 | ) | (99,272 | ) | (91,436 | ) | (69,914) | ||||||||||||||||||
|
| ||||||||||||||||||||||||
Net Expenses | 26,947 | 256,277 | 90,444 | 26,873 | |||||||||||||||||||||
|
| ||||||||||||||||||||||||
Net Investment Income | 435,474 | 4,326,608 | 1,550,185 | 937,756 | |||||||||||||||||||||
|
| ||||||||||||||||||||||||
Net Realized Gain (Loss) on Investments | (70,482 | ) | (740,582 | ) | (532,654 | ) | 1,984,502 | ||||||||||||||||||
Net Change in Unrealized Appreciation on Investments | 3,429,955 | 66,361,816 | 34,658,626 | 24,620,168 | |||||||||||||||||||||
|
| ||||||||||||||||||||||||
Net Realized and Unrealized Gain on Investments | 3,359,473 | 65,621,234 | 34,125,972 | 26,604,670 | |||||||||||||||||||||
|
| ||||||||||||||||||||||||
Net Increase in Net Assets Resulting from Operations | $ | 3,794,947 | $ | 69,947,842 | $ | 35,676,157 | $ | 27,542,426 | |||||||||||||||||
|
| ||||||||||||||||||||||||
* Commenced operations on December 6, 2021.
The accompanying notes are an integral part of the financial statements.
89
CATHOLIC RESPONSIBLE INVESTMENTS
FOR THE PERIOD ENDED
APRIL 30, 2022 (Unaudited)
* Commenced operations on December 6, 2021.
Amounts designated as “—” are $0.
The accompanying notes are an integral part of the financial statements.
90
CATHOLIC RESPONSIBLE INVESTMENTS
FOR THE PERIOD ENDED
APRIL 30, 2022 (Unaudited)
| STATEMENTS OF CHANGES IN NET ASSETS |
| Catholic Responsible Investments Equity Index Fund | Catholic Investments | Catholic Responsible Investments International Equity Fund | Catholic Responsible Investments Small-Cap Fund | Catholic Responsible Investments International Small-Cap Fund | ||||||||||||||||||||
| Period Ended April 30, 2022* | Period Ended April 30, 2022* | Period Ended April 30, 2022* | Period Ended April 30, 2022* | Period Ended April 30, 2022* | ||||||||||||||||||||
Operations: | ||||||||||||||||||||||||
Net Investment Income | $ | 15,068,847 | $ | 533,536 | $ | 6,736,036 | $ | 3,371,568 | $ | 557,051 | ||||||||||||||
Net Realized Gain (Loss) on Investments, Foreign Currency Translations and Futures Contracts | (1,342,336,238 | ) | (80,148,881 | ) | (272,118,031 | ) | 9,594,400 | (4,642,878 | ) | |||||||||||||||
Net Change in Unrealized Appreciation (Depreciation) on Investments, Foreign Currency Translations and Futures Contracts | 1,005,955,623 | (23,104,447 | ) | 67,576,512 | 51,063,877 | (2,302,784 | ) | |||||||||||||||||
|
|
|
|
|
|
|
|
|
| |||||||||||||||
Net Increase (Decrease) in Net Assets Resulting from Operations | (321,311,768 | ) | (102,719,792 | ) | (197,805,483 | ) | 64,029,845 | (6,388,611 | ) | |||||||||||||||
|
|
|
|
|
|
|
|
|
| |||||||||||||||
Distributions: | ||||||||||||||||||||||||
Institutional Shares | (12,573,785 | ) | (504,779 | ) | (2,255,794 | ) | (1,829,590 | ) | (257,816 | ) | ||||||||||||||
Investor Shares | — | (12,039 | ) | (86,407 | ) | — | — | |||||||||||||||||
|
|
|
|
|
|
|
|
|
| |||||||||||||||
Total Distributions | (12,573,785 | ) | (516,818 | ) | (2,342,201 | ) | (1,829,590 | ) | (257,816 | ) | ||||||||||||||
|
|
|
|
|
|
|
|
|
| |||||||||||||||
Capital Share Transactions: | ||||||||||||||||||||||||
Institutional: | ||||||||||||||||||||||||
Issued | 3,473,490,306 | 745,232,555 | 1,314,385,107 | 414,303,463 | 83,203,675 | |||||||||||||||||||
Reinvestment of Dividends and Distributions | 11,995,218 | 491,203 | 2,174,256 | 1,767,290 | 245,874 | |||||||||||||||||||
Redemption Fees - Note 2 | — | — | — | (2,753 | ) | — | ||||||||||||||||||
Redeemed | (109,254,535 | ) | (18,561,221 | ) | (39,529,611 | ) | (20,694,837 | ) | (3,291,589 | ) | ||||||||||||||
|
|
|
|
|
|
|
|
|
| |||||||||||||||
Net Institutional Share Transactions | 3,376,230,989 | 727,162,537 | 1,277,029,752 | 395,373,163 | 80,157,960 | |||||||||||||||||||
|
|
|
|
|
|
|
|
|
| |||||||||||||||
Investor: | ||||||||||||||||||||||||
Issued | — | 61,922,381 | 69,637,231 | — | — | |||||||||||||||||||
Reinvestment of Dividends and Distributions | — | 10,986 | 84,179 | — | — | |||||||||||||||||||
Redeemed | — | (7,875,865 | ) | (4,838,047 | ) | — | — | |||||||||||||||||
|
|
|
|
|
|
|
|
|
| |||||||||||||||
Net Investor Share Transactions | — | 54,057,502 | 64,883,363 | — | — | |||||||||||||||||||
|
|
|
|
|
|
|
|
|
| |||||||||||||||
Net Increase in Net Assets from Share Transactions | 3,376,230,989 | 781,220,039 | 1,341,913,115 | 395,373,163 | 80,157,960 | |||||||||||||||||||
|
|
|
|
|
|
|
|
|
| |||||||||||||||
Total Increase in Net Assets | 3,042,345,436 | 677,983,429 | 1,141,765,431 | 457,573,418 | 73,511,533 | |||||||||||||||||||
|
|
|
|
|
|
|
|
|
| |||||||||||||||
Net Assets: | ||||||||||||||||||||||||
Beginning of Year/Period | — | — | — | — | — | |||||||||||||||||||
|
|
|
|
|
|
|
|
|
| |||||||||||||||
End of Year/Period | $ | 3,042,345,436 | $ | 677,983,429 | $ | 1,141,765,431 | $ | 457,573,418 | $ | 73,511,533 | ||||||||||||||
|
|
|
|
|
|
|
|
|
| |||||||||||||||
Shares Transactions: | ||||||||||||||||||||||||
Institutional: | ||||||||||||||||||||||||
Issued | 347,662,765 | 74,537,134 | 131,766,673 | 52,471,724 | 8,317,895 | |||||||||||||||||||
Reinvestment of Dividends and Distributions | 1,179,966 | 48,867 | 227,869 | 174,311 | 24,527 | |||||||||||||||||||
Redeemed | (11,045,526 | ) | (1,860,461 | ) | (3,977,239 | ) | (2,098,596 | ) | (324,659 | ) | ||||||||||||||
|
|
|
|
|
|
|
|
|
| |||||||||||||||
Net Institutional Shares Capital Share Transactions | 337,797,205 | 72,725,540 | 128,017,303 | 50,547,439 | 8,017,763 | |||||||||||||||||||
|
|
|
|
|
|
|
|
|
| |||||||||||||||
Investor: | ||||||||||||||||||||||||
Issued | — | 6,193,439 | 6,977,267 | — | — | |||||||||||||||||||
Reinvestment of Dividends and Distributions | — | 1,070 | 8,835 | — | — | |||||||||||||||||||
Redeemed | — | (797,117 | ) | (481,993 | ) | — | — | |||||||||||||||||
|
|
|
|
|
|
|
|
|
| |||||||||||||||
Net Investor Shares Capital Share Transactions | — | 5,397,392 | 6,504,109 | — | — | |||||||||||||||||||
|
|
|
|
|
|
|
|
|
| |||||||||||||||
Net Increase in Shares Outstanding from Share Transactions | 337,797,205 | 78,122,932 | 134,521,412 | 50,547,439 | 8,017,763 | |||||||||||||||||||
|
|
|
|
|
|
|
|
|
| |||||||||||||||
* Commenced operations on December 6, 2021.
Amounts designated as “—” are $0.
The accompanying notes are an integral part of the financial statements.
91
CATHOLIC RESPONSIBLE INVESTMENTS
FOR THE PERIOD ENDED
APRIL 30, 2022 (Unaudited)
| STATEMENTS OF CHANGES IN NET ASSETS |
| Catholic Responsible Investments Magnus 45/55 Fund | Catholic Responsible Investments Magnus 60/40 Alpha Plus Fund | Catholic Responsible Investments Magnus 60/40 Beta Plus Fund | Catholic Responsible Investments Magnus 75/25 Fund | |||||||||||||||||
| Period Ended April 30, 2022* | Period Ended April 30, 2022* | Period Ended April 30, 2022* | Period Ended April 30, 2022* |
| ||||||||||||||||
Operations: | ||||||||||||||||||||
Net Investment Income | $ | 435,474 | $ | 4,326,608 | $ | 1,550,185 | $ | 937,756 | ||||||||||||
Net Realized Gain (Loss) on Investments | (70,482 | ) | (740,582 | ) | (532,654 | ) | 1,984,502 | |||||||||||||
Net Change in Unrealized Appreciation on Investments | 3,429,955 | 66,361,816 | 34,658,626 | 24,620,168 | ||||||||||||||||
|
|
|
|
|
|
|
| |||||||||||||
Net Increase in Net Assets Resulting from Operations | 3,794,947 | 69,947,842 | 35,676,157 | 27,542,426 | ||||||||||||||||
|
|
|
|
|
|
|
| |||||||||||||
Distributions: | ||||||||||||||||||||
Institutional Shares | (41,794 | ) | (568,966 | ) | (170,102 | ) | (176,258 | ) | ||||||||||||
Investor Shares | (34,507 | ) | (349,859 | ) | (135,333 | ) | (31,231 | ) | ||||||||||||
|
|
|
|
|
|
|
| |||||||||||||
Total Distributions | (76,301 | ) | (918,825 | ) | (305,435 | ) | (207,489 | ) | ||||||||||||
|
|
|
|
|
|
|
| |||||||||||||
Capital Share Transactions: | ||||||||||||||||||||
Institutional: | ||||||||||||||||||||
Issued | 44,298,630 | 708,080,545 | 173,349,079 | 226,786,845 | ||||||||||||||||
Reinvestment of Dividends and Distributions | 41,794 | 568,966 | 170,102 | 176,258 | ||||||||||||||||
Redeemed | (827,687 | ) | (4,860,060 | ) | (2,044,630 | ) | (52,721,141 | ) | ||||||||||||
|
|
|
|
|
|
|
| |||||||||||||
Net Institutional Share Transactions | 43,512,737 | 703,789,451 | 171,474,551 | 174,241,962 | ||||||||||||||||
|
|
|
|
|
|
|
| |||||||||||||
Investor: | ||||||||||||||||||||
Issued | 42,181,111 | 425,943,989 | 144,462,210 | 41,257,745 | ||||||||||||||||
Reinvestment of Dividends and Distributions | 31,130 | 348,987 | 133,181 | 31,231 | ||||||||||||||||
Redeemed | (3,193,491 | ) | (121,723,277 | ) | (25,699,231 | ) | (12,592,305 | ) | ||||||||||||
|
|
|
|
|
|
|
| |||||||||||||
Net Investor Share Transactions | 39,018,750 | 304,569,699 | 118,896,160 | 28,696,671 | ||||||||||||||||
|
|
|
|
|
|
|
| |||||||||||||
Net Increase in Net Assets from Share Transactions | 82,531,487 | 1,008,359,150 | 290,370,711 | 202,938,633 | ||||||||||||||||
|
|
|
|
|
|
|
| |||||||||||||
Total Increase in Net Assets | 86,250,133 | 1,077,388,167 | 325,741,433 | 230,273,570 | ||||||||||||||||
|
|
|
|
|
|
|
| |||||||||||||
Net Assets: | ||||||||||||||||||||
Beginning of Year/Period | — | — | — | — | ||||||||||||||||
|
|
|
|
|
|
|
| |||||||||||||
End of Year/Period | $ | 86,250,133 | $ | 1,077,388,167 | $ | 325,741,433 | $ | 230,273,570 | ||||||||||||
|
|
|
|
|
|
|
| |||||||||||||
Shares Transactions: | ||||||||||||||||||||
Institutional: | ||||||||||||||||||||
Issued | 5,059,627 | 82,454,640 | 20,881,920 | 27,151,881 | ||||||||||||||||
Reinvestment of Dividends and Distributions | 4,106 | 55,455 | 16,547 | 17,030 | ||||||||||||||||
Redeemed | (85,635 | ) | (500,829 | ) | (208,055 | ) | (5,178,584 | ) | ||||||||||||
|
|
|
|
|
|
|
| |||||||||||||
Net Institutional Shares Capital Share Transactions | 4,978,098 | 82,009,266 | 20,690,412 | 21,990,327 | ||||||||||||||||
|
|
|
|
|
|
|
| |||||||||||||
Investor: | ||||||||||||||||||||
Issued | 4,799,993 | 50,302,351 | 17,698,330 | 4,944,742 | ||||||||||||||||
Reinvestment of Dividends and Distributions | 3,058 | 34,015 | 12,956 | 3,018 | ||||||||||||||||
Redeemed | (331,557 | ) | (12,678,554 | ) | (2,582,971 | ) | (1,318,331 | ) | ||||||||||||
|
|
|
|
|
|
|
| |||||||||||||
Net Investor Shares Capital Share Transactions | 4,471,494 | 37,657,812 | 15,128,315 | 3,629,429 | ||||||||||||||||
|
|
|
|
|
|
|
| |||||||||||||
Net Increase in Shares Outstanding from Share Transactions | 9,449,592 | 119,667,078 | 35,818,727 | 25,619,756 | ||||||||||||||||
|
|
|
|
|
|
|
| |||||||||||||
* Commenced operations on December 6, 2021.
Amounts designated as “—” are $0.
The accompanying notes are an integral part of the financial statements.
92
CATHOLIC RESPONSIBLE INVESTMENTS
(Unaudited)
| FINANCIAL HIGHLIGHTS |
Selected Per Share Data & Ratios
For a Share Outstanding
Throughout the Period
| Net Asset Value, Beginning of Period | Net Investment | Net and Unrealized Loss on Investments | Total from Operations | Distributions from Net Investment Income | Total Distributions | Net Asset Value, End of Period | Total Return | Net Assets End of Period (000) | Ratio of Expenses to Average Net Assets (including waivers and reimbursements)** | Ratio of Expenses to Average Net Assets (excluding waivers and reimbursements)** | Ratio of Net Investment Income (Loss) to Average Net Assets | Portfolio Turnover† | ||||||||||||||||||
Catholic Responsible Investments Ultra Short Bond Fund | ||||||||||||||||||||||||||||||
Institutional Shares | ||||||||||||||||||||||||||||||
2022(1) | $10.00 | $ –(a) | $ –(a) | $ –(a) | $ – | $ – | $10.00 | –% | $ 59,881 | 0.35% | 0.51% | (0.08)% | 16% | |||||||||||||||||
Catholic Responsible Investments Short Duration Bond Fund | ||||||||||||||||||||||||||||||
Institutional Shares | ||||||||||||||||||||||||||||||
2022(1) | $10.00 | $ 0.05 | $ (0.35) | $ (0.30) | $ (0.05) | $ (0.05) | $ 9.65 | (3.00)% | $518,977 | 0.35% | 0.36% | 1.18% | 23% | |||||||||||||||||
Catholic Responsible Investments Opportunistic Bond Fund | ||||||||||||||||||||||||||||||
Institutional Shares | ||||||||||||||||||||||||||||||
2022(1) | $10.00 | $ 0.06 | $ (0.51) | $ (0.45) | $ (0.06) | $ (0.06) | $ 9.49 | (4.50)% | $ 464,942 | 0.41% | 0.43% | 1.56% | 14% | |||||||||||||||||
Investor Shares | ||||||||||||||||||||||||||||||
2022(1) | $10.00 | $ 0.05 | $ (0.50) | $ (0.45) | $ (0.06) | $ (0.06) | $ 9.49 | (4.55)% | $ 25,730 | 0.56% | 0.58% | 1.41% | 14% | |||||||||||||||||
Catholic Responsible Investments Bond Fund | ||||||||||||||||||||||||||||||
Institutional Shares | ||||||||||||||||||||||||||||||
2022(1) | $10.00 | $ 0.08 | $ (1.03) | $ (0.95) | $ (0.08) | $ (0.08) | $ 8.97 | (9.61)% | $1,594,910 | 0.35% | 0.35% | 1.99% | 33% | |||||||||||||||||
Investor Shares | ||||||||||||||||||||||||||||||
2022(1) | $10.00 | $ 0 .07 | $ (1.03) | $ (0.96) | $ (0.07) | $ (0.07) | $ 8.97 | (9.66)% | $ 54,424 | 0.50% | 0.50% | 1.84% | 33% | |||||||||||||||||
Catholic Responsible Investments Equity Index Fund | ||||||||||||||||||||||||||||||
Institutional Shares | ||||||||||||||||||||||||||||||
2022(1) | $10.00 | $ 0.05 | $ (1.00) | $ (0.95) | $ (0.04) | $ (0.04) | $ 9.01 | (9.57)% | $3,042,345 | 0.09% | 0.10% | 1.14% | 8% | |||||||||||||||||
Catholic Responsible Investments Multi-Style US Equity Fund | ||||||||||||||||||||||||||||||
Institutional Shares | ||||||||||||||||||||||||||||||
2022(1) | $10.00 | $ 0.01 | $ (1.32) | $ (1.31) | $ (0.01) | $ (0.01) | $ 8.68 | (13.14)% | $ 631,145 | 0.66% | 0.66% | 0.19% | 17% | |||||||||||||||||
Investor Shares | ||||||||||||||||||||||||||||||
2022(1) | $10.00 | $ –(a) | $ (1.32) | $ (1.32) | $ – | $ – | $ 8.68 | (13.18)% | $ 46,838 | 0.81% | 0.81% | 0.03% | 17% | |||||||||||||||||
Catholic Responsible Investments International Equity Fund | ||||||||||||||||||||||||||||||
Institutional Shares | ||||||||||||||||||||||||||||||
2022(1) | $10.00 | $ 0.05 | $ (1.54) | $ (1.49) | $ (0.02) | $ (0.02) | $ 8.49 | (14.94)% | $1,086,561 | 0.84% | 0.89% | 1.36% | 23% | |||||||||||||||||
Investor Shares | ||||||||||||||||||||||||||||||
2022(1) | $10.00 | $ 0.04 | $ (1.54) | $ (1.50) | $ (0.01) | $ (0.01) | $ 8.49 | (14.98)% | $ 55,205 | 0.99% | 1.04% | 1.17% | 23% | |||||||||||||||||
| * | Per unit data calculated using average units method. |
| † | Portfolio turnover is for the period indicated and has not been annualized. |
| (1) | Commenced operations on December 6, 2021. All ratios for the period have been annualized. |
| (a) | Amount represents less than $0.005 per share. |
| ** | Annualized. |
The accompanying notes are an integral part of the financial statements.
93
CATHOLIC RESPONSIBLE INVESTMENTS
(Unaudited)
| FINANCIAL HIGHLIGHTS |
Selected Per Share Data & Ratios
For a Share Outstanding
Throughout the Period
| Net Asset Value, Beginning of Period | Net Investment | Net and Unrealized Loss on Investments | Total from Operations | Distributions from Net Investment Income | Total Distributions | Net Asset Value, End of Period | Total Return | Net Assets End of Period (000) | Ratio of Expenses to Average Net Assets (including waivers and reimbursements)** | Ratio of Expenses to Average Net Assets (excluding waivers and reimbursements)** | Ratio of Net Investment Income (Loss) to Average Net Assets | Portfolio Turnover† | ||||||||||||||||||
Catholic Responsible Investments Small-Cap Fund | ||||||||||||||||||||||||||||||
Institutional Shares | ||||||||||||||||||||||||||||||
2022(1) | $10.00 | $ 0.07 | $ (0.98)^ | $ (0.91) | $ (0.04) | $ (0.04) | $ 9.05 | (9.18)% | $457,573 | 0.28% | 0.28% | 1.68% | 13% | |||||||||||||||||
Catholic Responsible Investments International Small-Cap Fund | ||||||||||||||||||||||||||||||
Institutional Shares | ||||||||||||||||||||||||||||||
2022(1) | $10.00 | $ 0.07 | $ (0.87) | $ (0.80) | $ (0.03) | $ (0.03) | $ 9.17 | (8.00)% | $ 73,512 | 1.15% | 1.28% | 1.82% | 36% | |||||||||||||||||
Catholic Responsible Investments Magnus 45/55 Fund | ||||||||||||||||||||||||||||||
Institutional Shares | ||||||||||||||||||||||||||||||
2022(1) | $10.00 | $ 0.05 | $ (0.91) | $ (0.86) | $ (0.01) | $ (0.01) | $ 9.13 | (8.62)% | $ 45,448 | –%(2) | 0.17%(2) | 1.29% | 1% | |||||||||||||||||
Investor Shares | ||||||||||||||||||||||||||||||
2022(1) | $10.00 | $ 0.04 | $ (0.91) | $ (0.87) | $ (0.01) | $ (0.01) | $ 9.12 | (8.73)% | $ 40,802 | 0.15%(2) | 0.32%(2) | 1.10% | 1% | |||||||||||||||||
Catholic Responsible Investments Magnus 60/40 Alpha Plus Fund | ||||||||||||||||||||||||||||||
Institutional Shares | ||||||||||||||||||||||||||||||
2022(1) | $10.00 | $ 0.04 | $ (1.03) | $ (0.99) | $ (0.01) | $ (0.01) | $ 9.00 | (9.93)% | $738,479 | –%(2) | 0.02%(2) | 1.02% | 1% | |||||||||||||||||
Investor Shares | ||||||||||||||||||||||||||||||
2022(1) | $10.00 | $ 0.03 | $ (1.02) | $ (0.99) | $ (0.01) | $ (0.01) | $ 9.00 | (9.94)% | $338,909 | 0.15%(2) | 0.17%(2) | 0.80% | 1% | |||||||||||||||||
Catholic Responsible Investments Magnus 60/40 Beta Plus Fund | ||||||||||||||||||||||||||||||
Institutional Shares | ||||||||||||||||||||||||||||||
2022(1) | $10.00 | $ 0.05 | $ (0.94) | $ (0.89) | $ (0.01) | $ (0.01) | $ 9.10 | (8.92)% | $188,206 | –%(2) | 0.07%(2) | 1.21% | 3% | |||||||||||||||||
Investor Shares | ||||||||||||||||||||||||||||||
2022(1) | $10.00 | $ 0.04 | $ (0.94) | $ (0.90) | $ (0.01) | $ (0.01) | $ 9.09 | (9.03)% | $137,535 | 0.15%(2) | 0.22%(2) | 1.03% | 3% | |||||||||||||||||
Catholic Responsible Investments Magnus 75/25 Fund | ||||||||||||||||||||||||||||||
Institutional Shares | ||||||||||||||||||||||||||||||
2022(1) | $10.00 | $ 0.04 | $ (1.04) | $ (1.00) | $ (0.01) | $ (0.01) | $ 8.99 | (10.03)% | $197,671 | –%(2) | 0.07%(2) | 0.92% | 23% | |||||||||||||||||
Investor Shares | ||||||||||||||||||||||||||||||
2022(1) | $10.00 | $ 0.03 | $ (1.04) | $ (1.01) | $ (0.01) | $ (0.01) | $ 8.98 | (10.14)% | $32,603 | 0.15%(2) | 0.22%(2) | 0.82% | 23% | |||||||||||||||||
| * | Per unit data calculated using average units method. |
| ** | Annualized. |
| ^ | Realized and unrealized gains and losses per share are balancing amounts necessary to reconcile the change in net asset value per share for the period, and may not reconcile with the aggregate gains and losses in the Statement of Operations due to share transactions for the period. |
| † | Portfolio turnover is for the period indicated and has not been annualized. |
| (1) | Commenced operations on December 6, 2021. All ratios for the period have been annualized. |
| (2) | The expense ratios do not include expenses of the underlying affiliated investment companies. |
The accompanying notes are an integral part of the financial statements.
94
CATHOLIC RESPONSIBLE INVESTMENTS
APRIL 30, 2022 (Unaudited)
| NOTES TO FINANCIAL STATEMENTS |
1. Organization:
Catholic Responsible Investments Funds (the “Trust”) is an open-end management investment company that currently offers shares of thirteen active separate diversified portfolios: the Catholic Responsible Investments Magnus 45/55 Fund, Catholic Responsible Investments Magnus 60/40 Beta Plus Fund, Catholic Responsible Investments Magnus 60/40 Alpha Plus Fund, Catholic Responsible Investments Magnus 75/25 Fund, Catholic Responsible Investments Ultra Short Bond Fund, Catholic Responsible Investments Short Duration Bond Fund, Catholic Responsible Investments Opportunistic Bond Fund, Catholic Responsible Investments Bond Fund, Catholic Responsible Investments Equity Index Fund, Catholic Responsible Investments Multi-Style US Equity Fund, Catholic Responsible Investments International Equity Fund, Catholic Responsible Investments Small-Cap Fund and Catholic Responsible Investments International Small-Cap Fund (each, a “Fund” and together, the “Funds”). The Trust was established as a Delaware statutory trust pursuant to an Agreement and Declaration of Trust dated July 8, 2021 and amended and restated November 17, 2021 (the “Declaration of Trust”). The Declaration of Trust permits the Trust to offer separate series (“portfolios”) of units of beneficial interest (“shares”) and separate classes of shares of such portfolios. Each share of each portfolio represents an equal proportionate interest in that portfolio with each other share of that portfolio. The Funds are successors to the funds of the Catholic United Investment Trust (the “Predecessor Funds”). The Predecessor Funds were managed by the Adviser using investment objectives, strategies, policies and restrictions that were in all material respects equivalent to those used in managing the Funds. The Predecessor Funds dissolved and reorganized into the Investor Shares and Institutional Shares of each Fund on December 6, 2021. All of the assets of the Predecessor Funds were transferred to the Funds in connection with the reorganization.
The investment objective of the Catholic Responsible Investments Ultra Short Bond Fund seeks to provide current income consistent with the preservation of capital.
The investment objective of the Catholic Responsible Investments Short Duration Bond Fund seeks maximum current income consistent with the preservation of capital.
The investment objective of the Catholic Responsible Investments Opportunistic Bond Fund seeks current income and to provide relatively low correlation to equity assets.
The investment objective of the Catholic Responsible Investments Bond Fund seeks current income and long-term capital appreciation.
The investment objective of the Catholic Responsible Investments Equity Index Fund seeks to replicate as closely as possible, before expenses, the performance of the S&P500® Index.
The investment objective of the Catholic Responsible Investments Multi-Style US Equity Fund seeks to achieve long-term capital appreciation.
The investment objective of the Catholic Responsible Investments International Equity Fund seeks to achieve long-term capital appreciation.
The investment objective of the Catholic Responsible Investments Small-Cap Fund seeks to replicate the performance of the S&P SmallCap 600® Index, an index representing small capitalization companies.
The investment objective of the Catholic Responsible Investments International Small-Cap Fund seeks to achieve long-term capital appreciation.
The investment objective of each of the Catholic Responsible Investments Magnus 45/55 Fund, Catholic Responsible Investments Magnus 60/40 Beta Plus Fund, Catholic Responsible Investments Magnus 60/40 Alpha Plus Fund and Catholic Responsible Investments Magnus 75/25 Fund seeks to achieve current income and long-term capital appreciation.
95
CATHOLIC RESPONSIBLE INVESTMENTS
APRIL 30, 2022 (Unaudited)
Each Fund’s investment objective is not a fundamental policy and may be changed by the Board without shareholder approval.
2. Significant Accounting Policies:
The following are significant accounting policies, which are consistently followed in the preparation of its financial statements of the Funds. The Funds are investment companies that apply the accounting and reporting guidance issued in Topic 946 by the U.S. Financial Accounting Standards Board (“FASB”).
Use of Estimates — The preparation of financial statements in conformity with U.S. generally accepted accounting principles (“U.S. GAAP”) requires management to make estimates and assumptions that affect the reported amount of assets and liabilities, disclosure of contingent assets and liabilities at the date of the financial statements and the reported amounts of increases and decreases in net assets from operations during the reporting period. Actual results could differ from those estimates and such differences could be material.
Security Valuation — Securities listed on a securities exchange, market or automated quotation system for which quotations are readily available (except for securities traded on the NASDAQ Stock Market (the “NASDAQ”)), including securities traded over the counter, are valued at the last quoted sale price on an exchange or market (foreign or domestic) on which they are traded on valuation date (or at approximately 4:00 pm ET if a security’s primary exchange is normally open at that time), or, if there is no such reported sale on the valuation date, at the most recent quoted bid price. For securities traded on NASDAQ, the NASDAQ Official Closing Price will be used. If available, debt securities are priced based upon valuations provided by independent, third-party pricing agents. Such values generally reflect the last reported sales price if the security is actively traded. The third-party pricing agents may also value debt securities at an evaluated bid price by employing methodologies that utilize actual market transactions, broker-supplied valuations, or other methodologies designed to identify the market value for such securities. Such methodologies generally consider such factors as security prices, yields, maturities, call features, ratings and developments relating to specific securities in arriving at valuations. On the first day a new debt security purchase is recorded, if a price is not available on the automated pricing feeds from our primary and secondary pricing vendors nor is it available from an independent broker, the security may be valued at its purchase price. Each day thereafter, the debt security will be valued according to the Trusts’ Fair Value Procedures until an independent source can be secured. Debt obligations with remaining maturities of sixty days or less may be valued at their amortized cost, which approximates market value provided that it is determined the amortized cost continues to approximate fair value. Should existing credit, liquidity or interest rate conditions in the relevant markets and issuer specific circumstances suggest that amortized cost does not approximate fair value, then the amortized cost method may not be used. The prices for foreign securities are reported in local currency and converted to U.S. dollars using currency exchange rates. Futures are valued at the final settled price or in lieu of a settled price at the last sale price on the day of valuation.
Securities for which market prices are not “readily available” are valued in accordance with fair value procedures established by the Funds’ Board of Trustees (the “Board”). The Funds’ fair value procedures are implemented through a fair value pricing committee (the “Committee”) designated by the Board. Some of the more common reasons that may necessitate that a security be valued using fair value procedures include: the security’s trading has been halted or suspended; the security has been de-listed from a national exchange; the security’s primary trading market is temporarily closed at a time when under normal conditions it would be open; or the security’s primary pricing source is not able or willing to provide a price. When a security is valued in accordance with the fair value procedures, the Committee will determine the value after taking into consideration relevant information reasonably available to the Committee.
For securities that principally trade on a foreign market or exchange, a significant gap in time can exist between the time of a particular security’s last trade and the time at which a Fund calculates its net asset value. The closing prices of such securities may no longer reflect their market value at the time a Fund calculates net asset value if an event that could materially affect the value of those securities (a “Significant Event”) has occurred between the time of the security’s last close and the time that a Fund calculates net asset value. A Significant Event may relate
96
CATHOLIC RESPONSIBLE INVESTMENTS
APRIL 30, 2022 (Unaudited)
to a single issuer or to an entire market sector. If the Board becomes aware of a Significant Event that has occurred with respect to a security or group of securities after the closing of the exchange or market on which the security or securities principally trade, but before the time at which a Fund calculates net asset value, it may request that a Committee meeting be called.
In accordance with the authoritative guidance on fair value measurements and disclosure under U.S. GAAP, the Funds disclose the fair value of their investments in a hierarchy that prioritizes the inputs to valuation techniques used to measure the fair value. The objective of a fair value measurement is to determine the price that would be received to sell an asset or paid to transfer a liability in an orderly transaction between market participants at the measurement date (an exit price). Accordingly, the fair value hierarchy gives the highest priority to quoted prices (unadjusted) in active markets for identical assets or liabilities (Level 1) and the lowest priority to unobservable inputs (Level 3). The three levels of the fair value hierarchy under ASC 820 are described below:
Level 1 — Unadjusted quoted prices in active markets for identical, unrestricted assets or liabilities that the Funds have the ability to access at the measurement date;
Level 2 — Other significant observable inputs (includes quoted prices for similar securities, interest rates, prepayment speeds, credit risk, referenced indices, quoted prices in inactive markets, adjusted quoted prices in active markets, adjusted quoted prices on foreign equity securities that were adjusted in accordance with pricing procedures approved by the Board, etc.)
Level 3 — Significant unobservable prices or inputs (including the Fund’s own assumptions in determining the fair value of investments) where there is little or no market activity for the asset or liability at the measurement date.
Investments are classified within the level of the lowest significant input considered in determining fair value. Investments classified within Level 3 whose fair value measurement considers several inputs may include Level 1 or Level 2 inputs as components of the overall fair value measurement.
The unobservable inputs used to determine fair value of recurring Level 3 assets may have similar or diverging impacts on valuation. Significant increases and decreases in these inputs in isolation and interrelationships between those inputs could result in significantly higher or lower fair value measurement.
For the period ended 4/30/2022, there have been no significant changes to the Funds’ fair value methodologies.
Federal Income Taxes — It is each Fund’s intention to continue to qualify as a regulated investment company for Federal income tax purposes by complying with the appropriate provisions of Subchapter M of the Internal Revenue Code of 1986, as amended, and to distribute substantially all of its income to shareholders. Accordingly, no provision for Federal income taxes has been made in the financial statements.
The Funds evaluate tax positions taken or expected to be taken in the course of preparing the Funds’ tax returns to determine whether it is “more likely- than-not” (i.e., greater than 50-percent) that each tax position will be sustained upon examination by a taxing authority based on the technical merits of the position. Tax positions deemed to meet the more-likely-than-not threshold are recorded as a tax benefit in the current period. The Funds did not record any tax provision in the current period. However, management’s conclusions regarding tax positions taken may be subject to review and adjustment at a later date based on factors including, but not limited to, examination by tax authorities (i.e., the open tax year ends, since inception), on-going analysis of and changes to tax laws, regulations and interpretations thereof.
As of and during the period ended April 30, 2022, the Funds did not have a liability for any unrecognized tax benefits. The Funds recognize interest and penalties, if any, related to unrecognized tax benefits as income tax expense in the Statements of Operations. During the period the Funds did not incur any interest or penalties.
97
CATHOLIC RESPONSIBLE INVESTMENTS
APRIL 30, 2022 (Unaudited)
Security Transactions and Investment Income — Security transactions are accounted for on trade date for financial reporting purposes. Dividend income is recorded on the ex-dividend date and interest income is recognized on the accrual basis. Costs used in determining realized gains and losses on the sales of investment securities are based on specific identification. Interest income is recognized on an accrual basis from settlement date. Discounts and premiums on securities purchased are accreted and amortized using the effective interest method. Realized gains (losses) on paydowns of mortgage-backed and asset-backed securities are recorded as an adjustment to interest income.
Futures Contracts — A futures contract is an agreement involving the delivery of a particular asset on a specified future date at an agreed upon price. The Core Equity Index, Intermediate Diversified Bond and Opportunistic Bond Funds generally invest in exchange traded futures. These contracts are generally used to provide the return of a type of security without purchasing the securities of the underlying futures contract or to manage the Fund’s overall exposure to the market risk of the fixed income and equity markets. Upon entering into futures contracts, the Fund maintains an amount of cash or liquid securities, with a value equal to a percentage of the contract amount, with either a futures commission merchant or with its custodian in an account in the broker’s name. This amount is known as initial margin. During the period the futures contract is open, payments are received from or made to the broker based upon the changes in the value of the contract (the variation margin).
A margin deposit held at one counterparty for the futures contracts is included in “Cash pledged as Collateral for Futures Contracts” on the Statement of Assets and Liabilities and would be noted on the Schedule of Investments, if applicable. Variation margin payments are paid or received, depending upon whether unrealized gains or losses are incurred. When the futures contract is closed, the Fund records a realized gain or loss equal to the difference between the proceeds from (or cost of) the closing transaction and the amount invested in the futures contract.
For the period ended April 30, 2022, the daily average notional value of long futures contracts held was as follows:
Catholic Responsible Investments Bond Fund | ||||
Average Monthly Notional Value Long | $ | 15,996,346 | ||
Catholic Responsible Investments Equity Index Fund | ||||
Average Monthly Notional Value Long | $ | 8,497,700 | ||
Catholic Responsible Investments Small-Cap Fund | ||||
Average Monthly Notional Value Long | $ | 4,705,161 |
The following tables are the exposure by type of risk on derivatives held throughout the period:
Catholic Responsible Investments Bond Fund Statements of Assets and Liabilities Location | Asset Derivatives | Liability Derivatives | ||||||||
Credit Risk | Unrealized appreciation/(depreciation) on futures contracts* | $ | — | $ | (1,877,681) | |||||
|
|
|
| |||||||
| $ | — | $ | (1,877,681) | |||||||
|
|
|
| |||||||
Catholic Responsible Investments Equity Index Statements of Assets and Liabilities Location | Asset Derivatives | Liability Derivatives | ||||||||
Equity Risk | Unrealized appreciation/(depreciation) on futures contracts* | $ | — | $ | (365,550) | |||||
|
|
|
| |||||||
| $ | — | $ | (365,550) | |||||||
|
|
|
| |||||||
98
CATHOLIC RESPONSIBLE INVESTMENTS
APRIL 30, 2022 (Unaudited)
Catholic Responsible Investments Small-Cap Fund Statements of Assets and Liabilities Location | Asset Derivatives | Liability Derivatives | ||||||||
Equity Risk | Unrealized appreciation/(depreciation) on futures contracts* | $ | — | $ | (509,535) | |||||
|
|
|
| |||||||
| $ | — | $ | (509,535) | |||||||
|
|
|
| |||||||
* Unrealized appreciation/(depreciation) on Futures Contracts is included in distributable earnings/(loss).
The effect of derivative instruments on the Consolidated Statements of Operations for the period ended April 30, 2022, was as follows:
| Catholic Responsible Investments Bond Fund | Net Realized Gain/(Loss)* | Change in Unrealized (Depreciation)** | ||||||
Credit Risk | ||||||||
Futures contracts | $ | (783,962) | $ | (1,877,681) | ||||
|
|
|
| |||||
| $ | (783,962) | $ | (1,877,681) | |||||
|
|
|
| |||||
| Catholic Responsible Investments Equity Index Fund | Net Realized Gain/(Loss)* | Change in Unrealized (Depreciation)** | ||||||
Equity Risk | ||||||||
Futures contracts | $ | 126,262 | $ | (365,550) | ||||
|
|
|
| |||||
| $ | 126,262 | $ | (365,550) | |||||
|
|
|
| |||||
| Catholic Responsible Investments Small-Cap Fund | Net Realized Gain/(Loss)* | Change in Unrealized (Depreciation)** | ||||||
Equity Risk | ||||||||
Futures contracts | $ | (367,900) | $ | (509,535) | ||||
|
|
|
| |||||
| $ | (367,900) | $ | (509,535) | |||||
|
|
|
| |||||
* Futures contracts are included in net realized gain (loss) on Futures Contracts.
** Futures contracts are included in change in unrealized appreciation (depreciation) on Futures Contracts.
Cash — Idle cash may be swept into various time deposit accounts and money market sweep accounts and is classified as cash on the Statements of Assets and Liabilities. The Funds maintain cash in bank deposit accounts which, at times, may exceed United States federally insured limits. Amounts invested are available on the same business day.
Expenses — Expenses of the Trust that can be directly attributed to a particular Fund are borne by that Fund. Expenses which cannot be directly attributed to a Fund are apportioned among the Funds of the Trust based on the number of funds and/or relative net assets.
Dividends and Distributions to Shareholders — The Funds will distribute substantially all of their net investment income and net realized capital gains, if any, at least annually. All distributions are recorded on ex-dividend date.
99
CATHOLIC RESPONSIBLE INVESTMENTS
APRIL 30, 2022 (Unaudited)
Investments in REITs — Dividend income from Real Estate Investment Trusts (“REIT”) is recorded based on the income included in distributions received from the REIT investments using published REIT reclassifications, including some management estimates when actual amounts are not available. Distributions received in excess of this estimated amount are recorded as a reduction of the cost of investments or reclassified to capital gains. The actual amounts of income, return of capital, and capital gains are only determined by each REIT after its fiscal year-end, and may differ from the estimated amounts.
Redemption Fees — A redemption fee of 2.00% of the value of the shares sold will be imposed on shares of the Catholic Responsible Investments Opportunistic Bond Fund, Catholic Responsible Investments Bond Fund, Catholic Responsible Investments Equity Index Fund, Catholic Responsible Investments Multi-Style US Equity Fund, Catholic Responsible Investments International Equity Fund, Catholic Responsible Investments Small-Cap Fund and Catholic Responsible Investments International Small-Cap Fund redeemed within 30 days or less after their date of purchase (subject to certain exceptions as discussed below in “Redemption Fees”). Such fees are retained by the Funds for the benefit of the remaining shareholders and are recorded as
additions to fund capital.
Deferred Offering Costs — Offering costs of the Funds, including costs of printing the initial prospectus, legal, and registration fees, are amortized to expense over a twelve month period. As of April 30, 2022, the Funds’ offering costs have been fully amortized.
Securities Lending — Each Fund may lend portfolio securities to brokers, dealers and other financial organizations that meet capital and other credit requirements or other criteria established by the Board. These loans, if and when made, may not exceed 331/3% of the total asset value of the Fund (including the loan collateral). Each Fund will not lend portfolio securities to its advisers or its affiliates unless it has applied for and received specific authority to do so from the SEC. Loans of portfolio securities will be fully collateralized by cash, letters of credit or U.S. Government securities, and the collateral will be maintained in an amount equal to at least 100% of the current market value of the loaned securities by marking to market daily, although the borrower will be required to deliver collateral of 102% and 105% of the market value of borrowed securities for domestic and foreign issuers, respectively. Any gain or loss in the market price of the securities loaned that might occur during the term of the loan would be for the account of the Fund. The investment of cash collateral subjects a Fund to market risk. A Fund remains obligated to return all collateral to the borrower under the terms of its securities lending arrangements even if the value of the investments made with the collateral has declined. Accordingly, if the value of a security in which the cash collateral has been invested declines, the loss would be borne by the Fund, and the Fund may be required to liquidate other investments in order to return collateral to the borrower at the end of a loan. As of April 30, 2022, and during the period ended April 30, 2022, none of the Funds utilized the program.
3. Transactions with Affiliates:
Certain officers of the Trust are also employees of SEI Investments Global Funds Services (the “Administrator”), a wholly owned subsidiary of SEI Investments Company, and/or SEI Investments Distribution Co. (the “Distributor”). Such officers are paid no fees by the Trust, other than the Chief Compliance Officer (“CCO”) as described below, for serving as officers of the Trust.
A portion of the services provided by the CCO and his staff, whom are employees of the Administrator, are paid for by the Trust as incurred. The services include regulatory oversight of the Trust’s Advisors and service providers as required by SEC regulations. The CCO’s services and fees have been approved by and are reviewed by the Board.
4. Administration, Distribution, Shareholder Servicing, Transfer Agent and Custody Agreements:
The Funds and the Administrator are parties to an Administration Agreement under which the Administrator provides management and administrative services to the Funds. For these services, the Administrator is paid an asset-based fee, which will vary depending on the number of share classes and the average daily net assets of the Funds.
100
CATHOLIC RESPONSIBLE INVESTMENTS
APRIL 30, 2022 (Unaudited)
For the period ended April 30, 2022, the Funds were charged the following for these services:
| Administration Fees | ||
Catholic Responsible Investments Ultra Short Bond Fund | $ 4,813 | |
Catholic Responsible Investments Short Duration Bond Fund | 41,450 | |
Catholic Responsible Investments Opportunistic Bond Fund | 40,119 | |
Catholic Responsible Investments Bond Fund | 138,109 | |
Catholic Responsible Investments Equity Index Fund | 261,175 | |
Catholic Responsible Investments Multi-Style US Equity Fund | 60,464 | |
Catholic Responsible Investments International Equity Fund | 99,637 | |
Catholic Responsible Investments Small-Cap Fund | 39,770 | |
Catholic Responsible Investments International Small-Cap Fund | 6,052 |
The Trust and the Distributor are parties to a Distribution Agreement. The Distributor receives no fees under the agreement.
The Funds have adopted a shareholder servicing plan that provides that the Funds may pay financial intermediaries for shareholder services in an annual amount not to exceed 0.15% based on the average daily net assets of the Funds’ Investor Shares. The Funds do not pay these service fees on shares purchased directly. In addition to payments made directly to financial intermediaries by the Funds, the Adviser or its affiliates may, at their own expense, pay financial intermediaries for these and other services to the Funds’ shareholders. For the period ended April 30, 2022, these amounts can be found on the Statement of Operations under Shareholder Servicing Fees.
Atlantic Shareholder Services, LLC serves as the Transfer Agent and dividend disbursing agent for the Funds under a transfer agency agreement.
Brown Brothers Harriman & Co. serves as custodian (the “Custodian”) for the Funds. The Custodian plays no role in determining the investment policies of the Funds or which securities are to be purchased and sold by the Funds.
5. Investment Advisory Agreement:
The Trust and the Adviser have entered into an investment advisory agreement (the “Advisory Agreement”). Pursuant to the Advisory Agreement, the Adviser provides investment advisory services to the Funds and oversees the investment sub-advisory services provided to the Asset Class Funds. Pursuant to separate sub-advisory agreements (the “Sub-Advisory Agreements” and, together with the Advisory Agreement, the “Investment Advisory Agreements”) with the Adviser, and under the supervision of the Adviser and the Board, one or more Sub-Advisers are responsible for the day-to-day investment management of all or a distinct portion of the assets of the Asset Class Funds. The Adviser pays each Fund’s Sub-Advisers out of the fee it receives from such Fund.
After its initial two year term, the continuance of each Investment Advisory Agreement with respect to each Fund must be specifically approved at least annually: (i) by the vote of a majority of the outstanding voting securities of that Fund or by the Trustees; and (ii) by the vote of a majority of the Trustees who are not parties to such Investment Advisory Agreement or “interested persons” (as defined under the 1940 Act) of any party thereto, cast in person at a meeting called for the purpose of voting on such approval. The Advisory Agreement will terminate automatically in the event of its assignment and is terminable at any time without penalty by the Board or, with respect to a Fund, by a majority of the outstanding voting securities of that Fund, or by the Adviser on not less than 30 days’ nor more than 60 days’ written notice to the Trust. Each Sub-Advisory Agreement will terminate automatically in the event of its assignment or in the event of the termination of the Advisory Agreement and is terminable at any time without penalty by the Board or, with respect to a Fund, by a majority of the outstanding voting securities of that Fund, or by the Adviser or Sub-Adviser on not less than 30 days’ nor more than 60 days’ written notice to the other party.
101
CATHOLIC RESPONSIBLE INVESTMENTS
APRIL 30, 2022 (Unaudited)
For its services under the Advisory Agreement, the Adviser is entitled to a fee, which is calculated daily and paid monthly, at the following annual rates based on the average daily net assets of each Fund:
Fund | Advisory Fee | |
Catholic Responsible Investments Ultra Short Bond Fund | 0.25% | |
Catholic Responsible Investments Short Duration Bond Fund | 0.30% | |
Catholic Responsible Investments Opportunistic Bond Fund | 0.35% | |
Catholic Responsible Investments Bond Fund | 0.30% | |
Catholic Responsible Investments Equity Index Fund | 0.06% | |
Catholic Responsible Investments Multi-Style US Equity Fund | 0.60% | |
Catholic Responsible Investments International Equity Fund | 0.74% | |
Catholic Responsible Investments Small-Cap Fund | 0.20% | |
Catholic Responsible Investments International Small-Cap | 0.96% | |
Catholic Responsible Investments Magnus 45/55 Fund | 0.00% | |
Catholic Responsible Investments Magnus 60/40 Alpha Plus Fund | 0.00% | |
Catholic Responsible Investments Magnus 60/40 Beta Plus Fund | 0.00% | |
Catholic Responsible Investments Magnus 75/25 Fund | 0.00% |
For each Fund, the Adviser has contractually agreed to waive fees and reimburse expenses to the extent necessary to keep the Fund’s total annual Fund operating expenses (excluding shareholder servicing fees, interest, taxes, brokerage commissions and other costs and expenses relating to the securities that are purchased and sold by the Fund, dividend and interest expenses on securities sold short, acquired fund fees and expenses, fees and expenses incurred in connection with tax reclaim recovery services, other expenditures which are capitalized in accordance with generally accepted accounting principles, and other non-routine expenses (collectively, “excluded expenses”)) for each of that Fund’s share class(es) from exceeding certain levels as set forth below until October 31, 2023 (each, a “contractual expense limit”). In addition, the Adviser may receive from a Fund the difference between the total annual Fund operating expenses (not including excluded expenses) and the Fund’s contractual expense limit to recoup all or a portion of its prior fee waivers or expense reimbursements made during the rolling three-year period preceding the date of the recoupment if at any point total annual Fund operating expenses (not including excluded expenses) are below the contractual expense limit (i) at the time of the fee waiver and/or expense reimbursement and (ii) at the time of the recoupment. This agreement may be terminated: (i) by the Board, for any reason at any time; or (ii) by the Adviser, upon ninety (90) days’ prior written notice to the Trust, effective as of the close if business on October 31, 2023. As of April 30, 2022, the amounts waived on the Statement of Operations under Waiver of Investment Advisory Fees are open to recoupment.
| Fund | Contractual Expense Limit | |
Catholic Responsible Investments Ultra Short Bond Fund | 0.35% | |
Catholic Responsible Investments Short Duration Bond Fund | 0.35% | |
Catholic Responsible Investments Opportunistic Bond Fund | 0.41% | |
Catholic Responsible Investments Bond Fund | 0.37% | |
Catholic Responsible Investments Equity Index Fund | 0.09% | |
Catholic Responsible Investments Multi-Style US Equity Fund | 0.69% | |
Catholic Responsible Investments International Equity Fund | 0.84% | |
Catholic Responsible Investments Small-Cap Fund | 0.31% | |
Catholic Responsible Investments International Small-Cap | 1.15% | |
Catholic Responsible Investments Magnus 45/55 Fund | 0.00% | |
Catholic Responsible Investments Magnus 60/40 Beta Plus Fund | 0.00% | |
Catholic Responsible Investments Magnus 60/40 Alpha Plus Fund | 0.00% | |
Catholic Responsible Investments Magnus 75/25 Fund | 0.00% |
102
CATHOLIC RESPONSIBLE INVESTMENTS
APRIL 30, 2022 (Unaudited)
6. Investment Transactions:
For the period ended April 30, 2022, the purchases and sales of investment securities other than short-term investments, were as follows:
U.S. Gov’t ($ Thousands) | Other ($ Thousands) | Total ($ Thousands) | ||||||||||
Catholic Responsible Investments Ultra Short Bond Fund | ||||||||||||
Purchases | $ | — | $ | 385,714 | $ | 385,714 | ||||||
Sales | — | 1,727,478 | 1,727,478 | |||||||||
Catholic Responsible Investments Short Duration Bond Fund | ||||||||||||
Purchases | 74,820,132 | 58,572,983 | 133,393,115 | |||||||||
Sales | 39,936,234 | 72,651,447 | 112,587,681 | |||||||||
Catholic Responsible Investments Opportunistic Bond Fund | ||||||||||||
Purchases | 63,473,472 | 19,297,037 | 82,770,509 | |||||||||
Sales | 14,070,941 | 42,241,985 | 56,312,926 | |||||||||
Catholic Responsible Investments Bond Fund | ||||||||||||
Purchases | 446,933,959 | 126,401,734 | 573,335,693 | |||||||||
Sales | 387,729,922 | 118,628,515 | 506,358,437 | |||||||||
Catholic Responsible Investments Equity Index Fund | ||||||||||||
Purchases | — | 302,395,238 | 302,395,238 | |||||||||
Sales | — | 249,318,788 | 249,318,788 | |||||||||
Catholic Responsible Investments Multi-Style US Equity Fund | ||||||||||||
Purchases | — | 123,208,093 | 123,208,093 | |||||||||
Sales | — | 140,236,154 | 140,236,154 | |||||||||
Catholic Responsible Investments International Equity Fund | ||||||||||||
Purchases | — | 344,454,679 | 344,454,679 | |||||||||
Sales | — | 280,238,161 | 280,238,161 | |||||||||
Catholic Responsible Investments Small-Cap Fund | ||||||||||||
Purchases | — | 452,145,277 | 452,145,277 | |||||||||
Sales | — | 62,931,784 | 62,931,784 | |||||||||
Catholic Responsible Investments International Small-Cap Fund | ||||||||||||
Purchases | — | 31,365,294 | 31,365,294 | |||||||||
Sales | — | 27,218,882 | 27,218,882 | |||||||||
Catholic Responsible Investments Magnus 45/55 Fund | ||||||||||||
Purchases | — | 83,941,153 | 83,941,153 | |||||||||
Sales | — | 1,119,798 | 1,119,798 | |||||||||
Catholic Responsible Investments Magnus 60/40 Alpha Plus Fund | ||||||||||||
Purchases | — | 1,022,049,115 | 1,022,049,115 | |||||||||
Sales | — | 10,404,802 | 10,404,802 | |||||||||
Catholic Responsible Investments Magnus 60/40 Beta Plus Fund | ||||||||||||
Purchases | — | 299,821,702 | 299,821,702 | |||||||||
Sales | — | 8,216,461 | 8,216,461 | |||||||||
Catholic Responsible Investments Magnus 75/25 Fund | ||||||||||||
Purchases | — | 256,456,752 | 256,456,752 | |||||||||
Sales | — | 52,863,865 | 52,863,865 | |||||||||
7. Federal Tax Information:
The amount and character of income and capital gain distributions to be paid, if any, are determined in accordance with Federal income tax regulations, which may differ from U.S. GAAP. As a result, net investment income (loss) and net realized gain/(loss) on investment transactions for a reporting period may differ significantly from distributions during the period. The book/tax differences may be temporary or permanent. To the extent these differences are permanent in nature, they are charged or credited to undistributed net investment income (loss), accumulated net realized gain (loss) or paid-in capital as appropriate, in the period that the difference arises.
103
CATHOLIC RESPONSIBLE INVESTMENTS
APRIL 30, 2022 (Unaudited)
The Federal tax cost and aggregate gross unrealized appreciation and depreciation for investments held by Funds at April 30, 2022, were as follows:
| Federal Tax Cost | Aggregate Gross Unrealized Appreciation | Aggregate Gross Unrealized Depreciation | Net Unrealized Appreciation (Depreciation) | |||||||||||||
Catholic Responsible Investments Ultra Short Bond Fund | $ | 60,495,817 | $ | 5,604 | $ | (324,475 | ) | $ | (318,871 | ) | ||||||
Catholic Responsible Investments Short Duration Bond Fund | 530,656,033 | 90,797 | (18,414,923 | ) | (18,324,126 | ) | ||||||||||
Catholic Responsible Investments Opportunistic Bond Fund | 506,991,487 | 295,293 | (23,386,013 | ) | (23,090,720 | ) | ||||||||||
Catholic Responsible Investments Bond Fund | 1,742,237,874 | 3,622,315 | (118,640,269 | ) | (115,017,954 | ) | ||||||||||
Catholic Responsible Investments Equity Index Fund | 2,030,923,567 | 1,058,740,625 | (52,419,452 | ) | 1,006,321,173 | |||||||||||
Catholic Responsible Investments Multi-Style US Equity Fund | 683,487,796 | 43,078,277 | (66,182,724 | ) | (23,104,447 | ) | ||||||||||
Catholic Responsible Investments International Equity Fund | 1,035,238,108 | 167,967,750 | (100,313,570 | ) | 67,654,180 | |||||||||||
Catholic Responsible Investments Small-Cap Fund | 399,175,724 | 98,147,042 | (46,573,630 | ) | 51,573,412 | |||||||||||
Catholic Responsible Investments International Small-Cap Fund | 73,267,193 | 6,633,733 | (8,921,299 | ) | (2,287,566 | ) | ||||||||||
Catholic Responsible Investments Magnus 45/55 Fund | 82,750,873 | 5,881,509 | (2,451,554 | ) | 3,429,955 | |||||||||||
Catholic Responsible Investments Magnus 60/40 Alpha Plus Fund | 1,010,903,731 | 87,729,890 | (21,368,074 | ) | 66,361,816 | |||||||||||
Catholic Responsible Investments Magnus 60/40 Beta Plus Fund | 291,072,587 | 39,983,569 | (5,324,943 | ) | 34,658,626 | |||||||||||
Catholic Responsible Investments Magnus 75/25 Fund | 205,577,389 | 28,229,247 | (3,609,079 | ) | 24,620,168 | |||||||||||
8. Concentration of Shareholders:
At April 30, 2022, the percentage of total shares outstanding held by Institutional Class shareholders for each Fund, which are comprised of individual shareholders and omnibus accounts that are held on behalf of various individual shareholders was as follows:
| No. of Shareholders | % Ownership | |||
CRI Ultra Short Bond Fund | 1 | 16 | ||
CRI Short Duration Bond Fund | 1 | 21 | ||
CRI Opportunistic Bond Fund | 1 | 24 | ||
CRI Bond Fund | 3 | 28 | ||
CRI Equity Index Fund | 2 | 15 | ||
CRI Multi-Style US Equity Fund | 4 | 58 | ||
CRI International Equity Fund | 3 | 34 | ||
CRI Small-Cap Fund | 2 | 20 | ||
CRI International Small-Cap Fund | 4 | 74 | ||
CRI Magnus 45/55 Fund | 3 | 46 | ||
CRI Magnus 60/40 Alpha Plus Fund | 2 | 30 | ||
CRI Magnus 60/40 Beta Plus Fund | 2 | 22 | ||
CRI Magnus 75/25 Fund | 4 | 72 |
In the normal course of business, the Funds enter into contracts that provide general indemnifications. The Funds’ maximum exposure under these arrangements is dependent on future claims that may be made against the Funds and, therefore, cannot be established; however, based on experience, the risk of loss from such claim is considered remote.
9. Concentration of Risks:
The foregoing is not intended to be a complete discussion of the risks associated with investing in a Fund. Please review each Fund’s prospectus for additional disclosures regarding the principal risks associated with investing in a particular Fund.
104
CATHOLIC RESPONSIBLE INVESTMENTS
APRIL 30, 2022 (Unaudited)
As with all mutual funds, there is no guarantee that the Funds will achieve their investment objectives. You could lose money by investing in the Funds. A Fund share is not a bank deposit and is not insured or guaranteed by the Federal Deposit Insurance Corporation or any government agency. The principal risk factors affecting shareholders’ investments in the Funds are set forth below.
Derivatives Risk — Derivatives are instruments that derive their value from an underlying security, financial asset or an index. Examples of derivative instruments include futures contracts, forward contracts, options and swaps. Changes in the market value of a security that is a reference asset for a derivative instrument may not be proportionate to changes in the market value of the derivative instrument itself. There may not be a liquid market for a Fund to sell a derivative instrument, which could result in difficulty in closing the position. Moreover, certain derivative instruments can magnify the extent of losses incurred due to changes in the market value of the securities to which they relate. Some derivative instruments are subject to counterparty risk. A default by the counterparty on its payments to a Fund will cause the value of your investment in the Fund to decrease. A Fund’s use of derivatives is also subject to credit risk, leverage risk, lack of availability risk, valuation risk, correlation risk and tax risk. Credit risk and leverage risk are each described elsewhere in this section. A Fund’s counterparties to its derivative contracts present the same types of credit risk as issuers of fixed income securities. Lack of availability risk is the risk that suitable derivative transactions, such as roll-forward contracts, may not be available in all circumstances for risk management or other purposes. Valuation risk is the risk that a particular derivative may be valued incorrectly. Correlation risk is the risk that changes in the value of the derivative may not correlate perfectly with the underlying asset, rate or index. Tax risk is the risk that the use of derivatives may cause a Fund to realize higher amounts of short-term capital gains, thereby increasing the amount of taxes payable by some shareholders. These risks could cause a Fund to lose more than the principal amount invested. Some derivatives have the potential for unlimited loss, regardless of the size of a Fund’s initial investment.
New Fund Risk — Because the Funds are new, investors in the Funds bear the risk that the Funds may not be successful in implementing their investment strategies, may not employ successful investment strategies, or may fail to attract sufficient assets under management to realize economies of scale, any of which could result in the Funds being liquidated at any time without shareholder approval and at a time that may not be favorable for all shareholders. Such liquidation could have negative tax consequences for shareholders and will cause shareholders to incur expenses of liquidation. Because non-U.S. securities are usually denominated in currencies other than the dollar, the value of a Fund’s portfolio may be influenced by currency exchange rates and exchange control regulations. The currencies of emerging market countries may experience significant declines against the U.S. dollar, and devaluation may occur subsequent to investments in these currencies by a Fund. Inflation and rapid fluctuations in inflation rates have had, and may continue to have, negative effects on the economies and securities markets of certain emerging market countries.
Investments in Underlying Funds Risk - The value of an investment in the Funds is based primarily on the prices of the Underlying Funds in which the Funds invest. In turn, the price of each Underlying Fund is based on the value of its assets. Each Fund, and thus its shareholders, bears its own direct expenses in addition to bearing a proportionate share of expenses of the Underlying Funds, which may make owning shares of such Fund more costly than owning shares of the Underlying Funds directly. Before investing in the Funds, investors should assess the risks associated with the Underlying Funds and the types of investments made by those Underlying Funds. These risks include any combination of the risks described elsewhere in this section, although a Fund’s exposure to a particular risk will be proportionate to the Fund’s overall asset allocation and Underlying Fund allocation.
Market Risk – The risk that the market value of an investment may move up and down, sometimes rapidly and unpredictably. A Fund’s NAV per share will fluctuate with the market prices of its portfolio securities. Market risk may affect a single issuer, an industry, a sector or the equity or bond market as a whole. Markets for securities in which a Fund invests may decline significantly in response to adverse issuer, political, regulatory, market, economic or other developments that may cause broad changes in market value, public perceptions concerning these developments, and adverse investor sentiment or publicity. Similarly, the impact of any epidemic, pandemic or natural disaster, or widespread fear that such events may occur, could negatively affect the global economy, as
105
CATHOLIC RESPONSIBLE INVESTMENTS
APRIL 30, 2022 (Unaudited)
well as the economies of individual countries, the financial performance of individual companies and sectors, and the markets in general in significant and unforeseen ways. Any such impact could adversely affect the prices and liquidity of the securities and other instruments in which a Fund invests, which in turn could negatively impact the Fund’s performance and cause losses on your investment in the Fund. Recent examples include pandemic risks related to COVID-19 and aggressive measures taken worldwide in response by governments, including closing borders, restricting international and domestic travel, and the imposition of prolonged quarantines of large populations, and by businesses, including changes to operations and reducing staff. The impact of the COVID-19 pandemic may be short term or may last for an extended period of time, and in either case could result in a substantial economic downturn or recession.
10. Subsequent Events:
The Funds have evaluated the need for additional disclosures and/or adjustments resulting from subsequent events through the date the financial statements were issued. Based on this evaluation, no additional disclosures and/or adjustments, other than that listed below, were required to the financial statements as of April 30, 2022.
106
CATHOLIC RESPONSIBLE INVESTMENTS
APRIL 30, 2022 (Unaudited)
| DISCLOSURE OF FUND EXPENSES (Unaudited) |
All mutual funds have operating expenses. As a shareholder of a mutual fund, your investment is affected by these ongoing costs, which include (among others) costs for Fund management, administrative services, and shareholder reports like this one. It is important for you to understand the impact of these costs on your investment returns.
Operating expenses such as these are deducted from the mutual fund’s gross income and directly reduce your final investment return. These expenses are expressed as a percentage of the mutual fund’s average net assets; this percentage is known as the mutual fund’s expense ratio.
The following examples use the expense ratio and are intended to help you understand the ongoing costs (in dollars) of investing in your Fund and to compare these costs with those of other mutual funds. The examples are based on an investment of $1,000 made at the beginning of the period shown and held for the entire period from November 1, 2021 to April 30, 2022.
The table on the next page illustrates your Fund’s costs in two ways:
• Actual Fund Return. This section helps you to estimate the actual expenses after fee waivers that your Fund incurred over the period. The “Expenses Paid During Period” column shows the actual dollar expense cost incurred by a $1,000 investment in the Fund, and the “Ending Account Value” number is derived from deducting that expense cost from the Fund’s gross investment return.
You can use this information, together with the actual amount you invested in the Fund, to estimate the expenses you paid over that period. Simply divide your ending starting account value by $1,000 to arrive at a ratio (for example, an $8,600 account value divided by $1,000 = 8.6), then multiply that ratio by the number shown for your Fund under “Expenses Paid During Period.”
• Hypothetical 5% Return. This section helps you compare your Fund’s costs with those of other mutual funds. It assumes that the Fund had an annual 5% return before expenses during the year, but that the expense ratio (Column 3) for the period is unchanged. This example is useful in making comparisons because the Securities and Exchange Commission requires all mutual funds to make this 5% calculation. You can assess your Fund’s comparative cost by comparing the hypothetical result for your Fund in the “Expenses Paid During Period” column with those that appear in the same charts in the shareholder reports for other mutual funds.
Note: Because the return is set at 5% for comparison purposes — NOT your Fund’s actual return — the account values shown may not apply to your specific investment.
107
CATHOLIC RESPONSIBLE INVESTMENTS
APRIL 30, 2022 (Unaudited)
Beginning Account Value 12/6/21 | Ending Account Value 4/30/22 | Annualized Expense Ratios | Expenses Paid Period | |||||||||||||||||
Catholic Responsible Investments Ultra Short Bond Fund*** | ||||||||||||||||||||
Actual Fund Return | ||||||||||||||||||||
Institutional | $ | 1,000.00 | $ | 1,000.00 | 0.35 | % | $1.40 | * | ||||||||||||
Hypothetical 5% Return | ||||||||||||||||||||
Institutional | $ | 1,000.00 | $ | 1,023.05 | 0.35 | % | $1.77 | ** | ||||||||||||
Catholic Responsible Investments Short Duration Bond Fund*** | ||||||||||||||||||||
Actual Fund Return | ||||||||||||||||||||
Institutional | $ | 1,000.00 | $ | 970.00 | 0.35 | % | $1.37 | * | ||||||||||||
Hypothetical 5% Return | ||||||||||||||||||||
Institutional | $ | 1,000.00 | $ | 1,023.06 | 0.35 | % | $1.76 | ** | ||||||||||||
Catholic Responsible Investments Opportunistic Bond Fund*** | ||||||||||||||||||||
Actual Fund Return | ||||||||||||||||||||
Institutional | $ | 1,000.00 | $ | 955.00 | 0.41 | % | $1.57 | * | ||||||||||||
Investor | 1,000.00 | 954.50 | 0.56 | % | 2.17 | * | ||||||||||||||
Hypothetical 5% Return | ||||||||||||||||||||
Institutional | $ | 1,000.00 | $ | 1,022.79 | 0.41 | % | $2.03 | ** | ||||||||||||
Investor | 1,000.00 | 1,022.02 | 0.56 | % | 2.81 | ** | ||||||||||||||
Catholic Responsible Investments Bond Fund*** | ||||||||||||||||||||
Actual Fund Return | ||||||||||||||||||||
Institutional | $ | 1,000.00 | $ | 1,000.00 | 0.35 | % | $1.40 | * | ||||||||||||
Investor | 1,000.00 | 1,000.00 | 0.50 | % | 2.00 | * | ||||||||||||||
Hypothetical 5% Return | ||||||||||||||||||||
Institutional | $ | 1,000.00 | $ | 1,018.60 | 0.35 | % | $1.41 | ** | ||||||||||||
Investor | 1,000.00 | 1,000.00 | 0.50 | % | 2.00 | ** | ||||||||||||||
Catholic Responsible Investments Equity Index Fund*** | ||||||||||||||||||||
Actual Fund Return | ||||||||||||||||||||
Institutional | $ | 1,000.00 | $ | 1,000.00 | 0.09 | % | $0.36 | * | ||||||||||||
Hypothetical 5% Return | ||||||||||||||||||||
Institutional | $ | 1,000.00 | $ | 1,019.64 | 0.09 | % | $0.36 | ** | ||||||||||||
Catholic Responsible Investments Multi-Style US Equity Fund*** | ||||||||||||||||||||
Actual Fund Return | ||||||||||||||||||||
Institutional | $ | 1,000.00 | $ | 1,000.00 | 0.66 | % | $2.64 | * | ||||||||||||
Investor | 1,000.00 | 1,000.00 | 0.81 | % | 3.24 | * | ||||||||||||||
Hypothetical 5% Return | ||||||||||||||||||||
Institutional | $ | 1,000.00 | $ | 1,017.36 | 0.66 | % | $2.66 | ** | ||||||||||||
Investor | 1,000.00 | 1,000.00 | 0.81 | % | 3.24 | ** | ||||||||||||||
Catholic Responsible Investments International Equity Fund*** | ||||||||||||||||||||
Actual Fund Return | ||||||||||||||||||||
Institutional | $ | 1,000.00 | $ | 1,000.00 | 0.84 | % | $3.32 | * | ||||||||||||
Investor | 1,000.00 | 1,000.00 | 0.99 | % | 3.92 | * | ||||||||||||||
Hypothetical 5% Return | ||||||||||||||||||||
Institutional | $ | 1,000.00 | $ | 1,016.68 | 0.84 | % | $3.35 | ** | ||||||||||||
Investor | 1,000.00 | 1,000.00 | 0.99 | % | 3.92 | ** | ||||||||||||||
Catholic Responsible Investments Small-Cap Fund*** | ||||||||||||||||||||
Actual Fund Return | ||||||||||||||||||||
Institutional | $ | 1,000.00 | $ | 1,000.00 | 0.28 | % | $1.12 | * | ||||||||||||
Hypothetical 5% Return | ||||||||||||||||||||
Institutional | $ | 1,000.00 | $ | 1,018.88 | 0.28 | % | $1.13 | ** | ||||||||||||
108
CATHOLIC RESPONSIBLE INVESTMENTS
APRIL 30, 2022 (Unaudited)
Beginning Account Value 12/6/21 | Ending Account Value 4/30/22 | Annualized Expense Ratios | Expenses Paid Period | |||||||||||||||||
Catholic Responsible Investments International Small-Cap Fund*** | ||||||||||||||||||||
Actual Fund Return | ||||||||||||||||||||
Institutional | $ | 1,000.00 | $ | 1,000.00 | 1.15 | % | $4.60 | * | ||||||||||||
Hypothetical 5% Return | ||||||||||||||||||||
Institutional | $ | 1,000.00 | $ | 1,015.40 | 1.15 | % | $4.64 | ** | ||||||||||||
Catholic Responsible Investments Magnus 45/55 Fund*** | ||||||||||||||||||||
Actual Fund Return | ||||||||||||||||||||
Institutional | $ | 1,000.00 | $ | 913.80 | — | % | $– | * | ||||||||||||
Investor | 1,000.00 | 912.70 | 0.15 | % | 0.57 | * | ||||||||||||||
Hypothetical 5% Return | ||||||||||||||||||||
Institutional | $ | 1,000.00 | $ | 1,024.79 | — | % | $– | ** | ||||||||||||
Investor | 1,000.00 | 1,024.05 | 0.15 | % | 0.75 | ** | ||||||||||||||
Catholic Responsible Investments Magnus 60/40 Alpha Plus Fund*** | ||||||||||||||||||||
Actual Fund Return | ||||||||||||||||||||
Institutional | $ | 1,000.00 | $ | 900.70 | — | % | $– | * | ||||||||||||
Investor | 1,000.00 | 900.60 | 0.15 | % | 0.57 | * | ||||||||||||||
Hypothetical 5% Return | ||||||||||||||||||||
Institutional | $ | 1,000.00 | $ | 1,024.80 | — | % | $0.01 | ** | ||||||||||||
Investor | 1,000.00 | 1,024.05 | 0.15 | % | 0.75 | ** | ||||||||||||||
Catholic Responsible Investments Magnus 60/40 Beta Plus Fund*** | ||||||||||||||||||||
Actual Fund Return | ||||||||||||||||||||
Institutional | $ | 1,000.00 | $ | 910.80 | — | % | $0.01 | * | ||||||||||||
Investor | 1,000.00 | 909.70 | 0.15 | % | 0.57 | * | ||||||||||||||
Hypothetical 5% Return | ||||||||||||||||||||
Institutional | $ | 1,000.00 | $ | 1,024.79 | — | % | $0.01 | ** | ||||||||||||
Investor | 1,000.00 | 1,024.05 | 0.15 | % | 0.75 | ** | ||||||||||||||
Catholic Responsible Investments Magnus 75/25 Fund*** | ||||||||||||||||||||
Actual Fund Return | ||||||||||||||||||||
Institutional | $ | 1,000.00 | $ | 899.70 | — | % | $– | * | ||||||||||||
Investor | 1,000.00 | 898.60 | 0.15 | % | 0.57 | * | ||||||||||||||
Hypothetical 5% Return | ||||||||||||||||||||
Institutional | $ | 1,000.00 | $ | 1,024.79 | — | % | $– | ** | ||||||||||||
Investor | 1,000.00 | 1,024.05 | 0.15 | % | 0.75 | ** | ||||||||||||||
| * | Expenses are equal to the Fund’s annualized expense ratio multiplied by the average account value over the period, multiplied by 145/365 (to reflect the period from commencement to period end.) |
| ** | Expenses are equal to the Fund’s annualized expense ratio multiplied by the average account value over the period, multiplied by 181/365 (to reflect the one-half year period.) |
| *** | Commenced operations on December 6, 2021. |
109
CATHOLIC RESPONSIBLE INVESTMENTS
APRIL 30, 2022 (Unaudited)
| APPROVAL OF INVESTMENT ADVISORY AGREEMENT (Unaudited) |
Catholic Responsible Investments Funds
Pursuant to Section 15 of the Investment Company Act of 1940 (the “1940 Act”), the Funds’ advisory and sub-advisory agreements (the “Agreements”) must be approved: (i) by a vote of a majority of the shareholders of the Funds; and (ii) by the vote of a majority of the members of the Board of Trustees (the “Board” or the “Trustees”) of Catholic Responsible Investments Funds (the “Trust”) who are not parties to the Agreements or “interested persons” of any party thereto, as defined in the 1940 Act (the “Independent Trustees”), cast in person at a meeting called for the purpose of voting on such approval.
Board meetings were held on August 18, 2021 and November 16, 2021 to decide whether to approve the following Agreements for initial two-year terms (the “Meetings”):
| • | the advisory agreement between Christian Brothers Investment Services, Inc. (the “Adviser”) and the Trust, on behalf of the Funds; and |
| • | the sub-advisory agreements between the Adviser and certain sub-advisers (each, a “Sub-Adviser” and together, the “Sub-Advisers”), pursuant to which the Sub-Advisers serve as investment sub-advisers to the Funds, as set for the in the following table: |
| Sub-Adviser | Fund(s) | |
Brandywine Global Investment Management, LLC | Catholic Responsible Investments Opportunistic Bond Fund | |
| Catholic Responsible Investments Bond Fund | ||
Causeway Capital Management LLC | Catholic Responsible Investments International Equity Fund | |
Dodge & Cox | Catholic Responsible Investments Bond Fund | |
| Catholic Responsible Investments Multi-Style US Equity Fund | ||
Global Alpha Capital Management, Ltd. | Catholic Responsible Investments International Small-Cap Fund | |
Lazard Asset Management LLC | Catholic Responsible Investments International Small-Cap Fund | |
Longfellow Investment Management Co., LLC | Catholic Responsible Investments Short Duration Bond Fund | |
| Catholic Responsible Investments Opportunistic Bond Fund | ||
Mar Vista Investment Partners, LLC | Catholic Responsible Investments Multi-Style US Equity Fund | |
Principal Global Investors, LLC | Catholic Responsible Investments International Equity Fund | |
RhumbLine Advisers | Catholic Responsible Investments Equity Index Fund | |
| Catholic Responsible Investments Small-Cap Fund | ||
Sun Life Capital Management (U.S.) LLC | Catholic Responsible Investments Bond Fund | |
WCM Investment Management, LLC | Catholic Responsible Investments International Equity Fund | |
Wellington Management Company LLP | Catholic Responsible Investments Ultra Short Bond Fund | |
| Catholic Responsible Investments Multi-Style US Equity Fund | ||
The Meetings were held via videoconference in reliance on relief provided in orders issued by the Securities and Exchange Commission (“SEC”) on March 13, 2020, March 25, 2020 and June 19, 2020 from 1940 Act sections and rules requiring that certain votes of a company’s board of trustees be cast in person due to circumstances related to the current or potential effects of the COVID-19 pandemic. In preparation for the Meetings, the Trustees requested that the Adviser and the Sub-Advisers furnish information necessary to evaluate the terms of the Agreements. Prior to the Meetings, the Independent Trustees of the Funds met to review and discuss the information provided and submitted a request for additional information to the Adviser and certain Sub-Advisers, and information was provided in response to this request. The Trustees used this information, as well as other information that the Adviser, the Sub-Advisers and other service providers of the Funds presented or submitted to the Board at the Meetings, to help them decide whether to approve the Agreements for initial two-year terms.
110
CATHOLIC RESPONSIBLE INVESTMENTS
APRIL 30, 2022 (Unaudited)
Specifically, the Board requested and received written materials from the Adviser, the Sub-Advisers and other service providers of the Funds regarding: (i) the nature, extent and quality of the services to be provided by the Adviser and the Sub-Advisers; (ii) the Adviser’s and the Sub-Advisers’ investment management personnel; (iii) the Adviser’s and the Sub-Advisers’ operations and information about their financial condition, capitalization, profitability or financial viability to advise or sub-advise the Funds; (iv) the brokerage practices (including any soft dollar arrangements) of the Adviser and those Sub-Advisers whose brokerage practices were not previously considered by the Board; (v) the Adviser’s and Sub-Advisers’ investment strategies; (vi) the Funds’ proposed advisory fees to be paid to the Adviser and the Sub-Advisers and overall fees and operating expenses compared with peer groups of mutual funds; (vii) the Adviser’s and the Sub-Advisers’ compliance programs, including a description of material compliance matters and material compliance violations; (viii) the Adviser’s and the Sub-Advisers’ policies on and compliance procedures for personal securities transactions; (ix) the Adviser’s and the Sub-Advisers’ investment experience; (x) the Adviser’s rationale for introducing the Funds as well as the Funds’ proposed objectives and strategies; (x) the Adviser’s rationale for recommending the Sub-Advisers; and (xi) the Adviser’s and applicable Sub-Advisers’ performance in managing similar accounts.
Representatives from the Adviser and the Sub-Advisers, along with other Fund service providers, presented additional information and participated in question and answer sessions at the Meetings to help the Trustees evaluate the Adviser’s and the Sub-Advisers’ services, fees and other aspects of the Agreements. The Independent Trustees received advice from independent counsel and met in executive sessions outside the presence of Fund management, the Adviser and the Sub-Advisers.
At the Meetings, the Trustees, including all of the Independent Trustees, based on their evaluation of the information provided by the Adviser, the Sub-Advisers and other service providers of the Funds, approved the Agreements. In considering the approval of the Agreements, the Board considered various factors that they determined were relevant, including: (i) the nature, extent and quality of the services to be provided by the Adviser and the Sub-Advisers; and (ii) the fees to be paid to the Adviser (and to the Sub-Advisers out of the Adviser’s assets), as discussed in further detail below.
Nature, Extent and Quality of Services to be Provided by the Adviser and the Sub-Advisers
In considering the nature, extent and quality of the services to be provided by the Adviser and the Sub-Advisers, the Board reviewed the portfolio management services to be provided by the Adviser and the Sub-Advisers to the Funds, including the quality and continuity of the Adviser’s and the Sub-Advisers’ portfolio management personnel, the resources of the Adviser and the Sub-Advisers, and the Adviser’s and the Sub-Advisers’ compliance histories and compliance programs. The Trustees reviewed the terms of the proposed Agreements. The Trustees also reviewed the Adviser’s and the Sub-Advisers’ proposed investment and risk management approaches for the Funds. The Trustees considered that the Adviser would supervise and monitor the performance of the Sub-Advisers. The responses of the Adviser and the Sub-Advisers to a detailed series of questions which included, among other things, information about the investment advisory services to be provided by the Adviser and the Sub-Advisers to the Funds were available to the Board, as were the most recent investment adviser registration forms (“Form ADV”) for the Adviser and the Sub-Advisers, in the materials or through public disclosure.
The Trustees also considered other services to be provided to the Funds by the Adviser and the Sub-Advisers such as monitoring adherence to the Funds’ investment restrictions, and monitoring compliance with various Fund policies and procedures and with applicable securities laws and regulations. Based on the factors above, as well as those discussed below, the Board concluded, within the context of its full deliberations, that the nature, extent and quality of the services to be provided to the Funds by the Adviser and the Sub-Advisers would be satisfactory.
Costs of Advisory Services
In considering the advisory fees payable by the Funds to the Adviser, as well as the fees payable by the Adviser to the Sub-Advisers, the Trustees reviewed, among other things, a report of the proposed advisory fees to be paid to
111
CATHOLIC RESPONSIBLE INVESTMENTS
APRIL 30, 2022 (Unaudited)
the Adviser and the Sub-Advisers. The Trustees also reviewed reports prepared by the Funds’ administrator comparing the Funds’ net and gross expense ratios and advisory fees to those paid by peer groups of mutual funds as classified by Lipper, an independent provider of investment company data. The Trustees reviewed pro forma fee and expense information, as well as the management fees charged by the Adviser and applicable Sub-Advisers to other clients with comparable mandates. The Trustees considered any differences in management fees and took into account the respective demands, resources and complexity associated with the Funds and other client accounts as well as the extensive regulatory, compliance and tax regimes to which the Funds are subject. The Trustees also considered that the Adviser, not the Funds, would pay the Sub-Advisers pursuant to the sub-advisory agreements and that the fees payable to the Sub-Advisers would reflect arms-length negotiations between the Adviser and the Sub-Advisers. The Trustees evaluated both the fee that would be payable under the sub-advisory agreements and the portion of the fee under the advisory agreement that would be retained by the Adviser. The Board concluded, within the context of its full deliberations, that the advisory fees were reasonable in light of the nature and quality of the services expected to be rendered by the Adviser and the Sub-Advisers. The Board also considered the Adviser’s and the Sub-Advisers’ commitment to managing the Funds and the Adviser’s willingness to enter into expense limitation and fee waiver arrangements with the Funds.
Investment Performance, Profitability and Economies of Scale
Because the Funds were new and had not commenced operations, they did not yet have their own investment performance record, although the Board took into account the performance of the Adviser in managing the assets of the Funds’ predecessor funds and the performance of the Sub-Advisers in managing their respective sleeves of the Funds’ predecessor funds over various time periods. The Trustees determined that the performance of the Funds’ predecessor funds was satisfactory, or, where such performance was materially below their benchmarks, the Trustees were satisfied by the reasons for the underperformance and/or the steps taken by the Adviser and the Sub-Advisers in an effort to improve performance. Based on this information, the Board concluded, within the context of its full deliberations, that the investment results that the Adviser and the Sub-Advisers had been able to achieve for the Funds’ predecessor funds were sufficient to support approval of the Agreements.
Because the Funds were new, it was not possible to determine the profitability that the Adviser or the Sub-Advisers might achieve with respect to the Funds or the extent to which economies of scale would be realized by the Adviser or the Sub-Advisers as the assets of the Funds grow. Accordingly, the Trustees did not make any conclusions regarding the Adviser’s or the Sub-Advisers’ profitability, or the extent to which economies of scale would be realized by the Adviser or the Sub-Advisers as the assets of the Funds grow, but will do so during future considerations of the Agreements.
Approval of the Agreements
Based on the Board’s deliberations and its evaluation of the information described above and other factors and information it believed relevant in the exercise of its reasonable business judgment, the Board, including all of the Independent Trustees, with the assistance of Fund counsel and Independent Trustees’ counsel, unanimously concluded that the terms of the Agreements, including the fees to be paid thereunder, were fair and reasonable and agreed to approve the Agreements for initial terms of two years. In its deliberations, the Board did not identify any absence of information as material to its decision, or any particular factor (or conclusion with respect thereto) or single piece of information that was all-important, controlling or determinative of its decision, but considered all of the factors together, and each Trustee may have attributed different weights to the various factors (and conclusions with respect thereto) and information.
Board Considerations in Approving a New Sub-Advisory Agreement with RhumbLine Advisers for the Catholic Responsible Investments Equity Index Fund and Catholic Responsible Investments Small-Cap Fund
Pursuant to Section 15 of the Investment Company Act of 1940 (the “1940 Act”), the Funds’ sub-advisory agreements (the “Agreements”) must be approved: (i) by a vote of a majority of the shareholders of the Funds; and
112
CATHOLIC RESPONSIBLE INVESTMENTS
APRIL 30, 2022 (Unaudited)
(ii) by the vote of a majority of the members of the Board of Trustees (the “Board” or the “Trustees”) of Catholic Responsible Investments Funds (the “Trust”) who are not parties to the Agreements or “interested persons” of any party thereto, as defined in the 1940 Act (the “Independent Trustees”), cast in person at a meeting called for the purpose of voting on such approval.
On April 30, 2022, RhumbLine Adviser’s (“RhumbLine”) Chief Executive Officer, Wayne Owen retired. As part of RhumbLine’s succession planning, Wayne Owen, along with Denise D’Entremont and Kim McCant entered into an internal transaction pursuant to which Ms. D’Entremont acquired more than 25% of the ownership interests in RhumbLine (the “Transaction”). Under the 1940 Act, any person who owns more than 25% of the voting securities of a company is presumed to control such company. Accordingly, the Transaction may have been considered to have resulted in a change in control of RhumbLine under the 1940 Act, resulting in the assignment, and automatic termination, of the prior sub-advisory agreement between Christian Brothers Investment Services, Inc. (the “Adviser”) and RhumbLine with respect to the Funds (the “Prior RhumbLine Sub-Advisory Agreement”). Accordingly, in anticipation of the Transaction, a Board meeting was held on April 29, 2022 (the “April 2022 Meeting”) to decide whether to approve a new sub-advisory agreement between the Adviser and RhumbLine with respect to the Funds (the “New RhumbLine Sub-Advisory Agreement”).
The April 2022 Meeting was held via videoconference in reliance on relief provided in orders issued by the Securities and Exchange Commission (“SEC”) on March 13, 2020, March 25, 2020 and June 19, 2020 from 1940 Act sections and rules requiring that certain votes of a company’s board of trustees be cast in person due to circumstances related to the current or potential effects of the COVID-19 pandemic. In preparation for the April 2022 Meeting, the Trustees requested that the Adviser and RhumbLine furnish information necessary to evaluate the terms of the New RhumbLine Sub-Advisory Agreement. The Trustees used this information, as well as other information that the Adviser, RhumbLine and other service providers of the Funds presented or submitted to the Board at the April 2022 Meeting, as well as at the Board’s meetings held on August 17-18, 2021 and November 15-17, 2021 (the “2021 Meetings”), to help them decide whether to approve the New RhumbLine Sub-Advisory Agreement for an initial two-year term.
Specifically, the Board requested and received written materials (or took into account written materials received at the 2021 Meetings) from the Adviser, RhumbLine and other service providers of the Funds regarding, among other things: (i) the terms, conditions, and expected timing of the Transaction, and the reasons that RhumbLine was undergoing the Transaction; (ii) the nature, extent and quality of the services to be provided by RhumbLine; (iii) RhumbLine’s operations and financial condition; (iv) RhumbLine’s brokerage practices (including any soft dollar arrangements) and investment strategies; (v) the Funds’ proposed sub-advisory fee to be paid to the Adviser; (vi) RhumbLine’s compliance program, including a description of material compliance matters and material compliance violations; (vii) RhumbLine’s policies on and compliance procedures for personal securities transactions; (viii) RhumbLine’s investment experience; and (ix) RhumbLine’s investment management personnel and the Funds’ performance attributable to RhumbLine.
Representatives from the Adviser then presented additional information and participated in question and answer sessions at the April 2022 Meeting to help the Trustees evaluate RhumbLine’s services, fee and other aspects of the New RhumbLine Sub-Advisory Agreement.
Based on their evaluation of the information provided by the Adviser and RhumbLine, the Trustees, including all of the trustees who are not parties to the New RhumbLine Sub-Advisory Agreement nor are considered “interested persons” (as such term is defined in the 1940 Act) of any party to the New RhumbLine Sub-Advisory Agreement (the “Independent Trustees”), voting separately, approved the New RhumbLine Sub-Advisory Agreement at the April 2022 Meeting. In considering the approval of the New RhumbLine Sub-Advisory Agreement, the Board considered various factors that they determined were relevant, including: (i) the nature, extent and quality of the services to be provided by RhumbLine; (ii) the investment performance of the Funds and RhumbLine; and (iii) the fees to be paid to RhumbLine from the Adviser, as discussed in further detail below. The Board also determined
113
CATHOLIC RESPONSIBLE INVESTMENTS
APRIL 30, 2022 (Unaudited)
that it was reasonable to take into account the conclusions the Board made, and the information provided in support thereof, when considering and evaluating its recent approval of the Prior RhumbLine Sub-Advisory Agreement as part of its considerations to approve the New RhumbLine Sub-Advisory Agreement.
Nature, Extent and Quality of Services Provided by RhumbLine
In considering the nature, extent and quality of the services to be provided by RhumbLine, the Board reviewed the portfolio management services to be provided by RhumbLine to the Funds, including the quality of the continuing portfolio management personnel, the resources of RhumbLine and RhumbLine’s compliance history and compliance program. The Trustees reviewed the terms of the proposed New RhumbLine Sub-Advisory Agreement, and noted that the terms of the New RhumbLine Sub-Advisory Agreement were identical to those of the Prior RhumbLine Sub-Advisory Agreement, except for the date. The Trustees also reviewed RhumbLine’s proposed investment and risk management approaches for the Funds. The Trustees considered that the Adviser would supervise and monitor the performance of RhumbLine. RhumbLine provided the Board with a response to a detailed series of questions which included, among other things, information about the investment advisory services to be provided by RhumbLine to the Funds. In addition, the Board considered representations from RhumbLine that the Transaction was not expected to result in any material changes to the nature, extent and quality of the services to be provided to the Funds, and that the portfolio managers of the Funds were not expected to change in connection with the Transaction.
When considering the recent approval of the Prior RhumbLine Sub-Advisory Agreement, the Trustees also considered other services to be provided to the Funds by RhumbLine such as selecting broker-dealers for executing portfolio transactions, monitoring adherence to the Funds’ investment restrictions, and monitoring compliance with various Fund policies and procedures and with applicable securities laws and regulations. Based on the factors above, as well as those discussed below, the Board concluded, within the context of its full deliberations, that the nature, extent and quality of the services to be provided to the Funds by RhumbLine would be satisfactory.
Investment Performance of RhumbLine
The Board was provided with reports at the 2021 Meetings regarding the performance of the Funds’ predecessor funds, and RhumbLine’s contribution thereto, over various time periods. The Trustees determined to take these reports into account and determined that RhumbLine’s performance was satisfactory. Based on this information and the representation that the portfolio managers of the Funds were not expected to change in connection with the Transaction, the Board concluded, within the context of its full deliberations, that the investment results that RhumbLine had been able to achieve for the Funds’ predecessor funds were sufficient to support approval of the New RhumbLine Sub-Advisory Agreement.
Costs of Advisory Services
In connection with the Board’s evaluation of the sub-advisory fee payable by the Adviser to RhumbLine when considering the approval of the Prior RhumbLine Sub-Advisory Agreement, the Trustees considered, among other things, information about the proposed sub-advisory fee to be paid to RhumbLine. The Trustees also reviewed the management fees charged by RhumbLine to other clients with comparable mandates. The Trustees considered any differences in management fees and took into account the respective demands, resources and complexity associated with the Funds and other client accounts as well as the extensive regulatory, compliance and tax regimes to which the Funds are subject. When considering the New RhumbLine Sub-Advisory Agreement, the Trustees also considered that the fee payable to RhumbLine under the New RhumbLine Sub-Advisory Agreement would be the same as the fee paid to RhumbLine under the Prior RhumbLine Sub-Advisory Agreement. The Board concluded, within the context of its full deliberations, that the sub-advisory fee was reasonable in light of the nature and quality of the services expected to be rendered by RhumbLine.
114
CATHOLIC RESPONSIBLE INVESTMENTS
APRIL 30, 2022 (Unaudited)
Approval of the New RhumbLine Sub-Advisory Agreement
Based on the Board’s deliberations and its evaluation of the information described above and other factors and information it believed relevant in the exercise of its reasonable business judgment, the Board, including all of the Independent Trustees, with the assistance of Fund counsel and Independent Trustees’ counsel, unanimously concluded that the terms of the New RhumbLine Sub-Advisory Agreement, including the fee to be paid thereunder, were fair and reasonable and agreed to approve the New RhumbLine Sub-Advisory Agreement for an initial term of two years. In its deliberations, the Board did not identify any absence of information material to its decision, or any particular factor (or conclusion with respect thereto) or single piece of information that was all-important, controlling or determinative of its decision, but considered all of the factors together, and each Trustee may have attributed different weights to the various factors (and conclusions with respect thereto) and information.
115
[THIS PAGE INTENTIONALLY LEFT BLANK]
[THIS PAGE INTENTIONALLY LEFT BLANK]
Catholic Responsible Investments
Investment Adviser:
Christian Brothers Investment Services, Inc.
125 S. Wacker Drive
Suite 2400
Chicago, Illinois 60606
Administrator:
SEI Investments Distribution Co.
One Freedom Valley Drive
Oaks, Pennsylvania 19456
Distributor:
SEI Investments Distribution Co.
One Freedom Valley Drive
Oaks, Pennsylvania 19456
Legal Counsel:
SEI Investments Distribution Co.
One Freedom Valley Drive
Oaks, Pennsylvania 19456
This information must be preceded or accompanied by a current prospectus for the Funds described.
CRI-SA-001-0100
| Item 2. | Code of Ethics. |
Not required for semi-annual report.
| Item 3. | Audit Committee Financial Expert. |
Not required for semi-annual report.
| Item 4. | Principal Accountant Fees and Services. |
Not required for semi-annual report.
| Item 5. | Audit Committee of Listed Registrants. |
Not applicable to open-end management investment companies.
| Item 6. | Schedule of Investments. |
Schedule of Investments is included as part of the Report to Shareholders filed under Item 1 of this form.
| Item 7. | Disclosure of Proxy Voting Policies and Procedures for Closed-End Management Investment Companies. |
Not applicable to open-end management investment companies.
| Item 8. | Portfolio Managers of Closed-End Management Investment Companies. |
Not applicable to open-end management investment companies.
| Item 9. | Purchases of Equity Securities by Closed-End Management Investment Company and Affiliated Purchasers. |
Not applicable to open-end management investment companies.
| Item 10. | Submission of Matters to a Vote of Security Holders. |
There have been no material changes to the registrant’s procedures by which shareholders may recommend nominees to the registrant’s board of trustees during the period covered by the report.
| Item 11. | Controls and Procedures. |
(a) The registrant’s principal executive and principal financial officers, or persons performing similar functions, have concluded that the registrant’s disclosure controls and procedures, as defined in Rule 30a-3(c) under the Act (17 CFR § 270.30a-3(c)) as of a date within 90 days of the filing date of the report, are effective based on the evaluation of these controls and procedures required by Rule 30a-3(b) under the Act (17 CFR § 270.30a-3(b)) and Rules 13a-15(b) or 15d-15(b) under the Exchange Act (17 CFR § 270.30a-15(b) or §240.15d-15(b)).
(b) There were no changes in the registrant’s internal control over financial reporting (as defined in Rule 30a-3(d) under the Act (17CFR § 270.30a-3(d)) that occurred during the period covered by this report that have materially affected, or are reasonably likely to materially affect, the registrant’s internal control over financial reporting.
| Item 12. | Disclosure of Securities Lending Activities for Closed-End Management Investment Companies. |
Not applicable to open-end management investment companies.
| Item 13. | Exhibits. |
(a)(1) Not required for semi-annual report.
SIGNATURES
Pursuant to the requirements of the Securities Exchange Act of 1934 and the Investment Company Act of 1940, the registrant has duly caused this report to be signed on its behalf by the undersigned, thereunto duly authorized.
(Registrant) | Catholic Responsible Investments Funds | |
By: | /s/ Michael Beattie | |
Michael Beattie, Trustee and President | ||
Date: | July 8, 2022 | |
Pursuant to the requirements of the Securities Exchange Act of 1934 and the Investment Company Act of 1940, this report has been signed below by the following persons on behalf of the registrant and in the capacities and on the dates indicated.
By: | /s/ Michael Beattie | |
Michael Beattie, Trustee and President | ||
Date: | July 8, 2022 | |
By: | /s/ Andrew Metzger | |
Andrew Metzger, Treasurer, Controller, and CFO | ||
Date: | July 8, 2022 | |