UNITED STATES
SECURITIES AND EXCHANGE COMMISSION
WASHINGTON, D.C. 20549
FORM N-CSR
CERTIFIED SHAREHOLDER REPORT OF REGISTERED
MANAGEMENT INVESTMENT COMPANIES
Investment Company Act file number: 811-23742
CONNORS FUNDS
(Exact name of registrant as specified in charter)
| 1210 Broadcasting Road, Suite 200 Wyomissing, Pennsylvania 19610 | ||
| (Address of principal executive offices) | (Zip code) | |
Peter Connors, President
c/o Connors Investor Services, Inc.
1210 Broadcasting Road, Suite 200
Wyomissing, Pennsylvania 19610
(Name and address of agent for service)
With copy to: Jeffrey T. Skinner, Esq.
Kilpatrick Townsend & Stockton LLP
1001 West Fourth Street
Winston-Salem, NC 27101
| Registrant’s telephone number, including area code: | (610) 376-7418 |
| Date of fiscal year end: | November 30 | |
| Date of reporting period: | May 31, 2024 |
Item 1. Reports to Stockholders.
(a)
Connors Hedged Equity Fund Institutional Class (CVRDX) Semi-Annual Shareholder Report - May 31, 2024 |
Fund Overview This contains important information about Connors Hedged Equity Fund for the period of December 1, 2023 to May 31, 2024. You can find additional information about the Fund at www.connorsinvestor.com/mutual-fund. You can also request this information by contacting us at (833) 601-2676. |
What were the Fund’s costs for the last six months?
(based on a hypothetical $10,000 investment)
| Class Name | Costs of a $10,000 investment | Costs paid as a percentage of a $10,000 investment | ||
| Institutional Class | $113 | 1.13% |
How did the Fund perform during the reporting period? Advancements in generative AI have driven a tech spending cycle with promise of increased automation and improved productivity. Many companies are embracing the new technology to improve sales and lower costs. As a result, market returns have been concentrated in those companies enabling AI. Cyclicals continue to trade off of inflation and Fed policy. Inflation remains sticky in areas such as housing and services causing the Fed to be deliberate in cutting rates. Market participation became more concentration as inflation proved more stubborn and thus reducing the likelihood of multiple rate cuts. The portfolio was overweight Materials (4.4% weight), Industrials (10.3%), Consumer Staples (8.7%), Financials (13.3%) and Communications (9.7%) and underweight Energy (3.5%), Consumer Discretionary (8.2%), Healthcare (10.9%), Technology (27.5%), Utilities (0%) and Real Estate (1.9%). During the first half we increased sector weights in Technology and Communications given the “higher for longer” rate policy and our desire for greater exposure to secular growth. We reduced exposure in Healthcare, Energy and Consumer Discretionary as inflation, higher rates and slowing wage growth negatively impacted consumer spending and demand for energy. Given strong market performance, several names were called away. We rolled a number of positions for credits or for debits where it made sense. In both cases, we allow time premium to decay and buy back intrinsic (i.e. rebuy the stock). In such cases, buying back the in-the-money option allows for additional upside and avoids capital gains. We continued to use any pullbacks to add to stock positions particularly after names have been called away. We took advantage of spikes in the stock prices to write additional call options to drive income as well as to add put protection as market spikes reduce the cost of insurance. We believe that volatility could increase from current levels which should benefit hedged equity strategies. |
| How has the Fund performed since inception? | ||
| Total Return Based on $25,000 Investment | ||
 | ||
| Years | Years | Connors Hedged Equity Fund - Institutional Class | S&P 500® Index | CBOE S&P 500® BuyWrite Index |
|---|---|---|---|---|
| 1/19/22 | 1/19/22 | 25,000 | 25,000 | 25,000 |
| 5/31/22 | 5/31/22 | 24,000 | 22,290 | 23,592 |
| 5/31/23 | 5/31/23 | 24,577 | 23,590 | 24,466 |
| 5/31/24 | 5/31/24 | 29,795 | 30,239 | 26,732 |
| Average Annual Total Returns | ||||
| 1 Year | Annualized Since Inception (1/19/2022) | |||
| Connors Hedged Equity Fund - Institutional Class | 21.23% | 7.71% | ||
| S&P 500® Index | 28.19% | 8.39% | ||
| CBOE S&P 500® BuyWrite Index | 9.26% | 2.88% | ||
The Fund’s past performance is not a good predictor of how the Fund will perform in the future. The graph and table do not reflect the deduction of taxes that a shareholder would pay on fund distributions or redemption of fund shares.
| Fund Statistics | ||
| Net Assets | $31,921,082 | |
| Number of Portfolio Holdings | 129 | |
| Advisory Fee | $113,755 | |
| Portfolio turnover (six months) | 32% | |
| Sharpe ratio | 0.33 | |
| Beta | 0.65 | |
| Standard Deviation | 12.36% | |
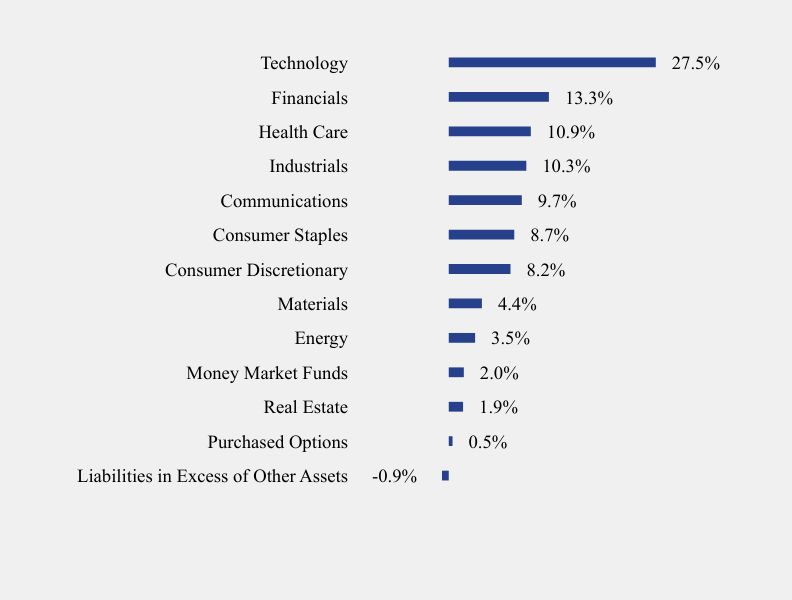
What did the Fund invest in?
| Sector Weighting (% of net assets) |
 |
| Asset Weighting (% of total investments) |
|

| Technology | 27.5% |
| Financials | 13.3% |
| Health Care | 10.9% |
| Industrials | 10.3% |
| Communications | 9.7% |
| Consumer Staples | 8.7% |
| Consumer Discretionary | 8.2% |
| Meterials | 4.4% |
| Energy | 3.5% |
| Money Market Funds | 2.0% |
| Real Estate | 1.9% |
| Purchased Option | 0.5% |
| Laibilities in Excess of Other Assets | -0.9% |
| Common Stocks | 97.5% |
| Money Market Funds | 2.0% |
| Purchased Option | 0.5% |
| Top 10 Holdings (% of net assets) | ||
| Apple, Inc. | ||
| Microsoft Corp. | ||
| Alphabet, Inc. - Class A | ||
| Amazon.com, Inc. | ||
| NVIDIA Corp. | ||
| Morgan Stanley | ||
| RTX Corp. | ||
| Bank of America Corp. | ||
| Palo Alto Networks, Inc. | ||
| Eli Lilly & Co. | ||
Material Fund Changes
No material changes occured during the period ended May 31, 2024.
Connors Hedged Equity Fund - Institutional Class (CVRDX) Semi-Annual Shareholder Report - May 31, 2024
Where can I find additional information about the Fund? Additional information is available on the Fund’s website (www.connorsinvestor.com/mutual-fund), including its:
| ||
| ● | Prospectus | |
| ● | Financial information | |
| ● | Holdings | |
| ● | Proxy voting information | |
TSR-SAR 053124-CVRDX
Item 2. Code of Ethics.
Not Applicable – disclosed with annual report
Item 3. Audit Committee Financial Expert.
Not Applicable – disclosed with annual report
Item 4. Principal Accountant Fees and Services.
Not Applicable – disclosed with annual report
Item 5. Audit Committee of Listed Registrants.
Not Applicable – disclosed with annual report
Item 6. Investments.
The Registrant’s schedule of investments in unaffiliated issuers is included in the Financial Statements under Item 7 of this form.
Item 7. Financial Statements and Financial Highlights for Open-End Management Investment Companies.
(a)
![]()
Connors Hedged Equity Fund
Financial Statements
May 31, 2024
Fund Adviser:
Connors Investor Services, Inc.
1210 Broadcasting Road, Suite 200
Wyomissing, PA 19610
Connors Hedged Equity Fund
Schedule of Investments
May 31, 2024 - (Unaudited)
| COMMON STOCKS — 98.39% | Shares | Fair Value | ||||||
| Communications — 9.65% | ||||||||
| Alphabet, Inc., Class A(a)(b) | 7,180 | $ | 1,238,550 | |||||
| Meta Platforms, Inc., Class A | 1,450 | 676,903 | ||||||
| Verizon Communications, Inc.(b) | 15,700 | 646,055 | ||||||
| Walt Disney Co. (The) | 5,000 | 519,550 | ||||||
| 3,081,058 | ||||||||
| Consumer Discretionary — 8.24% | ||||||||
| Amazon.com, Inc.(a)(b) | 6,720 | 1,185,677 | ||||||
| Lowe’s Companies, Inc. | 3,270 | 723,618 | ||||||
| TJX Companies, Inc. (The)(b) | 7,000 | 721,700 | ||||||
| 2,630,995 | ||||||||
| Consumer Staples — 8.65% | ||||||||
| Coca-Cola Co. (The)(b) | 9,035 | 568,573 | ||||||
| Costco Wholesale Corp.(b) | 815 | 660,060 | ||||||
| Hershey Co. (The)(b) | 1,500 | 296,745 | ||||||
| PepsiCo, Inc.(b) | 3,000 | 518,700 | ||||||
| Target Corp.(b) | 4,600 | 718,336 | ||||||
| 2,762,414 | ||||||||
| Energy — 3.51% | ||||||||
| ConocoPhillips(b) | 4,860 | 566,093 | ||||||
| Schlumberger Ltd.(b) | 12,100 | 555,269 | ||||||
| 1,121,362 | ||||||||
| Financials — 13.33% | ||||||||
| American Express Co.(b) | 2,590 | 621,600 | ||||||
| Bank of America Corp.(b) | 20,600 | 823,794 | ||||||
| Chubb Ltd.(b) | 2,470 | 668,926 | ||||||
| JPMorgan Chase & Co.(b) | 3,300 | 668,679 | ||||||
| Morgan Stanley(b) | 8,675 | 848,762 | ||||||
| Wells Fargo & Co.(b) | 10,385 | 622,269 | ||||||
| 4,254,030 | ||||||||
| Health Care — 10.89% | ||||||||
| Abbott Laboratories | 3,120 | 318,833 | ||||||
| AbbVie, Inc.(b) | 3,700 | 596,588 | ||||||
| Eli Lilly & Co.(b) | 965 | 791,628 | ||||||
| Merck & Co., Inc.(b) | 4,795 | 601,965 | ||||||
| Stryker Corp.(b) | 1,750 | 596,907 | ||||||
| Thermo Fisher Scientific, Inc.(b) | 1,005 | 570,820 | ||||||
| 3,476,741 | ||||||||
| Industrials — 10.26% | ||||||||
| Eaton Corp. PLC(b) | 1,875 | 624,094 | ||||||
| Emerson Electric Co.(b) | 5,800 | 650,528 | ||||||
| Honeywell International, Inc.(b) | 2,300 | 465,037 | ||||||
| Quanta Services, Inc.(b) | 1,400 | 386,316 | ||||||
| RTX Corp.(b) | 7,660 | 825,824 | ||||||
| Stanley Black & Decker, Inc.(b) | 3,700 | 322,529 | ||||||
| 3,274,328 | ||||||||
See accompanying notes which are an integral part of these financial statements.
1
Connors Hedged Equity Fund
Schedule of Investments (continued)
May 31, 2024 - (Unaudited)
| COMMON STOCKS — 98.39% - continued | Shares | Fair Value | ||||||
| Materials — 4.36% | ||||||||
| DuPont de Nemours, Inc.(b) | 8,970 | $ | 736,975 | |||||
| Linde PLC(b) | 1,500 | 653,280 | ||||||
| 1,390,255 | ||||||||
| Real Estate — 1.95% | ||||||||
| Welltower, Inc.(b) | 6,000 | 622,020 | ||||||
| Technology — 27.55% | ||||||||
| Advanced Micro Devices, Inc.(a)(b) | 4,425 | 738,532 | ||||||
| Apple, Inc.(b) | 9,360 | 1,799,460 | ||||||
| Microsoft Corp.(b) | 4,200 | 1,743,546 | ||||||
| NVIDIA Corp.(b) | 960 | 1,052,477 | ||||||
| Oracle Corp.(b) | 5,910 | 692,593 | ||||||
| Palo Alto Networks, Inc.(a)(b) | 2,750 | 811,002 | ||||||
| Salesforce.com, Inc.(b) | 2,400 | 562,656 | ||||||
| ServiceNow, Inc.(a)(b) | 400 | 262,772 | ||||||
| Tyler Technologies, Inc.(a)(b) | 1,100 | 528,396 | ||||||
| Visa, Inc., Class A(b) | 2,210 | 602,137 | ||||||
| 8,793,571 | ||||||||
| Total Common Stocks (Cost $26,475,009) | 31,406,774 | |||||||
| Description | Number of Contracts | Notional Amount | Exercise Price | Expiration Date | Fair Value | |||||||||||||
| PUT OPTIONS PURCHASED — 0.47% | ||||||||||||||||||
| S&P 500 Index | 15 | $ | 7,841,265 | $ | 5,150.00 | July 2024 | $ | 53,250 | ||||||||||
| S&P 500 Index | 15 | 7,841,265 | 5,200.00 | August 2024 | 95,475 | |||||||||||||
| Total Purchased Put Options (Cost $188,637) | 148,725 | |||||||||||||||||
| Total Purchased Options (Cost $188,637) | 148,725 | |||||||||||||||||
| MONEY MARKET FUNDS - 2.03% | ||||||||||||||||||
| First American Government Obligations Fund - Class X, 5.23%(c) | 649,107 | 649,107 | ||||||||||||||||
| Total Money Market Funds (Cost $649,107) | 649,107 | |||||||||||||||||
| Total Investments — 100.89% (Cost $27,312,753) | 32,204,606 | |||||||||||||||||
| Liabilities in Excess of Other Assets — (0.89)% | (283,524 | ) | ||||||||||||||||
| NET ASSETS — 100.00% | $ | 31,921,082 | ||||||||||||||||
| (a) | Non-income producing security. |
| (b) | Securities, or a portion thereof, have been pledged as collateral on written options. The total collateral pledged is $32,807,279. |
| (c) | Rate disclosed is the seven day effective yield as of May 31, 2024. |
See accompanying notes which are an integral part of these financial statements.
2
Connors Hedged Equity Fund
Schedule of Open Written Option Contracts
May 31, 2024 - (Unaudited)
| Number of | Notional | Exercise | Expiration | |||||||||||||||
| Description | Contracts | Amount | Price | Date | Fair Value | |||||||||||||
| WRITTEN OPTIONS (1.20)% | ||||||||||||||||||
| WRITTEN CALL OPTIONS (1.08)% | ||||||||||||||||||
| AbbVie, Inc. | (22) | $ | (354,728 | ) | $ | 185.00 | August 2024 | $ | (649 | ) | ||||||||
| Advanced Micro Devices, Inc. | (10) | (166,900 | ) | 260.00 | June 2024 | (15 | ) | |||||||||||
| Advanced Micro Devices, Inc. | (4) | (66,760 | ) | 190.00 | July 2024 | (1,300 | ) | |||||||||||
| Advanced Micro Devices, Inc. | (7) | (116,830 | ) | 200.00 | August 2024 | (3,325 | ) | |||||||||||
| Advanced Micro Devices, Inc. | (6) | (100,140 | ) | 210.00 | August 2024 | (1,830 | ) | |||||||||||
| Alphabet, Inc., Class A | (4) | (69,000 | ) | 185.00 | August 2024 | (1,670 | ) | |||||||||||
| Alphabet, Inc., Class A | (6) | (103,500 | ) | 180.00 | September 2024 | (4,620 | ) | |||||||||||
| Alphabet, Inc., Class A | (20) | (345,000 | ) | 185.00 | September 2024 | (11,749 | ) | |||||||||||
| Alphabet, Inc., Class A | (18) | (310,500 | ) | 190.00 | September 2024 | (7,920 | ) | |||||||||||
| Amazon.com, Inc. | (4) | (70,576 | ) | 210.00 | August 2024 | (610 | ) | |||||||||||
| Amazon.com, Inc. | (23) | (405,812 | ) | 205.00 | September 2024 | (7,303 | ) | |||||||||||
| Amazon.com, Inc. | (13) | (229,372 | ) | 210.00 | September 2024 | (3,133 | ) | |||||||||||
| American Express Co. | (18) | (432,000 | ) | 250.00 | June 2024 | (2,493 | ) | |||||||||||
| Apple, Inc. | (56) | (1,076,600 | ) | 210.00 | August 2024 | (12,320 | ) | |||||||||||
| Bank America Corp. | (15) | (59,985 | ) | 40.00 | June 2024 | (1,125 | ) | |||||||||||
| Bank America Corp. | (12) | (47,988 | ) | 41.00 | June 2024 | (432 | ) | |||||||||||
| Bank America Corp. | (80) | (319,920 | ) | 39.00 | July 2024 | (14,840 | ) | |||||||||||
| Bank America Corp. | (15) | (59,985 | ) | 40.00 | August 2024 | (2,670 | ) | |||||||||||
| Chubb Ltd. | (2) | (54,164 | ) | 275.00 | June 2024 | (465 | ) | |||||||||||
| Chubb Ltd. | (13) | (352,066 | ) | 265.00 | August 2024 | (17,810 | ) | |||||||||||
| Coca-Cola Co. (The) | (55) | (346,115 | ) | 65.00 | August 2024 | (3,878 | ) | |||||||||||
| ConocoPhillips | (30) | (349,440 | ) | 130.00 | August 2024 | (2,640 | ) | |||||||||||
| Costco Wholesale Corp. | (5) | (404,945 | ) | 835.00 | July 2024 | (6,949 | ) | |||||||||||
| Dupont de Nemours, Inc. | (11) | (90,376 | ) | 82.50 | June 2024 | (1,513 | ) | |||||||||||
| Eaton Corp. PLC | (10) | (332,850 | ) | 350.00 | July 2024 | (5,700 | ) | |||||||||||
See accompanying notes which are an integral part of these financial statements.
3
Connors Hedged Equity Fund
Schedule of Open Written Option Contracts (continued)
May 31, 2024 - (Unaudited)
| Number of | Notional | Exercise | Expiration | |||||||||||||||
| Description | Contracts | Amount | Price | Date | Fair Value | |||||||||||||
| WRITTEN OPTIONS (1.20)% (continued) | ||||||||||||||||||
| WRITTEN CALL OPTIONS (1.08)% (continued) | ||||||||||||||||||
| Eaton Corp. PLC | (2) | $ | (66,570 | ) | $ | 370.00 | August 2024 | $ | (1,020 | ) | ||||||||
| Eli Lilly & Co. | (1) | (82,034 | ) | 790.00 | July 2024 | (5,283 | ) | |||||||||||
| Eli Lilly & Co. | (3) | (246,102 | ) | 750.00 | August 2024 | (28,432 | ) | |||||||||||
| Eli Lilly & Co. | (1) | (82,034 | ) | 770.00 | August 2024 | (8,037 | ) | |||||||||||
| Emerson Electric Co. | (5) | (56,080 | ) | 110.00 | June 2024 | (1,675 | ) | |||||||||||
| Emerson Electric Co. | (6) | (67,296 | ) | 115.00 | June 2024 | (465 | ) | |||||||||||
| Emerson Electric Co. | (6) | (67,296 | ) | 120.00 | September 2024 | (1,245 | ) | |||||||||||
| Emerson Electric Co. | (17) | (190,672 | ) | 125.00 | September 2024 | (1,445 | ) | |||||||||||
| Hershey Co. | (8) | (158,264 | ) | 230.00 | August 2024 | (680 | ) | |||||||||||
| Honeywell International, Inc. | (18) | (363,942 | ) | 220.00 | June 2024 | (180 | ) | |||||||||||
| JPMorgan Chase & Co. | (20) | (405,260 | ) | 200.00 | July 2024 | (16,150 | ) | |||||||||||
| Linde PLC | (6) | (261,312 | ) | 475.00 | July 2024 | (705 | ) | |||||||||||
| Linde PLC | (2) | (87,104 | ) | 470.00 | August 2024 | (750 | ) | |||||||||||
| Merck & Co., Inc. | (28) | (351,512 | ) | 140.00 | September 2024 | (5,600 | ) | |||||||||||
| Meta Platforms, Inc., Class A | (9) | (420,147 | ) | 540.00 | August 2024 | (8,235 | ) | |||||||||||
| Microsoft Corp. | (5) | (207,565 | ) | 440.00 | July 2024 | (1,800 | ) | |||||||||||
| Microsoft Corp. | (2) | (83,026 | ) | 430.00 | September 2024 | (3,230 | ) | |||||||||||
| Microsoft Corp. | (18) | (747,234 | ) | 440.00 | September 2024 | (22,094 | ) | |||||||||||
| Morgan Stanley | (37) | (362,008 | ) | 100.00 | June 2024 | (3,626 | ) | |||||||||||
| Morgan Stanley | (5) | (48,920 | ) | 105.00 | August 2024 | (780 | ) | |||||||||||
| Morgan Stanley | (10) | (97,840 | ) | 110.00 | September 2024 | (1,215 | ) | |||||||||||
| NVIDIA Corp. | (2) | (219,266 | ) | 1,020.00 | June 2024 | (19,470 | ) | |||||||||||
| NVIDIA Corp. | (1) | (109,633 | ) | 1,100.00 | July 2024 | (7,470 | ) | |||||||||||
| NVIDIA Corp. | (2) | (219,266 | ) | 1,130.00 | July 2024 | (11,880 | ) | |||||||||||
See accompanying notes which are an integral part of these financial statements.
4
Connors Hedged Equity Fund
Schedule of Open Written Option Contracts (continued)
May 31, 2024 - (Unaudited)
| Number of | Notional | Exercise | Expiration | |||||||||||||||
| Description | Contracts | Amount | Price | Date | Fair Value | |||||||||||||
| WRITTEN OPTIONS (1.20)% (continued) | ||||||||||||||||||
| WRITTEN CALL OPTIONS (1.08)% (continued) | ||||||||||||||||||
| Oracle Corp. | (22) | $ | (257,818 | ) | $ | 135.00 | June 2024 | $ | (1,155 | ) | ||||||||
| Oracle Corp. | (15) | (175,785 | ) | 145.00 | June 2024 | (420 | ) | |||||||||||
| Palo Alto Networks, Inc. | (15) | (442,365 | ) | 350.00 | June 2024 | (330 | ) | |||||||||||
| Palo Alto Networks, Inc. | (1) | (29,491 | ) | 340.00 | August 2024 | (510 | ) | |||||||||||
| PepsiCo, Inc. | (17) | (293,930 | ) | 185.00 | July 2024 | (978 | ) | |||||||||||
| Quanta Services, Inc. | (8) | (220,752 | ) | 310.00 | July 2024 | (1,260 | ) | |||||||||||
| RTX Corp. | (36) | (388,116 | ) | 110.00 | August 2024 | (10,296 | ) | |||||||||||
| RTX Corp. | (9) | (97,029 | ) | 110.00 | September 2024 | (3,285 | ) | |||||||||||
| Salesforce.com, Inc. | (5) | (117,220 | ) | 350.00 | June 2024 | (40 | ) | |||||||||||
| Salesforce.com, Inc. | (7) | (164,108 | ) | 310.00 | August 2024 | (175 | ) | |||||||||||
| Schlumberger Ltd. | (46) | (211,094 | ) | 60.00 | June 2024 | (138 | ) | |||||||||||
| ServiceNow, Inc. | (2) | (262,772 | ) | 880.00 | August 2024 | (325 | ) | |||||||||||
| Stanley Black & Decker, Inc. | (19) | (165,623 | ) | 110.00 | July 2024 | (190 | ) | |||||||||||
| Stryker Corp. | (7) | (238,763 | ) | 370.00 | June 2024 | (193 | ) | |||||||||||
| Stryker Corp. | (3) | (102,327 | ) | 370.00 | September 2024 | (1,425 | ) | |||||||||||
| Target Corp. | (24) | (374,784 | ) | 180.00 | July 2024 | (492 | ) | |||||||||||
| Thermo Fisher Scientific, Inc. | (4) | (227,192 | ) | 620.00 | June 2024 | (690 | ) | |||||||||||
| Thermo Fisher Scientific, Inc. | (2) | (113,596 | ) | 630.00 | June 2024 | (150 | ) | |||||||||||
| TJX Companies Inc. (The) | (36) | (371,160 | ) | 100.00 | June 2024 | (15,210 | ) | |||||||||||
| TJX Companies Inc. (The) | (2) | (20,620 | ) | 105.00 | June 2024 | (153 | ) | |||||||||||
| Tyler Technologies, Inc. | (6) | (576,432 | ) | 460.00 | June 2024 | (13,830 | ) | |||||||||||
| Verizon Communications, Inc. | (30) | (123,450 | ) | 43.00 | July 2024 | (930 | ) | |||||||||||
| Visa, Inc., Class A | (11) | (299,706 | ) | 290.00 | June 2024 | (220 | ) | |||||||||||
| Visa, Inc., Class A | (2) | (54,492 | ) | 290.00 | July 2024 | (216 | ) | |||||||||||
| Walt Disney Co. (The) | (13) | (135,083 | ) | 130.00 | June 2024 | (46 | ) | |||||||||||
| Walt Disney Co. (The) | (17) | (176,647 | ) | 130.00 | August 2024 | (485 | ) | |||||||||||
| Wells Fargo & Co. | (10) | (59,920 | ) | 65.00 | August 2024 | (860 | ) | |||||||||||
| Wells Fargo & Co. | (25) | (149,800 | ) | 67.50 | August 2024 | (1,113 | ) | |||||||||||
| Wells Fargo & Co. | (25) | (149,800 | ) | 65.00 | October 2024 | (4,625 | ) | |||||||||||
See accompanying notes which are an integral part of these financial statements.
5
Connors Hedged Equity Fund
Schedule of Open Written Option Contracts (continued)
May 31, 2024 - (Unaudited)
| Number of | Notional | Exercise | Expiration | |||||||||||||||
| Description | Contracts | Amount | Price | Date | Fair Value | |||||||||||||
| WRITTEN OPTIONS (1.20)% (continued) | ||||||||||||||||||
| WRITTEN CALL OPTIONS (1.08)% (continued) | ||||||||||||||||||
| Welltower, Inc. | (35) | $ | (362,845 | ) | $ | 100.00 | June 2024 | $ | (16,450 | ) | ||||||||
| Total Written Call Options (Premiums Received $348,836) | (344,616 | ) | ||||||||||||||||
| WRITTEN PUT OPTIONS (0.12)% | ||||||||||||||||||
| S&P 500 Index | (15) | (7,841,265 | ) | 4,750.00 | July 2024 | (11,625 | ) | |||||||||||
| S&P 500 Index | (15) | (7,841,265 | ) | 4,800.00 | August 2024 | (26,250 | ) | |||||||||||
| Total Written Put Options (Premiums Received $49,992) | (37,875 | ) | ||||||||||||||||
| Total Written Options (Premiums Received $398,828) | $ | (382,491 | ) | |||||||||||||||
See accompanying notes which are an integral part of these financial statements.
6
Connors Hedged Equity Fund
Statement of Assets and Liabilities
May 31, 2024 - (Unaudited)
| Assets | ||||
| Investments in securities at fair value (cost $27,312,753) | $ | 32,204,606 | ||
| Receivable for fund shares sold | 79,970 | |||
| Dividends and interest receivable | 38,884 | |||
| Prepaid expenses | 17,886 | |||
| Total Assets | 32,341,346 | |||
| Liabilities | ||||
| Written Options, at fair value (premium received $398,828) | 382,491 | |||
| Payable to Adviser (Note 4) | 3,353 | |||
| Payable to Administrator | 9,130 | |||
| Administrative service fees payable | 270 | |||
| Payable to trustees | 7,500 | |||
| Other accrued expenses | 17,520 | |||
| Total Liabilities | 420,264 | |||
| Net Assets | $ | 31,921,082 | ||
| Net Assets consist of: | ||||
| Paid-in capital | $ | 26,901,177 | ||
| Accumulated earnings | 5,019,905 | |||
| Net Assets | $ | 31,921,082 | ||
| Institutional Class | ||||
| Shares outstanding (unlimited number of shares authorized, no par value) | 2,710,676 | |||
| Net asset value, offering and redemption price per share | $ | 11.78 |
See accompanying notes which are an integral part of these financial statements.
7
Connors Hedged Equity Fund
Statement of Operations
For the Six Months ended May 31, 2024 - (Unaudited)
| Investment Income | ||||
| Dividend income | $ | 234,368 | ||
| Total investment income | 234,368 | |||
| Expenses | ||||
| Investment Adviser fees | 113,755 | |||
| Administration fees | 38,693 | |||
| Legal fees | 21,688 | |||
| Compliance fees | 15,001 | |||
| Registration expenses | 8,930 | |||
| Transfer agent fees | 8,347 | |||
| Audit and tax preparation fees | 7,976 | |||
| Trustee fees | 7,500 | |||
| Printing and postage expenses | 6,252 | |||
| Custodian fees | 4,901 | |||
| Administrative service fees | 2,959 | |||
| Miscellaneous expense | 22,647 | |||
| Total expenses | 258,649 | |||
| Fees contractually waived and expenses reimbursed by Adviser | (97,283 | ) | ||
| Net operating expenses | 161,366 | |||
| Net investment income | 73,002 | |||
| Net Realized and Change in Unrealized Gain (Loss) on Investments | ||||
| Net realized gain (loss) on: | ||||
| Investment securities | 889,180 | |||
| Written options | 162,319 | |||
| Purchased options | (461,912 | ) | ||
| Net change in unrealized appreciation on: | ||||
| Investment securities | 2,575,385 | |||
| Written options | 27,640 | |||
| Purchased options | 17,308 | |||
| Net realized and change in unrealized gain on investments securities and options | 3,209,920 | |||
| Net increase in net assets resulting from operations | $ | 3,282,922 |
See accompanying notes which are an integral part of these financial statements.
8
Connors Hedged Equity Fund
Statements of Changes in Net Assets
| For the Six Months Ended May 31, 2024 | For the Year Ended November 30, 2023 | |||||||
| (Unaudited) | ||||||||
| Increase (Decrease) in Net Assets due to: | ||||||||
| Operations | ||||||||
| Net investment income | $ | 73,002 | $ | 168,190 | ||||
| Net realized gain (loss) on investment securities and options | 589,587 | (384,942 | ) | |||||
| Net change in unrealized appreciation of investment securities and options | 2,620,333 | 1,846,034 | ||||||
| Net increase in net assets resulting from operations | 3,282,922 | 1,629,282 | ||||||
| Distributions to shareholders from Earnings | (169,282 | ) | (78,058 | ) | ||||
| Total distributions | (169,282 | ) | (78,058 | ) | ||||
| Capital Transactions – Institutional Class: | ||||||||
| Proceeds from shares sold | 4,192,403 | 8,913,853 | ||||||
| Reinvestment of distributions | 169,282 | 78,058 | ||||||
| Amount paid for shares redeemed | (802,348 | ) | (281,956 | ) | ||||
| Net increase in net assets resulting from capital transactions | 3,559,337 | 8,709,955 | ||||||
| Total Increase in Net Assets | 6,672,977 | 10,261,179 | ||||||
| Net Assets | ||||||||
| Beginning of period | 25,248,105 | 14,986,926 | ||||||
| End of period | $ | 31,921,082 | $ | 25,248,105 | ||||
| Share Transactions – Institutional Class: | ||||||||
| Shares sold | 365,284 | 899,210 | ||||||
| Shares issued in reinvestment of distributions | 15,602 | 8,217 | ||||||
| Shares redeemed | (69,195 | ) | (27,938 | ) | ||||
| Net increase in shares | 311,691 | 879,489 | ||||||
See accompanying notes which are an integral part of these financial statements.
9
Connors Hedged Equity Fund - Institutional Class
Financial Highlights
(For a share outstanding during each period)
| For the Six Months Ended May 31, 2024 | For the Year Ended November 30, 2023 | For the Period Ended November 30, 2022(a) | ||||||||||
| (Unaudited) | ||||||||||||
| Selected Per Share Data: | ||||||||||||
| Net asset value, beginning of period | $ | 10.52 | $ | 9.86 | $ | 10.00 | ||||||
| Investment operations: | ||||||||||||
| Net investment income | 0.03 | 0.07 | 0.05 | |||||||||
| Net realized and unrealized gain (loss) | 1.30 | 0.64 | (0.19 | ) | ||||||||
| Total from investment operations | 1.33 | 0.71 | (0.14 | ) | ||||||||
| Less distributions to shareholders from: | ||||||||||||
| Net investment income | (0.07 | ) | (0.05 | ) | — | |||||||
| Total distributions | (0.07 | ) | (0.05 | ) | — | |||||||
| Net asset value, end of period | $ | 11.78 | $ | 10.52 | $ | 9.86 | ||||||
| Total Return(b) | 12.70 | %(c) | 7.25 | % | (1.40 | )%(c) | ||||||
| Ratios and Supplemental Data: | ||||||||||||
| Net assets, end of period (000 omitted) | $ | 31,921 | $ | 25,248 | $ | 14,987 | ||||||
| Ratio of net expenses to average net assets | 1.13 | %(d) | 1.15 | % | 1.15 | %(d) | ||||||
| Ratio of expenses to average net assets before waiver and reimbursement | 1.82 | %(d) | 2.32 | % | 4.05 | %(d) | ||||||
| Ratio of net investment income to average net assets | 0.51 | %(d) | 0.89 | % | 0.84 | %(d) | ||||||
| Portfolio turnover rate | 32 | %(c) | 52 | % | 30 | %(c) | ||||||
| (a) | For the period January 19, 2022 (commencement of operations) to November 30, 2022. |
| (b) | Total return represents the rate that the investor would have earned or lost on an investment in the Fund, assuming reinvestment of distributions. |
| (c) | Not annualized. |
| (d) | Annualized. |
See accompanying notes which are an integral part of these financial statements.
10
Connors Hedged Equity Fund
Notes to the Financial Statements
May 31, 2024 - (Unaudited)
NOTE 1. ORGANIZATION
The Connors Hedged Equity Fund (the “Fund”) is a diversified series of Connors Funds (the “Trust”), which is registered under the Investment Company Act of 1940, as amended (“1940 Act”) as an open-end management investment company. The Trust was organized as a Delaware statutory trust on September 15, 2021. The Fund currently offers one class of shares: Institutional Shares. The Fund commenced investment operations on January 19, 2022. The Fund’s investment adviser is Connors Investor Services, Inc. (the “Adviser”). The investment objective of the Fund is to seek to achieve capital appreciation and secondarily income generation, with lower volatility than U.S. equity markets.
NOTE 2. SIGNIFICANT ACCOUNTING POLICIES
The Fund is an investment company and follows accounting and reporting guidance under Financial Accounting Standards Board Accounting Standards Codification (“ASC”) Topic 946, “Financial Services-Investment Companies”. The following is a summary of significant accounting policies followed by the Fund in the preparation of its financial statements. These policies are in conformity with generally accepted accounting principles in the United States of America (“GAAP”).
Estimates – The preparation of financial statements in conformity with GAAP requires management to make estimates and assumptions that affect the reported amounts of assets and liabilities and disclosure of contingent assets and liabilities at the date of the financial statements and the reported amounts of increases and decreases in net assets from operations during the reporting period. Actual results could differ from those estimates.
Federal Income Taxes – The Fund makes no provision for federal income or excise tax. The Fund has qualified and intends to qualify each year as a regulated investment company (“RIC”) under subchapter M of the Internal Revenue Code of 1986, as amended, by complying with the requirements applicable to RICs and by distributing substantially all of its taxable income. The Fund also intends to distribute sufficient net investment income and net realized capital gains, if any, so that it will not be subject to excise tax on undistributed income and gains. If the required amount of net investment income or gains is not distributed, the Fund could incur a tax expense.
As of and during the six months ended May 31, 2024, the Fund did not have any liabilities for any unrecognized tax benefits. The Fund recognizes interest and penalties, if any, related to unrecognized tax benefits as income tax expense on the Statement of Operations when incurred. During the six months ended May 31, 2024, the Fund did not incur any interest or penalties. Management of the Fund has reviewed tax positions taken in tax years that remain subject to examination by all major tax jurisdictions, including federal (i.e., the
11
Connors Hedged Equity Fund
Notes to the Financial Statements (continued)
May 31, 2024 - (Unaudited)
last three tax year ends and the interim tax period since then, as applicable). Management believes that there is no tax liability resulting from unrecognized tax benefits related to uncertain tax positions taken.
Security Transactions and Related Income – The Fund follows industry practice and records security transactions on the trade date for financial reporting purposes. The specific identification method is used for determining gains or losses for financial statement and income tax purposes. Dividend income is recorded on the ex-dividend date and interest income is recorded on an accrual basis. Non-cash income, if any, is recorded at the fair market value of the securities received. Withholding taxes on foreign dividends, if any, have been provided for in accordance with the Fund’s understanding of the applicable country’s tax rules and rates.
Dividends and Distributions – The Fund intends to distribute its net investment income and net realized long-term and short-term capital gains, if any, at least annually. Dividends and distributions to shareholders, which are determined in accordance with income tax regulations, are recorded on the ex-dividend date. The treatment for financial reporting purposes of distributions made to shareholders during the period from net investment income or net realized capital gains may differ from their ultimate treatment for federal income tax purposes. These differences are caused primarily by differences in the timing of the recognition of certain components of income, expense or realized capital gain for federal income tax purposes. Where such differences are permanent in nature, they are reclassified among the components of net assets based on their ultimate characterization for federal income tax purposes. Any such reclassifications will have no effect on net assets, results of operations or net asset value (“NAV”) per share of the Fund.
For the six months ended May 31, 2024, the Fund made the following reclassifications to increase (decrease) the components of net assets:
| Paid-In Capital | Accumulated Earnings (Deficit) | |||||
| $ | — | $ | — | |||
12
Connors Hedged Equity Fund
Notes to the Financial Statements (continued)
May 31, 2024 - (Unaudited)
Derivative Transactions – The following tables identify the location and fair value of derivative instruments on the Statement of Assets and Liabilities as of May 31, 2024 and the effect of derivative instruments on the Statement of Operations for the six months ended May 31, 2024.
| Location of Derivatives on Statement of Assets and Liabilities | ||||||||
| Derivatives | Asset Derivatives | Liability Derivatives | Fair Value | |||||
| Equity Price Risk: | ||||||||
| Purchased Options | Investments in securities at fair value | $ | 148,725 | |||||
| Written Options | Options written, at fair value | (398,828 | ) | |||||
For the six months ended May 31, 2024:
| Derivatives | Location of Gain (Loss) on Derivatives on Statement of Operations | Realized Gain (Loss) on Derivatives | Change in Unrealized Appreciation (Depreciation) on Derivatives | |||||||
| Equity Price Risk: | ||||||||||
| Options purchased | Net realized gain and change in unrealized appreciation (depreciation) on investment securities | $ | (461,912 | ) | $ | 17,308 | ||||
| Options written | Net realized gain and change in unrealized appreciation (depreciation) on written options | 162,313 | 27,641 | |||||||
The following table summarizes the average ending monthly fair value of derivatives outstanding during the six months ended May 31, 2024:
| Derivatives | Average Ending Monthly Fair Value(a) | |||
| Purchased Options | $ | 80,842 | ||
| Written Options | (449,021 | ) | ||
| (a) | Average based on the 6 months during the period that had activity. |
13
Connors Hedged Equity Fund
Notes to the Financial Statements (continued)
May 31, 2024 - (Unaudited)
The following table provides a summary of offsetting financial liabilities and derivatives and the effect of derivative instruments on the Statement of Assets and Liabilities as of May 31, 2024:
| Gross Amounts of | Gross Amounts Offset in Statement of | Net Amounts of Liabilities Presented in Statement of | Gross Amounts Not Offset in Statement of Assets and Liabilities | |||||||||||||||||||||
| Recognized Liabilities | Assets and liabilities | Assets and Liabilities | Financial Instruments | Collateral Pledged | Net Amount | |||||||||||||||||||
| Written Options | $ | 382,491 | $ | — | $ | 382,491 | $ | (382,491 | ) | $ | — | $ | — | |||||||||||
NOTE 3. SECURITIES VALUATION AND FAIR VALUE MEASUREMENTS
The Fund values its portfolio securities at fair value as of the close of regular trading on the New York Stock Exchange (“NYSE”) (normally 4:00 p.m. Eastern Time) on each business day the NYSE is open for business. Fair value is defined as the price that the Fund would receive upon selling an investment in a timely transaction to an independent buyer in the principal or most advantageous market of the investment. GAAP establishes a three-tier hierarchy to maximize the use of observable market data and minimize the use of unobservable inputs and to establish classification of fair value measurements for disclosure purposes.
Inputs refer broadly to the assumptions that market participants would use in pricing the asset or liability, including assumptions about risk (the risk inherent in a particular valuation technique used to measure fair value including a pricing model and/or the risk inherent in the inputs to the valuation technique). Inputs may be observable or unobservable. Observable inputs are inputs that reflect the assumptions market participants would use in pricing the asset or liability developed based on market data obtained and available from sources independent of the reporting entity. Unobservable inputs are inputs that reflect the reporting entity’s own assumptions about the assumptions market participants would use in pricing the asset or liability developed based on the best information available in the circumstances.
Various inputs are used in determining the value of the Fund’s investments. These inputs are summarized in the three broad levels listed below.
14
Connors Hedged Equity Fund
Notes to the Financial Statements (continued)
May 31, 2024 - (Unaudited)
| ● | Level 1 – unadjusted quoted prices in active markets for identical investments and/or registered investment companies where the value per share is determined and published and is the basis for current transactions for identical assets or liabilities at the valuation date |
| ● | Level 2 – other significant observable inputs (including, but not limited to, quoted prices for an identical security in an inactive market, quoted prices for similar securities, interest rates, prepayment speeds, credit risk, etc.) |
| ● | Level 3 – significant unobservable inputs (including the Fund’s own assumptions in determining fair value of investments based on the best information available) |
The inputs used to measure fair value may fall into different levels of the fair value hierarchy. In such cases, for disclosure purposes, the level in the fair value hierarchy which is reported is determined based on the lowest level input that is significant to the fair value measurement in its entirety.
Equity securities that are traded on any stock exchange are generally valued at the last quoted sale price on the security’s primary exchange. Lacking a last sale price, an exchange-traded security is generally valued at the mean between the most recent quoted bid and ask prices. Securities traded in the Nasdaq over-the-counter market are generally valued at the Nasdaq Official Closing Price. When using market quotations and when the market is considered active, the security is classified as a Level 1 security. In the event that market quotations are not readily available or are considered unreliable due to market or other events, securities are valued in good faith by the Adviser as “Valuation Designee” under the oversight of the Board. The Adviser has adopted written policies and procedures for valuing securities and other assets in circumstances where market quotes are not readily available. In the event that market quotes are not readily available, and the security or asset cannot be valued pursuant to one of the valuation methods, the value of the security or asset will be determined in good faith by the Adviser pursuant to its policies and procedures. On a quarterly basis, the Adviser’s fair valuation determinations will be reviewed by the Board. Under these policies, the securities will be classified as Level 2 or 3 within the fair value hierarchy, depending on the inputs used.
Investments in mutual funds, including money market mutual funds, are generally priced at the ending NAV as reported by the underlying Fund companies. These securities are categorized as Level 1 securities.
Option contracts are generally traded on an exchange and are valued at the composite price, using the National Best Bid and Offer quotes (“NBBO”). NBBO consists of the highest bid price and lowest ask price across any of the exchanges on which an option
15
Connors Hedged Equity Fund
Notes to the Financial Statements (continued)
May 31, 2024 - (Unaudited)
is quoted, thus providing a view across the entire U.S. options marketplace. Composite option pricing calculates the mean of the highest bid price and lowest ask price across the exchanges where the option is traded. Expiring options may be priced at intrinsic value.
For options where market quotations are not readily available, fair value shall be determined by the Adviser. Generally, if market quotations are not readily available and the bid price or ask price is not available and, therefore, an option cannot be valued at the composite price, options may be valued at their last quoted sales price.
If the Fund decides that a price provided by the pricing service does not accurately reflect the fair value of the securities, when prices are not readily available from a pricing service, or when restricted or illiquid securities are being valued, securities are valued at fair value as determined by the Adviser, in conformity with policies adopted by the Board. These securities will generally be categorized as Level 2 or 3 within the fair value hierarchy, depending on the inputs used.
In accordance with the Trust’s valuation policies and fair value determinations pursuant to Rule 2a-5 under the 1940 Act, the Valuation Designee is required to consider all appropriate factors relevant to the value of securities for which it has determined other pricing sources are not available or reliable as described above. No single method exists for determining fair value because fair value depends upon the circumstances of each individual case. As a general principle, the current fair value of a security being valued by the Valuation Designee would be the amount that the Fund might reasonably expect to receive upon the current sale. Methods that are in accordance with this principle may, for example, be based on (i) a multiple of earnings; (ii) a discount from market prices of a similar freely traded security (including a derivative security or a basket of securities traded on other markets, exchanges or among dealers); or (iii) yield to maturity with respect to debt issues, or a combination of these and other methods. Fair-value pricing is permitted if, in the Valuation Designee’s opinion, the validity of market quotations appears to be questionable based on factors such as evidence of a thin market in the security based on a small number of quotations, a significant event occurs after the close of a market but before the Fund’s NAV calculation that may affect a security’s value, or the Valuation Designee is aware of any other data that calls into question the reliability of market quotations.
16
Connors Hedged Equity Fund
Notes to the Financial Statements (continued)
May 31, 2024 - (Unaudited)
The following is a summary of the inputs used to value the Fund’s investments as of May 31, 2024:
| Valuation Inputs | ||||||||||||||||
| Assets | Level 1 | Level 2 | Level 3 | Total | ||||||||||||
| Common Stocks(a) | $ | 31,406,774 | $ | — | $ | — | $ | 31,406,774 | ||||||||
| Put Options Purchased | — | 148,725 | — | 148,725 | ||||||||||||
| Money Market Funds | 649,107 | — | — | 649,107 | ||||||||||||
| Total | $ | 32,055,881 | $ | 148,725 | $ | — | $ | 32,204,606 | ||||||||
| Valuation Inputs | ||||||||||||||||
| Liabilities | Level 1 | Level 2 | Level 3 | Total | ||||||||||||
| Written Call Options | $ | (16,918 | ) | $ | (327,698 | ) | $ | — | $ | (344,616 | ) | |||||
| Written Put Options | (11,625 | ) | (26,250 | ) | — | (37,875 | ) | |||||||||
| Total | $ | (28,543 | ) | $ | (353,948 | ) | $ | — | $ | (382,491 | ) | |||||
| (a) | Refer to Schedule of Investments for sector classifications. |
NOTE 4. FEES AND OTHER TRANSACTIONS WITH AFFILIATES AND OTHER SERVICE PROVIDERS
Under the terms of the investment advisory agreement, on behalf of the Fund (the “Agreement”), the Adviser manages the Fund’s investments subject to oversight of the Board. As compensation for its services, the Fund pays the Adviser a fee, computed and accrued daily and paid monthly at an annual rate of 0.80% of the average daily net assets of the Fund. For the six months ended May 31, 2024, the Adviser earned a fee of $113,755 from the Fund before the waivers described below. At May 31, 2024, the Fund owed the Adviser $3,353.
The Fund has adopted an Administrative Services Plan (the “Plan”) for its Institutional Class shares. The Plan allows the Plan to pay financial intermediaries that provide services relating to Institutional Class shares computed and accrued daily at an annual rate of 0.10% of the Fund’s average daily net assets. For the six months ended May 31, 2024, the Fund paid $2,959 in administrative service fees. At May 31, 2024, the Fund accrued $270 in administrative service fees.
The Adviser has contractually agreed under an expense limitation agreement (the “Expense Limitation Agreement”), until March 31, 2025 to reduce its Management Fees and reimburse other expenses to the extent necessary to limit total annual fund operating expenses (excluding brokerage costs; taxes; interest; borrowing costs such as interest and dividend expenses on securities sold short, Acquired Fund Fees and Expenses; payments, if any, under a Rule 12b-1 Distribution Plan or Administrative Services Plan, extraordinary expenses such as litigation and merger or reorganization costs, and other expenses not incurred in the ordinary course of the Fund’s business) to 1.05% (1.15% prior to March 31, 2024)
17
Connors Hedged Equity Fund
Notes to the Financial Statements (continued)
May 31, 2024 - (Unaudited)
of the Fund’s average daily net assets of its Institutional Class shares. The Expense Limitation Agreement may be terminated by the Adviser, or the Board, without approval by the other party, at the end of the then current term upon not less than 90 days’ notice to the other parties as set forth in the Expense Limitation Agreement. The Expense Limitation Agreement will terminate automatically if the Fund’s Advisory Agreement with the Adviser is terminated.
Each fee waiver or expense reimbursement by the Adviser is subject to repayment by the Fund within the three years following the date the fee waiver or expense reimbursement occurred, provided that the Fund is able to make the repayment without exceeding the expense limitation that is in effect at the time of the repayment or at the time of the fee waiver or expense reimbursement, whichever is lower. For the six months ended May 31, 2024, the Adviser waived fees or reimbursed expenses totaling $97,283. As of May 31, 2024, the Adviser may seek repayment of investment advisory fee waivers and expense reimbursements as follows:
| Recoverable Through | ||||
| November 30, 2025 | $ | 248,401 | ||
| November 30, 2026 | 227,355 | |||
| May 31, 2027 | 97,283 | |||
Ultimus Fund Solutions, LLC (“Ultimus”) provides administration, fund accounting and transfer agent services to the Fund. The Fund pays Ultimus fees in accordance with the agreements for such services.
Under the terms of a Distribution Agreement with the Trust, Ultimus Fund Distributors, LLC (the “Distributor”) serves as principal underwriter to the Fund. The Distributor is a wholly-owned subsidiary of Ultimus. The Distributor is compensated by the Adviser (not the Fund) for acting as principal underwriter.
Pursuant to a Compliance Consulting Agreement with Beacon Compliance Consulting, Inc. (“Beacon”), Beacon provides the Chief Compliance Officer and compliance services to the Trust.
The Board supervises the business activities of the Trust. Each Trustee serves as a trustee until termination of the Trust unless the Trustee dies, resigns, retires, or is removed. The Trust pays each Trustee of the Trust who is not an interested person an annual retainer of $5,000. The Trust also reimburses the Trustees for travel and other expenses incurred in attending meetings of the Board. Officers of the Trust and Trustees who are interested persons of the Trust do not receive any direct compensation from the Trust. No other compensation or retirement benefits are received by any Trustee or officer from the Fund.
18
Connors Hedged Equity Fund
Notes to the Financial Statements (continued)
May 31, 2024 - (Unaudited)
NOTE 5. PURCHASES AND SALES OF SECURITIES
For the six months ended May 31, 2024, purchases and sales of investment securities, other than short-term investments, were $12,149,710 and $8,753,259, respectively.
There were no purchases or sales of long-term U.S. government obligations during the six months ended May 31, 2024.
NOTE 6. SECTOR RISK
If the Fund has significant investments in the securities of issuers within a particular sector, any development affecting that sector will have a greater impact on the value of the net assets of the Fund than would be the case if the Fund did not have significant investments in that sector. In addition, this may increase the risk of loss in the Fund and increase the volatility of the Fund’s NAV per share. For instance, economic or market factors, regulatory changes or other developments may negatively impact all companies in a particular sector, and therefore the value of the Fund’s portfolio will be adversely affected. As of May 31, 2024, the Fund had 27.55% of the value of its net assets invested in stocks within the Technology sector.
NOTE 7. FEDERAL TAX INFORMATION
At May 31, 2024, the net unrealized appreciation (depreciation) and tax cost of investments, including written options, for tax purposes was as follows:
| Gross unrealized appreciation | $ | 5,342,762 | ||
| Gross unrealized depreciation | (443,912 | ) | ||
| Net unrealized appreciation on investments | 4,898,850 | |||
| Tax cost of investments | $ | 26,923,266 |
The tax character of distributions paid for the fiscal year ended November 30, 2023, the Fund’s most recent fiscal year end, was as follows:
| Distributions paid from: | ||||
| Ordinary income(a) | $ | 78,058 | ||
| Total distributions paid | $ | 78,058 | ||
| (a) | Short-term capital gain distributions are treated as ordinary income for tax purposes. |
19
Connors Hedged Equity Fund
Notes to the Financial Statements (continued)
May 31, 2024 - (Unaudited)
At November 30, 2023, the Fund’s most recent fiscal year end, the components of accumulated earnings (deficit) on a tax basis were as follows:
| Undistributed ordinary income | $ | 161,878 | ||
| Accumulated capital and other losses | (534,129 | ) | ||
| Unrealized appreciation on investments | 2,278,516 | |||
| Total accumulated earnings | $ | 1,906,265 |
As of November 30, 2023, the Fund had short-term and long-term capital loss carryforwards of $358,953 and long-term capital loss carryforwards $175,175. These capital loss carryforwards, which do not expire, may be utilized in future years to offset net realized capital gains, if any, prior to distributing such gains to shareholders.
NOTE 8. COMMITMENTS AND CONTINGENCIES
The Trust indemnifies its officers and Trustees for certain liabilities that may arise from their performance of their duties to the Trust or the Fund. Additionally, in the normal course of business, the Trust enters into contracts that contain a variety of representations and warranties which provide general indemnifications. The Trust’s maximum exposure under these arrangements is unknown, as this would involve future claims that may be made against the Trust that have not yet occurred.
NOTE 9. REGULATORY UPDATES
On January 24, 2023, the SEC adopted rule and form amendments to require mutual funds and ETFs to transmit concise and visually engaging streamlined annual and semiannual reports to shareholders that highlight key information. Other information, including financial statements, will not appear in a streamlined shareholder report but must be available online, delivered free of charge upon request, and filed on a semiannual basis on Form N-CSR. The rule and form amendments have a compliance date of July 24, 2024.
NOTE 10. SUBSEQUENT EVENTS
Management of the Fund has evaluated the need for disclosures and/or adjustments resulting from subsequent events through the date at which these financial statements were issued. Based upon this evaluation, management has determined there were no items requiring adjustment of the financial statements or additional disclosure.
20
Proxy Voting
A description of the policies and procedures that the Fund uses to determine how to vote proxies relating to portfolio securities and information regarding how the Fund voted those proxies during the most recent twelve month period ended June 30, are available (1) without charge upon request by calling the Fund at (833) 601- 2676 and (2) in Fund documents filed with the SEC on the SEC’s website at www.sec.gov.
TRUSTEES | INDEPENDENT REGISTERED PUBLIC ACCOUNTING FIRM |
| Bradford H. Barrett Joni S. Naugle John R. Morahan | Cohen & Company, Ltd. 1835 Market Street, 3rd Floor Philadelphia, PA 19103 |
| OFFICERS | LEGAL COUNSEL |
| Debora M. Covell, Treasurer (Principal Financial Officer) Robert J. Cagliola, Secretary Kyle Bubeck, Chief Compliance Officer | Kilpatrick Townsend & Stockton LLP 1001 West Forth Street Winston-Salem, NC 27101 |
| INVESTMENT ADVISER | CUSTODIAN |
| Connors Investor Services, Inc. 1210 Broadcasting Road, Suite 200 Wyomissing, PA 19610 | U.S. Bank, N.A. 425 Walnut Street Cincinnati, OH 45202 |
| DISTRIBUTOR Ultimus Fund Distributors, LLC | ADMINISTRATOR, TRANSFER AGENT AND FUND ACCOUNTANT |
| 225 Pictoria Drive, Suite 450 Cincinnati, OH 45246 | Ultimus Fund Solutions, LLC 225 Pictoria Drive, Suite 450 Cincinnati, OH 45246 |
This report is intended only for the information of shareholders or those who have received the Fund’s prospectus which contains information about the Fund’s management fee and expenses. Please read the prospectus carefully before investing.
Distributed by Ultimus Fund Distributors, LLC, Member FINRA/SIPC
Item 8. Changes in and Disagreements with Accountants for Open-End Management Investment Companies.
Not Applicable
Item 9. Proxy Disclosures for Open-End Management Investment Companies.
Not Applicable
Item 10. Remuneration Paid to Directors, Officers, and Others of Open-End Management Investment Companies.
Included under Item 7
Item 11. Statement Regarding Basis for Approval of Investment Advisory Contract.
Included under Item 7
Item 12. Disclosure of Proxy Voting Policies and Procedures for Closed-End Management Investment Companies.
Not applicable
Item 13. Portfolio Managers of Closed-End Management Investment Companies.
Not applicable
Item 14. Purchases of Equity Securities by Closed-End Management Investment Company and Affiliated Purchasers.
Not applicable
Item 15. Submission of Matters to a Vote of Security Holders.
None
Item 16. Controls and Procedures
| (a) | The registrant’s Principal Executive Officer and Principal Financial Officer have concluded that the registrant’s disclosure controls and procedures (as defined in Rule 30a-3(c) under the Act) are effective in design and operation and are sufficient to form the basis of the certifications required by Rule 30a-(2) under the Act, based on their evaluation of these disclosure controls and procedures as of a date within 90 days of this report on Form N-CSR. |
| (b) | There were no changes in the registrant’s internal control over financial reporting (as defined in Rule 30a-3(d) under the Act) during the period covered by this report that have materially affected, or are reasonably likely to materially affect, the registrant’s internal control over financial reporting. |
Item 17. Disclosure of Securities Lending Activities for Closed-End Management Investment Companies.
Not applicable
Item 18. Recovery of Erroneously Awarded Compensation.
| (a) | Not applicable |
| (b) | Not applicable |
Item 19. Exhibits.
| (a)(1) | Not applicable – disclosed with annual report. |
| (a)(2) | Not applicable |
| (a)(4) | Not applicable |
| (b) | Certifications required by Rule 30a-2(b) under the Act (17 CFR 270.30a-2(b)): Attached hereto |
SIGNATURES
Pursuant to the requirements of the Securities Exchange Act of 1934 and the Investment Company Act of 1940, the registrant has duly caused this report to be signed on its behalf by the undersigned, thereunto duly authorized.
| (Registrant) | Connors Funds | |||
| By (Signature and Title) | /s/ Peter Connors | |||
| Peter Connors, President and Principal Executive Officer | ||||
| Date | 8/07/2024 | |||
| Pursuant to the requirements of the Securities Exchange Act of 1934 and the Investment Company Act of 1940, this report has been signed below by the following persons on behalf of the registrant and in the capacities and on the dates indicated. | ||||
| By (Signature and Title) | /s/ Peter Connors | |||
| Peter Connors, President and Principal Executive Officer | ||||
| Date | 8/07/2024 | |||
| By (Signature and Title) | /s/ Debora M. Covell | |||
| Debora M. Covell, Treasurer and Principal Financial Officer | ||||
| Date | 8/07/2024 | |||