UNITED STATES
SECURITIES AND EXCHANGE COMMISSION
Washington, D.C. 20549
FORM N-CSR
CERTIFIED SHAREHOLDER REPORT OF REGISTERED
MANAGEMENT INVESTMENT COMPANIES
Investment Company Act File Number: 811-23758
Eagle Point Institutional Income Fund
(Exact name of registrant as specified in charter)
600 Steamboat Road, Suite 202
Greenwich, CT 06830
(Address of principal executive offices) (Zip code)
Thomas P. Majewski
c/o Eagle Point Institutional Income Fund
600 Steamboat Road, Suite 202
Greenwich, CT 06830
(Name and address of agent for service)
Copies to
Thomas J. Friedmann
Philip Hinkle
Dechert LLP
One International Place, 40th Floor
100 Oliver Street
Boston, MA 02110
(617) 728-7120
Registrant’s telephone number, including area code: (203) 340-8500
Date of fiscal year end: December 31
Date of reporting period: June 30, 2024
Form N-CSR is to be used by management investment companies to file reports with the Commission not later than 10 days after the transmission to stockholders of any report that is required to be transmitted to stockholders under Rule 30e-1 under the Investment Company Act of 1940 (17 CFR 270.30e-1). The Commission may use the information provided on Form N-CSR in its regulatory, disclosure review, inspection, and policymaking roles.
A registrant is required to disclose the information specified by Form N-CSR, and the Commission will make this information public. A registrant is not required to respond to the collection of information contained in Form N-CSR unless the Form displays a currently valid Office of Management and Budget (“OMB”) control number. Please direct comments concerning the accuracy of the information collection burden estimate and any suggestions for reducing the burden to Secretary, Securities and Exchange Commission, 100 F Street, NE, Washington, DC 20549. The OMB has reviewed this collection of information under the clearance requirements of 44 U.S.C. § 3507.
Item 1. Report to Stockholders
The Company’s Semiannual Report to stockholders for the six months ending June 30, 2024 is filed herewith.


Eagle Point Institutional Income Fund
Semiannual Report – June 30, 2024
Table of Contents
1

Letter to Shareholders and Management Discussion of Fund Performance
Dear Shareholders:
We are pleased to provide you with the enclosed report of Eagle Point Institutional Income Fund (“we,” “us,” “our” or the “Fund”) for the six months ended June 30, 2024.
The Fund is a closed-end management investment company registered under the Investment Company Act of 1940, as amended (the “1940 Act”) and is advised by Eagle Point Credit Management LLC (the “Adviser”). The Fund is organized as a Delaware statutory trust and offers its shares of beneficial interest (“Shares”) to investors on a continuous basis at the Fund’s net asset value (“NAV”) per share plus any applicable sales load. The Fund’s primary investment objective is to generate high current income, with a secondary objective to generate capital appreciation. We seek to achieve these objectives by investing primarily in equity and junior debt tranches of collateralized loan obligations (“CLOs”). We may also invest in other securities or instruments that are related investments or that are consistent with our investment objectives.
The Adviser has significant expertise in CLO investing, including 62 years of combined CLO industry experience among the senior investment team, and over $10.0 billion of assets under management (including undrawn capital commitments)1 as of June 30, 2024. The Fund was formed in order to provide investors with access to institutional credit investment strategies in a continuously offered, SEC-registered and non-traded format.
In the first half of 2024, we:
| ■ | Exceeded $100 million of total assets, inclusive of available borrowings under a revolving credit facility. |
| ■ | Generated a net total return of 12.8% over the 12-month period ending June 30, 2024.2 |
| ■ | Paid consistent monthly distributions to shareholders totaling $0.483 per share during the first half of 2024, generating a 9.7% annualized distribution rate. This represents a 5.2% increase from the $0.459 per share distributed in the second half of 2023.3 |
| ■ | Opportunistically purchased CLO equity investments in the primary and secondary markets at a weighted average effective yield of 17.9%, and sustained a healthy weighted average remaining reinvestment period of the Fund’s CLO equity portfolio of 3.5 years as of June 30, 2024. |
Past performance is not indicative of, or a guarantee of, future performance.
Please see page 7 for endnotes.
2
| ■ | Increased the Fund’s NAV per share to $9.97 as of June 30, 2024, from $9.70 a year prior. |
The strong performance of our investment portfolio during the first half of 2024 enabled the Fund to distribute $3.1 million.3
We continue to prudently and actively manage the Fund’s investment portfolio while raising capital to take advantage of attractive investment opportunities. During the first half of 2024, we deployed $42.5 million into new CLO equity investments and loan accumulation facilities. We also sold three CLO debt investments and realized capital gains with a weighted average appreciation in price of 11.25%.
We believe our portfolio continues to have the potential for further meaningful upside. In our view, CLOs generally are not particularly sensitive to interest rate movements, as underlying broadly syndicated loans (“BSLs”), which generate the cash flows we receive as a CLO equity investor, and our financing from CLO debt are both principally floating rate.
The Fund’s investment portfolio as of June 30, 2024 consisted of 58 unique CLO investments. Importantly, nearly all of the Fund’s investments were also investments made by other institutional funds and accounts managed by the Adviser. To the extent that the Fund (along with other funds and accounts managed by the Adviser) owns a majority position in the equity tranche, our Adviser has the ability to exercise certain protective rights over the vehicle (such as the ability to call the CLO after the non-call period, to refinance/reprice certain CLO debt tranches after the non-call period and to influence potential amendments to the governing documents of the CLO) that may reduce our risk in these investments and/or enhance our economics.
For the first of half of 2024, the cash generation of the Fund’s CLO equity portfolio was steady and robust, with an annualized cash-on-cash return of 20.7%4 providing the Fund with valuable dry powder to deploy into new securities at attractive prices.
During the first half of 2024, the Fund raised $31.3 million through sales of shares and reinvestment of distributions. The Adviser intends to continue increasing the Fund’s equity by raising capital under the Fund’s continuous offering program.
On June 28, 2024, the Fund entered into an agreement that establishes a senior secured revolving credit facility, which provides $25 million of committed capital to the Fund. The Fund’s use of leverage through this credit facility is expected to be accretive to shareholders.
We also want to highlight the Fund’s distribution reinvestment plan for shareholders. This plan allows shareholders to have their distributions automatically reinvested into new shares at a 5% discount to NAV per share. We encourage all shareholders to carefully review the terms of the plan. See “Distribution Reinvestment Plan” in the enclosed report.
Past performance is not indicative of, or a guarantee of, future performance.
Please see page 7 for endnotes.
3
Market Overview5
Loan Market
For the first half of 2024, loan performance was stable. The Credit Suisse Leverage Loan Index6 (“CSLLI”), which is a broad index followed by many tracking the corporate loan market, generated a non-annualized total return of 4.44% in the first half of 2024. Interest rates remained elevated, helping to maintain the attractive current coupons on floating rate loans.
Average loan prices finished the first half of 2024 at 95.68, a modest increase from 95.32 at the beginning of the year.
Loan issuance totaled $289 billion for the first half of 2024, compared to $103 billion for the first half of 2023. Total institutional loans outstanding stood at $1.4 trillion as of June 30, 2024.
The trailing 12-month par-weighted default rate finished June at 0.92%, compared to 1.53% at the end of 2023, and remaining well below the long-term average of 2.65%.7 The Fund’s look through default exposure stood at 0.37% at the end of June.
While many CLO investors focus principally on default rates, we believe the market does not give enough consideration to loan repayment rates and the reinvestment period tenor within CLOs, which often allows CLOs to purchase loans at a discounted prices using par repayment proceeds. With over $44 billion of BSLs repaying at par in June, the 12-month trailing loan prepayment rate increased to 25.3% as of June 30, 2024.
Part of these repayments relate to refinancing of loans coming due. As of June 30, 2024, less than 3% of the loan market was set to mature prior to 2026 and the “maturity wall” continues to be pushed out; 2025 and 2026 maturities have each been reduced by over 50% since the beginning of the year. Only 2% of the loans in the portfolios of our underlying CLO equity positions mature prior to 2026.
CLO Market
The first half of 2024 saw CLO new issue at the fastest pace ever, with approximately $102 billion of volume. This is over 80% above new issue volume at the same time last year. Third party CLO equity investors (including us) have returned to the new issue market in 2024 as CLO AAAs have tightened. That tightening has also driven a large increase in CLO refinancing and reset activity to over $110 billion combined. We appear comfortably on pace to break the previous issuance records set in 2021.
Past performance is not indicative of, or a guarantee of, future performance.
Please see page 7 for endnotes.
4
In the first half of 2024, there were approximately $50 billion of CLO AAA paydowns, and we believe CLO AAA paydowns will continue. The brief bout of volatility in August has not materially affected the CLO market, so we expect tightening pressure on CLO AAA spreads to continue. We believe this trend will encourage more new issue, refinancing and reset activity.
As of June 30, 2024, CLO AAA discount margins, or DMs, averaged approximately 142 basis points over SOFR; this is 33 basis points tighter than the end of 2023.
The underlying fundamentals of CLO portfolios remain strong. The median market-wide CCC-rated loan exposure for U.S. CLOs was just 6.6%, with average OC cushions of 3.2% on June 30, 2024. For context, approximately 6.3% of U.S. CLOs recorded a breach of their overcollateralization test as of June 30, 2024. In other words, over 93% of U.S. CLOs continued to pay cash distributions to their CLO equity investors. All of our CLO equity positions with a payment date in July received a distribution
As we look into the second half of 2024, we expect continued tightening in CLO AAA spreads. This tightening trend, along with CLO equity investors directing liquidations of seasoned CLOs to capture higher loan prices, has led to AAA investors being redeemed out of paper despite the increased issuance activity. We believe many AAA investors will need to replenish their investment portfolios.
We remain excited about the investment opportunities within the CLO market – in particular, the equity portion of the capital structure.
Additional Information
In addition to the Fund’s regulatory requirement to file certain quarterly and annual portfolio information as described further in the enclosed report, the Fund makes certain additional financial information available to investors via our website (www.EPIIF.com).
About Our Adviser
Eagle Point Credit Management LLC is a specialist asset manager focused on investing in CLO securities and other income-oriented credit investments. As of June 30, 2024, our Adviser and its affiliates have over $10 billion of assets under management (inclusive of undrawn capital commitments).1
Subsequent Developments
Pursuant to the Fund’s continuous offering, during the period from July 1, 2024 through July 31, 2024, the Fund issued shares for total net proceeds to the Fund of $5.9 million.
Past performance is not indicative of, or a guarantee of, future performance.
Please see page 7 for endnotes.
5
For the month of July 2024, the Fund declared and paid a distribution in the amount of $0.083 per share, representing a 10% annualized distribution rate3 based on the Fund’s NAV per share of $9.97 as of June 30, 2024.
* * * *
Management remains keenly focused on continuing to create value for our shareholders. We appreciate the trust and confidence our shareholders have placed in the Fund.
Thomas Majewski
Chairman and Chief Executive Officer
This letter is intended to assist shareholders in understanding the Fund’s performance during the six months ended June 30, 2024. The views and opinions in this letter were current as of July 31, 2024. Statements other than those of historical facts included herein may constitute forward-looking statements and are not guarantees of future performance or results and involve a number of risks and uncertainties. Actual results may differ materially from those in the forward-looking statements as a result of a number of factors. The Fund undertakes no duty to update any forward-looking statement made herein. Information contained on our website is not incorporated by reference into this shareholder letter and you should not consider information contained on our website to be part of this shareholder letter or any other report we file with the Securities and Exchange Commission.
Past performance is not indicative of, or a guarantee of, future performance.
Please see page 7 for endnotes.
6
Notes
| 1 | Assets under management is as of June 30, 2024. Calculated in the aggregate with certain affiliated advisers. |
| 2 | Past performance is not indicative of, or a guarantee of, future performance. Total return reflects the percent change in NAV per share from the beginning of the period, plus the amount of any distribution per share paid in the period. Return calculation assumes reinvestment of distributions pursuant to the Fund’s distribution reinvestment plan and is net of all Fund expenses, including general and administrative expenses, transaction related expenses, amortization of offering costs, management and incentive fees, and expense limitation being in effect during the performance periods (if any). The Fund charges a maximum upfront sales load of 6.75%. Total return does not reflect the Fund’s upfront sales load. If reflected, the Fund’s total return would have been lower. Return information is not a measure used under GAAP. Valuations based upon unaudited reports may not correspond to realized value and may not accurately reflect the price at which assets could be liquidated. Performance reflects certain expense limitation arrangements in effect during the periods shown. Absent these arrangements, the Fund’s performance would have been lower. Certain expenses paid by Eagle Point Credit Management or its affiliates on the Fund’s behalf are subject to reimbursement by the Fund for up to three years (which reimbursement would have the effect of reducing the Fund’s performance). Performance does not reflect the impact of federal, state or local taxation to which an investor may be subject. |
| 3 | Annualized distribution rate reflects distributions paid during the period, annualized, and divided by the period end NAV. The annualized distribution rate is not a guarantee of future returns and future performance may vary. The timing and frequency of distribution payments is not guaranteed. Such variance may be material and adverse, including the potential for full loss of principal and no distributions. In considering returns, investors should bear in mind that historical performance is not a guarantee, projection or prediction and is not indicative of future results. Actual net returns in any given year may be lower than the historical returns. Investment return and principal value of any investment will fluctuate and may be worth more or less than the amount initially invested. Distribution payments are not guaranteed. Distributions may be comprised of any combination of 1) net investment income and/or 2) net capital gain, and, if the Fund distributes an amount in excess of net investment income and net capital gains, a portion of such distribution will constitute a return of capital. A distribution comprised in whole or in part by a return of capital does not necessarily reflect the Fund’s investment performance and should not be confused with “yield” or “income.” A return of capital distribution may reduce the amount of investable funds. The actual components of the Fund’s distributions for U.S. tax reporting purposes can only be finally determined as of the end of each fiscal year of the Fund and are thereafter reported to shareholders on Form 1099-DIV. |
| 4 | Cash-on-cash return represents the total amount of recurring distributions received from investments for the period over the Fund’s average beginning NAV for the period, annualized. |
| 5 | Market data and statistics summarized herein are sourced from JPMorgan Chase & Co., S&P Capital IQ, S&P LCD, and Credit Suisse. |
| 6 | The CSLLI tracks the investable universe of the US dollar-denominated leveraged loan market. The performance of an index is not an exact representation of any particular investment, as you cannot invest directly in an index. |
| 7 | “Par-weighted default rate” represents the rate of obligors who fail to remain current on their loans based on the par amount. |
7
Page Intentionally Left Blank
Important Information about this Report and Eagle Point Institutional Income Fund
This report is transmitted to the shareholders of Eagle Point Institutional Income Fund (“we”, “us”, “our” or the “Fund”) and is furnished pursuant to certain regulatory requirements. This report and the information and views herein do not constitute investment advice, or a recommendation or an offer to enter into any transaction with the Fund or any of its affiliates. This report is provided for informational purposes only, does not constitute an offer to sell securities of the Fund and is not a prospectus. From time to time, the Fund may have a registration statement relating to one or more of its securities on file with the US Securities and Exchange Commission (“SEC”). Any registration statement that has not yet been declared effective by the SEC, and any prospectus relating thereto, is not complete and may be changed. Any securities that are the subject of such a registration statement may not be sold until the registration statement filed with the SEC is effective.
The information and its contents are the property of Eagle Point Credit Management LLC (the “Adviser”) and/or the Fund. Any unauthorized dissemination, copying or use of this presentation is strictly prohibited and may be in violation of law. This presentation is being provided for informational purposes only.
Investors should read the Fund’s prospectus and SEC filings (which are publicly available on the EDGAR Database on the SEC website at www.sec.gov) carefully and consider their investment goals, time horizons and risk tolerance before investing in the Fund. Investors should consider the Fund’s investment objectives, risks, charges and expenses carefully before investing in securities of the Fund. There is no guarantee that any of the goals, targets or objectives described in this report will be achieved.
An investment in the Fund is not appropriate for all investors. The investment program of the Fund is speculative, entails substantial risk and includes investment techniques not employed by traditional mutual funds. An investment in the Fund is not intended to be a complete investment program. Past performance is not indicative of, or a guarantee of, future performance. The performance and certain other portfolio information quoted herein represents information as of June 30, 2024. Nothing herein should be relied upon as a representation as to the future performance or portfolio holdings of the Fund. Investment return and principal value of an investment will fluctuate, and shares, when sold, may be worth more or less than their original cost. The Fund’s performance is subject to change since the end of the period noted in this report and may be lower or higher than the performance data shown herein.
Liquidity will be provided by the Fund only through limited repurchase offers described below (if at all). An investment in the Fund is suitable only for investors who can bear the risks associated with the limited liquidity of the Shares and should be viewed as a long-term investment. The Fund’s shares will not be publicly traded and an investor should not expect to be able to sell shares regardless of how the Fund performs.
Neither the Adviser nor the Fund provide legal, accounting or tax advice. Any statement regarding such matters is explanatory and may not be relied upon as definitive advice. Investors should consult with their legal, accounting and tax advisors regarding any potential investment. The information presented herein is as of the dates noted herein and is derived from financial and other information of the Fund, and, in certain cases, from third party sources and reports (including reports of third party custodians, CLO managers and trustees) that have not been independently verified by the Fund. As noted herein, certain of this information is estimated and unaudited, and therefore subject to change. We do not represent that such information is accurate or complete, and it should not be relied upon as such.
Forward-Looking Statements
This report may contain “forward-looking statements” within the meaning of the Private Securities Litigation Reform Act of 1995. Statements other than statements of historical facts included in this report may constitute forward-looking statements and are not guarantees of future performance or results and involve a number of risks and uncertainties. Actual results may differ materially from those in the forward-looking statements as a result of a number of factors, including those described in the Fund’s filings with the SEC. The Fund undertakes no duty to update any forward-looking statement made herein. All forward-looking statements speak only as of the date of this report.
9
Summary of Certain Unaudited Portfolio Characteristics
The summary of portfolio characteristics reflected below is as of June 30, 2024. The information presented below is on a look–through basis to the collateralized loan obligation, or “CLO”, equity held by the Fund as of June 30, 2024 (except as otherwise noted) and reflects the aggregate underlying exposure of the Fund based on the portfolios of those investments. The data is estimated and unaudited and is derived from CLO trustee reports received by the Fund relating to June 2024 and from custody statements and/or other information received from CLO collateral managers, or other third party sources.
| Summary of Portfolio Investments1 |
| Number of CLO Securities | 58 |
| Number of Collateral Managers | 23 |
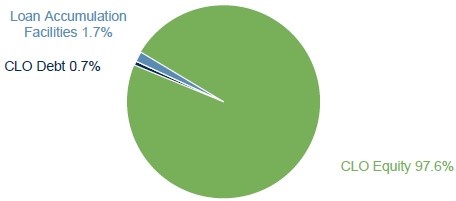
| Fair Value of CLO Equity Securities | $77,148,769 |
| Fair Value of Loan Accumulation Facility Securities | $1,367,944 |
| Fair Value of CLO Debt Securities | $546,095 |
| Summary of Underlying Portfolio Characteristics2 | |
| Number of Unique Underlying Loan Obligors | 1,293 |
| Largest Exposure to an Individual Obligor | 0.63% |
| Average Individual Loan Obligor Exposure | 0.08% |
| Top 10 Loan Obligors Exposure | 5.07% |
| Aggregate Indirect Exposure to Senior Secured Loans3 | 97.32% |
| Weighted Average Market Value of Loan Collateral | 97.51% |
| Weighted Average Stated Loan Spread | 3.63% |
| Weighted Average Loan Maturity | 4.7 years |
| Weighted Average Remaining CLO Reinvestment Period | 3.5 years |
Please see footnote disclosure on Page 11.
10
Notes
| 1 | The summary of portfolio investments shown is based on the estimated fair value of the underlying positions as of June 30, 2024. |
| 2 | The information presented herein is on a look-through basis to the collateralized loan obligation, or “CLO”, equity held by the Fund as of June 30, 2024 (except as otherwise noted) and reflects the aggregate underlying exposure of the Fund based on the portfolios of those investments. The data is estimated and unaudited and is derived from CLO trustee reports received by the Fund relating to June 2024 and from custody statements and/or other information received from CLO collateral managers and other third party sources. Information relating to the market price of underlying collateral is as of month end; however, with respect to other information shown, depending on when such information was received, the data may reflect a lag in the information reported. As such, while this information was obtained from third party data sources, June 2023 trustee reports and similar reports, other than market price, it does not reflect actual underlying portfolio characteristics as of June 30, 2024 and this data may not be representative of current or future holdings. The weighted average remaining reinvestment period information is based on the fair value of CLO equity investments held by the Fund as of June 30, 2024. |
| 3 | We obtain exposure in underlying senior secured loans indirectly through CLOs and related investments. |
11
Consolidated Financial Statements for the Six Months Ended
June 30, 2024 (Unaudited)
12
Eagle Point Institutional Income Fund & Subsidiaries
Consolidated Statement of Assets and Liabilities
As of June 30, 2024
(expressed in U.S. dollars)
(Unaudited)
| ASSETS | ||||
| Investments, at fair value (cost $81,299,030) | $ | 79,062,808 | ||
| Cash and cash equivalents | 2,878,804 | |||
| Interest receivable | 2,605,007 | |||
| Due from Adviser (Note 4) | 1,665,553 | |||
| Deferred offering costs (Note 4) | 572,453 | |||
| Other assets | 53,721 | |||
| Prepaid expenses | 47,847 | |||
| Total Assets | 86,886,193 | |||
| LIABILITIES | ||||
| Payable for securities purchased | 6,014,679 | |||
| Incentive fee payable (Note 4) | 1,548,578 | |||
| Management fee payable (Note 4) | 918,402 | |||
| Professional fees payable | 267,144 | |||
| Administration fees payable | 124,767 | |||
| Trustees’ fees payable | 53,153 | |||
| Transfer agent fees payable | 42,961 | |||
| Other expenses payable | 56,939 | |||
| Total Liabilities | 9,026,623 | |||
| COMMITMENTS AND CONTINGENCIES (Note 7) | ||||
| NET ASSETS applicable to common stock, 94,000,000 shares authorized, 7,813,240 shares issued and outstanding | $ | 77,859,570 | ||
| NET ASSETS consist of: | ||||
| Paid-in capital (Note 5) | $ | 78,185,698 | ||
| Aggregate distributable earnings (losses) | (326,128 | ) | ||
| Total Net Assets | $ | 77,859,570 | ||
| Shares issued and outstanding | 7,813,240 | |||
| Net asset value per share | $ | 9.97 | ||
See accompanying notes to the consolidated financial statements
13
Eagle Point Institutional Income Fund & Subsidiaries
Consolidated Schedule of Investments
As of June 30, 2024
(expressed in U.S. dollars)
(Unaudited)
| Issuer (1) | Investment (2) | Acquisition Date (3) | Principal Amount | Cost | Fair Value (4) | % of Net Assets | ||||||||||||||
| Investments at Fair Value (5) | ||||||||||||||||||||
| CLO Debt (6) | ||||||||||||||||||||
| Structured Finance | ||||||||||||||||||||
| United States | ||||||||||||||||||||
| Tralee CLO VII, Ltd. | Secured Note - Class E, 12.98% (3M SOFR + 7.65%, due 04/25/2034) | 06/02/22 | $ | 550,000 | $ | 492,852 | $ | 546,095 | 0.70 | % | ||||||||||
| Total CLO Debt | 492,852 | 546,095 | 0.70 | % | ||||||||||||||||
| CLO Equity (7) | ||||||||||||||||||||
| Structured Finance | ||||||||||||||||||||
| United States | ||||||||||||||||||||
| Ares LXII CLO Ltd. | Subordinated Note (effective yield 19.28%, maturity 01/25/2034) ⁽⁸⁾ | 01/18/24 | 4,750,000 | 3,223,390 | 3,124,277 | 4.01 | % | |||||||||||||
| Ares LXIV CLO Ltd. | Subordinated Note (effective yield 20.16%, maturity 04/15/2035) ⁽⁸⁾ | 01/26/23 | 600,000 | 447,428 | 462,375 | 0.59 | % | |||||||||||||
| Ares LXV CLO Ltd. | Subordinated Note (effective yield 20.67%, maturity 07/25/2034) ⁽⁸⁾ | 04/16/24 | 675,000 | 461,256 | 488,396 | 0.63 | % | |||||||||||||
| Ares LXIX CLO Ltd. | Income Note (effective yield 23.20%, maturity 04/15/2037) ⁽⁸⁾ ⁽⁹⁾ | 01/31/24 | 4,850,000 | 3,495,686 | 4,276,684 | 5.49 | % | |||||||||||||
| Ares LXXII CLO Ltd. | Income Note (effective yield 19.10%, maturity 07/15/2036) ⁽⁸⁾ ⁽⁹⁾ | 06/21/24 | 4,050,000 | 2,982,779 | 2,982,779 | 3.83 | % | |||||||||||||
| Ares Loan Funding IV, Ltd. | Subordinated Note (effective yield 17.24%, maturity 10/15/2036) ⁽⁸⁾ | 04/23/24 | 4,925,000 | 3,656,813 | 3,537,431 | 4.54 | % | |||||||||||||
| Bain Capital Credit CLO 2021-2, Limited | Subordinated Note (effective yield 22.17%, maturity 07/16/2034) ⁽⁸⁾ | 08/09/23 | 2,750,000 | 1,447,232 | 1,286,063 | 1.65 | % | |||||||||||||
| Bain Capital Credit CLO 2021-7, Limited | Subordinated Note (effective yield 20.12%, maturity 01/22/2035) ⁽⁸⁾ | 09/05/23 | 3,450,000 | 2,027,731 | 1,687,150 | 2.17 | % | |||||||||||||
| Bardot CLO, Ltd. | Subordinated Note (effective yield 34.85%, maturity 10/22/2032) ⁽⁸⁾ ⁽⁹⁾ | 11/22/22 | 275,000 | 156,751 | 124,095 | 0.16 | % | |||||||||||||
| Barings CLO Ltd. 2021-II | Subordinated Note (effective yield 18.15%, maturity 07/15/2034) ⁽⁸⁾ | 09/07/22 | 600,000 | 416,559 | 357,128 | 0.46 | % | |||||||||||||
| Barings CLO Ltd. 2022-II | Income Note (effective yield 32.08%, maturity 07/15/2072) ⁽⁸⁾ ⁽⁹⁾ | 06/21/22 | 1,000,000 | 366,930 | 522,485 | 0.67 | % | |||||||||||||
| Barings CLO Ltd. 2024-II | Income Note (effective yield 18.30%, maturity 07/15/2039) ⁽⁸⁾ ⁽⁹⁾ | 05/31/24 | 4,300,000 | 2,971,900 | 2,971,899 | 3.82 | % | |||||||||||||
| Battalion CLO XXIII Ltd. | Income Note (effective yield 18.81%, maturity 07/15/2036) ⁽⁸⁾ ⁽⁹⁾ | 05/19/22 | 600,000 | 414,662 | 293,557 | 0.38 | % | |||||||||||||
| Bear Mountain Park CLO, Ltd. | Income Note (effective yield 18.03%, maturity 07/15/2035) ⁽⁸⁾ ⁽⁹⁾ | 07/13/22 | 550,000 | 447,622 | 553,365 | 0.71 | % | |||||||||||||
| Belmont Park CLO, Ltd. | Income Note (effective yield 17.46%, maturity 04/15/2037) ⁽⁸⁾ ⁽⁹⁾ | 02/21/24 | 3,450,000 | 2,499,629 | 2,590,606 | 3.33 | % | |||||||||||||
| BlueMountain CLO XXIV Ltd. | Subordinated Note (effective yield 18.68%, maturity 04/20/2034) ⁽⁸⁾ | 05/31/22 | 750,000 | 455,429 | 336,896 | 0.43 | % | |||||||||||||
| Carlyle US CLO 2021-10, Ltd. | Subordinated Note (effective yield 17.59%, maturity 10/20/2034) ⁽⁸⁾ | 08/16/23 | 1,400,000 | 889,290 | 769,201 | 0.99 | % | |||||||||||||
| Carlyle US CLO 2022-2, Ltd. | Subordinated Note (effective yield 18.95%, maturity 04/20/2035) ⁽⁸⁾ | 08/15/23 | 2,775,000 | 1,959,326 | 1,846,739 | 2.37 | % | |||||||||||||
| Carlyle US CLO 2023-3, Ltd. | Income Note (effective yield 13.46%, maturity 10/15/2036) ⁽⁸⁾ ⁽⁹⁾ | 07/06/23 | 1,000,000 | 731,548 | 643,924 | 0.83 | % | |||||||||||||
| CIFC Funding 2019-V, Ltd. | Subordinated Note (effective yield 19.56%, maturity 01/15/2035) ⁽⁸⁾ | 02/07/23 | 650,000 | 462,515 | 450,292 | 0.58 | % | |||||||||||||
| CIFC Funding 2020-II, Ltd. | Subordinated Note (effective yield 21.68%, maturity 10/20/2034) ⁽⁸⁾ | 12/14/22 | 650,000 | 451,924 | 450,220 | 0.58 | % | |||||||||||||
| CIFC Funding 2022-IV, Ltd. | Subordinated Note (effective yield 18.59%, maturity 07/16/2035) ⁽⁸⁾ | 10/23/23 | 2,400,000 | 1,926,842 | 1,850,564 | 2.38 | % | |||||||||||||
| CIFC Funding 2022-VI, Ltd. | Income Note (effective yield 13.71%, maturity 07/16/2035) ⁽⁸⁾ ⁽⁹⁾ | 08/01/22 | 600,000 | 478,191 | 518,746 | 0.67 | % | |||||||||||||
| CIFC Funding 2023-I, Ltd. | Income Note (effective yield 19.75%, maturity 10/15/2037) ⁽⁸⁾ ⁽⁹⁾ | 09/14/23 | 4,350,000 | 3,388,293 | 3,692,650 | 4.74 | % | |||||||||||||
| Clover CLO 2019-1 Ltd. | Subordinated Note (effective yield 17.73%, maturity 04/18/2035) ⁽⁸⁾ | 02/15/24 | 1,831,800 | 1,299,567 | 1,293,618 | 1.66 | % | |||||||||||||
| Clover CLO 2021-2, Ltd. | Subordinated Note (effective yield 20.55%, maturity 07/20/2034) ⁽⁸⁾ | 08/09/23 | 2,150,000 | 1,423,512 | 1,494,691 | 1.92 | % | |||||||||||||
| Dryden 94 CLO, Ltd. | Income Note (effective yield 16.98%, maturity 07/15/2037) ⁽⁸⁾ ⁽⁹⁾ | 04/28/22 | 3,000,000 | 2,105,711 | 1,565,164 | 2.01 | % | |||||||||||||
| Dryden 109 CLO, Ltd. | Subordinated Note (effective yield 15.68%, maturity 04/20/2035) ⁽⁸⁾ | 02/15/23 | 775,000 | 582,713 | 440,317 | 0.57 | % | |||||||||||||
| Eaton Vance CLO 2020-1, Ltd. | Subordinated Note (effective yield 17.59%, maturity 10/15/2034) ⁽⁸⁾ | 08/08/23 | 1,985,000 | 1,403,385 | 1,281,295 | 1.65 | % | |||||||||||||
| Eaton Vance CLO 2020-2, Ltd. | Subordinated Note (effective yield 19.73%, maturity 01/15/2035) ⁽⁸⁾ | 09/16/22 | 650,000 | 436,683 | 412,144 | 0.53 | % | |||||||||||||
| Elmwood CLO 14 Ltd. | Subordinated Note (effective yield 19.11%, maturity 04/20/2035) ⁽⁸⁾ | 06/06/23 | 1,000,000 | 701,553 | 755,447 | 0.97 | % | |||||||||||||
| Elmwood CLO 17 Ltd. | Subordinated Note (effective yield 18.64%, maturity 07/17/2035) ⁽⁸⁾ | 04/25/23 | 650,000 | 468,164 | 516,316 | 0.66 | % | |||||||||||||
| Elmwood CLO 21 Ltd. | Subordinated Note (effective yield 14.33%, maturity 10/20/2036) ⁽⁸⁾ | 10/26/23 | 2,900,000 | 1,867,874 | 1,777,150 | 2.28 | % | |||||||||||||
| Generate CLO 3 Ltd. | Subordinated Note (effective yield 16.18%, maturity 10/20/2036) ⁽⁸⁾ | 04/23/24 | 5,874,000 | 3,377,550 | 3,254,164 | 4.18 | % | |||||||||||||
| Generate CLO 9 Ltd. | Subordinated Note (effective yield 24.06%, maturity 10/20/2034) ⁽⁸⁾ | 05/31/22 | 600,000 | 436,918 | 467,076 | 0.60 | % | |||||||||||||
| Kings Park CLO, Ltd. | Subordinated Note (effective yield 26.10%, maturity 01/21/2035) ⁽⁸⁾ | 04/27/23 | 925,000 | 543,489 | 594,780 | 0.76 | % | |||||||||||||
| Madison Park Funding XXXIV, Ltd. | Subordinated Note (effective yield 21.85%, maturity 04/25/2048) ⁽⁸⁾ | 09/27/22 | 750,000 | 436,739 | 433,915 | 0.56 | % | |||||||||||||
| Madison Park Funding LII, Ltd. | Subordinated Note (effective yield 16.51%, maturity 01/22/2035) ⁽⁸⁾ | 03/13/24 | 4,200,000 | 2,868,799 | 2,644,912 | 3.40 | % | |||||||||||||
| Madison Park Funding LXII, Ltd. | Subordinated Note (effective yield 13.53%, maturity 07/17/2036) ⁽⁸⁾ | 07/27/23 | 1,300,000 | 974,625 | 858,328 | 1.10 | % | |||||||||||||
| Morgan Stanley Eaton Vance CLO 2023-20, Ltd. | Subordinated Note (effective yield 15.33%, maturity 01/20/2037) ⁽⁸⁾ | 05/08/24 | 3,780,000 | 3,175,200 | 2,996,832 | 3.85 | % | |||||||||||||
| OCP CLO 2020-20, Ltd. | Subordinated Note (effective yield 18.09%, maturity 04/18/2037) ⁽⁸⁾ | 04/25/24 | 2,000,000 | 1,528,700 | 1,455,615 | 1.87 | % | |||||||||||||
| OCP CLO 2021-22, Ltd. | Preferred Share (effective yield 13.78%, maturity 12/02/2034) ⁽⁸⁾ | 05/08/24 | 1,650,000 | 1,256,063 | 1,131,149 | 1.45 | % | |||||||||||||
| OCP CLO 2021-22, Ltd. | Subordinated Note (effective yield 13.78%, maturity 12/02/2034) ⁽⁸⁾ | 05/08/24 | 1,500,000 | 1,141,875 | 1,028,317 | 1.32 | % | |||||||||||||
| OCP CLO 2023-30, Ltd. | Subordinated Note (effective yield 13.18%, maturity 01/24/2037) ⁽⁸⁾ | 05/10/24 | 3,600,000 | 2,992,500 | 2,690,117 | 3.46 | % | |||||||||||||
| Octagon Investment Partners 45, Ltd. | Subordinated Note (effective yield 21.03%, maturity 04/15/2035) ⁽⁸⁾ | 07/27/23 | 1,600,000 | 928,680 | 809,961 | 1.04 | % | |||||||||||||
| Octagon 58, Ltd. | Income Note (effective yield 19.81%, maturity 07/15/2037) ⁽⁸⁾ ⁽⁹⁾ | 04/21/22 | 3,000,000 | 2,032,076 | 1,855,332 | 2.38 | % | |||||||||||||
| Point Au Roche Park CLO, Ltd. | Subordinated Note (effective yield 23.15%, maturity 07/20/2034) ⁽⁸⁾ | 08/07/23 | 2,275,000 | 1,417,561 | 1,442,249 | 1.85 | % | |||||||||||||
| Regatta XXI Funding Ltd. | Subordinated Note (effective yield 16.29%, maturity 10/20/2034) ⁽⁸⁾ | 06/10/22 | 650,000 | 450,001 | 434,942 | 0.56 | % | |||||||||||||
| Regatta XXII Funding Ltd. | Subordinated Note (effective yield 22.44%, maturity 07/20/2035) ⁽⁸⁾ | 06/20/23 | 1,000,000 | 693,474 | 811,827 | 1.04 | % | |||||||||||||
| Regatta XXIV Funding Ltd. | Subordinated Note (effective yield 18.74%, maturity 01/20/2035) ⁽⁸⁾ | 02/14/23 | 700,000 | 435,223 | 447,042 | 0.57 | % | |||||||||||||
| Rockford Tower CLO 2022-3, Ltd. | Subordinated Note (effective yield 19.41%, maturity 01/20/2035) ⁽⁸⁾ | 07/27/23 | 1,400,000 | 995,750 | 1,276,784 | 1.64 | % | |||||||||||||
| RR 23 Ltd. | Subordinated Note (effective yield 17.11%, maturity 10/15/2035) ⁽⁸⁾ | 10/12/23 | 3,250,000 | 1,913,767 | 1,982,864 | 2.55 | % | |||||||||||||
| Shackleton 2019-XIV CLO, Ltd. | Subordinated Note (effective yield 21.54%, maturity 07/20/2034) ⁽⁸⁾ | 01/24/24 | 3,800,000 | 2,873,911 | 2,851,598 | 3.66 | % | |||||||||||||
| Venture 45 CLO, Ltd. | Subordinated Note (effective yield 14.39%, maturity 07/20/2035) ⁽⁸⁾ | 09/19/22 | 700,000 | 507,583 | 301,398 | 0.39 | % | |||||||||||||
| Wind River 2022-1 CLO Ltd. | Subordinated Note (effective yield 21.49%, maturity 07/20/2035) ⁽⁸⁾ | 08/15/23 | 3,118,610 | 2,005,980 | 1,699,357 | 2.18 | % | |||||||||||||
| Wind River 2022-2 CLO Ltd. | Income Note (effective yield 17.95%, maturity 07/20/2035) ⁽⁸⁾ ⁽⁹⁾ | 06/03/22 | 600,000 | 408,576 | 326,546 | 0.42 | % | |||||||||||||
| Total CLO Equity | 79,443,928 | 77,148,769 | 99.09 | % | ||||||||||||||||
| Loan Accumulation Facilities (10) | ||||||||||||||||||||
| Structured Finance | ||||||||||||||||||||
| United States | ||||||||||||||||||||
| Steamboat XLVIII Ltd. | Loan Accumulation Facility ⁽⁸⁾ | 04/08/24 | 887,250 | 887,250 | 892,754 | 1.15 | % | |||||||||||||
| Steamboat XLIX Ltd. | Loan Accumulation Facility ⁽⁸⁾ | 06/03/24 | 475,000 | 475,000 | 475,190 | 0.61 | % | |||||||||||||
| Total Loan Accumulation Facilities | 1,362,250 | 1,367,944 | 1.76 | % | ||||||||||||||||
| Total investments at fair value as of June 30, 2024 | $ | 81,299,030 | $ | 79,062,808 | 101.55 | % | ||||||||||||||
| Net assets above (below) fair value of investments | (1,203,238 | ) | ||||||||||||||||||
| Net Assets as of June 30, 2024 | $ | 77,859,570 | ||||||||||||||||||
(1) The Fund is not affiliated with, nor does it “control” (as such term is defined in the Investment Fund Act of 1940 (the “1940 Act”)), any of the issuers listed. In general, under the 1940 Act, the Fund would be presumed to “control” an issuer if it owned 25% or more of its voting securities.
(2) All securities exempt from registration under the Securities Act of 1933, and are deemed to be “restricted securities”.
(3) Acquisition date represents the initial purchase date of investment.
(4) Fair value is determined by the Adviser in accordance with written valuation policies and procedures, subject to oversight by the Fund’s Board of Trustees, in accordance with Rule 2a-5 under the 1940 Act.
(5) Country represents the principal country of risk where the investment has exposure.
(6) Variable rate investment. Interest rate shown reflects the rate in effect at the reporting date. Investment description includes the reference rate and spread.
(7) CLO subordinated notes and income notes are considered CLO equity positions. CLO equity positions are entitled to recurring distributions which are generally equal to the remaining cash flow of payments made by underlying assets less contractual payments to debt holders and fund expenses. The effective yield is estimated based upon the current projection of the amount and timing of these recurring distributions in addition to the estimated amount of terminal principal payment. It is the Fund's policy to update the effective yield for each CLO equity position held within the Fund’s portfolio at the initiation of each investment and each subsequent quarter thereafter. The effective yield and investment cost may ultimately not be realized. As of June 30, 2024, the Fund's weighted average effective yield on its aggregate CLO equity positions, based on current amortized cost, was 18.45%.
(8) Classified as Level III investments. See Note 3 “Investments” for further discussion.
(9) Fair value includes the Fund's interest in fee rebates on CLO subordinated and income notes.
(10) Loan accumulation facilities are financing structures intended to aggregate loans that may be used to form the basis of a CLO vehicle.
| Reference Key: | |
| SOFR | Secured Overnight Financing Rate |
See accompanying notes to the consolidated financial statements
14
Eagle Point Institutional Income Fund & Subsidiaries
Consolidated Statement of Operations
For the six months ended June 30, 2024
(expressed in U.S. dollars)
(Unaudited)
| INVESTMENT INCOME | ||||
| Interest income | $ | 5,451,787 | ||
| Other income | 109,029 | |||
| Total Investment Income | 5,560,816 | |||
| EXPENSES | ||||
| Incentive fee (Note 4) | 842,532 | |||
| Management fee (Note 4) | 572,822 | |||
| Amortization of offering costs (Note 4) | 427,162 | |||
| Administration fees (Note 4) | 227,084 | |||
| Professional fees | 226,392 | |||
| Transfer agent fees | 114,509 | |||
| Trustees’ fees | 53,153 | |||
| Tax Expense | 50,000 | |||
| Other expenses | 104,198 | |||
| Total Expenses | 2,617,852 | |||
| NET INVESTMENT INCOME | 2,942,964 | |||
| NET REALIZED AND UNREALIZED GAIN (LOSS) | ||||
| Net realized gain (loss) on investments | 97,688 | |||
| Net change in unrealized appreciation (depreciation) on investments | (2,093,049 | ) | ||
| NET REALIZED AND UNREALIZED GAIN (LOSS) | (1,995,361 | ) | ||
| NET INCREASE (DECREASE) IN NET ASSETS RESULTING FROM OPERATIONS | $ | 947,603 | ||
See accompanying notes to the consolidated financial statements
15
Eagle Point Institutional Income Fund & Subsidiaries
Consolidated Statements of Changes in Net Assets
(expressed in U.S. dollars, except share amounts)
(Unaudited)
| For the | For the | |||||||
| six months ended | year ended | |||||||
| June 30, 2024 | December 31, 2023 | |||||||
| Net Increase (decrease) in net assets resulting from operations: | ||||||||
| Net investment income | $ | 2,942,964 | $ | 3,691,383 | ||||
| Net realized gain (loss) on investments | 97,688 | 130,199 | ||||||
| Net change in unrealized appreciation (depreciation) on investments | (2,093,049 | ) | (91,023 | ) | ||||
| Total net increase (decrease) in net assets resulting from operations | 947,603 | 3,730,559 | ||||||
| Distributions to shareholders: | ||||||||
| Total earnings distributed | (3,097,749 | ) | (2,401,908 | ) | ||||
| Distributions from tax return of capital | — | — | ||||||
| Total distributions to shareholders | (3,097,749 | ) | (2,401,908 | ) | ||||
| Capital share transactions: | ||||||||
| Proceeds from shares sold | 30,147,643 | 32,544,606 | ||||||
| Reinvestment of distributions resulting in the issuance of shares | 1,123,295 | 1,360,921 | ||||||
| Repurchase of shares proceeds | (408,432 | ) | (60,866 | ) | ||||
| Total capital share transactions: | 30,862,506 | 33,844,661 | ||||||
| Total increase (decrease) in net assets | 28,712,360 | 35,173,312 | ||||||
| Net assets at beginning of period | 49,147,210 | 13,973,898 | ||||||
| Net assets at end of period | $ | 77,859,570 | $ | 49,147,210 | ||||
| Capital share activity: | ||||||||
| Shares sold | 2,937,114 | 3,271,466 | ||||||
| Shares sold pursuant to the Fund’s distribution reinvestment plan | 112,529 | 136,251 | ||||||
| Repurchase of shares | (39,771 | ) | (5,961 | ) | ||||
| Total increase (decrease) in capital share activity | 3,009,872 | 3,401,756 | ||||||
See accompanying notes to the consolidated financial statements
16
Eagle Point Institutional Income Fund & Subsidiaries
Consolidated Statement of Cash Flows
For the six months ended June 30, 2024
(expressed in U.S. dollars)
(Unaudited)
| CASH FLOWS FROM OPERATING ACTIVITIES: | ||||
| Net increase (decrease) in net assets from operations | $ | 947,603 | ||
| Adjustments to reconcile net increase (decrease) in net assets from operations to net cash provided by (used in) operating activities: | ||||
| Purchase of investments | (36,493,164 | ) | ||
| Proceeds from sales of investments and repayments of principal (1) | 2,834,314 | |||
| Net realized (gain) loss on investments | (97,688 | ) | ||
| Net change in unrealized (appreciation) depreciation on investments | 2,093,049 | |||
| Amortization (accretion) of premiums or discounts on CLO debt securities | (4,572 | ) | ||
| Change in assets and liabilities: | ||||
| Interest receivable | (857,022 | ) | ||
| Other assets | (53,721 | ) | ||
| Prepaid expenses | 25,049 | |||
| Incentive fee payable | 327,770 | |||
| Management fee payable | 473,657 | |||
| Professional fees payable | 99,827 | |||
| Administration fees payable | 65,828 | |||
| Trustees' fees payable | (97 | ) | ||
| Transfer agent fees payable | 31,024 | |||
| Other expenses payable | 43,977 | |||
| Net cash provided by (used in) operating activities | (30,564,166 | ) | ||
| CASH FLOWS FROM FINANCING ACTIVITIES: | ||||
| Distributions to shareholders | (3,097,749 | ) | ||
| Proceeds from shares sold | 30,147,643 | |||
| Reinvestment of distributions resulting in the issuance of shares | 1,123,295 | |||
| Repurchase of shares | (408,432 | ) | ||
| Offering costs paid and deferred | (263,854 | ) | ||
| Net cash provided by (used in) financing activities | 27,500,903 | |||
| NET INCREASE (DECREASE) IN CASH AND CASH EQUIVALENTS | (3,063,263 | ) | ||
| CASH AND CASH EQUIVALENTS, BEGINNING OF PERIOD | 5,942,067 | |||
| CASH AND CASH EQUIVALENTS, END OF PERIOD | $ | 2,878,804 | ||
(1) Proceeds from sales or maturity of investments includes $1,708,408 of return of capital on CLO equity investments from recurring cash flows.
See accompanying notes to the consolidated financial statements
17
Eagle Point Institutional Income Fund & Subsidiaries
Notes to Consolidated Financial Statements
June 30, 2024
(Unaudited)
| 1. | ORGANIZATION |
Eagle Point Institutional Income Fund (the “Fund”) was formed as a Delaware statutory trust on October 22, 2021, and is an externally managed, non-diversified closed-end management investment company registered under the Investment Company Act of 1940, as amended (the “1940 Act”). The Fund’s primary investment objective is to generate high current income, with a secondary objective to generate capital appreciation. The Fund seeks to achieve its investment objectives by investing primarily in equity and junior debt tranches of collateralized loan obligations (“CLOs”) that are collateralized by a portfolio consisting primarily of below investment grade U.S. senior secured loans with a large number of distinct underlying borrowers across various industry sectors. The Fund may also invest in other related securities and instruments or other securities and instruments that Eagle Point Credit Management LLC (the “Adviser”) believes are consistent with the Fund’s investment objectives, including senior debt tranches of CLOs, loan accumulation facilities (“LAFs”) and securities and instruments of corporate issuers. From time to time, in connection with the acquisition of CLO equity, the Fund may receive fee rebates from the CLO issuer. The CLO securities in which the Fund primarily seeks to invest are unrated or rated below investment grade and are considered speculative with respect to timely payment of interest and repayment of principal.
The Fund commenced operations on June 1, 2022 and is offering its shares of beneficial interest (“Shares”) on a continuous basis at the applicable period end net asset value (“NAV”) per share plus any applicable sales loads.
The Fund intends to operate so as to qualify to be taxed as a regulated investment company (“RIC”) under subchapter M of the Internal Revenue Code of 1986, as amended (the “Code”), for federal income tax purposes.
The Adviser is the investment adviser of the Fund and manages the investments of the Fund subject to the supervision of the Fund’s Board of Trustees (the “Board”). The Adviser is registered as an investment adviser with the U.S. Securities and Exchange Commission (the “SEC”) under the Investment Advisers Act of 1940, as amended. Eagle Point Administration LLC, an affiliate of the Adviser, is the administrator of the Fund (the “Administrator”).
The consolidated financial statements include the accounts of the Fund and its wholly-owned subsidiaries: EPIIF Sub (Cayman) Ltd. (“Sub I”), a Cayman Islands exempted company, and EPIIF Sub II (Cayman) Ltd. (“Sub II”), a Cayman Islands exempted company. All intercompany accounts and transactions have been eliminated upon consolidation. As of June 30, 2024, Sub I and Sub II represented 0.59% and 1.60% of the Fund’s net assets, respectively.
| 2. | SUMMARY OF SIGNIFICANT ACCOUNTING POLICIES |
Basis of Accounting
The consolidated financial statements have been prepared in conformity with U.S. generally accepted accounting principles (“U.S. GAAP”). The Fund is an investment company and follows the accounting and reporting guidance applicable to investment companies in the Financial Accounting Standards Board (“FASB”) Accounting Standards Codification (“ASC”) Topic 946 Financial Services – Investment Companies. Items included in the consolidated financial statements are measured and presented in United States dollars.
Use of Estimates
The preparation of financial statements in conformity with U.S. GAAP requires management to make estimates and assumptions which affect the reported amounts included in the consolidated financial statements and accompanying notes as of the reporting date. Actual results may differ from those estimates.
Valuation of Investments
The most significant estimate inherent in the preparation of the consolidated financial statements is the valuation of investments.
18
Eagle Point Institutional Income Fund & Subsidiaries
Notes to Consolidated Financial Statements
June 30, 2024
(Unaudited)
The Fund accounts for its investments in accordance with U.S. GAAP, and fair values its investment portfolio in accordance with the provisions of the FASB ASC Topic 820, Fair Value Measurements and Disclosures, which defines fair value, establishes a framework for measuring fair value and requires enhanced disclosures about fair value measurements. Investments are reflected in the consolidated financial statements at fair value. Fair value is the estimated amount that would be received to sell an asset, or paid to transfer a liability, in an orderly transaction between market participants at the measurement date (i.e., the exit price).
Pursuant to Rule 2a-5 under the 1940 Act adopted by the SEC in December 2020 (“Rule 2a-5”), the Board has elected to designate the Adviser as “valuation designee” to perform fair value determinations, subject to Board oversight and certain other conditions. In the absence of readily available market quotations, as defined by Rule 2a-5, the Adviser determines the fair value of the Fund’s investments in accordance with its written valuation policy approved by the Board. There is no single method for determining fair value in good faith. As a result, determining fair value requires judgment be applied to the specific facts and circumstances of each portfolio investment while employing a consistently applied valuation process for the types of investments held by the Fund. Due to the uncertainty of valuation, this estimate may differ significantly from the value that would have been used had a ready market for the investments existed, and the differences could be material.
The Fund determines fair value based on assumptions that market participants would use in pricing an asset or liability in an orderly transaction at the measurement date. When considering market participant assumptions in fair value measurements, the following fair value hierarchy prioritizes and ranks the level of market price observability used in measuring investments:
Level I – Unadjusted quoted prices in active markets for identical assets or liabilities that the Fund is able to access as of the reporting date.
Level II – Inputs, other than quoted prices included in Level I, that are observable either directly or indirectly as of the reporting date. These inputs may include (a) quoted prices for similar assets in active markets, (b) quoted prices for identical or similar assets in markets that are not active, (c) inputs other than quoted prices that are observable for the asset, or (d) inputs derived principally from or corroborated by observable market data by correlation or other means.
Level III – Pricing inputs are unobservable for the investment and little, if any, active market exists as of the reporting date. Fair value inputs require significant judgment or estimation from the Adviser.
In certain cases, inputs used to measure fair value may fall into different levels of the fair value hierarchy. In such cases, the determination of which category within the fair value hierarchy is appropriate for any given investment is based on the lowest level of input significant to that fair value measurement. The assessment of the significance of a particular input to the fair value measurement in its entirety requires judgment and consideration of factors specific to the investment.
Market price observability is impacted by a number of factors, including the type of investment, the characteristics specific to the investment and the state of the marketplace (including the existence and transparency of transactions between market participants). Investments with readily available actively quoted prices, or for which fair value can be measured from actively quoted prices in an orderly market, will generally have a higher degree of market price observability and a lesser degree of judgment used in measuring fair value.
Investments for which observable, quoted prices in active markets do not exist are reported at fair value based on Level III inputs. The amount determined to be fair value may incorporate the Adviser’s own assumptions (including assumptions the Adviser believes market participants would use in valuing investments and assumptions relating to appropriate risk adjustments for nonperformance and lack of marketability), as provided for in the Adviser’s valuation policy.
19
Eagle Point Institutional Income Fund & Subsidiaries
Notes to Consolidated Financial Statements
June 30, 2024
(Unaudited)
An estimate of fair value is made for each investment at least monthly taking into account information available as of the reporting date.
See Note 3 “Investments” for further discussion relating to the Fund’s investments.
Investment Income Recognition
Interest income from investments in CLO debt is recorded using the accrual basis of accounting to the extent such amounts are expected to be collected. Interest income on investments in CLO debt is generally expected to be received in cash. The Fund applies the provisions of Accounting Standards Update No. 2017-08 Premium Amortization on Purchased Callable Debt Securities (“ASU 2017-08”) in calculating amortization of premium for purchased CLO debt securities. Amortization of premium or accretion of discount is recognized using the effective interest method.
In certain circumstances, interest income may be paid in the form of additional investment principal, often referred to as payment-in-kind (“PIK”) interest. PIK interest is included in interest income and interest receivable through the payment date. The PIK interest rate for CLO debt securities represents the coupon rate at payment date when PIK interest is received. On the payment date, interest receivable is capitalized as additional investment principal in the CLO debt security. To the extent the Fund does not believe it will ultimately be able to collect PIK interest, the CLO debt security will be placed on non-accrual status, and previously recorded PIK interest income will be reversed. The Fund had no investments with PIK interest as of June 30, 2024.
CLO equity investments and fee rebates recognize investment income for U.S. GAAP purposes on the accrual basis utilizing an effective interest methodology based upon an effective yield to maturity utilizing projected cash flows. ASC Topic 325-40, Beneficial Interests in Securitized Financial Assets, requires investment income from CLO equity investments and fee rebates to be recognized under the effective interest method, with any difference between cash distributed and the amount calculated pursuant to the effective interest method being recorded as an adjustment to the cost basis of the investment. It is the Fund’s policy to update the effective yield for each CLO equity position held within the Fund’s portfolio at the initiation of each investment and each subsequent quarter thereafter.
LAFs recognize interest income according to the guidance noted in ASC Topic 325-40-35-1, Beneficial Interest in Securitized Financial Assets, which states that the holder of a beneficial interest in securitized financial assets shall determine interest income over the life of the beneficial interest in accordance with the effective yield method, provided such amounts are expected to be collected. FASB ASC 325-40-20 further defines “beneficial interests,” among other things, as “rights to receive all or portions of specified cash inflows received by a trust or other entity.” FASB ASC 325-40-15-7 also states that for income recognition purposes, beneficial interests in securitized financial assets (such as those in LAFs) are within the scope of ASC 325-40 because it is customary for certain industries, such as investment companies, to report interest income as a separate item in their income statements even though the investments are accounted for at fair value. The amount of interest income from LAFs recorded for the six months ended June 30, 2024 was $16,353.
Other Income
Other income includes the Fund’s share of income under the terms of fee rebate agreements.
Securities Transactions
The Fund records the purchase and sale of securities on trade date. Realized gains and losses on investments sold are recorded on the basis of the specific identification method.
Cash and Cash Equivalents
The Fund has defined cash and cash equivalents as cash and short-term, highly liquid investments with original maturities of three months or less from the date of purchase. The Fund maintains its cash in bank accounts, which, at times, may exceed federal insured limits. The Adviser monitors the performance of the financial institution where the accounts are held in order to manage any risk associated with such accounts.
20
Eagle Point Institutional Income Fund & Subsidiaries
Notes to Consolidated Financial Statements
June 30, 2024
(Unaudited)
Expense Recognition
Expenses are recorded on the accrual basis of accounting.
Prepaid Expenses
Prepaid expenses consist primarily of insurance premiums and state registration fees. Insurance premiums are amortized over the term of the current policy. State registration fees are amortized over twelve months from the time of payment.
Offering Costs
Offering costs of the Fund are capitalized and amortized to expense over the twelve month period following such capitalization on a straight line basis. Since inception of the Fund, a portion of the offering costs incurred by the Fund have been paid for by the Adviser, for which the Adviser has not yet sought reimbursement. See Note 4 “Related Party Transactions” for further discussion of the Fund’s offering costs.
Organization Costs
Organizational costs of the Fund are expensed as incurred. Since inception, organizational costs incurred by the Fund have been paid for the by the Adviser, for which it has not yet sought reimbursement. See Note 4 “Related Party Transactions” for further discussion of the Fund’s organizational costs.
Federal and Other Taxes
The Fund intends to operate so as to qualify to be taxed as a RIC under subchapter M of the Code and, as such, to not be subject to federal income tax on the portion of its taxable income and gains distributed to shareholders. To qualify for RIC tax treatment, among other requirements, the Fund is required to distribute at least 90% of its investment company taxable income, as defined by the Code.
Because U.S. federal income tax regulations differ from U.S. GAAP, distributions in accordance with tax regulations may differ from net investment income and realized capital gains recognized for financial reporting purposes. Differences may be permanent or temporary. Permanent differences are reclassified among capital accounts in the consolidated financial statements to reflect their tax character. Temporary differences arise when certain items of income, expense, gain or loss are recognized at some time in the future. Differences in classification may also result from the treatment of short-term capital gains as ordinary income for federal income tax purposes. The tax basis components of distributable earnings differ from the amounts reflected in the Consolidated Statement of Assets and Liabilities due to temporary book/tax differences arising primarily from partnerships and passive foreign investment company investments.
As of June 30, 2024, the federal income tax cost and net unrealized depreciation on securities were as follows:
| Cost for federal income tax purposes | $ | 76,633,494 | ||
| Gross unrealized appreciation | $ | 4,758,659 | ||
| Gross unrealized depreciation | (2,329,345 | ) | ||
| Net unrealized appreciation | $ | 2,429,314 |
Distributions
The composition of distributions paid to shareholders from net investment income and capital gains are determined in accordance with U.S. federal income tax regulations, which differ from U.S. GAAP. Distributions to shareholders can be comprised of net investment income, net realized capital gains and return of capital for U.S. federal income tax purposes and are intended to be paid monthly. Distributions payable to shareholders are recorded as a liability on ex-dividend date. If a shareholder opts-in to the Fund’s distribution reinvestment plan (the “DRIP”), distributions are automatically reinvested in full shares of the Fund as of the payment date, pursuant to the DRIP. The Fund’s shareholders who choose not to participate in the DRIP generally will receive all distributions in cash.
21
Eagle Point Institutional Income Fund & Subsidiaries
Notes to Consolidated Financial Statements
June 30, 2024
(Unaudited)
In addition to the regular monthly distributions, and subject to available taxable earnings of the Fund, the Fund may make periodic special distributions representing the excess of the Fund’s net taxable income over the Fund’s aggregate monthly distributions paid during the year (or for other purposes).
The characterization of distributions paid to shareholders, as set forth in the Consolidated Financial Highlights, reflect estimates made by the Fund for federal income tax purposes. Such estimates are subject to change once the final determination of the source of all distributions has been made by the Fund.
For the six months ended June 30, 2024, the Fund declared distributions to shareholders of $3,097,749 or $0.483 per share.
| 3. | INVESTMENTS |
Fair Value Measurement
The following tables summarize the valuation of the Fund’s investments measured and reported at fair value under the fair value hierarchy levels described in Note 2 “Summary of Significant Accounting Policies” as of June 30, 2024:
| Investments at Fair Value | Level I | Level II | Level III | Total | ||||||||||||
| CLO Debt | $ | — | $ | 546,095 | $ | — | $ | 546,095 | ||||||||
| CLO Equity | — | — | 77,148,769 | 77,148,769 | ||||||||||||
| Loan Accumulation Facilities | — | — | 1,367,944 | 1,367,944 | ||||||||||||
| Total Investments at Fair Value | $ | — | $ | 546,095 | $ | 78,516,713 | $ | 79,062,808 | ||||||||
Significant Unobservable Inputs
The following table summarizes the quantitative inputs and assumptions used for investments categorized within Level III of the fair value hierarchy as of June 30, 2024:
| Quantitative Information about Level III Fair Value Measurements | ||||||||||||
| Assets | Fair Value | Valuation Techniques/Methodologies | Unobservable Inputs | Range / Weighted Average (1) | ||||||||
| CLO Equity | $ | 71,194,091 | Discounted Cash Flows | Annual Default Rate (2) | 0.00% - 4.56% | |||||||
| Annual Prepayment Rate (3) | 25.00% | |||||||||||
| Reinvestment Spread | 3.38% - 3.96% / 3.57% | |||||||||||
| Reinvestment Price | 99.50% | |||||||||||
| Recovery Rate | 68.89% - 70.00% / 69.70% | |||||||||||
| Expected Yield (4) | 9.53% - 55.71% / 18.50% | |||||||||||
(1) Weighted average calculations are based on the fair value of investments.
(2) A weighted average is not presented as the input in the discounted cash flow model varies over the life of an investment.
(3) 0% is assumed for defaulted and non-performing assets.
(4) Represents yield based on fair value and projected future cash flow.
In addition to the techniques and inputs noted in the above table, the Adviser may use other valuation techniques and methodologies when determining the fair value measurements of the Fund’s investments, as provided for in the Adviser’s valuation policy approved by the Board. Please refer to Note 2 “Valuation of Investments”. The table is not intended to be all-inclusive, but rather provides information on the significant Level III inputs as they
22
Eagle Point Institutional Income Fund & Subsidiaries
Notes to Consolidated Financial Statements
June 30, 2024
(Unaudited)
relate to the Fund’s fair value measurements as of June 30, 2024. Unobservable inputs and assumptions are reviewed at each measurement date and updated as necessary to reflect current market conditions.
Increases (decreases) in the annual default rate, reinvestment price and expected yield in isolation would result in a lower (higher) fair value measurement. Increases (decreases) in the reinvestment spread and recovery rate in isolation would result in a higher (lower) fair value measurement. Changes in the annual prepayment rate may result in a higher (lower) fair value, depending on the circumstances. Generally, a change in the assumption used for the annual default rate may be accompanied by a directionally opposite change in the assumption used for the annual prepayment rate and recovery rate.
Certain of the Fund’s Level III investments have been valued using unadjusted inputs that have not been internally developed by the Adviser, including third-party transactions, recent transactions and data reported by trustees. As a result, investments with a fair value of $7,322,622 have been excluded from the preceding table.
Change in Investments Classified as Level III
The changes in investments classified as Level III are as follows for the year ended June 30, 2024:
| CLO Equity | Loan Accumulation Facilities | |||||||
| Balance as of January 1, 2024 | $ | 39,773,103 | $ | — | ||||
| Purchases of investments | 41,145,593 | 1,362,250 | ||||||
| Proceeds from sales, maturity of investments or return of capital | (1,708,408 | )(1) | — | |||||
| Net realized gains (losses) and net change in unrealized appreciation (depreciation) | (2,061,519 | ) | 5,694 | |||||
| Balance as of June 30, 2024(2) | $ | 77,148,769 | $ | 1,367,944 | ||||
| Change in unrealized appreciation (depreciation) on investments still held as of June 30, 2024 | $ | (2,061,522 | ) | $ | 5,694 | |||
(1) Includes $1,708,408 of return of capital on CLO equity investments from recurring cash flows and distributions from called deals.
(2) There were no transfers into or out of level III investments during the period.
The net realized gains (losses) recorded for Level III investments are reported in the net realized gain (loss) on investments account in the Consolidated Statement of Operations, if applicable. Net changes in unrealized appreciation (depreciation) are reported in the net change in unrealized appreciation (depreciation) on investments account in the Consolidated Statement of Operations.
Fair Value – Valuation Techniques and Inputs
The Adviser establishes valuation processes and procedures to ensure the valuation techniques are fair and consistent, and valuation inputs are supportable. The Adviser has a Valuation Committee comprised of various senior personnel of the Adviser, the majority of which are not members of the Fund’s portfolio management function. The Valuation Committee is responsible for overseeing the valuation process, evaluating the overall fairness and consistent application of the Adviser’s written valuation policies approved by the Board. The Valuation Committee reviews and approves the valuation on a monthly basis.
Valuation of CLO Equity
The Adviser utilizes the output of a financial model to estimate the fair value of CLO equity investments. The model contains detailed information on the characteristics of each CLO, including recent information about assets and liabilities from data sources such as trustee reports, and is used to project future cash flows to the CLO note tranches, as well as management fees. Key inputs to the model, including, but not limited to assumptions for
23
Eagle Point Institutional Income Fund & Subsidiaries
Notes to Consolidated Financial Statements
June 30, 2024
(Unaudited)
future loan default rates, recovery rates, prepayment rates, reinvestment rates and discount rates are determined by considering both observable and third-party market data and prevailing general market assumptions and conventions as well as those of the Adviser. Additionally, a third-party independent valuation firm is used as an input by the Adviser to determine the fair value of the Fund’s investments in CLO equity. The valuation firm’s advice is only one factor considered in the valuation of such investments, and the Adviser does not solely rely on such advice in determining the fair value of the Fund’s investments in accordance with the 1940 Act.
The Adviser categorizes CLO equity as Level III investments. Certain pricing inputs may be unobservable. An active market may exist, but not necessarily for CLO equity investments that the Fund holds as of the reporting date.
Valuation of CLO Debt
The Fund’s investments in CLO debt have been valued using an independent pricing service. The valuation methodology of the independent pricing service includes incorporating data comprised of observable market transactions, executable bids, broker quotes from dealers with two sided markets, as well as transaction activity from comparable securities to those being valued. As the independent pricing service contemplates real time market data and no unobservable inputs or significant judgment has been used by the Adviser in the valuation of the Fund’s investment in CLO debt, such positions are considered Level II assets.
Valuation of Loan Accumulation Facilities
The Adviser determines the fair value of LAFs in accordance with FASB ASC Topic 820, Fair Value Measurements and Disclosures, utilizing the income approach as noted in ASC 820-10-55-3F (the “Income Approach”), in which fair value measurement reflects current market expectations about the receipt of future amounts (i.e., exit price). LAFs are typically short- to medium-term in nature and formed to acquire loans on an interim basis that are expected to form part of a specific CLO transaction. Pursuant to LAF governing documents, loans acquired by the LAF are typically required to be transferred to the contemplated CLO transaction at original cost plus accrued interest. In such situations, because the LAF will receive its full cost basis in the underlying loan assets and the accrued interest thereon upon the consummation of the CLO transaction, the Adviser determines the fair value of the LAF as follows: (A) the cost of the Fund’s investment (i.e., the principal amount invested), and (B) to the extent the LAF has realized gains (losses) on its underlying loan assets which are reported by the Trustee during the applicable reporting period, its attributable portion of such realized gains (losses).
In certain circumstances, the LAF documents can contemplate transferring the underlying loans at a price other than original cost plus accrued interest or the Adviser may determine that, despite the initial expectation that a CLO transaction would result from a LAF, such a transaction is in fact unlikely to occur and, accordingly, it is unlikely the loans held by the LAF will be transferred at cost. Rather, the loans held by the LAF will most likely be sold at market value. In such situations, the Adviser will continue to fair value the LAF consistent with the Income Approach, but modify the fair value measurement to reflect the change in exit strategy of the LAF to incorporate market expectations of the receipt of future amounts (i.e., exit price). As such, the fair value of the LAF is most appropriately determined by reference to the market value of the LAF’s underlying loans, which is reflective of the price at which the LAF could sell its loan assets in an orderly transaction between market participants. As such, in these situations, the Adviser will continue utilizing the Income Approach and determine the fair value of the LAF as follows: (A) the cost of the Fund’s investment (i.e., the principal amount invested), (B) the Fund’s attributable portion of the unrealized gain (loss) on the LAF’s underlying loan assets, and (C) to the extent the LAF has realized gains (losses) on its underlying loan assets which are reported by the Trustee during the applicable reporting period, its attributable portion of such realized gains (losses). The Adviser’s measure of the Fund’s attributable portion of the unrealized gain (loss) on the LAF’s underlying loan assets takes into account the Adviser’s current market expectations of the receipt of future amounts on such assets, which may be impacted by various factors including any applicable change in market conditions or new information.
The Adviser categorizes LAFs as Level III investments. There is no active market and prices are unobservable.
24
Eagle Point Institutional Income Fund & Subsidiaries
Notes to Consolidated Financial Statements
June 30, 2024
(Unaudited)
Investment Risk Factors and Concentration of Investments
The following list is not intended to be a comprehensive list of all of the potential risks associated with the Fund. The Fund’s prospectus provides a detailed discussion of the Fund’s risks and considerations. The risks described in the prospectus are not the only risks the Fund faces. Additional risks and uncertainties not currently known to the Fund or that are currently deemed to be immaterial also may materially and adversely affect its business, financial condition and/or operating results.
Risks of Investing in CLOs and Other Structured Debt Securities
CLOs and other structured finance securities are generally backed by a pool of credit-related assets that serve as collateral. Accordingly, CLO and structured finance securities present risks similar to those of other types of credit investments, including default (credit), interest rate and prepayment risks. In addition, CLOs and other structured finance securities are often governed by a complex series of legal documents and contracts, which increases the risk of dispute over the interpretation and enforceability of such documents relative to other types of investments. There is also a risk that the trustee of a CLO does not properly carry out its duties to the CLO, potentially resulting in loss to the CLO. CLOs are also inherently leveraged vehicles and are subject to leverage risk.
Subordinated Securities Risk
CLO equity and junior debt securities that the Fund may acquire are subordinated to more senior tranches of CLO debt. CLO equity and junior debt securities are subject to increased risks of default relative to the holders of superior priority interests in the same CLO. In addition, at the time of issuance, CLO equity securities are under-collateralized in that the face amount of the CLO debt and CLO equity of a CLO at inception exceed its total assets. The Fund will typically be in a subordinated or first loss position with respect to realized losses on the underlying assets held by the CLOs in which the Fund is invested.
High Yield Investment Risk
The CLO equity and junior debt securities that the Fund acquires are typically rated below investment grade, or in the case of CLO equity securities unrated, and are therefore considered “higher yield” or “junk” securities and are considered speculative with respect to timely payment of interest and repayment of principal. The senior secured loans and other credit-related assets underlying CLOs are also typically higher yield investments. Investing in CLO equity and junior debt securities and other high yield investments involves greater credit and liquidity risk than investment grade obligations, which may adversely impact the Fund’s performance.
Leverage Risk
The use of leverage, whether directly or indirectly through investments such as CLO equity or junior debt securities that inherently involve leverage, may magnify the Fund’s risk of loss. CLO equity or junior debt securities are very highly leveraged (with CLO equity securities typically being leveraged ten times), and therefore the CLO securities in which the Fund invests are subject to a higher degree of risk of loss since the use of leverage magnifies losses.
Credit Risk
If (1) a CLO in which the Fund invests, (2) an underlying asset of any such CLO or (3) any other type of credit investment in the Fund’s portfolio declines in price or fails to pay interest or principal when due because the issuer or debtor, as the case may be, experiences a decline in its financial status, the Fund’s income, NAV and/or market price would be adversely impacted.
Key Personnel Risk
The Adviser manages our investments. Consequently, the Fund’s success depends, in large part, upon the services of the Adviser and the skill and expertise of the Adviser’s professional personnel. There can be no assurance that the professional personnel of the Adviser will continue to serve in their current positions or continue to be employed by the Adviser. We can offer no assurance that their services will be available for any length of time or that the Adviser will continue indefinitely as the Fund’s investment adviser.
25
Eagle Point Institutional Income Fund & Subsidiaries
Notes to Consolidated Financial Statements
June 30, 2024
(Unaudited)
Conflicts of Interest Risk
The Fund’s executive officers and trustees, and the Adviser and certain of its affiliates and their officers and employees, including the members of the Investment Committee, have several conflicts of interest as a result of the other activities in which they engage.
Prepayment Risk
The assets underlying the CLO securities in which the Fund invests are subject to prepayment by the underlying corporate borrowers. As such, the CLO securities and related investments in which the Fund invests are subject to prepayment risk. If the Fund or a CLO collateral manager are unable to reinvest prepaid amounts in a new investment with an expected rate of return at least equal to that of the investment repaid, the Fund’s investment performance will be adversely impacted.
Liquidity Risk
Generally, there is no public market for the CLO investments in which the Fund invests. As such, the Fund may not be able to sell such investments quickly, or at all. If the Fund is able to sell such investments, the prices the Fund receives may not reflect the Adviser’s assessment of their fair value or the amount paid for such investments by the Fund.
Incentive Fee Risk
The Fund’s incentive fee structure and the formula for calculating the fee payable to the Adviser may incentivize the Adviser to pursue speculative investments and use leverage in a manner that adversely impacts the Fund’s performance.
Fair Valuation of the Fund’s Portfolio Investments
Generally, there is no public market for the CLO investments and certain other credit assets in which the Fund may invest. The Adviser values these securities at least monthly, or more frequently as may be required from time to time, at fair value. The Adviser’s determinations of the fair value of the Fund’s investments have a material impact on the Fund’s net earnings through the recording of unrealized appreciation or depreciation of investments and may cause the Fund’s NAV on a given date to understate or overstate, possibly materially, the value that the Fund ultimately realizes on one or more of the Fund’s investments.
Limited Investment Opportunities Risk
The market for CLO securities is more limited than the market for other credit related investments. The Fund can offer no assurances that sufficient investment opportunities for the Fund’s capital will be available. In recent years there has been a marked increase in the number of, and flow of capital into, investment vehicles established to pursue investments in CLO securities whereas the size of this market is relatively limited. While the Fund cannot determine the precise effect of such competition, such increase may result in greater competition for investment opportunities, which may result in an increase in the price of such investments relative to the risk taken on by holders of such investments. Such competition may also result under certain circumstances in increased price volatility or decreased liquidity with respect to certain positions.
Non-Diversification Risk
The Fund is a non-diversified investment company under the 1940 Act and expect to hold a narrower range of investments than a diversified fund under the 1940 Act.
Market Risk
Political, regulatory, economic and social developments, and developments that impact specific economic sectors, industries or segments of the market, can affect the value of the Fund’s investments. A disruption or downturn in the capital markets and the credit markets could impair the Fund’s ability to raise capital, reduce the availability of suitable investment opportunities for the Fund, or adversely and materially affect the value of the Fund’s investments, any of which would negatively affect the Fund’s business. These risks may be magnified if certain events or developments adversely interrupt the global supply chain, and could affect companies worldwide.
26
Eagle Point Institutional Income Fund & Subsidiaries
Notes to Consolidated Financial Statements
June 30, 2024
(Unaudited)
Loan Accumulation Facilities Risk
The Fund may invest in LAFs, which are short to medium term facilities often provided by the bank that will serve as placement agent or arranger on a CLO transaction and which acquire loans on an interim basis which are expected to form part of the portfolio of a future CLO. Investments in LAFs have risks similar to those applicable to investments in CLOs. Leverage is typically utilized in such a facility and as such the potential risk of loss will be increased for such facilities employing leverage. In the event a planned CLO is not consummated, or the loans are not eligible for purchase by the CLO, the Fund may be responsible for either holding or disposing of the loans. This could expose the Fund to credit and/or mark-to-market losses, and other risks.
Currency Risk
Although the Fund primarily makes investments denominated in U.S. dollars, the Fund may make investments denominated in other currencies. The Fund’s investments denominated in currencies other than U.S. dollars will be subject to the risk that the value of such currency will decrease in relation to the U.S. dollar. The Fund may or may not hedge currency risk.
Hedging Risk
Hedging transactions seeking to reduce risks may result in poorer overall performance than if the Fund had not engaged in such hedging transactions. Additionally, such transactions may not fully hedge the Fund’s risks.
Reinvestment Risk
CLOs will typically generate cash from asset repayments and sales that may be reinvested in substitute assets, subject to compliance with applicable investment tests. If the CLO collateral manager causes the CLO to purchase substitute assets at a lower yield than those initially acquired or sale proceeds are maintained temporarily in cash, it would reduce the excess interest-related cash flow, thereby having a negative effect on the fair value of the Fund’s assets and the market value of the Fund’s securities. In addition, the reinvestment period for a CLO may terminate early, which would cause the holders of the CLO’s securities to receive principal payments earlier than anticipated. There can be no assurance that the Fund will be able to reinvest such amounts in an alternative investment that provides a comparable return relative to the credit risk assumed.
Interest Rate Risk
The price of certain of the Fund’s investments may be significantly affected by changes in interest rates, including recent increases in interest rates. Although senior secured loans are generally floating rate instruments, the Fund’s investments in senior secured loans through investments in junior equity and debt tranches of CLOs are sensitive to interest rate levels and volatility. For example, because the senior secured loans constituting the underlying collateral of CLOs typically pay a floating rate of interest, a reduction in interest rates would generally result in a reduction in the residual payments made to the Fund as a CLO equity holder (as well as the cash flow the Fund receives on the Fund’s CLO debt investments and other floating rate investments). Further, in the event of a significant rising interest rate environment and/or economic downturn, loan defaults may increase and result in credit losses that may adversely affect the Fund’s cash flow, fair value of the Fund’s assets and operating results. Because CLOs generally issue debt on a floating rate basis, an increase in the relevant reference rate will increase the financing costs of CLOs.
Refinancing Risk
If the Fund incurs debt financing and subsequently refinances such debt, the replacement debt may be at a higher cost and on less favorable terms and conditions. If the Fund fails to extend, refinance or replace such debt financings prior to their maturity on commercially reasonable terms, the Fund’s liquidity will be lower than it would have been with the benefit of such financings, which would limit the Fund’s ability to grow, and holders of the Fund’s shares would not benefit from the potential for increased returns on equity that incurring leverage creates.
27
Eagle Point Institutional Income Fund & Subsidiaries
Notes to Consolidated Financial Statements
June 30, 2024
(Unaudited)
Tax Risk
If the Fund fails to qualify for tax treatment as a RIC under Subchapter M of the Code for any reason, or otherwise becomes subject to corporate income tax, the resulting corporate taxes (and any related penalties) could substantially reduce the Fund’s net assets, the amount of income available for distributions to the Fund’s shareholders, and the amount of income available for payment of the Fund’s other liabilities.
Derivatives Risk
Derivative instruments in which the Fund may invest may be volatile and involve various risks different from, and in certain cases greater than, the risks presented by other instruments. The primary risks related to derivative transactions include counterparty, correlation, liquidity, leverage, volatility, over-the-counter trading, operational and legal risks. In addition, a small investment in derivatives could have a large potential impact on the Fund’s performance, effecting a form of investment leverage on the Fund’s portfolio. In certain types of derivative transactions, the Fund could lose the entire amount of the Fund’s investment; in other types of derivative transactions the potential loss is theoretically unlimited.
Counterparty Risk
The Fund may be exposed to counterparty risk, which could make it difficult for the Fund or the issuers in which the Fund invests to collect on obligations, thereby resulting in potentially significant losses.
Price Risk
Investors who buy shares at different times will likely pay different prices.
Global Risks
Due to highly interconnected global economies and financial markets, the value of the Fund’s securities and its underlying investments may go up or down in response to governmental actions and/or general economic conditions throughout the world. Events such as war, military conflict, acts of terrorism, social unrest, natural disasters, recessions, inflation, rapid interest rate changes, supply chain disruptions, sanctions, the spread of infectious illness or other public health threats could also significantly impact the Fund and its investments.
Banking Risk
The possibility of future bank failures poses risks of reduced financial market liquidity at clearing, cash management and other custodial financial institutions. The failure of banks which hold cash on behalf of the Fund, the Fund’s underlying obligors, the collateral managers of the CLOs in which the Fund invests (or managers of other securitized or pooled vehicles in which the Fund invests), or the Fund’s service providers could adversely affect the Fund’s ability to pursue its investment strategies and objectives. For example, if an underlying obligor has a commercial relationship with a bank that has failed or is otherwise distressed, such obligor may experience delays or other disruptions in meeting its obligations and consummating business transactions. Additionally, if a collateral manager has a commercial relationship with a distressed bank, the manager may experience issues conducting its operations or consummating transactions on behalf of the CLOs it manages, which could negatively affect the performance of such CLOs (and, therefore, the performance of the Fund).
Illiquid Shares Risk
The Fund’s shares are not publicly traded and the Fund does not expect a secondary market in the shares to develop in the foreseeable future, if ever. To provide shareholders with limited liquidity, the Fund intends to offer to repurchase shares from shareholders in each quarter in an amount up to 5% of the Fund’s NAV, calculated as of the prior calendar quarter end. The Board has complete discretion to determine whether the Fund will engage in any share repurchase, and if so, the terms of such repurchase. An investment in the Fund is not suitable for investors that require short-term liquidity.
28
Eagle Point Institutional Income Fund & Subsidiaries
Notes to Consolidated Financial Statements
June 30, 2024
(Unaudited)
| 4. | RELATED PARTY TRANSACTIONS |
Investment Advisory Agreement
Effective February 11, 2022, the Fund entered into an investment advisory agreement with the Adviser (the “Advisory Agreement”). Pursuant to the terms of the Advisory Agreement, the Fund will pay the Adviser a management fee and an incentive fee for its services.
Management fee
The management fee is calculated monthly and payable quarterly in arrears at an annual rate of 1.75% of the Fund’s “Managed Assets”, provided, that, if the Fund calculates its NAV more frequently than monthly, the management fee shall be calculated on the same frequency as the NAV is calculated. Managed Assets are defined as the Fund’s total assets (including assets attributable to the Fund’s use of leverage) minus the sum of the Fund’s accrued liabilities (other than liabilities incurred for the purpose of creating leverage). The Fund was charged a management fee of $572,822 for the six months ended June 30, 2024, and has a payable balance of $918,402 as of June 30, 2024. The payable balance includes $590,632 in management fees charged to the Fund for the period from June 1, 2022 (commencement of operations) to December 31, 2023.
Incentive fee
The incentive fee is payable quarterly, in arrears, on the pre-incentive fee net investment income (“PNII”) for the immediately preceding quarter. For this purpose, PNII means (a) interest income, dividend income and any other income (including any other fees, such as commitment, origination, structuring, diligence and consulting fees) accrued during the calendar quarter, minus (b) the Fund’s operating expenses for the quarter (including the management fee, expenses payable under the Administration Agreement (as defined below) to the Administrator, and any interest expense and/or dividends paid on any issued and outstanding debt or preferred stock, but excluding organizational and offering expenses and the incentive fee) after giving application to any reimbursement or recoupment under the ELA (as defined below). PNII includes, in the case of investments with a deferred interest feature (such as original issue discount, debt instruments payment-in-kind interest and zero coupon securities), accrued income that the Fund has not yet received in cash. PNII does not include any realized or unrealized capital gains or losses.
PNII, expressed as a rate of return on the value of the Fund’s net assets at the end of the immediately preceding calendar quarter, is compared to a hurdle rate of 2.00% per quarter. The Fund pays the Adviser an incentive fee with respect to the Fund’s PNII in each calendar quarter as follows: (1) no incentive fee in any calendar quarter in which the Fund’s PNII does not exceed the hurdle rate of 2.00%; (2) 100% of the Fund’s PNII with respect to that portion of such PNII, if any, exceeding the hurdle rate but equal to or less than 2.50% in any calendar quarter; and (3) 20% of the amount of the Fund’s PNII, if any, exceeding 2.50% in any calendar quarter. The Fund incurred incentive fees of $842,532 for the six months ended June 30, 2024, and has a payable balance of $1,548,578 as of June 30, 2024. The payable balance includes $1,074,921 in incentive fees charged to the Fund for the period from June 1, 2022 to December 31, 2023.
Administration Agreement
Effective February 11, 2022, the Fund entered into an administration agreement (the “Administration Agreement”) with the Administrator, an affiliate of the Adviser. Pursuant to the Administration Agreement, the Administrator performs, or arranges for the performance of, the Fund’s required administrative services, which include being responsible for the financial records which the Fund is required to maintain and preparing reports which are disseminated to the Fund’s shareholders. In addition, the Administrator provides the Fund with accounting services, assists the Fund in determining and publishing its NAV, oversees the preparation and filing of the Fund’s tax returns, monitors the Fund’s compliance with tax laws and regulations, and prepares and assists the Fund with any audit of the financial statements by an independent public accounting firm. The Administrator is also responsible for managing the printing and disseminating reports to the Fund’s shareholders and maintaining the Fund’s website, providing support to investor relations, generally overseeing the payment of the Fund’s expenses and the performance of administrative and professional services rendered to the Fund by others, and providing such other administrative services as the Fund may designate from time to time.
29
Eagle Point Institutional Income Fund & Subsidiaries
Notes to Consolidated Financial Statements
June 30, 2024
(Unaudited)
Payments under the Administration Agreement are equal to an amount based upon the Fund’s allocable portion of the Administrator’s overhead in performing its obligations under the Administration Agreement, including rent, the fees and expenses associated with performing compliance functions and the Fund’s allocable portion of the compensation of the Fund’s chief compliance officer, chief financial officer, chief operating officer and the Fund’s allocable portion of the compensation of any related support staff. The Fund’s allocable portion of such compensation is based on an allocation of the time spent on the Fund relative to other matters. To the extent the Administrator outsources any of its functions, the Fund pays the fees on a direct basis, without profit to the Administrator. For the period from June 1, 2022 (commencement of operations) to March 31, 2024, certain accounting and other administrative services had been delegated by the Administrator to UMB Fund Services, Inc. (“UMB”). Commencing April 1, 2024, the Fund transferred delegation of these services to ALPS Fund Services, Inc. (“SS&C ALPS”, collectively with UMB, the “Sub Administrators”). The Administration Agreement may be terminated by the Fund without penalty upon not less than sixty days’ written notice to the Administrator and by the Administrator upon not less than ninety days’ written notice to the Fund. The Administration Agreement is approved by the Board on an annual basis.
For the six months ended June 30, 2024, the Fund was charged a total of $227,084 in administration fees consisting of $177,035 and $50,049, relating to services provided by the Administrator and Sub Administrators, respectively, which are included in the Consolidated Statement of Operations and, of which $124,767 was payable as of June 30, 2024.
Expense Limitation and Reimbursement Agreement
On February 11, 2022, the Fund and the Adviser entered into an expense limitation and reimbursement agreement, which was amended and reinstated on February 13, 2024 (the “ELA”). Pursuant to the ELA, the Adviser may provide expense support by paying, directly or indirectly, the Fund’s operating expenses or waive fees due by the Fund to the Adviser or affiliates of the Adviser to the extent deems appropriate in the effort to limit expenses borne by the Fund. Expense support payments or fee waivers made by the Adviser may be subject to reimbursement from the Fund for up to three years after such expense support payment or waiver was made. Reimbursement to the Adviser must be approved by the Board prior to recoupment by the Adviser. The Adviser did not provide expense support for the six months ended June 30, 2024.
The following amounts are subject to reimbursement by the Adviser by the following dates:
| Period Ended | Expense Support Payments Due From Adviser | Expense Support Payments Reimbursed to Adviser | Unreimbursed Expense Support | Eligible to be Paid Through | |||||||||||
| June 30, 2022 | $ | 14,094 | $ | — | $ | 14,094 | June 30, 2025 | ||||||||
| September 30, 2022 | 53,891 | — | 53,891 | September 30, 2025 | |||||||||||
| December 31, 2022 | 172,748 | — | 172,748 | December 31, 2025 | |||||||||||
| March 31, 2023 | 181,991 | — | 181,991 | March 31, 2026 | |||||||||||
| June 30, 2023 | 205,617 | — | 205,617 | June 30, 2026 | |||||||||||
| September 30, 2023 | 413,782 | — | 413,782 | September 30, 2026 | |||||||||||
| December 31, 2023 | 623,430 | — | 623,430 | December 31, 2026 | |||||||||||
| Total | $ | 1,665,553 | $ | — | $ | 1,665,553 | |||||||||
Organizational and Offering Expense Support and Reimbursement Agreement
On February 11, 2022, the Fund and the Adviser entered into an organizational and offering (“O&O”) expense support and reimbursement agreement, which was amended and reinstated on February 13, 2024 (“O&O Agreement”). Pursuant to the O&O Agreement, the Fund may pay O&O expenses up to a limit of 1.50% of gross proceeds raised in the Fund’s offering of its shares. As of December 31, 2023, the fund had $308,599 in O&O expenses capitalized as a deferred asset in the Consolidated Statement of Assets and Liabilities. For the six months ended June 30, 2024, the fund incurred and capitalized additional offering expenses of $691,016, and amortized to expense on the Consolidated Statement of Operations $427,162 of capitalized offering expenses. In addition to offering expenses incurred by the Fund, the Adviser, on behalf of the Fund, paid O&O costs of approximately $2.2 million for the period from the Fund’s formation on October 22, 2021 to June 30, 2024. O&O expenses paid
30
Eagle Point Institutional Income Fund & Subsidiaries
Notes to Consolidated Financial Statements
June 30, 2024
(Unaudited)
by the Adviser are subject to reimbursement by the Fund up to three years after the date on which such O&O expenses were paid on the Fund’s behalf. Reimbursement must be approved by the Board. As of June 30, 2024, the Adviser has not sought reimbursement for any O&O expenses it incurred.
The following amounts may be subject to reimbursement by the Adviser by the following dates:
| O&O expenses paid by Adviser | Unreimbursed O&O expenses | Eligible to be paid through quarter ended | |||||||||
| $ | 35,093 | $ | 35,093 | December 31, 2024 | |||||||
| 560,093 | 560,093 | March 31, 2025 | |||||||||
| 351,412 | 351,412 | June 30, 2025 | |||||||||
| 150,629 | 150,629 | September 30, 2025 | |||||||||
| 227,336 | 227,336 | December 31, 2025 | |||||||||
| 126,179 | 126,179 | March 31, 2026 | |||||||||
| 324,003 | 324,003 | June 30, 2026 | |||||||||
| 116,004 | 116,004 | September 30, 2026 | |||||||||
| 249,796 | 249,796 | December 31, 2026 | |||||||||
| 44,753 | 44,753 | March 31, 2027 | |||||||||
| 57,740 | 57,740 | June 30, 2027 | |||||||||
| Total | $ | 2,243,038 | $ | 2,243,038 | |||||||
Exemptive Relief
On March 17, 2015, the SEC granted exemptive relief to the Adviser and its affiliates which permits the Fund to participate in certain negotiated co-investments alongside other accounts managed by the Adviser, or its affiliates, subject to certain conditions.
Affiliated Ownership
As of June 30, 2024, the Adviser and senior investment team held an aggregate of 18.14% of the Fund’s shares.
Dealer Manager
On March 1, 2024, the Fund entered into a dealer manager agreement (the “Dealer Manager Agreement”) with Eagle Point Securities LLC (the “Dealer Manager”), a registered broker-dealer and an affiliate of the Adviser. Pursuant to the terms of the Dealer Manager Agreement, the Dealer Manager acts as a distributor of the Fund’s shares on a best-efforts basis, subject to various conditions. Shares are offered for sale through the Dealer Manager at NAV plus any applicable sales load. Under the Dealer Manager Agreement, the Dealer Manager also provides certain marketing and wholesale services in consideration of receipt of a dealer manager fee.
Shareholders purchasing the Fund’s shares may pay a sales load of up to 6.75% of the investment amount. The 6.75% sales load is comprised of up to 6.0% selling commission and up to 0.75% dealer manager fee. For the six months ended June 30, 2024, the total amount of sales loads earned by the Dealer Manager was $1.0 million. The Dealer Manager may reallow a portion or all of the earned selling commissions and/or the dealer manager fees to participating broker-dealers and/or financial advisors for selling shares to their customers.
In addition, the Fund may reimburse the Adviser and its affiliates (including the Dealer Manager) for compensation of employees engaged in registering and marketing the Fund’s shares, which includes development of the Fund’s marketing materials and marketing presentations, training and education, and general coordination of the marketing process for the Fund. For the period from March 1, 2024, the date the Fund entered into the
31
Eagle Point Institutional Income Fund & Subsidiaries
Notes to Consolidated Financial Statements
June 30, 2024
(Unaudited)
Dealer Manager Agreement, to June 30, 2024, the Fund has reimbursed the Dealer Manager $0.1 million for such expenses.
| 5. | SHAREHOLDERS’ EQUITY |
The Fund offers its shares on a continuous basis at the applicable period end NAV per share plus any applicable sales load. The Fund’s authorized shares consist of 94,000,000 shares of beneficial interest.
For the six months ended June 30, 2024, the Fund sold 2,937,114 shares for total net proceeds to the Fund of $30.1 million.
For the six months ended June 30, 2024, the Fund issued 112,529 shares pursuant to the Fund’s distribution reinvestment plan for total net proceeds to the Fund of $1.1 million.
As of June 30, 2024, the Fund had 7,813,240 shares issued and outstanding.
Repurchases of Shares by the Fund
Subject to the Board’s discretion, the Fund conducts quarterly tender offers in accordance with the Fund’s share repurchase program in an amount up to 5% of the Fund’s NAV. The Fund may extend multiple offers to repurchase shares in a quarter in an aggregate amount of 5% of the Fund’s NAV. The following table summarizes the number of shares that were repurchased by the Fund for the six months ended June 30, 2024:
| Commencement Date | Valuation Date | Repurchase Price per Share | Shares Repurchased | Total Proceeds Paid for Repurchased Shares | ||||||||||
| November 30, 2023 | December 29, 2023 | $ | 10.23 | 13,527 | $ | 138,377 | ||||||||
| February 29, 2024 | March 28, 2024 | $ | 10.29 | 26,244 | $ | 270,055 | ||||||||
| 39,771 | $ | 408,432 | ||||||||||||
| 6. | COMMITMENTS AND CONTINGENCIES |
The Fund is not currently subject to any material legal proceedings. From time to time, the Fund may be a party to certain legal proceedings in the ordinary course of business, including proceedings relating to the enforcement of the Fund’s rights under contracts. While the outcome of these legal proceedings cannot be predicted with certainty, the Fund does not expect these proceedings will have a material effect upon its financial condition or results of operations.
As of June 30, 2024, the Fund has received support from the Adviser pursuant to the O&O Agreement and ELA which may be subject to reimbursement in the future. See Note 4 “Related Party Transactions” for further details. The Fund had no other unfunded commitments as of June 30, 2024.
| 7. | INDEMNIFICATIONS |
Under the Fund’s organizational documents, its officers and trustees are indemnified against certain liabilities arising out of the performance of their duties to the Fund. In addition, during the normal course of business, the Fund enters into contracts containing a variety of representations which provide general indemnifications. The Fund’s maximum exposure under these agreements cannot be known; however, the Fund expects any risk of loss to be remote.
| 8. | REVOLVING CREDIT FACILITY |
The Fund may utilize leverage to the extent permitted by the 1940 Act. The Fund may obtain leverage using any form of financial leverage instruments, including funds borrowed from banks or other financial institutions, margin facilities, notes or preferred stock and leverage attributable to repurchase agreements or similar
32
Eagle Point Institutional Income Fund & Subsidiaries
Notes to Consolidated Financial Statements
June 30, 2024
(Unaudited)
transactions. Instruments that create leverage are generally considered to be senior securities under the 1940 Act. The use of leverage creates an opportunity for increased net income and capital appreciation, but also creates additional risks and expenses which will be borne entirely by common stockholders. The Fund’s leverage strategy may not ultimately be successful.
On June 28, 2024 the Fund entered into a credit agreement with BNP Paribas, as lender, that established a revolving credit facility (the “Revolving Credit Facility”). Pursuant to the terms of the Revolving Credit Facility, the Fund can borrow up to an aggregate principal balance of $25.0 million (the “Commitment Amount”). The Revolving Credit facility is collateralized by certain investments held by the Fund. The Fund has granted a security interest in certain assets to BNP Paribas, as lender. Such borrowings under the Revolving Credit Facility bear interest at Term SOFR plus a spread under the credit agreement. The Fund is required to pay a commitment fee on the unused amount.
The Revolving Credit Facility will mature on the earlier of (i) the termination of the Commitment, as defined by the terms of the Revolving Credit Facility or (ii) the scheduled maturity date of June 28, 2025. The Fund has the option to extend the maturity from time to time in accordance with the credit agreement.
As of June 30, 2024, the Fund had no outstanding borrowings.
| 9. | RECENT ACCOUNTING PRONOUNCEMENTS |
In June 2022, the FASB issued Accounting Standards Update No. 2022-03 (“ASU 2022-03”) related to FASB ASC Topic 820 Fair Value Measurements - Fair Value Measurement of Equity Securities Subject to Contractual Sale Restrictions. This change prohibits entities from taking into account contractual restrictions on the sale of equity securities when estimating fair value and introduces required disclosures for such transactions. The Fund has fully adopted the provisions of ASU 2022-03, which did not have a material impact on the Fund’s consolidated financial statements and related disclosures.
| 10. | SUBSEQUENT EVENTS |
Pursuant to the continuous offering, in the period from July 1, 2024 through August 27, 2024, the Fund issued shares for total net proceeds to the Fund of $10.8 million.
On July 19, 2024, the Fund paid $1,843,601 related to the repurchase of 184,915 shares in accordance with the tender offer that commenced May 31, 2024.
On July 31, 2024, the Fund paid a distribution of $0.0830 per share to shareholders of record as of July 23, 2024.
Management of the Fund has evaluated the need for disclosures and/or adjustments resulting from subsequent events through the date of release of this report. Management has determined there are no events in addition to those described above which would require adjustment to or disclosure in the consolidated financial statements and related notes through the date of release of this report.
33
Eagle Point Institutional Income Fund & Subsidiaries
Consolidated Financial Highlights
(Unaudited)
| Per Share Data | For the six months ended June 30, 2024 | For the year ended December 31, 2023 | For the period from June 1, 2022 (Commencement of Operations) through December 31, 2022 | |||||||||
| Net asset value at beginning of period | $ | 10.23 | $ | 9.97 | $ | 10.00 | ||||||
| Net investment income (1) | 0.46 | 1.40 | 0.52 | |||||||||
| Net realized gain (loss) and change in unrealized appreciation (depreciation) on investments (1)(2) | (0.23 | ) | (0.23 | ) | (0.08 | ) | ||||||
| Net income (loss) and net increase (decrease) in net assets resulting from operations (1) | 0.23 | 1.17 | 0.44 | |||||||||
| Distributions to shareholders from net investment income (3) | (0.48 | ) | (0.91 | ) | (0.08 | ) | ||||||
| Distributions to shareholders from net realized gains on investments (3) | — | — | — | |||||||||
| Distributions to shareholders from tax return of capital (3) | — | — | (0.38 | ) | ||||||||
| Total distributions declared to shareholders | (0.48 | ) | (0.91 | ) | (0.46 | ) | ||||||
| Distributions to shareholders based on weighted average shares impact(4) | (0.01 | ) | (0.00 | ) | (0.01 | ) | ||||||
| Total distributions to shareholders | (0.49 | ) | (0.91 | ) | (0.47 | ) | ||||||
| Net asset value at end of period | $ | 9.97 | $ | 10.23 | $ | 9.97 | ||||||
| Total net asset value return (5) | 2.26 | % | 12.35 | % | 4.30 | % | ||||||
| Shares outstanding at end of period | 7,813,240 | 4,803,369 | 1,401,613 | |||||||||
| Ratios and Supplemental Data: | ||||||||||||
| Net asset value at end of period | $ | 77,859,570 | $ | 49,147,210 | $ | 13,973,898 | ||||||
| Ratio of expenses to average net assets, before expense support (6) | 8.01 | % | 9.93 | % | 9.62 | % | ||||||
| Ratio of expenses to average net assets, after expense support (7) | 8.01 | % | 4.54 | % | 6.35 | % | ||||||
| Ratio of net investment income to average net assets (7) | 9.00 | % | 13.95 | % | 10.34 | % | ||||||
| Portfolio turnover rate (8) | 4.66 | % | 11.74 | % | 4.63 | % | ||||||
Footnotes to Financial Highlights:
| (1) | Per share amounts are based on weighted average of shares outstanding for the period. |
| (2) | Net realized gain (loss) and change in unrealized appreciation (depreciation) on investments includes a balancing figure to reconcile to the change in NAV per share at the end of each period. The amount per share may not agree with the change in the aggregate net realized gain (loss) and change in unrealized appreciation (depreciation) on investments for the period because of the timing of issuance of the Fund’s shares in relation to fluctuating market values for the portfolio. |
| (3) | The information provided is based on estimates available at each respective period. The Fund’s final taxable income and the actual amount required to be distributed will be finally determined when the Fund files its final tax returns and may vary from these estimates. |
| (4) | Represents the difference between the per share amount distributed to shareholders of record and the per share amount distributed based on the weighted average of shares outstanding for the period. |
| (5) | Total return for the six months ended June 30, 2024 and for the period from June 1, 2022 to December 31, 2022 are not annualized. Total return is calculated based on a change in NAV per share between the beginning and end of period NAV per share and assumes distributions paid to shareholders during the period were reinvested in accordance with the Fund’s distribution reinvestment plan. |
| (6) | Ratios for the six months ended June 30, 2024 and for the period from June 1, 2022 to December 31, 2022 are annualized. Ratios for the six months ended June 30, 2024, the year ended December 31, 2023 and the period from June 1, 2022 to December 31, 2022 exclude expense limitation provided by the Adviser. |
| (7) | Ratios for the six months ended June 30, 2024 and for the period from June 1, 2022 to December 31, 2022 are annualized. Ratios for the six months ended June 30, 2024, the year ended December 31, 2023 and the period from June 1, 2022 to December 31, 2022 reflect expense limitation provided by the Adviser. |
| (8) | The portfolio turnover rate is calculated as the lesser of total investment purchases executed during the period or the total investment sales executed during the period and repayments of principal, divided by the average fair value of investments for the same period. |
34
Distribution Reinvestment Plan
Subject to our discretion and applicable legal restrictions, we intend to authorize and declare ordinary cash distributions on a quarterly basis and pay such distributions on a monthly basis. We have adopted an “opt in” distribution reinvestment plan (“DRIP”) pursuant to which shareholders may elect to have the full amount of your cash distributions reinvested in additional Shares. Shares will be issued pursuant to the DRIP at a price equal to 95% of their most recently determined net asset value as of the payment date (generally the last business day of each calendar month). There is no sales load or other charge for distributions reinvestment. A request must be received by the Fund before the record date to be effective for that dividend or capital gain distribution. Participants in our DRIP are free to elect or revoke reinstatement in the DRIP within a reasonable time as specified in the plan. If shareholders elect to participate in the DRIP, distributions on Shares are automatically reinvested in additional Shares by one or more affiliates of SS&C Technologies Holdings, Inc. (collectively, “SS&C”), or the “DRIP Agent.” Holders of our Shares who receive distributions in the form of additional Shares are nonetheless required to pay applicable federal, state or local taxes on the reinvested distribution and will not receive a corresponding cash distribution with which to pay any applicable tax. Reinvested distributions increase our Shareholders’ equity on which a management fee is payable to the Adviser.
We and the DRIP Agent reserve the right to amend or terminate the DRIP upon written notice to each participant at least 30 days before the record date for the payment of any dividend or distribution by us.
All correspondence or additional information about the DRIP should be directed to SS&C, at (833) 360-5520 or by mail: 80 Lamberton Rd, Windsor, Connecticut 06095.
35
Investment Advisory Agreement
At a meeting held on May 15, 2024, the Board of Eagle Point Institutional Income Fund, including all of the Independent Trustees (voting separately), unanimously voted to approve the continuation and renewal of the existing investment advisory agreement (the “Investment Advisory Agreement”) by and between the Fund and the Adviser for an additional one-year period.
In reaching a decision to approve the continuation and renewal of the Investment Advisory Agreement, the Board, assisted by the advice of fund counsel, requested and received a significant amount of information and considered all the factors the Board believed relevant, including, among other things, the following: (1) the nature, extent and quality of services performed by the Adviser, including the investment performance of the Fund, other comparable registered investment companies and certain other accounts advised by the Adviser; (2) information regarding the fees and other expenses paid by the Fund, including the cost of services provided by the Adviser and its affiliate; (3) the profitability to the Adviser of its relationship with the Company, including certain ancillary and other benefits received by the Adviser; (4) comparative information on fees and expenses borne by other comparable registered investment companies, and certain other accounts advised by the Adviser; (5) the extent to which economies of scale would be realized as the Fund grows and whether fee levels reflect these economies of scale for the benefit of the Fund’s investors; and (6) various other factors.
The Board’s decision to renew the Investment Advisory Agreement was not based on any single factor, but rather was based on a comprehensive consideration of the information provided to the Board at its meetings throughout the year. The Board did not assign relative weights to the factors considered by it as the Board conducted an overall analysis of these factors. Individual members of the Board may have given different weights to different factors.
The Board requested, considered and evaluated information regarding the following factors, among others:
Nature, Extent and Quality of Services and Performance
The Board reviewed and considered the nature, extent and quality of the services provided by the Adviser under the Investment Advisory Agreement and by its affiliate under a separate administration agreement and the services provided to the Fund by third party service providers. Among other things, the Board reviewed the most recent Form ADV for the Adviser and information about the qualifications, background and experience of the staff and personnel of the Adviser primarily responsible for the day-to-day portfolio management of the Fund, including their experience in managing portfolios of CLO securities and the CLO industry knowledge of the Adviser’s senior investment team.
The Board also evaluated the ability of the Adviser to attract and retain high-caliber professional personnel. In this regard, the Board considered information regarding the Adviser’s and its affiliates’ compensation program, which is designed to align personnel interests with the long-term success of the Adviser’s clients, including the Fund.
In addition, the Board reviewed information about the Adviser’s investment process, financial stability, risk management program, and legal and compliance program. The Board noted that the Fund does not currently utilize any forms of direct leverage, but considered the Fund’s potential use of leverage, the different forms of leverage proposed to be used by the Fund, and the effect of such leverage may have on the Fund’s portfolio, profitability and performance.
The Board then reviewed and considered the Fund’s performance results in terms of total return on a net asset value basis (i.e., book basis) during the 1-year period ended March 31, 2024 and the period from June 1, 2022 (the Fund’s inception date) to March 31, 2024, and considered such performance in light of the Fund’s investment objective, strategies and risks.
The Board also considered and discussed the performance results for various periods of (1) non-traded registered closed-end funds managed by third party investment advisers that allocate a significant portion of their capital to CLO debt and equity securities and other related securities (the “Peer Funds”), (2) funds and accounts managed by the Adviser and its affiliates that are comparable to the Fund in terms of investment objectives, policies, eligible portfolio investments and certain other characteristics (the “Comparable Accounts”), and (3) a composite of estimates of CLO equity performance published by several Wall Street research firms. The Board considered that the Fund launched in 2022 and had limited historical performance for
36
the Board to review. The Board considered the Adviser’s explanation of the differences between the Fund’s and the Peer Funds’ strategies and portfolios. The Board also discussed and considered the Company’s recent performance in light of recent and current market conditions.
The Board also noted certain distinguishing features between the Fund, the Peer Funds and the Comparable Accounts.
Based on the above factors, together with those referenced below, the Board concluded that it was generally satisfied with, and that the Fund should continue to benefit from, the nature, extent and quality of services provided to the Fund by the Adviser.
Investment Advisory Fee Rates and Total Expense Ratio
The Board then reviewed and considered the advisory fee rates, including the base management fee and incentive fee, payable by the Fund to the Adviser under the Investment Advisory Agreement and the total expense ratio of the Fund and any voluntary waivers thereof by the Adviser during the 2023 calendar year. Additionally, the Board considered a comparison of the advisory fee rates and total expense ratio of the Company with those of the Peer Funds and certain of the Comparable Accounts.
The Board noted that the Fund’s contractual management fee rate was higher than that of two of the Peer Funds, lower than or the same as that of three of the Peer Funds and lower than the average contractual management fee rate of the Peer Funds that invest at least 75% of their assets in CLO equity securities. The Board noted that the Fund’s incentive fee rate and its incentive fee hurdle were each higher than or the same as those of the Peer Funds except that one of the Peer Funds did not charge an incentive fee. The Board further considered that the Fund’s net expense ratio was higher than that of the average net expense ratio of the Peer Funds. Among other things, the Board considered the differences between the investment strategy of the Fund and the strategy of each of the Peer Funds.
The Board also compared the advisory fee rates paid by each of the Fund and the Comparable Accounts to the Adviser. The Board noted the differences in the fee structures and that such differences could cause the Fund to pay a higher or lower effective advisory fee rate than Comparable Accounts in certain circumstances. The Board considered that the different rate structures are driven by investor expectations for the different fund structures and strategies, the additional complexity of the Adviser’s investment strategy in the regulatory and tax environment applicable to the Fund’s portfolio and the costs associated with operating as an investment adviser for a registered investment company.
In considering the advisory fee rates, the Board also discussed the Fund’s potential use of leverage. The Board noted that while the Adviser believes that the prudent use of leverage is in the best interests of the Fund and its shareholders, the use of leverage has the potential to increase the Adviser’s base management fee and incentive fee, and therefore may create a conflict of interest with the Fund’s shareholders.
Based on its review, the Board concluded that each of the Fund’s advisory fee rates and total expense ratio is fair and reasonable in light of the services provided to the Fund and other factors considered.
Profitability
The Board also considered that due to the difficulty of projecting future asset raising with a reasonable degree of certainty (as well as the relative size of future fixed costs) and other factors, the Adviser was unable to provide a reliable estimate of projected profitability to the Adviser from its relationship with the Fund.
Economies of Scale
The Board considered the potential growth of the Fund and information regarding whether the Investment Advisory Agreement adequately addresses economies of scale with respect to providing advisory services to the Fund. The Board considered that, given (1) the complexity and time required to manage and monitor the types of CLO securities in which the Fund invests, (2) the resource-intensive nature of acquiring and disposing of certain of the Fund’s investments in the primary markets (particularly with respect to CLO equity investments), and (3) the limited size of individual CLO transactions, any growth in the Fund’s assets would be expected to require and had required additional investment resources, including personnel, and therefore generally would not meaningfully reduce the per unit cost of managing the portfolio. Based on the foregoing, the
37
Board concluded that the opportunity of the Fund to realize significant economies of scale is limited and that the lack of breakpoints in the fee structure was appropriate given the Fund’s investment objectives and strategies.
Other Benefits
The Board considered other benefits to the Adviser and its affiliates derived from their relationship with the Fund. The Board considered the Adviser’s representation that these ancillary benefits could not be appropriately valued.
Based on the information reviewed and the discussions detailed above, the Board reached a determination, through the exercise of its business judgment, that the compensation payable to the Adviser pursuant to the Investment Advisory Agreement was fair and reasonable in light of the services provided to the Fund by the Adviser and other factors considered.
Portfolio Information
The Fund files its complete schedule of portfolio holdings with the SEC for the first and third quarters of each fiscal year as an exhibit to its reports on Form N-PORT. The Fund Form N-PORT is available without charge, upon request by calling (203) 340-8500, or from the EDGAR Database on the SEC’s website (www.sec.gov).
Proxy Voting Records
The Fund has delegated its proxy voting responsibility to the Adviser. A description of these policies and procedures is available (1) without charge, upon request, by calling toll free (844) 810-6501; and (2) in the Fund’s prospectus, filed with the SEC, which can be found on the SEC’s website (www.sec.gov).
Information regarding how we voted proxies relating to portfolio securities during the most recent 12-month period ended June 30 is available: (1) without charge, upon request, by calling toll free (844) 810-6501; and (2) in the Fund’s Form N-PX filing, which can be found on the SEC’s website (www.sec.gov). You may also obtain information about how we voted proxies by making a written request for proxy voting information to: Eagle Point Credit Management LLC, 600 Steamboat Road, Suite 202, Greenwich, CT 06830.
Privacy Notice
The Fund is committed to protecting your privacy. This privacy notice explains the privacy policies of Eagle Point Institutional Income Fund and its affiliated companies. The terms of this notice apply to both current and former shareholders. The Fund will safeguard, according to strict standards of security and confidentiality, all information it receives about you. With regard to this information, the Fund maintains procedural safeguards that are reasonably designed to comply with federal standards. We have implemented procedures that are designed to restrict access to your personal information to authorized employees of the Fund’s investment adviser, Eagle Point Credit Management LLC and its affiliates who need to know your personal information to perform their jobs, and in connection with servicing your account. The Fund’s goal is to limit the collection and use of information about you. While we may share your personal information with our affiliates in connection with servicing your account, our affiliates are not permitted to share your information with non-affiliated entities, except as permitted or required by law.
When you purchase shares of the Fund and in the course of providing you with products and services, we and certain of our service providers, such as a transfer agent, may collect personal information about you, such as your name, address, social security number or tax identification number. This information may come from sources such as account applications and other forms, from other written, electronic or verbal correspondence, from your transactions, from your brokerage or financial advisory firm, financial adviser or consultant, and/or information captured on applicable websites.
We do not disclose any personal information provided by you or gathered by us to non-affiliated third parties, except as permitted or required by law or for our everyday business purposes, such as to process transactions or service your account. For example, we may share your personal information in order to send you annual and semiannual reports and other information required by law, and to send you information the Fund believes may be of interest to you. We may disclose your personal information to unaffiliated third party financial service providers (which may include a custodian, transfer agent, accountant or
38
financial printer) who need to know that information in order to provide services to you or to the Fund. These companies are required to protect your information and use it solely for the purpose for which they received it or as otherwise permitted by law. We may also provide your personal information to your brokerage or financial advisory firm and/or to your financial adviser or consultant, as well as to professional advisors, such as accountants, lawyers and consultants.
We reserve the right to disclose or report personal or account information to non-affiliated third parties in limited circumstances where we believe in good faith that disclosure is required by law, such as in accordance with a court order or at the request of government regulators or law enforcement authorities or to protect our rights or property. We may also disclose your personal information to a non-affiliated third party at your request or if you consent in writing to the disclosure.
If you have any queries or concerns about the privacy of your personal information, please contact our investor relations team (203) 340-8500.
We will review this policy from time to time and may update it at our discretion.
* * *
39
End of Semiannual Report. Back Cover Follows.

Item 2. Code of Ethics
The information required by this Item is only required in an annual report on this Form N-CSR.
Item 3. Audit Committee Financial Expert
The information required by this Item is only required in an annual report on this Form N-CSR.
Item 4. Principal Accountant Fees and Services
The information required by this Item is only required in an annual report on this Form N-CSR.
Item 5. Audit Committee of Listed Registrant
The information required by this Item is only required in an annual report on this Form N-CSR.
Item 6. Investments
A schedule of investments is included in the Company’s report to stockholders under Item 1.
Item 7. Disclosure of Proxy Voting Policies and Procedures for Closed-End Management Investment Companies
The information required by this Item is only required in an annual report on this Form N-CSR.
Item 8. Portfolio Managers of Closed-End Investment Companies
| (a) | The information required by this Item is only required in an annual report on this Form N-CSR. |
| (b) | There has been no change, as of the date of the filing of this N-CSR, to any of the portfolio managers identified in response to this item in the Registrant’s most recent annual report on Form N-CSR. |
Item 9. Purchases of Equity Securities by Closed-End Management Investment Company and Affiliated Purchases
There have been no purchases by or on behalf of the registrant of shares or other units of any class of the registrant’s equity securities that are registered pursuant to Section 12 of the Exchange Act during the period covered by this report.
Item 10. Submission of Matters to a Vote of Security Holders
There have been no material changes to the procedures by which stockholders may recommend nominees to the registrant’s board of directors.
Item 11. Controls and Procedures
| (a) | The registrant’s principal executive and principal financial officers, or persons performing similar functions, have concluded that the registrant’s disclosure controls and procedures (as defined in Rule 30(a)-3(c) under the Investment Company Act of 1940, as amended (the “1940 Act”)) are effective as of a date within 90 days of the filing of this report, based on the evaluation of these controls and procedures required by Rule 30a-3(b) under the 1940 Act and Rules 13a-15(b) or 15d-15(b) under the Exchange Act. |
| (b) | There were no changes in the Registrant’s internal control over financial reporting (as defined in Rule 30a-3(d) under the 1940 Act) that occurred during the period covered by this report that have materially affected, or are reasonably likely to materially affect, the registrant’s internal control over financial reporting. |
Item 12. Disclosure of Securities Lending Activities for Closed-End Management Investment Companies.
The registrant did not engage in securities lending activity during the six months ended June 30, 2024.
Item 13. Exhibits
Certifications pursuant to Section 302 of the Sarbanes-Oxley Act of 2002 filed herewith.
Certifications pursuant to Section 906 of the Sarbanes-Oxley Act of 2002 filed herewith.
SIGNATURES
Pursuant to the requirements of the Securities Exchange Act of 1934 and the Investment Company Act of 1940, the registrant has duly caused this report to be signed on its behalf by the undersigned, thereunto duly authorized.
| EAGLE POINT INSTITUTIONAL INCOME FUND | ||
| \ | ||
| By: | /s/ Thomas P. Majewski | |
| Thomas P. Majewski | ||
| Chief Executive Officer | ||
| Date: | August 28, 2024 | |
Pursuant to the requirements of the Securities Exchange Act of 1934 and the Investment Company Act of 1940, this report has been signed below by the following persons on behalf of the registrant and in the capacity and on the dates indicated.
| By: | /s/ Thomas P. Majewski | |
| Thomas P. Majewski | ||
| Chief Executive Officer (principal executive officer) | ||
| Date: | August 28, 2024 |
| By: | /s/ Kenneth P. Onorio | |
| Kenneth P. Onorio | ||
| Chief Financial Officer (principal financial officer) | ||
| Date: | August 28, 2024 |