Table of Contents
As filed with the Securities and Exchange Commission on May 13, 2022.
Registration No. 333-264287
UNITED STATES
SECURITIES AND EXCHANGE COMMISSION
WASHINGTON, D.C. 20549
AMENDMENT NO. 1
TO
FORM S-1
REGISTRATION STATEMENT
UNDER THE
SECURITIES ACT OF 1933
Steinway Musical Instruments Holdings, Inc.
(Exact Name of Registrant as Specified in its Charter)
| Delaware | 3931 | 46-3419986 | ||
(State or Other Jurisdiction of Incorporation or Organization) | (Primary Standard Industrial Classification Code Number) | (I.R.S. Employer Identification Number) |
1 Steinway Place
Astoria, New York 11105
(718) 721-2600
(Address, including zip code, and telephone number, including area code, of registrant’s principal executive offices)
Benjamin Steiner
President and Chief Executive Officer
1 Steinway Place
Astoria, New York 11105
(718) 721-2600
(Name, address, including zip code, and telephone number, including area code, of agent for service)
Copies to:
Marc D. Jaffe Benjamin J. Cohen Latham & Watkins LLP 1271 Avenue of the Americas New York, NY 10020 (212) 906-1200 | Joshua N. Korff Ross M. Leff Kirkland & Ellis LLP 601 Lexington Avenue New York, New York 10022 (212) 446-4800 |
Approximate date of commencement of proposed sale of the securities to the public: As soon as practicable after this registration statement becomes effective.
If any of the securities being registered on this Form are to be offered on a delayed or continuous basis pursuant to Rule 415 under the Securities Act of 1933, check the following box. ☐
If this Form is filed to register additional securities for an offering pursuant to Rule 462(b) under the Securities Act, please check the following box and list the Securities Act registration statement number of the earlier effective registration statement for the same offering. ☐
If this Form is a post-effective amendment filed pursuant to Rule 462(c) under the Securities Act, check the following box and list the Securities Act registration statement number of the earlier effective registration statement for the same offering. ☐
If this Form is a post-effective amendment filed pursuant to Rule 462(d) under the Securities Act, check the following box and list the Securities Act registration statement number of the earlier effective registration statement for the same offering. ☐
Indicate by check mark whether the registrant is a large accelerated filer, an accelerated filer, a non-accelerated filer, smaller reporting company, or an emerging growth company.
See the definitions of “large accelerated filer,” “accelerated filer,” “smaller reporting company,” and “emerging growth company” in Rule 12b-2 of the Exchange Act.
| Large accelerated filer | ☐ | Accelerated filer | ☐ | |||
| Non-accelerated filer | ☒ | Smaller reporting company | ☐ | |||
| Emerging growth company | ☒ | |||||
If an emerging growth company, indicate by check mark if the registrant has elected not to use the extended transition period for complying with any new or revised financial accounting standards provided pursuant to Section 7(a)(2)(B) of the Securities Act. ☐
The registrant hereby amends this registration statement on such date or dates as may be necessary to delay its effective date until the registrant shall file a further amendment which specifically states that this registration statement shall thereafter become effective in accordance with Section 8(a) of the Securities Act of 1933, as amended, or until the registration statement shall become effective on such date as the Securities and Exchange Commission, acting pursuant to said Section 8(a), may determine.
Table of Contents
The information in this preliminary prospectus is not complete and may be changed. The selling stockholders may not sell these securities until the Securities and Exchange Commission declares our registration statement effective. This preliminary prospectus is not an offer to sell these securities and it is not soliciting offers to buy these securities in any state or jurisdiction where the offer or sale is not permitted.
SUBJECT TO COMPLETION, DATED MAY 13, 2022
PRELIMINARY PROSPECTUS
Shares

Steinway Musical Instruments Holdings, Inc.
Class A Common Stock
This is the initial public offering of shares of Class A common stock of Steinway Musical Instruments Holdings, Inc. The selling stockholders identified in this prospectus are offering shares of Class A common stock in this offering. We are not selling any shares of our Class A common stock under this prospectus and we will not receive any of the proceeds from the sale of shares of our Class A common stock by the selling stockholders in this offering, including any shares it may sell pursuant to the underwriters’ option to purchase additional shares of Class A common stock.
Upon completion of this offering, we will have two classes of common stock, Class A common stock and Class B common stock. The rights of the holders of Class A common stock and Class B common stock are identical, except with respect to voting and conversion. Each share of Class A common stock is entitled to one vote per share. Each share of Class B common stock is entitled to ten votes per share. Holders of our Class A common stock and Class B common stock vote together as a single class on all matters, except as otherwise set forth in this prospectus or as required by applicable law. Each outstanding share of Class B common stock will convert automatically into one share of Class A common stock upon any transfer, except for certain exceptions and permitted transfers described in our amended and restated certificate of incorporation. Upon the completion of this offering, all shares of Class B common stock will be held by John Paulson and certain affiliated entities (as defined below), which will collectively represent approximately % of the total combined voting power of our outstanding common stock following this offering (or approximately % of the total combined voting power of our outstanding common stock if the underwriters exercise in full their option to purchase additional shares of our Class A common stock).
Prior to this offering, there has been no public market for our Class A common stock. We have applied to list our Class A common stock on the New York Stock Exchange (the “NYSE”), under the symbol “STWY”.
We anticipate that the initial public offering price for our Class A common stock will be between $ and $ per share.
After the completion of this offering, we will be a “controlled company” within the meaning of the corporate governance standards of the NYSE.
We are an “emerging growth company” under the federal securities laws and, as such, may elect to comply with certain reduced public reporting requirements. See “Prospectus Summary—Implications of Being an Emerging Growth Company.”
Investing in our Class A common stock involves risks. See “Risk Factors” beginning on page 37 of this prospectus to read about factors you should consider before buying shares of our Class A common stock.
Neither the Securities and Exchange Commission nor any other regulatory body has approved or disapproved of these securities or passed upon the accuracy or adequacy of this prospectus. Any representation to the contrary is a criminal offense.
| Per Share | Total | |||||||
Initial public offering price | $ | $ | ||||||
Underwriting discounts and commissions(1) | $ | $ | ||||||
Proceeds, before expenses, to the selling stockholders | $ | $ | ||||||
| (1) | See “Underwriting” for a description of the compensation payable to the underwriters. |
At our request, an affiliate of BofA Securities, Inc., a participating underwriter, has reserved for sale, at the initial public offering price, up to 5% of the shares of Class A common stock offered by this prospectus for sale to some of our directors, officers, employees, distributors, dealers, business associates and related persons through a reserved share program (the “Reserved Share Program”). For additional information, see “Underwriting—Reserved Share Program.”
The underwriters also may purchase up to additional shares of Class A common stock from the selling stockholders at the initial offering price less the underwriting discounts and commissions, within 30 days from the date of this prospectus.
The underwriters expect to deliver the shares to purchasers on or about , 2022.
| Goldman Sachs & Co. LLC | BofA Securities | Barclays | ||||||
| Evercore ISI | Cowen | Stifel | Bernstein | Telsey Advisory Group | Commerzbank | Loop Capital Markets |
Prospectus dated , 2022.
Table of Contents

Table of Contents

Table of Contents

Table of Contents

Table of Contents

Table of Contents

Table of Contents
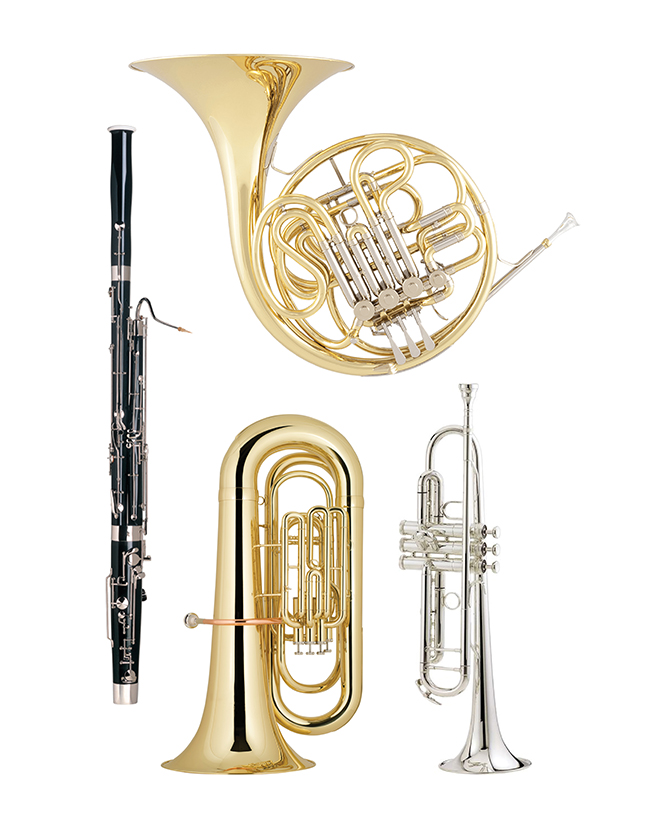
Table of Contents
| ii | ||||
| 1 | ||||
| 37 | ||||
| 91 | ||||
| 93 | ||||
| 94 | ||||
| 95 | ||||
MANAGEMENT’S DISCUSSION AND ANALYSIS OF FINANCIAL CONDITION AND RESULTS OF OPERATIONS | 96 | |||
| 129 | ||||
| 163 | ||||
| 170 | ||||
| 182 | ||||
| 184 | ||||
| 187 | ||||
| 197 | ||||
MATERIAL U.S. FEDERAL INCOME TAX CONSEQUENCES TO NON-U.S. HOLDERS | 200 | |||
| 204 | ||||
| 216 | ||||
| 216 | ||||
| 216 | ||||
| F-1 |
We have not, and the selling stockholders and the underwriters have not, authorized anyone to provide you with information different from, or in addition to, that contained in this prospectus and any related free writing prospectus prepared by or on behalf of us and the selling stockholders. We, the selling stockholders and the underwriters take no responsibility for, and can provide no assurances as to the reliability of, any information that others may give you. This prospectus is an offer to sell only the shares offered hereby, but only under circumstances and in jurisdictions where it is lawful to do so. The information contained in this prospectus is only accurate as of the date of this prospectus, regardless of the time of delivery of this prospectus and any sale of shares of our Class A common stock.
For investors outside the United States: We, the selling stockholders and the underwriters have not done anything that would permit this offering or possession or distribution of this prospectus in any jurisdiction where action for that purpose is required, other than in the United States. Persons outside the United States who come into possession of this prospectus must inform themselves about, and observe any restrictions relating to, the offering of the shares of our Class A common stock and the distribution of this prospectus outside the United States.
i
Table of Contents
We use the following capitalized terms in this prospectus:
| • | “ABL Facility” means our senior secured asset-based revolving credit facility, as described under “Management’s Discussion and Analysis of Financial Condition and Results of Operations—Liquidity and Capital Resources—Debt.” |
| • | “Credit Facilities” means, collectively, our ABL Facility and foreign credit facilities (as defined below). |
| • | “common stock” means our Class A common stock and our Class B common stock, collectively. |
| • | “First Lien Term Loan Facility” means our senior secured first lien term loan facility, as described under “Management’s Discussion and Analysis of Financial Condition and Results of Operations—Liquidity and Capital Resources—Debt.” |
| • | “foreign credit facilities” means our German Term Loan Facility, German ABL Facility, Japanese Term Loan Facility and Japanese Revolving Credit Facility, each as described under “Management’s Discussion and Analysis of Financial Condition and Results of Operations—Liquidity and Capital Resources—Debt.” |
| • | “Parent” means Paulson Pianissimo LLC, a Delaware limited liability company that, prior to this offering, directly owned 100% of our capital stock. |
| • | “Paulson & Co.” means Paulson & Co. Inc. |
| • | “John Paulson and certain affiliated entities” means John Paulson, Paulson Advantage Master Ltd. and Paulson Advantage Plus Master Ltd. |
| • | “Registration Rights Agreement” means the registration rights agreement to be effective upon the pricing of this offering, by and between John Paulson and certain affiliated entities, Benjamin Steiner and the Company. |
| • | “selling stockholders” means Paulson Advantage Master Ltd. and Paulson Advantage Plus Master Ltd. |
| • | “SMI” mean Steinway Musical Instruments, Inc. |
| • | “Stockholders Agreement” means the stockholders agreement to be effective upon the pricing of this offering, by and between John Paulson and certain affiliated entities and the Company. |
| • | “we,” “us,” “our,” the “Company,” or “Steinway” mean Steinway Musical Instruments Holdings, Inc. and its consolidated subsidiaries, unless the context refers only to Steinway Musical Instruments Holdings, Inc. as a corporate entity. |
MARKET AND INDUSTRY DATA
This prospectus contains estimates, projections and information concerning our industry, our business and the market size and growth rates of the markets in which we participate. Some data and statistical and other information are based on independent reports from third parties, including from Euromonitor International Ltd, The Wealth Report 2021, Technavio and IHS Markit, as well as industry and general publications and research, surveys and studies conducted by third parties which we have not independently verified. The content of the foregoing sources, publications and reports, except to the extent specifically set forth in this prospectus, does not constitute part of this prospectus and is not incorporated herein. Some data and statistical and other information are based on internal estimates and calculations that are derived from publicly available information, research we conducted, internal surveys, our management’s knowledge of our industry and their assumptions based on such information and knowledge, which we believe to be reasonable. In each case, this information and data
ii
Table of Contents
involves a number of assumptions and limitations, and you are cautioned not to give undue weight to such information, estimates or projections. Industry publications and other reports we have obtained from independent parties may state that the data contained in these publications or other reports have been obtained in good faith or from sources considered to be reliable, but they do not guarantee the accuracy or completeness of such data. In addition, projections, assumptions and estimates of the future performance of the industry in which we operate and our future performance are necessarily subject to a high degree of uncertainty and risk due to a variety of factors, including those described in “Risk Factors” and “Special Note Regarding Forward-Looking Statements.” These and other factors could cause our future performance to differ materially from the assumptions and estimates made by third parties and us.
SERVICE MARKS, TRADEMARKS AND TRADE NAMES
Steinway, Steinway & Sons, Spirio, Spirio | r , Spiriocast, Boston, Essex, Conn-Selmer, Bach, C.G. Conn, King, Selmer, Ludwig, Leblanc, Armstrong, Musser, Holton, Glaesel, Scherl & Roth and WM Lewis & Son and our logos and our other registered or common law trade names, trademarks or service marks appearing in this prospectus are the property of Steinway Musical Instruments Holdings, Inc. This prospectus contains additional trade names, trademarks and service marks of other companies that are the property of their respective owners. We do not intend our use or display of other companies’ trade names, trademarks or service marks to imply a relationship with, or endorsement or sponsorship of us by, these other companies. Solely for convenience, our trade names, trademarks and service marks referred to in this prospectus appear without the ®, ™ or SM symbols, but such references are not intended to indicate, in any way, that we will not assert, to the fullest extent under applicable law, our rights or the right of the applicable licensor to these trade names, trademarks and service marks.
BASIS OF PRESENTATION
Certain monetary amounts, percentages, and other figures included elsewhere in this prospectus have been subject to rounding adjustments. Accordingly, figures shown as totals in certain tables or charts may not be the arithmetic aggregation of the figures that precede them, and figures expressed as percentages in the text may not total 100% or, as applicable, when aggregated may not be the arithmetic aggregation of the percentages that precede them.
iii
Table of Contents
The following summary highlights selected information contained in this prospectus. Because this is only a summary, it does not contain all of the information you should consider before investing in our Class A common stock. You should carefully read this entire prospectus, including the sections titled “Risk Factors” and “Management’s Discussion and Analysis of Financial Condition and Results of Operations,” as well as our consolidated financial statements included elsewhere in this prospectus, before making an investment decision. For the definitions of certain capitalized terms used in this prospectus, please refer to “General Information.”
Our Company
We are a company that has been forged on, and has pushed the boundaries of, the credo of our founder, Henry Engelhard Steinway: “To build the best piano possible.” Since 1853, generation after generation, we have made and continue to make what we believe are the world’s finest musical instruments. With this expertise and heritage, we believe that we have created and sustained one of the best regarded luxury brands in the world. We strive to further our legacy by advancing the standards of modern musical instrument manufacturing with our enduring dedication to quality, artisanship, elegance, style and beauty.
Our masterfully crafted pianos are designed to meet the demands of a diverse range of music enthusiasts—from providing renowned concert pianists and pop culture icons, including Lang Lang, Yuja Wang and Billy Joel, an instrument to fully express their indelible artistry, to encouraging early-stage learners discovering the first joys of piano playing, to inspiring the most discerning listeners with the distinct musical experience of a Steinway Spirio piano in their own home, which we believe is indistinguishable from a live performance. Our ultimate goal is to foster and enrich the global musical community by continuing to provide the world’s finest pianos and musical instruments shaped by our unwavering commitment to innovation, improvement and technological preeminence.
Who We Are
We are a leading manufacturer of high-performance musical instruments, boasting a brand renowned worldwide. Steinway is one of the longest-lasting and most storied brands in the music industry and beyond.
Our legacy began in 1853 in New York City when German immigrant Henry Engelhard Steinway developed the first Steinway piano in a Manhattan loft on Varick Street. Over the next thirty years, Henry and his sons laid the foundation for modern grand piano building. They built their instruments one at a time, applying skills handed down from master to apprentice, generation after generation, and we have followed in their footsteps ever since.
Thereafter, our innovative designs, attention to detail and exacting quality have redefined and broken new ground in the market for ultra-premium pianos. With our 169-year history, we believe that we have been setting the standard for innovation in our industry for longer than most public companies have been in existence.
We produce a full line of grand and upright acoustic pianos at our manufacturing facilities in Astoria, New York; and Hamburg, Germany. We also offer exclusive, limited-edition pianos, as well as unique, fully customized models for the most discerning customers. We have mastered the end-to-end process that brings a Steinway piano to market, and we own and perfect each of the key components that complete our brand. At each step, our highly-trained craftsmen ensure that every Steinway piano meets our high standard of excellence.
1
Table of Contents
In addition to our long history of craftsmanship, we continue to innovate and integrate state-of-the art technology into our timeless foundation. In 2015, we introduced the Steinway Spirio, which we believe is the world’s finest high-resolution player piano. A masterpiece of artistry and engineering, Spirio pianos, playable like any other Steinway piano, also play themselves, enabling consumers to enjoy recorded performances by renowned pianists in their own homes, with what we believe to be the same nuance, power and passion as a live performance. In 2019, we further advanced our technology and offerings by introducing Spirio | r, which enables recording and high-resolution editing in addition to playback capabilities. In 2021, we launched our Spiriocast software feature, which permits customers to instantly stream live performances, synched with video and audio, from one Spirio | r piano to others across the world.
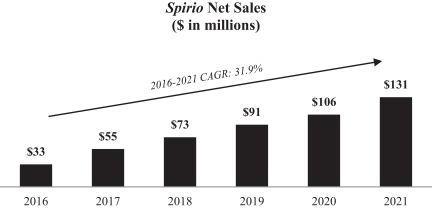
The Spirio piano significantly expands our potential target market to include non-piano players and enhances our relevance to recreational music consumers, as well as amateur and professional musicians. Furthermore, Spirio pianos sell at a premium to our traditional Steinway piano models. Sales of our Spirio and Spirio | r pianos have grown to represent approximately 32% of our total Piano segment net sales for fiscal year 2021, increasing our average selling price and improving our gross profit margin as a result. In creating and continuously adding to our expansive Spirio library, we regularly engage with a wide range of artists to record new tracks, strengthening our connection to a diverse community of professional artists. Spirio strengthens our brand by appealing to luxury consumers and reinforcing our reputation for quality and innovation.
A deep connection to the artist community has been at the core of our identity since our founding. For decades, we have used our Steinway Artist program to cultivate special relationships with the best pianists from a wide array of genres. This program forms a celebrated community of approximately 1,900 of today’s most acclaimed pianists, including Martha Argerich, Ahmad Jamal, Billy Joel, Diana Krall, Charlie Puth and Yuja Wang. These and other musical greats consistently choose Steinway when performing on the biggest stages. In fact, approximately 97% of pianists chose a Steinway piano when performing with orchestras across the globe during the 2018–2019 concert season, which was the last full concert season prior to the date of this prospectus due to the COVID-19 pandemic. Each Steinway Artist is vetted through a highly selective process. To be considered for that process, they must independently own a Steinway piano; we do not provide a piano to our Steinway Artists in exchange for an endorsement. We believe the timeless quality and excellent performance of Steinway pianos are recognized and appreciated by artists across generations, geographies and cultures, with pianists in orchestras on every continent performing on Steinway pianos.
We also invest in building relationships with the next generation of artists through our All-Steinway school program. This program partners with over 220 institutions and schools across the globe to provide students and faculties with our high-quality pianos. By furnishing these institutions and schools exclusively with Steinway and Steinway-designed instruments, we enable our All-Steinway schools to offer premier music education on some of the finest piano models.
Our pianos are sold through 33 company-owned retail showrooms, strategically located across the world. This direct-to-consumer channel allows us to fully manage the luxury customer experience and our brand narrative. We also distribute our pianos through a global, expansive network of approximately 180 experienced dealers with intimate local market knowledge and close ties to local musical communities. Our comprehensive product portfolio allows us to serve as an exclusive supplier to many of our Steinway dealers. We seek to further optimize our distribution through ongoing retail showroom expansion in regions where we see opportunity for growth or improved performance. We continue to support dealer initiatives and implement unique distribution methods to reach smaller, previously untouched markets, including through our team of Educational Sales Managers that travel and sell direct to institutions and customers in territories not represented by a retail store or a dealer.
2
Table of Contents
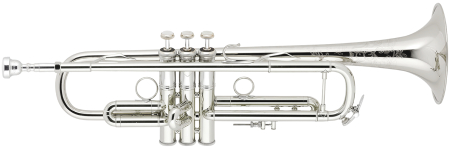
In addition to our ultra-premium piano offerings under our Steinway brand and our mid-range offerings under our Boston and Essex brands, we also sell musical instruments and accessories through our Band segment under our highly regarded Conn-Selmer umbrella of brands. For over 100 years, Conn-Selmer’s complete lines of brass, woodwind, percussion and string instruments, including Bach trumpets, C.G. Conn French horns, King trombones, Selmer saxophones, and Ludwig percussion instruments, have shaped the musical landscape through innovation and sophisticated musical performance. The C.G. Conn brand, with a legacy in music education, has been and continues to be one of the top choices for educators and marching band programs in the United States today. Most top orchestras and symphonies carry the sound of our Bach brass instruments. Ludwig, one of the world’s most recognized names in drums, is a leading fixture on the marching field and on rock-and-roll’s biggest stages. As such, our Conn-Selmer division caters to around 1,300 notable percussion, brass, and woodwind artists, including drummers such as Anderson Paak, Questlove and Alex Van Halen; saxophonist Kenny Garret; and trumpet players Sean Jones, Rashawn Ross and Michael Sachs.
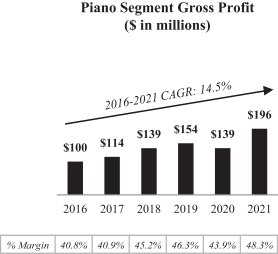
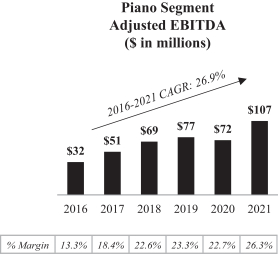
We operate in two reporting segments, Piano (Steinway & Sons) and Band (Conn-Selmer). In fiscal year 2021, our Piano and Band segments generated net sales of $406.6 million and $131.7 million, respectively, up from $317.4 million and $98.4 million, respectively, in the prior fiscal year. In fiscal year 2021, our Piano and Band segments generated Adjusted EBITDA of $106.8 million and $10.7 million, respectively, up from $72.1 million and $4.9 million, respectively, in the prior fiscal year. Below is a breakdown of our consolidated net sales and Adjusted EBITDA by segment for fiscal year 2021.
| 2021 Consolidated Net Sales | 2021 Consolidated Adjusted EBITDA | |
|
|
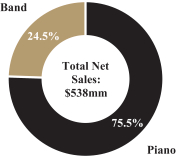
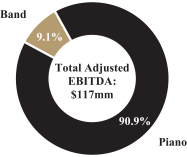
For a reconciliation of Adjusted EBITDA to its most directly comparable GAAP financial measure, information about why we consider Adjusted EBITDA useful and a discussion of the material risks and limitations of this measure, please see “Management’s Discussion and Analysis of Financial Condition and Results of Operations—Non-GAAP Financial Measures.”
Our Piano segment primarily includes sales of pianos offered under the Steinway brand as well as our Boston and Essex brands. Boston and Essex pianos are designed and engineered using the Steinway experience, expertise, specifications, and patents to achieve optimal performance. Boston and Essex models are built in Asia to maximize manufacturing efficiencies, but benefit from Steinway & Sons’ quality control and oversight. Boston competes in the upper-middle market segment, while Essex participates in the middle market segment. Both provide a level of performance and quality that we believe is highly favorable to others competing in their respective price ranges, giving a wide range of consumers access to pianos with genuine world-class tone and responsiveness.
3
Table of Contents
The Boston and Essex lines provide a broader range of consumers with an introduction into the Steinway & Sons family. Our Boston and Essex pianos come with the Steinway Promise—a trade-up program that varies across regions and channels but generally allows Boston and Essex pianos to be traded up for more expensive Steinway pianos, with a trade-in credit up to an amount equal to the original purchase price. This trade-in option allows our company to increase market share over time as our customers enter our community on lower-priced models, before trading up to our higher-priced models as they acquire wealth. With this family of products, we can offer our dealers a full line of our products at multiple price points, enabling us to replace lower priced product lines and to facilitate more exclusive arrangements with our dealers. This comprehensive suite of piano offerings has also allowed us to better penetrate schools and music learning centers and add to our list of All-Steinway Schools. Our Boston line in particular has been utilized by prominent institutions to build a strong foundation for a quality music education.
For fiscal years 2021 and 2020, approximately 69% and 67%, respectively, of net sales in the Piano segment were under the Steinway brand.

Our Band segment manufactures, markets and distributes a diverse portfolio of instruments and brands for student, amateur and professional use that have leading market shares in each of their musical instrument categories, including brass (trumpets, trombones, French horns), woodwinds (saxophones, flutes, clarinets), percussion (drums) and strings (violins, cellos, bass).
Through the Conn-Selmer family of brands, we offer a portfolio of individual brands that represent innovation, entrepreneurship and a focus on musical excellence. Emphasizing quality craftsmanship above all else, Conn-Selmer operates U.S. production facilities in Elkhart, Indiana; Eastlake, Ohio; and Monroe, North Carolina to create exceptional instruments.
4
Table of Contents
Over 50% of Conn-Selmer sales in fiscal year 2021 were generated through our preferred dealer network to schools and families who participate in beginning music education programs. Of the remaining sales, many are used by students in marching bands, concert bands, orchestras, and other school-related performances. Our Conn-Selmer Division of Education was created to proactively engage with music students and educators and has become an industry leader in providing programs, services, and advocacy tailored to the growth and development of music education worldwide. Our educational team is committed to ensuring that every student and educator not only has access to a quality music education and support for their professional development, but also to the tools necessary to help them achieve their highest musical potential.
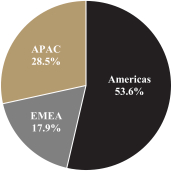
Our business is global and aims to serve consumers wherever they are. As of December 31, 2021, we distributed our instruments in approximately 88 countries throughout the Americas, the Asia-Pacific (“APAC”) region and the Europe, Middle East and Africa (“EMEA”) region. Below is a geographic breakdown of our consolidated net sales for fiscal year 2021.
| 2021 Consolidated Net Sales | ||
| ||
We were acquired by John Paulson and certain affiliated entities in 2013, and under John Paulson’s stewardship, we have increased our commitment to quality while honoring our legacy, expanding our business, and strengthening our technological capabilities. As a custodian of Steinway, John Paulson has focused on investing in our business, including in technology, company-owned showrooms, our manufacturing processes and machinery, and in training our workforce to create a stronger team. We believe that these commitments have made us better equipped than ever before to bolster our reputation as one of the industry’s finest musical instrument manufacturers. Over the course of the last decade, we have strategically expanded the international scope of our business, launched our Spirio technology, earned 18 new patents, and improved manufacturing quality. The results of these initiatives are reflected in our growth over the past few years, during which time we
5
Table of Contents
have grown our APAC region net sales at a 16.1% compound annualized growth rate (“CAGR”) from fiscal year 2016 to fiscal year 2021, released Steinway Spirio and Spirio | r player pianos and also the Spiriocast feature for Spirio | r models, built a team dedicated to limited-edition and bespoke pianos, and implemented manufacturing advances, such as the adoption of new machinery in our factories that raise our standards of precision and quality even higher than previously possible.
To push our boundaries and build on the strong foundation laid over a century ago, we operate with six primary objectives and guiding principles:
| • | Advance excellence in manufacturing and strive to consistently improve quality so that the newest Steinway remains the best Steinway. |
| • | Cultivate and nurture innovation, further developing the infrastructure and technological advancements paved by Spirio. |
| • | Continue to engage our customers directly through retail showroom expansion, thereby broadening our local presence and presenting a consistent luxury brand narrative and experience across all markets. |
| • | Continue to increase geographic penetration, aligning our business with the fastest-growing markets, such as China. |
| • | Leverage our pricing power and favorable luxury-market dynamics. |
| • | Reinforce our brand advantage through introducing a greater mix of special, limited-edition and bespoke products. |
Our Industry
We operate within two distinct markets that partially overlap each other: the global personal luxury goods market and the global musical instruments market.
Global Personal Luxury Goods
Steinway competes in the fast-growing and highly attractive global personal luxury goods market. This market, which includes both hard and soft personal luxury goods, premium and luxury cars, is expected to grow from $945.8 billion in 2021 to $1,286.8 billion in 2026 globally, representing a 6.4% CAGR, according to Euromonitor estimates.*
The factors driving this growth include higher demand for experiential luxury, increased spending and influence of millennials, and the rise in discretionary spending in China. Historically, the global personal luxury goods market has experienced strong growth, with a 5.0% CAGR from 2016 to 2019 according to Euromonitor.
According to Euromonitor, the APAC region represented approximately 45% of the global personal luxury goods market in 2021, the largest share of any region. Between 2021 and 2026, the APAC region is also expected to be the best-performing region in the world, furthering its lead in the global luxury goods market. In China, the personal luxury goods market is expected to increase from $302.7 billion in 2021 to $448.7 billion in 2026, representing an 8.2% CAGR, according to Euromonitor estimates. We believe China’s outsized share of growth in the luxury category can afford us numerous tailwinds as we continue to expand our presence in the country.
| * | Source: Euromonitor International Ltd., Luxury Goods 2022, y-o-y exchange rates, Retail Value RSP, Current Prices. Hard and soft luxury goods include apparel & footwear, eyewear, jewelry, leather goods, portable consumer electronics, timepieces, writing instruments & stationery, and beauty & personal care. |
6
Table of Contents
According to The Wealth Report 2022, published by Knight Frank, the number of high-net-worth individuals (“HNWI”) in China (including Mainland China and Hong Kong), those with a net worth of over $1 million, reached approximately 10.0 million in aggregate in 2021, representing a CAGR of 15.1% from 2016 to 2021. Meanwhile, the number of ultra-high-net-worth individuals (“UHNWI”) in China, those with a net worth of over $30 million, has grown 145% from 2016 to 2021 and is expected to continue to grow by 41% from 2021 to 2026. From 2021 to 2026, it is expected that the number of HNWI and UHNWI together will grow from 69.8 million to 106.3 million, representing a CAGR of 9% and that by 2026 the number of HNWI and UHNWI in China will reach 18.1 million, representing a five year CAGR of 13%. While the United States remains home to the largest high-net-worth population, China has the second-largest high-net-worth population.
Global Musical Instruments
In addition to the global personal luxury goods market, we operate in the global musical instruments market, which is also benefiting from numerous secular tailwinds. These include the increasing global appreciation for music and its role across many aspects of life; the growing desire for at-home entertainment, with pianos in particular; and the growing consumer appetite for heirloom products with longstanding interest across generations. We believe Steinway’s products are inherently timeless—and we expect to be a consistent beneficiary of music’s robust and growing importance in daily life and pursuits.
According to Technavio, the global musical instruments market is expected to grow from $7 billion in 2020 to over $7.8 billion in 2025, representing a 2.2% CAGR. The global piano market is expected to reach approximately $2.7 billion by 2025, up from $2.5 billion in 2020. Of that total growth, the APAC region is expected to contribute the most incremental growth.
The piano market in China is the world’s largest, with an average of around 400,000 pianos being sold a year from 2017 to 2020, compared to an average of around 30,000 per year in the United States over the same period.
According to statistics published by the Chinese Musicians’ Association, approximately 30 million children take piano lessons in China, perhaps inspired by famous Chinese Steinway Artists including Lang Lang and Yuja Wang. Over 40,000 children participated in Steinway’s 2021 International Children & Youth Piano Competition in China. To further serve the growing population of developing pianists in China, the Juilliard School made one of the largest orders of pianos in Steinway history in 2019 for its first overseas campus in Tianjin, China.
The Chinese musical instrument market in general and the piano market in particular have benefited from continued government support for music and the arts.
| • | China’s 14th Five-Year Plan for the 2021–2025 period emphasizes the importance of cultural development. The Ministry of Culture and Tourism has issued guidelines to promote cultural development, building upon the cultural activities already growing in China. The Chinese government has invested heavily in opening new concert halls in recent years. In fact, the number of concert halls in China that own Steinway pianos has increased from 11 to 134 from 2012 to 2021. |
| • | The government is promoting the development of young talent in music and the arts. As stated by the Opinions on Comprehensively Strengthening and Improving School Aesthetic Education in the New Era (Opinion) published by the Chinese State Council in October 2020, the Ministry of Education seeks to introduce music and the arts as a compulsory examination subject |
7
Table of Contents
nationwide as part of high school entrance examinations by 2022. Schools are also encouraged to develop a more structured curriculum for music and the arts. |
As China continues to promote classical music and music education, we expect increases in demand for musical instruments across multiple channels, including orchestras, educational institutions, concerts halls, and households.
The United States has also recently exhibited unique support for the arts in its education system through its $13.2 billion Elementary and Secondary School Emergency Relief funds. We believe that our piano brands and our Conn-Selmer band and orchestra brands are strongly positioned to benefit from these continued investments in music education.
Our Financial Performance
Since our acquisition by John Paulson and certain affiliated entities in 2013, we have been able to achieve consistently strong financial performance. We are proud of our robust growth, consistent profitability, and high cash-flow generation, which demonstrate our pricing power and optimized cost structure. While continuing to invest in innovation, we have also been able to reduce our debt from $311.6 million for the year ended December 31, 2016 to $50.9 million for the year ended December 31, 2021, while increasing cash and cash equivalents from $21.6 million to $43.7 million over the same period.
Our business demonstrated resilience through the COVID-19 pandemic. The first half of 2020 featured a prolonged closure of our Astoria, New York plant and significantly reduced traffic at Steinway showrooms across the globe. Despite the ongoing challenges of the pandemic, our artisans returned to work once they could do so safely and continued to craft exceptional pianos—as they have done for more than 165 years.
Increased consumer investment in the home and a gradual return to normalcy helped offset COVID-induced headwinds and spurred strong performance in the second half of 2020. The Company rebounded well in 2021 and has exhibited significant growth relative to 2019 levels.
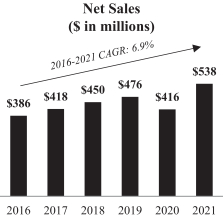
From fiscal year 2016 to fiscal year 2021, we realized the following results on a consolidated basis:
| • | Increased net sales from $386 million to $538 million, representing a CAGR of 6.9% |
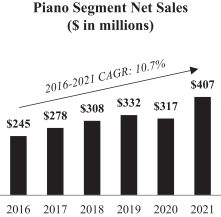
| • | Increased Piano segment net sales from $245 million to $407 million, representing a CAGR of 10.7% |
| • | Increased net sales in the Piano segment under the Steinway brand from $154 million to $280 million, representing a CAGR of 12.6% |
| • | Increased Piano segment net sales in the APAC region from $71 million to $150 million, representing a CAGR of 16.1% |
| • | Increased Piano segment Adjusted EBITDA from $33 million to $107 million, representing a CAGR of 26.9% |
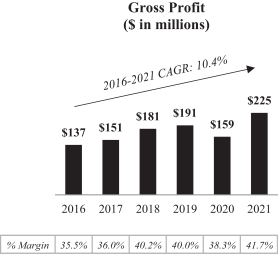
| • | Increased gross profit from $137 million to $225 million, representing a CAGR of 10.4% |
| • | Increased Piano segment gross profit from $100 million to $196 million, representing a CAGR of 14.5% |
8
Table of Contents
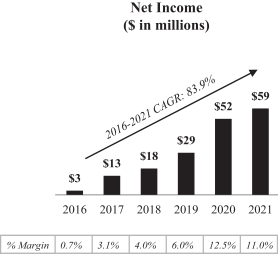
| • | Increased net income from $3 million to $59 million, representing a CAGR of 83.9% |
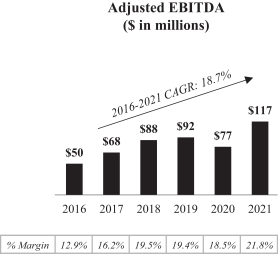
| • | Increased Adjusted EBITDA from $50 million to $117 million, representing a CAGR of 18.7% |
| • | Increased Adjusted Net Income from $14 million to $71 million, representing a CAGR of 38.5% |
| • | Increased Net Income Margin from 0.7% to 11.0% |
| • | Increased Adjusted EBITDA Margin from 12.9% to 21.8% |
| • | Increased Adjusted Net Income Margin from 3.6% to 13.3% |
 |  | |
|
| |
9
Table of Contents
|
| |
 |
| |
For a reconciliation of Adjusted EBITDA and Adjusted Net Income to their most directly comparable GAAP financial measure, information about why we consider Adjusted EBITDA and Adjusted Net Income useful and a discussion of the material risks and limitations of these measures, please see “Prospectus Summary—Summary Historical Consolidated Financial Data—Non-GAAP Financial Measures” and “Management’s Discussion and Analysis of Financial Condition and Results of Operations—Non-GAAP Financial Measures.”
Our Strengths
We built a deep competitive moat through our more than century-long track record of creating what we believe to be the world’s finest instruments and through the power of our brand.
For over 165 years, we believe our innovation, commitment to detail and extraordinary quality have established our brand as the standard by which all pianos are measured. We believe our long
10
Table of Contents
record of leadership across musical instrument categories places our company alongside some of the most admired American companies, with a luxury brand that transcends its functionality.
The fact that our industry’s most revered artists and musical institutions consistently choose Steinway fortifies our high standing within the music industry. Many musical greats have endorsed the quality of our instruments and personally use our instruments on the brightest stages—classical legends such as Sergei Rachmaninoff and Arthur Rubinstein; some of the biggest classical and pop icons of today, including Lang Lang and Billy Joel; and jazz legends such as Ahmad Jamal and McCoy Tyner all chose Steinway time and again as the desired instrument to express their art. We also lead piano demand among the world’s largest concert halls, performance venues and educational and cultural institutions.
The prominence of our instruments among the most respected musical authorities informs and influences the purchasing decisions of consumers across the world. When combined with the quality and beauty of our instruments, this reputation allows us to enjoy considerable pricing power while also increasing sales volumes. Between fiscal years 2016 and 2021, we increased sales volumes of our Steinway pianos by 22.4%, or at a CAGR of 4.1%, while the average sales price (“ASP”) generated by our Steinway pianos increased by 48.0%, or at a CAGR of 8.2%.
Our reach is global. Our instruments are desired and sold throughout the world, in approximately 88 countries. Our brands are well-known and universal, with over 800 trademarks registered in countries across the globe. With this reach, our reputation as a preeminent piano manufacturer has allowed us to gain, based on market data and internal estimates, approximately 80% of what we believe is the ultra-premium piano market, measured in terms of production volumes.
Our top-tier Steinway brand provides a professional-level experience; however we also maintain product lines that allow us to serve an array of consumers, including our Boston and Essex pianos which extend our high-quality piano offerings across more affordable price points. The Piano segment is supplemented by our Band segment where, among others, the Conn, Bach, Selmer and Ludwig brands all lead their respective categories and serve a diverse group of educational institutions and instrument consumers.
We are aligned with favorable long-term trends.
There are a number of socioeconomic trends that serve as tailwinds for us, including:
| • | Outsized growth in the population of HNWI and UHNWI, particularly in China. The global population of HNWI and UHNWI has grown at a 10.1% and 11.9% CAGR, respectively, over the five years ended December 31, 2021. In China, the population of HNWI and UHNWI has grown at a 15.1% and 19.6% CAGR respectively, over the same period, relative to total Chinese population growth of 0.3%. |
| • | Increasing Chinese investment in music education, with music and the arts expected to be a compulsory examination subject nationwide by 2022. |
| • | Unprecedented strength in the housing market, with U.S. housing starts up approximately 160% over the 10 years from 2011 to 2021, representing a CAGR of 10.1% based on U.S. Census data. Furthermore, housing sales have increased approximately 40% from 2011 to 2021 and just over 10% in the five years ended December 31, 2021, according to IHS Markit data. Median prices for new homes are expected to grow at a CAGR of 4% from the final quarter of 2021 to the final quarter of 2026, which is a function of demand. We typically expect demand for our products to track increased activity in the housing market, as consumers are more likely to buy Steinway pianos as they purchase new and higher-end homes. |
11
Table of Contents
| • | A greater consumer focus globally on the home and in-home activities following the onset of the COVID-19 pandemic. |
| • | A growing understanding of the cognitive and developmental benefits associated with music education. |
| • | Record $13.2 billion in U.S. government investment in education with access for music education through Elementary and Secondary School Emergency Relief (ESSER) funds, signed into law in March 2020. |
While we expect these favorable trends to continue, any ebbing or reversal of one or more of these trends could adversely affect the growth of our business. See “Risk Factors—Risks Related to our Business—Unfavorable economic conditions and changes in consumer preferences could adversely affect our business.”
Our manufacturing excellence and commitment to high-performance quality lies at the core of our identity.
For more than 165 years, we have played a key role in the development of the modern grand piano and due to our commitment to sustained advances in manufacturing—as evidenced by our ever-growing patent portfolio—we have remained a leading manufacturer of ultra-premium concert pianos ever since. We manufacture each of our Steinway pianos, one by one, in our historic factories in Astoria, New York; and Hamburg, Germany, through a precise and meticulous artisan process.
These factories and many of our pioneering techniques that we still currently employ date back to the 19th century and have shaped and further elevated the high-end piano manufacturing standards of today. Our integration of time-tested, old-world methods with state-of-the-art technology and investments in advanced machinery coalesce in a production process that requires six months to several years and dozens of artisans to create what we believe is the world’s finest piano.
12
Table of Contents
The quality of our materials and processes results in pianos that can be enjoyed for generations, as evidenced by what has historically been our primary competition, legacy Steinway pianos.

Our company-owned retail showrooms and deep relationships with experienced dealers create a powerful, high-touch distribution model.
We have established company-owned retail showrooms coast-to-coast in the United States in wealthy metro areas from New York to Beverly Hills, Chicago, San Francisco and Miami; across Europe with locations in cultural hubs including London, Paris, Vienna and throughout Germany; and in key APAC locations including Tokyo and Shanghai and in Beijing, where we launched our APAC flagship store in 2017. Currently, we own 16 retail showrooms in the United States, 11 in Europe and six in the Asia Pacific region. Our 33 company-owned showrooms heighten our brand awareness and allow us to build meaningful relationships directly with our valued customers.
13
Table of Contents
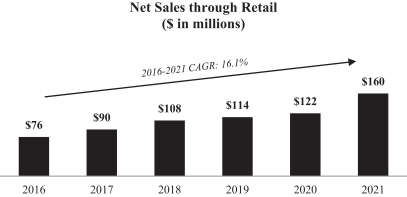
Our platform of company-owned retail locations has bolstered our sales from retail operations, which have increased by a CAGR of 16.1% between fiscal years 2016 and 2021, reaching 39.4% of our total Piano segment net sales for fiscal year 2021. The outsized growth of this channel has ushered in higher profitability, as pianos sold through direct channels capture a significantly larger share of margin compared to sales through traditional wholesale channels, with the added benefit that we build stronger, longer-lasting ties directly with our customers.

14
Table of Contents
In addition to our company-owned retail showrooms, we depend on a network of independent dealers and distributors to distribute a majority of our pianos and all of our band instruments. We believe that we have a robust network of dealers and distributors with deep knowledge of the markets in which they operate. However, there is no assurance that they will continue to generate sales at historical levels. See “Risk Factors—Risks Related to Our Reliance on Third Parties—We generate most of our sales through independent dealers and distributors.” The comprehensive family of brands we offer allows us to serve as the exclusive supplier to many of our piano dealers, and our dealers are also awarded exclusive territories to promote robust marketing and sales programs, promotional expenditures and loyalty. We also bolster our dealers through the provision of marketing and sales programs and materials, inventory management support, sales training, customer service and technical assistance.
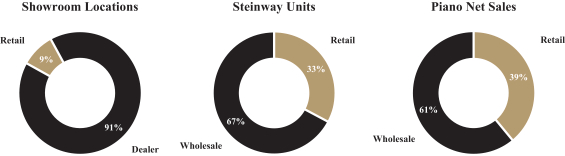
Note: Showroom locations, Steinway units and piano net sales data are presented for the year ended December 31, 2021.
Finally, we are finding new and relevant ways to sell to smaller, previously unrepresented territories. We have created a team of Educational Sales Managers that travel and sell direct to institutions and customers in territories not represented by a retail store or a dealer.
Within our Band segment, our Conn-Selmer Department of Education maintains close connections to educational institutions, often the ultimate customers of our band and orchestral instruments. Conn-Selmer is an industry leader in providing support and advocacy tools specifically tailored to music education through our educational outreach team. Through our coast-to-coast School Partnership program, Conn-Selmer maintains a specialized team of educational support managers who provide personalized service and support, customized lease and purchase programs, as well as artist and clinician funding. Conn-Selmer also provides partnering schools with free access to our instrument inventory management system, which helps customers manage their long-term supply needs and track inventory age and condition. These initiatives serve to deepen our institutional relationships and supplement demand for our instruments.
Our vertically-integrated supply chain affords numerous operational advantages.
Our commitment to quality extends throughout our entire supply chain. Historically, we have partnered with some of the most respected suppliers in the industry. To streamline our process, better control quality of production and ensure continuity in vendor business, at opportune times, we have strategically acquired significant key parts suppliers: Kluge GmbH, the largest piano keys manufacturer in Europe; O.S. Kelly, the largest piano plate manufacturer in the United States; and most recently in 2019, Louis Renner, which we believe is one of the world’s finest and most widely respected producers of piano action parts.
15
Table of Contents
By integrating these suppliers into our controlled manufacturing process, we can ensure that Steinway-caliber quality is preserved and more seamlessly improved upon across our key components. In addition, with these acquisitions, we are now the primary supplier of spare parts for used Steinway pianos, giving us the opportunity to reach a broader array of customers through the sale, rebuilding and restoration of certified pianos and set the standards for quality in the resale market.
We have a long history of innovation and have developed what we believe to be the premier technology in the piano industry.
We continue to innovate, adding 18 new patents to our portfolio in the last decade to reach a current total of over 150 patents over the course of our history. The Steinway pianos we produce today are the best and most advanced pianos we have ever produced.
The introduction of the Steinway Spirio in 2015 was a culmination of years of investment, research and development and technological expertise. Spirio’s high resolution playback system uses proprietary software to measure hammer velocity (up to 1,020 dynamic levels at a rate of up to 800 samples per second) and proportional pedaling – for both the damper pedal and soft pedal (up to 256 pedal positions at a rate of up to 100 samples per second). We consider the Spirio technology to be a masterpiece of artistry and engineering, delighting listeners with recorded performances of artists, with what we believe to be the same level of intimacy and nuance as a live performance. We further enhanced Spirio in 2019 with the introduction of Spirio | r, which enables recording, high-resolution editing, and playback, providing educational institutions and professional artists with new tools and opportunities and to seamlessly connect and integrate with multiple musical environments. In 2021 we released our latest Spirio feature, Spiriocast, which allows for performances to be streamed live, in sync with video and audio, from one Spirio | r piano to others anywhere in the world.
Our Spirio technology provides access to our large and diverse Spirio music library, which includes performances recorded exclusively for Spirio and produced by us, offering performances from an incredible roster of hundreds of Steinway Artists. A collection of these recorded works is also synched with video for an even more engaging and unique performance at home. In addition, we pioneered technology that allows Spirio pianos to showcase historical performances, synched with video, by Steinway Immortals including Glenn Gould, Duke Ellington and Vladimir Horowitz. Each month, the Spirio Spotlight showcases all new content—music, videos and curated playlists—which is automatically downloaded to every Spirio piano, allowing us to drive value for and deepen our connection to our customers.
These innovations fortify our reputation as an industry leader in musical instrument manufacturing and strengthen our offerings relative to our competition, including legacy Steinway pianos. Spirio has
16
Table of Contents
been a key driver of our growth, comprising approximately half of Steinway piano sales in 2021. With the evolution of our Spirio technology, we have built an experienced, high-tech, cutting-edge Music and Technology team that we continue to leverage for future opportunities, technological advancements, and product offerings, always striving to create new avenues to grow our brands and product portfolio. Our recent investments in innovation have dramatically expanded our target audience, increased our relevance to consumers and artists, and entrenched our leading competitive position in the piano market.

We are the clear brand of choice among the professional community.
The Steinway piano was the instrument of choice for approximately 97% of concert pianists when performing with orchestras across the globe during the 2018–2019 concert season, none of whom are compensated to use or endorse Steinway. These artists, many of whom perform at the pinnacle of the music industry, influence consumption trends across our customer base. For decades, we have cultivated relationships with the most talented pianists from nearly every genre, including Jon Batiste, Billy Joel, Lang Lang and Regina Spektor.
17
Table of Contents
We continue to source and grow these relationships through our Steinway Artists program. This program encompasses all genres of music and includes renowned musicians such as Martha Argerich, Ahmad Jamal, Diana Krall, Charlie Puth and Yuja Wang. We select our Steinway Artists through a rigorous application process that can last up to a year, requires applicants to already own a Steinway piano and have a recommendation from an existing Steinway Artist or a Steinway & Sons dealer. For our Steinway Artists, we have a concert and artist bank of Steinway pianos, many of which are permanently located at leading concert venues. We also transport our pianos to any location where a Steinway Artist is performing, ranging from the biggest music festivals to the hardest-to-reach locations, including an iceberg in the Arctic Ocean. These programs strengthen our relationships and standing with the professional community and also allow us to constantly solicit feedback from the most qualified sources: top concert pianists.

Leading educational institutions also choose Steinway, and we maintain relationships with nearly all of the top music schools across the world—which we believe cements our position as the world’s premier piano manufacturer and instills young artists globally with a devotion to Steinway pianos at the onset of their careers. Our All-Steinway schools provide pianos that inspire students to realize their artistic talents and best prepare them to compete at the highest level in the professional world. In addition, we maintain a dedicated institutional sales team that provides a suite of customized resources to colleges, universities and conservatories, including inventory analysis tools, fundraising programs, lease-to-own options, factory seminars and technical service guidelines.
We are proud of our strong market share among professionals and institutions, and believe this validates our meticulous artisan process and the quality products we produce. This endorsement by the professional and institutional community informs and drives consumer demand of individuals searching for high quality pianos for the home.
We have an experienced management team and shareholder group committed to serving as stewards of our brands.
Our management team, led by our Chief Executive Officer, Benjamin Steiner, has extensive industry experience and global expertise and is committed to preserving and further expanding the legacy of our brands. The management team represents a broad foundation of experiences spanning expertise in sales, marketing, manufacturing, technology and innovation and strives to conserve a deep continuity with Steinway’s rich heritage. In addition, our Americas, EMEA and APAC regional
18
Table of Contents
leaders have intimate local knowledge of their respective geographies, allowing us to navigate the nuances of the piano market across all of our operations.
Our Chief Executive Officer, Mr. Steiner, led the investment by John Paulson and certain affiliated entities in 2013 and has been associated with our company ever since, joining the Steinway team in 2016 and subsequently being appointed as Chief Executive Officer in August 2021. During his years with our company, Mr. Steiner has connected John Paulson’s vision with our management team’s industry and institutional knowledge, strengthening our business through operational and digital innovation while enhancing our stature within the music industry.
The talent and industry expertise of the members of our management team make our company well positioned to realize its growth potential. Our President of Steinway Asia Pacific, Wei Wei, brings a deep knowledge of the region and marketing expertise from her past experience as Director of Marketing and Sales to her current position overseeing this particularly fast-growing region. Eric Feidner serves as our Chief Technology and Innovation Officer managing the teams responsible for music technology in product development. With his accomplished background in technology, music and e-commerce, having previously founded ArkivMusic and served in executive positions at start-ups N2K, Inc. and Winstar Communications, Eric Feidner is expected to help expand the market for Steinway pianos. Our Chief Financial Officer, Maia Moutopoulos, also brings years of expertise to our management team. Before joining Steinway’s corporate finance team in 2014, Maia Moutopoulos served for eight years as the Accounting Manager at Steinway Inc., our Americas piano division, bringing an intimate knowledge of the company’s financial structure to her role.
Furthermore, John Paulson, founder of Paulson & Co., is one of the most prominent names in the financial industry. John Paulson’s reputation and knowledge—both operationally and financially—have proven to be key assets for Steinway and our people. John Paulson’s primary goal has been to ensure the long-term success of our business and the continued preeminence of the Steinway brand, and as our controlling stockholders, John Paulson and certain affiliated entities play a central role in creating our strategic vision and setting our long-term trajectory. As testament to this commitment, one of the first initiatives undertaken by John Paulson post-acquisition was to fortify our technological capabilities with significant investment in music technology, resulting in the successful launch of the Steinway Spirio piano, and our total capital expenditures have more than tripled since 2013. After this offering, John Paulson and certain affiliated entities will hold a significant portion of our common stock, including all of our Class B common stock, will control the direction of our business, and so long as they do so, will prevent you and other stockholders from influencing significant decisions of our business.
Our Growth Strategies
Innovate in technology, including through Spirio.
We believe our Steinway Spirio high-resolution player pianos are revolutionary for our industry and we have consistently advanced the technology since its original debut in 2015. We built upon our initial launch of Spirio with the introduction of Spirio | r in 2019, which enabled recording, high-resolution editing and playback capabilities. In 2021, we released a new software feature, Spiriocast, which allows instant streaming of live performances, perfectly in sync with audio and video, from one Spirio | r piano to others around the world. Our Spirio instruments play back the performances of renowned concert pianists, record and replay a consumer’s own performances, and also allow for high-resolution editing of such recordings. Our Spirio music library includes thousands of exclusive performances by hundreds of artists, many of which are synched with video, all accessed with the touch of an iPad and enjoyed in a consumer’s own home. Our Spirio music library is expanded monthly
19
Table of Contents
and automatically updated, increasing consumer value over time while also deepening our connection to our consumers.
With this evolution, enabled through Spirio technology, we believe the Steinway piano has been recast—not only as the preeminent high-performance piano, but also as a unique luxury entertainment system for the home. Our target market has expanded significantly with this development to now include recreational music lovers who may not play the piano but can nonetheless enjoy a moving musical experience at home. In fact, 67% of our Spirio customers from 2015 to 2021 reported that they are non-piano players. We have also increased our brand’s relevance to customers and artists, differentiating our product from older Steinway models that may have been considered by customers on the used market.
We have seen significant demand for our Steinway Spirio player pianos; sales of our Spirio and Spirio | r pianos grew at a CAGR of over 30% between fiscal years 2016 and 2021 and represented approximately 32% of Piano segment net sales in fiscal year 2021. We believe there is still significant room for growth in Steinway Spirio sales. Our Spirio player pianos sell at a premium to other Steinway models, leading to increased net sales and profit per unit sold.
We continue to advance the depth and breadth of our technology, with each Spirio generation continually improving on the last. In addition, the investments we have made in our technical capabilities have allowed our company to build an infrastructure of technological expertise, laying the foundation for further innovation across our instrument portfolio and potentially in adjacent markets.
Our Conn-Selmer business also continues to invest in digital technology to strengthen our relationships with music educators and students. Our recently acquired MusicProfessor digital lesson platform gives music educators a suite of teaching aids for in person, hybrid, and remote learning as well as a pedagogically-driven experience for new players without formal guidance.
Expand our company-owned retail locations and improve distribution.
We are driving top-line growth by building out our company-owned retail showroom presence in strategic high-growth metropolitan areas, providing the opportunity to cultivate deeper and more durable relationships directly with our end customers and to strengthen our ability to manage our luxury brand image. In addition, increasing sales through our direct outlets allows us to realize a larger share of margin compared to sales through wholesale channels.
To capitalize on this higher profit opportunity, we have improved many of our existing direct outlets and opened new locations, which feature high quality buildouts, curated merchandise and knowledgeable and effective sales employees. We have opened or renovated 26 of our 33 retail showrooms since 2013. These retail stores are strategically located across the United States, including locations in New York, Beverly Hills, Chicago, San Francisco and Miami; in cultural hubs in Europe such as London, Paris, Berlin and Vienna; and also in key APAC metros that include Shanghai, Beijing, Xi’an and Tokyo.
These initiatives have increased the percentage of sales that come from our retail operations over time, representing approximately 39.4% of all Piano segment sales in fiscal year 2021. We believe that continuing to expand our network of retail showrooms will enable us to increase the demand for our pianos, while also improving our margins, strengthening customer relationships and expanding our customer reach.
20
Table of Contents
Wholesale distribution remains our largest channel by volume of instruments. Many of our dealers have been in the business for almost as long as we have, and we always encourage exclusive relationships with us. They have intimate knowledge of their local markets and deep connections within their musical communities. We work with our dealers to further elevate their operations, including by providing retail design templates, encouraging location optimization, offering enhanced sales training, providing promotional materials and sales leads, and arranging ongoing technical support. These initiatives fortify our relationships with our dealers and also ensure a Steinway—level customer experience across our network. In addition, we continue to evaluate underperforming territories for further potential retail expansion.
Finally, we have seen successful sales results with our recently launched Steinway Educational Sales Manager program, which sends Steinway-trained sales managers to institutions in territories that are not represented by a dealer or a company-owned retail store. We continue to consider and implement new methods to reach underpenetrated markets.
Expand in China, a vast and rapidly growing market for our products.
China represents a unique market for Steinway due to two primary cultural and structural factors: a deep-rooted reverence for classical music, specifically piano music, and a sizeable and rapidly expanding middle and upper class with an appetite for luxury Western products. China is the largest global market for pianos and has approximately 40 million practicing pianists, roughly seven times the approximately six million practicing pianists in the United States. Currently there are approximately 30 million children in China taking piano lessons, compared to less than 10 million in the rest of the world, suggesting that the majority of children playing the piano globally are in China. Initiatives pursued by the Chinese central authorities to promote traditional forms of childhood recreation further bolster these organic dynamics, which we expect to provide further tailwinds to our business in the region.
In addition to these favorable trends, the Steinway brand is revered in China, where all of the 11 national conservatories use Steinway pianos, with four such conservatories serving as All-Steinway schools. We have taken steps to continue building our brand resonance in the region by actively partnering with celebrity Chinese concert pianists, such as Lang Lang, opening company-owned retail showrooms in strategic Chinese metro areas, promoting a full and diverse sales and marketing calendar nationwide, including, on average, over 215 events at each of our retail showrooms annually, and adding new tracks to our Spirio library that cater to the Chinese consumer.
Despite the prevalence of piano playing in China and our brand strength in the region, we have historically been underpenetrated in the country, selling approximately half as many Steinway grand pianos in China as in the U.S. market. However, as China continues to develop and accumulate wealth, we will seek to capture the growing demand for ultra-premium pianos by private customers. Over the last 20 years, we have transformed our business in China to sell more pianos to private customers rather than institutions. For example, over 90% of Steinway grand pianos sold in China in fiscal year 2001 were to institutional customers, compared to approximately 10% in fiscal year 2021. The Wealth Report 2022, published by Knight Frank, forecasts the number of UHNWI in China to grow by 41% over the five years from 2021 to 2026 while the combined population of UHNWI and HNWI is expected to reach 18.1 million, representing the second-largest wealth market globally. Our and third-party forecasts of growth in China are based on a number of assumptions, and should be read in conjunction with “Risk Factors—Risks Related to Our Business—Our estimates of market opportunity and forecasts of market growth, including in China, may prove to be inaccurate and there is no guarantee that demand for our products will grow as expected, or that we will be able to grow our business at similar rates, if at all.”
21
Table of Contents
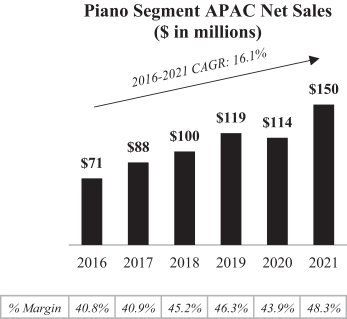
We have begun to see these dynamics play out as we have grown our net sales in China at a 20.4% CAGR from $46.0 million in fiscal year 2016 to $116.5 million in fiscal year 2021, and our Piano segment net sales in the APAC region from $71.2 million to $149.9 million, representing a CAGR of 16.1%, over the same period.

Grow our average net sales per unit by expanding our special, limited-edition and bespoke instrument business.
The investments we have made in our manufacturing facilities have made our factories nimbler and more efficient, allowing us to increase our range of stock keeping units (“SKUs”). We have built a team dedicated to creating new and exceptional design concepts, sourcing unique luxury materials and collaborating with specialty artisans to produce the most exquisite Steinway pianos. We have a long legacy of producing custom pianos, and with our advances in manufacturing capability and our investment in the right team, we are now able to produce a significantly larger number and spectacularly varied array of custom models. These include our Bespoke and Art Case custom Steinway pianos, our limited-edition Steinway pianos, our Crown Jewel Steinway collection of exotic
22
Table of Contents
wood veneers, and our special collections. These products not only increase the selection offered to our most discerning customers, but also allow us to drive meaningful increases in average selling price.
We believe we can further increase our average net sales per unit through greater customer adoption of our special instruments, including by: (1) continuing to expand our range of special and custom instruments; (2) investing in our manufacturing capabilities to increase capacity and decrease lead times for these instruments; (3) honing our marketing efforts for such instruments; and (4) capitalizing on the growing population of UHNWI, particularly in China. Our manufacturing advances to date have allowed us to increase the percentage of special pianos produced as part of total Steinway grand pianos manufactured at our Hamburg factory, which supplies our growing business in China, from 6% to 11% between fiscal years 2016 and 2021.
Our Band segment has also made strides in building demand for premium instruments offered within our Conn-Selmer family of brands. We have launched over 120 new or improved products since 2020, including our re-imagination of the most coveted line of trumpets on the market, the Bach 170, 180, and 190 series and the release of new Ludwig hardware to expand our growing Ludwig acoustic drum market. Alongside our Artist Select program, a celebration of our best horns which are hand-selected by our master artists, we have recently launched ConnSonic—a proprietary suite of processes for optimizing musical instrument acoustics. We believe instruments created using ConnSonic feature greater depth and efficiency of tone production than conventional instruments.
Summary Risk Factors
We are subject to a number of risks, including risks that may prevent us from achieving our business objectives or that may adversely affect our business, financial condition and results of operations. You should carefully consider the risks discussed in the section titled “Risk Factors,” including the following risks, before investing in our Class A common stock:
| • | Our business is dependent upon the distinctive appeal of the Steinway brand. |
| • | Competition within the luxury goods and broader music industry is intense and our existing and potential customers may be attracted to competing forms of products. |
| • | Since we have a limited number of facilities, any loss of use of any of our facilities, or those of our third-party suppliers, could adversely affect our operations. |
| • | Our estimates of market opportunity and forecasts of market growth, including in China, may prove to be inaccurate and there is no guarantee that demand for our products will grow as expected, or that we will be able to grow our business at similar rates, if at all. |
| • | Unfavorable economic conditions and changes in consumer preferences could adversely affect our business. |
| • | Any disruption in the supply of raw materials and components we and our key manufacturers need to manufacture our musical instruments could harm our business, financial condition and results of operations. |
| • | We operate in competitive markets. |
| • | We depend on skilled craftspeople to develop and create our pianos and a skilled sales force to sell our pianos. |
| • | The loss of one or more members of our senior management team could adversely affect our business. |
23
Table of Contents
| • | Our primary manufacturing facilities in Astoria, New York and Hamburg, Germany are expensive to operate, and subject us to high labor, tax and other expenses. |
| • | The artists who play and promote our instruments are an important aspect of our brands’ images and the loss of the support of artists may harm our business. |
| • | Our internal computer systems, or those of any of our third-party service providers, may fail or suffer security breaches. |
| • | We may be unable to strategically expand our showroom footprint, and maintaining our brand image and desirability to consumers requires significant investment in showroom construction, maintenance and periodic renovation. |
| • | Our international operations are exposed to risks associated with exchange rate fluctuations and customs, regulations, trade restrictions and political, economic and social instability. |
| • | Evolving U.S. and European trade regulations and policies, including with China, have in the past and may in the future have a material and adverse effect on our business. |
| • | Failure of our new products to gain market acceptance, or the obsolescence of our existing products, may adversely affect our operating results. |
| • | Our operations may subject us to liabilities for environmental or other regulatory matters, the costs of which could be material. |
| • | We generate most of our sales through independent dealers and distributors. |
| • | Any significant disruption in our supply from key suppliers could delay production. |
| • | Our third-party manufacturers and suppliers may not continue to manufacture products that are consistent with our standards and our quality control measures may be inadequate. |
| • | John Paulson and certain affiliated entities will hold a significant portion of our common stock, including all of our Class B common stock, will control the direction of our business, and so long as they do so, will prevent you and other stockholders from influencing significant decisions. |
| • | We will be a “controlled company” under the corporate governance rules of the NYSE and, as a result, will qualify for exemptions from certain corporate governance requirements. If in the future we choose to rely on certain of these exemptions, you will not have the same protections afforded to stockholders of companies that are subject to such requirements. |
Our business also faces a number of other challenges and risks discussed throughout this prospectus. You should read this entire prospectus carefully, including “Risk Factors,” “Management’s Discussion and Analysis of Financial Condition and Results of Operations” and our consolidated financial statements and related notes included elsewhere in this prospectus, before deciding to invest in our Class A common stock.
Our Corporate Information
Our principal executive office is located at 1 Steinway Place, Astoria, New York 11105 and our telephone number at that address is (718) 721-2600. We maintain a website on the Internet at www.steinway.com. We have included our website address in this prospectus as an inactive textual reference only. The information contained on, or that can be accessed through, our website is not a part of, and should not be considered as being incorporated by reference into, this prospectus.
24
Table of Contents
Implications of Being an Emerging Growth Company
We qualify as an “emerging growth company” as defined in Section 2(a) of the Securities Act of 1933, as amended (the “Securities Act”), as modified by the Jumpstart Our Business Startups Act of 2012 (the “JOBS Act”). As an emerging growth company, we may take advantage of specified reduced disclosure and other requirements that are otherwise applicable, in general, to public companies that are not emerging growth companies. These provisions include:
| • | the option to present only two years of audited financial statements and only two years of related Management’s Discussion and Analysis of Financial Condition and Results of Operations in this prospectus; |
| • | not being required to comply with the auditor attestation requirements of Section 404 of the Sarbanes-Oxley Act of 2002; |
| • | reduced disclosure obligations regarding executive compensation in our periodic reports, proxy statements and registration statements; and |
| • | exemptions from the requirements of holding nonbinding, advisory stockholder votes on executive compensation or on any golden parachute payments not previously approved. |
We will remain an emerging growth company until the earliest to occur of: (i) the last day of the first fiscal year in which our annual gross revenue exceeds $1.07 billion; (ii) the date that we become a “large accelerated filer,” with at least $700 million of equity securities held by non-affiliates as of the end of the second quarter of that fiscal year; (iii) the date on which we have issued, in any three-year period, more than $1.0 billion in non-convertible debt securities; and (iv) the last day of the first fiscal year ending after the fifth anniversary of the completion of this offering.
We have elected to take advantage of certain of the reduced disclosure obligations in the registration statement of which this prospectus is a part and may elect to take advantage of other reduced reporting requirements in future filings. As a result, the information that we provide may be different than the information you receive from other public companies in which you hold stock.
Emerging growth companies can also take advantage of the extended transition period provided in Section 13(a) of the Securities Exchange Act of 1934, as amended (the “Exchange Act”) for complying with new or revised accounting standards. In other words, an emerging growth company can delay the adoption of certain accounting standards until those standards would otherwise apply to private companies. We have elected to take advantage of this extended transition period and, as a result, our operating results and financial statements may not be comparable to the operating results and financial statements of companies who have adopted the new or revised accounting standards.
As a result of these elections, some investors may find our Class A common stock less attractive than they would have otherwise. The result may be a less active trading market for our Class A common stock, and the price of our Class A common stock may become more volatile.
Distribution
Prior to the closing of this offering, the Parent will be liquidated and its sole asset, the shares of our common stock it holds, will be distributed to certain of its members based on their relative rights under its operating agreement. John Paulson and certain affiliated entities will receive a number of shares of our common stock in the liquidation of Parent equal to the value of their holdings in the Parent immediately before the distribution. Our Chief Executive Officer, Benjamin Steiner, will receive a
25
Table of Contents
number of fully-vested shares of our common stock in the distribution equal to the value of his fully-vested holdings in the Parent immediately before the distribution and will receive a number of restricted shares of our common stock in the distribution equal to the value of his unvested holdings in the Parent immediately before the distribution, which restricted shares shall be subject to the same time-vesting conditions as Mr. Steiner’s unvested holdings in the Parent as of immediately before the distribution. See “Certain Relationships and Related Party Transactions—Relationships with Other Directors, Executive Officers and Affiliates.” After giving effect to the filing and effectiveness of our amended and restated certificate of incorporation and the adoption of our amended and restated bylaws, each of which will be in effect upon the closing of this offering, and the Reclassification (as defined herein), John Paulson and certain affiliated funds’ common stock will be recapitalized into Class B common stock and Mr. Steiner’ s common stock will be recapitalized into Class A common stock.
We refer to these transactions collectively as the “Distribution.” Unless otherwise indicated, all information in this prospectus assumes the completion of the Distribution prior to the closing of this offering and a public offering price of $ per share, which is the midpoint of the price range set forth on the cover page of this prospectus. Although the combined number of Class A common stock and Class B common stock outstanding after the offering will remain fixed regardless of the initial public offering price in this offering, the split between the number of shares of Class A common stock and Class B common stock issued to John Paulson and certain affiliated entities and Benjamin Steiner in the Distribution will vary depending on the initial public offering price in this offering. These changes will not significantly impact the relative economic and voting interests of such stockholders after this offering. The Distribution will not affect our operations, which we will continue to conduct through our operating subsidiaries.
26
Table of Contents
THE OFFERING
Class A common stock offered by the selling stockholders | shares. |
Class A common stock to be outstanding after this offering | shares ( shares if the underwriters exercise their option to purchase additional shares of Class A common stock in full). |
Class B common stock to be outstanding after this offering | shares ( shares if the underwriters exercise their option to purchase additional shares in full). |
Total Class A common stock and Class B common stock to be outstanding after this offering | shares. |
Option to purchase additional shares of Class A common stock offered by the selling stockholders | The underwriters have a 30-day option to purchase up to an additional shares of Class A common stock from the selling stockholders at the initial public offering price, less underwriting discounts and commissions. |
Reserved Share Program | At our request, an affiliate of BofA Securities, Inc., a participating underwriter, has reserved for sale, at the initial public offering price, up to 5% of the shares of Class A common stock offered by this prospectus for sale to some of our directors, officers, employees, distributors, dealers, business associates and related persons. If these persons purchase reserved shares it will reduce the number of shares available for sale to the general public. Any reserved shares that are not so purchased will be offered by the underwriters to the general public on the same terms as the other shares of Class A common stock offered by this prospectus. Any of our directors, officers and other Lock-Up Parties (as defined below) buying shares of Class A common stock through the Reserved Share Program will be subject to a 180-day lock-up period with respect to such shares, subject to certain exceptions described herein. |
| For additional information, see “Underwriting—Reserved Share Program.” |
Use of proceeds | The selling stockholders will receive all of the net proceeds from this offering. We will not receive any proceeds from the sale of Class A common |
27
Table of Contents
stock by the selling stockholders in this offering. See “Use of Proceeds.” |
Voting rights | Shares of Class A common stock are entitled to one vote per share. Shares of Class B common stock are entitled to ten votes per share. |
| Holders of our Class A common stock and Class B common stock will generally vote together as a single class, unless otherwise required by law or our amended and restated certificate of incorporation. Following the completion of this offering, each share of our Class B common stock will be convertible into one share of our Class A common stock at any time and will convert automatically upon certain transfers and upon the earlier of (i) ten years from the filing and effectiveness of our amended and restated certificate of incorporation in connection with this offering, (ii) the first date on which the aggregate number of outstanding shares of our Class B common stock ceases to represent at least 5% of the aggregate number of our outstanding shares of common stock and (iii) the death or disability, as defined in our amended and restated certificate of incorporation, of John Paulson. |
| Upon the completion of this offering, John Paulson and certain affiliated entities, which will be the holders of all of the outstanding shares of Class B common stock, will collectively hold approximately % of the total combined voting power of our outstanding common stock (or approximately % of the total combined voting power of our outstanding common stock if the underwriters exercise in full their option to purchase additional shares of our Class A common stock). As a result, the holders of the outstanding shares of Class B common stock will have the ability to control the outcome of matters submitted to our stockholders for approval, including the election of our directors and the approval of any change in control transaction. See the sections titled “Principal and Selling Stockholders” and “Description of Capital Stock” for additional information. |
Dividend Policy | As a public company we anticipate paying a quarterly dividend at a rate initially equal to $ per share per annum on our common stock to holders of our common stock. Our ability to pay dividends on our common stock is limited |
28
Table of Contents
by the agreements governing our Credit Facilities. See “Dividend Policy.” |
Controlled company | Following this offering we will be a “controlled company” within the meaning of the corporate governance rules of the NYSE. |
Risk factors | See the section titled “Risk Factors” and the other information included in this prospectus for a discussion of factors you should consider carefully before deciding to invest in shares of our Class A common stock. |
Proposed stock exchange symbol | “STWY.” |
The number of shares of our common stock to be outstanding immediately following this offering is based on shares of Class A common stock, including shares of restricted stock, and shares of Class B common stock outstanding as of , 2022 and reflects the Distribution, Stock Split and Reclassification described below.
The number of shares of our Class A common stock and Class B common stock to be outstanding after this offering does not include:
| • | shares of Class A common stock, based on an assumed initial public offering price of $ per share, which is the midpoint of the price range set forth on the cover page of this prospectus, issuable in connection with the vesting and settlement of restricted stock units that we intend to grant, to certain of our employees, under our 2022 Incentive Award Plan (the “2022 Plan”), which will become effective in connection with this offering (the “IPO RSUs”); |
| • | shares of Class A common stock reserved for future issuance following this offering under our 2022 Plan (which number, for the avoidance of doubt, excludes the IPO RSUs), which will become effective on the day prior to the first public trading date of our Class A common stock, as well as any shares that become issuable pursuant to the provisions in the 2022 Plan that automatically increase the share reserve under the 2022 Plan; or |
| • | shares of Class A common stock reserved for future issuance following this offering under our 2022 Employee Stock Purchase Plan (the “ESPP”), which will become effective on the day prior to the first public trading date of our Class A common stock, as well as any shares that become issuable pursuant to the provisions in the ESPP that automatically increase the share reserve under the ESPP. |
Unless otherwise indicated, all information in this prospectus reflects and assumes:
| • | the completion of the Distribution prior to the closing of this offering, including the issuance of shares of restricted common stock to Mr. Steiner, of which shares of restricted stock are expected to vest on April 30, 2023 and an additional shares of restricted stock are expected to vest on April 30, 2024, in each case, subject to Mr. Steiner’s continued service through such vesting date; |
| • | the filing and effectiveness of our amended and restated certificate of incorporation and the adoption of our amended and restated bylaws, each of which will be in effect prior to the closing of this offering; |
| • | the reclassification of outstanding shares of our common stock as of , 2022 into shares of Class A common stock and shares of Class B common stock, which will occur prior to the closing of this offering (the “Reclassification”); |
29
Table of Contents
| • | no exercise of outstanding options; |
| • | a -for-one stock split on our common stock to be effected prior to the consummation of this offering (the “Stock Split”); |
| • | no exercise by the underwriters of their option to purchase additional shares of Class A common stock from the selling stockholders; and |
| • | that the initial public offering price of our Class A common stock will be $ per share (which is the midpoint of the price range set forth on the cover page of this prospectus). |
Although the combined number of Class A common stock and Class B common stock outstanding after the offering will remain fixed regardless of the initial public offering price in this offering, the split between the number of shares of Class A common stock and Class B common stock issued to John Paulson and certain affiliated entities and Benjamin Steiner in the Distribution will vary depending on the initial public offering price in this offering. These changes will not significantly impact the relative economic and voting interests of such stockholders after this offering. See “—Distribution.”
30
Table of Contents
SUMMARY HISTORICAL CONSOLIDATED FINANCIAL DATA
The following tables present our summary historical consolidated financial data for the periods and as of the dates indicated. The summary consolidated statements of operations data for the years ended December 31, 2020 and 2021 have been derived from our audited consolidated financial statements that are included elsewhere in this prospectus. The summary consolidated statements of operations data for the three months ended March 31, 2021 and 2022 and the consolidated balance sheet data as of March 31, 2022 have been derived from our unaudited condensed consolidated financial statements that are included elsewhere in this prospectus. We have prepared the unaudited condensed consolidated financial statements on the same basis as the presentation of our audited consolidated financial statements that are included elsewhere in this prospectus. We have included, in our opinion, all adjustments necessary to state fairly our results of operations for these periods. Our historical results are not necessarily indicative of the results to be expected in the future and our summary consolidated statement of operations data for the three months ended March 31, 2022 are not necessarily indicative of the results that may be expected for the year ending December 31, 2022 or any other period. This summary financial data should be read in conjunction with “Management’s Discussion and Analysis of Financial Condition and Results of Operations” and our consolidated financial statements and the accompanying notes thereto included elsewhere in this prospectus.
Consolidated Statements of Operations Data
| Year Ended December 31, | Three Months Ended March 31, | |||||||||||||||
| 2020 | 2021 | 2021 | 2022 | |||||||||||||
| (in thousands, except share and per share data) | ||||||||||||||||
Net sales | $ | 415,856 | $ | 538,350 | $ | 92,683 | $ | 116,304 | ||||||||
Cost of sales | 256,672 | 313,735 | 57,245 | 71,082 | ||||||||||||
|
|
|
|
|
|
|
| |||||||||
Gross profit | 159,184 | 224,615 | 35,438 | 45,222 | ||||||||||||
Selling, general and administrative expenses | 105,222 | 136,385 | 27,057 | 33,278 | ||||||||||||
Goodwill impairment | 13,593 | — | — | — | ||||||||||||
|
|
|
|
|
|
|
| |||||||||
Total operating expenses | 118,815 | 136,385 | 27,057 | 33,278 | ||||||||||||
|
|
|
|
|
|
|
| |||||||||
Income from operations | 40,369 | 88,230 | 8,381 | 11,944 | ||||||||||||
Other (income) expense, net: | ||||||||||||||||
Interest (income) expense, net | 15,546 | 5,237 | 656 | (3,552) | ||||||||||||
Other pension benefit | (165 | ) | (341 | ) | (94) | (278) | ||||||||||
Gain on sale of assets held for sale | (56,290 | ) | — | — | — | |||||||||||
Other income | (943 | ) | (1,606 | ) | (1,161) | (5,115) | ||||||||||
|
|
|
|
|
|
|
| |||||||||
Total other (income) expense, net | (41,852 | ) | 3,290 | (599) | (8,945) | |||||||||||
|
|
|
|
|
|
|
| |||||||||
Income before provision for income taxes | 82,221 | 84,940 | 8,980 | 20,889 | ||||||||||||
Income tax expense | 30,406 | 25,677 | 2,714 | 6,121 | ||||||||||||
|
|
|
|
|
|
|
| |||||||||
Net income | $ | 51,815 | $ | 59,263 | $ | 6,266 | $ | 14,768 | ||||||||
|
|
|
|
|
|
|
| |||||||||
Net income per share attributable to common stockholders, basic and diluted | $ | 51,815 | $ | 59,263 | $ | 6,266 | $ | 14,768 | ||||||||
Weighted-average shares used in computing net income per share attributable to common stockholders, basic and diluted | 1,000 | 1,000 | 1,000 | 1,000 | ||||||||||||
31
Table of Contents
Consolidated Balance Sheet Data
| As of March 31, 2022 | ||||
| (in thousands) | ||||
Cash and cash equivalents | $ | 39,345 | ||
Net working capital(1) | 96,831 | |||
Goodwill | 91,487 | |||
Total assets | 652,402 | |||
Debt-noncurrent | 16,723 | |||
| (1) | We define net working capital as current assets less current liabilities. See our unaudited condensed consolidated financial statements and the accompanying notes included elsewhere in this prospectus for further details regarding our current assets and current liabilities. |
Consolidated Cash Flows Data
| Year Ended December 31, | Three Months Ended March 31, | |||||||||||||||
| 2020 | 2021 | 2021 | 2022 | |||||||||||||
| (in thousands) | ||||||||||||||||
Net cash provided by (used in): | ||||||||||||||||
Operating activities | $ | 58,447 | $ | 122,485 | $ | (539 | ) | $ | (17,766 | ) | ||||||
Investing activities | 57,580 | (24,987 | ) | (4,057 | ) | 2,169 | ||||||||||
Financing activities | (104,091 | ) | (96,360 | ) | 17,278 | 11,802 | ||||||||||
Non-GAAP Financial Measures
In addition to our results determined in accordance with U.S. generally accepted accounting principles (“GAAP”), we believe the following non-GAAP financial measures are useful in evaluating and comparing our financial and operational performance over multiple periods, identifying trends affecting our business, formulating business plans and making strategic decisions.
| Year Ended December 31, | Three Months Ended March 31, | |||||||||||||||
| 2020 | 2021 | 2021 | 2022 | |||||||||||||
| (dollars in thousands, except percentages) | ||||||||||||||||
Net Income | $ | 51,815 | $ | 59,263 | $ | 6,266 | $ | 14,768 | ||||||||
Net Income Margin | 12.5 | % | 11.0 | % | 6.8 | % | 12.7 | % | ||||||||
Adjusted EBITDA(1) | $ | 76,998 | $ | 117,462 | $ | 13,697 | $ | 19,480 | ||||||||
Adjusted EBITDA Margin(1) | 18.5 | % | 21.8 | % | 14.8 | % | 16.7 | % | ||||||||
Adjusted Net Income(2) | $ | 30,203 | $ | 71,420 | $ | 6,695 | $ | 14,087 | ||||||||
Adjusted Net Income Margin(2) | 7.3 | % | 13.3 | % | 7.2 | % | 12.1 | % | ||||||||
| (1) | Adjusted EBITDA and Adjusted EBITDA margin are non-GAAP financial measures. We define Adjusted EBITDA as net income before interest expense, net, income tax expense, depreciation and amortization, foreign exchange (gain)/loss, non-cash impairment, purchase accounting adjustments, non-cash stock-based and other compensation expense, gain on sale of intangible assets, corporate re-organization and related charges, dealer termination expense, gain on sale of assets held for sale, potential transaction / acquisition costs, loss on extinguishment of debt, initial public offering expense, non-operating legal costs and other charges that we do not consider reflective of our ongoing performance. Adjusted EBITDA margin is calculated as Adjusted EBITDA divided by net sales, expressed as a percentage. For information about why we consider Adjusted EBITDA and Adjusted EBITDA margin useful and a discussion of the material risks and limitations of these measures, see “Management’s Discussion and Analysis of Financial Condition and Results of Operations—Non-GAAP Financial Measures.” |
We derived the below financial data for the fiscal years ended December 31, 2020 and 2021 from our audited consolidated financial statements included elsewhere in this prospectus. We derived the below financial data for the fiscal
32
Table of Contents
years ended December 31, 2016, 2017, 2018 and 2019 from our consolidated financial statements not included in this prospectus. We derived the below financial data for the three months ended March 31, 2021 and 2022 from our unaudited condensed consolidated financial statements included elsewhere in this prospectus. We have prepared the consolidated financial statements for the fiscal years ended December 31, 2016, 2017, 2018 and 2019 and the unaudited condensed consolidated financial statements for the three months ended March 31, 2021 and 2022 on the same basis as our audited consolidated financial statements and have included all adjustments, consisting of only normal recurring adjustments, that we consider necessary for a fair presentation of our operating results for such periods. The following table reconciles net income, which is the most directly comparable measure calculated in accordance with GAAP, to Adjusted EBITDA, for each of the periods presented:
| Year Ended December 31, | Three Months Ended March 31, | |||||||||||||||||||||||||||||||
| 2016 | 2017 | 2018 | 2019 | 2020 | 2021 | 2021 | 2022 | |||||||||||||||||||||||||
| (dollars in thousands, except percentages) | ||||||||||||||||||||||||||||||||
Net income | $ | 2,817 | $ | 12,988 | $ | 17,941 | $ | 28,656 | $ | 51,815 | $ | 59,263 | $ | 6,266 | $ | 14,768 | ||||||||||||||||
Interest (income) expense, net | 16,607 | 17,658 | 19,800 | 23,420 | 15,546 | 5,237 | 656 | (3,552 | ) | |||||||||||||||||||||||
Income tax expense | 7,820 | 10,698 | 20,825 | 13,518 | 30,406 | 25,677 | 2,714 | 6,121 | ||||||||||||||||||||||||
Depreciation and amortization | 19,622 | 19,383 | 14,365 | 13,654 | 14,950 | 14,889 | 3,762 | 4,069 | ||||||||||||||||||||||||
Foreign exchange (gain)/loss(a) | (1,023 | ) | 1,419 | 1,072 | 431 | 588 | (438 | ) | (309 | ) | (28 | ) | ||||||||||||||||||||
Non-cash impairment(b) | — | — | — | — | 16,093 | — | — | — | ||||||||||||||||||||||||
Purchase accounting adjustments(c) | 943 | 298 | 131 | 17 | 468 | 71 | 4 | 2 | ||||||||||||||||||||||||
Non-cash stock-based and other compensation expense(d) | — | 3,456 | 7,621 | 7,203 | 2,110 | 7,644 | — | 1,125 | ||||||||||||||||||||||||
Gain on sale of intangible assets(e) | — | — | — | — | — | — | — | (5,100 | ) | |||||||||||||||||||||||
Corporate re-organization and related charges(f) | 2,022 | 961 | 1,954 | — | — | — | — | — | ||||||||||||||||||||||||
Dealer termination expense(g) | 526 | — | — | — | — | — | — | — | ||||||||||||||||||||||||
Gain on sale of assets held for sale(h) | — | — | — | — | (56,290 | ) | — | — | — | |||||||||||||||||||||||
Potential transaction / acquisition costs(i) | 512 | — | 113 | 3,718 | — | 512 | 547 | — | ||||||||||||||||||||||||
Loss on extinguishment of debt(j) | — | — | 3,825 | — | — | — | — | — | ||||||||||||||||||||||||
Initial public offering expense(k) | — | — | — | — | — | 1,513 | — | 2,046 | ||||||||||||||||||||||||
Non-operating legal costs(l) | — | — | — | 471 | 457 | 184 | 41 | 29 | ||||||||||||||||||||||||
Other charges(m) | — | 978 | — | 977 | 855 | 2,910 | 16 | — | ||||||||||||||||||||||||
|
|
|
|
|
|
|
|
|
|
|
|
|
|
|
| |||||||||||||||||
Adjusted EBITDA | $ | 49,846 | $ | 67,839 | $ | 87,647 | $ | 92,065 | $ | 76,998 | $ | 117,462 | $ | 13,697 | $ | 19,480 | ||||||||||||||||
|
|
|
|
|
|
|
|
|
|
|
|
|
|
|
| |||||||||||||||||
Adjusted EBITDA Margin | 12.9 | % | 16.2 | % | 19.5 | % | 19.4 | % | 18.5 | % | 21.8 | % | 14.8 | % | 16.7 | % | ||||||||||||||||
|
|
|
|
|
|
|
|
|
|
|
|
|
|
|
| |||||||||||||||||
| (a) | Foreign exchange (gain)/loss is comprised of gains or losses on receivables, payables or other assets or liabilities which are denominated in foreign currencies. |
| (b) | Non-cash impairment is comprised of impairment losses recorded during the period for both goodwill as well as other long-lived assets. During 2020, we recognized $13.6 million of goodwill impairment and $2.5 million of impairment on trademark assets, both related to our Band segment. |
| (c) | Purchase accounting adjustments reflect the impact on our operating results from step up adjustments recorded in connection with our acquisition by John Paulson and certain affiliated entities in 2013. |
| (d) | Non-cash stock-based and other compensation expense is comprised of expense recognized for liability classified share-based payment awards granted to our executives. |
| (e) | Gain on sale of intangible assets in the three months ended March 31, 2022 relates to the sale of certain land development rights, which drove the gain recognized during the period. |
| (f) | Corporate re-organization and related charges are comprised of expenses incurred in connection with a corporate re-organization that included relocations of our corporate office and our flagship New York City showroom, as well as corporate management changes including the change of our CEO and the elimination of certain global departments, such as global marketing and global human resources. The financial impact of this re-organization and relocation was $2.0 million in 2016, $1.0 million in 2017 and $2.0 million in 2018, of which $1.5 million was for legal settlement fees paid in 2018 to our previous CEO. |
| (g) | Dealer termination expense includes a one-time dealer termination fee of $0.5 million in connection with the termination of our agreement with an exclusive third-party piano dealer in France in 2016. |
| (h) | Gain on sale of assets held for sale is comprised of gains on assets which we held for sale during the period. In 2020, we sold a real estate property, which drove the gain recognized during the period. |
33
Table of Contents
| (i) | Potential transaction / acquisition costs are comprised of professional fees and expenses associated with potential strategic merger and acquisition activities. In 2016 we incurred $0.5 million in costs related to real estate transfer taxes in Germany that were triggered by the purchase of our business by John Paulson and certain affiliated entities in 2013, but not assessed by the German tax authorities until 2016. In 2018, we had $0.1 million of combined costs related to our acquisition of Louis Renner GmbH & Co. KG (“Louis Renner”) and an Austrian piano dealer, as well as strategic transactions that were not consummated. In 2019, we incurred an additional $1.6 million of costs in connection with our acquisition of Louis Renner and the Austrian piano dealer, $1.6 million of costs in connection with certain strategic transactions that were not consummated and $0.5 million of costs in relation to the disposition of a non-operating asset. In 2021, we incurred $0.5 million of employee severance costs in connection with our 2019 acquisition of Louis Renner. |
| (j) | Loss on extinguishment of debt relates to the 2018 refinancing of our First Lien Term Loan Facility and ABL Facility. See “Management’s Discussion and Analysis of Financial Condition and Results of Operations—Liquidity and Capital Resources—Debt.” |
| (k) | Initial public offering expense relates to non-recurring fees and expenses associated with the preparation for this offering. |
| (l) | Non-operating legal costs are comprised of non-recurring legal costs with respect to a case filed by a former piano dealer. The case was dismissed on summary judgment and was affirmed on appeal. |
| (m) | Other charges include non-cash accrual of potential environmental mitigation costs in our Band segment, $0.3 million one-time consulting fees in 2021 associated with the lowering of withholding taxes in the APAC region and a $0.4 million one-time expense in 2021, including $0.2 million in the three months ended March 31, 2021, associated with relocating the production facility of our Musser products. |
| (2) | Adjusted Net Income and Adjusted Net Income margin are non-GAAP financial measures. We define Adjusted Net Income as net income before foreign exchange (gain)/loss, non-cash impairment, purchase accounting adjustments, non-cash stock-based and other compensation expense, gain on sale of intangible assets, corporate re-organization and related charges, dealer termination expense, gain on sale of assets held for sale, potential transaction / acquisition costs, loss on extinguishment of debt, initial public offering expense, non-operating legal costs, other charges that we do not consider reflective of our ongoing performance and tax impacts on the foregoing adjustments. Adjusted Net Income margin is calculated as Adjusted Net Income divided by net sales, expressed as a percentage. For information about why we consider Adjusted Net Income and Adjusted Net Income margin useful and a discussion of the material risks and limitations of these measures, see “Management’s Discussion and Analysis of Financial Condition and Results of Operations—Non-GAAP Financial Measures.” |
We derived the below financial data for the fiscal years ended December 31, 2020 and 2021 from our audited consolidated financial statements included elsewhere in this prospectus. We derived the below financial data for the fiscal years ended December 31, 2016, 2017, 2018 and 2019 from our consolidated financial statements not included in this prospectus. We derived the below financial data for the three months ended March 31, 2021 and 2022 from our unaudited condensed consolidated financial statements included elsewhere in this prospectus. We have prepared the consolidated financial statements for the fiscal years ended December 31, 2016, 2017, 2018 and 2019 and the unaudited condensed consolidated financial statements for the three months ended March 31, 2021 and 2022 on the same basis as our audited consolidated financial statements and have included all adjustments, consisting of only normal recurring adjustments, that we consider necessary for a fair presentation of our operating results for such periods. The following table reconciles net income, which is the most directly comparable measure calculated in accordance with GAAP, to Adjusted Net Income, for each of the periods presented:
34
Table of Contents
| Year Ended December 31, | Three Months Ended March 31, | |||||||||||||||||||||||||||||||
| 2016 | 2017 | 2018 | 2019 | 2020 | 2021 | 2021 | 2022 | |||||||||||||||||||||||||
| (dollars in thousands, except percentages) | ||||||||||||||||||||||||||||||||
Net income | $ | 2,817 | $ | 12,988 | $ | 17,941 | $ | 28,656 | $ | 51,815 | $ | 59,263 | $ | 6,266 | $ | 14,768 | ||||||||||||||||
Foreign exchange (gain)/loss(a) | (1,023 | ) | 1,419 | 1,072 | 431 | 588 | (438 | ) | (309 | ) | (28 | ) | ||||||||||||||||||||
Non-cash impairment(b) | — | — | — | — | 16,093 | — | — | — | ||||||||||||||||||||||||
Purchase accounting adjustments(c) | 9,888 | 7,828 | 1,659 | 205 | 1,413 | 913 | 254 | 514 | ||||||||||||||||||||||||
Non-cash stock-based and other compensation expense(d) | — | 3,456 | 7,621 | 7,203 | 2,110 | 7,644 | — | 1,125 | ||||||||||||||||||||||||
Gain on sale of intangible assets(e) | — | — | — | — | — | — | — | (5,100 | ) | |||||||||||||||||||||||
Corporate re-organization and related charges(f) | 2,022 | 961 | 1,954 | — | — | — | — | — | ||||||||||||||||||||||||
Dealer termination expense(g) | 526 | — | — | — | — | — | — | — | ||||||||||||||||||||||||
Gain on sale of assets held for sale(h) | — | — | — | — | (56,290 | ) | — | — | — | |||||||||||||||||||||||
Potential transaction / acquisition costs(i) | 512 | — | 113 | 3,718 | — | 512 | 547 | — | ||||||||||||||||||||||||
Loss on extinguishment of debt(j) | — | — | 3,825 | — | — | — | — | — | ||||||||||||||||||||||||
Initial public offering expense(k) | — | — | — | — | — | 1,513 | — | 2,046 | ||||||||||||||||||||||||
Non-operating legal costs(l) | — | — | — | 471 | 457 | 184 | 41 | 29 | ||||||||||||||||||||||||
Other charges(m) | — | 978 | — | 977 | 855 | 2,910 | 16 | — | ||||||||||||||||||||||||
Tax impact on adjustments to net income(n) | (724 | ) | (1,289 | ) | (1,717 | ) | (1,507 | ) | 13,162 | (1,081 | ) | (120 | ) | 733 | ||||||||||||||||||
|
|
|
|
|
|
|
|
|
|
|
|
|
|
|
| |||||||||||||||||
Adjusted Net Income | $ | 14,018 | $ | 26,341 | $ | 32,468 | $ | 40,154 | $ | 30,203 | $ | 71,420 | $ | 6,695 | $ | 14,087 | ||||||||||||||||
|
|
|
|
|
|
|
|
|
|
|
|
|
|
|
| |||||||||||||||||
Adjusted Net Income Margin | 3.6 | % | 6.3 | % | 7.2 | % | 8.4 | % | 7.3 | % | 13.3 | % | 7.2 | % | 12.1 | % | ||||||||||||||||
|
|
|
|
|
|
|
|
|
|
|
|
|
|
|
| |||||||||||||||||
| (a) | Foreign exchange (gain)/loss is comprised of gains or losses on receivables, payables or other assets or liabilities which are denominated in foreign currencies. |
| (b) | Non-cash impairment is comprised of impairment losses recorded during the period for both goodwill as well as other long-lived assets. During 2020, we recognized $13.6 million of goodwill impairment and $2.5 million of impairment on trademark assets, both related to our Band segment. |
| (c) | Purchase accounting adjustments reflect the impact on our operating results from step up adjustments, including depreciation thereon, recorded in connection with our acquisition by John Paulson and certain affiliated entities in 2013. |
| (d) | Non-cash stock-based and other compensation expense is comprised of expense recognized for liability classified share-based payment awards granted to our executives. |
| (e) | Gain on sale of intangible assets in the three months ended March 31, 2022 relates to the sale of certain land development rights, which drove the gain recognized during the period. |
| (f) | Corporate re-organization and related charges are comprised of expenses incurred in connection with a corporate re-organization that included relocations of our corporate office and our flagship New York City showroom, as well as corporate management changes including the change of our CEO and the elimination of certain global departments, such as global marketing and global human resources. The financial impact of this re-organization and relocation was $2.0 million in 2016, $1.0 million in 2017 and $2.0 million in 2018, of which $1.5 million was for legal settlement fees paid in 2018 to our previous CEO. |
| (g) | Dealer termination expense includes a one-time dealer termination fee of $0.5 million in connection with the termination of our agreement with an exclusive third-party piano dealer in France in 2016. |
35
Table of Contents
| (h) | Gain on sale of assets held for sale is comprised of gains on assets which we held for sale during the period. In 2020, we sold a real estate property, which drove the gain recognized during the period. |
| (i) | Potential transaction / acquisition costs are comprised of professional fees and expenses associated with potential strategic merger and acquisition activities. In 2016 we incurred $0.5 million in costs related to real estate transfer taxes in Germany that were triggered by the purchase of our business by John Paulson and certain affiliated entities in 2013, but not assessed by the German tax authorities until 2016. In 2018, we had $0.1 million of combined costs related to our acquisition of Louis Renner and an Austrian piano dealer, as well as strategic transactions that were not consummated. In 2019, we incurred an additional $1.6 million of costs in connection with our acquisition of Louis Renner and the Austrian piano dealer, $1.6 million of costs in connection with certain strategic transactions that were not consummated and $0.5 million of costs in relation to the disposition of a non-operating asset. In 2021, we incurred $0.5 million of employee severance costs in connection with our 2019 acquisition of Louis Renner. |
| (j) | Loss on extinguishment of debt relates to the 2018 refinancing of our First Lien Term Loan Facility and ABL Facility. See “Management’s Discussion and Analysis of Financial Condition and Results of Operations—Liquidity and Capital Resources—Debt.” |
| (k) | Initial public offering expense relates to non-recurring fees and expenses associated with the preparation for our initial public offering. |
| (l) | Non-operating legal costs are comprised of non-recurring legal costs with respect to a case filed by a former piano dealer. The case was dismissed on summary judgment and was affirmed on appeal. |
| (m) | Other charges include non-cash accrual of potential environmental mitigation costs in our Band segment, $0.3 million one-time consulting fees in 2021 associated with the lowering of withholding taxes in the APAC region and a $0.4 million one-time expense in 2021, including $0.2 million in the three months ended March 31, 2021, associated with relocating the production facility of our Musser products. |
| (n) | Tax impact on adjustments to net income represents the tax provision estimate calculated by management associated with the aforementioned adjustments. |
36
Table of Contents
Investing in our Class A common stock involves a high degree of risk. You should consider and read carefully all of the risks and uncertainties described below, as well as other information contained in this prospectus, including the section titled “Management’s Discussion and Analysis of Financial Condition and Results of Operations” and our consolidated financial statements, before making an investment decision. The risks described below are not the only ones facing us. The occurrence of any of the following risks or additional risks and uncertainties not presently known to us or that we currently believe to be immaterial could materially and adversely affect our business, financial position, results of operations or cash flows. In any such case, the trading price of our Class A common stock could decline, and you may lose all or part of your investment. This prospectus also contains forward-looking statements and estimates that involve risks and uncertainties. Our actual results could differ materially from those anticipated in the forward-looking statements as a result of specific factors, including the risks and uncertainties described below.
Risks Related to Our Business
Our business is dependent upon the distinctive appeal of the Steinway brand.
Our financial performance is influenced by the perception and recognition of the Steinway brand, which, in turn, depends on many factors such as the quality and image of our pianos, the appeal of our showrooms and stores, our association with leading artists and music institutions, the success of our promotional activities, including public relations and marketing, as well as our general reputation and image. The value of our brand and our ability to achieve premium pricing for our pianos may decline if we are unable to maintain the high-quality standards associated with the Steinway brand. Maintaining our reputation and image, and thus the value of our brand, will depend significantly on our ability to continue to produce high-quality pianos using quality materials and production processes.
Consequently, poor maintenance, promotion and positioning of the Steinway brand, as well as market over-saturation, including due to the supply of used Steinway pianos sold by third-parties outside of our dealer network, may adversely affect our business by diminishing the distinctive appeal of the Steinway brand and tarnishing its image. In addition, we face competition from unauthorized piano dealers and private restoration companies that offer rebuilt or refurbished Steinway pianos using non-Steinway parts. The use of non-Steinway components during the restoration process may result in pianos that bear our name but do not satisfy our quality standards, and such unauthorized products could create confusion in the market and negatively impact our reputation. Products, production methods, distribution networks or marketing methods not in line with our brand image of quality, timelessness and dependability could also affect brand awareness and adversely impact net sales. Additionally, if people do not perceive our products to be high quality or if they do not believe our products are high value, we may not be able to attract new customers, which may have a negative impact on our results of operations.
In addition, adverse publicity regarding Steinway and its products, as well as adverse publicity in respect of, or resulting from, the Company’s third-party vendors, could adversely affect the Company’s business. The considerable expansion in the use of social media in recent years has significantly expanded the potential scope of any negative publicity, which magnifies the risks associated with negative publicity.
Any of the above could harm the Steinway brand and reputation, cause a loss of consumer confidence in the Steinway brand, its products and the industry, and/or negatively affect our results of operations.
37
Table of Contents
Competition within the luxury goods and broader music industry is intense and our existing and potential customers may be attracted to competing forms of products, such as luxury cars, jewelry, and other luxury goods, as well as electronic pianos and keyboards. If our acoustic product lines do not maintain or increase their popularity relative to other types of luxury goods, or electronic or digital instruments, our business, financial condition, results of operations and prospects could be materially adversely affected.
We operate in the luxury goods and musical instrument industries, with a primary focus on acoustic instruments. We compete in the highly competitive market for luxury goods and the long-term success of our business depends on maintaining and increasing the popularity of our Steinway pianos relative to other luxury products and experiences, such as spending on luxury cars, yachts, jewelry, handbags, travel and other forms of leisure. If the Steinway brand becomes less attractive to consumers and HNWI and UHNWI populations choose to purchase other luxury goods instead of our Steinway pianos, demand for our products could decline and have an adverse impact on our financial condition and results of operations. Additionally, other forms of musical instruments, such as electronic pianos and keyboards, have grown in popularity in recent years and may be perceived by users to offer greater variety, affordability, interactivity and enjoyment than our acoustic product lines. Measured by units, the acoustic piano industry in the United States and Europe is much smaller than it was decades ago and the industry could shrink further due to declining consumer interest in the musical genres that feature our instruments or increased competition with other forms of musical or other types of recreation. For example, we compete with other forms of digital and online music composition that do not involve buying and playing physical musical instruments. Evolving consumer tastes and shifting interests, coupled with an ever changing and expanding pipeline of consumer products that compete for consumers’ interest and acceptance, create an environment in which some products can fail to achieve consumer acceptance, while others can be popular during a certain period of time but then be rapidly replaced. If we are unable to sustain sufficient interest in our product lines in comparison to our competitors that specialize in electronic and digital instruments, or other forms of music recreation or luxury goods, our business may be negatively affected.
Since we have a limited number of facilities, any loss of use of any of our facilities, or those of our third-party suppliers, could adversely affect our operations.
Our operations with respect to specific products are concentrated in a limited number of manufacturing and distribution facilities and any disruption at or loss of any of our facilities or those of our third-party suppliers could have a material adverse effect on our Company and operations. All of our Steinway pianos are manufactured in our Astoria, New York or Hamburg, Germany factories. Additionally, we rely on manufacturing facilities for certain of the critical components for our Steinway pianos, including our Springfield, Ohio facility which produces the plates for our pianos and our Louis Renner facilities, located in Gärtringen, Germany and Meuselwitz, Germany, which manufacture the piano actions that connect the keys to the hammers that strike the strings. We also rely on facilities in Germany and Poland that produce the keys for our Steinway pianos. Our Boston pianos are produced in Hamamatsu, Japan and near Jakarta, Indonesia by third-party manufacturers, while our Essex pianos are manufactured in Guangzhou, China by a third-party manufacturer. In addition, our band products sold under our Band segment are manufactured in our U.S. production facilities in Elkhart, Indiana, Eastlake, Ohio and Monroe, North Carolina, as well as at facilities in China, Taiwan and Vietnam. These manufacturing facilities, as well as certain distribution centers we utilize, including those of our third-party suppliers, include computer-controlled equipment, and are subject to a number of risks related to security, computer viruses, software and hardware malfunctions, power interruptions, mechanical failures or other system failures. Strikes and work stoppages, as well as earthquakes, fires, floods, severe weather events, tornadoes or other natural disasters at or near these manufacturing and distribution facilities could also interrupt our operations. A natural disaster or other catastrophic event or the outbreak of a pandemic, including as a result of the COVID-19 pandemic, could cause interruptions
38
Table of Contents
in the manufacture or distribution of our products or critical components thereof and loss of inventory and could impair our ability to fulfill customer orders in a timely manner, or at all. For example, in response to the COVID-19 pandemic and the resultant public health restrictions mandated by governments, we closed our Astoria, New York factory for approximately three months in Spring 2020 and implemented capacity restrictions in our Hamburg, Germany factory that limited the number of personnel on site in compliance with local regulations throughout 2020 and 2021. Additionally, in response to a resurgence of COVID-19 outbreaks in China, in March 2022, the Chinese government imposed lockdowns on several cities, including Shanghai. This mandate has required us to temporarily close our Shanghai facilities, which consist of a key warehouse and distribution center, retail showrooms and administrative offices. As a result of these recent closures, we are currently experiencing, and may continue to experience, delays in our ability to distribute our products and fulfill customer orders in the APAC region, which may have an adverse effect on our business and results of operations. We and our third-party suppliers may also be required to suspend or alter our operations at our respective manufacturing and distribution facilities as a result of any regulatory investigations, enforcement actions or violations or alleged violations of applicable environmental, health, safety or other regulations. To the extent disruptions at a manufacturing or distribution facility occur for an extended time period, we may be required to lease or purchase a new facility. This process would increase the complexity of our supply chain management and be time-consuming and expensive, and would likely result in delays in deliveries of our products to our customers. Furthermore, there is no assurance that we could find new manufacturing or distribution facilities, which are satisfactory to us on commercially acceptable terms, or at all. We maintain only a limited amount of business interruption insurance, which would not be sufficient to cover us in the event of significant disruption at our facilities or at any of our suppliers’ facilities. Because we are heavily dependent on each of our facilities, our operations may be adversely affected if we experience a disruption in business at any particular facility for a prolonged period of time because we may not have adequate substitute facilities available to us.
Our estimates of market opportunity and forecasts of market growth, including in China, may prove to be inaccurate and there is no guarantee that demand for our products will grow as expected, or that we will be able to grow our business at similar rates, if at all.
This prospectus contains various estimates of market opportunities and forecasts of market growth, including estimates and forecasts relating to the global markets for luxury goods, pianos and musical instruments . Our estimates of the market size for our products that we have provided in this prospectus are subject to significant uncertainty and are based on assumptions and estimates, including our internal analysis and industry experience, which may not prove to be accurate. Such estimates and forecasts are derived from third-party industry reports and other business data that are in turn based on a number of assumptions and estimates, including the size of the general application areas in which our products are targeted, that may not prove to be accurate. Even if the markets in which we compete or intend to expand into meet our estimates and forecasts, our business could fail to grow at similar rates, if at all. In particular, although we believe that there is significant market opportunity for increased sales of our products and net sales growth in China, our forecasts are based on a number of assumptions, including in relation to the continued rise of incomes in the country and Chinese government policies that promote music education. Despite our efforts to grow our brand and increase sales of our products in China, there is no guarantee that demand for our products will grow as expected, or at all. Our products are discretionary items and, if China experiences periods of adverse or uncertain economic conditions, consumers may shift their purchases to lower-priced products from our competitors or may forgo purchases of pianos and other musical instruments altogether. Further, during economic downturns we may need to reduce the price of our products or increase marketing spend to remain competitive. Distributors and retailers in China may also seek to reduce their inventories in response to such economic conditions and we could experience a reduction in sales of our products as a result. In addition, China has a large number of social media platforms, which we and our competitors are increasingly using to advertise our products. If we are unable to use
39
Table of Contents
social media effectively to advertise our products in China, it could impact our ability to attract consumers and adversely affect our business, financial condition, results of operations and cash flows. Additionally, we may also face more intense competition from domestic competitors in China, which could negatively impact our growth prospects and market share. The Chinese government has also promoted sales of musical instruments through its enactment of policies that focus on investing in and encouraging music education. This includes China’s 14th Five-Year Plan for the 2021–2025 period, which emphasizes the importance of cultural development, as well as the Ministry of Education’s plan to introduce music and the arts as a compulsory examination subject nationwide as part of high school entrance examinations by 2022. If these policies are abandoned or are no longer prioritized by the government, we could face reduced demand for our products in China, which could adversely affect our ability to implement our growth strategy.
Unfavorable economic conditions and changes in consumer preferences could adversely affect our business.
As a manufacturer and retailer of high-end pianos and other instruments, our products are discretionary purchases and our sales results are particularly sensitive to changes in economic conditions and consumer confidence. Consumer confidence is affected by general business conditions, domestic and international political uncertainties and/or developments, including geopolitical events such as the Russia-Ukraine conflict, changes in the market value of equity securities and real estate, inflation, interest rates and the availability of consumer credit, tax rates and expectations of future economic conditions and employment prospects. Consumer spending for discretionary goods generally declines during times of falling consumer confidence, which negatively affects our sales and net income. Accordingly, our financial and business performance is exposed to global social and macroeconomic risks due to its international scale. An unfavorable economy in one or more of the main countries where we operate, as well as on a global level, could adversely affect the propensity to spend on luxury goods and have a negative impact on piano sales. In particular, we depend on the U.S. and Chinese markets to maintain our current sales and support future growth, and any slowdown in the U.S. or Chinese economies could have a negative impact on the sales and profitability derived from these markets. Measured by units, the acoustic piano industry in the United States and Europe is much smaller than it was decades ago and the industry could shrink further. Growing concerns regarding increased inflation and the overall economic outlook in these regions may have a negative impact on our net sales. Additionally, our Piano segment, which represented approximately 76% and 71% of our total consolidated net sales for the year ended December 31, 2021 and the three months ended March 31, 2022, respectively, sells a relatively small number of Steinway grand pianos each year and even a slight decrease in sales could adversely affect our profitability. Our business is particularly sensitive to changes in the housing market, as consumers are more likely to buy Steinway pianos as they purchase new and higher-end homes. Any decline or slowdown in the U.S. or other housing markets could negatively impact sales of our pianos. The COVID-19 pandemic has had and may continue to have an adverse impact on sales in our Piano segment due to the closing of music and entertainment venues. In the three months ended March 31, 2022, our business was negatively impacted by the imposition of new lockdowns in certain parts of China, and these lockdowns or similar measures in the future could continue to adversely affect our business and operating results. See “Management’s Discussion and Analysis of Financial Condition and Results of Operations—Covid-19 Update.”
Sales in our Band segment are primarily dependent upon our relationships with educational and musical institutions, as well as the continued interest of school-aged children in playing musical instruments, among other factors. The COVID-19 pandemic has had an adverse impact on sales from our Band segment due to the suspension of school music programs. Any decrease in consumer spending, reduction in school budgets or decrease in the number of school-aged children or their interest in music could result in decreased sales, which could adversely affect our business and operating results.
Moreover, the cost of raw materials and components for our products may increase in line with global inflation rates. Increases in the cost of our raw materials may negatively impact our profitability
40
Table of Contents
and profit margins if we are unable to pass the increased costs of raw materials on to our customers. In addition, the rise in freight and warehousing costs incurred to transport and store our products and manufacturing components has had, and may continue to have, a negative impact on our business and results of operations. We may also be adversely affected by increased labor costs as a result of market shortages for employees in the manufacturing, freight, warehousing and other sectors. If our costs were to become subject to significant inflationary pressures, we may not be able to fully offset such higher costs by increasing prices for our products.
Any disruption in the supply of raw materials and components we and our key manufacturers need to manufacture our musical instruments could harm our business, financial condition and results of operations.
At our owned factories as well as the facilities of our manufacturers, our raw materials consist primarily of metals and woods. The majority of these materials are sourced from the United States and Europe, with the balance coming from Asia. We obtain certain of our raw materials from single sources, and any interruption in supply of one or more of our single-sourced raw materials would require us to find replacement sources, which could result in increased costs, disrupt our supply chain and divert management attention and resources. Although we have had adequate supplies of metals and woods in the past, there is no assurance that we may not experience serious interruptions to our supply in the future, which could have an adverse impact on our business, financial condition and results of operations.
In addition, securing adequate supplies of certain electronic components has become more important in our business as we continue to increase our production of our Spirio pianos. For these pianos, which represented approximately 32% of our total Piano segment net sales for the year ended December 31, 2021, we have experienced difficulty obtaining semiconductor chips at their historical standard prices as a result of the ongoing global shortage. If the worldwide shortage of semiconductor chips continues or worsens, we may not be able to source an adequate number of semiconductors at a reasonable price to meet our needs or at all. If we are unable to obtain a sufficient number of semiconductors, we may experience extended lead times for our Spirio products, which may result in order cancellations and/or negative publicity. Semiconductor chips are also a component of the iPads which we include in each sale of our Spirio pianos. As such, any difficulties in sourcing the iPad models included with our Spirio products as a result of the ongoing global semiconductor chip shortage or otherwise could negatively impact our ability to ship completed Spirio pianos on time. Our inability or failure to offset the higher costs of supplies as a result of inflation or disruptions in the supply chain could harm our business, financial condition and results of operations.
We operate in competitive markets.
Our success depends upon our ability to maintain our share of the musical instrument market by providing the best instruments in each market segment in which we compete. Increased competition could lead to price reductions, fewer large sales to institutions, reduced operating margins and loss of market share.
Prices for instruments in the Piano segment are generally higher than those of our competitors but are in line with consumer expectations for pianos of superior performance and quality. Our Steinway pianos currently compete with brands sold by Bösendorfer and Fazioli, which primarily produce and market pianos at the high end of the market. Due to the potential savings associated with buying a used or restored instrument, as well as the durability of the Steinway piano, a relatively large market exists for used or restored Steinway pianos. While it is difficult to estimate the significance of used or restored piano sales because many of these sales are conducted in the private aftermarket,
41
Table of Contents
we believe that used and restored Steinway pianos, including ones sold by us, provide the most significant competition for us in the high-end piano markets in the Americas and EMEA regions. Competition from used and restored Steinway pianos is less prevalent in the APAC region, including China, than it is in the Americas and EMEA regions, as there is not a significant installed base of Steinway pianos in the APAC market.
Our mid and upper-mid priced Boston and Essex pianos compete with brands such as Bechstein, Schimmel, Kawai, and Yamaha. With certain limited exceptions, we allow only Steinway dealers to carry our mid and upper-mid market Boston and Essex piano lines, thereby ensuring that these pianos will be marketed as complementary product lines to the Steinway line.
Our Band segment faces particularly intense competition with a number of domestic and overseas manufacturers of band instruments. Our Band segment competes with various Asian manufacturers, including Jupiter, Yamaha and Eastman Music Company, and our woodwinds and brass instruments also face competition from European manufacturers, such as Buffet Crampon SAS. In addition to Yamaha, our Ludwig line of drums competes with a number of well-known domestic and overseas drum manufacturers, including Pearl and Drum Workshop. Any of our competitors may concentrate their resources upon efforts to compete in our markets. Such competitors may spend more money and time on developing and testing products and services, undertake more extensive marketing campaigns, adopt more aggressive pricing or promotional policies, or otherwise develop more commercially successful products or services than ours, which could negatively impact our business. Our competitors may also develop products, features or services that are similar to ours or that achieve greater market acceptance. Such competitors may also undertake more far-reaching and successful product development efforts or marketing campaigns, or may adopt more aggressive pricing policies. Furthermore, new competitors may enter the musical instrument industry or consolidate with existing competitors. Such consolidation could result in the formation of larger competitors with increased financial resources and altered cost structures, which may enable them to offer more competitive products, gain a larger market share, expand offerings and broaden their geographic scope of operations. In addition, Asian musical instrument manufacturers have made significant strides in recent years to improve their product quality, while continuing to benefit from lower labor costs relative to western markets. They now offer a broad range of quality products at highly competitive prices and represent a significant competitive challenge for us.
It is difficult for us to assess the impact on our business from imported instruments and the sale of used Steinway pianos and those of our competitors, as there is limited data available on this from industry channels, and such impact could be more significant than expected. Our failure to compete effectively could have a negative impact on our results of operations.
We depend on skilled craftspeople to develop and create our pianos and a skilled sales force to sell our pianos, and the failure to attract and retain such individuals could adversely affect our business, financial condition and cash flow.
Although portions of our manufacturing processes are automated and/or outsourced, certain of our products, particularly those under our Piano segment, require a significant amount of skilled labor. We rely on skilled and well-trained craftspeople for the design and production of our pianos. Each Steinway piano is manufactured in our Astoria, New York or Hamburg, Germany factories through an artisanal process that takes at least six months per piano. Our inability to attract or retain qualified employees in our design, production, research and development, sales or other functions could result in diminished quality products and delinquent production schedules, impede our ability to develop new products and harm our business, financial condition and cash flows.
Many of the skills we require are not typically taught in traditional universities or schools. For example, the process of bending the Steinway piano rim is an acquired skill and not widely taught.
42
Table of Contents
Similarly, the skills required to construct and repair our pianos are taught only in highly-specialized trade schools or passed down from generation to generation. For these reasons, many of the skills required to manufacture our pianos are taught to new employees through in-house training and mentoring by more experienced staff. Therefore, if we are unable to retain and promote talent who can teach and train new employees regarding their skillset and expertise, we may be unable to sustain our historical technologies, and the long-term success of our business, as well as our financial condition and cash flows, could be adversely affected. Additionally, we currently have a small technology team that is responsible for the development, maintenance and continuous improvement of our Spirio technology. If we are unable to retain or attract employees with the technical expertise to promote the growth of our Spirio line, our business, reputation and financial condition could be adversely affected.
In addition, we rely on a skilled sales force that is knowledgeable about our products. It is essential that we continue to focus on developing, motivating, and retaining our sales personnel, particularly as we endeavor to grow our direct-to-consumer sales channels. If we fail to adequately identify, recruit, train and retain such sales personnel, our business, financial condition, and results of operations could be adversely affected.
The loss of one or more members of our senior management team could adversely affect our business, financial condition and cash flows.
We operate with minimal redundancy of personnel across various key areas of our business, including manufacturing, sales, legal/compliance, and finance. As a result, we depend on the efforts and expertise of our senior management team, and our future success largely depends on our ability to retain these qualified individuals and to attract and retain other qualified managerial personnel, especially as we grow and expand our international operations. From time to time, there may be changes in our executive management team resulting from the hiring or departure of these personnel. Retaining key management personnel will require significant time, expense and attention, as there is intense competition for such individuals, and new hires require significant training and time before they achieve full productivity. We may also need to increase our management compensation levels to remain competitive in attracting and retaining members of our management team. Further, we do not have formal employment agreements with all of our key personnel and the loss of one or more of our senior management members’ services, and our inability to find suitable replacements or suitable new talent, or the failure by our executive team to effectively work with our employees and lead our company, could have an adverse effect on our business, financial condition and cash flows.
Our primary manufacturing facilities in Astoria, New York and Hamburg, Germany are expensive to operate, and subject us to high labor, tax and other expenses.
Our primary manufacturing facilities in Astoria, New York and Hamburg, Germany are more expensive to operate than equivalent facilities in jurisdictions with more favorable legal regimes and lower cost of labor. We have been producing our Steinway pianos at our Astoria and Hamburg facilities for over 140 years, and believe that our legacy of craftsmanship is inextricably intertwined with our manufacturing process at these locations. Nevertheless, our operations in our Astoria and Hamburg facilities expose us to costs that would be significantly less in jurisdictions more favorable to manufacturing. For example, our cost of labor, including employee wages and benefits, insurance costs, general legal compliance costs, including workplace safety and environmental regulations and protections, and federal, state and local taxes are all substantially higher than they might otherwise be if our primary manufacturing facilities were located elsewhere. Additionally, the jurisdictions in which we operate our manufacturing facilities permit or support unionized labor and, as a result, our labor costs are higher than they might be if our operations were conducted elsewhere.
In 2021, we were able to avoid a substantial property tax increase on our Astoria, New York facility by negotiating a tax abatement with New York City. We could face similar or larger tax
43
Table of Contents
increases in the future which we may be unable to mitigate through negotiating similar tax abatements or other arrangements to reduce our tax burden. Furthermore, the enactment of and our compliance with new laws affecting our Astoria and/or Hamburg facilities could give rise to additional expenses in the future, some of which we may not be able to predict or adequately manage. Our high operating costs at our primary manufacturing facilities in Astoria and Hamburg could have a material adverse effect on our business, financial condition and results of operations.
The artists who play and promote our instruments are an important aspect of our brands’ images. The loss of the support of artists and institutions for our musical instrument products or our inability to gain endorsements from new artists or institutions may harm our business, financial condition and cash flows.
If current or future artists and famous musicians do not use and endorse our musical instrument products, our musical instrument brands could lose value and our net sales could decline. We have created a number of programs to further promote our brands. This includes the Steinway Artist Program, which consists of world-class pianists who voluntarily endorse Steinway & Sons by selecting the Steinway piano. These renowned artists help to reinforce the recognition of the Steinway brand name and its association with quality. Further, we maintain relationships with nearly all of the top music conservatories and schools across the world, which allows emerging artists to become familiar with our Steinway pianos at the outset of their careers. Additionally, the Young Steinway Artist Program allows us to consider pianists between 16 and 35 years of age who own either a Boston or an Essex piano, thus expanding our reach to emerging artists. We also partner with over 220 institutions and schools across the globe as part of our All-Steinway school program to provide students and faculties with our high-quality pianos. Our relationships with leading institutions and artists serve as an endorsement by the institutional and professional community, which in turn helps to drive consumer demand from individuals seeking to purchase high-quality pianos for home use. However, we do not have long-term contracts with any of our Steinway Artists. If we are unable to maintain our current relationships with these artists and institutions, if these artists or institutions attract negative publicity or are no longer popular or if we are unable to continue to attract the endorsement of new artists or institutions in the future, the value of our brands and our business, financial condition and cash flows could be harmed.
Our internal computer systems, or those of any of our third-party service providers, may fail or suffer security breaches, which could cause our business, financial condition and results of operations to suffer.
We increasingly rely on various information technology systems, including the use of our Spirio mobile application, all of which make up our integrated management information system, to process, transmit and store electronic information and we use information technology systems and networks in our operations and supporting departments. The future success and growth of our business depends on these information systems, communications, Internet activity and other network processes.
We may experience unanticipated delays, data breaches, complications or expenses in replacing, upgrading, implementing, integrating and operating our systems. Our integrated management information system regularly requires modifications, improvements or replacements that may result in substantial expenditures and interruptions to our operations and divert our management’s attention and resources away from other aspects of our business. Our ability to implement these systems is subject to the availability of skilled information technology specialists to assist us in creating, implementing and supporting these systems. Our failure to successfully manage, design, implement and maintain all of our systems could have a material adverse effect on our business, financial condition and results of operations.
For instance, our Spirio technology, including our ability to regularly update the Spirio music library, is largely dependent on the operability of our internal computer systems, as well as our ability to
44
Table of Contents
secure and update the source code for our Spirio mobile application, which provides Spirio users access to the music library. Our mobile application, as well as our internal systems, depend in part on the ability of highly technical software and hardware to store, retrieve, process, and manage immense amounts of data. The software and hardware on which we rely has contained, and may in the future contain, errors, bugs, or vulnerabilities and our systems are subject to certain technical limitations that may compromise our ability to meet our objectives. Some errors, bugs, or vulnerabilities inherently may be difficult to detect and may only be discovered after the code has been released for external or internal use. Errors, bugs, vulnerabilities, design defects, or technical limitations within the software and hardware we rely on have in the past led to, and may in the future lead to, outcomes including a negative experience for customers who use our products, compromised ability of our products to perform as advertised or as intended, delayed product launches or updates, compromised ability to protect the data of our customers and/or our intellectual property, or reductions in our ability to provide some or all of our product features. To the extent such errors, bugs, vulnerabilities, or defects impact our software or the ability of customers to utilize our product features and technologies, our brand and reputation may be harmed.
Additionally, our implementation of new information technology or information systems and/or increased use and reliance on web-based hosted (i.e., cloud computing) applications and systems for the storage, processing and transmission of information, including customer and employee personal data, could expose us, our employees and our customers to a risk of loss or misuse of such information. For instance, if we fail to identify vulnerabilities in our information technology or information systems, or if the hosted payment processing applications on which we rely are breached, our customers’ credit card information could be compromised. Like most companies, despite our current security measures, our information technology systems, and those of our third-party service providers, may be vulnerable to information security breaches, acts of vandalism, computer viruses and interruption or loss of personal information and other valuable business data. Our Spirio mobile application also involves the collection, storage, processing and transmission of a large amount of data, including personal information, and the mobile app ecosystem is prone to cyberattacks by third parties seeking unauthorized access to our data or the data of our customers or users or to disrupt our ability to provide service. Stored data might be improperly accessed due to a variety of events beyond our control, including, but not limited to, natural disasters, terrorist attacks, telecommunications failures, computer viruses, hackers and other security issues. For instance, in the past we have experienced certain ransomware attacks that have temporarily disrupted our operations. While these breaches did not materially impact our operations, there is no guarantee that we will not experience similar breaches in the future, which could have a material adverse effect on our operations, cash flows and financial condition. Our efforts to protect personal data and company information may also be adversely impacted by data security or privacy breaches that occur at our third-party suppliers and vendors. We cannot control these third-parties or their systems and cannot guarantee that a data security or privacy breach of their systems will not occur in the future.
Although we rely on a variety of security measures, software, tools and monitoring to provide security for our processing, transmission, and storage of personal information and other confidential information, we cannot assure that we, or our respective third-party service providers will not experience any future security breaches, cyber-attacks or unauthorized disclosures. For example, we face a complex and evolving threat landscape in which cybercriminals, nation-states and “hacktivists” employ a complex array of techniques designed to access personal data and other information, including the use of stolen access credentials, malware, ransomware, phishing, structured query language injection attacks and distributed denial-of-service attacks, which may penetrate our systems despite our extensive and evolving protective information security measures. Further, we rely on our software and hardware providers to issue timely patches for known vulnerabilities; however, the failure of software and hardware companies to release or to timely release effective patching and our reliance
45
Table of Contents
on patches or inability to patch software and hardware vulnerabilities, could expose us to increased risk of attack, data loss and data breach.
Any material misappropriation, loss or other unauthorized disclosure of confidential or personal information, or disruption in performance or availability of our websites or information technology systems as a result of a security breach or cyber-attack could materially adversely affect our business and operations, including damaging our reputation and our relationships with customers, exposing us to risks of litigation and liability, all of which could have a material adverse effect on our operations, cash flows and financial condition. For further information, see also, “—New and existing data privacy laws and/or a significant data security breach of our information systems could increase our operational costs, subject us to claims and otherwise adversely affect our business.” These costs may not be covered by insurance and may require us to divert cash needed to support the growth of our business.
The costs of mitigating cybersecurity risks are significant and are likely to increase in the future. These costs include, but are not limited to, retaining the services of cybersecurity providers; obtaining cyber liability insurance coverage; compliance costs arising out of existing and future cybersecurity, data protection and privacy laws and regulations; and costs related to maintaining redundant networks, data backups and other damage-mitigation measures.
Our business could be adversely impacted by changes in the Internet accessibility of consumers.
Our Spirio technology relies on the ability of our customers to access the Internet and our Spirio library of music and videos through the Spirio application on their personal devices or on the iPad that we provide with each Spirio piano we sell. As a result, sales of and demand for our Spirio pianos may be affected by our customers’ ability to access the Internet. We may operate in jurisdictions with limited Internet connectivity, particularly as we expand internationally. Internet access may be affected by actions taken by Internet providers with significant market power or government-imposed restrictions that degrade, disrupt or increase the cost of our customers’ ability to access our Spirio technology through the Internet. In addition, the Internet infrastructure that we rely on in any particular geographic area may be unable to support the demands placed upon it and could interfere with the speed and availability of our Spirio technology. Any such failure in Internet accessibility, even for a short period of time, could adversely affect our business and results of operations.
We may be unable to strategically expand our showroom footprint or secure direct retail outlets in prime locations, and maintaining our brand image and desirability to consumers requires significant investment in showroom construction, maintenance and periodic renovation.
We operate a network of 33 company-owned retail showrooms globally, ranging from New York to Beverly Hills, Chicago, San Francisco and Miami; across Europe with locations in cultural hubs including London, Paris, Vienna and throughout Germany; and in key APAC locations including Tokyo, Shanghai and Beijing, and we expect to continue to open additional showrooms as we grow our retail operations and execute our growth strategy. Our plan to continue to strategically open showrooms domestically and internationally is dependent upon a number of factors. These include strategically choosing new markets to expand into, the availability of desirable property, placement of showrooms in easily accessible locations with high visibility, the ability to attract qualified sales staff and store managers, the demographics of the area around the showroom, the design and maintenance of the showrooms, the availability of attractive locations within the markets that also meet the operational and financial criteria of management, and the ability to negotiate attractive lease terms. If we are unable to
46
Table of Contents
effectively expand our showroom footprint to satisfy our operational, and financial strategies, our growth and profitability could be negatively impacted.
Additionally, maintaining our brand image and desirability to consumers requires our stores to be constructed and maintained in a manner consistent with that brand image and to be staffed with knowledgeable and qualified sales staff. This requires significant capital investment, including for periodic renovations of existing showrooms. Renovations of existing showrooms may also result in temporary disruptions to an individual showroom’s business. If we cannot secure and retain showroom locations on suitable terms in prime and desired luxury shopping locations, appropriately staff our showrooms or if our investments to construct and/or renovate existing showrooms do not generate sufficient incremental sales and/or profitability or significantly disrupt sales and/or profitability during renovations, our sales and/or earnings performance could be jeopardized.
Our international operations are exposed to risks associated with exchange rate fluctuations and customs, regulations, trade restrictions and political, economic and social instability specific to the countries in which we operate.
We manufacture, market and distribute our products worldwide. Sales outside the Americas accounted for 46.4% and 36.7% of our net sales in the year ended December 31, 2021 and the three months ended March 31, 2022, respectively, and we expect that our international operations could account for a larger portion of our sales in future years as we continue to pursue growth opportunities in China. The various risks inherent in doing business in the United States generally also exist when doing business outside of the United States, and may be exaggerated by the difficulty of doing business in numerous sovereign jurisdictions due to differences in culture, laws and regulations. For example, foreign regulations may limit our ability to produce and sell some of our products or repatriate profits to the United States. In addition, a foreign government may impose trade or foreign exchange restrictions or increased tariffs, which could adversely affect our operations. Our operations may also be negatively impacted by political, economic and social instability in the foreign countries in which we operate. We are also exposed to risks associated with foreign currency fluctuations. A change in the exchange rates of the U.S. dollar, the Chinese yuan, the Japanese yen, the British pound or the Euro relative to each other or other foreign currencies could have a negative impact on us. Although we sometimes engage in transactions to protect against risks associated with foreign currency fluctuations, we cannot be sure that these fluctuations will not have an adverse effect on us. Other examples of risks arising from our international operations include the following, any of which could adversely affect our business, financial condition and cash flows:
| • | increased transportation costs or delays and other logistical problems relating to the transportation of goods shipped by ocean or air freight, including border shutdowns, trade conflicts and general trade route delays caused by events such as adverse weather events and the recent stoppage in the Suez Canal; |
| • | competition from local incumbents that may understand the local market and may operate more effectively than us; |
| • | restrictions on the transfer of funds from such countries to the United States; |
| • | imposition of currency controls; |
| • | increased labor costs and/or shortages; |
| • | changes in governmental policies and regulations, including changes to import/export regulations, tariffs, freight rates or the adoption of protectionist legislation; |
| • | differing and potentially adverse tax consequences, including resulting from the complexities of foreign corporate income tax systems, value added tax (“VAT”) regimes, tax withholding rules, and other indirect taxes, tax collection or remittance obligations, and restrictions on the repatriation of earnings; |
47
Table of Contents
| • | the availability and extent of intellectual property law protections; |
| • | longer payment cycles and difficulties in managing international accounts receivables; |
| • | trade sanctions, political unrest, terrorism, war, including the Russia-Ukraine conflict, epidemics, pandemics, including COVID-19, or the threats of any of these events; |
| • | changing or unstable economic conditions or poor infrastructure; |
| • | different customer demand dynamics and difficulties and costs that arise in our efforts to adapt to local purchasing behaviors and consumer preferences; |
| • | difficulties in ensuring compliance by our employees, agents and contractors with our business practices, as well as with applicable U.S. or foreign laws, including anti-bribery laws, labor laws and laws regulating the sale and manufacture of our products; and |
| • | difficulties in understanding and complying with local laws and regulations in foreign jurisdictions. |
Evolving U.S. and European trade regulations and policies, including with China and other Asian countries, have in the past and may in the future have a material and adverse effect on our business, financial condition and results of operations.
Our products are sourced from a wide variety of suppliers, including from suppliers overseas, particularly in China and other Asian countries. In addition, some of the products that we purchase from vendors in the United States also depend, in whole or in part, on suppliers located outside the United States. Any supply chain disruption or increased costs due to tariffs could impact our ability to obtain adequate supplies from our vendors or our ability to produce sufficient quantities of our products to meet demand in a timely manner, which could harm our business, reputation and relationships with our customers. As a result of our overseas exposure, restrictions or tariffs imposed on products that we or our suppliers import for sale in the United States, European Union, Asia-Pacific and other regions in which we operate could adversely and directly impact our cost of sales. Similarly, we may be materially and adversely affected by retaliatory import tariffs imposed by foreign governments, including China as further described below.
Changes in U.S., German and other trade regulations and policies could have an adverse impact on trade relations between the countries where we operate and certain foreign countries, which could materially and adversely affect our relationships with our international suppliers and reduce the supply of goods available to us. Further, we cannot predict the extent to which the United States, Germany and the other countries in which we operate, will adopt changes to existing trade regulations and policies, or the extent to which certain foreign countries will adopt retaliatory trade measures in response, which creates uncertainties in planning our sourcing strategies and forecasting our margins. For instance, since the beginning of 2018, there has been increasing rhetoric, in some cases coupled with legislative or executive action, from several U.S. and foreign leaders regarding tariffs against foreign imports of certain goods and materials. For example, in 2018 and 2019, the United States imposed significant tariffs on various products imported from China, including certain products we source from China. In response, the Chinese government imposed retaliatory tariffs on imports of U.S. goods. Currently, the majority of Steinway pianos sold in China originate from our Hamburg, Germany factory and, as a result, we have not experienced a significant increase in the cost of importing Steinway pianos into China due to retaliatory tariffs. However, the rise in tariffs has caused us to raise prices on certain of our other products and could increase the cost of selling our products into China and result in us further increasing the prices of those products or increasing the price of Steinway pianos manufactured in the United States and sold in China in the future. Increasing sales into China is one of our key growth strategies and any increase in the cost of our products sold in China, as well as any further raise of the prices of our products, could materially and adversely affect our growth
48
Table of Contents
prospectus and results of operation. The United States has also stated that further tariffs may be imposed on additional products imported from China if a trade agreement is not reached. On January 15, 2020, a “phase one” trade deal was signed between the United States and China and was accompanied by a decision from the United States to cancel a plan to increase tariffs on an additional list of products from China. However, given the limited scope of the phase one agreement, concerns over the stability of bilateral trade relations remain. In addition, the 2020 U.S. presidential election and the resulting transition in the administration has resulted in additional uncertainty regarding the future of U.S. trade relations. At this time, there is no assurance that a broader trade agreement will be successfully negotiated between the United States and China to reduce or eliminate the existing tariffs.
If additional tariffs are imposed on our products, or other retaliatory trade measures are taken, our costs could further increase and we may be required to further raise our prices, which could materially and adversely affect our results.
Failure of our new products to gain market acceptance, or the obsolescence of our existing products, may adversely affect our operating results.
We believe our long-term success will depend in part on our ability to continue to design and engineer products that employ a mix of traditional and cutting-edge technologies that address market needs and appeal to consumers. A portion of our net sales in any year is from new or modified products. We first introduced Steinway Spirio, a line of high-resolution self-player pianos in 2015. This was followed by the launch of Spirio | r in 2019, which enables recording, high-resolution editing and playback. Furthermore, in 2021, we launched Spiriocast, which permits customers to instantly stream live performances, synched with video and audio, from one Spirio | r piano to others across the world. Sales of our Spirio and Spirio | r pianos represented approximately 32% of our total Piano segment net sales for the year ended December 31, 2021. We also continue to introduce custom pianos, such as our bespoke and Art Case custom Steinway pianos, our limited-edition Steinway pianos, our Crown Jewel Steinway collection and our other special collections.
New products may not achieve significant market acceptance or generate sufficient sales to permit us to recover development, manufacturing and marketing costs associated with these products. Achieving market acceptance for new products may also require substantial marketing efforts and expenditures to expand consumer demand. These requirements could strain our management, financial and operational resources. Furthermore, failure of our new products to achieve market acceptance could prevent us from maintaining our existing customer base, gaining new customers or expanding our markets and could have a material adverse effect on our business, financial condition and results of operations.
Additionally, customers may require features and capabilities that our current products do not have. The introduction of new technologies and products by our competitors could make our existing products obsolete or adversely affect our business. Developing new technology and enhancements to our products may require substantial investment and we have no assurance that such investments will be successful. Moreover, we may experience difficulties with development, design or marketing that could delay or prevent our development or introduction of new products. We may also have to upgrade existing products in order for such products to benefit from new features and capabilities developed by us internally. There can be no assurance that new products or upgrades will be released according to schedule, or that when released they will not contain defects. Either of these situations could result in adverse publicity, loss of net sales or delay in market acceptance, all of which could have a material adverse effect on our reputation, business, operating results and financial condition.
49
Table of Contents
We conduct a significant portion of our business in China, and we and our affiliates may be subject to negative publicity in China, which could damage our reputation and have an adverse effect on our business and results of operations.
China is currently our largest market for pianos outside of the United States and piano sales in China represented 28.7% of our Piano segment net sales for the year ended December 31, 2021. We have also sought to grow our brand resonance in the region by establishing relationships with many national conservatories and actively partnering with Chinese concert pianists. Conducting business in China exposes us to political, legal and economic risks. In particular, the political, legal and economic climate in China, both nationally and regionally, is fluid and unpredictable. Our brand could be subject to adverse publicity if incidents related to our products, image, or that of our affiliates, occur or are perceived to have occurred, whether or not we or our affiliates are at fault. In particular, given the popularity of social media, including WeChat and Weibo in China, any negative publicity, regardless of its truthfulness, could quickly proliferate and harm consumer perceptions of and confidence in our company. Furthermore, our ability to successfully position our brand could be adversely affected by public perceptions of the artists or other business partners we collaborate with in China and any actions they take that attract negative publicity, whether or not such actions are related to their collaboration with us. In recent years, certain luxury brands have experienced Chinese boycotts of their products as a result of politically or racially offensive products, ads and statements made by individuals associated with the brands. Incidents such as these may have an adverse effect on our business, financial condition and results of operations.
Our marketing programs may not be successful and the marketing materials we use are regulated and could expose us to potential liability.
We incur costs and expend other resources in our marketing efforts to attract and retain customers. As part of our marketing approach, we rely on various strategies, such as partnering with popular music artists to promote our products, Google ad words, and utilizing various forms of social media advertising, including the operation of a WeChat channel aimed at consumers based in China. Our marketing activities are principally focused on customer education, increasing brand awareness and driving customer volumes. As we open new showrooms, we may undertake additional marketing campaigns to increase awareness about our products. These initiatives may not be successful, and may not adequately attract new customers, resulting in expenses incurred without the benefit of higher net sales.
Further, our ability to market our products may be restricted or limited by federal, state or foreign law, including federal and state consumer protection, advertisement and unfair competition laws that broadly regulate our marketing practices and prohibit false advertising about our products. These laws generally require any claims in advertisement to be truthful, cannot be deceptive or unfair and must be evidence-based. Any failure to comply with such laws can lead to penalties, including sanctions and fines. In addition to domestic laws regulating our marketing efforts, we are subject to regulation by foreign governments in overseas countries where we operate. For instance, in the European Union, the Consumer Rights Directive and the Unfair Commercial Practices Directive harmonized consumer rights across the EU member states. If Consumer Protection Regulators in the European Union find that we are in breach of consumer protection laws, we may be fined or required to change our terms and processes, which may result in increased operational costs. Consumers and certain Consumer Protection Associations in the European Union may also bring individual claims against us if they believe that our terms and/or business practices are not in compliance with local consumer protection laws. Currently, class actions may also be brought in certain countries in the European Union, and the Collective Redress Directive will extend the right to collective redress across the European Union.
50
Table of Contents
Additionally, China’s advertising laws, rules and regulations require advertisers, advertising operators and advertising distributors to ensure that the content of the advertisements they prepare or distribute is fair and accurate and is in full compliance with applicable law. Violation of these laws, rules or regulations may result in penalties, including fines, confiscation of advertising fees, orders to cease dissemination of the advertisements and orders to publish an advertisement correcting the misleading information. In addition, for advertising content related to specific types of products and services, advertisers, advertising operators and advertising distributors must confirm that the advertisers have obtained requisite government approvals, including the advertiser’s operating qualifications, proof of quality inspection of the advertised products, government pre-approval of the contents of the advertisement and filing with the local authorities. Pursuant to China’s advertising laws, we could be required to take steps to monitor the content of any advertisements displayed on our platforms. This could require considerable resources and time, and could significantly affect the operation of our business, while also subjecting us to increased liability under the relevant laws, rules and regulations. The costs associated with complying with such laws, rules and regulations, including any penalties or fines for our failure to so comply if required, could have a material adverse effect on our business, financial condition and results of operations. Any change in the classification of our products and other related services by China’s government may also significantly disrupt our operations and materially and adversely affect our business and prospects.
Our inability to accurately forecast demand for our products and to respond to changes in consumer demand and trends with respect to particular products and product mixes could harm our business, financial condition and cash flows.
Our products typically have long production lead times, particularly our grand pianos that take at least six months to build. Additionally, we also offer exclusive, limited-edition pianos, as well as unique, fully customized models, which typically have production lead times that exceed our standard grand piano models. Accordingly, we make decisions that determine our inventory levels based on our expectations regarding demand for our products. Actual demand may differ significantly from the demand levels that we project, and is particularly uncertain with respect to new products. If we underestimate demand for a new or existing product, we will not have sufficient inventory to meet this demand, which could result in delayed shipments to customers and lost sales. On the other hand, if we overestimate demand, we will have excess inventory of finished products as well as raw materials and work-in-progress. This excess inventory could become obsolete, could result in us incurring costs to manufacture those products earlier than otherwise would have been required, or could result in us shifting production to other products for which we may not have materials in stock. Additionally, the volatile economic conditions in the Unites States, Europe, China and other countries in which we sell our products have also made, and may continue to make, accurate forecasting particularly challenging. Any failure on our part to accurately forecast demand for our products could adversely affect our business, financial condition and cash flows. Further, we operate a limited number of manufacturing facilities. As we continue to expand our business globally, there is a risk that demand for our products could exceed our production capacity. If we are unable to satisfy increased demand for our products, our product sales and operating results may be adversely affected.
Moreover, actual demand for our products is difficult to predict because consumer preferences within the markets for our various products are subject to rapid change and may shift away from our musical instruments and towards other areas based on new products and trends and for other reasons substantially beyond our control. These reasons include, among others: the popularity of genres of music that feature our musical instruments; the popularity of music in general; and new and different ways in which music is created, including, but not limited to, software-based instruments such as GarageBand. In addition, shifts of consumer preferences as to style of music may impact demand for our musical instruments and can change our musical instrument mix. For example, shifts towards
51
Table of Contents
electronic music, rap or music created using sampling or other digital technology, synthesizers, tablets, computers or keyboards could reduce the demand for many of our musical instrument products.
If we are not able to anticipate, identify and respond to changes in consumer preferences and trends in a timely manner, or at all, or if we fail to accurately forecast demand for our products due to those changing preferences and trends, our business, financial condition and cash flows could be harmed.
The COVID-19 pandemic has had a significant effect on our sales results, and could have a significant negative impact on our business, net sales, financial condition and results of operations.
The COVID-19 pandemic has severely restricted the level of economic activity around the world. In response to COVID-19, the governments of many countries, states, cities and other geographic regions have taken preventative or protective actions, such as imposing restrictions on travel and business operations and advising or requiring individuals to limit or forego their time outside of their homes. Temporary closures of businesses, schools and music and entertainment venues have been ordered and numerous other businesses have temporarily closed voluntarily. Further, individuals’ ability to travel has been curtailed through mandated travel restrictions and may be further limited through additional voluntary or mandated closures of travel-related businesses.
Our Band segment has been particularly impacted by COVID-19 due to the prolonged suspension of school music programs and delayed reopening of concert venues. In fiscal years 2021, 2020 and 2019, our Band segment’s net sales was $131.7 million, $98.4 million and $144.1 million, respectively. Due to the impact from COVID-19 on the Band segment, we also recognized a total of $13.6 million and $2.5 million of non-cash goodwill and trademark impairment charges, respectively, during fiscal year 2020. Additionally, our Piano segment was impacted by COVID-19 due to school closings, as well as the closing of music and entertainment venues. Our Piano segment net sales fell for fiscal year 2020 to $317.4 million, compared to $331.6 million for fiscal year 2019, but rebounded to $406.6 million for fiscal year 2021 as schools and entertainment venues re-opened. Piano segment and Band segment net sales for the three months ended March 31, 2022 were $82.3 million and $34.0 million, respectively, compared to $67.8 million and $24.9 million, respectively, for the three months ended March 31, 2021, demonstrating significant growth in both Piano and Band segments as the overall impact of COVID-19 subsided. Our Band segment benefitted from the resumption of school music programs and the reopening of concert venues, while our Piano segment saw improvements in demand in the Americas and EMEA regions, partially offset by modest declines in the APAC region due to new COVID-19 restrictions introduced towards the end of March 2022 in certain parts of China. See “Management’s Discussion and Analysis of Financial Condition and Results of Operations–Covid-19 Update.”
Our business is particularly sensitive to reductions in discretionary consumer spending, music institution closures, and, specifically with respect to our Band segment, school closures. We cannot predict the degree to, or the time period over, which our business will be affected by COVID-19. For example, COVID-19 could continue to impede global economic activity, leading to a further decline in discretionary spending by customers, and result in additional significant effects on our business, net sales, financial condition and results of operations. There are numerous uncertainties associated with the COVID-19 pandemic, including the number of individuals who will become infected, the extent to which vaccines will be widely adopted, the extent of the protective and preventative measures that have been put in place by both governmental entities and other businesses and those that may be put in place in the future, whether the virus’s impact will be seasonal, whether there will be additional variants of the virus and numerous other uncertainties. We intend to continue to execute on our strategic plans and operational initiatives during the COVID-19 pandemic. However, the aforementioned uncertainties may result in delays or modifications to these plans and initiatives.
52
Table of Contents
COVID-19 has also impacted, and may continue to impact, our office locations, and manufacturing and servicing facilities, as well as those of our third-party suppliers and vendors, including through the effects of facility closures, reductions in operating hours, staggered shifts and other social distancing efforts, labor shortages, decreased productivity and unavailability of raw materials or components. For example, we closed most of our facilities temporarily, including our Astoria, New York manufacturing facility for approximately three months in 2020, from late-March to the beginning of July. Further, all of our retail locations have been impacted by the pandemic. The majority of our U.S. retail stores were closed during the spring of 2020 and our European retail stores have been closed intermittently throughout 2020 and 2021. Our retail stores in the APAC region were also impacted by the imposition of lockdowns in certain parts of China in late March 2022. Even after we reopened our U.S. retail locations, we continued to require customers to make appointments in advance until the end of summer in 2021. Further, we have suspended hosting recitals and other similar events in response to the COVID-19 pandemic, which has impacted our sales promotion strategy and overall consumer traffic to our retail stores. The COVID-19 pandemic may also impact distribution and logistics providers’ ability to operate or increase their operating costs. For instance, since the start of the COVID-19 pandemic, we have experienced significant price increases for components that are essential to our products, which has increased our cost of sales. Our cost of sales has also been negatively impacted by increased freight costs. These supply chain effects may negatively affect our ability to meet consumer demand and may increase our costs of production and distribution.
In addition, the COVID-19 pandemic has exacerbated a global semiconductor shortage and made it difficult for us to obtain microchips needed for the production of our Spirio pianos. Since the inception of the pandemic, factory shutdowns and limitations due to employee illness or public health requirements have significantly slowed microchip output, while global demand for products requiring chips has increased. These challenges worsened a pre-existing semiconductor shortage and the supply of semiconductors has not yet rebounded to pre-pandemic levels, driving up demand and costs. The continued delay or disruption in the availability of semiconductors may have a material and negative impact on our Company’s operations and financial results. There is no guarantee that we will be able to obtain semiconductors from suppliers on commercially acceptable terms or at all, and the heightened cost of semiconductors may increase our production costs, which we may not be able to fully pass on to consumers. Further, in order to mitigate risks associated with semiconductor shortages, we may need to carry more inventory than normal to meet expected demand, which could negatively impact our margins.
While the COVID-19 pandemic negatively impacted numerous areas of our business operations, we have also been positively impacted by certain changes to consumer behavior caused by the pandemic. Government mandates, including restrictions on travel and shelter-in-place orders, have caused more people to spend time in the home, in turn spurring increased spending and investment in their housing environment. In 2021 and early 2022, these consumer spending patterns were favorable for our business, as many of our consumers tend to purchase our instruments when upsizing or upscaling their homes. We also believe consumers have placed a greater emphasis on family time and in-home leisure activities during the pandemic. Any reversal of these trends, including a shift to pre-pandemic consumer behavior or other adverse trends as a result of the recovery from the COVID-19 pandemic, could have a materially adverse impact on our piano sales and our business more generally.
For the reasons set forth above and other reasons that may come to light as the Covid-19 pandemic continues to evolve, as of the date hereof, we cannot reasonably estimate the impact of COVID-19 on our business, net sales, financial condition or results of operations; however, such impact could be significantly negative.
53
Table of Contents
Any material disruption of, or a failure to successfully implement or make changes to, information systems could negatively impact our business.
We are increasingly dependent on our information systems to operate our business, including in designing, manufacturing, marketing and distributing our products, as well as processing transactions, managing inventory and accounting for our results. Additionally, we use enterprise resource planning software to manage day-to-day business activities such as accounting, procurement, project management, risk management and compliance, and supply chain operations, and any breach or prolonged disruption to our systems could adversely impact our business. Given the complexity of our global business, it is critical that we maintain the uninterrupted operation of our information systems. Despite our preventative efforts, our information systems may be vulnerable to damage, disruption or shutdown due to power outages, computer and telecommunications failures, computer viruses, systems failures, security breaches, severe weather events or natural disasters. Damage, disruption or shutdown of our information systems may require a significant investment to repair or replace them, and we could suffer interruptions in our operations in the interim.
In addition, in the ordinary course of business, we regularly evaluate and make changes and upgrades to our information systems. These system changes and upgrades can require significant capital investments and dedication of resources. For example, we are currently upgrading our lead management system, customer databases and inventory systems. While we follow a disciplined methodology when evaluating and making such changes, there can be no assurances that we will successfully implement such changes, that such changes will be implemented without delays, that such changes will occur without disruptions to our operations or that the new or upgraded systems will achieve the desired business objectives.
Any damage, disruption or shutdown of our information systems, or the failure to successfully implement new or upgraded systems, could have a direct material adverse effect on our results of operations, could undermine our ability to execute on our strategic and operational initiatives, and could also affect our reputation, our ability to compete effectively, our relationship with customers and the Steinway brand, which could result in reduced sales and profitability.
We could be subject to work stoppages or other business interruptions as a result of our unionized work force.
A significant portion of our hourly employees are represented by various union locals and covered by collective bargaining agreements. We have in the past been and may in the future be involved in disputes with unions or employees represented by a union. Any union organizing activities, such as a strike or work stoppage, could also adversely affect our operations. Organized labor may benefit from new legislation or legal interpretations by the current presidential administration. Particularly, in light of current support for changes to federal and state labor laws, we may be exposed to risks of increased union organization activities in the future, which could result in material interruptions to our business. Additionally, our collective bargaining agreements contain various expiration dates and must be renegotiated upon expiration. See “Business – Human Capital.” If we are unable to negotiate any of our collective bargaining agreements on satisfactory terms prior to expiration, we could experience disruptions in our operations which could have a material adverse effect on our operating results.
Increased pension expenses, contributions and surcharges may have an adverse impact on our financial results.
We are sponsors of defined benefit retirement plans for certain employees. The funded status of these plans (the difference between the fair value of the plan assets and the projected benefit obligation) is a significant factor in determining annual pension expense and cash contributions to fund the plans.
54
Table of Contents
Unfavorable investment performance, increased pension expense and cash contributions may have an adverse impact on our financial results. Under the Employee Retirement Income Security Act of 1974, as amended (“ERISA”), the Pension Benefit Guaranty Corporation (“PBGC”) has the authority to petition a court to terminate an underfunded pension plan in limited circumstances. In the event that our defined benefit pension plans are terminated for any reason, we could be liable for the entire amount of the underfunding, as calculated by the PBGC based on its own assumptions (which would result in a larger obligation than that based on the actuarial assumptions used to fund such plans). Under ERISA and the Code (as defined below), the liability under these defined benefit plans is joint and several with all members of our control group, such that each member of our control group is potentially liable for the defined benefit plans of each other member of the control group.
In addition, we participate in and are required pursuant to collective bargaining agreements to contribute to one material multiemployer pension plan, the United Furniture Worker’s Pension Fund A (the “UFW Plan”), for certain employees. Under the Pension Protection Act of 2006 (the “PPA”), contributions in addition to those made pursuant to a collective bargaining agreement may be required in limited circumstances.
Pension expenses for multiemployer pension plans are recognized by us as contributions are made. Generally, benefits are based on a fixed amount for each year of service. Our contributions to the UFW Plan were $1.5 million during fiscal year 2021.
On February 28, 2017, the UFW Plan trustees filed an application with the PBGC to partition the UFW Plan in accordance with Section 4233 of ERISA. This request was approved effective September 1, 2017, at which point the PBGC partitioned 56% of the UFW Plan’s in-pay participants’ liabilities and 100% of the terminated vested participants’ liabilities to a successor pension plan. On March 15, 2017, the trustees also filed an application with the U.S. Treasury to suspend benefits in accordance with Section 432(e)(9) of the Code and the application was approved effective September 1, 2017. As a result of the partition and the benefits suspension, the UFW Plan’s actuaries project that, on the basis of reasonable assumptions, the UFW Plan will not become insolvent, and will emerge from “critical status” under the PPA in or around the plan year ending February 29, 2044.
The PPA zone status for both of the UFW Plan years ended February 28, 2022 and February 28, 2021 was red. The zone status is based on information we received from the plan and is certified by the plan’s actuary. Plans in the red zone are generally less than 65% funded. A rehabilitation plan was adopted by the plan’s trustees effective March 2009. The rehabilitation plan is designed to improve the plan’s funding status over time. This rehabilitation plan removed some adjustable benefits (pre-retirement lump sum death benefit, withdrawal benefit, 36-month guarantee option and subsidized early retirement for terminated vested members). Effective March 1, 2018, the Company is required to increase its total contributions to the UFW Plan by 1.5% per year (previously 5.5% under the prior rehabilitation plan).
If the hourly employees covered by this plan and our management agree to stop participating in the UFW Plan through the collective bargaining process, then our portion of the estimated unfunded vested benefit as determined by the plan’s actuary would be approximately $49.1 million as of February 28, 2022. Our withdrawal liability is based on unfunded status of the plan and our contribution history and could change based on the amount contributed to the plans, investment returns on the assets held in the plans, actions taken by trustees who manage the plans’ benefit payments, interest rates, the amount of withdrawal liability payments made to the plans, if the employers currently contributing to these plans cease participation, and requirements under the PPA, the Multiemployer Pension Reform Act of 2014 and applicable provisions of the Code. While we currently believe it is unlikely that we would choose to withdraw from this plan, should the rehabilitation effort not be successful or if other participating employers decide to leave the plan, we may elect to do so in the future.
55
Table of Contents
The American Rescue Plan Act of 2021 (“ARPA”) created a new program under which the PBGC will provide grants in the form of special financial assistance (“SFA”) to multiemployer plans with solvency challenges. The UFW Plan is eligible for such relief and, on February 24, 2022, the trustees of the UFW Plan voted to apply to receive SFA. If the UFW Plan receives SFA, the withdrawal liability estimate described above could be materially affected resulting in increased potential withdrawal liability for all employers, including the Company, under the UFW Plan.
In the event we were to exit certain markets or otherwise cease contributing to these plans, we could trigger a substantial withdrawal liability. Any accrual for withdrawal liability will be recorded when a withdrawal is probable and can be reasonably estimated, in accordance with GAAP. All trades or businesses in the employer’s control group are jointly and severally liable for the employer’s withdrawal liability.
We may be subject to warranty claims and consumer protection laws that could result in significant direct or indirect costs, which could have an adverse effect on our business, financial condition, and operating results.
We generally provide a minimum limited warranty on all of our instruments. For example, our pianos generally have warranties that vary between five to ten years depending on the brand. The occurrence of any defects, real or perceived, in our products could damage our brand and make us liable for damages and warranty claims in excess of our current reserves, which could result in an adverse effect on our business prospects, liquidity, financial condition, and cash flows if returns or warranty claims were to materially exceed anticipated levels. Also, while our warranty is limited to defects in material and workmanship, warranty claims may result in litigation, the occurrence of which could have an adverse effect on our business, financial condition, and operating results.
Additionally, in recent years, China’s government, media outlets and public advocacy groups have been increasingly focused on consumer protection. China’s consumer protection laws have broad coverage and regulate all business operators, including manufacturers and retailers, and the laws outline specific measures that businesses must take in the event of defective products or services, including, among other things, recalling products and halting sales. Further, if a consumer is dissatisfied with their purchase of a durable good and makes a complaint within six months, businesses bear the burden of proving that the product is not deficient. We have incurred, and may in the future continue to incur, costs in connection with complying with these increased regulations. If we fail to fully comply with these consumer protection laws, we risk facing strict penalties and the imposition of such penalties in China or any of the other countries in which we operate could have a material adverse effect on our business, financial condition, cash flows and results of operations.
The United Kingdom’s withdrawal from the European Union may have a negative effect on global economic conditions, financial markets and our business.
Following a national referendum and enactment of legislation by the government of the United Kingdom, the United Kingdom formally withdrew from the European Union and ratified a trade and cooperation agreement governing its future relationship with the European Union. The agreement, which was applied provisionally from January 1, 2021 and entered into force on May 1, 2021, addresses trade, economic arrangements, law enforcement, judicial cooperation and a governance framework including procedures for dispute resolution, among other things. Because the agreement merely sets forth a framework in many respects and will require complex additional bilateral negotiations between the United Kingdom and the European Union as both parties continue to work on the rules for implementation, significant political and economic uncertainty remains about how the precise terms of the relationship between the parties will differ from the terms before withdrawal.
56
Table of Contents
We have operations in the United Kingdom and the European Union and, as a result, we face risks associated with the potential uncertainty and disruptions that may follow Brexit and the implementation and application of the trade and cooperation agreement, including with respect to volatility in exchange rates and interest rates, disruptions to the free movement of data, goods, services, people and capital between the United Kingdom and the European Union and potential material changes to the regulatory regime applicable to our operations in the United Kingdom. The uncertainty concerning the United Kingdom’s future legal, political and economic relationship with the European Union could adversely affect political, regulatory, economic or market conditions in the European Union, the United Kingdom and worldwide and could contribute to instability in global political institutions, regulatory agencies and financial markets. These developments have had and may continue to have a material adverse effect on global economic conditions and the stability of global financial markets and could significantly reduce global market liquidity and limit the ability of key market participants to operate in certain financial markets.
We may also face new regulatory costs and challenges as a result of Brexit that could have a material adverse effect on our operations. For example, as of January 1, 2021, the United Kingdom lost the benefits of global trade agreements negotiated by the European Union on behalf of its members, which may result in increased trade barriers that could make doing business in areas that are subject to such global trade agreements more difficult. In addition, Brexit could lead to legal uncertainty and potentially divergent national laws and regulations as the United Kingdom determines which laws of the European Union to replace or replicate. There may continue to be economic uncertainty surrounding the consequences of Brexit that adversely impact customer confidence resulting in fewer customers buying our products, which could materially adversely affect our business, financial condition and results of operations.
The ongoing instability and uncertainty surrounding Brexit and the implementation and application of the trade and cooperation agreement could require us to restructure our business operations in the United Kingdom and the European Union and could have an adverse impact on our business and staff in the United Kingdom and European Union.
We may be vulnerable to climate change, severe weather conditions and natural and man-made disasters, including earthquakes, fires, floods, hurricanes, tornadoes, severe storms (including impacts from rain, snow, lightning and wind), as well as power outages and other industrial incidents, which could severely disrupt the normal operation of our business and adversely affect our results of operations.
We have both domestic and foreign manufacturing operations and operate 33 retail showrooms across the world, including 16 in the United States, 11 in Europe and six in APAC, that are susceptible to the risks associated with climate change as well as natural and man-made disasters. Such risks include those related to the physical impacts of climate change, such as more frequent and severe weather conditions and natural disasters, including earthquakes, fires, floods, hurricanes, tornadoes, severe storms (including impacts from rain, snow, lightning and wind) that may result in power outages or other damage or disruptions at our facilities. In addition to risks associated with climate change, our manufacturing operations and retail showrooms could be negatively affected by man-made disasters and other industrial incidents, any of which could result in system failures, power supply disruptions and other interruptions that could harm our business.
The potential physical impacts of climate change on our properties and operations are highly uncertain and would be particular to the geographic circumstances in areas in which we operate. These may include changes in rainfall and storm patterns and intensities, water shortages, changing sea levels and changing temperatures. Further, climate change and climate events could also result in social, cultural and economic disruptions in these areas, including supply chain disruptions, the
57
Table of Contents
disruption of local infrastructure and transportation systems that could limit the ability of our employees and/or our customers to access locations, or reductions in the availability and quality of raw materials used in our products such as wood, which is sensitive to changes in environmental conditions. These events could also compound adverse economic conditions and impact consumer confidence and discretionary spending. Severe weather events and other risks associated with climate change could negatively affect our business and operations. Further, any impacts to our business and financial condition as a result of climate change are likely to occur over an undetermined period of time and are therefore difficult to quantify with any degree of specificity.
We do not currently, and may not in the future, carry business interruption insurance that would be sufficient to compensate for the losses that may result from interruptions in our operations as a result of inability to operate or failures of equipment and infrastructure at our facilities due to climate change.
Additionally, under Local Law 97 in New York City, most buildings over 25,000 square feet will be required to meet new energy efficiency and greenhouse gas emissions limits by 2024, with stricter limits coming into effect in 2030. We are currently in the process of developing a strategy to adhere to the heightened regulations under Local Law 97. However, if our plan does not meet the statutory requirements of the law, we may be subject to fines in the future. Further, the cost of implementation may exceed our expectations, which could adversely affect our business and results of operations.
We calculate certain operational metrics using internal systems and tools and do not independently verify such metrics. Certain metrics are subject to inherent challenges in measurement, and real or perceived inaccuracies in such metrics may harm our reputation and negatively affect our business.
We refer to a number of operational metrics herein, including Adjusted EBITDA, Adjusted EBITDA margin, Adjusted Net Income, Adjusted Net Income margin and other metrics. We calculate these metrics using internal systems and tools that are not independently verified by any third-party. These metrics may differ from estimates or similar metrics published by third-parties or other companies due to differences in sources, methodologies or the assumptions on which we rely. Our internal systems and tools have a number of limitations, and our methodologies for tracking these metrics may change over time, which could result in unexpected changes to our metrics, including the metrics we publicly disclose on an ongoing basis. If the internal systems and tools we use to track these metrics undercount or over count performance or contain algorithmic or other technical errors, the data we present may not be accurate. While these numbers are based on what we believe to be reasonable estimates of our metrics for the applicable period of measurement, there are inherent challenges in measuring Adjusted EBITDA, Adjusted EBITDA margin, Adjusted Net Income, Adjusted Net Income margin and other metrics. In addition, limitations or errors with respect to how we measure data or with respect to the data that we measure may affect our understanding of certain details of our business, which would affect our long-term strategies. If our operating metrics or our estimates are not accurate representations of our business, or if investors do not perceive our operating metrics to be accurate, or if we discover material inaccuracies with respect to these figures, our reputation may be significantly harmed, and our operating and financial results could be adversely affected.
We may be unable to successfully integrate acquisitions of related companies into our business.
We have historically acquired other businesses whose operations or product lines complement our existing business. For example, in 2019 we acquired Louis Renner GmbH & Co. KG, a German piano actions supplier, to further vertically integrate our production and increase our global competitiveness. We continually explore new opportunities to enter into business combinations with other companies in order to maintain and grow our net sales and market presence.
58
Table of Contents
These potential transactions with other companies create risks, such as difficulty in assimilating their personnel, customers, technology, products and operations with our personnel, customers, technology, products and operations; disruption of our ongoing business, including loss of management focus on existing businesses; and impairment of relationships with existing executives, employees, customers and business partners. In addition, we may not be able to identify suitable candidates for these transactions or obtain financing or otherwise complete these transactions on acceptable terms. Furthermore, the benefits that we anticipate from these potential transactions may not be realized and we cannot be sure that we will recover our investment in any such strategic transaction. In addition, to the extent that we are not able to identify or complete additional acquisitions or investments on satisfactory terms or at all, our ability to expand our business and lower our cost of production may be adversely affected. If we are not able to effectively manage these or any other risks relating to past or future acquisitions or investments, our business, financial condition and cash flows could be harmed.
Our internal control over financial reporting does not currently meet the standards required by Section 404 of the Sarbanes-Oxley Act and if we are unable to effectively implement or maintain a system of internal control over financial reporting, we may not be able to accurately or timely report our financial results and our stock price could be adversely affected.
We are in the process of evaluating our internal controls systems to allow management to report on, and our independent registered public accounting firm to audit, our internal controls over financial reporting. We will be performing the system and process evaluation and testing (and any necessary remediation) required to comply with the management certification and, if required, the auditor attestation requirements of Section 404 of the Sarbanes-Oxley Act. Pursuant to Section 404, we will be required to furnish a report by management on, among other things, the effectiveness of our internal control over financial reporting commencing with our second annual report on Form 10-K. Furthermore, upon completion of this process, we may identify control deficiencies of varying degrees of severity under applicable SEC and PCAOB rules and regulations that require remediation. As a public company, we will be required to report, among other things, control deficiencies that constitute a “material weakness” or changes in internal controls that, or that are reasonably likely to, materially affect internal controls over financial reporting. A “material weakness” is a deficiency, or a combination of deficiencies, in internal control over financial reporting, such that there is a reasonable possibility that a material misstatement of our annual or interim financial statements will not be prevented or detected on a timely basis. A “significant deficiency” is a deficiency, or a combination of deficiencies, in internal control over financial reporting that is less severe than a material weakness, yet important enough to merit attention by those responsible for oversight of our financial reporting.
This assessment will need to include disclosure of any material weaknesses identified by our management in our internal control over financial reporting, as well as a statement that our independent registered public accounting firm has issued an opinion on the effectiveness of our internal control over financial reporting, provided that our independent registered public accounting firm will not be required to attest to the effectiveness of our internal control over financial reporting until our first annual report required to be filed with the SEC following the later of the date we are deemed to be an “accelerated filer” or a “large accelerated filer,” each as defined in the Exchange Act, or the date we are no longer an emerging growth company, as defined in the JOBS Act. We could be an emerging growth company for up to five years. An independent assessment of the effectiveness of our internal controls could detect problems that our management’s assessment might not. Undetected material weaknesses in our internal controls could lead to financial statement restatements and require us to incur the expense of remediation. We will be required to disclose changes made in our internal control and procedures on a quarterly basis. To comply with the requirements of being a public company, we may need to undertake various actions, such as implementing new internal controls and procedures
59
Table of Contents
and hiring accounting or internal audit staff. Testing and maintaining internal controls can divert our management’s attention from other matters that are important to the operation of our business.
In connection with the audit of our consolidated financial statements for fiscal year 2020, we identified certain material weaknesses in our internal controls over financial reporting. Specifically, we did not have sufficient processes for the provisioning and governance of user access to financially significant systems that resulted in a lack of segregation of duties related to journal entries. Additionally, we did not have sufficient processes to facilitate accurate and timely financial reporting according to GAAP as related to non-cash stock-based and other compensation.
We remediated these material weaknesses during fiscal year 2021 by designing and implementing the following controls and procedures:
| • | we implemented additional approval processes to ensure completeness and accuracy of approved and posted journal entries; |
| • | we implemented changes to our user access governance practice to ensure proper segregation of duties for the new journal entries approval process; |
| • | we implemented further IT general controls to manage access and program changes within our IT environment; |
| • | we engaged external resources to assist with remediation efforts related to non-cash stock-based and other compensation and internal control execution as well as to provide additional training to existing personnel, including the development of written policies and procedures in certain areas; and |
| • | we hired additional internal resources with appropriate knowledge and expertise to effectively operate financial reporting processes and internal controls. |
We have not been required to provide a management assessment of internal controls under section 404(a) of the Sarbanes-Oxley Act. It is possible that if we had a 404(a) assessment, additional material weaknesses may have been identified. Additionally, our registered independent public accounting firm has not been engaged to perform an audit of our internal controls over financial reporting.
We cannot assure you that measures we have taken to date, and actions we may take in the future, will be sufficient to prevent or avoid potential future material weaknesses. In the future, it is possible that additional material weaknesses or significant deficiencies that we identify may not be remedied in time to meet the applicable deadline imposed upon us for compliance with the requirements of Section 404. Our ability to comply with the annual internal control reporting requirements will depend on the effectiveness of our financial reporting and data systems and controls across our Company. If we identify any material weaknesses in our internal control over financial reporting or are unable to comply with the requirements of Section 404 in a timely manner or assert that our internal control over financial reporting is effective, if we are required to make restatements of our financial statements, or if our independent registered public accounting firm is unable to express an opinion as to the effectiveness of our internal control over financial reporting, investors may lose confidence in the accuracy, completeness or reliability of our financial reports and the trading price of our common stock may be adversely affected, and we could become subject to sanctions or investigations by the NYSE, the SEC or other regulatory authorities, which could require additional financial and management resources. In addition, if we fail to remedy any material weakness, our financial statements could be inaccurate and we could face restricted access to the capital markets.
60
Table of Contents
Defects in our products could harm our brands and our business.
Our products may expose us to liability from claims by consumers for damages, including bodily injury or property damage. These claims, whether meritorious or not, could harm our reputation and net sales, be costly to defend and could harm our business and results of operations. In addition, even if no bodily injury or property damage occurs from a defect, if our products do not function properly, we may be obligated to replace these products at no additional charge, which also could harm our business and results of operations. Although we maintain general product liability insurance, there can be no assurance that we will be adequately covered against claims or that we will not have to obtain additional coverage in the future, which may not be available on acceptable terms or at all.
Risks Related to Our Reliance on Third-Parties
We generate most of our sales through independent dealers and distributors.
We depend on a network of independent dealers and distributors to distribute a majority of our pianos and all of our band instruments. If our dealers are unsuccessful, they will reduce their purchases from us. This would negatively impact our sales and production rates.
In addition, we rely on our dealers to be knowledgeable about our products and their features. If we are not able to educate our dealers so that they may effectively sell our pianos and all of our band instruments, or if our dealers do not provide positive buying experiences for our consumers, demand for our products may fall and our brands and business could be harmed.
Because we rely on independent dealers for the majority of our sales, we depend on our dealers having succession and management continuity plans. If our dealers cease their operations due to a lack of such plans, we would need to find new dealers, which may not be possible on favorable terms or at all. In the alternative, we would need to use our own sales force to replace such dealers, which may require expanding our retail presence. Expanding our sales force and retail presence into new locations takes a significant amount of time and resources, and there is no assurance that we would be successful in such an expansion. Any failure on the part of our dealers or inability to secure adequate replacement representation in all of our existing markets could have an adverse effect on our operating results.
Any significant disruption in our supply from key suppliers could delay production and adversely affect our sales.
We depend on a number of key suppliers with respect to our piano and band instruments. Our Essex and Boston piano lines are sourced from manufacturers in Asia. For our Band segment, certain component parts and some of our entry-level band instruments, including our entry-level trumpets, trombones, saxophones, flutes and clarinets, are also sourced from single manufacturers in Asia. We also depend on certain job shops located in the Midwestern United States for milling and sub-assembly of component parts used in our premium U.S.-manufactured instruments. For example, one job shop on which we rely makes the valve guides for our professional line of trumpets. Furthermore, due to the relatively small size of the piano industry, suppliers of machinery and equipment for manufacturing are also limited.
We are highly dependent on the availability of essential materials and purchased components from our suppliers, some of which may be available only from limited or sole resources. Moreover, we are dependent upon the ability of our suppliers to provide material that meets specifications, quality standards and delivery schedules. Our suppliers’ failure to provide expected raw materials or component parts would adversely affect production schedules and profitability.
61
Table of Contents
Although we have had adequate supplies of raw materials and component parts in the past, there is no assurance that we may not experience serious interruptions in the future. Our continued supply of materials is subject to a number of risks, including: the destruction of our suppliers’ facilities or their distribution infrastructure; work stoppages or strikes by our suppliers’ employees; the failure of our suppliers to provide materials of the requisite quality and compliant with applicable regulatory requirements; the failure of essential equipment at our suppliers’ plants; the failure or shortage of supply of raw materials and labor available to our suppliers; the liquidity of our suppliers and their ability to access adequate financing to fund their operations and contractual amendments and disputes with our suppliers.
We cannot assure investors that our suppliers will continue to provide products to us at attractive prices or at all, or that we will be able to obtain such products in the future from these or other providers on the scale and within the time periods we require. Furthermore, we cannot assure investors that substitute raw materials or component parts will meet the strict specification and quality standards we impose or that are required under applicable laws and regulations. If we are not able to obtain key materials, supplies, components or sourced instruments on a timely basis and at affordable costs, or we experience significant delays or interruptions of their supply, it could have a material adverse effect on our business, financial condition and results of operations.
Our third-party manufacturers and suppliers may not continue to manufacture products that are consistent with our standards and our quality control measures may be inadequate, either of which could damage the value of our brands and harm our business, financial condition and cash flows.
We rely on our third-party manufacturers and suppliers to maintain production quality that meets our standards. Our third-party manufacturers and suppliers may not continue to manufacture products that are consistent with our standards as a result of the use of lower-quality raw materials, changes in production methods, a shortage of qualified employees or poor financial condition. Our products are transported from our third-party manufacturers and suppliers primarily by ocean freight where the product can be exposed to fluctuations in temperature and humidity. Supply chain logistics issues exacerbated by the COVID-19 pandemic may lead to increasing delays in offloading ocean freight and could cause our products to be exposed to these conditions for longer time periods. The primary material used in the production of our musical instruments is wood, which is sensitive to such changing environmental conditions. Our quality control measures largely consist of inspecting samples of products shipped to us and visiting our third-party manufacturers and suppliers. In addition, we currently outsource our restoration services to a third-party contractor with facilities in Iowa and we rely on such third-party to maintain our quality control standards during the restoration process. With respect to all of our outsourced products, we engage employees located in the country of origin to oversee quality control and production at offshore manufacturing facilities operated by third parties. Our inspection methods, however, may prove inadequate to detect defects in our products before they reach consumers.
If our third-party manufacturers and suppliers do not maintain adequate quality control measures, or if the quality control inspection measures that we employ fail to detect quality control issues, our reputation and the value of our brands could be harmed, and we could incur increased returns and warranty expense, either of which would harm our business, financial condition and cash flows.
Any delay in the delivery of our products to customers could harm our business, financial condition and cash flows.
Our ability to meet our customers’ demand in a timely manner is a critical component of our business. Any delay in the shipment of our products could result in lost sales. It is especially important
62
Table of Contents
that we meet our customers’ demand in a timely manner during the holiday selling season, as the fourth quarter historically has been our highest selling quarter. In many instances, delays in filling our wholesale customers’ product orders have led to an increased backlog. Events that could result in shipment delays include:
| • | disruption at our manufacturing facilities or those of our third-party suppliers or manufacturers, as a result of a variety of factors, including, but not limited to, labor disruptions, contractual disputes, labor shortages, natural disasters, technological or mechanical failures in the machines used to manufacture our products or in our enterprise resource planning systems and warehouse management systems; |
| • | limitations on the ability of our suppliers to provide raw materials and finished goods to ensure our paced production plan volumes and product mix schedule; |
| • | delays in receiving component parts required to manufacture our products; |
| • | delays in the transportation of our products either to our warehouse facilities or to our customers; and |
| • | inaccurate forecasting of demand for our products. |
Any of the events discussed above, or other events that disrupt the supply of our products to our customers, could harm our business, financial condition and cash flows.
In addition, if demand for our products increases, we would need to accurately forecast, purchase, warehouse and transport materials and critical components to our manufacturing facilities and distribution locations and at higher volumes. We rely on a limited number of manufacturing facilities and if demand outpaces our current production capacity at those locations or those of our third parties, we could be unable to satisfy customer orders on time, or at all. Additionally, if our key suppliers are unable to deliver adequate quantities of materials and critical components to satisfy heightened demand, we would need to identify alternate sources for such materials in a timely manner. Developing alternate sources of supply that meet our quality standards may be time-consuming, difficult and costly and we may not be able to source these essential materials and components on terms that are acceptable to us, or at all, which may undermine our ability to fulfill our orders in a timely manner. Further, disruptions at our manufacturing facilities and warehouses, including as a result of government-mandated closures in response to COVID-19 outbreaks, could negatively impact our production and distribution capacity and reduce our ability to meet increased customer demand for our products. Our expansion into new and existing geographic markets increases this risk, as do disruptions in global supply chain networks. If we cannot meet increased demand for our products, our reputation with customers could be harmed.
Increased focus on corporate responsibility, including environmental, social, and governance factors, may impose additional costs and expose us to new risks.
In recent years, increasing attention has been given to corporate activities related to environmental, social and governance (“ESG”) matters. A number of investors, advocacy groups, and other stakeholders, both domestically and internationally, have campaigned for governmental and private action to promote change at public companies related to ESG matters, including increasing attention and demands for action and public disclosure related to climate change, implementation of sustainable business practices (such as recycling, waste reduction, energy efficiency and use of renewable energy), consideration of biodiversity impact, workforce diversity and inclusion, issues associated with supply chains (including involuntary labor risks and human rights of workers in the supply chain), and fair labor practices. Organizations that provide information to investors on corporate governance and related matters have developed ratings systems for evaluating companies on their
63
Table of Contents
approach to ESG matters and these ratings are used by some investors to inform their investment and voting decisions. If we fail to adapt to or meet internal or external expectations and standards on ESG, even if not legally obligated to do so, we may receive unfavorable ESG ratings and/or suffer from reputational damage, which could have a negative impact on our stock price and our access to and costs of capital.
In addition, the adoption of new ESG-related regulations applicable to our business, or pressure from key stakeholders to comply with additional voluntary ESG-related initiatives or frameworks, could require us to make substantial investments in ESG matters, which could impact the results of our operations. Decisions or related investments in this regard could affect consumer perceptions as to our brand. Furthermore, if our competitors’ corporate responsibility or ESG performance is perceived to be greater than ours, potential or current investors may elect to invest with our competitors instead. In the event that we publicize certain initiatives or goals regarding ESG matters, we could fail, or be perceived to fail, in our achievement of such initiatives or goals, or we could be criticized for the scope of such initiatives or goals. If we fail to satisfy the expectations of investors and other key stakeholders or our initiatives are not executed as planned, our reputation and financial results could be materially and adversely affected.
While we have undertaken a number of ESG-related initiatives, for example, we are installing energy-efficient LED lighting at our Astoria, New York factory and other company facilities in order to reduce our energy consumption, recycling wood wastes, sourcing lumber supplies from Forest Stewardship Council (“FSC”) certified suppliers, and continuing our commitment to attracting and retaining a diverse and inclusive workforce, this increased focus on ESG initiatives could affect some aspects of our operations. For example, the criteria used in assessing our products’ sustainability, or our companies’ ESG-related performance more generally, could change, which could result in greater expectations of us and cause us to undertake costly initiatives to satisfy such new criteria. If we are unable to satisfy such new criteria, investors may conclude that our ESG-related policies are inadequate. We risk damage to our brand and reputation in the event that our corporate responsibility procedures or standards do not meet the standards set by various constituencies.
We do not control our suppliers or third-party manufacturers, or require them to comply with a formal code of conduct, and actions that they might take could harm our reputation and business, financial condition and cash flows.
We do not control our suppliers or third-party manufacturers. We generally do not inspect or audit our suppliers’ compliance with labor, environmental or other laws, regulations or practices and we do not require our suppliers or third-party manufacturers to comply with any form of code of conduct. Other consumer products companies have faced significant criticism for the actions of their suppliers or third-party manufacturers, and we could face similar problems in the future. A violation of such laws or regulations by our suppliers or third-party manufacturers, or a failure of these parties to follow generally accepted ethical business practices, could reduce demand for our products (or harm our ability to meet demand if we need to locate alternative suppliers or third-party manufacturers because of such violations or failures), create negative publicity and harm our business, financial condition and cash flows.
We are subject to payment processing risks and our business is affected by the availability of third-party financing to our customers.
Our customers pay for our products using a variety of different payment methods, including credit and debit cards, certified checks, personal checks, wires, purchase orders for institutional buyers, and third-party financing arrangements. In China, we accept WeChat Pay or Alipay for certain of our pianos. We commonly offer financing arrangements in connection with the purchase of our Piano
64
Table of Contents
segment products and such arrangements serve as an important alternative to cash payments. Historically, a majority of our customers using financing arrangements have relied on third-party credit providers with whom we have existing relationships. If we are unable to maintain our relationships with our financing partners, there is no guarantee that we will be able to find replacement partners who will provide our customers with financing on similar terms, if any, and our ability to sell our services may be materially adversely affected. Further, reductions in consumer lending and the availability of consumer credit could limit the number of customers with the financial means to purchase our products. Higher interest rates could increase our costs or the monthly payments for our services financed through other sources of consumer financing. In the future, there is no assurance that third-party financing providers will continue to provide consumers with access to credit or that available credit limits will not be reduced. Such restrictions or reductions in the availability of consumer credit, or the loss of any of our relationships with our current financing partners, could have a material adverse effect on our business, financial condition and results of operations.
We rely on internal systems as well as those of third parties to process payment. Acceptance and processing of these payment methods are subject to certain rules and regulations and require payment of interchange and other fees. For example, we are subject to the Payment Card Industry (“PCI”) Data Security Standard, which contains compliance guidelines and standards designed to protect payment card data as mandated by payment card industry entities. We have implemented various internal processes to ensure PCI compliance, such as conducting annual audits in the U.S., and we are currently PCI compliant in the applicable jurisdictions in which we operate. Despite our ongoing compliance efforts, we may become subject to claims that we have violated the PCI Data Security Standard, which could subject us to substantial fines and penalties.
To the extent there are disruptions in our payment processing systems, increases in payment processing fees, material changes in the payment ecosystem, such as large reissuances of payment cards, delays in receiving payments from payment processors, or changes to rules or regulations concerning payment processing, our net sales, operating expenses and results of operation could be adversely impacted. We leverage our third-party payment processors to bill customers on our behalf. If these third parties become unwilling or unable to continue processing payments on our behalf, including due to their non-compliance with applicable rules or regulations concerning payment processing, we would have to find alternative methods of collecting payments, which could adversely impact customer acquisition and retention. In addition, from time to time, we encounter fraudulent use of payment methods, which could impact our results of operation and, if not adequately controlled and managed, could create negative consumer perceptions of our business. If we fail to comply with applicable rules and regulations of any provider of a payment method we accept, if the volume of payment fraud in our transactions triggers limits or terminates our rights to use payment methods we currently accept, or if a data breach occurs relating to our payment systems, we may be subject to fines or higher transaction fees and may lose our ability to accept certain payment card transactions. If services of our payment providers are interrupted, harmed or such payment providers or our internal payment processing systems are subject to fraud or cyber security attacks, this may result in the data protection of our customers being compromised and the access, public disclosure, loss or theft of their personal information, as well as an inability to process their payments.
Risks Related to Our Intellectual Property
We depend upon third-party licenses for the use of content in our Spirio library of music and videos. An adverse change to, loss of, or claim that we do not hold necessary licenses may have an adverse effect on our business, operating results, and financial condition.
Approximately 32% of our total Piano segment net sales for the year ended December 31, 2021 were attributable to sales of our Spirio and Spirio | r pianos, giving our customers access to a library of
65
Table of Contents
music and videos, accessible on their personal devices, which can be enjoyed via their high-resolution player piano. To secure the rights required to use music and/or videos in our content, we rely upon a combination of content that is in the public domain and licenses from rights holders such as music publishers, performing rights organizations, collecting societies, artists, and other copyright owners or their agents. Such license agreements may require us to pay royalties and license fees to such parties or their agents around the world.
The process of obtaining licenses involves identifying and negotiating with many rights holders, some of whom are unknown or difficult to identify, and implicates a myriad of complex and evolving legal issues across many jurisdictions, including open questions of law as to when and whether particular licenses are needed. At times, while we may hold the necessary license for certain music in the United States, it may be difficult to obtain the necessary license for the same music from the applicable rights holders outside of the United States. Rights holders also may attempt to take advantage of their market power to seek onerous financial terms from us. Our relationship with certain rights holders may deteriorate. Artists and/or artist representatives may object and may exert public or private pressure on rights holders to discontinue or to modify license terms. Additionally, there is a risk that aspiring rights holders, their agents, or legislative or regulatory bodies will create or attempt to create new rights that could require us to enter into new license agreements with, and pay royalties to, newly defined groups of rights holders, some of which may be difficult or impossible to identify. As a result, we may enter into a license for our Spirio library of music and videos from a content owner who may later be found not to legally have the right to grant us a license to distribute the music and videos on our platform. Lastly, if we fail to obtain necessary rights to comply with any of the obligations under our license agreements, we may be required to pay damages and the counterparty may have the right to terminate the license. Termination by the licensor would cause us to lose valuable rights, and could prevent us from using certain music and/or videos in the Spirio library, or inhibit our ability to commercialize future products. Any of the foregoing could have a material adverse effect on our competitive position, business, financial condition and results of operations.
With respect to musical compositions, in addition to obtaining publishing rights, we may need to obtain separate public performance rights for certain features of our product suite. In the United States, public performance rights are typically obtained through intermediaries known as performing rights organizations (“PROs”), which (a) issue blanket licenses with copyright users for the public performance of compositions in their repertory, (b) collect royalties under those licenses, and (c) distribute such royalties to copyright owners. Licenses provided by ASCAP and BMI currently are governed by consent decrees, which were issued by the U.S. Department of Justice in an effort to curb anti-competitive conduct. Removal of, or changes to, the terms or interpretation of our agreements could affect our ability to obtain licenses from these PROs on current and/or otherwise favorable terms, which could harm our business, operating results, and financial condition.
In other parts of the world, including in Canada and Europe, we may also require licenses for musical compositions either through local collecting societies representing publishers, or from publishers or other rights holders directly, or a combination thereof. No assurance can be given that any licenses with collecting societies and our direct licenses with publishers or other rights holders provide full coverage for all of the musical compositions we use in our service in the countries in which we operate, or that we may enter in the future. Publishers, songwriters, and other rights holders who choose not to be represented by major or independent publishing companies or collecting societies could adversely impact our ability to secure licensing arrangements in connection with musical compositions that such rights holders own or control, and could increase the risk of liability for copyright infringement.
License agreements securing the right to use and distribute music and videos are complex, and certain provisions in those agreements may be susceptible to multiple interpretations. The resolution of
66
Table of Contents
any contract interpretation disagreement that may arise could narrow what we believe to be the scope of our rights, or increase what we believe to be our financial or other obligations under the relevant agreement. If it is determined in an applicable tribunal or court of competent jurisdiction that we are in breach of any such agreement, we could be liable for damages, and the license might be subject to termination, which may mean that we would need to cease use of the applicable music and/or videos.
Furthermore, although we seek to comply with all applicable statutory, regulatory, and judicial frameworks, due to a multitude of factors beyond our control, including the disparities in how music rights are licensed and administered across such statutory, regulatory and judicial frameworks, the variable interests that rights holders may possess in the music used on our platform and the number of rights holders whose interests may be implicated, no assurance can be given that we currently hold, or will always hold, every necessary right to use all of the music that is offered in our Spirio library.
These challenges, and others concerning the licensing of music on our platform, may subject us to liability for copyright infringement, breach of contract, or other claims.
If we cannot successfully protect our intellectual property and proprietary information, our business would suffer.
Our success depends, to a significant degree, on our ability to obtain, maintain, protect, defend and enforce our intellectual property and other proprietary rights. We particularly rely on our trademarks for our brand recognition and protection, and rely on trade dress, patents and other intellectual property rights to protect and maintain the distinctiveness of our products and their sound quality and style. Because of the differences in foreign trademark, patent and other laws concerning proprietary rights, our intellectual property rights may not receive the same degree of protection in foreign countries as they would in the United States. Our failure to obtain or maintain adequate protection of our intellectual property rights for any reason could have a material adverse effect on our business, results of operations and financial condition.
We have registered many of our brand names as trademarks in the United States and in certain foreign countries. While we intend to continue to apply for trademark registrations where we believe it would be beneficial, we cannot assure you that our trademark applications will be approved. Third parties may also oppose our trademark applications, or otherwise challenge our use of the trademarks. In the event that our trademarks are successfully challenged, we could be forced to rebrand our products, which could result in loss of brand recognition, and could require us to devote resources to advertising and marketing new brands. Further, we cannot assure you that competitors will not infringe our trademarks, or that we will have adequate resources to enforce our trademarks. We also license third parties to use our trademarks. In an effort to preserve our trademark rights, we enter into license agreements with these third parties which govern the use of our trademarks, and which require our licensees to abide by quality control standards with respect to the goods and services that they provide under our trademarks. Although we make efforts to police the use of our trademarks by our licensees, we cannot assure you that these efforts will be sufficient to ensure that our licensees abide by the terms of their licenses. In the event that our licensees fail to do so, our trademark rights could be diminished, and our reputation could be harmed.
We have also applied for patent protection in the United States and certain other countries relating to certain existing and proposed products and processes. We cannot assure you that any of our patent applications will be approved or that our products, such as the Steinway piano and Spirio technology, will not infringe third-party patents or other proprietary rights. The patents we own could be challenged, invalidated or circumvented by others and may not be of sufficient scope or strength to provide us with any meaningful protection or commercial advantage. Many patent applications in the U.S. are maintained in secrecy for a period of time after they are filed, and since publication of
67
Table of Contents
discoveries in the scientific or patent literature tends to lag behind actual discoveries by several months, we cannot be certain that we will be the first creator of inventions covered by any patent application we make or the first to file patent applications on such inventions. Further, we cannot assure you that competitors will not infringe our patents, or that we will have adequate resources to enforce our patents.
We also rely on unpatented proprietary technology. It is possible that others will independently develop the same or similar technology or otherwise obtain access to our unpatented technology. To protect our trade secrets, know-how and other proprietary information, we require employees, consultants, advisors and collaborators to enter into confidentiality agreements. We cannot assure you that these agreements will provide meaningful protection for our trade secrets, know-how or other proprietary information in the event of any unauthorized use, misappropriation or disclosure of such trade secrets, know-how or other proprietary information. Further, these agreements may not prevent our competitors from independently developing technologies and products that are substantially equivalent or superior to ours. These agreements may be breached, and we may not have adequate remedies for any such breach. Additionally, enforcing a claim that a party illegally disclosed or misappropriated a trade secret or know-how is difficult, expensive, and time-consuming, and the outcome is often unpredictable. Moreover, trade secrets and know-how can be difficult to protect and some courts inside and outside the U.S. are less willing or unwilling to protect trade secrets.
In addition, while it is our policy to require our employees, consultants, advisors and collaborators and other third parties who may be involved in the conception or development of intellectual property on our behalf to execute agreements containing language assigning such intellectual property to us, we may be unsuccessful in getting such agreements executed with every party who, in fact, conceives or develops intellectual property that we regard as our own. The assignment of intellectual property rights may not be self-executing, or the assignment agreements may be breached, and we may be forced to bring claims against third parties or defend claims that they may bring against us to determine the ownership of what we regard as our intellectual property. Any of the foregoing could have a material adverse effect on our business, financial condition, results of operations and prospects.
If third parties infringe upon our intellectual property rights, our operating profits could be adversely affected.
The steps we have taken to protect our intellectual property may not be adequate to prevent infringement of our intellectual property. We have processes in place to regularly identify potential and actual infringement on our intellectual property rights. These activities often involve unlicensed use of our trademarks or trade dress on a variety of products that we believe could harm our image. From time to time, we have discovered unauthorized products in the marketplace that are counterfeit reproductions of our products. Although we expend efforts to pursue counterfeiters, it is not practicable to pursue all counterfeiters. If we are unsuccessful in challenging a third-party’s products on the basis of trademark infringement or if we are unable to dedicate sufficient resources to detecting and pursuing counterfeit products or otherwise do not aggressively pursue producers or sellers of counterfeit products, continued sales of these products could harm the value of our brands, our competitive position and our business, financial condition and cash flows.
Enforcing our intellectual property rights, including through litigation, can be expensive and time-consuming, and there is no assurance that we will be successful. If our efforts to enforce our intellectual property are inadequate, or if a third-party misappropriates our rights, the value of our brands could be harmed and our product sales could be adversely affected, which would adversely affect our business, financial condition and cash flows.
68
Table of Contents
We may be subject to intellectual property infringement claims, which are costly to defend and could limit our ability to use certain intellectual property in the future.
From time to time, third parties claim that one or more of our products or the music and/or videos in our content infringe or otherwise violate their intellectual property and proprietary rights. Our competitors in both the United States and foreign countries, some of which may have substantially greater resources, may have applied for or obtained, or may in the future apply for and obtain, patents that will prevent, limit or otherwise interfere with our ability to make and sell our products. We also from time to time face claims that we infringe people’s copyright through our Spirio library of music and videos, photos on our website, or marketing materials. Any claims of infringement by a third party, even those without merit, could be expensive and time consuming to defend, could divert management’s attention and resources, could cause us to cease making, licensing, and selling the accused products, could require us to redesign, reengineer, or rebrand our content, products or packaging, if feasible, and could require us to enter into royalty or licensing agreements in order to obtain the right to use a third party’s intellectual property. Any royalty or licensing agreements, if required, may not be available on acceptable terms or at all. Furthermore, a successful claim of infringement against us of third-party intellectual property infringement could result in our being required to pay significant damages, enter into costly license or royalty agreements, or stop the sale of certain products. Any of these events could harm our business, financial condition and cash flows.
Our proprietary software may not operate properly, which could damage our reputation or divert application of our resources from other purposes, any of which could harm our business, results of operations and financial condition.
Proprietary software development is time-consuming, expensive and complex, and may involve unforeseen difficulties. Our proprietary software, including our Spirio technology, encounters technical obstacles from time to time, and it is possible that we may discover additional problems that prevent its proprietary applications from operating properly. This could damage our reputation and impair our ability to attract or maintain customers. Any defects and errors in our proprietary software, and any failure by us to identify and address them, could result in loss of net sales or market share, diversion of development resources, harm to our reputation and increased service and maintenance costs. Defects or errors may discourage existing or potential customers from purchasing its products from us. Correction of defects or errors could prove to be impossible or impracticable. The costs incurred in correcting any defects or errors may be substantial and could have a material adverse effect on our business, results of operations and financial condition.
Risks Related to the Financial Position of Our Business
Our indebtedness could materially adversely affect our financial condition and our ability to operate our business, react to changes in the economy or industry or pay our debts and meet our obligations under our debt and could divert our cash flow from operations to debt payments.
As of March 31, 2022, we had $20.0 million of indebtedness outstanding under our ABL Facility, with $46.6 million available under our ABL Facility, net of letters of credit and borrowing restrictions. Additionally, we have multiple foreign credit facilities. As of March 31, 2022, our German subsidiary had $18.3 million outstanding under the German Term Loan Facility and had $22.7 million outstanding under the German ABL Facility, with $9.4 million available under the German ABL Facility, net of letters of credit. As of March 31, 2022, our Japanese subsidiary had $0.7 million outstanding under the Japanese Term Loan Facility and the Japanese Revolving Credit Facility was fully undrawn, with $5.0 million available under the Japanese Revolving Credit Facility, net of letters of credit. See “Management’s Discussion and Analysis of Financial Condition and Results of Operations—Liquidity and Capital Resources—Debt.” In addition, subject to restrictions in the agreements governing our Credit Facilities, we may incur additional debt.
69
Table of Contents
Our debt could have important consequences to you, including the following:
| • | it may be difficult for us to satisfy our obligations under our outstanding debt, resulting in possible defaults on and acceleration of such indebtedness; |
| • | our ability to obtain additional financing for working capital, capital expenditures, debt service requirements or other general corporate purposes may be impaired; |
| • | a portion of cash flow from operations may be dedicated to the payment of principal and interest on our debt, therefore reducing our ability to use our cash flow to fund our operations, capital expenditures, future business opportunities, acquisitions and other purposes; |
| • | we may be more vulnerable to economic downturns and adverse industry conditions and our flexibility to plan for, or react to, changes in our business or industry may be more limited; |
| • | our ability to capitalize on business opportunities and to react to competitive pressures, as compared to our competitors, may be compromised due to our level of debt; and |
| • | our ability to borrow additional funds or to refinance debt may be limited. |
Furthermore, a majority of our debt under our Credit Facilities bears interest at variable rates. If these rates were to increase significantly, whether because of an increase in market interest rates or a decrease in our creditworthiness, our ability to borrow additional funds may be reduced and the risks related to our debt would intensify. Historically we have utilized interest rate swaps to manage interest rate risk associated with our borrowings with floating interest rates. Subsequent to March 31, 2022, we terminated all of our outstanding interest rate swap derivative instruments, and as a result, we expect that any future changes in market interest rates will impact interest expense related to our borrowings with floating interest rates.
For the years ended December 31, 2021 and 2020, our interest and minimum mandatory principal re-payments were $12.5 million and $17.0 million, respectively. Our ability to generate sufficient cash depends on numerous factors beyond our control, and we may be unable to generate sufficient cash flow to service our debt obligations.
Our business may not generate sufficient cash flow from operating activities to service our debt obligations. Our ability to make payments on and to refinance our debt and to fund planned capital expenditures depends on our ability to generate cash in the future. To some extent, this is subject to general economic, financial, competitive, legislative, regulatory and other factors, such as those described in this “Risk Factors” section, that are beyond our control.
If we are unable to generate sufficient cash flow from operations to service our debt and meet our other commitments, we may need to refinance all or a portion of our debt, sell material assets or operations, delay capital expenditures or raise additional debt or equity capital. We may not be able to effect any of these actions on a timely basis, on commercially reasonable terms or at all, and these actions may not be sufficient to meet our capital requirements. In addition, the terms of our existing or future debt agreements may restrict us from pursuing any of these alternatives.
Restrictive covenants in the agreements governing our Credit Facilities and future indebtedness that we may incur may restrict our ability to pursue our business strategies, and failure to comply with any of these restrictions could result in acceleration of our debt.
The operating and financial restrictions and covenants in one or more of the agreements governing our Credit Facilities and future indebtedness that we may incur may materially adversely
70
Table of Contents
affect our ability to finance future operations or capital needs or to engage in other business activities. Such agreements limit our ability, among other things, to:
| • | incur liens; |
| • | incur or assume additional indebtedness and guarantee indebtedness or amend our debt and other material agreements; |
| • | prepay, redeem or repurchase indebtedness; |
| • | increase applicable interest rate margins; |
| • | declare or make dividends on or make distributions and redeem, repurchase or retire equity interests or make other restricted payments; |
| • | make certain acquisitions, investments, loans, guarantees and advances; |
| • | transfer or sell certain assets; |
| • | consolidate, merge, sell or otherwise dispose of all or substantially all of our assets; |
| • | redeem, repay, repurchase or refinance other indebtedness; |
| • | enter into agreements restricting the ability to pay dividends or grant liens securing obligations under the credit agreements; |
| • | enter into certain transactions with our affiliates; |
| • | amend or modify governing documents or other debt agreements; and |
| • | alter the business conducted by us and our restricted subsidiaries. |
A breach of any of these covenants could result in a default under one or more of our Credit Facilities. Upon the occurrence of an event of default under our Credit Facilities, the lenders could elect to declare all amounts outstanding under our Credit Facilities to be immediately due and payable and terminate any commitments to extend further credit, or we may be required to sell our assets, restructure our indebtedness or seek additional equity capital, which would dilute our stockholders’ interests. In addition, a default or acceleration under our Credit Facilities may result in the acceleration of our other outstanding indebtedness to which a cross-acceleration or cross-default provision applies. We may not have or be able to obtain sufficient funds to make any accelerated payments in the event of an acceleration of our debt upon a default. Any covenant breach or event of default could harm our credit rating and our ability to access credit markets and obtain additional financing on acceptable terms.
Furthermore, the terms of any future indebtedness we may incur could have further additional restrictive covenants. We may not be able to maintain compliance with these covenants in the future, and in the event that we are not able to maintain compliance, we cannot assure you that we will be able to obtain waivers from the lenders or amend the covenants.
We may be adversely impacted by the potential discontinuation of the London Interbank Offered Rate (“LIBOR”).
Interest rates under certain of our Credit Facilities are based partly on LIBOR, which is the basic rate of interest used in lending between banks on the London interbank market and is widely used as a reference for setting the interest rate on loans globally. The financial authority that regulates LIBOR has announced that it intends to stop compelling banks to submit rates for the calculation of LIBOR, only certain LIBOR tenors may continue beyond 2021 and the most widely used LIBOR tenors may continue until mid-2023. It is unclear if LIBOR will cease to exist, whether reforms to LIBOR may be enacted, precisely how any alternative reference rates would be calculated and published or whether
71
Table of Contents
alternative reference rates will gain market acceptance as a replacement for LIBOR. The Federal Reserve Board and the Federal Reserve Bank of New York organized the Alternative Reference Rates Committee, which identified the Secured Overnight Financing Rate (“SOFR”) as its preferred alternative to U.S. dollar LIBOR in derivatives and other financial contracts. We are not able to predict when LIBOR will cease to be available or if SOFR, or another alternative reference rate, attains market traction as a LIBOR replacement. If the method for calculation of LIBOR changes, if LIBOR is no longer available, or if lenders have increased costs due to changes in LIBOR, we may suffer from potential increases in interest rates on our borrowings. As of December 31, 2021 we had repaid in full the borrowings outstanding under our First Lien Term Loan Facility and cancelled such facility. Further, we are currently in the process of amending our ABL Facility, our only other credit facility with LIBOR exposure, to replace LIBOR with SOFR. However, there is no guarantee that we will be able to successfully amend our ABL Facility before LIBOR is discontinued.
We and our subsidiaries may incur substantially more debt. This could further exacerbate the risks associated with our leverage.
We and our subsidiaries may be able to incur substantial additional debt in the future. Although the agreements governing our Credit Facilities contain restrictions on the incurrence of additional debt, these restrictions are subject to a number of qualifications and exceptions, and the debt incurred in compliance with these restrictions could be substantial. Additionally, we may successfully obtain waivers of these restrictions. If we incur additional debt above the levels currently in effect, the risks associated with our leverage, including those described above, would increase.
We are a holding company with no operations of our own, and we depend on our subsidiaries for cash.
We are a holding company and do not have any material assets or operations other than ownership of equity interests of our subsidiaries. Our operations are conducted almost entirely through our subsidiaries, and our ability to generate cash to meet our obligations or to pay dividends, if any, is highly dependent on the earnings of, and receipt of funds from, our subsidiaries through dividends or intercompany loans. The ability of our subsidiaries to generate sufficient cash flow from operations to allow us and them to make scheduled payments on our debt obligations will depend on their future financial performance, which will be affected by a range of economic, competitive and business factors, many of which are outside of our control.
We experience inherent concentration of credit risk in our accounts receivable.
Historically, a large portion of our sales have been generated by our top 15 customers who represented approximately 20% of our net sales for each of the years ended December 31, 2021 and 2020. As a result, we experience some inherent concentration of credit risk in our accounts receivable due to its composition and the relative proportion of large customer receivables to the total. This is especially true for our Band segment, which typically accounts for the majority of our consolidated accounts receivable balance. We consider the credit health and solvency of our customers when extending credit and when we develop our receivable allowance estimates. If our customers fail to pay a significant portion of outstanding receivable balances, or if we are unable to collect outstanding receivables on a timely basis, it would have a negative impact on our results of operations. Consolidation of our customers in the future or additional concentration of market share among our customers may also increase the concentration of our credit risk.
Shifts in our product mix may result in declines in our gross margins and profit levels.
Our gross margins vary among our product groups and as a result, shifts in product mix (that is, how much of each product type we sell in any particular period) could impact our profitability. For our
72
Table of Contents
Piano segment, the product, regional and channel mix of our sales from year to year is a significant factor affecting our gross margins. Generally, Steinway pianos sold in APAC are sold at a higher margin than Steinway pianos sold in the Americas or Europe, Spirio pianos are sold at a higher margin than comparable non-Spirio pianos, and larger and therefore more expensive models are sold at a higher margin than our smaller and therefore less expensive pianos. Our piano profitability is also impacted by the sales contribution from our retail showroom locations. We generate a significantly higher gross margin from our retail sales as compared to sales through our third-party dealer network. Because the majority of our gross profit is realized from the sale of our high-end grand pianos, economic downturns that impact the luxury goods market have had, and in the future may continue to have, an adverse effect on our sales and gross profits.
For our Band segment, professional instruments and procured student instruments, many of which are manufactured in Asia, are generally sold at a higher margin than domestically produced student instruments. The introduction of new band instruments, decreases in average selling prices, and shifts in the proportion of student-level instruments to professional-level instruments may cause variances in our gross margins.
If global economic conditions changed and the demand for our products shifted away from Steinway pianos, including those with Spirio technology, toward our Boston and Essex lines, or if demand for our products shifted away from APAC to other regions, and/or sales through our retail outlets slowed in proportion to sales through our dealers, our gross margin on our pianos could decline. Similarly, if we were forced to produce more of our Band segment products domestically, our gross margin on our Band segment instruments could also significantly decline and have an adverse impact on our results of operations.
As an international company, we are subject to taxation in the United States and various other foreign jurisdictions in which we do business.
Some of the foreign jurisdictions in which we operate, including Germany, Japan and China, have higher statutory tax rates than those in the United States, and certain of our international earnings are also taxable in the United States. Accordingly, our effective tax rates will vary depending on the relative proportion of foreign to U.S. income and absorption of foreign tax credits, changes in the valuation of our deferred tax assets and liabilities, and changes in applicable tax laws or their interpretation and application, including the possibility of retroactive effect. In addition, we are subject to examination of our income tax returns by the U.S. Internal Revenue Service and other tax authorities.
As we expand our e-commerce channel, we may face increased exposure to tax liability. State and local taxing authorities in the United States have identified e-commerce platforms as a means to calculate, collect and remit indirect taxes for transactions taking place over the Internet. Multiple U.S. states have enacted related legislation and other states are now considering such legislation. Furthermore, in 2018, the U.S. Supreme Court held in South Dakota v. Wayfair that a U.S. state may require an online retailer to collect sales taxes imposed by the state in which the buyer is located, even if the retailer has no physical presence in that state, thus permitting a wider enforcement of such sales tax collection requirements. Outside of the United States, the application of VAT or other indirect taxes on e-commerce providers continues to evolve. An increasing number of jurisdictions are legislating or have adopted laws that impose new taxes, including revenue-based taxes that target online commerce and the remote selling of goods. These laws include new obligations to collect sales, consumption, value added, or other taxes on remote sellers, or other requirements that may result in liability for third-party obligations. Our business could be adversely affected by additional taxes that focus on e-commerce revenue. Additionally, existing and new tax laws and legislation in our current or future markets could require us to incur substantial costs in order to comply, including costs associated with legal advice, tax calculation, collection, remittance and audit requirements, which could make selling in
73
Table of Contents
such markets less attractive and could adversely affect our business. Further, these laws can be applied prospectively or retroactively. Noncompliance with new laws may result in fines or penalties. It is possible we may not have sufficient notice to create and adopt processes to properly comply with new reporting or collection obligations by the effective date of any new laws or regulations.
We regularly assess the likelihood of adverse outcomes resulting from these examinations to determine the adequacy of our income tax reserves and expense. Should actual events or results differ from our current expectations, charges or credits to our income tax expense reserves and income tax expense may become necessary. Any such adjustments could have a significant impact on our results of operations.
Risks Related to Regulation
Our operations may subject us to liabilities for environmental or other regulatory matters, the costs of which could be material.
Our manufacturing operations involve the use, handling, storage, treatment and disposal of materials and waste products that may be toxic or hazardous. Consequently, we are subject to numerous federal, state and local environmental laws and regulations, specifically those relating to discharges to air, water and land, the handling and disposal of solid and hazardous waste, and the cleanup and remediation of properties contaminated by hazardous substances. Many environmental laws impose strict, retroactive, joint and several liability broadly upon owners and operators of properties, including with respect to discharges or releases of hazardous materials matters that occurred prior to the time the party became an owner or operator. In addition, we may have liability with respect to third-party sites to which we sent wastes for disposal in the past. Our potential liability at any of these sites is affected by many factors including, but not limited to, the method of remediation, our portion of the hazardous substances at the site relative to that of other responsible parties, the number of responsible parties, the financial capabilities of other parties, the availability of insurance coverage and other contractual rights and obligations.
We have obligations and liabilities with respect to the remediation of current and former properties and third-party waste disposal sites. We have accrued liabilities for sites where the liability is known or probable and can be estimated. Furthermore, we may be required to fund additional remedial programs in connection with other current, former or future facilities for which we do not currently maintain an accrual.
Future events, such as the discovery of additional contamination or other information concerning past releases of hazardous substances at our manufacturing sites (or at sites to which we sent wastes for disposal), changes in existing environmental laws or their interpretation, or more rigorous efforts by regulatory authorities, may require additional expenditures by us to modify operations, install pollution control equipment, clean contaminated sites or curtail our operations. These expenditures could have a material negative impact on our operations.
In addition to risks relating to traditional environmental law and regulations, we also face increasing complexity in the design and manufacture of our products as we adjust to new and future requirements relating to the materials composition of many of our products, including worker safety laws. For example, our products are subject to certain reporting and labeling requirements under California’s Proposition 65, officially known as the Safe Drinking Water and Toxic Enforcement Act of 1986 (“Prop 65”), which requires a specific warning on any product that contains a substance listed by the State of California as having been found to cause cancer or birth defects, unless the level of such substance in the product is below a safe harbor level. We have in the past been subject to lawsuits brought under Prop 65 and required to pay settlements in connection therewith. If we fail to comply
74
Table of Contents
with Prop 65 or other similar laws in the future, such failure to comply may result in lawsuits and regulatory enforcement that could have a material adverse effect on our reputation, business, financial condition, results of operations and prospects. Further, the inclusion of warnings on our products as required by Prop 65 could also negatively affect consumer perception of our products and reduce overall demand, which could adversely affect our reputation, business, financial condition, results of operations and prospects.
We have incurred costs to comply with environmental, health, safety, product compliance and other regulations in the past and expect to incur additional costs in the future. Compliance with these regulations by us and by our suppliers could also disrupt our operations and logistics. For example, the sale of electronic goods, both domestically and internationally, is subject to various regulations and permitting requirements. Complying with regulations concerning electronic goods has had, and will likely continue to have, an impact on our ability to launch and sell our Spirio products worldwide. We need to ensure that we design and manufacture our products in compliance with these requirements and that we are assured a supply of compliant components from our suppliers. These and other environmental, health and safety regulations may require us to redesign our products to utilize new components that are compatible with these regulations and/or obtain mandated permits to sell our products in the jurisdictions in which we operate, which may result in additional costs to us or cause us to eliminate the products from our portfolio.
As regulations of our products and operations increase with our international footprint, so does the risk of our unintentional violation of applicable laws and regulations that we may be subject to globally. Violations of such laws and regulations could subject us to substantial fines and penalties.
In addition, we could be affected by future laws or regulations imposed in response to climate change concerns. Because it is uncertain what laws will be enacted, we cannot predict whether or not these laws or regulations could have a material adverse effect on our business, financial condition and results of operations.
We may be subject to the enforcement of regulations and laws relating to the importation and use of certain raw materials, which could adversely affect our ability to use certain raw materials and harm our business, financial condition and cash flows.
We are subject to a variety of customs and import laws and regulations that, if not properly followed, could delay or impact our importation of raw materials, which could harm our business, financial condition and cash flows. Although we believe our sourcing and importation practices are in compliance with the Lacey Act, Title 16, United States Code, Section 3371, et seq., and other applicable regulations, such as 50 CFR Part 23 related to the implementation of the Convention on International Trade in Endangered Species of Wild Fauna and Flora, the U.S. Department of Justice, or other applicable regulators could take a different view, which could restrict or prevent our use of specific types of woods from specific countries/regions of the world, and/or subject us to additional fines and other penalties. Other raw materials used in our business may be subject to restrictions under other environmental laws and regulations, including Title VI of the Toxic Substances Control Act that established formaldehyde emission standards, along with product testing and labeling obligations, for certain types of composite wood products. While we have implemented policies and procedures designed to ensure compliance with such laws and regulations, any inability to obtain compliant materials or any failure by us to comply with the applicable requirements could result in an adverse impact on our business, including potential negative impacts on our ability to manufacture products or imposition of fines or penalties if we have not complied.
In the case of certain raw materials that we use in our products, including certain types of woods, we may also be subject to pressure from environmental groups, media attention or consumer
75
Table of Contents
preference to use alternative materials. These alternative materials could reduce the quality of our products or could be more expensive. In addition, negative publicity regarding environmental matters also could harm our brands.
We may also be subject to the enforcement of other new or existing regulations and laws relating to the sourcing, transportation, distribution and use of raw materials and components, including wood, electrical components and adhesives, which could impact our ability to use certain raw materials or components.
Any of these risks may harm our business, financial condition and cash flows.
Failure to comply with global anti-corruption laws, including the FCPA, and other laws such as sanctions and export controls associated with our activities outside of the United States could subject us to penalties and other adverse consequences.
We operate a global business and may have direct or indirect interactions with officials and employees of government agencies or state-owned or affiliated entities. We are subject to the U.S. Foreign Corrupt Practices Act of 1977 (as amended) (the “FCPA”), the U.S. domestic bribery statute contained in 18 U.S.C. § 201, the U.S. Travel Act, the USA PATRIOT Act, the U.K. Bribery Act 2010, and other anti-bribery and anti-money laundering laws in countries in which we conduct activities. These laws generally prohibit companies and their employees, officers and directors, as well as any third-party acting on their behalf from corruptly promising, authorizing, offering, or providing, directly or indirectly, improper payments or anything of value to foreign government officials, political parties, and private-sector recipients for the purpose of obtaining or retaining business, directing business to any person, or securing any advantage. In addition, U.S. public companies are required to maintain records that accurately and fairly represent their transactions and have an adequate system of internal accounting controls.
We implement certain anti-corruption compliance programs and policies, procedures and training designed to promote compliance with anti-corruption laws. However, we cannot provide assurance that our internal controls and compliance systems will always protect us from liability for acts committed by employees, agents or our employees, officers and directors, or any third parties acting on our behalf (including distributors), or any businesses that we subsequently acquire, business partners of ours (or of businesses we acquire or partner with) that would violate U.S. and/or non-U.S. laws, including the laws governing payments to government officials, bribery, fraud, kickbacks and other related laws. Any such improper actions or allegations of such acts could subject us to costly investigations and/or significant sanctions, including civil or criminal fines and penalties, disgorgement of profits, injunctions and debarment from government contracts, as well as related stockholder lawsuits and other remedial measures, all of which could adversely affect our reputation, business, financial condition and results of operations.
We face significant risks if we or any of our directors, officers, employees, agents or other partners or representatives fail to comply with these laws and governmental authorities in the United States and elsewhere could seek to impose substantial civil and/or criminal fines and penalties which could have a material adverse effect on our business, reputation, operating results and financial condition.
Further, we are subject to rules and regulations of the United States and other countries, as applicable, relating to export controls and economic sanctions, including, but not limited to, trade sanctions administered by the Office of Foreign Assets Control within the U.S. Department of the Treasury, as well as the Export Administration Regulations administered by the U.S. Department of Commerce. These regulations limit our ability to market, sell, distribute or otherwise transfer our
76
Table of Contents
products or technology to prohibited countries or persons. While we have taken steps to comply with these rules and regulations, a determination that we have failed to comply, whether knowingly or inadvertently, may result in substantial penalties, including fines, enforcement actions, civil and/or criminal sanctions, the disgorgement of profits, and may materially adversely affect our business, results of operations and financial condition. Moreover, in the future, additional U.S., EU and UK trade and economic sanctions or regulations, enacted due to geopolitical events or otherwise, and any counter-sanctions enacted by sanctioned counties, could restrict our ability to operate or generate or collect revenue in certain sanctioned countries, such as Russia, which could adversely affect our business. In particular, in relation to Russia, which accounted for approximately $3.4 million, or less than 1.0%, of our net sales in the year ended December 31, 2021, recent sanctions have impacted our operations in this and the wider Commonwealth of Independent States region.
Any violation of the FCPA, other applicable anti-corruption laws, anti-money laundering laws, or laws related to export controls and economic sanctions could result in whistleblower complaints, adverse media coverage, investigations, loss of export privileges, severe criminal or civil sanctions and, in the case of the FCPA, suspension or debarment from U.S. government contracts, any of which could have a materially adverse effect on our reputation, business, operating results and prospects. In addition, responding to any enforcement action may result in a significant diversion of management’s attention and resources and significant defense costs and other professional fees.
New and existing data privacy laws and/or a significant data security breach of our information systems could increase our operational costs, subject us to claims and otherwise adversely affect our business.
The protection of customer, employee and company information is important to us, and our customers and employees expect that their personal data will be adequately protected. In addition, the regulatory environment surrounding information security and data privacy is becoming increasingly demanding, with evolving requirements in respect of personal data use and processing, including significant penalties for non-compliance, in the various jurisdictions in which we do business. For example, we are subject to the E.U. General Data Protection Regulation 2016/679 (“GDPR”) that came into force in 2018 and the United Kingdom data protection regime consisting primarily of the UK General Data Protection Regulation (“UK GDPR”) and the UK Data Protection Act 2018, as well as the California Consumer Privacy Act (“CCPA”) that came into force in 2020. The enactment of these and other similar data privacy laws and regulations has caused, and will continue to cause, us to incur additional compliance costs related thereto.
For example, in the European Union and United Kingdom we are subject to rules with respect to cross-border transfers of personal data out of the European Union and the United Kingdom, respectively. Recent legal developments in Europe have created complexity and uncertainty regarding transfers of personal data from the European Union and the United Kingdom to the United States and other countries outside the European Union. Most recently, on July 16, 2020, the Court of Justice of the European Union (“CJEU”) invalidated the EU-US Privacy Shield Framework (“Privacy Shield”) under which personal data could be transferred from the European Union to US entities who had self-certified under the Privacy Shield scheme and the decision cast uncertainly on when transfers could be made under the standard contractual clauses.
These recent developments mean we have to review and may need to change the legal mechanisms by which we transfer data outside of the European Union and United Kingdom, including to the United States. As supervisory authorities issue further guidance on personal data export mechanisms, including circumstances where our intra-company data transfer agreement cannot be used, and/or start taking enforcement action, we could suffer additional costs, complaints and/or regulatory investigations or fines, and/or if we are otherwise unable to transfer personal data between
77
Table of Contents
and among countries and regions in which we operate, it could affect the manner in which we provide our services, the geographical location or segregation of our relevant systems and operations, and could adversely affect our financial results.
We are also subject to evolving European Union and United Kingdom privacy laws on cookies and e-marketing. In the European Union and the United Kingdom, regulators are increasingly focusing on compliance with requirements in the online behavioral advertising ecosystem, and current national laws that implement the ePrivacy Directive are highly likely to be replaced by an EU regulation known as the ePrivacy Regulation which will significantly increase fines for non-compliance. While the text of the ePrivacy Regulation is still under development, a recent European court decision, regulators’ recent guidance and a campaign by a not-for-profit organization are driving increased attention to cookies and tracking technologies. If regulators start to enforce the strict approach in recent guidance, this could lead to substantial costs, limit the effectiveness of our marketing activities, divert the attention of our technology personnel, adversely affect our margins, increase costs and subject us to additional liabilities.
We are also subject to federal and state laws in the United States that impose limits on or requirements regarding the collection, distribution, use, security and storage of personal data of individuals. The Federal Trade Commission (“FTC”) Act (the “FTC Act”) grants the FTC authority to enforce against unfair or deceptive practices, which the FTC has interpreted to require companies’ practices with respect to personal data to comply with the commitments posted in their privacy policies. With respect to the use of personal information for direct marketing purposes, the Controlling the Assault of Non-Solicited Pornography and Marketing Act of 2003, or the CAN-SPAM Act, establishes specific requirements for commercial email messages and specifies penalties for the transmission of commercial email messages that are intended to deceive the recipient as to source or content, and obligates, among other things, the sender of commercial emails to provide recipients with the ability to opt out of receiving future commercial emails from the sender. In addition, the protection and privacy of children’s data has come under increasing scrutiny by regulatory bodies in the U.S. and abroad. The Children’s Online Privacy Protection Act (“COPPA”) applies to operators of commercial websites and online services directed to U.S. children under the age of 13 that collect personal information from children, and to operators of general audience websites and services with actual knowledge that they are collecting personal information from U.S. children under the age of 13. Our failure to comply with these laws could result in us being subject to governmental enforcement actions, data processing restrictions, litigation, fines and penalties, adverse publicity, reputational damage, or loss of customers.
Many states have also enacted or are considering additional data privacy and security laws and regulations that govern the processing of personal data and other information. For instance, the CCPA contains, among other things, new disclosure obligations for businesses that collect personal data from California residents and affords those individuals numerous rights relating to their personal data. It provides for civil penalties for CCPA violations, in addition to providing a private right of action for data breaches. All U.S. states have adopted laws requiring the timely notification to individuals and regulators if a company exercises the unauthorized access or use of personal data. The CCPA has changed the manner in which we process personal data and resulted in increased litigation or regulatory oversight risks and costs of compliance. The California Privacy Rights Act (“CPRA”) was passed in November 2020 and will take effect in January 2023 (with respect to information collected from and after January 2022), which will significantly modify the CCPA, including by creating a new state agency that will be vested with authority to implement and enforce the CCPA and CPRA. Moreover, other jurisdictions in which we do business, including Colorado, Nevada and Virginia, have and may continue to adopt privacy-related laws whose restrictions and requirements differ from those of California, which could require us to design, implement and maintain different types of state-based, privacy-related compliance controls and programs simultaneously in multiple states, thereby further increasing the complexity and cost of compliance. These costs, including others relating to increased regulatory oversight and compliance, could materially and adversely affect our business.
78
Table of Contents
In addition to the GDPR and UK GDPR and US data privacy laws, virtually every international jurisdiction in which we operate has established its own legal framework relating to privacy, data protection, and information security matters to which we may also be subject. For example, we are also subject to laws in China. Under China’s Cybersecurity Law, any collection, use, transfer and storage of personal information of a Chinese citizen through a network by the network operator should be based on the three principles of legitimacy, justification and necessity and requires the consent of the data subject. The rules, purposes, methods and ranges of such collection should also be disclosed to the data subject. China’s data localization requirements are becoming increasingly common in sector-specific regulations, and laws including data localization requirements exist in many of the other jurisdictions in which we operate. For example, China’s Cybersecurity Law requires operators of critical information infrastructure (“CIIOs”) to store personal information and important data collected and generated from the critical information infrastructure within China. Building on this, China’s Data Security Law (“Data Security Law”) became effective on September 1, 2021. The primary purpose of the Data Security Law is to regulate data activities, safeguard data security, promote data development and usage, protect individuals and entities’ legitimate rights and interests, and safeguard state sovereignty, state security and development interests. The Data Security Law applies extraterritorially, and to a broad range of activities that involve “data” (not only personal or sensitive data). Under the Data Security Law, entities and individuals carrying out data activities must abide by various data security obligations. For example, the Data Security Law proposes to classify and protect data based on the importance of data to the state’s economic development, as well as the degree of harm it will cause to national security, public interests, or legitimate rights and interests of individuals or organizations when such data is tampered with, destroyed, leaked, or illegally acquired or used. The appropriate level of protective measures is required to be taken for each respective class of data. The Data Security Law also echoes the data localization requirement in the Cybersecurity Law and requires important data to be stored locally in China. Such important data may only be transferred outside of China subject to compliance with certain data transfer restrictions, such as passing a security assessment organized by the relevant authorities. Additionally, on August 20, 2021, China announced the Personal Information Protection Law (“PIPL”), which took effect on November 1, 2021. The PIPL is intended to clarify the scope of application, the definitions of personal information and sensitive personal information, the legality of personal information processing and the basic requirements of notice and consent, among other things. The PIPL also sets out data localization requirements for CIIOs and personal information processors who process personal information above a certain threshold prescribed by the relevant authorities. The PIPL also includes a list of rules which must be complied with prior to the transfer of personal information outside of China, such as compliance with a security assessment or certification by an agency designated by the relevant authorities or entering into standard form model contracts approved by the relevant authorities with the overseas recipient. Notably, the PIPL, similar to the GDPR, applies extraterritorially. Failure to comply with PIPL can result in fines of up to RMB 50 million or 5% of the prior year’s total annual revenue. In addition, the government agencies of China promulgated several regulations or released a number of draft regulations for public comments which are designed to provide further implemental guidance in accordance with the laws mentioned above. We cannot predict what impact the new laws and regulations or the increased costs of compliance, if any, will have on our operations in China. The overarching complexity of privacy and data protection laws and regulations around the world pose a compliance challenge that could manifest in costs, damages, or liability in other forms as a result of failure to implement proper programmatic controls, failure to adhere to those controls, or the malicious or inadvertent breach of applicable privacy and data protection requirements by us, our employees, our business partners, or our customers.
A significant violation of applicable privacy laws or the occurrence of a cybersecurity incident resulting in breach of personal data or company information could result in the temporary suspension of some or all of our operating and/or information systems, damage our reputation, our relationships with customers, suppliers, vendors and service providers and the Steinway brand and could result in
79
Table of Contents
lost data, lost sales, investigations by regulators, sizable fines (for example, non-compliance with the GDPR or UK GDPR, specifically, may result in administrative fines or monetary penalties, each regime having the ability to fine up to the greater of €20 million/£17 million or 4% of global turnover, and noncompliance with China’s Cybersecurity Law can result in fines of up to RMB 100,000), increased insurance premiums, substantial breach-notification and other remediation costs and lawsuits, as well as adversely affect results of operations. In addition, we may face civil claims including representative actions and other class action type litigation (where individuals have suffered harm), potentially amounting to significant compensation or damages liabilities, as well as associated costs, diversion of internal resources, and reputational harm. We may also incur additional costs in the future related to the implementation of additional security measures to protect against new or enhanced data security and privacy threats, to comply with state, federal and international laws that may be enacted to address personal data processing risks and data security threats or to investigate or address potential or actual data security or privacy breaches. As of the date of this prospectus, we do not currently maintain cybersecurity insurance and therefore have no insurance coverage in the event of any breach or disruption of our or our vendors’ information systems, including any unauthorized access or loss of any personal data that we collect, store or otherwise process. Although we are in the process of building up the infrastructure necessary to be eligible for cybersecurity insurance, there is no assurance of when or if we will be able to obtain cybersecurity insurance on terms satisfactory to us, if at all. To the extent we are unable to obtain cybersecurity insurance and experience any disruption or security breach that results in a loss of, or damage to, our data or information systems, or inappropriate disclosure of confidential or proprietary information, we could incur liability, our competitive position could be harmed and our business operations and financial results could be adversely affected.
Risks Related to This Offering and Ownership of Our Class A Common Stock
There has been no prior market for our Class A common stock. An active market may not develop or be sustainable, and investors may be unable to resell their shares at or above the initial public offering price.
There has been no public market for our Class A common stock prior to this offering. The initial public offering price for our Class A common stock will be determined through negotiations between the representatives of the underwriters and the selling stockholders and may vary from the market price of our Class A common stock following the completion of this offering. An active or liquid market in our Class A common stock may not develop upon completion of this offering or, if it does develop, it may not be sustainable. In the absence of an active trading market for our Class A common stock, you may not be able to resell those shares at or above the initial public offering price or at all. We cannot predict the prices at which our Class A common stock will trade.
Our stock price may be volatile or may decline regardless of our operating performance, resulting in substantial losses for investors purchasing shares in this offering.
The market price of our Class A common stock may fluctuate significantly in response to numerous factors, many of which are beyond our control, including:
| • | actual or anticipated fluctuations in our financial conditions and results of operations; |
| • | the financial projections we may provide to the public, any changes in these projections or our failure to meet these projections; |
| • | failure of securities analysts to initiate or maintain coverage of our company, changes in financial estimates or ratings by any securities analysts who follow our company or our failure to meet these estimates or the expectations of investors; |
80
Table of Contents
| • | announcements by us or our competitors of significant technical innovations, acquisitions, strategic partnerships, joint ventures, results of operations or capital commitments; |
| • | changes in stock market valuations and operating performance of other luxury good or musical instrument companies generally, or those in our industry in particular; |
| • | price and volume fluctuations in the overall stock market, including as a result of trends in the economy as a whole; |
| • | changes in our board of directors or management; |
| • | action by institutional stockholders or other large stockholders (including John Paulson and certain affiliated entities), including future sales of our Class A common stock; |
| • | lawsuits threatened or filed against us; |
| • | anticipated or actual changes in laws, regulations or government policies applicable to our business; |
| • | changes in our capital structure, such as future issuances of debt or equity securities; |
| • | short sales, hedging and other derivative transactions involving our capital stock; |
| • | general economic conditions in the United States; |
| • | other events or factors, including those resulting from war, pandemics (including COVID-19), incidents of terrorism or responses to these events; and |
| • | the other factors described in the sections of this prospectus titled “Risk Factors” and “Special Note Regarding Forward-Looking Statements.” |
The stock market has recently experienced extreme price and volume fluctuations. The market prices of securities of companies have experienced fluctuations that often have been unrelated or disproportionate to their results of operations. Market fluctuations could result in extreme volatility in the price of shares of our Class A common stock, which could cause a decline in the value of your investment. Price volatility may be greater if the public float and trading volume of shares of our Class A common stock is low. Furthermore, in the past, stockholders have sometimes instituted securities class action litigation against companies following periods of volatility in the market price of their securities. Any similar litigation against us could result in substantial costs, divert management’s attention and resources, and harm our business, financial condition and results of operations.
The dual class structure of our common stock may adversely affect the trading market for our Class A common stock.
We cannot predict whether our dual class structure will result in a lower or more volatile market price of our Class A common stock or in adverse publicity or other adverse consequences. For example, in 2017, FTSE Russell and S&P Dow Jones announced restrictions on including companies with dual class or multi-class share structures in certain of their indexes. FTSE Russell announced plans to require new constituents of its indices to have at least five percent of their voting rights in the hands of public stockholders, whereas S&P Dow Jones announced changes to its eligibility criteria for the inclusion of shares of public companies on certain indices, including the S&P 500, the S&P MidCap 400 and the S&P SmallCap 600, to exclude companies with multiple classes of shares of common stock from being added to these indices. Other index providers may in the future restrict or omit companies with unequal voting structures from their indices. As a result, our dual class capital structure would make us ineligible for inclusion in any of these indices, and mutual funds, exchange-traded funds and other investment vehicles that attempt to passively track these indices will not be investing in our stock. These policies are still fairly new and it is as of yet unclear what effect, if any, they will have
81
Table of Contents
on the valuations of publicly traded companies excluded from the indices, but it is possible that they may depress these valuations compared to those of other similar companies that are included. Furthermore, we cannot assure you that other stock indices will not take a similar approach to S&P Dow Jones or FTSE Russell in the future. Exclusion from indices could make our Class A common stock less attractive to investors and, as a result, the market price of our Class A common stock could be adversely affected.
The dual class structure of our common stock and the existing ownership of Class B common stock by John Paulson and certain affiliated entities have the effect of concentrating voting control with John Paulson and certain affiliated entities for the foreseeable future, which will limit or preclude your ability to influence corporate matters.
Our Class A common stock, which is the stock being offered in this offering, has one vote per share, and our Class B common stock has ten votes per share. Given the greater number of votes per share attributed to our Class B common stock, John Paulson and certain affiliated entities, who are our only Class B stockholders, will hold approximately % of the total combined voting power of our outstanding common stock following the completion of this offering. As a result of our dual class ownership structure, John Paulson and certain affiliated entities will be able to exert a significant degree of influence or actual control over our management and affairs and over matters requiring stockholder approval, including the election of directors, mergers or acquisitions, asset sales and other significant corporate transactions. Further, John Paulson and certain affiliated entities will own shares representing approximately % of the economic interest of our outstanding common stock following this offering and, together with our other executive officers, directors and their affiliates, will own shares representing approximately % of the economic interest and % of total combined voting power of our outstanding common stock following this offering. Because of the 10-to-1 voting ratio between the Class B common stock and Class A common stock, the holders of Class B common stock collectively will continue to control a majority of the total combined voting power of our outstanding common stock and therefore be able to control most matters submitted to our stockholders for approval, so long as the outstanding shares of Class B common stock represent at least % of the total number of outstanding shares of common stock. This concentrated control will limit your ability to influence corporate matters for the foreseeable future.
In addition, we will agree to nominate to our board of directors individuals designated by John Paulson and certain affiliated entities in accordance with our Stockholders Agreement. Pursuant to the Stockholders Agreement, so long as John Paulson and certain affiliated entities own, in the aggregate, (i) at least 35% of the total outstanding shares of our common stock owned by them immediately following the consummation of this offering (including the sale of any shares pursuant to the underwriters’ option to purchase additional shares), they will be entitled to nominate four directors, (ii) less than 35% but at least 25% of the total outstanding shares of our common stock owned by them immediately following the consummation of this offering (including the sale of any shares pursuant to the underwriters’ option to purchase additional shares), they will be entitled to nominate three directors, (iii) less than 25%, but at least 15% of the total outstanding shares of our common stock owned by them immediately following the consummation of this offering (including the sale of any shares pursuant to the underwriters’ option to purchase additional shares), they will be entitled to nominate two directors, (iv) less than 15%, but at least 5% of the total outstanding shares of our common stock owned by them immediately following the consummation of this offering (including the sale of any shares pursuant to the underwriters’ option to purchase additional shares), they will be entitled to nominate one director and (v) less than 5% of the total outstanding shares of our common stock owned by them immediately following the consummation of this offering (including the sale of any shares pursuant to the underwriters’ option to purchase additional shares), they will not be entitled to nominate a director. See “Certain Relationships and Related Party Transactions—Relationship with John Paulson and Certain Affiliated Entities Following this Offering—Stockholders Agreement.” The
82
Table of Contents
concentration of ownership could deprive you of an opportunity to receive a premium for your shares of Class A common stock as part of a sale of our Company and ultimately might affect the market price of our Class A common stock.
Further, our amended and restated certificate of incorporation, which will be in effect prior to the closing of this offering, will provide that the doctrine of “corporate opportunity” will not apply with respect to John Paulson and certain affiliated entities or their respective affiliates (other than us and our subsidiaries), and any of their respective principals, members, directors, partners, stockholders, officers, employees or other representatives (other than any such person who is also our employee or an employee of our subsidiaries), or any director or stockholder who is not employed by us or our subsidiaries. See “—Our amended and restated certificate of incorporation will provide that the doctrine of ‘corporate opportunity’ will not apply with respect to certain parties to our Stockholders Agreement and any director or stockholder who is not employed by us or our subsidiaries.”
Substantial future sales by John Paulson and certain affiliated entities or other holders of our common stock, or the perception that such sales may occur, could depress the price of our Class A common stock.
Immediately following the completion of this offering, John Paulson and certain affiliated entities will collectively own % of our outstanding shares of common stock (or % if the underwriters exercise their option to purchase additional shares of Class A common stock in full). Subject to the restrictions described in the paragraph below, future sales of these shares in the public market will be subject to the volume and other restrictions of Rule 144 under the Securities Act, for so long as such parties are deemed to be our affiliates, unless the shares to be sold are registered with the Securities and Exchange Commission (the “SEC”). John Paulson and certain affiliated entities and Mr. Steiner are entitled to rights with respect to the registration of their shares following this offering. For a description of these registration rights, see the section titled “Description of Capital Stock—Registration Rights.” We are unable to predict with certainty whether or when John Paulson and certain affiliated entities will sell a substantial number of shares of our Class A common stock. The sale by John Paulson and certain affiliated entities of a substantial number of shares after this offering, or a perception that such sales could occur, could significantly reduce the market price of our Class A common stock. Upon completion of this offering, except as otherwise described herein, all shares of our Class A common stock that are being offered hereby will be freely tradable without restriction, assuming they are not held by our affiliates.
We, the selling stockholders, and all directors, officers and the holders of substantially all of our outstanding common stock and stock options have agreed that, without the prior written consent of the representatives on behalf of the underwriters and subject to certain exceptions, we and they will not, and will not publicly disclose an intention to, during the period ending 180 days after the date of this prospectus (the “restricted period”), (i) offer, pledge, sell, contract to sell, sell any option or contract to purchase, purchase any option or contract to sell, grant any option, right or warrant to purchase, lend or otherwise transfer or dispose of, directly or indirectly, any shares of common stock or any securities convertible into or exercisable or exchangeable for shares of common stock, (ii) file any registration statement with the SEC relating to the offering of any shares of common stock or any securities convertible into or exercisable or exchangeable for common stock or (iii) enter into any swap or other arrangement that transfers to another, in whole or in part, any of the economic consequences of ownership of the common stock. Any of our directors, officers and other Lock-Up Parties buying shares of Class A common stock through the Reserved Share Program will be subject to the same restrictions during the restricted period.
Immediately following this offering, we intend to file a registration statement on Form S-8 registering under the Securities Act the shares of our Class A common stock reserved for issuance under our 2022
83
Table of Contents
Plan and ESPP. In connection with this offering, we intend to grant the IPO RSUs which, if vested, would result in the issuance of shares of Class A common stock. See “Prospectus Summary—The Offering” for additional information regarding the shares of Class A common stock issuable upon vesting and settlement of such IPO RSUs. If equity securities granted under our 2022 Plan and ESPP are sold or it is perceived that they will be sold in the public market, the trading price of our Class A common stock could decline substantially. These sales also could impede our ability to raise future capital.
We will be a “controlled company” under the corporate governance rules of the NYSE and, as a result, will qualify for exemptions from certain corporate governance requirements. If in the future we choose to rely on certain of these exemptions, you will not have the same protections afforded to stockholders of companies that are subject to such requirements.
Upon completion of this offering, John Paulson and certain affiliated entities will own approximately % of the combined voting power of our Class A and Class B common stock (or % if the underwriters exercise their option to purchase additional shares of Class A common stock in full) and will be party to a Stockholders Agreement described in “Certain Relationships and Related Party Transactions—Stockholders Agreement.” As a result, we will be a “controlled company” within the meaning of the corporate governance standards of the rules of the NYSE. Under these rules, a listed company of which more than 50% of the voting power is held by an individual, group or another company is a “controlled company” and may elect not to comply with certain corporate governance requirements, including:
| • | the requirement that a majority of its board of directors consist of independent directors; |
| • | the requirement that its director nominations be made, or recommended to the full board of directors, by its independent directors or by a nominations committee that is comprised entirely of independent directors and that it adopt a written charter or board resolution addressing the nominations process; and |
| • | the requirement that it have a compensation committee that is composed entirely of independent directors with a written charter addressing the committee’s purpose and responsibilities. |
Following this offering, we do not intend to rely on these exemptions. However, as long as we remain a “controlled company,” we may elect in the future to take advantage of any of these exemptions. As a result of any such election, our board of directors would not have a majority of independent directors, our compensation committee would not consist entirely of independent directors and our directors would not be nominated or selected by independent directors. Accordingly, if in the future we choose to rely on any of these exemptions, you will not have the same protections afforded to stockholders of companies that are subject to all of the corporate governance requirements of the rules of the NYSE.
If securities or industry analysts do not publish research or reports about our business, or they publish negative reports about our business, our share price and trading volume could decline.
The trading market for our Class A common stock depends in part on the research and reports that securities or industry analysts publish about us or our business, our market and our competitors. We do not have any control over these analysts. If one or more of the analysts who cover us downgrade our shares or publish negative views on us or our shares, our share price would likely decline. If one or more of these analysts cease coverage of our company or fail to regularly publish reports on us, we could lose visibility in the financial markets, which could cause our share price or trading volume to decline.
84
Table of Contents
We are an “emerging growth company” and our compliance with the reduced reporting and disclosure requirements applicable to “emerging growth companies” may make our Class A common stock less attractive to investors.
We are an “emerging growth company,” as defined in the JOBS Act, and we have elected to take advantage of certain exemptions and relief from various reporting requirements that are applicable to other public companies that are not “emerging growth companies.” These provisions include, but are not limited to: being permitted to have only two years of audited financial statements and only two years of related selected financial data and management’s discussion and analysis of financial condition and results of operations disclosures; being exempt from compliance with the auditor attestation requirements of Section 404(b) of the Sarbanes-Oxley Act; being exempt from any rules that could be adopted by the Public Company Accounting Oversight Board requiring mandatory audit firm rotations or a supplement to the auditor’s report on financial statements; being subject to reduced disclosure obligations regarding executive compensation in our periodic reports and proxy statements; and not being required to hold nonbinding advisory votes on executive compensation or on any golden parachute payments not previously approved.
In addition, while we are an “emerging growth company,” we will not be required to comply with any new financial accounting standard until such standard is generally applicable to private companies. As a result, our financial statements may not be comparable to companies that are not “emerging growth companies” or elect not to avail themselves of this provision.
We may remain an “emerging growth company” until as late as December 31, 2027, the fiscal year-end following the fifth anniversary of the completion of this initial public offering, though we may cease to be an “emerging growth company” earlier under certain circumstances, including if (i) we have more than $1.07 billion in annual revenue in any fiscal year, (ii) we become a “large accelerated filer,” with at least $700 million of equity securities held by non-affiliates as of the end of the second quarter of that fiscal year or (iii) we issue more than $1.0 billion of non-convertible debt over a three-year period. The exact implications of the JOBS Act are still subject to interpretations and guidance by the SEC and other regulatory agencies, and we cannot assure you that we will be able to take advantage of all of the benefits of the JOBS Act. In addition, investors may find our Class A common stock less attractive to the extent we rely on the exemptions and relief granted by the JOBS Act. If some investors find our Class A common stock less attractive as a result, there may be a less active trading market for our Class A common stock and our stock price may decline or become more volatile.
We will incur significant increased costs as a result of operating as a public company, and our management will be required to devote substantial time to new compliance initiatives.
As a public company, we will incur significant legal, accounting and other expenses that we did not incur as a private company. We will be subject to the reporting requirements of the Exchange Act, which will require, among other things, that we file with the SEC annual, quarterly and current reports with respect to our business and financial condition. In addition, the Sarbanes-Oxley Act, as well as rules subsequently adopted by the SEC and to implement provisions of the Sarbanes-Oxley Act, impose significant requirements on public companies, including requiring establishment and maintenance of effective disclosure and financial controls and changes in corporate governance practices. Further, in July 2010, the Dodd-Frank Wall Street Reform and Consumer Protection Act, or the Dodd-Frank Act, was enacted. There are significant corporate governance and executive compensation related provisions in the Dodd-Frank Act that require the SEC to adopt additional rules and regulations in these areas such as “say on pay” and proxy access. Emerging growth companies are permitted to implement many of these requirements over a longer period and up to five years from the pricing of this offering. We intend to take advantage of this legislation for as long as we are permitted to do so. Once we become required to implement these requirements, we will incur
85
Table of Contents
additional compliance-related expenses. Stockholder activism, the current political environment and the current high level of government intervention and regulatory reform may lead to substantial new regulations and disclosure obligations, which may lead to additional compliance costs and impact the manner in which we operate our business in ways we cannot currently anticipate.
We expect the rules and regulations applicable to public companies to continue to increase our legal and financial compliance costs and to make some activities more time-consuming and costly. If these requirements divert the attention of our management and personnel from other business concerns, they could have a material adverse effect on our business, financial condition and results of operations. The increased costs will decrease our net income or increase our net loss, and may require us to reduce costs in other areas of our business or increase the prices of our solutions or services. For example, we expect these rules and regulations to make it more difficult and more expensive for us to obtain director and officer liability insurance and we may be required to incur substantial costs to maintain the same or similar coverage. We cannot predict or estimate the amount or timing of additional costs we may incur to respond to these requirements. The impact of these requirements could also make it more difficult for us to attract and retain qualified persons to serve on our board of directors, our board committees or as executive officers.
In addition, public company reporting and disclosure obligations may cause our business and financial condition to become more visible. We believe that this increased profile and visibility may result in threatened or actual litigation from time to time. If such claims are successful, our business, operating results and financial condition may be adversely affected, and even if the claims do not result in litigation or are resolved in our favor, these claims, and the time and resources necessary to resolve them and the diversion of management resources, could adversely affect our business, operating results and financial condition.
Future offerings of debt or equity securities which would rank senior to our common stock may adversely affect the market price of our Class A common stock.
If, in the future, we decide to issue debt or equity securities that rank senior to our Class A common stock, it is likely that such securities will be governed by an indenture or other instrument containing covenants restricting our operating flexibility. Additionally, any convertible or exchangeable securities that we issue in the future may have rights, preferences and privileges more favorable than those of our Class A common stock and may result in dilution to owners of our Class A common stock. We and, indirectly, our stockholders, will bear the cost of issuing and servicing such securities. Because our decision to issue debt or equity securities in any future offering will depend on market conditions and other factors beyond our control, we cannot predict or estimate the amount, timing or nature of our future offerings. Thus, holders of our Class A common stock will bear the risk of our future offerings reducing the market price of our Class A common stock and diluting the value of their stock holdings in us.
Delaware law and provisions in our amended and restated certificate of incorporation and amended and restated bylaws could make a merger, tender offer or proxy contest more difficult, limit attempts by our stockholders to replace or remove our current management and limit the market price of our Class A common stock.
Certain provisions in our amended and restated certificate of incorporation and amended and restated bylaws will contain provisions that may make the acquisition of our company more difficult, including the following:
| • | at any time when the holders of our Class B common stock no longer beneficially own, in the aggregate, at least the majority of the voting power of our outstanding capital stock, |
86
Table of Contents
amendments to certain provisions of our amended and restated certificate of incorporation or amendments to our amended and restated bylaws by our stockholders will generally require the approval of at least 66 2/3% of the voting power of our outstanding capital stock; |
| • | our dual class common stock structure, which provides John Paulson and certain affiliated entities with the ability to significantly influence the outcome of matters requiring stockholder approval, even if they own significantly less than a majority of the shares of our outstanding Class A common stock and Class B common stock; |
| • | our staggered board; |
| • | at any time when the holders of our Class B common stock no longer beneficially own, in the aggregate, at least the majority of the voting power of our outstanding capital stock, our stockholders will only be able to take action at a meeting of stockholders and will not be able to take action by written consent for any matter; |
| • | our amended and restated certificate of incorporation will not provide for cumulative voting; |
| • | vacancies on our board of directors will be able to be filled only by our board of directors and not by stockholders, subject to the rights granted pursuant to the Stockholders Agreement; |
| • | a special meeting of our stockholders may only be called by the chairperson of our board of directors, our Chief Executive Officer or a majority of our board of directors, except that, at any time when the holders of our Class B common stock beneficially own, in the aggregate, at least the majority of the voting power of our outstanding capital stock, the secretary may call a special meeting at the request of the holders of at least a majority of the voting power of the then outstanding shares of our capital stock; |
| • | restrict the forum for certain litigation against us to Delaware or the federal courts, as applicable; |
| • | our amended and restated certificate of incorporation will authorize undesignated preferred stock, the terms of which may be established and shares of which may be issued without further action by our stockholders; and |
| • | advance notice procedures apply for stockholders (other than John Paulson and certain affiliated entities, who have certain additional rights pursuant to the Stockholders Agreement) to nominate candidates for election as directors or to bring matters before an annual meeting of stockholders. |
In addition, we have opted out of Section 203 of the Delaware General Corporation Law, but our amended and restated certificate of incorporation will provide that engaging in any of a broad range of business combinations with any “interested stockholder” (generally defined to be any entity or person who, together with that entity’s or person’s affiliates and associates, owns or within the previous three years owned, 15% or more of our outstanding voting stock) for a period of three years following the date on which the stockholder became an “interested stockholder” is prohibited, provided, however, that, under our amended and restated certificate of incorporation, John Paulson and certain affiliated entities and any of their respective affiliates will not be deemed to be interested stockholders regardless of the percentage of our outstanding voting stock owned by them, and accordingly will not be subject to such restrictions.
These provisions, alone or together, could discourage, delay or prevent a transaction involving a change in control of our company. These provisions could also discourage proxy contests and make it more difficult for stockholders to elect directors of their choosing and to cause us to take other corporate actions they desire, any of which, under certain circumstances, could limit the opportunity for our stockholders to receive a premium for their shares of our Class A common stock, and could also affect the price that some investors are willing to pay for our Class A common stock.
87
Table of Contents
Our amended and restated certificate of incorporation will provide that the doctrine of “corporate opportunity” will not apply with respect to certain parties to our Stockholders Agreement and any director or stockholder who is not employed by us or our subsidiaries.
The doctrine of corporate opportunity generally provides that a corporate fiduciary may not develop an opportunity using corporate resources, acquire an interest adverse to that of the corporation or acquire property that is reasonably incident to the present or prospective business of the corporation or in which the corporation has a present or expectancy interest, unless that opportunity is first presented to the corporation and the corporation chooses not to pursue that opportunity. The doctrine of corporate opportunity is intended to preclude officers or directors or other fiduciaries from personally benefiting from opportunities that belong to the corporation. Our amended and restated certificate of incorporation, which will be in effect prior to the closing of this offering, will provide that the doctrine of “corporate opportunity” will not apply with respect to John Paulson and certain affiliated entities or their affiliates (other than us and our subsidiaries), and any of their respective principals, members, directors, partners, stockholders, officers, employees or other representatives (other than any such person who is also our employee or an employee of our subsidiaries), or any director or stockholder who is not employed by us or our subsidiaries, in each case unless the transaction or opportunity was presented to such person solely in his or her capacity as a director of the Company. John Paulson and certain affiliated entities and any director or stockholder who is not employed by us or our subsidiaries will, therefore, have no duty to communicate or present certain corporate opportunities to us, and will have the right to either hold such corporate opportunity for their (and their affiliates’) own account and benefit or to recommend, assign or otherwise transfer such corporate opportunity to persons other than us, including to any director or stockholder who is not employed by us or our subsidiaries. As a result, certain of our stockholders, directors and their respective affiliates will not be prohibited from operating or investing in competing businesses. We, therefore, may find ourselves in competition with certain of our stockholders, directors or their respective affiliates, and we may not have knowledge of, or be able to pursue, transactions that could potentially be beneficial to us. Accordingly, we may lose a corporate opportunity or suffer competitive harm, which could negatively impact our business, operating results and financial condition.
Our amended and restated certificate of incorporation will provide that the Court of Chancery of the State of Delaware will be the sole and exclusive forum for certain stockholder litigation matters and the federal district courts of the United States shall be the exclusive forum for the resolution of any complaint asserting a cause of action arising under the Securities Act, which could limit our stockholders’ ability to obtain a favorable judicial forum for disputes with us or our directors, officers, employees or stockholders.
Our amended and restated certificate of incorporation will provide that, unless we otherwise consent in writing, (A) (i) any derivative action or proceeding brought on behalf of the Company, (ii) any action asserting a claim of breach of a fiduciary duty owed by any current or former director, officer, other employee or stockholder of the Company to the Company or the Company’s stockholders, (iii) any action asserting a claim arising pursuant to any provision of the Delaware General Corporation Law, our amended and restated certificate of incorporation or our amended and restated bylaws (as either may be amended or restated) or as to which the Delaware General Corporation Law confers exclusive jurisdiction on the Court of Chancery of the State of Delaware or (iv) any action asserting a claim governed by the internal affairs doctrine of the law of the State of Delaware shall, to the fullest extent permitted by law, be exclusively brought in the Court of Chancery of the State of Delaware or, if such court does not have subject matter jurisdiction thereof, the federal district court of the State of Delaware; and (B) the federal district courts of the United States shall be the exclusive forum for the resolution of any complaint asserting a cause of action arising under the Securities Act. Notwithstanding the foregoing, the exclusive forum provision shall not apply to claims seeking to enforce any liability or duty created by the Exchange Act. The choice of forum provision may limit a
88
Table of Contents
stockholder’s ability to bring a claim in a judicial forum that it finds favorable for disputes with us or our directors, officers or other employees, which may discourage such lawsuits against us and our directors, officers, and other employees, although our stockholders will not be deemed to have waived our compliance with federal securities laws and the rules and regulations thereunder. Alternatively, if a court were to find the choice of forum provision contained in our amended and restated certificate of incorporation to be inapplicable or unenforceable in an action, we may incur additional costs associated with resolving such action in other jurisdictions, which could harm our business, results of operations, and financial condition. Any person or entity purchasing or otherwise acquiring or holding any interest in shares of our capital stock shall be deemed to have notice of and consented to the forum provisions in our amended and restated certificate of incorporation.
General Risk Factors
Changes in accounting rules, assumptions and/or judgments could materially and adversely affect us.
Accounting rules and interpretations for certain aspects of our operations are highly complex and involve significant assumptions and judgment. These complexities could lead to a delay in the preparation and dissemination of our financial statements. Furthermore, changes in accounting rules and interpretations or in our accounting assumptions and/or judgments could significantly impact our financial statements. In some cases, we could be required to apply a new or revised standard retroactively, resulting in restating prior period financial statements. Any of these circumstances could have a material adverse effect on our business, prospects, liquidity, financial condition and results of operations.
Litigation and the outcomes of such litigation could negatively impact our future financial condition and results of operations.
In the ordinary course of our business, we are, from time to time, subject to various litigation and legal proceedings and could face litigation relating to compliance with environmental laws and regulations, product liability and contractual disputes with dealers and business partners, among others. As a public company, we may be subject to proceedings across a variety of matters, including matters involving stockholder class actions, tax audits, unclaimed property audits and related matters, environmental, employment and others. The outcome of litigation and other legal proceedings and the magnitude of potential losses therefrom, particularly class action lawsuits and regulatory actions, is difficult to assess or quantify. Significant legal proceedings, if decided adversely to us or settled by us, may require changes to our business operations that negatively impact our operating results or involve significant liability awards that impact our financial condition. The cost to defend litigation may be significant. As a result, legal proceedings may adversely affect our business, financial condition, results of operations or liquidity.
We may change our dividend policy at any time.
Although following this offering we initially expect to pay quarterly dividends at a rate initially equal to $ per share per annum on our common stock to holders of our common stock, we have no obligation to pay any dividend, and our dividend policy may change at any time without notice. The declaration and amount of any future dividends is subject to the discretion of our board of directors in determining whether dividends are in the best interest of our stockholders based on our financial performance and other factors and are in compliance with all laws and agreements applicable to the declaration and payment of cash dividends by us. In addition, our ability to pay dividends on our common stock is currently limited by the covenants of our Credit Facilities and may be further restricted by the terms of any future debt or preferred securities. See “Dividend Policy.” Future dividends may
89
Table of Contents
also be affected by factors that our board of directors deems relevant, including our potential future capital requirements for investments, legal risks, changes in federal and state income tax laws or corporate laws and contractual restrictions such as financial or operating covenants in our debt arrangements. As a result, there can be no assurance that we will not need to reduce or eliminate the payment of dividends on our common stock in the future, and any return on investment in our common stock.
90
Table of Contents
SPECIAL NOTE REGARDING FORWARD-LOOKING STATEMENTS
This prospectus contains forward-looking statements. All statements contained in this prospectus other than statements of historical facts, including statements regarding our business strategy, plans, market growth and our objectives for future operations, are forward-looking statements. The words “may,” “will,” “should,” “expect,” “plan,” “anticipate,” “could,” “intend,” “target,” “project,” “contemplate,” “believe,” “estimate,” “forecast,” “predict,” “potential” or “continue” or the negative of these terms and other similar expressions are intended to identify forward-looking statements.
Forward-looking statements contained in this prospectus include, but are not limited to, statements about:
| • | our ability to maintain the distinctive appeal of the Steinway brand; |
| • | the ability of our acoustic products to successfully compete within the luxury goods and broader music industry; |
| • | our continued and uninterrupted operations at a limited number of facilities; |
| • | our estimates of market opportunity and forecasts of market growth, including in China, and the expected growth rates of these markets and our ability to grow within and further penetrate our primary markets, as well as our ability to penetrate new markets; |
| • | our expectations regarding macroeconomic conditions and consumer preferences for luxury goods; |
| • | our ability to continue to obtain the raw materials and components parts needed to manufacture our musical instruments; |
| • | our ability to successfully compete with existing and new competitors in our markets; |
| • | our ability to successfully attract and retain senior management, skilled craftspeople and sales personnel to develop and sell our products; |
| • | our ability to operate our primary manufacturing facilities in Astoria, New York and Hamburg, Germany and our expectations regarding the costs to operate those locations; |
| • | our ability to develop and maintain relationships with new and existing artists who play and promote our instruments; |
| • | our ability to adequately prevent security breaches and/or material disruptions of our internal computer systems; |
| • | our ability to expand our showroom footprint and/or secure direct retail outlets and build and maintain our brands; |
| • | our future financial performance, including our expectations regarding our net sales, cost of sales, operating expenses, including capital expenditures, fluctuations in foreign currency exchange rates or changes in our effective tax rates and our ability to maintain future profitability; |
| • | our expectations regarding evolving U.S. and European trade regulations and policies and our ability to comply with new regulations that are applicable to our business and products; |
| • | our ability to successfully develop and gain market acceptance for new products; |
| • | our expectations regarding the success of our marketing programs and marketing materials; |
| • | our ability to accurately forecast demand for our products and consumer trends; |
| • | our ability to attract new customers; |
91
Table of Contents
| • | our ability to develop and protect our brand; |
| • | our relationship with our unionized work force and our ability to enter into collective bargaining agreements on favorable terms in the future; |
| • | our expectations regarding warranty claims and our ability to comply with evolving consumer protection laws; |
| • | our ability to successfully identify acquisition targets, acquire businesses and integrate acquired operations into our business; |
| • | our ability to implement, maintain and improve effective internal controls; |
| • | the ability of our third-party suppliers and manufacturers to meet our supply needs and quality standards on a timely basis or at all; |
| • | our ability to obtain third-party licenses for the use of content in our Spirio library of music and videos; |
| • | our ability to maintain, protect and enhance our intellectual property; |
| • | our expectations regarding the effects of existing and developing laws and regulations; |
| • | our ability to comply with regulations applicable to our business and our products; |
| • | our expectations regarding geopolitical and economic risks in the international markets in which we operate; |
| • | our ability to successfully execute our business strategy; and |
| • | the increased expenses associated with being a public company. |
We caution you that the foregoing list may not contain all of the forward-looking statements made in this prospectus.
We have based these forward-looking statements largely on our current expectations and projections about future events and trends that we believe may affect our financial condition, results of operations, business strategy, short-term and long-term business operations and objectives, and financial needs. These forward-looking statements are subject to a number of risks, uncertainties, and assumptions, including those described in the section titled “Risk Factors.” Moreover, we operate in a very competitive and rapidly changing environment. New risks emerge from time to time. It is not possible for our management to predict all risks, nor can we assess the impact of all factors on our business or the extent to which any factor, or combination of factors, may cause actual results to differ materially from those contained in any forward-looking statements we may make. In light of these risks, uncertainties and assumptions, the future events and trends discussed in this prospectus may not occur and our actual results could differ materially and adversely from those anticipated or implied in the forward-looking statements.
You should not rely upon forward-looking statements as predictions of future events. The events and circumstances reflected in the forward-looking statements may not be achieved or occur. Although we believe that the expectations reflected in the forward-looking statements are reasonable, we cannot guarantee future results, performance, or achievements. We undertake no obligation to update any of these forward-looking statements for any reason after the date of this prospectus or to conform these statements to actual results or revised expectations, except as required by law.
You should read this prospectus and the documents that we reference in this prospectus and have filed with the SEC as exhibits to the registration statement of which this prospectus is a part with the understanding that our actual future results, performance, and events and circumstances may be materially different from what we expect.
92
Table of Contents
We will not receive any proceeds from the sale of Class A common stock by the selling stockholders in this offering (including any proceeds from the sale of shares of Class A common stock that the selling stockholders may sell pursuant to the underwriters’ option to purchase additional Class A common stock). The selling stockholders will receive all of the net proceeds from the sale of shares of our Class A common stock in this offering. However, we will bear the costs associated with the sale of shares of Class A common stock by the selling stockholders, other than underwriting discounts and commissions.
93
Table of Contents
As a public company we anticipate paying a quarterly dividend at a rate initially equal to $ per share per annum on our common stock to holders of our common stock. Based on shares of our common stock outstanding immediately following this offering, we estimate that the cash outlay on our dividend will be approximately $ million per annum. We had $43.7 million of cash and cash equivalents as of December 31, 2021 and $122.5 million of net cash provided by operating activities for the year then ended. Additionally, we had $31.0 million outstanding under our revolving credit facilities in the United States, Germany and Japan with an additional available balance of $69.3 million as of December 31, 2021 under all facilities. Based on our cash and cash equivalents on hand and historical net cash provided by operating activities, we believe that we have sufficient liquidity to be able to pay our intended dividend. Any future determination related to our dividend policy will be made at the discretion of our board of directors after considering our financial condition, results of operations, capital requirements, the operations and performance of our subsidiaries, business prospects and other factors our board of directors deems relevant, and may be subject to statutory, regulatory and contractual limitations, including those contained in agreements governing the indebtedness of our subsidiaries.
We are a holding company and do not currently conduct significant business operations of our own. As such, our ability to pay dividends is highly dependent on cash distributions and other transfers received from our subsidiaries, including SMI, whose ability to make any payments to us will depend upon many factors, including their operating results and cash flows. Our current Credit Facilities also impose restrictions on our subsidiaries’ ability to pay dividends or make other distributions to us. In addition to these restrictions, our ability to pay cash dividends on our capital stock in the future may also be limited by the terms of any preferred securities we may issue or agreements governing any additional indebtedness we or our subsidiaries may incur. Delaware law may also impose requirements that may restrict our ability to pay dividends to holders of our common stock. See “Risk Factors—Risks Related to the Financial Position of Our Business—We are a holding company with no operations of our own, and we depend on our subsidiaries for cash,” “Risk Factors—General Risk Factors—We may change our dividend policy at any time” and “Management’s Discussion and Analysis of Financial Condition and Results of Operations—Liquidity and Capital Resources.”
Based on the status of the factors listed above, the anticipated size of our intended quarterly dividend, the current relationships with our operating subsidiaries and the status of our various operating and debt agreements, we believe that we have sufficient liquidity and authorization to be able to pay our intended dividend. See Note 9 to our consolidated financial statements and “Management’s Discussion and Analysis of Financial Condition and Results of Operations—Liquidity and Capital Resources—Debt” appearing elsewhere in this prospectus, for descriptions of restrictions on our ability to pay dividends.
94
Table of Contents
The following table sets forth our cash and cash equivalents and capitalization as of March 31, 2022 on:
| • | an actual basis; and |
| • | a pro forma basis to give effect to (i) the Distribution, (ii) the filing and effectiveness of our amended and restated certificate of incorporation, (iii) the Reclassification, and (iv) the Stock Split. |
The selling stockholders are selling all of the shares of Class A common stock in this offering. We will not receive any of the proceeds from the sale of shares of Class A common stock by the selling stockholders, including any proceeds from the sale of shares of Class A common stock that such selling stockholders may sell pursuant to the underwriters’ option to purchase additional Class A common stock.
You should read this information in conjunction with the section titled “Management’s Discussion and Analysis of Financial Condition and Results of Operations” and our consolidated financial statements and the accompanying notes thereto included elsewhere in this prospectus.
| As of March 31, 2022 | ||||||||
| Actual | Pro Forma | |||||||
| (in thousands, except share and per share data) | ||||||||
Cash and cash equivalents | $ | 39,345 | $ | |||||
|
|
|
| |||||
Long-term debt: | ||||||||
ABL Facility(1) | 20,000 | |||||||
German Term Loan Facility | 18,259 | |||||||
German ABL Facility(2) | 22,685 | |||||||
Japanese Term Loan Facility | 723 | |||||||
Japanese Revolving Credit Facility(3) | — | |||||||
Total debt | 61,667 | |||||||
|
|
|
| |||||
Stockholders’ equity: | ||||||||
Preferred stock, par value $0.01 per share; 1,000 shares authorized, no shares issued and outstanding, actual; and 50,000,000 shares authorized, par value 0.0001, no shares issued and outstanding, pro forma | — | — | ||||||
Common stock, par value $0.01 per share; 1,000 shares authorized, 1,000 shares issued and outstanding, actual; and zero shares authorized, issued and outstanding, pro forma | — | — | ||||||
Class A common stock, par value $0.0001 per share; no shares authorized, issued and outstanding, actual; and 500,000,000 shares authorized, shares issued and outstanding, pro forma | — | |||||||
Class B common stock, par value $0.0001 per share; no shares authorized, issued and outstanding, actual; and 100,000,000 shares authorized, shares issued and outstanding, pro forma | — | |||||||
Additional paid-in capital(4) | 233,170 | |||||||
Retained earnings(4) | 184,795 | |||||||
Accumulated other comprehensive loss | (34,789 | ) | ||||||
Total stockholders’ equity | 383,176 | |||||||
|
|
|
| |||||
Total capitalization | $ | 444,843 | $ | |||||
|
|
|
| |||||
| (1) | As of March 31, 2022, we had $46.6 million of available borrowing capacity under our ABL Facility. |
| (2) | As of March 31, 2022, we had $9.4 million of available borrowing capacity under our German ABL Facility. |
| (3) | As of March 31, 2022, we had $5.0 million of available borrowing capacity under our Japanese Revolving Credit Facility. |
| (4) | The Pro Forma amount gives effect to the vested portion of liability classified share-based payment awards revalued at $ million based on the assumed initial public offering price of $ per share (which is the midpoint of the price range set forth on the cover page of this prospectus), as the vested portion of the awards will be converted to Class A common stock and the related liability will be reclassified to additional paid-in capital upon the completion of this offering. The difference of $ million between the $ million, which represents the revalued vested portion of the awards, and the $ million, which represents the value of the awards as of March 31, 2022, has been reflected as an adjustment within Pro Forma retained earnings. |
95
Table of Contents
MANAGEMENT’S DISCUSSION AND ANALYSIS OF FINANCIAL CONDITION AND RESULTS OF OPERATIONS
You should read the following discussion and analysis of our financial condition and results of operations in conjunction with the section titled “Summary Historical Consolidated Financial Data” and our consolidated financial statements and the accompanying notes thereto and unaudited condensed consolidated financial statements and the accompanying notes thereto included elsewhere in this prospectus. Some of the information contained in this discussion and analysis or set forth elsewhere in this prospectus, including information with respect to our plans and strategy for our business, includes forward looking statements that involve risks and uncertainties. You should read the sections titled “Risk Factors” and “Special Note Regarding Forward Looking Statements” for a discussion of important factors that could cause our actual results to differ materially from the results described in or implied by the forward looking statements contained in the following discussion and analysis.
Overview
Steinway is a leading manufacturer of what we believe are the world’s finest musical instruments and our flagship piano brand, Steinway, is among the world’s foremost luxury brands. We are focused on manufacturing, designing and selling the world’s most recognized ultra-premium pianos. Since our founding in 1853, our innovative designs, attention to detail and exacting quality have established Steinway as a symbol of manufacturing excellence, innovation and timelessness. We operate in two reporting segments: Piano (Steinway & Sons) and Band (Conn-Selmer). Our Piano segment primarily includes sales of pianos offered under the Steinway brand as well as under our mid-range Boston and Essex brands. In addition, under our Band segment, we manufacture a portfolio of band, orchestral and percussion instruments which are distributed through our Conn-Selmer family of brands, most of which have leading market shares in their respective musical instrument categories.
From fiscal years 2016 to 2021, we grew our net sales from $385.7 million to $538.4 million, representing a CAGR of 6.9%. Over this same period, our Piano segment net sales grew from $244.8 million to $406.6 million, equivalent to a CAGR of 10.7%. Our Piano segment net sales benefited considerably from our Steinway piano sales, which grew at an approximately 12.6% CAGR from $154.3 million to $279.6 million between fiscal years 2016 and 2021. Within our Piano segment, sales of our higher margin Spirio pianos grew at an approximately 31.9% CAGR from $32.9 million to $131.2 million between fiscal years 2016 and 2021. Piano segment net sales has also been supported by the growth of sales from retail operations, which grew at an approximately 16.1% CAGR from $75.9 million to $160.4 million between fiscal years 2016 and 2021. Furthermore, sales from the APAC region, our key growth market, grew at an approximately 16.1% CAGR from $71.2 million to $149.9 million between fiscal years 2016 and 2021.
In fiscal year 2021, we had total net sales of $538.4 million, of which our Piano and Band segments contributed $406.6 million and $131.7 million, respectively. We had net income of $59.3 million in fiscal year 2021 and Adjusted EBITDA of $117.5 million, of which our Piano and Band segments contributed $106.8 million and $10.7 million, respectively.
In fiscal year 2020, we had total net sales of $415.9 million, of which our Piano and Band segments contributed $317.4 million and $98.4 million, respectively. We had net income of $51.8 million in fiscal year 2020 and Adjusted EBITDA of $77.0 million, of which our Piano and Band segments contributed $72.1 million and $4.9 million, respectively.
In the three months ended March 31, 2022, we had total net sales of $116.3 million, of which our Piano and Band segments contributed $82.3 million and $34.0 million, respectively. We had net income of $14.8 million in the three months ended March 31, 2022 and Adjusted EBITDA of
96
Table of Contents
$19.5 million, of which our Piano and Band segments contributed $18.5 million and $0.9 million, respectively.
In the three months ended March 31, 2021, we had total net sales of $92.7 million, of which our Piano and Band segments contributed $67.8 million and $24.9 million, respectively. We had net income of $6.3 million in the three months ended March 31, 2021 and Adjusted EBITDA of $13.7 million, of which our Piano and Band segments contributed $12.7 million and $1.0 million, respectively.
The strength of our Steinway brand and the quality of our instruments are key strategic assets which we believe position our company for continuing success. As we continue to leverage our Steinway brand and fortify our business with technological advances, higher priced offerings and strategic geographic and retail expansion, we have ample pathways to support future growth. We are proud of our track record of growth, consistent profitability and high cash flow generation and we will continue to enhance our operations, innovate within our industry and bolster the strength of our brands to preserve and enhance our financial profile.
Our business celebrates a 169-year history of innovation and a commitment to providing the global musical community with what we believe are the world’s finest pianos and musical instruments. We were founded in 1853, when German immigrant Henry Engelhard Steinway developed the first Steinway piano in a Manhattan loft on Varick Street. Over the next thirty years, Henry and his sons honed the exacting hand-crafted process that brings a Steinway piano to market, which they passed down from generation to generation and which still forms the basis of our Steinway pianos today. In 1857, our company was granted its first patent and by 1880, we invented the iconic curved shape of the grand piano that defines our Steinway pianos. In 1873 we opened our manufacturing facility in Astoria, New York, followed by our factory in Hamburg, Germany in 1880, where our Steinway pianos continue to be manufactured to this day. We have grown our business beyond its founding in the United States, opening our first APAC flagship store in 2017 in Beijing. As we have expanded our international reach, we have also continued to push the boundaries of what makes a high-quality piano, launching the Steinway Spirio in 2015, followed by the Spirio | r in 2019 and also the Spiriocast software feature for our Spirio | r models in 2021.
Our Business Model
How We Generate Net Sales
Our net sales consist of sales of products through our Piano and Band segments. In fiscal years 2021 and 2020, we generated 75.5% and 76.3%, respectively, of our net sales through our Piano segment, and our Band segment contributed the remaining 24.5% and 23.7%, respectively. In the three months ended March 31, 2022 and 2021, we generated 70.7% and 73.2%, respectively, of our net sales through our Piano segment, and our Band segment contributed the remaining 29.3% and 26.8%, respectively. We are a global business and the demand for our products spans many continents. In fiscal year 2021, sales in the Americas region contributed 53.6% of our net sales, followed by 28.5% in the APAC region and 17.9% in the EMEA region. In fiscal year 2020, sales in the Americas region contributed 51.7% of our net sales, followed by 27.8% in the APAC region and 20.5% in the EMEA region. In the three months ended March 31, 2022, sales in the Americas region contributed 63.3% of our net sales, followed by 18.9% in the APAC region and 17.8% in the EMEA region, compared to 56.3%, 24.7% and 19.0%, respectively, in the three months ended March 31, 2021.
Piano. Sales of our pianos are influenced by general economic conditions, demographic trends and general interest in music and the arts. The operating results of our Piano segment are primarily
97
Table of Contents
affected by Steinway piano sales, which comprised approximately 68.8% and 66.5% of Piano segment net sales for fiscal years 2021 and 2020, respectively, and approximately 62.9% and 59.9% of Piano segment net sales for the three months ended March 31, 2022 and 2021, respectively. Steinway pianos are a high-performance and professionally-endorsed offering, meticulously crafted through an intensive process lasting at least six months. As such, we produce a limited volume of Steinways and sell them at a high price point. Given the high individual net sales contribution of each Steinway, our total piano net sales are significantly influenced by small absolute changes in the unit volume of our Steinway pianos compared to similar changes in the unit volume of pianos sold under our mid-market Boston and Essex brands. In fiscal years 2021 and 2020, sales of Boston and Essex brands together represented 77.7% and 79.7%, respectively, of total new piano units sold and approximately 18.9% and 20.3%, respectively, of total Piano segment net sales. In the three months ended March 31, 2022 and 2021, sales of Boston and Essex brands together represented 79.5% and 83.0%, respectively, of total new piano units sold and approximately 21.2% and 24.2%, respectively, of total Piano segment net sales.
The price premium between our Steinway pianos and our Boston and Essex pianos means that the composition of our sales mix materially impacts the net sales that we generate each year. We monitor the percentage change in the unit volume of our products and the percentage change in our average selling price for each of our products across our sales channels in a given year. Our average selling price is a function of both product level pricing and the composition of our sales mix.
The introduction of our Steinway Spirio pianos, which are priced above the traditional Steinway, has become an increasingly important factor in increasing our average selling price. In 2015, we introduced the Steinway Spirio, the world’s premier high-resolution player piano, which has grown to represent approximately 32.3% and 33.3% of our total Piano segment net sales for each of fiscal year 2021 and 2020, respectively, and approximately 30.7% and 26.4% of our total Piano segment net sales for the three months ended March 31, 2022 and 2021, respectively. We have since introduced the Spirio | r, which enables recording and high-resolution editing in addition to playback capabilities, and the Spiriocast software feature for Spirio | r models, which permits customers to instantly stream live performances, synched with video and audio, from one Spirio | r piano to others across the world. In addition, improvements in our manufacturing capabilities have allowed us to produce higher proportions of special and custom pianos, which can be sold at higher margins than our Steinway and Steinway Spirio pianos and further drive growth in average selling price.
Our pianos are sold through 33 company-owned retail showrooms, strategically located across the world. We have established company-owned retail showrooms coast-to-coast in the United States and in various international locations that have bolstered our retail sales. In addition to our company-owned retail showrooms, we also distribute our pianos through a global, expansive network of approximately 180 third-party dealers. Additionally, we have created a Steinway team of Educational Sales Managers that travel and sell direct to institutions in territories not represented by a retail store or a dealer.
In fiscal year 2021, 40.1% of our Piano segment net sales were in the Americas region, 36.9% were in the APAC region and 23.0% were in the EMEA region. In fiscal year 2020, 37.6% of our Piano segment net sales were in the Americas region, 36.1% were in the APAC region and 26.3% were in the EMEA region. In the three months ended March 31, 2022, 50.2% of our Piano segment net sales were in the Americas region, 25.9% were in the APAC region and 23.9% were in the EMEA region. In the three months ended March 31, 2021, 41.8% of our Piano segment net sales were in the Americas region, 32.9% were in the APAC region and 25.3% were in the EMEA region.
Band. Through our Conn-Selmer family of brands, we offer a portfolio of individual music accessories and brass, percussion, woodwind and string instrument brands that have leading market
98
Table of Contents
shares in each of their musical instrument categories. In fiscal years 2021 and 2020, Brass instruments contributed approximately 40.4% and 42.4%, respectively, to our Band segment net sales; Percussion instruments contributed approximately 19.7% and 20.5%, respectively; Woodwind instruments contributed approximately 21.2% and 19.9%, respectively; Music Accessories and Others contributed approximately 16.9% and 15.8%, respectively, and String Instruments contributed approximately 1.7% and 1.4%, respectively. In the three months ended March 31, 2022 and 2021, Brass instruments contributed approximately 39.2% and 42.4%, respectively, to our Band segment net sales; Percussion instruments contributed approximately 24.0% and 21.2%, respectively; Woodwind instruments contributed approximately 18.4% and 17.9%, respectively; Music Accessories and Others contributed approximately 16.2% and 17.6%, respectively, and String Instruments contributed approximately 2.2% and 0.9%, respectively.
Our band instrument sales are influenced by trends in school enrollment, school budgeting and the prevalence and popularity of extracurricular music education. Over 50% and 45% of Conn-Selmer net sales in fiscal years 2021 and 2020, respectively, and over 46% and 49% of Conn-Selmer net sales in the three months ended March 31, 2022 and 2021, respectively, were generated through our preferred dealer network to schools and families who participate in beginning music education programs. Of the remaining sales, many are used by students in marching bands, concert bands, orchestras and other school-related performances. Due to the suspension of in-person schooling and extra-curricular activities for a significant part of fiscal year 2020 due to COVID-19, our Band segment net sales decreased significantly in fiscal year 2020 from historical levels, but recovered significantly in fiscal year 2021 as schools and concert halls re-opened.
Our Band segment is primarily a domestic business. For fiscal years 2021 and 2020, 95.5% and 97.0%, respectively, of our Band segment net sales were generated in the United States, 2.0% and 1.7%, respectively, were generated in EMEA and 2.5% and 1.3%, respectively, were generated in APAC. For the three months ended March 31, 2022 and 2021, 95.1% and 95.9%, respectively, of our Band segment net sales were generated in the United States, 2.9% and 1.5%, respectively, were generated in EMEA and 2.0% and 2.6%, respectively, were generated in APAC.
Gross Profit and Gross Margin
Our operating results are impacted by our ability to convert net sales into higher gross profit, which we monitor using the metric gross margin. Gross margin measures gross profit as a percentage of net sales. We define gross profit as net sales less cost of sales. Our cost of sales is largely variable, enabling us to align costs to production levels and to maintain consistent gross margins.
In fiscal year 2021, we generated $224.6 million of gross profit, of which $196.5 million, or 87.5%, was attributable to the Piano segment and $28.1 million, or 12.5%, was attributable to the Band segment. This translated to a consolidated gross margin of 41.7%, Piano segment gross margin of 48.3% and Band segment gross margin of 21.4%.
In fiscal year 2020, we generated $159.2 million of gross profit, of which $139.3 million, or 87.5%, was attributable to the Piano segment and $19.8 million, or 12.5%, was attributable to the Band segment. This translated to a consolidated gross margin of 38.3%, Piano segment gross margin of 43.9% and Band segment gross margin of 20.2%.
In the three months ended March 21, 2022, we generated $45.2 million of gross profit, of which $39.1 million, or 86.4%, was attributable to the Piano segment and $6.2 million, or 13.6%, was attributable to the Band segment. This translated to a consolidated gross margin of 38.9%, Piano segment gross margin of 47.5% and Band segment gross margin of 18.1%.
99
Table of Contents
In the three months ended March 21, 2021, we generated $35.4 million of gross profit, of which $30.4 million, or 85.7%, was attributable to the Piano segment and $5.1 million, or 14.3%, was attributable to the Band segment. This translated to a consolidated gross margin of 38.2%, Piano segment gross margin of 44.8% and Band segment gross margin of 20.3%.
Our Piano segment gross profit has increased from $99.9 million to $196.5 million from fiscal year 2016 to 2021, primarily driven by higher net sales, as well as a higher share of Spirio piano sales, sales from retail operations and sales in the APAC region. For our Piano segment, the product, regional and channel mix of our sales from year to year is a significant factor affecting our gross margins. Generally, larger and more expensive models are sold at a higher margin than our smaller and less expensive pianos, and Spirio pianos are sold at a higher margin than comparable non-Spirio pianos. Our wholesale gross profit on a Model B Spirio | r piano in the United States is two times greater than our wholesale gross profit on the equivalent non-Spirio model in the United States. Generally, pianos sold through the retail channel generate higher margin than pianos sold through the third-party dealer network. Our retail gross profit on a Model B Spirio | r piano in the United States is nearly two-and-a-half times greater than the wholesale gross profit on an equivalent model in the United States. Steinway pianos sold in APAC are generally sold at a higher margin than Steinway pianos sold in the Americas or EMEA. Our retail gross profit on a Model B Spirio | r piano in China is one-and-a-half times greater than our retail gross profit for the same model sold in the United States. These factors, when combined, generally generate even higher gross margin than any one factor by itself. Retail sales of our Model B Spirio | r piano in China generate gross profit that is nearly seven-and-half times higher than sales of the equivalent non-Spirio model in the United States through our third-party dealer network. Additionally, we generally generate higher margin on our special, bespoke, and limited edition pianos, and our retail gross profit on a Crown Jewel Spirio | r piano in China is two-and-a-half times greater than the retail gross profit on a Model B Spirio | r piano in China.
For our Band segment, professional instruments and procured student instruments, many of which are manufactured in Asia, are generally sold at a higher margin than domestically produced student instruments.
In addition, our ability to innovate and continually improve our products enables us to command premium prices for our pianos and other instruments, thereby contributing to profitability. By implementing certain new manufacturing processes, including automation, we are able to achieve manufacturing efficiencies that improve our gross margin. Our gross margin is also impacted by labor costs, the price at which we are able to procure instruments and raw materials, overhead expenses, logistics expenses and the productivity of our plants.
Key Factors Affecting our Business
Macroeconomic conditions
We realize the majority of our gross profit from the sale of our high-end grand pianos, the demand for which, as an ultra-premium item, is generally more significantly affected by demographics and economic cycles than industry trends. Due to the discretionary nature of consumer spending, economic downturns can have a greater effect on the luxury goods market. The purchasing decision behind acquiring one of our instruments is emotional and is tightly linked to consumer confidence, especially regarding future income streams and the ability to make a significant investment at the time of purchase. However, the overall impact of macroeconomic conditions on our industry is less prominent as compared to other consumer goods industries given that the HNWI, who comprise a significant portion of our consumer base, are often better equipped to withstand the typical restrictions on consumer spending caused by economic downturns.
100
Table of Contents
Growth of the global UHNWI and HNWI populations
The world’s UHNWI population grew by 9.3% from 2020 to 2021, according to The Wealth Report 2022. The global population of HNWI and UHNWI has grown at a 10.1% and 11.9% CAGR, respectively, over the past five years, and over the next five years, the global population of UHNWIs is forecast to grow by a further 28%, driven especially by increasing wealth creation in Asia. As the HNWI and UHNWI populations in China and other APAC nations continue to grow, we expect that APAC will continue to be one of our largest growth opportunities in the future, particularly given the strong appeal of western classical music and luxury goods in China.
International expansion
As a luxury brand offering ultra-premium products, we believe that Steinway strongly appeals to Chinese consumers and benefits from an established reputation in the market. We also believe our growing physical presence in China will allow us to grow our Steinway brand and meet the high demand for western luxury products in China and across the APAC region. In fiscal years 2021 and 2020, 37% and 36%, respectively, of Piano segment net sales came from the APAC region, of which 70% and 68%, respectively, was generated from the sale of our high-end Steinway pianos. In the three months ended March 31, 2022 and 2021, 26% and 33%, respectively, of Piano segment net sales came from the APAC region, of which 62% and 61%, respectively, was generated from the sale of our high-end Steinway pianos.
Housing market strength
The U.S. housing market has demonstrated robust growth in the rebound from the COVID-19 pandemic, particularly with regards to the sale of high-end houses. Following a significant decline in the first few months of 2020, pending and existing home sales experienced a rapid recovery in the second half of 2020 and sustained elevated levels throughout 2021. The luxury housing market in particular performed better than expected during the COVID-19 pandemic, with over 80% of the markets featured in the Prime International Residential Index (PIRI) experiencing an increase in prices and growth in 2021, according to The Wealth Report 2022. Furthermore, according to the Attitudes Survey of The Wealth Report 2022, 21% of UHNWIs planned to buy a new home in 2021 and almost a third of the wealth held by UHNWIs is derived from their primary and/or secondary residences, with the majority stating a desire to upgrade main residences as the impetus behind their purchasing decision. Demand for our pianos typically tracks activity in the housing market, as consumers are more likely to purchase our pianos when they upscale to larger and higher-end homes. Our special and custom pianos cater specifically to these positive trends in the housing market, as we are able to offer ultra-high-end instruments to luxury home owners.
Investment in music education
Increasing attention to and investment in the development of music education and performance significantly affects our business. Both our Piano and Band segments maintain close connections to educational institutions. We are seeing increasing government support for music education, as demonstrated by the U.S. government’s $13.2 billion investment in education, including access to music education, through its Elementary and Secondary School Emergency Relief (“ESSER”) funds in 2020. The Chinese government has also indicated an increasing focus on promoting the development of young talent in the music and the arts, including encouraging schools to develop a more structured curriculum for music and the arts and seeking to introduce music and the arts as a compulsory examination subject as part of high school entrance examinations nationwide by 2022. These initiatives are reflective of the increasing appreciation for Western music in China, where there are currently approximately 30 million children taking piano lessons and where four of the top Chinese
101
Table of Contents
conservatories serve as All-Steinway Schools. The remaining top conservatories all have fleets of Steinway pianos. Moreover, four major conservatories that have opened in China since 2016 (Tianjin Julliard Conservatory, Shenzhen Conservatory, Harbin Conservatory and Zhejiang Conservatory) have purchased more than 750 pianos from us to date. Through our partnerships with schools and institutions, our business is one of the key suppliers of premier pianos and orchestral instruments to top conservatories across the globe. Furthermore, the artists and teachers who use our instruments serve as mentors to future generations of musicians and music enthusiasts.
Support from the professional community
A deep respect and connection to the artist community is at the center of Steinway’s business. We further reinforce and expand our relationship with the artist community through the Steinway Artist program, where professional musicians endorse the quality of our instruments by personally selecting our pianos to play in their performances. Though we are only one of many manufacturers who make pianos for the concert-hall stage, approximately 97% of concert pianists used our pianos at their concerts in the 2018-2019 season, which was the last full concert season prior to the date of this prospectus due to the COVID-19 pandemic. The support from these acclaimed artists brings visibility to our pianos on some of the world’s most renowned stages and we believe makes our pianos the instrument of choice, both among the professional community and their audience.
Ability to innovate with new technology
We believe our ability to innovate and integrate state-of-the-art technology into our timeless designs gives us a key competitive edge above other manufacturers of pianos and musical instruments. Our legacy of innovation is reflected in our substantial portfolio of patents, which to date stands at more than 150 since our founding. Investing in product innovation enables us to maintain price momentum and to affirm our reputation as the world’s premier piano manufacturer. Our commitment to constantly innovate is at the heart of our business and we ensure that each new Steinway piano builds and improves on the quality of the last through advancements we make in our technological and manufacturing capabilities. By continuing to develop and integrate new technologies, we are able to expand our potential target market beyond piano players and professional musicians and provide a wide range of music experiences to our diverse group of customers. Since we first launched the Steinway Spirio in 2015, the high-resolution player piano has grown to represent approximately 32% of our total Piano segment net sales in fiscal year 2021, and we expect it will continue to represent a significant portion of our Piano segment net sales.
Effects of foreign currency exchange rates
Our business is affected by changes in foreign currency exchange rates through transactions by our entities in currencies other than their own functional currency. As our international business grows, our results of operations can be impacted by changes in foreign currency exchange rates, as we generate net sales and certain costs in regions outside of the U.S. and recognize these results in foreign currencies. As a result, we are exposed to certain gains and losses in our reported results as we translate from foreign currencies into U.S. dollars. In particular, a strengthening of the U.S. dollar will negatively affect our net sales and gross margins as expressed in U.S. dollars, and strengthening of EURO, RMB, YEN or GBP will have a positive impact. Historically foreign currency fluctuations accounted for approximately 0 to 2% of the change in our net sales on an absolute basis. In fiscal years 2021 and 2020, our consolidated net sales were favorably impacted by foreign currency fluctuations by 2.4% and 1.0%, respectively, compared to the prior year period. In the three months ended March 31, 2022, our consolidated net sales were unfavorably impacted by foreign currency fluctuations by 1.2%, compared to the same period in the prior fiscal year. In the three months ended
102
Table of Contents
March 31, 2021, our consolidated net sales were favorably impacted by foreign currency fluctuations by 3.4%, compared to the same period in the prior fiscal year.
COVID-19 Update
In response to COVID-19 and the public health restrictions mandated by governments, at various points in time in fiscal year 2020 we had to close most of our plants and retail showrooms. Most of our dealers also had to close their storefronts. In addition to these closures, government restrictions required the cancellation of many of our events and recitals, which are important ways that our company markets our products and generates business. The suspension of live musical events and in-person schooling and extra-curricular activities significantly decreased the institutional demand for our products, particularly for our Band segment.
As a result of these measures and economic headwinds, we experienced a decline in net sales in fiscal year 2020. Our Band segment was particularly impacted by COVID-19 due to the prolonged suspension of school music programs and delayed reopening of concert venues. In fiscal year 2020, our Band segment’s net sales was $98.4 million, compared to $144.1 million for fiscal year 2019. Due in large part to the challenges in the Band segment and uncertainties stemming from the COVID-19 pandemic, we recognized goodwill and other intangible asset impairments in our fiscal year 2020 results. See Note 8 to our consolidated financial statements included elsewhere in this prospectus. Additionally, our Piano segment was impacted by COVID-19 as a majority of our retail showrooms and some manufacturing facilities had to close due to government mandates. Our Piano segment was also impacted by the closures of music and entertainment venues. Our Piano segment saw net sales fall to $317.4 million for fiscal year 2020, compared to $331.6 million for fiscal year 2019. However, despite the challenges of fiscal year 2020, through disciplined expense control and selling down inventory we were able to generate more cash flows from operating activities than in each of the previous five years, demonstrating the resiliency of our business model.
In fiscal year 2021, as our plants, retail showrooms and dealers resumed full operations, government restrictions were repealed, and concert venues and schools re-opened, our consolidated net sales increased to $538.4 million, exceeding our performance in each of the prior two fiscal years, including our 2019 consolidated net sales of $475.7 million. Our Band segment had net sales of $131.7 million in fiscal year 2021, demonstrating a significant improvement over the prior fiscal year, but was still lower than pre-COVID levels due the continued suspension of school music programs and delayed reopening of concert venues. This improvement continued in the first quarter of fiscal year 2022 with our consolidated net sales reaching $116.3 million, compared to $92.7 million in the three months ended March 31, 2021. Our Band segment had net sales of $34.0 million in the three months ended March 31, 2022, compared to $24.9 million for the three months ended March 31, 2021, demonstrating a significant improvement over the prior year quarter amid the resumption of school music programs and the reopening of concert venues. Our Piano segment had net sales of $82.3 million in the three months ended March 31, 2022, compared to $67.8 million for the three months ended March 31, 2021, with improvements in the Americas and EMEA regions, partially offset by modest declines in the APAC region due to the implementation of new COVID-19 restrictions in certain parts of China towards the end of March 2022.
The COVID-19 pandemic also negatively impacted our supply chain, leading to longer lead times and increasing freight costs. Specifically, in response to a resurgence of COVID-19 outbreaks in China, in March 2022 the Chinese government imposed lockdowns on several cities, including Shanghai. This mandate has required us to temporarily close our Shanghai facilities, which consist of a key warehouse and distribution center, retail showrooms and administrative offices. As a result of these recent closures, we are currently experiencing delays in our ability to distribute our products and fulfill customer orders in parts of China affected by the aforementioned lockdowns. We have also
103
Table of Contents
experienced decreasing microchip availability leading to increased material costs for Spirio pianos. Going forward, the COVID-19 pandemic may continue to impact our business in a variety of ways.
While the COVID-19 pandemic negatively impacted numerous areas of our business operations, we have also been positively impacted by certain changes to consumer behavior caused by the pandemic, many of which we believe will continue post-recovery. Government mandates, including restrictions on travel and shelter-in-place orders, have caused more people to spend time in the home, in turn spurring increased spending and investment in their housing environment. This effect was favorable for our business, as many of our consumers tend to purchase our instruments when upsizing or upscaling their homes. We also believe consumers have placed a greater emphasis on family time and in-home leisure activities.
For additional information regarding COVID-19’s impact on our business, see “Risk Factors–Risks Related to our Business—The COVID-19 pandemic has had a significant effect on our sales results, and could have a significant negative impact on our business, net sales, financial condition and results of operations.”
Non-GAAP Financial Measures
In addition to our results determined in accordance with GAAP, our management and board of directors also consider Adjusted EBITDA, Adjusted EBITDA margin, Adjusted Net Income and Adjusted Net Income margin, non-GAAP financial measures, to assess the performance of our business.
We define Adjusted EBITDA as net income before interest expense, net, income tax expense, depreciation and amortization, foreign exchange (gain)/loss, non-cash impairment, purchase accounting adjustments, non-cash stock-based and other compensation expense, gain on sale of intangible assets, corporate re-organization and related charges, dealer termination expense, gain on sale of assets held for sale, potential transaction/acquisition costs, loss on extinguishment of debt, initial public offering expense, non-operating legal costs and other charges that we do not consider reflective of our ongoing performance. We believe that Adjusted EBITDA provides useful information to investors regarding our performance as it removes items that reduce the comparability of our underlying core business performance across reporting periods. Adjusted EBITDA margin measures Adjusted EBITDA as a percentage of net sales.
We define Adjusted Net Income as net income before foreign exchange (gain)/loss, non-cash impairment, purchase accounting adjustments, non-cash stock-based and other compensation expense, gain on sale of intangible assets, corporate re-organization and related charges, dealer termination expense, gain on sale of assets held for sale, potential transaction/acquisition costs, loss on extinguishment of debt, initial public offering expense, non-operating legal costs, other charges that we do not consider reflective of our ongoing performance, and tax impacts on the foregoing adjustments. We believe that Adjusted Net Income provides useful information to investors regarding our performance as it removes items that reduce the comparability of our underlying core business performance across reporting periods. Adjusted Net Income margin measures Adjusted Net Income as a percentage of net sales. Adjusted EBITDA, Adjusted EBITDA margin, Adjusted Net Income and Adjusted Net Income margin are non-GAAP financial measures and are not intended to be substitutes for any GAAP financial measures. They should be considered in addition to, not as substitutes for, or in isolation from, measures prepared in accordance with GAAP, such as consolidated net income.
You are encouraged to evaluate our calculation of Adjusted EBITDA, Adjusted EBITDA margin, Adjusted Net Income and Adjusted Net Income margin and the reasons we consider these adjustments appropriate for supplemental analysis. In evaluating these measures, you should be aware that in the
104
Table of Contents
future we may incur expenses that are the same as or similar to some of the adjustments in our presentation of Adjusted EBITDA and Adjusted Net Income. Our presentation of these measures should not be construed as an inference that our future results will be unaffected by unusual or non-recurring items. There can be no assurance that we will not modify the presentation of these measures following this offering, and any such modification may be material. Adjusted EBITDA, Adjusted EBITDA margin, Adjusted Net Income and Adjusted Net Income margin have their limitations as analytical tools, and you should not consider it in isolation or as a substitute for analysis of our results as reported under GAAP. Some of these limitations include:
| • | Adjusted EBITDA and Adjusted Net Income do not include our cash expenditure or future requirements for capital expenditures or contractual commitments; |
| • | Adjusted EBITDA and Adjusted Net Income do not reflect changes in our cash requirements for our working capital needs; |
| • | Adjusted EBITDA does not include the interest expense and the cash requirements necessary to service interest or principal payments on our debt; |
| • | although depreciation and amortization are non-cash charges, the assets being depreciated and amortized may have to be replaced in the future, and Adjusted EBITDA does not reflect cash requirements for replacement of assets that are being depreciated and amortized; |
| • | Adjusted EBITDA and Adjusted Net Income exclude the impact of certain cash charges or cash receipts resulting from matters we do not find indicative of our ongoing operations; and |
| • | other companies in our industry may calculate Adjusted EBITDA, Adjusted EBITDA margin, Adjusted Net Income and Adjusted Net Income margin differently than we do. |
The following table reconciles Adjusted EBITDA to its most directly comparable GAAP financial measure, net income:
| Year Ended December 31, | Three Months Ended March 31, | |||||||||||||||
| 2020 | 2021 | 2021 | 2022 | |||||||||||||
| (dollars in thousands, except percentages) | ||||||||||||||||
Net income | $ | 51,815 | $ | 59,263 | $ | 6,266 | $ | 14,768 | ||||||||
Interest (income) expense, net | 15,546 | 5,237 | 656 | (3,552 | ) | |||||||||||
Income tax expense | 30,406 | 25,677 | 2,714 | 6,121 | ||||||||||||
Depreciation and amortization | 14,950 | 14,889 | 3,762 | 4,069 | ||||||||||||
Foreign exchange (gain)/loss(a) | 588 | (438 | ) | (309 | ) | (28 | ) | |||||||||
Non-cash impairment(b) | 16,093 | — | — | — | ||||||||||||
Purchase accounting adjustments(c) | 468 | 71 | 4 | 2 | ||||||||||||
Non-cash stock-based and other compensation expense(d) | 2,110 | 7,644 | — | 1,125 | ||||||||||||
Gain on sale of intangible assets(e) | — | — | — | (5,100 | ) | |||||||||||
Gain on sale of assets held for sale(f) | (56,290 | ) | — | — | — | |||||||||||
Potential transaction / acquisition costs(g) | — | 512 | 547 | — | ||||||||||||
Initial public offering expense(h) | — | 1,513 | — | 2,046 | ||||||||||||
Non-operating legal costs(i) | 457 | 184 | 41 | 29 | ||||||||||||
Other charges(j) | 855 | 2,910 | 16 | — | ||||||||||||
|
|
|
|
|
|
|
| |||||||||
Adjusted EBITDA | $ | 76,998 | $ | 117,462 | $ | 13,697 | $ | 19,480 | ||||||||
|
|
|
|
|
|
|
| |||||||||
Adjusted EBITDA Margin | 18.5 | % | 21.8 | % | 14.8 | % | 16.7 | % | ||||||||
|
|
|
|
|
|
|
| |||||||||
| (a) | Foreign exchange (gain)/loss is comprised of gains or losses on receivables, payables or other assets or liabilities which are denominated in foreign currencies. |
| (b) | Non-cash impairment is comprised of impairment losses recorded during the period for both goodwill as well as other long-lived assets. During 2020, we recognized $13.6 million of goodwill impairment and $2.5 million of impairment on trademark assets, both related to our Band segment. |
105
Table of Contents
| (c) | Purchase accounting adjustments reflect the impact on our operating results from step up adjustments recorded in connection with our acquisition by John Paulson and certain affiliated entities in 2013. |
| (d) | Non-cash stock-based and other compensation expense is comprised of expense recognized for liability classified share-based payment awards granted to our executives. |
| (e) | Gain on sale of intangible assets in the three months ended March 31, 2022, relates to the sale of certain land development rights, which drove the gain recognized during the period. |
| (f) | Gain on sale of assets held for sale is comprised of gains on assets which we held for sale during the period. In 2020, we sold a real estate property, which drove the gain recognized during the period. |
| (g) | Potential transaction / acquisition costs are comprised of professional fees and expenses associated with potential strategic merger and acquisition activities. In 2021, we incurred $0.5 million of employee severance costs in connection with our 2019 acquisition of Louis Renner. |
| (h) | Initial public offering expense relates to non-recurring fees and expenses associated with the preparation for this offering. |
| (i) | Non-operating legal costs are comprised of non-recurring legal costs with respect to a case filed by a former piano dealer. The case was dismissed on summary judgment and was affirmed on appeal. |
| (j) | Other charges include non-cash accrual of potential environmental mitigation costs in our Band segment, $0.3 million one-time consulting fees in 2021 associated with the lowering of withholding taxes in the APAC region and a $0.4 million one-time expense in 2021, including $0.2 million in the three months ended March 31, 2021, associated with relocating the production facility of our Musser products. |
Consolidated Adjusted EBITDA increased by $40.5 million, or 52.6%, from $77.0 million in fiscal year 2020 to $117.5 million in fiscal year 2021. Consolidated Adjusted EBITDA margin improved to 21.8% from 18.5%, primarily driven by the combination of higher net sales from both the Piano and Band segments, improvement in gross margin primarily due to favorable product and channel mix from the Piano segment and a slower increase in consolidated SG&A that was outpaced by faster growth in consolidated gross profit.
Consolidated Adjusted EBITDA increased by $5.8 million, or 42.2%, from $13.7 million in the three months ended March 31, 2021 to $19.5 million in the three months ended March 31, 2022. Consolidated Adjusted EBITDA margin improved to 16.7% from 14.8%, primarily driven by the combination of higher net sales, improvement in gross margin primarily due to favorable product and channel mixes from the Piano segment, and a slower increase in SG&A that was outpaced by faster growth in gross profit. For additional information regarding Adjusted EBITDA for the Piano segment and Adjusted EBITDA for the Band segment, see “—Results of Operations—Segment Information.”
The following table reconciles Adjusted Net Income to its most directly comparable GAAP financial measure, net income:
| Year Ended December 31, | Three Months Ended March 31, | |||||||||||||||
| 2020 | 2021 | 2021 | 2022 | |||||||||||||
| (dollars in thousands, except percentages) | ||||||||||||||||
Net income | $ | 51,815 | $ | 59,263 | $6,266 | $14,768 | ||||||||||
Foreign exchange (gain)/loss(a) | 588 | (438 | ) | (309 | ) | (28 | ) | |||||||||
Non-cash impairment(b) | 16,093 | — | — | — | ||||||||||||
Purchase accounting adjustments(c) | 1,413 | 913 | 254 | 514 | ||||||||||||
Non-cash stock-based and other compensation expense(d) | 2,110 | 7,644 | — | 1,125 | ||||||||||||
Gain on sale of intangible assets(e) | — | — | — | (5,100 | ) | |||||||||||
Gain on sale of assets held for sale(f) | (56,290 | ) | — | — | — | |||||||||||
Potential transaction / acquisition costs(g) | — | 512 | 547 | — | ||||||||||||
Initial public offering expense(h) | — | 1,513 | — | 2,046 | ||||||||||||
Non-operating legal costs(i) | 457 | 184 | 41 | 29 | ||||||||||||
Other charges(j) | 855 | 2,910 | 16 | — | ||||||||||||
Tax impact on adjustments to net income(k) | 13,162 | (1,081 | ) | (120 | ) | 733 | ||||||||||
|
|
|
|
|
|
|
| |||||||||
Adjusted Net Income | $ | 30,203 | $ | 71,420 | $ | 6,695 | $ | 14,087 | ||||||||
|
|
|
|
|
|
|
| |||||||||
Adjusted Net Income Margin | 7.3 | % | 13.3 | % | 7.2 | % | 12.1 | % | ||||||||
|
|
|
|
|
|
|
| |||||||||
106
Table of Contents
| (a) | Foreign exchange (gain)/loss is comprised of gains or losses on receivables, payables or other assets or liabilities which are denominated in foreign currencies. |
| (b) | Non-cash impairment is comprised of impairment losses recorded during the period for both goodwill as well as other long-lived assets. During 2020, we recognized $13.6 million of goodwill impairment and $2.5 million of impairment on trademark assets, both related to our Band segment. |
| (c) | Purchase accounting adjustments reflect the impact on our operating results from step up adjustments, including depreciation thereon, recorded in connection with our acquisition by John Paulson and certain affiliated entities in 2013. |
| (d) | Non-cash stock-based and other compensation expense is comprised of expense recognized for liability classified share-based payment awards granted to our executives. |
| (e) | Gain on sale of intangible assets in the three months ended March 31, 2022, relates to the sale of certain land development rights, which drove the gain recognized during the period. |
| (f) | Gain on sale of assets held for sale is comprised of gains on assets which we held for sale during the period. In 2020, we sold a real estate property, which drove the gain recognized during the period. |
| (g) | Potential transaction / acquisition costs are comprised of professional fees and expenses associated with potential strategic merger and acquisition activities. In 2021, we incurred $0.5 million of employee severance costs in connection with our 2019 acquisition of Louis Renner. |
| (h) | Initial public offering expense relates to non-recurring fees and expenses associated with the preparation for this offering. |
| (i) | Non-operating legal costs are comprised of non-recurring legal costs with respect to a case filed by a former piano dealer. The case was dismissed on summary judgment and was affirmed on appeal. |
| (j) | Other charges include non-cash accrual of potential environmental mitigation costs in our Band segment, $0.3 million one-time consulting fees in 2021 associated with the lowering of withholding taxes in the APAC region and a $0.4 million one-time expense in 2021, including $0.2 million in the three months ended March 31, 2021, associated with relocating the production facility of our Musser products. |
| (k) | Tax impact on adjustments to net income represents the tax provision estimate calculated by management associated with the aforementioned adjustments. |
Adjusted Net Income increased by $41.2 million, or 136%, from $30.2 million in fiscal year 2020 to $71.4 million in fiscal year 2021, primarily driven by the combination of higher net sales, improvement in gross margin, a slower increase in SG&A that was outpaced by faster growth in net sales, lower interest expense, net and income tax expense.
Adjusted Net Income increased by $7.4 million, or 110.4%, from $6.7 million in the three months ended March 31, 2021 to $14.1 million in the three months ended March 31, 2022, primarily driven by the combination of higher net sales, improvement in gross margin, a slower increase in SG&A that was outpaced by faster growth in net sales and higher net interest income.
Components of Our Results of Operations
Net Sales
We generate substantially all of our net sales through the manufacture and distribution of musical instruments from our two operating segments: Piano and Band. In our Piano segment, net sales is primarily comprised of sales of our pianos under different brands including Steinway, Boston and Essex, which are sold through our retail operations and wholesale distribution network. In our Band segment, net sales is primarily comprised of wholesale distribution of band instruments under various brands.
Net sales include revenue recognized from other adjacent services, including from restoration and maintenance services, sale of piano parts and other musical instruments accessories, rental, and royalty from the use of our trademarks.
Cost of Sales
Cost of sales in both our Piano and Band segments comprise the cost to manufacture our products, including raw materials, direct labor, and overhead, plus freight, duties, and non-refundable taxes incurred in delivering the goods to distribution centers managed by third parties or to our retail stores. Product development costs, primarily payroll and related expenses, included in inventories are recognized in cost of sales when the musical instruments are sold.
107
Table of Contents
Selling, General and Administrative Expenses
Selling, general and administrative expenses (“SG&A”) consist of payroll and related expenses for employees involved in selling and general corporate functions, including sales, accounting, finance, tax, legal and human resources; costs associated with these functions, such as depreciation expense and rent relating to facilities, retail storefronts and equipment; professional fees; and other general corporate costs. SG&A also includes expenditures related to sales commissions, marketing, advertising, our brand awareness activities, sales support and professional fees.
Following the completion of this offering, we expect to incur additional expenses as a result of operating as a public company. These costs include the costs of complying with the rules and regulations applicable to companies listed on a U.S. securities exchange and costs related to compliance and reporting obligations pursuant to the rules and regulations of the SEC, including third-party and internal resources related to accounting, auditing, compliance with the Sarbanes-Oxley Act, legal, and investor and public relations expenses. In addition, as a public company, we expect to incur increased expenses, such as insurance and professional services. As a result, we expect our SG&A expenses to increase for the foreseeable future.
Goodwill Impairment
Goodwill impairment is comprised of the impairment charges taken on our goodwill assets recorded as a result of the 2013 acquisition of our company by John Paulson and certain affiliated entities. In assessing whether goodwill and trademarks were impaired in connection with the Company’s annual impairment testing performed during the fourth quarter of 2020, we performed a quantitative assessment of our Piano and Band reporting segments using October 1, 2020 carrying values. In performing the 2020 quantitative assessment we considered, among other factors, the financial performance of each of the Piano and Band reporting segments, as well as the impact of COVID-19 on our operations and the deteriorations in general economic conditions. As a result of our annual impairment test, we determined that the fair value of the Piano reporting segment exceeded the respective carrying amount and the fair value of the Band reporting segment was lower than the respective carrying amount primarily due to lower than expected sales and the impact of COVID-19. We determined the fair value of the reporting units based on discounted cash flows of the Company’s projections.
See Note 8 to our consolidated financial statements included elsewhere in this prospectus for a description of the goodwill impairment analysis.
Interest Expense, Net
Interest expense includes the cost of our borrowings under our Credit Facilities, net of interest income. Debt issuance costs related to our indebtedness are included as an offset to long-term debt in our consolidated balance sheets and are amortized to interest expense over the life of the applicable facility using the effective interest rate method.
Historically we have utilized interest rate swaps to manage interest rate risk associated with our borrowings with floating interest rates. We have not elected to apply hedge accounting to these derivative financial instruments, and therefore, we recognize all changes in the fair value of the instruments as a component of interest expense, net. Subsequent to March 31, 2022, we terminated all of our outstanding interest rate swap derivative instruments, and as a result, we expect that any future changes in market interest rates will impact interest expense related to our borrowings with floating interest rates.
108
Table of Contents
Other Pension Benefit
We have defined benefit pension plans covering certain domestic employees and certain foreign employees. Benefits under the pension plans are generally based on age at retirement and years of service, and for some pension plans, benefits are also based on the employee’s annual earnings. We determine the net cost of pension and other post-retirement benefit plans using the projected unit credit method and several actuarial assumptions, including the discount rate, the long-term rate of asset return, and current interest rate trends.
Gain on Sale of Assets Held for Sale
Gain on sale of assets held for sale relates to the sale of a real estate property in New York.
Other Income
Other income, net is primarily comprised of foreign subsidies received and foreign currency gains and losses.
Results of Operations for the Three Months Ended March 31, 2021 and 2022
Consolidated Overview
The following unaudited results of operations data for the three months ended March 31, 2021 and 2022 have been derived from the unaudited condensed consolidated financial statements included elsewhere in this prospectus.
| Three Months Ended March 31, | Change | |||||||||||||||
| 2021 | 2022 | Amount | % | |||||||||||||
| (in thousands) | ||||||||||||||||
Net sales | $ | 92,683 | $ | 116,304 | $ | 23,621 | 25.5 | % | ||||||||
Cost of sales | 57,245 | 71,082 | 13,837 | 24.2 | ||||||||||||
|
|
|
|
|
|
|
| |||||||||
Gross profit | 35,438 | 45,222 | 9,784 | 27.6 | ||||||||||||
Selling, general and administrative expenses | 27,057 | 33,278 | 6,221 | 23.0 | ||||||||||||
|
|
|
|
|
|
|
| |||||||||
Total operating expenses | 27,057 | 33,278 | 6,221 | 23.0 | % | |||||||||||
|
|
|
|
|
|
|
| |||||||||
Income from operations | 8,381 | 11,944 | 3,563 | 42.5 | ||||||||||||
Other (income) expense, net: | ||||||||||||||||
Interest (income) expense, net | 656 | (3,552 | ) | (4,208 | ) | * | ||||||||||
Other pension benefit | (94 | ) | (278 | ) | (184 | ) | * | |||||||||
Other income | (1,161 | ) | (5,115 | ) | (3,954 | ) | * | |||||||||
|
|
|
|
|
|
|
| |||||||||
Total other income, net | (599 | ) | (8,945 | ) | (8,346 | ) | * | |||||||||
|
|
|
|
|
|
|
| |||||||||
Income before provision for income taxes | $ | 8,980 | $ | 20,889 | $ | 11,909 | 132.6 | |||||||||
Income tax expense | 2,714 | 6,121 | 3,407 | 125.5 | ||||||||||||
|
|
|
|
|
|
|
| |||||||||
Net income | $ | 6,266 | $ | 14,768 | $ | 8,502 | 135.7 | |||||||||
|
|
|
|
|
|
|
| |||||||||
| * | Not meaningful |
109
Table of Contents
The following table sets forth our results of operations data expressed as a percentage of net sales:
| Three Months Ended March 31, | ||||||||
| 2021 | 2022 | |||||||
| (% of net sales) | ||||||||
Net sales | 100.0 | % | 100.0 | % | ||||
Cost of sales | 61.8 | 61.1 | ||||||
|
|
|
| |||||
Gross profit | 38.2 | 38.9 | ||||||
Selling, general and administrative expenses | 29.2 | 28.6 | ||||||
|
|
|
| |||||
Total operating expenses | 29.2 | % | 28.6 | % | ||||
|
|
|
| |||||
Income from operations | 9.0 | 10.3 | ||||||
Other (income) expense, net: | ||||||||
Interest (income) expense, net | 0.7 | (3.1 | ) | |||||
Other pension benefit | (0.1 | ) | (0.2 | ) | ||||
Other income | (1.3 | ) | (4.4 | ) | ||||
|
|
|
| |||||
Total other income, net | (0.6 | ) | (7.7 | ) | ||||
|
|
|
| |||||
Income before provision for income taxes | 9.7 | 18.0 | ||||||
Income tax expense | 2.9 | 5.3 | ||||||
|
|
|
| |||||
Net income | 6.8 | % | 12.7 | % | ||||
|
|
|
| |||||
Net Sales
| Three Months Ended March 31, | Change | |||||||||||||||
| 2021 | 2022 | Amount | % | |||||||||||||
| (in thousands) | ||||||||||||||||
Net Sales: | ||||||||||||||||
Piano | $ | 67,823 | $ | 82,281 | $ | 14,458 | 21.3 | % | ||||||||
Band | 24,860 | 34,023 | 9,163 | 36.9 | % | |||||||||||
|
|
|
|
|
|
|
| |||||||||
Total net sales | $ | 92,683 | $ | 116,304 | $ | 23,621 | 25.5 | % | ||||||||
|
|
|
|
|
|
|
| |||||||||
Net sales from our consolidated operations increased $23.6 million, or 25.5%, from $92.7 million in the three months ended March 31, 2021 to $116.3 million in the three months ended March 31, 2022. Excluding the unfavorable impact of foreign currency fluctuations, our consolidated net sales in the three months ended March 31, 2022 would have increased by $24.7 million, or 26.7% compared to the three months ended March 31, 2021. The increase in our consolidated net sales was attributable to growth in our Piano segment, which was largely due to increased net sales of Steinway pianos as well as higher net sales from retail operations, and growth in our Band segment, which was largely due to increased institutional and dealer orders. For additional information regarding net sales for the Piano segment and net sales for the Band segment, see “—Segment Information.”
110
Table of Contents
Cost of Sales, Gross Profit and Gross Margin
| Three Months Ended March 31, | Change | |||||||||||||||
| 2021 | 2022 | Amount | % | |||||||||||||
| (in thousands, except percentages) | ||||||||||||||||
Cost of sales: | ||||||||||||||||
Piano | $ | 37,443 | $ | 43,213 | $ | 5,770 | 15.4 | % | ||||||||
Band | 19,802 | 27,869 | 8,067 | 40.7 | % | |||||||||||
|
|
|
|
|
|
|
| |||||||||
Total cost of sales | $ | 57,245 | $ | 71,082 | $ | 13,837 | 24.2 | % | ||||||||
|
|
|
|
|
|
|
| |||||||||
Gross profit: | ||||||||||||||||
Piano | $ | 30,380 | $ | 39,068 | $ | 8,688 | 28.6 | % | ||||||||
Band | 5,058 | 6,154 | 1,096 | 21.7 | % | |||||||||||
|
|
|
|
|
|
|
| |||||||||
Total gross profit | $ | 35,438 | $ | 45,222 | $ | 9,784 | 27.6 | % | ||||||||
|
|
|
|
|
|
|
| |||||||||
Gross margin: | ||||||||||||||||
Piano | 44.8 | % | 47.5 | % | 2.7 | % | ||||||||||
Band | 20.3 | % | 18.1 | % | (2.2 | )% | ||||||||||
|
|
|
|
|
| |||||||||||
Total gross margin | 38.2 | % | 38.9 | % | 0.7 | % | ||||||||||
|
|
|
|
|
| |||||||||||
Cost of sales from our consolidated operations increased by $13.8 million, or 24.2%, to $71.1 million for the three months ended March 31, 2022 as compared to $57.2 million in the three months ended March 31, 2021. The increase was primarily driven by higher net sales from both the Piano and Band segments as well as higher total manufacturing costs associated with higher production volumes.
Gross profit for the Company increased by $9.8 million, or 27.6%, to $45.2 million and gross margin improved to 38.9% from 38.2%. The margin improvement was primarily driven by favorable product and channel mixes in our Piano segment with increases in our Steinway shipments and a higher share of retail sales, which were partially offset by unfavorable manufacturing variances and higher material and freight costs in our Band segment. Many Band product orders shipped during the three months ended March 31, 2022 were sold at prior year prices, negatively impacting our gross margin, as we were unable to offset higher costs driven by supply chain shortages and inflationary pressures with higher prices. For additional information regarding gross profit for the Piano segment and gross profit for the Band segment, see “—Segment Information.”
Selling, General and Administrative Expenses
| Three Months Ended March 31, | Change | |||||||||||||||
| 2021 | 2022 | Amount | % | |||||||||||||
| (in thousands) | ||||||||||||||||
Selling, General and Administrative | $27,057 | $33,278 | $6,221 | 23.0 | % | |||||||||||
|
|
|
|
|
|
|
| |||||||||
Selling, general and administrative expenses increased by $6.2 million, or 23.0%, to $33.3 million compared to $27.1 million in the three months ended March 31, 2021, primarily due to an increase in legal and professional fees of $3.0 million, which was largely driven by incremental professional services fees associated with this offering, an increase in compensation expenses of $1.1 million, which was primarily driven by higher non-cash stock-based compensation, and an increase in advertising and promotional expenses of $0.6 million.
111
Table of Contents
Other (Income) Expense, Net
| Three Months Ended March 31, | Change | |||||||||||||||
| 2021 | 2022 | Amount | % | |||||||||||||
| (in thousands) | ||||||||||||||||
Other (income) expense, net: | ||||||||||||||||
Interest (income) expense, net | $ | 656 | $ | (3,552 | ) | $ | (4,208 | ) | * | |||||||
Other pension benefit | (94 | ) | (278 | ) | (184 | ) | * | |||||||||
Other income | (1,161 | ) | (5,115 | ) | (3,954 | ) | * | |||||||||
|
|
|
|
|
|
|
| |||||||||
Total other income, net | $ | (599 | ) | $ | (8,945 | ) | $ | (8,346 | ) | * | ||||||
|
|
|
|
|
|
|
| |||||||||
| * | Not meaningful |
Interest Expense, net
The change in interest (income) expense, net, was primarily attributable to a recognized gain of $4.6 million during the three months ended March 31, 2022, resulting from the remeasurement of interest rate swap derivative financial instruments.
Other Pension Benefit
Other pension benefit remained stable at $0.3 million in the three months ended March 31, 2022, as compared to $0.1 million in the three months ended March 31, 2021.
Other Income
Other income increased by $4.0 million, to $5.1 million as compared to $1.2 million in the three months ended March 31, 2021. The increase was primarily attributable to the gain on sale of land development rights.
112
Table of Contents
Results of Operations for the Years Ended December 31, 2020 and 2021
Consolidated Overview
The following results of operations data for the years ended December 31, 2020 and 2021 have been derived from the audited consolidated financial statements included elsewhere in this prospectus.
| Year Ended December 31, | Change | |||||||||||||||
| 2020 | 2021 | Amount | % | |||||||||||||
| (in thousands) | ||||||||||||||||
Net sales | $ | 415,856 | $ | 538,350 | $ | 122,494 | 29.5 | % | ||||||||
Cost of sales | 256,672 | 313,735 | 57,063 | 22.2 | ||||||||||||
|
|
|
|
|
|
|
| |||||||||
Gross profit | 159,184 | 224,615 | 65,431 | 41.1 | ||||||||||||
Selling, general and administrative expenses | 105,222 | 136,385 | 31,163 | 29.6 | ||||||||||||
Goodwill impairment | 13,593 | — | (13,593 | ) | (100.0 | ) | ||||||||||
|
|
|
|
|
|
|
| |||||||||
Total operating expenses | 118,815 | 136,385 | 17,570 | 14.8 | % | |||||||||||
|
|
|
|
|
|
|
| |||||||||
Income from operations | 40,369 | 88,230 | 47,861 | 118.6 | ||||||||||||
Other (income) expense, net: | ||||||||||||||||
Interest expense, net | 15,546 | 5,237 | (10,309 | ) | (66.3 | ) | ||||||||||
Other pension benefit | (165 | ) | (341 | ) | (176 | ) | 106.7 | |||||||||
Gain on sale of assets held for sale | (56,290 | ) | — | 56,290 | (100.0 | ) | ||||||||||
Other income | (943 | ) | (1,606 | ) | (663 | ) | 70.3 | |||||||||
|
|
|
|
|
|
|
| |||||||||
Total other (income) expense, net | (41,852 | ) | 3,290 | 45,142 | (107.9 | ) | ||||||||||
|
|
|
|
|
|
|
| |||||||||
Income before provision for income taxes | $ | 82,221 | $ | 84,940 | $ | 2,719 | 3.3 | |||||||||
Income tax expense | 30,406 | 25,677 | (4,729 | ) | (15.6 | ) | ||||||||||
|
|
|
|
|
|
|
| |||||||||
Net income | $ | 51,815 | $ | 59,263 | $ | 7,448 | 14.4 | % | ||||||||
|
|
|
|
|
|
|
| |||||||||
The following table sets forth our results of operations data expressed as a percentage of net sales:
| Year Ended December 31, | ||||||||
| 2020 | 2021 | |||||||
| (% of net sales) | ||||||||
Net sales | 100.0 | % | 100.0 | % | ||||
Cost of sales | 61.7 | 58.3 | ||||||
|
|
|
| |||||
Gross profit | 38.3 | 41.7 | ||||||
Selling, general and administrative expenses | 25.3 | 25.3 | ||||||
Goodwill impairment | 3.3 | — | ||||||
|
|
|
| |||||
Total operating expenses | 28.6 | % | 25.3 | % | ||||
|
|
|
| |||||
Income from operations | 9.7 | 16.4 | ||||||
Other (income) expense, net: | ||||||||
Interest expense, net | 3.7 | 1.0 | ||||||
Other pension benefit | — | (0.1 | ) | |||||
Gain on sale of assets held for sale | (13.5 | ) | — | |||||
Other income | (0.2 | ) | (0.3 | ) | ||||
|
|
|
| |||||
Total other (income) expense, net | (10.1 | ) | 0.6 | |||||
|
|
|
| |||||
Income before provision for income taxes | 19.8 | 15.8 | ||||||
Income tax expense | 7.3 | 4.8 | ||||||
|
|
|
| |||||
Net income | 12.5 | % | 11.0 | % | ||||
|
|
|
| |||||
113
Table of Contents
Net Sales
| Year Ended December 31, | Change | |||||||||||||||
| 2020 | 2021 | Amount | % | |||||||||||||
| (in thousands) | ||||||||||||||||
Net Sales: | ||||||||||||||||
Piano | $ | 317,428 | $ | 406,601 | $ | 89,173 | 28.1 | % | ||||||||
Band | 98,428 | 131,749 | 33,321 | 33.9 | % | |||||||||||
|
|
|
|
|
|
|
| |||||||||
Total net sales | $ | 415,856 | $ | 538,350 | $ | 122,494 | 29.5 | % | ||||||||
|
|
|
|
|
|
|
| |||||||||
Net sales from our consolidated operations increased $122.5 million, or 29.5%, from $415.9 million in fiscal year 2020 to $538.4 million in fiscal year 2021. Excluding the favorable impact of foreign currency fluctuations, our consolidated net sales in 2021 would have increased by $112.4 million, or 27.0% compared to fiscal year 2020. The increase in our consolidated net sales was attributable to the growth in our Piano segment driven by increased retail net sales globally led by the APAC region, followed by the recovery from the macroeconomic effects of COVID-19. For additional information regarding net sales for the Piano segment and net sales for the Band segment, see “—Segment Information.”
Cost of Sales, Gross Profit and Gross Margin
| Year Ended December 31, | Change | |||||||||||||||
| 2020 | 2021 | Amount | % | |||||||||||||
| (in thousands, except percentages) | ||||||||||||||||
Cost of sales: | ||||||||||||||||
Piano | $ | 178,086 | $ | 210,118 | $ | 32,031 | 18.0 | % | ||||||||
Band | 78,586 | 103,617 | 25,031 | 31.9 | % | |||||||||||
|
|
|
|
|
|
|
| |||||||||
Total cost of sales | $ | 256,672 | $ | 313,735 | $ | 57,062 | 22.2 | % | ||||||||
|
|
|
|
|
|
|
| |||||||||
Gross profit: | ||||||||||||||||
Piano | $ | 139,342 | $ | 196,483 | $ | 57,141 | 41.0 | % | ||||||||
Band | 19,842 | 28,132 | 8,290 | 41.8 | % | |||||||||||
|
|
|
|
|
|
|
| |||||||||
Total gross profit | $ | 159,184 | $ | 224,615 | $ | 65,431 | 41.1 | % | ||||||||
|
|
|
|
|
|
|
| |||||||||
Gross margin: | ||||||||||||||||
Piano | 43.9 | % | 48.3 | % | 4.4 | % | ||||||||||
Band | 20.2 | % | 21.4 | % | 1.2 | % | ||||||||||
|
|
|
|
|
| |||||||||||
Total gross margin | 38.3 | % | 41.7 | % | 3.4 | % | ||||||||||
|
|
|
|
|
| |||||||||||
Cost of sales from our consolidated operations increased by $57.1 million, or 22.2%, to $313.7 million for fiscal year 2021 as compared to fiscal year 2020. The increase was primarily driven by higher sales from both the Piano and Band segments, as well as higher manufacturing cost associated with higher production rates.
Gross profit for the Company increased by $65.4 million, or 41.1%, to $224.6 million and gross margin improved to 41.7% from 38.3%. The margin improvement was primarily driven by favorable product and channel mix in our Piano segment as well as increased fixed cost leverage across our manufacturing facilities as we increased production rates. These favorable factors were partially offset by unfavorable product mix and higher material cost in our Band segment. For additional information regarding gross profit for the Piano segment and gross profit for the Band segment, see “—Segment Information.”
114
Table of Contents
Selling, General and Administrative Expenses
| Year Ended December 31, | Change | |||||||||||||||
| 2020 | 2021 | Amount | % | |||||||||||||
| (in thousands) | ||||||||||||||||
Selling, General and Administrative | $ | 105,222 | $ | 136,385 | $ | 31,163 | 29.6 | % | ||||||||
|
|
|
|
|
|
|
| |||||||||
Selling, general and administrative expenses increased by $31.2 million, or 29.6%, to $136.4 million compared to fiscal year 2020, primarily due to an increase in personnel related expenses of $22.4 million, which was driven by a combination of higher compensation expenses in fiscal year 2021 (including higher non-cash stock-based compensation), and temporary pay reductions in fiscal year 2020 due to COVID-19 related impacts. Additionally, the increase in selling, general and administrative expenses was driven by a $6.9 million increase in professional and outside services costs, including legal and auditor fees, a $2.1 million increase in occupancy costs and a $1.2 million increase in advertising and promotion expenses. These increases were partially offset by an impairment loss of $2.5 million recognized in fiscal year 2020 related to trademarks in our Band segment.
Goodwill Impairment
| Year Ended December 31, | Change | |||||||||||||||
| 2020 | 2021 | Amount | % | |||||||||||||
| (in thousands) | ||||||||||||||||
Goodwill impairment | $ | 13,593 | $ | — | $ | (13,593 | ) | (100.0 | )% | |||||||
|
|
|
|
|
|
|
| |||||||||
For fiscal year 2020, we recorded a goodwill impairment in the Band segment driven by lower-than-expected sales and profitability due to the effects of the COVID-19 pandemic, as our business is still recovering from the school and band program closures and restrictions.
Other (Income) Expense, Net
| Year Ended December 31, | Change | |||||||||||||||
| 2020 | 2021 | Amount | % | |||||||||||||
| (in thousands) | ||||||||||||||||
Other (income) expense, net: | ||||||||||||||||
Interest expense, net | $ | 15,546 | $ | 5,237 | $ | (10,309 | ) | (66.3 | )% | |||||||
Other pension benefit | (165 | ) | (341 | ) | (176 | ) | N/A | |||||||||
Gain on sale of assets held for sale | (56,290 | ) | — | 56,290 | N/A | |||||||||||
Other income | (943 | ) | (1,606 | ) | (663 | ) | (70.3 | )% | ||||||||
|
|
|
|
|
|
|
| |||||||||
Total other (income) expense, net | $ | (41,852 | ) | $ | 3,290 | $ | 45,142 | N/A | ||||||||
|
|
|
|
|
|
|
| |||||||||
Interest Expense, net
Interest expense decreased by $10.3 million, or 66.3%, to $5.2 million as compared to fiscal year 2020. The decrease was primarily attributable to lower interest expense associated with a reduced average level of outstanding debt and the change in the value of our interest rate swaps instruments, which was partially offset by a $1.4 million write-off of deferred financing costs related to our First Lien Term Loan Facility. Throughout fiscal year 2021, we fully repaid our First Lien Term loan Facility, which had a $96.2 million outstanding balance as of December 31, 2020.
115
Table of Contents
Other Pension Benefit
Other pension benefit remained stable at $0.3 million in fiscal year 2021, as compared to $0.2 million in fiscal year 2020.
Gain on Sale of Assets Held for Sale
We recorded no gain on assets held for sale in fiscal year 2021, compared to $56.3 million in fiscal year 2020, during which we recorded a gain on the sale of an underutilized real estate property.
Other Income
Other income decreased by $0.7 million, or 70.3%, to $(1.6) million as compared to fiscal year 2020. The decrease was primarily attributable due to foreign exchange fluctuations.
Segment Information
We have two operating segments: Piano and Band. We evaluate segment operating performance using net sales, gross margin and Adjusted EBITDA, with Adjusted EBITDA being the primary profitability metric used to make resource allocation decisions and evaluate segment performance.
The segment measurements provided to and evaluated by the chief operating decision maker (CODM) are described in Note 16 to our consolidated financial statements included elsewhere in this prospectus. Management believes segment Adjusted EBITDA is indicative of operational performance and ongoing profitability and uses Adjusted EBITDA to evaluate the operating performance of our segments and for planning and forecasting purposes, including the allocation of resources and capital.
Net Sales
Piano Segment
Net sales for the Piano segment for the three months ended March 31, 2022 increased by $14.5 million, or 21.3%, to $82.3 million from $67.8 million in the three months ended March 31, 2021. Piano segment net sales from the Americas region increased by $12.9 million, or 45.5%, net sales from the APAC region decreased by $0.9 million, or 4.3%, and net sales from the EMEA region increased by $2.5 million, or 14.5%. Excluding the unfavorable impact of foreign currency fluctuations, Piano segment net sales across all regions would have increased by $15.6 million, or 22.9%, net sales from the APAC region would have decreased by $1.0 million, or 4.5% and net sales from the EMEA region would have increased by $3.6 million, or 21.2%. The increase in Piano segment net sales was primarily driven by higher sales from our Steinway pianos, which increased by $11.1 million, or 27.3%, and higher sales from retail operations, which increased by $10.9 million, or 48.4%. The increase in Steinway piano net sales was primarily driven by greater shipments of Spirio pianos, which increased by $7.1 million, or 38.8%. Growth from our retail operations was led by higher net sales from our showrooms in the Americas region, which increased by $8.5 million, or 79.6%. This favorable impact was partially offset by a decline in net sales from showrooms in the APAC region, which decreased by $1.0 million, or 17.4%, due to COVID-19 related lockdowns in China that restricted our ability to ship pianos from our warehouse in Shanghai.
Net sales for the Piano segment for fiscal year 2021 increased by $89.2 million, or 28.1%, to $406.6 million from $317.4 million in fiscal year 2020. Piano segment net sales from the Americas region increased by $43.4 million, or 36.3%, net sales from the APAC region increased by $35.4 million, or 30.9%, and net sales from the EMEA region increased by $10.3 million, or 12.4%. Excluding the favorable impact of foreign currency fluctuations, Piano segment net sales across all regions would have
116
Table of Contents
increased by $79.4 million, or 25.0%, net sales from the APAC region would have increased by $28.2 million, or 24.6% and net sales from the EMEA region would have increased by $7.8 million, or 9.3%. The increase in net sales in all regions was primarily driven by higher sales from our Steinway pianos, which increased by $68.5 million, or 32.4%, as we experienced stronger demand globally. Within Steinway piano sales, sales from our higher margin Spirio pianos increased by $25.4 million, or 24.0%.
Band Segment
Net sales for the Band Segment for the three months ended March 31, 2022 increased by $9.2 million, or 36.9%, to $34.0 million from $24.9 million in the three months ended March 31, 2021, primarily driven by an increase in institutional and dealer orders as a result of the resumption of school music programs and the reopening of concert venues amid the easing of COVID-19 restrictions. Net sales in the Americas region, which represented 95.1% of Band segment net sales in the three months ended March 31, 2022, increased by $8.5 million, or 35.7%, while net sales in the rest of the world increased by $0.7 million, or 64.5%.
Net sales from brasswind instruments increased by $2.8 million, or 25.6%, to $13.7 million for the three months ended March 31, 2022. Net Sales from woodwind instruments increased by $1.8 million, or 39.8%, to $6.4 million for the three months ended March 31, 2022. Net sales from percussion instruments increased by $2.9 million, or 53.4%, to $8.4 million for the three months ended March 31, 2022. Sales from string instruments, accessories, and others increased by $1.7 million, or 35.3%, to $6.5 million for the three months ended March 31, 2022. Across all band instrument types, sales of professional and step-up instruments increased by $3.7 million, or 32.7%, to $15.1 million while sales of student instruments increased by $0.9 million, or 22.1%, to $5.1 million for the three months ended March 31, 2022.
Net sales for the Band Segment for fiscal year 2021 increased by $33.3 million, or 33.9%, to $131.7 million from $98.4 million in fiscal year 2020, primarily driven by a recovery in school bid business amid continued loosening of COVID-19 restrictions on school music programs and concert venues. Net sales in the Americas region, which represented 95.5% of Band segment net sales in fiscal year 2021, increased by $30.3 million, or 31.7%, while net sales in the rest of the world increased by $3.0 million, or 104.7%.
Net sales from brasswind instruments increased by $12.0 million, or 27.7%, to $55.4 million for fiscal year 2021. Net Sales from woodwind instruments increased by $8.6 million, or 42.3%, to $29.0 million for fiscal year 2021. Net sales from percussion instruments increased by $6.1 million, or 29.0%, to $27.0 million for fiscal year 2021. Sales from string instruments, accessories, and others increased by $7.8 million, or 44.3%, to $25.5 million for fiscal year 2021. Across all band instrument types, sales of professional and step-up instruments increased by $12.8 million, or 30.0%, to $55.7 million while sales of student instruments increased by $7.8 million, or 37.3%, to $28.7 million for fiscal year 2021.
Gross Profit
Piano Segment
Gross profit from the Piano segment for the three months ended March 31, 2022 increased by $8.7 million, or 28.6%, to $39.1 million from $30.4 million for the three months ended March 31, 2021, and gross margin improved to 47.5% from 44.8%, due to a combination of a higher share of net sales from retail operations and a favorable product mix due to a higher share of Spirio piano shipments during the quarter.
Gross profit from the Piano segment for fiscal year 2021 increased by $57.1 million, or 41.0%, to $196.5 million from $139.3 million in fiscal year 2020, and gross margin improved to 48.3% from
117
Table of Contents
43.9%, due to a higher share of sales from retail operations and increased sales of Spirio pianos and sales in the APAC region at higher margin. Additionally, we realized greater production volume and manufacturing efficiencies across our production facilities compared to fiscal year 2020, during which we operated at lower production rates due to COVID-19 related restrictions.
Band Segment
Gross profit from the Band segment for the three months ended March 31, 2022 increased by $1.1 million, or 21.7%, to $6.2 million from $5.1 million for the three months ended March 31, 2021, and gross margin declined to 18.1% from 20.3%. The decline in gross margin was primarily driven by unfavorable manufacturing variances, higher material and freight costs, supply chain shortages and inflationary pressures that outpaced price increases.
Gross profit from the Band segment for fiscal year 2021 increased by $8.3 million, or 41.8%, to $28.1 million from $19.8 million for fiscal year 2020, and gross margin improved to 21.4% from 20.2%. The improvement in gross margin was primarily driven by lower costs per unit associated with higher production rates compared to fiscal year 2020, during which our production was disrupted by COVID-19 related restrictions. This favorable factor was partially offset by a higher share of lower margin student product sales, as well as higher material and freight costs as a percentage of net sales.
Adjusted EBITDA
Piano Segment
Adjusted EBITDA for the Piano segment for the three months ended March 31, 2022 increased by $5.8 million, or 46.1%, to $18.5 million from $12.7 million in the three months ended March 31, 2021. Adjusted EBITDA margin improved to 22.5% from 18.7%, primarily driven by the combination of higher net sales, improvement in gross margin primarily due to favorable product and channel mixes, and a slower increase in SG&A that was outpaced by faster growth in gross profit.
Adjusted EBITDA for the Piano segment for fiscal year 2021 increased by $34.7 million, or 48.2%, to $106.8 million from $72.1 million in fiscal year 2020. Adjusted EBITDA margin improved to 26.3% from 22.7%, primarily driven by strong growth in net sales that outpaced growth in cost of sales and selling, general and administrative expenses.
Band Segment
Adjusted EBITDA for the Band Segment for the three months ended March 31, 2022 remained stable at $0.9 million as compared to $1.0 million in the three months ended March 31, 2021. Adjusted EBITDA margin declined to 2.8% from 4.1%, driven by the combination of lower gross margin primarily due to higher manufacturing and freight costs, and a slower growth in gross profit that was outpaced by faster growth in SG&A.
Adjusted EBITDA for the Band Segment for fiscal year 2021 increased by $5.7 million, or 116.0%, to $10.7 million from $4.9 million in fiscal year 2020. Adjusted EBITDA margin improved to 8.1% from 5.0%, primarily driven by a combination of higher sales, improved gross profit margin as well as lower selling, general and administrative expenses as a percentage of net sales.
Seasonality and Quarterly Trends
We experience seasonal fluctuations in our net sales and operating results and we historically have realized a higher portion of our revenue and earnings for the fiscal year during our third and
118
Table of Contents
fourth fiscal quarters. For our Piano segment, we typically realize our strongest net sales and earnings during the fourth fiscal quarter driven by holiday shopping, while for our Band segment we experience strongest demand during the third fiscal quarter driven by back-to-school shopping activities. In addition, we typically experience lower profitability in the first and second fiscal quarters as we invest ahead of our most active seasons. Working capital requirements typically increase throughout our first and second fiscal quarters as inventory builds to support our peak shipping and selling period which typically occurs from November to December. Cash provided by operating activities is typically highest in our fourth fiscal quarter due to the significant inflows associated with our peak selling season.
For fiscal years 2021 and 2020, we generated the highest percentage of net sales during the fourth fiscal quarter. Net sales in the fourth fiscal quarter of fiscal years 2021 and 2020 contributed 33.3% and 35.3%, respectively, of annual net sales. For fiscal year 2021, we generated the lowest percentage of net sales during the first fiscal quarter. Net sales in the first fiscal quarter of fiscal year 2021 contributed 17.2% of annual net sales. For fiscal year 2020, we generated the lowest percentage of net sales during the second fiscal quarter as we were most heavily impacted during that quarter by COVID-19 related restrictions that led to closures of our retail showrooms and dealer storefronts. Net sales in the second fiscal quarter of fiscal year 2020 contributed 18.3% of annual net sales.
For fiscal years 2021 and 2020, we generated the highest percentage of Adjusted EBITDA during the fourth fiscal quarter. Adjusted EBITDA in the fourth fiscal quarter of fiscal years 2021 and 2020 contributed 41.2% and 48.6%, respectively, of annual adjusted EBITDA. For fiscal year 2021, we generated the lowest percentage of Adjusted EBITDA during the first fiscal quarter. Adjusted EBITDA in the first fiscal quarter of fiscal year 2021 contributed 11.7% of annual Adjusted EBITDA. For fiscal year 2020, we generated the lowest percentage of Adjusted EBITDA during the second fiscal quarter due to COVID-19 related impacts. Adjusted EBITDA in the second fiscal quarter of fiscal year 2020 contributed 8.7% of annual adjusted EBITDA.
For fiscal years 2022, 2021 and 2020, we had negative cash flows from operating activities during the first fiscal quarter as we built up our inventory levels in anticipation of our peak selling period, which is typically the fourth fiscal quarter. For fiscal year 2021 and 2020, we had the highest cash inflows from operating activities during the fourth fiscal quarter due to higher sales. In the fourth fiscal quarters of fiscal years 2021 and 2020, we generated cash inflows from operating activities of $67.3 million and $48.1 million, respectively.
Liquidity and Capital Resources
We assess our liquidity in terms of our ability to generate adequate amounts of cash to meet current and future needs. We have relied primarily upon cash provided by operations, supplemented as necessary by seasonal borrowings under our Credit Facilities, to finance our operations, repay or repurchase long-term indebtedness, finance acquisitions, and fund our capital expenditures.
As of December 31, 2021 and March 31, 2022, we had $43.7 million and $39.3 million, respectively, of cash and cash equivalents which were primarily invested in short-term certificates of deposit with maturities of three months or less. Additionally, we had $42.7 million outstanding under our revolving credit facilities in the United States, Germany and Japan with an additional available balance of $61.0 million as of March 31, 2022 under all facilities. We believe that our existing cash and cash equivalent balances will be sufficient to support our working capital requirements for at least the next 12 months based on our current operating plans.
However, our future capital requirements will depend on many factors, including our net sales growth rate, the level of our expenditures in advertising and marketing activities and all other areas of the company, the impact of the COVID-19 pandemic and other factors described in “Risk Factors.” Our
119
Table of Contents
expected primary uses on a short-term and long-term basis are for repayment of debt, interest payments, working capital, capital expenditures, geographic expansion, and other general corporate purposes. We also have ongoing lease obligations with remaining payment commitments of $95.5 million as of December 31, 2021.
We may, in the future, enter into arrangements to acquire or invest in complementary businesses, products and technologies which may require us to seek additional financing. To the extent additional funds are necessary to meet our liquidity needs as we continue to execute our business strategy, we anticipate that they will be obtained through borrowings under our existing Credit Facilities, the incurrence of other additional indebtedness, the issuance of additional equity or a combination of these potential sources of funds; however, such financing may not be available on favorable terms, or at all. In particular, the widespread COVID-19 pandemic has resulted in, and may continue to result in, significant disruption of global financial markets, reducing our ability to access capital. If we are unable to raise additional funds on commercially reasonable terms or at all, our business, financial condition and results of operations could be adversely affected. See “Risk Factors—Risks Related to the Financial Position of Our Business—Our indebtedness could materially adversely affect our financial condition and our ability to operate our business, react to changes in the economy or industry or pay our debts and meet our obligations under our debt and could divert our cash flow from operations to debt payments.”
Cash Flows for the Three Months Ended March 31, 2021 and 2022
The following table summarizes our cash flows for the three months ended March 31, 2021 and 2022:
| Three Months Ended March 31, | ||||||||
| 2021 | 2022 | |||||||
| (in thousands) | ||||||||
Net cash provided by (used in) operating activities | $ | (539) | $ | (17,766) | ||||
Net cash provided by (used in) investing activities | (4,057) | 2,169 | ||||||
Net cash provided by (used in) financing activities | 17,278 | 11,802 | ||||||
Effects of foreign exchange rate changes on cash and cash equivalents | (962) | (578) | ||||||
|
|
|
| |||||
Net increase (decrease) in cash and cash equivalents | $ | 11,720 | $ | (4,373) | ||||
|
|
|
| |||||
Operating Activities
Net cash used in operating activities of $17.8 million for the three months ended March 31, 2022 was primarily due to net income of $14.8 million, a net cash outflow related to changes in operating assets and liabilities of $28.9 million, and negative non-cash adjustments of $3.6 million. Non-cash adjustments primarily consisted of positive adjustments related to depreciation and amortization expense of $4.1 million, share-based compensation of $1.1 million, a change in net deferred tax liabilities of $0.6 million, and amortization of pension through other comprehensive loss of $0.5 million, which were offset by negative adjustments related to gain on sale of land development rights of $5.1 million and a change in the fair value of derivative instruments of $4.6 million. Changes in cash flows related to operating assets and liabilities primarily consisted of cash inflows related to a decrease in prepaid expenses of $4.4 million and an increase in accounts payable of $0.5 million. These inflows were offset by cash outflows related to an increase of inventories of $16.2 million as a result of higher production rates during the period to support higher anticipated sales later in the year, a decrease in other current and noncurrent liabilities of $14.5 million largely due to the combination of fiscal year 2021 employee bonus payouts as well as foreign tax payments during the period, and an increase in accounts receivable of $3.0 million due to higher sales.
Net cash used in operating activities of $0.5 million for the three months ended March 31, 2021 was primarily due to net income of $6.3 million, a net cash outflow related to changes in operating assets
120
Table of Contents
and liabilities of $11.2 million, and positive non-cash adjustments of $4.4 million. Non-cash adjustments primarily consisted of positive adjustments related to depreciation and amortization expense of $3.8 million, a change in net deferred tax liabilities of $1.5 million, amortization on pension from other comprehensive loss of $0.7 million, and non-cash interest expense of $0.2 million, which were partially offset by negative adjustments related to a change in the fair value of derivative instruments of $1.8 million. Changes in cash flows related to operating assets and liabilities primarily consisted of cash inflows related to an increase in other current and noncurrent liabilities of $2.0 million and an increase in accounts payable of $1.8 million. These inflows were offset by cash outflows related to an increase in inventory of $12.7 million due to higher production rates during the period to support higher anticipated sales later in the year, an increase in accounts receivables of $1.2 million due to higher sales and an increase in prepaid expenses and other current assets of $1.2 million.
Investing Activities
Net cash provided by investing activities of $2.2 million for the three months ended March 31, 2022 was due to proceeds from the sale of land development rights of $6.4 million, partially offset by capital expenditures of $4.0 million due to ongoing investment in machinery and equipment at our factories and capitalization of software development costs of $0.2 million.
Net cash used in investing activities of $4.1 million for the three months ended March 31, 2021 consisted of capital expenditures of $2.5 million due to ongoing investment in machinery and equipment at our factories, a $1.3 million acquisition of land development rights, and capitalization of software development costs of $0.3 million.
Financing Activities
Net cash provided by financing activities of $11.8 million for the three months ended March 31, 2022 consisted of borrowings under foreign lines of credit of $11.8 million and borrowings under domestic lines of credit of $0.5 million, partially offset by repayments of long-term debt of $0.5 million.
Net cash provided by financing activities of $17.3 million for the three months ended March 31, 2021 consisted of borrowings under domestic lines of credit of $10.5 million, borrowings under foreign lines of credit of $6.4 million, and borrowings of long-term debt of $0.9 million, offset by repayments of long-term debt of $0.5 million.
Cash Flows for the Years Ended December 31, 2020 and 2021
The following table summarizes our cash flows for the years ended December 31, 2020 and 2021:
| Year Ended December 31, | ||||||||
| 2020 | 2021 | |||||||
| (in thousands) | ||||||||
Net cash provided by (used in) operating activities | $ | 58,447 | $ | 122,485 | ||||
Net cash provided by (used in) investing activities | 57,580 | (24,987 | ) | |||||
Net cash provided by (used in) financing activities | (104,091 | ) | (96,360 | ) | ||||
Effects of foreign exchange rate changes on cash and cash equivalents | 1,926 | (1,204 | ) | |||||
|
|
|
| |||||
Net increase (decrease) in cash and cash equivalents | $ | 13,862 | $ | (66 | ) | |||
|
|
|
| |||||
Operating Activities
Net cash provided by operating activities of $122.5 million for fiscal year 2021 was primarily due to net income of $59.3 million, a net cash inflow related to changes in operating assets and liabilities of
121
Table of Contents
$41.7 million, and non-cash adjustments of $21.5 million. Non-cash adjustments primarily consisted of depreciation and amortization expense of $14.9 million, share-based compensation of $7.6 million, amortization of pension through other comprehensive loss of $2.8 million, and non-cash interest expense of $2.2 million, partially offset by a change in fair value of derivative instruments of $4.7 million and a change in net deferred tax liabilities of $1.2 million. Changes in cash flows related to operating assets and liabilities primarily consisted of cash inflow related to an increase of $39.2 million in other current and noncurrent liabilities due to a higher level of deferred income associated with advanced payments on pianos that were not yet delivered to our customers as well as higher accrued compensation expenses, a decrease in inventories of $15.4 million as a result increased sales in 2021, and an increase in accounts payable of $1.9 million due to timing of payments. This inflow was partially offset by an increase in prepaid expenses and other current assets of $7.9 million due to timing of payments and an increase in accounts receivable of $6.8 million due to a higher sales.
Net cash provided by operating activities of $58.4 million for fiscal year 2020 was primarily due to net income of $51.8 million and a net cash inflow related to changes in operating assets and liabilities of $20.2 million, partially offset by non-cash adjustments of $13.6 million. Non-cash adjustments primarily consisted of gain on sale of assets of $55.9 million, partially offset by impairment charges of $16.1 million, depreciation and amortization expense of $15.0 million, deferred income tax expense of $4.7 million, amortization of pension through other comprehensive loss of $2.0 million, share based compensation of $1.9 million, decrease in fair value of derivative instruments of $1.5 million, non-cash interest expense of $0.7 million, and non-cash employee compensation of $0.3 million. Changes in cash flows related to operating assets and liabilities primarily consisted of cash inflow related to a decrease in accounts receivable of $19.6 million due to a decline in sales and timing of payments, a decrease in inventories of $10.8 million as a result of reduced production volume during the year driven by our response to the COVID-19 pandemic and related restrictions, and a decrease in prepaid expenses and other current assets of $2.1 million due to timing of payments. This inflow was partially offset by a $11.4 million decrease in other current and noncurrent liabilities due to changes in compensation related items and in accrued tax balances. We also had a $0.9 million decrease in accounts payable due to timing of payments.
Investing Activities
Net cash used in investing activities of $25.0 million for fiscal year 2021 was due to capital expenditures of $22.0 million primarily due to ongoing investment in machinery and equipment at our factories, a $1.3 million acquisition of land development rights, capitalization of software development costs of $1.0 million as a result of our continued investment in software for internal use, and other investments of $0.8 million, partially offset by proceeds from sales of property, plant and equipment of $0.1 million.
Net cash provided by investing activities of $57.6 million for fiscal year 2020 was due to proceeds from sales of property, plant and equipment of $68.6 million, mainly driven by the sale of underutilized real-estate, partially offset by capital expenditures of $9.9 million primarily due to ongoing investment in machinery and equipment at our factories, and capitalization of software development costs of $1.1 million as a result of our continued investment in software for internal use.
On average from fiscal year 2016 to 2021, we have generated higher cash flow from operating activities when compared to our capital expenditures. From fiscal year 2016 to 2021, we generated average annual cash flow from operating activities of $55.4 million and incurred average annual capital expenditures of $15.7 million.
122
Table of Contents
Financing Activities
Net cash used in financing activities of $96.4 million for fiscal year 2021 consisted of repayments of long-term debt of $98.3 million and repayments under lines of credit of $0.5 million, partially offset by borrowings under lines of credit $1.5 million and borrowings of long-term debt of $0.9 million.
Net cash used in financing activities of $104.1 million for fiscal year 2020 consisted of repayments of long-term debt of $136.7 million and repayments under lines of credit of $9.2 million, partially offset by borrowings of long-term debt of $21.7 million and borrowings under lines of credit of $20.0 million.
Debt
We entered into the First Lien Term Loan Facility and the ABL Facility (collectively, “domestic debt”) in September 2013, and on February 16, 2018, we refinanced both the First Lien Term Loan Facility and the ABL Facility. The First Lien Term Loan Facility, which matures on February 16, 2025, provided an aggregate principal amount of $235.0 million at an interest rate of either LIBOR plus 3.75% (subject to a LIBOR floor of 1.0%) or a Base Rate, as defined below, plus 2.75% (subject to a Base Rate floor of 2.0%). The Base Rate is defined as the highest of the Prime Rate (as defined in the First Lien Term Loan Facility), the Federal Funds Rate (as defined in the First Lien Term Loan Facility) plus 0.5%, or the one-month LIBOR plus 1.0%. LIBOR loans have interest periods of one, three, or six months, as selected by us, but interest payments are due no less than every three months. We selected the one-month LIBOR in 2020. The applicable interest rate with respect to the First Lien Term Loan Facility was 4.75% as of December 31, 2020. The repayment terms of the First Lien Term Loan Facility required quarterly installment payments of $0.6 million beginning June 30, 2018. The First Lien Term Loan Facility also required mandatory annual excess cash flow prepayments starting December 31, 2019 equal to 50%, 25% or 0% of our Excess Cash Flow (as defined in therein). Amortization payments of $600,000 per quarter were made during fiscal year 2020. Moreover, we made additional prepayments totaling $132.3 million during fiscal year 2020. As a result, there were no additional mandatory quarterly principal payments required on or after December 31, 2020, and there was no excess cash flow payment required for fiscal year 2020. As of December 31, 2021 we had repaid in full and cancelled our First Lien Term Loan Facility.
The ABL Facility provided a total commitment of $110.0 million expiring on February 16, 2023. The ABL Facility provides for borrowings at either LIBOR plus a range from 1.50% to 2.00% or as-needed borrowings at an alternate base rate, plus a range from 0.50% to 1.00%; both ranges depend upon availability at the time of borrowing. The applicable interest rate with respect to the ABL Facility was 2.0% as of March 31, 2022. The amount outstanding under the ABL Facility amounted to $20.0 million as of March 31, 2022. Any outstanding amounts are payable when the facility matures in 2023. The amount available on the ABL Facility, net of letters of credit and borrowing restrictions, was $46.6 million as of March 31, 2022.
Capitalized debt issuance costs are reflected net of amortization in long-term debt, net on our consolidated balance sheet.
Simultaneously with the execution of the credit agreements governing our domestic debt, we and various of our subsidiaries entered into a guarantee agreement and a collateral agreement with respect to each of our First Lien Term Loan Facility and our ABL Facility. Pursuant to the guarantee agreements, we and various of our subsidiaries are guarantors under the ABL Facility. Pursuant to the collateral agreements, our ABL Facility is collateralized by substantially all our assets, including our intellectual property and the equity interests of our various subsidiaries.
In addition to our domestic debt, we also have multiple foreign credit facilities. In 2019, our German subsidiary entered into a credit facility with a foreign bank which entitles it to borrow up to the
123
Table of Contents
amount of €18.0 million. This credit facility, which is guaranteed by SMI, originally expired on December 31, 2019 and was extended to April 15, 2020. In April 2020, our German subsidiary refinanced this credit facility, resulting in a €20.0 million term loan (the “German Term Loan Facility”) and €30.0 million ABL facility (the “German ABL Facility”). Our Japanese subsidiary also has a term loan facility in the amount of ¥98.0 million, entered into in January 2021 (the “Japanese Term Loan Facility” and together with the German Term Loan Facility, the “foreign term loans”), and a revolving credit facility which it increased from ¥300.0 million to ¥600.0 million in March 2020 (the “Japanese Revolving Credit Facility”). The German ABL Facility, together with the Japanese Revolving Credit Facility, are referred to as the “foreign revolving credit facilities” and, together with the foreign term loans, the “foreign credit facilities.” The outstanding debt issuance costs related to the foreign credit facilities was $22.7 million as of March 31, 2022.
The outstanding balance of our foreign term loans was $19.0 million as of March 31, 2022. The total outstanding balance of our foreign revolving credit facilities was $22.7 million as of March 31, 2022. The amount available on the foreign revolving credit facilities, net of letters of credit, was $14.4 million as of March 31, 2022.
Current portion of debt represents the quarterly installments on the foreign term loan and foreign revolving credit facilities that are due within the next fiscal year.
All of our debt agreements contain affirmative and negative covenants that place certain restrictions on us, including, among other things, restrictions on indebtedness, liens, fundamental changes and asset sales, investments, negative pledges, repurchases of stock, dividends and other distributions, and transactions with affiliates. We were in compliance with all such covenants as of March 31, 2022.
Off-Balance Sheet Arrangements
We did not have during the period presented, and we do not currently have, any off-balance sheet financing arrangements as defined under the rules and regulations of the SEC, or any relationships with unconsolidated entities or financial partnerships, including entities sometimes referred to as structured finance or special purpose entities, that were established for the purpose of facilitating off-balance sheet arrangements or other contractually narrow or limited purposes.
Critical Accounting Policies and Estimates
We believe that the following accounting policies involve a high degree of judgment and complexity. Accordingly, these are the policies we believe are the most critical to aid in fully understanding and evaluating our financial condition and results of our operations. See Note 2 to our consolidated financial statements included elsewhere in this prospectus for a description of our other significant accounting policies. The preparation of our financial statements in conformity with GAAP requires us to make estimates and judgments that affect the amounts reported in those financial statements and accompanying notes. Although we believe that the estimates we use are reasonable, due to the inherent uncertainty involved in making those estimates, actual results reported in future periods could differ from those estimates.
Valuation of Goodwill and Intangible Assets
The valuation of assets acquired in a business combination and subsequent impairment reviews of such assets require the use of significant estimates and assumptions. The acquisition method of accounting for business combinations requires us to estimate the fair value of assets acquired and
124
Table of Contents
liabilities assumed, and we record goodwill when consideration paid in a business acquisition exceeds the value of the net assets acquired. We also hold trademarks which are considered indefinite-lived as we expect to continue to derive benefits from these assets. Goodwill and indefinite-lived intangible assets are not amortized, but rather are tested for impairment annually, or more frequently if facts and circumstances warrant a review.
We assess both the existence of potential impairment and the amount of loss, if any, by comparing the fair value of each reporting unit that includes goodwill or indefinite-lived intangible assets with its carrying amount. Our estimates are based upon assumptions that we believe to be reasonable, but which are inherently uncertain and unpredictable. These valuations require the use of management’s assumptions, which do not reflect unanticipated events and circumstances that may occur. If factors indicate that the fair value of the reporting unit or indefinite lived intangible assets is less than its carrying amount, we perform a quantitative assessment and the fair value of the reporting unit is determined by analyzing the expected present value of future cash flows for goodwill and relief from royalty method of indefinite-lived intangible assets. If the carrying value of the reporting unit or indefinite-lived intangible assets continues to exceed its fair value, the implied fair value of the reporting unit’s goodwill or indefinite-lived intangible assets is calculated and an impairment loss equal to the excess is recorded.
We performed a qualitative assessment for each of our reporting units and our indefinite-lived intangible assets as of October 1. The qualitative analyses resulted in us determining that it was more likely than not that the fair value of the Band reporting unit and certain indefinite-lived intangible assets was less than its carrying amount. As a result, management performed a quantitative analysis to determine the amount of impairment associated with the reporting unit for goodwill and certain indefinite-lived intangible assets.
Refer to Note 8 of our consolidated financial statements included elsewhere in this prospectus for further information.
We evaluate long-lived assets, including finite-lived intangible assets and other assets, for impairment whenever events or changes in circumstances indicate that the carrying amount of the assets may not be recoverable. Events or changes in circumstances that could result in an impairment review include, but are not limited to, significant underperformance relative to historical or projected future operating results, significant changes in the manner of use of the acquired assets or the strategy for our overall business, and significant negative industry or economic trends. If an event occurs that would cause us to revise our estimates and assumptions used in analyzing the value of our property and equipment or our finite-lived intangibles and other assets, that revision could result in a non-cash impairment charge that could have a material impact on our financial results.
Revenue Recognition
We recognize net sales from contracts with customers when (or as) control of the promised goods or services transfers to the customer. For wholesale net sales, this generally occurs when the product is shipped to the dealer after receipt of a valid order. For retail net sales, this generally occurs when the product is delivered to the customer in accordance with the purchase agreement. Net sales is recorded at the amount of consideration we expect to be entitled to in exchange for the delivered goods or services, which includes an estimate of expected returns or refunds and customer incentives.
Share-Based Compensation
We recognize compensation cost of share-based awards on a straight-line basis over the requisite service period (typically the vesting period) of the award and we elected to recognize
125
Table of Contents
forfeitures as they occur. The awards were classified as a liability in our financial statements. We recognize compensation expense as selling, general and administrative expenses within our consolidated statement of operations.
As a nonpublic entity, the Company elected to measure the awards based on their intrinsic value as permitted under ASC 718. The Company measured the intrinsic value of the awards based on the estimated settlement value of the awards at each reporting period. The Company continued to record changes in the intrinsic value of the awards up to the date on which the Company ceased to be a nonpublic entity as defined in ASC 718. Upon becoming a public entity, as a result of filing its initial registration statement with the SEC and for each reporting period thereafter, the Company measured the awards using the fair value-based method as required under ASC 718. The impact from the change in valuation methods on the date on which the Company became a public entity was accounted for as compensation cost during that period.
Refer to Note 14 of our consolidated financial statements included elsewhere in this prospectus for further information.
Environmental Obligations
We accrue for any environmental investigation, remediation, operating and maintenance costs when it is probable that a liability has been incurred and the amount can be reasonably estimated. For environmental matters, the most likely cost to be incurred is accrued based on an evaluation of currently available facts with respect to each individual site, current laws and regulations and prior remediation experience. For sites with multiple potentially responsible parties, we consider the likely proportionate share of the anticipated remediation costs and the ability of the other parties to fulfill obligations in establishing a provision for those costs. Where no amount within a range of estimates is more likely to occur than another, the minimum undiscounted amount is accrued.
The uncertain nature inherent in such remediation and the possibility that initial estimates may not reflect the outcome could result in additional costs being recognized by us in future periods.
Retirement Plans
We have defined benefit or defined contribution pension plans covering a majority of our employees, including certain employees in foreign countries. Certain domestic hourly employees are covered by a multi-employer defined benefit pension plan to which we make contributions. We also provide post-retirement life insurance benefits to certain eligible hourly retirees and their dependents. We previously maintained a non-qualified Supplemental Executive Retirement Plan (“SERP”) for a select group of our current and former executives; however, the SERP was terminated in March of 2021 and final asset distributions were completed by April of 2022.
Benefits under the pension and other post-retirement benefit plans are generally based on age at retirement and years of service and, for some pension plans, benefits are also based on the employee’s annual earnings. The net cost of our pension and other post-retirement benefit plans is determined using the projected unit credit method and several actuarial assumptions, the most significant of which are the discount rate, the long-term rate of asset return, and current rate trends. A portion of these costs is not recognized in net income in the year incurred because it is allocated to product costs and reflected in inventory at the end of a reporting period.
Recent Accounting Pronouncements
See Note 2 to our consolidated financial statements and unaudited condensed consolidated financial statements included elsewhere in this prospectus for additional details regarding recent accounting pronouncements.
126
Table of Contents
Quantitative and Qualitative Disclosures about Market Risk
We are exposed to market risk in the ordinary course of our business. Market risk represents the risk of loss that may impact our financial position due to adverse changes in financial market prices and rates.
Inflation Risk
We do not believe that inflation has had a material effect on our business, financial condition, or results of operations, other than its impact on the general economy. Nonetheless, if our costs were to become subject to inflationary pressures, we might not be able to fully offset such higher costs through price increases. Our inability or failure to do so could harm our business, financial condition, and results of operations.
Interest Rate Risk and Market Risk
Our cash equivalents and marketable securities are subject to market risk due to changes in interest rates. Fixed rate securities may have their market value adversely affected due to a rise in interest rates, while floating rate securities may produce less income than expected if interest rates fall. As of March 31, 2022, a hypothetical 10% change in interest rates would not have had a material impact on the value of our cash and cash equivalents.
We are also subjected to interest rate exposure on interest rates on our debt. Interest rate risk is highly sensitive due to many factors, including domestic and foreign monetary and tax policies, U.S. and international economic factors and other factors beyond our control. The vast majority of our debt bears interest equal to the LIBOR or EURIBOR rates plus a margin. As of March 31, 2022, we had a total outstanding debt balance of $61.3 million, net of $0.5 million of deferred financing costs. Based on the amounts outstanding, a 100-basis point increase or decrease in market interest rates over a twelve-month period would not result in a material change to our interest expense due to our interest rate swap derivative financial instruments. Our interest rate swaps effectively fixed the interest rate on our debt. The swaps have a higher notional value than the outstanding debt, which effectively mitigates our exposure to variability in interest rates. Subsequent to March 31, 2022, we terminated all of our outstanding interest rate swap derivative financial instruments. As a result, any future changes in market interest rates will impact the interest expense related to our floating rate debt instruments.
Foreign Currency Exchange Rate Risk
Our reporting and functional currency is the U.S. dollar, and the functional currency of our foreign subsidiaries is their respective local currencies. Our consolidated results of operations and cash flows are therefore subject to fluctuations due to changes in foreign currency exchange rates and may be adversely affected in the future due to changes in foreign exchange rates. We conduct transactions denominated in foreign currencies including the EUR, RMB, GBP and JPY. The assets and liabilities of each of our foreign subsidiaries are translated into U.S. dollars at exchange rates in effect at each balance sheet date. Adjustments resulting from translating foreign functional currency financial statements into U.S. dollars are recorded as a separate component on the consolidated statements of comprehensive loss. Gains or losses due to transactions in foreign currencies are included in other income in our consolidated results of operations.
The volatility of exchange rates depends on many factors that we cannot forecast with reliable accuracy. We have experienced and will continue to experience fluctuations in foreign exchange gains and losses related to changes in foreign currency exchange rates. In the event our foreign currency denominated assets, liabilities, net sales, or expenses increase, our results of operations may be more
127
Table of Contents
greatly affected by fluctuations in the exchange rates of the currencies in which we do business. To date we have not engaged in the hedging of foreign currency transactions, although we may choose to do so in the future. A hypothetical 10% change in the relative value of the U.S. dollar to other currencies during any of the periods presented would not have had a material effect on our consolidated financial statements.
JOBS Act
We qualify as an “emerging growth company” as defined in Section 2(a) of the Securities Act, as modified by the JOBS Act. As an emerging growth company, we may take advantage of specified reduced disclosure and other requirements that are otherwise applicable, in general, to public companies that are not emerging growth companies. These provisions include:
| • | the option to present only two years of audited financial statements and only two years of related Management’s Discussion and Analysis of Financial Condition and Results of Operations in this prospectus; |
| • | not being required to comply with the auditor attestation requirements of Section 404 of the Sarbanes-Oxley Act of 2002; |
| • | reduced disclosure obligations regarding executive compensation in our periodic reports, proxy statements and registration statements; and |
| • | exemptions from the requirements of holding nonbinding, advisory stockholder votes on executive compensation or on any golden parachute payments not previously approved. |
We will remain an emerging growth company until the earliest to occur of: (i) the last day of the first fiscal year in which our annual gross revenue exceeds $1.07 billion; (ii) the date that we become a “large accelerated filer,” with at least $700.0 million of equity securities held by non-affiliates as of the end of the second quarter of that fiscal year; (iii) the date on which we have issued, in any three-year period, more than $1.0 billion in non-convertible debt securities; and (iv) the last day of the fiscal year ending after the fifth anniversary of the completion of this offering.
We have elected to take advantage of certain of the reduced disclosure obligations in the registration statement of which this prospectus is a part and may elect to take advantage of other reduced reporting requirements in future filings. As a result, the information that we provide may be different than the information you receive from other public companies in which you hold stock.
An emerging growth company can also take advantage of the extended transition period provided in Section 13(a) of the Exchange Act for complying with new or revised accounting standards. As such, an emerging growth company can delay the adoption of certain accounting standards until those standards would otherwise apply to private companies. We have elected to take advantage of this extended transition period and, as a result, our operating results and financial statements may not be comparable to the operating results and financial statements of companies who have adopted the new or revised accounting standards.
As a result of these elections, some investors may find our Class A common stock less attractive than they would have otherwise. The result may be a less active trading market for our Class A common stock, and the price of our Class A common stock may become more volatile.
128
Table of Contents
Our Purpose
We are a company that has been forged on, and has pushed the boundaries of, the credo of our founder, Henry Engelhard Steinway: “To build the best piano possible.” Since 1853, generation after generation, we have made and continue to make what we believe are the world’s finest musical instruments. With this expertise and heritage, we believe that we have created and sustained one of the best regarded luxury brands in the world. We strive to further our legacy by advancing the standards of modern musical instrument manufacturing with our enduring dedication to quality, artisanship, elegance, style and beauty.
Our masterfully crafted pianos are designed to meet the demands of a diverse range of music enthusiasts—from providing renowned concert pianists and pop culture icons, including Lang Lang, Yuja Wang and Billy Joel, an instrument to fully express their indelible artistry, to encouraging early-stage learners discovering the first joys of piano playing, to inspiring the most discerning listeners with the distinct musical experience of a Steinway Spirio piano in their own home, which we believe is indistinguishable from a live performance. Our ultimate goal is to foster and enrich the global musical community by continuing to provide the world’s finest pianos and musical instruments shaped by our unwavering commitment to innovation, improvement and technological preeminence.
Who We Are
We are a leading manufacturer of high-performance musical instruments, boasting a brand renowned worldwide. Steinway is one of the longest-lasting and most storied brands in the music industry and beyond.
Our legacy began in 1853 in New York City when German immigrant Henry Engelhard Steinway developed the first Steinway piano in a Manhattan loft on Varick Street. Over the next thirty years, Henry and his sons laid the foundation for modern grand piano building. They built their instruments one at a time, applying skills handed down from master to apprentice, generation after generation, and we have followed in their footsteps ever since.
Thereafter, our innovative designs, attention to detail and exacting quality have redefined and broken new ground in the market for ultra-premium pianos. With our 169-year history, we believe that we have been setting the standard for innovation in our industry for longer than most public companies have been in existence.
We produce a full line of grand and upright acoustic pianos at our manufacturing facilities in Astoria, New York; and Hamburg, Germany. We also offer exclusive, limited-edition pianos, as well as unique, fully customized models for the most discerning customers. We have mastered the end-to-end process that brings a Steinway piano to market, and we own and perfect each of the key components that complete our brand. At each step, our highly-trained craftsmen ensure that every Steinway piano meets our high standard of excellence.
In addition to our long history of craftsmanship, we continue to innovate and integrate state-of-the art technology into our timeless foundation. In 2015, we introduced the Steinway Spirio, which we believe is the world’s finest high-resolution player piano. A masterpiece of artistry and engineering, Spirio pianos, playable like any other Steinway piano, also play themselves, enabling consumers to enjoy recorded performances by renowned pianists in their own homes, with what we believe to be the same nuance, power and passion as a live performance. In 2019, we further advanced our technology
129
Table of Contents
and offerings by introducing Spirio | r, which enables recording and high-resolution editing in addition to playback capabilities. In 2021, we launched our Spiriocast software feature, which permits customers to instantly stream live performances, synched with video and audio, from one Spirio | r piano to others across the world.
The Spirio piano significantly expands our potential target market to include non-piano players and enhances our relevance to recreational music consumers, as well as amateur and professional musicians. Furthermore, Spirio pianos sell at a premium to our traditional Steinway piano models. Sales of our Spirio and Spirio | r pianos have grown to represent approximately 32% of our total Piano segment net sales for fiscal year 2021, increasing our average selling price and improving our gross profit margin as a result. In creating and continuously adding to our expansive Spirio library, we regularly engage with a wide range of artists to record new tracks, strengthening our connection to a diverse community of professional artists. Spirio strengthens our brand by appealing to luxury consumers and reinforcing our reputation for quality and innovation.
A deep connection to the artist community has been at the core of our identity since our founding. For decades, we have used our Steinway Artist program to cultivate special relationships with the best pianists from a wide array of genres. This program forms a celebrated community of approximately 1,900 of today’s most acclaimed pianists, including Martha Argerich, Ahmad Jamal, Billy Joel, Diana Krall, Charlie Puth and Yuja Wang. These and other musical greats consistently choose Steinway when performing on the biggest stages. In fact, approximately 97% of pianists chose a Steinway piano when performing with orchestras across the globe during the 2018–2019 concert season, which was the last full concert season prior to the date of this prospectus due to the COVID-19 pandemic. Each Steinway Artist is vetted through a highly selective process. To be considered for that process, they must independently own a Steinway piano; we do not provide a piano to our Steinway Artists in exchange for an endorsement. We believe the timeless quality and excellent performance of Steinway pianos are recognized and appreciated by artists across generations, geographies and cultures, with pianists in orchestras on every continent performing on Steinway pianos.
We also invest in building relationships with the next generation of artists through our All-Steinway school program. This program partners with over 220 institutions and schools across the globe to provide students and faculties with our high-quality pianos. By furnishing these institutions and schools exclusively with Steinway and Steinway-designed instruments, we enable our All-Steinway schools to offer premier music education on some of the finest piano models.
Our pianos are sold through 33 company-owned retail showrooms, strategically located across the world. This direct-to-consumer channel allows us to fully manage the luxury customer experience and our brand narrative. We also distribute our pianos through a global, expansive network of approximately 180 experienced dealers with intimate local market knowledge and close ties to local musical communities. Our comprehensive product portfolio allows us to serve as an exclusive supplier to many of our Steinway dealers. We seek to further optimize our distribution through ongoing retail showroom expansion in regions where we see opportunity for growth or improved performance. We continue to support dealer initiatives and implement unique distribution methods to reach smaller, previously untouched markets, including through our team of Educational Sales Managers that travel and sell direct to institutions and customers in territories not represented by a retail store or a dealer.
In addition to our ultra-premium piano offerings under our Steinway brand and our mid-range offerings under our Boston and Essex brands, we also sell musical instruments and accessories through our Band segment under our highly regarded Conn-Selmer umbrella of brands. For over 100 years, Conn-Selmer’s complete lines of brass, woodwind, percussion and string instruments, including Bach trumpets, C.G. Conn French horns, King trombones, Selmer saxophones, and Ludwig percussion instruments, have shaped the musical landscape through innovation and sophisticated
130
Table of Contents
musical performance. The C.G. Conn brand, with a legacy in music education, has been and continues to be one of the top choices for educators and marching band programs in the United States today. Most top orchestras and symphonies carry the sound of our Bach brass instruments. Ludwig, one of the world’s most recognized names in drums, is a leading fixture on the marching field and on rock-and-roll’s biggest stages. As such, our Conn-Selmer division caters to around 1,300 notable percussion, brass, and woodwind artists, including drummers such as Anderson Paak, Questlove and Alex Van Halen; saxophonist Kenny Garret; and trumpet players Sean Jones, Rashawn Ross and Michael Sachs.
We operate in two reporting segments, Piano (Steinway & Sons) and Band (Conn-Selmer). In fiscal year 2021, our Piano and Band segments generated net sales of $406.6 million and $131.7 million, respectively, up from $317.4 million and $98.4 million, respectively, in the prior fiscal year. In fiscal year 2021, our Piano and Band segments generated Adjusted EBITDA of $106.8 million and $10.7 million, respectively, up from $72.1 million and $4.9 million, respectively, in the prior fiscal year. Below is a breakdown of our consolidated net sales and Adjusted EBITDA by segment for fiscal year 2021.
| 2021 Consolidated Net Sales | 2021 Consolidated Adjusted EBITDA | |
|
|
For a reconciliation of Adjusted EBITDA to its most directly comparable GAAP financial measure, information about why we consider Adjusted EBITDA useful and a discussion of the material risks and limitations of this measure, please see “Management’s Discussion and Analysis of Financial Condition and Results of Operations—Non-GAAP Financial Measures.”
Our Piano segment primarily includes sales of pianos offered under the Steinway brand as well as our Boston and Essex brands. Boston and Essex pianos are designed and engineered using the Steinway experience, expertise, specifications, and patents to achieve optimal performance. Boston and Essex models are built in Asia to maximize manufacturing efficiencies, but benefit from Steinway & Sons’ quality control and oversight. Boston competes in the upper-middle market segment, while Essex participates in the middle market segment. Both provide a level of performance and quality that we believe is highly favorable to others competing in their respective price ranges, giving a wide range of consumers access to pianos with genuine world-class tone and responsiveness.
The Boston and Essex lines provide a broader range of consumers with an introduction into the Steinway & Sons family. Our Boston and Essex pianos come with the Steinway Promise—a trade-up program that varies across regions and channels but generally allows Boston and Essex pianos to be traded up for more expensive Steinway pianos, with a trade-in credit up to an amount equal to the original purchase price. This trade-in option allows our company to increase market share over time as our customers enter our community on lower-priced models, before trading up to our higher-priced models as they acquire wealth. With this family of products, we can offer our dealers a full line of our
131
Table of Contents
products at multiple price points, enabling us to replace lower priced product lines and to facilitate more exclusive arrangements with our dealers. This comprehensive suite of piano offerings has also allowed us to better penetrate schools and music learning centers and add to our list of All-Steinway Schools. Our Boston line in particular has been utilized by prominent institutions to build a strong foundation for a quality music education.
For fiscal years 2021 and 2020, approximately 69% and 67%, respectively, of net sales in the Piano segment were under the Steinway brand.
Our Band segment manufactures, markets and distributes a diverse portfolio of instruments and brands for student, amateur and professional use that have leading market shares in each of their musical instrument categories, including brass (trumpets, trombones, French horns), woodwinds (saxophones, flutes, clarinets), percussion (drums) and strings (violins, cellos, bass).
Through the Conn-Selmer family of brands, we offer a portfolio of individual brands that represent innovation, entrepreneurship and a focus on musical excellence. Emphasizing quality craftsmanship above all else, Conn-Selmer operates U.S. production facilities in Elkhart, Indiana; Eastlake, Ohio; and Monroe, North Carolina to create exceptional instruments.
Over 50% of Conn-Selmer sales in fiscal year 2021 were generated through our preferred dealer network to schools and families who participate in beginning music education programs. Of the remaining sales, many are used by students in marching bands, concert bands, orchestras, and other school-related performances. Our Conn-Selmer Division of Education was created to proactively engage with music students and educators and has become an industry leader in providing programs, services, and advocacy tailored to the growth and development of music education worldwide. Our educational team is committed to ensuring that every student and educator not only has access to a quality music education and support for their professional development, but also to the tools necessary to help them achieve their highest musical potential.
132
Table of Contents
Our business is global and aims to serve consumers wherever they are. As of December 31, 2021, we distributed our instruments in approximately 88 countries throughout the Americas, the APAC region and the EMEA region. Below is a geographic breakdown of our consolidated net sales for fiscal year 2021.
| 2021 Consolidated Net Sales | ||
| ||
We were acquired by John Paulson and certain affiliated entities in 2013, and under John Paulson’s stewardship, we have increased our commitment to quality while honoring our legacy, expanding our business, and strengthening our technological capabilities. As a custodian of Steinway, John Paulson has focused on investing in our business, including in technology, company-owned showrooms, our manufacturing processes and machinery, and in training our workforce to create a stronger team. We believe that these commitments have made us better equipped than ever before to bolster our reputation as one of the industry’s finest musical instrument manufacturers. Over the course of the last decade, we have strategically expanded the international scope of our business, launched our Spirio technology, earned 18 new patents, and improved manufacturing quality. The results of these initiatives are reflected in our growth over the past few years, during which time we have grown our APAC region net sales at a 16.1% CAGR from fiscal year 2016 to fiscal year 2021, released Steinway Spirio and Spirio | r player pianos and also the Spiriocast feature for Spirio | r models, built a team dedicated to limited-edition and bespoke pianos, and implemented manufacturing advances, such as the adoption of new machinery in our factories that raise our standards of precision and quality even higher than previously possible.
To push our boundaries and build on the strong foundation laid over a century ago, we operate with six primary objectives and guiding principles:
| • | Advance excellence in manufacturing and strive to consistently improve quality so that the newest Steinway remains the best Steinway. |
| • | Cultivate and nurture innovation, further developing the infrastructure and technological advancements paved by Spirio. |
| • | Continue to engage our customers directly through retail showroom expansion, thereby broadening our local presence and presenting a consistent luxury brand narrative and experience across all markets. |
| • | Continue to increase geographic penetration, aligning our business with the fastest-growing markets, such as China. |
| • | Leverage our pricing power and favorable luxury-market dynamics. |
| • | Reinforce our brand advantage through introducing a greater mix of special, limited-edition and bespoke products. |
133
Table of Contents
Our Industry
We operate within two distinct markets that partially overlap each other: the global personal luxury goods market and the global musical instruments market.
Global Personal Luxury Goods
Steinway competes in the fast-growing and highly attractive global personal luxury goods market. This market, which includes both hard and soft personal luxury goods, premium and luxury cars, is expected to grow from $945.8 billion in 2021 to $1,286.8 billion in 2026 globally, representing a 6.4% CAGR, according to Euromonitor estimates.*
The factors driving this growth include higher demand for experiential luxury, increased spending and influence of millennials, and the rise in discretionary spending in China. Historically, the global personal luxury goods market has experienced strong growth, with a 5.0% CAGR from 2016 to 2019 according to Euromonitor.
According to Euromonitor, the APAC region represented approximately 45% of the global personal luxury goods market in 2021, the largest share of any region. Between 2021 and 2026, the APAC region is also expected to be the best-performing region in the world, furthering its lead in the global luxury goods market. In China, the personal luxury goods market is expected to increase from $302.7 billion in 2021 to $448.7 billion in 2026, representing an 8.2% CAGR, according to Euromonitor estimates. We believe China’s outsized share of growth in the luxury category can afford us numerous tailwinds as we continue to expand our presence in the country.
According to The Wealth Report 2022, published by Knight Frank, the number of HNWIs in China (including Mainland China and Hong Kong), those with a net worth of over $1 million, reached approximately 10.0 million in aggregate in 2021, representing a CAGR of 15.1% from 2016 to 2021. Meanwhile, the number of UHNWIs in China, those with a net worth of over $30 million, has grown 145% from 2016 to 2021 and is expected to continue to grow by 41% from 2021 to 2026. From 2021 to 2026, it is expected that the number of HNWI and UHNWI together will grow from 69.8 million to 106.3 million, representing a CAGR of 9% and that by 2026 the number of HNWI and UHNWI in China will reach 18.1 million, representing a five year CAGR of 13%. While the United States remains home to the largest high-net-worth population, China has the second-largest high-net-worth population.
Global Musical Instruments
In addition to the global personal luxury goods market, we operate in the global musical instruments market, which is also benefiting from numerous secular tailwinds. These include the increasing global appreciation for music and its role across many aspects of life; the growing desire for at-home entertainment, with pianos in particular; and the growing consumer appetite for heirloom products with longstanding interest across generations. We believe Steinway’s products are inherently timeless—and we expect to be a consistent beneficiary of music’s robust and growing importance in daily life and pursuits.
According to Technavio, the global musical instruments market is expected to grow from $7 billion in 2020 to over $7.8 billion in 2025, representing a 2.2% CAGR. The global piano market is expected to reach approximately $2.7 billion by 2025, up from $2.5 billion in 2020. Of that total growth, the APAC region is expected to contribute the most incremental growth.
| * | Source: Euromonitor International Ltd., Luxury Goods 2022, y-o-y exchange rates, Retail Value RSP, Current Prices. Hard and soft luxury goods include apparel & footwear, eyewear, jewelry, leather goods, portable consumer electronics, timepieces, writing instruments & stationery, and beauty & personal care. |
134
Table of Contents
The piano market in China is the world’s largest, with an average of around 400,000 pianos being sold a year from 2017 to 2020, compared to an average of around 30,000 per year in the United States over the same period.
According to statistics published by the Chinese Musicians’ Association, approximately 30 million children take piano lessons in China, perhaps inspired by famous Chinese Steinway Artists including Lang Lang and Yuja Wang. Over 40,000 children participated in Steinway’s 2021 International Children & Youth Piano Competition in China. To further serve the growing population of developing pianists in China, the Juilliard School made one of the largest orders of pianos in Steinway history in 2019 for its first overseas campus in Tianjin, China.
The Chinese musical instrument market in general and the piano market in particular have benefited from continued government support for music and the arts.
| • | China’s 14th Five-Year Plan for the 2021–2025 period emphasizes the importance of cultural development. The Ministry of Culture and Tourism has issued guidelines to promote cultural development, building upon the cultural activities already growing in China. The Chinese government has invested heavily in opening new concert halls in recent years. In fact, the number of concert halls in China that own Steinway pianos has increased from 11 to 134 from 2012 to 2021. |
| • | The government is promoting the development of young talent in music and the arts. As stated by the Opinions on Comprehensively Strengthening and Improving School Aesthetic Education in the New Era (Opinion) published by the Chinese State Council in October 2020, the Ministry of Education seeks to introduce music and the arts as a compulsory examination subject nationwide as part of high school entrance examinations by 2022. Schools are also encouraged to develop a more structured curriculum for music and the arts. |
As China continues to promote classical music and music education, we expect increases in demand for musical instruments across multiple channels, including orchestras, educational institutions, concerts halls, and households.
The United States has also recently exhibited unique support for the arts in its education system through its $13.2 billion Elementary and Secondary School Emergency Relief funds. We believe that our piano brands and our Conn-Selmer band and orchestra brands are strongly positioned to benefit from these continued investments in music education.
Our Financial Performance
Since our acquisition by John Paulson and certain affiliated entities in 2013, we have been able to achieve consistently strong financial performance. We are proud of our robust growth, consistent profitability, and high cash-flow generation, which demonstrate our pricing power and optimized cost structure. While continuing to invest in innovation, we have also been able to reduce our debt from $311.6 million for the year ended December 31, 2016 to $50.9 million for the year ended December 31, 2021, while increasing cash and cash equivalents from $21.6 million to $43.7 million over the same period.
Our business demonstrated resilience through the COVID-19 pandemic. The first half of 2020 featured a prolonged closure of our Astoria, New York plant and significantly reduced traffic at Steinway showrooms across the globe. Despite the ongoing challenges of the pandemic, our artisans returned to work once they could do so safely and continued to craft exceptional pianos—as they have done for more than 165 years.
135
Table of Contents
Increased consumer investment in the home and a gradual return to normalcy helped offset COVID-induced headwinds and spurred strong performance in the second half of 2020. The Company rebounded well in 2021 and has exhibited significant growth relative to 2019 levels.
From fiscal year 2016 to fiscal year 2021, we realized the following results on a consolidated basis:
| • | Increased net sales from $386 million to $538 million, representing a CAGR of 6.9% |
| • | Increased Piano segment net sales from $245 million to $407 million, representing a CAGR of 10.7% |
| • | Increased net sales in the Piano segment under the Steinway brand from $154 million to $280 million, representing a CAGR of 12.6% |
| • | Increased Piano segment net sales in the APAC region from $71 million to $150 million, representing a CAGR of 16.1% |
| • | Increased Piano segment Adjusted EBITDA from $33 million to $107 million, representing a CAGR of 26.9% |
| • | Increased gross profit from $137 million to $225 million, representing a CAGR of 10.4% |
| • | Increased Piano segment gross profit from $100 million to $196 million, representing a CAGR of 14.5% |
| • | Increased net income from $3 million to $59 million, representing a CAGR of 83.9% |
| • | Increased Adjusted EBITDA from $50 million to $117 million, representing a CAGR of 18.7% |
| • | Increased Adjusted Net Income from $14 million to $71 million, representing a CAGR of 38.5% |
| • | Increased Net Income Margin from 0.7% to 11.0% |
| • | Increased Adjusted EBITDA Margin from 12.9% to 21.8% |
| • | Increased Adjusted Net Income Margin from 3.6% to 13.3% |
| |
136
Table of Contents
|
| |
|
| |
| 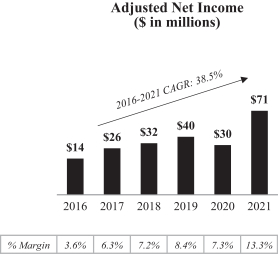 |
137
Table of Contents
For a reconciliation of Adjusted EBITDA and Adjusted Net Income to their most directly comparable GAAP financial measure, information about why we consider Adjusted EBITDA and Adjusted Net Income useful and a discussion of the material risks and limitations of these measures, please see “Prospectus Summary—Summary Historical Consolidated Financial Data—Non-GAAP Financial Measures” and “Management’s Discussion and Analysis of Financial Condition and Results of Operations—Non-GAAP Financial Measures.”
Our Strengths
We built a deep competitive moat through our more than century-long track record of creating what we believe to be the world’s finest instruments and through the power of our brand.
For over 165 years, we believe our innovation, commitment to detail and extraordinary quality have established our brand as the standard by which all pianos are measured. We believe our long record of leadership across musical instrument categories places our company alongside some of the most admired American companies, with a luxury brand that transcends its functionality.
The fact that our industry’s most revered artists and musical institutions consistently choose Steinway fortifies our high standing within the music industry. Many musical greats have endorsed the quality of our instruments and personally use our instruments on the brightest stages—classical legends such as Sergei Rachmaninoff and Arthur Rubinstein; some of the biggest classical and pop icons of today, including Lang Lang and Billy Joel; and jazz legends such as Ahmad Jamal and McCoy Tyner all chose Steinway time and again as the desired instrument to express their art. We also lead piano demand among the world’s largest concert halls, performance venues and educational and cultural institutions.
The prominence of our instruments among the most respected musical authorities informs and influences the purchasing decisions of consumers across the world. When combined with the quality and beauty of our instruments, this reputation allows us to enjoy considerable pricing power while also increasing sales volumes. Between fiscal years 2016 and 2021, we increased sales volumes of our Steinway pianos by 22.4%, or at a CAGR of 4.1%, while the ASP generated by our Steinway pianos increased by 48.0%, or at a CAGR of 8.2%.
Our reach is global. Our instruments are desired and sold throughout the world, in approximately 88 countries. Our brands are well-known and universal, with over 800 trademarks registered in countries across the globe. With this reach, our reputation as a preeminent piano manufacturer has allowed us to gain, based on market data and internal estimates, approximately 80% of what we believe is the ultra-premium piano market, measured in terms of production volumes.
Our top-tier Steinway brand provides a professional-level experience; however we also maintain product lines that allow us to serve an array of consumers, including our Boston and Essex pianos which extend our high-quality piano offerings across more affordable price points. The Piano segment is supplemented by our Band segment where, among others, the Conn, Bach, Selmer and Ludwig brands all lead their respective categories and serve a diverse group of educational institutions and instrument consumers.
We are aligned with favorable long-term trends.
There are a number of socioeconomic trends that serve as tailwinds for us, including:
| • | Outsized growth in the population of HNWI and UHNWI, particularly in China. The global population of HNWI and UHNWI has grown at a 10.1% and 11.9% CAGR, respectively, over the five years ended December 31, 2021. In China, the population of HNWI and UHNWI has grown at a 15.1% and 19.6% CAGR respectively, over the same period, relative to total Chinese population growth of 0.3%. |
138
Table of Contents
| • | Increasing Chinese investment in music education, with music and the arts expected to be a compulsory examination subject nationwide by 2022. |
| • | Unprecedented strength in the housing market, with U.S. housing starts up approximately 160% over the 10 years from 2011 to 2021, representing a CAGR of 10.1% based on U.S. Census data. Furthermore, housing sales have increased approximately 40% from 2011 to 2021 and just over 10% in the five years ended December 31, 2021, according to IHS Markit data. Median prices for new homes are expected to grow at a CAGR of 4% from the final quarter of 2021 to the final quarter of 2026, which is a function of demand. We typically expect demand for our products to track increased activity in the housing market, as consumers are more likely to buy Steinway pianos as they purchase new and higher-end homes. |
| • | A greater consumer focus globally on the home and in-home activities following the onset of the COVID-19 pandemic. |
| • | A growing understanding of the cognitive and developmental benefits associated with music education. |
| • | Record $13.2 billion in U.S. government investment in education with access for music education through Elementary and Secondary School Emergency Relief (ESSER) funds, signed into law in March 2020. |
While we expect these favorable trends to continue, any ebbing or reversal of one or more of these trends could adversely affect the growth of our business. See “Risk Factors—Risks Related to our Business—Unfavorable economic conditions and changes in consumer preferences could adversely affect our business.”
Our manufacturing excellence and commitment to high-performance quality lies at the core of our identity.
For more than 165 years, we have played a key role in the development of the modern grand piano and due to our commitment to sustained advances in manufacturing—as evidenced by our ever-growing patent portfolio—we have remained a leading manufacturer of ultra-premium concert pianos ever since. We manufacture each of our Steinway pianos, one by one, in our historic factories in Astoria, New York; and Hamburg, Germany, through a precise and meticulous artisan process.
These factories and many of our pioneering techniques that we still currently employ date back to the 19th century and have shaped and further elevated the high-end piano manufacturing standards of today. Our integration of time-tested, old-world methods with state-of-the-art technology and investments in advanced machinery coalesce in a production process that requires six months to several years and dozens of artisans to create what we believe is the world’s finest piano.
139
Table of Contents
The quality of our materials and processes results in pianos that can be enjoyed for generations, as evidenced by what has historically been our primary competition, legacy Steinway pianos.
Our company-owned retail showrooms and deep relationships with experienced dealers create a powerful, high-touch distribution model.
We have established company-owned retail showrooms coast-to-coast in the United States in wealthy metro areas from New York to Beverly Hills, Chicago, San Francisco and Miami; across Europe with locations in cultural hubs including London, Paris, Vienna and throughout Germany; and in key APAC locations including Tokyo and Shanghai and in Beijing, where we launched our APAC flagship store in 2017. Currently, we own 16 retail showrooms in the United States, 11 in Europe and six in the Asia Pacific region. Our 33 company-owned showrooms heighten our brand awareness and allow us to build meaningful relationships directly with our valued customers.
140
Table of Contents
Our platform of company-owned retail locations has bolstered our sales from retail operations, which have increased by a CAGR of 16.1% between fiscal years 2016 and 2021, reaching 39.4% of our total Piano segment net sales for fiscal year 2021. The outsized growth of this channel has ushered in higher profitability, as pianos sold through direct channels capture a significantly larger share of margin compared to sales through traditional wholesale channels, with the added benefit that we build stronger, longer-lasting ties directly with our customers.
141
Table of Contents
In addition to our company-owned retail showrooms, we depend on a network of independent dealers and distributors to distribute a majority of our pianos and all of our band instruments. We believe that we have a robust network of dealers and distributors with deep knowledge of the markets in which they operate. However, there is no assurance that they will continue to generate sales at historical levels. See “Risk Factors—Risks Related to Our Reliance on Third Parties—We generate most of our sales through independent dealers and distributors.” The comprehensive family of brands we offer allows us to serve as the exclusive supplier to many of our piano dealers, and our dealers are also awarded exclusive territories to promote robust marketing and sales programs, promotional expenditures and loyalty. We also bolster our dealers through the provision of marketing and sales programs and materials, inventory management support, sales training, customer service and technical assistance.
| Note: | Showroom locations, Steinway units and piano net sales data are presented for the year ended December 31, 2021. |
Finally, we are finding new and relevant ways to sell to smaller, previously unrepresented territories. We have created a team of Educational Sales Managers that travel and sell direct to institutions and customers in territories not represented by a retail store or a dealer.
Within our Band segment, our Conn-Selmer Department of Education maintains close connections to educational institutions, often the ultimate customers of our band and orchestral instruments. Conn-Selmer is an industry leader in providing support and advocacy tools specifically tailored to music education through our educational outreach team. Through our coast-to-coast School Partnership program, Conn-Selmer maintains a specialized team of educational support managers who provide personalized service and support, customized lease and purchase programs, as well as artist and clinician funding. Conn-Selmer also provides partnering schools with free access to our instrument inventory management system, which helps customers manage their long-term supply needs and track inventory age and condition. These initiatives serve to deepen our institutional relationships and supplement demand for our instruments.
Our vertically-integrated supply chain affords numerous operational advantages.
Our commitment to quality extends throughout our entire supply chain. Historically, we have partnered with some of the most respected suppliers in the industry. To streamline our process, better control quality of production and ensure continuity in vendor business, at opportune times, we have strategically acquired significant key parts suppliers: Kluge GmbH, the largest piano keys manufacturer in Europe; O.S. Kelly, the largest piano plate manufacturer in the United States; and most recently in 2019, Louis Renner, which we believe is one of the world’s finest and most widely respected producers of piano action parts.
By integrating these suppliers into our controlled manufacturing process, we can ensure that Steinway-caliber quality is preserved and more seamlessly improved upon across our key components. In addition, with these acquisitions, we are now the primary supplier of spare parts for used Steinway pianos, giving us the opportunity to reach a broader array of customers through the sale, rebuilding and restoration of certified pianos and set the standards for quality in the resale market.
142
Table of Contents
We have a long history of innovation and have developed what we believe to be the premier technology in the piano industry.
We continue to innovate, adding 18 new patents to our portfolio in the last decade to reach a current total of over 150 patents over the course of our history. The Steinway pianos we produce today are the best and most advanced pianos we have ever produced.
The introduction of the Steinway Spirio in 2015 was a culmination of years of investment, research and development and technological expertise. Spirio’s high resolution playback system uses proprietary software to measure hammer velocity (up to 1,020 dynamic levels at a rate of up to 800 samples per second) and proportional pedaling – for both the damper pedal and soft pedal (up to 256 pedal positions at a rate of up to 100 samples per second). We consider the Spirio technology to be a masterpiece of artistry and engineering, delighting listeners with recorded performances of artists, with what we believe to be the same level of intimacy and nuance as a live performance. We further enhanced Spirio in 2019 with the introduction of Spirio | r, which enables recording, high-resolution editing, and playback, providing educational institutions and professional artists with new tools and opportunities and to seamlessly connect and integrate with multiple musical environments. In 2021 we released our latest Spirio feature, Spiriocast, which allows for performances to be streamed live, in sync with video and audio, from one Spirio | r piano to others anywhere in the world.
Our Spirio technology provides access to our large and diverse Spirio music library, which includes performances recorded exclusively for Spirio and produced by us, offering performances from an incredible roster of hundreds of Steinway Artists. A collection of these recorded works is also synched with video for an even more engaging and unique performance at home. In addition, we pioneered technology that allows Spirio pianos to showcase historical performances, synched with video, by Steinway Immortals including Glenn Gould, Duke Ellington and Vladimir Horowitz. Each month, the Spirio Spotlight showcases all new content—music, videos and curated playlists—which is automatically downloaded to every Spirio piano, allowing us to drive value for and deepen our connection to our customers.
These innovations fortify our reputation as an industry leader in musical instrument manufacturing and strengthen our offerings relative to our competition, including legacy Steinway pianos. Spirio has been a key driver of our growth, comprising approximately half of Steinway piano sales in 2021. With the evolution of our Spirio technology, we have built an experienced, high-tech, cutting-edge Music and Technology team that we continue to leverage for future opportunities, technological advancements, and product offerings, always striving to create new avenues to grow our brands and product portfolio. Our recent investments in innovation have dramatically expanded our target audience, increased our relevance to consumers and artists, and entrenched our leading competitive position in the piano market.
143
Table of Contents
We are the clear brand of choice among the professional community.
The Steinway piano was the instrument of choice for approximately 97% of concert pianists when performing with orchestras across the globe during the 2018–2019 concert season, none of whom are compensated to use or endorse Steinway. These artists, many of whom perform at the pinnacle of the music industry, influence consumption trends across our customer base. For decades, we have cultivated relationships with the most talented pianists from nearly every genre, including Jon Batiste, Billy Joel, Lang Lang and Regina Spektor.
We continue to source and grow these relationships through our Steinway Artists program. This program encompasses all genres of music and includes renowned musicians such as Martha Argerich, Ahmad Jamal, Diana Krall, Charlie Puth and Yuja Wang. We select our Steinway Artists through a rigorous application process that can last up to a year, requires applicants to already own a Steinway piano and have a recommendation from an existing Steinway Artist or a Steinway & Sons dealer. For our Steinway Artists, we have a concert and artist bank of Steinway pianos, many of which are permanently located at leading concert venues. We also transport our pianos to any location where a Steinway Artist is performing, ranging from the biggest music festivals to the hardest-to-reach locations, including an iceberg in the Arctic Ocean. These programs strengthen our relationships and standing with the professional community and also allow us to constantly solicit feedback from the most qualified sources: top concert pianists.
Leading educational institutions also choose Steinway, and we maintain relationships with nearly all of the top music schools across the world—which we believe cements our position as the world’s
144
Table of Contents
premier piano manufacturer and instills young artists globally with a devotion to Steinway pianos at the onset of their careers. Our All-Steinway schools provide pianos that inspire students to realize their artistic talents and best prepare them to compete at the highest level in the professional world. In addition, we maintain a dedicated institutional sales team that provides a suite of customized resources to colleges, universities and conservatories, including inventory analysis tools, fundraising programs, lease-to-own options, factory seminars and technical service guidelines.
We are proud of our strong market share among professionals and institutions, and believe this validates our meticulous artisan process and the quality products we produce. This endorsement by the professional and institutional community informs and drives consumer demand of individuals searching for high quality pianos for the home.
We have an experienced management team and shareholder group committed to serving as stewards of our brands.
Our management team, led by our Chief Executive Officer, Benjamin Steiner, has extensive industry experience and global expertise and is committed to preserving and further expanding the legacy of our brands. The management team represents a broad foundation of experiences spanning expertise in sales, marketing, manufacturing, technology and innovation and strives to conserve a deep continuity with Steinway’s rich heritage. In addition, our Americas, EMEA and APAC regional leaders have intimate local knowledge of their respective geographies, allowing us to navigate the nuances of the piano market across all of our operations.
Our Chief Executive Officer, Mr. Steiner, led the investment by John Paulson and certain affiliated entities in 2013 and has been associated with our company ever since, joining the Steinway team in 2016 and subsequently being appointed as Chief Executive Officer in August 2021. During his years with our company, Mr. Steiner has connected John Paulson’s vision with our management team’s industry and institutional knowledge, strengthening our business through operational and digital innovation while enhancing our stature within the music industry.
The talent and industry expertise of the members of our management team make our company well positioned to realize its growth potential. Our President of Steinway Asia Pacific, Wei Wei, brings a deep knowledge of the region and marketing expertise from her past experience as Director of Marketing and Sales to her current position overseeing this particularly fast-growing region. Eric Feidner serves as our Chief Technology and Innovation Officer managing the teams responsible for music technology in product development. With his accomplished background in technology, music and e-commerce, having previously founded ArkivMusic and served in executive positions at start-ups N2K, Inc. and Winstar Communications, Eric Feidner is expected to help expand the market for Steinway pianos. Our Chief Financial Officer, Maia Moutopoulos, also brings years of expertise to our management team. Before joining Steinway’s corporate finance team in 2014, Maia Moutopoulos served for eight years as the Accounting Manager at Steinway Inc., our Americas piano division, bringing an intimate knowledge of the company’s financial structure to her role.
Furthermore, John Paulson, founder of Paulson & Co., is one of the most prominent names in the financial industry. John Paulson’s reputation and knowledge—both operationally and financially—have proven to be key assets for Steinway and our people. John Paulson’s primary goal has been to ensure the long-term success of our business and the continued preeminence of the Steinway brand, and as our controlling stockholders, John Paulson and certain affiliated entities play a central role in creating our strategic vision and setting our long-term trajectory. As testament to this commitment, one of the first initiatives undertaken by John Paulson post-acquisition was to fortify our technological capabilities with significant investment in music technology, resulting in the successful launch of the Steinway Spirio piano, and our total capital expenditures have more than tripled since 2013. After this offering,
145
Table of Contents
John Paulson and certain affiliated entities will hold a significant portion of our common stock, including all of our Class B common stock, will control the direction of our business, and so long as they do so, will prevent you and other stockholders from influencing significant decisions of our business.
Our Growth Strategies
Innovate in technology, including through Spirio.
We believe our Steinway Spirio high-resolution player pianos are revolutionary for our industry and we have consistently advanced the technology since its original debut in 2015. We built upon our initial launch of Spirio with the introduction of Spirio | r in 2019, which enabled recording, high-resolution editing and playback capabilities. In 2021, we released a new software feature, Spiriocast, which allows instant streaming of live performances, perfectly in sync with audio and video, from one Spirio | r piano to others around the world. Our Spirio instruments play back the performances of renowned concert pianists, record and replay a consumer’s own performances, and also allow for high-resolution editing of such recordings. Our Spirio music library includes thousands of exclusive performances by hundreds of artists, many of which are synched with video, all accessed with the touch of an iPad and enjoyed in a consumer’s own home. Our Spirio music library is expanded monthly and automatically updated, increasing consumer value over time while also deepening our connection to our consumers.
With this evolution, enabled through Spirio technology, we believe the Steinway piano has been recast—not only as the preeminent high-performance piano, but also as a unique luxury entertainment system for the home. Our target market has expanded significantly with this development to now include recreational music lovers who may not play the piano but can nonetheless enjoy a moving musical experience at home. In fact, 67% of our Spirio customers from 2015 to 2021 reported that they are non-piano players. We have also increased our brand’s relevance to customers and artists, differentiating our product from older Steinway models that may have been considered by customers on the used market.
We have seen significant demand for our Steinway Spirio player pianos; sales of our Spirio and Spirio | r pianos grew at a CAGR of over 30% between fiscal years 2016 and 2021 and represented approximately 32% of Piano segment net sales in fiscal year 2021. We believe there is still significant room for growth in Steinway Spirio sales. Our Spirio player pianos sell at a premium to other Steinway models, leading to increased net sales and profit per unit sold.
We continue to advance the depth and breadth of our technology, with each Spirio generation continually improving on the last. In addition, the investments we have made in our technical capabilities have allowed our company to build an infrastructure of technological expertise, laying the foundation for further innovation across our instrument portfolio and potentially in adjacent markets.
Our Conn-Selmer business also continues to invest in digital technology to strengthen our relationships with music educators and students. Our recently acquired MusicProfessor digital lesson platform gives music educators a suite of teaching aids for in person, hybrid, and remote learning as well as a pedagogically-driven experience for new players without formal guidance.
Expand our company-owned retail locations and improve distribution.
We are driving top-line growth by building out our company-owned retail showroom presence in strategic high-growth metropolitan areas, providing the opportunity to cultivate deeper and more durable relationships directly with our end customers and to strengthen our ability to manage our luxury brand image. In addition, increasing sales through our direct outlets allows us to realize a larger share of margin compared to sales through wholesale channels.
146
Table of Contents
To capitalize on this higher profit opportunity, we have improved many of our existing direct outlets and opened new locations, which feature high quality buildouts, curated merchandise and knowledgeable and effective sales employees. We have opened or renovated 26 of our 33 retail showrooms since 2013. These retail stores are strategically located across the United States, including locations in New York, Beverly Hills, Chicago, San Francisco and Miami; in cultural hubs in Europe such as London, Paris, Berlin and Vienna; and also in key APAC metros that include Shanghai, Beijing, Xi’an and Tokyo.
These initiatives have increased the percentage of sales that come from our retail operations over time, representing approximately 39.4% of all Piano segment sales in fiscal year 2021. We believe that continuing to expand our network of retail showrooms will enable us to increase the demand for our pianos, while also improving our margins, strengthening customer relationships and expanding our customer reach.
Wholesale distribution remains our largest channel by volume of instruments. Many of our dealers have been in the business for almost as long as we have, and we always encourage exclusive relationships with us. They have intimate knowledge of their local markets and deep connections within their musical communities. We work with our dealers to further elevate their operations, including by providing retail design templates, encouraging location optimization, offering enhanced sales training, providing promotional materials and sales leads, and arranging ongoing technical support. These initiatives fortify our relationships with our dealers and also ensure a Steinway—level customer experience across our network. In addition, we continue to evaluate underperforming territories for further potential retail expansion.
Finally, we have seen successful sales results with our recently launched Steinway Educational Sales Manager program, which sends Steinway-trained sales managers to institutions in territories that are not represented by a dealer or a company-owned retail store. We continue to consider and implement new methods to reach underpenetrated markets.
Expand in China, a vast and rapidly growing market for our products.
China represents a unique market for Steinway due to two primary cultural and structural factors: a deep-rooted reverence for classical music, specifically piano music, and a sizeable and rapidly expanding middle and upper class with an appetite for luxury Western products. China is the largest global market for pianos and has approximately 40 million practicing pianists, roughly seven times the approximately six million practicing pianists in the United States. Currently there are approximately 30 million children in China taking piano lessons, compared to less than 10 million in the rest of the world, suggesting that the majority of children playing the piano globally are in China. Initiatives pursued by the Chinese central authorities to promote traditional forms of childhood recreation further bolster these organic dynamics, which we expect to provide further tailwinds to our business in the region.
In addition to these favorable trends, the Steinway brand is revered in China, where all of the 11 national conservatories use Steinway pianos, with four such conservatories serving as All-Steinway schools. We have taken steps to continue building our brand resonance in the region by actively partnering with celebrity Chinese concert pianists, such as Lang Lang, opening company-owned retail showrooms in strategic Chinese metro areas, promoting a full and diverse sales and marketing calendar nationwide, including, on average, over 215 events at each of our retail showrooms annually, and adding new tracks to our Spirio library that cater to the Chinese consumer.
Despite the prevalence of piano playing in China and our brand strength in the region, we have historically been underpenetrated in the country, selling approximately half as many Steinway grand
147
Table of Contents
pianos in China as in the U.S. market. However, as China continues to develop and accumulate wealth, we will seek to capture the growing demand for ultra-premium pianos by private customers. Over the last 20 years, we have transformed our business in China to sell more pianos to private customers rather than institutions. For example, over 90% of Steinway grand pianos sold in China in fiscal year 2001 were to institutional customers, compared to approximately 10% in fiscal year 2021. The Wealth Report 2022, published by Knight Frank, forecasts the number of UHNWI in China to grow by 41% over the five years from 2021 to 2026 while the combined population of UHNWI and HNWI is expected to reach 18.1 million, representing the second-largest wealth market globally. Our and third-party forecasts of growth in China are based on a number of assumptions, and should be read in conjunction with “Risk Factors—Risks Related to Our Business—Our estimates of market opportunity and forecasts of market growth, including in China, may prove to be inaccurate and there is no guarantee that demand for our products will grow as expected, or that we will be able to grow our business at similar rates, if at all.”
We have begun to see these dynamics play out as we have grown our net sales in China at a 20.4% CAGR from $46.0 million in fiscal year 2016 to $116.5 million in fiscal year 2021, and our Piano segment net sales in the APAC region from $71.2 million to $149.9 million, representing a CAGR of 16.1%, over the same period.
148
Table of Contents
Grow our average net sales per unit by expanding our special, limited-edition and bespoke instrument business.
The investments we have made in our manufacturing facilities have made our factories nimbler and more efficient, allowing us to increase our range of SKUs. We have built a team dedicated to creating new and exceptional design concepts, sourcing unique luxury materials and collaborating with specialty artisans to produce the most exquisite Steinway pianos. We have a long legacy of producing custom pianos, and with our advances in manufacturing capability and our investment in the right team, we are now able to produce a significantly larger number and spectacularly varied array of custom models. These include our Bespoke and Art Case custom Steinway pianos, our limited-edition Steinway pianos, our Crown Jewel Steinway collection of exotic wood veneers, and our special collections. These products not only increase the selection offered to our most discerning customers, but also allow us to drive meaningful increases in average selling price.
We believe we can further increase our average net sales per unit through greater customer adoption of our special instruments, including by: (1) continuing to expand our range of special and custom instruments; (2) investing in our manufacturing capabilities to increase capacity and decrease lead times for these instruments; (3) honing our marketing efforts for such instruments; and (4) capitalizing on the growing population of UHNWI, particularly in China. Our manufacturing advances to date have allowed us to increase the percentage of special pianos produced as part of total Steinway grand pianos manufactured at our Hamburg factory, which supplies our growing business in China, from 6% to 11% between fiscal years 2016 and 2021.
Our Band segment has also made strides in building demand for premium instruments offered within our Conn-Selmer family of brands. We have launched over 120 new or improved products since 2020, including our re-imagination of the most coveted line of trumpets on the market, the Bach 170, 180, and 190 series and the release of new Ludwig hardware to expand our growing Ludwig acoustic drum market. Alongside our Artist Select program, a celebration of our best horns which are hand-selected by our master artists, we have recently launched ConnSonic—a proprietary suite of processes for optimizing musical instrument acoustics. We believe instruments created using ConnSonic feature greater depth and efficiency of tone production than conventional instruments.
Our Segments and Brands
Our company is a global manufacturer and distributor of world-class pianos and band instruments. We operate our business in two segments: Piano and Band. In fiscal year 2021 and the three months ended March 31, 2022, our Piano segment contributed approximately 75.5% and 70.7%, respectively, of our total consolidated net sales and our Band segment contributed 24.5% and 29.3%, respectively, of our consolidated total net sales.
Piano Segment
We sell our pianos under our Piano segment, Steinway & Sons, which includes our Steinway, Boston and Essex brands. Select Steinway models also feature our Steinway Spirio technology, offered through both our Spirio and Spirio | r pianos. Through these brands, we provide a comprehensive offering of what we believe are the world’s finest pianos at three distinct price points.
Steinway
For more than 165 years, our innovative designs and superior craftsmanship have established our pianos as what we believe are the world’s finest pianos and Steinway as a luxury brand. At retail, the price of our Steinway grand pianos ranges from approximately $60,000 to approximately $340,000. Our special, limited-edition and bespoke pianos garner significantly higher selling prices, with our
149
Table of Contents
Frank Pollaro-designed Fibonacci piano selling for $2.4 million in 2016. Our Steinway pianos are available in the following grand piano models (from largest to smallest):
| • | Our Model D Concert Grand, our largest grand piano, is the pinnacle of concert grands and the overwhelming choice of concert pianists and educational and cultural institutions throughout the world; |
| • | Our Model B Classic Grand is designed for spacious homes, smaller recital halls, auditoriums, and broadcasting, recording or professional studios; |
| • | Our Model A Salon Grand was first designed by C.F. Theodore Steinway in 1878 and reintroduced in 2005 due to popular demand. It is known for delivering a grand sound in a medium-sized piano; |
| • | Our Model O Living Room Grand, the largest of our “small grands” offers remarkable depth and resonance while requiring less space than full-sized grands; |
| • | Our Model M Medium Grand is a grand piano with a full tone, yet small enough to fit in nearly any home or apartment; and |
| • | Our Model S Baby Grand is a small grand piano suitable for the home or apartment where space is more limited. |
We also offer a Steinway Model K Professional Upright piano, which is made in the same factory as our grand pianos, using the same materials, techniques, conditioning processes and artisans. Introduced in 1903, our Steinway upright piano features a soundboard larger in area than many grand pianos produced by other manufacturers for a larger, more resonant tone. At retail, the price of our Steinway Model K Professional Upright ranges from approximately $40,000 to approximately $70,000.
In 2015, we introduced our high-resolution player piano, the Steinway Spirio. A piece of artistry and engineering, Steinway Spirio pianos, playable like any other Steinway piano, also play themselves. We continue to advance our Spirio technology, releasing the Spirio | r piano in 2019, which offers recording and playback capabilities, followed by the Spiriocast software in 2021, which offers new live streaming technology. Our Steinway Spirio pianos significantly expand our customer base to include non-piano players and music enthusiasts of all kinds.
In addition to our standard portfolio of piano offerings, we also manufacture custom pianos to serve the demand of ultra-high end customers. Our Bespoke, Art Case and Crown Jewel Steinway collections employ innovative design concepts, unique luxury materials and specialty artist collaborations to create one-of-a-kind instruments. These products allow us to serve a broader customer base and also meaningfully increase the average selling price within our Piano segment. To capitalize on this opportunity, we have equipped our factories to produce significantly larger volumes and more variations of custom pianos.
150
Table of Contents

Our Steinway customers include individual households and professional artists, with Steinway representing the brand of choice for approximately 97% of concert pianists when performing with orchestras across the globe during the 2018-2019 season, which was the last full concert season prior to the date of this prospectus due to the COVID-19 pandemic. The relationships we maintain with concert pianists are a defining trait of our brand—and we actively build and strengthen these ties through our Steinway Artist program. This program forms a community of over 1,900 premier pianists from every genre and includes such acclaimed artists as Martha Argerich, Ahmad Jamal, Billy Joel, Diana Krall, Charlie Puth and Yuja Wang. Our Steinway Artists are selected through a rigorous application process which requires every applicant to independently own a Steinway piano; we do not provide a piano to our Steinway Artists in exchange for an endorsement. We believe this program serves to cement our artist relationships while deepening our credibility among leisure piano consumers.
In addition, we sell used and restored Steinway pianos and we recently introduced a certified pre-owned program for Steinway pianos. Due to both the potential savings associated with buying a used instrument and the durability of the Steinway piano, a relatively large market exists for used Steinway instruments. We have developed the infrastructure to sell certified pre-owned Steinway pianos directly to our customers. Our certified pre-owned business has two distinct advantages relative to other resellers: we are able to certify that the Steinway piano has undergone a rigorous 74-point quality assessment to ensure authenticity, condition and performance and that any repair or replacement is done with 100% genuine Steinway parts, establishing peace of mind; and we offer a three-year limited warranty covering any defects in material or workmanship.
Boston
In 1992, we introduced the Boston piano to provide our dealers with quality pianos that retail at a more attainable price point than our Steinway models. We offer five models of grand pianos and five models of upright pianos under our Boston brand. Our performance edition Boston pianos are geared towards pianists and institutions, and include many of the unique design specifications developed by our Steinway engineers, such as the Steinway-patented, vertically laminated maple bridge that yields
151
Table of Contents
Boston’s characteristic richer, fuller tone. We also offer the Boston upright models, which are designed for those customers who appreciate the quality of our pianos but desire a lower price point and footprint. We exercised great care in developing and engineering our Boston pianos, and have patented three specific components of the Boston piano design. We believe our Boston grand and upright pianos achieve a superior playing experience at a highly competitive price level. At retail, the price of our Boston grand pianos ranges from approximately $20,000 to approximately $60,000. The price of our Boston uprights at retail ranges from approximately $10,000 to approximately $20,000.
Essex
We believe that beautiful piano styles and finishes can and should be possible in every price range, and in 2001 we introduced the Essex line of pianos, priced below our Boston line. At retail, the price of our Essex grand pianos ranges from approximately $10,000 to approximately $20,000. The price of our Essex uprights at retail ranges from approximately $6,000 to approximately $10,000.
Our Essex brand includes three grand pianos, ranging in various sizes. We offer our largest assortment of upright pianos under the Essex brand umbrella, with eleven upright piano models in total. Our Essex pianos are also based on exclusive Steinway-patented design specifications and feature a special wide-tail design that enriches their sound, enabling the musician to play with maximum expression and control.
Neither our Boston nor Essex pianos are available with our Steinway Spirio technology, but all Boston and Essex pianos are sold with the Steinway Promise: a trade-up program that varies across regions and channels but generally allows Boston and Essex pianos to be traded up for more expensive Steinway pianos, with a trade-in credit up to an amount equal to the original purchase price. This is particularly attractive to parents of young children—who may want to trade up to a Steinway as their child progresses in their piano studies and ability.
Our Essex customers include individual households and professional artists that are typically earlier in their careers than our Steinway concert artists. Both our Boston and Essex pianos are also a popular choice for schools, teaching studios and students.
Band Segment
Through our Band segment, we sell musical instruments and accessories under highly regarded brand names widely recognized throughout our industry. In fiscal year 2021 and the three months ended March 31, 2022, the Band segment represented approximately 24.5% and 29.3%, respectively, of total net sales. These brands, consolidated under the Conn-Selmer umbrella, include:
| • | Bach trombones, trumpets, cornets and flugelhorns; |
| • | C.G. Conn flugelhorns, French horns, trombones and tubas; |
| • | Glaesel string instruments (i.e., cellos, double bass, violas, and violins); |
| • | Holton baritones, euphoniums, French horns and tubas; |
| • | King band and marching brass instruments (i.e., sousaphones, trombones, trumpets and tubas); |
| • | Leblanc clarinets; |
| • | Ludwig and Ludwig-Musser drums and other percussion instruments; |
| • | Prelude woodwind and brass instruments; |
| • | Scherl & Roth string instruments (i.e., cellos, double bass, violas and violins); |
152
Table of Contents
| • | Selmer bassoons, clarinets, flutes, oboes, piccolos and saxophones; |
| • | Henri Selmer Paris clarinets and saxophones; and |
| • | Yanagisawa saxophones |

We enjoy leading market positions through many of our Conn-Selmer brands, including the largest market share in B-flat professional trumpets and student low brass instruments, such as sousaphones and euphoniums in the U.S. market. Over 50% of Conn-Selmer sales in fiscal year 2021 were generated through our preferred dealer network to schools and families who participate in beginning music education programs. Of the remaining sales, many are used by students in marching bands, concert bands, orchestras, and other school-related performances.
Our Legacy of Innovation
Our company is built on a legacy of innovation, which continues today. The first Steinway patent was granted in 1857, and since that time we have added over 150 patents to our portfolio. We believe we have disrupted our industry at each stage of our journey—from inventing the iconic curved shape of the grand piano in 1880, to most recently introducing what we believe to be the world’s finest high-resolution player piano, Steinway Spirio. The introduction of the Spirio technology was a culmination of years of investment, research and development and technological expertise.
We introduced the Steinway Spirio in 2015, followed by the launch of Spirio | r in 2019. Spirio | r enables recording, high-resolution editing and playback. Our Steinway Spirio technology features:
| • | A comprehensive music library, with thousands of performances from current Steinway Artists and Steinway Artist Immortals including Duke Ellington and Glenn Gould, as well as Spirio sync videos, available at the touch of a button on an accompanying iPad. Every month the library expands, with new music automatically uploaded to each Steinway Spirio piano every month. |
| • | With Spirio | r, customers have the capability to record and listen to performances in state-of-the-art high-resolution. Customers also have the ability to save and share recordings in multiple file formats. |
| • | With Spirio | r, customers have access to high-resolution editing on an accompanying iPad, allowing them to modify note velocity and note duration, correct wrong notes, change pedal data and delete or add time. |
| • | Seamless connectivity, as Spirio integrates into multiple musical environments via WiFi, Ethernet, Bluetooth, USB, MIDI-In & MIDI-Out, and HDMI video out connections. |
153
Table of Contents
Furthermore, in 2021, we launched Spiriocast, a feature which permits customers to instantly stream live performances, synched with video and audio, from one Spirio | r piano to another—or to many at the same time—across the world.

We also continue to innovate in our manufacturing facilities. In recent years, we have invested millions of dollars across our factories to improve our instruments. Specific recent investments include new facilities and machinery for our O.S. Kelly cast iron plate foundry in Springfield, OH, and a new Rim Computer Numerical Control (“CNC”) machine in our Astoria, New York facility. We are also investing in a new lacquer application facility in Hamburg, Germany. As a result of these and other investments and improvements, the Steinway pianos we are building today are significantly better than those we made even just a decade ago. These improvements and innovations provide us with a competitive advantage relative to used Steinways and offer compelling reasons for customers to pay more for a new piano when they are in the market for a Steinway.
Our Manufacturing Process
Our Steinway pianos are still handmade at our manufacturing facilities in Astoria, New York, and Hamburg, Germany, as they have been since 1873 and 1880, respectively. Our meticulous production process requires at least six months per piano.
We believe our production process for our Steinway pianos sets the industry standard for craftsmanship and quality. We exercise extreme care at every step of the process. This starts from choosing only the highest quality wood, which we dry for over two years, allowing water to evaporate naturally to achieve the world’s best acoustic quality. From there, our technicians fixate on each detail, from manually nailing hundreds of parallel coded pins to each Steinway piano bridge to guide the piano strings, to measuring the precise weight and balance of each piano key, to playing each piano up to 3,200 times to adjust and fine tune the sound. The culture at our Steinway facilities is not a race against time; we are committed to building the best piano possible.
Like Steinway pianos, the Boston and Essex models use all-wood action parts and incorporate Steinway & Sons’ latest design specifications, engineering standards and commitment to high-quality sound. The original Boston piano was designed from the ground up at our Astoria, New York facility and today our Boston pianos are produced in Hamamatsu, Japan and near Jakarta, Indonesia, while our Essex pianos are manufactured in Guangzhou, China.
Our Conn-Selmer portfolio of instruments is manufactured in our U.S. production facilities in Elkhart, Indiana, Eastlake, Ohio and Monroe, North Carolina as well as at facilities in China, Taiwan and Vietnam. Conn-Selmer also serves as U.S. distributor for Henri Selmer Paris woodwinds and Yanagisawa saxophones.
154
Table of Contents
Our Distribution Networks
Piano Segment
We sell our new pianos directly to consumers through company-operated showrooms and directly to select institutional accounts. We also sell through a global, expansive network of approximately 180 experienced third-party dealers.
Retail. We operate a network of 33 company-owned retail showrooms globally and employ knowledgeable salespeople, many of whom are musicians, to assist customers and represent our brand. We have strategically selected our showroom locations, focusing on wealthy metro areas ranging from New York to Beverly Hills, Chicago, San Francisco and Miami; across Europe with locations in cultural hubs including London, Paris, Vienna and throughout Germany; and in key APAC locations including Tokyo and Shanghai and in Beijing, where we launched our APAC flagship store in 2017. Our retail sales have increased at a CAGR of 16.1% from $76 million to $160 million between fiscal year 2016 and fiscal year 2021, reaching 39.4% of our total Piano segment net sales in fiscal year 2021. The outsized growth of this channel has ushered in higher profitability, as pianos sold through direct channels capture a significantly larger share of margin compared to traditional wholesale channels, with the added benefit that we build stronger, longer-lasting ties with our customers.

Third-Party Dealers. We have also cultivated a network of approximately 180 third-party dealers with intimate local market knowledge and close ties to local musical communities. We believe that our dealer network is difficult to replicate and represents a key competitive advantage. The breadth of our brands across multiple price points has allowed us to displace lower-priced brands and to facilitate more exclusive arrangements with our dealers. We serve as the exclusive supplier to many of our piano dealers, and our dealers are also awarded exclusive territories to promote robust marketing and sales programs, promotional expenditures and loyalty. We work directly with our dealers and bolster their operations through the provision of marketing and sales programs and materials, inventory management and support, sales training, customer service and technical assistance.
Underserved Markets. We are also implementing unique distribution methods to reach smaller markets that were previously underserved by our traditional distribution network. We have created a team of Educational Sales Managers that travel and sell directly to institutions or territories not represented by a retail showroom location or dealer. By creating this program, institutions that are not geographically close to our existing dealer network or are otherwise not in close contact with us are now handled directly by Steinway. Educational Sales Managers even sell direct to individual customers in those untouched territories. Like sales from our company-owned retail stores, sales direct to institutions capture a significantly larger share of the margin compared to traditional wholesale channels.
155
Table of Contents
Band Segment
Our band, string and percussion instruments and related accessories are distributed worldwide through over 1,200 independent musical instrument dealers and distributors. In addition, we maintain a dedicated institutional sales team that provides a suite of customized resources to public and private education institutions, colleges, universities and conservatories, including inventory analysis tools, supplemental educational resources through our MusicProfessor product, fundraising programs and accredited professional development resources.
Marketing and Customer Support
Piano Segment
Our success has been driven organically by many of the world’s most beloved musicians who choose to use our pianos time and again on the world’s biggest stages, reinforcing our well-established brand. We have found that the experience people have watching their favorite artists perform on our pianos generates exceptional demand for our products. We have created a number of programs to support our brand ambassadors and further promote our brands.
Steinway Artist Program. Steinway Artists are world-class pianists who voluntarily endorse Steinway by selecting the Steinway piano. Our Steinway Artist program is unique in that we do not pay artists to endorse our instruments. To become a Steinway Artist, a pianist must not only meet certain performance and professional criteria—he or she must also own a Steinway piano. The involvement of these renowned artists in our marketing programs helps reinforce recognition of the Steinway brand and its association with quality. The Steinway Artist program currently includes over 1,900 of the world’s finest pianists who perform on Steinway pianos.
Young Steinway Artist Program and All-Steinway Schools. Often a formal affiliation with Steinway has not been possible for an emerging artist since all Steinway Artists must personally own a Steinway piano. In an effort to reach out to young pianists at an early point in their burgeoning careers, we developed the Young Steinway Artist program. This program allows us to consider pianists between 16 and 35 years of age who own either a Boston or an Essex piano. The select group of talented musicians chosen for the Young Steinway Artist program has the distinction of an affiliation with the Steinway Artist family as well as access to the worldwide resources of Steinway. Similar to the Young Steinway Artist program, we build relationships with the next generation of artists through our All-Steinway School program. These schools include some of the world’s leading conservatories and through them we offer students and young artists the opportunity to play and study music on our instruments. All-Steinway schools exclusively use Steinway and Steinway-designed instruments, enabling music education on some of the world’s finest piano models.
Concert and Artist Piano Bank. To ensure that all pianists, especially Steinway Artists, have a broad selection of instruments to meet their individual touch and tonal preferences, we maintain the Concert and Artist Piano Bank. The Concert and Artist Piano Bank includes approximately 300 instruments worldwide. Of these instruments, approximately 220 are located in the United States. Many of these pianos are housed at prominent concert venues such as Lincoln Center and Carnegie Hall. The Concert and Artist Piano Bank promotes our instruments in the music industry and provides management with continual feedback on the quality and performance of recently produced instruments from our most critical customer, the professional pianist. The Concert and Artist Piano Bank instruments are generally sold after five years and replaced with new pianos.
Steinway Service Program. We offer technician services directly to owners of our Steinway and Spirio pianos. Our Steinway-approved piano technicians have many years of experience and are able to give expert advice to ensure the highest-level of service for our pianos, ranging from standard tuning
156
Table of Contents
to providing adjustments for the optimization of touch and tone. Our customers rely on us to connect them with technicians in their area equipped to meet the maintenance needs of a Steinway piano. Through these services, we maintain a relationship directly with our customers even after they have purchased one of our pianos and continue to work with them to make sure their Steinway experience remains at the highest quality.
Events and Recitals. Sharing the Steinway experience through live performances on our pianos is an important part of our business. Most of our Steinway showrooms have recital rooms precisely for this purpose, gathering music students and music enthusiasts alike to share in the inspiring sound and quality of our pianos. Events can also be a significant source of sales leads and we are able to track the success of these events in bolstering our net sales and reach. Supporting local artists and musicians is important to us. We provide instruments and technical services for hundreds of concerts and events each year, ranging from concert hall recitals to houses of worship to private events.
Website and Customer Conversion. In recent years, we have rebuilt our website to enhance our lead generation capabilities. Our leads are very valuable for our business and our system enables us to track and redirect relevant leads to retail stores and dealers for follow-up. Our technology also allows us to track the life of a lead. We use the statistics gathered on lead conversion in order to better tailor our sales training programs and strategies to provide the best customer experience and enhance our sales generation.
Band Segment
Sales to educational institutions have historically represented a large portion of our Band segment net sales. In North America, we market our products through pods of district sales managers, educational support managers, and inside sales engineers, who are responsible for sales within assigned geographic territories through a dealer network. Each pod is also responsible for developing relationships with band and orchestral directors. These directors represent all levels of music educators, from those who teach elementary school children to those involved at the college and professional levels. These individuals are the primary influencers in the choice of an instrument brand as they will generally refer students to designated dealers for the purchase of instruments.
We believe that our well-established, long-standing relationships with influential music educators are an important component of our marketing and distribution strategy. As part of our band director outreach and support, we operate a Division of Education to provide an educational forum that supports the day-to-day aspects of music classroom management. Led by our Vice President of Education, our educational clinicians travel extensively throughout the United States, lecturing and motivating students, educators and parents on the value of music in a child’s development. Within our Education Division, we continue to operate Conn-Selmer Institute (“CSI”), a program which assists graduating music education majors transitioning into teaching careers. CSI also offers refresher courses to experienced music educators, further enhancing our relationships with these key influencers. Through our coast-to-coast School Partnership Program, Conn-Selmer maintains a specialized team of Educational Support Managers who provide personalized service and support, customized lease and purchase programs, as well as artist and clinician funding. Conn-Selmer also provides partnering schools with free access to our instrument inventory management system, which helps customers manage their long-term supply needs and track inventory age and condition. Conn-Selmer continues to invest in tools and resources for educators with the 2021 acquisition of the MusicProfessor business, a digital music lesson tool, adding supplemental teaching resources for music educators.
We also support our dealers and distributors through advertising and promotional activities. We reach our customers through trade shows, educator conferences, print media, direct mail, online
157
Table of Contents
advertising and promotions, and via personal sales calls. Through content partnerships with our world-class artists, Conn-Selmer connects with beginners, aspiring musicians, and professionals through a range of targeted artists content. We also actively advertise in educator and trade publications and provide educational materials, catalogs and product specifications to students, educators, dealers and distributors.
Competition
Piano Segment
Steinway Pianos. Our Steinway pianos compete with different competitors depending on the markets and regions in which they are sold. We believe Steinway pianos hold a unique position at the top of the grand piano market, both in terms of quality and price. While there are many makers of pianos, only a few compete directly with our Steinway brand, including Bösendorfer, Fazioli, Kawai and Yamaha.
Because Steinway pianos are built to last for generations, a relatively large market exists for used Steinways, particularly in the Americas and in Europe. It is difficult to estimate the size of the used piano market because many of these sales are conducted in the private aftermarket, but we believe that used Steinway pianos provide the most significant competition in the high-end piano market for our Americas and EMEA regions. Competition from used Steinways is less prevalent in China and most of APAC because there is not as large of an installed base of Steinway pianos and because of a consumer preference for new products.
In addition, because our Steinway Spirio high-resolution player piano opened up a new category of consumers for our company, we are also now competing with other luxury goods outside of the high-end piano market.
Boston and Essex Pianos. Our mid-priced pianos compete with brands such as Bechstein and Schimmel, as well as Kawai and Yamaha, who also produce high-end pianos that compete with Steinway pianos. By working with manufacturers in Asia, we have been able to benefit from labor costs and manufacturing efficiencies similar to those of some of our primary competitors while offering consumers the added benefit of being able to afford pianos designed by Steinway.
Band Segment
We are the largest domestic producer of band, string, and percussion instruments and we have leading market shares in many professional-level instrument markets. Yamaha, a Japanese corporation, is our largest competitor, but we also compete with other manufacturers such as Eastman, Jupiter and Buffet Crampon. We own the rights to distribute Henri Selmer Paris instruments in the U.S. but compete with this brand in the international market. New entrants into the domestic market generally experience difficulty competing due to the need for brand recognition, music educator approval and an effective distribution system.
Competition for sales of student-level instruments in the United States has intensified in recent years. Offshore producers benefit from low labor costs, enabling these producers to offer instruments at highly competitive prices. Imported instruments have also allowed dealers to source their own proprietary lines in an attempt to improve their margins.
Intellectual Property
Steinway pioneered the development of the modern piano with over 150 utility and design patents granted since its founding. In the United States, utility patents generally have a term of 20 years from
158
Table of Contents
their priority filing date, and design patents generally have a term of 15 years from the date of issuance. The term of foreign patents is similar, but may vary from jurisdiction to jurisdiction. We currently own 22 United States utility patents, five United States design patents, two United States design patent applications, 30 foreign utility patents, three foreign utility patent applications and one foreign design patent. The issued patents in our current portfolio have varying expiry dates, ranging from 2023 to 2036. We do not believe our business is materially dependent upon any single patent. We also have some of the most well-known brand names in the music industry. Our piano trademarks include Steinway, Steinway & Sons, the Lyre design, Spirio, Spiriocast (registration pending), Boston, Heirloom Collection, Crown Jewel Collection, Essex, Renner and Certified Pre-Owned Steinway (registration pending). Our band & orchestral trademarks include Bach, Selmer, C.G. Conn, Leblanc, King, Armstrong, Ludwig, Musser, Holton, Glaesel, Scherl & Roth, and WM Lewis & Son. We consider our trademarks to be important and valuable assets. In the United States and certain other countries, “common law” trademark rights are of indefinite duration, for so long as the marks remain in use in commerce. Trademark registrations in the United States have an initial term of 10 years, and subject to timely filings, fee payments, and other legal requirements, they potentially can be renewed for an indefinite number of renewal terms. The terms of foreign trademark registrations are generally similar, although they may vary from jurisdiction to jurisdiction. It is possible that the termination, expiration or infringement of one or more of our trademarks may have an adverse effect on our business, depending on the trademark and the jurisdiction. Accordingly, we maintain trademark registrations in appropriate jurisdictions on an ongoing basis and vigorously pursue any infringement by competitors or other third parties.
Regardless of term length, there is a risk that our patents, trademarks and other intellectual property rights may be invalidated or cancelled as a result of third-party challenges. See “Risk Factors—Risks Related to our Intellectual Property—If we cannot successfully protect our intellectual property and proprietary information, our business would suffer.”
Raw Materials, Component Parts, and Sourced Products
Our raw materials consist primarily of metals and woods. The majority of these materials are sourced from the United States and Europe, with the balance coming from Asia. Electronic components are becoming more important with the increase in production of our Spirio pianos. For these pianos, we also source semiconductor chips. We manufacture our own piano plates, piano actions and keys to ensure quality and availability of these component parts. Component parts for string and percussion instruments are imported from Europe and Asia. Our Boston brand and our Essex brand are each sole sourced from manufacturers in Asia. Our Henri Selmer Paris instruments, certain component parts, and some of our entry-level band instruments are also sourced from single manufacturers. We continually scrutinize these suppliers and the quality of products that they manufacture for us. We have had adequate supplies of raw materials in the past and continue to monitor the effect of COVID-19 on global supply chains and potential impacts on our business.
Human Capital
Human capital is a crucial factor in our success, in terms of building on our position as a global leader in the ultra-premium piano and musical instrument sector and creating long-term, sustainable value. At Steinway, many of our talented employees and craftspeople have been with us for decades, and the average tenure of our production employees in each of our Astoria, New York and Hamburg, Germany factories is approximately 14 years. Our craftspeople do not just feel like family, but often are family, passing down their unique skillset from one generation to the next. To recognize excellence, encourage professional development, and create equal opportunities, we have adopted a number of initiatives. For instance, at our factory in Astoria, New York, we commenced an apprenticeship program in 2019 to emulate the long success of apprentices in our Hamburg factory. In this two-year
159
Table of Contents
program, apprentices rotate through the various stations of our full production line. We are proud that our first graduating class of apprentices has now joined our production line in specific roles. We have also recently overhauled and improved our William Steinway University, a comprehensive sales training program for our own retail staff and dealer sales staff, which now includes global training options both in-person and online. In addition, in 2020, we formed our first Diversity and Inclusion committee to cultivate an environment of belonging and inclusion in our workplace and to attract and retain a diverse staff. The work of this committee also aims to forge meaningful relationships with organizations and to develop a Steinway Artist roster that spans broad intersections of genre, background, musical style and personal identities. We have also undertaken an important initiative in our Hamburg manufacturing facility to establish a new remuneration system with the goal of increasing transparency and raising productivity.
As of March 31, 2022, we employed 1,958 people, consisting of 622 salaried employees and 1,336 hourly employees who work primarily in production. Of the 1,958 employees, 1,065 were employed in the United States, 822 were employed in Europe and 71 were employed in Asia. We have over 270 employees working in production at our Astoria, New York manufacturing facility and over 400 employees working in production at our Hamburg, Germany manufacturing facility.
Approximately 45% of our workforce in the United States is represented by labor unions. The following table indicates the union representation and the current status of our collective bargaining agreements in the United States:
Location | Union Affiliation | Type of Manufacturing | Number of | Agreement | ||||||
Springfield, OH | Glass, Molders, Pottery, Plastics & Allied Workers | Piano Plates | 67 | September 30, 2023 | ||||||
Astoria, NY | United Furniture Workers | Pianos | 242 | December 31, 2024 | ||||||
Eastlake, OH | United Auto Workers | Band Instruments | 174 | February 13, 2026 | ||||||
In Germany, the workers’ council represents all employees other than management. Most employment contract conditions are settled in collective bargaining agreements made between various trade unions and the employer organizations to which we belong. Our agreement with employees at our piano facility in Hamburg, Germany expires on November 30, 2023. We believe that relations with our employees and these unions are generally good.
Since March 2020, we have been closely monitoring the volatile COVID-19 landscape, prioritizing the health and safety of our employees. We acted swiftly in response to the crisis by temporarily closing most of our facilities, including our Astoria, New York manufacturing facility for over three months. Most of our workers returned to work on or around July 2020 with substantial health and safety policies in place, such as staggered shifts, daily health screenings and mask requirements. However, we are continuing to monitor developments with respect to COVID-19 and are prepared to temporarily close facilities and restrict operations as necessary, based upon information from government and health officials. In our managerial offices and retail showrooms, we have implemented a flexible and proactive approach that adapted our work environment, policies and benefits to provide support for our workforce as they balanced their personal and professional lives. For example, once our U.S. retail showrooms opened in accordance with applicable local laws in the Spring and Summer of 2020, until August 2021, they all still allowed visitors by appointment only and only after completing health screenings and currently still restrict events and recitals. Most of our office staff also worked remotely from March 2020 to June 2021 to limit the number of people and potential exposures at our facilities.
160
Table of Contents
Environmental Matters and Regulation
We are subject to various federal, state and local environmental laws and regulations governing, among other things, protection of the environment and natural resources and the use, generation, storage, handling, release and disposal of hazardous substances. These laws and regulations impose numerous obligations that are applicable to us, including acquisition of a permit or other approval required for our manufacturing activities or other regulated activities; restrictions on the types, quantities or concentration of materials that can be released into the environment; the handling and disposal of solid and hazardous waste; limitations on the use or importation of endangered plants or animals; imposition of specific health and safety standards addressing public and worker health and safety; or imposition of significant liabilities for contamination or pollution, including investigation, remedial and clean-up costs.
We believe that we are in material compliance with the environmental laws and regulations applicable to our business; however, there can be no assurance that we are in full compliance with all environmental laws and regulations or that we will be able to comply with any future requirements or changes in such laws and regulations without significant costs. Failure to comply with these requirements, including any new environmental laws or regulations that may be enacted or may become more stringent over time, may expose us to regulatory enforcement actions, fines, civil or criminal penalties, revocations of our permits and/or interruptions in our operations, among other sanctions, that could have a material adverse effect on our financial position, capital expenditures, results of operations and cash flows.
In addition to the above, many environmental laws impose strict, joint and several liability for costs required to clean up and restore sites where hazardous substances have been disposed or otherwise released into the environment, even under circumstances where the hazardous substances were released by prior owners or operators or the activities conducted, and from which a release emanated, complied with applicable law. We currently have obligations and liabilities with respect to the remediation of current and former properties and third-party waste disposal sites, some of which is covered under applicable insurance policies. We have accrued liabilities for sites where the liability is probable and can be estimated (taking into account reasonably anticipated insurance coverage or contributions from other responsible parties). While such liabilities are not expected to be material, there can be no assurance that we will not be required in the future to conduct or fund additional remedial programs in connection with other current, former or future facilities, which could have a material adverse effect on our financial position, capital expenditures, results of operations and cash flows. See “Risk Factors—Risks Related to Regulation—Our operations may subject us to liabilities for environmental or other regulatory matters, the costs of which could be material.”
161
Table of Contents
Properties
We own most of our manufacturing and warehousing facilities. Our remaining retail stores are leased. Substantially all of the domestic real estate has been pledged to secure our debt. The following table lists our significant owned and leased manufacturing, office and warehouse facilities as of March 31, 2022:
Location | Owned/ | Approximate Floor | Type of Facility and Activity Performed | |||||
Astoria, NY, USA | Owned | 397,000 | Piano manufacturing, offices, selection room and used piano showroom | |||||
Springfield, OH, USA | Owned | 110,000 | Piano plate manufacturing | |||||
Elkhart, IN, USA | Owned | 25,000 | Corporate offices | |||||
| Owned | 54,668 | Band instrument manufacturing | ||||||
| Owned | 81,000 | Warehouse | ||||||
| Owned | 43,904 | Band instrument manufacturing | ||||||
| Leased | 28,120 | Warehouse | ||||||
Monroe, NC, USA | Leased | 114,000 | Percussion instrument manufacturing | |||||
Eastlake, OH, USA | Owned | 160,000 | Brass instrument manufacturing | |||||
Wilkow, Poland | Owned | 10,000 | Piano key manufacturing, office, warehouse | |||||
Hamburg, Germany | Owned | 221,000 | Piano manufacturing, office, warehouse, selection room | |||||
Remscheid, Germany | Leased | 25,000 | Piano key manufacturing | |||||
Gärtringen, Germany | Owned | 125,110 | Piano action manufacturing | |||||
Meuselwitz, Germany | Owned | 160,858 | Piano action manufacturing | |||||
Tokyo, Japan | Leased | 79,083 | Office, warehouse | |||||
Shanghai, China | Leased | 68,383 | Warehouse, showroom, office | |||||
Tianjin City, China | Leased | 6,598 | Band instrument office, warehouse | |||||
Uxbridge, England | Leased | 8,000 | Band instrument office, warehouse | |||||
Elkhorn, WI | Owned | 58,000 | Former brass instrument manufacturing, held for sale | |||||
We also have leased properties in select cities around the world that serve as our 33 retail showroom locations, including 16 showrooms in the United States, 11 in the EMEA region and six in the APAC region. Additionally, we recently leased another retail location in APAC that we are planning to open in 2022.
Legal Proceedings
From time to time, we may become involved in legal or regulatory proceedings arising in the ordinary course of our business. Management believes that we do not have any pending or threatened litigation which, individually or in the aggregate, would have a material adverse effect on our business, results of operations, financial condition and/or cash flows.
162
Table of Contents
The following table sets forth information regarding our executive officers, directors and director nominees as of the date of this prospectus.
Name | Age | Position | ||
Benjamin Steiner | 36 | President, Chief Executive Officer and Director | ||
Maia Moutopoulos | 46 | Chief Financial Officer | ||
Eric Feidner | 59 | Chief Technology Officer and Chief Innovation Officer | ||
John Paulson | 66 | Director | ||
Michael Waldorf | 51 | Director | ||
Wei Wei | 44 | Director | ||
Howard Gurvitch | 63 | Director Nominee* | ||
Benjamin Mensah | 33 | Director Nominee* |
| * | To be elected to the board of directors following the effectiveness of the registration statement of which this prospectus forms a part |
Executive Officers
Our executive officers are appointed by, and serve at the discretion of, our board of directors. Each executive officer is an employee of the Company or one of its subsidiaries. The following information provides a brief description of the business experience of each of our executive officers and directors. The current executive officers are as follows:
Benjamin Steiner was appointed director of the Company in April 2022 and has served as the President and Chief Executive Officer of the Company since April 2022. Mr. Steiner has been President and Chief Executive Officer of SMI since September 2021, and served as the Chief Financial Officer and Chief Operating Officer of SMI prior thereto. Mr. Steiner was a partner at Paulson & Co. from 2016 until December 2021. Paulson & Co. is an investment management firm specializing in merger arbitrage and distressed debt, which manages and provides oversight of investments in public and private companies, both domestically and internationally. Entities affiliated with Paulson & Co. have been the sole stockholders of the Company since 2013 and will continue to control the Company upon the completion of this offering. Mr. Steiner has served as a director of A.C.T. Lighting, Inc., a private manufacturer and distributor of lighting products, since March 2020. Mr. Steiner received an A.B., magna cum laude, in Government and Public Policy from Princeton University, a J.D from Harvard Law School, magna cum laude, and an M.B.A. from Harvard Business School, where he was a Baker Scholar. Mr. Steiner is qualified to serve on our Board of Directors because of his financial expertise and his management and board experience.
Maia Moutopoulos has served as the Chief Financial Officer of the Company since April 2022. Ms. Moutopoulos has been Chief Financial Officer of SMI since September 2021, and joined SMI’s corporate finance team in 2014. Prior to September 2021, Ms. Moutopoulos served as SMI’s VP Chief Accounting Officer/Corporate Controller. From 2016 to 2017, Ms. Moutopoulos was the Director of Financial Planning & Analysis. Prior to 2014 she was the Accounting Manager at Steinway, Inc., the company’s Americas piano division, which she joined in 2006. Ms. Moutopoulos received a B.B.A., magna cum laude, in Accounting from Baruch College School of Business.
Eric Feidner has served as the Chief Technology Officer and Chief Innovation Officer of the Company since April 2022 and has held the same title at SMI since October 2021. Mr. Feidner manages the teams responsible for music technology in product development, web and app development, information technology, recorded music production, and content creation. Mr. Feidner previously served as Senior Vice President, Music Technology and President of Steinway’s former
163
Table of Contents
subsidiary, ArkivMusic, which he founded in 2001 and sold to Steinway, Inc. in 2008. Prior to 2001, Mr. Feidner held executive positions at start-ups, including N2K, Inc. and Winstar Communications, where he managed large teams developing music, technology, and e-commerce platforms. Mr. Feidner received a BFA, magna cum laude, in music performance from SUNY Purchase and attended the Baruch College School of Business.
Directors
John Paulson was appointed director of the Company in April 2022 and has served as a director of SMI since 2013. Since 1994, Mr. Paulson has been the President of Paulson & Co., a private investment company. Entities affiliated with Paulson & Co. have been the sole stockholders of the Company since 2013 and will continue to control the Company upon the completion of this offering. Mr. Paulson has served as a director of PFC Associates LLC, a casual dining restaurant chain, since March 2019, and as a director of BrightSphere investment Group Inc., an asset management company, since November 2018. Since June 2017, Mr. Paulson served as a director of Bausch Health Companies Inc., a specialty pharmaceutical company. From May 2016 to July 2017, Mr. Paulson also served as a director of American International Group, Inc., an insurance organization. Mr. Paulson received a B.S. in Business from New York University and an M.B.A. from Harvard Business School. Mr. Paulson is qualified to serve on our Board of Directors because of his financial expertise and his management and board experience.
Michael Waldorf was appointed director of the Company in April 2022 and has served as a director of SMI since 2013. Since January 2002, Mr. Waldorf has been a Partner, Managing Director and Senior Counsel at Paulson & Co., an investment management firm specializing in merger arbitrage and distressed debt. Entities affiliated with Paulson & Co. have been the sole stockholders of the Company since 2013 and will continue to control the Company upon the completion of this offering. Mr. Waldorf has served as a director of PFC Associates LLC, a casual dining restaurant chain, since March 2019. Mr. Waldorf received a B.A., magna cum laude, in Economics and Russian & Soviet Studies from Harvard College and a J.D., cum laude, from Harvard Law School. Mr. Waldorf is qualified to serve on our Board of Directors because of his financial and legal expertise and his management and board experience.
Wei Wei was appointed director of the Company in April 2022. Ms. Wei has served as the President of Steinway Piano Asia Pacific Co., Ltd., a subsidiary of the Company, since 2017, and previously served as Steinway Piano Asia Pacific Co., Ltd.’s Marketing & Sales Manager, Director of Marketing & Sales and Vice President Marketing & Sales, General Manager. From 2002 to 2003, Ms. Wei served as the Senior Administrator and Assistant to Chief Representative at Steinway & Sons’ representative office in Beijing. Ms. Wei received a Bachelor’s Degree in German Language and Literature from Nanjing University and an E.M.B.A from Tsinghua University. Ms. Wei is qualified to serve on our Board of Directors because of her experience in developing the Steinway business in APAC and her international business acumen.
Howard Gurvitch has been nominated to serve as a director of the Company following the effectiveness of the registration statement of which this prospectus forms a part. Since January 2006, Mr. Gurvitch has been the founder and sole managing member of a privately-held, New York based, “family office” that manages a diversified investment portfolio of both direct and fund investments in public and private securities, including equities, credit, real estate and venture capital. From 1987 through 2005, Mr. Gurvitch served as a Managing Director at Bear, Stearns & Co. Inc., specializing in corporate finance and M&A as well as the provision of wealth management services and solutions. Mr. Gurvitch received a B.A. with high distinction, Phi Beta Kappa, in Economics and Political Science from the University of Rhode Island and a J.D. with honors from The National Law Center of the George Washington University. Mr. Gurvitch is qualified to serve on our Board of Directors because of his financial expertise and his management experience.
164
Table of Contents
Benjamin Mensah has been nominated to serve as a director of the Company following the effectiveness of the registration statement of which this prospectus forms a part. Since February 2020, Mr. Mensah has worked as an investment professional at The Carlyle Group where he is responsible for sourcing and executing private and public investments across a variety of industries. From June 2016 until December 2019, Mr. Mensah worked as an investment analyst at Paulson & Co., an investment management firm specializing in merger arbitrage and distressed debt. Entities affiliated with Paulson & Co. have been the sole stockholders of the Company since 2013 and will continue to control the Company upon the completion of this offering. Prior to his time at Paulson & Co., Mr. Mensah was an investment analyst at SVP Global and investment banker at Goldman Sachs. Mr. Mensah received a dual B.S. from the Massachusetts Institute of Technology and an MBA from Harvard Business School. Mr. Mensah is qualified to serve on our Board of Directors because of his financial expertise and his management experience.
Corporate Governance
Board Composition
Our board of directors will consist of six directors following the effectiveness of the registration statement of which this prospectus forms a part. Our directors will be divided into three classes with staggered three-year terms. At each annual meeting of stockholders after the initial classification, the successors to the directors whose terms will then expire will be elected to serve from the time of election and qualification until the third annual meeting following their election and until their successors are duly elected and qualified.
The Stockholders Agreement will provide John Paulson and certain affiliated entities with certain rights relating to the composition of our board of directors. See “Certain Relationships and Related Party Transactions—Relationship with John Paulson and Certain Affiliated Entities Following this Offering—Stockholders Agreement.”
Subject to the provisions of the Stockholders Agreement, so long as John Paulson and certain affiliated entities own, in the aggregate, (i) at least 35% of the total outstanding shares of our common stock owned by them immediately following the consummation of this offering (including the sale of any shares pursuant to the underwriters’ option to purchase additional shares), they will be entitled to nominate four directors, (ii) less than 35% but at least 25% of the total outstanding shares of our common stock owned by them immediately following the consummation of this offering (including the sale of any shares pursuant to the underwriters’ option to purchase additional shares), they will be entitled to nominate three directors, (iii) less than 25%, but at least 15% of the total outstanding shares of our common stock owned by them immediately following the consummation of this offering (including the sale of any shares pursuant to the underwriters’ option to purchase additional shares), they will be entitled to nominate two directors, (iv) less than 15%, but at least 5% of the total outstanding shares of our common stock owned by them immediately following the consummation of this offering (including the sale of any shares pursuant to the underwriters’ option to purchase additional shares), they will be entitled to nominate one director and (v) less than 5% of the total outstanding shares of our common stock owned by them immediately following the consummation of this offering (including the sale of any shares pursuant to the underwriters’ option to purchase additional shares), they will not be entitled to nominate a director. Additionally, so long as John Paulson and certain affiliated entities have the right to designate at least one director for nomination to the board of directors, they will be entitled to have one director designated by them to serve on each committee of the board of directors.
Each director shall hold office until his or her successor has been duly elected and qualified, or until his or her earlier death, resignation or removal.
165
Table of Contents
In accordance with our amended and restated certificate of incorporation to be in effect prior to the closing of this offering, our board of directors will be divided into three classes of directors. At each annual meeting of stockholders, a class of directors will be elected for a three-year term to succeed the class whose terms are then expiring, to serve from the time of election and qualification until the third annual meeting following their election or until their earlier death, resignation or removal. Upon the closing of this offering, our directors will be divided among the three classes as follows:
The Class I directors will be John Paulson and Michael Waldorf, and their terms will expire at our first annual meeting of stockholders following this offering.
The Class II directors will be Benjamin Steiner and Wei Wei, and their terms will expire at our second annual meeting of stockholders following this offering.
The Class III directors will be Howard Gurvitch and Benjamin Mensah, and their terms will expire at our third annual meeting of stockholders following this offering.
Our amended and restated certificate of incorporation will provide that the authorized number of directors may be changed only by resolution of our board of directors or as provided in the Stockholders Agreement. See “Certain Relationships and Related Party Transactions—Relationship with John Paulson and Certain Affiliated Entities Following this Offering—Stockholders Agreement.” Any additional directorships resulting from an increase in the number of directors will be distributed among the three classes so that, as nearly as possible, each class will consist of one-third of the directors. The division of our board of directors into three classes with staggered three-year terms may delay or prevent a change of our management or a change in control. See the section of this prospectus captioned “Description of Capital Stock—Anti-Takeover Provisions” for a discussion of these and other anti-takeover provisions found in our amended and restated certificate of incorporation and amended and restated bylaws, which will become effective prior to the closing of this offering.
Director Independence
After the consummation of this offering, John Paulson and certain affiliated entities will hold approximately % of the total combined voting power of our outstanding common stock (or approximately % if the underwriters exercise in full their option to purchase additional shares of our Class A common stock from the selling stockholders) through their ownership of all of the Class B common stock. Accordingly, we will be a “controlled company” under the rules of the NYSE.
Even though we will be a controlled company, we are required to comply with the rules of the SEC and the NYSE relating to the membership, qualifications and operations of the audit committee, as discussed below. If we cease to be a controlled company and the Class A common stock continues to be listed on the NYSE, we will be required to comply with these requirements by the date our status as a controlled company changes or within specified transition periods applicable to certain provisions, as the case may be.
In connection with this offering, our board of directors has undertaken a review of the independence of each director and considered whether each director has a material relationship with us that could compromise his or her ability to exercise independent judgment in carrying out his or her responsibilities. As a result of this review, our board of directors determined that Messrs. Paulson, Waldorf, Gurvitch and Mensah are “independent directors” as defined under the applicable rules and regulations of the SEC and the listing requirements and rules of the NYSE, representing four of our six directors.
166
Table of Contents
Board Committees
Our board of directors has an audit committee, a compensation committee and nominating and corporate governance committee, each of which has the composition and the responsibilities described below. In addition, from time to time, special committees may be established under the direction of our board of directors when necessary to address specific issues.
Each of the audit committee, the compensation committee and nominating and corporate governance committee will operate under a written charter that will be approved by our board of directors in connection with this offering. A copy of each of the audit committee, compensation committee and nominating and corporate governance committee charters will be available on our corporate website. The reference to our website address in this prospectus does not include or incorporate by reference the information on our website into this prospectus.
Audit Committee
Our audit committee oversees our corporate accounting and financial reporting process and assists our board of directors in monitoring our financial systems. Our audit committee will be responsible for, among other things:
| • | appointing, compensating, retaining, evaluating, terminating and overseeing our independent registered public accounting firm; |
| • | discussing with our independent registered public accounting firm their independence; |
| • | reviewing with our independent registered public accounting firm the scope and results of their audit; |
| • | approving all audit and permissible non-audit services to be performed by our independent registered public accounting firm; |
| • | overseeing the financial reporting process and discussing with management and our independent registered public accounting firm the interim and annual financial statements that we file with the SEC; |
| • | reviewing our policies on risk assessment and risk management; |
| • | reviewing related party transactions; |
| • | overseeing our financial and accounting controls and compliance with legal and regulatory requirements; and |
| • | establishing procedures for the confidential anonymous submission of concerns regarding questionable accounting, internal controls or auditing matters. |
Our audit committee consists of Messrs. Gurvitch, Mensah and Waldorf, with Mr. Gurvitch serving as chair. Rule 10A-3 of the Exchange Act requires us to have one independent audit committee member upon the listing of our Class A common stock, a majority of independent directors on our audit committee within 90 days of the effective date of the registration statement of which this prospectus forms a part and an audit committee composed entirely of independent directors within one year of the effective date of the registration statement of which this prospectus forms a part. In order to be considered independent for purposes of Rule 10A-3, a member of an audit committee of a listed company may not, other than in his or her capacity as a member of the audit committee, the board of directors, or any other board committee, accept, directly or indirectly, any consulting, advisory, or other compensatory fee from the listed company or any of its subsidiaries or otherwise be an affiliated person of the listed company or any of its subsidiaries. Our board of directors has determined that each of Messrs. Gurvitch and Mensah are independent directors under the rules of the NYSE and the
167
Table of Contents
additional independence standards applicable to audit committee members established pursuant to Rule 10A-3 under the Exchange Act. Our board of directors has also determined that each of Messrs. Gurvitch, Mensah and Waldorf meets the “financial literacy” requirement for audit committee members under the rules of the NYSE.
Compensation Committee
Our compensation committee oversees our compensation policies, plans and benefits programs. Our compensation committee will be responsible for, among other things:
| • | reviewing and approving corporate goals and objectives relevant to the compensation of our Chief Executive Officer, evaluating the performance of our Chief Executive Officer in light of these goals and objectives and setting or making recommendations to the Board regarding the compensation of our Chief Executive Officer; |
| • | reviewing and setting or making recommendations to our board of directors regarding the compensation of our other executive officers; |
| • | making recommendations to our board of directors regarding the compensation of our directors; |
| • | reviewing and approving or making recommendations to our board of directors regarding our incentive compensation and equity-based plans and arrangements; and |
| • | appointing and overseeing any compensation consultants. |
Our compensation committee consists of Messrs. Waldorf, Gurvitch and Mensah, with Mr. Waldorf serving as chair. The composition of our compensation committee meets the requirements for independence under the current listing standards and SEC rules and regulations. Each of Messrs. Gurvitch and Mensah is a non-employee director, as defined in Section 16b-3 of the Exchange Act.
Nominating and Corporate Governance Committee
Our nominating and corporate governance committee oversees and assists our board of directors in reviewing and recommending nominees for election as directors. Our nominating and corporate governance committee will be responsible for, among other things:
| • | identifying individuals qualified to become members of our board of directors, consistent with criteria approved by our board of directors; |
| • | recommending to our board of directors the nominees for election to our board of directors at annual meetings of our stockholders; |
| • | overseeing an evaluation of our board of directors and its committees; and |
| • | developing and recommending to our board of directors a set of corporate governance guidelines. |
Our nominating and corporate governance committee consists of Messrs. Paulson, Waldorf and Gurvitch, with Mr. Paulson serving as chair. The composition of our nominating and corporate governance committee meets the requirements for independence under the current NYSE listing standards and SEC rules and regulations.
Role of the Board in Risk Oversight
Our board of directors has an active role, as a whole and also at the committee level, in overseeing the management of our risks. Our board of directors is responsible for general oversight of
168
Table of Contents
risks and regular review of information regarding our risks, including credit risks, liquidity risks and operational risks. The compensation committee is responsible for overseeing the management of risks relating to our executive compensation plans and arrangements. The audit committee is responsible for overseeing the management of financial and cybersecurity risks. The nominating and corporate governance committee is responsible for overseeing the management of risks associated with the independence of our board of directors and potential conflicts of interest. Although each committee is responsible for evaluating certain risks and overseeing the management of such risks, the entire board of directors is regularly informed through discussions from committee members about such risks. Our board of directors believes its administration of its risk oversight function has not negatively affected our board of directors’ leadership structure.
Code of Business Conduct and Ethics
We have adopted a written code of business conduct and ethics that applies to our directors, officers and employees, including our principal executive officer, principal financial officer, principal accounting officer or controller, or persons performing similar functions prior to the completion of this offering. Following this offering, a current copy of the code will be posted on the investor section of our website.
Compensation Committee Interlocks and Insider Participation
None of the members of our compensation committee is or has been within the past three years an officer or one of our employees. None of our executive officers currently serves, or in the past year has served, as a member of the board of directors or compensation committee (or other board committee performing equivalent functions or, in the absence of any such committee, the entire board of directors) of any entity that has one or more executive officers serving on our board of directors or compensation committee.
169
Table of Contents
This section discusses the material components of the executive compensation program for our executive officers who are named in the “2021 Summary Compensation Table” below (each, an “NEO”). In fiscal year 2021, our NEOs and their positions were as follows:
| • | Benjamin Steiner, Chief Executive Officer; |
| • | Maia Moutopoulos, Chief Financial Officer; |
| • | Eric Feidner, Chief Technology and Innovation Officer; and |
| • | Ron Losby, former Chief Executive Officer. |
This discussion may contain forward-looking statements that are based on our current plans, considerations, expectations and determinations regarding future compensation programs. Actual compensation programs that we adopt following the completion of this offering may differ materially from the currently planned programs summarized in this discussion. As an “emerging growth company” as defined in the JOBS Act, we are not required to include a Compensation Discussion and Analysis section and have elected to comply with the scaled disclosure requirements applicable to emerging growth companies. The discussion set forth below includes information regarding the compensation of Mr. Losby, who retired from his role as our Chief Executive Officer on August 31, 2021 and who was succeeded by Mr. Steiner.
2021 Summary Compensation Table
The following table sets forth information concerning the compensation of our NEOs for fiscal year 2021.
Name and Principal | Year | Salary ($) | Stock Awards ($) | Non-Equity Incentive Plan Compensation Earnings ($)(1) | All Other Compensation ($) | Total | ||||||||||||||||||
Benjamin Steiner | 2021 | 505,000 | (2) | — | (3) | 1,243,200 | 40,708 | (4) | 1,788,908 | |||||||||||||||
Chief Executive Officer | ||||||||||||||||||||||||
Maia Moutopoulos | 2021 | 275,000 | — | 471,240 | 15,849 | (5) | 762,089 | |||||||||||||||||
Chief Financial Officer | ||||||||||||||||||||||||
Eric Feidner | 2021 | 300,000 | — | 648,720 | 27,765 | (6) | 976,485 | |||||||||||||||||
Chief Technology and Innovation Officer | ||||||||||||||||||||||||
Ron Losby | 2021 | 304,124 | — | 744,600 | 17,749 | (7) | 1,066,473 | |||||||||||||||||
Former Chief Executive Officer | ||||||||||||||||||||||||
| (1) | Amounts to reflect annual cash performance-based bonuses earned during the year ended December 31, 2021. For additional information about the annual cash performance-based bonuses, please see the section titled “2021 Bonuses” below. |
| (2) | Of this amount, $45,833 was paid by Paulson & Co. and $459,167 was paid by SMI pursuant to Mr. Steiner’s Employment Letter Agreement, as further discussed below in “—Executive Compensation Arrangements”. |
| (3) | Amount reflects the aggregate grant date fair value of profits interests granted during the year ended December 31, 2021 computed in accordance with FASB ASC Topic 718, Compensation—Stock Compensation. See Note 14 of the audited consolidated financial statements included elsewhere in this prospectus for a discussion of the relevant assumptions used in calculating this amount. The amount reported in this column reflects the aggregate grant date fair value for the profits interests as determined for financial accounting purposes and do not correspond to the actual economic value that may be received by the named executive officer from these awards. |
| (4) | Amount reflects (i) $4,920 as the rental value of a loaner piano provided to Mr. Steiner for personal use, (ii) $12,564 in commuting reimbursements, (iii) $15,225 in employer contributions from SMI under the Company’s 401(k) plan, (iv) $7,375 in employer contributions from Paulson & Co. under the Company’s 401(k) plan and (v) $624 in group term life insurance premiums. |
170
Table of Contents
| (5) | Amount reflects (i) $15,225 in employer contributions under the Company’s 401(k) plan and (ii) $624 in group term life insurance premiums. |
| (6) | Amount reflects (i) $11,916 as the rental value of a loaner piano provided to Mr. Feidner for research and development purposes and personal use, (ii) $15,225 in employer contributions under the Company’s 401(k) plan and (iii) $624 in group term life insurance premiums. |
| (7) | Amount reflects (i) $17,333 in housing allowance payments and (ii) $416 in group term life insurance premiums. |
Narrative To Summary Compensation Table
2021 Salaries
The NEOs receive a base salary to compensate them for services rendered to our company. The base salary payable to each NEO is intended to provide a fixed component of compensation reflecting the executive’s skill set, experience, role and responsibilities. As of December 31, 2021, the annual base salaries for our named executives officers were:
| Name | 2021 Annual Base Salary ($) | |||
Benjamin Steiner | 560,000 | |||
Maia Moutopoulos | �� | 275,000 | ||
Eric Feidner | 300,000 | |||
Mr. Steiner’s base salary was increased from $450,000 (paid by SMI) and $50,000 (paid by Paulson & Co.) to $560,000 (paid wholly by SMI), effective as of December 1, 2021. Ms. Moutopoulos’ base salary was increased from $250,000 to $275,000 in connection with her promotion to Chief Financial Officer, effective September 1, 2021 with a catch-up to January 1, 2021. Mr. Losby retired effective as of August 31, 2021 and thus did not have a base salary as of December 31, 2021.
The actual base salary amounts paid to the named executive officers during fiscal year 2021 are set forth in the 2021 Summary Compensation Table in the column titled “Salary.”
2021 Bonuses
We maintain an annual performance-based cash bonus program in which each of our NEOs participated in fiscal year 2021. Under this program, each NEO receives a number of “profit points” based on either a percentage of his or her base salary or a negotiated amount. These profit points are then multiplied by two bonus multiples to calculate the NEO’s annual performance-based cash bonus. The bonus multiples are determined based on (i) individual performance reviews and (ii) the amount by which an NEO’s business unit(s) exceed unit-specific minimum EBITDA targets. In the event an NEO’s applicable business unit does not exceed its minimum EBITDA target, the NEO will not receive any bonus with respect to the profit points associated with such business unit; however, once the minimum EBITDA target for a business unit has been met, the bonus multiple for such business unit is not subject to any maximum limit.
For fiscal 2021, the applicable business unit(s) of each NEO exceeded their minimum EBITDA targets and, as a result, each NEO qualified for an annual performance-based cash bonus. Additionally, Mr. Steiner and Mr. Losby each received individual performance bonus multiples of 100% and Ms. Moutopoulos and Mr. Feidner each received individual performance bonus multiples of 102%. Mr. Losby’s annual performance-based cash bonus was pro-rated to reflect his retirement effective August 31, 2021. The annual performance-based cash bonus amounts are generally paid after the end of the fiscal year in which they were earned. The actual annual cash bonuses awarded to each NEO for fiscal year 2021 performance are set forth above in the 2021 Summary Compensation Table in the column titled “Non-Equity Incentive Plan Compensation.”
171
Table of Contents
Equity Compensation
Mr. Steiner holds a 5% Class B1 membership interest, which is treated for tax purposes as a profits interest, in Parent, which were the only Class B membership interests issued by Parent and which we refer to as “Class B Units.” During fiscal year 2021, Mr. Steiner was issued the Class B Units representing 5% of Parent’s total membership interests, 25% of which (or 1.25% of Parent’s total membership interests) vested on the grant date, an additional 25% of which vested on April 30, 2022, and the remaining 50% of which vests in two equal installments on April 30, 2023 and April 30, 2024, subject to Mr. Steiner’s continued service through the applicable vesting date. In the event Mr. Steiner’s employment is terminated by us without cause (as defined in his employment letter agreement) or due to his death or disability, Mr. Steiner is entitled to payment in redemption of any vested Class B Units held by him at the time of such termination (including any Class B Units that would have otherwise vested through the date of his termination had the Class B Units vested on a daily straight-line basis between vesting dates) in an amount determined according to a preset formula provided in Parent’s operating agreement with such amount to be paid no later than sixty days following the end of the year of such termination. In the event Mr. Steiner’s employment is terminated by us with cause, Mr. Steiner is entitled to payment in redemption of only those Class B Units held by him that are vested at the time of such termination in an amount determined according to the same preset formula. In connection with this offering, Parent will liquidate (as further discussed in “Prospectus Summary—Distribution”) and Mr. Steiner will receive (i) fully-vested shares of our Class A common stock in exchange for his fully-vested Class B Units and (ii) restricted shares of our Class A common stock in exchange for his unvested Class B Units, in each case determined immediately prior to the liquidation and on a value-for-value basis, with such restricted shares subject to the same time-vesting conditions as Mr. Steiner’s unvested Class B Units as of immediately prior to the liquidation.
We have not granted any equity or equity-based compensation to our employees, including to our NEOs, other than the Class B Units granted to Mr. Steiner.
Other Elements of Compensation
Retirement Plans. We maintain a 401(k) retirement savings plan for our employees, including our NEOs, who satisfy certain eligibility requirements. Our NEOs are eligible to participate in the 401(k) plan on the same terms as other full-time employees. The Code allows eligible employees to defer a portion of their compensation, within prescribed limits, on a pre-tax basis through contributions to the 401(k) plan. We believe that providing a vehicle for tax-deferred retirement savings though our 401(k) plan adds to the overall desirability of our executive compensation package and further incentivizes our employees, including our NEOs, in accordance with our compensation policies. We previously maintained a non-qualified Supplemental Executive Retirement Plan (“SERP”) for a select group of current and former executives, including Mr. Losby; however, the SERP was terminated in March of 2021 and final asset distributions were completed by April of 2022.
Employee Benefits and Perquisites. All of our full-time employees, including our NEOs, are eligible to participate in our health and welfare plans, including medical, dental and vision benefits, medical and dependent care flexible spending accounts, short-term and long-term disability insurance, and life insurance.
Additionally, certain of our executive officers, including each of our NEOs, are entitled to a piano loan, free of charge, for personal use. Both Mr. Steiner and Mr. Feidner are currently taking advantage of this program.
No Tax Gross-Ups. We do not make gross-up payments to cover our NEOs’ personal income taxes that may pertain to any of the compensation or perquisites paid or provided by our company.
172
Table of Contents
Outstanding Equity Awards at 2021 Fiscal Year-End
The following table summarizes the number of Class B Units underlying outstanding equity incentive plan awards for each NEO as of December 31, 2021.
| Stock Awards | ||||||||
Name | Number of Shares or Units of Stock That Have Not Vested (#)(1) | Market Value of Shares or Units of Stock That Have Not Vested ($)(2) | ||||||
Benjamin Steiner | — | 13,759,092 | ||||||
| (1) | Represents the unvested Class B Units in Parent held by Mr. Steiner as of December 31, 2021, which were granted on a percentage basis. As of December 31, 2021, Parent was not unitized and the Class B Units did not represent a specific number of membership interests with respect to Parent. As of December 31, 2021, 75% of Mr. Steiner’s Class B Units (or 3.75% of Parent’s total membership interests) were unvested. The unvested Class B Units vest in three equal installments on April 30, 2022, April 30, 2023, and April 30, 2024, subject to Mr. Steiner’s continued service through each applicable vesting date. In the event Mr. Steiner is terminated by us without cause (as defined in his employment letter agreement) or due to his death or disability, Mr. Steiner is entitled to payment in redemption of any vested Class B Units held by him at the time of such termination (including any Class B Units that would have otherwise vested through the date of his termination had the Class B Units vested on a daily straight-line basis between vesting dates) in an amount determined according to a preset formula provided in Parent’s operating agreement with such amount to be paid no later than sixty days following the end of the year of such termination. In the event Mr. Steiner is terminated by us with cause, Mr. Steiner is entitled to payment in redemption of only those Class B Units held by him that are vested at the time of such termination in an amount determined according to the same preset formula. |
| (2) | The Class B Units are not publicly traded and, as a result, there was no ascertainable public market value for the Class B Units as of December 31, 2021. Therefore, the Class B Units have been valued on the basis set forth in Footnote 3 of the 2021 Summary Compensation Table, above, based on financial results for 2021. |
Executive Compensation Arrangements
We have entered into employment agreements with each of our named executive officers except Ms. Moutopoulos, the key terms of which are described below. The following is a summary of the material terms of each agreement. For complete terms, please see the respective agreements attached as exhibits to the registration statement of which this prospectus forms a part.
Benjamin Steiner Employment Letter Agreement
Mr. Steiner is subject to an employment letter agreement effective as of May 1, 2016 and amended January 9, 2019 by and among Mr. Steiner, Paulson & Co. and Steinway Musical Instruments, Inc., which letter agreement continues to govern Mr. Steiner’s employment following his appointment as Chief Executive Officer, effective as of September 1, 2021. Mr. Steiner’s letter agreement contains standard employment terms, including at-will employment, base salary, and bonus eligibility. Under this letter agreement, in the event Mr. Steiner is terminated due to death, disability, or by us without cause (as defined in the letter agreement), Mr. Steiner is entitled to (i) a pro-rata portion of the cash bonus payable to him for the year of termination and (ii) vesting of a pro-rata portion of his Class B Units, if any, due to vest during the year of his termination, in each case subject to Mr. Steiner’s execution and non-revocation of a release of claims and continued compliance with restrictive covenants, including a perpetual confidentiality restriction, an invention assignment provision, a 90 day post-employment non-competition covenant, and a six month post-employment non-solicitation covenant.
On April 13, 2022, the parties to Mr. Steiner’s employment letter agreement entered into a new letter agreement, pursuant to which Mr. Steiner’s existing employment letter agreement will terminate immediately prior to the effectiveness of the registration statement of which this prospectus is a part. Following this offering, Mr. Steiner’s employment with us will continue at-will.
173
Table of Contents
Eric Feidner Employment Agreement
Mr. Feidner is subject to an employment agreement dated May 16, 2008 by and between Mr. Feidner and ArkivMusic, LLC (which was later merged into Steinway, Inc.), pursuant to which Mr. Feidner was initially employed as the President of ArkivMusic, LLC and which employment agreement continues to govern Mr. Feidner’s employment following his appointment as Chief Technology and Innovation Officer, effective as of October 1, 2021. Mr. Feidner’s employment agreement contains standard employment terms, including an indefinite term and a base salary. Under this employment agreement, in the event Mr. Feidner is terminated due to death, disability, or by us without cause or by Mr. Feidner for good reason (each as defined in the employment agreement), Mr. Feidner is entitled to six months of continued base salary, payable in six equal monthly installments, subject to Mr. Feidner’s execution and non-revocation of a release of claims and continued compliance with restrictive covenants, including one-year post-employment confidentiality, non-competition, and non-solicitation covenants. In addition, upon Mr. Feidner’s termination of employment for any reason, he is entitled to continued participation, at his own expense, in health and medical plans at employee rates until he becomes a participant in another plan or for as long as permitted by applicable law.
Ron Losby Employment Agreement
Mr. Losby was subject to an employment agreement dated May 1, 2011 and amended December 31, 2012 by and between Mr. Losby and Steinway, Inc., which employment agreement governed Mr. Losby’s employment as Chief Executive Officer until his retirement effective August 31, 2021. Mr. Losby’s employment agreement contained standard employment terms, including one-year automatically renewing terms, a base salary, bonus eligibility, and a housing allowance of up to $25,100 per year. Under his employment agreement, in the event Mr. Losby was terminated by us without cause (including via a notice of non-renewal of the term) or by him with good reason (as such terms were defined in the employment agreement), Mr. Losby was entitled to (i) a pro-rata bonus for the year of termination, (ii) one year of his then-current annual base salary (or two years if the termination occurred within 12 months following a change in control (as defined in the employment agreement)), and (iii) the greater of his target bonus for the year of termination or his actual annual bonus for the year prior to the year of termination. Mr. Losby’s employment agreement also contained one-year post-employment confidentiality, non-competition, and non-solicitation covenants. In addition, upon Mr. Losby’s termination of employment for any reason, he was entitled to continued participation, at his own expense, in health and medical plans at employee rates until he became a participant in another plan or for as long as permitted by applicable law.
2021 Director Compensation
For all of 2021, a loaner piano (the rental value of which for the year was $14,208) was provided to John Paulson for personal use. Other than this loaner piano, none of our non-employee directors received any compensation for his or her service as a non-employee director during fiscal year 2021 and none of our non-employee directors held equity awards (vested or unvested) as of December 31, 2021.
In connection with this offering, we have approved and intend to implement a compensation policy that, effective upon the closing of this offering, will be applicable to all of our non-employee directors who are not employees or equityholders of Paulson & Co., Inc. Under this compensation policy, each such non-employee director will receive an annual cash retainer of $65,000. In addition, (i) the Chairperson of the Board shall receive an additional annual retainer of $40,000, (ii) the Chairpersons of the Audit Committee, Compensation Committee, and Nominating and Corporate Governance Committee, shall receive additional annual retainers of $20,000, $15,000, and $10,000,
174
Table of Contents
respectively, and (ii) non-Chairperson members of the Audit Committee, Compensation Committee, and Nominating and Corporate Governance Committee shall receive additional annual retainers of $10,000, $5,000, and $7,500, respectively. In addition, each such non-employee director will receive an annual restricted stock unit award with a grant date value of $110,000 (or, in the case of the Chairperson of the Board, $150,000) on the date of each annual meeting, with all such annual restricted stock unit awards vesting on the first anniversary of the grant date of the award (or immediately prior to the date of the annual shareholder meeting immediately following the date of grant, if sooner), subject to such non-employee director continuing in service through such date. The vesting of all restricted stock unit awards under the policy will accelerate and vest in full upon a change in control (as defined in the 2022 Plan, described below).
New Equity Plans
2022 Incentive Award Plan
In connection with this offering, we intend to adopt and have our shareholders approve the 2022 Incentive Award Plan, or the 2022 Plan, under which we may grant cash and equity incentive awards to eligible employees and other service providers in order to attract, motivate and retain the talent for which we compete. The material terms of the 2022 Plan are summarized below. The description below is meant to be general in nature and is qualified in its entirety by reference to the full text of the 2022 Plan, a form of which has been filed as an exhibit to the registration statement of which this prospectus is a part.
Eligibility and Administration. Our employees, consultants and directors, and the employees and consultants of our subsidiaries, will be eligible to receive awards under the 2022 Plan. Following our initial public offering, the 2022 Plan will be administered by our board of directors with respect to awards to non-employee directors and by our compensation committee with respect to other participants, each of which may delegate its duties and responsibilities to committees of our directors and/or officers (referred to collectively as the “plan administrator” below), subject to certain limitations that may be imposed under the 2022 Plan, Section 16 of the Exchange Act, and/or stock exchange rules, as applicable. The plan administrator will have the authority to make all determinations and interpretations under, prescribe all forms for use with, and adopt rules for the administration of, the 2022 Plan, subject to its express terms and conditions. The plan administrator will also set the terms and conditions of all awards under the 2022 Plan, including any vesting and vesting acceleration conditions.
Limitation on Awards and Shares Available. We expect a total of shares of our Class A common stock (intended to be equal to 10% of the total shares of our Class A common stock and Class B common stock outstanding immediately prior to this offering) will initially be available for issuance under the 2022 Plan. The number of shares initially available for issuance will be increased by an annual increase on January 1 of each calendar year beginning in 2023 and ending in and including 2032, equal to the lesser of (A) 5% of the total number of combined shares of our Class A common stock and Class B common stock outstanding on the final day of the immediately preceding calendar year and (B) a smaller number of shares as determined by our board of directors. No more than shares of Class A common stock may be issued under the 2022 Plan upon the exercise of incentive stock options. Shares available under the 2022 Plan may be authorized but unissued shares, shares purchased on the open market or treasury shares.
If any shares subject to an award under the 2022 Plan are forfeited, expire, are converted to shares of another entity in connection with certain corporate events, are surrendered pursuant to an “exchange program” (as described below), are tendered or withheld to satisfy the exercise price or tax withholding obligations associated with an award or if such award is settled for cash, any shares
175
Table of Contents
subject to such award may, to the extent of such forfeiture, expiration or cash settlement, be used again for new grants under the 2022 Plan. However, the following shares may not be used again for grant under the 2022 Plan: (i) shares subject to a stock appreciation right, or SAR, or other stock-settled award that are not issued in connection with the stock settlement of the SAR or other stock-settled award on its exercise; and (ii) shares purchased on the open market with the cash proceeds from the exercise of options.
Awards granted under the 2022 Plan upon the assumption of, or in substitution for, outstanding equity awards previously granted by an entity in connection with a corporate transaction, such as a merger, combination, consolidation or acquisition of property or stock, will not reduce the shares available for grant under the 2022 Plan.
The 2022 Plan will provide that the sum of any cash compensation and the aggregate grant date fair value (determined as of the date of the grant under ASC 718 or any successor thereto) of all awards granted to a non-employee director pursuant to the 2022 Plan as compensation for services as a non-employee director during any calendar year shall not exceed the amount equal to $750,000 (with such amount increased to $1,000,000 for the calendar year of a non-employee director’s initial service). The plan administrator may make exceptions to this limit for individual non-employee directors in extraordinary circumstances, as the plan administrator may determine in its discretion, provided that the non-employee director receiving such additional compensation may not participate in the decision to award such compensation or in other contemporaneous compensation decisions involving non-employee directors.
Awards. The 2022 Plan provides for the grant of stock options, including incentive stock options, or ISOs, and nonqualified stock options, or NSOs, restricted stock, dividend equivalents, restricted stock units, or RSUs, other stock-based awards, SARs, and cash awards. Certain awards under the 2022 Plan may constitute or provide for a deferral of compensation, subject to Section 409A of the Code, which may impose additional requirements on the terms and conditions of such awards. All awards under the 2022 Plan (other than cash awards) will be set forth in award agreements, which will detail all terms and conditions of the awards, including any applicable vesting and payment terms and post-termination exercise limitations. Awards other than cash awards generally will be settled in shares of our Class A common stock, but the plan administrator may provide for cash settlement of any award. A brief description of each award type follows.
| • | Stock Options. Stock options provide for the purchase of shares of our Class A common stock in the future at an exercise price set on the grant date. ISOs, by contrast to NSOs, may provide tax deferral beyond exercise and favorable capital gains tax treatment to their holders if certain holding period and other requirements of the Code are satisfied. The exercise price of a stock option may not be less than 100% of the fair market value of the underlying share on the date of grant (or 110% in the case of ISOs granted to certain significant stockholders), except with respect to certain substitute options granted in connection with a corporate transaction. The term of a stock option may not be longer than ten years (or five years in the case of ISOs granted to certain significant stockholders). Vesting conditions determined by the plan administrator may apply to stock options and may include continued service, performance and/or other conditions. |
| • | SARs. SARs entitle their holder, upon exercise, to receive from us an amount equal to the appreciation of the shares subject to the award between the grant date and the exercise date. The exercise price of a SAR may not be less than 100% of the fair market value of the underlying share on the date of grant (except with respect to certain substitute SARs granted in connection with a corporate transaction) and the term of a SAR may not be longer than ten years. Vesting conditions determined by the plan administrator may apply to SARs and may include continued service, performance and/or other conditions. |
176
Table of Contents
| • | Restricted Stock and RSUs. Restricted stock is an award of nontransferable shares of our Class A common stock that remain forfeitable unless and until specified conditions are met, and which may be subject to a purchase price. RSUs are contractual promises to deliver shares of our Class A common stock in the future, which may also remain forfeitable unless and until specified conditions are met. Delivery of the shares underlying RSUs may be deferred under the terms of the award or at the election of the participant, if the plan administrator permits such a deferral. Conditions applicable to restricted stock and RSUs may be based on continuing service, the attainment of performance goals and/or such other conditions as the plan administrator may determine. Holders of restricted stock generally have all of the rights of a stockholder upon the issuance of restricted stock, but dividends paid with respect to a share of restricted stock prior to such share vesting shall be paid to the holder only to the extent such share subsequently vests. RSU holders have no rights of a stockholder with respect to shares subject to RSUs unless and until such shares are delivered in settlement of the RSUs. In the sole discretion of the plan administrator, RSUs may also be settled for an amount of cash equal to the fair market value of the shares underlying the RSU on the RSU’s maturity date, or a combination of cash and shares. |
| • | Other Stock or Cash-Based Awards. Other stock or cash-based awards are awards of cash, fully vested shares of our Class A common stock and other awards denominated in, linked to, or derived from shares of our Class A common stock or value metrics related to our shares. Other stock or cash-based awards may be granted to participants and may also be available as a payment form in the settlement of other awards, as standalone payments and as payment in lieu of base salary, bonus, fees or other cash compensation otherwise payable to any individual who is eligible to receive awards. Conditions applicable to other stock or cash-based awards may be based on continuing service, the attainment of performance goals and/or such other conditions as the plan administrator may determine. |
| • | Dividend Equivalents. Dividend equivalents represent the right to receive the equivalent value of dividends paid on shares of our Class A common stock and may be granted alone or in tandem with awards other than restricted stock, stock options or SARs. Dividend equivalents are credited as of dividend record dates during the period between the date an award is granted and the date such award terminates or expires, as determined by the plan administrator. |
Performance Awards. Performance awards include any of the foregoing awards that are granted subject to vesting and/or payment based on the attainment of specified performance goals or other criteria the plan administrator may determine, which may or may not be objectively determinable. Performance criteria upon which performance goals are established by the plan administrator may include but are not limited to: net earnings or losses (either before or after one or more of interest, taxes, depreciation, amortization, and non-cash equity-based compensation expense); gross or net sales or revenue or sales or revenue growth; net income (either before or after taxes) or adjusted net income; profits (including but not limited to gross profits, net profits, profit growth, net operation profit or economic profit), profit return ratios or operating margin; budget or operating earnings (either before or after taxes or before or after allocation of corporate overhead and bonus); cash flow (including operating cash flow and free cash flow or cash flow return on capital); return on assets; return on capital or invested capital; cost of capital; return on stockholders’ equity; total stockholder return; return on sales; costs, reductions in costs and cost control measures; expenses; working capital; earnings or loss per share; adjusted earnings or loss per share; price per share or dividends per share (or appreciation in or maintenance of such price or dividends); regulatory achievements or compliance; implementation, completion or attainment of objectives relating to research, development, regulatory, commercial, or strategic milestones or developments; market share; economic value or economic value added models; division, group or corporate financial goals; customer satisfaction/growth; customer service; employee satisfaction; recruitment and maintenance of personnel; human resources
177
Table of Contents
management; environmental, social and governance measures; supervision of litigation and other legal matters; strategic partnerships and transactions; financial ratios (including those measuring liquidity, activity, profitability or leverage); debt levels or reductions; sales-related goals; financing and other capital raising transactions; cash on hand; acquisition activity; investment sourcing activity; marketing initiatives; or any combination of the foregoing, any of which may be measured either in absolute terms for us or any operating unit of our company or as compared to any incremental increase or decrease or as compared to results of a peer group or to market performance indicators or indices.
Certain Transactions and Adjustments. The plan administrator will have broad discretion to take action under the 2022 Plan, as well as make adjustments to the terms and conditions of existing and future awards, to prevent the dilution or enlargement of intended benefits and facilitate necessary or desirable changes in the event of certain transactions and events affecting our Class A common stock, such as stock dividends, stock splits, mergers, acquisitions, consolidations and other corporate transactions. In addition, in the event of certain non-reciprocal transactions with our stockholders known as “equity restructurings,” the plan administrator will make equitable adjustments to the 2022 Plan and outstanding awards. In the event of a “change in control” of our company (as defined in the 2022 Plan), to the extent that the surviving entity declines to continue, convert, assume or replace outstanding awards and, provided a given participant remains employed through such change in control, any such awards held by such participant shall become fully vested, exercisable and/or payable, as applicable, and all forfeiture, repurchase and other restrictions on such award shall lapse. In the event an outstanding award is assumed or substituted for an equivalent award in connection with a change in control and the holder of such award terminates employment without “cause” (as such term is defined in the 2022 Plan or as set forth in the award agreement relating to such award) within the 12 months following the change in control, then such award will become fully vested and exercisable upon such termination of employment. Individual award agreements may provide for additional accelerated vesting and payment provisions.
Foreign Participants, Claw-Back Provisions, Transferability, and Participant Payments. The plan administrator may modify award terms, establish subplans and/or adjust other terms and conditions of awards, subject to the share limits described above, in order to facilitate grants of awards subject to the laws and/or stock exchange rules of countries outside of the United States. All awards will be subject to the provisions of any claw-back policy implemented by our company to the extent set forth in such claw-back policy and/or in the applicable award agreement. With limited exceptions for estate planning, domestic relations orders, certain beneficiary designations and the laws of descent and distribution, awards under the 2022 Plan are generally non-transferable, and are exercisable only by the participant. With regard to tax withholding, exercise price and purchase price obligations arising in connection with awards under the 2022 Plan, the plan administrator may, in its discretion, accept cash or check, provide for net withholding of shares, allow shares of our Class A common stock that meet specified conditions to be repurchased, allow a “market sell order” or such other consideration as it deems suitable.
Plan Amendment and Termination. Our board of directors may amend or terminate the 2022 Plan at any time; however, except in connection with certain changes in our capital structure, stockholder approval will be required for any amendment that increases the number of shares available under the 2022 Plan. No award may be granted pursuant to the 2022 Plan after the tenth anniversary of the date on which our board of directors adopts the 2022 Plan.
New Equity Awards
In connection with this offering, we intend to grant equity awards with respect to shares of our Class A common stock under the 2022 Plan to certain of our employees, including certain of our named executive officers. These equity awards are expected to consist of restricted stock unit awards,
178
Table of Contents
which awards are expected to vest in four equal annual installments on the first four anniversaries of the offering. The aggregate number of shares of Class A common stock subject to these awards will be determined based on the initial public offering price per share of our Class A common stock in this offering and will be approximately (based on the midpoint of the price range of our Class A common stock set forth on the cover page of the prospectus ($ per share)). A form of restricted stock unit agreement has been filed as an exhibit to the registration statement of which this prospectus is a part.
ESPP
In connection with this offering, we intend to adopt and have our shareholders approve the 2022 Employee Stock Purchase Plan, or ESPP. The material terms of the ESPP are summarized below. The description below is intended to be general in nature and is qualified in its entirety by reference to the full text of the ESPP, a form of which has been filed as an exhibit to the registration statement of which this prospectus is a part.
The ESPP will be comprised of two distinct components in order to provide increased flexibility to grant options to purchase shares under the ESPP. Specifically, the ESPP will authorize (1) the grant of options to employees that are intended to qualify for favorable U.S. federal tax treatment under Section 423 of the Code (the “Section 423 Component”), and (2) the grant of options that are not intended to be tax-qualified under Section 423 of the Code to facilitate participation for employees who are not eligible to benefit from favorable U.S. federal tax treatment and, to the extent applicable, to provide flexibility to comply with non-U.S. laws and other considerations (the “Non-Section 423 Component”). The Non-Section 423 Component will generally be operated and administered on terms and conditions similar to the Section 423 Component, except as otherwise required by applicable law, rule or regulation.
Shares Available; Administration. We expect a total of shares of our Class A common stock (intended to be equal to 1.5% of the total shares of our Class A common stock and Class B common stock outstanding immediately prior to this offering) will initially be available for issuance under our ESPP. In addition, the number of shares available for issuance under the ESPP will be annually increased on January 1 of each calendar year beginning in 2023 and ending in 2032, by an amount equal to the lesser of: (i) 1% of the aggregate number of total shares of our Class A common stock and Class B common stock outstanding on the final day of the immediately preceding calendar year and (ii) such smaller number of shares as is determined by our board of directors. Subject to adjustment upon certain changes in our capitalization, no more than shares of our Class A common stock will be available for issuance under the Section 423 Component.
The compensation committee of our board of directors will be the plan administrator of the ESPP and will have authority to interpret the terms of the ESPP and determine eligibility of participants.
Eligibility. The plan administrator may designate certain of our subsidiaries as participating “designated subsidiaries” in the ESPP and may change these designations from time to time. Employees of our company and our designated subsidiaries are eligible to participate in the ESPP if they meet the eligibility requirements under the ESPP established from time to time by the plan administrator. However, an employee may not be granted rights to purchase stock under the ESPP if such employee, immediately after the grant, would own (directly or through attribution) stock possessing 5% or more of the total combined voting power or value of all classes of our common or other class of stock.
If the grant of a purchase right under the ESPP to any eligible employee who is a citizen or resident of a foreign jurisdiction would be prohibited under the laws of such foreign jurisdiction or the
179
Table of Contents
grant of a purchase right to such employee in compliance with the laws of such foreign jurisdiction would cause the ESPP to violate the requirements of Section 423 of the Code, as determined by the plan administrator in its sole discretion, such employee will not be permitted to participate in the Section 423 Component.
Eligible employees become participants in the ESPP by enrolling and authorizing payroll deductions by the deadline established by the plan administrator prior to the relevant offering date. Directors who are not employees, as well as consultants, are not eligible to participate in the ESPP. Employees who choose not to participate, or are not eligible to participate at the start of an offering period but who become eligible thereafter, may enroll in any subsequent offering period.
Participation in an Offering. Stock will be offered under the ESPP during offering periods. The length of offering periods under the ESPP will be determined by the plan administrator and may be up to 27 months long. Employee payroll deductions will be used to purchase shares on the last day of each offering period (or such other date as set forth in the offering document). Offering periods under the ESPP will commence when determined by the plan administrator. The plan administrator may, in its discretion, modify the terms of future offering periods. To the extent applicable, in non-U.S. jurisdictions where participation in the ESPP through payroll deductions is prohibited, the plan administrator may provide that an eligible employee may elect to participate through contributions to the participant’s account under the ESPP in a form acceptable to the plan administrator in lieu of or in addition to payroll deductions.
The ESPP will permit participants to purchase our Class A common stock through payroll deductions of up to 40% of their eligible compensation (or such other amount as determined by the compensation committee), which will include a participant’s gross base compensation for services to us. The maximum number of shares that may be purchased by a participant during any offering period or purchase period is 5,000 shares. In addition, no employee will be permitted to accrue the right to purchase stock under the Section 423 Component at a rate in excess of $25,000 worth of shares during any calendar year during which such a purchase right is outstanding (based on the fair market value per share of our Class A common stock as of the first day of the offering period).
On the first trading day of each offering period, each participant automatically will be granted an option to purchase shares of our Class A common stock. The option will be exercised on the applicable purchase date(s) during the offering period, to the extent of the payroll deductions accumulated during the applicable purchase period. The purchase price of the shares, in the absence of a contrary determination by the plan administrator, will be 85% of the lower of the fair market value of our Class A common stock on the first trading day of the offering period or on the applicable purchase date, which will be the final trading day of the applicable purchase period.
Participants may voluntarily end their participation in the ESPP at any time at least one week prior to the end of the applicable offering period (or such longer or shorter period specified by the plan administrator), and will be paid their accrued payroll deductions that have not yet been used to purchase shares of Class A common stock. Participation ends automatically upon a participant’s termination of employment.
Transferability. A participant may not transfer rights granted under the ESPP other than by will, the laws of descent and distribution or as otherwise provided in the ESPP.
Certain Transactions. In the event of certain transactions or events affecting our Class A common stock, such as any stock dividend or other distribution, change in control, reorganization, merger, consolidation or other corporate transaction, the plan administrator will make equitable adjustments to the ESPP and outstanding rights. In addition, in the event of the foregoing transactions
180
Table of Contents
or events or certain significant transactions, including a change in control, the plan administrator may provide for (i) either the replacement of outstanding rights with other rights or property or termination of outstanding rights in exchange for cash, (ii) the assumption or substitution of outstanding rights by the successor or survivor corporation or parent or subsidiary thereof, (iii) the adjustment in the number and type of shares of stock subject to outstanding rights, (iv) the use of participants’ accumulated payroll deductions to purchase stock on a new purchase date prior to the next scheduled purchase date and termination of any rights under ongoing offering periods or (v) the termination of all outstanding rights.
Plan Amendment; Termination. The plan administrator may amend, suspend or terminate the ESPP at any time. However, stockholder approval of any amendment to the ESPP must be obtained for any amendment which increases the aggregate number or changes the type of shares that may be sold pursuant to rights under the ESPP or changes the corporations or classes of corporations whose employees are eligible to participate in the ESPP.
181
Table of Contents
PRINCIPAL AND SELLING STOCKHOLDERS
The following tables set forth information as of April 30, 2022 with respect to the ownership of our common stock by:
| • | the selling stockholders and certain of their affiliates, which represent the only persons or group of affiliated persons known by us to beneficially own more than five percent of our common stock; |
| • | each of our directors and director nominees; |
| • | each of our named executive officers; and |
| • | all of our executive officers, directors and director nominees as a group. |
The amounts and percentages of shares beneficially owned are reported on the basis of regulations of the SEC governing the determination of beneficial ownership of securities. Under SEC rules, a person is deemed to be a “beneficial owner” of a security if that person has or shares “voting power,” which includes the power to vote or direct the voting of such security, or “investment power,” which includes the power to dispose of or direct the disposition of such security. A person is also deemed to be a beneficial owner of any securities of which that person has a right to acquire beneficial ownership within 60 days of April 30, 2022.
Securities that can be so acquired are deemed to be outstanding for purposes of computing such person’s ownership percentage, but not for purposes of computing any other person’s percentage. Under these rules, more than one person may be deemed to be a beneficial owner of the same securities, and a person may be deemed to be a beneficial owner of securities as to which such person has no economic interest.
Percentage computations are based on approximately shares of our Class A common stock and shares of our Class B common stock outstanding as of April 30, 2022 (reflecting the Distribution, Stock Split and Reclassification), and shares of our Class A common stock (or shares, if the underwriters exercise in full their option to purchase additional shares of our Class A common stock) and shares of our Class B common stock outstanding following this offering (or shares, if the underwriters exercise in full their option to purchase additional shares of our Class A common stock). Additionally, the table below assumes no purchases of our Class A common stock by the beneficial owners identified therein through our Reserved Share Program. See “Underwriting—Reserved Share Program.”
182
Table of Contents
Except as otherwise indicated in these footnotes, each of the beneficial owners listed has, to our knowledge, sole voting and investment power with respect to the indicated shares of common stock. Unless otherwise set forth in the footnotes to the table, the address for each listed stockholder is c/o Steinway Musical Instruments Holdings, Inc., 1 Steinway Place, Astoria, New York 11105.
| Shares Beneficially Owned Before the Offering | Shares Offered Hereby | Shares Beneficially Owned After the Offering Assuming No Exercise of Underwriters’ Option | Shares Beneficially Owned After the Offering Assuming Full Exercise of Underwriters’ Option | |||||||||||||||||||||||||||||||||||||||||||||||||||||||||||||
| Class A Common Stock | Class B Common Stock | % of Total Voting Power Before the Offering(1) | Class A | Class B | % of Total Voting Power After Offering(1) | Class A | Class B | % of Total Voting Power After Offering(1) | ||||||||||||||||||||||||||||||||||||||||||||||||||||||||
| Shares | % | Shares | % | Shares | % | Shares | % | Shares | % | Shares | % | |||||||||||||||||||||||||||||||||||||||||||||||||||||
5% Stockholders and Selling Stockholders | ||||||||||||||||||||||||||||||||||||||||||||||||||||||||||||||||
John Paulson and certain affiliated entities(2) | ||||||||||||||||||||||||||||||||||||||||||||||||||||||||||||||||
Directors, Director Nominees and Named Executive Officers | ||||||||||||||||||||||||||||||||||||||||||||||||||||||||||||||||
Benjamin Steiner(3) | ||||||||||||||||||||||||||||||||||||||||||||||||||||||||||||||||
Maia Moutopoulos | ||||||||||||||||||||||||||||||||||||||||||||||||||||||||||||||||
Eric Feidner | ||||||||||||||||||||||||||||||||||||||||||||||||||||||||||||||||
John Paulson(2) | ||||||||||||||||||||||||||||||||||||||||||||||||||||||||||||||||
Michael Waldorf | ||||||||||||||||||||||||||||||||||||||||||||||||||||||||||||||||
Wei Wei | ||||||||||||||||||||||||||||||||||||||||||||||||||||||||||||||||
Howard Gurvitch | ||||||||||||||||||||||||||||||||||||||||||||||||||||||||||||||||
| Benjamin Mensah | ||||||||||||||||||||||||||||||||||||||||||||||||||||||||||||||||
| Ron Losby(4) | ||||||||||||||||||||||||||||||||||||||||||||||||||||||||||||||||
All Current Directors, Director Nominees and Executive Officers as a Group (Eight Persons) | ||||||||||||||||||||||||||||||||||||||||||||||||||||||||||||||||
| * | Less than one percent. |
| (1) | Percentage of total voting power represents voting power with respect to all shares of our Class A common stock and Class B common stock, as a single class. The holders of our Class B common stock are entitled to ten votes per share, and holders of our Class A common stock are entitled to one vote per share. For more information about the voting rights of our Class A and Class B common stock, see “Description of Capital Stock—Common Stock.” |
| (2) | Represents shares held directly by John Paulson, shares held directly by Paulson Advantage Master Ltd., and shares held directly by Paulson Advantage Plus Master Ltd. John Paulson exercises sole voting and investment power over the shares listed above. The address for each of the persons and entities named in this footnote is c/o Paulson & Co. Inc., 1133 Avenue of the Americas, New York, NY 10036. |
| (3) | Represents shares of Class A common stock and shares of restricted Class A common stock. |
| (4) | Ron Losby resigned as Chief Executive Officer effective as of August 31, 2021. |
183
Table of Contents
CERTAIN RELATIONSHIPS AND RELATED PARTY TRANSACTIONS
Other than compensation arrangements for our executive officers and directors that are described elsewhere in this prospectus, below we describe transactions since January 1, 2019 to which we were or will be a participant and in which:
| • | The amounts involved exceeded or will exceed $120,000; and |
| • | Any of our directors, executive officers or holders of more than 5% of our capital stock, or any member of the immediate family of, or person sharing the household with, the foregoing persons, had or will have a direct or indirect material interest. |
Relationship with John Paulson and Certain Affiliated Entities Following this Offering
Following this offering, John Paulson and certain affiliated entities will continue to hold more than a majority of the total combined voting power of our outstanding common stock. As a result, John Paulson and certain affiliated entities will continue to have significant control of our business, including pursuant to the agreements described below. See “Risk Factors—Risks Related to This Offering and Ownership of Our Class A Common Stock—The dual class structure of our common stock and the existing ownership of Class B common stock by John Paulson and certain affiliated entities have the effect of concentrating voting control with John Paulson and certain affiliated entities for the foreseeable future, which will limit or preclude your ability to influence corporate matters.”
Stockholders Agreement
The Stockholders Agreement will require us to, among other things, nominate a number of individuals for election as our directors at any meeting of our stockholders, designated by John Paulson and certain affiliated entities (each such individual a “Paulson Designee”), such that, upon the election of such individual and each other individual nominated by or at the direction of our board of directors or a duly-authorized committee of the board, as a director of our company, the number of: Paulson Designees serving as directors will be equal to (i) four directors, if John Paulson and certain affiliated entities continue to beneficially own at least 35% of the aggregate number of shares of common stock outstanding immediately following this offering, (ii) three directors, if John Paulson and certain affiliated entities continue to beneficially own less than 35% but at least 25% of the aggregate number of shares of common stock outstanding immediately following this offering, (iii) two directors, if John Paulson and certain affiliated entities continue to beneficially own less than 25% but at least 15% of the aggregate number of shares of common stock outstanding immediately following this offering, or (iv) one director, if John Paulson and certain affiliated entities continue to beneficially own less than 15% but more than 5% of the aggregate number of shares of common stock outstanding immediately following this offering.
If the number of individuals that John Paulson and certain affiliated entities have the right to designate is decreased because of the decrease in their ownership, then one or more Paulson Designees will immediately tender his or her resignation for consideration by our board of directors and, if such resignation is requested by the board of directors, such director shall resign within thirty days of the date on which John Paulson and certain affiliated entities’ right to designate individuals for election as our directors was decreased pursuant to the terms of the Stockholders Agreement. Notwithstanding the foregoing, a director may resign at any time regardless of the period of time left in his or her then current term.
Registration Rights Agreement
We intend to enter into a registration rights agreement with John Paulson and certain affiliated entities and Mr. Steiner (the “Registration Rights Agreement”) prior to the consummation of this
184
Table of Contents
offering. The Registration Rights Agreement will provide for demand registration rights, S-3 registration rights and piggyback registration rights. For a description of these registration rights, see the section titled “Description of Capital Stock—Registration Rights.”
Relationships with Other Directors, Executive Officers and Affiliates
In May 2016, Mr. Steiner, our Chief Executive Officer, entered into an employment letter agreement, which agreement was updated via letter amendment in January 2018, with Paulson & Co., pursuant to which, in addition to certain cash salary and bonuses, Mr. Steiner was granted a 4% profits interest in Paulson & Co.’s equity in SMI (increasing to 6% upon Mr. Steiner becoming Chief Executive Officer of SMI) that vested over a four-year period ending on May 1, 2020. Upon full vesting of the awards, or upon termination, the awards permitted settlement in stock of SMI or in cash, at the election of Mr. Steiner. During 2020, Paulson & Co. settled the compensation arrangements on SMI’s behalf in cash for $17.6 million.
In July 2021, Mr. Steiner entered into an equity participation arrangement with Parent, whereby Parent awarded Mr. Steiner a 5% profits interest in Parent (the “Class B Units”). 25% of the Class B Units vested upon execution of the agreement, an additional 25% vested on April 30, 2022, and the remaining 50% vests in two equal installments on April 30 of each of 2023 and 2024. Upon full vesting of the Class B Units Mr. Steiner, at his election, has the option to liquidate the Class B Units in the form of a redemption by Parent at the price specified therein. In connection with this offering, Parent will be liquidated and Mr. Steiner will receive shares of our common stock in exchange for his Class B Units, as further described in “Executive Compensation—Equity Compensation” and Note 14 to our consolidated financial statements appearing elsewhere in this prospectus.
Sublease Agreement
In December 2017, our subsidiary, Steinway, Inc., entered into a sublease agreement with Paulson & Co., pursuant to which Paulson & Co. subleases an office facility located at 1133 Avenue of the Americas, New York, New York 10036 from Steinway, Inc. The sublease commenced on January 1, 2018 and extends through December 31, 2022, and includes an option to be extended for an additional five-year period through December 31, 2027 and thereafter through the expiration date of the original lease. Paulson & Co., as sublessee, must directly remit to the landlord any rent and incidental charges.
Director Indemnification Agreements
We have entered into, and plan on entering into, indemnification agreements with each of our directors and executive officers. See “Description of Capital Stock—Limitations on Liability and Indemnification Matters.”
Reserved Share Program
At our request, an affiliate of BofA Securities, Inc., a participating underwriter, has reserved for sale, at the initial public offering price, up to 5% of the shares offered by this prospectus for sale to some of our directors, officers, employees, distributors, dealers, business associates and related persons. For additional information, see “Underwriting—Reserved Share Program.”
Policies and Procedures for Related Party Transactions
Our board of directors will adopt a written related person transaction policy, which will become effective upon the closing of this offering, setting forth the policies and procedures for the review and
185
Table of Contents
approval or ratification of related person transactions. This policy covers, with certain exceptions set forth in Item 404 of Regulation S-K under the Securities Act, any transaction, arrangement or relationship, or any series of similar transactions, arrangements or relationships, in which we were or are to be a participant, where the amount involved exceeds $120,000 in any fiscal year and a related person had, has or will have a direct or indirect material interest, including without limitation, purchases of goods or services by or from the related person or entities in which the related person has a material interest, indebtedness, guarantees of indebtedness and employment by us of a related person. In reviewing and approving any such transactions, our audit committee is tasked to consider all relevant facts and circumstances, including, but not limited to, whether the transaction is on terms comparable to those that could be obtained in an arm’s length transaction and the extent of the related person’s interest in the transaction. All of the transactions described in this section occurred prior to the adoption of this policy.
186
Table of Contents
The following description of our capital stock and certain provisions of our amended and restated certificate of incorporation and amended and restated bylaws are summaries and are qualified by reference to the amended and restated certificate of incorporation and the amended and restated bylaws that will be in effect prior to the closing of this offering. Copies of these documents will be filed with the SEC as exhibits to our registration statement, of which this prospectus forms a part. The descriptions of our Class A common stock, Class B common stock and preferred stock reflect changes to our capital structure that will occur upon the closing of this offering.
General
Upon the closing of this offering, our authorized capital stock will consist of 500,000,000 shares of Class A common stock, par value of $0.0001 per share, 100,000,000 shares of Class B common stock, par value $0.0001 per share, and 50,000,000 shares of preferred stock, par value $0.0001 per share.
As of , 2022, after giving effect to (i) the Distribution, (ii) the filing and effectiveness of our amended and restated certificate of incorporation (ii) the Reclassification and (iii) the Stock Split, there were shares of our Class A common stock outstanding held by one stockholder of record and shares of our Class B common stock outstanding, held by three stockholders of record, and no shares of our preferred stock outstanding.
Common Stock
We have two classes of authorized common stock, Class A common stock and Class B common stock. The rights of the holders of Class A common stock and Class B common stock are generally identical, except with respect to voting and conversion.
Dividend Rights
The DGCL permits a corporation to declare and pay dividends out of “surplus” or, if there is no “surplus,” out of its net profits for the fiscal year in which the dividend is declared or the preceding fiscal year. “Surplus” is defined as the excess of the net assets of the corporation over the amount determined to be the capital of the corporation by the board of directors. The capital of the corporation is typically calculated to be (and cannot be less than) the aggregate par value of all issued shares of capital stock. Net assets equal the fair value of the total assets minus total liabilities. The DGCL also provides that dividends may not be paid out of net profits if, after the payment of the dividend, capital is less than the capital represented by the outstanding stock of all classes having a preference upon the distribution of assets.
Declaration and payment of any dividend will be subject to the discretion of our board of directors. The time and amount of dividends will depend upon our financial condition, operations, cash requirements and availability, debt repayment obligations, capital expenditure needs, restrictions in our debt instruments, industry trends, the provisions of Delaware law affecting the payment of distributions to shareholders and any other factors our board of directors may consider relevant.
Any decision to declare and pay dividends in the future will be made at the sole discretion of our board of directors and will depend on, among other things, our results of operations, cash requirements, financial condition, contractual restrictions and other factors that our board of directors may deem relevant. Our ability to pay dividends will be limited by covenants in our existing indebtedness and may be limited by the agreements governing other indebtedness that we or our subsidiaries incur in the future. See “Management’s Discussion and Analysis of Financial Condition
187
Table of Contents
and Results of Operations—Liquidity and Capital Resources—Debt.” In addition, because we are a holding company and have no direct operations, we will only be able to pay dividends from funds we receive from our subsidiaries. See the section titled “Dividend Policy” for additional information.
Voting Rights
Holders of our Class A common stock are entitled to one vote for each share of Class A common stock held on all matters submitted to a vote of stockholders and holders of our Class B common stock are entitled to ten votes for each share of Class B common stock held on all matters submitted to a vote of stockholders. Following this offering, the holders of our outstanding Class B common stock will hold % of the voting power of our outstanding capital stock. Holders of shares of our Class A common stock and Class B common stock vote together as a single class on all matters (including the election of directors) submitted to a vote of stockholders, unless otherwise required by Delaware law or our amended and restated certificate of incorporation. Delaware law could require either holders of our Class A common stock or Class B common stock to vote separately as a single class in the following circumstances:
| • | if we were to seek to amend our amended and restated certificate of incorporation to increase or decrease the par value of a class of our capital stock, then that class would be required to vote separately to approve the proposed amendment; and |
| • | if we were to seek to amend our amended and restated certificate of incorporation in a manner that alters or changes the powers, preferences, or special rights of a class of our capital stock in a manner that affected its holders adversely, then that class would be required to vote separately to approve the proposed amendment. |
Our amended and restated certificate of incorporation does not provide for cumulative voting for the election of directors. As a result, the holders of a majority of the voting power of our outstanding capital stock can elect all of the directors then standing for election. Our amended and restated certificate of incorporation establishes a classified board of directors, to be divided into three classes with staggered three-year terms. Only one class of directors will be elected at each annual meeting of our stockholders, with the other classes continuing for the remainder of their respective three-year terms.
Board Designation Rights
Pursuant to the Stockholders Agreement, John Paulson and certain affiliated entities will have certain board designation rights following this offering. See “Certain Relationships and Related Party Transactions—Relationship with John Paulson and Certain Affiliated Entities Following this Offering—Stockholders Agreement.”
No Preemptive or Similar Rights
Our common stock is not entitled to preemptive rights and is not subject to redemption or sinking fund provisions.
Right to Receive Liquidation Distributions
Upon our liquidation, dissolution, or winding up, the assets legally available for distribution to our stockholders would be distributable ratably among the holders of our Class A common stock, Class B common stock and any participating preferred stock outstanding at that time, subject to the prior satisfaction of all outstanding debt and liabilities and the preferential rights of and the payment of liquidation preferences, if any, on any shares of preferred stock outstanding at that time, and unless
188
Table of Contents
disparate or different treatment of the shares of each class of common stock is approved by the affirmative vote of the holders of a majority of the outstanding shares of Class A common stock and Class B common stock, each voting as a separate class.
Change of Control Transactions
In the case of any distribution or payment in respect of the shares of our Class A common stock or Class B common stock upon a merger or consolidation with or into any other entity, or other substantially similar transaction, the holders of our Class A common stock and Class B common stock will be treated equally and identically with respect to shares of Class A common stock or Class B common stock owned by them; provided, however, shares of each class may receive, or have the right to elect to receive, different or disproportionate consideration if (i) the only difference in the per share consideration is that the shares to be distributed to a holder of a share of Class B common stock have equal or greater voting power than any securities distributed to a holder of a share of Class A common stock or (ii) such disparate consideration is approved by the affirmative vote of the holders of a majority of the outstanding shares of Class A common stock and Class B common stock, each voting separately as a class.
Subdivisions and Combinations
If we subdivide or combine in any manner outstanding shares of Class A common stock or Class B common stock, the outstanding shares of the other class will be subdivided or combined in the same manner, unless different treatment of the shares of each class is approved by the affirmative vote of the holders of a majority of the outstanding shares of Class A common stock and Class B common stock, each voting as a separate class.
Conversion
Each outstanding share of Class B common stock is convertible at any time at the option of the holder into one share of Class A common stock. In addition, each share of Class B common stock will convert automatically into one share of Class A common stock upon any transfer, whether or not for value, which occurs after the closing of this offering, except for certain permitted transfers described in our amended and restated certificate of incorporation. Permitted transfers include transfers made to John Paulson and certain affiliated entities and any trust, general partnership, limited partnership, limited liability company, corporation or other entity over which John Paulson exercises beneficial ownership in accordance with Rule 13d-3 under the Exchange Act. Once converted or transferred and converted into Class A common stock, the Class B common stock may not be reissued.
All the outstanding shares of our Class B common stock will convert automatically into shares of our Class A common stock upon the date that is the earlier of (i) ten (10) years from the filing and effectiveness of our amended and restated certificate of incorporation in connection with this offering, (ii) the first date the aggregate number of outstanding shares of Class B common stock ceases to represent at least 5% of the aggregate number of outstanding shares of our common stock and (iii) the death or disability, as defined in our amended and restated certificate of incorporation, of John Paulson. Following such conversion, each share of Class A common stock will have one vote per share and the rights of the holders of all outstanding common stock will be identical. Once converted into Class A common stock, the Class B common stock may not be reissued.
Preferred Stock
Following the completion of this offering, our board of directors will be authorized, subject to limitations prescribed by Delaware law, to issue preferred stock in one or more series, to establish from time to time the number of shares to be included in each series, and to fix the designation, powers (including voting powers), preferences, and rights of the shares of each series and any of its
189
Table of Contents
qualifications, limitations, or restrictions, in each case without further vote or action by our stockholders. Our board of directors can also increase or decrease the number of shares of any series of preferred stock, but not below the number of shares of that series then outstanding, without any further vote or action by our stockholders. Our board of directors may authorize the issuance of preferred stock with voting or conversion rights that could adversely affect the voting power or other rights of the holders of our common stock. The issuance of preferred stock, while providing flexibility in connection with possible acquisitions and other corporate purposes, could, among other things, have the effect of delaying, deferring, or preventing a change in control of our company and might adversely affect the market price of our Class A common stock.
Restricted Stock Units
As of , 2022, we had no outstanding RSUs. In connection with this offering, we intend to grant the IPO RSUs, which grants will become effective immediately following the effectiveness of the registration statement on Form S-8 for the shares of our Class A common stock reserved for issuance under our 2022 Plan. Based on an assumed initial public offering price of $ per share, which is the midpoint of the price range set forth on the cover page of this prospectus, shares of our Class A common stock will be issuable upon the vesting and settlement of the IPO RSUs. See “Executive Compensation” for additional information regarding the IPO RSUs.
Registration Rights Agreement
The Registration Rights Agreement will grant the parties thereto certain registration rights in respect of the “registrable securities” held by them, which securities include, among others, (1) the shares of our common stock issued or issuable, or that are otherwise issuable upon exercise, conversion or exchange of any option, warrant or convertible security, (2) the shares of our common stock held by such parties and (3) any shares of common stock issued as a dividend or in connection with a combination of shares, recapitalization, merger, consolidation or other reorganization. The registration of shares of our common stock pursuant to the exercise of these registration rights would enable the holders thereof to sell such shares without restriction under the Securities Act when the applicable registration statement is declared effective. Under the Registration Rights Agreement, we will pay all expenses relating to such registrations, including the fees and disbursements of one counsel for the parties requesting that their shares be registered pursuant to the applicable registration statement. The Registration Rights Agreement also includes customary indemnification and procedural terms.
The Registration Rights Agreement will terminate on the earliest of (i) the election of John Paulson and certain affiliated entities holding a majority of the outstanding shares, (ii) with respect to John Paulson and certain affiliated entities, when they cease to hold any shares and (iii) with respect to any stockholder other than John Paulson and certain affiliated entities that is or becomes a signatory to the Registration Rights Agreement, when such stockholder may sell all of its shares without regard to volume restrictions under Rule 144 under the Securities Act.
Following the completion of this offering, the holders of an aggregate of shares of our Class B common stock, which represents % of our outstanding shares of common stock after the offering, are entitled to registration rights pursuant to the Registration Rights Agreement.
Demand Registration Rights
Following the completion of this offering, John Paulson and certain affiliated entities, who collectively hold an aggregate of shares of our common stock, which represents % of our outstanding shares of common stock after the offering, will be entitled to certain demand registration
190
Table of Contents
rights. John Paulson and certain affiliated entities may request that we prepare and file a registration statement to register their registrable securities. Following such a request, pursuant to the “piggyback” registration rights in the Registration Rights Agreement, we will provide Mr. Steiner and any other stockholders that may become party to the Registration Rights Agreement prompt written notice thereof at least five days prior to the anticipated filing date of the registration statement relating to such registration. We are not obligated to effect the proposed demand registration if (i) the demand is made within 90 days after the pricing date of a previous underwritten registered offering or (ii) the aggregate market value of the registrable shares to be sold by John Paulson and certain affiliated entities is under $50 million (provided that John Paulson and certain affiliated entities may demand registration of shares having a lesser aggregate market value if they have proposed to sell all of their registrable shares in such offering). If we determine that it would be detrimental to us and our stockholders to effect a requested registration, we may postpone each such registration for a period of up to 60 days; provided that any such delays in any 12-month period should not exceed 120 days in the aggregate.
The foregoing demand registration rights are subject to a number of additional exceptions and limitations.
Piggyback Registration Rights
In the event that we propose to register any of our securities under the Securities Act, either for our own account or for the account of other stockholders, the stockholders party to the Registration Rights Agreement will be entitled to certain “piggyback” registration rights, entitling them to notice of the registration and allowing them to include their registrable securities in such registration. These rights will apply whenever we propose to file a registration statement under the Securities Act other than with respect to (i) a registration on Form S-4 or S-8 or any similar successor forms, (ii) where the shares are not being sold for cash or (iii) where the offering is a bona fide offering of securities other than shares, even if such securities are convertible into or exchangeable or exercisable for shares.
The foregoing piggyback registration rights are subject to a number of additional exceptions and limitations.
Shelf Registration Rights
Following the completion of this offering, John Paulson and certain affiliated entities will be entitled to certain shelf registration rights. John Paulson and certain affiliated entities may request that we register their shares on a shelf registration statement if we are eligible to file such registration statement, and demand we effect a “takedown” of such shares. We are not obligated to effect a shelf takedown if (i) the demand is made within 90 days after the pricing date of a previous underwritten registered offering or (ii) the aggregate market value of the registrable shares to be sold by John Paulson and certain affiliated entities is under $50 million (provided that John Paulson and certain affiliated entities may demand a takedown of shares having a lesser aggregate market value if they have proposed to sell all of their registrable shares in such offering). If we determine that it would be detrimental to us and our stockholders to effect a requested registration, we may postpone such registration, not more than 120 days in any 12-month period, for a period of up to 60 days.
Anti-Takeover Provisions
Our amended and restated certificate of incorporation and our amended and restated bylaws, which will become effective prior to the completion of this offering, which are summarized below, may have the effect of delaying, deferring or discouraging another person from acquiring control of us. They are also designed, in part, to encourage persons seeking to acquire control of us to negotiate first with our board of directors. We believe that the benefits of increased protection of our potential ability to
191
Table of Contents
negotiate with an unfriendly or unsolicited acquirer outweigh the disadvantages of discouraging a proposal to acquire us because negotiation of these proposals could result in an improvement of their terms.
Section 203 of the Delaware General Corporation Law
Our amended and restated certificate of incorporation will contain a provision opting out of Section 203 of the Delaware General Corporation Law. However, our amended and restated certificate of incorporation will contain provisions that are similar to Section 203. Specifically, our amended and restated certificate of incorporation will provide that, subject to certain exceptions, we will not be able to engage in a “business combination” with any “interested stockholder” for three years following the date that the person became an interested stockholder, unless:
| • | prior to such time, our board of directors approved either the business combination or the transaction that resulted in the stockholder becoming an interested stockholder; |
| • | upon consummation of the transaction that resulted in the stockholder becoming an interested stockholder, the interested stockholder owned at least 85% of our voting stock outstanding at the time the transaction commenced, excluding certain shares; or |
| • | at or subsequent to that time, the business combination is approved by our board of directors and by the affirmative vote of holders of at least 66 2/3% of our outstanding voting stock that is not owned by the interested stockholder. |
Generally, a “business combination” includes a merger, asset or stock sale, consolidation involving us and the “interested stockholder” or other transactions resulting in a financial benefit to the interested stockholder. Subject to certain exceptions, an “interested stockholder” is any entity or person who, together with that entity’s or person’s affiliates and associates, owns or within the previous three years owned, 15% or more of our outstanding voting stock. For purposes of this section only, “voting stock” has the meaning given to it in Section 203.
Under certain circumstances, this provision will make it more difficult for a person who would be an “interested stockholder” to effect various business combinations with us for a period of three years. This provision may encourage companies interested in acquiring us to negotiate in advance with our board of directors. These provisions also may have the effect of preventing changes in our board of directors and may make it more difficult to accomplish transactions that stockholders may otherwise deem to be in their best interests.
Our amended and restated certificate of incorporation will provide that John Paulson and certain affiliated entities, and any group as to which such persons are a party, will not be deemed to be “interested stockholders” for purposes of this provision.
Amended and Restated Certificate of Incorporation and Amended and Restated Bylaws
Our amended and restated certificate of incorporation and our amended and restated bylaws, which will become effective prior to the completion of this offering, will include a number of provisions that could deter hostile takeovers or delay or prevent changes in control of our board of directors or management team, including the following:
Dual Class Stock
As described above in “—Common Stock—Voting Rights,” our amended and restated certificate of incorporation provides for a dual class common stock structure, which will provide holders of our
192
Table of Contents
Class B common stock with significant influence over matters requiring stockholder approval, including the election of directors and significant corporate transactions, such as a merger or other sale of our company or its assets.
Classified Board
Our amended and restated certificate of incorporation will further provide that our board of directors is divided into three classes, Class I, Class II and Class III, with each class serving staggered three-year terms. Our amended and restated certificate of incorporation provides that directors may be removed with or without cause upon the affirmative vote of a majority of the voting power of our outstanding capital stock entitled to vote generally in the election of directors, voting together as a single class; provided, however, that at any time when the holders of our Class B common stock no longer beneficially own, in the aggregate, at least the majority of the voting power of our outstanding capital stock entitled to vote generally in the election of directors, directors may only be removed for cause and upon the affirmative vote of a majority of the voting power of our outstanding capital stock entitled to vote generally in the election of directors, voting together as a single class. The existence of a classified board could delay a potential acquirer from obtaining majority control of our board of directors, and the prospect of that delay might deter a potential acquirer. See “Management—Corporate Governance—Board Composition.”
Board of Directors Vacancies
Subject to the rights of the holders of any series of preferred stock to elect directors and the rights granted pursuant to the Stockholders Agreement, our amended and restated certificate of incorporation and amended and restated bylaws will authorize our board of directors to fill vacant directorships, including newly created seats, and the number of directors constituting our board of directors will be permitted to be set only by a resolution adopted by our board of directors. These provisions would prevent a stockholder from increasing the size of our board of directors and then gaining control of our board of directors by filling the resulting vacancies with its own nominees. This will make it more difficult to change the composition of our board of directors and will promote continuity of management.
Stockholder Action; Special Meeting of Stockholders
Our amended and restated certificate of incorporation will provide that at any time when the holders of our Class B common stock no longer beneficially own, in the aggregate, at least the majority of the voting power of our outstanding capital stock, our stockholders may not take action by written consent, but may only take action at annual or special meetings of our stockholders. As a result, a holder controlling a majority of our capital stock would not be able to amend our amended and restated bylaws or remove directors without holding a meeting of our stockholders called in accordance with our amended and restated bylaws. Our amended and restated certificate of incorporation will further provide that at any time when the holders of our Class B common stock no longer beneficially own, in the aggregate, at least the majority of the voting power of our outstanding capital stock, special meetings of our stockholders may be called only by a majority of our board of directors, the chairperson of our board of directors and our Chief Executive Officer, thus prohibiting a stockholder from calling a special meeting. Additionally, so long as the holders of our Class B common stock beneficially own, in the aggregate, at least the majority of the voting power of our outstanding capital stock, the holders of at least a majority of the voting power of the then outstanding shares of our capital stock may take action by written consent or request that a special meeting of stockholders be called. These provisions might delay the ability of our stockholders to force consideration of a proposal or for stockholders controlling a majority of our capital stock to take any action, including the removal of directors.
193
Table of Contents
Advance Notice Requirements for Stockholder Proposals and Director Nominations
Our amended and restated bylaws will provide advance notice procedures for stockholders seeking to bring business before our annual meeting of stockholders or to nominate candidates for election as directors at our annual meeting of stockholders. Our amended and restated bylaws will also specify certain requirements regarding the form and content of a stockholder’s notice. These provisions will not apply to John Paulson and certain affiliated entities so long as the Stockholders Agreement remains in effect. These provisions might preclude our stockholders from bringing matters before our annual meeting of stockholders or from making nominations for directors at our annual meeting of stockholders if the proper procedures are not followed. We expect that these provisions may also discourage or deter a potential acquirer from conducting a solicitation of proxies to elect the acquirer’s own slate of directors or otherwise attempting to obtain control of our company.
No Cumulative Voting
The Delaware General Corporation Law provides that stockholders are not entitled to cumulate votes in the election of directors unless a corporation’s certificate of incorporation provides otherwise. Our amended and restated certificate of incorporation does not provide for cumulative voting.
Amendment of Charter and Bylaws Provisions
Our amended and restated certificate of incorporation will provide that, at any time when the holders of our Class B common stock no longer beneficially own, in the aggregate, at least the majority of the voting power of our outstanding capital stock, amendments to certain provisions of our amended and restated certificate of incorporation will require the approval of 66 2/3% of the voting power of our outstanding capital stock, voting as a single class. In addition, for so long as any shares of our Class B common stock remain outstanding, the approval of a majority of the voting power of our outstanding shares of Class B common stock, voting as a separate class, will be required to amend the provisions of our amended and restated certificate of incorporation relating to the terms of our Class A common stock or Class B common stock and the provisions relating to corporate opportunities. Our amended and restated certificate of incorporation and amended and restated bylaws will provide that, at any time when the holders of our Class B common stock no longer beneficially own, in the aggregate, at least the majority of the voting power of our outstanding capital stock, approval of stockholders holding 66 2/3% of the voting power of our outstanding capital stock, voting as a single class, is required for stockholders to amend or adopt any provision of our bylaws.
Issuance of Undesignated Preferred Stock
Our board of directors will have the authority, without further action by our stockholders, to issue up to 50,000,000 shares of undesignated preferred stock with rights and preferences, including voting rights, designated from time to time by our board of directors. The existence of authorized but unissued shares of preferred stock would enable our board of directors to render more difficult or to discourage an attempt to obtain control of us by means of a merger, tender offer, proxy contest or other means.
Exclusive Forum
Our amended and restated certificate of incorporation will provide that, unless we consent in writing to the selection of an alternative forum, (A) (i) any derivative action or proceeding brought on behalf of the Company, (ii) any action asserting a claim of breach of a fiduciary duty owed by any current or former director, officer, other employee or stockholder of the Company to the Company or the Company’s stockholders, (iii) any action asserting a claim arising pursuant to any provision of the Delaware General Corporation Law, our amended and restated certificate of incorporation or our
194
Table of Contents
amended and restated bylaws (as either may be amended or restated) or as to which the Delaware General Corporation Law confers exclusive jurisdiction on the Court of Chancery of the State of Delaware or (iv) any action asserting a claim governed by the internal affairs doctrine of the law of the State of Delaware shall, to the fullest extent permitted by law, be exclusively brought in the Court of Chancery of the State of Delaware or, if such court does not have subject matter jurisdiction thereof, the federal district court of the State of Delaware; and (B) the federal district courts of the United States shall be the exclusive forum for the resolution of any complaint asserting a cause of action arising under the Securities Act. Notwithstanding the foregoing, the exclusive forum provision shall not apply to claims seeking to enforce any liability or duty created by the Exchange Act. Our amended and restated certificate of incorporation will also provide that, to the fullest extent permitted by law, any person or entity purchasing or otherwise acquiring or holding any interest in shares of our capital stock shall be deemed to have notice of and consented to the foregoing. By agreeing to this provision, however, stockholders will not be deemed to have waived our compliance with the federal securities laws and the rules and regulations thereunder.
Corporate Opportunity Doctrine
Delaware law permits corporations to adopt provisions renouncing any interest or expectancy in certain opportunities that are presented to the corporation or its officers, directors or stockholders. Our amended and restated certificate of incorporation will, to the fullest extent permitted from time to time by Delaware law, renounce any interest or expectancy that we otherwise would have in, all rights to be offered an opportunity to participate in, any business opportunity that are from time to time may be presented to John Paulson and certain affiliated entities (other than us and our subsidiaries), and any of their respective principals, members, directors, partners, stockholders, officers, employees or other representatives (other than any such person who is also our employee or an employee of our subsidiaries), or any director or stockholder who is not employed by us or our subsidiaries (each such person, an “exempt person”). Our amended and restated certificate of incorporation will provide that, to the fullest extent permitted by law, no exempt person will have any duty to refrain from (1) engaging in a corporate opportunity in the same or similar lines of business in which we or our subsidiaries now engage or propose to engage or (2) otherwise competing with us or our subsidiaries. In addition, to the fullest extent permitted by law, if an exempt person acquires knowledge of a potential transaction or other business opportunity which may be a corporate opportunity for itself or himself or its or his affiliates or for us or our subsidiaries, such exempt person will have no duty to communicate or offer such transaction or business opportunity to us or any of our subsidiaries and such exempt person may take any such opportunity for themselves or offer it to another person or entity. To the fullest extent permitted by Delaware law, no potential transaction or business opportunity may be deemed to be a corporate opportunity of the corporation or its subsidiaries unless (1) we or our subsidiaries would be permitted to undertake such transaction or opportunity in accordance with the amended and restated certificate of incorporation, (2) we or our subsidiaries, at such time have sufficient financial resources to undertake such transaction or opportunity, (3) we or our subsidiaries have an interest or expectancy in such transaction or opportunity, and (4) such transaction or opportunity would be in the same or similar line of our or our subsidiaries’ business in which we or our subsidiaries are engaged or a line of business that is reasonably related to, or a reasonable extension of, such line of business. Our amended and restated certificate of incorporation will not renounce our interest in any business opportunity that is expressly offered to a director solely in his or her capacity as a director of the Company.
Limitations on Liability and Indemnification Matters
Our amended and restated certificate of incorporation will limit the liability of our directors to the fullest extent permitted by the Delaware General Corporation Law, and our amended and restated bylaws will provide that we will indemnify them to the fullest extent permitted by such law. We expect to
195
Table of Contents
enter into indemnification agreements with our current directors and executive officers prior to the completion of this offering and expect to enter into a similar agreement with any new directors or executive officers. Further, pursuant to our indemnification agreements and directors’ and officers’ liability insurance, our directors and executive officers will be indemnified and insured against the cost of defense, settlement or payment of a judgment under certain circumstances. In addition, as permitted by Delaware law, our amended and restated certificate of incorporation will include provisions that eliminate the personal liability of our directors for monetary damages resulting from breaches of certain fiduciary duties as a director. The effect of this provision is to restrict our rights and the rights of our stockholders in derivative suits to recover monetary damages against a director for breach of fiduciary duties as a director.
These provisions may be held not to be enforceable for violations of the federal securities laws of the United States.
Listing
We have applied to list our Class A common stock on the NYSE under the symbol “STWY.”
Transfer Agent and Registrar
The transfer agent and registrar for our Class A common stock is American Stock Transfer & Trust Company, LLC.
196
Table of Contents
SHARES AVAILABLE FOR FUTURE SALE
Immediately prior to this offering, there was no public market for our Class A common stock. Sales of substantial amounts of our Class A common stock in the public market, or the perception that such sales may occur, could adversely affect the prevailing market price of our Class A common stock. Some shares of our Class A common stock will not be available for sale for a certain period of time after this offering because they are subject to contractual and legal restrictions on resale, some of which are described below. Sales of substantial amounts of Class A common stock in the public market after these restrictions lapse, or the perception that these sales could occur, could adversely affect the prevailing market price of our Class A common stock and our ability to raise equity capital in the future.
Sales of Restricted Securities
Based on the number of shares of our capital stock outstanding as of , 2022, after giving effect to (i) the Distribution, (ii) the filing and effectiveness of our amended and restated certificate of incorporation, (iii) the Reclassification and (iv) the Stock Split, on the completion of this offering, shares of our Class A common stock and shares of our Class B common stock will be outstanding. Of these shares, all of the Class A common stock sold in this offering by the selling stockholders, plus any shares of Class A common stock sold by the selling stockholders upon the exercise of the underwriters’ option to purchase additional shares of Class A common stock, will be freely tradable without restriction under the Securities Act, unless these shares are purchased by our “affiliates,” as that term is defined in Rule 144 under the Securities Act.
The remaining shares of Class A common stock and all shares of Class B common stock outstanding after this offering will be “restricted securities” within the meaning of Rule 144 under the Securities Act. Restricted securities may be sold in the public market only if they are registered under the Securities Act or are sold pursuant to an exemption from registration under Rule 144 or Rule 701 under the Securities Act, which are summarized below. Restricted securities may also be sold outside the United States to non-U.S. persons in accordance with Rule 904 of Regulation S. Subject to the lock-up agreements described below, shares held by our affiliates that are not restricted securities or that have been owned for more than one year may be sold subject to compliance with Rule 144 of the Securities Act without regard to the prescribed one-year holding period under Rule 144.
Form S-8 Registration Statements
Upon the completion of this offering, we intend to file one or more registration statements on Form S-8 under the Securities Act to register the shares of Class A common stock to be issued under our 2022 Plan. These registration statements will become effective immediately on filing. Shares covered by these registration statements will then be eligible for sale in public markets, subject to vesting restrictions, the lock-up agreements described below and Rule 144 limitations applicable to affiliates.
Lock-up Agreements
We, the selling stockholders, all of our directors and executive officers and all other holders of our Class A common stock, Class B common stock and securities exercisable for or convertible into our Class A common stock and Class B common stock outstanding immediately prior to the completion of this offering have agreed that, without the prior consent of Goldman Sachs & Co. LLC, BofA Securities, Inc. and Barclays Capital Inc., on behalf of the underwriters, we and they will not, subject to certain exceptions, for a period of 180 days after the date of this prospectus, among other things, offer, sell, contract to sell, pledge, grant any option to purchase, lend or otherwise dispose of, or engage in
197
Table of Contents
hedging activities in relation to, any shares of our Class A common stock or Class B common stock, or any options or warrants to purchase any shares of our Class A common stock or Class B common stock, or any securities convertible into, exchangeable for or that represent the right to receive shares of our Class A common stock or Class B common stock. Goldman Sachs & Co. LLC, BofA Securities, Inc. and Barclays Capital Inc. may, in their sole discretion, release all or any portion of the securities subject to these lock-up agreements at any time. These agreements are subject to certain exceptions, including a price-based release, and are described below under “Underwriting.”
Registration Rights
John Paulson and certain affiliated entities and Mr. Steiner will have the right to require us to register their shares of common stock for resale, subject to the lock-up agreements described above. Registration of these shares under the Securities Act would result in the shares becoming freely tradable without restriction under the Securities Act immediately on the effectiveness of the registration. See “Certain Relationships and Related Party Transactions—Relationship with John Paulson and Certain Affiliated Entities Following this Offering—Registration Rights Agreement.”
Rule 144
In general, under Rule 144, as currently in effect, once we have been subject to the public company reporting requirements of Section 13 or Section 15(d) of the Exchange Act for at least 90 days, a person (or persons whose shares are aggregated) who is not deemed to be or have been one of our affiliates for purposes of the Securities Act at any time during the 90 days preceding a sale and who has beneficially owned the shares proposed to be sold for at least six months, including the holding period of any prior owner other than an affiliate, is entitled to sell such shares without registration, subject to compliance with the public information requirements of Rule 144. If such a person has beneficially owned the shares proposed to be sold for at least one year, including the holding period of a prior owner other than an affiliate, then such person is entitled to sell such shares without complying with any of the requirements of Rule 144.
In general, under Rule 144, as currently in effect, our affiliates or persons selling shares on behalf of our affiliates, who have met the six-month holding period for beneficial ownership of “restricted shares” of our Class A common stock, are entitled to sell upon the expiration of the lock-up agreements described in this prospectus, within any three-month period, a number of shares that does not exceed the greater of:
| • | 1% of the number of shares of our Class A common stock then outstanding, which will equal approximately shares immediately after this offering (or shares if the underwriters exercise in full their option to purchase additional shares of Class A common stock from the selling stockholders); and |
| • | the average reported weekly trading volume of our Class A common stock on the NYSE during the four calendar weeks preceding the date of filing a Notice of Proposed Sale of Securities Pursuant to Rule 144 with respect to the sale. |
Sales under Rule 144 by our affiliates or persons selling shares on behalf of our affiliates are also subject to certain manner of sale provisions and notice requirements and to the availability of current public information about us. The sale of these shares, or the perception that sales will be made, could adversely affect the price of our Class A common stock after this offering because a great supply of shares would be, or would be perceived to be, available for sale in the public market.
Rule 701
Any of our employees, officers or directors who acquired shares under a written compensatory plan or contract may be entitled to sell them in reliance on Rule 701. Rule 701 permits affiliates to sell
198
Table of Contents
their Rule 701 shares under Rule 144 without complying with the holding period requirements of Rule 144. Rule 701 further provides that non-affiliates may sell these shares in reliance on Rule 144 without complying with the holding period, public information, volume limitation or notice provisions of Rule 144. However, all shares issued under Rule 701 are subject to lock-up agreements and will only become eligible for sale when the 180-day lock-up agreements expire.
199
Table of Contents
MATERIAL U.S. FEDERAL INCOME TAX CONSEQUENCES TO NON-U.S. HOLDERS
The following discussion is a summary of the material U.S. federal income tax consequences to Non-U.S. Holders (as defined below) of the purchase, ownership, and disposition of our Class A common stock offered for purchase pursuant to this offering, but does not purport to be a complete analysis of all potential tax effects. The effects of other U.S. federal tax laws, such as estate and gift tax laws, and any applicable state, local, or non-U.S. tax laws are not discussed. This discussion is based on the U.S. Internal Revenue Code of 1986, as amended (the “Code”), Treasury Regulations promulgated thereunder, judicial decisions, and published rulings and administrative pronouncements of the U.S. Internal Revenue Service (the “IRS”), in each case in effect as of the date hereof. These authorities may change or be subject to differing interpretations. Any such change or differing interpretation may be applied retroactively in a manner that could adversely affect a Non-U.S. Holder. We have not sought and will not seek any rulings from the IRS regarding the matters discussed below. There can be no assurance the IRS or a court will not take a contrary position to that discussed below regarding the tax consequences of the purchase, ownership, and disposition of our Class A common stock.
This discussion is limited to Non-U.S. Holders that hold our Class A common stock as a “capital asset” within the meaning of Section 1221 of the Code (generally, property held for investment). This discussion does not address all U.S. federal income tax consequences relevant to a Non-U.S. Holder’s particular circumstances, including the impact of the Medicare contribution tax on net investment income and the alternative minimum tax. In addition, it does not address consequences relevant to Non-U.S. Holders subject to special rules, including, without limitation:
| • | U.S. expatriates and former citizens or long-term residents of the United States; |
| • | persons holding our Class A common stock as part of a hedge, straddle, or other risk reduction strategy or as part of a conversion transaction or other integrated investment; |
| • | banks, insurance companies, and other financial institutions; |
| • | brokers, dealers, or traders in securities; |
| • | “controlled foreign corporations,” “passive foreign investment companies,” and corporations that accumulate earnings to avoid U.S. federal income tax; |
| • | partnerships or other entities or arrangements treated as partnerships for U.S. federal income tax purposes (and investors therein); |
| • | tax-exempt organizations or governmental organizations; |
| • | persons deemed to sell our Class A common stock under the constructive sale provisions of the Code; |
| • | persons who hold or receive our Class A common stock pursuant to the exercise of any employee stock option or otherwise as compensation; |
| • | tax-qualified retirement plans; and |
| • | “qualified foreign pension funds” as defined in Section 897(l)(2) of the Code and entities all of the interests of which are held by qualified foreign pension funds. |
If an entity treated as a partnership for U.S. federal income tax purposes holds our Class A common stock, the tax treatment of a partner in the partnership will depend on the status of the partner, the activities of the partnership, and certain determinations made at the partner level. Accordingly, partnerships holding our Class A common stock and the partners in such partnerships should consult their tax advisors regarding the U.S. federal income tax consequences to them.
THIS DISCUSSION IS FOR INFORMATIONAL PURPOSES ONLY AND IS NOT TAX ADVICE. INVESTORS SHOULD CONSULT THEIR TAX ADVISORS WITH RESPECT TO THE APPLICATION
200
Table of Contents
OF THE U.S. FEDERAL INCOME TAX LAWS TO THEIR PARTICULAR SITUATIONS AS WELL AS ANY TAX CONSEQUENCES OF THE PURCHASE, OWNERSHIP, AND DISPOSITION OF OUR CLASS A COMMON STOCK ARISING UNDER THE U.S. FEDERAL ESTATE OR GIFT TAX LAWS OR UNDER THE LAWS OF ANY STATE, LOCAL, OR NON-U.S. TAXING JURISDICTION OR UNDER ANY APPLICABLE INCOME TAX TREATY.
Definition of a Non-U.S. Holder
For purposes of this discussion, a “Non-U.S. Holder” is any beneficial owner of our Class A common stock that is neither a “U.S. person” nor an entity treated as a partnership for U.S. federal income tax purposes. A U.S. person is any person that, for U.S. federal income tax purposes, is or is treated as any of the following:
| • | an individual who is a citizen or resident of the United States; |
| • | a corporation created or organized under the laws of the United States, any state thereof, or the District of Columbia; |
| • | an estate, the income of which is subject to U.S. federal income tax regardless of its source; or |
| • | a trust that (1) is subject to the primary supervision of a U.S. court and the control of one or more “United States persons” (within the meaning of Section 7701(a)(30) of the Code), or (2) has a valid election in effect to be treated as a United States person for U.S. federal income tax purposes. |
Distributions
Distributions of cash or property on our Class A common stock will constitute dividends for U.S. federal income tax purposes to the extent paid from our current or accumulated earnings and profits, as determined under U.S. federal income tax principles. Amounts not treated as dividends for U.S. federal income tax purposes will constitute a return of capital and first be applied against and reduce a Non-U.S. Holder’s adjusted tax basis in its Class A common stock, but not below zero. Any excess will be treated as capital gain and will be treated as described below under “—Sale or Other Taxable Disposition.”
Subject to the discussion below on effectively connected income, dividends paid to a Non-U.S. Holder will be subject to U.S. federal withholding tax at a rate of 30% of the gross amount of the dividends (or such lower rate specified by an applicable income tax treaty, provided the Non-U.S. Holder furnishes a valid IRS Form W-8BEN or W-8BEN-E (or other applicable documentation) certifying qualification for the lower treaty rate). A Non-U.S. Holder that does not timely furnish the required documentation, but that qualifies for a reduced treaty rate, may obtain a refund of any excess amounts withheld by timely filing an appropriate claim for refund with the IRS. Non-U.S. Holders should consult their tax advisors regarding their entitlement to benefits under any applicable income tax treaty.
If dividends paid to a Non-U.S. Holder are effectively connected with the Non-U.S. Holder’s conduct of a trade or business within the United States (and, if required by an applicable income tax treaty, the Non-U.S. Holder maintains a permanent establishment in the United States to which such dividends are attributable), the Non-U.S. Holder will be exempt from the U.S. federal withholding tax described above. To claim the exemption, the Non-U.S. Holder must furnish to the applicable withholding agent a valid IRS Form W-8ECI, certifying that the dividends are effectively connected with the Non-U.S. Holder’s conduct of a trade or business within the United States.
Any such effectively connected dividends will be subject to U.S. federal income tax on a net income basis at the regular rates. A Non-U.S. Holder that is a corporation also may be subject to a branch profits tax at a rate of 30% (or such lower rate specified by an applicable income tax treaty) on such effectively connected dividends, as adjusted for certain items. Non-U.S. Holders should consult their tax advisors regarding any applicable tax treaties that may provide for different rules.
201
Table of Contents
Sale or Other Taxable Disposition
Subject to the discussions below regarding FATCA and backup withholding, a Non-U.S. Holder will not be subject to U.S. federal income tax (including withholding thereof) on any gain realized upon the sale or other taxable disposition of our Class A common stock unless:
| • | the gain is effectively connected with the Non-U.S. Holder’s conduct of a trade or business within the United States (and, if required by an applicable income tax treaty, the Non-U.S. Holder maintains a permanent establishment in the United States to which such gain is attributable); |
| • | the Non-U.S. Holder is a nonresident alien individual present in the United States for 183 days or more during the taxable year of the disposition and certain other requirements are met; or |
| • | our Class A common stock constitutes a U.S. real property interest (“USRPI”) by reason of our status as a U.S. real property holding corporation (“USRPHC”) for U.S. federal income tax purposes at any time during the shorter of the five-year period ending on the date of the sale or other taxable disposition of, or the Non-U.S. Holder’s holding period for, our Class A common stock. |
Gain described in the first bullet point above generally will be subject to U.S. federal income tax on a net income basis at the regular rates. A Non-U.S. Holder that is a corporation also may be subject to a branch profits tax at a rate of 30% (or such lower rate specified by an applicable income tax treaty) on such effectively connected gain, as adjusted for certain items.
A Non-U.S. Holder described in the second bullet point above will be subject to U.S. federal income tax at a rate of 30% (or such lower rate specified by an applicable income tax treaty) on gain realized upon the sale or other taxable disposition of our Class A common stock, which may be offset by U.S. source capital losses of the Non-U.S. Holder (even though the individual is not considered a resident of the United States), provided the Non-U.S. Holder has timely filed U.S. federal income tax returns with respect to such losses.
With respect to the third bullet point above, we believe we currently are not, and do not anticipate becoming, a USRPHC. Because the determination of whether we are a USRPHC depends, however, on the fair market value of our USRPIs relative to the fair market value of our non-U.S. real property interests and our other business assets, there can be no assurance we currently are not a USRPHC or will not become one in the future. Even if we are or were to become a USRPHC, gain arising from the sale or other taxable disposition of our Class A common stock by a Non-U.S. Holder will not be subject to U.S. federal income tax if our Class A common stock is “regularly traded,” as defined by applicable Treasury Regulations, on an established securities market and such Non-U.S. Holder owned, actually and constructively, 5% or less of our Class A common stock throughout the shorter of the five-year period ending on the date of the sale or other taxable disposition or the Non-U.S. Holder’s holding period.
Non-U.S. Holders should consult their tax advisors regarding potentially applicable income tax treaties that may provide for different rules.
Information Reporting and Backup Withholding
Payments of dividends on our Class A common stock will not be subject to backup withholding, provided the applicable withholding agent does not have actual knowledge or reason to know the holder is a United States person and the holder either certifies its non-U.S. status, such as by furnishing a valid IRS Form W-8BEN, W-8BEN-E, or W-8ECI (or other applicable form), or otherwise establishes an exemption. However, information returns are required to be filed with the IRS in
202
Table of Contents
connection with any distributions on our Class A common stock paid to the Non-U.S. Holder, regardless of whether such distributions constitute dividends or whether any tax was actually withheld. In addition, proceeds of the sale or other taxable disposition of our Class A common stock within the United States or conducted through certain U.S.-related brokers generally will not be subject to backup withholding or information reporting if the applicable withholding agent receives the certification described above and does not have actual knowledge or reason to know that such holder is a United States person or the holder otherwise establishes an exemption. Proceeds of a disposition of our Class A common stock conducted through a non-U.S. office of a non-U.S. broker generally will not be subject to backup withholding or information reporting.
Copies of information returns that are filed with the IRS may also be made available under the provisions of an applicable treaty or agreement with the tax authorities of the country in which the Non-U.S. Holder resides or is established.
Backup withholding is not an additional tax. Any amounts withheld under the backup withholding rules may be allowed as a refund or a credit against a Non-U.S. Holder’s U.S. federal income tax liability, provided the required information is timely furnished to the IRS.
Additional Withholding Tax on Payments Made to Foreign Accounts
Withholding taxes may be imposed under Sections 1471 to 1474 of the Code (such Sections commonly referred to as the Foreign Account Tax Compliance Act, or “FATCA”) on certain types of payments made to non-U.S. financial institutions and certain other non-U.S. entities. Specifically, a 30% withholding tax may be imposed on dividends on, or (subject to the proposed Treasury Regulations discussed below) gross proceeds from the sale or other disposition of, our Class A common stock paid to a “foreign financial institution” or a “non-financial foreign entity” (each as defined in the Code), unless (1) the foreign financial institution undertakes certain diligence and reporting obligations, (2) the non-financial foreign entity either certifies it does not have any “substantial United States owners” (as defined in the Code) or furnishes identifying information regarding each substantial United States owner, or (3) the foreign financial institution or non-financial foreign entity otherwise qualifies for an exemption from these rules. If the payee is a foreign financial institution and is subject to the diligence and reporting requirements in (1) above, it must enter into an agreement with the U.S. Department of the Treasury requiring, among other things, that it undertake to identify accounts held by certain “specified United States persons” or “United States owned foreign entities” (each as defined in the Code), annually report certain information about such accounts, and withhold 30% on certain payments to non-compliant foreign financial institutions and certain other account holders. Foreign financial institutions located in jurisdictions that have an intergovernmental agreement with the United States governing FATCA may be subject to different rules.
Under the applicable Treasury Regulations and administrative guidance, withholding under FATCA generally applies to payments of dividends on our Class A common stock. While withholding under FATCA would have applied also to payments of gross proceeds from the sale or other disposition of stock on or after January 1, 2019, proposed Treasury Regulations eliminate FATCA withholding on payments of gross proceeds entirely. Taxpayers generally may rely on these proposed Treasury Regulations until final Treasury Regulations are issued.
Prospective investors should consult their tax advisors regarding the potential application of withholding under FATCA to their investment in our Class A common stock.
203
Table of Contents
We, the selling stockholders and the underwriters named below have entered into an underwriting agreement with respect to the shares of Class A common stock being offered by this prospectus. Subject to certain conditions, each underwriter has severally agreed to purchase from the selling stockholders the number of shares of Class A common stock indicated in the following table. Goldman Sachs & Co. LLC, BofA Securities, Inc. and Barclays Capital Inc. are the representatives of the underwriters.
Name | Number of Shares | |||
Goldman Sachs & Co. LLC | ||||
BofA Securities, Inc. | ||||
Barclays Capital Inc. | ||||
Evercore Group L.L.C. | ||||
| Cowen and Company, LLC | ||||
| Stifel, Nicolaus & Company, Incorporated | ||||
| Sanford C. Bernstein & Co., LLC | ||||
| Telsey Advisory Group LLC | ||||
| Commerz Markets LLC | ||||
| Loop Capital Markets LLC | ||||
| Total | ||||
|
| |||
The underwriters are committed to take and pay for all of the shares of Class A common stock being offered, if any are taken, other than the shares of Class A common stock covered by the option described below unless and until this option is exercised. The underwriting agreement also provides that if an underwriter defaults, the purchase commitments of non-defaulting underwriters may also be increased or the offering may be terminated.
The underwriters have an option to buy up to an additional shares of Class A common stock from the selling stockholders to cover sales by the underwriters of a greater number of shares of Class A common stock than the total number set forth in the table above. They may exercise that option for 30 days from the date of this prospectus. If any shares of Class A common stock are purchased pursuant to this option, the underwriters will severally purchase shares of Class A common stock in approximately the same proportion as set forth in the table above.
The following table shows the per share and total underwriting discounts and commissions to be paid to the underwriters by the selling stockholders. Such amounts are shown assuming both no exercise and full exercise of the underwriters’ option to purchase up to additional shares of Class A common stock from the selling stockholders.
| Paid by Selling stockholders | ||||||||
| No Exercise | Full Exercise | |||||||
Per Share | $ | $ | ||||||
Total | $ | $ | ||||||
Shares sold by the underwriters to the public will initially be offered at the initial public offering price set forth on the cover of this prospectus. Any shares of Class A common stock sold by the underwriters to securities dealers may be sold at a discount of up to $ per share from the initial public offering price. After the initial offering of the shares of Class A common stock, the representatives may change the offering price and the other selling terms.
204
Table of Contents
The offering of the shares of Class A common stock by the underwriters is subject to receipt and acceptance and subject to the underwriters’ right to reject any order in whole or in part. Sales of shares of Class A common stock made outside of the United States may be made by affiliates of the underwriters.
A prospectus in electronic format may be made available on websites maintained by one or more underwriters, or selling group members, if any, participating in this offering. The representative may agree to allocate a number of shares of our Class A common stock to underwriters and selling group members for sale to their online brokerage account holders. Internet distributions will be allocated by the representative to underwriters and selling group members that may make Internet distributions on the same basis as other allocations.
We, the selling stockholders, all of our directors and executive officers and other holders (each, a “Lock-Up Party”) of our Class A common stock, Class B common stock and securities exercisable for or convertible into our Class A common stock and Class B common stock outstanding immediately prior to the completion of this offering (collectively, the “Restricted Securities”) have agreed with the underwriters not to, and not to cause or direct any of our or their affiliates to, without the prior written consent of Goldman Sachs & Co. LLC, BofA Securities, Inc. and Barclays Capital Inc. on behalf of the underwriters, during the period ending 180 days after the date of this prospectus (the “Lock-Up Period”), (i) offer, sell, contract to sell, pledge, grant any option to purchase, lend or otherwise dispose of, directly or indirectly, or file with the Securities and Exchange Commission a registration statement under the Securities Act relating to, any Restricted Securities, (ii) engage in any hedging or other transaction or arrangement which is designed to or which reasonably could be expected to lead to or result in a sale, loan, pledge or other disposition, or transfer of any of the economic consequences of ownership of the Restricted Securities or (iii) publicly announce any intention to engage in the foregoing.
The restrictions described above (the “Lock-Up Restrictions”) do not apply to transfers of Restricted Securities:
(i) as a result of the redemption, repurchase or forfeiture by us or our affiliates of Restricted Securities held by or on behalf of an employee or other service provider of our company in connection with the death, disability or termination of such employee or service provider, in each case pursuant to an employment agreement, employee benefit plan or other contractual arrangement in existence on the date of effectiveness of the registration statement of which this prospectus is a part and described herein; provided that any filing under Section 16(a) of the Exchange Act or any other public filing or disclosure of such transfer by or on behalf of the Lock-Up Party, shall clearly indicate in the footnotes thereto the nature and conditions of such transfer;
(ii) acquired by the Lock-Up Party in the open market after the completion of this offering or from the underwriters;
(iii) by bona fide gift or gifts, will, intestacy or charitable contribution, provided that the donee or donees, beneficiary or beneficiaries, heir or heirs or legal representatives thereof agree to be bound in writing by the Lock-Up Restrictions for the balance of the Lock-Up Period, and provided further that any such transfer shall not involve a disposition for value;
(iv) to any trust, partnership, limited liability company or other entity for the direct or indirect benefit of the Lock-Up Party or the immediate family of the Lock-Up Party, provided that the trustee of the trust or the partnership or limited liability company or other entity agrees to be bound in writing by the Lock-Up Restrictions for the balance of the Lock-Up Period, and provided further that any such transfer shall not involve a disposition for value;
205
Table of Contents
(v) to any immediate family member or other dependent; provided, that the transferee agrees to be bound in writing by the Lock-Up Restrictions for the balance of the Lock-Up Period, and provided further that any such transfer shall not involve a disposition for value;
(vi) by operation of law or court order, such as pursuant to a qualified domestic order, divorce settlement, divorce decree or separation agreement;
(vii) if the Lock-Up Party is a corporation, partnership, limited liability company or other business entity, (A) to another corporation, partnership, limited liability company or other business entity that is an affiliate (as defined in Rule 405 promulgated under the Securities Act) of the Lock-Up Party, (B) to the Lock-Up Party’s wholly-owned subsidiaries, partners, limited partners, managers, members, equityholders, shareholders, trustors or beneficiaries, or to any investment fund or other entity that controls, is controlled by, manages, is managed by or is under common control with the Lock-Up Party (including, if the Lock-Up Party is a partnership, to its general partner or a successor partnership or fund, or any other funds managed by such partnership and, if the Lock-Up Party is a trust, to a trustor or beneficiary of the trust) or (C) as part of a distribution by the Lock-Up Party to its stockholders, partners, members or other equityholders or to the estate of any such stockholders, partners, members or other equityholders; provided, that the transferee agrees to be bound in writing by the Lock-Up Restrictions for the balance of the Lock-Up Period, and provided further that any such transfer shall not involve a disposition for value, and provided further that any such transfer shall not involve a disposition for value;
(viii) to a nominee or custodian of a person or entity to whom a disposition or transfer would be permissible under clauses (iii) through (vii) above; provided, that the transferee agrees to be bound in writing by the Lock-Up Restrictions for the balance of the Lock-Up Period, and provided further that any such transfer shall not involve a disposition for value;
(ix) (A) to us for the purposes of exercising (including for the payment of tax withholdings or remittance payments due as a result of such exercise) on a “net exercise” or “cashless” basis options or warrants to purchase the Restricted Securities that are due to expire during the Lock-Up Period, or (B) in connection with the vesting or settlement of restricted stock units or restricted stock awards, any transfer to us for the payment of tax withholdings or remittance payments due as a result of the vesting or settlement of such restricted stock units or restricted stock awards, in each case pursuant to employee benefit plans disclosed herein; provided that any filing under Section 16(a) of the Exchange Act or any other public filing or disclosure of such transfer by or on behalf of the Lock-Up Party, shall clearly indicate in the footnotes thereto the nature and conditions of such transfer; and provided further that any shares of Class A Common Stock, Class B Common Stock or other securities received upon the exercise, settlement or vesting of the Lock-Up Party’s Restricted Securities and options or warrants to purchase Restricted Securities shall be subject to the Lock-Up Restrictions;
(x) to any third-party pledgee in a bona fide transaction as collateral to secure obligations pursuant to lending or other arrangements, including any bona fide purpose (margin) or bona fide non-purpose loan that is in effect on the date hereof (including any replacement, amendment or modification thereof), between such third parties (or their affiliates or designees) and the Lock-Up Party and/or its affiliates or any similar arrangement relating to a financing agreement for the benefit of the Lock-Up Party and/or its affiliates, provided, that any such pledgee or other transferee to which the pledged Restricted Securities are transferred shall agree to execute and deliver to the representatives an agreement in the form of the lock-up agreements entered into by the Lock-Up Parties;
(xi) to the extent the Lock-Up Party is a selling stockholder in this offering, to the underwriters pursuant to the terms of the underwriting agreement in connection with this offering; and
206
Table of Contents
(xii) (A) the conversion or reclassification of our outstanding common stock or other classes of capital stock into shares of Class A common stock or Class B common stock in connection with this offering and (B) the completion of the Distribution; provided that any Restricted Securities and any securities convertible into or exercisable or exchangeable for Restricted Securities received in connection with the organizational transactions in connection with this offering remain subject to the Lock-Up Restrictions; provided further that, to the extent an announcement or filing under the Exchange Act, if any, is required of or voluntarily made by or on behalf of the Lock-Up Party or us regarding the conversion, reclassification or the Distribution, as applicable, such announcement or filing shall include a statement to the effect that such conversion, reclassification or Distribution occurred pursuant to the organizational transactions in connection with this offering and no transfer of shares of common stock or other securities received in connection thereto may be made during the Lock-Up Period;
provided, that in connection with any transfers pursuant to clauses (i), (iii) through (viii) and (ix) above, no filing under Section 16(a) of the Exchange Act shall, during the Lock-Up Period, be required or voluntarily made, and provided further that in connection with any other transfers, to the extent a filing under Section 16(a) of the Exchange Act is required in connection with any such transfers of the Lock-Up Party’s Securities, the Lock-Up Party shall disclose therein the reason for such filing.
Notwithstanding the foregoing, subject to compliance with applicable securities laws, including without limitation Rule 144 under the Securities Act, each Lock-Up Party may sell in the public market beginning at the commencement of the second trading day on which the New York Stock Exchange and the Nasdaq Stock Market are open for the buying and selling of securities (each, a “Trading Day”) after we publicly announce our earnings (which for this purpose shall include reporting of financial results on a press release or a Form 10-Q but shall not include reporting of “flash” numbers or preliminary or partial earnings) for the first completed quarterly period following the most recent period for which financial statements are included in this prospectus, which earnings release is at least 60 days following the pricing of this offering (the “Earnings Release”), a number of shares of Restricted Securities not in excess of 30% of the Restricted Securities owned by such Lock-Up Party on the date of its lock-up agreement, calculated after giving effect to any sales of shares by the selling stockholders in this offering; provided that the last reported closing price of our Class A common stock is at least 33% greater than the initial public offering price per share set forth on the cover of this prospectus for 10 out of any 15-consecutive full Trading Day period beginning on or after the Trading Day of the Earnings Release.
The Lock-Up Restrictions also do not apply to us with respect to certain transactions, including (A) the sale of our Class A common stock to the underwriters pursuant to the underwriting agreement (including sales by us to the underwriters in connection with the Reserved Share Program), (B) the issuance of Class A common stock upon the exercise of an option or warrant, in connection with the vesting and/or settlement of restricted stock, or the conversion of a security outstanding on the date of the underwriting agreement as described in this prospectus, (C) the grant of compensatory equity-based awards, and/or the issuance of shares of Class A common stock with respect thereto, made pursuant to compensatory equity-based plans disclosed in this prospectus, (D) any shares of Class A common stock issued pursuant to any non-employee director compensation plan or program disclosed in this prospectus, (E) the purchase of shares of Class A common stock pursuant to employee stock purchase plans described in this prospectus, (F) the filing of a registration statement on Form S-8 to register Class A common stock issuable pursuant to any employee benefit plans, qualified stock option plans or other employee compensation plans, described in this prospectus, (G) Class A common stock or any securities convertible into, or exercisable or exchangeable for, Class A common stock, or the entrance into an agreement to issue Class A common stock or any securities convertible into, or exercisable or exchangeable for, Class A common stock, in connection with any merger, joint venture, strategic alliances, commercial or other collaborative transaction or the acquisition or license of the business, property, technology or other assets of another individual or entity or the assumption of an
207
Table of Contents
employee benefit plan in connection with a merger or acquisition; provided that the aggregate number of Class A common stock or any securities convertible into, or exercisable or exchangeable for, Class A common stock that we may issue or agree to issue pursuant to this clause (G) shall not exceed 5% of our total outstanding share capital immediately following the completion of this offering; and provided further, that the recipients of any such shares of Class A common stock and securities issued pursuant to this clause (G) during the Lock-Up Period shall enter into an agreement substantially in the form of the lock-up agreements entered into by the Lock-Up Parties on or prior to such issuance, or (H) facilitating the establishment of a trading plan on behalf of a stockholder, officer or director of our Company pursuant to Rule 10b5-1 under the Exchange Act for the transfer of shares of Class A common stock, provided that (i) such plan does not provide for the transfer of Class A common stock during the Lock-Up Period and (ii) no public announcement or filing under the Exchange Act shall be voluntarily made by our Company regarding the establishment of such plan during the Lock-Up Period and to the extent a public announcement or filing under the Exchange Act, if any, is required of our Company regarding the establishment of such plan, such announcement or filing shall include a statement to the effect that no transfer of Class A common stock may be made under such plan during the Lock-Up Period; provided that each recipient of any Class A common stock pledged, issued or sold pursuant to clauses (B), (C) and (D) above executes and delivers to the representatives prior to such pledge, issuance or sale, as the case may be, an agreement having substantially the same terms as the lock-up agreements entered into by the Lock-Up Parties.
Goldman Sachs & Co. LLC, BofA Securities, Inc. and Barclays Capital Inc. may, in their sole discretion, release all or any portion of the securities subject to these lock-up agreements at any time.
Prior to the offering, there has been no public market for the shares of Class A common stock. The initial public offering price will be negotiated among the selling stockholders and the representatives. Among the factors to be considered in determining the initial public offering price of the shares of Class A common stock, in addition to prevailing market conditions, will be our historical performance, estimates of our business potential and earnings prospects, an assessment of our management, and the consideration of the above factors in relation to market valuation of companies in related businesses.
We have applied to list our Class A common stock on the NYSE under the symbol “STWY.”
In connection with the offering, the underwriters may purchase and sell shares of our Class A common stock in the open market. These transactions may include short sales, stabilizing transactions and purchases to cover positions created by short sales. Short sales involve the sale by the underwriters of a greater number of shares of our Class A common stock than they are required to purchase in the offering, and a short position represents the amount of such sales that have not been covered by subsequent purchases. A “covered short position” is a short position that is not greater than the amount of additional shares of our Class A common stock for which the underwriters’ option described above may be exercised. The underwriters may cover any covered short position by either exercising their option to purchase additional shares of Class A common stock or purchasing shares of Class A common stock in the open market. In determining the source of shares to cover the covered short position, the underwriters will consider, among other things, the price of shares of Class A common stock available for purchase in the open market as compared to the price at which they may purchase additional shares of Class A common stock pursuant to the option described above. “Naked” short sales are any short sales that create a short position greater than the amount of additional shares of Class A common stock for which the option described above may be exercised. The underwriters must cover any such naked short position by purchasing shares of Class A common stock in the open market. A naked short position is more likely to be created if the underwriters are concerned that there may be downward pressure on the price of the Class A common stock in the open market after pricing that could adversely affect investors who purchase in the offering. Stabilizing transactions consist of
208
Table of Contents
various bids for or purchases of Class A common stock made by the underwriters in the open market prior to the completion of the offering.
The underwriters may also impose a penalty bid. This occurs when a particular underwriter repays to the underwriters a portion of the underwriting discount received by it because the representatives have repurchased shares of our Class A common stock sold by or for the account of such underwriter in stabilizing or short covering transactions.
Purchases to cover a short position and stabilizing transactions, as well as other purchases by the underwriters for their own accounts, may have the effect of preventing or retarding a decline in the market price of our Class A common stock, and together with the imposition of the penalty bid, may stabilize, maintain, or otherwise affect the market price of the Class A common stock. As a result, the price of the Class A common stock may be higher than the price that otherwise might exist in the open market. The underwriters are not required to engage in these activities and may end any of these activities at any time. These transactions may be effected on the NYSE, in the over-the-counter market or otherwise.
We estimate that our share of the total expenses of the offering, excluding underwriting discounts and commissions, will be approximately $ . We have agreed to reimburse the underwriters for certain of their expenses relating to the clearance of this offering with the Financial Industry Regulatory Authority in an amount up to $35,000.
We and the selling stockholders have agreed to indemnify the several underwriters against certain liabilities, including liabilities under the Securities Act.
Other Relationships
The underwriters and their respective affiliates are full service financial institutions engaged in various activities, which may include sales and trading, commercial and investment banking, advisory, investment management, investment research, principal investment, hedging, market making, brokerage, and other financial and non-financial activities and services. Certain of the underwriters and their respective affiliates have provided, and may in the future provide, a variety of these services to the issuer and to persons and entities with relationships with the issuer, for which they received or will receive customary fees and expenses.
In the ordinary course of their various business activities, the underwriters and their respective affiliates, officers, directors, and employees may purchase, sell, or hold a broad array of investments and actively traded securities, derivatives, loans, commodities, currencies, credit default swaps and other financial instruments for their own account and for the accounts of their customers, and such investment and trading activities may involve or relate to assets, securities, or instruments of the issuer (directly, as collateral securing other obligations or otherwise) or persons and entities with relationships with the issuer. The underwriters and their respective affiliates may also communicate independent investment recommendations, market color or trading ideas or publish or express independent research views in respect of such assets, securities, or instruments and may at any time hold, or recommend to clients that they should acquire, long and/or short positions in such assets, securities, and instruments.
Reserved Share Program
At our request, an affiliate of BofA Securities, Inc., a participating underwriter, has reserved for sale, at the initial public offering price, up to 5% of the shares offered by this prospectus for sale to some of our directors, officers, employees, distributors, dealers, business associates and related persons. If these
209
Table of Contents
persons purchase reserved shares it will reduce the number of shares available for sale to the general public. Any reserved shares that are not so purchased will be offered by the underwriters to the general public on the same terms as the other shares offered by this prospectus. Any of our directors, officers and other Lock-Up Parties buying shares of Class A common stock through the Reserved Share Program will be subject to a 180-day lock-up period with respect to such shares, subject to certain exceptions described herein.
Other than the underwriting discount described on the front cover of this prospectus, the underwriters will not be entitled to any commission with respect to shares of Class A common stock sold pursuant to our Reserved Share Program. We will agree to indemnify the underwriters against certain liabilities and expenses, including liabilities under the Securities Act, in connection with sales of the shares reserved for our Reserved Share Program.
Selling Restrictions
European Economic Area
In relation to each Member State of the European Economic Area (each an “EEA State”), no shares of Class A common stock have been offered or will be offered pursuant to the offering to the public in that EEA State prior to the publication of a prospectus in relation to the shares of Class A common stock which has been approved by the competent authority in that EEA State or, where appropriate, approved in another EEA State and notified to the competent authority in that EEA State, all in accordance with the EU Prospectus Regulation, except that shares of Class A common stock may be offered to the public in that EEA State at any time under the following exemptions under the EU Prospectus Regulation:
| • | to any legal entity which is a qualified investor as defined under Article 2 of the EU Prospectus Regulation; |
| • | to fewer than 150 natural or legal persons (other than qualified investors as defined under Article 2 of the EU Prospectus Regulation), subject to obtaining the prior consent of the representatives for any such offer; or |
| • | in any other circumstances falling within Article 1(4) of the EU Prospectus Regulation, |
provided that no such offer of the shares of Class A common stock shall require the Company or any underwriter to publish a prospectus pursuant to Article 3 of the EU Prospectus Regulation or supplement a prospectus pursuant to Article 23 of the EU Prospectus Regulation.
Each person in an EEA State who initially acquires any shares of Class A common stock or to whom any offer is made will be deemed to have represented, acknowledged and agreed to and with the Company and the representatives that it is a qualified investor within the meaning of the EU Prospectus Regulation.
In the case of any shares of Class A common stock being offered to a financial intermediary as that term is used in Article 5(1) of the EU Prospectus Regulation, each such financial intermediary will be deemed to have represented, acknowledged and agreed that the shares of Class A common stock acquired by it in the offer have not been acquired on a non-discretionary basis on behalf of, nor have they been acquired with a view to their offer or resale to, persons in circumstances which may give rise to an offer to the public other than their offer or resale in an EEA State to qualified investors, in circumstances in which the prior consent of the representatives has been obtained to each such proposed offer or resale.
The Company, the underwriters and their affiliates will rely upon the truth and accuracy of the foregoing representations, acknowledgements and agreements.
210
Table of Contents
For the purposes of this provision, the expression an “offer to the public” in relation to the shares of Class A common stock in any EEA State means the communication in any form and by any means of sufficient information on the terms of the offer and any shares of Class A common stock to be offered so as to enable an investor to decide to purchase or subscribe for any shares, and the expression “EU Prospectus Regulation” means Regulation (EU) 2017/1129.
The above selling restriction is in addition to any other selling restrictions set out below.
United Kingdom
In relation to the United Kingdom, no shares of Class A common stock have been offered or will be offered pursuant to the offering to the public in the United Kingdom prior to the publication of a prospectus in relation to the shares of Class A common stock which has been approved by the Financial Conduct Authority in accordance with the UK Prospectus Regulation, except that shares of Class A common stock may be offered to the public in the United Kingdom at any time under the following exemptions under the UK Prospectus Regulation:
| (i) | to any legal entity which is a qualified investor as defined under the UK Prospectus Regulation; |
| (ii) | to fewer than 150 natural or legal persons (other than qualified investors as defined under the UK Prospectus Regulation), subject to obtaining the prior consent of the representatives for any such offer; or |
| (iii) | at any time in other circumstances falling within section 86 of the FSMA, |
provided that no such offer of shares of Class A common stock shall require the Company or any underwriter to publish a prospectus pursuant to Section 85 of the FSMA or Article 3 of the UK Prospectus Regulation or supplement a prospectus pursuant to Article 23 of the UK Prospectus Regulation.
Each person in the United Kingdom who initially acquires any shares of Class A common stock or to whom any offer is made will be deemed to have represented, acknowledged and agreed to and with the Company and the representatives that it is a qualified investor within the meaning of the UK Prospectus Regulation.
In the case of any shares of Class A common stock being offered to a financial intermediary as that term is used in Article 5(1) of the UK Prospectus Regulation, each such financial intermediary will be deemed to have represented, acknowledged and agreed that the shares of Class A common stock acquired by it in the offer have not been acquired on a non-discretionary basis on behalf of, nor have they been acquired with a view to their offer or resale to, persons in circumstances which may give rise to an offer to the public other than their offer or resale in the United Kingdom to qualified investors, in circumstances in which the prior consent of the representatives has been obtained to each such proposed offer or resale.
The Company, the representatives and their affiliates will rely upon the truth and accuracy of the foregoing representations, acknowledgements and agreements.
For the purposes of this provision, the expression an “offer to the public” in relation to any shares of Class A common stock in the UK means the communication in any form and by any means of sufficient information on the terms of the offer and any shares of Class A common stock to be offered so as to enable an investor to decide to purchase or subscribe for any shares, the expression “UK Prospectus Regulation” means Regulation (EU) 2017/1129 as it forms part of domestic law by virtue of
211
Table of Contents
the European Union (Withdrawal) Act 2018, and the expression “FSMA” means the Financial Services and Markets Act 2000.
This document is for distribution only to persons who (i) have professional experience in matters relating to investments and who qualify as investment professionals within the meaning of Article 19(5) of the Financial Services and Markets Act 2000 (Financial Promotion) Order 2005 (as amended, the “Financial Promotion Order”), (ii) are persons falling within Article 49(2)(a) to (d) (“high net worth companies, unincorporated associations etc.”) of the Financial Promotion Order, (iii) are outside the United Kingdom, or (iv) are persons to whom an invitation or inducement to engage in investment activity (within the meaning of Section 21 of the FSMA) in connection with the issue or sale of any securities may otherwise lawfully be communicated or caused to be communicated (all such persons together being referred to as “relevant persons”). This document is directed only at relevant persons and must not be acted on or relied on by persons who are not relevant persons. Any investment or investment activity to which this document relates is available only to relevant persons and will be engaged in only with relevant persons.
Canada
The shares of Class A common stock may be sold in Canada only to purchasers purchasing, or deemed to be purchasing, as principal that are accredited investors, as defined in National Instrument 45-106 Prospectus Exemptions or subsection 73.3(1) of the Securities Act (Ontario), and are permitted clients, as defined in National Instrument 31-103 Registration Requirements, Exemptions, and Ongoing Registrant Obligations. Any resale of the shares of Class A common stock must be made in accordance with an exemption from, or in a transaction not subject to, the prospectus requirements of applicable securities laws.
Securities legislation in certain provinces or territories of Canada may provide a purchaser with remedies for rescission or damages if this prospectus (including any amendment thereto) contains a misrepresentation, provided that the remedies for rescission or damages are exercised by the purchaser within the time limit prescribed by the securities legislation of the purchaser’s province or territory. The purchaser should refer to any applicable provisions of the securities legislation of the purchaser’s province or territory for particulars of these rights or consult with a legal advisor.
Pursuant to section 3A.3 of National Instrument 33-105 Underwriting Conflicts (NI 33-105), the underwriters are not required to comply with the disclosure requirements of NI 33-105 regarding underwriter conflicts of interest in connection with this offering.
Hong Kong
The shares of Class A common stock may not be offered or sold in Hong Kong by means of any document other than (i) in circumstances which do not constitute an offer to the public within the meaning of the Companies (Winding Up and Miscellaneous Provisions) Ordinance (Cap. 32 of the Laws of Hong Kong) (the “Companies (Winding Up and Miscellaneous Provisions) Ordinance”), or which do not constitute an invitation to the public within the meaning of the Securities and Futures Ordinance (Cap. 571 of the Laws of Hong Kong) (the “Securities and Futures Ordinance”), or (ii) to “professional investors” as defined in the Securities and Futures Ordinance and any rules made thereunder, or (iii) in other circumstances which do not result in the document being a “prospectus” as defined in the Companies (Winding Up and Miscellaneous Provisions) Ordinance, and no advertisement, invitation, or document relating to the shares of Class A common stock may be issued or may be in the possession of any person for the purpose of issue (in each case whether in Hong Kong or elsewhere), which is directed at, or the contents of which are likely to be accessed or read by, the public in Hong Kong (except if permitted to do so under the securities laws of Hong Kong) other than with respect to shares of Class A common stock which are or are intended to be disposed of only
212
Table of Contents
to persons outside Hong Kong or only to “professional investors” in Hong Kong as defined in the Securities and Futures Ordinance and any rules made thereunder.
Singapore
This prospectus has not been registered as a prospectus with the Monetary Authority of Singapore. Accordingly, this prospectus and any other document or material in connection with the offer or sale, or invitation for subscription or purchase, of the shares of Class A common stock may not be circulated or distributed, nor may the shares of Class A common stock be offered or sold, or be made the subject of an invitation for subscription or purchase, whether directly or indirectly, to persons in Singapore other than (i) to an institutional investor (as defined under Section 4A of the Securities and Futures Act, Chapter 289 of Singapore (the “SFA”)) under Section 274 of the SFA, (ii) to a relevant person (as defined in Section 275(2) of the SFA) pursuant to Section 275(1) of the SFA, or any person pursuant to Section 275(1A) of the SFA, and in accordance with the conditions specified in Section 275 of the SFA, or (iii) otherwise pursuant to, and in accordance with the conditions of, any other applicable provision of the SFA, in each case subject to conditions set forth in the SFA.
Where the shares of Class A common stock are subscribed or purchased under Section 275 of the SFA by a relevant person which is a corporation (which is not an accredited investor (as defined in Section 4A of the SFA)) the sole business of which is to hold investments and the entire share capital of which is owned by one or more individuals, each of whom is an accredited investor, the securities (as defined in Section 239(1) of the SFA) of that corporation shall not be transferable for 6 months after that corporation has acquired the shares of Class A common stock under Section 275 of the SFA except: (i) to an institutional investor under Section 274 of the SFA or to a relevant person (as defined in Section 275(2) of the SFA), (ii) where such transfer arises from an offer in that corporation’s securities pursuant to Section 275(1A) of the SFA, (iii) where no consideration is or will be given for the transfer, (iv) where the transfer is by operation of law, (v) as specified in Section 276(7) of the SFA, or (vi) as specified in Regulation 32 of the Securities and Futures (Offers of Investments) (Shares and Debentures) Regulations 2005 of Singapore (the “Regulation 32”).
Where the shares of Class A common stock are subscribed or purchased under Section 275 of the SFA by a relevant person which is a trust (where the trustee is not an accredited investor (as defined in Section 4A of the SFA)) whose sole purpose is to hold investments and each beneficiary of the trust is an accredited investor, the beneficiaries’ rights and interest (howsoever described) in that trust shall not be transferable for 6 months after that trust has acquired the shares of Class A common stock under Section 275 of the SFA except: (i) to an institutional investor under Section 274 of the SFA or to a relevant person (as defined in Section 275(2) of the SFA), (ii) where such transfer arises from an offer that is made on terms that such rights or interest are acquired at a consideration of not less than S$200,000 (or its equivalent in a foreign currency) for each transaction (whether such amount is to be paid for in cash or by exchange of securities, or other assets), (iii) where no consideration is or will be given for the transfer, (iv) where the transfer is by operation of law, (v) as specified in Section 276(7) of the SFA, or (vi) as specified in Regulation 32.
Singapore SFA Product Classification—In connection with Section 309B of the SFA and the CMP Regulations 2018, unless otherwise specified before an offer of shares of our common stock, we have determined, and hereby notify, all relevant persons (as defined in Section 309A(1) of the SFA), that shares of our Class A common stock are “prescribed capital markets products” (as defined in the CMP Regulations 2018) and Excluded Investment Products (as defined in MAS Notice SFA 04-N12: Notice on the Sale of Investment Products and MAS Notice FAA-N16: Notice on Recommendations on Investment Products).
213
Table of Contents
Japan
The shares of Class A common stock have not been and will not be registered under the Financial Instruments and Exchange Act of Japan (Act No. 25 of 1948, as amended), or the FIEA. The shares of Class A common stock may not be offered or sold, directly or indirectly, in Japan or to or for the benefit of any resident of Japan (including any person resident in Japan or any corporation or other entity organized under the laws of Japan) or to others for reoffering or resale, directly or indirectly, in Japan or to or for the benefit of any resident of Japan, except pursuant to an exemption from the registration requirements of the FIEA and otherwise in compliance with any relevant laws and regulations of Japan.
Australia
No placement document, prospectus, product disclosure statement or other disclosure document has been lodged with the Australian Securities and Investments Commission (“ASIC”), in relation to the offering. This prospectus does not constitute a prospectus, product disclosure statement or other disclosure document under the Corporations Act 2001 (the “Corporations Act”), and does not purport to include the information required for a prospectus, product disclosure statement or other disclosure document under the Corporations Act.
Any offer in Australia of the shares of Class A common stock may only be made to persons (the “Exempt Investors”) who are “sophisticated investors” (within the meaning of section 708(8) of the Corporations Act), “professional investors” (within the meaning of section 708(11) of the Corporations Act) or otherwise pursuant to one or more exemptions contained in section 708 of the Corporations Act so that it is lawful to offer the shares of Class A common stock without disclosure to investors under Chapter 6D of the Corporations Act.
The shares of Class A common stock applied for by Exempt Investors in Australia must not be offered for sale in Australia in the period of 12 months after the date of allotment under the offering, except in circumstances where disclosure to investors under Chapter 6D of the Corporations Act would not be required pursuant to an exemption under section 708 of the Corporations Act or otherwise or where the offer is pursuant to a disclosure document which complies with Chapter 6D of the Corporations Act. Any person acquiring shares of Class A common stock must observe such Australian on-sale restrictions.
This prospectus contains general information only and does not take account of the investment objectives, financial situation or particular needs of any particular person. It does not contain any securities recommendations or financial product advice. Before making an investment decision, investors need to consider whether the information in this prospectus is appropriate to their needs, objectives and circumstances, and, if necessary, seek expert advice on those matters.
Dubai International Financial Centre
This prospectus relates to an Exempt Offer in accordance with the Offered Securities Rules of the Dubai Financial Services Authority (“DFSA”). This prospectus is intended for distribution only to persons of a type specified in the Offered Securities Rules of the DFSA. It must not be delivered to, or relied on by, any other person. The DFSA has no responsibility for reviewing or verifying any documents in connection with Exempt Offers. The DFSA has not approved this prospectus nor taken steps to verify the information set forth herein and has no responsibility for the prospectus. The shares of Class A common stock to which this prospectus relates may be illiquid and/or subject to restrictions on their resale. Prospective purchasers of the shares of Class A common stock offered should conduct their own due diligence on the shares of Class A common stock. If you do not understand the contents of this prospectus you should consult an authorized financial advisor.
214
Table of Contents
Switzerland
We have not and will not register with the Swiss Financial Market Supervisory Authority (“FINMA”) as a foreign collective investment scheme pursuant to Article 119 of the Federal Act on Collective Investment Scheme of 23 June 2006, as amended (“CISA”), and accordingly the shares of Class A Common Stock being offered pursuant to this prospectus have not and will not be approved, and may not be licenseable, with FINMA. Therefore, the shares of Class A common stock have not been authorized for distribution by FINMA as a foreign collective investment scheme pursuant to Article 119 CISA and the shares of Class A common stock offered hereby may not be offered to the public (as this term is defined in Article 3 CISA) in or from Switzerland. The shares of Class A common stock may solely be offered to “qualified investors,” as this term is defined in Article 10 CISA, and in the circumstances set out in Article 3 of the Ordinance on Collective Investment Scheme of 22 November 2006, as amended (“CISO”), such that there is no public offer. Investors, however, do not benefit from protection under CISA or CISO or supervision by FINMA. This prospectus and any other materials relating to the shares of Class A common stock are strictly personal and confidential to each offeree and do not constitute an offer to any other person. This prospectus may only be used by those qualified investors to whom it has been handed out in connection with the offer described herein and may neither directly or indirectly be distributed or made available to any person or entity other than its recipients. It may not be used in connection with any other offer and shall in particular not be copied and/or distributed to the public in Switzerland or from Switzerland. This prospectus does not constitute an issue prospectus as that term is understood pursuant to Article 652a and/or 1156 of the Swiss Federal Code of Obligations. We have not applied for a listing of the shares of Class A common stock on the SIX Swiss Exchange or any other regulated securities market in Switzerland, and consequently, the information presented in this prospectus does not necessarily comply with the information standards set out in the listing rules of the SIX Swiss Exchange and corresponding prospectus schemes annexed to the listing rules of the SIX Swiss Exchange.
215
Table of Contents
The validity of the shares of our Class A common stock offered hereby and certain legal matters in connection with this offering will be passed upon for us by Latham & Watkins LLP, New York, New York. Certain legal matters in connection with this offering will be passed upon for the underwriters by Kirkland & Ellis LLP, New York, New York.
The consolidated financial statements as of December 31, 2020 and 2021 and the years then ended included in this prospectus have been so included in reliance on the report of Crowe LLP, independent registered public accounting firm, given on the authority of said firm as experts in auditing and accounting.
WHERE YOU CAN FIND MORE INFORMATION
We have filed with the SEC a registration statement on Form S-1 under the Securities Act with respect to the shares of Class A common stock offered hereby. This prospectus, which constitutes a part of the registration statement, does not contain all of the information set forth in the registration statement or the exhibits filed therewith. For further information about us and the shares of Class A common stock offered hereby, reference is made to the registration statement and the exhibits filed therewith. Statements contained in this prospectus regarding the contents of any contract or any other document that is filed as an exhibit to the registration statement are not necessarily complete, and in each instance, we refer you to the copy of such contract or other document filed as an exhibit to the registration statement. The SEC maintains a website that contains reports, proxy and information statements and other information regarding registrants that file electronically with the SEC. The address of the website is www.sec.gov.
As a result of this offering, we will become subject to the information and reporting requirements of the Exchange Act and, in accordance with this law, will file periodic reports, proxy and information statements and other information with the SEC. These periodic reports, proxy and information statements and other information will be available for inspection at the website of the SEC referred to above. We also maintain a website at www.steinway.com. Upon completion of this offering, you may access these materials free of charge as soon as reasonably practicable after they are filed electronically with, or furnished to, the SEC. The inclusion of our website address in this prospectus is an inactive textual reference only. The information contained on, or that can be accessed through, our website is not incorporated by reference into, and is not a part of, this prospectus or the registration statement of which this prospectus forms a part. Investors should not rely on any such information in deciding whether to purchase our Class A common stock.
216
Table of Contents
STEINWAY MUSICAL INSTRUMENTS HOLDINGS, INC.
INDEX TO CONSOLIDATED FINANCIAL STATEMENTS
| Page | ||||
| F-2 | ||||
Consolidated Financial Statements as of and for the Years Ended December 31, 2020 and 2021: | ||||
| F-3 | ||||
| F-4 | ||||
| F-5 | ||||
| F-6 | ||||
| F-7 | ||||
| F-8 | ||||
Consolidated Financial Statements as of March 31, 2022 and for the Three Months Ended March 31, 2022 and 2021: | ||||
| F-46 | ||||
| F-47 | ||||
Unaudited Condensed Consolidated Statements of Comprehensive Income | F-48 | |||
Unaudited Condensed Consolidated Statements of Stockholders’ Equity | F-49 | |||
| F-50 | ||||
| F-51 | ||||
Table of Contents
REPORT OF INDEPENDENT REGISTERED PUBLIC ACCOUNTING FIRM
Board of Directors and Stockholder of
Steinway Musical Instruments Holdings, Inc.
New York, New York
Opinion on the Financial Statements
We have audited the accompanying consolidated balance sheets of Steinway Musical Instruments Holdings, Inc. (the “Company”) as of December 31, 2021 and 2020, the related consolidated statements of operations, comprehensive income, stockholder’s equity, and cash flows for each of the years then ended, and the related notes (collectively referred to as the “financial statements”). In our opinion, the financial statements present fairly, in all material respects, the financial position of the Company as of December 31, 2021 and 2020, and the results of its operations and its cash flows for each of the years then ended, in conformity with accounting principles generally accepted in the United States of America.
Basis for Opinion
These financial statements are the responsibility of the Company’s management. Our responsibility is to express an opinion on the Company’s financial statements based on our audits. We are a public accounting firm registered with the Public Company Accounting Oversight Board (United States) (“PCAOB”) and are required to be independent with respect to the Company in accordance with the U.S. federal securities laws and the applicable rules and regulations of the Securities and Exchange Commission and the PCAOB.
We conducted our audits in accordance with the standards of the PCAOB. Those standards require that we plan and perform the audit to obtain reasonable assurance about whether the financial statements are free of material misstatement, whether due to error or fraud. The Company is not required to have, nor were we engaged to perform, an audit of its internal control over financial reporting. As part of our audits we are required to obtain an understanding of internal control over financial reporting but not for the purpose of expressing an opinion on the effectiveness of the Company’s internal control over financial reporting. Accordingly, we express no such opinion.
Our audits included performing procedures to assess the risks of material misstatement of the financial statements, whether due to error or fraud, and performing procedures that respond to those risks. Such procedures included examining, on a test basis, evidence regarding the amounts and disclosures in the financial statements. Our audits also included evaluating the accounting principles used and significant estimates made by management, as well as evaluating the overall presentation of the financial statements. We believe that our audits provide a reasonable basis for our opinion.
/s/ Crowe LLP
We have served as the Company’s auditor since 2016.
Livingston, New Jersey
March 28, 2022
F-2
Table of Contents
STEINWAY MUSICAL INSTRUMENTS HOLDINGS, INC.
(In thousands, except share and per share data)
| December 31, | ||||||||
| 2020 | 2021 | |||||||
ASSETS | ||||||||
Current assets: | ||||||||
Cash and cash equivalents | $ | 43,784 | $ | 43,718 | ||||
Accounts and notes receivable, net | 31,815 | 39,050 | ||||||
Inventories, net | 181,733 | 168,007 | ||||||
Prepaid expenses and other current assets | 6,273 | 13,866 | ||||||
|
|
|
| |||||
Total current assets | 263,605 | 264,641 | ||||||
Property, plant and equipment, net | 133,406 | 138,502 | ||||||
Intangible assets, net | 131,516 | 133,221 | ||||||
Goodwill | 92,536 | 91,767 | ||||||
Deferred tax assets | 5,606 | 7,483 | ||||||
Other long-term assets | 10,591 | 10,436 | ||||||
|
|
|
| |||||
Total assets | $ | 637,260 | $ | 646,050 | ||||
|
|
|
| |||||
LIABILITIES AND STOCKHOLDERS’ EQUITY | ||||||||
Current liabilities: | ||||||||
Accounts payable | 12,860 | 20,734 | ||||||
Debt – current | 4,558 | 2,122 | ||||||
Other current liabilities | 71,546 | 123,183 | ||||||
|
|
|
| |||||
Total current liabilities | 88,964 | 146,039 | ||||||
Debt – noncurrent | 142,776 | 48,382 | ||||||
Deferred tax liabilities | 16,099 | 20,481 | ||||||
Pension and other post-retirement benefit liabilities | 59,171 | 42,470 | ||||||
Other noncurrent liabilities | 24,777 | 18,282 | ||||||
|
|
|
| |||||
Total liabilities | 331,787 | 275,654 | ||||||
Commitments and contingencies (Note 10) | ||||||||
Stockholders’ equity: | ||||||||
Preferred stock, $0.01 par value; 1,000 shares authorized as of December 31, 2020 and 2021; no shares issued and outstanding as of December 31, 2020 and 2021 | — | — | ||||||
Common stock, $0.01 par value; 1,000 shares authorized as of December 31, 2020 and 2021; 1,000 shares issued and outstanding as of December 31, 2020 and 2021 | — | — | ||||||
Additional paid-in capital | 233,170 | 233,170 | ||||||
Retained earnings | 110,764 | 170,027 | ||||||
Accumulated other comprehensive loss | (38,461 | ) | (32,801 | ) | ||||
|
|
|
| |||||
Total stockholders’ equity | 305,473 | 370,396 | ||||||
|
|
|
| |||||
Total liabilities and stockholders’ equity | $ | 637,260 | $ | 646,050 | ||||
|
|
|
| |||||
The accompanying notes are an integral part of these consolidated financial statements.
F-3
Table of Contents
STEINWAY MUSICAL INSTRUMENTS HOLDINGS, INC.
CONSOLIDATED STATEMENTS OF OPERATIONS
(In thousands, except share and per share data)
| Year Ended December 31, | ||||||||
| 2020 | 2021 | |||||||
Net sales | $ | 415,856 | $ | 538,350 | ||||
Cost of sales | 256,672 | 313,735 | ||||||
|
|
|
| |||||
Gross profit | 159,184 | 224,615 | ||||||
Selling, general and administrative expenses | 105,222 | 136,385 | ||||||
Goodwill impairment | 13,593 | — | ||||||
|
|
|
| |||||
Total operating expense | 166 | 136,385 | ||||||
|
|
|
| |||||
Income from operations | 40,369 | 88,230 | ||||||
Other (income) expense, net: | ||||||||
Interest expense, net | 15,546 | 5,237 | ||||||
Other pension benefit | (165 | ) | (341 | ) | ||||
Gain on sale of assets held for sale | (56,290 | ) | — | |||||
Other income | (943 | ) | (1,606 | ) | ||||
|
|
|
| |||||
Total other (income) expense, net | (41,852 | ) | 3,290 | |||||
|
|
|
| |||||
Income before provision for income taxes | $ | 82,221 | $ | 84,940 | ||||
Income tax expense | 30,406 | 25,677 | ||||||
|
|
|
| |||||
Net income | $ | 51,815 | $ | 59,263 | ||||
|
|
|
| |||||
Net income per share: | ||||||||
Basic and diluted | $ | 51,815 | $ | 59,263 | ||||
|
|
|
| |||||
Weighted-average common shares used in computing net income per share: | ||||||||
Basic and diluted | 1,000 | 1,000 | ||||||
|
|
|
| |||||
The accompanying notes are an integral part of these consolidated financial statements.
F-4
Table of Contents
STEINWAY MUSICAL INSTRUMENTS HOLDINGS, INC.
CONSOLIDATED STATEMENTS OF COMPREHENSIVE INCOME
(In thousands)
| Year Ended December 31, | ||||||||
| 2020 | 2021 | |||||||
Net income | $ | 51,815 | $ | 59,263 | ||||
Other comprehensive income (loss), net of tax: | ||||||||
Foreign currency translation adjustments | 6,811 | (3,776 | ) | |||||
Pension and other post-retirement benefit plans activity | (5,100 | ) | 9,436 | |||||
|
|
|
| |||||
Total other comprehensive income | 1,711 | 5,660 | ||||||
|
|
|
| |||||
Total comprehensive income | $ | 53,526 | $ | 64,923 | ||||
|
|
|
| |||||
The accompanying notes are an integral part of these consolidated financial statements.
F-5
Table of Contents
STEINWAY MUSICAL INSTRUMENTS HOLDINGS, INC.
CONSOLIDATED STATEMENTS OF STOCKHOLDER’S EQUITY
(In thousands, except share data)
| Preferred Stock | Common Stock | Additional Paid-in Capital | Retained Earnings | Accumulated Other Comprehensive Loss | Total Stockholders’ Equity | |||||||||||||||||||||||||||
| Shares | Amount | Shares | Amount | |||||||||||||||||||||||||||||
Balance—January 1, 2020 | — | $ | — | 1,000 | $ | — | $ | 215,313 | $ | 58,949 | $ | (40,172 | ) | $ | 234,090 | |||||||||||||||||
Pension and other post-retirement benefit plans activity, net of taxes | — | — | — | — | — | — | (5,100 | ) | (5,100 | ) | ||||||||||||||||||||||
Contribution from parent | — | — | — | — | 17,857 | — | — | 17,857 | ||||||||||||||||||||||||
Foreign currency translation adjustments | — | — | — | — | — | — | 6,811 | 6,811 | ||||||||||||||||||||||||
Net income | — | — | — | — | — | 51,815 | — | 51,815 | ||||||||||||||||||||||||
|
|
|
|
|
|
|
|
|
|
|
|
|
|
|
| |||||||||||||||||
Balance—December 31, 2020 | — | $ | — | 1,000 | $ | — | $ | 233,170 | $ | 110,764 | $ | (38,461 | ) | $ | 305,473 | |||||||||||||||||
Pension and other post-retirement benefit plans activity, net of taxes | — | — | — | — | — | — | 9,436 | 9,436 | ||||||||||||||||||||||||
Contribution from parent | — | — | — | — | — | — | — | — | ||||||||||||||||||||||||
Foreign currency translation adjustments | — | — | — | — | — | — | (3,776 | ) | (3,776 | ) | ||||||||||||||||||||||
Net income | — | — | — | — | — | 59,263 | — | 59,263 | ||||||||||||||||||||||||
|
|
|
|
|
|
|
|
|
|
|
|
|
|
|
| |||||||||||||||||
Balance—December 31, 2021 | — | $ | — | 1,000 | $ | — | $ | 233,170 | $ | 170,027 | $ | (32,801 | ) | $ | 370,396 | |||||||||||||||||
|
|
|
|
|
|
|
|
|
|
|
|
|
|
|
| |||||||||||||||||
The accompanying notes are an integral part of these consolidated financial statements.
F-6
Table of Contents
STEINWAY MUSICAL INSTRUMENTS HOLDINGS, INC.
CONSOLIDATED STATEMENTS OF CASH FLOWS
(In thousands)
| Year Ended December 31, | ||||||||
| 2020 | 2021 | |||||||
Cash flows from operating activities: | ||||||||
Net income | $ | 51,815 | $ | 59,263 | ||||
Adjustments to reconcile net income to net cash used in operating activities: | ||||||||
Depreciation and amortization | 14,950 | 14,889 | ||||||
Impairment charges | 16,093 | — | ||||||
Non-cash interest expense and other | 745 | 2,206 | ||||||
Share-based compensation | 1,860 | 7,644 | ||||||
Non-cash employee compensation | 250 | — | ||||||
Decrease (increase) in fair value of derivative instruments | 1,478 | (4,685 | ) | |||||
Deferred income tax | 4,674 | (1,156 | ) | |||||
Provision for (recovery of) doubtful accounts | 228 | (149 | ) | |||||
Amortization of pension from other comprehensive loss | 2,031 | 2,758 | ||||||
Gain on sale of assets | (55,888 | ) | (23 | ) | ||||
Changes in operating assets and liabilities: | ||||||||
Accounts and notes receivable | 19,669 | (6,845 | ) | |||||
Inventories | 10,781 | 15,407 | ||||||
Prepaid expenses and other current assets | 2,095 | (7,925 | ) | |||||
Accounts payable | (909 | ) | 1,912 | |||||
Other current and noncurrent liabilities | (11,425 | ) | 39,189 | |||||
|
|
|
| |||||
Net cash provided by operating activities | 58,447 | 122,485 | ||||||
|
|
|
| |||||
Cash flows from investing activities: | ||||||||
Capital expenditures | (9,895 | ) | (21,991 | ) | ||||
Capitalization of software development costs | (1,076 | ) | (958 | ) | ||||
Acquisition of land development rights | — | (1,297 | ) | |||||
Proceeds from sales of property, plant and equipment | 68,551 | 108 | ||||||
Other investments | — | (849 | ) | |||||
|
|
|
| |||||
Net cash provided by (used in) investing activities | 57,580 | (24,987 | ) | |||||
|
|
|
| |||||
Cash flows from financing activities: | ||||||||
Net borrowings/(repayments) under domestic lines of credit | 20,000 | (500 | ) | |||||
Borrowings of long-term debt | 21,742 | 945 | ||||||
Net borrowings/(repayments) under foreign lines of credit | (9,174 | ) | 1,501 | |||||
Repayments of long-term debt | (136,659 | ) | (98,306 | ) | ||||
|
|
|
| |||||
Net cash used in financing activities | (104,091 | ) | (96,360 | ) | ||||
|
|
|
| |||||
Effects of foreign exchange rate changes on cash and cash equivalents | 1,926 | (1,204 | ) | |||||
Net increase (decrease) in cash and cash equivalents | 13,862 | (66 | ) | |||||
Cash and cash equivalents—beginning of year | 29,922 | 43,784 | ||||||
|
|
|
| |||||
Cash and cash equivalents—end of year | $ | 43,784 | $ | 43,718 | ||||
|
|
|
| |||||
Supplemental disclosure of cash flow information: | ||||||||
Cash paid for interest | $ | 13,150 | $ | 8,143 | ||||
Cash paid for income taxes | 31,357 | 20,814 | ||||||
Supplemental disclosure of non-cash information: | ||||||||
Accrued capital expenditures | 500 | (440 | ) | |||||
Non-cash contribution from parent | 17,857 | — | ||||||
The accompanying notes are an integral part of these consolidated financial statements.
F-7
Table of Contents
1. Organization and Description of Business
Steinway Musical Instruments Holdings, Inc. (“SMIH” or the “Company”) was previously incorporated under the name Pianissimo Holdings Corp. On November 29, 2021, the Company changed its name from Pianissimo Holdings Corp. to Steinway Musical Instruments Holdings, Inc.
SMIH is a manufacturer of musical instruments. The Company, through its piano (“Steinway”) and band (“Conn-Selmer”) divisions, manufactures and distributes products within the musical instrument industry, as well as the personal luxury goods industry. Steinway pianos are primarily manufactured in facilities in the United States and Germany. The Company’s Boston and Essex brand pianos are manufactured in Asia at third-party manufacturing facilities. Conn-Selmer is a manufacturer of band and orchestral instruments and related accessories, offering complete lines of brass, woodwind, percussion, and string instruments. The Company maintains its United States headquarters in New York and operates globally throughout the Americas, Europe, Middle East, and Africa (“EMEA”), and Asia-Pacific.
Emerging Growth Company Status
The Company is an “emerging growth company” as defined in Section 2(a) of the Securities Act, as modified by the Jumpstart Our Business Startups Act of 2012 (the “JOBS Act”), and it may take advantage of certain exceptions from various reporting requirements that are applicable to other public companies that are not emerging growth companies including, but not limited to, not being required to comply with the auditor attestation requirements of Section 404 of the Sarbanes-Oxley Act of 2002, reduced disclosure obligations regarding executive compensation in its periodic reports and proxy statements, and exemptions from the requirements of holding a nonbinding advisory vote on executive compensation and shareholder approval of any golden parachute payments not previously approved.
Further, Section 102(b)(1) of the JOBS Act exempts emerging growth companies from being required to comply with new or revised financial accounting standards until private companies (that is, those that have not had a Securities Act registration statement declared effective or do not have a class of securities registered under the Exchange Act) are required to comply with the new or revised financial accounting standards. The JOBS Act provides that a company can elect to opt out of the extended transition period and comply with the requirements that apply to non-emerging growth companies, but any such election to opt out is irrevocable. The Company has elected not to opt out of such extended transition period, which means that when a standard is issued or revised and it has different application dates for public or private companies, the Company, as an emerging growth company, can adopt the new or revised standard at the time private companies adopt the new or revised standard. This may make comparison of the Company’s consolidated financial statements with another public company, which is neither an emerging growth company, nor an emerging growth company which has opted out of using the extended transition period, difficult or impossible because of the potential differences in accounting standards used.
2. Summary of Significant Accounting Policies
Basis of Presentation
These consolidated financial statements have been prepared in accordance with accounting principles generally accepted in the United States (U.S. GAAP) and include the accounts of the Company and its wholly owned subsidiaries. All intercompany balances and transactions have been eliminated.
Reclassifications
Certain prior year amounts have been reclassified for comparative purposes to conform to the current-year financial statement presentation. These reclassifications had no effect on previously reported results.
F-8
Table of Contents
Use of Estimates
The preparation of financial statements in conformity with U.S. GAAP requires management to make significant estimates and assumptions that affect the reported amounts of assets and liabilities, the disclosure of assets and contingent liabilities at the date of the financial statements, and the reported amounts of revenues and expenses during the reporting period. Actual results could differ from those estimates. The significant estimates in the consolidated financial statements include determining the sufficiency of the reserve for sales discounts and returns, the evaluation of the recoverability of goodwill, indefinite life intangible assets and long-lived assets, pension and other post-retirement benefit cost assumptions, deferred income tax asset valuation allowances, and the measurement to fair value of the share-based compensation liability.
Segment Information
Operating segments are defined as components of an enterprise about which separate financial information is available that is evaluated regularly by the chief operating decision maker, or decision-making group, in deciding how to allocate resources and in assessing performance. The Company operates in two operating segments: Piano and Band. The Company considers these two segments as operating segments since they are managed separately, and the operating results of each segment are separately reviewed and evaluated by senior management on a regular basis.
Basic and Diluted Net Income per Share
Basic income per share is computed by dividing net income by the weighted-average number of shares of common stock outstanding during the period. Diluted income per share is computed by dividing net income by the weighted-average number of shares of common stock together with the number of additional shares of common stock that would have been outstanding if all potentially dilutive shares of common stock had been issued. The Company does not have any other participating equity instruments outstanding. Accordingly, basic and diluted net income per share is the same for all periods.
Risk and Uncertainties
On March 11, 2020, the World Health Organization characterized the outbreak of COVID-19 as a global pandemic and recommended containment and mitigation measures. In response, extraordinary actions were taken by international, federal, state, and local public health and governmental authorities to contain and combat the outbreak and spread of COVID-19 in regions throughout the world. These actions included travel bans, quarantines, “stay-at-home” orders, and similar mandates for many individuals to substantially restrict daily activities and for many businesses to curtail or cease normal operations. Some of these measures have since been rescinded, but the Company continues to take precautionary measures in order to minimize the risk of the virus to its employees and the communities in which it operates. While the impacts of COVID-19 had generally stabilized by the end of the year, there remains uncertainty around the broader implications of the COVID-19 pandemic on the Company’s results of operations and overall financial performance, including the Company’s ability to offset higher costs of suppliers as a result of inflation or disruptions in the supply chain. The COVID-19 pandemic negatively impacted the Company’s supply chain, leading to longer lead times and increasing freight costs. The Company also experienced decreasing microchip availability leading to increased material costs for Spirio pianos. The COVID-19 pandemic has, to date, not had a material adverse impact on the Company’s ability to raise funds to sustain operations. However, due to the impact from COVID-19 on the Band segment, the Company recognized a total of $13.6 million and $2.5 million of non-cash goodwill and trademark impairment charges, respectively, during 2020. See Note 8 for further discussion. The economic effects of the pandemic and resulting long-term societal changes are currently not predictable, and the future financial impacts could vary from those we have experienced.
As the Company expands globally, it becomes more exposed to global social and macroeconomic risks, including geopolitical events such as the Russia-Ukraine conflict. For the year
F-9
Table of Contents
ended December 31, 2021, the Company’s net sales in Russia and Ukraine were immaterial. However, the economic effects of the geopolitical events are currently not predictable, and the future financial impacts could vary from those the Company has experienced.
Business Combinations
The Company accounts for its business combinations using the acquisition method of accounting, which requires, among other things, allocation of the fair value of purchase consideration to the tangible and intangible assets acquired and liabilities assumed at their estimated fair values on the acquisition date. The excess of the fair value of purchase consideration over the values of these identifiable assets and liabilities is recorded as goodwill. When determining the fair value of assets acquired and liabilities assumed, management makes significant estimates and assumptions, especially with respect to intangible assets. Management’s estimates of fair value are based upon assumptions believed to be reasonable, but which are inherently uncertain and unpredictable and, as a result, actual results may differ from estimates. During the measurement period, not to exceed one year from the date of acquisition, the Company may record adjustments to the assets acquired and liabilities assumed, with a corresponding offset to goodwill if new information is obtained related to facts and circumstances that existed as of the acquisition date. After the measurement period, any subsequent adjustments are reflected in the consolidated statements of operations and comprehensive loss. Acquisition costs, such as legal and consulting fees, are expensed as incurred.
Cash and Cash Equivalents
The Company considers all investments purchased with maturities of three months or less to be cash equivalents. Cash equivalents consist primarily of investments in highly liquid securities. As of December 31, 2020 and 2021, the Company maintained $43.8 million and $36.9 million of cash in foreign countries, respectively.
Concentration of Credit Risk
Financial instruments that potentially subject the Company to concentrations of credit risk consist primarily of cash and cash equivalents, and accounts and notes receivable. The Company maintains cash and cash equivalents with various domestic and foreign financial institutions of high credit quality. Management believes that the Company is not exposed to significant credit risk due to the financial strength of the depository institution in which the cash is held.
Accounts and Notes Receivable, net
The Company’s accounts receivable and notes receivable are derived from contracts with customers and are recorded per the terms of the agreement or sales contract. Certain creditworthy institutional customers are offered extended financing through notes receivable. The Company’s notes receivables generally range 1 to 5 years. The Company classifies its notes receivable as accounts and notes receivables, net or other long-term assets based on the underlying due dates. The notes receivables bear interest with rates ranging from 0 - 11.25%, and any imputed interest income recognized for long term notes receivables for the years ended December 31, 2020 and 2021 were immaterial. See Note 5.
The Company’s policy for estimating the allowance for doubtful accounts on accounts receivable and notes receivable is to reserve for all receivables that are in excess of one year past due. For certain institutional customers, the Company performs a specific reserve analysis on a case-by-case basis. Adjustments to the allowance doubtful accounts are recorded in selling, general and administrative expenses.
Inventories, net
Inventories are stated at the lower of cost or net realizable value, which is defined as estimated selling prices in the ordinary course of business, less reasonably predictable costs of completion,
F-10
Table of Contents
disposal and transportation. Cost is determined on a first-in, first-out basis. Once inventory is written-down, a new, lower cost basis for that inventory is established and subsequent changes in facts and circumstances do not result in the restoration or increase in that newly established cost basis. The Company also estimates for obsolescence and slow-moving inventory. Changes in the Company’s inventory provision are included in cost of sales.
Fair Value of Financial Instruments
Fair value is defined as the exchange price that would be received for an asset or paid to transfer a liability (an exit price) in the principal or most advantageous market for the asset or liability in an orderly transaction between market participants on the measurement date. Valuation techniques used to measure fair value must maximize the use of observable inputs and minimize the use of unobservable inputs. The guidance describes a fair value hierarchy based on three levels of inputs, of which the first two are considered observable and the last unobservable, that may be used to measure fair value.
Level 1—Inputs are unadjusted quoted prices in active markets for identical assets or liabilities at the measurement date.
Level 2—Inputs are observable, unadjusted quoted prices in active markets for similar assets or liabilities; unadjusted quoted prices for identical or similar assets or liabilities in markets that are not active; or other inputs that are observable or can be corroborated by observable market data for substantially the full term of the related assets or liabilities.
Level 3—Unobservable inputs that are supported by little or no market data for the related assets or liabilities.
The categorization of a financial instrument within the fair value hierarchy is based upon the lowest level of input that is significant to the fair value measurement. The Company’s financial instruments include cash and cash equivalents, accounts and notes receivable, accounts payable and accrued liabilities, other current assets and liabilities, debt, and interest rate swaps. At December 31, 2020 and 2021, the carrying amounts of accounts and notes receivable, accounts payable and other current assets and liabilities approximated at their fair values because of their short-term nature. At December 31, 2021, the carrying amount of the Company’s long-term debt approximates fair value as the stated interest rate approximates market rates currently available to the Company. See Note 4.
Derivative Instruments
The Company uses derivative financial instruments to manage its exposure to fluctuations in interest rates. The Company currently does not engage in speculative derivative activities or derivative trading activities. All financial derivative instruments are recorded on the consolidated balance sheets at fair value. The estimated fair values of derivative financial instruments are calculated based on market rates. These values represent the estimated amounts the Company would receive or pay on termination of agreements, taking into consideration current market rates and the current creditworthiness of the counterparty or the Company. The Company has not formally documented or designated its interest rate swaps as hedges and therefore does not apply hedge accounting to these instruments. All derivative financial instruments have been marked-to-market and the related unrealized gain or loss is included in interest expense, net in the consolidated statements of operations. There was no cash collateral received or pledged as of December 31, 2020 and 2021 related to the Company’s derivative financial instruments.
Property, Plant and Equipment, net
Property, plant and equipment are recorded at cost less accumulated depreciation and amortization. Cost basis includes certain assets acquired in business combinations that were initially
F-11
Table of Contents
recorded at fair value as of the date of acquisition. Depreciation is provided using the straight-line method over the estimated useful lives of the assets. Leasehold improvements are amortized using the straight-line method over the estimated useful lives of the improvements or the remaining term of the respective lease, whichever is shorter.
Concert and artist, and rental pianos are periodically transferred between inventories and property, plant and equipment.
Software and Software Development Costs
The Company incurs costs to develop software for internal use, as well as software integrated as a component of its products. For computer software developed for internal use, costs that are incurred in the preliminary project and post implementation stages of software development are expensed as incurred. Costs incurred during the application and development stage, which could include compensation, consulting and related expenses, costs of computer hardware and software, and costs incurred in developing features and functionality are capitalized. Capitalized costs are amortized using the straight-line method over a five-year estimated useful life, beginning in the period in which the software is available for use.
Software incorporated in the Company’s products (i.e. Spirio software) are integrated components, not sold or marketed separately. These costs consist primarily of third-party consulting costs, are expensed as incurred until technological feasibility has been established. The Company’s process for developing software is completed concurrently with the establishment of technological feasibility.
During the years ended December 31, 2020 and 2021, the Company capitalized $1.1 million and $1.0 million, respectively, of internally generated software development costs.
Impairment of Long-Lived Assets
Long-lived assets, including property, plant and equipment and definite-lived intangible assets, are reviewed for impairment whenever events or changes in circumstances indicate that the carrying amount of such assets or asset groups (collectively “asset groups”) may not be recoverable. This includes but is not limited to significant adverse changes in business climate, market conditions, or other events that indicate an asset groups’ carrying amount may not be recoverable. Recoverability of asset groups to be held and used is measured first by a comparison of the carrying amount of an asset to future undiscounted net cash flows expected to be generated by the asset group. If such asset groups were considered to be impaired, an impairment loss would be recognized when the carrying amount of the asset exceeds the fair value of the asset. No impairment losses for long-lived assets have been recognized in any of the periods presented.
Goodwill and Indefinite Lived Intangible Assets
Goodwill represents the excess of the cost of an acquired business over the fair value of the assets acquired at the date of acquisition. The Company also holds trademarks with indefinite lives as the Company expects the usefulness to continue indefinitely with no issues of renewal. Goodwill and indefinite lived intangible assets are not subject to amortization but are subject to impairment testing on an annual basis, as of October 1, or whenever events and circumstances indicate the carrying value of the reporting unit or the indefinite lived intangible assets asset may be in excess of their fair value. The Company has two reporting units and tests for goodwill and indefinite lived intangible assets for impairment at the reporting unit level. As part of the goodwill and indefinite lived intangible assets impairment test, the Company first performs a qualitative assessment to determine whether further
F-12
Table of Contents
impairment testing is necessary. If, as a result of its qualitative assessment, it is more-likely-than not that the fair value of the Company’s reporting unit or indefinite lived intangible assets is less than its carrying amount, the impairment test uses a single step approach.
If factors indicate that the fair value of the reporting unit or indefinite lived intangible assets is less than its carrying amount, the Company performs a quantitative assessment and the fair value of the reporting unit is determined by analyzing the expected present value of future cash flows. If the carrying value of the reporting unit continues to exceed its fair value, the implied fair value of the reporting unit’s goodwill is calculated and an impairment loss equal to the excess is recorded. During the year ended December 31, 2020, the Company recognized a non-cash goodwill impairment charge of $13.6 million. During the year ended December 31, 2020, the Company also recognized a non-cash trademark impairment charge of $2.5 million, which is included in selling, general and administrative expenses on the consolidated statements of operations. During the year ended December 31, 2021, the Company performed a qualitative assessment of goodwill and indefinite lived intangible assets, and as a result no such impairment charges were recognized. See Note 8.
Environmental Obligations
The Company accrues for its environmental investigation, remediation, operating and maintenance costs when it is probable that a liability has been incurred and the amount can be reasonably estimated. For environmental matters, the most likely cost to be incurred is accrued based on an evaluation of currently available facts with respect to each individual site, current laws and regulations and prior remediation experience. For sites with multiple potentially responsible parties, the Company considers its likely proportionate share of the anticipated remediation costs and the ability of the other parties to fulfill obligations in establishing a provision for those costs. Where no amount within a range of estimates is more likely to occur than another, the minimum undiscounted amount is accrued.
The uncertain nature inherent in such remediation and the possibility that initial estimates may not reflect the outcome could result in additional costs being recognized by the Company in future periods.
Revenue Recognition
The Company recognizes revenue in accordance with the following five steps: (i) identify the contract(s) with a customer, (ii) identify the performance obligations in the contract, (iii) determine the transaction price, (iv) allocate the transaction price to the performance obligations in the contract, and (v) recognize revenue when (or as) the entity satisfies a performance obligation. The Company applies the five-step model to arrangements that meet the definition of a contract under the standard, including when it is probable that the entity will collect the consideration it is entitled to in exchange for the goods or services it transfers to the customer. At contract inception, once the contract is determined to be within the scope of revenue accounting, the Company evaluates the goods or services promised within each contract related performance obligation and assesses whether each promised good or service is distinct. The Company recognizes as revenue, the amount of the transaction price that is allocated to the respective performance obligation when (or as) the performance obligation is satisfied.
The Company recognizes revenue from contracts with customers when (or as) control of the promised goods or services transfers to the customer. For wholesale revenue, this generally occurs when the product is shipped to the dealer after receipt of a valid order. For retail revenue, this generally occurs when the product is delivered to the customer in accordance with the purchase agreement.
Revenue is recorded at the amount of consideration the Company expects to be entitled to in exchange for the delivered goods or services, which includes an estimate of expected returns or refunds when applicable. The Company records estimates for sales discounts, returns and allowances
F-13
Table of Contents
in the period the related revenue is recognized. The provision for sales discounts, returns and allowances is recorded as a reduction from gross sales and the corresponding reserves are presented within other current liabilities on the consolidated balance sheets. While unit prices are generally fixed, the Company provides variable consideration for some customers, typically in the form of promotional incentives at the time of sale. The Company utilizes the most likely amount to estimate the effect of uncertainty on the amount of variable consideration to which it would be entitled based upon the contractual terms of the incentives and historical experience with each customer.
The Company evaluates contracts with customers to determine if there are separate performance obligations related to timing of product shipment that will be satisfied in different accounting periods. Revenue is deferred until control of the performance obligation has been transferred to the customer. The Company applies the practical expedient in Accounting Standards Codification (“ASC”) 606, Revenue from Contracts with Customers, and does not disclose information about remaining performance obligations that have original expected durations of one year or less, for which work has not yet been performed.
Steinway Spirio pianos include Spirio software as an integrated component of the piano and that cannot be removed, retrofitted, or used separately; therefore, it is not considered a distinct performance obligation. Upon purchase of a Spirio piano, the Company’s customers are given lifetime access to the Company’s Spirio library and, for Spirio | r customers, additional Spiriocast content. No subscription or recurring fees are charged to access the Spirio content. The Spirio functionality represents a right to receive, on a when-and-if-available basis, future unspecified upgrades and additions relating to the Spirio library contents. The Company has determined that the digital music library is a separate performance obligation, under ASC 606. However, the revenues attributable to these promised services are not material and therefore the Company does not treat these services as separate performance obligations in accordance with ASC 606.
Typical payment terms vary based on the customer and the type of goods and services in the contract or purchase order. The period of time between invoicing and when payment is due is not significant. Amounts billed and due from customers are classified as account receivables on the consolidated balance sheets. Standard payment terms are less than one year hence, the Company has elected the practical expedient under ASC 606 to not assess whether a contract has a significant financing component. For contracts with terms of one year or more where a significant financing component exists, the Company records the difference between the amount to be paid by the customer and the standalone price of the product sold as interest income or interest expense over the contractual period using the effective interest rate method.
The Company recognizes an immaterial amount of revenue related to instrument rentals, service contracts, tuning and other services and royalties on the Company’s trademarks. Revenues associated with instrument rental, service contracts, and royalties on the Company’s trademarks are recognized over time as the performance obligation is satisfied. Revenues associated with one-time tuning services are recognized at a point in time once the performance obligation is completed, which is typically the same day the service is provided. See Note 3 for further details.
The Company has elected the practical expedient whereby any incremental costs of obtaining contracts are recognized as an expense when incurred if the amortization period of the assets the Company otherwise would have recognized is one year or less. Certain taxes assessed by governmental authorities on revenue producing transactions, such as sales taxes and value added taxes, are excluded from revenue and recorded on a net basis. The Company has elected to account for any shipping and handling activities that occur after the customer has obtained control of goods as a fulfillment cost rather than as a separate performance obligation.
F-14
Table of Contents
Product Warranties
The Company provides product warranty coverage to the end-user for parts and labor on products sold under its warranty policy. The standard length of the warranty is between one and ten years, depending on the product classification. The Company does not sell or otherwise issue warranties or warranty extensions as stand-alone products. Product warranty is not a separate performance obligation and the estimated cost is recognized at the time of revenue recognition. The accrued expense recorded is generally based on historical warranty costs as a percentage of sales and is adjusted periodically following an analysis of warranty activity.
Costs of Sales
Cost of sales comprises the cost to manufacture our products, including raw materials, direct labor, and overhead, plus freight, duties, warehousing, distribution, and non-refundable taxes incurred in delivering the goods to distribution centers managed by third parties or to our retail stores.
Selling, General and Administrative Expenses
Selling, general and administrative expenses include payroll and payroll related expenses, share-based compensation, occupancy costs for our retail locations and corporate headquarters, including utilities, depreciation, amortization, marketing expense, sales commissions, and other operating costs. Payroll includes both fixed compensation and variable compensation. Costs associated with the Company’s advertising and sales promotions are expensed as incurred. During the years ended December 31, 2020 and 2021, the Company recognized advertising costs of $9.1 million and $10.3 million, respectively.
Income Taxes
The Company provides for income taxes using the asset and liability approach. The Company computes deferred income tax assets and liabilities for differences between the financial statement and tax bases of assets and liabilities that will result in taxable or deductible amounts in the future based on enacted tax laws and rates applicable to the periods in which the differences are expected to affect taxable income. When necessary, the Company establishes valuation allowances to reduce deferred tax assets to the amount that more likely than not will be realized.
The Company reports income tax-related interest and penalties as a component of income tax expense. The Company files income tax returns at the U.S. federal, state, and local levels, as well as in several foreign jurisdictions. With few exceptions, the Company’s tax returns are no longer subject to examinations for years before 2016.
The calculation of tax liabilities involves dealing with uncertainties in the application of complex tax laws and regulations in a multitude of jurisdictions across the Company’s global operations. A tax benefit from an uncertain tax position may be recognized when it is more likely than not that the position will be sustained upon examination, including resolutions of any appeals or litigation processes, on the basis of the technical merits.
The Company records unrecognized tax benefits as uncertain tax liabilities when it is not more likely than not the position will be sustained and adjusts these liabilities when its judgment changes as a result of new information not previously available. Because of the complexity of some of these uncertainties, the ultimate resolution may result in a payment that is materially different from current estimates of the unrecognized tax benefit liabilities. These differences will be reflected as increases or decreases to income tax expense in the period in which new information is available. The Company
F-15
Table of Contents
reevaluates these uncertain tax positions on a quarterly basis. Interest and penalties incurred associated with unresolved income tax positions are included in income tax expense. During the year ended December 31, 2021, the Company recorded $2.7 million of non-current liabilities related to uncertain tax liabilities.
Foreign Currency
The consolidated financial statements are presented in U.S. dollars. The Company’s non-U.S. subsidiaries have a functional currency (i.e., the currency in which operational activities are primarily conducted) that is other than the U.S. dollar, generally the currency of the country in which such subsidiaries are domiciled. Transactions denominated in currencies other than the functional currency are remeasured at period-end using the period-end exchange rate. Gains and losses on transactions denominated in currencies other than the functional currency are included in determining net income for the period. The Company translates assets and liabilities of non-U.S. operations into U.S. dollars using the exchange rates in effect at the balance sheet date, and revenues and expenses at average exchange rates during the year. The Company reports the resulting translation adjustments as a separate component of accumulated other comprehensive income or loss. Transaction (gains)/losses included in other income for the years ended December 31, 2020 and 2021 were $0.6 million and $(0.4) million, respectively.
Retirement Plans
The Company has defined benefit or defined contribution pension plans covering the majority of our employees, including certain employees in foreign countries. Certain domestic hourly employees are covered by multi-employer defined benefit pension plans to which the Company makes contributions. The Company also provides post-retirement life insurance benefits to certain eligible hourly retirees and their dependents. The Company has a non-qualified Supplemental Executive Retirement Plan (“SERP”) for a select group of former executives. On March 5, 2021, the Company’s Board of Directors approved the termination of the Company’s SERP. In conjunction with the termination of the SERP, all participants were fully vested in the awards granted, and benefit accruals ceased. During 2021 the Company liquidated the plan assets, and final asset distributions are planned to be completed during 2022.
Benefits under the pension and other post-retirement benefit plans are generally based on age at retirement and years of service and, for some pension plans, benefits are also based on the employee’s annual earnings. The net cost of pension and other post-retirement benefit plans is determined using the projected unit credit method and several actuarial assumptions, the most significant of which are the discount rate, the long-term rate of asset return, and current rate trends. A portion of these costs is not recognized in net income in the year incurred because it is allocated to product costs and reflected in inventory at the end of a reporting period.
Share-Based Compensation
During the years ended December 31, 2020 and 2021, shareholders of the Company or their affiliates (including such affiliates, the “Owner”) were party to profit participation agreements with an executive. The Company recognizes compensation expense for these profit participation awards as selling, general and administrative expense since the executive provides services to the Company.
The awards are liability classified due to the executive’s ability to require the Company to cash settle the awards. As a nonpublic entity, the Company elected to measure the awards based on their intrinsic value as permitted under ASC 718. The Company measured the intrinsic value of the awards based on the estimated settlement value of the awards at each reporting period. The Company
F-16
Table of Contents
continued to record changes in the intrinsic value of the awards up to the date on which the Company ceased to be a nonpublic entity as defined in ASC 718. Upon becoming a public entity, as a result of filing its initial registration statement with the Securities and Exchange Commission (“SEC”) and for each reporting period thereafter, the Company measured the awards using the fair value-based method as required under ASC 718. The impact from the change in valuation methods on the date on which the Company became a public entity was accounted for as compensation cost during that period, see Note 14. The Company recognizes the compensation cost of share-based awards on a straight-line basis over the requisite service period (typically the vesting period) of each award. The Company has elected to recognize forfeitures as they occur.
Accumulated Other Comprehensive Loss
Comprehensive income is comprised of net income and other comprehensive loss. Other comprehensive loss includes foreign currency translation adjustments and pension and other post-retirement benefit activity, net of income taxes.
The following table summarizes the changes in the components of accumulated other comprehensive loss for the years ended December 31, 2020 and 2021:
| Foreign Currency Translation Adjustments | Minimum Pension Liability and Other Post-Retirement Benefits | Accumulated Other Comprehensive Loss | ||||||||||
Balance at January 1, 2020 | $ | (9,715 | ) | $ | (30,457 | ) | $ | (40,172 | ) | |||
Other comprehensive (loss) income before reclassifications | 6,811 | (7,132 | ) | (321 | ) | |||||||
Amounts reclassified from AOCI | — | 2,032 | 2,032 | |||||||||
|
|
|
|
|
| |||||||
Other comprehensive loss, net of tax | 6,811 | (5,100 | ) | 1,711 | ||||||||
|
|
|
|
|
| |||||||
Balance at December 31, 2020 | $ | (2,904 | ) | $ | (35,557 | ) | $ | (38,461 | ) | |||
Other comprehensive (loss) income before reclassifications | (3,776 | ) | 6,683 | 2,907 | ||||||||
Amounts reclassified from AOCI | — | 2,753 | 2,753 | |||||||||
|
|
|
|
|
| |||||||
Other comprehensive loss, net of tax | (3,776 | ) | 9,436 | 5,660 | ||||||||
|
|
|
|
|
| |||||||
Balance at December 31, 2021 | $ | (6,680 | ) | $ | (26,121 | ) | $ | (32,801 | ) | |||
|
|
|
|
|
| |||||||
Recently Adopted Accounting Pronouncements
In August 2018, the FASB issued ASU No. 2018-13, Fair Value Measurement (Topic 820), Disclosure Framework—Changes to the Disclosure Requirements for Fair Value Measurement, (“ASU 2018-13”). This update removed the following disclosure requirements: (1) the amount of and reasons for transfers between Level 1 and Level 2 of the fair value hierarchy; (2) the policy for timing of transfers between levels; and (3) the valuation processes for Level 3 fair value measurements. Additionally, this update added the following disclosure requirements: (1) the changes in unrealized gains and losses for the period included in other comprehensive income and loss for recurring Level 3 fair value measurements held at the end of the reporting period; (2) the range and weighted average of significant unobservable inputs used to develop Level 3 fair value measurements. For certain unobservable inputs, an entity may disclose other quantitative information (such as the median or arithmetic average) in lieu of the weighted average if the entity determines that other quantitative information would be a more reasonable and rational method to reflect the distribution of unobservable inputs used to develop Level 3 fair value measurements. ASU 2018-13 was effective for fiscal years beginning after December 15, 2019 with early adoption permitted. The Company adopted this update as of January 1, 2020, and noted no effect on the financial statements and related disclosures.
F-17
Table of Contents
In August 2018, the FASB issued ASU No. 2018-15, Goodwill and Other—Internal-Use Software (Subtopic 350-40): Customer’s Accounting for Implementation Costs Incurred in a Cloud Computing Arrangement that is a Service Contract (“ASU 2018-15”). ASU 2018-15 aligns the accounting for costs incurred to implement a cloud computing arrangement that is a service arrangement with the guidance on capitalizing costs associated with developing or obtaining internal-use software. The ASU can be applied on a retrospective or prospective basis and is effective for financial statements issued for fiscal years beginning after December 15, 2020, and interim periods within those fiscal years. Early adoption is permitted. The Company early adopted this update as of January 1, 2021 on a prospective basis. The adoption did not have a material impact on the financial statements.
Recently Issued Accounting Pronouncements
In February 2016, the FASB issued ASU No. 2016-02, Leases (Topic 842), which supersedes the guidance in former ASC 840, Leases. This standard requires lessees to apply a dual approach, classifying leases as either finance or operating leases based on the principle of whether or not the lease is effectively a financed purchase by the lessee. This classification will determine whether lease expense is recognized based on an effective interest method or on a straight-line basis over the term of the lease. A lessee is also required to record a right-of-use asset and a lease liability for all leases with a term of greater than 12 months regardless of their classification. Leases with a term of 12 months or less may be accounted for similar to existing guidance for operating leases today. This standard is effective for the Company on January 1, 2022, and early adoption is permitted. Originally, a modified retrospective transition approach was required for leases existing at, or entered into after, the beginning of the earliest comparative period presented in the financial statements. In July 2018, the FASB issued guidance to permit an alternative transition method for Topic 842, which allows transition to the new lease standard by recognizing a cumulative-effect adjustment to the opening balance of retained earnings in the period of adoption. Entities may elect to apply either approach. The Company elected the modified retrospective transition approach. The new standard provides a number of optional practical expedients in transition. The Company elected the practical expedients to not reassess its prior conclusions about lease identification under the new standard, to not reassess lease classification, and to not reassess initial direct costs. The Company did not elect the practical expedient allowing the use of hindsight which would require the Company to reassess the lease term of its leases based on all facts and circumstances through the effective date and did not elect the practical expedient pertaining to land easements as this is not applicable to the current contract portfolio. The new guidance also provides practical expedients for ongoing lease accounting. The Company elected the recognition exemption for short term leases for all leases that qualify. Under this exemption, the Company did not recognize right of use (“ROU”) assets or lease liabilities for those leases that qualify as a short-term lease, which includes not recognizing ROU assets or lease liabilities for existing short-term leases of those assets in transition. The Company also elected the practical expedient to not separate lease and non-lease components for all existing asset classes. During the first quarter of 2022, the Company expects to record a ROU asset in the range of approximately $75.0 million to $80.0 million and corresponding lease liability in the range of approximately $80.0 million to $90.0 million, in connection with this adoption.
In June 2016, the FASB issued ASU 2016-13, Financial Instruments-Credit Losses (Topic 326): Measurement of Credit Losses on Financial Instruments (“Topic 326”), in order to improve financial reporting of expected credit losses on financial instruments and other commitments to extend credit. Topic 326 requires that an entity measure and recognize expected credit losses for financial assets held at amortized cost and replaces the incurred loss impairment methodology in current GAAP with a methodology that requires consideration of a broader range of information to estimate credit losses. The guidance is effective for annual periods beginning after December 15, 2022, including interim periods within those fiscal years. Early adoption is permitted. The Company does not expect this standard to have a material impact on its financial statements.
F-18
Table of Contents
In August 2018, the FASB has issued ASU 2018-14, Compensation—Retirement Benefits—Defined Benefit Plans—General (Subtopic 715-20): Disclosure Framework—Changes to the Disclosure Requirements for Defined Benefit Plans, that applies to all employers that sponsor defined benefit pension or other postretirement plans. The amendments modify the disclosure requirements for employers that sponsor defined benefit pension or other postretirement plans. Disclosure requirements, including but not limited to, the following were removed from Subtopic 715-20: the amounts in accumulated other comprehensive income expected to be recognized as components of net periodic benefit cost over the next fiscal year; the amount and timing of plan assets expected to be returned to the employer and for public entities, the effects of a one-percentage-point change in assumed health care cost trend rates on the (a) aggregate of the service and interest cost components of net periodic benefit costs and (b) benefit obligation for postretirement health care benefits. The following disclosure requirements were added to Subtopic 715-20: (1) the weighted-average interest crediting rates for cash balance plans and other plans with promised interest crediting rates; and (2) an explanation of the reasons for significant gains and losses related to changes in the benefit obligation for the period. The amendments also clarify the disclosure requirements in paragraph 715-20-50-3, which state that the following information for defined benefit pension plans should be disclosed: (1) the projected benefit obligation (PBO) and fair value of plan assets for plans with PBOs in excess of plan assets; and (2) the accumulated benefit obligation (ABO) and fair value of plan assets for plans with ABOs in excess of plan assets. The amendments in this ASU are effective for the Company for the fiscal year beginning January 1, 2022. Early adoption is permitted. The adoption of this guidance is not expected to have a material impact on our consolidated results of operations or financial position
In April 2019, the FASB issued ASU 2019-04, Codification Improvements to Topic 326, Financial Instruments—Credit Losses (Topic 815) Derivatives and Hedging, and Topic 825, Financial Instruments (“ASU 2019-04”). This update provides clarifications for three topics related to financial instruments accounting, some of which could be applied to the Company. The standard is effective for annual periods beginning after December 15, 2022 and interim periods within those fiscal years, with early adoption permitted. The Company is currently assessing the impact that adopting this standard will have on its financial statements but does not expect it to be material.
In December 2019, the FASB issued ASU 2019-12, Income Taxes (Topic 740): Simplifying the Accounting for Income Taxes (“ASU 2019-12”), which is intended to simplify various aspects related to accounting for income taxes. ASU 2019-12 removes certain exceptions to the general principles in Topic 740 and also clarifies and amends existing guidance to improve consistent application. ASU 2019-12 is effective for public business entities for fiscal years beginning after December 15, 2021, with early adoption permitted. The Company is currently evaluating the impact of adoption of this standard on the consolidated financial statements and disclosures.
In March 2020, the FASB issued ASU 2020-04, Reference Rate Reform (Topic 848), which provides optional expedients and exceptions to contract modifications and hedging relationships that reference the London Interbank Offered Rate or another reference rate expected to be discontinued. The standard is effective upon issuance through December 31, 2022 and may be applied at the beginning of the interim period that includes March 12, 2020 or any date thereafter. The Company is currently evaluating the impact of this guidance on its consolidated financial statements.
F-19
Table of Contents
3. Revenue Recognition
The following table summarizes the Company’s disaggregated net sales by segment, nature, amount, and timing:
| Year Ended December 31, 2020 | ||||||||||||
| Piano | Band | Total | ||||||||||
Product sales, net | $ | 308,344 | $ | 98,051 | $ | 406,395 | ||||||
Service and restoration | 6,238 | — | 6,238 | |||||||||
|
|
|
|
|
| |||||||
Revenue recognized at a point in time | 314,582 | 98,051 | 412,633 | |||||||||
Other | 2,846 | 377 | 3,223 | |||||||||
|
|
|
|
|
| |||||||
Revenue recognized over time | 2,846 | 377 | 3,223 | |||||||||
|
|
|
|
|
| |||||||
Net sales | $ | 317,428 | $ | 98,428 | $ | 415,856 | ||||||
|
|
|
|
|
| |||||||
| Year Ended December 31, 2021 | ||||||||||||
| Piano | Band | Total | ||||||||||
Product sales, net | $ | 393,196 | $ | 131,234 | $ | 524,430 | ||||||
Service and restoration | 9,455 | 256 | 9,711 | |||||||||
|
|
|
|
|
| |||||||
Revenue recognized at a point in time | 402,651 | 131,490 | 534,141 | |||||||||
Other | 3,950 | 259 | 4,209 | |||||||||
|
|
|
|
|
| |||||||
Revenue recognized over time | 3,950 | 259 | 4,209 | |||||||||
|
|
|
|
|
| |||||||
Net sales | $ | 406,601 | $ | 131,749 | $ | 538,350 | ||||||
|
|
|
|
|
| |||||||
Contract Liabilities
Timing may differ between the satisfaction of performance obligations and the invoicing and collection of amounts related to contracts with customers. Contract liabilities consists of customer deposits and are recorded for amounts that are collected in advance of the satisfaction of performance obligations. These liabilities are classified as current liabilities and are recognized as revenue within 12 months.
4. Fair Values of Financial Instruments
The following table presents information about the Company’s assets and liabilities measured at fair value on a recurring basis as of December 31, 2020 and 2021 and the fair value hierarchy of the valuation techniques utilized. The Company classifies these assets and liabilities as either short- or long-term based on maturity and anticipated realization dates.
| December 31, 2020 | ||||||||||||||||
| Level 1 | Level 2 | Level 3 | Total | |||||||||||||
Financial assets: | ||||||||||||||||
Trading securities – prepaid expenses and other current assets | $ | 270 | $ | — | — | $ | 270 | |||||||||
Trading securities – other long-term assets | 2,789 | — | — | 2,789 | ||||||||||||
|
|
|
|
|
|
|
| |||||||||
| $ | 3,059 | $ | — | $ | — | $ | 3,059 | |||||||||
|
|
|
|
|
|
|
| |||||||||
Financial liabilities: | ||||||||||||||||
Interest rate swaps – other current liabilities | $ | — | $ | 59 | $ | — | $ | 59 | ||||||||
Interest rate swaps – other noncurrent liabilities | — | 10,336 | — | 10,336 | ||||||||||||
|
|
|
|
|
|
|
| |||||||||
| $ | — | $ | 10,395 | $ | — | $ | 10,395 | |||||||||
|
|
|
|
|
|
|
| |||||||||
F-20
Table of Contents
| December 31, 2021 | ||||||||||||||||
| Level 1 | Level 2 | Level 3 | Total | |||||||||||||
Financial assets: | ||||||||||||||||
Cash equivalents – prepaid expenses and other current assets | $ | 2,861 | $ | — | $ | — | $ | 2,861 | ||||||||
|
|
|
|
|
|
|
| |||||||||
| $ | 2,861 | $ | — | $ | — | $ | 2,861 | |||||||||
|
|
|
|
|
|
|
| |||||||||
Financial liabilities: | ||||||||||||||||
Interest rate swaps – other current liabilities | $ | — | $ | 553 | $ | — | $ | 553 | ||||||||
Share-based compensation liability – other current liabilities | — | — | 7,644 | 7,644 | ||||||||||||
Interest rate swaps – other noncurrent liabilities | — | 5,157 | — | 5,157 | ||||||||||||
|
|
|
|
|
|
|
| |||||||||
| $ | — | $ | 5,710 | $ | 7,644 | $ | 13,354 | |||||||||
|
|
|
|
|
|
|
| |||||||||
As of December 31, 2020, trading securities include marketable securities related to the SERP. Short term trading securities were $0.3 million and long-term trading securities were $2.8 million. During 2021, the Company liquidated the marketable securities related to the SERP. As of December 31, 2021, the Company maintained cash equivalents of $2.9 million related to the SERP. Short term trading securities and SERP related cash equivalents are included in prepaid expenses and other current assets, and long-term trading securities are included in other long-term assets on the consolidated balance sheets. The trading securities and cash equivalents are held in a rabbi trust. The Company records a corresponding liability for the same amount in the consolidated financial statements, which represents the Company’s obligation to SERP participants.
Interest rate swaps are used to reduce the Company’s exposure to changes in interest rates (Note 13). The fair value of the Company’s interest rate swap agreement is estimated with the assistance of a third-party valuation specialist, using inputs that can be corroborated by observable market data.
SERP related investments in marketable securities are categorized as trading, available-for-sale, or held-to-maturity. As of December 31, 2020 the Company held only trading securities. As of December 31, 2021, the Company did not hold any marketable securities related to the SERP.
Other income that relates to trading securities still held is as follows:
| Year Ended December 31, | ||||||||
| 2020 | 2021 | |||||||
Other income | $ | 226 | $ | — | ||||
|
|
|
| |||||
As of December 31, 2020 the Company estimated the fair value of its debt, which is Level 1, based on institutional quotes currently available to us. The net carrying value and estimated fair value are as follows:
| December 31, 2020 | ||||||||
| Net Carrying Value | Estimated Fair Value | |||||||
Financial liabilities: | ||||||||
Debt | $ | 149,991 | $ | 147,104 | ||||
|
|
|
| |||||
As of December 31, 2021, the fair value of the Company’s debt approximated carrying value.
F-21
Table of Contents
During December 2021, in connection with the Company’s filing its initial registration statement with the SEC and changing its status to a public entity as defined by ASC 718, the Company’s share-based compensation liability was remeasured to fair value using a probability-weighted expected return method (“PWERM”) whereby the Company’s total settlement obligation under the equity participation agreement was determined based on the estimated enterprise and equity value of the entity under various scenarios. The PWERM’s output is determined based on inputs not observable in the market, which represented a Level 3 measurement within the fair value hierarchy. The PWERM contemplated two scenarios: i) completing an IPO in the near term or ii) continuing operations as a private company. An assessed likelihood of occurrence was assigned to each scenario based on the Company’s estimate of the probability of each event occurring. The settlement value of the awards under the IPO scenario was based on the estimated total enterprise and equity value of the Company in an IPO, which was determined by considering similar market transactions. The settlement value under the staying private scenario was based on an Option Pricing Model. The Company uses the Black-Scholes model in its option pricing calculation. The Black-Scholes option pricing model requires inputs based on certain subjective assumptions, including (i) the fair value of the Company’s equity, (ii) the risk-free interest rate, (iii) volatility of returns, and (iv) expected dividends. The Black-Scholes option pricing model inputs assumed risk-free interest rate of 0.39%, volatility of returns of 30%, expected dividends yield of 0% and expected term of one year. The fair value of the Company’s total enterprise and equity was estimated using both a market approach and an income approach. Upon changing the Company’s status to a public entity as defined by ASC 718, the liability was remeasured from its intrinsic value of $7.0 million to its fair value of $7.6 million, an increase of $0.6 million, with a corresponding compensation charge being recorded in the period. (Note 14)
Level 3 Financial Liabilities
The following table summarizes the change in the fair value of the share-based compensation liability balance for the years ended December 31, 2020 and 2021:
| December 31, | ||||||||
| 2020 | 2021 | |||||||
Beginning balance | $ | — | $ | — | ||||
Intrinsic value of share-based compensation award | — | 7,016 | ||||||
Change upon remeasurement to fair value | — | 628 | ||||||
|
|
|
| |||||
Ending balance | $ | — | $ | 7,644 | ||||
|
|
|
| |||||
5. Balance Sheet Components
Accounts and Notes Receivable, net
Accounts and notes receivable, net consists of the following:
| December 31, | ||||||||
| 2020 | 2021 | |||||||
Accounts receivable | $ | 28,570 | $ | 38,528 | ||||
Notes receivable from customers | 6,737 | 3,708 | ||||||
Allowance for doubtful accounts | (3,492 | ) | (3,186 | ) | ||||
|
|
|
| |||||
Total accounts and notes receivable, net | $ | 31,815 | $ | 39,050 | ||||
|
|
|
| |||||
F-22
Table of Contents
Allowance for Doubtful Accounts
The following table summarizes the activity of the Company’s allowance for doubtful accounts for its accounts and notes receivable:
| December 31, | ||||||||
| 2020 | 2021 | |||||||
Beginning of period | $ | (3,138 | ) | $ | (3,492 | ) | ||
Allowance, net of recoveries | (209 | ) | 172 | |||||
Foreign currency translation | (293 | ) | 64 | |||||
Net write-offs and other | 148 | 70 | ||||||
|
|
|
| |||||
Total allowance for doubtful accounts | $ | (3,492 | ) | $ | (3,186 | ) | ||
|
|
|
| |||||
Other Long-Term Assets
Other long-term assets consist of the following:
| December 31, | ||||||||
| 2020 | 2021 | |||||||
Note receivable, net | $ | 1,576 | $ | 772 | ||||
Marketable securities (SERP) | 2,789 | — | ||||||
Deposits | 4,309 | 4,386 | ||||||
Benefits insurance | 1,417 | 1,690 | ||||||
Net pension benefit asset | — | 2,420 | ||||||
Prepayments and other assets | 500 | 1,168 | ||||||
|
|
|
| |||||
Total other long-term assets | $ | 10,591 | $ | 10,436 | ||||
|
|
|
| |||||
Deposits include $1.5 million and $1.7 million related to a rental deposit for distribution and retail facilities in China and $2.1 million and $2.1 million for environmental remediation as of December 31, 2020 and 2021, respectively.
Other Current Liabilities
Other current liabilities consist of the following:
| December 31, 2020 | ||||||||
| 2020 | 2021 | |||||||
Accrued payroll and related benefits | $ | 21,034 | $ | 29,253 | ||||
Customer deposits and prepayments | 21,209 | 42,832 | ||||||
Income and other taxes payable | 10,191 | 14,564 | ||||||
Share-based compensation liability | — | 7,644 | ||||||
Sales and use taxes payable | 3,161 | 3,375 | ||||||
Deferred compensation liability (SERP) | 270 | 2,861 | ||||||
Reserve for sales discounts, returns and allowances | 1,624 | 2,070 | ||||||
Current portion of pension and other post-retirement benefit liabilities | 1,568 | 1,529 | ||||||
Accrued warranty expense(a) | 1,092 | 1,194 | ||||||
Other accrued expenses | 11,397 | 17,861 | ||||||
|
|
|
| |||||
Total other current liabilities | $ | 71,546 | $ | 123,183 | ||||
|
|
|
| |||||
F-23
Table of Contents
| (a) | A summary of the activity in accrued warranty expense is as follows: |
| December 31, | ||||||||
| 2020 | 2021 | |||||||
Beginning balance | $ | 1,152 | $ | 1,092 | ||||
Additions | 464 | 1,046 | ||||||
Claims and reversals | (578 | ) | (916 | ) | ||||
Foreign currency translation adjustments | 54 | (28 | ) | |||||
|
|
|
| |||||
Ending balance | $ | 1,092 | $ | 1,194 | ||||
|
|
|
| |||||
Other Noncurrent Liabilities
Other noncurrent liabilities consist of the following:
| December 31, 2020 | ||||||||
| 2020 | 2021 | |||||||
Interest rate swap liability – noncurrent | $ | 10,336 | $ | 5,157 | ||||
Deferred rent – noncurrent | 6,577 | 6,099 | ||||||
Deferred compensation liability (SERP) | 2,789 | — | ||||||
Deferred payroll taxes – noncurrent | 2,004 | — | ||||||
Environmental liabilities | 1,775 | 2,890 | ||||||
Uncertain tax provision liabilities | — | 2,951 | ||||||
Other long-term liabilities | 1,296 | 1,185 | ||||||
|
|
|
| |||||
Total other noncurrent liabilities | $ | 24,777 | $ | 18,282 | ||||
|
|
|
| |||||
6. Inventories, net
A summary of the inventories, net is as follows:
| December 31, | ||||||||
| 2020 | 2021 | |||||||
Raw materials | $ | 28,919 | $ | 28,273 | ||||
Work-in-process | 61,067 | 62,747 | ||||||
Finished goods | 102,780 | 87,876 | ||||||
|
|
|
| |||||
Total inventories | 192,766 | 178,896 | ||||||
Provision(a) | (11,033 | ) | (10,889 | ) | ||||
|
|
|
| |||||
Total inventories, net | $ | 181,733 | $ | 168,007 | ||||
|
|
|
| |||||
| (a) | Inventory Provision |
The following table summarizes the activity of the Company’s inventory provision:
| December 31, | ||||||||
| 2020 | 2021 | |||||||
Beginning of period | $ | (10,725 | ) | $ | (11,033 | ) | ||
Provision | (221 | ) | (1,708 | ) | ||||
Foreign currency translation adjustments | (121 | ) | 67 | |||||
Net write-offs and other | 34 | 1,785 | ||||||
|
|
|
| |||||
Total inventory provision | $ | (11,033 | ) | $ | (10,889 | ) | ||
|
|
|
| |||||
F-24
Table of Contents
7. Property, Plant and Equipment, net
Property, plant and equipment, net consists of the following:
| Estimated Useful Lives (Years) | December 31, | |||||||||||
| 2020 | 2021 | |||||||||||
Land | N/A | $ | 26,436 | $ | 26,317 | |||||||
Buildings and improvements | 15 – 40 | 59,050 | 59,668 | |||||||||
Leasehold improvements | | Shorter of useful life or term of lease | | 33,568 | 34,643 | |||||||
Machinery, equipment and tooling | 3 – 10 | 57,515 | 57,591 | |||||||||
Office furniture and fixtures | 5 – 7 | 10,295 | 10,473 | |||||||||
Concert and artist, and rental pianos | 7 – 15 | 32,146 | 29,272 | |||||||||
Construction-in-progress | N/A | 6,138 | 19,597 | |||||||||
|
|
|
| |||||||||
Total property, plant and equipment | 225,148 | 237,561 | ||||||||||
Less: Accumulated depreciation and amortization | (91,742 | ) | (99,059 | ) | ||||||||
|
|
|
| |||||||||
Total property, plant and equipment, net | $ | 133,406 | $ | 138,502 | ||||||||
|
|
|
| |||||||||
Depreciation expense relating to property, plant and equipment amounts was $13.6 million and $13.9 million for the years ended December 31, 2020 and 2021, respectively. Construction-in-progress is primarily related to machinery and equipment which has not been placed in operation.
In January 2020, the Company sold certain real estate property in New York to an unrelated party for $71.6 million. The net proceeds from the sale were used to pay down the Company’s debt. The net gain on sale of real estate property in the amount of $56.3 million is included in the gain on sale of assets held for sale on the consolidated statements of operations for the year ended December 31, 2020.
8. Trademarks, Goodwill, and Other Intangible Assets
In assessing whether goodwill and trademarks were impaired in connection with the Company’s annual impairment testing performed during the fourth quarter of 2020 using October 1, 2020, carrying values, the Company, in accordance with ASC 350, Intangibles—Goodwill and Other (“ASC 350”), performed a quantitative assessment for its Piano and Band reporting units. In performing the 2020 quantitative assessment, the Company considered, among other factors, the financial performance of each of its Piano and Band reporting units, as well as the COVID-19 impact on the Company’s operations and the deteriorations in the general economic conditions. As a result of the Company’s annual impairment test, the Company determined that the fair value of the Piano reporting unit exceeded the respective carrying amount and the fair value of the Band reporting unit was lower than the respective carrying amount primarily due to lower than expected sales and the impact of COVID-19. The Company determined the fair value of the reporting units based on discounted cash flows of the Company’s projections. Accordingly, the Company recognized a total of $13.6 million and $2.5 million of non-cash goodwill and trademarks impairment charges, respectively, related to the Band reporting unit during the year ended December 31, 2020. The Company did not identify any indicators of impairment during 2021 and as such did not record any impairment charges for the year ended December 31, 2021.
F-25
Table of Contents
Goodwill
The changes in the carrying amount of goodwill are as follows:
| Piano | Band | Total | ||||||||||
Balance – January 1, 2020 | $ | 91,623 | $ | 13,593 | $ | 105,216 | ||||||
Goodwill acquired as part of acquisitions during the year | — | — | — | |||||||||
Impairment charge | — | (13,593 | ) | (13,593 | ) | |||||||
Foreign currency translation adjustments | 913 | — | 913 | |||||||||
|
|
|
|
|
| |||||||
Balance – December 31, 2020 | $ | 92,536 | $ | — | 92,536 | |||||||
Goodwill acquired as part of acquisitions during the year | — | — | — | |||||||||
Foreign currency translation adjustments | (769 | ) | — | (769 | ) | |||||||
|
|
|
|
|
| |||||||
Balance – December 31, 2021 | $ | 91,767 | $ | — | $ | 91,767 | ||||||
|
|
|
|
|
| |||||||
The Company’s gross goodwill balance was $106.1 million for each of the years ended December 31, 2020 and 2021. The Company’s accumulated impairment losses were $13.6 million for the years ended December 31, 2020 and 2021. Accumulated impairment losses were generated through goodwill impairments related to the Band segment.
Intangible Assets, net
Details of the Company’s intangible assets subject to amortization and indefinite-lived intangible assets and their respective carrying amounts are as follows:
| 2020 | ||||||||||||||||||||||||
| Weighted-Average Remaining Useful Life (in years) | Gross Carrying Amount | Additions | Impairment Charges | Accumulated Amortization | Net Book Value | |||||||||||||||||||
Finite-lived intangibles assets: |
| |||||||||||||||||||||||
Music copyright | 2.1 | $ | 825 | $ | 65 | $ | — | $ | (714 | ) | $ | 176 | ||||||||||||
Internal use software | 3.3 | 5,882 | 1,011 | — | (3,553 | ) | 3,340 | |||||||||||||||||
Indefinite lived intangible assets: |
| |||||||||||||||||||||||
Indefinite-lived trademarks | 130,500 | — | (2,500 | ) | — | 128,000 | ||||||||||||||||||
|
|
|
|
|
|
|
|
|
| |||||||||||||||
Total | 2.7 | $ | 137,207 | $ | 1,076 | $ | (2,500 | ) | $ | (4,267 | ) | $ | 131,516 | |||||||||||
|
|
|
|
|
|
|
|
|
| |||||||||||||||
| 2021 | ||||||||||||||||||||||||
| Weighted-Average Remaining Useful Life (in years) | Gross Carrying Amount | Additions | Impairment Charges | Accumulated Amortization | Net Book Value | |||||||||||||||||||
Finite-lived intangibles assets: | ||||||||||||||||||||||||
Music copyright | 2.2 | $ | 890 | $ | 60 | $ | — | $ | (787 | ) | $ | 163 | ||||||||||||
Acquired digital lessons platform | 4.3 | — | 400 | — | (57 | ) | 343 | |||||||||||||||||
Internal use software | 4.2 | 6,893 | 898 | — | (4,373 | ) | 3,418 | |||||||||||||||||
Indefinite lived intangible assets: | ||||||||||||||||||||||||
Indefinite-lived trademarks | 128,000 | — | — | — | 128,000 | |||||||||||||||||||
Land development rights | — | 1,297 | — | — | 1,297 | |||||||||||||||||||
|
|
|
|
|
|
|
|
|
| |||||||||||||||
Total | 4.1 | $ | 135,783 | $ | 2,655 | $ | — | $ | (5,217 | ) | $ | 133,221 | ||||||||||||
|
|
|
|
|
|
|
|
|
| |||||||||||||||
During the years ended December 31, 2020 and 2021, the Company capitalized $1.0 million and $0.9 million, respectively, of costs associated with internally developed software. Amortization of software costs was $1.0 million and $0.8 million for the years ended December 31, 2020 and 2021, respectively.
F-26
Table of Contents
Amortization expense related to finite-lived intangible assets, other than software, amounted to $0.3 million and $0.1 million in 2020 and 2021, respectively.
During the year ended December 31, 2020, the Company recognized impairment losses of $2.5 million associated with its indefinite-lived trademarks related to the Band segment in selling, general and administrative expenses. During the year ended December 31, 2021, the Company did not record any impairment charges.
As of December 31, 2021, expected amortization of intangible assets is as follows:
Year Ending December 31: | ||||
2022 | $ | 1,360 | ||
2023 | 980 | |||
2024 | 680 | |||
2025 | 524 | |||
2026 | 380 | |||
Thereafter | — | |||
|
| |||
Total future amortization | $ | 3,924 | ||
|
|
9. Long-Term Debt
Long-term debt consists of the following:
| December 31, | ||||||||||||
| Maturity Date | 2020 | 2021 | ||||||||||
First Lien Term Loan | February 2025 | $ | 96,193 | $ | — | |||||||
Foreign term credit facilities | December 2026 | 22,827 | 19,929 | |||||||||
ABL Facility | February 2023 | 20,000 | 19,500 | |||||||||
Foreign revolving credit facilities | January 2023 | 10,971 | 11,504 | |||||||||
|
|
|
| |||||||||
Total | 149,991 | 50,933 | ||||||||||
Less: Current portion of debt | 4,558 | 2,122 | ||||||||||
|
|
|
| |||||||||
Debt - noncurrent | 145,433 | 48,811 | ||||||||||
Less: deferred financing costs, net | 2,657 | 429 | ||||||||||
|
|
|
| |||||||||
Debt noncurrent | $ | 142,776 | $ | 48,382 | ||||||||
|
|
|
| |||||||||
As of December 31, 2020, the Company was a party to two credit agreements in the United States, the First Lien Term Loan (as subsequently amended, the “First Lien Term Loan”) and an asset-based lending credit facility (as subsequently amended, the “ABL Facility,” and together with the First Lien Term Loan, “domestic debt”). Each of these agreements is with a syndicate of lenders.
On February 16, 2018, the Company refinanced both the First Lien Term Loan and ABL Facility. The amended First Lien Term Loan provided an aggregate principal amount of $235.0 million at an interest rate of either LIBOR plus 3.75% (subject to a LIBOR floor of 1.0%) or a Base Rate, as defined below, plus 2.75% (subject to a Base Rate floor of 2.0%). The Base Rate is defined as the highest of the Prime Rate (as defined in the First Lien Term Loan), the Federal Funds Rate (as defined in the First Lien Term Loan) plus 0.5%, or the one-month LIBOR plus 1.0%. LIBOR loans have interest periods of one, three, or six months, as selected by the Company, but interest payments are due no less than every three months. The Company selected the one-month LIBOR in 2020. The applicable interest rate with respect to the First Lien Term Loan was 4.75% as of December 31, 2020. The repayment terms of the First Lien Term Loan require quarterly installment payments of approximately $0.6 million beginning June 30, 2018. The First Lien Term Loan also requires mandatory annual excess cash flow prepayments starting December 31, 2019 equal to 50%, 25% or 0% of Excess Cash Flow (as defined therein). Amortization payments of $0.6 million per
F-27
Table of Contents
quarter were made during fiscal year 2020. Moreover, the Company made additional prepayments totaling $132.3 million during 2020. As a result, there were no additional mandatory quarterly principal payments required on or after December 31, 2020, and there was no excess cash flow payment required for 2020. During the year ended December 31, 2021, the Company prepaid the remaining balance of the First Lien Term Loan and recorded a loss of $1.4 million to write-off the related deferred financing costs.
The amended ABL Facility provided a total commitment of $110.0 million. The ABL Facility provides for borrowings at either LIBOR plus a range from 1.50% to 2.00% or as-needed borrowings at an alternate base rate, plus a range from 0.50% to 1.00%; both ranges depend upon availability at the time of borrowing. The applicable interest rate with respect to the ABL Facility was 1.9% and 1.6% as of December 31, 2020 and 2021, respectively. The amount outstanding under the ABL Facility amounted to $20 million and $19.5 million as of December 31, 2020 and 2021, respectively. Borrowings under the facility are repayable within 30 days, with all outstanding borrowings being repaid when the facility matures in 2023. The amount available on the ABL Facility, net of letters of credit and borrowing restrictions, was $63.4 million $42.5 million as of December 31, 2020 and 2021, respectively. Commitment fees for the unused credit line were $0.3 million for the years ended December 31, 2020 and 2021.
Capitalized debt issuance costs are reflected net of amortization in debt—noncurrent on the consolidated balance sheets.
In addition to domestic debt, the Company also has multiple foreign credit facilities. In 2019, the Company’s German subsidiary entered into a credit facility with a foreign bank which entitles it to borrow up to the amount of €18.0 million. This credit facility, which is guaranteed by Steinway Musical Instruments, Inc., originally expired on December 31, 2019 and was extended to April 15, 2020. In April 2020, the Company’s German subsidiary refinanced this credit facility, resulting in a €20.0 million term loan (the “foreign term loan”) and €30.0 million borrowing base facility. The foreign term loan provides for borrowings at the Euro Interbank Offered Rate (“EURIBOR”) plus 1.80%, with a EURIBOR floor of 0%. The borrowing base facility provides for borrowings at either EURIBOR plus 2.25% or as needed borrowings at an alternate rate of 3.25% interest or LIBOR plus 3.25% interest, depending on the currency of borrowings. The applicable interest rate with respect to the foreign term loan was 1.80% as of each of December 31, 2020 and 2021. The applicable interest rate with respect to the borrowing base facility was 3.25% and 3.25% as of December 31, 2020 and 2021, respectively. Commitment fees for the borrowing base facility were $0.1 million for the years ended December 31, 2020 and 2021. The outstanding debt issuance costs related to the Company’s foreign credit facilities was $0.4 million and $0.2 million as of December 31, 2020, and 2021, respectively. The Company’s Japanese subsidiary also has a revolving credit facility (together with the German revolving credit facility, the “foreign revolving credit facilities”) which, in March 2020, increased from ¥300.0 million to ¥600.0 million and bears interest at a 1.5% rate.
The outstanding balance of the foreign term loan was $22.8 million and $19.3 million as of December 31, 2020 and December 31, 2021, respectively. The total outstanding balance of the Company’s foreign revolving credit facilities was $11.0 million and $11.5 million as of December 31, 2020 and December 31, 2021, respectively. The amount available on the foreign revolving credit facilities, net of letters of credit, was $30.4 million and $26.8 million as of December 31, 2020 and 2021, respectively.
Current portion of debt represents the quarterly installments on the foreign term loan and foreign revolving credit facilities that are due within the next fiscal year.
Financial Covenants
The foreign term loan and German foreign credit facility requires the Company’s German subsidiary to maintain certain financial covenants. The Company must maintain a capital ratio of 20%
F-28
Table of Contents
as of each reporting date as defined in the agreement. As of December 31, 2020 and 2021, the Company was in compliance with all financial covenants.
Restrictive covenants
The ABL Facility agreements contains various restrictive covenants that, among other things, restrict or limit our ability to (subject to certain negotiated exceptions): incur additional indebtedness; grant liens; make fundamental changes; sell assets; make restricted payments including cash dividends to shareholders; make investments; enter into transactions with affiliates; and enter into restrictive agreements.
The foreign term loan agreement contains various restrictive covenants that restrict the Company’s ability to make fundamental changes, sell assets, or change the control of the German subsidiary. As of December 31, 2020 and 2021, the Company was in compliance with all restrictive covenants.
Scheduled debt repayments as of December 31, 2021 are as follows:
Year Ending December 31, | ||||
2022 | $ | 2,122 | ||
2023 | 32,994 | |||
2024 | 2,122 | |||
2025 | 2,122 | |||
2026 | 11,433 | |||
Thereafter | 140 | |||
|
| |||
Total | $ | 50,933 | ||
|
|
10. Commitments and Contingencies
Lease Commitments
The Company leases various facilities and equipment under non-cancelable operating lease arrangements. Rent expense amounted to $12.7 million and $15.2 million for the years ended December 31, 2020 and 2021, respectively.
Future minimum lease payments for non-cancelable operating leases are as follows:
Year Ending December 31, | ||||
2022 | $ | 15,482 | ||
2023 | 14,338 | |||
2024 | 13,048 | |||
2025 | 11,852 | |||
2026 | 10,117 | |||
Thereafter | 30,670 | |||
|
| |||
Total | $ | 95,507 | ||
|
|
Standby Letters of Credit
As of December 31, 2020 and 2021, the Company was contingently liable under standby letters of credit of $4.9 million and $5.8 million, respectively. These letters of credit are subject to the terms of our credit agreements (Note 9).
F-29
Table of Contents
Legal Matters
In the ordinary course of business, the Company is a party to various legal actions that we believe are routine in nature and incidental to the operation of our business. While the outcome of such actions cannot be predicted with certainty, the Company believes that, based on its experience in dealing with these matters, their ultimate resolution will not have a material adverse impact on our business, financial condition, results of operations or prospects.
11. Retirement Plans
The Company has defined benefit or defined contribution pension plans covering the majority of our employees, including certain employees in foreign countries. Certain domestic hourly employees are covered by multi-employer defined benefit pension plans to which the Company makes contributions. The corresponding pension plan assets and liabilities belong to third parties and, accordingly, are not reflected in the consolidated financial statements.
All of the benefit accruals under the domestic pension plans are frozen and all of the assets have been combined under a master trust, “The Steinway Musical Pension Plan,” to facilitate plan monitoring and plan investment management.
The funded status of all of the pension and other post-retirement benefit plans is measured as the difference between each plan’s assets at fair value and the projected benefit obligation. The Company has recognized the aggregate of all underfunded plans in pension and other post-retirement benefit liabilities on the consolidated balance sheets. The portion of the amount by which the actuarial present value of benefits included in the projected benefit obligation exceeds the fair value of plan assets, payable in the next twelve months, is reflected in other current liabilities. The balance of the liability is included in pension and other post-retirement benefit liabilities. The measurement date for pension and other post-retirement plans is December 31.
The following table sets forth the funded status and amounts recognized for the Company’s defined benefit pension plans:
| December 31, 2020 | December 31, 2021 | |||||||||||||||
| Domestic Plan | Foreign Plan | Domestic Plan | Foreign Plan | |||||||||||||
Change in benefit obligation: | ||||||||||||||||
Projected benefit obligation, beginning | $ | 78,740 | $ | 50,745 | $ | 82,256 | $ | 55,948 | ||||||||
Service cost | — | 534 | — | 1,326 | ||||||||||||
Interest cost | 2,135 | 603 | 1,444 | 466 | ||||||||||||
Actuarial loss (gain) | 5,803 | 1,708 | (1,989 | ) | (2,369 | ) | ||||||||||
Participant contributions | 3 | 24 | 1 | 28 | ||||||||||||
Plan amendments | — | 76 | — | — | ||||||||||||
Benefits paid | (4,425 | ) | (1,852 | ) | (4,372 | ) | (2,054 | ) | ||||||||
Foreign currency translation adjustments | — | 4,110 | — | (2,633 | ) | |||||||||||
|
|
|
|
|
|
|
| |||||||||
Projected benefit obligation, end of year | $ | 82,256 | $ | 55,948 | $ | 77,340 | $ | 50,712 | ||||||||
|
|
|
|
|
|
|
| |||||||||
Change in plan assets: | ||||||||||||||||
Fair value of plan assets, beginning | $ | 58,000 | $ | 17,270 | $ | 60,000 | $ | 18,254 | ||||||||
Return on plan assets | 3,822 | 351 | 8,871 | 1,926 | ||||||||||||
Employer contributions | 2,600 | 1,643 | 3,000 | 1,795 | ||||||||||||
Employee contributions | 3 | 24 | 1 | 28 | ||||||||||||
Benefits paid | (4,425 | ) | (1,852 | ) | (4,372 | ) | (2,054 | ) | ||||||||
Foreign currency translation adjustments | — | 818 | — | (414 | ) | |||||||||||
|
|
|
|
|
|
|
| |||||||||
Fair value of plan assets, end of year | $ | 60,000 | $ | 18,254 | $ | 67,500 | $ | 19,535 | ||||||||
|
|
|
|
|
|
|
| |||||||||
F-30
Table of Contents
| December 31, 2020 | December 31, 2021 | |||||||||||||||
| Domestic Plan | Foreign Plan | Domestic Plan | Foreign Plan | |||||||||||||
Benefit obligation | $ | 82,256 | $ | 55,948 | $ | 77,340 | $ | 50,712 | ||||||||
Fair value of plan assets | 60,000 | 18,254 | 67,500 | 19,535 | ||||||||||||
|
|
|
|
|
|
|
| |||||||||
Funded status | $ | (22,256 | ) | $ | (37,694 | ) | $ | (9,840 | ) | $ | (31,177 | ) | ||||
|
|
|
|
|
|
|
| |||||||||
Amounts recognized on the statement of financial position consist of: | ||||||||||||||||
Pension assets | $ | — | $ | — | $ | — | $ | 2,420 | ||||||||
Pension and other post-retirement benefits liabilities | (22,256 | ) | (37,694 | ) | (9,840 | ) | (33,597 | ) | ||||||||
|
|
|
|
|
|
|
| |||||||||
Net amount recognized | $ | (22,256 | ) | $ | (37,694 | ) | $ | (9,840 | ) | $ | (31,177 | ) | ||||
|
|
|
|
|
|
|
| |||||||||
As of December 31, 2020, other assets include pension benefits of nil, other current liabilities include the current portion of pension benefit liabilities of $1.6 million, and noncurrent liabilities include the noncurrent portion of pension benefit liabilities of $58.3 million. As of December 31, 2021, other assets include pension benefits of $2.4 million, other current liabilities include the current portion of pension benefit liabilities of $1.5 million, and noncurrent liabilities include the noncurrent portion of pension benefit liabilities of $41.9 million.
The weighted-average assumptions used to determine the Company’s benefit obligations are as follows:
| December 31, 2020 | December 31, 2021 | |||||||||||||||
| Domestic Plan | Foreign Plan | Domestic Plan | Foreign Plan | |||||||||||||
Discount rate | 2.50 | % | 1.37 | % | 2.85 | % | 2.05 | % | ||||||||
Rate of compensation increase | n/a | 3.19 | % | n/a | 3.57 | % | ||||||||||
The weighted-average assumptions used to determine the Company’s net periodic benefit cost are as follows:
| December 31, 2020 | December 31, 2021 | |||||||||||||||
| Domestic Plan | Foreign Plan | Domestic Plan | Foreign Plan | |||||||||||||
Discount rate | 3.23 | % | 1.95 | % | 2.51 | % | 1.38 | % | ||||||||
Expected return on assets | 7.25 | % | 5.19 | % | 7.25 | % | 4.28 | % | ||||||||
Rate of compensation increase | n/a | 3.19 | % | n/a | 3.19 | % | ||||||||||
The net periodic pension (benefit) expense is as follows:
| Year Ended December 31, 2020 | Year Ended December 31, 2021 | |||||||||||||||
| Domestic Plan | Foreign Plan | Domestic Plan | Foreign Plan | |||||||||||||
Service cost | $ | — | $ | 534 | $ | — | $ | 1,326 | ||||||||
Interest cost | 2,135 | 603 | 1,444 | 466 | ||||||||||||
Expected return on plan assets | (4,094 | ) | (869 | ) | (4,280 | ) | (768 | ) | ||||||||
Amortization of actuarial loss | 1,054 | 977 | 1,361 | 1,392 | ||||||||||||
Other | — | 29 | — | 49 | ||||||||||||
|
|
|
|
|
|
|
| |||||||||
Net periodic pension (benefit) expense | $ | (905 | ) | $ | 1,274 | $ | (1,475 | ) | $ | 2,465 | ||||||
|
|
|
|
|
|
|
| |||||||||
F-31
Table of Contents
Estimated amounts that will be amortized from accumulated other comprehensive income (loss) into net periodic benefit cost in 2022 are as follows:
| Domestic Plan | Foreign Plan | |||||||
Net actuarial loss | $ | 990 | $ | 588 | ||||
|
|
|
| |||||
Amounts recognized in accumulated other comprehensive loss as of December 31, 2020 and 2021 are as follows:
| December 31, 2020 | December 31, 2021 | |||||||||||||||
| Domestic Plan | Foreign Plan | Domestic Plan | Foreign Plan | |||||||||||||
Pension and other post-retirement benefit activity | $ | 34,452 | $ | 13,254 | $ | 26,497 | $ | 8,317 | ||||||||
Income taxes | (8,642 | ) | (3,507 | ) | (6,342 | ) | (2,351 | ) | ||||||||
|
|
|
|
|
|
|
| |||||||||
Total | $ | 25,810 | $ | 9,747 | $ | 20,155 | $ | 5,966 | ||||||||
|
|
|
|
|
|
|
| |||||||||
The projected benefit obligation, accumulated benefit obligation, and fair value of plan assets for pension plans with accumulated benefit obligations in excess of plan assets were as follows:
| December 31, | ||||||||
| 2020 | 2021 | |||||||
Projected benefit obligation | $ | 138,203 | $ | 111,914 | ||||
Accumulated benefit obligation | 137,218 | 111,739 | ||||||
Fair value of plan assets | 78,254 | 68,477 | ||||||
The projected benefit obligation, accumulated benefit obligation, and fair value of plan assets for pension plans with pension plan assets in excess of accumulated benefit obligations were as follows:
| December 31, | ||||||||
| 2020 | 2021 | |||||||
Projected benefit obligation | $ | — | $ | 16,138 | ||||
Accumulated benefit obligation | — | 15,770 | ||||||
Fair value of plan assets | — | 18,558 | ||||||
The accumulated benefit obligation for the Company’s domestic pension plan was $82.3 million and $77.3 million as of December 31, 2020 and 2021, respectively. The accumulated benefit obligation for the Company’s foreign pension plans was $55.0 million and $50.2 million as of December 31, 2020 and 2021, respectively.
Domestic pension plan assets are held in a master trust and are overseen by the Investment Committee. The Investment Committee is assisted by a registered investment advisory firm.
The Investment Committee is responsible for setting the policy that provides the framework for management of the plan assets. In accordance with its responsibilities and charter, the Investment Committee meets on a regular basis to review the performance of the plan assets and compliance with the investment policy. The policy sets forth an investment structure for managing plan assets, including setting the asset allocation ranges, which are expected to provide an appropriate level of diversification and investment return over the long term while maintaining sufficient liquidity to pay the benefits of the plan. Asset allocation ranges are set to produce the highest overall return taking into account investment risks that are prudent and reasonable given prevailing market conditions. In developing the
F-32
Table of Contents
asset allocation ranges, third-party asset allocation studies are periodically performed that consider the current and expected positions of the plan assets and funded status. Based on these studies and other appropriate information, the Investment Committee establishes asset allocation ranges taking into account acceptable risk targets and associated returns.
The investment policy asset allocation ranges for the plan, as set by the Investment Committee, for the years ended December 31, 2020 and 2021, were as follows:
| December 31, 2020 | December 31, 2021 | |||||||||||||||
| Minimum | Maximum | Minimum | Maximum | |||||||||||||
Domestic equity securities | 25 | % | 90 | % | 25 | % | 90 | % | ||||||||
International and other equity securities | 0 | % | 50 | % | 0 | % | 50 | % | ||||||||
International debt securities | 0 | % | 20 | % | 0 | % | 20 | % | ||||||||
Domestic debt securities | 10 | % | 50 | % | 10 | % | 50 | % | ||||||||
Other | 0 | % | 10 | % | 0 | % | 10 | % | ||||||||
Cash | 0 | % | 5 | % | 0 | % | 5 | % | ||||||||
The Investment Committee determines the specific allocation of the plan’s investments within various asset classes. The plan utilizes select investment strategies which are executed through separate account or fund structures with external investment managers who demonstrate experience and expertise in the appropriate asset classes and styles. The selection of investment managers is done with careful evaluation of all aspects of performance and risk, due diligence of internal operations and controls, reputation, systems evaluation and a review of investment manager’s policies and processes. The plan also utilizes unleveraged exchange traded funds that track indices. Investment performance is monitored frequently against appropriate benchmarks and compared to compliance guidelines with the assistance of third-party performance evaluation tools and metrics.
Consistent with the objective of maximizing return while minimizing risk, multiple investment strategies are employed to diversify risk such that no single investment or investment manager presents a significant exposure to the total investment portfolio. Plan assets are invested in numerous diversified strategies with the intent to minimize correlations. This allows for diversification of returns. Further, within each strategy, guidelines are established which set forth the list of authorized investments, the typical portfolio characteristics and diversification required by limiting the amount that can be invested by sector, country and issuer. As a result, the plan is not significantly exposed to any single entity, investment manager, sector or international location.
The Investment Committee reviews the domestic benefit obligations no less than annually with the objective of maintaining a 90% funded status for the projected benefit obligation. Whenever possible, the Company’s annual contribution is expected to cover the short-term liquidity requirements of the plan, so as to maintain the plan’s assets for long-term investment. The performance goal set for the plan’s assets is to achieve a long-term rate of return no less than 8.5%.
For the years ended December 31, 2020 and 2021, the Company used an assumed long-term rate of return on plan assets of 7.25% and 7.00%, respectively. This rate is based on the long-term (20 years) rates of return for the assets held. Accordingly, the Company expects that the actual rate of return for any given year will differ from the assumed rate and, therefore, does not adjust this assumption based on such differences. Because our monitoring criteria creates a bias in favor of funds that out-perform their benchmarks, the Company limits the adjustment to the rate of return assumption to changes in the underlying long-term rate of return for stocks generally.
The domestic pension plan assets are stated at fair value. Investments in equity securities are valued at the last reported sales price. Investments in debt securities are generally valued using
F-33
Table of Contents
methods based upon market transactions for comparable securities and various relationships between securities which are generally recognized by institutional traders.
The Company purchased member interests in several limited liability corporations. These investments include municipal bonds and short positions on U.S. Treasury Obligations, long-dated out-of-the-money options and swaps, privately placed mezzanine transactions consisting of subordinated debt with equity features, fully collateralized debt of energy companies, and the origination of short-term and medium-term high-yield notes receivables.
The Company’s investments in municipal bonds, U.S. Treasury Obligations, and long-dated out-of-the-money options and swaps are valued monthly at a net asset value per membership unit by the custodian. Municipal bonds are valued using recently executed transactions, market price quotations and pricing models that factor in, where applicable, interest rates, and bond or default risk spreads. U.S. Treasury Obligations are valued using quoted market prices. Long-dated out of the money options are valued using market price quotations, recently executed transactions, and option pricing models. These investments can be redeemed at net asset value by providing written notice to the fund managers and are considered Level 2 investments.
The Company’s additional investments in limited liability corporations are estimated at fair market value based on the most recent available financial statements of the corporations and updated for known capital contributions, distributions, and other market observations, if any, to determine the value as of December 31. These investments are presented at fair value, priced based on unobservable inputs and are considered Level 3 investments in the financial statements. Underlying mezzanine transactions are measured at fair value using a market approach based on comparable transactions or performance multiples and, to a lesser extent, an income approach using discounted cash flows. The fair market value of collateralized debt in energy companies is based on the price at which the investment was acquired and adjusted for the nature of the investment, local market conditions, trading values on public exchanges for comparable securities, current and projected operating performance and financing transactions subsequent to the acquisition of the investment. The fair value of notes receivable are based on discounted cash flows giving consideration to interest rate risk and creditworthiness of the borrower, current economic conditions, specific problem loans, and the value of underlying collateral.
As of December 31, 2020 and 2021, the domestic pension plan had $2.3 million and $2.1 million, respectively, unfunded investment commitment to private equity partnerships described above.
The fair value of domestic pension plan assets by asset category and by level at December 31, 2020 and 2021 were as follows:
| December 31, 2020 | ||||||||||||||||
| Level 1 | Level 2 | Level 3 | Total | |||||||||||||
Cash and cash equivalents | $ | 2,300 | $ | — | $ | — | $ | 2,300 | ||||||||
Equity securities: | ||||||||||||||||
U.S. large-cap | 32,400 | — | — | 32,400 | ||||||||||||
International large-cap | 6,100 | — | — | 6,100 | ||||||||||||
Emerging markets | 3,200 | — | — | 3,200 | ||||||||||||
Debt securities: | ||||||||||||||||
Intermediate government bond | 4,700 | — | — | 4,700 | ||||||||||||
Other types of investments: | ||||||||||||||||
Private equity(1) | — | — | — | — | ||||||||||||
|
|
|
|
|
|
|
| |||||||||
Total | $ | 48,700 | $ | — | $ | — | $ | 48,700 | ||||||||
|
|
|
|
|
|
|
| |||||||||
F-34
Table of Contents
| (1) | Investments in private equity are through partnership interests in limited liability corporations and consist of 31% investments in mezzanine debt, 11% investments in collateralized debt of energy companies, and 58% from the origination of notes receivables. As of December 31, 2020, the Company has investments of $11.3 million based on the net asset value. |
| December 31, 2021 | ||||||||||||||||
| Level 1 | Level 2 | Level 3 | Total | |||||||||||||
Cash and cash equivalents | $ | 400 | — | $ | — | $ | 400 | |||||||||
Equity securities: | ||||||||||||||||
U.S. large-cap | 37,500 | — | — | 37,500 | ||||||||||||
International large-cap | 7,400 | — | — | 7,400 | ||||||||||||
Emerging markets | 3,800 | — | — | 3,800 | ||||||||||||
Debt securities: | ||||||||||||||||
Intermediate government bond | 7,600 | — | — | 7,600 | ||||||||||||
Other types of investments: | ||||||||||||||||
Private equity(1) | — | — | — | — | ||||||||||||
|
|
|
|
|
|
|
| |||||||||
Total | $ | 56,700 | $ | — | $ | — | $ | 56,700 | ||||||||
|
|
|
|
|
|
|
| |||||||||
| (1) | Investments in private equity are through partnership interests in limited liability corporations and consist of 30% investments in mezzanine debt, 13% investments in collateralized debt of energy companies, and 57% from the origination of notes receivables. As of December 31, 2021, the Company has investments of $10.8 million based on the net asset value. |
There were no transfers into or out of Level 1, Level 2, or Level 3 during the years ended December 31, 2020 and 2021.
The Company made contributions of $2.6 million and $3.0 million, respectively, to the domestic pension plan in 2020 and 2021. Based on the current funded status, the Company expects to make a voluntary contribution of $2.0 million to the domestic plan in 2022.
The foreign pension plans in Germany and the U.K. are governed locally in accordance with specific jurisdictional requirements. The German plans pay participant benefits when due and are not required to hold assets. However, in order to limit exposure to a large pension annuity obligation which became payable in January 2013, the Company entered into two insurance contracts valued at $1.2 million and $1.1 million as of December 31, 2020 and 2021, respectively. These contracts are with two German insurance companies and provide annuity payments to the Company’s German subsidiary at a guaranteed interest rate. The duration of these contracts matches the expected pension obligation to the single participant to which they relate. The guaranteed interest returns within these contracts are based on market rates of products with similar duration and risk at the time the Company entered into the contracts. The Company considers these assets Level 2 investments. We anticipate contributing $1.5 million to the German plans in 2022.
Assets held in the U.K. plan are stated at fair value. These assets are the responsibility of trustees, who consist of a management member participant, a local member nominated participant and a third-party professional trustee. The U.K. plan invests primarily in foreign corporate bonds and foreign equities that approximate the trustees’ target allocation of 49% debt securities and 51% equity securities. Target allocations have been designed to cover the U.K. plan’s future benefit obligation and are reviewed annually. Investment performance is monitored regularly to attain the funding goals.
The U.K. plan invests in private funds owned by a life insurance company that acts as the plan’s third-party administrator. The funds have limited availability but are valued daily at a unit level based on
F-35
Table of Contents
bid and offer prices. These funds are liquid and bought and sold regularly. A majority of the underlying securities within the funds held by the U.K. plan are traded on a market exchange.
The fair values of the U.K. plan assets by asset category at December 31, 2020 and 2021 were as follows:
| December 31, 2020 | ||||||||||||||||
| Level 1 | Level 2 | Level 3 | Total | |||||||||||||
Cash | $ | 4 | $ | — | $ | — | $ | 4 | ||||||||
Equity securities: | ||||||||||||||||
U.K. equity | — | 7,013 | — | 7,013 | ||||||||||||
European equity | — | 598 | — | 598 | ||||||||||||
U.S. equity | — | 770 | — | 770 | ||||||||||||
Pacific equity | — | 315 | — | 315 | ||||||||||||
Debt securities: | ||||||||||||||||
U.K. treasuries | 8,325 | — | — | 8,325 | ||||||||||||
|
|
|
|
|
|
|
| |||||||||
Total | $ | 8,329 | $ | 8,696 | $ | — | $ | 17,025 | ||||||||
|
|
|
|
|
|
|
| |||||||||
| December 31, 2021 | ||||||||||||||||
| Level 1 | Level 2 | Level 3 | Total | |||||||||||||
Cash | $ | 46 | $ | — | $ | 46 | ||||||||||
Equity securities: | ||||||||||||||||
U.K. equity | — | 7,994 | — | 7,994 | ||||||||||||
European equity | — | 695 | — | 695 | ||||||||||||
U.S. equity | — | 970 | — | 970 | ||||||||||||
Pacific equity | — | 322 | — | 322 | ||||||||||||
Debt securities: | ||||||||||||||||
U.K. treasuries | $ | 8,531 | — | — | 8,531 | |||||||||||
|
|
|
|
|
|
|
| |||||||||
Total | $ | 8,577 | $ | 9,981 | $ | — | $ | 18,558 | ||||||||
|
|
|
|
|
|
|
| |||||||||
The Company assumed long-term rates of return on the U.K. plan assets of 5.5% and 4.5% for the years ended December 31, 2020 and 2021, respectively. Contributions to this plan totaled $0.2 million in 2020 and 2021. The Company anticipates contributing $0.2 million to this plan in 2022.
The domestic and foreign pension plans expect to pay benefits in each year from 2022 through 2031 as follows:
Year Ending December 31, | Domestic Plan | Foreign Plan | ||||||
2022 | $ | 4,662 | $ | 1,993 | ||||
2023 | 4,699 | 1,958 | ||||||
2024 | 4,700 | 2,136 | ||||||
2025 | 4,686 | 2,159 | ||||||
2026 | 4,697 | 2,186 | ||||||
2027 - 2031 | 22,671 | 12,163 | ||||||
|
|
|
| |||||
Total | $ | 46,115 | $ | 22,595 | ||||
|
|
|
| |||||
The Company provides post-retirement life insurance benefits to a limited number of certain eligible hourly retirees and their dependents. This plan and the activity contained therein are not material to the consolidated financial statements and the Company estimates no amortization from accumulated other comprehensive income (loss) into net post-retirement benefit cost in 2022.
The Company sponsors several 401(k) retirement savings plans for eligible employees. Contributions by the Company to these plans, with one exception, are discretionary. Contributions are
F-36
Table of Contents
determined annually by the Board of Directors. The amount of cost recognized for these plans for the years ended December 31, 2020 and 2021 were $1.4 million and $1.6 million, respectively. Non-discretionary contributions were immaterial.
The Company has a SERP for a select group of former executives who constitute a “top hat” group as defined by the Employee Retirement Income Security Act of 1974, as amended (“ERISA”). Discretionary employer contributions made to this plan, as determined annually by the Board of Directors, are held in a rabbi trust. The SERP assets and the corresponding liability are presented in the consolidated balance sheets other assets and other noncurrent liabilities as of December 31, 2020, and within prepaid expenses and other current assets and other current liabilities as of December 31, 2021 (Note 5). No contributions were made to this plan for the years ended December 31, 2020 and 2021. As of December 31, 2020 and 2021, the total SERP liability was $3.1 million and $2.9 million, respectively. During 2021 SERP plan was terminated and final plan asset distributions are expected to be completed during 2022.
The Company contributes to multiemployer defined benefit pension plans under the terms of collective bargaining agreements that cover certain domestic hourly employees. The corresponding pension plan assets and liabilities belong to third parties and, accordingly, are not reflected in the consolidated financial statements. The risks of participating in these multiemployer plans are different from single-employer plans in the following aspects:
| a. | Assets contributed to the multiemployer plan by one employer may be used to provide benefits to employees of other participating employers. |
| b. | If a participating employer stops contributing to the plan, the unfunded obligations of the plan may be borne by the remaining participating employers. |
| c. | If the Company chooses to stop participating in these multiemployer plans, the Company may be required to pay those plans an amount based on the underfunded status of the plan, referred to as a withdrawal liability. |
The Company’s participation in the United Furniture Worker’s (“UFW”) Pension Fund A that covers hourly workers of the Company’s piano manufacturing facility in New York, NY is outlined in the table below:
Pension Fund | EIN/Pension Plan Number | Pension Protection Act Zone Status | Rehabilitation Plan | Expiration Date of Collective Bargaining Agreement | ||||||||||||||||
| 2020 | 2021 | |||||||||||||||||||
UFW Pension Fund A | 13-5511877-001 | Red | Red | Implemented | 12/31/2021 | |||||||||||||||
The most recent Pension Protection Act (“PPA”) zone status available is for the plan’s year ended February 28, 2021 and February 28, 2020. The zone status is based on information received from the plan and is certified by the plan’s actuary. Plans in the red zone are generally less than 65% funded. A rehabilitation plan was adopted by the plan’s trustees effective March 2009. The rehabilitation plan is designed to improve the plan’s funding status over time. This rehabilitation plan removed some adjustable benefits (pre-retirement lump sum death benefit, withdrawal benefit, 36 month guarantee option and subsidized early retirement for terminated vested members). Effective March 1, 2018, the Company is required to increase its total contributions to the UFW Pension Fund A by 1.5% (previously 5.5% under the prior rehabilitation plan).
F-37
Table of Contents
Below is the amount of cost recognized for the UFW Pension Fund A for the years ended December 31, 2020 and 2021:
Pension Fund | 2020 | 2021 | Surcharge | Year Contributions to | ||||||||
UFW Pension Fund A | $ | 1,071 | $ | 1,452 | Yes | 2020 and 2021 | ||||||
On February 28, 2017, the UFW plan trustees filed an application with the Pension Benefit Guaranty Corporation (“PBGC”) to partition the UFW Pension Fund A in accordance with Section 4233 of ERISA. This request was approved effective September 1, 2017, at which point the PBGC has partitioned 56% of the UFW Pension Fund A’s in-pay participants’ liabilities and 100% of the terminated vested participants’ liabilities to a successor pension plan. On March 15, 2017, the trustees also filed an application with the U.S. Treasury to suspend benefits in accordance with Section 432(e)(9) of the Internal Revenue Code, the application was approved effective September 1, 2017. As a result of the partition and the benefits suspension, the UFW Pension Fund A’s actuaries project that, on the basis of reasonable assumptions, the UFW Pension Fund A will not become insolvent, and will emerge from “critical status” under the PPA in or around the plan year ending February 29, 2044.
If the hourly employees covered by this plan and the Company’s management agree to stop participating in the UFW Pension Fund A through the collective bargaining process, then the Company’s portion of the estimated unfunded vested benefit as determined by the plan’s actuary would be $51.3 million and $49.1 million as of February 28, 2021 and February 28, 2022, respectively. The Company’s withdrawal liability is based on unfunded status of the plan and our contribution history. Based on the 20-year annual payment limitation, it is estimated that it would require 80 quarterly payments of $0.3 million to discharge this liability. While the Company currently believes it is unlikely to choose to withdraw from this plan, should the rehabilitation effort not be successful or if other participating employers decide to leave the plan, the Company may elect to do so in the future. The Company was listed in the Form 5500 as providing more than 5% of the total contributions for the above plan as of the plan years ended February 28, 2021. As of the date the consolidated financial statements were issued, Form 5500 was not available for the plan year ended February 28, 2022. Subsequent to December 31, 2021, the Company executed a new collective bargaining agreement effective January 1, 2022 with an expiration date of December 31, 2024.
12. Income Taxes
The components of the income tax expense (benefit) are as follows:
| Year Ended December 31, | ||||||||
| 2020 | 2021 | |||||||
U.S. federal: | ||||||||
Current | $ | 7,700 | $ | 7,105 | ||||
Deferred | 5,403 | 514 | ||||||
U.S. state and local: | ||||||||
Current | 3,560 | 699 | ||||||
Deferred | (89 | ) | (1,380 | ) | ||||
Foreign: | ||||||||
Current | 13,999 | 19,116 | ||||||
Deferred | (167 | ) | (377 | ) | ||||
|
|
|
| |||||
Total income tax provision | $ | 30,406 | $ | 25,677 | ||||
|
|
|
| |||||
F-38
Table of Contents
The components of income before income taxes are as follows:
| Year Ended December 31, | ||||||||
| 2020 | 2021 | |||||||
U.S. operations | $ | 51,646 | $ | 39,491 | ||||
Non-U.S. operations | 30,575 | 45,449 | ||||||
|
|
|
| |||||
Total income before income taxes | $ | 82,221 | $ | 84,940 | ||||
|
|
|
| |||||
The Company’s income tax provision differed from that using the statutory U.S. federal rate of 21% as follows:
| Year Ended December 31, | ||||||||
| 2020 | 2021 | |||||||
Federal statutory rate applied to income before income taxes | $ | 17,358 | $ | 17,837 | ||||
State income taxes (net of federal tax benefit) | 3,269 | (3,225 | ) | |||||
Foreign income taxes (net of federal tax benefit) | (1,896 | ) | (2,679 | ) | ||||
Foreign withholding tax | 2,197 | 1,154 | ||||||
Goodwill & trademark impairment | 3,380 | — | ||||||
Valuation allowances | 2,811 | 6,898 | ||||||
Uncertain tax position | — | 2,951 | ||||||
Share-based compensation | 443 | 1,606 | ||||||
Global intangible low-taxed income | 2,574 | — | ||||||
Permanent items | 102 | 1,191 | ||||||
Other | 168 | (56 | ) | |||||
|
|
|
| |||||
Total income tax provision | $ | 30,406 | $ | 25,677 | ||||
|
|
|
| |||||
Accumulated retained earnings of the Company’s non-U.S. subsidiaries, net of any deficits, totaled $42.9 million and $53.7 million as of December 31, 2020 and 2021, respectively. Included in this amount is $16.3 million and $18.7 million as of December 31, 2020 and 2021, respectively, related to the Company’s subsidiaries in Germany which are treated as disregarded entities for U.S. tax purposes. It also included $32.2 million and $40.4 million as of December 31, 2020 and 2021, respectively, related to the Company’s subsidiaries in China and Japan. Income taxes related to the China and Japan subsidiaries, comprised of $7.3 million and $11.1 million of the gross income tax expense as of December 31, 2020 and 2021, respectively. No additional provision has been made for undistributed earnings of non-U.S. subsidiaries, other than China, because the Company’s current intention is to indefinitely reinvest the remaining earnings of these subsidiaries.
F-39
Table of Contents
The components of net deferred taxes are as follows:
| Year Ended December 31, | ||||||||
| 2020 | 2021 | |||||||
Deferred tax assets: | ||||||||
Uniform capitalization and reserve adjustments to inventory | $ | 4,730 | $ | 2,414 | ||||
Pension and other post-retirement benefits | 17,035 | 12,192 | ||||||
Allowance for doubtful accounts | 768 | 2,781 | ||||||
Accrued expenses and other current assets and liabilities | 5,126 | 6,465 | ||||||
State net operating losses | 1,529 | 1,412 | ||||||
Foreign tax credits | 15,248 | 23,103 | ||||||
Other | 4,892 | 7,160 | ||||||
|
|
|
| |||||
Total deferred tax assets | 49,328 | 55,527 | ||||||
Less: valuation allowances | (15,261 | ) | (23,103 | ) | ||||
|
|
|
| |||||
Total deferred tax assets, net | $ | 34,067 | $ | 32,424 | ||||
|
|
|
| |||||
Deferred tax liabilities: | ||||||||
Property, plant and equipment | $ | (13,103 | ) | $ | (11,468 | ) | ||
Intangibles | (31,457 | ) | (30,987 | ) | ||||
Other | — | (2,967 | ) | |||||
|
|
|
| |||||
Total deferred tax liabilities | $ | (44,560 | ) | $ | (45,422 | ) | ||
|
|
|
| |||||
Net deferred tax liabilities | $ | (10,493 | ) | $ | (12,998 | ) | ||
|
|
|
| |||||
Gross state tax net operating loss carryforwards totaled $12.8 million and $13.1 million as of December 31, 2020 and 2021, respectively, and expire in varying amounts for taxable years between 2019 and 2039. Because the acquisition of SMI in 2013 constituted a change of control, the Company’s ability to use state net operating loss carryforwards and Foreign Tax Credits subsequent to the acquisition date is subject to limits under section 382 and 383 of the Internal Revenue Code. As of December 31, 2020 and 2021, the Company has foreign tax credit carryforwards of $15.2 million and $23.1 million, respectively. The Company’s foreign tax credit carryforward expire in varying amounts from 2022 through 2031. A valuation allowance of $15.3 million and $23.1 million, respectively, was established for foreign tax credit carryforwards due to the Company’s assessment that it is more likely than not that the absorption of the carryforwards will not be realized.
Certain income earned by the Company’s foreign subsidiaries, known as global intangible low-tax income (“GILTI”), must be included in the gross income of their U.S. shareholder. The FASB allows an accounting policy election of either recognizing deferred taxes for differences expected to reverse as GILTI in future years or recognizing such taxes as a current-period expense when incurred. The Company elected to treat the tax effect of GILTI as a current-period expense when incurred which resulted in additional income tax expense of $2.6 million and nil million in 2020 and 2021, respectively. A related foreign tax credit was also generated during the years ended December 31, 2020 and 2021, subject to limitation, of $2.3 million and $2.9 million, respectively.
A reconciliation of the beginning and ending amounts of gross unrecognized tax benefits follows:
| Year Ended December 31, | ||||||||
| 2020 | 2021 | |||||||
Unrecognized tax benefits, beginning | $ | — | $ | — | ||||
Increase as a result of tax positions taken during the current period | — | 2,665 | ||||||
|
|
|
| |||||
Unrecognized tax benefits, end of year | $ | — | $ | 2,665 | ||||
|
|
|
| |||||
F-40
Table of Contents
Under the provisions of ASC 740, the Company determined that there was nil and $2.7 million of unrecognized tax benefit as of December 31, 2020 and 2021, respectively, if recognized, would affect the annual effective tax rate. The uncertain tax position results from the Company’s treatment of a gain for certain real estate property in New York in 2020.
The accrued liability for interest expense related to income tax matters and income tax penalties related to the above unrecognized tax benefits was nil and $0.3 million for the years ended December 31, 2020 and 2021, respectively. The Company recognized nil and $0.3 million of expense for interest and penalties as a component of the provision for income taxes for the years ended December 31, 2020 and 2021, respectively. Although it is possible that the amount of unrecognized benefits with respect to our uncertain tax position will increase or decrease in the next twelve months, the Company does not expect material changes.
The Company files Federal income tax returns, as well as multiple state, local and foreign jurisdiction tax returns. As of December 31, 2021, the Company’s New York State tax returns from 2015 and 2016 are currently under audit and the Company does not anticipate any material tax adjustments. Otherwise, the Company is no longer subject to examination of its federal, state and local tax matters for years before 2018 and foreign jurisdictions for the years before 2016.
13. Interest Rate Swaps
On February 16, 2018, in conjunction with the debt refinancing, the Company entered into multiple interest rate swaps to manage interest rate risk on the debt. The interest rate swaps allow the Company to effectively convert LIBOR and other variable rate-based interest expenses into a fixed interest expense, and have annual maturities between 2022 and 2025. The Company has not designated its interest rate swaps as hedging instruments.
The Company’s aggregate notional amount as of December 31, 2020 and 2021 is $215.0 million and $185.0 million, respectively. As of December 31, 2020, $0.1 million of derivative liabilities were included other current liabilities on the consolidated balance sheet, and $10.3 million were included in other noncurrent liabilities on the consolidated balance sheet. As of December 31, 2021, $0.5 million of derivative liabilities were included other current liabilities on the consolidated balance sheet, and $5.2 million were included in other noncurrent liabilities on the consolidated balance sheet. For the years ended December 31, 2020 and 2021, the Company recognized a net impact of $1.5 million and $(4.7) million, respectively, from the remeasurement and settlement of derivative financial instruments, and this is reflected in interest expense, net on the consolidated statement of operations.
14. Executive Compensation
In January 2018, a compensation agreement was executed between the Owner and an executive of the Company. In addition to certain cash salary and bonuses, the agreement stated that certain stock-based awards were granted to the executive with an effective date of May 2016, and that these awards vested over four years with 25% vesting on each anniversary of the effective date. Upon full vesting of the awards, or upon termination, the awards could be settled in stock of the Company or in cash by the Owner. During 2020, the Owner settled the agreement on the Company’s behalf. The awards were classified as a liability in the Company’s financial statements and were measured by their intrinsic value.
For the year ended December 31, 2020, the Company recognized compensation expense of $1.9 million in connection with these awards. During 2020, the Owner settled the award agreement in cash for $17.6 million. This transaction is reflected in the Company’s financial statements as an equity contribution by the Owner.
F-41
Table of Contents
In addition, the Company recognized $0.3 million of compensation expense associated with a cash bonus payable to the executive by the Owner for the year ended December 31, 2020.
In July 2021, the Owner entered into a profits interest agreement with an executive. The profits interest award granted to the executive vests over four years with 25% vested upon execution of the agreement, and the remaining 75% vesting in three equal installments on April 30, 2022, April 30, 2023, and April 30, 2024. Upon full vesting of the profits interest award and a request of the executive, or automatically upon termination, the vested award will be settled in cash by the limited liability company that owns the Company. If the Company executes an initial public offering (“IPO”), the vested portion of the profits interest award will be valued at the IPO price and converted into shares in the Company and the unvested portion of the award will be converted into restricted stock in the Company, subject to the same vesting requirements as the profits interest award. The profits interest award is classified as a liability due to the executive’s ability to require the Company to settle the award in cash and is remeasured at fair value as of each reporting date. The fair value of the award is determined based on the Company’s estimate of the fair value of the settlement obligation. This is determined by using the PWERM method applied to the Company’s estimate of its settlement obligations in either an IPO or private company settlement scenario. The settlement value of the award under the IPO scenario was based on the estimated total enterprise and equity value of the Company in an IPO. The settlement value under the staying private scenario was based on a Black-Scholes model (Note 4). The Company estimated the fair value of the vested portion of the settlement obligation on December 31, 2021 to be $7.6 million.
For the year ended December 31, 2021, the Company recognized compensation expense of $7.6 million in connection with the profits interest award. No settlement payments were made for this award during the period. Settlement payments will be reflected as contributions by the Owner.
15. Related Party Transactions
In December 2017, the Company entered into a sublease agreement with the Owner. Pursuant to the agreement, the related party will sublease the office facility in New York starting January 1, 2018, through December 31, 2022, which may be extended for an additional 5-year period through December 31, 2027 and thereafter through the expiration date of the original lease. The Owner has agreed to pay the full amount of the obligation per the sublease by directly remitting to the landlord any rent and incidental charges. Per the agreement the base rent for the subleased premises for 2020 and 2021 would have been $1.9 million and $2.0 million, respectively.
Certain compensation related arrangements existed between an executive of the Company and Owner. See Note 14 for a description of these arrangements.
16. Segment Information
The Company has identified two operating segments: Piano and Band.
Income from operations for the operating segments includes certain corporate costs allocated to the segments based on revenue, assets and headcount. There were no transactions within the segments which would require elimination. The primary measurement of profitability used by the chief operating decision maker (CODM) to assess the performance of the segment and to allocate resources is Adjusted Earnings Before Interests, Taxes, Depreciation and Amortization (“Adjusted EBITDA”).
F-42
Table of Contents
The following tables present information about the Company’s operating segments:
| Year Ended December 31, 2020 | ||||||||||||
| Piano | Band | Consolidated | ||||||||||
Net sales: | ||||||||||||
Americas | $ | 119,489 | $ | 95,507 | $ | 214,996 | ||||||
Asia Pacific | 114,481 | 1,226 | 115,707 | |||||||||
EMEA | 83,458 | 1,695 | 85,153 | |||||||||
|
|
|
|
|
| |||||||
Total Net Sales | 317,428 | 98,428 | 415,856 | |||||||||
Gross profit | 139,342 | 19,842 | 159,184 | |||||||||
Gross profit margin | 43.9 | % | 20.2 | % | 38.3 | % | ||||||
Adjusted EBITDA | $ | 72,064 | $ | 4,934 | $ | 76,998 | ||||||
Adjusted EBITDA margin | 22.7 | % | 5.0 | % | 18.5 | % | ||||||
Less addbacks: | ||||||||||||
Interest expense, net | $ | 15,546 | ||||||||||
Income tax expense | 30,406 | |||||||||||
Depreciation and amortization | 14,950 | |||||||||||
Foreign exchange (gain)/loss | 588 | |||||||||||
Non-cash impairment | 16,093 | |||||||||||
Purchase accounting adjustments | 468 | |||||||||||
Non-cash stock-based and other compensation expense | 2,110 | |||||||||||
Gain on sale of assets held for sale | (56,290 | ) | ||||||||||
Non-operating legal costs | 457 | |||||||||||
Other charges | 855 | |||||||||||
|
| |||||||||||
Total addbacks | $ | (25,183 | ) | |||||||||
|
| |||||||||||
Net income | $ | 51,815 | ||||||||||
|
| |||||||||||
Cash capital expenditure | $ | 8,197 | $ | 1,698 | $ | 9,895 | ||||||
Property, plant and equipment, net: | ||||||||||||
Americas | $ | 59,705 | $ | 18,896 | $ | 78,601 | ||||||
Asia Pacific | 5,769 | 61 | 5,830 | |||||||||
EMEA | 48,975 | — | 48,975 | |||||||||
|
|
|
|
|
| |||||||
Total property, plant and equipment, net | $ | 114,449 | $ | 18,957 | $ | 133,406 | ||||||
Total assets | $ | 514,750 | $ | 122,510 | $ | 637,260 | ||||||
F-43
Table of Contents
| Year Ended December 31, 2021 | ||||||||||||
| Piano | Band | Consolidated | ||||||||||
Net sales: | ||||||||||||
Americas | $ | 162,913 | $ | 125,771 | $ | 288,684 | ||||||
Asia Pacific | 149,904 | 3,267 | 153,171 | |||||||||
EMEA | 93,784 | 2,711 | 96,495 | |||||||||
|
|
|
|
|
| |||||||
Total Net Sales | 406,601 | 131,749 | 538,350 | |||||||||
Gross profit | 196,483 | 28,132 | 224,615 | |||||||||
Gross profit margin | 48.3 | % | 21.4 | % | 41.7 | % | ||||||
Adjusted EBITDA | $ | 106,805 | $ | 10,657 | $ | 117,462 | ||||||
Adjusted EBITDA margin | 26.3 | % | 8.1 | % | 21.8 | % | ||||||
Less addbacks: | ||||||||||||
Interest expense, net | $ | 5,237 | ||||||||||
Income tax expense | 25,677 | |||||||||||
Depreciation and amortization | 14,889 | |||||||||||
Foreign exchange (gain)/loss | (438 | ) | ||||||||||
Purchase accounting adjustments | 71 | |||||||||||
Non-cash stock-based compensation expense | 7,644 | |||||||||||
Potential transaction / acquisition costs | 512 | |||||||||||
Initial public offering expenses | 1,513 | |||||||||||
Non-operating legal costs | 184 | |||||||||||
Other charges | 2,910 | |||||||||||
|
| |||||||||||
Total addbacks | $ | (58,199 | ) | |||||||||
|
| |||||||||||
Net income | $ | 59,263 | ||||||||||
|
| |||||||||||
Cash capital expenditure | $ | 17,213 | $ | 4,778 | $ | 21,991 | ||||||
Property, plant and equipment, net: | ||||||||||||
Americas | $ | 57,742 | $ | 19,950 | $ | 77,692 | ||||||
Asia Pacific | 5,358 | 27 | 5,385 | |||||||||
EMEA | 55,425 | — | 55,425 | |||||||||
|
|
|
|
|
| |||||||
Total property, plant and equipment, net | $ | 118,525 | $ | 19,977 | $ | 138,502 | ||||||
Total assets | $ | 518,889 | $ | 127,161 | $ | 646,050 | ||||||
17. Stockholder’s Capital
The Company is authorized to issue 1,000 shares of Preferred Stock at $0.01 par value, but has no shares issued or outstanding as of December 31, 2020 and 2021.
In addition, the Company is authorized to issue 1,000 shares of Common Stock at $0.01 par value.
18. Net Income Per Share
The Company has only issued common stock and does not have any potentially dilutive instrument as of December 31, 2020 and 2021.
F-44
Table of Contents
The following table presents the calculation of basic and diluted earnings per share:
| Year Ended December 31, | ||||||||
In thousands, except share and per share data | 2020 | 2021 | ||||||
Numerator: | ||||||||
Net income | $ | 51,815 | $ | 59,263 | ||||
Denominator: | ||||||||
Weighted-average common shares outstanding – basic and diluted | 1,000 | 1,000 | ||||||
|
|
|
| |||||
Net income per share: | ||||||||
Basic and diluted | $ | 51,815 | $ | 59,263 | ||||
|
|
|
| |||||
19. Subsequent Events
The Company has evaluated subsequent events from the balance sheet date through March 28, 2022, the date which these consolidated financial statements were available to be issued.
On February 4, 2022, the Company executed the sale of a portion of its land development rights with a carrying value of $1.3 million for $6.6 million of cash paid at the closing. As a result of the transaction, the Company will derecognize the portion of the intangible asset related to the land development rights sold and recognize an associated gain amount.
F-45
Table of Contents
STEINWAY MUSICAL INSTRUMENTS HOLDINGS, INC.
CONDENSED CONSOLIDATED BALANCE SHEETS
(In thousands, except share and per share data)
| December 31, | March 31, | |||||||
| 2021 | 2022 | |||||||
| (Unaudited) | ||||||||
ASSETS | ||||||||
Current assets: | ||||||||
Cash and cash equivalents | $ | 43,718 | $ | 39,345 | ||||
Accounts and notes receivable, net | 39,050 | 42,067 | ||||||
Inventories, net | 168,007 | 182,687 | ||||||
Prepaid expenses and other current assets | 13,866 | 9,222 | ||||||
|
|
|
| |||||
Total current assets | 264,641 | 273,321 | ||||||
Property, plant and equipment, net | 138,502 | 138,042 | ||||||
Intangible assets, net | 133,221 | 131,851 | ||||||
Goodwill | 91,767 | 91,487 | ||||||
Deferred tax assets | 7,483 | 7,234 | ||||||
Other long-term assets | 10,436 | 10,467 | ||||||
|
|
|
| |||||
Total assets | $ | 646,050 | $ | 652,402 | ||||
|
|
|
| |||||
LIABILITIES AND STOCKHOLDERS’ EQUITY | ||||||||
Current liabilities: | ||||||||
Accounts payable | 20,734 | 22,300 | ||||||
Debt – current | 2,122 | 44,593 | ||||||
Other current liabilities | 123,183 | 109,597 | ||||||
|
|
|
| |||||
Total current liabilities | $ | 146,039 | $ | 176,490 | ||||
Debt – noncurrent | 48,382 | 16,723 | ||||||
Deferred tax liabilities | 20,481 | 20,839 | ||||||
Pension and other post-retirement benefit liabilities | 42,470 | 41,276 | ||||||
Other noncurrent liabilities | 18,282 | 13,898 | ||||||
|
|
|
| |||||
Total liabilities | 275,654 | 269,226 | ||||||
Commitments and contingencies (Note 10) | ||||||||
Stockholders’ equity: | ||||||||
Preferred stock, $0.01 par value; 1,000 shares authorized as of December 31, 2021 and March 31, 2022; no shares issued and outstanding as of December 31, 2021 and March 31, 2022 | — | — | ||||||
Common stock, $0.01 par value; 1,000 shares authorized as of December 31, 2021 and March 31, 2022; 1,000 shares issued and outstanding as of December 31, 2021 and March 31, 2022 | — | — | ||||||
Additional paid-in capital | 233,170 | 233,170 | ||||||
Retained earnings | 170,027 | 184,795 | ||||||
Accumulated other comprehensive loss | (32,801 | ) | (34,789 | ) | ||||
|
|
|
| |||||
Total stockholders’ equity | 370,396 | 383,176 | ||||||
|
|
|
| |||||
Total liabilities and stockholders’ equity | $ | 646,050 | $ | 652,402 | ||||
|
|
|
| |||||
The accompanying notes are an integral part of these unaudited condensed consolidated financial statements.
F-46
Table of Contents
STEINWAY MUSICAL INSTRUMENTS HOLDINGS, INC.
CONDENSED CONSOLIDATED STATEMENTS OF OPERATIONS
(In thousands, except share and per share data)
(Unaudited)
| Three Months Ended March 31, | ||||||||
| 2021 | 2022 | |||||||
Net sales | $ | 92,683 | $ | 116,304 | ||||
Cost of sales | 57,245 | 71,082 | ||||||
|
|
|
| |||||
Gross profit | 35,438 | 45,222 | ||||||
Selling, general and administrative expenses | 27,057 | 33,278 | ||||||
|
|
|
| |||||
Total operating expense | 27,057 | 33,278 | ||||||
|
|
|
| |||||
Income from operations | 8,381 | 11,944 | ||||||
Other (income) expense, net: | ||||||||
Interest expense (income), net | 656 | (3,552 | ) | |||||
Other pension benefit | (94 | ) | (278 | ) | ||||
Other income | (1,161 | ) | (5,115 | ) | ||||
|
|
|
| |||||
Total other income, net | (599 | ) | (8,945 | ) | ||||
|
|
|
| |||||
Income before provision for income taxes | $ | 8,980 | $ | 20,889 | ||||
Income tax expense | 2,714 | 6,121 | ||||||
|
|
|
| |||||
Net income | $ | 6,266 | $ | 14,768 | ||||
|
|
|
| |||||
Net income per share: | ||||||||
Basic and diluted | $ | 6,266 | $ | 14,768 | ||||
|
|
|
| |||||
Weighted-average common shares used in computing net income per share: | ||||||||
Basic and diluted | 1,000 | 1,000 | ||||||
|
|
|
| |||||
The accompanying notes are an integral part of these unaudited condensed consolidated financial statements.
F-47
Table of Contents
STEINWAY MUSICAL INSTRUMENTS HOLDINGS, INC.
CONDENSED CONSOLIDATED STATEMENTS OF COMPREHENSIVE INCOME
(In thousands)
(Unaudited)
| Three Months Ended March 31, | ||||||||
| 2021 | 2022 | |||||||
Net income | $ | 6,266 | $ | 14,768 | ||||
Other comprehensive income (loss), net of tax: | ||||||||
Foreign currency translation adjustments | (2,310 | ) | (2,077 | ) | ||||
Pension and other post-retirement benefit plans activity | 128 | 89 | ||||||
|
|
|
| |||||
Total other comprehensive loss | (2,182 | ) | (1,988 | ) | ||||
|
|
|
| |||||
Total comprehensive income | $ | 4,084 | $ | 12,780 | ||||
|
|
|
| |||||
The accompanying notes are an integral part of these unaudited condensed consolidated financial statements.
F-48
Table of Contents
STEINWAY MUSICAL INSTRUMENTS HOLDINGS, INC.
CONDENSED CONSOLIDATED STATEMENTS OF STOCKHOLDERS’ EQUITY
(In thousands, except share data)
(Unaudited)
| Preferred Stock | Common Stock | Additional Paid-in Capital | Retained Earnings | Accumulated Other Comprehensive Loss | Total Stockholders’ Equity | |||||||||||||||||||||||||||
| Shares | Amount | Shares | Amount | |||||||||||||||||||||||||||||
Balance—January 1, 2021 | — | $ | — | 1,000 | $ | — | $ | 233,170 | $ | 110,764 | $ | (38,461 | ) | $ | 305,473 | |||||||||||||||||
Pension and other post-retirement benefit plans activity, net of taxes | — | — | — | — | — | — | 128 | 128 | ||||||||||||||||||||||||
Foreign currency translation adjustments | — | — | — | — | — | — | (2,310 | ) | (2,310 | ) | ||||||||||||||||||||||
Net income | — | — | — | — | — | 6,266 | — | 6,266 | ||||||||||||||||||||||||
|
|
|
|
|
|
|
|
|
|
|
|
|
|
|
| |||||||||||||||||
Balance—March 31, 2021 | — | $ | — | 1,000 | $ | — | $ | 233,170 | $ | 117,030 | $ | (40,643 | ) | $ | 309,557 | |||||||||||||||||
Balance—January 1, 2022 | — | $ | — | 1,000 | $ | — | $ | 233,170 | $ | 170,027 | $ | (32,801 | ) | $ | 370,396 | |||||||||||||||||
Pension and other post-retirement benefit plans activity, net of taxes | — | — | — | — | — | — | 89 | 89 | ||||||||||||||||||||||||
Foreign currency translation adjustments | — | — | — | — | — | — | (2,077 | ) | (2,077 | ) | ||||||||||||||||||||||
Net income | — | — | — | — | — | 14,768 | — | 14,768 | ||||||||||||||||||||||||
|
|
|
|
|
|
|
|
|
|
|
|
|
|
|
| |||||||||||||||||
Balance—March 31, 2022 | — | $ | — | 1,000 | $ | — | $ | 233,170 | $ | 184,795 | $ | (34,789 | ) | $ | 383,176 | |||||||||||||||||
|
|
|
|
|
|
|
|
|
|
|
|
|
|
|
| |||||||||||||||||
The accompanying notes are an integral part of these unaudited condensed consolidated financial statements.
F-49
Table of Contents
STEINWAY MUSICAL INSTRUMENTS HOLDINGS, INC.
CONDENSED CONSOLIDATED STATEMENTS OF CASH FLOWS
(In thousands)
(Unaudited)
| Three Months Ended March 31, | ||||||||
| 2021 | 2022 | |||||||
Cash flows from operating activities: | ||||||||
Net income | $ | 6,266 | $ | 14,768 | ||||
Adjustments to reconcile net income to net cash used in operating activities: | ||||||||
Depreciation and amortization | 3,762 | 4,069 | ||||||
Non-cash interest expense and other | 191 | 73 | ||||||
Share-based compensation | — | 1,125 | ||||||
Increase in fair value of derivative instruments | (1,803 | ) | (4,586 | ) | ||||
Deferred income tax | 1,512 | 585 | ||||||
Provision for (recovery of) doubtful accounts | 89 | (269 | ) | |||||
Amortization of pension from other comprehensive loss | 682 | 474 | ||||||
Gain on sale of intangible assets | — | (5,100 | ) | |||||
Loss/(gain) on sale of assets | 7 | (3 | ) | |||||
Changes in operating assets and liabilities: | ||||||||
Accounts and notes receivable | (1,230 | ) | (3,021 | ) | ||||
Inventories, net | (12,729 | ) | (16,246 | ) | ||||
Prepaid expenses and other current assets | (1,169 | ) | 4,366 | |||||
Accounts payable | 1,848 | 507 | ||||||
Other current and noncurrent liabilities | 2,035 | (14,508 | ) | |||||
|
|
|
| |||||
Net cash used in operating activities | (539 | ) | (17,766 | ) | ||||
|
|
|
| |||||
Cash flows from investing activities: | ||||||||
Capital expenditures | (2,467 | ) | (3,972 | ) | ||||
Capitalization of software development costs | (293 | ) | (256 | ) | ||||
Acquisition of land development rights | (1,297 | ) | — | |||||
Proceeds from sale of land development rights | — | 6,397 | ||||||
|
|
|
| |||||
Net cash (used in) provided by investing activities | (4,057 | ) | 2,169 | |||||
|
|
|
| |||||
Cash flows from financing activities: | ||||||||
Net borrowings under domestic lines of credit | 10,500 | 500 | ||||||
Borrowings of long-term debt | 945 | — | ||||||
Net borrowings under foreign lines of credit | 6,354 | 11,817 | ||||||
Repayments of long-term debt | (521 | ) | (515 | ) | ||||
|
|
|
| |||||
Net cash provided by financing activities | 17,278 | 11,802 | ||||||
|
|
|
| |||||
Effects of foreign exchange rate changes on cash and cash equivalents | (962 | ) | (578 | ) | ||||
Net increase (decrease) in cash and cash equivalents | 11,720 | (4,373 | ) | |||||
Cash and cash equivalents—beginning of period | 43,784 | 43,718 | ||||||
|
|
|
| |||||
Cash and cash equivalents—end of period | $ | 55,504 | $ | 39,345 | ||||
|
|
|
| |||||
Supplemental disclosure of cash flow information: | ||||||||
Cash paid for interest | $ | 2,298 | $ | 1,013 | ||||
Cash paid for income taxes | 4,135 | 7,602 | ||||||
Supplemental disclosure of non-cash information: | ||||||||
Accrued capital expenditures | (457 | ) | 633 | |||||
The accompanying notes are an integral part of these unaudited condensed consolidated financial statements.
F-50
Table of Contents
1. Organization and Description of Business
Steinway Musical Instruments Holdings, Inc. (“SMIH” or the “Company”) is a manufacturer of musical instruments. The Company, through its piano (“Steinway”) and band (“Conn-Selmer”) divisions, manufactures and distributes products within the musical instrument industry, as well as the personal luxury goods industry. Steinway pianos are primarily manufactured in facilities in the United States and Germany. The Company’s Boston and Essex brand pianos are manufactured in Asia through a third-party manufacturing facility. Conn-Selmer is a manufacturer of band and orchestral instruments and related accessories, offering complete lines of brass, woodwind, percussion, and string instruments. The Company maintains its United States headquarters in New York and operates globally throughout the Americas, Europe, Middle East, and Africa (“EMEA”), and Asia-Pacific.
Emerging Growth Company Status
The Company is an “emerging growth company” as defined in Section 2(a) of the Securities Act, as modified by the Jumpstart Our Business Startups Act of 2012 (the “JOBS Act”), and it may take advantage of certain exceptions from various reporting requirements that are applicable to other public companies that are not emerging growth companies including, but not limited to, not being required to comply with the auditor attestation requirements of Section 404 of the Sarbanes-Oxley Act of 2002, reduced disclosure obligations regarding executive compensation in its periodic reports and proxy statements, and exemptions from the requirements of holding a nonbinding advisory vote on executive compensation and shareholder approval of any golden parachute payments not previously approved.
Further, Section 102(b)(1) of the JOBS Act exempts emerging growth companies from being required to comply with new or revised financial accounting standards until private companies (that is, those that have not had a Securities Act registration statement declared effective or do not have a class of securities registered under the Exchange Act) are required to comply with the new or revised financial accounting standards. The JOBS Act provides that a company can elect to opt out of the extended transition period and comply with the requirements that apply to non-emerging growth companies, but any such election to opt out is irrevocable. The Company has elected not to opt out of such extended transition period, which means that when a standard is issued or revised and it has different application dates for public or private companies, the Company, as an emerging growth company, can adopt the new or revised standard at the time private companies adopt the new or revised standard. This may make comparison of the Company’s consolidated financial statements with another public company, which is neither an emerging growth company, nor an emerging growth company which has opted out of using the extended transition period, difficult or impossible because of the potential differences in accounting standards used.
2. Summary of Significant Accounting Policies
Basis of Presentation
These condensed consolidated financial statements have been prepared in accordance with accounting principles generally accepted in the United States (U.S. GAAP) and include the accounts of the Company and its wholly owned subsidiaries. All intercompany balances and transactions have been eliminated.
Unaudited Interim Financial Information
The accompanying unaudited interim condensed consolidated financial statements have been prepared pursuant to the rules and regulations of the Securities and Exchange Commission (the “SEC”) for interim financial information and include the accounts of the Company. Certain information and disclosures normally included in consolidated financial statements prepared in accordance with
F-51
Table of Contents
U.S. GAAP have been condensed or omitted. Accordingly, the unaudited condensed consolidated financial statements and notes included herein should be read in conjunction with the Company’s audited consolidated financial statements and notes for the year ended December 31, 2021. The interim condensed consolidated balance sheet as of December 31, 2021 has been derived from audited financial statements for the year ended December 31, 2021. The accompanying interim condensed consolidated balance sheet as of March 31, 2022, and the interim condensed consolidated statements of operations, comprehensive income, stockholders’ equity and cash flows for the three months ended March 31, 2022 and 2021 are unaudited.
There have been no significant changes in accounting policies during the three months ended March 31, 2022 from those disclosed in the annual consolidated financial statements for the year ended December 31, 2021 and the related notes. The unaudited interim condensed consolidated financial statements have been prepared on a basis consistent with that used to prepare the annual audited consolidated financial statements and include, in the opinion of management, all adjustments, consisting of normal and recurring items, necessary for the fair presentation of the condensed consolidated financial statements. The operating results for the three months ended March 31, 2022 are not necessarily indicative of the results expected for the full year ending December 31, 2022.
Risk and Uncertainties
On March 11, 2020, the World Health Organization characterized the outbreak of COVID-19 as a global pandemic and recommended containment and mitigation measures. In response, extraordinary actions were taken by international, federal, state, and local public health and governmental authorities to contain and combat the outbreak and spread of COVID-19 in regions throughout the world. These actions included travel bans, quarantines, “stay-at-home” orders, and similar mandates for many individuals to substantially restrict daily activities and for many businesses to curtail or cease normal operations. Some of these measures have since been rescinded, but the Company continues to take precautionary measures in order to minimize the risk of the virus to its employees and the communities in which it operates. While the impacts of COVID-19 had generally stabilized by the end of the year, there remains uncertainty around the broader implications of the COVID-19 pandemic on the Company’s results of operations and overall financial performance, including the Company’s ability to offset higher costs of suppliers as a result of inflation or disruptions in the supply chain. The COVID-19 pandemic negatively impacted the Company’s supply chain, leading to longer lead times and increasing freight costs. The Company also experienced decreasing microchip availability leading to increased material costs for Spirio pianos. The COVID-19 pandemic has, to date, not had a material adverse impact on the Company’s ability to raise funds to sustain operations. However, due to the impact from COVID-19 on the Band segment, the Company recognized a total of $13.6 million and $2.5 million of non-cash goodwill and trademark impairment charges, respectively, during 2020. The economic effects of the pandemic and resulting long-term societal changes are currently not predictable, and the future financial impacts could vary from those we have experienced.
As the Company expands globally, it becomes more exposed to global social and macroeconomic risks, including geopolitical events such as the Russia-Ukraine conflict. For the year ended December 31, 2021, and the three months ended March 31, 2022, the Company’s net sales in Russia and Ukraine were immaterial. However, the economic effects of the geopolitical events are currently not predictable, and the future financial impacts could vary from those the Company has experienced.
Use of Estimates
The preparation of condensed consolidated financial statements in conformity with U.S. GAAP requires management to make significant estimates and assumptions that affect the reported amounts of assets and liabilities, the disclosure of assets and contingent liabilities at the date of the condensed
F-52
Table of Contents
consolidated financial statements, and the reported amounts of revenues and expenses during the reporting period. Actual results could differ from those estimates. The significant estimates in the condensed consolidated financial statements include determining the sufficiency of the reserve for sales discounts and returns, the evaluation of the recoverability of goodwill, indefinite life intangible assets and long-lived assets, pension and other post-retirement benefit cost assumptions, deferred income tax valuation allowances, and the measurement to fair value of the share-based compensation liability.
Cash and Cash Equivalents
The Company considers all investments purchased with maturities of three months or less to be cash equivalents. Cash equivalents consist primarily of investments in highly liquid securities. As of December 31, 2021 and March 31, 2022, the Company maintained $36.9 million and $34.2 million of cash in foreign countries, respectively.
Fair Value of Financial Instruments
Fair value is defined as the exchange price that would be received for an asset or paid to transfer a liability (an exit price) in the principal or most advantageous market for the asset or liability in an orderly transaction between market participants on the measurement date. Valuation techniques used to measure fair value must maximize the use of observable inputs and minimize the use of unobservable inputs. The guidance describes a fair value hierarchy based on three levels of inputs, of which the first two are considered observable and the last unobservable, that may be used to measure fair value.
Level 1—Inputs are unadjusted quoted prices in active markets for identical assets or liabilities at the measurement date
Level 2—Inputs are observable, unadjusted quoted prices in active markets for similar assets or liabilities; unadjusted quoted prices for identical or similar assets or liabilities in markets that are not active; or other inputs that are observable or can be corroborated by observable market data for substantially the full term of the related assets or liabilities
Level 3—Unobservable inputs that are supported by little or no market data for the related assets or liabilities
The categorization of a financial instrument within the fair value hierarchy is based upon the lowest level of input that is significant to the fair value measurement. The Company’s financial instruments include cash and cash equivalents, accounts and notes receivable, accounts payable and accrued liabilities, other current assets and liabilities, debt and interest rate swaps. At December 31, 2021 and March 31, 2022, the carrying amounts of accounts and notes receivables, accounts payable and other current assets and liabilities approximated at their fair values because of their short-term nature. At December 31, 2021 and March 31, 2022, the carrying amount of the Company’s long-term debt approximates fair value as the stated interest rate approximates market rates currently available to the Company. See Note 4.
Software and Software Development Costs
During the three months ended March 31, 2021 and March 31, 2022, the Company capitalized $0.3 million and $0.2 million, respectively, of internally generated software development costs.
Selling, General and Administrative Expenses
Costs associated with the Company’s advertising and sales promotions are expensed as incurred. During the three months ended March 31, 2021 and 2022, the Company recognized advertising costs of $1.7 million and $2.4 million, respectively.
F-53
Table of Contents
Accumulated Other Comprehensive Loss
Comprehensive income is comprised of net income and other comprehensive loss. Other comprehensive loss includes foreign currency translation adjustments and pension and other post-retirement benefit activity, net of income taxes.
The following tables summarize the changes in the components of accumulated other comprehensive loss for the following periods:
| Three Months Ended March 31, 2021 (Unaudited) | ||||||||||||
| Foreign Currency Translation Adjustments | Minimum Pension Liability and Other Post-Retirement Benefits | Accumulated Other Comprehensive Loss | ||||||||||
Balance at January 1, 2021 | $ | (2,904 | ) | $ | (35,557 | ) | $ | (38,461 | ) | |||
Other comprehensive loss before reclassifications | (2,310 | ) | (554 | ) | (2,864 | ) | ||||||
Amounts reclassified from AOCI | — | 682 | 682 | |||||||||
|
|
|
|
|
| |||||||
Other comprehensive loss (income), net of tax | (2,310 | ) | 128 | (2,182 | ) | |||||||
|
|
|
|
|
| |||||||
Balance at March 31, 2021 | $ | (5,214 | ) | $ | (35,429 | ) | $ | (40,643 | ) | |||
|
|
|
|
|
| |||||||
| Three Months Ended March 31, 2022 (Unaudited) | ||||||||||||
| Foreign Currency Translation Adjustments | Minimum Pension Liability and Other Post-Retirement Benefits | Accumulated Other Comprehensive Loss | ||||||||||
Balance at January 1, 2022 | $ | (6,680 | ) | $ | (26,121 | ) | $ | (32,801 | ) | |||
Other comprehensive (loss) income before reclassifications | (2,077 | ) | (386 | ) | (2,463 | ) | ||||||
Amounts reclassified from AOCI | — | 475 | 475 | |||||||||
|
|
|
|
|
| |||||||
Other comprehensive loss (income), net of tax | (2,077 | ) | 89 | (1,988 | ) | |||||||
|
|
|
|
|
| |||||||
Balance at March 31, 2022 | $ | (8,757 | ) | $ | (26,032 | ) | $ | (34,789 | ) | |||
|
|
|
|
|
| |||||||
Recently Adopted Accounting Pronouncements
In August 2018, the FASB issued ASU No. 2018-15, Goodwill and Other—Internal-Use Software (Subtopic 350-40): Customer’s Accounting for Implementation Costs Incurred in a Cloud Computing Arrangement that is a Service Contract (“ASU 2018-15”). ASU 2018-15 aligns the accounting for costs incurred to implement a cloud computing arrangement that is a service arrangement with the guidance on capitalizing costs associated with developing or obtaining internal-use software. The ASU can be applied on a retrospective or prospective basis and is effective for financial statements issued for fiscal years beginning after December 15, 2020, and interim periods within those fiscal years. Early adoption is permitted. The Company early adopted this update as of January 1, 2021 on a prospective basis. The adoption did not have a material impact on the financial statements.
Recently Issued Accounting Pronouncements
In February 2016, the FASB issued ASU No. 2016-02, Leases (Topic 842), which supersedes the guidance in former ASC 840, Leases. This standard requires lessees to apply a dual approach,
F-54
Table of Contents
classifying leases as either finance or operating leases based on the principle of whether or not the lease is effectively a financed purchase by the lessee. This classification will determine whether lease expense is recognized based on an effective interest method or on a straight-line basis over the term of the lease. A lessee is also required to record a right-of-use asset and a lease liability for all leases with a term of greater than 12 months regardless of their classification. Leases with a term of 12 months or less may be accounted for similar to existing guidance for operating leases today. The standard is effective for public companies for annual periods beginning after December 15, 2018, including interim periods therein. For all other entities, the standard is effective for annual periods beginning after December 15, 2021, and interim periods within annual periods beginning after December 15, 2022. The Company is allowed to use the private company adoption timeline, and therefore the standard is effective for the Company for its annual period beginning January 1, 2022, and interim periods within annual periods beginning January 1, 2023. The Company will adopt the standard using the modified retrospective transition approach. The Company expects to record a ROU asset in the range of approximately $75.0 million to $80.0 million and corresponding lease liability in the range of approximately $80.0 million to $90.0 million, in connection with this adoption. The impact of the adoption on the financial statements will be reflected in for the annual period ending December 31, 2022.
In June 2016, the FASB issued ASU 2016-13, Financial Instruments-Credit Losses (Topic 326): Measurement of Credit Losses on Financial Instruments (“Topic 326”), in order to improve financial reporting of expected credit losses on financial instruments and other commitments to extend credit. Topic 326 requires that an entity measure and recognize expected credit losses for financial assets held at amortized cost and replaces the incurred loss impairment methodology in current GAAP with a methodology that requires consideration of a broader range of information to estimate credit losses. The guidance is effective for annual periods beginning after December 15, 2022, including interim periods within those fiscal years. Early adoption is permitted. The Company does not expect this standard to have a material impact on its financial statements.
In August 2018, the FASB has issued ASU 2018-14, Compensation—Retirement Benefits—Defined Benefit Plans—General (Subtopic 715-20): Disclosure Framework—Changes to the Disclosure Requirements for Defined Benefit Plans, that applies to all employers that sponsor defined benefit pension or other postretirement plans. The amendments modify the disclosure requirements for employers that sponsor defined benefit pension or other postretirement plans. Disclosure requirements, including but not limited to, the following were removed from Subtopic 715-20: the amounts in accumulated other comprehensive income expected to be recognized as components of net periodic benefit cost over the next fiscal year; the amount and timing of plan assets expected to be returned to the employer and for public entities, the effects of a one-percentage-point change in assumed health care cost trend rates on the (a) aggregate of the service and interest cost components of net periodic benefit costs and (b) benefit obligation for postretirement health care benefits. The following disclosure requirements were added to Subtopic 715-20: (1) the weighted-average interest crediting rates for cash balance plans and other plans with promised interest crediting rates; and (2) an explanation of the reasons for significant gains and losses related to changes in the benefit obligation for the period. The amendments also clarify the disclosure requirements in paragraph 715-20-50-3, which state that the following information for defined benefit pension plans should be disclosed: (1) the projected benefit obligation (PBO) and fair value of plan assets for plans with PBOs in excess of plan assets; and (2) the accumulated benefit obligation (ABO) and fair value of plan assets for plans with ABOs in excess of plan assets. The amendments in this ASU are effective for the Company for the fiscal year beginning January 1, 2022. Early adoption is permitted. The adoption of this guidance is not expected to have a material impact on our consolidated results of operations or financial position.
In April 2019, the FASB issued ASU 2019-04, Codification Improvements to Topic 326, Financial Instruments—Credit Losses (Topic 815) Derivatives and Hedging, and Topic 825, Financial
F-55
Table of Contents
Instruments (“ASU 2019-04”). This update provides clarifications for three topics related to financial instruments accounting, some of which could be applied to the Company. The standard is effective for annual periods beginning after December 15, 2022 and interim periods within those fiscal years, with early adoption permitted. The Company is currently assessing the impact that adopting this standard will have on its financial statements but does not expect it to be material.
In December 2019, the FASB issued ASU 2019-12, Income Taxes (Topic 740): Simplifying the Accounting for Income Taxes (“ASU 2019-12”), which is intended to simplify various aspects related to accounting for income taxes. ASU 2019-12 removes certain exceptions to the general principles in Topic 740 and also clarifies and amends existing guidance to improve consistent application. ASU 2019-12 is effective for public business entities for fiscal years beginning after December 15, 2021, and interim periods within fiscal years beginning after December 15, 2022, with early adoption permitted. The Company is currently evaluating the impact of adoption of this standard on the consolidated financial statements and disclosures.
In March 2020, the FASB issued ASU 2020-04, Reference Rate Reform (Topic 848), which provides optional expedients and exceptions to contract modifications and hedging relationships that reference the London Interbank Offered Rate or another reference rate expected to be discontinued. The standard is effective upon issuance through December 31, 2022 and may be applied at the beginning of the interim period that includes March 12, 2020 or any date thereafter. The Company is currently evaluating the impact of this guidance on its consolidated financial statements.
3. Revenue Recognition
The following table summarizes the Company’s disaggregated net sales by segment, nature, amount, and timing:
| Three Months Ended March 31, 2021 (Unaudited) | ||||||||||||
| Piano | Band | Total | ||||||||||
Product sales, net | $ | 65,225 | $ | 24,669 | $ | 89,894 | ||||||
Service and restoration | 1,866 | 123 | 1,989 | |||||||||
|
|
|
|
|
| |||||||
Revenue recognized at a point in time | 67,091 | 24,792 | 91,883 | |||||||||
Other | 732 | 68 | 800 | |||||||||
|
|
|
|
|
| |||||||
Revenue recognized over time | 732 | 68 | 800 | |||||||||
|
|
|
|
|
| |||||||
Net sales | $ | 67,823 | $ | 24,860 | $ | 92,683 | ||||||
|
|
|
|
|
| |||||||
| Three Months Ended March 31, 2022 (Unaudited) | ||||||||||||
| Piano | Band | Total | ||||||||||
Product sales, net | $ | 79,489 | $ | 33,990 | $ | 113,479 | ||||||
Service and restoration | 2,044 | 3 | 2,047 | |||||||||
|
|
|
|
|
| |||||||
Revenue recognized at a point in time | 81,533 | 33,993 | 115,526 | |||||||||
Other | 748 | 30 | 778 | |||||||||
|
|
|
|
|
| |||||||
Revenue recognized over time | 748 | 30 | 778 | |||||||||
|
|
|
|
|
| |||||||
Net sales | $ | 82,281 | $ | 34,023 | $ | 116,304 | ||||||
|
|
|
|
|
| |||||||
Contract Liabilities
Timing may differ between the satisfaction of performance obligations and the invoicing and collection of amounts related to contracts with customers. Contract liabilities consists of customer
F-56
Table of Contents
deposits and are recorded for amounts that are collected in advance of the satisfaction of performance obligations. These liabilities are classified as current liabilities and are recognized as revenue within 12 months.
4. Fair Values of Financial Instruments
The following tables present information about the Company’s assets and liabilities measured at fair value on a recurring basis as of December 31, 2021 and March 31, 2022 and the fair value hierarchy of the valuation techniques utilized. The Company classifies these assets and liabilities as either short- or long-term based on maturity and anticipated realization dates.
| December 31, 2021 | ||||||||||||||||
| Level 1 | Level 2 | Level 3 | Total | |||||||||||||
Financial assets: | ||||||||||||||||
Cash equivalents – prepaid expenses and other current assets | $ | 2,861 | $ | — | $ | — | $ | 2,861 | ||||||||
|
|
|
|
|
|
|
| |||||||||
Total financial assets | $ | 2,861 | $ | — | $ | — | $ | 2,861 | ||||||||
|
|
|
|
|
|
|
| |||||||||
Financial liabilities: | ||||||||||||||||
Interest rate swaps – other current liabilities | $ | — | $ | 553 | $ | — | $ | 553 | ||||||||
Share-based compensation liability – other current liabilities | — | — | 7,644 | 7,644 | ||||||||||||
Interest rate swaps – other noncurrent liabilities | — | 5,157 | — | 5,157 | ||||||||||||
|
|
|
|
|
|
|
| |||||||||
Total financial liabilities | $ | — | $ | 5,710 | $ | 7,644 | $ | 13,354 | ||||||||
|
|
|
|
|
|
|
| |||||||||
| March 31, 2022 (Unaudited) | ||||||||||||||||
| Level 1 | Level 2 | Level 3 | Total | |||||||||||||
Financial assets: | ||||||||||||||||
Cash equivalents – prepaid expenses and other current assets | $ | 1,157 | $ | — | $ | — | $ | 1,157 | ||||||||
|
|
|
|
|
|
|
| |||||||||
Total financial assets | $ | 1,157 | $ | — | $ | — | $ | 1,157 | ||||||||
|
|
|
|
|
|
|
| |||||||||
Financial liabilities: | ||||||||||||||||
Interest rate swaps – other current liabilities | $ | — | $ | 276 | $ | — | $ | 276 | ||||||||
Share-based compensation liability – other current liabilities | — | — | 8,769 | 8,769 | ||||||||||||
Interest rate swaps – other noncurrent liabilities | — | 848 | — | 848 | ||||||||||||
|
|
|
|
|
|
|
| |||||||||
Total financial liabilities | $ | — | $ | 1,124 | $ | 8,769 | $ | 9,893 | ||||||||
|
|
|
|
|
|
|
| |||||||||
There were no transfers into or out of Level 3 liabilities during the three months ended March 31, 2021 and 2022.
Interest rate swaps are used to reduce the Company’s exposure to changes in interest rates (Note 13). The fair value of the Company’s interest rate swap agreement is estimated with the assistance of a third-party valuation specialist, using inputs that can be corroborated by observable market data.
As of December 31, 2021 and March 31, 2022, the fair value of the Company’s debt approximated carrying value.
F-57
Table of Contents
During December 2021, in connection with the Company’s filing its initial registration statement with the SEC and changing its status to a public entity as defined by ASC 718, the Company’s share-based compensation liability was remeasured to fair value using a probability-weighted expected return method (“PWERM”) whereby the Company’s total settlement obligation under the equity participation agreement was determined based on the estimated enterprise and equity value of the entity under various scenarios. The PWERM’s output is determined based on inputs not observable in the market, which represented a Level 3 measurement within the fair value hierarchy. The PWERM contemplated two scenarios: i) completing an IPO in the near term or ii) continuing operations as a private company. An assessed likelihood of occurrence was assigned to each scenario based on the Company’s estimate of the probability of each event occurring. The settlement value of the awards under the IPO scenario was based on the estimated total enterprise and equity value of the Company in an IPO, which was determined by considering similar market transactions. The settlement value under the staying private scenario was based on an Option Pricing Model. The Company uses the Black-Scholes model in its option pricing calculation. The Black-Scholes option pricing model requires inputs based on certain subjective assumptions, including (i) the fair value of the Company’s equity, (ii) the risk-free interest rate, (iii) volatility of returns, and (iv) expected dividends. The Black-Scholes option pricing model inputs assumed risk-free interest rate of 0.39%, volatility of returns of 30%, expected dividends yield of 0% and expected term of one year. The fair value of the Company’s total enterprise and equity was estimated using both a market approach and an income approach. Upon changing the Company’s status to a public entity as defined by ASC 718, the liability was remeasured from its intrinsic value of $7.0 million to its fair value of $7.6 million, an increase of $0.6 million, with a corresponding compensation charge being recorded in the period. As of March 31, 2022, the fair value of the share-based payment liability was $8.8 million.
Level 3 Financial Liabilities
The following table summarizes the change in the fair value of the share-based compensation liability balance for the three months ended March 31, 2021, and 2022:
| March 31, 2021 | March 31, 2022 | |||||||
| (Unaudited) | ||||||||
Beginning balance | $ | — | $ | 7,644 | ||||
Change in fair value | — | 1,125 | ||||||
|
|
|
| |||||
Ending balance | $ | — | $ | 8,769 | ||||
|
|
|
| |||||
5. Balance Sheet Components
Accounts and Notes Receivable, net
Accounts and notes receivable, net consists of the following:
| December 31, 2021 | March 31, 2022 | |||||||
| (Unaudited) | ||||||||
Accounts receivable | $ | 38,528 | $ | 40,807 | ||||
Notes receivable from customers | 3,708 | 4,204 | ||||||
Allowance for doubtful accounts | (3,186 | ) | (2,944 | ) | ||||
|
|
|
| |||||
Total accounts and notes receivable, net | $ | 39,050 | $ | 42,067 | ||||
|
|
|
| |||||
F-58
Table of Contents
Other Long-Term Assets
Other long-term assets consist of the following:
| December 31, 2021 | March 31, 2022 | |||||||
| (Unaudited) | ||||||||
Note receivable, net | $ | 772 | $ | 884 | ||||
Deposits | 4,386 | 4,394 | ||||||
Benefits insurance | 1,690 | 1,671 | ||||||
Net pension benefit asset | 2,420 | 2,523 | ||||||
Prepayments and other assets | 1,168 | 995 | ||||||
|
|
|
| |||||
Total other long-term assets | $ | 10,436 | $ | 10,467 | ||||
|
|
|
| |||||
Deposits include $2.1 million for environmental remediation and $1.7 million related to the rental deposit for distribution and retail facilities in China as of December 31, 2021 and March 31, 2022, respectively.
Other Current Liabilities
Other current liabilities are comprised of the following:
| December 31, 2021 | March 31, 2022 | |||||||
| (Unaudited) | ||||||||
Accrued payroll and related benefits | $ | 29,253 | $ | 20,988 | ||||
Customer deposits and prepayments | 42,832 | 46,086 | ||||||
Income and other taxes payable | 14,564 | 11,561 | ||||||
Share-based compensation liability | 7,644 | 8,769 | ||||||
Sales and use taxes payable | 3,375 | 23 | ||||||
Deferred compensation liability (SERP) | 2,861 | 1,157 | ||||||
Reserve for sales discounts, returns and allowances | 2,070 | 1,972 | ||||||
Current portion of pension and other post-retirement benefit liabilities | 1,529 | 1,489 | ||||||
Accrued warranty expense | 1,194 | 1,176 | ||||||
Other accrued expenses | 17,861 | 16,376 | ||||||
|
|
|
| |||||
Total other current liabilities | $ | 123,183 | $ | 109,597 | ||||
|
|
|
| |||||
Other Noncurrent Liabilities
Other noncurrent liabilities are comprised of the following:
| December 31, 2021 | March 31, 2022 | |||||||
| (Unaudited) | ||||||||
Interest rate swap liability – noncurrent | $ | 5,157 | $ | 848 | ||||
Deferred rent – noncurrent | 6,099 | 5,973 | ||||||
Environmental liabilities | 2,890 | 2,890 | ||||||
Uncertain tax provision liabilities | 2,951 | 3,039 | ||||||
Other long-term liabilities | 1,185 | 1,148 | ||||||
|
|
|
| |||||
Total other noncurrent liabilities | $ | 18,282 | $ | 13,898 | ||||
|
|
|
| |||||
F-59
Table of Contents
6. Inventories, net
A summary of the inventories, net is as follows:
| December 31, 2021 | March 31, 2022 | |||||||
| (Unaudited) | ||||||||
Raw materials | $ | 28,273 | $ | 30,870 | ||||
Work-in-process | 62,747 | 67,853 | ||||||
Finished goods | 87,876 | 97,003 | ||||||
|
|
|
| |||||
Total inventories | 178,896 | 195,726 | ||||||
Provision | (10,889 | ) | (13,039 | ) | ||||
|
|
|
| |||||
Total inventories, net | $ | 168,007 | $ | 182,687 | ||||
|
|
|
| |||||
7. Property, Plant and Equipment, net
Property, plant and equipment, net consists of the following:
| Estimated Useful Lives (Years) | December 31, 2021 | March 31, 2022 | ||||||||||
| (Unaudited) | ||||||||||||
Land | N/A | $ | 26,317 | $ | 26,274 | |||||||
Buildings and improvements | 15 – 40 | 59,668 | 61,168 | |||||||||
Leasehold improvements | | Shorter of useful life or term of lease | | 34,643 | 34,112 | |||||||
Machinery, equipment and tooling | 3 – 10 | 57,591 | 58,400 | |||||||||
Office furniture and fixtures | 5 – 7 | 10,473 | 10,338 | |||||||||
Concert and artist, and rental pianos | 7 – 15 | 29,272 | 28,293 | |||||||||
Construction-in-progress | N/A | 19,597 | 20,861 | |||||||||
|
|
|
| |||||||||
Total property, plant and equipment | 237,561 | 239,446 | ||||||||||
Less: Accumulated depreciation and amortization | (99,059 | ) | (101,404 | ) | ||||||||
|
|
|
| |||||||||
Total property, plant and equipment, net | $ | 138,502 | $ | 138,042 | ||||||||
|
|
|
| |||||||||
Depreciation expense relating to property, plant and equipment amounts was $3.5 million and $3.7 million for the three months ended March 31, 2021 and 2022, respectively. Construction-in-progress is primarily related to machinery and equipment and buildings and improvements, which has not been placed in operation.
8. Trademarks, Goodwill, and Other Intangible Assets
Goodwill
The changes in the carrying amount of goodwill are as follows:
| Piano | Band | Total | ||||||||||
Balance – January 1, 2022 | $ | 91,767 | $ | — | $ | 91,767 | ||||||
Goodwill acquired as part of acquisitions during the year | — | — | — | |||||||||
Foreign currency translation adjustments | (280 | ) | — | (280 | ) | |||||||
|
|
|
|
|
| |||||||
Balance – March 31, 2022 | $ | 91,487 | $ | — | $ | 91,487 | ||||||
|
|
|
|
|
| |||||||
F-60
Table of Contents
Intangible Assets, net
Details of the Company’s intangible assets subject to amortization and indefinite-lived intangible assets and their respective carrying amounts are as follows:
| Weighted-Average Remaining Useful Life (in years) | Gross Carrying Amount, January 1, 2022 | Additions | Accumulated Amortization | Dispositions | Net Book Value March 31, 2022 | |||||||||||||||||||
Finite-lived intangibles assets: | ||||||||||||||||||||||||
Music copyright | 2.5 | $ | 950 | $ | 5 | $ | (802 | ) | $ | — | $ | 153 | ||||||||||||
Acquired digital lessons platform | 4.0 | 400 | — | (87 | ) | — | 323 | |||||||||||||||||
Internal use software | 3.0 | 7,791 | 251 | (4,657 | ) | — | 3,375 | |||||||||||||||||
Indefinite lived intangible assets: | ||||||||||||||||||||||||
Indefinite-lived trademarks | 128,000 | — | — | — | 128,000 | |||||||||||||||||||
Land development rights(1) | 1,297 | — | — | (1,297 | ) | — | ||||||||||||||||||
|
|
|
|
|
|
|
|
|
| |||||||||||||||
Total intangible assets | 3.2 | $ | 138,438 | $ | 256 | $ | (5,546 | ) | $ | (1,297 | ) | $ | 131,851 | |||||||||||
|
|
|
|
|
|
|
|
|
| |||||||||||||||
| (1) | During the three months ended March 31, 2022, the Company completed the sale of land development rights for $6.6 million and realized a net gain of $5.1 million. The land development rights had been included in the total assets of the Company’s Piano reporting segment. |
Amortization expense related to finite-lived intangible assets amounted to $0.2 million and $0.3 million for the three months ended March 31, 2021 and 2022, respectively.
9. Long-Term Debt
Long-term debt consists of the following:
| Maturity Date | December 31, 2021 | March 31, 2022 (Unaudited) | ||||||||||
Foreign term credit facilities | December 2026 | $ | 19,929 | $ | 18,982 | |||||||
ABL Facility | February 2023 | 19,500 | 20,000 | |||||||||
Foreign revolving credit facilities | January 2023 | 11,504 | 22,685 | |||||||||
Less: deferred financing costs, net | 429 | 351 | ||||||||||
|
|
|
| |||||||||
Total debt | 50,504 | 61,316 | ||||||||||
Less: Current portion of debt | 2,122 | 44,746 | ||||||||||
Less: Current portion of deferred financing cost, net | — | (153 | ) | |||||||||
|
|
|
| |||||||||
Debt -noncurrent | $ | 48,382 | $ | 16,723 | ||||||||
|
|
|
| |||||||||
F-61
Table of Contents
The Company is a party to an asset-based lending credit facility (“ABL Facility,”) with a syndicate of lenders.
The ABL Facility provides a total commitment of $110.0 million expiring on February 16, 2023. The ABL Facility provides for borrowings at either LIBOR plus a range from 1.50% to 2.00% or as-needed borrowings at an alternate base rate, plus a range from 0.50% to 1.00%; both ranges depend upon availability at the time of borrowing. The applicable interest rate with respect to the ABL Facility was 1.6% and 2.0% as of December 31, 2021 and March 31, 2022, respectively. The amount outstanding under the ABL Facility amounted to $19.5 million and $20.0 million as of December 31, 2021 and March 31, 2022, respectively. Any outstanding amounts are payable when the facility matures in 2023. The amount available on the ABL Facility, net of letters of credit and borrowing restrictions, was $42.5 million and $46.6 million as of December 31, 2021 and March 3, 2022, respectively. Commitment fees for the unused credit line were $0.1 million for the three months ended March 31, 2021 and 2022, respectively.
Capitalized debt issuance costs are reflected net of amortization in debt—current and debt—noncurrent on the condensed consolidated balance sheets.
In addition to ABL Facility, the Company also has multiple foreign credit facilities. In April 2020, the Company’s German subsidiary refinanced its existing credit facility resulting in a €20.0 million term loan (the “foreign term loan”) and €30.0 million borrowing base facility. The foreign term loan provides for borrowings at the Euro Interbank Offered Rate (“EURIBOR”) plus 1.80%, with a EURIBOR floor of 0%. The borrowing base facility provides for borrowings at either EURIBOR plus 2.25% or as-needed borrowings at an alternate rate of 3.25% interest or LIBOR plus 3.25% interest, depending on the currency of borrowings. The applicable interest rate with respect to the foreign term loan was 1.80% as of December 31, 2021 and March 31, 2022, respectively. The applicable interest rate with respect to the borrowing base facility was 2.25% as of December 31, 2021 and March 31, 2022, respectively. Commitment fees for the borrowing base facility were immaterial for the three months ended March 31, 2021 and 2022. The outstanding debt issuance costs related to the Company’s foreign credit facilities was $0.2 million as of December 31, 2021 and March 31, 2022, respectively. The Company’s Japanese subsidiary also has a ¥600.0 million revolving credit facility (together with the German revolving credit facility, the “foreign revolving credit facilities”) which bears interest at a 1.5% rate.
The outstanding balance of the foreign term loan was approximately $19.3 million and $18.3 million as of December 31, 2021 and March 31, 2022, respectively. The total outstanding balance of the Company’s foreign revolving credit facilities was approximately $11.5 million and $22.7 million as of December 31, 2021 and March 31, 2022, respectively. The amount available on the foreign revolving credit facilities, net of letters of credit, was approximately $26.8 million and $14.4 million as of December 31, 2021 and March 31, 2022, respectively.
Current portion of debt represents the quarterly installments on the ABL Facility, foreign term loan and foreign revolving credit facilities that are due within the next fiscal year.
Financial covenants
Foreign term loan and German foreign credit facility required the Company’s German subsidiary to maintain certain financial covenants. The Company must maintain a capital ratio of 20% as of each reporting date as defined in the agreement. As of December 31, 2021 and March 31, 2022, the Company was in compliance with all financial covenants.
F-62
Table of Contents
Restrictive covenants
The ABL facility agreements contain various restrictive covenants that, among other things, restrict or limit our ability to (subject to certain negotiated exceptions): incur additional indebtedness; grant liens; make fundamental changes; sell assets; make restricted payments including cash dividends to shareholders; make investments; prepay subordinated indebtedness; enter into transactions with affiliates; and enter into restrictive agreements.
The foreign term loan agreements contains various restrictive covenants that restrict the Company’s ability to make fundamental changes, sell assets, or change the control of the German subsidiary. As of December 31, 2021 and March 31, 2022, the Company was in compliance with all restrictive covenants.
10. Commitments and Contingent Liabilities
Standby Letters of Credit
As of December 31, 2021 and March 31, 2022, the Company was contingently liable under standby letters of credit of $5.8 million. These letters of credit are subject to the terms of our credit agreements (Note 9).
Legal Matters
In the ordinary course of business, the Company is a party to various legal actions that we believe are routine in nature and incidental to the operation of our business. While the outcome of such actions cannot be predicted with certainty, the Company believes that, based on its experience in dealing with these matters, their ultimate resolution will not have a material adverse impact on our business, financial condition, results of operations or prospects.
11. Retirement Plans
The Company has defined benefit or defined contribution pension plans covering the majority of our employees, including certain employees in foreign countries. Certain domestic hourly employees are covered by multi-employer defined benefit pension plans to which the Company makes contributions. The corresponding pension plan assets and liabilities belong to third parties and, accordingly, are not reflected in the condensed consolidated financial statements.
The net periodic pension (benefit) expense is as follows:
| Three Months Ended March 31, 2021 (Unaudited) | Three Months Ended March 31, 2022 (Unaudited) | |||||||||||||||
| Domestic Plan | Domestic Plan | Domestic Plan | Foreign Plan | |||||||||||||
Service cost | $ | — | $ | 375 | $ | — | $ | 332 | ||||||||
Interest cost | 359 | 116 | 361 | 156 | ||||||||||||
Expected return on plan assets | (1,069 | ) | (192 | ) | (1,070 | ) | (211 | ) | ||||||||
Amortization of actuarial loss | 330 | 352 | 340 | 134 | ||||||||||||
Other | — | 11 | — | 11 | ||||||||||||
|
|
|
|
|
|
|
| |||||||||
Net periodic pension (benefit) expense | $ | (380 | ) | $ | 662 | $ | (369 | ) | $ | 422 | ||||||
|
|
|
|
|
|
|
| |||||||||
F-63
Table of Contents
The Company has a Supplemental Executive Retirement Plan (“SERP”) for a select group of current and former executives who constitute a “top hat” group as defined by the Employee Retirement Income Security Act of 1974, as amended (“ERISA”). Discretionary employer contributions made to this plan, as determined annually by the Board of Directors, are held in a rabbi trust. The SERP assets and the corresponding liability are presented in the condensed consolidated balance sheets within prepaid expenses and other current assets and other current liabilities (Notes 5). No contributions were made to this plan for the three months ended March 31, 2021 and 2022. See Note 18, for more details about the SERP plan termination.
12. Income Taxes
The Company computes its quarterly income tax expense by using an annual effective tax rate and adjusts for any discrete items arising during the quarter. For the three months ended March 31, 2021 and 2022, the Company had income tax expense of $2.7 million, based on 30.2% effective tax rate, and $6.1 million, based on 29.3% effective tax rate, respectively. The primary differences between the effective tax rates and the 21.0% U.S. federal statutory tax rate were due to the valuation allowance on the Company’s foreign tax credit carryforwards, partially offset by state taxes and the foreign tax rate differential on non-US income.
13. Interest Rate Swaps
The Company’s interest rate swaps have annual maturities between 2023 and 2025. The Company has not designated its interest rate swaps as hedging instruments.
The Company’s aggregate notional amount as of December 31, 2021 and March 31, 2022, is $185.0 million and $155.0 million, respectively. As of December 31, 2021 and March 31, 2022, $0.5 million and $0.3 million of derivative liabilities were included other current liabilities on the condensed consolidated balance sheets, and $5.2 million and $0.8 million were included in other noncurrent liabilities on the condensed consolidated balance sheets, respectively. For the three months ended March 31, 2021 and 2022, the Company recognized a gain of $1.8 million and $4.6 million, respectively, from the remeasurement and settlement of derivative financial instruments, and this is reflected in interest (income) expense, net on the condensed consolidated statements of operations.
14. Executive Compensation
During the year ended December 31, 2021, shareholders of the Company or their affiliates (including such affiliates, the “Owner”) were party to profit interest participation agreements with an executive. For the three months ended March 31, 2021 and 2022, the Company recognized compensation expense of nil and $1.1 million, respectively, in connection with the profit interest awards. No settlement payments were made for these awards during the period.
15. Related Party Transaction
In December 2017, the Company entered into a sublease agreement with the Owner. Pursuant to the agreement, the related party will sublease the office facility in New York starting January 1, 2018, through December 31, 2022, which may be extended for an additional 5-year period through December 31, 2027 and thereafter through the expiration date of the original lease. The owner has agreed to pay the full amount of the obligation per the sublease by directly remitting to the landlord any rent and incidental charges. Per the agreement the base rent for the subleased premises for March 31, 2021 and 2022 would have been $0.5 million.
F-64
Table of Contents
Certain compensation related arrangements existed between an executive of the Company and Owner. See Note 14 for the amount recorded for these arrangements.
16. Segment Information
The Company has identified two operating segments: Piano and Band.
Income from operations for the operating segments includes certain corporate costs allocated to the segments based on revenue, assets and headcount. There were no transactions within the segments which would require elimination. The primary measurement of profitability used by the CODM to assess the performance of the segment and to allocate resources is Adjusted Earnings Before Interests, Taxes, Depreciation and Amortization (“Adjusted EBITDA”).
The following tables present information about the Company’s operating segments:
| Three Months Ended March 31, 2021 (Unaudited) | Three Months Ended March 31, 2022 (Unaudited) | |||||||||||||||||||||||
| Piano | Band | Consolidated | Piano | Band | Consolidated | |||||||||||||||||||
Net sales: | ||||||||||||||||||||||||
Americas | $ | 28,364 | $ | 23,849 | $ | 52,213 | $ | 41,281 | $ | 32,360 | $ | 73,641 | ||||||||||||
Asia Pacific | 22,280 | 638 | 22,918 | 21,331 | 690 | 22,021 | ||||||||||||||||||
EMEA | 17,179 | 373 | 17,552 | 19,669 | 973 | 20,642 | ||||||||||||||||||
|
|
|
|
|
|
|
|
|
|
|
| |||||||||||||
Total Net Sales | 67,823 | 24,860 | 92,683 | 82,281 | 34,023 | 116,304 | ||||||||||||||||||
Gross profit | 30,380 | 5,058 | 35,438 | 39,068 | 6,154 | 45,222 | ||||||||||||||||||
Gross profit margin | 44.8 | % | 20.3 | % | 38.2 | % | 47.5 | % | 18.1 | % | 38.9 | % | ||||||||||||
Adjusted EBITDA | $ | 12,686 | $ | 1,011 | $ | 13,697 | $ | 18,537 | $ | 943 | $ | 19,480 | ||||||||||||
Adjusted EBITDA margin | 18.7 | % | 4.1 | % | 14.8 | % | 22.5 | % | 2.8 | % | 16.7 | % | ||||||||||||
Less addbacks: | ||||||||||||||||||||||||
Interest (income) expense, net | $ | 656 | $ | (3,552 | ) | |||||||||||||||||||
Income tax expense | 2,714 | 6,121 | ||||||||||||||||||||||
Depreciation and amortization | 3,762 | 4,069 | ||||||||||||||||||||||
Foreign exchange (gain)/loss | (309 | ) | (28 | ) | ||||||||||||||||||||
Purchase accounting adjustments | 4 | 2 | ||||||||||||||||||||||
Non-cash stock-based compensation expense | — | 1,125 | ||||||||||||||||||||||
Gain on sale of intangible assets | — | (5,100 | ) | |||||||||||||||||||||
Potential transaction / acquisition costs | 547 | — | ||||||||||||||||||||||
Initial public offering expenses | — | 2,046 | ||||||||||||||||||||||
Non-operating legal costs | 41 | 29 | ||||||||||||||||||||||
Other charges | 16 | — | ||||||||||||||||||||||
|
|
|
| |||||||||||||||||||||
Total addbacks | $ | (7,431 | ) | $ | (4,712 | ) | ||||||||||||||||||
|
|
|
| |||||||||||||||||||||
Net income | $ | 6,266 | $ | 14,768 | ||||||||||||||||||||
|
|
|
| |||||||||||||||||||||
Cash capital expenditures | $ | 1,246 | $ | 1,221 | $ | 2,467 | $ | 3,030 | $ | 942 | $ | 3,972 | ||||||||||||
17. Net Income Per Share
The Company has only issued common stock and does not have any potentially dilutive instrument as of December 31, 2021 and March 31, 2022.
F-65
Table of Contents
The following table presents the calculation of basic and diluted earnings per share:
| Three Months Ended March 31, | ||||||||
In thousands, except share and per share data | 2021 | 2022 | ||||||
Numerator: | ||||||||
Net income | $ | 6,266 | $ | 14,768 | ||||
Denominator: | ||||||||
Weighted-average common shares outstanding – basic and diluted | 1,000 | 1,000 | ||||||
|
|
|
| |||||
Net income per share: | ||||||||
Basic and diluted | $ | 6,266 | $ | 14,768 | ||||
|
|
|
| |||||
18. Subsequent Events
The Company has evaluated subsequent events from the balance sheet date through May 13, 2022, the date which these condensed consolidated financial statements were available to be issued.
During 2021, the Company terminated the SERP plan and liquidated the associated plan assets. In April 2022, the Company finalized the asset distributions to all participants.
In May 2022, the Company terminated its interest rate swap contracts and in consideration of the termination, the Company will recognize the impact within interest expense (income), net on the condensed consolidated statements of operations during the second quarter of 2022.
F-66
Table of Contents

Table of Contents

Table of Contents
Through and including , 2022 (the 25th day after the date of this prospectus), all dealers effecting transactions in the Class A common stock, whether or not participating in this offering, may be required to deliver a prospectus. This delivery requirement is in addition to a dealer’s obligation to deliver a prospectus when acting as an underwriter and with respect to an unsold allotment or subscription.
Shares

Steinway Musical Instruments Holdings, Inc.
Class A Common Stock
Goldman Sachs & Co. LLC
BofA Securities
Barclays
Evercore ISI
Cowen
Stifel
Bernstein
Telsey Advisory Group
Commerzbank
Loop Capital Markets
Table of Contents
Part II
INFORMATION NOT REQUIRED IN PROSPECTUS
(1) Item 13. Other Expenses of Issuance and Distribution.
The following table indicates the expenses to be incurred in connection with the offering described in this registration statement, other than the underwriting discounts and commissions, all of which will be paid by us. All amounts are estimated except the Securities and Exchange Commission registration fee, the Financial Industry Regulatory Authority, Inc., or FINRA, filing fee and the New York Stock Exchange listing fee.
| Amount | ||||
● Securities and Exchange Commission registration fee | $ | 9,270 | ||
● FINRA filing fee | 15,500 | |||
● Initial New York Stock Exchange listing fee | * | |||
● Accountants’ fees and expenses | * | |||
● Legal fees and expenses | * | |||
● Blue Sky fees and expenses | * | |||
● Transfer Agent’s fees and expenses | * | |||
● Printing and engraving expenses | * | |||
● Miscellaneous | * | |||
|
| |||
● Total expenses | $ | * | ||
| * | To be filed by amendment |
(2) Item 14. Indemnification of Directors and Officers.
The registrant is governed by the Delaware General Corporation Law (the “DGCL”). Section 145 of the DGCL provides that a corporation may indemnify any person, including an officer or director, who was or is, or is threatened to be made, a party to any threatened, pending or completed legal action, suit or proceeding, whether civil, criminal, administrative or investigative (other than an action by or in the right of such corporation), by reason of the fact that such person was or is an officer, director, employee or agent of such corporation or is or was serving at the request of such corporation as a director, officer, employee or agent of another corporation or enterprise. The indemnity may include expenses (including attorneys’ fees), judgments, fines and amounts paid in settlement actually and reasonably incurred by such person in connection with such action, suit or proceeding, provided such officer, director, employee or agent acted in good faith and in a manner such person reasonably believed to be in, or not opposed to, the corporation’s best interest and, for criminal proceedings, had no reasonable cause to believe that such person’s conduct was unlawful. A Delaware corporation may indemnify any person, including an officer or director, who was or is, or is threatened to be made, a party to any threatened, pending or contemplated action or suit by or in the right of such corporation, under the same conditions, except that such indemnification is limited to expenses (including attorneys’ fees) actually and reasonably incurred by such person, and except that no indemnification is permitted without judicial approval if such person is adjudged to be liable to such corporation. Where an officer or director of a corporation is successful, on the merits or otherwise, in the defense of any action, suit or proceeding referred to above, or any claim, issue or matter therein, the corporation must indemnify that person against the expenses (including attorneys’ fees) which such officer or director actually and reasonably incurred in connection therewith.
The registrant’s amended and restated certificate of incorporation will authorize the indemnification of its officers and directors, consistent with Section 145 of the DGCL.
II-1
Table of Contents
Reference is made to Section 102(b)(7) of the DGCL, which enables a corporation in its original certificate of incorporation or an amendment thereto to eliminate or limit the personal liability of a director for violations of the director’s fiduciary duty, except (i) for any breach of the director’s duty of loyalty to the corporation or its stockholders, (ii) for acts or omissions not in good faith or which involve intentional misconduct or a knowing violation of law, (iii) pursuant to Section 174 of the DGCL, which provides for liability of directors for certain unlawful payments of dividends of unlawful stock purchase or redemptions or (iv) for any transaction from which a director derived an improper personal benefit. The registrant’s amended and restated certificate of incorporation will include such an exculpation provision, consistent with Section 102(b)(7) of the DGCL.
We have entered into indemnification agreements with each of our directors and officers. These indemnification agreements may require us, among other things, to indemnify our directors and officers for some expenses, including attorneys’ fees, judgments, fines and settlement amounts incurred by a director or officer in any action or proceeding arising out of his or her service as one of our directors or officers, or any of our subsidiaries or any other company or enterprise to which the person provides services at our request.
We maintain a general liability insurance policy that covers certain liabilities of directors and officers of our corporation arising out of claims based on acts or omissions in their capacities as directors or officers.
In any underwriting agreement we enter into in connection with the sale of Class A common stock being registered hereby, the underwriters will agree to indemnify, under certain conditions, us, our directors, our officers and persons who control us, within the meaning of the Securities Act against certain liabilities.
(3) Item 15. Recent Sales of Unregistered Securities.
None.
(4) Item 16. Exhibits and Financial Statement Schedules.
Exhibits.
The following documents are filed as exhibits to this registration statement.
II-2
Table of Contents
II-3
Table of Contents
| * | To be filed by amendment. |
| # | Indicates management contract or compensatory plan. |
| † | Previously filed. |
(b) Financial Statement Schedules.
Schedules not listed above have been omitted because the information required to be set forth therein is not applicable or is shown in the financial statements or notes thereto.
(5) Item 17. Undertakings.
The undersigned registrant hereby undertakes to provide to the underwriter, at the closing specified in the underwriting agreement, certificates in such denominations and registered in such names as required by the underwriter to permit prompt delivery to each purchaser.
Insofar as indemnification for liabilities arising under the Securities Act may be permitted to directors, officers and controlling persons of the registrant pursuant to the foregoing provisions, or otherwise, the registrant has been advised that in the opinion of the Securities and Exchange Commission such indemnification is against public policy as expressed in the Securities Act and is, therefore, unenforceable. In the event that a claim for indemnification against such liabilities (other than the payment by the registrant of expenses incurred or paid by a director, officer or controlling person of the registrant in the successful defense of any action, suit or proceeding) is asserted by such director, officer or controlling person in connection with the securities being registered, the registrant will, unless in the opinion of its counsel the matter has been settled by controlling precedent, submit to a court of appropriate jurisdiction the question whether such indemnification by it is against public policy as expressed in the Securities Act and will be governed by the final adjudication of such issue.
The undersigned hereby undertakes that:
| a) | For purposes of determining any liability under the Securities Act, the information omitted from the form of prospectus filed as part of this registration statement in reliance upon Rule 430A and contained in a form of prospectus filed by the registrant pursuant to Rule 424(b)(1) or (4) or 497(h) under the Securities Act shall be deemed to be part of this registration statement as of the time it was declared effective. |
| b) | For the purpose of determining any liability under the Securities Act, each post-effective amendment that contains a form of prospectus shall be deemed to be a new registration statement relating to the securities offered therein, and the offering of such securities at that time shall be deemed to be the initial bona fide offering thereof. |
II-4
Table of Contents
SIGNATURES
Pursuant to the requirements of the Securities Act, the registrant has duly caused this registration statement to be signed on its behalf by the undersigned, thereunto duly authorized, in the City of New York, State of New York, on this 13th day of May, 2022.
| STEINWAY MUSICAL INSTRUMENTS HOLDINGS, INC. | ||
| By: | /s/ Benjamin Steiner | |
| Benjamin Steiner | ||
| President and Chief Executive Officer | ||
II-5
Table of Contents
Pursuant to the requirements of the Securities Act of 1933, as amended, this Registration Statement has been signed below by the following persons on behalf of the Registrant and in the capacities and on the dates indicated.
Signature | Title | Date | ||
/s/ Benjamin Steiner Benjamin Steiner | President, Chief Executive Officer and Director (Principal Executive Officer) | May 13, 2022 | ||
/s/ Maia Moutopoulos Maia Moutopoulos | Chief Financial Officer (Principal Financial Officer and Accounting Officer) | May 13, 2022 | ||
* John Paulson | Director | May 13, 2022 | ||
* Michael Waldorf | Director | May 13, 2022 | ||
* Wei Wei | Director | May 13, 2022 | ||
| *By: | /s/ Maia Moutopoulos | |
| Maia Moutopoulos | ||
| Attorney-in-fact |
II-6