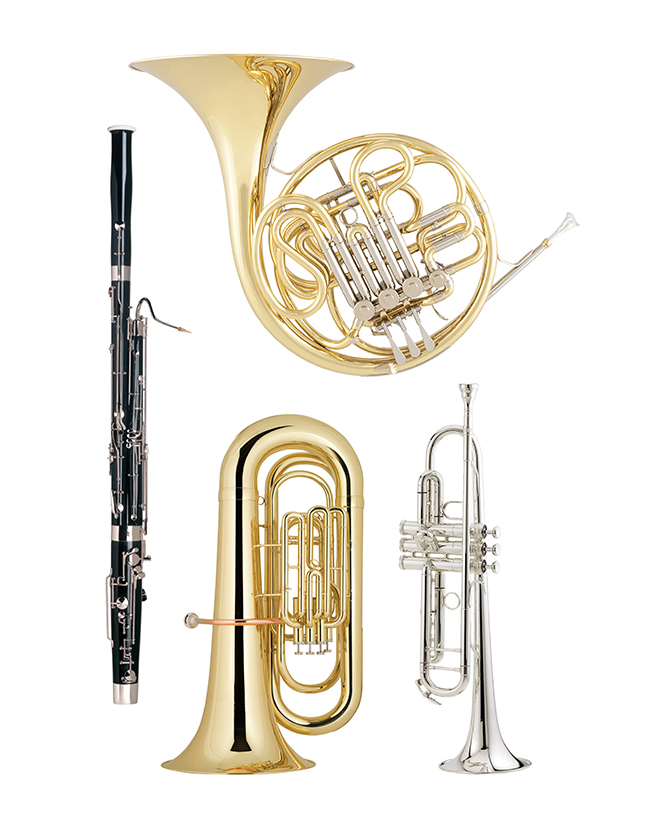
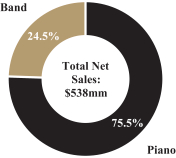
shares in each of their musical instrument categories. In fiscal years 2021 and 2020, brass and woodwind instruments contributed approximately 64.1% and 64.7%, respectively, to our Band segment net sales; percussion instruments contributed approximately 20.5% and 21.3%, respectively; strings, accessories, and others contributed approximately 15.4% and 14.0%, respectively. In the six months ended June 30, 2022 and 2021, brass and woodwind instruments contributed approximately 62.2% and 65.6%, respectively, to our Band segment net sales; percussion instruments contributed approximately 21.3% and 21.0%, respectively; strings, accessories, and others contributed approximately 16.5% and 13.4%, respectively.
Our band instrument sales are influenced by trends in school enrollment, school budgeting and the prevalence and popularity of extracurricular music education. Over 50% and 45% of Conn-Selmer net sales in fiscal years 2021 and 2020, respectively, and over 49% and 55% of Conn-Selmer net sales in the six months ended June 30, 2022 and 2021, respectively, were generated through our preferred dealer network to schools and families who participate in beginning music education programs. Of the remaining sales, many are used by students in marching bands, concert bands, orchestras and other school-related performances. Due to the suspension of in-person schooling and extra-curricular activities for a significant part of fiscal year 2020 due to COVID-19, our Band segment net sales decreased significantly in fiscal year 2020 from historical levels, but recovered significantly in fiscal year 2021 as schools and concert halls re-opened.
Our Band segment is primarily a domestic business. For fiscal years 2021 and 2020, 95.5% and 97.0%, respectively, of our Band segment net sales were generated in the United States, 2.0% and 1.7%, respectively, were generated in EMEA and 2.5% and 1.3%, respectively, were generated in APAC. For the six months ended June 30, 2022 and 2021, 94.7% and 95.9%, respectively, of our Band segment net sales were generated in the United States, 2.6% and 1.7%, respectively, were generated in EMEA and 2.7% and 2.4%, respectively, were generated in APAC.
Gross Profit and Gross Margin
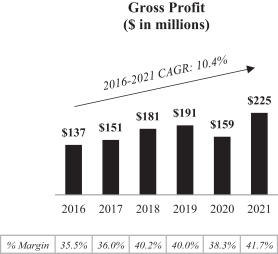
Our operating results are impacted by our ability to convert net sales into higher gross profit, which we monitor using the metric gross margin. Gross margin measures gross profit as a percentage of net sales. We define gross profit as net sales less cost of sales. Our cost of sales is largely variable, enabling us to align costs to production levels and to maintain consistent gross margins.
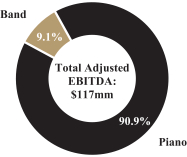
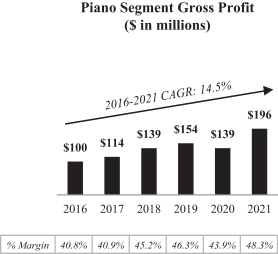
In fiscal year 2021, we generated $224.6 million of gross profit, of which $196.5 million, or 87.5%, was attributable to the Piano segment and $28.1 million, or 12.5%, was attributable to the Band segment. This translated to a consolidated gross margin of 41.7%, Piano segment gross margin of 48.3% and Band segment gross margin of 21.4%.
In fiscal year 2020, we generated $159.2 million of gross profit, of which $139.3 million, or 87.5%, was attributable to the Piano segment and $19.8 million, or 12.5%, was attributable to the Band segment. This translated to a consolidated gross margin of 38.3%, Piano segment gross margin of 43.9% and Band segment gross margin of 20.2%.
In the six months ended June 30, 2022, we generated $102.8 million of gross profit, of which $88.2 million, or 85.8%, was attributable to the Piano segment and $14.6 million, or 14.2%, was attributable to the Band segment. This translated to a consolidated gross margin of 40.5%, Piano segment gross margin of 48.7% and Band segment gross margin of 20.1%.
98


