| FREE WRITING PROSPECTUS | ||
| FILED PURSUANT TO RULE 433 | ||
| REGISTRATION FILE NO.: 333-258342-01 | ||
JANUARY 21, 2022 | |||||||
BENCHMARK 2022-B32 Commercial Mortgage Trust | |||||||
Free Writing Prospectus Structural and Collateral Term Sheet
$1,774,834,674 (Approximate Mortgage Pool Balance)
$1,246,160,000 (Approximate Offered Certificates)
| |||||||
J.P. Morgan Chase Commercial Mortgage Depositor | |||||||
Commercial Mortgage Pass-Through Certificates Series 2022-B32
| |||||||
JPMorgan Chase Bank, National Association
Citi Real Estate Funding Inc.
Goldman Sachs Mortgage Company
German American Capital Corporation | |||||||
| As Sponsors and Mortgage Loan Sellers | |||||||
| J.P. Morgan | Goldman Sachs & Co. LLC | Deutsche Bank Securities | Citigroup | ||||
Co-Lead Managers and Joint Bookrunners
| |||||||
| Academy Securities | Drexel Hamilton | ||||||
Co-Managers | |||||||
| January 21, 2022 | BENCHMARK 2022-B32 |
This material is for your information, and none of J.P. Morgan Securities LLC (“JPMS”), Citigroup Global Markets Inc. (“CGMI”), Goldman Sachs & Co. LLC (“GS”), Deutsche Bank Securities Inc. (“DBSI”), Drexel Hamilton, LLC (“Drexel”) or Academy Securities, Inc. (“Academy Securities”) (each individually, an “Underwriter”, and together, the ‘‘Underwriters’’) are soliciting any action based upon it. This material is not to be construed as an offer to sell or the solicitation of any offer to buy any security in any jurisdiction where such an offer or solicitation would be illegal.
The Depositor has filed a registration statement (including a prospectus) with the SEC (SEC File no. 333-258342) for the offering to which this free writing prospectus relates. Before you invest, you should read the prospectus in the registration statement and other documents the Depositor has filed with the SEC for more complete information about the Depositor, the issuing entity and this offering. You may get these documents for free by visiting EDGAR on the SEC Website at www.sec.gov. Alternatively, the Depositor or any Underwriter or any dealer participating in the offering will arrange to send you the prospectus if you request it by calling (800) 408-1016 or by emailing the ABS Syndicate Desk at abs_synd@jpmorgan.com. Neither this document nor anything contained in this document shall form the basis for any contract or commitment whatsoever. The information contained in this document is preliminary as of the date of this document, supersedes any previous such information delivered to you and will be superseded by any such information subsequently delivered prior to the time of sale. These materials are subject to change, completion or amendment from time to time.
This document has been prepared by the Underwriters for information purposes only and does not constitute, in whole or in part, a prospectus for the purposes of Regulation (EU) 2017/1129 (as amended), such Regulation as it forms part of the domestic law of the United Kingdom and/or Part VI of the Financial Services and Markets Act 2000 (as amended); and does not constitute an offering document for any other purpose.
The attached information contains certain tables and other statistical analyses (the “Computational Materials”) that have been prepared in reliance upon information furnished by the Mortgage Loan Sellers. Numerous assumptions were used in preparing the Computational Materials, which may or may not be reflected in this document. The Computational Materials should not be construed as either projections or predictions or as legal, tax, financial or accounting advice. You should consult your own counsel, accountant and other advisors as to the legal, tax, business, financial and related aspects of a purchase of these certificates. Any weighted average lives, yields and principal payment periods shown in the Computational Materials are based on prepayment and/or loss assumptions, and changes in such prepayment and/or loss assumptions may dramatically affect such weighted average lives, yields and principal payment periods. In addition, it is possible that prepayments or losses on the underlying assets will occur at rates higher or lower than the rates shown in the Computational Materials. The specific characteristics of the certificates may differ from those shown in the Computational Materials due to differences between the final underlying assets and the preliminary underlying assets used in preparing the Computational Materials. The principal amount and designation of any certificate described in the Computational Materials are subject to change prior to issuance. None of the Underwriters nor any of their respective affiliates make any representation or warranty as to the actual rate or timing of payments or losses on any of the underlying assets or the payments or yield on the certificates.
This information is based upon management forecasts and reflects prevailing conditions and management’s views as of this date, all of which are subject to change.
This document contains forward-looking statements. Those statements are subject to certain risks and uncertainties that could cause the success of collections and the actual cash flow generated to differ materially from the information set forth in this document. While such information reflects projections prepared in good faith based upon methods and data that are believed to be reasonable and accurate as of their dates, the Depositor undertakes no obligation to revise these forward-looking statements to reflect subsequent events or circumstances. Investors should not place undue reliance on forward-looking statements and are advised to make their own independent analysis and determination with respect to the forecasted periods, which reflect the Depositor’s view only as of the date of this document.
J.P. Morgan is the marketing name for the investment banking businesses of JPMorgan Chase & Co. and its subsidiaries worldwide. Securities, syndicated loan arranging, financial advisory and other investment banking activities are performed by JPMS and its securities affiliates, and lending, derivatives and other commercial banking activities are performed by JPMorgan Chase Bank, National Association and its banking affiliates. JPMS is a member of SIPC and the NYSE. Securities and investment banking activities in the United States are performed by Deutsche Bank Securities Inc., a member of NYSE, FINRA and SIPC, and its broker-dealer affiliates. Lending and other commercial banking activities in the United States are performed by Deutsche Bank AG, acting through its New York Branch.
Capitalized terms used in this material but not defined herein shall have the meanings ascribed to them in the Preliminary Prospectus (as defined below).
THE CERTIFICATES REFERRED TO IN THESE MATERIALS ARE SUBJECT TO MODIFICATION OR REVISION (INCLUDING THE POSSIBILITY THAT ONE OR MORE CLASSES OF CERTIFICATES MAY BE SPLIT, COMBINED OR ELIMINATED AT ANY TIME PRIOR TO ISSUANCE OR AVAILABILITY OF A FINAL PROSPECTUS) AND ARE OFFERED ON A “WHEN, AS AND IF ISSUED” BASIS.
THE UNDERWRITERS MAY FROM TIME TO TIME PERFORM INVESTMENT BANKING SERVICES FOR, OR SOLICIT INVESTMENT BANKING BUSINESS FROM, ANY COMPANY NAMED IN THESE MATERIALS. THE UNDERWRITERS AND/OR THEIR AFFILIATES OR RESPECTIVE EMPLOYEES MAY FROM TIME TO TIME HAVE A LONG OR SHORT POSITION IN ANY CERTIFICATE OR CONTRACT DISCUSSED IN THESE MATERIALS.
THE INFORMATION IN THIS STRUCTURAL AND COLLATERAL TERM SHEET IS NOT COMPLETE AND MAY BE AMENDED PRIOR TO THE TIME OF SALE. THIS TERM SHEET IS NOT AN OFFER TO SELL THESE SECURITIES AND IT IS NOT A SOLICITATION OF AN OFFER TO BUY THESE SECURITIES IN ANY JURISDICTION WHERE THE OFFER OR SALE IS NOT PERMITTED.
2 of 158
| Structural and Collateral Term Sheet | Benchmark 2022-B32 | |
| Indicative Capital Structure | ||
Publicly Offered Certificates
| Class | Expected Ratings (Moody’s / Fitch / KBRA) | Approximate Initial Certificate Balance or Notional Amount(1) | Approximate Initial Credit Support(2) | Expected Weighted Avg. Life (years)(3) | Expected Principal Window(3) | Certificate Principal to Value Ratio(4) | Underwritten NOI Debt Yield(5) |
| A-1 | Aaa(sf) / AAAsf / AAA(sf) | $6,410,000 | 30.000% | 2.80 | 3/2022 – 11/2026 | 39.1% | 16.3% |
| A-2 | Aaa(sf) / AAAsf / AAA(sf) | $162,053,000 | 30.000% | 4.89 | 11/2026 – 1/2027 | 39.1% | 16.3% |
| A-3 | Aaa(sf) / AAAsf / AAA(sf) | $253,574,000 | 30.000% | 6.92 | 12/2028 – 2/2029 | 39.1% | 16.3% |
| A-4 | Aaa(sf) / AAAsf / AAA(sf) | (6) | 30.000% | (6) | (6) | 39.1% | 16.3% |
| A-5 | Aaa(sf) / AAAsf / AAA(sf) | (6) | 30.000% | (6) | (6) | 39.1% | 16.3% |
| A-SB | Aaa(sf) / AAAsf / AAA(sf) | $18,046,000 | 30.000% | 7.42 | 1/2027 – 11/2031 | 39.1% | 16.3% |
| X-A | Aa1(sf) / AAAsf / AAA(sf) | $1,359,412,000(7) | N/A | N/A | N/A | N/A | N/A |
| X-B | NR / A-sf / AAA(sf) | $151,748,000 (7) | N/A | N/A | N/A | N/A | N/A |
| A-S | Aa2(sf) / AAAsf / AAA(sf) | $179,147,000 | 19.375% | 9.91 | 1/2032 – 1/2032 | 45.1% | 14.1% |
| B | NR / AA-sf / AA-(sf) | $82,197,000 | 14.500% | 9.91 | 1/2032 – 1/2032 | 47.8% | 13.3% |
| C | NR / A-sf / A-(sf) | $69,551,000 | 10.375% | 9.91 | 1/2032 – 1/2032 | 50.1% | 12.7% |
Privately Offered Certificates(8)
| Class | Expected Ratings (Moody’s / Fitch / KBRA) | Approximate Initial Certificate Balance or Notional Amount(1) | Approximate Initial Credit Support(2) | Expected Weighted Avg. Life (years)(3) | Expected Principal Window(3) | Certificate Principal to Value Ratio(4) | Underwritten NOI Debt Yield(5) |
| A-2A1 | Aaa(sf) / AAAsf / AAA(sf) | $265,000,000 | 30.000% | 4.89 | 11/2026 – 1/2027 | 39.1% | 16.3% |
| X-D | NR / BBB-sf / BBB-(sf) | $65,336,000(7) | N/A | N/A | N/A | N/A | N/A |
| X-FG | NR / BB-sf / BB-(sf) | $37,937,000(7) | N/A | N/A | N/A | N/A | N/A |
| X-H | NR / B-sf / B-(sf) | $16,861,000(7) | N/A | N/A | N/A | N/A | N/A |
| X-NR | NR / NR / NR | $54,798,940(7) | N/A | N/A | N/A | N/A | N/A |
| D | NR / BBBsf / BBB(sf) | $44,260,000 | 7.750% | 9.91 | 1/2032 – 1/2032 | 51.6% | 12.4% |
| E | NR / BBB-sf / BBB-(sf) | $21,076,000 | 6.500% | 9.91 | 1/2032 – 1/2032 | 52.3% | 12.2% |
| F | NR / BB+sf / BB+(sf) | $18,969,000 | 5.375% | 9.91 | 1/2032 – 1/2032 | 52.9% | 12.0% |
| G | NR / BB-sf / BB-(sf) | $18,968,000 | 4.250% | 9.91 | 1/2032 – 1/2032 | 53.5% | 11.9% |
| H | NR / B-sf / B-(sf) | $16,861,000 | 3.250% | 9.91 | 1/2032 – 1/2032 | 54.1% | 11.8% |
| J | NR / NR / NR | $16,861,000 | 2.250% | 9.91 | 1/2032 – 1/2032 | 54.6% | 11.7% |
| K | NR / NR / NR | $37,937,940 | 0.000% | 9.93 | 1/2032 – 2/2032 | 55.9% | 11.4% |
Non-Offered Vertical Risk Retention Interest(8)
| Non-Offered Vertical Risk Retention Interest | Expected Ratings (Moody’s / Fitch / KBRA) | Approximate Initial VRR Interest Balance (1) | Approximate Initial Credit Support(2) | Expected Weighted Avg. Life (years)(3)(9) | Expected Principal Window(3)(9) | Certificate Principal to Value Ratio(4) | Underwritten NOI Debt Yield(5) |
| Class RR Certificates(10)(11) | NR / NR / NR | $37,252,097 | N/A | 8.10 | 3/2022 – 2/2032 | N/A | N/A |
| RR Interest(10)(11) | NR / NR / NR | $51,489,637 | N/A | 8.10 | 3/2022 – 2/2032 | N/A | N/A |
| (1) | In the case of each such Class or the RR Interest, subject to a permitted variance of plus or minus 5%. The VRR interest balance of the VRR Interest is not included in the certificate balance or notional amount of any class of certificates set forth under “Publicly Offered Certificates” or “Privately Offered Certificates in the table above, and the VRR Interest is not offered by this Term Sheet. In addition, the notional amounts of the Class X-A, Class X-B, Class X-D, Class X-FG, Class X-H and Class X-NR Certificates may vary depending upon the final pricing of the Classes of Principal Balance Certificates whose Certificate Balances comprise such notional amounts, and, if as a result of such pricing the pass-through rate of any Class of the Class X-A, Class X-B, Class X-D, Class X-FG, Class X-H or Class X-NR Certificates, as applicable, would be equal to zero at all times, such Class of Certificates will not be issued on the closing date of this securitization. |
| (2) | The approximate initial credit support percentages set forth for the certificates are approximate and for the Class A-1, Class A-2, Class A-2A1, Class A-3, Class A-4, Class A-5 and Class A-SB Certificates are represented in the aggregate. The VRR interest provides credit support only to the limited extent that it is allocated a portion of any losses incurred on the mortgage loans which such losses are allocated between it on the one hand, and the non-VRR certificates (other than the Class X-A, Class X-B, Class X-D, Class X-FG, Class X-H and Class X-NR Certificates) on the other hand, pro rata in accordance with their respective percentage allocation entitlement. See “Description of the Certificates” in the Preliminary Prospectus. |
| (3) | Assumes 0% CPR / 0% CDR and February 16, 2022 closing date. Based on modeling assumptions as described in the Preliminary Prospectus dated January 21, 2022 (the “Preliminary Prospectus”). |
| (4) | The “Certificate Principal to Value Ratio” for any Class of Principal Balance Certificates (other than the Class A-1, Class A-2, Class A-2A1, Class A-3, Class A-4, Class A-5 and Class A-SB Certificates) is calculated as the product of (a) the weighted average Cut-off Date LTV for the mortgage loans, and (b) a fraction, the numerator of which is the total initial Certificate Balance of such Class of Certificates and all Classes of Principal Balance Certificates senior to such Class of Certificates and the denominator of which is the total initial Certificate Balance of all of the Classes of Principal Balance Certificates. The Class A-1, Class A-2, Class A-2A1, Class A-3, Class A-4, Class A-5 and Class A-SB Certificate Principal to Value Ratios are calculated in the aggregate for those Classes as if they were a single class. Investors should note, however, that excess mortgaged property value associated with a mortgage loan will not be available to offset losses on any other mortgage loan. |
| (5) | The “Underwritten NOI Debt Yield” for any Class of Principal Balance Certificates (other than the Class A-1, Class A-2, Class A-2A1, Class A-3, Class A-4, Class A-5 and Class A-SB Certificates) is calculated as the product of (a) the weighted average UW NOI DY for the mortgage loans and (b) a fraction, the numerator of which is the total initial Certificate Balance of all of the Classes of Principal Balance Certificates and the denominator of which is the total initial Certificate Balance for such Class and all |
THE INFORMATION IN THIS STRUCTURAL AND COLLATERAL TERM SHEET IS NOT COMPLETE AND MAY BE AMENDED PRIOR TO THE TIME OF SALE. THIS TERM SHEET IS NOT AN OFFER TO SELL THESE SECURITIES AND IT IS NOT A SOLICITATION OF AN OFFER TO BUY THESE SECURITIES IN ANY JURISDICTION WHERE THE OFFER OR SALE IS NOT PERMITTED.
3 of 158
| Structural and Collateral Term Sheet | Benchmark 2022-B32 | |
| Indicative Capital Structure | ||
| Classes of Principal Balance Certificates senior to such Class of Certificates. The Underwritten NOI Debt Yield for each of the Class A-1, Class A-2, Class A-2A1, Class A-3, Class A-4, Class A-5 and Class A-SB Certificates is calculated in the aggregate for those Classes as if they were a single Class. Investors should note, however, that net operating income from any mortgaged property supports only the related mortgage loan and will not be available to support any other mortgage loan. |
| (6) | The exact initial certificate balances of the Class A-4 and Class A-5 certificates are unknown and will be determined based on the final pricing of those classes of certificates. However, the respective initial certificate balances, weighted average lives and principal windows of the Class A-4 and Class A-5 certificates are expected to be within the applicable ranges reflected in the following chart. The aggregate initial certificate balance of the Class A-4 and Class A-5 certificates is expected to be approximately $475,182,000, subject to a variance of plus or minus 5%. |
| Class of Certificates | Expected Range of Initial Certificate Balance | Expected Range of Weighted Avg. Life (years) | Expected Range of Principal Window |
| A-4 | $0 – $225,000,000 | NAP – 9.61 | NAP / 1/2030 – 12/2031 |
| A-5 | $250,182,000 – $475,182,000 | 9.77 – 9.91 | 1/2030 – 1/2032 / 12/2031 – 1/2032 |
| (7) | The Class X-A, Class X-B, Class X-D, Class X-FG, Class X-H and Class X-NR Notional Amounts are defined in the Preliminary Prospectus. |
| (8) | The Classes of Certificates set forth under “Privately Offered Certificates”, “Non-Offered Vertical Risk Retention Interest” in the tables above are not being offered by the Preliminary Prospectus or this Term Sheet. The Class S and Class R Certificates are not shown above. |
| (9) | The expected weighted average life and expected principal window during which distributions of principal would be received as set forth in the foregoing table with respect to the VRR Interest are based on the assumptions set forth under “Yield and Maturity Considerations—Weighted Average Life” in the Preliminary Prospectus and on the assumptions that there are no prepayments, modifications or losses in respect of the mortgage loans and that there are no extensions or forbearances of maturity dates or anticipated repayment dates of the mortgage loans. |
| (10) | JPMorgan Chase Bank, National Association, as the retaining sponsor for this securitization is expected to acquire from the depositor, on the Closing Date, an “eligible vertical interest” (as defined in Regulation RR) comprised of the Class RR Certificates and the RR Interest (collectively, the “VRR Interest”), which is expected to represent approximately 5.00% of all Principal Balance Certificates and the VRR Interest. Portions of the VRR Interest will be acquired by each of Citi Real Estate Funding Inc., DBR Investments Co. Limited (or its "majority-owned affiliate") and Goldman Sachs Bank USA (or its "majority-owned affiliate") (together with JPMorgan Chase Bank, National Association in such capacity, the “VRR Interest Owners”) in accordance with the U.S. credit risk retention rules applicable to this securitization transaction. See “Credit Risk Retention” in the Preliminary Prospectus. |
| (11) | Although it does not have a specified pass-through rate (other than for tax reporting purposes), the effective interest rate for the VRR Interest will be the WAC rate. |
THE INFORMATION IN THIS STRUCTURAL AND COLLATERAL TERM SHEET IS NOT COMPLETE AND MAY BE AMENDED PRIOR TO THE TIME OF SALE. THIS TERM SHEET IS NOT AN OFFER TO SELL THESE SECURITIES AND IT IS NOT A SOLICITATION OF AN OFFER TO BUY THESE SECURITIES IN ANY JURISDICTION WHERE THE OFFER OR SALE IS NOT PERMITTED.
4 of 158
| Structural and Collateral Term Sheet | Benchmark 2022-B32 | |
| Indicative Capital Structure | ||
| Securities Offered: | $1,246,160,000 monthly pay, multi-class, commercial mortgage REMIC Pass-Through Certificates. |
| Co-Lead Managers and Joint Bookrunners: | J.P. Morgan Securities LLC, Citigroup Global Markets Inc., Goldman Sachs & Co. LLC and Deutsche Bank Securities Inc. |
| Co-Managers: | Drexel Hamilton, LLC and Academy Securities, Inc. |
| Mortgage Loan Sellers: | Citi Real Estate Funding Inc. (“CREFI”) (35.6%), Goldman Sachs Mortgage Company (“GSMC”) (24.3%), German American Capital Corporation (“GACC”) (22.0%), and JPMorgan Chase Bank, National Association (“JPMCB”) (18.1%). |
| Master Servicer: | Midland Loan Services, a Division of PNC Bank, National Association. |
| Special Servicer: | KeyBank National Association. |
| Directing Certificateholder: | Ellington Management Group, LLC. |
| Trustee: | Wilmington Trust, N.A. |
| Certificate Administrator: | Computershare Trust Company, N.A. |
| Operating Advisor: | Pentalpha Surveillance LLC. |
| Asset Representations Reviewer: | Pentalpha Surveillance LLC. |
| Rating Agencies: | Moody’s Investors Service, Inc. (“Moody’s”), Fitch Ratings, Inc. (“Fitch”) and Kroll Bond Rating Agency, LLC (“KBRA”). |
| U.S. Credit Risk Retention: | JPMCB is expected to act as the “retaining sponsor” for this securitization and intends to satisfy the U.S. credit risk retention requirement by acquiring (either through itself or through one or more of its “majority owned affiliates” (as defined in Regulation RR)) from the depositor, on the Closing Date, an “eligible vertical interest” which will be comprised of the VRR Interest and portions of which will be transferred by JPMCB to each of CREFI, DBRI (or its “majority-owned affiliate”) and GSBI (or its “majority-owned affiliate”).
The restrictions on hedging and transfer under the U.S. credit risk retention rules as in effect on the closing date of this transaction will expire on and after the date that is the latest of (i) the date on which the aggregate principal balance of the mortgage loans has been reduced to 33% of the aggregate principal balance of the mortgage loans as of the Cut-off Date; (ii) the date on which the total unpaid principal obligations under the Certificates has been reduced to 33% of the aggregate total unpaid principal obligations under the Certificates as of the Closing Date; or (iii) two years after the Closing Date.
Notwithstanding any references in this term sheet to the credit risk retention rules, Regulation RR, the retaining sponsor and other risk retention related matters, in the event the credit risk retention rules and/or Regulation RR (or any relevant portion thereof) are repealed or determined by applicable regulatory agencies to be no longer applicable to this securitization transaction, none of the retaining sponsor or any other party will be required to comply with or act in accordance with the U.S. credit risk retention rules and/or Regulation RR (or such relevant portion thereof).
For additional information, see “Credit Risk Retention” in the Preliminary Prospectus. |
| EU/UK Credit Risk Retention: | The transaction is not structured to satisfy any requirements in effect in the European Union or the United Kingdom as regards risk retention, transparency/reporting and due diligence. |
| Pricing Date: | On or about January 27, 2022. |
| Closing Date: | On or about February 16, 2022. |
| Cut-off Date: | With respect to each mortgage loan, the related due date in February 2022 or with respect to any mortgage loan that has its first due date after February 2022, the date that would otherwise have been the related due date in February 2022. |
| Distribution Date: | The 4th business day after the Determination Date in each month, commencing in March 2022. |
| Determination Date: | 11th day of each month, or if the 11th day is not a business day, the next succeeding business day, commencing in March 2022. |
| Assumed Final Distribution Date: | The Distribution Date in February 2032, which is the latest anticipated repayment date of the Certificates. |
| Rated Final Distribution Date: | The Distribution Date in January 2055. |
| Tax Treatment: | The Publicly Offered Certificates are expected to be treated as REMIC “regular interests” for U.S. federal income tax purposes. |
THE INFORMATION IN THIS STRUCTURAL AND COLLATERAL TERM SHEET IS NOT COMPLETE AND MAY BE AMENDED PRIOR TO THE TIME OF SALE. THIS TERM SHEET IS NOT AN OFFER TO SELL THESE SECURITIES AND IT IS NOT A SOLICITATION OF AN OFFER TO BUY THESE SECURITIES IN ANY JURISDICTION WHERE THE OFFER OR SALE IS NOT PERMITTED.
5 of 158
| Structural and Collateral Term Sheet | Benchmark 2022-B32 | |
| Indicative Capital Structure | ||
| Form of Offering: | The Class A-1, Class A-2, Class A-3, Class A-4, Class A-5, Class A-SB, Class X-A, Class X-B, Class A-S, Class B and Class C Certificates (the “Publicly Offered Certificates”) will be offered publicly. The Class A-2A1, Class X-D, Class X-FG, Class X-H, Class X-NR, Class D, Class E, Class F, Class G, Class H, Class J, Class K, Class S and Class R Certificates (the “Privately Offered Certificates”) will be offered domestically to Qualified Institutional Buyers and to Institutional Accredited Investors (other than the Class R Certificates) and to institutions that are not U.S. Persons pursuant to Regulation S. |
| SMMEA Status: | The Publicly Offered Certificates will not constitute “mortgage related securities” for purposes of SMMEA. |
| ERISA: | The Publicly Offered Certificates are expected to be ERISA eligible. |
| Optional Termination: | On any Distribution Date on which the aggregate principal balance of the pool of mortgage loans is less than 1% of the aggregate principal balance of the mortgage loans as of the Cut-off Date (solely for the purposes of this calculation, if a mortgage loan with an anticipated repayment date is still an asset of the issuing entity and such right is being exercised after its respective anticipated repayment date, then such mortgage loan will be excluded from the then-aggregate stated principal balance of the pool of mortgage loans and from the initial pool balance), certain entities specified in the Preliminary Prospectus will have the option to purchase all of the remaining mortgage loans (and all property acquired through exercise of remedies in respect of any mortgage loan) at the price specified in the Preliminary Prospectus. Refer to “Pooling and Servicing Agreement—Termination; Retirement of Certificates” in the Preliminary Prospectus. |
| Minimum Denominations: | The Publicly Offered Certificates (other than the Class X-A and Class X-B Certificates) will be issued in minimum denominations of $10,000 and integral multiples of $1 in excess of $10,000. The Class X-A and Class X-B Certificates will be issued in minimum denominations of $1,000,000 and in integral multiples of $1 in excess of $1,000,000. |
| Settlement Terms: | DTC, Euroclear and Clearstream Banking. |
| Analytics: | The transaction is expected to be modeled by Intex Solutions, Inc. and Trepp, LLC and is expected to be available on Bloomberg L.P., Blackrock Financial Management, Inc., Interactive Data Corporation, CMBS.com, Inc., Markit Group Limited, Moody’s Analytics, MBS Data, LLC, RealINSIGHT, KBRA Analytics, LLC, Thomson Reuters Corporation and DealView Technologies Ltd. |
| Risk Factors: | THE CERTIFICATES INVOLVE CERTAIN RISKS AND MAY NOT BE SUITABLE FOR ALL INVESTORS. REFER TO “RISK FACTORS” IN THE PRELIMINARY PROSPECTUS. |
THE INFORMATION IN THIS STRUCTURAL AND COLLATERAL TERM SHEET IS NOT COMPLETE AND MAY BE AMENDED PRIOR TO THE TIME OF SALE. THIS TERM SHEET IS NOT AN OFFER TO SELL THESE SECURITIES AND IT IS NOT A SOLICITATION OF AN OFFER TO BUY THESE SECURITIES IN ANY JURISDICTION WHERE THE OFFER OR SALE IS NOT PERMITTED.
6 of 158
| Structural and Collateral Term Sheet | Benchmark 2022-B32 | |
| Collateral Characteristics | ||
| Loan Pool | ||
| Initial Pool Balance (“IPB”): | $1,774,834,674 | |
| Number of Mortgage Loans: | 47 | |
| Number of Mortgaged Properties: | 171 | |
| Average Cut-off Date Balance per Mortgage Loan: | $37,762,440 | |
| Weighted Average Current Mortgage Rate: | 3.53779% | |
| 10 Largest Mortgage Loans as % of IPB: | 51.7% | |
| Weighted Average Remaining Term to Maturity(1): | 98 months | |
| Weighted Average Seasoning: | 1 month | |
| Credit Statistics | ||
| Weighted Average UW NCF DSCR(2): | 2.98x | |
| Weighted Average UW NOI DY(2): | 11.4% | |
| Weighted Average Cut-off Date Loan-to-Value Ratio (“LTV”)(2)(3): | 55.9% | |
| Weighted Average Maturity Date LTV(1)(2)(3): | 54.9% | |
| Other Statistics | ||
| % of Mortgage Loans with Additional Debt(4): | 19.9% | |
| % of Mortgaged Properties with Single Tenants: | 31.8% | |
| Amortization | ||
| Weighted Average Original Amortization Term(5): | 360 months | |
| Weighted Average Remaining Amortization Term(5): | 360 months | |
| % of Mortgage Loans with Interest-Only: | 74.1% | |
| % of Mortgage Loans with Interest Only-ARD: | 14.1% | |
| % of Mortgage Loans with Partial Interest-Only followed by Amortizing Balloon: | 8.2% | |
| % of Mortgage Loans with Amortizing Balloon: | 3.5% | |
| Lockbox / Cash Management(6) | ||
| % of Mortgage Loans with In-Place, Hard Lockboxes: | 67.3% | |
| % of Mortgage Loans with Springing Lockboxes: | 20.6% | |
| % of Mortgage Loans with Springing (Residential) / Hard (Commercial) Lockboxes: | 7.0% | |
| % of Mortgage Loans with In-Place, Soft Lockboxes: | 4.7% | |
| % of Mortgage Loans with Soft (Residential) / Hard (Commercial) Lockboxes: | 0.5% | |
| % of Mortgage Loans with Springing Cash Management: | 91.7% | |
| % of Mortgage Loans with In-Place Cash Management: | 8.3% | |
| Reserves | ||
| % of Mortgage Loans Requiring Monthly Tax Reserves: | 66.9% | |
| % of Mortgage Loans Requiring Monthly Insurance Reserves: | 37.2% | |
| % of Mortgage Loans Requiring Monthly CapEx Reserves(7): | 55.8% | |
| % of Mortgage Loans Requiring Monthly TI/LC Reserves(8): | 30.1% | |
| (1) | In the case of Loan Nos. 4, 5 and 12, each with an anticipated repayment date, Remaining Term to Maturity and Maturity Date LTV are calculated as of the related anticipated repayment date. |
| (2) | In the case of Loan Nos . 1, 2, 4, 5, 7, 8, 10, 11, 12, 13, 17, 19, 20, 21, 23, 25, 27 and 28, UW NCF DSCR, UW NOI DY, Cut-off Date LTV and Maturity Date LTV calculations include the related Pari Passu Companion Loan(s). In the case of Loan Nos. 1, 4, 10, 18 and 23, UW NCF DSCR, UW NOI DY, Cut-off Date LTV and Maturity Date LTV calculations exclude the related Subordinate Companion Loan(s), related mezzanine loan(s) and/or related additional secured subordinate debt. |
| (3) | In the case of Loan Nos. 1, 3, 4, 8 and 22, Cut-off Date LTV and the Maturity Date LTV are calculated by using an appraised value based on certain hypothetical assumptions. Refer to “Description of the Mortgage Pool—Assessments of Property Value and Condition” and “—Appraised Value” in the Preliminary Prospectus for additional details. |
| (4) | Excludes Loan No. 8 with respect to an exchange transaction note in connection with, and to partially fund, the acquisition of the related Mortgaged Property. For a more detailed description, refer to “Description of the Mortgage Pool—Certain Terms of the Mortgage Loans—Additional Indebtedness” in the Preliminary Prospectus. |
| (5) | Excludes 38 mortgage loans that are interest-only for the entire term. |
| (6) | For a more detailed description of Lockbox / Cash Management, refer to “Description of the Mortgage Pool—Certain Terms of the Mortgage Loans—Mortgaged Property Accounts” in the Preliminary Prospectus. |
| (7) | CapEx Reserves include FF&E reserves for hotel properties. |
| (8) | Calculated only with respect to the Cut-off Date Balance of mortgage loans secured or partially secured by retail, office, industrial and mixed use properties. |
THE INFORMATION IN THIS STRUCTURAL AND COLLATERAL TERM SHEET IS NOT COMPLETE AND MAY BE AMENDED PRIOR TO THE TIME OF SALE. THIS TERM SHEET IS NOT AN OFFER TO SELL THESE SECURITIES AND IT IS NOT A SOLICITATION OF AN OFFER TO BUY THESE SECURITIES IN ANY JURISDICTION WHERE THE OFFER OR SALE IS NOT PERMITTED.
7 of 158
| Structural and Collateral Term Sheet | Benchmark 2022-B32 | |
| Collateral Characteristics | ||
Mortgage Loan Seller | Number of | Number of | Aggregate | % of IPB |
| CREFI(1) | 24 | 72 | $620,477,473 | 35.0% |
| GSMC(1)(2) | 11 | 18 | 431,702,201 | 24.3_ |
| GACC(1)(3) | 6 | 60 | 377,275,000 | 21.3_ |
| JPMCB(1) | 5 | 20 | 320,380,000 | 18.1_ |
| GACC / CREFI(1)(4) | 1 | 1 | 25,000,000 | 1.4_ |
| Total | 47 | 171 | $1,774,834,674 | 100.0% |
| (1) | In the case of Loan No. 2, the whole loan was co-originated by JPMCB and Starwood Mortgage Capital LLC. In the case of Loan No. 4, the whole loan was co-originated by DBR Investments Co. Limited (“DBRI”), JPMCB, Bank of America, N.A. (“BANA”), and 3650 Cal Bridge Lending, LLC. In the case of Loan No. 10, the whole loan was co-originated by Goldman Sachs Bank USA (“GSBI”) and Barclays Capital Real Estate Inc. (“BCREI”). In the case of Loan No. 11, the whole loan was co-originated by CREFI and BCREI. In the case of Loan No. 23, the whole loan was co-originated by DBRI, Morgan Stanley Bank, N.A (“MSBNA”), CREFI and Wells Fargo Bank, National Association (“WFBNA”). |
| (2) | Each mortgage loan being sold by Goldman Sachs Mortgage Company (“GSMC”) was originated or co-originated by GSBI, an affiliate of GSMC, and will be transferred to GSMC on or prior to the Closing Date. |
| (3) | Each mortgage loan being sold by German American Capital Corporation (“GACC”) was originated or co-originated by DBRI, an affiliate of GACC, and will be transferred to GACC on or prior to the Closing Date. |
| (4) | In the case of Loan No. 23, the whole loan was co-originated by DBRI, MSBNA, CREFI and WFBNA. Loan No. 23 is evidenced by two promissory notes: (i) Note A-2-C2-2 with a principal balance of $12,800,000 as of the Cut-off Date, as to which GACC is acting as mortgage loan seller, and (ii) Note A-4-C2-2, with a principal balance of $12,200,000 as of the Cut-off Date, as to which CREFI is acting as mortgage loan seller. |
Ten Largest Mortgage Loans | |||||||||||
| No. | Loan Name | Mortgage Loan Seller | No. of Prop. | Cut-off Date Balance | % of IPB | SF / Units | Property Type | UW NCF DSCR(1) | UW NOI DY(1) | Cut-off Date LTV(1)(2) | Maturity Date LTV(1)(2) |
| 1 | Old Chicago Post Office | JPMCB | 1 | $125,000,000 | 7.0% | 2,331,477 | Office | 4.22x | 14.9% | 43.1% | 43.1% |
| 2 | Bedrock Portfolio | JPMCB | 14 | $125,000,000 | 7.0% | 2,694,627 | Various | 3.30x | 13.6% | 59.4% | 59.4% |
| 3 | Rosewood National Storage 13 | GACC | 13 | $108,575,000 | 6.1% | 1,564,651 | Self Storage | 3.13x | 9.8% | 59.7% | 59.7% |
| 4 | CX - 350 & 450 Water Street | GACC | 1 | $101,000,000 | 5.7% | 915,233 | Mixed Use | 3.50x | 9.9% | 41.7% | 41.7% |
| 5 | One Wilshire | GSMC | 1 | $90,000,000 | 5.1% | 661,553 | Office | 3.37x | 9.6% | 42.6% | 42.6% |
| 6 | SVEA New Mexico Portfolio | GACC | 40 | $78,550,000 | 4.4% | 652,850 | Office | 2.95x | 12.4% | 65.0% | 65.0% |
| 7 | JW Marriott Desert Springs | GSMC | 1 | $75,000,000 | 4.2% | 884 | Hospitality | 3.14x | 20.4% | 41.8% | 41.8% |
| 8 | Woodmore Towne Centre | GSMC | 1 | $75,000,000 | 4.2% | 712,091 | Retail | 2.96x | 10.4% | 59.5% | 59.5% |
| 9 | Dealertrack and Divvy | CREFI | 2 | $74,500,000 | 4.2% | 318,832 | Office | 1.96x | 9.4% | 68.0% | 68.0% |
| 10 | The Summit | GSMC | 1 | $65,000,000 | 3.7% | 907,306 | Office | 4.11x | 12.6% | 36.5% | 36.5% |
| Top 3 Total/Weighted Average | 28 | $358,575,000 | 20.2% | 3.57x | 12.9% | 53.8% | 53.8% | ||||
| Top 5 Total/Weighted Average | 30 | $549,575,000 | 31.0% | 3.52x | 11.8% | 49.7% | 49.7% | ||||
| Top 10 Total/Weighted Average | 75 | $917,625,000 | 51.7% | 3.31x | 12.3% | 51.7% | 51.7% | ||||
| (1) | In the case of Loan Nos. 1, 2, 4, 7, 8 and 10, UW NCF DSCR, UW NOI DY, Cut-off Date LTV and Maturity Date LTV calculations include the related Pari Passu Companion Loan(s). In the case of Loan Nos. 1, 4, and 10, UW NCF DSCR, UW NOI DY, Cut-off Date LTV and Maturity Date LTV calculations exclude the related Subordinate Companion Loan(s), related mezzanine loan(s) and/or related additional secured subordinate debt. |
| (2) | In the case of Loan Nos. 1, 3, 4, and 8, Cut-off Date LTV and the Maturity Date LTV are calculated by using an appraised value based on certain hypothetical assumptions. Refer to “Description of the Mortgage Pool—Assessments of Property Value and Condition” and “—Appraised Value” in the Preliminary Prospectus for additional details. |
THE INFORMATION IN THIS STRUCTURAL AND COLLATERAL TERM SHEET IS NOT COMPLETE AND MAY BE AMENDED PRIOR TO THE TIME OF SALE. THIS TERM SHEET IS NOT AN OFFER TO SELL THESE SECURITIES AND IT IS NOT A SOLICITATION OF AN OFFER TO BUY THESE SECURITIES IN ANY JURISDICTION WHERE THE OFFER OR SALE IS NOT PERMITTED.
8 of 158
| Structural and Collateral Term Sheet | Benchmark 2022-B32 | |
| Collateral Characteristics | ||
| Companion Loan Summary | ||||||||
| Loan No. | Mortgage Loan | Note(s) | Original Balance ($) | Cut-off Date Balance ($) | Holder of Note | Lead Servicer for Whole Loan (Y/N) | Master Servicer Under Lead Securitization | Special Servicer Under Lead Securitization |
| 1 | Old Chicago Post Office | A-1, A-2, A-3, A-4, A-7, B (1) | $705,000,000 | $705,000,000 | JPMCC 2022-OPO | Yes | KeyBank | KeyBank |
| A-5, A-6 | $125,000,000 | $125,000,000 | Benchmark 2022-B32 | No | ||||
| Total | $830,000,000 | $830,000,000 | ||||||
| 2 | Bedrock Portfolio | A-1-1 | $125,000,000 | $125,000,000 | Benchmark 2022-B32 | Yes | Midland | KeyBank |
| A-1-2 | $50,000,000 | $50,000,000 | JPMCB | No | ||||
| A-1-3 | $50,000,000 | $50,000,000 | JPMCB | No | ||||
| A-1-4 | $50,000,000 | $50,000,000 | JPMCB | No | ||||
| A-1-5 | $30,000,000 | $30,000,000 | JPMCB | No | ||||
| A-1-6 | $39,000,000 | $39,000,000 | JPMCB | No | ||||
| A-2-1 | $40,000,000 | $40,000,000 | SMC | No | ||||
| A-2-2 | $26,000,000 | $26,000,000 | SMC | No | ||||
| A-2-3 | $10,000,000 | $10,000,000 | SMC | No | ||||
| A-2-4 | $10,000,000 | $10,000,000 | SMC | No | ||||
| Total | $430,000,000 | $430,000,000 | ||||||
| 4 | CX – 350 & 450 Water Street | A-1-1, A-2-1, A-3-1, A-4-1, B-1(1), B-2(1), B-3(1), B-4(1) | $696,000,000 | $696,000,000 | CAMB 2021-CX2 | Yes | KeyBank | Situs |
| A-1-2, A-1-4, A-1-9, A-3-3 | $148,140,816 | $148,140,816 | Benchmark 2021-B31 | No | ||||
| A-1-3, A-3-2 | $94,000,000 | $94,000,000 | Benchmark 2021-B30 | No | ||||
| A-1-5, A-1-6, A-1-8 | $101,000,000 | $101,000,000 | Benchmark 2022-B32 | No | ||||
| A-1-7, A-4-2, A-4-3 | $77,900,000 | $77,900,000 | 3650R 2021-PF1 | No | ||||
| A-2-2 | $50,000,000 | $50,000,000 | BANK 2022-BNK39 | No | ||||
| A-2-3, A-2-4 | $55,000,000 | $55,000,000 | BANK 2021-BNK38 | No | ||||
| A-2-5 | $2,959,184 | $2,959,184 | BANK 2022-BNK39 | No | ||||
| Total | $1,225,000,000 | $1,225,000,000 | ||||||
| 5 | One Wilshire | A-1 | $90,000,000 | $90,000,000 | Benchmark 2022-B32 | Yes | Midland | KeyBank |
| A-2 | $120,000,00 | $120,000,00 | GSBI | No | ||||
| A-3 | $85,000,000 | $85,000,000 | GSBI | No | ||||
| A-4 | $94,250,000 | $94,250,000 | GSBI | No | ||||
| Total | $389,250,000 | $389,250,000 | ||||||
| 7 | JW Marriott Desert Springs | A-1 | $75,000,000 | $75,000,000 | Benchmark 2022-B32 | Yes | Midland | KeyBank |
| A-2 | $53,000,000 | $53,000,000 | GSBI | No | ||||
| Total | $128,000,000 | $128,000,000 | ||||||
| 8 | Woodmore Towne Centre | A-1 | $75,000,000 | $75,000,000 | Benchmark 2022-B32 | Yes | Midland | KeyBank |
| A-2 | $39,066,666.67 | $39,066,666.67 | GSBI | No | ||||
| A-3 | $3,133,333.33 | $3,133,333.33 | GSBI | No | ||||
| Total | $117,200,000 | $117,200,000 | ||||||
| 10 | The Summit | A-1-S, A-2-S, B-1-1(1), B-2-1(1) | $305,000,000 | $305,000,000 | SUMIT 2022-BVUE | Yes | KeyBank | KeyBank |
| A-1-1 | $50,000,000 | $50,000,000 | BCREI | No | ||||
| A-1-2 | $50,000,000 | $50,000,000 | BCREI | No | ||||
| A-1-3 | $25,000,000 | $25,000,000 | BCREI | No | ||||
| A-1-4 | $7,000,000 | $7,000,000 | BCREI | No | ||||
| A-2-1 | $65,000,000 | $65,000,000 | Benchmark 2022-B32 | No | ||||
| A-2-2 | $23,000,000 | $23,000,000 | GSBI | No | ||||
| Total | $525,000,000 | $525,000,000 | ||||||
| 11 | Moonwater Office Portfolio | A-1, A-2 | $63,000,000 | $63,000,000 | Benchmark 2022-B32 | Yes | Midland | KeyBank |
| A-3 | $35,000,000 | $35,000,000 | BCREI | |||||
| A-4 | $18,000,000 | $18,000,000 | BCREI | |||||
| Total | $116,000,000 | $116,000,000 | ||||||
| 12 | Novo Nordisk HQ | A-1 | $75,000,000 | $75,000,000 | Benchmark 2021-B31 | Yes | Midland | Rialto |
| A-2, A-3-1 | $60,000,000 | $60,000,000 | Benchmark 2022-B32 | No | ||||
| A-3-2, A-4 | $75,667,000 | $75,667,000 | DBRI | No | ||||
| Total | $210,667,000 | $210,667,000 | ||||||
| 13 | The Kirby Collection | A-1 | $55,000,000 | $55,000,000 | Benchmark 2022-B32 | Yes | Midland | KeyBank |
| A-2 | $40,661,369 | $40,661,369 | CREFI | No | ||||
| Total | $95,661,469 | $95,661,469 | ||||||
| 17 | 425 Eye Street | A-1 | $62,400,000 | $62,400,000 | GSMS 2021-GSA3 | Yes | Wells | Argentic |
| A-2 | $39,818,000 | $39,818,000 | Benchmark 2022-B32 | No | ||||
| Total | $102,218,000 | $102,218,000 | ||||||
| 19 | ExchangeRight Net Leased Portfolio #53 | A-1 | $30,000,000 | $30,000,000 | Benchmark 2022-B32 | No(2) | ||
| A-2 | $56,000,000 | $56,000,000 | CREFI | Yes | (2) | (2) | ||
| Total | $86,000,000 | $86,000,000 | ||||||
| 20 | Glen Forest Office Portfolio | A-1 | $30,000,000 | $30,000,000 | Benchmark 2022-B32 | Yes | Midland | KeyBank |
| A-2 | $29,000,000 | $29,000,000 | CREFI | No | ||||
| Total | $59,000,000 | $59,000,000 | ||||||
| 21 | Grede Casting Industrial Portfolio | A-1 | $30,000,000 | $30,000,000 | Benchmark 2022-B32 | Yes | Midland | KeyBank |
| A-2 | $18,225,000 | $18,225,000 | GSBI | No | ||||
| Total | $48,225,000 | $48,225,000 | ||||||
THE INFORMATION IN THIS STRUCTURAL AND COLLATERAL TERM SHEET IS NOT COMPLETE AND MAY BE AMENDED PRIOR TO THE TIME OF SALE. THIS TERM SHEET IS NOT AN OFFER TO SELL THESE SECURITIES AND IT IS NOT A SOLICITATION OF AN OFFER TO BUY THESE SECURITIES IN ANY JURISDICTION WHERE THE OFFER OR SALE IS NOT PERMITTED.
9 of 158
| Structural and Collateral Term Sheet | Benchmark 2022-B32 | |
| Collateral Characteristics | ||
| Loan No. | Mortgage Loan | Note(s) | Original Balance ($) | Cut-off Date Balance ($) | Holder of Note | Lead Servicer for Whole Loan (Y/N) | Master Servicer Under Lead Securitization | Special Servicer Under Lead Securitization |
| 23 | 601 Lexington Avenue | A-1-S1, A-2-S1, A-3-S1, A-4-S1, B-1(1), B-2(1), B-3(1), B-4(1) | $426,700,000 | $426,700,000 | BXP 2021-601L | Yes | Wells Fargo | Situs |
| A-1-C1 | $17,500,000 | $17,500,000 | WFNA | No | ||||
| A-1-C2 | $67,543,860 | $67,543,860 | BANK 2022-BNK39 | No | ||||
| A-1-C3 | $67,543,860 | $67,543,860 | WFNA | No | ||||
| A-1-C4 | $48,067,280 | $48,067,280 | WFNA | No | ||||
| A-2-C1 | $11,000,000 | $11,000,000 | DBRI | No | ||||
| A-2-C2-1 | $43,479,070 | $43,479,070 | DBRI | No | ||||
| A-2-C2-2, A-4-C2-2 | $25,000,000 | $25,000,000 | Benchmark 2022-B32 | No | ||||
| A-2-C3 | $56,279,070 | $56,279,070 | DBRI | No | ||||
| A-2-C4 | $2,567,860 | $2,567,860 | DBRI | No | ||||
| A-3-C1 | $11,000,000 | $11,000,000 | MSBNA | No | ||||
| A-3-C2 | $42,456,140 | $42,456,140 | BANK 2022-BNK39 | No | ||||
| A-3-C3 | $42,456,140 | $42,456,140 | MSBNA | No | ||||
| A-3-C4 | $30,213,720 | $30,213,720 | MSBNA | No | ||||
| A-4-C1 | $10,500,000 | $10,500,000 | CREFI | No | ||||
| A-4-C2-1 | $41,520,930 | $41,520,930 | CREFI | No | ||||
| A-4-C3 | $53,720,930 | $53,720,930 | CREFI | No | ||||
| A-4-C4 | $2,451,140 | $2,451,140 | CREFI | No | ||||
| Total | $1,000,000,000 | $1,000,000,000 | ||||||
| 25 | Nyberg Portfolio | A-1 | $40,000,000 | $40,000,000 | Benchmark 2021-B31 | Yes | Midland | Rialto |
| A-2 | $23,900,000 | $23,900,000 | Benchmark 2022-B32 | No | ||||
| Total | $63,900,000 | $63,900,000 | ||||||
| 27 | Sara Lee Portfolio | A-1 | $40,000,000 | $40,000,000 | Benchmark 2021-B31 | Yes | Midland | Rialto |
| A-2 | $23,150,000 | $23,150,000 | Benchmark 2022-B32 | No | ||||
| Total | $63,150,000 | $63,150,000 | ||||||
| 28 | Charcuterie Artisans SLB | A-1 | $40,000,000 | $40,000,000 | Benchmark 2021-B31 | Yes | Midland | Rialto |
| A-2 | $23,000,000 | $23,000,000 | Benchmark 2022-B32 | No | ||||
| Total | $63,000,000 | $63,000,000 |
| (1) | Each note represents a subordinate companion loan. |
| (2) | In the case of Loan No. 19, the related whole loan is expected to be serviced under the Benchmark 2022-B32 pooling and servicing agreement until such time as the related controlling note has been securitized, at which point the related whole loan will be serviced under the pooling and servicing agreement related to such securitization. |
THE INFORMATION IN THIS STRUCTURAL AND COLLATERAL TERM SHEET IS NOT COMPLETE AND MAY BE AMENDED PRIOR TO THE TIME OF SALE. THIS TERM SHEET IS NOT AN OFFER TO SELL THESE SECURITIES AND IT IS NOT A SOLICITATION OF AN OFFER TO BUY THESE SECURITIES IN ANY JURISDICTION WHERE THE OFFER OR SALE IS NOT PERMITTED.
10 of 158
| Structural and Collateral Term Sheet | Benchmark 2022-B32 | |
| Collateral Characteristics | ||
| Additional Debt Summary |
No. | Loan Name | Trust | Subordinate | Total Debt | Mortgage | Total Debt UW NCF DSCR | Mortgage | Total | Mortgage | Total |
| 1 | Old Chicago Post Office | $125,000,000 | $317,200,000 | $955,000,000 | 4.22x | 1.90x | 43.1% | 80.3% | 14.9% | 8.0% |
| 4 | CX - 350 & 450 Water Street | $101,000,000 | $411,000,000 | $1,225,000,000 | 3.50x | 2.32x | 41.7% | 62.7% | 9.9% | 6.6% |
| 10 | The Summit | $65,000,000 | $198,000,000 | $525,000,000 | 4.11x | 2.56x | 36.5% | 58.6% | 12.6% | 7.8% |
| 18 | The Onyx | $38,000,000 | $7,000,000 | $45,000,000 | 2.28x | 1.58x | 63.1% | 74.8% | 9.4% | 7.9% |
| 23 | 601 Lexington Avenue | $25,000,000 | $276,700,000 | $1,000,000,000 | 4.50x | 3.25x | 42.5% | 58.8% | 13.2% | 9.5% |
| (1) | In the case of Loan Nos., 1, 4, 10 and 23, Subordinate Debt Cut-off Date Balance represents one or more Subordinate Companion Loan(s) and/or related mezzanine loan(s). In the case of Loan No. 18, Subordinate Debt Cut-off Date Balance represents one or more mezzanine loans. |
| (2) | In the case of Loan Nos. 1, 4, 10 and 23, Mortgage Loan UW NCF DSCR, Mortgage Loan UW NOI DY and Mortgage Loan Cut-off Date LTV calculations exclude the related Subordinate Companion Loan(s) and/or related mezzanine loan(s). In the case of Loan No. 18, Mortgage Loan UW NCF DSCR, Mortgage Loan UW NOI DY and Mortgage Loan Cut-off Date LTV calculations exclude the related mezzanine loan(s). |
| (3) | In the case of Loan Nos. 1 and 4, Mortgage Loan Cut-Off Date LTV and Total Debt Cut-Off Date LTV are calculated by using an appraised value based on certain hypothetical assumptions. Refer to “Description of the Mortgage Pool—Assessments of Property Value and Condition” and “—Appraised Value” in the Preliminary Prospectus for additional details. |
THE INFORMATION IN THIS STRUCTURAL AND COLLATERAL TERM SHEET IS NOT COMPLETE AND MAY BE AMENDED PRIOR TO THE TIME OF SALE. THIS TERM SHEET IS NOT AN OFFER TO SELL THESE SECURITIES AND IT IS NOT A SOLICITATION OF AN OFFER TO BUY THESE SECURITIES IN ANY JURISDICTION WHERE THE OFFER OR SALE IS NOT PERMITTED.
11 of 158
| Structural and Collateral Term Sheet | Benchmark 2022-B32 | |
| Collateral Characteristics | ||
| Mortgaged Properties by Type(1) |
| Weighted Average | |||||||||
| Property Type | Property Subtype | Number of Properties | Cut-off Date Principal Balance | % of IPB | Occupancy | UW NCF DSCR(2) | UW NOI DY(2) | Cut-off Date LTV(2)(3) | Maturity Date LTV (2)(3)(4) |
| Office | Suburban | 67 | $475,865,606 | 26.8% | 95.6% | 2.31x | 10.2% | 64.3% | 62.4% |
| CBD | 10 | 308,130,000 | 17.4 | 93.2% | 3.94x | 13.9% | 46.6% | 46.6% | |
| CBD/Data Center | 1 | 90,000,000 | 5.1 | 87.3% | 3.37x | 9.6% | 42.6% | 42.6% | |
| Urban | 1 | 39,818,000 | 2.2 | 76.7% | 3.66x | 11.0% | 56.8% | 56.8% | |
| Medical | 2 | 5,089,794 | 0.3 | 56.6% | 2.80x | 10.8% | 59.6% | 59.6% | |
| Subtotal: | 81 | $918,903,400 | 51.8% | 92.9% | 3.02x | 11.4% | 55.9% | 54.9% | |
| Retail | Anchored | 7 | $177,190,916 | 10.0% | 96.3% | 2.90x | 10.7% | 60.8% | 59.5% |
| Single Tenant | 23 | 17,089,535 | 1.0 | 100.0% | 2.68x | 9.6% | 53.9% | 53.9% | |
| Subtotal: | 30 | $194,280,451 | 10.9% | 96.6% | 2.88x | 10.6% | 60.2% | 59.0% | |
| Mixed Use | Office/Lab | 1 | $101,000,000 | 5.7% | 100.0% | 3.50x | 9.9% | 41.7% | 41.7% |
| Multifamily/Office/Retail | 2 | 58,987,500 | 3.3 | 90.8% | 3.82x | 12.1% | 48.9% | 48.9% | |
| Retail/Office | 1 | 23,467,534 | 1.3 | 89.6% | 1.56x | 9.5% | 65.7% | 51.9% | |
| Multifamily/Retail | 3 | 10,237,500 | 0.6 | 91.9% | 2.34x | 9.6% | 55.2% | 55.2% | |
| Subtotal: | 7 | $193,692,534 | 10.9% | 95.5% | 3.30x | 10.5% | 47.5% | 45.8% | |
| Self Storage | Self Storage | 21 | $151,975,000 | 8.6% | 95.3% | 2.93x | 9.5% | 60.6% | 60.6% |
| Subtotal: | 21 | $151,975,000 | 8.6% | 95.3% | 2.93x | 9.5% | 60.6% | 60.6% | |
| Industrial | Flex | 5 | $59,367,344 | 3.3% | 96.0% | 2.30x | 9.5% | 60.3% | 58.4% |
| Manufacturing | 12 | 46,816,730 | 2.6 | 100.0% | 2.79x | 11.9% | 59.9% | 58.1% | |
| Warehouse | 1 | 14,912,656 | 0.8 | 100.0% | 2.34x | 9.3% | 62.8% | 62.8% | |
| Cold Storage | 2 | 12,434,794 | 0.7 | 100.0% | 2.06x | 8.9% | 60.6% | 60.6% | |
| Subtotal: | 20 | $133,531,523 | 7.5% | 98.2% | 2.45x | 10.3% | 60.5% | 59.0% | |
| Hospitality | Full Service | 1 | $75,000,000 | 4.2% | 36.8% | 3.14x | 20.4% | 41.8% | 41.8% |
| Limited Service | 1 | 18,000,000 | 1.0 | 61.0% | 3.68x | 16.1% | 53.7% | 53.7% | |
| Extended Stay | 1 | 7,991,766 | 0.5 | 96.2% | 2.45x | 17.4% | 65.0% | 57.7% | |
| Subtotal: | 3 | $100,991,766 | 5.7% | 45.8% | 3.18x | 19.4% | 45.8% | 45.2% | |
| Multifamily | Garden | 3 | $53,490,000 | 3.0% | 95.4% | 2.23x | 9.4% | 63.1% | 63.1% |
| Mid Rise | 1 | 2,275,000 | 0.1 | 100.0% | 2.09x | 8.0% | 64.6% | 64.6% | |
| Subtotal: | 4 | $55,765,000 | 3.1% | 95.6% | 2.23x | 9.3% | 63.2% | 63.2% | |
| Other | Parking Garage | 5 | $25,695,000 | 1.4% | NAP | 3.30x | 13.6% | 59.4% | 59.4% |
| Subtotal: | 5 | $25,695,000 | 1.4% | NAP | 3.30x | 13.6% | 59.4% | 59.4% | |
| Total / Weighted Average: | 171 | $1,774,834,674 | 100.0% | 91.6%(5) | 2.98x | 11.4% | 55.9% | 54.9% | |
| (1) | Because this table presents information relating to the mortgaged properties and not mortgage loans, the information for mortgage loans secured by more than one mortgaged property is based on allocated loan amounts. |
| (2) | In the case of Loan Nos. 1, 2, 4, 5, 7, 8, 10, 11, 12, 13, 17, 19, 20, 21, 23, 25, 27 and 28, UW NOI DY, Cut-off Date LTV and Maturity Date LTV calculations include the related Pari Passu Companion Loan(s). In the case of Loan Nos. 1, 4, 10, 18 and 23, UW NCF DSCR, UW NOI DY, Cut-off Date LTV and Maturity Date LTV calculations exclude the related Subordinate Companion Loan(s), related mezzanine loan(s) and/or related additional secured subordinate debt. |
| (3) | In the case of Loan Nos. 1, 3, 4, 8 and 22, Cut-off Date LTV and the Maturity Date LTV are calculated by using an appraised value based on certain hypothetical assumptions. Refer to “Description of the Mortgage Pool—Assessments of Property Value and Condition” and “—Appraised Value” in the Preliminary Prospectus for additional details. |
| (4) | In the case of Loan Nos. 4, 5 and 12, each with an anticipated repayment date, Maturity Date LTV is calculated as of the related anticipated repayment date. |
| (5) | Excludes occupancy for five properties in connection with Loan No. 2 as the collateral consists of parking garages with no attributable occupancy. |
THE INFORMATION IN THIS STRUCTURAL AND COLLATERAL TERM SHEET IS NOT COMPLETE AND MAY BE AMENDED PRIOR TO THE TIME OF SALE. THIS TERM SHEET IS NOT AN OFFER TO SELL THESE SECURITIES AND IT IS NOT A SOLICITATION OF AN OFFER TO BUY THESE SECURITIES IN ANY JURISDICTION WHERE THE OFFER OR SALE IS NOT PERMITTED.
12 of 158
| Structural and Collateral Term Sheet | Benchmark 2022-B32 | |
| Collateral Characteristics | ||

| Mortgaged Properties by Location(1) | ||||||||
Weighted Average | ||||||||
State | Number of Properties | Cut-off Date Principal Balance | % of IPB | Occupancy | UW NCF DSCR(2) | UW NOI DY(2) | Cut-off Date LTV(2)(3) | Maturity Date LTV (2)(3)(4) |
| California | 3 | $171,000,000 | 9.6% | 65.6% | 3.27x | 14.4% | 41.8% | 41.8% |
| Illinois | 4 | 148,066,512 | 8.3 | 93.1% | 4.00x | 14.2% | 45.3% | 45.3% |
| Michigan | 18 | 145,541,005 | 8.2 | 91.4% | 3.15x | 13.1% | 59.6% | 59.2% |
| Texas | 7 | 138,612,065 | 7.8 | 94.4% | 3.11x | 10.5% | 56.2% | 56.2% |
| Massachusetts | 2 | 101,495,437 | 5.7 | 100.0% | 3.49x | 9.9% | 41.8% | 41.8% |
| New Mexico | 41 | 85,910,100 | 4.8 | 97.4% | 2.97x | 12.2% | 64.5% | 64.5% |
| Ohio | 6 | 82,676,488 | 4.7 | 99.2% | 1.95x | 9.4% | 65.8% | 61.6% |
| Virginia | 12 | 78,490,000 | 4.4 | 90.9% | 2.97x | 10.6% | 64.3% | 64.3% |
| Maryland | 1 | 75,000,000 | 4.2 | 96.7% | 2.96x | 10.4% | 59.5% | 59.5% |
| Utah | 2 | 74,500,000 | 4.2 | 100.0% | 1.96x | 9.4% | 68.0% | 68.0% |
| Washington | 2 | 66,148,613 | 3.7 | 98.2% | 4.07x | 12.5% | 36.9% | 36.9% |
| Nevada | 6 | 63,000,000 | 3.5 | 97.6% | 1.42x | 9.0% | 59.1% | 52.7% |
| New Jersey | 1 | 60,000,000 | 3.4 | 77.0% | 3.16x | 9.2% | 63.8% | 63.8% |
| Florida | 4 | 56,240,856 | 3.2 | 95.8% | 2.72x | 9.4% | 61.7% | 61.7% |
| Pennsylvania | 11 | 51,856,058 | 2.9 | 95.1% | 2.05x | 9.7% | 64.4% | 60.9% |
| South Carolina | 3 | 49,756,165 | 2.8 | 99.6% | 2.57x | 10.5% | 63.7% | 63.7% |
| Georgia | 5 | 45,828,343 | 2.6 | 79.1% | 2.99x | 13.5% | 59.1% | 57.9% |
| New York | 7 | 44,166,279 | 2.5 | 97.9% | 3.58x | 11.5% | 48.9% | 48.9% |
| Connecticut | 4 | 39,991,141 | 2.3 | 93.2% | 2.16x | 10.0% | 63.4% | 55.3% |
| District of Columbia | 1 | 39,818,000 | 2.2 | 76.7% | 3.66x | 11.0% | 56.8% | 56.8% |
| North Carolina | 4 | 26,552,510 | 1.5 | 100.0% | 2.27x | 9.3% | 59.4% | 59.4% |
| Oregon | 2 | 23,900,000 | 1.3 | 95.8% | 3.14x | 12.5% | 60.0% | 60.0% |
| Rhode Island | 1 | 23,000,000 | 1.3 | 100.0% | 2.35x | 9.2% | 57.7% | 57.7% |
| Minnesota | 3 | 17,706,502 | 1.0 | 96.9% | 2.29x | 11.4% | 65.3% | 58.9% |
| Arizona | 1 | 16,975,916 | 1.0 | 97.3% | 1.77x | 10.3% | 65.3% | 51.4% |
| Wisconsin | 4 | 11,855,439 | 0.7 | 100.0% | 3.23x | 13.1% | 58.4% | 58.4% |
| Indiana | 3 | 10,331,061 | 0.6 | 99.6% | 3.17x | 11.4% | 58.9% | 58.9% |
| Missouri | 2 | 7,612,423 | 0.4 | 97.7% | 3.01x | 9.7% | 58.1% | 58.1% |
| Tennessee | 2 | 7,428,140 | 0.4 | 97.0% | 2.37x | 10.0% | 62.6% | 62.6% |
| Kentucky | 1 | 5,241,400 | 0.3 | 89.2% | 3.13x | 9.8% | 59.7% | 59.7% |
| Alabama | 1 | 1,827,826 | 0.1 | 100.0% | 3.25x | 13.2% | 58.5% | 58.5% |
| Oklahoma | 2 | 1,594,186 | 0.1 | 100.0% | 2.68x | 9.6% | 53.9% | 53.9% |
| Kansas | 1 | 1,037,791 | 0.1 | 100.0% | 2.68x | 9.6% | 53.9% | 53.9% |
| Arkansas | 2 | 959,302 | 0.1 | 100.0% | 2.68x | 9.6% | 53.9% | 53.9% |
| Louisiana | 2 | 715,116 | 0.0 | 100.0% | 2.68x | 9.6% | 53.9% | 53.9% |
| Total / Weighted Average: | 171 | $1,774,834,674 | 100.0% | 91.6%(5) | 2.98x | 11.4% | 55.9% | 54.9% |
| (1) | Because this table presents information relating to the mortgaged properties and not mortgage loans, the information for mortgage loans secured by more than one mortgaged property is based on allocated loan amounts. |
| (2) | In the case of Loan Nos. 1, 2, 4, 5, 7, 8, 10, 11, 12, 13, 17, 19, 20, 21, 23, 25, 27 and 28, UW NCF DSCR, UW NOI DY, Cut-off Date LTV and Maturity Date LTV calculations include the related Pari Passu Companion Loan(s). In the case of Loan Nos. 1, 4, 10, 18 and 23, UW NCF DSCR, UW NOI DY, Cut-off Date LTV and Maturity Date LTV calculations exclude the related Subordinate Companion Loan(s), related mezzanine loan(s) and/or related additional secured subordinate debt. |
| (3) | In the case of Loan Nos. 1, 3, 4, 8 and 22, Cut-off Date LTV and the Maturity Date LTV are calculated by using an appraised value based on certain hypothetical assumptions. Refer to “Description of the Mortgage Pool—Assessments of Property Value and Condition” and “—Appraised Value” in the Preliminary Prospectus for additional details. |
| (4) | In the case of Loan Nos. 4, 5 and 12, each with an anticipated repayment date, Maturity Date LTV is calculated as of the related anticipated repayment date. |
| (5) | Excludes occupancy for five properties in connection with Loan No. 2 as the collateral consists of parking garages with no attributable occupancy. |
THE INFORMATION IN THIS STRUCTURAL AND COLLATERAL TERM SHEET IS NOT COMPLETE AND MAY BE AMENDED PRIOR TO THE TIME OF SALE. THIS TERM SHEET IS NOT AN OFFER TO SELL THESE SECURITIES AND IT IS NOT A SOLICITATION OF AN OFFER TO BUY THESE SECURITIES IN ANY JURISDICTION WHERE THE OFFER OR SALE IS NOT PERMITTED.
13 of 158
| Structural and Collateral Term Sheet | Benchmark 2022-B32 | |
| Collateral Characteristics | ||
| Cut-off Date Principal Balance |
Weighted Average | |||||||||||
| Range of Cut-off Date Principal Balances | Number of Loans | Cut-off Date Principal Balance | % of IPB | Mortgage Rate | Remaining Loan Term(1) | UW NCF DSCR(2) | UW NOI DY(2) | Cut-off Date LTV(2)(3) | Maturity Date LTV (1)(2)(3) | ||
| $2,275,000 | - | $9,999,999 | 10 | $69,073,224 | 3.9% | 4.00504% | 102 | 2.34x | 11.1% | 59.6% | 56.9% |
| $10,000,000 | - | $19,999,999 | 8 | 112,665,916 | 6.3 | 3.67491% | 119 | 2.48x | 10.6% | 62.0% | 58.9% |
| $20,000,000 | - | $29,999,999 | 8 | 193,762,534 | 10.9 | 3.56866% | 116 | 2.56x | 10.4% | 60.0% | 57.5% |
| $30,000,000 | - | $49,999,999 | 8 | 303,708,000 | 17.1 | 3.56079% | 91 | 2.68x | 10.4% | 62.0% | 61.0% |
| $50,000,000 | - | $125,000,000 | 13 | 1,095,625,000 | 61.7 | 3.48240% | 94 | 3.22x | 11.9% | 52.6% | 52.3% |
Total / Wtd. Avg: | 47 | $1,774,834,674 | 100.0% | 3.53779% | 98 | 2.98x | 11.4% | 55.9% | 54.9% | ||
| Mortgage Interest Rates |
Weighted Average | |||||||||||
| Range of Mortgage Interest Rates | Number of Loans | Cut-off Date Principal Balance | % of IPB | Mortgage Rate | Remaining Loan Term(1) | UW NCF DSCR(2) | UW NOI DY(2) | Cut-off Date LTV(2)(3) | Maturity Date LTV (1)(2)(3) | ||
| 2.77600% | - | 3.00000% | 7 | $435,818,000 | 24.6% | 2.85118% | 101 | 3.63x | 10.7% | 46.4% | 46.4% |
| 3.00001% | - | 3.50000% | 9 | 456,577,500 | 25.7 | 3.32050% | 93 | 3.30x | 11.4% | 55.6% | 55.4% |
| 3.50001% | - | 4.00000% | 24 | 627,487,473 | 35.4 | 3.77242% | 105 | 2.56x | 11.0% | 62.3% | 60.6% |
| 4.00001% | - | 5.13500% | 7 | 254,951,701 | 14.4 | 4.52315% | 81 | 2.30x | 13.3% | 56.9% | 54.9% |
| Total / Wtd. Avg: | 47 | $1,774,834,674 | 100.0% | 3.53779% | 98 | 2.98x | 11.4% | 55.9% | 54.9% | ||
| Original Term to Maturity in Months(1) |
Weighted Average | |||||||||
| Original Term to Maturity in Months | Number of Loans | Cut-off Date Principal Balance | % of IPB | Mortgage Rate | Remaining Loan Term(1) | UW NCF DSCR(2) | UW NOI DY(2) | Cut-off Date LTV(2)(3) | Maturity Date LTV (1)(2)(3) |
| 60 | 9 | $449,809,935 | 25.3% | 3.85901% | 59 | 3.10x | 13.0% | 54.5% | 54.3% |
| 84 | 4 | 202,809,766 | 11.4 | 3.66049% | 83 | 3.33x | 13.2% | 59.0% | 58.7% |
| 86 | 1 | 65,000,000 | 3.7 | 2.95200% | 84 | 4.11x | 12.6% | 36.5% | 36.5% |
| 96 | 1 | 22,262,500 | 1.3 | 3.42100% | 95 | 2.74x | 9.6% | 64.8% | 64.8% |
| 120 | 32 | 1,034,952,473 | 58.3 | 3.41344% | 119 | 2.79x | 10.3% | 57.0% | 55.4% |
Total / Wtd. Avg: | 47 | $1,774,834,674 | 100.0% | 3.53779% | 98 | 2.98x | 11.4% | 55.9% | 54.9% |
| Remaining Term to Maturity in Months(1) | |||||||||
| Weighted Average | |||||||||||
| Range of Remaining Term to Maturity in Months | Number of Loans | Cut-off Date Principal Balance | % of IPB | Mortgage Rate | Remaining Loan Term(1) | UW NCF DSCR(2) | UW NOI DY(2) | Cut-off Date LTV(2)(3) | Maturity Date LTV (1)(2)(3) | ||
| 57 | - | 60 | 9 | $449,809,935 | 25.3% | 3.85901% | 59 | 3.10x | 13.0% | 54.5% | 54.3% |
| 61 | - | 84 | 5 | 267,809,766 | 15.1 | 3.48853% | 83 | 3.52x | 13.0% | 53.5% | 53.3% |
| 85 | - | 119 | 32 | 1,049,164,973 | 59.1 | 3.41010% | 118 | 2.79x | 10.3% | 57.2% | 55.6% |
| 120 | - | 120 | 1 | 8,050,000 | 0.5 | 3.87000% | 120 | 2.08x | 8.5% | 54.0% | 54.0% |
| Total / Wtd. Avg: | 47 | $1,774,834,674 | 100.0% | 3.53779% | 98 | 2.98x | 11.4% | 55.9% | 54.9% | ||
| (1) | In the case of Loan Nos. 4, 5 and 12, each with an anticipated repayment date, Original Term to Maturity, Remaining Loan Term and Maturity Date LTV are calculated as of the related anticipated repayment date. |
| (2) | In the case of Loan Nos. 1, 2, 4, 5, 7, 8, 10, 11, 12, 13, 17, 19, 20, 21, 23, 25, 27 and 28, UW NCF DSCR, UW NOI DY, Cut-off Date LTV and Maturity Date LTV calculations include the related Pari Passu Companion Loan(s). In the case of Loan Nos. 1, 4, 10, 18 and 23, UW NCF DSCR, UW NOI DY, Cut-off Date LTV and Maturity Date LTV calculations exclude the related Subordinate Companion Loan(s), related mezzanine loan(s) and/or related additional secured subordinate debt. |
| (3) | In the case of Loan Nos. Nos. 1, 3, 4, 8 and 22, Cut-off Date LTV and the Maturity Date LTV are calculated by using an appraised value based on certain hypothetical assumptions. Refer to “Description of the Mortgage Pool—Assessments of Property Value and Condition” and “—Appraised Value” in the Preliminary Prospectus for additional details. |
THE INFORMATION IN THIS STRUCTURAL AND COLLATERAL TERM SHEET IS NOT COMPLETE AND MAY BE AMENDED PRIOR TO THE TIME OF SALE. THIS TERM SHEET IS NOT AN OFFER TO SELL THESE SECURITIES AND IT IS NOT A SOLICITATION OF AN OFFER TO BUY THESE SECURITIES IN ANY JURISDICTION WHERE THE OFFER OR SALE IS NOT PERMITTED.
14 of 158
| Structural and Collateral Term Sheet | Benchmark 2022-B32 | |
| Collateral Characteristics | ||
| Original Amortization Term in Months |
| Weighted Average | |||||||||||||
| Original Amortization Term in Months | Number of Loans | Cut-off Date Principal Balance | % of IPB | Mortgage Rate | Remaining Loan Term(1) | UW NCF DSCR(2) | UW NOI DY(2) | Cut-off Date LTV(2)(3) | Maturity Date LTV (1)(2)(3) | ||||
Interest Only | 38 | $1,566,005,500 | 88.2% | 3.48109% | 95 | 3.16x | 11.6% | 54.8% | 54.8% | ||||
| 360 | - | 360 | 9 | 208,829,174 | 11.8 | 3.96298% | 115 | 1.60x | 9.9% | 64.2% | 55.9% | ||
| Total / Wtd. Avg: | 47 | $1,774,834,674 | 100.0% | 3.53779% | 98 | 2.98x | 11.4% | 55.9% | 54.9% | ||||
| Remaining Amortization Term in Months |
| Weighted Average | |||||||||||||
| Range of Remaining Amortization Term in Months | Number of Loans | Cut-off Date Principal Balance | % of IPB | Mortgage Rate | Remaining Loan Term(1) | UW NCF DSCR(2) | UW NOI DY(2) | Cut-off Date LTV(2)(3) | Maturity Date LTV (1)(2)(3) | ||||
Interest Only | 38 | $1,566,005,500 | 88.2% | 3.48109% | 95 | 3.16x | 11.6% | 54.8% | 54.8% | ||||
| 359 | - | 360 | 9 | 208,829,174 | 11.8 | 3.96298% | 115 | 1.60x | 9.9% | 64.2% | 55.9% | ||
| Total / Wtd. Avg: | 47 | $1,774,834,674 | 100.0% | 3.53779% | 98 | 2.98x | 11.4% | 55.9% | 54.9% | ||||
| Amortization Types |
Weighted Average | |||||||||
| Amortization Types | Number of Loans | Cut-off Date Principal Balance | % of IPB | Mortgage Rate | Remaining Loan Term(1) | UW NCF DSCR(2) | UW NOI DY(2) | Cut-off Date LTV(2)(3) | Maturity Date LTV (1)(2)(3) |
| Interest Only | 35 | $1,315,005,500 | 74.1% | 3.61162% | 94 | 3.12x | 12.0% | 56.2% | 56.2% |
| Interest Only - ARD | 3 | 251,000,000 | 14.1 | 2.79726% | 103 | 3.37x | 9.6% | 47.3% | 47.3% |
| Interest Only, Amortizing Balloon | 4 | 146,152,500 | 8.2 | 3.93820% | 119 | 1.53x | 9.4% | 63.5% | 56.8% |
| Amortizing Balloon | 5 | 62,676,674 | 3.5 | 4.02076% | 107 | 1.77x | 11.1% | 65.9% | 53.9% |
| Total / Wtd. Avg: | 47 | $1,774,834,674 | 100.0% | 3.53779% | 98 | 2.98x | 11.4% | 55.9% | 54.9% |
| Underwritten Net Cash Flow Debt Service Coverage Ratios(2) |
| Weighted Average | |||||||||||
| Range of Underwritten Net Cash Flow Debt Service Coverage Ratios | Number of Loans | Cut-off Date Principal Balance | % of IPB | Mortgage Rate | Remaining Loan Term(1) | UW NCF DSCR(2) | UW NOI DY(2) | Cut-off Date LTV(2)(3) | Maturity Date LTV (1)(2)(3) | ||
| 1.42x | - | 1.79x | 7 | $194,735,885 | 11.0% | 3.91999% | 116 | 1.56x | 9.5% | 64.1% | 56.0% |
| 1.80x | - | 2.09x | 6 | 122,396,523 | 6.9 | 4.19638% | 82 | 1.98x | 9.2% | 65.2% | 64.5% |
| 2.10x | - | 2.29x | 2 | 50,870,000 | 2.9 | 3.87749% | 118 | 2.27x | 9.3% | 62.1% | 62.1% |
| 2.30x | - | 2.59x | 8 | 150,041,766 | 8.5 | 3.82874% | 98 | 2.40x | 10.0% | 62.8% | 62.4% |
| 2.60x | 2.99x | 8 | 261,007,500 | 14.7 | 3.56319% | 103 | 2.88x | 11.0% | 61.3% | 61.3% | |
| 3.00x | - | 4.50x | 16 | 995,783,000 | 56.1 | 3.31425% | 94 | 3.52x | 12.4% | 50.4% | 50.4% |
| Total / Wtd. Avg: | 47 | $1,774,834,674 | 100.0% | 3.53779% | 98 | 2.98x | 11.4% | 55.9% | 54.9% | ||
| (1) | In the case of Loan Nos. 4, 5 and 12, each with an anticipated repayment date, Remaining Loan Term and Maturity Date LTV are calculated as of the related anticipated repayment date. |
| (2) | In the case of Loan Nos. 1, 2, 4, 5, 7, 8, 10, 11, 12, 13, 17, 19, 20, 21, 23, 25, 27 and 28, UW NCF DSCR, UW NOI DY, Cut-off Date LTV and Maturity Date LTV calculations include the related Pari Passu Companion Loan(s). In the case of Loan Nos. 1, 4, 10, 18 and 23, UW NCF DSCR, UW NOI DY, Cut-off Date LTV and Maturity Date LTV calculations exclude the related Subordinate Companion Loan(s), related mezzanine loan(s) and/or related additional secured subordinate debt. |
| (3) | In the case of Loan Nos. Nos. 1, 3, 4, 8 and 22, Cut-off Date LTV and the Maturity Date LTV are calculated by using an appraised value based on certain hypothetical assumptions. Refer to “Description of the Mortgage Pool—Assessments of Property Value and Condition” and “—Appraised Value” in the Preliminary Prospectus for additional details. |
THE INFORMATION IN THIS STRUCTURAL AND COLLATERAL TERM SHEET IS NOT COMPLETE AND MAY BE AMENDED PRIOR TO THE TIME OF SALE. THIS TERM SHEET IS NOT AN OFFER TO SELL THESE SECURITIES AND IT IS NOT A SOLICITATION OF AN OFFER TO BUY THESE SECURITIES IN ANY JURISDICTION WHERE THE OFFER OR SALE IS NOT PERMITTED.
15 of 158
| Structural and Collateral Term Sheet | Benchmark 2022-B32 | |
| Collateral Characteristics | ||
| LTV Ratios as of the Cut-off Date(2)(3) |
| Weighted Average | |||||||||||
| Range of Cut-off Date LTVs | Number of Loans | Cut-off Date Principal Balance | % of IPB | Mortgage Rate | Remaining Loan Term(1) | UW NCF DSCR(2) | UW NOI DY(2) | Cut-off Date LTV(2)(3) | Maturity Date LTV (1)(2)(3) | ||
| 29.3% | - | 39.9% | 2 | $71,000,000 | 4.0% | 2.98986% | 87 | 4.06x | 12.6% | 35.9% | 35.9% |
| 40.0% | - | 49.9% | 6 | 471,000,000 | 26.5 | 3.33684% | 93 | 3.70x | 13.3% | 43.0% | 43.0% |
| 50.0% | - | 59.9% | 12 | 540,138,000 | 30.4 | 3.55425% | 103 | 2.91x | 11.1% | 58.5% | 57.8% |
| 60.0% | - | 69.2% | 27 | 692,696,674 | 39.0 | 3.71775% | 98 | 2.42x | 10.2% | 64.6% | 62.7% |
Total / Wtd. Avg: | 47 | $1,774,834,674 | 100.0% | 3.53779% | 98 | 2.98x | 11.4% | 55.9% | 54.9% | ||
| LTV Ratios as of the Maturity Date(1)(2)(3) |
Weighted Average | |||||||||||
| Range of Maturity Date LTVs | Number of Loans | Cut-off Date Principal Balance | % of IPB | Mortgage Rate | Remaining Loan Term(1) | UW NCF DSCR(2) | UW NOI DY(2) | Cut-off Date LTV(2)(3) | Maturity Date LTV (1)(2)(3) | ||
| 29.3% | - | 39.9% | 2 | $71,000,000 | 4.0% | 2.98986% | 87 | 4.06x | 12.6% | 35.9% | 35.9% |
| 40.0% | - | 44.9% | 5 | 416,000,000 | 23.4 | 3.38931% | 90 | 3.68x | 13.4% | 42.4% | 42.4% |
| 45.0% | - | 49.9% | 1 | 55,000,000 | 3.1 | 2.94000% | 119 | 3.86x | 12.0% | 48.1% | 48.1% |
| 50.0% | - | 54.9% | 7 | 165,594,973 | 9.3 | 3.93171% | 108 | 2.00x | 10.1% | 59.1% | 52.8% |
| 55.0% | - | 68.0% | 32 | 1,067,239,701 | 60.1 | 3.60180% | 99 | 2.73x | 10.7% | 62.4% | 61.8% |
Total / Wtd. Avg: | 47 | $1,774,834,674 | 100.0% | 3.53779% | 98 | 2.98x | 11.4% | 55.9% | 54.9% | ||
| Prepayment Protection |
Weighted Average | |||||||||
| Prepayment Protection | Number of Loans | Cut-off Date Principal Balance | % of IPB | Mortgage Rate | Remaining Loan Term(1) | UW NCF DSCR(2) | UW NOI DY(2) | Cut-off Date LTV(2)(3) | Maturity Date LTV (1)(2)(3) |
| Defeasance | 40 | $1,423,513,151 | 80.2% | 3.58702% | 98 | 2.88x | 11.3% | 57.3% | 56.1% |
| Yield Maintenance or Defeasance | 5 | 219,151,523 | 12.3 | 3.07240% | 107 | 3.44x | 10.9% | 44.8% | 44.4% |
| Yield Maintenance | 2 | 132,170,000 | 7.4 | 3.77919% | 82 | 3.25x | 13.4% | 59.6% | 59.6% |
Total / Wtd. Avg: | 47 | $1,774,834,674 | 100.0% | 3.53779% | 98 | 2.98x | 11.4% | 55.9% | 54.9% |
| Loan Purpose |
Weighted Average | |||||||||
| Loan Purpose | Number of Loans | Cut-off Date Principal Balance | % of IPB | Mortgage Rate | Remaining Loan Term(1) | UW NCF DSCR(2) | UW NOI DY(2) | Cut-off Date LTV(2)(3) | Maturity Date LTV (1)(2)(3) |
| Refinance | 19 | $872,817,235 | 49.2% | 3.43964% | 90 | 3.30x | 12.3% | 50.5% | 49.7% |
| Acquisition | 24 | 730,117,439 | 41.1 | 3.63881% | 105 | 2.66x | 10.5% | 62.6% | 61.8% |
| Recapitalization | 4 | 171,900,000 | 9.7 | 3.60710% | 108 | 2.66x | 10.6% | 54.8% | 52.5% |
| Total / Wtd. Avg: | 47 | $1,774,834,674 | 100.0% | 3.53779% | 98 | 2.98x | 11.4% | 55.9% | 54.9% |
| (1) | In the case of Loan Nos. 4, 5 and 12, each with an anticipated repayment date, Remaining Loan Term and Maturity Date LTV are calculated as of the related anticipated repayment date. |
| (2) | In the case of Loan Nos. 1, 2, 4, 5, 7, 8, 10, 11, 12, 13, 17, 19, 20, 21, 23, 25, 27 and 28, UW NCF DSCR, UW NOI DY, Cut-off Date LTV and Maturity Date LTV calculations include the related Pari Passu Companion Loan(s). In the case of Loan Nos. 1, 4, 10, 18 and 23, UW NCF DSCR, UW NOI DY, Cut-off Date LTV and Maturity Date LTV calculations exclude the related Subordinate Companion Loan(s), related mezzanine loan(s) and/or related additional secured subordinate debt. |
| (3) | In the case of Loan Nos. Nos. 1, 3, 4, 8 and 22, Cut-off Date LTV and the Maturity Date LTV are calculated by using an appraised value based on certain hypothetical assumptions. Refer to “Description of the Mortgage Pool—Assessments of Property Value and Condition” and “—Appraised Value” in the Preliminary Prospectus for additional details. |
THE INFORMATION IN THIS STRUCTURAL AND COLLATERAL TERM SHEET IS NOT COMPLETE AND MAY BE AMENDED PRIOR TO THE TIME OF SALE. THIS TERM SHEET IS NOT AN OFFER TO SELL THESE SECURITIES AND IT IS NOT A SOLICITATION OF AN OFFER TO BUY THESE SECURITIES IN ANY JURISDICTION WHERE THE OFFER OR SALE IS NOT PERMITTED.
16 of 158
| Structural and Collateral Term Sheet | Benchmark 2022-B32 | |
| Collateral Characteristics | ||
| Previous Securitization History(1) |
| No. | Mortgaged Property | Cut-off Date Principal Balance(2) | % of IPB | Location | Property Type | Previous Securitization |
| 1 | Old Chicago Post Office | $125,000,000 | 7.0% | Chicago, IL | Office | BXMT 2021-FL4, BXMT 2020-FL3, BXMT 2020-FL2 |
| 2.01 | Bedrock Portfolio - First National Building | $28,820,000 | 1.6% | Detroit, MI | Office | JPMBB 2015-C32, JPMCC 2015-JP1 |
| 2.03 | Bedrock Portfolio - Chrysler House | $14,325,000 | 0.8% | Detroit, MI | Office | WFRBS 2013-C16 |
| 2.04 | Bedrock Portfolio - 1001 Woodward | $14,232,500 | 0.8% | Detroit, MI | Office | JPMBB 2014-C19 |
| 2.05 | Bedrock Portfolio - One Woodward | $10,317,500 | 0.6% | Detroit, MI | Office | COMM 2014-UBS6 |
| 5 | One Wilshire | $90,000,000 | 5.1% | Los Angeles, CA | Office | COMM 2013-CR10 |
| 7 | JW Marriott Desert Springs | $75,000,000 | 4.2% | Palm Desert, CA | Hospitality | BACM 2017-BNK3, BANK 2017-BNK4 |
| 12 | Novo Nordisk HQ | $60,000,000 | 3.4% | Plainsboro, NJ | Office | WFCM 2016-NXS6, CSMC 2016-NXSR, CGCMT 2017-P7 |
| 13 | The Kirby Collection | $55,000,000 | 3.1% | Houston, TX | Mixed Use | TRTX 2018-FL2 |
| 18 | The Onyx | $38,000,000 | 2.1% | Houston, TX | Multifamily | RAITF 2017-FL8 |
| 19.11 | ExchangeRight Net Leased Portfolio #53 - Walgreens - Watervliet (2nd), NY | $969,767 | 0.1% | Watervliet, NY | Retail | COMM 2013-LC13 |
| 20.01 | Glen Forest Office Portfolio - Hillcrest | $5,702,338 | 0.3% | Richmond, VA | Office | BCORE 2019-CORE |
| 20.02 | Glen Forest Office Portfolio - Arrington | $5,360,198 | 0.3% | Richmond, VA | Office | BCORE 2019-CORE |
| 20.03 | Glen Forest Office Portfolio - Highland II | $3,729,329 | 0.2% | Richmond, VA | Office | BCORE 2019-CORE |
| 20.04 | Glen Forest Office Portfolio - Meridian | $3,506,938 | 0.2% | Richmond, VA | Office | BCORE 2019-CORE |
| 20.05 | Glen Forest Office Portfolio - Bayberry | $2,452,005 | 0.1% | Richmond, VA | Office | BCORE 2019-CORE |
| 20.06 | Glen Forest Office Portfolio - Highland I | $2,278,084 | 0.1% | Richmond, VA | Office | BCORE 2019-CORE |
| 20.07 | Glen Forest Office Portfolio - Capstone | $2,155,484 | 0.1% | Richmond, VA | Office | BCORE 2019-CORE |
| 20.08 | Glen Forest Office Portfolio - Forest Plaza I | $1,767,725 | 0.1% | Richmond, VA | Office | BCORE 2019-CORE |
| 20.09 | Glen Forest Office Portfolio - Forest Plaza II | $1,482,608 | 0.1% | Richmond, VA | Office | BCORE 2019-CORE |
| 25.01 | Nyberg Portfolio - Nyberg Rivers | $12,522,254 | 0.7% | Tualatin, OR | Retail | COMM 2015-LC21 |
| 25.02 | Nyberg Portfolio - Nyberg Woods | $11,377,746 | 0.6% | Tualatin, OR | Retail | COMM 2015-LC21 |
| 43 | Lakeville Townhomes | $7,170,000 | 0.4% | Memphis, TN | Multifamily | BANC 2019-CRE5 |
| (1) | The table above represents the properties for which the previously existing debt was securitized, based on information provided by the related borrower or obtained through searches of a third-party database. |
| (2) | Cut-off Date Principal Balance represents the allocated loan amount for each respective mortgaged property. |
THE INFORMATION IN THIS STRUCTURAL AND COLLATERAL TERM SHEET IS NOT COMPLETE AND MAY BE AMENDED PRIOR TO THE TIME OF SALE. THIS TERM SHEET IS NOT AN OFFER TO SELL THESE SECURITIES AND IT IS NOT A SOLICITATION OF AN OFFER TO BUY THESE SECURITIES IN ANY JURISDICTION WHERE THE OFFER OR SALE IS NOT PERMITTED.
17 of 158
| Structural and Collateral Term Sheet | Benchmark 2022-B32 | |
| Class A-2 and Class A-2A1(1) | ||
No. | Loan Name | Location | Cut-off Date Balance | % of IPB | Maturity Date Balance | % of Certificate Class(2) | Original Loan Term | Remaining Loan Term | UW NCF DSCR(3) | UW NOI Debt Yield(3) | Cut-off Date LTV(3) | Maturity Date LTV(3) |
| 1 | Old Chicago Post Office | Chicago, IL | $125,000,000 | 7.0% | $125,000,000 | 29.3% | 60 | 59 | 4.22 | 14.9% | 43.1% | 43.1% |
| 7 | JW Marriott Desert Springs | Palm Desert, CA | $75,000,000 | 4.2% | $75,000,000 | 17.6% | 60 | 59 | 3.14 | 20.4% | 41.8% | 41.8% |
| 9 | Dealertrack and Divvy | Draper, UT | $74,500,000 | 4.2% | $74,500,000 | 17.4% | 60 | 59 | 1.96 | 9.4% | 68.0% | 68.0% |
| 12 | Novo Nordisk HQ | Plainsboro, NJ | $60,000,000 | 3.4% | $60,000,000 | 14.0% | 60 | 57 | 3.16 | 9.2% | 63.8% | 63.8% |
| 16 | Benefitfocus HQ | Charleston, SC | $40,000,000 | 2.3% | $40,000,000 | 9.4% | 60 | 59 | 2.45 | 10.7% | 64.9% | 64.9% |
| 19 | ExchangeRight Net Leased Portfolio #53 | Various | $30,000,000 | 1.7% | $30,000,000 | 7.0% | 60 | 59 | 2.68 | 9.6% | 53.9% | 53.9% |
| 20 | Glen Forest Office Portfolio | Richmond, VA | $30,000,000 | 1.7% | $30,000,000 | 7.0% | 60 | 58 | 2.85 | 11.3% | 61.7% | 61.7% |
| 40 | Metro Place | Dublin, OH | $8,139,935 | 0.5% | $7,438,296 | 1.7% | 60 | 59 | 1.66 | 11.1% | 69.0% | 63.0% |
| 43 | Lakeville Townhomes | Memphis, TN | $7,170,000 | 0.4% | $7,170,000 | 1.7% | 60 | 59 | 2.36 | 10.0% | 62.9% | 62.9% |
| Total / Weighted Average: | $449,809,935 | 25.3% | $449,108,296 | 105.2% | 60 | 59 | 3.10x | 13.0% | 54.5% | 54.3% | ||
| (1) | The table above presents the mortgage loans whose balloon payments would be applied to pay down the certificate balance of the Class A-2 and Class A-2A1 Certificates, assuming a 0% CPR and applying the “Modeling Assumptions” described in the Preliminary Prospectus, including the assumptions that (i) none of the mortgage loans in the pool experience prepayments, defaults or losses; (ii) there are no extensions or forbearances of maturity dates or anticipated repayment dates of any mortgage loans in the pool; and (iii) each mortgage loan in the pool is paid in full on its stated maturity date or anticipated repayment date, as applicable. Each Class of Certificates, including the Class A-2 and Class A-2A1 Certificates, evidences undivided ownership interests in the entire pool of mortgage loans. Debt service coverage ratio, debt yield and loan-to-value ratio information does not take into account subordinate debt (whether or not secured by the mortgaged property), if any, that exists or is allowed under the terms of any mortgage loan. See Annex A-1 to the Preliminary Prospectus. |
| (2) | Reflects the percentage equal to the Maturity Date Balance divided by the initial Class A-2 and Class A-2A1 Certificate Balance. |
| (3) | In the case of Loan Nos. 1, 7, 12, 19 and 20, the UW NCF DSCR, UW NOI Debt Yield, Cut-off Date LTV and Maturity Date LTV calculations include the related Pari Passu Companion Loan. |
THE INFORMATION IN THIS STRUCTURAL AND COLLATERAL TERM SHEET IS NOT COMPLETE AND MAY BE AMENDED PRIOR TO THE TIME OF SALE. THIS TERM SHEET IS NOT AN OFFER TO SELL THESE SECURITIES AND IT IS NOT A SOLICITATION OF AN OFFER TO BUY THESE SECURITIES IN ANY JURISDICTION WHERE THE OFFER OR SALE IS NOT PERMITTED.
18 of 158
| Structural and Collateral Term Sheet | Benchmark 2022-B32 | |
| Class A-3(1) | ||
| Loan Name | Location | Cut-off Date Balance | % of IPB | Maturity Date Balance | % of Certificate Class(2) | Original Loan Term | Remaining Loan Term | UW NCF DSCR(3) | UW NOI Debt Yield(3) | Cut-off Date LTV(3) | Maturity Date LTV(3) |
| 2 | Bedrock Portfolio | Detroit, MI | $125,000,000 | 7.0% | $125,000,000 | 49.3% | 84 | 83 | 3.30 | 13.6% | 59.4% | 59.4% |
| 10 | The Summit | Bellevue, WA | $65,000,000 | 3.7% | $65,000,000 | 25.6% | 86 | 84 | 4.11 | 12.6% | 36.5% | 36.5% |
| 17 | 425 Eye Street | Washington, D.C. | $39,818,000 | 2.2% | $39,818,000 | 15.7% | 84 | 83 | 3.66 | 11.0% | 56.8% | 56.8% |
| 21 | Grede Casting Industrial Portfolio | Various | $30,000,000 | 1.7% | $30,000,000 | 11.8% | 84 | 82 | 3.25 | 13.2% | 58.5% | 58.5% |
| 42 | WoodSpring McDonough | McDonough, GA | $7,991,766 | 0.5% | $7,102,385 | 2.8% | 84 | 83 | 2.45 | 17.4% | 65.0% | 57.7% |
| Total / Weighted Average: | $267,809,766 | 15.1% | $266,920,385 | 105.3% | 84 | 83 | 3.52x | 13.0% | 53.5% | 53.3% | ||
| (1) | The table above presents the mortgage loans whose balloon payments would be applied to pay down the certificate balance of the Class A-3 Certificates, assuming a 0% CPR and applying the “Modeling Assumptions” described in the Preliminary Prospectus, including the assumptions that (i) none of the mortgage loans in the pool experience prepayments, defaults or losses; (ii) there are no extensions or forbearances of maturity dates or anticipated repayment dates of any mortgage loans in the pool; and (iii) each mortgage loan in the pool is paid in full on its stated maturity date or anticipated repayment date, as applicable. Each Class of Certificates, including the Class A-3 Certificates, evidences undivided ownership interests in the entire pool of mortgage loans. Debt service coverage ratio, debt yield and loan-to-value ratio information does not take into account subordinate debt (whether or not secured by the mortgaged property), if any, that exists or is allowed under the terms of any mortgage loan. See Annex A-1 to the Preliminary Prospectus. |
| (2) | Reflects the percentage equal to the Maturity Date Balance divided by the initial Class A-3 Certificate Balance. |
| (3) | In the case of Loan Nos. 2, 17 and 21, the UW NCF DSCR, UW NOI Debt Yield, Cut-off Date LTV and Maturity Date LTV calculations include the related Pari Passu Companion Loan. |
THE INFORMATION IN THIS STRUCTURAL AND COLLATERAL TERM SHEET IS NOT COMPLETE AND MAY BE AMENDED PRIOR TO THE TIME OF SALE. THIS TERM SHEET IS NOT AN OFFER TO SELL THESE SECURITIES AND IT IS NOT A SOLICITATION OF AN OFFER TO BUY THESE SECURITIES IN ANY JURISDICTION WHERE THE OFFER OR SALE IS NOT PERMITTED.
19 of 158
| Structural and Collateral Term Sheet | Benchmark 2022-B32 | |
| Collateral Characteristics | ||
| ■ Accrual: | Each Class of Certificates (other than the Class S and Class R Certificates) will accrue interest on a 30/360 basis. The Class S and Class R Certificates will not accrue interest. | |
| ■ Allocation between VRR Interest and the Non-VRR Certificates: | The aggregate amount available for distribution to holders of the non-VRR Certificates and the VRR Interest Owners on each Distribution Date will be: (i) the gross amount of interest, principal, yield maintenance charges and prepayment premiums collected with respect to the Mortgage Loans in the applicable one-month collection period (other than any excess interest accrued after the related anticipated repayment date on any mortgage loan with an anticipated repayment date), net of specified expenses of the issuing entity, including fees payable therefrom to, and losses, liabilities, costs and expenses reimbursable or indemnifiable therefrom to, the Master Servicer, the Special Servicer, the Certificate Administrator, the Trustee, the Operating Advisor, the Asset Representations Reviewer and CREFC®; and (ii) allocated to amounts available for distribution to the VRR Interest Owners, on the one hand, and amounts available for distribution to the holders of the remaining Certificates ((other than the Class RR, Class S and Class R certificates) (the “Non-VRR Certificates”)), on the other hand. On each Distribution Date, the portion of such aggregate available funds allocable to: (a) the VRR Interest will at all times be the product of such aggregate available funds multiplied by a fraction, expressed as a percentage, the numerator of which is the initial VRR interest balance of the VRR Interest, and the denominator of which is the aggregate initial Certificate Balances of the Principal Balance Certificates and the initial VRR Interest Balance of the VRR Interest (the “VRR Percentage”); and (b) the Non-VRR Certificates (the “Non-VRR Available Funds”) will at all times be the product of such aggregate available funds multiplied by the difference between 100% and the VRR Percentage (such difference, the “Non-VRR Percentage”). Any excess interest accrued after the related anticipated repayment date on any mortgage loan with an anticipated repayment date will, to the extent collected, be allocated between the VRR interest, on the one hand, and the Class S certificates, on the other hand, in accordance with their respective percentage allocation entitlement on the related Distribution Date. See “Credit Risk Retention” and “Description of the Certificates” in the Preliminary Prospectus. | |
| ■ Distribution of Interest: | On each Distribution Date, accrued interest for each Class of Non-VRR Certificates at the applicable pass-through rate will be distributed in the following order of priority to the extent of the Non-VRR Available Funds: first, to the Class A-1, Class A-2, Class A-2A1, Class A-3, Class A-4, Class A-5, Class A-SB, Class X-A, Class X-B, Class X-D, Class X-FG, Class X-H and Class X-NR Certificates (the “Senior Certificates”), on a pro rata basis, based on the interest entitlement for each such Class on such date, and then to the Class A-S, Class B, Class C, Class D, Class E, Class F, Class G, Class H, Class J and Class K Certificates, in that order, in each case until the interest entitlement for such date payable to each such Class is paid in full.
The pass-through rate applicable to the Class A-1, Class A-2, Class A-2A1, Class A-3, Class A-4, Class A-5, Class A-SB, Class A-S, Class B, Class C, Class D, Class E, Class F, Class G, Class H, Class J and Class K Certificates on each Distribution Date, will be a per annum rate equal to one of (i) a fixed rate, (ii) the weighted average of the net mortgage rates on the mortgage loans (in each case adjusted, if necessary, to accrue on the basis of a 360-day year consisting of twelve 30-day months), (iii) a variable rate equal to the lesser of a specified fixed pass-through rate and the rate described in clause (ii) above or (iv) the rate described in clause (ii) above less a specified percentage.
The pass-through rate for the Class X-A Certificates for any Distribution Date will be a per annum rate equal to the excess, if any, of (a) the weighted average of the net mortgage rates on the mortgage loans (in each case adjusted, if necessary, to accrue on the basis of a 360-day year consisting of twelve 30-day months), over (b) the weighted average of the pass-through rates on the Class A-1, Class A-2, Class A-2A1, Class A-3, Class A-4, Class A-5, Class A-SB and Class A-S Certificates for the related Distribution Date, weighted on the basis of their respective Certificate Balances outstanding immediately prior to that Distribution Date.
The pass-through rate for the Class X-B Certificates for any Distribution Date will be a per annum rate equal to the excess, if any, of (a) the weighted average of the net mortgage rates on the mortgage loans (in each case adjusted, if necessary, to accrue on the basis of a 360-day year consisting of twelve 30-day months), over (b) the weighted average of the pass-through rates on the Class B and Class C Certificates for the related Distribution Date weighted on the basis of their respective Certificate Balances outstanding immediately prior to that Distribution Date.
The pass-through rate for the Class X-D Certificates for any Distribution Date will be a per annum rate equal to the excess, if any, of (a) the weighted average of the net mortgage rates on the mortgage loans (in each case adjusted, if necessary, to accrue on the basis of a 360-day year consisting of twelve 30-day months), over (b) the weighted average of the pass-through |
THE INFORMATION IN THIS STRUCTURAL AND COLLATERAL TERM SHEET IS NOT COMPLETE AND MAY BE AMENDED PRIOR TO THE TIME OF SALE. THIS TERM SHEET IS NOT AN OFFER TO SELL THESE SECURITIES AND IT IS NOT A SOLICITATION OF AN OFFER TO BUY THESE SECURITIES IN ANY JURISDICTION WHERE THE OFFER OR SALE IS NOT PERMITTED.
20 of 158
| Structural and Collateral Term Sheet | Benchmark 2022-B32 | |
| Collateral Characteristics | ||
rates on the Class D and Class E Certificates for the related Distribution Date weighted on the basis of their respective Certificate Balances outstanding immediately prior to that Distribution Date.
The pass-through rate for the Class X-FG Certificates for any Distribution Date will be a per annum rate equal to the excess, if any, of (a) the weighted average of the net mortgage rates on the mortgage loans (in each case adjusted, if necessary, to accrue on the basis of a 360-day year consisting of twelve 30-day months), over (b) the weighted average of the pass-through rates on the Class F and Class G Certificates for the related Distribution Date weighted on the basis of their respective Certificate Balances outstanding immediately prior to that Distribution Date.
The pass-through rate for the Class X-H Certificates for any Distribution Date will be a per annum rate equal to the excess, if any, of (a) the weighted average of the net mortgage rates on the mortgage loans (in each case adjusted, if necessary, to accrue on the basis of a 360-day year consisting of twelve 30-day months), over (b) the pass-through rate on the Class H Certificates for the related Distribution Date.
The pass-through rate for the Class X-NR Certificates for any Distribution Date will be a per annum rate equal to the excess, if any, of (a) the weighted average of the net mortgage rates on the mortgage loans (in each case adjusted, if necessary, to accrue on the basis of a 360-day year consisting of twelve 30-day months), over (b) the weighted average of the pass-through rates on the Class J and Class K Certificates for the related Distribution Date weighted on the basis of their respective Certificate Balances outstanding immediately prior to that Distribution Date.
See “Description of the Certificates—Distributions” in the Preliminary Prospectus.
| ||
| ■ Distribution of Principal: | On any Distribution Date prior to the Cross-Over Date, payments in respect of the Non-VRR Percentage of principal on the Non-VRR Certificates will be distributed, up to the Non-VRR Available Funds:
first, to the Class A-SB Certificates until the Certificate Balance of the Class A-SB Certificates is reduced to the Class A-SB planned principal balance for the related Distribution Date set forth in Annex H to the Preliminary Prospectus, second, to the Class A-1 Certificates, until the Certificate Balance of such Class is reduced to zero, third, to the Class A-2 and Class A-2A1 Certificates, pro rata based on their respective Certificate Balances, until their Certificate Balances have been reduced to zero, fourth, to the Class A-3 Certificates, until the Certificate Balance of such Class is reduced to zero, fifth, to the Class A-4 Certificates, until the Certificate Balance of such Class is reduced to zero, sixth, to the Class A-5 Certificates until the Certificate Balance of such Class is reduced to zero, seventh, to the Class A-SB Certificates, until the Certificate Balance of such Class is reduced to zero and then to the Class A-S, Class B, Class C, Class D, Class E, Class F, Class G, Class H, Class J and Class K Certificates, in that order, until the Certificate Balance of each such Class is reduced to zero.
On any Distribution Date on or after the Cross-Over Date, payments in respect of the Non-VRR Percentage of principal on the Non-VRR Certificates will be distributed, up to the Non-VRR Available Funds, to the Class A-1, Class A-2, Class A-2A1, Class A-3, Class A-4, Class A-5 and Class A-SB Certificates, pro rata based on the Certificate Balance of each such Class until the Certificate Balance of each such Class is reduced to zero.
The “Cross-Over Date” means the Distribution Date on which the Certificate Balances of the Class A-S, Class B, Class C, Class D, Class E, Class F, Class G, Class H, Class J and Class K Certificates have been reduced to zero as a result of the allocation of realized losses to such Classes.
The Class X-A, Class X-B, Class X-D, Class X-FG, Class X-H and Class X-NR Certificates (the “Class X Certificates”) will not be entitled to receive distributions of principal; however, the notional amount of the Class X-A Certificates will be reduced by the aggregate amount of principal distributions, realized losses and trust fund expenses, if any, allocated to the Class A-1, Class A-2, Class A-2A1, Class A-3, Class A-4, Class A-5, Class A-SB and Class A-S Certificates, the notional amount of the Class X-B Certificates will be reduced by the aggregate amount of principal distributions, realized losses and trust fund expenses, if any, allocated to the Class B and Class C Certificates, the notional amount of the Class X-D Certificates will be reduced by the aggregate amount of principal distributions, realized losses and trust fund expenses, if any, allocated to the Class D and Class E Certificates, the notional amount of the
|
THE INFORMATION IN THIS STRUCTURAL AND COLLATERAL TERM SHEET IS NOT COMPLETE AND MAY BE AMENDED PRIOR TO THE TIME OF SALE. THIS TERM SHEET IS NOT AN OFFER TO SELL THESE SECURITIES AND IT IS NOT A SOLICITATION OF AN OFFER TO BUY THESE SECURITIES IN ANY JURISDICTION WHERE THE OFFER OR SALE IS NOT PERMITTED.
21 of 158
| Structural and Collateral Term Sheet | Benchmark 2022-B32 | |
| Collateral Characteristics | ||
Class X-FG Certificates will be reduced by the aggregate amount of principal distributions, realized losses and trust fund expenses, if any, allocated to the Class F and Class G Certificates, the notional amount of the Class X-H Certificates will be reduced by the aggregate amount of principal distributions, realized losses and trust fund expenses, if any, allocated to the Class H Certificates, and the notional amount of the Class X-NR Certificates will be reduced by the aggregate amount of principal distributions, realized losses and trust fund expenses, if any, allocated to the Class J and Class K Certificates.
See “Description of the Certificates—Distributions” in the Preliminary Prospectus.
| ||
| ■ Yield Maintenance / Fixed Penalty Allocation: | For purposes of the distribution of Yield Maintenance Charges on any Distribution Date, the Non-VRR Percentage of any Yield Maintenance Charges collected in respect of the mortgage loans will be allocated pro rata among certain groups (based on the aggregate amount of principal distributed to the Principal Balance Certificates in each group), consisting of (a) the Class A-1, Class A-2, Class A-2A1, Class A-3, Class A-4, Class A-5, Class A-SB, Class A-S and Class X-A Certificates ("YM Group A"), (b) the Class X-B, Class B and Class C Certificates (“YM Group B”) and (c) the Class X-D, Class D and Class E Certificates (“YM Group D”). As among the Classes of Certificates in each YM Group, each Class of Certificates entitled to distributions of principal will receive an amount calculated generally in accordance with the following formula and as more specifically described in the Preliminary Prospectus, with any remaining Yield Maintenance Charges on such Distribution Date being distributed to the class of Class X Certificates in such YM Group. YM Charge X Principal Paid to Class X (Pass-Through Rate on Class – Discount Rate) Total Principal Paid to the related YM Group (Mortgage Rate on Loan – Discount Rate) No Yield Maintenance Charges will be distributed to the Class X-FG, Class X-H, Class X-NR, Class F, Class G, Class H, Class J, Class K, Class R or Class S Certificates. Instead, after the Notional Amounts of the Class X-A, Class X-B and Class X-D certificates, and the Certificate Balances of the Class A-1, Class A-2, Class A-2A1, A-3, Class A-4, Class A-5, Class A-SB, Class A-S, Class B, Class C, Class D and Class E certificates have been reduced to zero, all prepayment premiums and Yield Maintenance Charges with respect to Mortgage Loans allocated to the Certificateholders will be distributed to holders of the Class X-D certificates. |
| YM Charge | X | Principal Paid to Class | X | (Pass-Through Rate on Class – Discount Rate) |
| Total Principal Paid to the related YM Group | (Mortgage Rate on Loan – Discount Rate) |
No Yield Maintenance Charges will be distributed to the Class X-FG, Class X-H, Class X-NR, Class F, Class G, Class H, Class J, Class K, Class R or Class S Certificates. Instead, after the Notional Amounts of the Class X-A, Class X-B and Class X-D certificates, and the Certificate Balances of the Class A-1, Class A-2, Class A-2A1, A-3, Class A-4, Class A-5, Class A-SB, Class A-S, Class B, Class C, Class D and Class E certificates have been reduced to zero, all prepayment premiums and Yield Maintenance Charges with respect to Mortgage Loans allocated to the Certificateholders will be distributed to holders of the Class X-D certificates.
| ||
| ■ Realized Losses: | On each Distribution Date, the Non-VRR Percentage of losses on the mortgage loans will be allocated first to the Class K, Class J, Class H, Class G, Class F, Class E, Class D, Class C, Class B and Class A-S Certificates, in that order, in each case until the Certificate Balance of all such Classes have been reduced to zero, and then, to the Class A-1, Class A-2, Class A-2A1, Class A-3, Class A-4, Class A-5 and Class A-SB Certificates, pro rata, based on the Certificate Balance of each such Class, until the Certificate Balance of each such Class has been reduced to zero. The notional amounts of the Class X-A, Class X-B, Class X-D, Class X-FG, Class X-H and Class X-NR Certificates will be reduced by the aggregate amount of realized losses allocated to Certificates that are components of the notional amounts of the Class X-A, Class X-B, Class X-D, Class X-FG, Class X-H and Class X-NR Certificates, respectively.
Losses on each Whole Loan will be allocated first, to any related subordinate companion loan(s) (if any) until reduced to zero and then to the related mortgage loan and any related pari passu companion loans, pro rata, based on their respective principal balances.
See “Description of the Certificates—Distributions” in the Preliminary Prospectus. | |
| ■ Interest Shortfalls: | A shortfall with respect to the amount of available funds distributable in respect of interest can result from, among other sources: (a) delinquencies and defaults by borrowers; (b) shortfalls resulting from the application of appraisal reductions to reduce P&I Advances; (c) shortfalls resulting from interest on Advances made by the Master Servicer, the Special Servicer or the Trustee; (d) shortfalls resulting from the payment of Special Servicing Fees and other additional compensation that the Special Servicer is entitled to receive; (e) shortfalls resulting from extraordinary expenses of the trust, including indemnification payments payable to the Depositor, the Master Servicer, the Special Servicer, the Certificate Administrator, the Trustee, the Operating Advisor and the Asset Representations Reviewer; (f) shortfalls resulting from a modification of a mortgage loan’s interest rate or principal balance; and (g) shortfalls resulting from other unanticipated or default-related expenses of the trust. Any such shortfalls that decrease the amount of available funds distributable in respect of interest to the Certificateholders will reduce distributions to the classes of Certificates (other than the Class R |
THE INFORMATION IN THIS STRUCTURAL AND COLLATERAL TERM SHEET IS NOT COMPLETE AND MAY BE AMENDED PRIOR TO THE TIME OF SALE. THIS TERM SHEET IS NOT AN OFFER TO SELL THESE SECURITIES AND IT IS NOT A SOLICITATION OF AN OFFER TO BUY THESE SECURITIES IN ANY JURISDICTION WHERE THE OFFER OR SALE IS NOT PERMITTED.
22 of 158
| Structural and Collateral Term Sheet | Benchmark 2022-B32 | |
| Collateral Characteristics | ||
Certificates) beginning with those with the lowest payment priorities, in reverse sequential order. See “Description of the Certificates—Distributions—Priority of Distributions” in the Preliminary Prospectus.
| ||
| ■ Appraisal Reduction Amounts: | With respect to mortgage loans serviced under the Pooling and Servicing Agreement, upon the occurrence of certain trigger events with respect to a mortgage loan, which are generally tied to certain events of default under the related mortgage loan documents, the Special Servicer will be obligated to obtain an appraisal of the related mortgaged property and the Special Servicer (prior to the occurrence of a Consultation Termination Event and only with respect to any Mortgage Loan other than an Excluded Loan, in consultation with the Directing Certificateholder) will calculate the Appraisal Reduction Amount. The “Appraisal Reduction Amount” is generally the amount by which the current principal balance of the related mortgage loan or serviced whole loan, plus outstanding advances, real estate taxes, unpaid servicing fees and certain similar amounts exceeds the sum of (a) 90% of the appraised value of the related mortgaged property, (b) the amount of any escrows, letters of credit and reserves as of the date of calculation and (c) all insurance and casualty proceeds and condemnation awards that are collateral for the related mortgage loan or serviced whole loan.
With respect to the Non-Serviced Whole Loans, any Appraisal Reduction Amount will be similarly determined pursuant to the related trust and servicing agreement or pooling and servicing agreement, as applicable, under which it is serviced.
In general, the Non-VRR Percentage of any Appraisal Reduction Amount that is allocated to a mortgage loan is notionally allocated to reduce, in reverse sequential order, the Certificate Balance of each Class of Certificates (other than the Class A-1, Class A-2, Class A-2A1, Class A-3, Class A-4, Class A-5 and Class A-SB Certificates) beginning with the Class K Certificates for certain purposes, including certain voting rights and the determination of the controlling class. As a result of calculating one or more Appraisal Reduction Amounts (and, in the case of any Whole Loan, to the extent allocated to the related mortgage loan), the amount of any required P&I Advance will be reduced, which will have the effect of reducing the amount of interest available to the most subordinate class of certificates then-outstanding (i.e., first, to Class K Certificates; second, to the Class J Certificates; third, to the Class H Certificates; fourth, to the Class G Certificates; fifth, to the Class F Certificates; sixth, to the Class E Certificates; seventh, to the Class D Certificates; eighth, to the Class C Certificates; ninth to the Class B Certificates; tenth, to the Class A-S Certificates; and finally, pro rata based on their respective interest entitlements, to the Senior Certificates).
With respect to each Serviced Whole Loan, the Appraisal Reduction Amount is notionally allocated, first, to any related serviced subordinate companion loan(s), (if any), then pro rata, between the related mortgage loan and any related serviced pari passu companion loan(s), based upon their respective principal balances.
Except as described in the Preliminary Prospectus, no event, circumstance or action that has occurred or will occur with respect to a COVID modified loan or the entry into of a COVID modification agreement will constitute an appraisal reduction event, but only if, and for so long as, the related borrower and each related obligor is in compliance with the terms of the related COVID modification agreement. See “Pooling and Servicing Agreement—Appraisal Reduction Amounts” in the Preliminary Prospectus.
| |
| ■ Master Servicer Advances: | The Master Servicer will be required to advance certain delinquent scheduled mortgage loan payments of principal and interest and certain property protection advances, in each case, to the extent the Master Servicer deems such advances to be recoverable. At any time that an Appraisal Reduction Amount exists, the amount that would otherwise be required to be advanced by the Master Servicer in respect of delinquent payments of interest on any mortgage loan will be reduced to equal the product of (x) the interest portion of the amount that would be advanced without regard to any Appraisal Reduction Amount and (y) a fraction, expressed as a percentage, the numerator of which is the then-outstanding principal balance of the mortgage loan, as applicable, minus the Appraisal Reduction Amount and the denominator of which is the then-outstanding principal balance of the mortgage loan. The Master Servicer will not make any principal or interest advances with respect to any companion loan that is not held by the issuing entity.
| |
| ■ Whole Loans: | Eighteen mortgage loans are each evidenced by one mortgage loan and one or more companion loans (each a “Companion Loan” and collectively with the relatedmortgage loan, a “Whole Loan”), secured by the same mortgage(s) on the related mortgaged property(ies). Each |
THE INFORMATION IN THIS STRUCTURAL AND COLLATERAL TERM SHEET IS NOT COMPLETE AND MAY BE AMENDED PRIOR TO THE TIME OF SALE. THIS TERM SHEET IS NOT AN OFFER TO SELL THESE SECURITIES AND IT IS NOT A SOLICITATION OF AN OFFER TO BUY THESE SECURITIES IN ANY JURISDICTION WHERE THE OFFER OR SALE IS NOT PERMITTED.
23 of 158
| Structural and Collateral Term Sheet | Benchmark 2022-B32 | |
| Collateral Characteristics | ||
such mortgage loan and its related Companion Loan(s) are subject to an intercreditor agreement. None of these Companion Loans will be part of the trust.
In the case of all of the Whole Loans, referred to as the “Old Chicago Post Office Whole Loan”, the “Bedrock Portfolio Whole Loan”, the “CX – 350 & 450 Water Street Whole Loan”, the “One Wilshire Whole Loan”, the “JW Marriott Desert Springs Whole Loan”, the “Woodmore Towne Centre Whole Loan”, “The Summit Whole Loan”, the “Moonwater Office Portfolio Whole Loan”, the “Novo Nordisk HQ Whole Loan”, “The Kirby Collection Whole Loan”, the “425 Eye Street Whole Loan”, the “ExchangeRight Net Leased Portfolio #53 Whole Loan”, the “Glen Forest Office Portfolio Whole Loan”, the “Grede Casting Industrial Portfolio Whole Loan”, the “601 Lexington Avenue Whole Loan”, the “Nyberg Portfolio Whole Loan”, the “Sara Lee Portfolio Whole Loan”, and the “Charcuterie Artisans SLB Whole Loan” one or more related Companion Loans are pari passu with the related mortgage loan (these Companion Loans are also referred to as the “Pari Passu Companion Loans”). In the case of each of the Old Chicago Post Office Whole Loan, the CX – 350 & 450 Water Street Whole Loan, The Summit Whole Loan and the 601 Lexington Avenue Whole Loan, one or more related Companion Loans are subordinate in right of payment to the related mortgage loan and any related Pari Passu Companion Loans (these Companion Loans are also referred to as the “Subordinate Companion Loans”).
The Old Chicago Post Office Whole Loan, the CX – 350 & 450 Water Street Whole Loan, The Summit Whole Loan, the Novo Nordisk HQ Whole Loan, the 425 Eye Street Whole Loan, the 601 Lexington Avenue Whole Loan, the Nyberg Portfolio Whole Loan, the Sara Lee Portfolio Whole Loan and the Charcuterie Artisans SLB Whole Loan (each, a “Non-Serviced Whole Loan”) are being serviced and administered pursuant to the applicable trust and servicing agreement or pooling and servicing agreement, as applicable, as described under “Description of the Mortgage Pool—The Whole Loans—The Non-Serviced Pari Passu Whole Loans”, “—The Non-Serviced AB Whole Loans” and “Pooling and Servicing Agreement—Servicing of the Non-Serviced Mortgage Loans” in the Preliminary Prospectus.
The Exchange Right Net Leased Portfolio #53 Whole Loan, (the “Servicing Shift Whole Loan”, and the related mortgage loan, a “Servicing Shift Mortgage Loan”) will initially be serviced pursuant to the Pooling and Servicing Agreement. After the securitization of the related controlling companion loan, the related Servicing Shift Whole Loan is expected to be serviced pursuant to the pooling and servicing agreement relating to the securitization of such controlling companion loan as described under “Description of the Mortgage Pool—The Whole Loans—The Serviced Pari Passu Whole Loans”, “—The Non-Serviced Pari Passu Whole Loans” and “Pooling and Servicing Agreement—Servicing of the Non-Serviced Mortgage Loans” in the Preliminary Prospectus.
| ||
| ■ Highlighted Servicing Provisions: | The following are certain servicing provisions of note:
A mortgage loan may become a specially serviced loan as a result of an imminent or reasonably foreseeable default only if the Master Servicer or, if Midland is not both the Special Servicer and the Master Servicer, the Special Servicer determines such default is not likely to be cured by the related borrower within 60 days.
A mortgage loan will not become a specially serviced loan for up to 120 days in circumstances where the related borrower does not make its balloon payment at maturity upon satisfaction of certain conditions, including that the borrower has, prior to such maturity date, provided documentation from an acceptable lender, including, without limitation, an executed term sheet or refinancing commitment or an executed purchase and sale agreement, in each case, that is consistent with CMBS market practices and is reasonably satisfactory in form and substance to the Master Servicer or the Special Servicer evidencing an expected refinancing of the mortgage loan or sale of the related mortgaged property.
The Special Servicer will not be entitled to any fees from the securitization trust or the related borrower during a fee restricted period, other than a special servicing fee, and, in certain circumstances described in the succeeding paragraph, a liquidation fee, if the Special Servicer elects to cause a mortgage loan to be transferred to special servicing as a result of an imminent or reasonably foreseeable default when the Master Servicer has not independently transferred the mortgage loan to special servicing for that reason.
Notwithstanding the foregoing, the special servicer may be entitled to a liquidation fee if it transfers a mortgage loan into special servicing as described above and a default occurs that leads to a liquidation of the applicable mortgage loan. |
THE INFORMATION IN THIS STRUCTURAL AND COLLATERAL TERM SHEET IS NOT COMPLETE AND MAY BE AMENDED PRIOR TO THE TIME OF SALE. THIS TERM SHEET IS NOT AN OFFER TO SELL THESE SECURITIES AND IT IS NOT A SOLICITATION OF AN OFFER TO BUY THESE SECURITIES IN ANY JURISDICTION WHERE THE OFFER OR SALE IS NOT PERMITTED.
24 of 158
| Structural and Collateral Term Sheet | Benchmark 2022-B32 | |
| Collateral Characteristics | ||
In order to streamline the servicing and administration of the mortgage loans with the goal of reducing the amount of time a CMBS borrower has to wait for certain approvals from the lender, “major decisions” will be administered solely by the Special Servicer, thereby reducing the number of parties involved in the approval process. Under these updated terms, the Special Servicer will be directly responsible for obtaining the consent of the Directing Certificateholder for “major decisions” involving all mortgage loans, rather than requiring the Master Servicer’s involvement in the approval process for Non-Specially Serviced Loans. In prior CMBS transactions, the master servicer would commonly prepare a recommendation related to a particular approval and be required to obtain the consent of the special servicer (who, in turn, would commonly be required to obtain the consent of the Directing Certificateholder before providing its consent to the master servicer) prior to taking any action with respect to that “major decision”.
In addition, certain revisions have been incorporated in the scope of the “major decisions” in the Preliminary Prospectus, that limit the involvement of the Directing Certificateholder in (1) the replacement of the related property management company, (2) the approval of releases of certain performance escrows and earnouts, and (3) the consent to modifications of any mezzanine intercreditor agreement in circumstances when the Directing Certificateholder is affiliated with the mezzanine lender.
The Certificate Administrator will be required to identify the then-current Directing Certificateholder as part of its monthly distribution date statement.
See “Description of the Certificates” and “Pooling and Servicing Agreement” in the Preliminary Prospectus. | ||
| ■ Liquidated Loan Waterfall: | On liquidation of any mortgage loan, all net liquidation proceeds related to the mortgage loan (but not any related Companion Loan) will be applied so that amounts allocated as a recovery of accrued and unpaid interest will not, in the first instance, include any delinquent interest that was not advanced as a result of Appraisal Reduction Amounts or interest that accrued on any junior note(s) if such mortgage loan is an AB Modified Loan. After the adjusted interest amount is so allocated, any remaining liquidation proceeds will be allocated to offset certain advances and to pay principal on the mortgage loan until the unpaid principal amount of the mortgage loan has been reduced to zero. Any remaining liquidation proceeds will then be allocated to pay delinquent interest that was not advanced as a result of Appraisal Reduction Amounts and any interest that accrued on any junior note(s) if such mortgage loan is an AB Modified Loan. Any liquidation proceeds in respect of each such mortgage loan in excess of the related outstanding balance will first be applied to offset any interest shortfalls allocated to the Certificates (other than the Class R Certificates), in sequential order, and then to offset any realized losses allocated to the Certificates (other than the Class R Certificates), in sequential order. Any liquidation proceeds remaining after such applications will be distributed to the Class R Certificates.
| |
| ■ Sale of Defaulted Loans and REO Properties: | The Special Servicer is required to solicit offers for any defaulted loan (other than a non-serviced mortgage loan) in such a manner as will be reasonably likely to maximize the value of the defaulted loan on a net present value basis, if the Special Servicer determines that no satisfactory arrangements can be made for collection of delinquent payments and the sale would be in the best economic interests of the Certificateholders and the RR Interest Owners (or, in the case of any Serviced Whole Loan, the Certificateholders, the RR Interest Owners and any holders of the related serviced Companion Loans, as a collective whole, taking into account the pari passu or subordinate nature of such serviced Companion Loans), on a net present value basis. Additionally, the Special Servicer may offer to sell any REO property if, and when, the Special Servicer determines that such a sale would be in the best economic interest of the issuing entity and the holders of any related Companion Loans, on a net present value basis.
In the case of each non-serviced mortgage loan, under certain circumstances permitted under the related intercreditor agreement, to the extent that such non-serviced mortgage loan is not sold together with the related non-serviced companion loan by the special servicer for the related Non-Serviced Whole Loans, the Special Servicer will be entitled to sell (with respect to any mortgage loan other than an Excluded Loan, with the consent of the Directing Certificateholder if no Control Termination Event has occurred and is continuing) such non-serviced mortgage loan if it determines in accordance with the servicing standard that such action would be in the best interests of the Certificateholders and the RR Interest Owners.
The Special Servicer is required to accept a cash offer received from any person for any defaulted loan or REO property in an amount at least equal to par plus accrued interest plus all |
THE INFORMATION IN THIS STRUCTURAL AND COLLATERAL TERM SHEET IS NOT COMPLETE AND MAY BE AMENDED PRIOR TO THE TIME OF SALE. THIS TERM SHEET IS NOT AN OFFER TO SELL THESE SECURITIES AND IT IS NOT A SOLICITATION OF AN OFFER TO BUY THESE SECURITIES IN ANY JURISDICTION WHERE THE OFFER OR SALE IS NOT PERMITTED.
25 of 158
| Structural and Collateral Term Sheet | Benchmark 2022-B32 | |
| Collateral Characteristics | ||
other outstanding amounts due under such mortgage loan and any outstanding expenses of the trust relating to such mortgage loan (the “Purchase Price”) except as described in the Preliminary Prospectus.
With respect to the Serviced Whole Loans, any such sale of the related defaulted loan is required to also include any related Companion Loans, if any, and the prices will be adjusted accordingly.
Within 30 days of a defaulted loan becoming a specially serviced loan, the Special Servicer is required to order an appraisal and, within 30 days of receipt of such appraisal, is required to determine the fair value of such defaulted loan in accordance with the applicable servicing standard. If, however, the Special Servicer is already in the process of obtaining an appraisal with respect to the related mortgaged property, the Special Servicer is required to make its fair value determination as soon as reasonably practicable (but in any event within 30 days) after its receipt of such appraisal. Additionally, with respect to the mortgage loans that have mezzanine debt or permit mezzanine debt in the future, the mezzanine lenders may have the option to purchase the related mortgage loan after certain events of default under such mortgage loan.
The Directing Certificateholder will not have a right of first refusal to purchase a defaulted loan.
If the Special Servicer does not receive a cash offer at least equal to the Purchase Price, the Special Servicer may purchase the defaulted loan or REO property at the Purchase Price. If the Special Servicer does not purchase the defaulted loan or REO property at the Purchase Price, the Special Servicer is required to accept the highest offer received from any person that is determined to be a fair price (supported by an appraisal required to be obtained by the Special Servicer within 30 days of a mortgage loan becoming a specially serviced loan) for such defaulted loan or REO property, if the highest offeror is a person other than an Interested Person. If the highest offer is made by an Interested Person, the Trustee will determine (based upon the most recent appraisal or updated appraisal conducted in accordance with the terms of the Pooling and Servicing Agreement) whether the offer constitutes a fair price for the defaulted loan or REO property provided that no offer from an Interested Person will constitute a fair price unless (A) it is the highest offer received and (B) if the offer is less than the applicable Purchase Price, at least two other offers are received from independent third parties and the Trustee may conclusively rely on the opinion of an independent appraiser or other independent expert retained by the Trustee in connection with making such determination. Neither the Trustee nor any of its affiliates may make an offer for or purchase any specially serviced loan or REO property. An “Interested Person” is any person that is (i) a party to the Pooling and Servicing Agreement, the Directing Certificateholder, any Risk Retention Consultation Party, any sponsor, any Borrower Party, any independent contractor engaged by the Special Servicer, any holder of a mezzanine loan (but only with respect to the related mortgage loan) or any known affiliate of any such person or, (ii) with respect to a defaulted whole loan, the depositor, the master servicer, the special servicer (or independent contractor engaged by such special servicer) or the trustee for any securitization that includes a related Companion Loan and each holder of any related Companion Loan, or any known affiliate of any such person.
The Special Servicer is not required to accept the highest offer for a defaulted loan or REO property if the Special Servicer determines, in accordance with the servicing standard (and subject to the requirements of any related intercreditor agreement), that a rejection of such offer would be in the best interests of the Certificateholders, the RR Interest Owners and, with respect to any Serviced Whole Loan, the holder of the related Companion Loans, as a collective whole, as if such Certificateholders, the RR Interest Owners and, if applicable, the related Companion Loan Holder(s) constituted a single lender), and may accept a lower offer (so long as such lower offer was not made by the Special Servicer or any of its affiliates) if it determines that acceptance of such lower offer would be in the best interests of the Certificateholders, the RR Interest Owners and, with respect to any Serviced Whole Loan, the holder of the related Companion Loans, as a collective whole, as if such Certificateholders and, if applicable, the related Companion Loan Holder(s) constituted a single lender).
If title to any mortgaged property is acquired by the trust fund, the Special Servicer will be required to sell such mortgaged property prior to the close of the third calendar year beginning after the year of acquisition, unless (a) the IRS grants (or has not denied) a qualifying extension of time to sell such mortgaged property or (b) the Special Servicer obtains for the Trustee, the Certificate Administrator and the Master Servicer an opinion of independent counsel to the effect that the holding of the property by the trust longer than the above-referenced three-year period will not result in the imposition of a tax on any REMIC of the trust fund or cause any REMIC of the trust fund to fail to qualify as a REMIC. |
THE INFORMATION IN THIS STRUCTURAL AND COLLATERAL TERM SHEET IS NOT COMPLETE AND MAY BE AMENDED PRIOR TO THE TIME OF SALE. THIS TERM SHEET IS NOT AN OFFER TO SELL THESE SECURITIES AND IT IS NOT A SOLICITATION OF AN OFFER TO BUY THESE SECURITIES IN ANY JURISDICTION WHERE THE OFFER OR SALE IS NOT PERMITTED.
26 of 158
| Structural and Collateral Term Sheet | Benchmark 2022-B32 | |
| Collateral Characteristics | ||
The foregoing applies to mortgage loans serviced under the Pooling and Servicing Agreement. With respect to each Non-Serviced Whole Loan, if the special servicer under the applicable trust and servicing agreement or pooling and servicing agreement determines to sell the related Companion Loan(s) as described above, then the applicable special servicer will be required to sell the related non-serviced mortgage loan included in the Benchmark 2022-B32 trust, and the related Companion Loan(s), as a single loan. In connection with any such sale, the then-applicable special servicer will be required to follow procedures substantially similar to those set forth above.
| ||
| ■ Control Eligible Certificates: | Classes F, G, H, J and K.
| |
| ■ Control Rights: | The Control Eligible Certificates will have certain control rights attached to them. The “Directing Certificateholder” will be, (A) with respect to each serviced mortgage loan (other than any Servicing Shift Mortgage Loan), the Controlling Class Certificateholder (or its representative) selected by more than 50% of the Controlling Class Certificateholders; provided, however, that (1) absent that selection, (2) until a Directing Certificateholder is so selected or (3) upon receipt of a notice from a majority of the Controlling Class Certificateholders that a Directing Certificateholder is no longer designated, the Controlling Class Certificateholder that owns the largest aggregate Certificate Balance of the Controlling Class (or its representative) will be the Directing Certificateholder; provided, however, that in the case of this clause (3), in the event no one holder owns the largest aggregate Certificate Balance of the Controlling Class, then there will be no Directing Certificateholder until appointed in accordance with the terms of the Pooling and Servicing Agreement and (B) with respect to any Servicing Shift Mortgage Loan, the related “controlling holder” or any analogous concept under the related intercreditor agreement, which prior to the securitization of the related controlling companion loan will be the holder of such companion loan. With respect to any mortgage loan (other than any Excluded Loan), unless a Control Termination Event has occurred and is continuing, the Directing Certificateholder will be entitled to direct the Special Servicer to take, or refrain from taking, certain actions with respect to such mortgage loan. Furthermore, the Directing Certificateholder will also have the right to receive notice and provide consent with respect to certain material actions that the Master Servicer and the Special Servicer plan on taking with respect to a mortgage loan (other than any non-serviced mortgage loan, any Servicing Shift Mortgage Loan or any Excluded Loan). With respect to any mortgage loan that has or may in the future have mezzanine debt, pursuant to the related intercreditor agreement, the related mezzanine lender may have certain consent rights with respect to certain modifications related to such mortgage loan.
A “Borrower Party” means a borrower, a mortgagor, a manager of a mortgaged property, an Accelerated Mezzanine Loan Lender, or any Borrower Party Affiliate.
A “Borrower Party Affiliate” means, with respect to a borrower, a mortgagor, a manager of a Mortgaged Property or an Accelerated Mezzanine Loan Lender, (a) any other person controlling or controlled by or under common control with such borrower, mortgagor, manager or Accelerated Mezzanine Loan Lender, as applicable, or (b) any other person owning, directly or indirectly, 25% or more of the beneficial interests in such borrower, mortgagor, manager or Accelerated Mezzanine Loan Lender, as applicable. For purposes of this definition, “control” when used with respect to any specified person means the power to direct the management and policies of such person, directly or indirectly, whether through the ownership of voting securities, by contract or otherwise and the terms “controlling” and “controlled” have meanings correlative to the foregoing.
An “Accelerated Mezzanine Loan Lender” means a mezzanine lender under a mezzanine loan that has been accelerated or as to which foreclosure or enforcement proceedings have been commenced against the equity collateral pledged to secure such mezzanine loan.
An “Excluded Loan” means (a) with respect to the Directing Certificateholder, a Mortgage Loan or Whole Loan with respect to which the Directing Certificateholder or the holder of the majority of the Controlling Class is a Borrower Party or (b) with respect to any Risk Retention Consultation Party, a Mortgage Loan or Whole Loan with respect to which, as of the applicable date of determination, such Risk Retention Consultation Party or the person entitled to appoint such Risk Retention Consultation Party or the applicable VRR Interest owner is a Borrower Party. As of the Closing Date, it is expected that there will be no Excluded Loans in this securitization.
With respect to the Serviced Whole Loans, direction, consent and consultation rights with respect to the related Whole Loan are subject to certain consultation rights of the holders of the related Pari Passu Companion Loans pursuant to the related intercreditor agreement. |
THE INFORMATION IN THIS STRUCTURAL AND COLLATERAL TERM SHEET IS NOT COMPLETE AND MAY BE AMENDED PRIOR TO THE TIME OF SALE. THIS TERM SHEET IS NOT AN OFFER TO SELL THESE SECURITIES AND IT IS NOT A SOLICITATION OF AN OFFER TO BUY THESE SECURITIES IN ANY JURISDICTION WHERE THE OFFER OR SALE IS NOT PERMITTED.
27 of 158
| Structural and Collateral Term Sheet | Benchmark 2022-B32 | |
| Collateral Characteristics | ||
With respect to any Non-Serviced Whole Loan, direction, consent and consultation rights with respect to the related Whole Loan will be exercised by the directing certificateholder or controlling class representative under the applicable trust and servicing agreement or pooling and servicing agreement or the holder of the related controlling Companion Loan, as applicable. | ||
| With respect to any Servicing Shift Whole Loan, direction, consent and consultation rights with respect to the related Whole Loan will be exercised by the related controlling noteholder and, after the securitization of the related controlling note, the applicable directing holder pursuant to the applicable pooling and servicing agreement and related intercreditor agreement. | ||
| ■ Directing Certificateholder: | Ellington Management Group, LLC (or an affiliate) is expected to be appointed as the initial directing certificateholder with respect to all serviced mortgage loans (other than any Excluded Loans and any Servicing Shift Mortgage Loans). | |
| ■ Controlling Class: | The “Controlling Class” will at any date of determination be the most subordinate Class of Control Eligible Certificates then outstanding that has an aggregate Certificate Balance, as notionally reduced by any Cumulative Appraisal Reduction Amounts allocable to such Class, equal to no less than 25% of the initial Certificate Balance for such Class; provided that if at any time the Certificate Balances of the certificates (other than the Control Eligible Certificates and the Class RR Certificates) have been reduced to zero as a result of the allocation of principal payments on the mortgage loans, then the Controlling Class will be the most subordinate Class among the Control Eligible Certificates that has an aggregate Certificate Balance greater than zero without regard to any Cumulative Appraisal Reduction Amounts. The Controlling Class as of the Closing Date will be the Class K Certificates.
Each holder of a certificate of the Controlling Class is referred to herein as a “Controlling Class Certificateholder”.
| |
| ■ Control Termination Event: | A “Control Termination Event” will occur with respect to any serviced Mortgage Loan, when the Class F Certificates have a Certificate Balance (taking into account the application of any Cumulative Appraisal Reduction Amounts to notionally reduce the Certificate Balance of such class) of less than 25% of the initial Certificate Balance of that class; provided that prior to the applicable securitization of the controlling Companion Loan with respect to a Servicing Shift Whole Loan, no Control Termination Event may occur with respect to the Directing Certificateholder related to such Servicing Shift Whole Loan, and the term “Control Termination Event” will not be applicable to the Directing Certificateholder related to such Servicing Shift Whole Loan; provided, further, that a Control Termination Event will not be deemed to be continuing in the event the Certificate Balances of all Classes of Principal Balance Certificates (other than the Control Eligible Certificates and the Class RR Certificates) have been reduced to zero.
The “Cumulative Appraisal Reduction Amount” as of any date of determination, is equal to the sum of (i) with respect to any mortgage loan, all Appraisal Reduction Amounts then in effect, and (ii) with respect to any AB Modified Loan, any Collateral Deficiency Amount then in effect.
An “AB Modified Loan” means any corrected loan (1) that became a corrected loan (which includes for purposes of this definition any non-serviced mortgage loan that became a “corrected loan” (or any term substantially similar thereto) pursuant to the trust and servicing agreement or pooling and servicing agreement, as applicable, governing such non-serviced mortgage loan) due to a modification thereto that resulted in the creation of an A/B note structure (or similar structure) and as to which the new junior note(s) did not previously exist or the principal amount of the new junior note(s) was previously part of either an A note held by the issuing entity or the original unmodified mortgage loan and (2) as to which an Appraisal Reduction Amount is not in effect.
The “Collateral Deficiency Amount” means, with respect to any AB Modified Loan as of any date of determination, the excess of (i) the principal balance of such AB Modified Loan (taking into account the related junior note(s) and any pari passu notes included therein), over (ii) the sum of (in the case of a Whole Loan, solely to the extent allocable to the subject mortgage loan) (x) the most recent Appraised Value for the related mortgaged property or mortgaged properties, plus (y) solely to the extent not reflected or taken into account in such Appraised Value and to the extent on deposit with, or otherwise under the control of, the lender as of the date of such determination, any capital or additional collateral contributed by the related borrower at the time the mortgage loan became (and as part of the modification related to) such AB Modified Loan for the benefit of the related mortgaged property or mortgaged properties (provided that in the case of a non-serviced mortgage loan, the amounts set forth in this clause (y) will be taken into |
THE INFORMATION IN THIS STRUCTURAL AND COLLATERAL TERM SHEET IS NOT COMPLETE AND MAY BE AMENDED PRIOR TO THE TIME OF SALE. THIS TERM SHEET IS NOT AN OFFER TO SELL THESE SECURITIES AND IT IS NOT A SOLICITATION OF AN OFFER TO BUY THESE SECURITIES IN ANY JURISDICTION WHERE THE OFFER OR SALE IS NOT PERMITTED.
28 of 158
| Structural and Collateral Term Sheet | Benchmark 2022-B32 | |
| Collateral Characteristics | ||
account solely to the extent relevant information is received by the Special Servicer), plus (z) any other escrows or reserves (in addition to any amounts set forth in the immediately preceding clause (y)) held by the lender in respect of such AB Modified Loan as of the date of such determination.
Upon the occurrence and during the continuance of a Control Termination Event, the Controlling Class will no longer have any control rights and the Directing Certificateholder will relinquish its right to direct certain actions of the Special Servicer and will no longer have consent rights with respect to certain actions that the Master Servicer or the Special Servicer plan on taking with respect to a mortgage loan. Following the occurrence and during the continuance of a Control Termination Event, the Directing Certificateholder will retain consultation rights with the Special Servicer with respect to certain material actions that the Special Servicer plans on taking with respect to any mortgage loan other than an Excluded Loan. Such consultation rights will continue until the occurrence of a Consultation Termination Event.
| ||
| ■ Consultation Termination Event: | A “Consultation Termination Event” will occur with respect to any serviced Mortgage Loan, when there is no class of Control Eligible Certificates that has a then-outstanding Certificate Balance at least equal to 25% of the initial Certificate Balance of that class, in each case, without regard to the application of any Cumulative Appraisal Reduction Amounts; provided that prior to the applicable securitization of the controlling Companion Loan with respect to a Servicing Shift Whole Loan, no Consultation Termination Event may occur with respect to with respect to the Directing Certificateholder related to such Servicing Shift Whole Loan, and the term “Consultation Termination Event” will not be applicable to the Directing Certificateholder related to such Servicing Shift Whole Loan; provided, further, that a Consultation Termination Event will not be deemed to be continuing in the event the Certificate Balances of all Classes of Principal Balance Certificates (other than the Control Eligible Certificates and the Class RR Certificates) have been reduced to zero.
Upon the occurrence of a Consultation Termination Event, there will be no Class of Certificates that will act as the Controlling Class and the Directing Certificateholder will have no rights under the Pooling and Servicing Agreement, other than those rights generally available to all Certificateholders.
| |
| ■ Risk Retention Consultation Parties: | The risk retention consultation parties will have certain non-binding consultation rights with respect to certain material servicing actions. The owners of the VRR Interest, which is expected to be transferred by the depositor on the Closing Date to JPMCB, CREFI, DBRI and GSBI or its respective “majority-owned affiliate”, will each be entitled to appoint a risk retention consultation party. JPMCB, CREFI, DBNY and GSMC are expected to be appointed as the initial risk retention consultation parties. | |
| ■ Appraised-Out Class: | A Class of Control Eligible Certificates that has been determined, as a result of Appraisal Reduction Amounts or Collateral Deficiency Amounts allocable to such Class, to no longer be the Controlling Class. | |
| ■ Remedies Available to Holders of an Appraised-Out Class: | Holders of the majority of any Appraised-Out Class will have the right, at their sole expense, to require the Special Servicer to order a supplemental appraisal report from an MAI appraiser (selected by the Special Servicer) for any mortgage loan (or Serviced Whole Loan) that results in the Class becoming an Appraised-Out Class.
Upon receipt of that supplemental appraisal, the Special Servicer will be required to determine, in accordance with the Servicing Standard, whether, based on its assessment of the supplemental appraisal, any recalculation of the Appraisal Reduction Amount or Collateral Deficiency Amount is warranted, and if so warranted, the Master Servicer will be required to recalculate the Appraisal Reduction Amount or Collateral Deficiency Amount, as applicable, based on the supplemental appraisal and if required by such recalculation, the Appraised-Out Class will be reinstated as the Controlling Class. The holders of an Appraised-Out Class requesting a supplemental appraisal are not permitted to exercise any control or consent rights of the Controlling Class until such time, if any, as the Class is reinstated as the Controlling Class.
| |
| ■ Operating Advisor: | The Operating Advisor will initially be Pentalpha Surveillance LLC. The Operating Advisor will have access to any final asset status report and information available with respect to the transaction on the certificate administrator’s website and will have certain monitoring responsibilities on behalf of the entire issuing entity. During the continuance of a Control Termination Event, the Operating Advisor will be entitled to consult with the Special Servicer with respect to certain major decisions on behalf of the issuing entity and in the best interest of, and for the benefit of, the certificateholders, the RR Interest Owners and, in the case of a serviced whole loan, the related companion loan holder(s), as a collective whole, as if those |
THE INFORMATION IN THIS STRUCTURAL AND COLLATERAL TERM SHEET IS NOT COMPLETE AND MAY BE AMENDED PRIOR TO THE TIME OF SALE. THIS TERM SHEET IS NOT AN OFFER TO SELL THESE SECURITIES AND IT IS NOT A SOLICITATION OF AN OFFER TO BUY THESE SECURITIES IN ANY JURISDICTION WHERE THE OFFER OR SALE IS NOT PERMITTED.
29 of 158
| Structural and Collateral Term Sheet | Benchmark 2022-B32 | |
| Collateral Characteristics | ||
certificateholders, RR Interest Owners and, if applicable, such companion loan holder(s) constituted a single lender (taking into account the pari passu or subordinate nature of any related companion loan(s)).
In addition, if during the continuance of a Control Termination Event, the Operating Advisor determines, in its sole discretion exercised in good faith, that (1) the Special Servicer is not performing its duties as required under the Pooling and Servicing Agreement or is otherwise not acting in accordance with the Servicing Standard and (2) the replacement of the Special Servicer would be in the best interest of the certificateholders and the RR Interest Owners as a collective whole, then, the Operating Advisor will have the right to recommend the replacement of the Special Servicer and will submit its formal recommendation to the Trustee and the Certificate Administrator (along with its rationale, its proposed replacement special servicer and other relevant information justifying its recommendation).
The Operating Advisor’s recommendation to replace the Special Servicer must be confirmed by an affirmative vote of holders of Principal Balance Certificates and Class RR Certificates evidencing at least a majority of a quorum of certificateholders (which, for this purpose, is the holders of Certificates that (i) evidence at least 20% of the Voting Rights (taking into account the application of any Appraisal Reduction Amounts to notionally reduce the respective Certificate Balances) of all Principal Balance Certificates and the Class RR Certificates on an aggregate basis and (ii) consist of at least three Certificateholders or certificate owners that are not affiliated with each other. In the event the holders of Principal Balance Certificates and Class RR Certificates evidencing at least a majority of a quorum of certificateholders elect to remove and replace the Special Servicer (which requisite affirmative votes must be received within 180 days of the posting of the notice of the Operating Advisor’s recommendation to replace the Special Servicer to the Certificate Administrator's website), the Certificate Administrator will be required to receive a Rating Agency Confirmation from each of the Rating Agencies at that time.
| ||
| ■ Replacement of Operating Advisor: | The Operating Advisor may be terminated or removed under certain circumstances and a replacement operating advisor appointed as described in the Preliminary Prospectus.
Any replacement operating advisor (or the personnel responsible for supervising the obligations of the replacement operating advisor) must be an institution (A) that is a special servicer or operating advisor on a commercial mortgage-backed securities transaction rated by the Rating Agencies (including, in the case of the Operating Advisor, this transaction) but has not been special servicer or operating advisor on a transaction for which any of the Rating Agencies has qualified, downgraded or withdrawn its rating or ratings of, one or more classes of certificates for such transaction publicly citing servicing concerns with the operating advisor in its capacity as special servicer or operating advisor on such commercial mortgage-backed securities transaction as the sole or a material factor in such rating action; (B) that can and will make the representations and warranties of the operating advisor set forth in the Pooling and Servicing Agreement; (C) that is not (and is not affiliated with) the Depositor, the Trustee, the Certificate Administrator, the Master Servicer, the Special Servicer, a Mortgage Loan Seller, the Directing Certificateholder, a Risk Retention Consultation Party, a depositor, a trustee, a certificate administrator, a master servicer or special servicer with respect to any securitization that includes a Companion Loan, or any of their respective affiliates; (D) that has not been paid by any Special Servicer or successor special servicer any fees, compensation or other remuneration (x) in respect of its obligations hereunder or (y) for the appointment or recommendation for replacement of a successor special servicer to become the Special Servicer; (E) that (x) has been regularly engaged in the business of analyzing and advising clients in commercial mortgage-backed securities matters and that has at least five years of experience in collateral analysis and loss projections and (y) has at least five years of experience in commercial real estate asset management and experience in the workout and management of distressed commercial real estate assets; and (F) that does not directly or indirectly, through one or more affiliates or otherwise, own or have derivative exposure in any interest in any certificates, any mortgage loans, any Companion Loan or any securities backed by a Companion Loan or otherwise have any financial interest in the securitization transaction to which the Pooling and Servicing Agreement relates, other than in fees from its role as operating advisor and asset representations reviewer (to the extent it also acts as the asset representations reviewer).
| |
| ■ Asset Representations Reviewer: | The Asset Representations Reviewer will be required to review certain delinquent mortgage loans after a specified delinquency threshold has been exceeded and notification from the Certificate Administrator that the required percentage of Certificateholders have voted to direct a review of such delinquent mortgage loans. An “Asset Review Trigger” will occur when either |
THE INFORMATION IN THIS STRUCTURAL AND COLLATERAL TERM SHEET IS NOT COMPLETE AND MAY BE AMENDED PRIOR TO THE TIME OF SALE. THIS TERM SHEET IS NOT AN OFFER TO SELL THESE SECURITIES AND IT IS NOT A SOLICITATION OF AN OFFER TO BUY THESE SECURITIES IN ANY JURISDICTION WHERE THE OFFER OR SALE IS NOT PERMITTED.
30 of 158
| Structural and Collateral Term Sheet | Benchmark 2022-B32 | |
| Collateral Characteristics | ||
(1) mortgage loans with an aggregate outstanding principal balance of 25.0% or more of the aggregate outstanding principal balance of all of the mortgage loans (including any REO Loans (or a portion of any REO Loan in the case of a Whole Loan) held by the issuing entity as of the end of the applicable Collection Period are Delinquent Loans, (2)(A) prior to and including the second anniversary of the Closing Date, at least 10 mortgage loans are Delinquent Loans and the outstanding principal balance of such Delinquent Loans in the aggregate constitutes at least 15.0% of the aggregate outstanding principal balance of all of the mortgage loans (including any REO Loans (or a portion of any REO Loan in the case of a Whole Loan)) held by the issuing entity as of the end of the applicable Collection Period or (B) after the second anniversary of the Closing Date, at least 15 mortgage loans are Delinquent Loans and the outstanding principal balance of such Delinquent Loans in the aggregate constitutes at least 20.0% of the aggregate outstanding principal balance of all of the mortgage loans (including any REO Loans (or a portion of any REO Loan in the case of a Whole Loan)) held by the issuing entity as of the end of the applicable Collection Period.
Following the determination that an Asset Review Trigger has occurred, the Certificate Administrator will include in the Form 10-D relating to the distribution period in which the Asset Review Trigger occurred a description of the events that caused the Asset Review Trigger to occur. Once an Asset Review Trigger has occurred, Certificateholders evidencing not less than 5% of the voting rights may deliver to the Certificate Administrator a written direction requesting a vote on whether to commence an Asset Review within 90 days after the filing of the Form 10-D reporting the occurrence of the Asset Review Trigger (an “Asset Review Vote Election”). If directed by such Certificateholders, a vote of all Certificateholders will commence and an Asset Review will occur if a majority of Certificateholders voting (assuming Certificateholders representing a minimum of 5% of the voting rights respond) vote affirmatively within 150 days of the Asset Review Vote Election. If the vote does not pass, then no Certificateholder may request a vote or cast a vote for an Asset Review and the Asset Representations Reviewer will not be required to review any delinquent mortgage loan until an additional mortgage loan becomes a Delinquent Loan, an Asset Review Trigger occurs as a result or is otherwise in effect, another Asset Review Vote Election is made and a majority of Certificateholders voting (assuming Certificateholders representing a minimum of 5% of the voting rights respond) vote affirmatively within 150 days of such Asset Review Vote Election.
Delinquent Loan means a mortgage loan that is delinquent at least 60 days in respect of its periodic payments or balloon payment, if any, in either case such delinquency to be determined without giving effect to any grace period. For the avoidance of doubt, a delinquency that would have existed but for a COVID modification will not constitute a delinquency for so long as the related borrower is complying with the terms of such COVID modification.
| ||
| ■ Replacement of the Asset Representations Reviewer: | The Asset Representations Reviewer may be terminated and replaced without cause. Upon (i) the written direction of Certificateholders evidencing not less than 25% of the voting rights (without regard to the application of any Cumulative Appraisal Reduction Amounts) requesting a vote to terminate and replace the Asset Representations Reviewer with a proposed successor asset representations reviewer that is an Eligible Asset Representations Reviewer, and (ii) payment by such holders to the Certificate Administrator of the reasonable fees and expenses to be incurred by the Certificate Administrator in connection with administering such vote, the Certificate Administrator will promptly provide notice to all Certificateholders and the Asset Representations Reviewer of such request by posting such notice on its website, and by mailing to all Certificateholders, the RR Interest Owners and the Asset Representations Reviewer. Upon the written direction of holders of Principal Balance Certificates and Class RR Certificates evidencing at least 75% of a Certificateholder Quorum (without regard to the application of any Cumulative Appraisal Reduction Amounts), the Trustee will terminate all of the rights and obligations of the Asset Representations Reviewer under the Pooling and Servicing Agreement by written notice to the Asset Representations Reviewer, and the proposed successor asset representations reviewer will be appointed. |
THE INFORMATION IN THIS STRUCTURAL AND COLLATERAL TERM SHEET IS NOT COMPLETE AND MAY BE AMENDED PRIOR TO THE TIME OF SALE. THIS TERM SHEET IS NOT AN OFFER TO SELL THESE SECURITIES AND IT IS NOT A SOLICITATION OF AN OFFER TO BUY THESE SECURITIES IN ANY JURISDICTION WHERE THE OFFER OR SALE IS NOT PERMITTED.
31 of 158
| Structural and Collateral Term Sheet | Benchmark 2022-B32 | |
| Collateral Characteristics | ||
| ■ Appointment and Replacement of Special Servicer: | The Directing Certificateholder will appoint the initial Special Servicer as of the Closing Date. Prior to the occurrence and continuance of a Control Termination Event, the Special Servicer may generally be replaced at any time, with or without cause by the Directing Certificateholder.
If the Special Servicer obtains knowledge that it is a Borrower Party with respect to any mortgage loan or Serviced Whole Loan (any such mortgage loan or Serviced Whole Loan, an “Excluded Special Servicer Loan”), the Special Servicer will be required to resign as Special Servicer of that Excluded Special Servicer Loan. Prior to the occurrence and continuance of a Control Termination Event, if the applicable Excluded Special Servicer Loan is not also an Excluded Loan, the controlling class certificateholders or the Directing Certificateholder on their behalf will be required to select a successor special servicer that is not a Borrower Party in accordance with the terms of the Pooling and Servicing Agreement (an “Excluded Special Servicer”) for the related Excluded Special Servicer Loan. After the occurrence and during the continuance of a Control Termination Event or if at any time the applicable Excluded Special Servicer Loan is also an Excluded Loan, the resigning Special Servicer will be required to use reasonable efforts to select the related Excluded Special Servicer.
Upon the occurrence and during the continuance of a Control Termination Event, the Directing Certificateholder will no longer have the right to replace the Special Servicer and such replacement will occur based on a vote of holders of all voting eligible Classes of Certificates as described below.
The Operating Advisor may also recommend the replacement of the Special Servicer at any time as described in “—Operating Advisor” above.
| |
| ■ Replacement of Special Servicer by Vote of Certificateholders: | After the occurrence and during the continuance of a Control Termination Event and upon (a) the written direction of holders of Principal Balance Certificates and/or Class RR Certificates evidencing not less than 25% of the Voting Rights (taking into account the application of Cumulative Appraisal Reduction Amounts to notionally reduce the Certificate Balances of the Principal Balance Certificates and/or Class RR Certificates) requesting a vote to replace the Special Servicer with a replacement special servicer, (b) payment by such requesting holders to the Certificate Administrator of all reasonable fees and expenses to be incurred by the Certificate Administrator in connection with administering such vote and (c) delivery by such holders to the Certificate Administrator and the Trustee of written confirmations from each Rating Agency that the appointment of such replacement special servicer will not result in a downgrade, withdrawal or qualification of the Certificates (which confirmations will be obtained at the expense of such holders), the Certificate Administrator will be required to post notice of such direction on its website and by mail, and conduct the solicitation of votes of all Certificates in such regard, which such vote must occur within 180 days of the posting of such notice. Upon the written direction of holders of Principal Balance Certificates and/or Class RR Certificates evidencing at least 50% of a Certificateholder Quorum, the Trustee will immediately replace the Special Servicer with a qualified replacement special servicer designated by such holders of Certificates.
A “Certificateholder Quorum” means, in connection with any solicitation of votes in connection with the replacement of the Special Servicer or the Asset Representations Reviewer described above, the holders of Certificates evidencing at least 50% of the aggregate Voting Rights (taking into account the application of realized losses and, other than with respect to the termination of the Asset Representations Reviewer, the application of any Cumulative Appraisal Reduction Amounts to notionally reduce the Certificate Balance of the Certificates) of all Principal Balance Certificates and the Class RR Certificates on an aggregate basis.
With respect to each of the Serviced Whole Loan, subject to the related intercreditor agreement, the holders of the related Pari Passu Companion Loans, under certain circumstances following a servicer termination event with respect to the Special Servicer, will be entitled to direct the Trustee (and the Trustee will be required) to terminate the Special Servicer solely with respect to such Serviced Whole Loan. A replacement special servicer will be selected by the Trustee or, prior to a Control Termination Event, by the Directing Certificateholder; provided, however, that any successor special servicer appointed to replace the Special Servicer with respect to such Whole Loan can generally not be the person (or its affiliate) that was terminated at the direction of the holder of the related Pari Passu Companion Loan.
With respect to any Non-Serviced Whole Loan, subject to the related intercreditor agreement, the Benchmark 2022-B32 trust as holder of the related mortgage loan has similar termination rights in the event of a servicer termination event with respect to the special servicer under the |
THE INFORMATION IN THIS STRUCTURAL AND COLLATERAL TERM SHEET IS NOT COMPLETE AND MAY BE AMENDED PRIOR TO THE TIME OF SALE. THIS TERM SHEET IS NOT AN OFFER TO SELL THESE SECURITIES AND IT IS NOT A SOLICITATION OF AN OFFER TO BUY THESE SECURITIES IN ANY JURISDICTION WHERE THE OFFER OR SALE IS NOT PERMITTED.
32 of 158
| Structural and Collateral Term Sheet | Benchmark 2022-B32 | |
| Collateral Characteristics | ||
applicable trust and servicing agreement or pooling and servicing agreement, as applicable, as described above, which may be exercised by the Directing Certificateholder prior to the Control Termination Event. However, the successor special servicer will be selected pursuant to the applicable trust and servicing agreement or pooling and servicing agreement, as applicable, by the related directing holder prior to a control event under such trust and servicing agreement or pooling and servicing agreement, as applicable. The Master Servicer and Special Servicer are entitled to certain fees in connection with the servicing and administration of the mortgage loans as more fully described in “Pooling and Servicing Agreement—Servicing and Other Compensation and Payment of Expenses” in the Preliminary Prospectus.
| ||
| ■ Dispute Resolution Provisions: | Each Mortgage Loan Seller will be subject to the dispute resolution provisions set forth in the Pooling and Servicing Agreement to the extent those provisions are triggered with respect to any mortgage loan sold to the Depositor by a Mortgage Loan Seller and such Mortgage Loan Seller will be obligated under the related mortgage loan purchase agreement to comply with all applicable provisions and to take part in any mediation or arbitration proceedings that may result.
Generally, in the event that a request to repurchase a mortgage loan (a “Repurchase Request”) is not “Resolved” (as defined below) within 180 days after the related Mortgage Loan Seller receives such Repurchase Request (a “Resolution Failure”), then the Enforcing Servicer (as defined below) will be required to send a notice to the “Initial Requesting Certificateholder” (if any) indicating the Enforcing Servicer’s intended course of action with respect to the Repurchase Request. If (a) the Enforcing Servicer’s intended course of action with respect to the Repurchase Request does not involve pursuing further action to exercise rights against the related Mortgage Loan Seller with respect to the Repurchase Request and the Initial Requesting Certificateholder, if any, or any other Certificateholder or Certificate Owner wishes to exercise its right to refer the matter to mediation (including nonbinding arbitration) or arbitration, or (b) the Enforcing Servicer’s intended course of action is to pursue further action to exercise rights against the related Mortgage Loan Seller with respect to the Repurchase Request but the Initial Requesting Certificateholder, if any, or any other Certificateholder or Certificate Owner does not agree with the dispute resolution method selected by the Enforcing Servicer, then the Initial Requesting Certificateholder, if any, or such other Certificateholder or Certificate Owner may deliver a written notice to the Enforcing Servicer indicating its intent to exercise its right to refer the matter to either mediation or arbitration.
The Enforcing Servicer will be required to consult with any Certificateholder or Certificate Owner that delivers a notice of its intent to exercise its dispute resolution rights (a “Requesting Certificateholder”) so that a Requesting Certificateholder may consider the views of the Enforcing Servicer as to the claims underlying the Repurchase Request and possible dispute resolution methods. If a Requesting Certificateholder elects to exercise its right to refer the matter to either mediation or arbitration, then it will become the party responsible for enforcing the Repurchase Request and must promptly submit the matter to mediation (including nonbinding arbitration) or arbitration. Failure to make an election to exercise that right or failure to begin the elected form of proceedings within the certain timeframe set forth in the Pooling and Servicing Agreement will generally waive the Certificateholders’ or Certificate Owners’ rights with respect to the related Repurchase Request.
The “Enforcing Servicer” will be (a) with respect to a specially serviced loan, the Special Servicer, and (b) with respect to a non-specially serviced loan, (i) in the case of a Repurchase Request made by the Special Servicer, the Directing Certificateholder or a Controlling Class Certificateholder, the Master Servicer, and (ii) in the case of a Repurchase Request made by any person other than the Special Servicer, the Directing Certificateholder or a Controlling Class Certificateholder, (A) prior to a Resolution Failure relating to such non-specially serviced loan, the Master Servicer, and (B) from and after a Resolution Failure relating to such non-specially serviced Loan, the Special Servicer.
“Resolved” means, with respect to a Repurchase Request, (i) that the related Material Defect has been cured, (ii) the related mortgage loan has been repurchased in accordance with the related mortgage loan purchase agreement, (iii) a mortgage loan has been substituted for the related mortgage loan in accordance with the related mortgage loan purchase agreement, (iv) the applicable Mortgage Loan Seller has made a Loss of Value Payment, (v) a contractually binding agreement is entered into between the Enforcing Servicer, on behalf of the issuing entity, and the related Mortgage Loan Seller that settles the related Mortgage Loan Seller’s obligations under the related mortgage loan purchase agreement, or (vi) the related mortgage |
THE INFORMATION IN THIS STRUCTURAL AND COLLATERAL TERM SHEET IS NOT COMPLETE AND MAY BE AMENDED PRIOR TO THE TIME OF SALE. THIS TERM SHEET IS NOT AN OFFER TO SELL THESE SECURITIES AND IT IS NOT A SOLICITATION OF AN OFFER TO BUY THESE SECURITIES IN ANY JURISDICTION WHERE THE OFFER OR SALE IS NOT PERMITTED.
33 of 158
| Structural and Collateral Term Sheet | Benchmark 2022-B32 | |
| Collateral Characteristics | ||
loan is no longer property of the issuing entity as a result of a sale or other disposition in accordance with the Pooling and Servicing Agreement.
| ||
| ■ Investor Communications: | The Certificate Administrator is required to include on any Form 10–D any request received from a Certificateholder to communicate with other Certificateholders related to Certificateholders exercising their rights under the terms of the Pooling and Servicing Agreement. Any Certificateholder wishing to communicate with other Certificateholders regarding the exercise of its rights under the terms of the Pooling and Servicing Agreement should deliver a written request signed by an authorized representative of the requesting investor to the Certificate Administrator at the address below:
9062 Old Annapolis Road
Columbia, Maryland 21045
Attention: Corporate Trust Administration Group – Benchmark 2022-B32
With a copy to: trustadministrationgroup@wellsfargo.com
| |
| ■ Master Servicer and Special Servicer Compensation: | The Master Servicer is entitled to a fee (the “Servicing Fee”) payable monthly from interest received in respect of each mortgage loan, any related REO loan and any related serviced Companion Loan that will accrue at the related servicing fee rate described in the Preliminary Prospectus. The Special Servicer is also entitled to a fee (the “Special Servicing Fee”) with respect to each specially serviced loan and REO loan (other than a non-serviced mortgage loan) at the special servicing fee rate described in the Preliminary Prospectus.
In addition to the Servicing Fee, Special Servicing Fee and certain other fees described below, the Master Servicer and Special Servicer are entitled to retain and share certain additional servicing compensation, including assumption application fees, assumption fees, defeasance fees, processing fees and certain Excess Modification Fees and consent fees with respect to the mortgage loans. The Special Servicer may also be entitled to either a Workout Fee or Liquidation Fee, but not both, from recoveries in respect of any particular mortgage loan.
An “Excess Modification Fee” with respect to any mortgage loan (other than the non-serviced mortgage loans) or Serviced Whole Loan is the sum of (A) the excess, if any, of (i) any and all Modification Fees with respect to a mortgage loan or Serviced Whole Loan, as applicable, over (ii) all unpaid or unreimbursed additional expenses described in the Preliminary Prospectus (excluding Special Servicing Fees, Workout Fees and Liquidation Fees) outstanding or previously incurred on behalf of the issuing entity with respect to the related mortgage loan or Serviced Whole Loan, as applicable, and reimbursed from such Modification Fees and (B) expenses previously paid or reimbursed from Modification Fees as described in clause (A), which expenses have been recovered from the related borrower or otherwise.
With respect to the Master Servicer and Special Servicer, the Excess Modification Fees collected and earned by such servicer from the related borrower (taken in the aggregate with any other Excess Modification Fees collected and earned by such servicer from the related borrower within the prior 18 months of the collection of the current Excess Modification Fees) will be subject to a cap of 1.00% of the outstanding principal balance of the related mortgage loan or Serviced Whole Loan, as applicable, on the closing date of the related modification, extension, waiver or amendment. A “Modification Fee” with respect to any mortgage loan (other than the non-serviced mortgage loans) or serviced Companion Loan is generally any fee with respect to a modification, extension, waiver or amendment of any mortgage loan and/or related serviced Companion Loan (other than all assumption fees, assumption application fees, consent fees, defeasance fees, Special Servicing Fees, Liquidation Fees or Workout Fees).
A “Workout Fee” will generally be payable with respect to each corrected loan (except with respect to a corrected loan that was a fee restricted specially serviced loan and became a corrected loan while it was a fee restricted specially serviced loan) (as more specifically described in the Preliminary Prospectus) and will be calculated at a rate of 1.00% of payments of principal and interest on the respective mortgage loan for so long as it remains a corrected loan, subject to a maximum of $1,000,000 in the aggregate with respect to any particular corrected loan. After receipt by the Special Servicer of Workout Fees with respect to a corrected loan in an amount equal to $25,000, any Workout Fees in excess of such amount will be reduced by the Excess Modification Fee Amount; provided that in the event the Workout Fee, collected over the course of such workout calculated at the Workout Fee Rate is less than $25,000, then the Special Servicer will be entitled to an amount from the final payment on the related corrected loan (including any related serviced Companion Loan) that would result in the total Workout |
THE INFORMATION IN THIS STRUCTURAL AND COLLATERAL TERM SHEET IS NOT COMPLETE AND MAY BE AMENDED PRIOR TO THE TIME OF SALE. THIS TERM SHEET IS NOT AN OFFER TO SELL THESE SECURITIES AND IT IS NOT A SOLICITATION OF AN OFFER TO BUY THESE SECURITIES IN ANY JURISDICTION WHERE THE OFFER OR SALE IS NOT PERMITTED.
34 of 158
| Structural and Collateral Term Sheet | Benchmark 2022-B32 | |
| Collateral Characteristics | ||
Fees payable to the Special Servicer in respect of that corrected loan (including any related serviced Companion Loan) to be $25,000.
The “Excess Modification Fee Amount” for any corrected loan is an amount equal to any Excess Modification Fees paid by or on behalf of the related borrower with respect to the related mortgage loan (including the related serviced Companion Loan, unless prohibited under the related intercreditor agreement) and received and retained by the Master Servicer or the Special Servicer, as applicable, as compensation within the prior 18 months of the related modification, waiver, extension or amendment resulting in the mortgage loan or REO loan being a corrected loan, but only to the extent those fees have not previously been deducted from a Workout Fee or Liquidation Fee.
A “Liquidation Fee” will generally be payable with respect to (i) each specially serviced loan (except, under certain circumstances, with respect to any fee restricted specially serviced loan) or REO property (except with respect to any non-serviced mortgage loan), (ii) each Mortgage Loan repurchased by a Mortgage Loan Seller or (iii) each defaulted Mortgage Loan that is a Non-Serviced Mortgage Loan sold by the Special Servicer in accordance with the Pooling and Servicing Agreement, in each case, as to which the Special Servicer obtains a full or partial recovery of the related asset. The Liquidation Fee for each specially serviced loan will be payable at a rate of 1.00% of the liquidation proceeds (exclusive of default interest) subject to a maximum of $1,000,000; provided, however, that no Liquidation Fee will be less than $25,000.
The Liquidation Fees will be reduced by the amount of any Excess Modification Fees received by the Special Servicer with respect to the related mortgage loan (including a serviced Companion Loan) or REO property as additional compensation within the prior 18 months, but only to the extent those fees have not previously been deducted from a Workout Fee or Liquidation Fee.
Similar fees to those described above will be payable to the applicable special servicer for the Non-Serviced Whole Loans under the related trust and servicing agreement or pooling and servicing agreement, as applicable.
Subject to certain limited exceptions, in connection with its duties under the Pooling and Servicing Agreement, the Special Servicer and its affiliates are prohibited from receiving or retaining any compensation (other than compensation specifically provided for under the Pooling and Servicing Agreement) from anyone in connection with the disposition, workout or foreclosure of any mortgage loan, the management or disposition of any REO property, or the performance of any other special servicing duties under the Pooling and Servicing Agreement. In the event the Special Servicer does receive any such compensation, it will be required to disclose those fees to the Certificate Administrator who will include it as part of the statement to Certificateholders.
In addition, no liquidation fee will be payable to the Special Servicer if a mortgage loan or Serviced Whole Loan becomes a specially serviced loan only because of a maturity default and the related liquidation proceeds are received within 90 days following the related maturity date as a result of the related mortgage loan or Serviced Whole Loan being refinanced or otherwise repaid in full.
See “Pooling and Servicing Agreement—Servicing and Other Compensation and Payment of Expenses” in the Preliminary Prospectus.
| ||
| ■ Deal Website: | The Certificate Administrator will maintain a deal website to which certain persons will have access to certain information including, but not limited to the following, which will be posted:
■ special notices; ■ summaries of any final asset status reports; ■ appraisals in connection with Appraisal Reductions plus any second appraisals ordered; ■ an “Investor Q&A Forum”; ■ a voluntary investor registry; ■ SEC EDGAR filings; and ■ risk retention. |
THE INFORMATION IN THIS STRUCTURAL AND COLLATERAL TERM SHEET IS NOT COMPLETE AND MAY BE AMENDED PRIOR TO THE TIME OF SALE. THIS TERM SHEET IS NOT AN OFFER TO SELL THESE SECURITIES AND IT IS NOT A SOLICITATION OF AN OFFER TO BUY THESE SECURITIES IN ANY JURISDICTION WHERE THE OFFER OR SALE IS NOT PERMITTED.
35 of 158
| Structural and Collateral Term Sheet | Benchmark 2022-B32 | |
| Old Chicago Post Office | ||

THE INFORMATION IN THIS STRUCTURAL AND COLLATERAL TERM SHEET IS NOT COMPLETE AND MAY BE AMENDED PRIOR TO THE TIME OF SALE. THIS TERM SHEET IS NOT AN OFFER TO SELL THESE SECURITIES AND IT IS NOT A SOLICITATION OF AN OFFER TO BUY THESE SECURITIES IN ANY JURISDICTION WHERE THE OFFER OR SALE IS NOT PERMITTED.
36 of 158
| Structural and Collateral Term Sheet | Benchmark 2022-B32 | |
| Old Chicago Post Office | ||
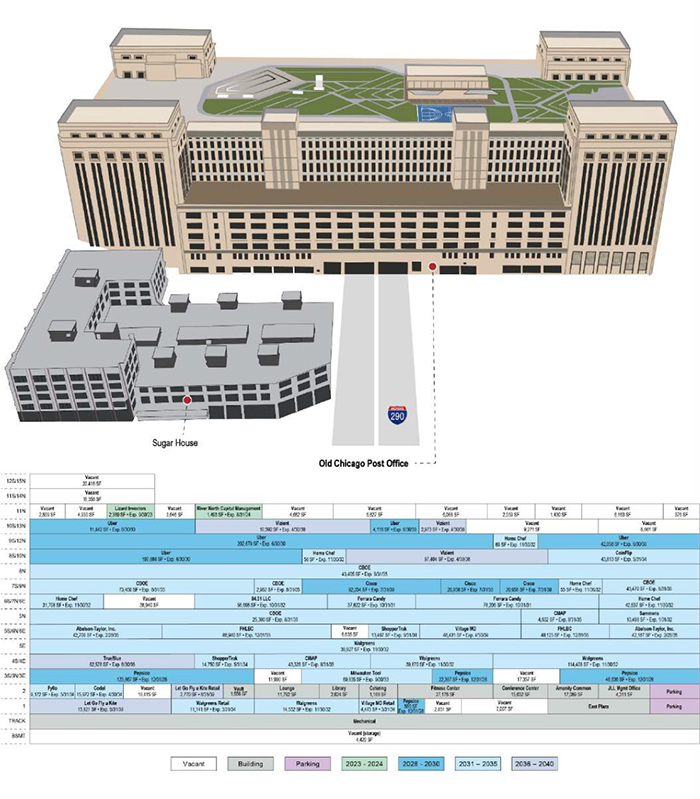
THE INFORMATION IN THIS STRUCTURAL AND COLLATERAL TERM SHEET IS NOT COMPLETE AND MAY BE AMENDED PRIOR TO THE TIME OF SALE. THIS TERM SHEET IS NOT AN OFFER TO SELL THESE SECURITIES AND IT IS NOT A SOLICITATION OF AN OFFER TO BUY THESE SECURITIES IN ANY JURISDICTION WHERE THE OFFER OR SALE IS NOT PERMITTED.
37 of 158
| Structural and Collateral Term Sheet | Benchmark 2022-B32 | |
| Old Chicago Post Office | ||
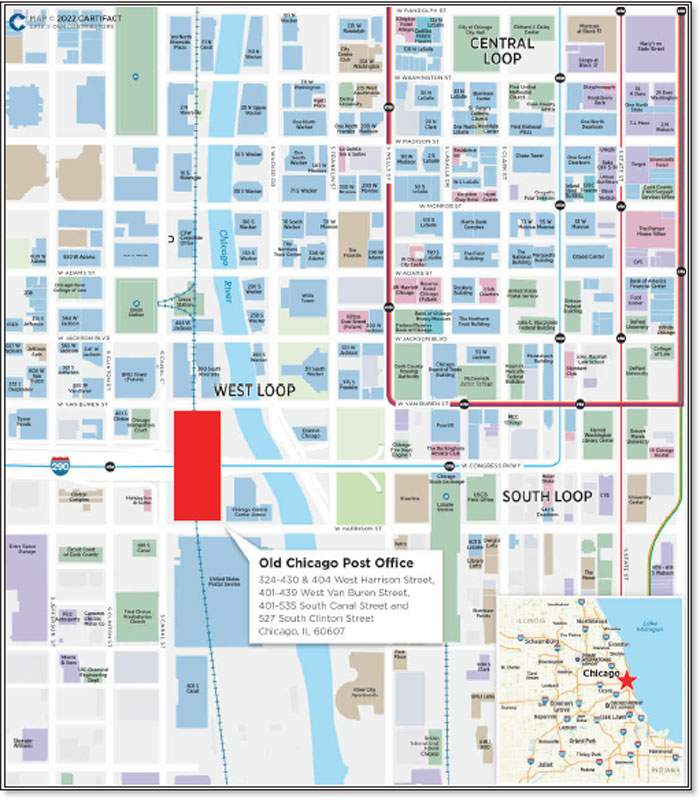
THE INFORMATION IN THIS STRUCTURAL AND COLLATERAL TERM SHEET IS NOT COMPLETE AND MAY BE AMENDED PRIOR TO THE TIME OF SALE. THIS TERM SHEET IS NOT AN OFFER TO SELL THESE SECURITIES AND IT IS NOT A SOLICITATION OF AN OFFER TO BUY THESE SECURITIES IN ANY JURISDICTION WHERE THE OFFER OR SALE IS NOT PERMITTED.
38 of 158
| Structural and Collateral Term Sheet | Benchmark 2022-B32 | |
| Old Chicago Post Office | ||
| Mortgage Loan Information | Property Information | |||
| Mortgage Loan Seller: | JPMCB | Single Asset / Portfolio: | Single Asset | |
| Original Principal Balance(1): | $125,000,000 | Title: | Fee | |
| Cut-off Date Principal Balance(1): | $125,000,000 | Property Type – Subtype: | Office – CBD | |
| % of Pool by IPB: | 7.0% | Net Rentable Area (SF): | 2,331,477 | |
| Loan Purpose: | Refinance | Location: | Chicago, IL | |
| Borrower: | 601W Companies Chicago LLC | Year Built / Renovated: | 1916 / 2016-2021 | |
| Guarantors: | Mark Karasick and | Occupancy: | 91.8% | |
| Michael Silberberg | Occupancy Date: | 12/1/2021 | ||
| Interest Rate: | 3.46957% | Fourth Most Recent NOI(4): | NAV | |
| Note Date: | 12/9/2021 | Third Most Recent NOI(4): | NAV | |
| Maturity/ARD Date: | 1/1/2027 | Second Most Recent NOI(4): | NAV | |
| Interest-only Period: | 60 months | Most Recent NOI(4): | NAV | |
| Original Term: | 60 months | UW Economic Occupancy: | 91.6% | |
| Original Amortization: | None | UW Revenues: | $115,801,966 | |
| Amortization Type: | Interest Only | UW Expenses: | $39,254,351 | |
| Call Protection: | L(25),D(31),O(4) | UW NOI: | $76,547,615 | |
| Lockbox / Cash Management: | Hard / In Place | UW NCF: | $76,080,387 | |
| Additional Debt(1): | Yes | Appraised Value / Per SF(5): | $1,189,500,000 / $510 | |
| Additional Debt Balance(1): | $387,800,000 / $317,200,000 / | Appraisal Date(5): | 5/7/2021 | |
| $125,000,000 | ||||
| Additional Debt Type(1)(2): | Pari Passu / Subordinate / | |||
| Mezzanine | ||||
| Escrows and Reserves(3) | Financial Information(1)(2) | ||||||||||||||||
| Initial | Monthly | Initial Cap | Senior Notes | Whole Loan | Total Debt | ||||||||||||
| Taxes: | $2,343,888 | $1,171,944 | N/A | Cut-off Date Loan / SF: | $220 | $356 | $410 | ||||||||||
| Insurance: | $302,576 | $302,576 | N/A | Maturity Date Loan / SF: | $220 | $356 | $410 | ||||||||||
| Replacement Reserves: | $0 | $48,572 | $1,165,739 | Cut-off Date LTV: | 43.1% | 69.8% | 80.3% | ||||||||||
| TI/LC: | $0 | Springing | N/A | Maturity Date LTV: | 43.1% | 69.8% | 80.3% | ||||||||||
| Other: | $118,572,762 | $0 | N/A | UW NCF DSCR: | 4.22x | 2.61x | 1.90x | ||||||||||
| UW NOI Debt Yield: | 14.9% | 9.2% | 8.0% | ||||||||||||||
| Sources and Uses(1)(2) | |||||||||||||||||
| Sources | Proceeds | % of Total | Uses | Proceeds | % of Total | ||||||||||||
| Mortgage Loan | $512,800,000 | 52.8% | Existing Loan Paydown | $835,582,814 | 86.1% | ||||||||||||
| Sponsor Equity | 15,425,825 | 1.6% | Outstanding TILC Reserve | 50,942,055 | 5.2% | ||||||||||||
| Sub-Debt | 442,200,000 | 45.6% | Rent Abatement Reserve | 47,960,429 | 4.9% | ||||||||||||
| Gap Rent Reserve | 11,492,939 | 1.2% | |||||||||||||||
| HTC Put Reserve | 4,265,829 | 0.4% | |||||||||||||||
| Remaining Hard Costs Reserve | 3,911,510 | 0.4% | |||||||||||||||
| Taxes and Insurance Reserve | 2,646,463 | 0.3% | |||||||||||||||
| Closing Costs | 13,623,786 | 1.4% | |||||||||||||||
| Total Sources | $970,425,825 | 100.0% | Total Uses | $970,425,825 | 100.0% | ||||||||||||
| (1) | The Old Chicago Post Office Whole Loan is comprised of (i) the Old Chicago Post Office Mortgage Loan (comprised of two senior notes with an outstanding principal balance as of the Cut-off Date of $125.0 million, (ii) a companion loan, which is pari passu with the Old Chicago Post Office Mortgage Loan, (comprised of five pari passu notes) with an aggregate outstanding principal balance as of the Cut-off Date of $387.8 million and (iii) a subordinate companion loan with an outstanding principal balance as of the Cut-off Date of $317.2 million. The Senior Notes Financial Information presented in the chart above reflects the $512.8 million aggregate Cut-off Date balance of the Old Chicago Post Office Mortgage Loan and the Old Chicago Post Office Companion Loan, excluding the Old Chicago Post Office Subordinate Companion Loan and the Old Chicago Post Office Mezzanine Loan (as defined below). The Whole Loan Financial Information presented in the chart above reflects the Cut-Off Date balance of the $830.0 million aggregate Cut-off Date balance of the Old Chicago Post Office Senior Notes and the Old Chicago Post Office Subordinate Companion Loan, and excludes the related Old Chicago Post Office Mezzanine Loan. The Total Debt Financial Information presented in the chart above reflects the $955.0 million aggregate Cut-off Date balance Old Chicago Post Office Whole Loan and the Old Chicago Post Office Mezzanine Loan. |
| (2) | See “Current Mezzanine or Secured Subordinate Indebtedness” herein. |
| (3) | For a full description of Escrows and Reserves, please refer to “Escrows and Reserves” below. |
| (4) | Historical financials are not available as the property is newly redeveloped. Redevelopment began in 2016 and as of the Cut-off Date construction is substantially complete. |
THE INFORMATION IN THIS STRUCTURAL AND COLLATERAL TERM SHEET IS NOT COMPLETE AND MAY BE AMENDED PRIOR TO THE TIME OF SALE. THIS TERM SHEET IS NOT AN OFFER TO SELL THESE SECURITIES AND IT IS NOT A SOLICITATION OF AN OFFER TO BUY THESE SECURITIES IN ANY JURISDICTION WHERE THE OFFER OR SALE IS NOT PERMITTED.
39 of 158
| Structural and Collateral Term Sheet | Benchmark 2022-B32 | |
| Old Chicago Post Office | ||
| (5) | Based on the “Hypothetical Market Value Assuming Reserves”, which assumes an upfront escrow is established for all remaining costs to complete, gap rent, outstanding leasing costs and outstanding rent abatements. At origination, the borrowers reserved $59,453,368 for outstanding gap rent and free rent and approximately $50,942,055 for all outstanding tenant improvements and leasing commissions. Based on the “As-Is” appraised value as of May 7, 2021 equal to $1,019,500,000, the Old Chicago Post Office Senior Notes Cut-off Date LTV and the Old Chicago Post Office Senior Notes Maturity Date LTV are 50.3%. The appraisal also assumes the Old Chicago Post Office Property has attained the Class L tax abatement as described further in “Class L Tax Abatement” herein. |
The Loan. The Old Chicago Post Office mortgage loan is secured by a first mortgage lien on the borrower’s fee simple interest in a 12-story 2,331,477 square foot, newly renovated, Class A multi-tenant office building located in downtown Chicago, Illinois (the “Old Chicago Post Office Property”) and, due to historic tax credits associated with the redevelopment, a pledge of interest in the Master Lessee (as defined below) by the Managing Member of the Master Lessee (as defined below) to the lender. The Old Chicago Post Office loan is part of a whole loan, which has an aggregate outstanding balance as of the Cut-off Date of $830.0 million (the “Old Chicago Post Office Whole Loan”) and is comprised of (i) seven pari passu senior notes with an aggregate initial principal balance of $512.8 million (collectively the “Old Chicago Post Office Senior Notes”) and (ii) one junior note, with an initial principal balance of $317.2 million (the “Old Chicago Post Office Subordinate Companion Loan”). Among the Old Chicago Post Office Senior Notes are the non-controlling Notes A-5 and A-6, with an aggregate initial principal balance of $125.0 million, which will be contributed to the BMARK 2022-B32 trust (the “Old Chicago Post Office Mortgage Loan”). The remaining $387.8 million of Old Chicago Post Office Senior Notes (the “Old Chicago Post Office Companion Notes” or the “Old Chicago Post Office Companion Loan”) and the Junior Note will not be part of the assets backing the Certificates. The relationship between the holders of the Old Chicago Post Office Whole Loan is governed by a co-lender agreement as described under “Description of the Mortgage Pool—The Whole Loans—The Non-Serviced AB Whole Loans—The Old Chicago Post Office Whole Loan” in the Preliminary Prospectus.
| Whole Loan Summary | ||||
| Note | Original Balance | Cut-off Date Balance | Note Holder | Controlling Piece |
| A-1, A-2, A-3, A-4, A-7 | $387,800,000 | $387,800,000 | JPMCC 2022-OPO | Yes |
| A-5, A-6 | $125,000,000 | $125,000,000 | Benchmark 2022-B32 | No |
| Total Senior Notes | $512,800,000 | $512,800,000 | ||
| B-1 | $317,200,000 | $317,200,000 | JPMCC 2022-OPO | No |
| Whole Loan | $830,000,000 | $830,000,000 | ||
| Whole Loan Summary(1) |
Non-Trust A Notes $387,800,000 Old Chicago Post Office Companion Notes JPMCC 2022-OPO Note A-1, A-2, A-3, A-4, A-7 | Trust A Notes $125,000,000 Old Chicago Post Office Mortgage Loan Note A-5, A-6 |
Non-Trust B Note $317,200,000 Old Chicago Post Office Subordinate Companion Loan JPMCC 2022-OPO Notes B-1 | |
| (1) | The Old Chicago Post Office Subordinate Note will be subordinate in right of payment to the Old Chicago Post Office Senior Notes. |
The Borrower. The borrower of the Old Chicago Post Office Whole Loan is 601W Companies Chicago LLC (the “Borrower”), a Delaware limited liability company and single purpose entity with two independent managers in its organizational structure. Legal counsel to the Borrowers delivered a non-consolidation opinion in connection with the origination of the Old Chicago Post Office Whole Loan. Additionally, the ownership interest of the Managing Member of the Master Lessee, which is owned and controlled by an affiliate of the Borrower, has been pledged as collateral for the Old Chicago Post Office Whole Loan. See “Historic Tax Credits” and “Master Lease” herein.
The Loan Sponsors. The loan sponsors and non-recourse carveout guarantors are Mark Karasick and Michael Silberberg (collectively, the “Loan Sponsor”). Mark Karasick is a senior member of 601W Companies, a New York City based private real estate acquisition, ownership, development and management company with experience in major markets throughout the United States. Over the past 25 years, 601W Companies has acquired a number of substantial and well known commercial properties throughout the country, aggregating approximately 21.0 million square feet with a collective value in excess of $7.0 billion. 601W Companies’ investment profile focuses on core plus assets with an opportunity to significantly appreciate, thus yielding income growth and enhanced returns. Michael Silberberg has acted as both sole managing member and as co-managing member in a significant number of 601W Companies’ transactions. Mark Karasick leads the 601W Companies team in the acquisition, development, leasing and management of its properties.
THE INFORMATION IN THIS STRUCTURAL AND COLLATERAL TERM SHEET IS NOT COMPLETE AND MAY BE AMENDED PRIOR TO THE TIME OF SALE. THIS TERM SHEET IS NOT AN OFFER TO SELL THESE SECURITIES AND IT IS NOT A SOLICITATION OF AN OFFER TO BUY THESE SECURITIES IN ANY JURISDICTION WHERE THE OFFER OR SALE IS NOT PERMITTED.
40 of 158
| Structural and Collateral Term Sheet | Benchmark 2022-B32 | |
| Old Chicago Post Office | ||
The Property. The Old Chicago Post Office Property is a Class A, 12-story, 2,331,477 square foot, office building in downtown Chicago, Illinois. Spanning two entire city blocks bound by Van Buren Street, Harrison Street, Canal Street and the Chicago River, the Old Chicago Post Office Property is one of the most recognizable buildings in the city. Constructed in 1916 as a mail terminal building and post office, the Old Chicago Post Office Property is located in the West Loop submarket in the epicenter of the city. In 1997, the Post Office vacated the property in favor of a new facility with more enhanced features and technology, at which point the property remained vacant for nearly two decades The Borrower acquired the property in 2016 and implemented an approximately $1.26 billion redevelopment plan over a four year period to reposition the property as a modern business and commerce hub. The newly redeveloped Old Chicago Post Office Property is comprised of a wide array of state of the art and unique amenities including a 3.5 acre roof deck that spans the entirety of the building and features a basketball court, a bistro and bar area and athletic track. Additional amenities include an onsite food hall, an 11,792 square foot lounge, a 2,824 square foot library, event space, a 27,176 square foot luxury fitness center, versatile conference center space and a fully restored landmarked lobby, which also functions as event space. The Loan Sponsor has applied for, and expects to receive, a Class L Reduction (as defined below) which is ultimately passed through to tenants via the NNN lease structure. According to the Loan Sponsor, as a result of such tax savings, in-place rents at the Old Chicago Post Office Property are expected to be significantly more attractive to tenants, as gross occupancy cost is expected to be significantly reduced. The Loan Sponsor expects that the Class L tax abatements will present an advantageous position for the Loan Sponsor to maintain market level NNN rents, as tenants benefit from reduced gross rents.
As of December 1, 2021, the Old Chicago Post Office Property was 91.8% occupied by 25 tenants, comprised largely of institutional quality tenants and investment rated tenants. Approximately 40.3% of net rentable area and 45.1% of underwritten rent are attributable to investment grade rated tenants. The Old Chicago Post Office Property benefits from a unique tenant roster with office users predominately represented by the technology sector. The Property benefits from long-term tenancy with no major tenant rolling during the term of the Whole Loan and a weighted average remaining lease term of approximately 9.42 years as of the Cut-off Date. Approximately 0.2% of net rentable area is attributable to tenants with maturity dates expiring during the term of the Whole Loan.
The largest tenant, Uber (NYSE: UBER) (Moody’s/S&P/Fitch: B2/B/NR; 368,179 square feet; 15.8% of net rentable area; 17.2% of underwritten base rent), is an American multinational ride-hailing company offering services that include peer-to-peer ridesharing, ride hailing, food delivery and freight transportation. The company was launched in 2010 and is currently headquartered in San Francisco, California. The Old Chicago Post Office Property serves as the headquarters for Uber Freight, Uber’s logistics arm. Uber Freight is a logistics platform built on the power of Uber with the goal to reshape global logistics and deliver reliability, flexibility and transparency for shippers and carriers. Since launching in 2017, Uber Freight has built one of the world’s largest digitally-enabled carrier networks and transformed entrenched practices around pricing and booking freight to reduce inefficiencies and increase opportunities for business growth and industry collaboration. Today, the business counts over 70,000 carriers in its network and thousands of shippers as customers, from small businesses to Fortune 500 companies. Uber is listed on the NYSE and has a market cap of approximately $84.49 billion as of January 12, 2022. Uber has a one-time option to surrender not less than 35,000 square feet nor more than 45,000 square feet on one full floor in the north building or on the southernmost end of the portion of the premises on any floor in the south building as selected by Uber, effective as of December 31, 2025. If Uber exercises such surrender option, it is required to pay the sum of (i) the unamortized portion of leasing costs provided by landlord for each portion of contracted space with such costs amortized with 8% interest per annum over the initial term plus (ii) three months of the recurring rent for contracted space as of the contraction date. In addition, Uber has two, five-year renewal options upon providing 18 months’ notice prior to lease expiration.
The second largest tenant, Walgreens (Moody’s/S&P/Fitch: Baa2/BBB/BBB-; 219,698 square feet; 9.4% of net rentable area; 9.6% of underwritten base rent), utilizes the Old Chicago Post Office Property as the company’s downtown office. The company hosts digital and IT operations employees as well as some Walgreens Boots Alliance global IT personnel in the new space. Walgreens is one of the largest drugstore chains in the US, operating over 9,000 mostly freestanding Walgreens stores in all 50 US states, the District of Columbia, the Virgin Islands, and Puerto Rico. Walgreens has over 225,000 employees including 85,000 healthcare service providers, including pharmacists, pharmacy technicians, nurse practitioners and other health-related professionals. Walgreens is the US subsidiary and leading brand of Walgreens Boots Alliance, a pharmacy retailer with more than 18,750 stores in about a dozen countries. The company was founded in 1901 and is headquartered in Deerfield, IL. Walgreens Boots Alliance, Inc. is listed on the NASDAQ and has a market cap of approximately $47.2 billion as of January 12, 2022. Walgreens has a one-time option to surrender 38,000 to 42,000 square feet on the east portion of the 4th floor or the east portion of the 5th floor of the premises, as selected by Walgreens upon the day immediately preceding the 8th year anniversary of the lease commencement date. The contraction fee will equal the sum of the contraction share of the landlord’s unamortized costs utilizing a 7.5% interest rate per annum plus three months of the recurring rent for the contraction portion. In addition, Walgreens has two renewal options for consecutive periods of either a five-year or 10 years with written notice between 15-24 months’ notice prior to expiration.
The third largest tenant, PepsiCo (NASDAQ: PEP) (Moody’s/S&P/Fitch: A1/A+/NR; 193,420 square feet; 8.3% of net rentable area; 9.7% of underwritten base rent), is a multi-national food and beverage company. The Old Chicago Post Office Property houses the company’s Gatorade, Quaker and Tropicana brands, and its North America Central Division. PepsiCo is one of the largest food and beverage companies globally. It makes, markets, and sells 23 brands across the beverage and snack categories, including Pepsi, Mountain Dew, Gatorade, Doritos, Lays, and Ruffles. The company’s headquarters are in Purchase, New York. PepsiCo is listed on the NASDAQ and has a market cap of approximately $240.7 billion as of January 12, 2022. PepsiCo has the option to reduce the square footage of its
THE INFORMATION IN THIS STRUCTURAL AND COLLATERAL TERM SHEET IS NOT COMPLETE AND MAY BE AMENDED PRIOR TO THE TIME OF SALE. THIS TERM SHEET IS NOT AN OFFER TO SELL THESE SECURITIES AND IT IS NOT A SOLICITATION OF AN OFFER TO BUY THESE SECURITIES IN ANY JURISDICTION WHERE THE OFFER OR SALE IS NOT PERMITTED.
41 of 158
| Structural and Collateral Term Sheet | Benchmark 2022-B32 | |
| Old Chicago Post Office | ||
premises by 22,367 square feet located in the East Building from the premises on December 31, 2025. The contraction fee payable is the sum of two months recurring rent payable for contraction premises and the unamortized portion of rent with interest of 8% per annum over the term. In addition, PepsiCo has two, five-year renewal options upon providing 14-20 months’ notice prior to lease expiration.
COVID-19 Update. As of January 1, 2021, the Old Chicago Post Office Whole Loan is not subject to any modification or forbearance requests. No tenants are currently subject to rent abatements in connection with COVID-19. See “Risk Factors—Special Risks—Coronavirus Pandemic Has Adversely Affected the Global Economy and Will Likely Adversely Affect the Performance of the Mortgage Loans” in the Preliminary Prospectus.
The Market. The Old Chicago Post Office Property spans two entire city blocks bound by Van Buren Street, Harrison Street, Canal Street and the Chicago River and is a part of the West Loop submarket within the Chicago-Naperville-Elgin metropolitan statistical area (“MSA”). According to the appraisal, Chicago has been ranked as the top metropolitan area in the nation for corporate relocation and expansion as companies seek to tap the city’s deep talent pool, efficient transportation system and rich amenities base. An extensive urban infrastructure with a highly efficient distribution system linking suppliers and customers further supports Chicago’s position as one of the nation’s most important business centers. It thus attracts some of the largest and most respected companies in the world, including the headquarters for McDonald’s, Boeing and more.
The Old Chicago Post Office is located in the West Loop submarket of Chicago. The West Loop is the metro’s largest office submarket in terms of inventory, containing approximately 60.7 million square feet of space and commanding some of the highest rents in the metro area. The West Loop, bound by Grand Ave to the north, I-290 to the south, the Chicago River to the east and Ashland Ave to the west, is considered to be one of Chicago’s most attractive neighborhoods. The submarket is known for the areas old industrial stock, lower density of real estate square footage in comparison to downtown Chicago neighborhoods, the presence of many highly rated restaurants and its proximity to the downtown Chicago and the University of Illinois at Chicago.
According to the appraisal, as of year-end 2020, all classes of office space in the West Loop submarket had inventory of approximately 60.7 million square feet with a market vacancy of 13.2% and overall asking rents of $42.99 per square foot on a gross basis, while the overall Central Business District (the “CBD”) had a vacancy of 13.3% and asking rents of $24.79 per square foot. In recent years, the submarket has benefitted from the influx of technology, advertising, media and information companies. Many large corporations, including 16 Fortune 500 companies, are headquartered in Chicago. Furthermore, the MSA employment base is comprised of more than 4.4 million employees. Due to Chicago’s talented labor pool, numerous companies have relocated to more than 9.1 million square feet in downtown Chicago since 2008. The majority of migrations relocate to the West Loop out of all Chicago CBD submarkets. Notable companies that have relocated offices to the downtown Chicago office market include McDonald’s, Echo, Allstate, Walgreens, Motorola Solutions, Treehouse Foods, Ferrara Candy, Mondelez International and Kraft Heinz.
The appraisal identified 10 comparable NNN office leases with in-place rents ranging from $25.00 to $37.00 per square foot with a weighted average in-place rent of approximately $34.00 per square foot.
| Office Lease Comparables(1) | ||||||||
| Property | Class | Year Built / Renovated | Tenant | NRA (SF) | Rent Per SF | Term (Mos.) | ||
| Old Chicago Post Office | A | 1916 / 2016 - 2021 | 2,331,477 | $32.08(2) | 11.1 | |||
| Citadel Center | A | 2003 / NAP | 1,504,364 | |||||
| Donohue Brown | 21,489 | $25.00 | 11.0 | |||||
| 167 N Green Street | A | 2020 / NAP | 635,000 | |||||
| CCC Information Services | 140,565 | $37.00 | 15.0 | |||||
| Foxtrot Market | 30,000 | $27.00 | 12.0 | |||||
| BMO Tower Chicago | A | 2022 / NAP | 1,463,000 | |||||
| BMO Financial Group | 493,000 | $35.00 | NAV | |||||
| Chapman & Cutler LLP | 88,020 | $36.00 | 12.0 | |||||
| 333 North Green Street | A | 2019 / NAP | 553,412 | |||||
| Ernst & Young | 39,203 | $35.50 | 12.0 | |||||
| Willis Tower | A | 1973 / 2020 | 3,810,000 | |||||
| Vi Senior Living | 30,405 | $33.50 | 11.0 | |||||
| 600 West Chicago | B | 1908 / 2001 & 2016 | 1,617,630 | |||||
| Barry Callebaut | 60,000 | $27.00 | 12.0 | |||||
| 24 East Washington Street | A | 1909 / 2020 | 672,590 | |||||
| Vivid Seats | 110,000 | $32.00 | 12.0 | |||||
| 210 North Carpenter Street | A | 2018 / NAP | 205,630 | |||||
| 132,205 | $33.27 | 15.0 | ||||||
| Total / Wtd. Avg | 1,144,887 | $34.00 | ||||||
| (1) | Source: Appraisal. |
| (2) | Based on the underwritten rent roll dated December 1, 2021. Rent PSF for the Old Chicago Post Office Property is solely based on the office tenants. |
THE INFORMATION IN THIS STRUCTURAL AND COLLATERAL TERM SHEET IS NOT COMPLETE AND MAY BE AMENDED PRIOR TO THE TIME OF SALE. THIS TERM SHEET IS NOT AN OFFER TO SELL THESE SECURITIES AND IT IS NOT A SOLICITATION OF AN OFFER TO BUY THESE SECURITIES IN ANY JURISDICTION WHERE THE OFFER OR SALE IS NOT PERMITTED.
42 of 158
| Structural and Collateral Term Sheet | Benchmark 2022-B32 | |
| Old Chicago Post Office | ||
| Market Rent Conclusion(1) | |||||
| Office | First Floor Retail | Food Hall | Storage | Management | |
| Market Rent | $30.50 | $35.00 | $20.00 | $22.50 | $0.00 |
| Lease Term (months) | 120 | 120 | 120 | 120 | 180 |
| Lease Type (reimbursements) | NNN | NNN | NNN | Gross | Gross |
| (1) | Source: Appraisal. |
| Historical Occupancy(1) | |||
| 2019 | 2020 | 2021 | Current(2) |
| N/A | N/A | N/A | 91.8% |
| (1) | Historical occupancies are not available as the property is newly redeveloped. Redevelopment began in 2016 and as of the Cut-off Date construction is substantially complete. |
| (2) | Current Occupancy is based on the December 1, 2021 rent roll. |
| Tenant Summary(1) | |||||||
| Tenant | Credit Rating | Net Rentable Area (SF)(3) | % of Total NRA | Base Rent(2) | Base Rent PSF(2) | % of Total Base Rent | Lease Expiration Date |
| Uber | B2 / B / NR | 368,179 | 15.8% | $11,801,870 | $32.05 | 17.2% | 6/30/2030 |
| Walgreens(3) | Baa2 / BBB / BBB- | 219,698 | 9.4 | 6,573,550 | $29.92 | 9.6 | 11/30/2032 |
| Pepsico | A1 / A+ / NR | 193,420 | 8.3 | 6,636,908 | $34.31 | 9.7 | 12/31/2028 |
| CBOE | A3 / A- / NR | 188,667 | 8.1 | 6,283,716 | $33.31 | 9.2 | 8/31/2035 |
| Cisco Systems, Inc. | A1 / AA- / NR | 134,270 | 5.8 | 4,864,503 | $36.23 | 7.1 | 7/31/2030 |
| FHLBC | Aaa / AA+ / NR | 129,065 | 5.5 | 4,282,177 | $33.18 | 6.2 | 12/31/2035 |
| Ferrara Candy | NR / NR / NR | 115,828 | 5.0 | 4,151,013 | $35.84 | 6.0 | 10/31/2031 |
| Vizient(4) | Ba3 / BB / NR | 110,769 | 4.8 | 3,826,758 | $34.55 | 5.6 | 4/30/2038 |
| Abelson-Taylor, Inc.(5) | NR / NR / NR | 84,887 | 3.6 | 2,564,052 | $30.21 | 3.7 | 2/28/2035 |
| TrueBlue(6) | NR / NR / NR | 82,578 | 3.5 | 2,793,201 | $33.83 | 4.1 | 6/30/2036 |
| Total Occupied | 1,627,361 | 69.8% | $53,777,748 | $33.05 | 78.3% | ||
| Other Occupied Tenants | 431,737 | 18.5 | 12,802,178 | $29.65 | 18.6 | ||
| Amenity(7) | 80,948 | 3.5 | 2,074,293 | $25.63 | 3.0 | ||
| Total Occupied Space | 2,140,046 | 91.8% | $68,654,219 | $32.08 | 100.0% | ||
| Vacant | 191,431 | 8.2 | |||||
| Total / Wtd. Avg. | 2,331,477 | 100.0% | |||||
| (1) | Based on the underwritten rent roll dated December 1, 2021. Certain tenants have associated gap and free rent abatements all of which were reserved for on the origination date. See “Description of the Mortgage Pool – Tenant Issues – Other” in the Preliminary Prospectus for additional information. |
| (2) | Base Rent and Base Rent PSF are exclusive of straight line credit for investment grade tenants taken through the Old Chicago Post Office Whole Loan term. |
| (3) | Walgreens tenancy is comprised of (i) 208,557 square feet of office space ($29.88 per square foot) and (ii) 11,141 square feet of ground floor retail ($30.75 per square foot). Lease Expiration Date is reflective of Walgreens office lease. The Lease Expiration Date with respect to the Walgreens retail space is March 31, 2034. Please see “Major Office Tenant Termination Options” below. |
| (4) | Vizient, has executed a lease but has not yet taken occupancy for the entirety of their space. Following buildout of its space, Vizient is expected to take occupancy in May 2023. |
| (5) | Abelson-Taylor is currently marketing 43,000 square feet (approximately 1.8% of net rentable area) for sublease. The related lease expires in February 2035 with a one-time termination option in February 2032, both beyond the term of the Old Chicago Post Office Whole Loan. |
| (6) | TrueBlue subleased a portion of its’ space (24,853 square feet, approximately 1.1% of net rentable area) to Peerless Network, Inc. The related lease expires in October 2024 and has a base rental rate of $28.17 per square foot during the initial lease year. |
| (7) | Amenity spaces at the Old Chicago Post Office Property have been leased to the Property Manager, an affiliate of the Loan Sponsor, which in turn passes through related rents to the underlying tenant’s at the Old Chicago Post Office Property. |
THE INFORMATION IN THIS STRUCTURAL AND COLLATERAL TERM SHEET IS NOT COMPLETE AND MAY BE AMENDED PRIOR TO THE TIME OF SALE. THIS TERM SHEET IS NOT AN OFFER TO SELL THESE SECURITIES AND IT IS NOT A SOLICITATION OF AN OFFER TO BUY THESE SECURITIES IN ANY JURISDICTION WHERE THE OFFER OR SALE IS NOT PERMITTED.
43 of 158
| Structural and Collateral Term Sheet | Benchmark 2022-B32 | |
| Old Chicago Post Office | ||
| Major Office Tenant Termination Options | ||||
| Tenant | NRA(1) | % of NRA | Termination/Contraction Effective Date | Termination |
| Uber | 368,179 | 15.8% | 12/31/2025 | One-time option, effective December 31, 2025, to surrender not less than 35,000 square feet nor more than 45,000 square feet, subject to a requirement for a prior notice by no later than September 30, 2024, and a contraction fee equal to the unamortized portion of leasing costs and three months recurring rent. |
| Walgreens | 219,698 | 9.4% | 11/30/2027 | One-time option, effective November 30, 2027, to surrender 38,000 to 42,000 square feet, subject to a 12 months’ prior notice and a contraction fee equal to the unamortized portion of leasing costs. |
| PepsiCo | 193,420 | 8.3% | 12/31/2025 | One-time option, effective December 31, 2025, to reduce the square footage by 22,367 square feet, subject to at least 12 months’ prior notice and a contraction fee equal to two months’ recurring rent and the unamortized portion of leasing costs. |
| CBOE | 188,667 | 8.1% | 8/31/2032 | One-time termination option, effective August 31, 2032, subject to 18 months’ prior notice and a termination fee equal to six times the monthly recurring rent and the unamortized portion of the leasing costs. |
| Cisco Systems, Inc. | 134,270 | 5.8% | 1/31/2028 | One-time termination option, effective on the last day of the 90th lease month, subject to a 12 months’ notice requirement and termination fee equal to four times the monthly recurring rent and the unamortized portion of leasing costs. |
| FHLBC | 129,065 | 5.5% | 12/31/2030 | One-time termination option, effective on the last day of the 10th lease year, subject to a 15 months’ notice requirement and a termination fee equal to (i) three times the monthly rent, (ii) $11,356,633 and (iii) the unamortized portion of leasing costs. |
| Ferrara Candy | 115,828 | 5.0% | 9/30/2028 | One-time termination option, effective on the 9th year anniversary of the lease commencement date, subject to a 12 months’ notice requirement and a termination fee equal to the unamortized portion of the leasing costs and four months of recurring rent. |
| Vizient | 110,769 | 4.8% | 4/30/2035 | One-time termination option, effective on the last day of the 12th lease year, subject to a 15 months’ notice requirement and a termination fee equal to the sum of (i) five times the monthly base rent, (ii) five times the monthly installment of additional rent and (iii) the unamortized portion of the leasing costs. |
| Abelson-Taylor, Inc. | 84,887 | 3.6% | 2/29/2032 | One-time termination option, effective on the last day of the 12th lease year, subject to a 12 months’ notice requirement and a termination fee equal to unamortized leasing costs and two months of recurring rent. |
| TrueBlue | 82,578 | 3.5% | 3/31/2033 | One-time termination option, effective on the last day of the 12th of the last lease year, subject to a 12 months’ notice requirement and a termination fee equal to two times recurring rent and the unamortized portion of the leasing costs. |
| Total | 1,627,361 | 69.8% | ||
| (1) | Based on the underwritten rent roll dated as of December 1, 2021. |
| Lease Rollover Schedule(1) | |||||||||
| Year | Number of Leases Expiring | Net Rentable Area Expiring | % of NRA Expiring | Base Rent Expiring(2)(3) | % of Base Rent Expiring(2)(3) | Cumulative Net Rentable Area Expiring | Cumulative % of NRA Expiring | Cumulative Base Rent Expiring | Cumulative % of Base Rent Expiring |
| Vacant | NAP | 191,431 | 8.2% | NAP | NAP | 191,431 | 8.2% | NAP | NAP |
| 2022 & MTM | 0 | 0 | 0.0% | 0 | 0.0% | 191,431 | 8.2% | $0 | 0.0% |
| 2023 | 1 | 2,389 | 0.1% | 130,416 | 0.2% | 193,820 | 8.3% | $130,416 | 0.2% |
| 2024 | 1 | 1,493 | 0.1% | 81,503 | 0.1% | 195,313 | 8.4% | $211,918 | 0.3% |
| 2025 | 0 | 0 | 0.0% | 0 | 0.0% | 195,313 | 8.4% | $211,918 | 0.3% |
| 2026 | 0 | 0 | 0.0% | 0 | 0.0% | 195,313 | 8.4% | $211,918 | 0.3% |
| 2027 | 0 | 0 | 0.0% | 0 | 0.0% | 195,313 | 8.4% | $211,918 | 0.3% |
| 2028 | 1 | 193,420 | 8.3% | 6,636,908 | 9.7% | 388,733 | 16.7% | $6,848,826 | 10.0% |
| 2029(4) | 0 | 80,948 | 3.5% | 2,074,293 | 3.0% | 469,681 | 20.1% | $8,923,119 | 13.0% |
| 2030 | 2 | 502,449 | 21.6% | 16,666,373 | 24.3% | 972,130 | 41.7% | $25,589,492 | 37.3% |
| 2031 | 1 | 115,828 | 5.0% | 4,151,013 | 6.0% | 1,087,958 | 46.7% | $29,740,504 | 43.3% |
| 2032 & Thereafter(5) | 18 | 1,243,519 | 53.3% | 38,913,715 | 56.7% | 2,331,477 | 100.0% | $68,654,219 | 100.0% |
| Total | 2,331,477 | 100.0% | $68,654,219 | 100.0% | |||||
| (1) | Based on the underwritten rent roll dated December 1, 2021. |
| (2) | Certain tenants may hold termination or contraction options (which may become exercisable prior to the originally stated expiration date of the tenant lease) that are not considered in the above Lease Rollover Schedule. |
| (3) | Base Rent Expiring and % of Base Rent Expiring are exclusive of straight line credit for investment grade tenants taken through the loan term. |
| (4) | Inclusive of square footage and base rent attributable to amenity spaces leased to an affiliate of the Loan Sponsor. |
| (5) | 2032 & Thereafter includes storage and management office space. |
THE INFORMATION IN THIS STRUCTURAL AND COLLATERAL TERM SHEET IS NOT COMPLETE AND MAY BE AMENDED PRIOR TO THE TIME OF SALE. THIS TERM SHEET IS NOT AN OFFER TO SELL THESE SECURITIES AND IT IS NOT A SOLICITATION OF AN OFFER TO BUY THESE SECURITIES IN ANY JURISDICTION WHERE THE OFFER OR SALE IS NOT PERMITTED.
44 of 158
| Structural and Collateral Term Sheet | Benchmark 2022-B32 | |
| Old Chicago Post Office | ||
| Underwritten Net Cash Flow(1)(2) | ||||
| Loan Sponsor Budget | Underwritten | Per Square Foot | % of EGI | |
| Base Rent | $68,654,219 | $68,654,219 | $29.45 | 59.3% |
| Vacant Income | 6,317,223 | 6,285,085 | $2.70 | 5.4% |
| Gross Potential Rent | $74,971,442 | $74,939,304 | $32.14 | 64.7% |
| Total Reimbursements | 35,898,718 | 39,460,931 | $16.93 | 34.1% |
| Gross Rental Income | $110,870,160 | $114,400,235 | $49.07 | 98.8% |
| (Vacancy/Credit Loss) | (9,342,111) | (9,594,634) | ($4.12) | (8.4)% |
| Straight Line Rent Credit(3) | $0 | 1,357,955 | $0.58 | 1.2% |
| Total Other Income(4) | 9,638,410 | 9,638,410 | $4.13 | 8.4% |
| Effective Gross Income | $111,166,459 | $115,801,966 | $49.67 | 100.0% |
| Total Expenses(5) | 38,166,196 | 39,254,351 | $16.84 | 33.9% |
| Net Operating Income | $73,000,263 | $76,547,615 | $32.83 | 66.1% |
| TI/LC | 0 | 0 | $0.00 | 0.0% |
| Replacement Reserves | 0 | 467,228 | $0.20 | 0.4% |
| Net Cash Flow | $73,000,263 | $76,080,387 | $32.63 | 65.7% |
| (1) | Based on the underwritten rent roll dated December 1, 2021. |
| (2) | Historical financials are not available as the property is newly redeveloped. Redevelopment began in 2016 and as of the Cut-off Date construction is substantially complete. |
| (3) | Underwritten Straight Line Rent Credit is inclusive straight line rent for investment grade tenants through the Old Chicago Post Office Whole Loan term. |
| (4) | Total Other Income is inclusive of event rental/commission income, fitness center income, food hall operations income, parking revenue. |
| (5) | Underwritten Total Expenses are inclusive of real estate taxes subject to certain adjustments assuming the Borrower has attained Class L real estate tax designation and benefits from the associated real estate tax savings. See “Class L Tax Abatement” below. |
Property Management. The Old Chicago Post Office Property is managed by 601 W Chicago OPO Property Manager LLC, an affiliate of the Borrower and sub-managed by Jones Lang LaSalle Americas, Inc., a Maryland corporation.
Escrows and Reserves. At loan origination, the Borrower deposited (i) approximately $302,576 into an insurance reserve, (ii) approximately $2,343,888 into a real estate tax reserve, (iii) approximately $3,911,510 into a remaining hard cost reserve, (iv) approximately $4,265,829 into an HTC put obligation reserve, (v) approximately $50,942,055 into an outstanding TI/LC reserve and (vi) approximately $59,453,368 into a gap and free rent reserve.
Tax Reserve – On each monthly due date, the Borrower is required to deposit an amount equal to 1/12th of the estimated annual real estate taxes and other charges into the tax reserve account.
Insurance Reserve – On each monthly due date, the Borrower is required to deposit into an insurance reserve an amount equal to 1/12th of estimated insurance premiums. Notwithstanding the foregoing, if the Borrower maintains a blanket insurance policy in form and substance reasonably acceptable to the lender, and provided that no event of default exists and remains uncured, the Borrower will not be required to make monthly deposits for insurance premiums into the insurance reserve account.
Replacement Reserve – On each monthly due date, the Borrower is required to deposit approximately $48,572 into a replacement reserve, subject to a cap of $1,165,739.
TI/LC Reserve – On each monthly due date, during the continuance of a Cash Sweep Event (as defined below), the Borrower is required to deposit approximately $194,289.
HTC Put Obligation Reserve – Commencing on January 1, 2025 and continuing each monthly due date thereafter, the Borrower is required to deposit approximately $177,743. The HTC Put Obligation Reserve may be used to purchase the HTC Investor’s ownership interest in the Master Lessee in the event that the HTC Investor exercises its related put option after the recapture period. See “Description of the Mortgage Pool–Real Estate and Other Tax Considerations” in the Preliminary Prospectus.
Lockbox / Cash Management. The Old Chicago Post Office Whole Loan is structured with an in place hard lockbox and in place cash management. At loan origination, the Borrower was required to deliver tenant direction letters instructing all tenants to deposit rents into a lender-controlled lockbox account. All funds in the lockbox accounts will be swept twice per week into a cash management account controlled by the lender throughout the term of the Old Chicago Post Office Whole Loan. All funds on deposit in the Cash Management Account will be used first to pay the Master Lessee Monthly Remittance Amount (as defined below) to the master lessee on each payment date. Any amounts remaining in the cash management account after payment of the Master Lessee Monthly Remittance Amount will be run through lender’s cash management waterfall. All funds on deposit in the cash management account will be used first to pay the Master Lessee Monthly Remittance Amount (as defined below) to the Master Lessee (as defined below) on each payment date. During the
THE INFORMATION IN THIS STRUCTURAL AND COLLATERAL TERM SHEET IS NOT COMPLETE AND MAY BE AMENDED PRIOR TO THE TIME OF SALE. THIS TERM SHEET IS NOT AN OFFER TO SELL THESE SECURITIES AND IT IS NOT A SOLICITATION OF AN OFFER TO BUY THESE SECURITIES IN ANY JURISDICTION WHERE THE OFFER OR SALE IS NOT PERMITTED.
45 of 158
| Structural and Collateral Term Sheet | Benchmark 2022-B32 | |
| Old Chicago Post Office | ||
continuance of a Cash Sweep Event, all excess cash remaining in the cash management account after payment of the Master Lessee Monthly Remittance Amount will be applied in accordance with the Old Chicago Post Office Whole Loan documents and are required to be held by the lender in an excess cash flow reserve account as additional collateral for the Old Chicago Post Office Whole Loan, provided, that, in the event of a Major Tenant Trigger Event (as defined below), the lender will only continue to hold excess cash until such time as the amount in the excess cash reserve equals $100.00 times the aggregate number of rentable square feet demised by the applicable major lease.
A “Cash Sweep Event” means (a) an event of default under the Old Chicago Post Office Whole Loan or the Old Chicago Post Office Mezzanine Loan (b) the bankruptcy or insolvency of the Borrower, master lessee, manager or sub-manager, (c) if the debt service coverage ratio based on the trailing three month period immediately preceding the date of determination is less than (x) 1.65x for the total debt including the Old Chicago Post Office Whole Loan and the Old Chicago Post Office Mezzanine Loan (the “Old Chicago Post Office Total Debt”) or (y) 2.28x for the Old Chicago Post Office Whole Loan (a “DSCR Trigger Event”), or (d) a Major Tenant Trigger Event.
A Cash Sweep Event may be cured upon occurrence of the following: (i) with respect to the clause (c) above, the achievement of a debt service coverage ratio of (A) 1.70x or greater with respect to the Old Chicago Post Office Total Debt and (B) 2.35x or greater with respect to the Old Chicago Post Office Whole Loan, in each case, for two consecutive quarters based upon the trailing three-month period immediately preceding the date of determination, (ii) with respect to the clause (a) above, the acceptance by the lender under the Old Chicago Post Office Whole Loan or the Old Chicago Post Office Mezzanine Loan, as applicable, of a cure of such event of default, (iii) with respect to the clause (b) above solely with respect to the manager, if the Borrower replaces the manager with a “Qualified Manager” (as fully described in the Old Chicago Post Office Whole Loan documents) under a replacement management agreement acceptable to the lender in accordance with the Old Chicago Post Office Whole Loan documents within 60 days after such bankruptcy action, or (iv) with respect to the clause (d) above, (A) if the Borrower leases all or substantially all of the space previously leased to the Major Tenant (as defined below) to one or more replacement tenants reasonably acceptable to the lender pursuant to one or more leases reasonably acceptable to the lender, (B) if the Major Tenant that is the subject of a Major Tenant Operations Trigger Event (as defined below) (x) has delivered notice of its intent to vacate or terminate its lease and subsequently rescinds such notice in writing or (y) was dark and subsequently resumes operations and, in each case, such Major Tenant is paying full unabated rent (other than full or partial abatements set forth in such Major Tenant’s lease provided such abated rent has been reserved with the lender), (C) if the Major Tenant that was the subject of a Major Tenant Renewal Trigger Event extends its lease or (D) if the Major Tenant that was the subject of a bankruptcy action assumes its lease in such bankruptcy action; provided, (i) no event of default has occurred and is continuing under the Old Chicago Post Office Whole Loan documents or the Old Chicago Post Office Mezzanine Loan documents, (ii) a Cash Sweep Event may be cured no more than a total of four times in the aggregate during the term of the Old Chicago Post Office Whole Loan, and (iii) the Borrower has paid all of the lender’s reasonable expenses incurred in connection with such cure of a Cash Sweep Event, including reasonable attorneys’ fees and expenses.
A “Major Tenant” means Uber.
A “Major Tenant Trigger Event” means (a) any bankruptcy action of the Major Tenant, (b) the failure of the Major Tenant to renew its lease prior to the date that is 12 months prior to the expiration date of its lease (a “Major Tenant Renewal Trigger Event”), or (c) the Major Tenant, among other things, “going dark”, vacating, or otherwise abandoning its premises or terminating its lease in accordance with the Old Chicago Post Office Whole Loan documents (a “Major Tenant Operations Trigger Event”).
The “Master Lessee Monthly Remittance Amount” means any revenues from the Old Post Office portion of the Old Chicago Post Office Property that exceed the sum of (i) base rent (currently $3,541,666.66 per month), (ii) 1/12th of the estimated annual percentage rent (if cash receipts are in excess of annual base rent in any collection period, then percentage rent will equal 20% of cash receipts, provided that such amount will not exceed 90% of the excess of cash receipts over project expenses), subject to an annual reconciliation if the monthly projected percentage rent that is paid to Borrower in aggregate over a calendar year ends up being different than the annual percentage rent required under the master lease), (iii) any accrued and unpaid rent that is due and payable to Borrower under the master lease, (iv) certain project expenses (including, without limitation, operating expenses and the costs of any necessary repairs and replacements of the Old Chicago Post Office Property in accordance with an approved capital budget) and (v) 1/12th of the projected annual distribution to the managing member of master lessee, which is an affiliate of Borrower, under the operating agreement of master lessee.
Current Mezzanine or Subordinate Indebtedness. Concurrently with the funding of the Old Chicago Post Office Whole Loan, the direct and certain indirect equity owners of the Borrower pledged their respective direct or indirect ownership interests to secure a mezzanine loan in the original principal amount of $125,000,000 (the “Old Chicago Post Office Mezzanine Loan”). The Old Chicago Post Office Mezzanine Loan is coterminous with the Old Chicago Post Office Whole Loan. Interest is payable on the Old Chicago Post Office Mezzanine Loan at a fixed per annum rate equal to 8.50000%. The rights of the mezzanine lender under the Old Chicago Post Office Mezzanine Loan is further described under “Description of the Mortgage Pool—Additional Indebtedness—Mezzanine Indebtedness” in the Preliminary Prospectus.
THE INFORMATION IN THIS STRUCTURAL AND COLLATERAL TERM SHEET IS NOT COMPLETE AND MAY BE AMENDED PRIOR TO THE TIME OF SALE. THIS TERM SHEET IS NOT AN OFFER TO SELL THESE SECURITIES AND IT IS NOT A SOLICITATION OF AN OFFER TO BUY THESE SECURITIES IN ANY JURISDICTION WHERE THE OFFER OR SALE IS NOT PERMITTED.
46 of 158
| Structural and Collateral Term Sheet | Benchmark 2022-B32 | |
| Old Chicago Post Office | ||
Future Mezzanine or Subordinate Indebtedness Permitted. None.
Partial Release. The Borrower may obtain release of a certain parcel as described in the Old Chicago Post Office Whole Loan documents (the “Release Parcel”) from the lien of the mortgage upon the satisfaction of the conditions set forth in the Old Chicago Post Office Whole Loan documents, including, without limitation, the following: (i) the amount of the outstanding principal balance of the Old Chicago Post Office Whole Loan to be defeased must equal or exceed $30,492,644, (ii) no event of default is continuing, (iii) after giving effect to the release of the Release Parcel (including the portion of the Old Chicago Post Office Whole Loan defeased), (A) the debt service coverage ratio for the Old Chicago Post Office Property then remaining subject to the lien of the mortgage based on the trailing 12-month period immediately preceding the release of the Release Parcel must be equal to or greater than the greater of (x) 1.90x and (y) the debt service coverage ratio immediately preceding the release of the Release Parcel based on the trailing 12-month period immediately preceding the release of the Release Parcel for the Old Chicago Post Office Total Debt and (B) the debt service coverage ratio (mortgage only) for the Old Chicago Post Office Property then remaining subject to the lien of the mortgage based on the trailing 12-month period immediately preceding the release of the Release Parcel must be equal to or greater than the greater of (x) 2.61x and (y) the debt service coverage ratio (mortgage only) immediately preceding the release of the Release Parcel based on the trailing 12-month period immediately preceding the release of the Release Parcel for the Old Chicago Post Office Whole Loan, (iv) the Borrower must transfer title of the Release Parcel to a person other than the Borrower or any of its affiliates, (v) the borrower of the Old Chicago Post Office Mezzanine Loan must prepay the Old Chicago Post Office Mezzanine Loan in an amount which equals or exceeds $4,592,266, together with the payment of the applicable yield maintenance premium, and (vi) upon release of the Release Parcel, the customary REMIC rules are satisfied.
Class L Tax Abatement. The Borrower has applied for a reduction in the assessed value of a portion of the Old Chicago Post Office Property, including the underlying land, under the Cook County Class L real estate tax incentive program (the “Class L Reduction”), which encourages the preservation and rehabilitation of landmark commercial, industrial and income-producing not-for-profit buildings. If the Class L Reduction is approved, the value of the applicable portion of the Old Chicago Post Office Property will be assessed for real estate taxes at reduced assessment levels for a 12-year period: 10% of full market value for the first 10 years, 15% in year 11, 20% in year 12 and back to the regular assessment level in year 13, which is currently 25% of full market value. See “Description of the Mortgage Pool – Real Estate and Other Tax Considerations” in the Preliminary Prospectus for additional information.
Historic Tax Credits. In connection with the Borrower’s rehabilitation and conversion of the Old Chicago Post Office Property from a former United States Postal Service building to an office property, the Old Chicago Post Office Property benefits from federal historic tax credits (the “HTCs”), in the amount equal to 20% of the qualified rehabilitation expenditures (“QREs”) incurred in connection with such rehabilitation. The Borrower has elected to pass the HTCs through to the Master Lessee (as defined below). The Loan Sponsor has sold a 99% interest in the Master Lessee to Carlisle Sandpiper Historic Fund II Limited Partnership, (a majority of which is owned by an entity affiliated with JPMCB) (the “HTC Investor“), resulting in the HTC Investor being entitled to 99% of the HTCs due to its equity interest in the Master Lessee. An affiliate of the borrower (the “Managing Member of the Master Lessee”) retains a 1% controlling interest in the master lessee, which interest the Managing Member of the Master Lessee has pledged as collateral for the Old Chicago Post Office Whole Loan. The HTCs are subject to recapture in the event the building on which HTCs were claimed ceases to be a “business use property” or upon a “disposition” of the building (which includes, among other things, a sale or transfer of the improvements attributable to QREs (the “Rehabilitation Improvements”)) prior to the first business day following the fifth anniversary of the date on which the related Rehabilitation Improvements are “Placed in Service” (the “HTC Recapture Period Expiration Date”). In addition, (x) pursuant to the Master Lessee’s operating agreement, the HTC Investor is entitled to certain distributions subject to available cash flow and (y) pursuant to a certain purchase agreement (the “Purchase Agreement”) between the Managing Member of the Master Lessee and the HTC Investor, the HTC Investor has a put-option to cause the Managing Member of the Master Lessee to purchase all of the HTC Investor’s interests in the Master Lessee upon the occurrence of the HTC Recapture Period Expiration Date and the payment to HTC Investor of aggregate distributions equal to or greater than 10% of the Master Lessee’s capital contributions (or, in the event that the lender or mezzanine lender has foreclosed on the Old Chicago Post Office Property or accepted a deed in lieu thereof, HTC Investor may exercise it’s put option upon the occurrence of any recapture of the HTCs). See “Description of the Mortgage Pool – Real Estate and Other Tax Considerations” in the Preliminary Prospectus for additional information.
Master Lease. In connection with the Old Chicago Post Office Property benefitting from the HTC program, the borrower leased the Old Chicago Post Office Property to 601W Companies Chicago MT LLC (“Master Lessee”), pursuant to a master lease, under which the Master Lessee operates the Old Chicago Post Office Property and pays an annual rent to the Borrower, payable out of the net cash flow of the Old Chicago Post Office Property. The Master Lessee has agreed to deposit all income generated by the property into a lockbox account for the benefit of the lender. Pursuant to the related subordination, non-disturbance and attornment agreement among the lender, the Borrower, and the Master Lessee, the master lease is subordinate to the lien of the mortgage in exchange for the lender’s agreement to not terminate the master lease following a foreclosure until the HTC Recapture Period Expiration Date for the last QRE that is included in any federal income tax return of the Master Lessee or the HTC Investor. The lender has agreed that, notwithstanding whether any Cash Sweep Event or event of default is continuing, each month it will disburse to Master Lessee any revenues from the Old Post Office portion of the Old Chicago Post Office Property that exceed the sum of (i) base rent (currently $3,541,666.66 per month), (ii) 1/12th of the estimated annual percentage rent (if cash receipts are in excess of annual base rent in any collection period, then percentage rent will equal 20% of cash receipts, provided that such amount will not exceed 90% of the excess of cash receipts over project expenses), subject to an annual
THE INFORMATION IN THIS STRUCTURAL AND COLLATERAL TERM SHEET IS NOT COMPLETE AND MAY BE AMENDED PRIOR TO THE TIME OF SALE. THIS TERM SHEET IS NOT AN OFFER TO SELL THESE SECURITIES AND IT IS NOT A SOLICITATION OF AN OFFER TO BUY THESE SECURITIES IN ANY JURISDICTION WHERE THE OFFER OR SALE IS NOT PERMITTED.
47 of 158
| Structural and Collateral Term Sheet | Benchmark 2022-B32 | |
| Old Chicago Post Office | ||
reconciliation if the monthly projected percentage rent that is paid to Borrower in aggregate over a calendar year ends up being different than the annual percentage rent required under the Master Lease), (iii) any accrued and unpaid rent that is due and payable to the Borrower under the master lease (iv) certain project expenses (including, without limitation, operating expenses and the costs of any necessary repairs and replacements of the Old Chicago Post Office Property in accordance with an approved capital budget) and (v) 1/12th of the projected annual distribution to the Managing Member of Master Lessee, which is an affiliate of the Borrower, under the operating agreement (the “Master Lessee Operating Agreement”) of the Master Lessee (the “Master Lessee Monthly Remittance Amount”). See “Description of the Mortgage Pool – Tenant Issues – Affiliated Leases” in the Preliminary Prospectus for additional information.
THE INFORMATION IN THIS STRUCTURAL AND COLLATERAL TERM SHEET IS NOT COMPLETE AND MAY BE AMENDED PRIOR TO THE TIME OF SALE. THIS TERM SHEET IS NOT AN OFFER TO SELL THESE SECURITIES AND IT IS NOT A SOLICITATION OF AN OFFER TO BUY THESE SECURITIES IN ANY JURISDICTION WHERE THE OFFER OR SALE IS NOT PERMITTED.
48 of 158
(THIS PAGE INTENTIONALLY LEFT BLANK)
THE INFORMATION IN THIS STRUCTURAL AND COLLATERAL TERM SHEET IS NOT COMPLETE AND MAY BE AMENDED PRIOR TO THE TIME OF SALE. THIS TERM SHEET IS NOT AN OFFER TO SELL THESE SECURITIES AND IT IS NOT A SOLICITATION OF AN OFFER TO BUY THESE SECURITIES IN ANY JURISDICTION WHERE THE OFFER OR SALE IS NOT PERMITTED.
49 of 158
| Structural and Collateral Term Sheet | Benchmark 2022-B32 | |
| Bedrock Portfolio | ||
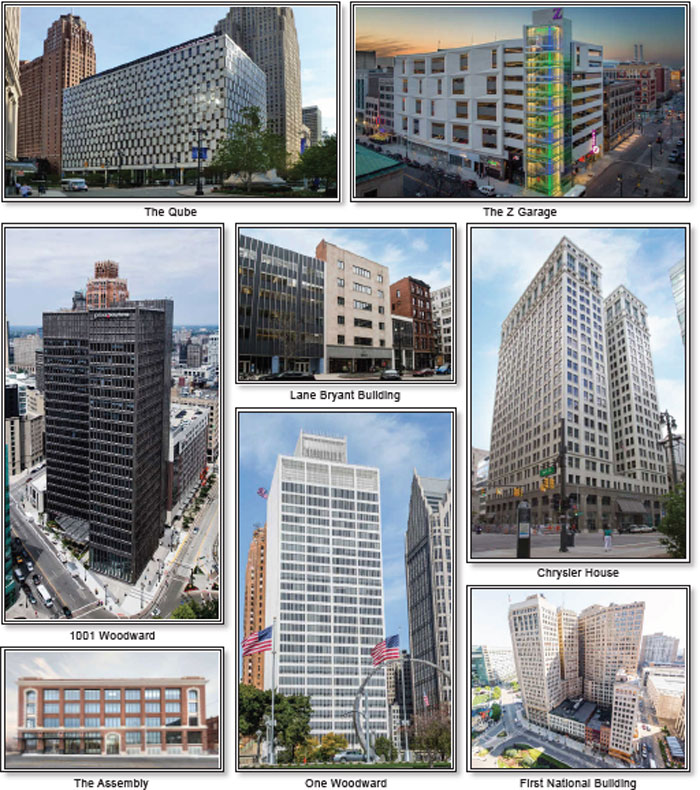
THE INFORMATION IN THIS STRUCTURAL AND COLLATERAL TERM SHEET IS NOT COMPLETE AND MAY BE AMENDED PRIOR TO THE TIME OF SALE. THIS TERM SHEET IS NOT AN OFFER TO SELL THESE SECURITIES AND IT IS NOT A SOLICITATION OF AN OFFER TO BUY THESE SECURITIES IN ANY JURISDICTION WHERE THE OFFER OR SALE IS NOT PERMITTED.
50 of 158
| Structural and Collateral Term Sheet | Benchmark 2022-B32 | |
| Bedrock Portfolio | ||
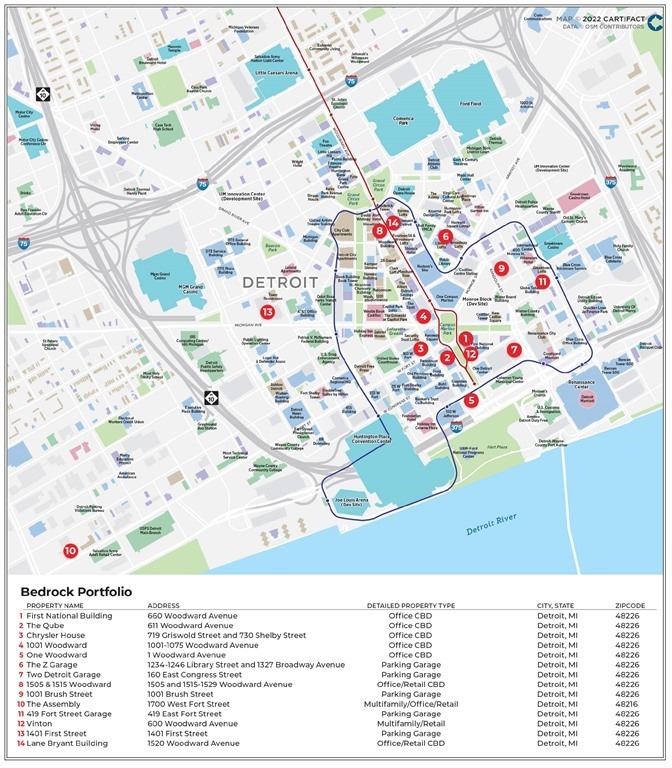
THE INFORMATION IN THIS STRUCTURAL AND COLLATERAL TERM SHEET IS NOT COMPLETE AND MAY BE AMENDED PRIOR TO THE TIME OF SALE. THIS TERM SHEET IS NOT AN OFFER TO SELL THESE SECURITIES AND IT IS NOT A SOLICITATION OF AN OFFER TO BUY THESE SECURITIES IN ANY JURISDICTION WHERE THE OFFER OR SALE IS NOT PERMITTED.
51 of 158
| Structural and Collateral Term Sheet | Benchmark 2022-B32 | |
| Bedrock Portfolio | ||
| Mortgage Loan Information | Property Information | |||
| Mortgage Loan Seller: | JPMCB | Single Asset / Portfolio: | Portfolio | |
| Original Principal Balance(1): | $125,000,000 | Title(3): | Fee / Leasehold | |
| Cut-off Date Principal Balance(1): | $125,000,000 | Property Type – Subtype(4): | Various / Various | |
| % of Pool by IPB: | 7.0% | Net Rentable Area (SF): | 2,694,627 | |
| Loan Purpose: | Refinance | Location: | Detroit, Michigan | |
| Borrower(2): | Various | Year Built / Renovated(4): | Various / Various | |
| Guarantor: | Rock Backer LLC | Occupancy(5): | 88.7% | |
| Interest Rate: | 3.77800% | Occupancy Date: | Various | |
| Note Date: | 12/28/2021 | Number of Tenants: | 113 | |
| Maturity Date: | 1/1/2029 | Fourth Most Recent NOI: | $42,141,735 (December 31, 2018) | |
| Interest-only Period: | 84 months | Third Most Recent NOI: | $47,208,742 (December 31, 2019) | |
| Original Term: | 84 months | Second Most Recent NOI: | $54,095,059 (December 31, 2020) | |
| Original Amortization: | None | Most Recent NOI: | $55,595,704 (TTM September 30, 2021) | |
| Amortization Type: | Interest Only | UW Economic Occupancy: | 87.7% | |
| Call Protection: | L(25),YM1(55),O(4) | UW Revenues: | $97,560,449 | |
| Lockbox / Cash Management: | Hard (Commercial); | UW Expenses: | $39,136,450 | |
| Springing (Residential) / Springing | UW NOI: | $58,423,999 | ||
| Additional Debt(1): | Yes | UW NCF: | $54,409,505 | |
| Additional Debt Balance(1): | $305,000,000 | Appraised Value / Per SF: | $724,300,000 / $269 | |
| Additional Debt Type(1): | Pari Passu | Appraisal Date: | Various | |
| Escrows and Reserves(6) | Financial Information(1) | ||||||
| Initial | Monthly | Initial Cap | Cut-off Date Loan / SF: | $160 | |||
| Taxes: | $1,696,002 | $424,000 | N/A | Maturity Date Loan / SF: | $160 | ||
| Insurance: | $0 | Springing | N/A | Cut-off Date LTV: | 59.4% | ||
| Replacement Reserves: | $62,336 | $62,336 | $1,469,568 | Maturity Date LTV: | 59.4% | ||
| TI/LC: | $280,690 | $280,690 | $5,000,000 | UW NCF DSCR: | 3.30x | ||
| Other: | $9,362,153 | $0 | N/A | UW NOI Debt Yield: | 13.6% | ||
| |||||||
| Sources and Uses | |||||||
| Sources | Proceeds | % of Total | Uses | Proceeds | % of Total | ||
| Loan Amount | $430,000,000 | 100.0% | Payoff Existing Debt | $331,057,990 | 77.0% | ||
| Principal Equity Distribution | 83,185,780 | 19.3% | |||||
| Reserves | 11,401,181 | 2.7% | |||||
| Closing Costs | 4,355,049 | 1.0% | |||||
| Total Sources | $430,000,000 | 100.0% | Total Uses | $430,000,000 | 100.0% | ||
| (1) | The Bedrock Portfolio Loan (as defined below) is part of a whole loan evidenced by 10 pari passu notes with an aggregate outstanding principal balance of $430.0 million. The financial information in the chart above reflects the Cut-off Date Balance of the Bedrock Portfolio Whole Loan (as defined below). |
| (2) | The borrowers of the Bedrock Portfolio Mortgage Loan are Michigan Parking Co LLC, 419 Fort Street LLC, 1001 Brush Street LLC, 1001 Webward LLC, One Webward Avenue LLC, 719 Griswold Associates LLC, 660 Woodward Associates LLC, 1234 Library LLC, 600 Webward Avenue LLC, 611 Webward Avenue LLC, 1505 Webward LLC, 1520 Webward Avenue LLC, Corktown Lofts LLC and WWA Parking LLC. |
| (3) | The One Woodward Mortgaged Property is subject to a ground lease expiring in April 2040. |
| (4) | The Bedrock Portfolio Whole Loan is secured by the fee or leasehold interests in seven office buildings, five parking garages and two mixed-use properties that were built between 1913 and 2013. Each Mortgaged Property within the portfolio was renovated between 2010 and 2019. See “Portfolio Summary” table herein. |
| (5) | Occupancy represents occupancy for office and retail space in the Bedrock Portfolio. |
| (6) | For a full description of Escrows and Reserves, please refer to “Escrows and Reserves” below. |
THE INFORMATION IN THIS STRUCTURAL AND COLLATERAL TERM SHEET IS NOT COMPLETE AND MAY BE AMENDED PRIOR TO THE TIME OF SALE. THIS TERM SHEET IS NOT AN OFFER TO SELL THESE SECURITIES AND IT IS NOT A SOLICITATION OF AN OFFER TO BUY THESE SECURITIES IN ANY JURISDICTION WHERE THE OFFER OR SALE IS NOT PERMITTED.
52 of 158
| Structural and Collateral Term Sheet | Benchmark 2022-B32 | |
| Bedrock Portfolio | ||
The Loan. The Bedrock Portfolio mortgage loan is part of a whole loan with an aggregate outstanding principal balance as of the Cut-off Date of $430.0 million (the “Bedrock Portfolio Whole Loan”) evidenced by 10 pari passu notes, secured by the borrower’s fee or leasehold interests in a portfolio of office, mixed use and parking garage properties located in the Detroit, Michigan central business district (the “Bedrock Portfolio” or the “Bedrock Portfolio Properties”). The controlling note A-1-1, with an aggregate outstanding principal balance as of the Cut-off Date of $125,000,000 (the “Bedrock Portfolio Loan”), will be included in the Benchmark 2022-B32 trust. The remaining notes are expected to be contributed to one or more future securitization trusts or may otherwise be transferred at any time. The Bedrock Portfolio Whole Loan was co-originated by JPMorgan Chase Bank, National Association and Starwood Mortgage Capital LLC (“SMC”). The proceeds of the Bedrock Portfolio Whole Loan were primarily used to refinance the Bedrock Portfolio, return equity to the loan sponsor and pay closing costs. The relationship between the holders of the Bedrock Portfolio Whole Loan is governed by a co-lender agreement as described under “Description of the Mortgage Pool—The Whole Loans—The Serviced Pari Passu Whole Loans” in the Preliminary Prospectus.
| Whole Loan Summary | ||||
| Note | Original Balance | Cut-off Date Balance | Note Holder | Controlling Piece |
| A-1-1 | $125,000,000 | $125,000,000 | Benchmark 2022-B32 | Yes |
| A-1-2 | $50,000,000 | $50,000,000 | JPMCB(1) | No |
| A-1-3 | $50,000,000 | $50,000,000 | JPMCB(1) | No |
| A-1-4 | $50,000,000 | $50,000,000 | JPMCB(1) | No |
| A-1-5 | $30,000,000 | $30,000,000 | JPMCB(1) | No |
| A-1-6 | $39,000,000 | $39,000,000 | JPMCB(1) | No |
| A-2-1 | $40,000,000 | $40,000,000 | SMC(1) | No |
| A-2-2 | $26,000,000 | $26,000,000 | SMC(1) | No |
| A-2-3 | $10,000,000 | $10,000,000 | SMC(1) | No |
| A-2-4 | $10,000,000 | $10,000,000 | SMC(1) | No |
| Whole Loan | $430,000,000 | $430,000,000 | ||
| (1) | Expected to be contributed to one or more future securitization trusts or otherwise transferred at any time. |
The Borrowers. The borrowers are Michigan Parking Co LLC, 419 Fort Street LLC, 1001 Brush Street LLC, 1001 Webward LLC, One Webward Avenue LLC, 719 Griswold Associates LLC, 660 Woodward Associates LLC, 1234 Library LLC, 600 Webward Avenue LLC, 611 Webward Avenue LLC, 1505 Webward LLC, 1520 Webward Avenue LLC, Corktown Lofts LLC and WWA Parking LLC, each a Delaware limited liability company structured to be single purpose bankruptcy-remote entities having at least two independent directors in their organizational structure. Legal counsel to the borrowers delivered a non-consolidation opinion in connection with the origination of the Bedrock Portfolio Whole Loan.
The Loan Sponsor. The loan sponsor is Bedrock Detroit, which is owned and controlled by Dan Gilbert and affiliated entities, and the non-recourse carveout guarantor is Rock Backer LLC. Founded in 2011, Bedrock Detroit is a full service commercial real estate firm based in downtown Detroit, specializing in the strategic development of urban cores. With a portfolio of more than 100 properties totaling over 18 million square feet, Bedrock Detroit is one of the largest real estate partners in downtown Detroit. Since its founding, Bedrock Detroit and its affiliates have invested and committed more than $5.6 billion to acquiring and developing more than 100 properties, including new construction of ground up developments in downtown Detroit and Cleveland totaling more than 20 million square feet. Bedrock Detroit’s real estate personnel provide a full range of services with in-house teams for each area of expertise, including leasing, acquisition, finance, construction, architecture, historic rehab and property management. Bedrock Detroit’s tenants include leading technology companies and startups, world-renowned restaurants and national retailers, as well as Detroit locals. Bedrock Detroit also leases mixed-income residential properties to individuals, and acquires and renovates properties for new development. Bedrock Detroit and Dan Gilbert’s family of companies have been critical in the urban revival of Detroit and have demonstrated a strong commitment to the continued growth and stability of the market.
The loan sponsor acquired the Bedrock Portfolio for an aggregate purchase price of approximately $191.2 million and has since invested approximately $464.9 million across the Bedrock Portfolio, resulting in a total cost basis of approximately $656.1 million.
The Properties. The Bedrock Portfolio consists of seven office buildings with ground floor retail (2,529,041 square feet; 80.7% of underwritten net cash flow), five parking garages (5,036 stalls; 16.1% of underwritten net cash flow) and two mixed-use multifamily buildings (53 units; 3.1% of underwritten net cash flow). The Bedrock Portfolio Properties are located in Downtown Detroit and are accessible via the I-75, I-94 and I-96 expressways in addition to other major roadways. The Bedrock Portfolio benefits from diversity across a cross collateralized portfolio encompassing several commercial and residential uses, in addition to a tenant mix representing a wide array of industries. A number of trophy office assets are included in the Bedrock Portfolio, which includes historic rehabilitations of landmark buildings, as well as state of the art ground up construction. The Bedrock Portfolio represents a critical mass of CBD Class A office inventory, comprising a substantial share of the overall submarket.
As of November 10, 2021, the Bedrock Portfolio office properties were 88.7% leased to a diverse array of institutional quality tenancy, including several sponsor-affiliated publicly traded entities. Dan Gilbert-affiliated and/or controlled entities including Quicken Loans, Amrock, Inc. and Bedrock Management Services LLC account for approximately 58.0% of underwritten base rent.
THE INFORMATION IN THIS STRUCTURAL AND COLLATERAL TERM SHEET IS NOT COMPLETE AND MAY BE AMENDED PRIOR TO THE TIME OF SALE. THIS TERM SHEET IS NOT AN OFFER TO SELL THESE SECURITIES AND IT IS NOT A SOLICITATION OF AN OFFER TO BUY THESE SECURITIES IN ANY JURISDICTION WHERE THE OFFER OR SALE IS NOT PERMITTED.
53 of 158
| Structural and Collateral Term Sheet | Benchmark 2022-B32 | |
| Bedrock Portfolio | ||
Collectively, the five parking garages drive approximately 16.1% of underwritten net cash flow. The parking garage component features a combination of long-term parking leases (37.8% of total parking garage revenue), month-to-month leases (22.6% of total parking garage revenue), transient parking (9.4% of total parking garage revenue), as well as contractual parking leases associated with on-site parking at the office properties (30.2%). The parking garages in the Bedrock Portfolio benefit from high demand for parking in the Detroit central business district, with an average monthly utilization (occupancy) of 124.5% on leased and month-to-month parking spaces (not including transient parking) as of the third quarter of 2021. Utilization has averaged 122.8% since Q1 2019. Due to the lack of publicly available transportation historically driven in part by resistance from the motor vehicle industry, Detroit has functioned primarily on personal car transportation which continues to benefit the garages in the Bedrock Portfolio.
| Portfolio Summary | |||||||||
| Property Name | Property Type / Subtype | Year Built / Renovated | SF / Stalls / Units | Allocated Whole Loan Cut-off Date Balance | % of Allocated Whole Loan Cut-off Date Balance | Appraised Value | % of Appraised Value | UW NCF | % of UW NCF |
| First National Building | Office / CBD | 1921 / 2010 | 800,119 / 427 / - | 99,140,800 | 23.1% | $162,000,000 | 22.4% | $14,276,324 | 26.2% |
| The Qube | Office / CBD | 1958 / 2011 | 522,702 / - / - | 63,038,000 | 14.7% | 103,000,000 | 14.2% | $8,693,152 | 16.0% |
| Chrysler House | Office / CBD | 1919 / 2013 | 343,488 / 924 / - | 49,278,000 | 11.5% | 83,000,000 | 11.5% | $6,142,746 | 11.3% |
| 1001 Woodward | Office / CBD | 1965 / 2013 | 319,039 / 731 / - | 48,959,800 | 11.4% | 80,000,000 | 11.0% | $6,887,443 | 12.7% |
| One Woodward | Office / CBD | 1962 / 2013 | 370,257 / 90 / - | 35,492,200 | 8.3% | 58,000,000 | 8.0% | $5,096,070 | 9.4% |
| The Z Garage | Other / Parking Garage | 2013 / 2015-2016 | 40,227 / 1,351 / - | 29,007,800 | 6.7% | 53,000,000 | 7.3% | $2,078,882 | 3.8% |
| Two Detroit Garage | Other / Parking Garage | 2002 / 2015-2016 | - / 1,106 / - | 21,955,800 | 5.1% | 37,000,000 | 5.1% | $2,928,886 | 5.4% |
| 1505 & 1515 Woodward | Office / CBD | 1925 / 2018 | 141,741 / - / - | 20,777,600 | 4.8% | 35,000,000 | 4.8% | $2,454,589 | 4.5% |
| 1001 Brush Street | Other / Parking Garage | 1993 / 2015-2016 | 38,519 / 1,309 / - | 17,535,400 | 4.1% | 32,000,000 | 4.4% | $1,683,875 | 3.1% |
| The Assembly | Mixed Use / Multifamily/Office/Retail | 1913 / 2019 | 81,147 / 50 / 32 | 13,717,000 | 3.2% | 23,100,000 | 3.2% | $1,334,926 | 2.5% |
| 419 Fort Street Garage | Other / Parking Garage | 2005 / 2015-2016 | - / 637 / - | 12,470,000 | 2.9% | 21,000,000 | 2.9% | $1,584,990 | 2.9% |
| Vinton | Mixed Use / Multifamily/Retail | 1917 / 2018 | 5,693 / - / 21 | 7,525,000 | 1.8% | 17,500,000 | 2.4% | $377,823 | 0.7% |
| 1401 First Street | Other / Parking Garage | 1976 / 2017 | - / 633 / - | 7,421,800 | 1.7% | 13,500,000 | 1.9% | $502,080 | 0.9% |
| Lane Bryant Building | Office / CBD | 1917 / 2018 | 31,695 / - / - | 3,680,800 | 0.9% | 6,200,000 | 0.9% | $367,719 | 0.7% |
| Total | 2,694,627 / 7,258 / 53 | $430,000,000 | 100.0% | $724,300,000 | 100.0% | $54,409,505 | 100.0% | ||
| Historical Parking Utilization(1) | |||||||||||||
| Parking Garages | Stalls | Q1 2019 | Q2 2019 | Q3 2019 | Q4 2019 | Q1 2020 | Q2 2020 | Q3 2020 | Q4 2020 | Q1 2021 | Q2 2021 | Q3 2021 | Average |
| 1001 Brush Street | 1,309 | 119.3% | 118.6% | 120.8% | 119.0% | 131.5% | 127.1% | 129.3% | 122.7% | 116.7% | 91.5% | 129.3% | 120.5% |
| 1401 First Street | 633 | 147.9% | 131.3% | 130.3% | 133.3% | 107.7% | 92.1% | 80.9% | 79.8% | 76.8% | 78.5% | 80.9% | 103.6% |
| 419 Fort Street Garage | 637 | 106.4% | 109.6% | 122.8% | 120.1% | 152.9% | 163.7% | 167.7% | 153.4% | 146.2% | 142.1% | 167.7% | 141.1% |
| The Z Garage | 1,351 | 119.3% | 119.0% | 120.0% | 117.6% | 125.7% | 119.0% | 112.2% | 107.8% | 101.1% | 115.2% | 112.2% | 115.4% |
| Two Detroit Garage | 1,106 | 119.0% | 119.9% | 120.8% | 120.2% | 122.9% | 127.3% | 134.2% | 146.8% | 162.6% | 177.3% | 134.2% | 135.0% |
| Total / Wtd. Avg. | 5,036 | 121.2% | 119.4% | 122.0% | 120.8% | 127.8% | 125.2% | 124.5% | 122.5% | 121.3% | 121.4% | 124.5% | 122.8% |
| (1) | Historical parking utilization above 100% is attributable to transient parking allowing for a single space to be occupied by multiple users in a given day. |
Major Tenants.
The largest tenant, Quicken Loans Inc. (“Quicken Loans”) (905,935 square feet; 33.6% of net rentable area; 39.5% of underwritten base rent), was founded in 1985 and markets conventional, government insured and sub-prime debt consolidation and home financing loans, secured primarily by first or second mortgages on one-to four-family, owner-occupied residences. Quicken Loans originates loans through 18 stores and branches, one call center and an Internet site. During the third quarter of 2021, Quicken Loans originated approximately $88 billion of mortgage loans and generated net income of approximately $1.4 billion. Quicken Loans rebranded in July 2021 and is now known as Rocket Mortgage. Quicken Loans leases space in five buildings with staggered lease expiration dates, including (i) 183,664 square feet expiring in August 2023 for which it has two, five-year renewal options, (ii) 122,475 square feet expiring in April 2024 for which it has three, three-year renewal options, (iii) 15,602 square feet expiring in October 2025 for which it has no renewal options, (iv) 407,050 square feet expiring in July 2028 for which it has two, five-year renewal options, (v) 21,124 square feet expiring in January 2030 for which it has two, five-year renewal options and (vi) 156,020 square feet expiring in March 2032 for which it has, two, five-year renewal options. Quicken Loans has no remaining termination options. Dan Gilbert, the founder of the Loan Sponsor, has voting control in the parent company of Rocket Mortgage as a preferred shareholder.
The second largest tenant, Amrock, Inc (“Amrock”) (424,486 square feet; 15.8% of net rentable area; 16.7% of underwritten base rent), was founded in 1997 and provides title insurance, property valuations, and settlement services in the United States. Amrock offers residential solutions for a range of settlement services and products, including defined process work flows and data integrations; commercial title insurance coverages; valuation products and services through a network of residential real estate appraisers; title and settlement services in the state of Connecticut; escrow and closing services in the state of Washington; and ATLAS, a technology platform that supports title and settlement service platform, as well as allows a client to manage preferences, prioritize orders, and work flows. Amrock serves Fortune 100 companies and residential mortgage lenders, as well as residential lending institutions and smaller community-based lenders. Amrock has two, five-year renewal options and no termination options. Amrock is affiliated with Dan Gilbert and the Loan Sponsor.
THE INFORMATION IN THIS STRUCTURAL AND COLLATERAL TERM SHEET IS NOT COMPLETE AND MAY BE AMENDED PRIOR TO THE TIME OF SALE. THIS TERM SHEET IS NOT AN OFFER TO SELL THESE SECURITIES AND IT IS NOT A SOLICITATION OF AN OFFER TO BUY THESE SECURITIES IN ANY JURISDICTION WHERE THE OFFER OR SALE IS NOT PERMITTED.
54 of 158
| Structural and Collateral Term Sheet | Benchmark 2022-B32 | |
| Bedrock Portfolio | ||
Quicken Loans and Amrock are subsidiaries of Rocket Mortgage Companies (NYSE:RKT), founded and controlled by Dan Gilbert, which announced its IPO in the summer of 2020. Rocket Mortgage Companies engages in the tech-driven real estate, mortgage and eCommerce businesses in the United States and Canada. As of January 12, 2022, Rocket Mortgage Companies had a market cap of approximately $28.1 billion and approximately 24,000 employees.
The third largest tenant, Honigman Miller Schwartz and Cohn LLP (“Honigman”) (150,786 square feet; 5.6% of net rentable area; 6.7% of underwritten base rent), was founded in 1948 and is a law firm that employs over 325 attorneys and 350 staff and operates a local, national, and international practice from its Michigan offices in Detroit, Bloomfield Hills, Lansing, Ann Arbor, Kalamazoo, and Grand Rapids, its Illinois office in Chicago and its office in Washington, DC. Honigman’s attorneys practice in more than 60 different areas of business law. Honigman has two, five-year renewal options and no termination options.
The Market. The Bedrock Portfolio is located in downtown Detroit, Michigan, which, according to the appraisal, remains the economic and entertainment focal point of southeast Michigan and serves as a major international crossing with Canada. The Bedrock Portfolio benefits from Detroit’s hub layout that results in many roadways emanating from the central business district into the surrounding communities. Detroit is serviced by the Detroit-Metropolitan Wayne County Airport situated approximately fifteen miles southwest in the City of Romulus. This international airport serves as the mid-western hub of operation for Delta Airlines, as well as servicing other commercial airlines. Passenger rail service to other cities is provided by Amtrak with the central station located in the New Center area immediately north of the central business district.
According to the appraisal, the primary demand generator in Downtown Detroit has been the growing employment base. A number of large employers have anchored the central business district including Quicken Loans, TitleSource, Blue Cross/Blue Shield, MSX International, Rossetti and Campbell Ewald. Downtown Detroit offers a number of entertainment districts including Foxtown, the sports venues (Ford Field, home to the NFL’s Detroit Lions, Comerica Park, home to MLB’s Detroit Tigers, and Little Caesars Arena, home to the NBA’s Detroit Pistons and the NHL’s Detroit Red Wings) and three casinos. There are a growing number of restaurants and bars throughout the Downtown area. This district is emerging with new developments and renovation projects that are projected to transform the district.
According to the appraisal, there have been several recent developments in Downtown Detroit that are expected to have a positive long-term impact on the Downtown market, including Ford’s acquisition of Michigan Central Station in Corktown. Ford is in the process of developing a multi-billion dollar investment in autonomous-vehicle development in Corktown. Additionally, TCF Bank, formerly Chemical Bank, is constructing a new 20-story building downtown that is projected to add an additional 500 workers.
The appraiser identified four comparable office leases with rents ranging from $24.50 to $29.75 per square foot. Based on the identified lease comparables, the appraiser concluded market rents ranging between $26.50 and $29.50 per square foot for the seven office properties in the Bedrock Portfolio, generally in-line with underwritten base rents across the office component of the Bedrock Portfolio.
| Office Lease Comparables(1) | ||||||||
| Property | Address | Year Built | Building Size (SF) | Tenant Name | Size (SF) | Lease Start Date | Lease Term | Rent PSF |
| Bedrock Portfolio Office Tenants | Various | 2,694,627 | $25.26 | |||||
| One Detroit Center | 500 Woodward Ave. | 1992 | 979,477 | DT Midstream | 22,727 | Nov-21 | 126 | $29.75 |
| Renaissance Center | 400 E. Jefferson Ave. | 1980 | 7,123,170 | Consulate of Italy | 4,133 | Mar-21 | 110 | $26.00 |
| Fisher Building | 3011 W. Grand Blvd. | 1928 | 634,819 | Strategic Staffing | 57,000 | Jan-21 | 120 | $24.50 |
| Hemmeter Building | 230 E. Grand River Ave. | 1913 | 56,203 | UHY | 7,156 | Sep-20 | 60 | $25.00 |
| Total / Wtd. Avg. | 1945 | 2,198,417 | 22,754 | Mar-21 | 116 | $25.92 | ||
| (1) | Bedrock Portfolio Office Tenants Rent PSF is based on the underwritten rent roll dated as of November 10, 2021. |
COVID-19 Update. As of February 1, 2022, the Bedrock Portfolio Properties are open and operating. No tenants are currently subject to rent abatements in connection with COVID-19. As of February 1, 2022, the Bedrock Portfolio Whole Loan is not subject to any modification or forbearance requests. The first payment date is scheduled for February 1, 2022. See “Risk Factors—Special Risks—The Coronavirus Pandemic Has Adversely Affected the Global Economy and Will Likely Adversely Affect the Performance of the Mortgage Loans” in the Preliminary Prospectus.
| Office and Retail Historical and Current Occupancy(1) | |||||
| 2016 | 2017 | 2018 | 2019 | 2020 | Current(2) |
| 82.5% | 81.5% | 85.0% | 88.9% | 92.4% | 88.7% |
| (1) | Historical occupancies are as of December 31 of each respective year. |
| (2) | Current Occupancy is based on the underwritten rent roll as of November 10, 2021. |
THE INFORMATION IN THIS STRUCTURAL AND COLLATERAL TERM SHEET IS NOT COMPLETE AND MAY BE AMENDED PRIOR TO THE TIME OF SALE. THIS TERM SHEET IS NOT AN OFFER TO SELL THESE SECURITIES AND IT IS NOT A SOLICITATION OF AN OFFER TO BUY THESE SECURITIES IN ANY JURISDICTION WHERE THE OFFER OR SALE IS NOT PERMITTED.
55 of 158
| Structural and Collateral Term Sheet | Benchmark 2022-B32 | |
| Bedrock Portfolio | ||
| Office and Retail Tenant Summary(1) | ||||||||
| Tenant | Tenant Type | Ratings Moody’s/S&P/Fitch(2) | Net Rentable Area (SF) | % of Total NRA | Base Rent PSF | % of Total Base Rent | Lease Expiration Date | Renewal Options |
| Quicken Loans Inc.(3) | Office | NR/NR/NR | 905,935 | 33.6% | $26.04 | 39.5% | Various | Various |
| Amrock, Inc | Office | NR/NR/NR | 424,486 | 15.8% | $23.50 | 16.7% | 1/31/2032 | 2, 5-Year |
| Honigman Miller Schwartz and Cohn LLP | Office | NR/NR/NR | 150,786 | 5.6% | $26.50 | 6.7% | 11/30/2025 | 2, 5-Year |
| LinkedIn Corporation | Office | Aaa/AAA/AAA | 74,497 | 2.8% | $31.53 | 3.9% | 7/31/2026 | 1, 5-Year |
| Coyote Logistics | Office | A2/A-/NR | 58,192 | 2.2% | $29.25 | 2.9% | 10/31/2030 | 1, 5-Year |
| Kitch Drutchas Wagner Valitutti & Sherbrook, P.C. | Office | NR/NR/NR | 56,265 | 2.1% | $27.17 | 2.6% | 5/31/2028 | 1, 5-Year |
| Board of Trustees of Michigan State University | Office | NR/NR/NR | 46,598 | 1.7% | $28.84 | 2.3% | 9/30/2031 | 2, 1-Year |
| Bedrock Management Services LLC | Office | NR/NR/NR | 39,087 | 1.5% | $26.81 | 1.8% | 1/31/2032 | 1, 5-Year |
| JPMorgan Chase, National Association | Office | A2/A-/AA- | 32,126 | 1.2% | $29.13 | 1.6% | 5/31/2027 | 1, 5-Year |
| Fifth Third Bank | Office | Baa1/BBB+/A- | 31,204 | 1.2% | $24.80 | 1.3% | 10/31/2025 | 1, 5-Year |
| Ten Largest Tenants | 1,819,176 | 67.5% | $25.97 | 79.2% | ||||
| Remaining Occupied Office Tenants | 461,647 | 17.1% | $22.47 | 17.4% | ||||
| Remaining Occupied Retail Tenants | 110,225 | 4.1% | $18.48 | 3.4% | ||||
| Total Occupied | 2,391,048 | 88.7% | $24.95 | 100.0% | ||||
| Vacant | 303,579 | 11.3% | �� | |||||
| Total / Wtd. Avg. | 2,694,627 | 100.0% | ||||||
| (1) | Based on the underwritten rent roll dated as of November 10, 2021. |
| (2) | In certain instances, ratings provided are those of the parent company of the entity shown, whether or not the parent company guarantees the lease. |
| (3) | Quicken Loans Inc. has various Lease Expiration Dates, including (i) 183,664 square feet expiring in August 2023 for which it has two, five-year renewal options, (ii) 122,475 square feet expiring in April 2024 for which it has three, three-year renewal options, (iii) 15,602 square feet expiring in October 2025 for which it has no renewal options, (iv) 407,050 square feet expiring in July 2028 for which it has two, five-year renewal options, (v) 21,124 square feet expiring in January 2030 for which it has two, five-year renewal options and (vi) 156,020 square feet expiring in March 2032 for which it has, two, five-year renewal options. Quicken Loans Inc. has no remaining termination options. |
| Office and Retail Lease Rollover Schedule(1)(2) | |||||||||
| Year | Number of Leases Expiring | Net Rentable Area Expiring | % of NRA Expiring | Base Rent Expiring | % of Base Rent Expiring | Cumulative NRA Expiring | Cumulative % of NRA Expiring | Cumulative Base Rent Expiring | Cumulative % of Base Rent Expiring |
| Vacant | NAP | 303,579 | 11.3% | NAP | NAP | 303,579 | 11.3% | NAP | NAP |
| 2022 & MTM | 44 | 146,690 | 5.4% | $3,246,316 | 5.4% | 450,269 | 16.7% | $3,246,316 | 5.4% |
| 2023 | 16 | 304,272 | 11.3% | 7,252,186 | 12.2% | 754,541 | 28.0% | $10,498,502 | 17.6% |
| 2024 | 18 | 200,069 | 7.4% | 5,784,259 | 9.7% | 954,610 | 35.4% | $16,282,761 | 27.3% |
| 2025 | 15 | 258,173 | 9.6% | 6,687,343 | 11.2% | 1,212,783 | 45.0% | $22,970,104 | 38.5% |
| 2026 | 11 | 142,573 | 5.3% | 4,271,955 | 7.2% | 1,355,356 | 50.3% | $27,242,059 | 45.7% |
| 2027 | 7 | 76,383 | 2.8% | 1,493,570 | 2.5% | 1,431,739 | 53.1% | $28,735,629 | 48.2% |
| 2028 | 3 | 463,315 | 17.2% | 12,537,526 | 21.0% | 1,895,054 | 70.3% | $41,273,155 | 69.2% |
| 2029 | 1 | 3,536 | 0.1% | 97,240 | 0.2% | 1,898,590 | 70.5% | $41,370,395 | 69.3% |
| 2030 | 2 | 79,316 | 2.9% | 2,329,710 | 3.9% | 1,977,906 | 73.4% | $43,700,105 | 73.3% |
| 2031 | 1 | 46,598 | 1.7% | 1,343,886 | 2.3% | 2,024,504 | 75.1% | $45,043,991 | 75.5% |
| 2032 & Thereafter | 4 | 670,123 | 24.9% | 14,612,316 | 24.5% | 2,694,627 | 100.0% | $59,656,307 | 100.0% |
| Total | 122 | 2,694,627 | 100.0% | $59,656,307 | 100.0% | ||||
| (1) | Based on the underwritten rent roll dated November 10, 2021. |
| (2) | Certain tenants may have termination or contraction options (which may become exercisable prior to the originally stared expiration date of the tenant lease) that are not considered in the above Office and Retail Lease Rollover Schedule. |
THE INFORMATION IN THIS STRUCTURAL AND COLLATERAL TERM SHEET IS NOT COMPLETE AND MAY BE AMENDED PRIOR TO THE TIME OF SALE. THIS TERM SHEET IS NOT AN OFFER TO SELL THESE SECURITIES AND IT IS NOT A SOLICITATION OF AN OFFER TO BUY THESE SECURITIES IN ANY JURISDICTION WHERE THE OFFER OR SALE IS NOT PERMITTED.
56 of 158
| Structural and Collateral Term Sheet | Benchmark 2022-B32 | |
| Bedrock Portfolio | ||
| Operating History and Underwritten Net Cash Flow(1) | |||||||
| 2018 | 2019 | 2020 | TTM September 2021 | Underwritten(1) | Per Square Foot | % | |
| Rents In Place(2) | $49,546,085 | $52,751,303 | $57,994,616 | $60,138,958 | $59,656,311 | $22.14 | 70.4% |
| Vacant Income | 0 | 0 | 0 | 0 | 7,501,625 | 2.78 | 8.9% |
| Gross Potential Rent | $49,546,085 | $52,751,303 | $57,994,616 | $60,138,958 | $67,157,936 | $24.92 | 79.3% |
| Total Reimbursements | 8,517,719 | 9,107,253 | 8,931,194 | 7,857,374 | 12,024,156 | 4.46 | 14.2% |
| Percentage Rent | 2,421,923 | 2,615,463 | 1,377,500 | 1,277,610 | 2,991,501 | 1.11 | 3.5% |
| Other Rental Storage(3) | 1,978,084 | 2,343,354 | 2,799,699 | 2,808,240 | 2,544,077 | 0.94 | 3.0% |
| Gross Potential Income | $62,463,811 | $66,817,372 | $71,103,009 | $72,082,182 | $84,717,669 | $31.44 | 100.0% |
| Vacancy/Credit Loss | (1,100,662) | (1,099,639) | (1,694,177) | (2,030,041) | (10,418,183) | (3.87) | (12.3%) |
| Concessions | (89,423) | (49,389) | (45,615) | (44,800) | 0 | 0.00 | 0.0% |
| Parking (Contractual) | 19,565,127 | 20,062,906 | 20,373,075 | 20,247,590 | 19,321,511 | 7.17 | 22.8% |
| Parking (Transient) | 4,382,014 | 5,250,614 | 1,860,131 | 2,231,702 | 2,004,714 | 0.74 | 2.4% |
| Other Income | 1,423,306 | 2,619,763 | 1,723,795 | 1,925,200 | 1,934,739 | 0.72 | 2.3% |
| Effective Gross Income | $86,644,173 | $93,601,628 | $93,320,219 | $94,411,832 | $97,560,449 | $36.21 | 115.2% |
| Total Expenses | 44,502,438 | 46,392,886 | 39,225,160 | 38,816,129 | 39,136,450 | 14.52 | 40.1% |
| Net Operating Income | $42,141,735 | $47,208,742 | $54,095,059 | $55,595,704 | $58,423,999 | $21.68 | 59.9% |
| TI/LC | 0 | 0 | 0 | 0 | 3,353,632 | 1.24 | 3.4% |
| Capital Expenditures | 0 | 0 | 0 | 0 | 660,862 | 0.25 | 0.7% |
| Net Cash Flow | $42,141,735 | $47,208,742 | $54,095,059 | $55,595,704 | $54,409,505 | $20.19 | 55.8% |
| (1) | Based on underwritten rent roll dated November 10, 2021. |
| (2) | Underwritten Rents In Place is inclusive of (i) contractual rent steps though December 2022 and (i) straight-line average rent over the lease term for investment grade rated tenants. |
| (3) | Other Rental Storage includes grossed up multifamily income and other storage income. |
Property Management. The Bedrock Portfolio Properties are currently managed by Bedrock Management Services LLC.
Escrows and Reserves. At loan origination, the Borrower deposited (i) $8,392,690 into an outstanding TI/LC reserve, (ii) approximately $1,696,002 into a real estate tax reserve, (iii) $477,905 into a free rent reserve, (iv) $280,690 into a rollover reserve, (v) $250,000 into an outstanding environmental reserve with respect to the 1700 W Fort Street individual property, (vi) $241,558 into a required repairs reserve and (vii) $62,336 into a replacement reserve.
Tax Reserve – On each monthly due date, the borrowers are required to deposit an amount equal to 1/12th of the estimated annual real estate taxes into the tax reserve account, which is estimated to be $424,000.
Insurance Reserve – On each monthly due date, the borrowers are required to deposit into an insurance reserve an amount equal to 1/12th of estimated insurance premiums, unless the borrower maintains a blanket policy in accordance with the Bedrock Portfolio Whole Loan documents.
Replacement Reserve – On each monthly due date, the borrowers are required to deposit $62,336 into a replacement reserve, subject to a cap of $1,469,568.
Rollover Reserve – On each monthly due date, the borrowers are required to deposit $280,690.
Lockbox / Cash Management. The Bedrock Portfolio Whole Loan is structured with an in place hard lockbox for commercial units, the office and retail properties, a springing lockbox for residential units, the multifamily properties and various parking properties, and springing cash management. At loan origination, the borrowers were required to direct each tenant at a property subject to a hard lockbox to remit all rents directly to the applicable lockbox account. In addition, the borrowers are required to cause all cash revenues and all other money received by the borrowers or the property manager with respect to the properties subject to a hard lockbox to be deposited into the applicable lockbox account within one business day of receipt. On each business day on which no Cash Sweep Event (as defined below) is continuing, all amounts in the lockbox account are required to be remitted to a borrower-controlled operating account. Upon the occurrence of a Cash Sweep Event, (i) the borrowers are required to establish lockbox accounts for all properties, and (ii) the borrowers are required to establish a cash management account. On each business day during the continuance of a Cash Sweep Event, all amounts in each lockbox account are required to be remitted to the cash management account. On each due date during the continuance of a Cash Sweep Event, all funds on deposit in the cash management account after payment of debt service on the Bedrock Portfolio Whole Loan, required reserves and budgeted operating expenses are required to be deposited into an excess cash flow reserve account as additional collateral for the Bedrock Portfolio Whole Loan.
A “Cash Sweep Event” means (a) an event of default, (b) the bankruptcy or insolvency of the any of the borrowers or the property manager, or (c) if the debt service coverage ratio based on a trailing three month basis for the total debt falls below 2.50x.
THE INFORMATION IN THIS STRUCTURAL AND COLLATERAL TERM SHEET IS NOT COMPLETE AND MAY BE AMENDED PRIOR TO THE TIME OF SALE. THIS TERM SHEET IS NOT AN OFFER TO SELL THESE SECURITIES AND IT IS NOT A SOLICITATION OF AN OFFER TO BUY THESE SECURITIES IN ANY JURISDICTION WHERE THE OFFER OR SALE IS NOT PERMITTED.
57 of 158
| Structural and Collateral Term Sheet | Benchmark 2022-B32 | |
| Bedrock Portfolio | ||
A Cash Sweep Event may be cured upon the occurrence of the following: (i) with respect to clause (a) above, the acceptance by the lender of a cure of such event of default in accordance with the Bedrock Portfolio Whole Loan documents, (ii) with respect to clause (b) above solely with respect to the borrowers, if the bankruptcy action is an involuntary petition against such individual borrower and no individual borrower has colluded with, or otherwise assisted, such person, and has not solicited creditors for any involuntary petition against such individual borrower from any person and the bankruptcy action is dismissed within 90 days from the filing of such bankruptcy action, (iii) with respect to clause (b) above solely with respect to the property manager, if the applicable individual borrower replaces such property manager with a “Qualified Manager” (as fully described in the Bedrock Portfolio Whole Loan documents) under a replacement management agreement acceptable to the lender in accordance with the Bedrock Portfolio Whole Loan documents, or (iv) with respect to clause (c) above, if the debt service coverage ratio based on the trailing three-month period immediately preceding the date of such determination for two consecutive quarters is not less than 2.50x; provided, however, (A) no event of default has occurred and be continuing under the Bedrock Portfolio Whole Loan documents, (B) the borrowers have paid all of Lender’s reasonable expenses incurred in connection with such Cash Sweep Event Cure including reasonable attorney’s fees and expenses, and (C) in no event may the borrowers cure a Cash Sweep Event caused by a bankruptcy action caused by any of the borrowers filing a voluntary petition or arising from a person filing an involuntary petition against any of the borrowers and any such borrower has colluded with or otherwise assisted such person with the involuntary petition against the applicable borrower.
Current Mezzanine or Subordinate Indebtedness. None.
Future Mezzanine or Subordinate Indebtedness Permitted. None.
Partial Release. The Bedrock Portfolio Whole Loan documents permit the release of an individual property (each, an “Individual Property”) from the lien of the mortgage, provided no event of default has occurred and is continuing and upon satisfaction of certain conditions set forth in the Bedrock Portfolio Whole Loan documents, including, without limitation, the following: (a) the amount of the outstanding principal balance of the Loan to be prepaid must equal or exceed 115% of the allocated loan amount for such applicable Individual Property, (b) the resulting debt service coverage ratio for the remaining Property is equal to or greater than 3.10x, (c) unless the Individual Property to be released is subject to a non-monetary event of default that relates solely to such Individual Property and borrower has demonstrated in good faith that it has pursued a cure of the event of default, the Individual Property to be released is conveyed in an arm’s length transfer to a person other than the applicable individual borrower or any of its affiliates, and (d) upon release of the Individual Property, the customary REMIC rules are satisfied.
Ground Lease. The individual property identified as One Woodward is ground leased by the borrower, as the ground lessee, under a ground lease with Lawrence Edwin Burch Living Trust and related individuals who collectively comprise the ground lessor. The borrower assumed the ground lease in 2012, which expires in April 2040 with five, 25-year remaining extension options. The current rent is approximately $43,775 annually. The ground lessee’s interest in the ground lease is freely assignable to the leasehold mortgagee without the consent of the ground lessor and, in the event that it is so assigned, is further assignable by the leasehold mortgagee without the need to obtain the consent of the ground lessor.
Master Leases. Three individual properties, identified as The Qube, Chrysler House, and 1001 Woodward, are subject to a master leases that were originally entered into for the purpose of securing historic tax credit investors. None of the historic tax credit investors remain in the ownership of the master tenants, which are now wholly owned indirectly by Detroit Real Estate Holdings Company I LLC, which directly owns each of the borrowers. Each master tenant is required to comply with single purpose entity covenants in the Bedrock Portfolio Whole Loan documents, including having independent directors. Each master tenant granted the lender a mortgage and an assignment of leases and rents on its individual property.
THE INFORMATION IN THIS STRUCTURAL AND COLLATERAL TERM SHEET IS NOT COMPLETE AND MAY BE AMENDED PRIOR TO THE TIME OF SALE. THIS TERM SHEET IS NOT AN OFFER TO SELL THESE SECURITIES AND IT IS NOT A SOLICITATION OF AN OFFER TO BUY THESE SECURITIES IN ANY JURISDICTION WHERE THE OFFER OR SALE IS NOT PERMITTED.
58 of 158
(THIS PAGE INTENTIONALLY LEFT BLANK)
THE INFORMATION IN THIS STRUCTURAL AND COLLATERAL TERM SHEET IS NOT COMPLETE AND MAY BE AMENDED PRIOR TO THE TIME OF SALE. THIS TERM SHEET IS NOT AN OFFER TO SELL THESE SECURITIES AND IT IS NOT A SOLICITATION OF AN OFFER TO BUY THESE SECURITIES IN ANY JURISDICTION WHERE THE OFFER OR SALE IS NOT PERMITTED.
59 of 158
| Structural and Collateral Term Sheet | Benchmark 2022-B32 | |
| Rosewood National Storage 13 | ||
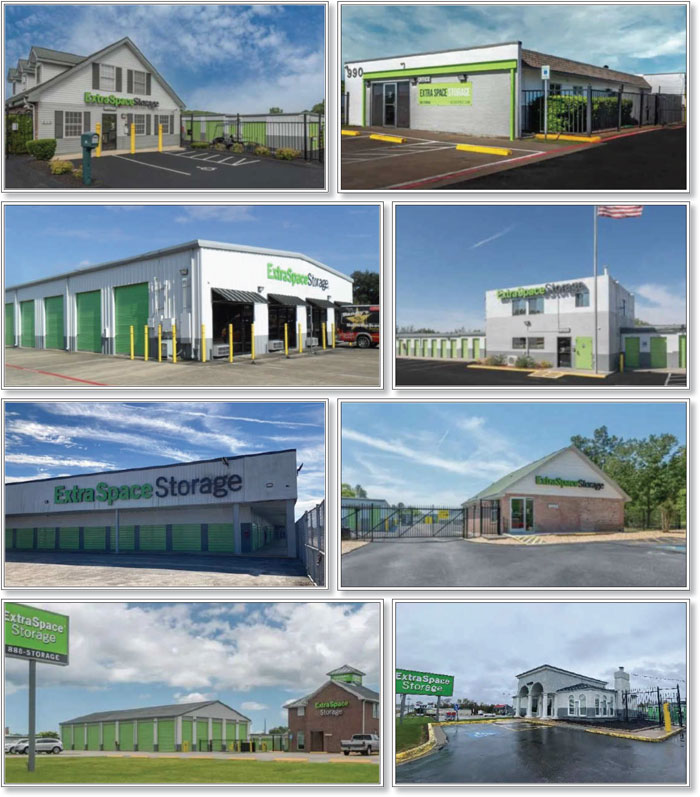
THE INFORMATION IN THIS STRUCTURAL AND COLLATERAL TERM SHEET IS NOT COMPLETE AND MAY BE AMENDED PRIOR TO THE TIME OF SALE. THIS TERM SHEET IS NOT AN OFFER TO SELL THESE SECURITIES AND IT IS NOT A SOLICITATION OF AN OFFER TO BUY THESE SECURITIES IN ANY JURISDICTION WHERE THE OFFER OR SALE IS NOT PERMITTED.
60 of 158
| Structural and Collateral Term Sheet | Benchmark 2022-B32 | |
| Rosewood National Storage 13 | ||
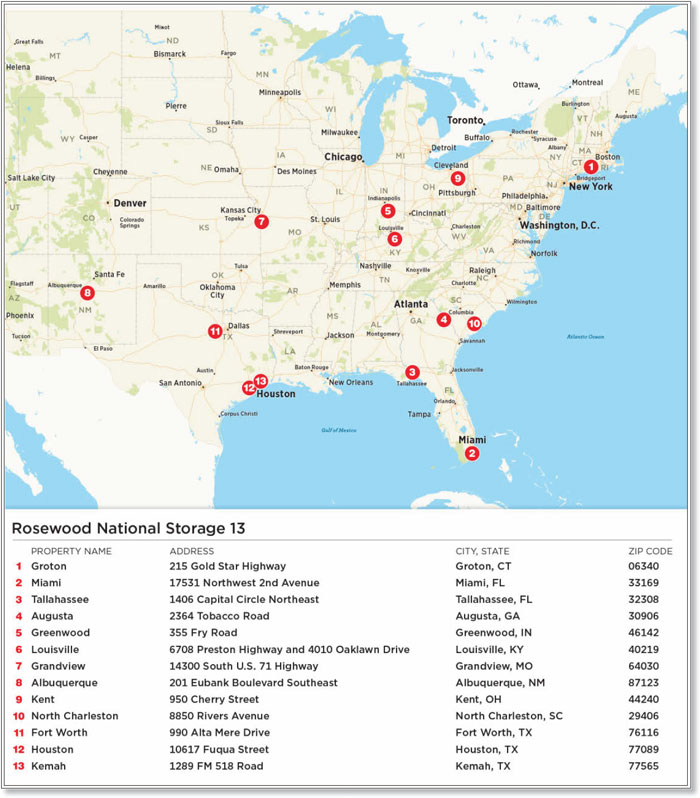
THE INFORMATION IN THIS STRUCTURAL AND COLLATERAL TERM SHEET IS NOT COMPLETE AND MAY BE AMENDED PRIOR TO THE TIME OF SALE. THIS TERM SHEET IS NOT AN OFFER TO SELL THESE SECURITIES AND IT IS NOT A SOLICITATION OF AN OFFER TO BUY THESE SECURITIES IN ANY JURISDICTION WHERE THE OFFER OR SALE IS NOT PERMITTED.
61 of 158
| Structural and Collateral Term Sheet | Benchmark 2022-B32 | |
| Rosewood National Storage 13 | ||
| Mortgage Loan Information | Property Information | |||
| Mortgage Loan Seller: | GACC | Single Asset / Portfolio: | Portfolio | |
| Original Principal Balance: | $108,575,000 | Title: | Fee | |
| Cut-off Date Principal Balance: | $108,575,000 | Property Type - Subtype: | Self - Storage | |
| % of Pool by IPB: | 6.1% | Net Rentable Area (SF): | 1,564,651 | |
| Loan Purpose: | Acquisition | Location(1): | Various | |
| Borrower: | RPC Storage 13 Portfolio, LLC | Year Built / Renovated(1): | Various / Various | |
| Guarantor: | RPC Reliance, LLC | Occupancy: | 95.5% | |
| Interest Rate: | 3.04900% | Occupancy Date: | 9/30/2021 | |
| Note Date: | 12/16/2021 | Number of Tenants: | N/A | |
| Maturity Date: | 1/6/2032 | Fourth Most Recent NOI(3): | NAV | |
| Interest-only Period: | 120 months | Third Most Recent NOI: | $8,815,991 (December 31, 2019) | |
| Original Term: | 120 months | Second Most Recent NOI: | $8,540,410 (December 31, 2020) | |
| Original Amortization: | None | Most Recent NOI: | $10,195,139 (TTM October 31, | |
| Amortization Type: | Interest Only | 2021) | ||
| Call Protection: | L(25),D(91),O(4) | UW Economic Occupancy: | 94.3% | |
| Lockbox / Cash Management: | Springing / Springing | UW Revenues: | $15,796,582 | |
| Additional Debt: | N/A | UW Expenses: | $5,122,665 | |
| Additional Debt Balance: | N/A | UW NOI: | $10,673,917 | |
| Additional Debt Type: | N/A | UW NCF: | $10,502,488 | |
| Appraised Value / Per SF(3): | $181,940,000 / $116 | |||
| Appraisal Date: | Various | |||
| Escrows and Reserves(4) | Financial Information | |||||||
| Initial | Monthly | Initial Cap | Cut-off Date Loan / SF: | $69 | ||||
| Taxes: | $166,821 | $110,764 | N/A | Maturity Date Loan / SF: | $69 | |||
| Insurance: | $0 | Springing | N/A | Cut-off Date LTV(2): | 59.7% | |||
| Replacement Reserves: | $0 | $0 | N/A | Maturity Date LTV(2): | 59.7% | |||
| TI/LC: | $0 | $0 | N/A | UW NCF DSCR: | 3.13x | |||
| Other: | $405,121 | Springing | N/A | UW NOI Debt Yield: | 9.8% | |||
| Sources and Uses | ||||||
| Sources | Proceeds | % of Total | Uses | Proceeds | % of Total | |
| Mortgage Loan | $108,575,000 | 59.6% | Purchase Price | $180,907,000 | 99.4% | |
| Sponsor Equity | 73,518,344 | 40.4 | Closing Costs | 614,402 | 0.3 | |
| Upfront Reserves | 571,942 | 0.3 | ||||
| Total Sources | $182,093,344 | 100.0% | Total Uses | $182,093,344 | 100.0% | |
| (1) | See “Portfolio Summary & Unit Mix” table herein. |
| (2) | The Fourth Most Recent NOI is unavailable due to the Rosewood National Storage 13 Portfolio being an acquisition. |
| (3) | The Appraised Value is based on the “As Portfolio” value, which assumes the Rosewood National Storage 13 Properties are sold together. The sum of the individual appraised values is $178,750,000, which equates to a Cut-off Date LTV and Maturity Date LTV of 60.7%. |
| (4) | For a full description of Escrows and Reserves, please refer to “Escrows and Reserves” herein. |
The Loan. The Rosewood National Storage 13 loan (the “Rosewood National Storage 13 Loan”) is secured by a first mortgage lien on the borrower’s fee interests in a portfolio of 13 self-storage properties comprised of 10,616 storage and non-storage units totaling 1,564,651 square feet across 10 states (collectively, the “Rosewood National Storage 13 Portfolio” or “Rosewood National Storage 13 Properties”). The Rosewood National Storage 13 Loan accrues interest at an interest rate of 3.04900% per annum, had an original term of 120 months, has a remaining term of 119 months as of the Cut-off Date, and is interest only for the entire term.
The Borrower. The borrowing entity for the Rosewood National Storage 13 Loan is RPC Storage 13 Portfolio, LLC, a Delaware limited liability company and special purpose entity, with two independent directors in its organizational structure. Legal counsel to the borrower delivered a non-consolidation opinion in connection with the origination of the Rosewood National Storage 13 Loan.
The Loan Sponsor. The loan sponsor is Rosewood Property Company (“RPC”) and the non-recourse carveout guarantor is RPC Reliance, LLC, which is wholly owned by, and an affiliate of, RPC. RPC is a Dallas-based real estate investment vehicle for The Rosewood Corporation, which is wholly owned by trusts funded by the assets of the Caroline Hunt Trust Estate. RPC has been involved in the development, investment and operation of real estate for over 40 years. In addition to RPC’s self-storage portfolio, the company has
THE INFORMATION IN THIS STRUCTURAL AND COLLATERAL TERM SHEET IS NOT COMPLETE AND MAY BE AMENDED PRIOR TO THE TIME OF SALE. THIS TERM SHEET IS NOT AN OFFER TO SELL THESE SECURITIES AND IT IS NOT A SOLICITATION OF AN OFFER TO BUY THESE SECURITIES IN ANY JURISDICTION WHERE THE OFFER OR SALE IS NOT PERMITTED.
62 of 158
| Structural and Collateral Term Sheet | Benchmark 2022-B32 | |
| Rosewood National Storage 13 | ||
investments in multi-family, office, industrial, retail and land as well as private equity real estate funds. RPC currently owns approximately 72 self-storage properties containing approximately 42,500 units and 5.6 million square feet.
The Property. The Rosewood National Storage 13 Portfolio consists of 13 self-storage assets located in Connecticut, Florida, Georgia, Indiana, Kentucky, Missouri, New Mexico, Ohio, South Carolina, and Texas. The Rosewood National Storage 13 Properties were built between 1971 and 2008 and are situated on approximately 97 acres and include 124 buildings. The Rosewood National Storage 13 Portfolio encompasses 10,616 total units totaling 1,564,651 square feet, which include 9,458 enclosed self-storage units totaling 1,143,064 square feet and 1,158 non-storage units totaling 421,587 square feet. The enclosed self-storage segment includes three unit types: non-climate-controlled units, climate-controlled units, and storage lockers. The non-storage units include uncovered surface parking spaces, covered parking spaces, office spaces, and one warehouse unit. The Rosewood National Storage 13 Portfolio also includes two cell towers. As of September 1, 2021, the self-storage segment was 96.0% occupied, and the non-storage segment was 94.2% occupied, which equates to an overall occupancy of 95.5%. Ten of the Rosewood National Storage 13 Properties are managed by Extra Space Management Inc. (“Extra Space”) and three are managed by CubeSmart Asset Management, LLC (“CubeSmart”).
The following table presents certain information relating to the Rosewood National Storage 13 Properties:
| Portfolio Summary and Unit Mix(1) | |||||||||
| Property Name | City/State | Allocated Cut-off Date Loan Amount | % of ALA | Appraised Value(2) | Year Built/Renovated | Total Units | Storage NRA | Non-Storage NRA | Total NRA |
| Tallahassee | Tallahassee, FL | $18,090,600 | 16.7% | $29,300,000 | 1979-1987/NAP | 1,608 | 183,264 | 8,700 | 191,964 |
| Fort Worth | Fort Worth, TX | $15,905,600 | 14.6% | $26,890,000 | 1976/NAP | 1,412 | 103,565 | 189,787 | 293,352 |
| Kemah | Kemah, TX | $14,932,300 | 13.8% | $26,300,000 | 1977/NAP | 1,378 | 231,900 | 72,470 | 304,370 |
| North Charleston | North Charleston, SC | $8,395,700 | 7.7% | $14,000,000 | 1974/1991 | 738 | 63,459 | 103,980 | 167,439 |
| Groton | Groton, CT | $7,995,700 | 7.4% | $14,000,000 | 2003/NAP | 606 | 61,100 | 800 | 61,900 |
| Albuquerque | Albuquerque, NM | $7,360,100 | 6.8% | $12,920,000 | 1984/NAP | 833 | 71,045 | 0 | 71,045 |
| Augusta | Augusta, GA | $5,889,000 | 5.4% | $9,520,000 | 2000/NAP | 597 | 80,979 | 5,000 | 85,979 |
| Grandview | Grandview, MO | $5,519,400 | 5.1% | $8,620,000 | 1986/NAP | 555 | 67,055 | 4,320 | 71,375 |
| Louisville | Louisville, KY | $5,241,400 | 4.8% | $8,490,000 | 1980/NAP | 842 | 81,968 | 19,500 | 101,468 |
| Houston | Houston, TX | $5,093,700 | 4.7% | $7,500,000 | 2008/NAP | 514 | 66,551 | 4,250 | 70,801 |
| Greenwood | Greenwood, IN | $4,953,800 | 4.6% | $6,930,000 | 1980/NAP | 431 | 45,834 | 0 | 45,834 |
| Miami | Miami, FL | $4,937,600 | 4.5% | $8,010,000 | 1971/NAP | 672 | 32,812 | 0 | 32,812 |
| Kent | Kent, OH | $4,260,100 | 3.9% | $6,270,000 | 1988/NAP | 430 | 53,532 | 12,780 | 66,312 |
| Total / Wtd. Avg. | $108,575,000 | 100.0% | $178,750,000 | 10,616 | 1,143,064 | 421,587 | 1,564,651 | ||
| (1) | Based on the rent roll dated September 1, 2021. |
| (2) | The appraisal concluded to an “As Portfolio” value of $181,940,000. |
| Unit Mix - Self Storage(1) | |||||||
| Unit Type | # of Units | Occupancy | Total SF | Avg Unit SF | Avg Rent per Unit | Avg Rent PSF | Base Rent |
| Non-Climate Controlled Storage | 7,317 | 95.5% | 934,220 | 128 | $130 | $1.00 | $10,740,488 |
| Climate-Controlled Storage | 1,871 | 98.2% | 200,084 | 107 | $136 | $1.26 | $2,976,496 |
| Locker | 270 | 100.0% | 8,760 | 32 | $33 | $1.02 | $107,424 |
| Total / Wtd. Avg. | 9,458 | 96.0% | 1,143,064 | 121 | $128 | $1.05 | $13,824,408 |
| (1) Based on the rent roll dated September 1, 2021. | |||||||
| Unit Mix - Non-Self Storage(1) | |||||||
| Unit Type | # of Units | Occupancy | Total SF | Avg Unit SF | Avg Rent per Unit | Avg Rent PSF | Base Rent |
| Surface Parking | 675 | 91.7% | 218,457 | 324 | $88 | $0.27 | $648,893 |
| Covered Parking | 466 | 97.2% | 192,440 | 413 | $164 | $0.40 | $890,850 |
| Office | 16 | 91.1% | 9,390 | 587 | $440 | $0.72 | $73,909 |
| Warehouse | 1 | 100.0% | 1,300 | 1,300 | $450 | $0.35 | $5,400 |
| Total / Wtd. Avg. | 1,158 | 94.2% | 421,587 | 364 | $125 | $0.34 | $1,619,052 |
| (1) | Based on the rent roll dated September 1, 2021. |
THE INFORMATION IN THIS STRUCTURAL AND COLLATERAL TERM SHEET IS NOT COMPLETE AND MAY BE AMENDED PRIOR TO THE TIME OF SALE. THIS TERM SHEET IS NOT AN OFFER TO SELL THESE SECURITIES AND IT IS NOT A SOLICITATION OF AN OFFER TO BUY THESE SECURITIES IN ANY JURISDICTION WHERE THE OFFER OR SALE IS NOT PERMITTED.
63 of 158
| Structural and Collateral Term Sheet | Benchmark 2022-B32 | |
| Rosewood National Storage 13 | ||
COVID-19 Update. As of December 16, 2021, the Rosewood National Storage 13 Properties are open and operating. There has been no material rent relief requested. The Rosewood National Storage 13 Loan is not subject to any modification or forbearance requests. The first payment date under the Rosewood National Storage 13 Loan documents is in February 2022. See “Risk Factors—Special Risks—Coronavirus Pandemic Has Adversely Affected the Global Economy and Will Likely Adversely Affect the Performance of the Mortgage Loans” in the Preliminary Prospectus.
The Market. The Rosewood National Storage 13 Portfolio is comprised of 13 geographically diverse properties across 10 different states. Texas (33.1%) and Florida (21.2%) represent the largest concentration of the Rosewood National Storage 13 Portfolio by allocated loan amount. No other state accounts for more than 7.7% of the Rosewood National Storage 13 Loan by allocated loan amount, or more than 10.7% of the total square feet.
The following table presents market demographic, vacancy and rent information relating to the Rosewood National Storage 13 Portfolio:
| Demographic Summary(1) | |||||||||||
| Property Name | City/State | 1-mile Population | 3-mile Population | 5-mile Population | 1-mile Avg. Household Income | 3-mile Avg. Household Income | 5-mile Avg. Household Income | Market Vacancy | Market Rent per SF | ||
| Tallahassee | Tallahassee, FL | 8,189 | 56,590 | 137,816 | $72,014 | $85,236 | $80,037 | 10.0% | $1.07 | ||
| Fort Worth | Fort Worth, TX | 7,657 | 88,416 | 190,805 | $68,795 | $71,875 | $85,553 | 5.0% | $1.11 | ||
| Kemah | Kemah, TX | 7,936 | 60,778 | 128,519 | $140,144 | $130,782 | $117,006 | 8.0% | $0.86 | ||
| North Charleston | North Charleston, SC | 5,200 | 62,527 | 145,849 | $62,592 | $66,190 | $72,522 | 6.0% | $1.21 | ||
| Groton(2) | Groton, CT | 6,520 | 83,003 | 148,167 | $81,981 | $85,399 | $96,832 | 6.0% | $1.56 | ||
| Albuquerque | Albuquerque, NM | 14,941 | 114,539 | 216,547 | $63,362 | $61,754 | $69,948 | 8.0% | $1.30 | ||
| Augusta | Augusta, GA | 5,802 | 38,445 | 83,337 | $62,344 | $57,328 | $56,535 | 6.0% | $0.94 | ||
| Grandview | Grandview, MO | 6,500 | 33,405 | 94,803 | $61,077 | $64,865 | $75,922 | 5.0% | $0.96 | ||
| Louisville | Louisville, KY | 8,531 | 54,604 | 197,795 | $47,942 | $55,702 | $67,423 | 10.% | $0.87 | ||
| Houston | Houston, TX | 18,628 | 130,842 | 258,498 | $70,734 | $77,550 | $80,186 | 5.0% | $1.01 | ||
| Greenwood | Greenwood, IN | 11,839 | 84,299 | 193,797 | $55,896 | $73,295 | $82,963 | 6.0% | $1.05 | ||
| Miami | Miami, FL | 18,425 | 201,772 | 524,196 | $59,133 | $59,615 | $64,920 | 5.0% | $1.88 | ||
| Kent | Kent, OH | 3,384 | 45,543 | 110,716 | $68,248 | $76,222 | $83,632 | 8.0% | $1.04 | ||
| (1) | Source: Appraisal. |
| (2) | The Groton property’s population and household income data are based on a 1, 5 and 10-mile radius. |
| Operating History and Underwritten Net Cash Flow | ||||||
| 2019 | 2020 | TTM 10/31/2021 | Underwritten(1) | Per Square Foot | %(2) | |
| Base Rent | $12,900,444 | $12,687,694 | $14,181,133 | $15,610,230 | $9.98 | 106.0% |
| Bad Debt/Collection Loss | 311,773 | 356,046 | 332,330 | 365,820 | $0.23 | 2.5% |
| Concessions | 451,453 | 397,082 | 473,978 | 521,743 | $0.33 | 3.5% |
| Net Rental Income | $12,137,219 | $11,934,566 | $13,374,825 | $14,722,667 | $9.41 | 100.0% |
| Other Income(3) | 869,490 | 743,918 | 816,971 | 994,701 | $0.64 | 6.8% |
| Commercial Income | 106,119 | 93,234 | 84,365 | 79,214 | $0.05 | 0.5% |
| Effective Gross Income | $13,112,828 | $12,771,718 | $14,276,162 | $15,796,582 | $10.10 | 107.3% |
| Total Expenses | 4,296,836 | 4,231,308 | 4,081,023 | 5,122,665 | $3.27 | 32.4% |
| Net Operating Income | $8,815,991 | $8,540,410 | $10,195,139 | $10,673,917 | $6.82 | 67.6% |
| Total TI/LC, CapEx | 0 | 0 | 0 | 171,430 | $0.11 | 1.1% |
| Net Cash Flow | $8,815,991 | $8,540,410 | $10,195,139 | $10,502,488 | $6.71 | 66.5% |
| (1) | Underwritten base rent is based on the trailing three-month annualized in-place base rent ending October 31, 2021, which equates to $15,610,230. |
| (2) | % column represents percent of Net Rental Income for all revenue lines and represents percent of Effective Gross Income for the remainder of the fields. |
| (3) | Other Income includes tenant insurance revenue associated with the three CubeSmart managed properties. The borrower agreed to pay CubeSmart a higher management fee (5.0%) in exchange for receiving 50% of tenant insurance revenues. |
THE INFORMATION IN THIS STRUCTURAL AND COLLATERAL TERM SHEET IS NOT COMPLETE AND MAY BE AMENDED PRIOR TO THE TIME OF SALE. THIS TERM SHEET IS NOT AN OFFER TO SELL THESE SECURITIES AND IT IS NOT A SOLICITATION OF AN OFFER TO BUY THESE SECURITIES IN ANY JURISDICTION WHERE THE OFFER OR SALE IS NOT PERMITTED.
64 of 158
| Structural and Collateral Term Sheet | Benchmark 2022-B32 | |
| Rosewood National Storage 13 | ||
Escrows and Reserves. At loan origination, the borrower deposited with the lender (i) a deferred maintenance reserve in the amount of $405,121 and (ii) a real estate tax reserve in the amount of approximately $166,821.
Tax Reserve – On each monthly payment date, the borrower is required to deposit into a real estate tax reserve, 1/12th of the amount that the lender estimates will be necessary to pay real estate taxes over the then succeeding 12-month period (initially estimated at approximately $110,764).
Insurance Reserve – On each monthly payment date, the borrower is required to deposit into an insurance reserve, 1/12th of the amount that the lender estimates will be necessary to cover insurance premiums over the then succeeding 12-month period. The borrower’s obligation to make monthly deposits into the insurance reserve is waived so long as the borrower has provided satisfactory evidence that all insurance premiums have been paid with respect to an acceptable blanket insurance policy. As of the origination date, an acceptable blanket policy was in place.
Expansion Deposit Reserve – The borrower is required to deposit any Expansion Deposit Amounts (as defined below) into an Expansion Deposit reserve.
Lockbox / Cash Management. The Rosewood National Storage 13 Loan is structured with a springing lockbox and springing cash management. Upon the first occurrence of a Lockbox Trigger Event (as defined below), the borrower is required to establish a clearing account to be maintained by the borrower at a bank approved by the lender. Upon the occurrence of a Lockbox Trigger Event, and at all times thereafter, the borrower is required to cause (x) all gross revenues relating to leases (other than leases that demise space solely for self-storage purposes) to be deposited directly by the applicable tenant into the clearing account and (y) all other gross revenues to be deposited in the clearing account within one business day of receipt by the borrower or the manager. From and after a Lockbox Trigger Event, (i) during a Trigger Period (as defined below), a deposit account controlled by the lender is required to be established and funds deposited into the clearing account are required to be swept on a daily basis into such deposit account and applied to pay and applied to pay debt service on the Rosewood National Storage 13 Loan, required reserves and operating expenses (with all excess cash transferred to a lender-controlled account to be held as additional collateral for the Rosewood National Storage 13 Loan during such Trigger Period) and (ii) if a Trigger Period is not continuing funds deposited into the clearing account will be swept by the clearing bank on a daily basis into the borrower’s operating account at the clearing bank.
A “Lockbox Trigger Event” means (i) the occurrence of an event of default or (ii) the debt service coverage ratio is less than 1.15x as of any calendar quarter.
A “Trigger Period” means a period commencing (i) upon the occurrence of an event of default, (ii) upon the commencement of a Low Debt Service Period (as defined below) and (iii) if the manager or non-recourse carveout guarantor becomes insolvent or a debtor in any bankruptcy or insolvency proceeding and ending, if, (A) with respect to a Trigger Period continuing pursuant to clause (i), the event of default commencing the Trigger Period has been cured and such cure has been accepted by the lender, (B) with respect to a Trigger Period continuing due to clause (ii), the Low Debt Service Period has been cured as provided in the definition of such term, or (C) with respect to a Trigger Period continuing due to clause (iii), the manager is replaced with an unaffiliated qualified manager approved by the lender under a replacement management agreement approved by the lender.
A “Low Debt Service Period” means the debt service coverage ratio is less than 1.10x as of the last day of any calendar quarter and is cured upon the achievement of a 1.15x debt service coverage ratio as of any calendar quarter.
Property Management. The Rosewood National Storage 13 Portfolio is managed by CubeSmart as to the properties located in (i) Augusta, Georgia, (ii) Tallahassee, Florida, and (iii) Groton, Connecticut and Extra Space as to the remaining Rosewood National Storage 13 Properties.
Current Mezzanine or Subordinate Indebtedness. None.
Future Mezzanine or Secured Subordinate Indebtedness Permitted. None.
Partial Release. On any business day after the defeasance lockout expiration date, the borrower has the right to obtain the release of one or more of the individual Rosewood National Storage 13 Properties (each an “Individual Property”) in connection with a sale to a bona fide third party purchaser, upon defeasance of an amount equal to 120% of the allocated loan amount of the Individual Property or Individual Properties to be released, and satisfaction of the following conditions, among others, (i) after giving effect to the release, the debt service coverage ratio of the remaining Rosewood National Storage 13 Properties is not less than the greater of 1.78x and the debt service coverage ratio immediately prior to the release, (ii) after giving effect to the release, the loan-to-value ratio of the remaining Rosewood National Storage 13 Properties is not greater than the lesser of 59.7% and the loan-to-value ratio immediately prior to the release, and (iii) satisfaction of REMIC related requirements.
THE INFORMATION IN THIS STRUCTURAL AND COLLATERAL TERM SHEET IS NOT COMPLETE AND MAY BE AMENDED PRIOR TO THE TIME OF SALE. THIS TERM SHEET IS NOT AN OFFER TO SELL THESE SECURITIES AND IT IS NOT A SOLICITATION OF AN OFFER TO BUY THESE SECURITIES IN ANY JURISDICTION WHERE THE OFFER OR SALE IS NOT PERMITTED.
65 of 158
| Structural and Collateral Term Sheet | Benchmark 2022-B32 | |
| Rosewood National Storage 13 | ||
Future Expansion. The borrower may expand any building, or build a new building on any Individual Property, subject to the lender’s approval, in its sole, but good faith discretion, and satisfaction of the following conditions, among others, (i) no event of default is continuing at the time the expansion is requested, (ii) delivery of the applicable plans and specifications, budget, and all related construction contracts, all acceptable to the lender, (iii) delivery of evidence acceptable to the lender that all required licenses, consents, approvals and permits have been obtained for such expansion and such expansion does not violate any legal requirements or any agreement affecting the applicable Individual Property, (iv) no indebtedness is incurred in connection with the expansion other than permitted indebtedness, (v) compliance with REMIC related requirements, and (vi) delivery of security (in the form of cash, a letter of credit, United States government obligations or other securities acceptable to the lender) for payment of the cost of such expansion in an amount equal to 110% of the total cost of such expansion (the “Expansion Deposit Amounts”); provided, however, such security is not required if the cost of the applicable expansion (together with the cost of any other alterations currently taking place at such Individual Property) is less than 25% of the allocated loan amount of such Individual Property, and the aggregate cost of all expansions and other alterations then occurring across all Rosewood National Storage 13 Properties is less than 5% of the total amount of the Rosewood National Storage 13 Loan. If such security as set forth in clause (vi) above is required, the same is required to be held by the lender in a reserve and disbursed subject to the same conditions as a customary ongoing capital expenditure reserve.
THE INFORMATION IN THIS STRUCTURAL AND COLLATERAL TERM SHEET IS NOT COMPLETE AND MAY BE AMENDED PRIOR TO THE TIME OF SALE. THIS TERM SHEET IS NOT AN OFFER TO SELL THESE SECURITIES AND IT IS NOT A SOLICITATION OF AN OFFER TO BUY THESE SECURITIES IN ANY JURISDICTION WHERE THE OFFER OR SALE IS NOT PERMITTED.
66 of 158
(THIS PAGE INTENTIONALLY LEFT BLANK)
THE INFORMATION IN THIS STRUCTURAL AND COLLATERAL TERM SHEET IS NOT COMPLETE AND MAY BE AMENDED PRIOR TO THE TIME OF SALE. THIS TERM SHEET IS NOT AN OFFER TO SELL THESE SECURITIES AND IT IS NOT A SOLICITATION OF AN OFFER TO BUY THESE SECURITIES IN ANY JURISDICTION WHERE THE OFFER OR SALE IS NOT PERMITTED.
67 of 158
| Structural and Collateral Term Sheet | Benchmark 2022-B32 | |
| CX – 350 & 450 Water Street | ||

THE INFORMATION IN THIS STRUCTURAL AND COLLATERAL TERM SHEET IS NOT COMPLETE AND MAY BE AMENDED PRIOR TO THE TIME OF SALE. THIS TERM SHEET IS NOT AN OFFER TO SELL THESE SECURITIES AND IT IS NOT A SOLICITATION OF AN OFFER TO BUY THESE SECURITIES IN ANY JURISDICTION WHERE THE OFFER OR SALE IS NOT PERMITTED.
68 of 158
| Structural and Collateral Term Sheet | Benchmark 2022-B32 | |
| CX – 350 & 450 Water Street | ||

THE INFORMATION IN THIS STRUCTURAL AND COLLATERAL TERM SHEET IS NOT COMPLETE AND MAY BE AMENDED PRIOR TO THE TIME OF SALE. THIS TERM SHEET IS NOT AN OFFER TO SELL THESE SECURITIES AND IT IS NOT A SOLICITATION OF AN OFFER TO BUY THESE SECURITIES IN ANY JURISDICTION WHERE THE OFFER OR SALE IS NOT PERMITTED.
69 of 158
| Structural and Collateral Term Sheet | Benchmark 2022-B32 | |
| CX – 350 & 450 Water Street | ||
| Mortgage Loan Information | Property Information | |||
| Mortgage Loan Seller(1): | GACC | Single Asset / Portfolio: | Single Asset | |
| Original Principal Balance(2): | $101,000,000 | Title: | Fee | |
| Cut-off Date Principal Balance(2): | $101,000,000 | Property Type - Subtype: | Mixed Use – Office/Lab | |
| % of Pool by IPB: | 5.7% | Net Rentable Area (SF): | 915,233 | |
| Loan Purpose: | Refinance | Location: | Cambridge, MA | |
| Borrowers: | DW PropCo G, LLC and DW | Year Built / Renovated: | 2021 / NAP | |
| PropCo H, LLC | Occupancy: | 100.0% | ||
| Guarantor: | None | Occupancy Date: | 10/14/2021 | |
| Interest Rate(3): | 2.79200% | Number of Tenants: | 1 | |
| Note Date: | 10/14/2021 | Fourth Most Recent NOI: | NAV | |
| Anticipated Repayment Date(3): | 11/6/2031 | Third Most Recent NOI: | NAV | |
| Maturity Date(3): | 11/6/2036 | Second Most Recent NOI: | NAV | |
| Interest-only Period: | 120 months | Most Recent NOI: | NAV | |
| Original Term(3): | 120 months | UW Economic Occupancy: | 98.5% | |
| Original Amortization: | None | UW Revenues: | $92,929,288 | |
| Amortization Type: | Interest Only - ARD | UW Expenses: | $12,225,756 | |
| Call Protection: | L(24),YM1(3),DorYM1(86),O(7) | UW NOI: | $80,703,532 | |
| Lockbox / Cash Management: | Hard / Springing | UW NCF: | $80,566,247 | |
| Additional Debt(2): | Yes | Appraised Value / Per SF(4): | $1,954,000,000 / $2,135 | |
| Additional Debt Balance(2): | $713,000,000 / $411,000,000 | Appraisal Date(4): | 4/1/2023 | |
| Additional Debt Type(2): | Pari Passu / Subordinate | |||
| Escrows and Reserves(5) | Financial Information(2) | |||||||
| Initial | Monthly | Initial Cap | Senior Notes | Whole Loan | ||||
| Taxes: | $0 | Springing | N/A | Cut-off Date Loan / SF: | $889 | $1,338 | ||
| Insurance: | $0 | Springing | N/A | Maturity Date Loan / SF(3): | $889 | $1,338 | ||
| Replacement Reserves: | $0 | $0 | N/A | Cut-off Date LTV: | 41.7% | 62.7% | ||
| TI/LC: | $52,062,079 | Springing | N/A | Maturity Date LTV(3): | 41.7% | 62.7% | ||
| Other(6): | $97,383,122 | $0 | N/A | UW NCF DSCR: | 3.50x | 2.32x | ||
| UW NOI Debt Yield: | 9.9% | 6.6% | ||||||
| Sources and Uses | ||||||
| Sources | Proceeds | % of Total | Uses | Proceeds | % of Total | |
| Senior Notes | $814,000,000 | 66.4% | Loan Payoff | $617,846,136 | 50.4% | |
| Junior Notes | 411,000,000 | 33.6 | Return of Equity | 451,939,763 | 36.9 | |
| Upfront Reserves | 149,445,201 | 12.2 | ||||
| Closing Costs | 5,768,900 | 0.5 | ||||
| Total Sources | $1,225,000,000 | 100.0% | Total Uses | $1,225,000,000 | 100.0% | |
| (1) | The CX - 350 & 450 Water Street Whole Loan (as defined below) was co-originated by DBR Investments Co. Limited, JPMorgan Chase Bank, National Association, Bank of America, N.A. (“BANA”) and 3650 Cal Bridge Lending, LLC. GACC will be contributing Notes A-1-5, A-1-6 and A-1-8 to the Benchmark 2022-B32 transaction. |
| (2) | The CX - 350 & 450 Water Street Loan (as defined below) is part of a whole loan evidenced by 20 senior pari passu notes, with an aggregate outstanding principal balance as of the Cut-off Date of $814.0 million (the “CX - 350 & 450 Water Street Senior Notes”) and four pari passu subordinate notes with an aggregate outstanding principal balance as of the Cut-off Date of $411.0 million (the “CX – 350 & 450 Water Street Junior Notes”). The Financial Information in the chart above reflects the Cut-off Date Balances of the CX - 350 & 450 Water Street Senior Notes and the CX - 350 & 450 Water Street Whole Loan, respectively. |
| (3) | The CX - 350 & 450 Water Street Whole Loan is structured with an Anticipated Repayment Date (“ARD”) of November 6, 2031 and a final maturity date of November 6, 2036. The initial interest rate for the CX – 350 & 450 Water Street Whole Loan is 2.79200% per annum. After the ARD, the interest rate will increase by 2.00000% over the greater of (x) 2.79200%, and (y) (1) the swap rate in effect on the ARD plus (2) 1.26000%. The metrics presented above are calculated based on the ARD. |
| (4) | Based on the “Prospective Market Value Upon Completion & Stabilization” appraised value of $1,954,000,000 as of April 1, 2023, which assumes that the outstanding capital expenditure of approximately $56,000,000 for 350 Water Street (as defined below) and $80,000,000 for 450 Water Street (as defined below) are fully funded and reserved by the lender, and that these reserved funds would pass with title to any purchaser of the CX – 350 & 450 Water Street Property (as defined below). The appraisal concluded to an “as-is” appraised value of $1,778,000,000 as of September 8, 2021. The “as-is” appraised value results in a Cut-off Date LTV Ratio and Maturity Date LTV Ratio of 45.8% for the CX - 350 & 450 Water Street Senior Notes, and a Cut-off Date LTV Ratio and Maturity Date LTV Ratio of 68.9% for the CX - 350 & 450 Water Street Whole Loan. The appraisal concluded to an aggregate “as dark” appraised value of $1,901,000,000. The “as dark” appraised value results in a Cut-off Date LTV Ratio and Maturity Date LTV Ratio of 42.8% for the CX - 350 & 450 Water Street Senior Notes, and a Cut-off Date LTV Ratio and Maturity Date LTV Ratio of 64.4% for the CX - 350 & 450 Water Street Whole Loan. |
| (5) | For a full description of Escrows and Reserves, please refer to “Escrows and Reserves” below. |
| (6) | Other upfront reserve includes a Base Building Work Reserve of approximately $86,650,891 and an Aventis Rent Reserve of approximately $10,732,231. |
THE INFORMATION IN THIS STRUCTURAL AND COLLATERAL TERM SHEET IS NOT COMPLETE AND MAY BE AMENDED PRIOR TO THE TIME OF SALE. THIS TERM SHEET IS NOT AN OFFER TO SELL THESE SECURITIES AND IT IS NOT A SOLICITATION OF AN OFFER TO BUY THESE SECURITIES IN ANY JURISDICTION WHERE THE OFFER OR SALE IS NOT PERMITTED.
70 of 158
| Structural and Collateral Term Sheet | Benchmark 2022-B32 | |
| CX – 350 & 450 Water Street | ||
The Loan. The CX - 350 & 450 Water Street mortgage loan (the “CX - 350 & 450 Water Street Loan”) is part of a whole loan with an aggregate outstanding principal balance as of the Cut-off Date of $1.225 billion (the “CX - 350 & 450 Water Street Whole Loan”) consisting of 20 senior pari passu notes with an aggregate outstanding principal balance as of the Cut-off Date of $814.0 million and four junior pari passu notes with an aggregate outstanding principal balance as of the Cut-off Date of $411.0 million. The CX - 350 & 450 Water Street Whole Loan is secured by the borrowers’ fee interest in two life sciences laboratory and office buildings totaling 915,233 square feet located in Cambridge, Massachusetts (the “CX - 350 & 450 Water Street Property”). The non-controlling Notes A-1-5, A-1-6 and A-1-8, with an aggregate outstanding principal balance as of the Cut-off Date of $101.0 million, will be included in the Benchmark 2022-B32 trust. The remaining notes have been, or are expected to be, contributed to one or more future securitization trusts or may otherwise be transferred at any time. The CX – 350 & 450 Water Street Whole Loan is serviced under the CAMB 2021-CX2 trust and servicing agreement.
The CX - 350 & 450 Water Street Whole Loan accrues interest at the rate of 2.79200% per annum through the ARD. After the ARD, through and including November 6, 2036, the following structure will apply: the interest rate will increase (such new rate, the “Adjusted Interest Rate”) by 2.00000% over the greater of (x) 2.79200%, and (y)(1) the swap rate in effect on the ARD plus (2) 1.26000%; however, interest accrued at the excess of the Adjusted Interest Rate over the initial interest rate will be deferred as described below under “Lockbox / Cash Management.” The CX - 350 & 450 Water Street Whole Loan has an initial term to the ARD of 120 months and has a remaining term to the ARD of 117 months as of the Cut-off Date. The CX - 350 & 450 Water Street Whole Loan requires payments of interest only until the ARD in November 2031 or, if not repaid on the ARD, the final maturity date in November 2036.
| Whole Loan Summary | |||||
| Note | Original Balance | Cut-off Date Balance | Note Holder | Controlling Piece | |
| A-1-1, A-2-1, A-3-1, A-4-1 | $285,000,000 | $285,000,000 | CAMB 2021-CX2 | Yes | |
| A-1-3, A-3-2 | $94,000,000 | $94,000,000 | Benchmark 2021-B30 | No | |
| A-1-7, A-4-2, A-4-3 | $77,900,000 | $77,900,000 | 3650R 2021-PF1 | No | |
| A-1-2, A-1-4, A-1-9, A-3-3 | $148,140,816 | $148,140,816 | Benchmark 2021-B31 | No | |
| A-1-5, A-1-6, A-1-8 | $101,000,000 | $101,000,000 | Benchmark 2022-B32 | No | |
| A-2-3, A-2-4 | $55,000,000 | $55,000,000 | BANK 2021-BNK38 | No | |
| A-2-2, A-2-5 | $52,959,184 | $52,959,184 | BANK 2022-BNK39(1) | No | |
| Total Senior Notes | $814,000,000 | $814,000,000 | |||
| B-1, B-2, B-3, B-4 | $411,000,000 | $411,000,000 | CAMB 2021-CX2 | No | |
| Whole Loan | $1,225,000,000 | $1,225,000,000 | |||
| (1) | Transaction is not yet closed. |
The Borrowers. The borrowers are DW PropCo G, LLC and DW PropCo H, LLC, both Delaware limited liability companies and single purpose entities with two independent directors. Legal counsel to the borrowers delivered a non-consolidation opinion in connection with the origination of the CX - 350 & 450 Water Street Whole Loan.
The Loan Sponsors. There is no non-recourse carveout guarantor or environmental indemnitor for the CX – 350 & 540 Water Street Whole Loan. The loan sponsors are a joint venture between DivcoWest (“Divco”), California State Teachers’ Retirement System (“CalSTRS”), and Teacher Retirement System of Texas (“TRS”).
Founded in 1993, Divco is a multidisciplinary investment firm headquartered in San Francisco, California with over 160 employees across six investment offices. Divco is an experienced developer, owner and operator of real estate throughout the United States, with significant expertise in Boston, having invested in and managed over 22 commercial properties in the area, including offices in the Seaport, Financial District, and East Cambridge submarkets. Most notably, Divco owned and operated One Kendall Square, a life sciences office campus in the Kendall Square submarket. As of June 30, 2021, Divco had over $13.7 billion in assets under management. Since inception, Divco has acquired approximately 55.0 million square feet.
CalSTRS is reported to be the nation’s second largest public pension fund with assets totaling approximately $312.2 billion as of September 30, 2021. Their investment portfolio is broadly diversified into nine asset categories, approximately including 12.8% (approximately $39.8 billion) which is allocated towards real estate investments in institutional Class A commercial assets across the United States. Divco and CalSTRS have an 18-year history of investing together with CalSTRS investing over $1.5 billion into various Divco sponsored investment vehicles.
Established in 1937, TRS provides retirement and related benefits for those employed by the public schools, colleges, and universities supported by the State of Texas. As of August, 31 2020, the agency is serving nearly 1.7 million participants and had assets under management of nearly $187 billion. TRS is the largest public retirement system in Texas in both membership and assets.
The Property. The CX – 350 & 450 Water Street Property consists of two Class A LEED Gold (targeted), life sciences laboratory and office buildings totaling 915,233 square feet located in Cambridge, Massachusetts. The CX – 350 & 450 Water Street Property includes (i) the 350 Water Street building (Parcel G) (“350 Water Street”), which is a laboratory building consisting of 511,157 square feet and (ii) the 450 Water Street building (Parcel H) (“450 Water Street”), which is a contemporary office building consisting of 404,076 square feet. Designed
THE INFORMATION IN THIS STRUCTURAL AND COLLATERAL TERM SHEET IS NOT COMPLETE AND MAY BE AMENDED PRIOR TO THE TIME OF SALE. THIS TERM SHEET IS NOT AN OFFER TO SELL THESE SECURITIES AND IT IS NOT A SOLICITATION OF AN OFFER TO BUY THESE SECURITIES IN ANY JURISDICTION WHERE THE OFFER OR SALE IS NOT PERMITTED.
71 of 158
| Structural and Collateral Term Sheet | Benchmark 2022-B32 | |
| CX – 350 & 450 Water Street | ||
by Perkins +Will (350 Water Street) and NBBJ (450 Water Street), the CX – 350 & 450 Water Street Property has views of both the Cambridge and Boston skylines. The CX – 350 & 450 Water Street Property has an adjacent open space with playing field, a plaza to host food trucks and nearby access to two MBTA stops (Green and Orange line). The Lechmere MBTA green line is a 5-minute walk away. The CX – 350 & 450 Water Street Property is 100.0% leased to Aventis Inc., which is a wholly-owned subsidiary of Sanofi S.A. (“Sanofi”).
350 Water Street is a 12-story building featuring laboratory space, ground floor retail, a third-floor terrace, three below-grade parking levels with 377 parking spaces (0.74 per 1,000 square feet), bike storage with showers, an adjacent open space with playing field and fitness center. 350 Water Street has 15’ - 19’ ceiling heights and eight passenger elevators. 350 Water Street is anticipated to be Wired Score Platinum and LEED Gold certified upon completion.
450 Water Street is a 9-story building featuring office space, ground floor retail, a two-story mezzanine, three above-grade and two below-grade parking levels with 440 parking spaces (1.09 per 1,000 square feet) and bike storage. 450 Water Street has 14’ - 16’ ceiling heights and five passenger elevators. 450 Water Street is anticipated to be Wired Score Platinum, WELL Gold and LEED Gold certified upon completion.
The CX – 350 & 450 Water Street Property is currently under construction and expected to be substantially completed for 350 Water Street in the second quarter of 2022. 450 Water Street reached substantial completion on December 16, 2021. At loan origination, the borrowers reserved the following with the lender: (i) $86,650,891 for base building work related to hard costs, hard cost contingency, soft costs and soft cost contingency for the CX – 350 & 450 Water Street Property, (ii) approximately $15,483,880 on account of tenant improvement allowance related to 350 Water Street and $28,254,233 of tenant improvement allowances related to 450 Water Street and (iii) approximately $8,323,967 of leasing commissions related to 450 Water Street. Below is a chart which details the loan sponsors’ development budgets, which do not include land allocations or financing costs. We cannot assure you either 350 Water Street or 450 Water Street will be completed as expected or at all.
| Development Budget Summary | ||||
| 350 Water Street (Parcel G) | 450 Water Street (Parcel H) | |||
| Budget | Remaining Cost | Budget | Remaining Cost | |
| Hard Costs | $221,627,140 | $35,507,711 | $181,926,397 | $28,882,890 |
| Hard Cost Contingency | 915,139 | 1,065,231 | 866,487 | 866,487 |
| Soft Costs | 43,854,255 | 8,357,324 | 42,547,726 | 11,379,153 |
| Soft Cost Contingency | 210,241 | 250,720 | 341,375 | 341,375 |
| Tenant Improvement Allowance | 139,789,250 | 15,483,880 | 64,916,764 | 28,254,233 |
| Leasing Commissions | 26,886,858 | 0 | 21,254,398 | 8,323,967 |
| Total | $433,282,883 | $60,664,866 | $311,853,147 | $78,048,105 |
As of October 14, 2021, the CX – 350 & 450 Water Street Property is 100.0% leased to Aventis Inc., a wholly-owned subsidiary of Sanofi S.A. (rated A+/A1/AA by Fitch/Moody’s/S&P), which is the guarantor under the Aventis Inc. leases. Founded in 1973, Sanofi is a multinational pharmaceutical company headquartered in Paris, France. Sanofi engages in the research and development, manufacturing, and marketing of pharmaceutical drugs principally in the prescription market. Sanofi (NASDAQ:SNY) is publicly traded on the NASDAQ stock exchange and had a market capitalization of approximately $123.1 billion as of October 16, 2021.
The CX – 350 & 450 Water Street Property is expected to serve as Sanofi’s North American research headquarters, where it is expected to consolidate approximately 3,000 employees from a number of local offices in the Boston area, as well as the company’s Center of Excellence dedicated to mRNA vaccine research. Additionally, Sanofi is expected to consolidate approximately 400 employees from various sites at the Cambridge Crossing development and in Lyon, France to form a Center of Excellence dedicated to mRNA vaccine research. Sanofi plans to invest more than $476.0 million per year to develop vaccines against infectious diseases.
The CX – 350 & 450 Water Street Property is currently undergoing a buildout with an expected completion date of the second quarter of 2022 for 350 Water Street. 450 Water Street reached substantial completion on December 16, 2021. We cannot assure you the buildouts will be completed as expected or at all. Aventis Inc.’s tenant buildout contract and base building changes total approximately $304.3 million ($595 per square foot) for 350 Water Street and approximately $90.9 million ($225 per square foot) for 450 Water Street. Aventis Inc. is entitled to receive an approximately $139.8 million ($273 per square foot) tenant improvement allowance for 350 Water Street and an approximately $73.7 million ($182 per square foot) tenant improvement allowance for 450 Water Street. In total, the approximately $395.2 million ($432 per square foot) tenant buildout contract and base building changes do not include any tenant investment for soft costs. Additionally, the approximately $395.2 million ($432 per square foot) can be paid from the tenant improvement allowance to the extent available. In addition to the tenant buildout contract and base building changes, Sanofi is expected to invest approximately $181.7 million ($198 per square foot) into the CX – 350 & 450 Water Street Property, not including furniture, fixtures and equipment.
Aventis Inc. executed two, 15-year leases at the CX – 350 & 450 Water Street Property in late 2018. The rent commencement date of the lease at 350 Water Street was July 1, 2021 and the rent commencement date of the lease at 450 Water Street was November 10, 2021. The sole tenant, Aventis Inc. is not yet in occupancy of either 350 Water Street or 450 Water Street, pending the buildout of its
THE INFORMATION IN THIS STRUCTURAL AND COLLATERAL TERM SHEET IS NOT COMPLETE AND MAY BE AMENDED PRIOR TO THE TIME OF SALE. THIS TERM SHEET IS NOT AN OFFER TO SELL THESE SECURITIES AND IT IS NOT A SOLICITATION OF AN OFFER TO BUY THESE SECURITIES IN ANY JURISDICTION WHERE THE OFFER OR SALE IS NOT PERMITTED.
72 of 158
| Structural and Collateral Term Sheet | Benchmark 2022-B32 | |
| CX – 350 & 450 Water Street | ||
space. We cannot assure you that the buildout of the CX – 350 & 450 Water Street Property will be completed as expected or at all, or that Aventis Inc. will take occupancy as expected or at all. At loan origination, the borrowers reserved approximately $10,732,231 into a gap rent reserve for the Aventis Inc. lease related to 450 Water Street. Aventis Inc. has the right to terminate each of its respective leases effective as of the end of the 14th lease year subject to a termination fee equal to 12 months base rent.
The blended starting base rent for the Aventis Inc. triple-net leases is $71.53 per square foot for 350 Water Street and 450 Water Street. Base rent for the laboratory building, 350 Water Street, is $75.90 per square foot and base rent for the office building, 450 Water Street, is $66.00 per square foot, with both leases including approximately 2.5% annual rent steps. Aventis, Inc. did not receive any free rent as part of its lease. The in-place rent at 350 Water Street is approximately 31.0% below the appraisal’s concluded triple-net market rent of $110.00 per square foot for the laboratory space and in-place rent at 450 Water Street is approximately 22.4% below the appraisal’s concluded triple-net market rent of $85.00 per square foot for the office space. Sanofi’s guarantees of the leases at 350 Water Street and 450 Water Street have guaranty caps of $207.5 million and $142.5 million, respectively.
COVID-19 Update. As of January 6, 2022, the CX – 350 & 450 Water Street Whole Loan is not subject to any forbearance, modification or debt service relief request. There have been no requests for rent relief. The CX – 305 & 450 Water Street Whole Loan is current as of the January 2022 payment date. See “Risk Factors—Special Risks—Coronavirus Pandemic Has Adversely Affected the Global Economy and Will Likely Adversely Affect the Performance of the Mortgage Loans” in the Preliminary Prospectus.
The Market. The CX – 350 & 450 Water Street Property is located in the Cambridge market within the Greater Boston area. The city of Cambridge is located in the Boston core-based statistical area directly north of the city of Boston and separated from Boston’s central business district by the Charles River. Cambridge is bordered by Somerville to the north and Watertown to the west. The city is acclaimed for its mix of venture capital, National Institutes of Health funding and state investments. In recent years, Cambridge has become a life sciences and biotechnology hub not only for the northeast, but for the entire United States. Cambridge is home to over 5,000 private business establishments with major companies including Watson Health, Amgen, Facebook and Apple, among others.
The Cambridge market is best known for its innovation and high concentration of research and development operations. Cambridge has one of the highest densities of educated people in the world with 42 colleges, universities and community colleges and is home to Harvard University and the Massachusetts Institute of Technology. There are over 11,000 undergraduate students and over 11,000 graduate students living in Cambridge.
The CX – 350 & 450 Water Street Property is part of a larger approximately 4.5 million square feet master-planned mixed-use-transit-oriented development known as Cambridge Crossing, which is an innovation community in East Cambridge, proximate to Kendall Square. Cambridge Crossing is spread across 43 acres and is expected to total over 17 buildings consisting of over 2.1 million square feet of science and technology space, approximately 2.4 million square feet of residential space, 100,000 square feet of retail space and 11 acres of open space. The development of Cambridge Crossing has approximately 2.5 million square feet completed or under construction and recent leases to Philips, Sanofi, and Bristol Myers Squibb.
Cambridge Crossing benefits from its various forms of transit, including one MBTA (Green Line) station soon to be on site, and one MBTA (Orange Line) station a short walk away, four Hubway stations, designated bike lanes, an EZ ride and private Cambridge Crossing shuttle, walking paths and acres of green spaces. In addition, Cambridge Crossing is approximately 3.5 miles from the Boston Logan International Airport.
The following table presents the submarket statistics for the laboratory and office space in the Cambridge market:
| Laboratory Submarket Statistics(1) | ||||||||
| Submarket | Inventory | Overall Rate | Direct Vacancy Rate | YTD Construction Completions | YTD Overall Absorptions | Under Construction | Direct Avg. Rent | Direct (Class A) |
| Alewife | 1,192,000 | 1.0% | 0.0% | 0 | 100,681 | 3,100,000 | $71.00 | N/A |
| East Cambridge | 7,397,000 | 1.3% | 0.0% | 0 | (56,745) | 2,304,000 | $105.81 | $105.81 |
| Mid Cambridge | 3,934,000 | 1.3% | 0.0% | 0 | (41,966) | 0 | $82.88 | $81.07 |
| Total/Wtd. Avg. | 12,523,000 | 1.0% | 0.0% | 0 | 1,970 | 5,404,000 | $100.40 | $104.14 |
| (1) | Source: Appraisal. |
THE INFORMATION IN THIS STRUCTURAL AND COLLATERAL TERM SHEET IS NOT COMPLETE AND MAY BE AMENDED PRIOR TO THE TIME OF SALE. THIS TERM SHEET IS NOT AN OFFER TO SELL THESE SECURITIES AND IT IS NOT A SOLICITATION OF AN OFFER TO BUY THESE SECURITIES IN ANY JURISDICTION WHERE THE OFFER OR SALE IS NOT PERMITTED.
73 of 158
| Structural and Collateral Term Sheet | Benchmark 2022-B32 | |
| CX – 350 & 450 Water Street | ||
| Office Submarket Statistics(1) | ||||||||
| Submarket | Inventory | Overall Vacancy Rate | Direct Vacancy Rate | YTD Construction Completions | YTD Overall Absorptions | Under Construction | Direct Avg. Rent | Direct (Class A) |
| Alewife | 1,652,770 | 5.6% | 3.6% | 0 | 37,442 | 0 | $59.92 | $60.22 |
| East Cambridge | 8,207,363 | 7.2% | 2.8% | 0 | 196,420 | 1,235,423 | $82.60 | $82.29 |
| Mid Cambridge | 2,175,363 | 6.8% | 3.7% | 0 | (40,073) | 0 | $65.07 | $80.56 |
| Total/Wtd. Avg. | 12,035,496 | 6.9% | 3.0% | 0 | 193,789 | 1,235,423 | $75.07 | $79.92 |
| (1) | Source: Appraisal. |
The laboratory lease comparables range in size from 40,000 square feet to 260,000 square feet with lease terms ranging from 5 to 15 years. The comparables exhibit a range in rents from $88.50 to $105.00 per square foot, with an average of $95.20 per square foot on a net basis. Free rent concessions ranged from 0 to 12 months, averaging 1.71 months with tenant improvement allowances ranging from $0.00 to $225.00 per square foot, an average of $182.14 per square foot.
The appraiser concluded to a market rent of $110.00 per square foot at 350 Water Street, which is a 44.9% premium to the in-place rent of $75.90 per square foot.
The following table summarizes the comparable laboratory leases in the surrounding market.
| Summary of Comparable Laboratory Leases(1) | ||||||||||
| Property | Location | Year Built | Tenant Name | Lease Start Date | Term (yrs.) | Lease Type | Tenant Size (SF) | Base Rent PSF | Rent Steps | TI PSF |
| 350 Water Street(2) | Cambridge, MA | 2021(3) | Aventis Inc. | Jul-21 | 15.0 | Net | 511,157 | $75.90 | 2.50% | $250.00 |
| Seaport Labs | Boston, MA | 2023 | Eli Lilly LOI | Jan-23 | 15.0 | Net | 165,000 | $103.00 | 3.00% | $210.00 |
| 201 Brookline Avenue | Boston, MA | 2022 | Verve Therapeutics | Jun-22 | 15.0 | Net | 105,000 | $91.00 | 3.00% | $225.00 |
| Cambridge Crossing EF | Cambridge, MA | 2023 | Bristol Myers Squibb | May-22 | 15.0 | Net | 40,000 | $105.00 | 2.75% | $225.00 |
| 238 Main Street | Cambridge, MA | 2021 | Beam Therapeutics | Aug-21 | 12.0 | Net | 122,620 | $96.50 | 3.00% | $190.00 |
| 65 Landsdowne Street | Cambridge, MA | 2001 | Brigham and Women's | Feb-21 | 5.0 | Net | 112,410 | $100.00 | 3.00% | $0.00 |
| Cambridge Crossing EF | Cambridge, MA | 2023 | Bristol Myers Squibb | Aug-20 | 15.0 | Net | 260,000 | $88.50 | 2.50% | $225.00 |
| Cambridge Crossing | Cambridge, MA | 2019 | Cereval | Feb-20 | 10.0 | Net | 59,865 | $92.00 | 3.00% | $200.00 |
| Total/Wtd. Avg.(4) | 12.4 | 123,556 | $95.20 | $186.20 | ||||||
| (1) | Source: Appraisal. |
| (2) | Based on the rent roll dated October 14, 2021. |
| (3) | 350 Water Street is currently under construction with the base building substantial completion date expected in the second quarter of 2022. We cannot assure you the base building construction will be completed as expected or at all. |
| (4) | The Total/Wtd. Avg. excludes 350 Water Street. |
The office lease comparables range in size from 47,304 per square foot to 581,538 square feet and have lease terms ranging from 10 to 15 years. The lease comparables exhibit a range in rents from $64.95 to $100.00 per square foot, with an average of $79.16 per square foot on a net basis. Free rent concessions ranged from 0 to 8 months, averaging two months with tenant improvement allowances ranging from $0.00 to $161 per square foot, an average of $66.00 per square foot. The Google lease ($88.50 per square foot) and Bluebird Bio lease ($100 per square foot) are most comparable to 450 Water Street due to their Cambridge locations but warrant slight downward adjustments as they are in Kendall Square.
The appraiser concluded to a market rent of $85.00 per square foot at 450 Water Street, which is a 28.8% premium to the in-place rent of $66.00 per square foot.
THE INFORMATION IN THIS STRUCTURAL AND COLLATERAL TERM SHEET IS NOT COMPLETE AND MAY BE AMENDED PRIOR TO THE TIME OF SALE. THIS TERM SHEET IS NOT AN OFFER TO SELL THESE SECURITIES AND IT IS NOT A SOLICITATION OF AN OFFER TO BUY THESE SECURITIES IN ANY JURISDICTION WHERE THE OFFER OR SALE IS NOT PERMITTED.
74 of 158
| Structural and Collateral Term Sheet | Benchmark 2022-B32 | |
| CX – 350 & 450 Water Street | ||
The following table summarizes the comparable office leases in the surrounding market.
| Summary of Comparable Office Leases(1) | ||||||||||
| Property | Location | Year Built | Tenant Name | Lease Start Date | Term (yrs.) | Lease Type | Tenant Size (SF) | Base Rent PSF | Rent Steps | TI PSF |
| 450 Water Street(2) | Cambridge, MA | 2021(3) | Aventis Inc. | Nov-21 | 15.0 | Net | 404,076 | $66.00 | 2.50% | $175.00 |
| Seaport Labs I | Boston, MA | 2023 | Foundation Medicine (Shell) | Sep-23 | 15.0 | Net | 581,538 | $69.50 | 2.50% | $0.00 |
| 1001 Boylston Street | Boston, MA | 2022 | CarGurus | Jun-23 | 15.0 | Net | 225,428 | $64.95 | $1.30/SF | $161.00 |
| Google HQ | Cambridge, MA | 2022 | Apr-22 | 15.0 | Net | 385,423 | $88.50 | $1.00/SF | $84.00 | |
| 222 Berkeley Street | Boston, MA | 1991 | GW&K Investments | Feb-21 | 10.0 | Net | 47,304 | $72.00 | 2.00% | $85.00 |
| Alexandria Center | Cambridge, MA | 2017 | Bluebird Bio | Jan-21 | 10.0 | Net | 267,000 | $100.00 | 3.00% | $0.00 |
| Total/Wtd. Avg.(4) | 13.0 | 301,339 | $79.16 | $48.24 | ||||||
| (1) | Source: Appraisal. |
| (2) | Based on the rent roll dated October 14, 2021. |
| (3) | 450 Water Street is currently under construction with the base building work having reached substantial completion on December 16, 2021. We cannot assure you that buildout will be completed as expected or at all. |
| (4) | The Total/Wtd. Avg. excludes 450 Water Street. |
| Tenant Summary(1) | |||||||
| Tenant(2) | Ratings Moody’s/Fitch/S&P(3) | Net Rentable Area (SF)(4) | % of Total NRA | Base Rent PSF | % of Total Base Rent | Lease Expiration Date(5) | |
| Aventis Inc. (350 Water Street) | A1 / A+ / AA | 511,157 | 55.8% | $75.90 | 59.3% | 6/30/2036 | |
| Aventis Inc. (450 Water Street) | A1 / A+ / AA | 404,076 | 44.2 | $66.00 | 40.7% | 11/30/2036 | |
| Total | 915,233 | 100.0% | $71.53 | 100.0% | |||
| Vacant | 0 | 0.0 | |||||
| Total | 915,233 | 100.0% | |||||
| (1) | Based on the underwritten rent roll as of October 14, 2021. |
| (2) | Aventis Inc. is currently not in occupancy of either 350 Water Street or 450 Water Street, pending the substantial completion of the buildout out of its spaces at the CX- 350 & 450 Water Street Property. The CX – 350 & 450 Water Street Property is currently undergoing a buildout with an expected completion date of the second quarter of 2022 for 350 Water Street. 450 Water Street reached substantial completion on December 16, 2021. The lease at 350 Water Street commenced on July 1, 2021 and the lease at 450 Water Street commenced on November 10, 2021. |
| (3) | The credit ratings are those of the direct parent company, Sanofi, which is the guarantor under the leases. |
| (4) | The Tenant NRA includes up to 10,000 square feet of terrace space at 350 Water Street and up to 4,000 square feet of terrace space at 450 Water Street. |
| (5) | Aventis Inc. has the right to terminate each of the leases, with a termination fee, effective as of the end of its 14th lease year. If Aventis Inc. elects to exercise the early termination right, it must deliver to the landlord between 24 and 36 months prior to the early termination date (a) notice that the early termination right has been exercised and (b) the early termination payment. The early termination payment equals the sum of (i) the 12 monthly installments of base rent that would have been due for the 12-month period immediately following the early termination date in the absence of such termination and (ii) the stipulated operating expenses/tax component per the lease. |
| Lease Rollover Schedule(1)(2) | |||||||||
| Year | Number of Leases Expiring | Net Rentable Area Expiring | % of NRA Expiring | Base Rent Expiring(1) | % of Base Rent Expiring | Cumulative Net Rentable Area Expiring | Cumulative % of NRA Expiring | Cumulative Base Rent Expiring | Cumulative % of Base Rent Expiring |
| Vacant | 0 | 0 | 0.0% | NAP | NAP | 0 | 0.0% | NAP | NAP |
| MTM & 2022 | 0 | 0 | 0.0% | 0 | 0 | 0 | 0.0% | 0 | 0.0% |
| 2023 | 0 | 0 | 0.0% | 0 | 0 | 0 | 0.0% | 0 | 0.0% |
| 2024 | 0 | 0 | 0.0% | 0 | 0 | 0 | 0.0% | 0 | 0.0% |
| 2025 | 0 | 0 | 0.0% | 0 | 0 | 0 | 0.0% | 0 | 0.0% |
| 2026 | 0 | 0 | 0.0% | 0 | 0 | 0 | 0.0% | 0 | 0.0% |
| 2027 | 0 | 0 | 0.0% | 0 | 0 | 0 | 0.0% | 0 | 0.0% |
| 2028 | 0 | 0 | 0.0% | 0 | 0 | 0 | 0.0% | 0 | 0.0% |
| 2029 | 0 | 0 | 0.0% | 0 | 0 | 0 | 0.0% | 0 | 0.0% |
| 2030 | 0 | 0 | 0.0% | 0 | 0 | 0 | 0.0% | 0 | 0.0% |
| 2031 | 0 | 0 | 0.0% | 0 | 0 | 0 | 0.0% | 0 | 0.0% |
| 2032 and Thereafter | 2 | 915,233 | 100.0% | $65,465,832 | 100.0% | 915,233 | 100.0% | $65,465,832 | 100.0% |
| Total | 2 | 915,233 | 100.0% | $65,465,832 | 100.0% | ||||
| (1) | Based on the underwritten rent roll dated October 14, 2021. |
| (2) | Certain tenants may have termination or contraction options (which may become exercisable prior to the originally stated expiration date of the tenant lease) that are not considered in the above Lease Rollover Schedule. |
THE INFORMATION IN THIS STRUCTURAL AND COLLATERAL TERM SHEET IS NOT COMPLETE AND MAY BE AMENDED PRIOR TO THE TIME OF SALE. THIS TERM SHEET IS NOT AN OFFER TO SELL THESE SECURITIES AND IT IS NOT A SOLICITATION OF AN OFFER TO BUY THESE SECURITIES IN ANY JURISDICTION WHERE THE OFFER OR SALE IS NOT PERMITTED.
75 of 158
| Structural and Collateral Term Sheet | Benchmark 2022-B32 | |
| CX – 350 & 450 Water Street | ||
Underwritten Net Cash Flow(1)(2) | |||
| Underwritten | Per Square Foot | %(3) | |
| Base Rent(4) | $65,465,832 | $71.53 | 69.4% |
| Straight Line Base Rent Average(5) | 13,436,165 | 14.68 | 14.2% |
| Gross Potential Rent | $78,901,997 | $86.21 | 83.6% |
| Tenant Recoveries | 11,768,903 | 12.86 | 12.5% |
| Total Recoveries | 11,768,903 | 12.86 | 12.5% |
| Other Income | 3,673,555 | 4.01 | 3.9% |
| Net Rentable Income | $94,344,455 | $103.08 | 100.0% |
| Vacancy | (1,415,167) | (1.55) | -1.5% |
| Effective Gross Income | $92,929,288 | $101.54 | 98.5% |
| Total Fixed Expenses | 7,998,329 | 8.74 | 8.6% |
| Total Variable Expenses | 4,227,428 | 4.62 | 4.5% |
| Total Expenses | $12,225,756 | $13.36 | 13.2% |
| 0.0% | |||
| Net Operating Income | $80,703,532 | $88.18 | 86.8% |
| Reserves for Replacements | 137,285 | 0.15 | 0.1% |
| TI/LC | 0 | 0.00 | 0.0% |
| Net Cash Flow | $80,566,247 | $88.03 | 86.7% |
| (1) | Historical financial information and occupancy is not available because the CX - 350 & 450 Water Street Property is currently under construction. As of October 8, 2021, the base building work for the CX – 350 & 450 Water Street Property is 90% complete. |
| (2) | Based on the underwritten rent roll as of October 14, 2021. |
| (3) | % column represents percent of Net Rental Income for all revenue lines and represents percent of Effective Gross Income for the remainder of the fields. |
| (4) | The rent commencement date for the lease at 350 Water Street was in July 2021 and the rent commencement date for the lease at 450 Water Street was in November 2021. At loan origination, the borrowers reserved approximately $10,732,231 into a gap rent reserve for the Aventis Inc. lease related to 450 Water Street. |
| (5) | Straight-line average rent credit for Aventis Inc. (Sanofi, investment grade rated parent company) through its lease term, including parking income rent adjusted for increases of 2.0% adjusted for CPI. The straight-line rent averages result in an average triple-net base rent of $90.99 per square foot for the 350 Water Street lease and $78.98 per square foot for the 450 Water Street lease over the life of the lease. |
Property Management. The CX - 350 & 450 Water Street Property is managed by Divco West Real Estate Services, Inc., an affiliate of one of the loan sponsors.
Escrows and Reserves. At loan origination, the borrowers deposited approximately (i) $52,062,079 into an existing TI/LC reserve, (ii) $86,650,891 into a base building work reserve and (iii) $10,732,231 into an Aventis rent reserve.
Tax Reserve – During a Trigger Period (as defined below), the borrowers are required to deposit into a real estate tax reserve, on a monthly basis, 1/12th of the estimated annual real estate taxes.
Insurance Reserve – During a Trigger Period, the borrowers are required to deposit into an insurance reserve, on a monthly basis, 1/12th of estimated insurance premiums, unless an acceptable blanket policy is in effect.
Rollover Reserve – During a Lease Sweep Period (as defined below), all available cash will be swept into the deposit account held by the lender, which will be transferred to the rollover reserve.
Lockbox / Cash Management. The CX - 350 & 450 Water Street Whole Loan is structured with a hard lockbox and springing cash management. The borrowers are required to deliver tenant direction letters instructing all tenants to deposit rents into a lender-controlled lockbox account. The borrowers are required to cause all rents to be deposited directly into the lender-controlled lockbox account. All funds received by the borrowers or the manager are required to be deposited in the lockbox account within two business days following receipt. During the continuance of a Trigger Period, funds on deposit in the lockbox account are required to be swept on a daily basis into a lender-controlled cash management account and applied to pay debt service on the CX - 350 & 450 Water Street Whole Loan, required reserves and operating expenses. Prior to the ARD, all excess cash is required to be transferred to a lender-controlled account as additional collateral for the CX - 350 & 450 Water Street Whole Loan during such Trigger Period, subject to certain permitted uses by the borrowers described in the CX – 350 & 450 Water Street Whole Loan documents, and except as described above with respect to a Lease Sweep Period. If the CX - 350 & 450 Water Street Whole Loan is not paid by the ARD, from and after the ARD, the CX - 350 & 450 Water Street Whole Loan will accrue interest at the Adjusted Interest Rate; however, interest accrued at the excess of the Adjusted Interest Rate over the initial interest rate will be deferred.
After the ARD, all amounts on deposit in the cash management account after payment of debt service on the CX - 350 & 450 Water Street Whole Loan, required reserves and budgeted operating expenses will be required to be applied to the prepayment of the outstanding principal balance of the CX – 350 & 450 Water Street Whole Loan, first to the CX – 350 & 450 Water Street Senior Notes and then to the CX – 350 & 450 Water Street Junior Notes, until the outstanding principal balance has been reduced to zero, then to any excess interest
THE INFORMATION IN THIS STRUCTURAL AND COLLATERAL TERM SHEET IS NOT COMPLETE AND MAY BE AMENDED PRIOR TO THE TIME OF SALE. THIS TERM SHEET IS NOT AN OFFER TO SELL THESE SECURITIES AND IT IS NOT A SOLICITATION OF AN OFFER TO BUY THESE SECURITIES IN ANY JURISDICTION WHERE THE OFFER OR SALE IS NOT PERMITTED.
76 of 158
| Structural and Collateral Term Sheet | Benchmark 2022-B32 | |
| CX – 350 & 450 Water Street | ||
until the excess interest has been reduced to zero and then to any other indebtedness due under the CX – 350 & 450 Water Street Whole Loan until the other indebtedness has been reduced to zero.
A “Trigger Period” will commence upon (i) the ARD, (ii) the occurrence of an event of default under the CX - 350 & 450 Water Street Whole Loan and continue until cured, (iii) on any date from and after December 31, 2022, the debt service coverage ratio is less than 1.75x based on the CX - 350 & 450 Water Street Whole Loan as of two consecutive calendar quarters, and will end upon the earlier to occur of (a) the debt service coverage ratio based on the CX - 350 & 450 Water Street Whole Loan is equal to or greater than 1.75x for two consecutive calendar quarters or (b) the funds on deposit in the cash collateral account are equal to the sum of (x) $25,557,850, to the extent 350 Water Street has not been released and (y) $20,203,800, to the extent 450 Water Street has not been released, and (iv) the commencement of a Lease Sweep Period and will continue until such Lease Sweep Period ends in accordance with the definition of such term.
A “Lease Sweep Period” will commence (prior to the ARD), upon (i) the earliest to occur of (a) the date that is 12 months prior to the earliest stated expiration of the Lease Sweep Lease (as defined below), (b) the last date under such Lease Sweep Lease that the tenant has the right to give notice of its exercise of a renewal option, (c) with respect to any Lease Sweep Lease that is a Short Term Qualifying Lease (as defined below), the date that is 12 months prior to the ARD and (d) with respect to any Lease Sweep Lease that is a Short Term Qualifying Lease, the date that the lender reasonably determines that a Lease Sweep Period commences in order for the aggregate amount of available cash that is projected to be deposited into the rollover account for the period commencing on such date through the ARD will be equal to the applicable Lease Sweep Deposit Amount (as defined below), (ii) the date of the early termination, early cancellation or early surrender of a Lease Sweep Lease (or any material portion thereof) prior to its then current expiration date or the receipt by the applicable borrower or manager of written notice from the tenant under a Lease Sweep Lease of its intent to effect an early termination, early cancellation or early surrender of such Lease Sweep Lease prior to its then current expiration date; (iii) solely with respect to any Lease Sweep Lease under which neither the tenant thereunder, nor any guarantor of all of the tenant’s obligations thereunder, is an investment grade entity, if such tenant has ceased operating its business (i.e., “goes dark”) in a majority of its leased space at the applicable property and the same has not been subleased, on the origination date or thereafter in accordance with the terms of the CX – 350 & 450 Water Street Whole Loan documents, pursuant to a sublease on the same or substantially similar or better terms as the applicable Lease Sweep Lease (provided that a Lease Sweep Period will not exist if the sole reason the tenant is dark is for certain reasons relating to the COVID-19 pandemic or any other pandemic or epidemic, and the tenant continues paying contractual rent under its lease); (iv) a monetary or material non-monetary default under a Lease Sweep Lease by the tenant; or (v) the occurrence of an insolvency proceeding of a tenant under a Lease Sweep Lease or its parent company or lease guarantor.
A Lease Sweep Period will end upon, (A) in the case of clauses (i)(a), (i)(b), (i)(c), and/or (i)(d) above, the entirety of the Lease Sweep Lease space (or applicable portion thereof) is leased pursuant to one or more qualified leases and in the lender’s reasonable judgment, sufficient funds have been accumulated in the rollover account, (B) in the case of clause (i)(a) above, the date on which the tenant under the Lease Sweep Lease irrevocably exercises its renewal or extension option or otherwise extends its Lease Sweep Lease in accordance with the terms of the CX – 350 & 450 Water Street Whole Loan documents with respect to all of its Lease Sweep Lease space, and, in the lender’s reasonable judgment, sufficient funds have been accumulated in the rollover account, (C) in the case of clause (ii) above, if the tenant under the applicable Lease Sweep Lease rescinds in writing the exercise of its notice exercising its early termination, cancellation or surrender right or option, (D) in the case of clause (iii) above, the circumstances giving rise to a Lease Sweep Period under clause (iii) no longer exist; (E) in the case of clause (iv) above, the date on which the subject default has been cured; (F) in the case of clause (v) above, either (x) the applicable insolvency proceeding has terminated or (y) the applicable Lease Sweep Lease has been assumed or assumed and assigned to a third party in a manner reasonably satisfactory to the lender; (G) in the case of clauses (i), (ii), (iii), (iv) and/or (v) above, the properties have achieved a debt yield of not less than 6.0% and, in the lender’s reasonable judgment, sufficient funds have been accumulated in the rollover account; or (H) in the case of clauses (i), (ii), (iii), (iv) and/or (v) above, the date on which funds in the rollover account collected with respect to the Lease Sweep Lease space in question is equal to the Lease Sweep Deposit Amount applicable to such Lease Sweep Lease space.
A “Lease Sweep Lease” means (i) the Aventis Inc. lease at 350 Water Street, (ii) the Aventis Inc. lease at 450 Water Street or (iii) any replacement lease that, either individually, or when taken together with any other lease with the same tenant or its affiliates covers the majority of the Lease Sweep Lease space.
A “Lease Sweep Deposit Amount” means an amount equal to the total rentable square feet of the applicable Lease Sweep Lease space that is the subject of a Lease Sweep Period multiplied by $50.00.
A “Short Term Qualifying Lease” means any qualified lease that has an initial term which does not extend at least two years beyond the ARD.
THE INFORMATION IN THIS STRUCTURAL AND COLLATERAL TERM SHEET IS NOT COMPLETE AND MAY BE AMENDED PRIOR TO THE TIME OF SALE. THIS TERM SHEET IS NOT AN OFFER TO SELL THESE SECURITIES AND IT IS NOT A SOLICITATION OF AN OFFER TO BUY THESE SECURITIES IN ANY JURISDICTION WHERE THE OFFER OR SALE IS NOT PERMITTED.
77 of 158
| Structural and Collateral Term Sheet | Benchmark 2022-B32 | |
| CX – 350 & 450 Water Street | ||
Current Mezzanine or Subordinate Indebtedness. The CX - 350 & 450 Water Street Junior Notes have an aggregate outstanding principal balance as of the Cut-off Date of $411,000,000 and accrue interest at an initial fixed rate of 2.79200% per annum, followed by a rate increase after the ARD. For additional information, see “Description of the Mortgage Pool—The Whole Loans—The Non-Serviced AB Whole Loans—CX - 350 & 450 Water Street Whole Loan” in the Preliminary Prospectus.
Future Mezzanine or Subordinate Indebtedness Permitted. Not permitted.
Partial Release. The CX - 350 & 450 Water Street Whole Loan documents allow, on any business day following the defeasance lockout period (for a defeasance) or on any business day after December 6, 2023 (for a prepayment), any borrower to obtain the release of its respective property in connection with a bona fide third-party sale upon the following conditions: (i) the borrowers must partially prepay (with the prepayment fee) or partially defease the CX – 350 & 450 Water Street Whole Loan in an amount equal to, (a) with respect to the release of 350 Water Street, 110% of the allocated loan amount and (b) with respect to the release of 450 Water Street, 105% of the allocated loan amount so long as after giving effect to such release, (ii) the debt service coverage ratio is equal to or greater than the greater of the debt service coverage ratio of the CX – 350 & 450 Water Street Whole Loan preceding such release and 1.90x and (iii) certain REMIC related conditions are satisfied. The allocated loan amount for 350 Water Street is $720,300,000 and the allocated loan amount for 450 Water Street is $504,700,000.
THE INFORMATION IN THIS STRUCTURAL AND COLLATERAL TERM SHEET IS NOT COMPLETE AND MAY BE AMENDED PRIOR TO THE TIME OF SALE. THIS TERM SHEET IS NOT AN OFFER TO SELL THESE SECURITIES AND IT IS NOT A SOLICITATION OF AN OFFER TO BUY THESE SECURITIES IN ANY JURISDICTION WHERE THE OFFER OR SALE IS NOT PERMITTED.
78 of 158
(THIS PAGE INTENTIONALLY LEFT BLANK)
THE INFORMATION IN THIS STRUCTURAL AND COLLATERAL TERM SHEET IS NOT COMPLETE AND MAY BE AMENDED PRIOR TO THE TIME OF SALE. THIS TERM SHEET IS NOT AN OFFER TO SELL THESE SECURITIES AND IT IS NOT A SOLICITATION OF AN OFFER TO BUY THESE SECURITIES IN ANY JURISDICTION WHERE THE OFFER OR SALE IS NOT PERMITTED.
79 of 158
| Structural and Collateral Term Sheet | Benchmark 2022-B32 | |
| One Wilshire | ||

THE INFORMATION IN THIS STRUCTURAL AND COLLATERAL TERM SHEET IS NOT COMPLETE AND MAY BE AMENDED PRIOR TO THE TIME OF SALE. THIS TERM SHEET IS NOT AN OFFER TO SELL THESE SECURITIES AND IT IS NOT A SOLICITATION OF AN OFFER TO BUY THESE SECURITIES IN ANY JURISDICTION WHERE THE OFFER OR SALE IS NOT PERMITTED.
80 of 158
| Structural and Collateral Term Sheet | Benchmark 2022-B32 | |
| One Wilshire | ||

THE INFORMATION IN THIS STRUCTURAL AND COLLATERAL TERM SHEET IS NOT COMPLETE AND MAY BE AMENDED PRIOR TO THE TIME OF SALE. THIS TERM SHEET IS NOT AN OFFER TO SELL THESE SECURITIES AND IT IS NOT A SOLICITATION OF AN OFFER TO BUY THESE SECURITIES IN ANY JURISDICTION WHERE THE OFFER OR SALE IS NOT PERMITTED.
81 of 158
| Structural and Collateral Term Sheet | Benchmark 2022-B32 | |
| One Wilshire | ||
| Mortgage Loan Information | Property Information | |||
| Mortgage Loan Seller: | GSMC | Single Asset / Portfolio: | Single Asset | |
| Original Principal Balance(1): | $90,000,000 | Title: | Fee | |
| Cut-off Date Principal Balance(1): | $90,000,000 | Property Type - Subtype: | Office - CBD/Data Center | |
| % of Pool by IPB: | 5.1% | Net Rentable Area (SF): | 661,553 | |
| Loan Purpose: | Refinance | Location: | Los Angeles, CA | |
| Borrower: | GI TC One Wilshire, LLC | Year Built / Renovated: | 1967 / 1992 | |
| Guarantor: | TechCore, LLC | Occupancy: | 87.3% | |
| Interest Rate(2): | 2.77600% | Occupancy Date: | 11/1/2021 | |
| Note Date: | 12/22/2021 | Number of Tenants: | 35 | |
| ARD Date(2): | 1/6/2032 | Fourth Most Recent NOI: | $29,471,312 (December 31, 2018) | |
| Maturity Date: | 1/6/2035 | Third Most Recent NOI: | $31,610,806 (December 31, 2019) | |
| Interest-only Period: | 120 months | Second Most Recent NOI: | $34,570,190 (December 31, 2020) | |
| Original Term: | 120 months | Most Recent NOI: | $35,627,157 (TTM September 30, 2021) | |
| Original Amortization: | None | UW Economic Occupancy: | 88.8% | |
| Amortization Type: | Interest Only - ARD | UW Revenues: | $54,609,882 | |
| Call Protection(3): | L(25),D(88),O(7) | UW Expenses: | $17,099,493 | |
| Lockbox / Cash Management: | Hard / Springing | UW NOI: | $37,510,389 | |
| Additional Debt(1): | Yes | UW NCF: | $36,919,391 | |
| Additional Debt Balance(1): | $299,250,000 | Appraised Value / Per SF: | $913,000,000 / $1,380 | |
| Additional Debt Type(1): | Pari Passu | Appraisal Date: | 11/5/2021 | |
| Escrows and Reserves(4) | Financial Information | ||||||
| Initial | Monthly | Initial Cap | |||||
| Taxes: | $0 | Springing | N/A | Cut-off Date Loan / SF: | $588 | ||
| Insurance: | $0 | Springing | N/A | Maturity Date Loan / SF: | $588 | ||
| Replacement Reserves: | $0 | Springing | N/A | Cut-off Date LTV: | 42.6% | ||
| TI/LC: | $0 | Springing | N/A | Maturity Date LTV: | 42.6% | ||
| Other: | $0 | Springing | N/A | UW NCF DSCR: | 3.37x | ||
| UW NOI Debt Yield: | 9.6% | ||||||
| Sources and Uses | ||||||
| Sources | Proceeds | % of Total | Uses | Proceeds | % of Total | |
| Loan Amount | $389,250,000 | 100.0% | Loan Payoff | $190,909,806 | 49.0% | |
| Return of Equity | 197,558,597 | 50.8 | ||||
| Closing Costs | 781,598 | 0.2 | ||||
| Total Sources | $389,250,000 | 100.0% | Total Uses | $389,250,000 | 100.0% | |
| (1) | The One Wilshire Loan (as defined below) is part of a whole loan evidenced by four pari passu notes, with an aggregate outstanding principal balance as of the Cut-off Date of $389.25 million. The Financial Information in the chart above reflects the Cut-off Date Balance of the One Wilshire Whole Loan (as defined below). |
| (2) | The One Wilshire Loan is structured with an anticipated repayment date (“ARD”) of January 6, 2032 and a final maturity date of January 6, 2035. After the ARD, the interest rate will be revised to 3.0% over the greater of (x) 2.77600% and (y) the term SOFR rate in effect on the ARD, pursuant to the One Wilshire Whole Loan documents. The Mortgage Loan Information and Financial Information presented in the tables above are calculated based on the ARD. |
| (3) | The defeasance lockout period, with respect to a defeasance of the One Wilshire Whole Loan, will be at least 25 payment dates beginning with and including the first payment date on February 6, 2022. Defeasance of the full $389.25 million One Wilshire Whole Loan is permitted after the date that is earlier of (i) two years from the closing date of the securitization that includes the last note to be securitized and (ii) December 22, 2024. |
| (4) | For a full description of Escrows and Reserves, please refer to “Escrows and Reserves” below. |
THE INFORMATION IN THIS STRUCTURAL AND COLLATERAL TERM SHEET IS NOT COMPLETE AND MAY BE AMENDED PRIOR TO THE TIME OF SALE. THIS TERM SHEET IS NOT AN OFFER TO SELL THESE SECURITIES AND IT IS NOT A SOLICITATION OF AN OFFER TO BUY THESE SECURITIES IN ANY JURISDICTION WHERE THE OFFER OR SALE IS NOT PERMITTED.
82 of 158
| Structural and Collateral Term Sheet | Benchmark 2022-B32 | |
| One Wilshire | ||
The Loan. The One Wilshire mortgage loan (the “One Wilshire Loan”) is part of a whole loan with an aggregate outstanding principal balance as of the Cut-off Date of $389.25 million (the “One Wilshire Whole Loan) comprised of four pari passu notes with an aggregate outstanding principal balance as of the Cut-off Date of $389.25 million. The One Wilshire Whole Loan is secured by the borrower’s fee interest in a 661,553 square foot building comprised of data center and office space located in downtown Los Angeles, California (the “One Wilshire Property”). The controlling note A-1, with an aggregate outstanding principal balance as of the Cut-off Date of $90,000,000 (the “One Wilshire Loan”), will be included in the Benchmark 2022-B32 trust. The remaining notes are expected to be contributed to one or more future securitization trusts or may otherwise be transferred at any time.
The One Wilshire Whole Loan, which accrues interest at an interest rate of 2.77600% per annum, was originated by Goldman Sachs Bank USA on December 22, 2021, had an aggregate original principal balance of $389.25 million and has an aggregate outstanding principal balance as of the Cut-off Date of $389.25 million. The proceeds of the One Wilshire Whole Loan were primarily used to refinance the One Wilshire Property, pay origination costs, cover defeasance and return equity to the loan sponsor. The relationship between the holders of the One Wilshire Whole Loan is governed by a co-lender agreement as described under “Description of the Mortgage Pool—The Whole Loans—The Serviced Pari Passu Whole Loans” in the Preliminary Prospectus. The One Wilshire Whole Loan has a 10-year interest-only term through the ARD of January 6, 2032 and a final maturity date of January 6, 2035. After the ARD, through and including January 6, 2035, the following structure will apply: the interest rate will increase (such new rate, the “Adjusted Interest Rate”) by 3.0% over the greater of (x) 2.77600%, and (y) the term SOFR rate in effect on the ARD; however, interest accrued at the excess of the Adjusted Interest Rate over the initial interest rate will be deferred as described below under “Lockbox / Cash Management.” For the period from the origination date through the ARD, the One Wilshire Whole Loan accrues interest at the rate of 2.77600% per annum. Voluntary prepayment of the One Wilshire Whole Loan in whole (but not in part) is permitted on or after the open prepayment date occurring in July 2031 without payment of any prepayment premium. Defeasance of the One Wilshire Whole Loan only in whole is permitted at any time after the earlier of (i) December 22, 2024 or (ii) the first due date following the second anniversary of the closing date of the securitization that includes that last note of the One Wilshire Whole Loan to be securitized.
The table below summarizes the promissory notes that comprise the One Wilshire Whole Loan. The relationship between the holders of the One Wilshire Whole Loan will be governed by a co-lender agreement as described “Description of the Mortgage Pool—The Whole Loans—The Serviced Pari Passu Whole Loans” in the Preliminary Prospectus.
| Whole Loan Summary | |||||
| Note | Original Balance | Cut-off Date Balance | Note Holder | Controlling Piece | |
| A-1 | $90,000,000 | $90,000,000 | Benchmark 2022-B32 | Yes | |
| A-2 | $120,000,000 | $120,000,000 | GSBI(1) | No | |
| A-3 | $85,000,000 | $85,000,000 | GSBI(1) | No | |
| A-4 | $94,250,000 | $94,250,000 | GSBI(1) | No | |
| Whole Loan | $389,250,000 | $389,250,000 | |||
| (1) | Expected to be contributed to one or more future securitization trusts. |
THE INFORMATION IN THIS STRUCTURAL AND COLLATERAL TERM SHEET IS NOT COMPLETE AND MAY BE AMENDED PRIOR TO THE TIME OF SALE. THIS TERM SHEET IS NOT AN OFFER TO SELL THESE SECURITIES AND IT IS NOT A SOLICITATION OF AN OFFER TO BUY THESE SECURITIES IN ANY JURISDICTION WHERE THE OFFER OR SALE IS NOT PERMITTED.
83 of 158
| Structural and Collateral Term Sheet | Benchmark 2022-B32 | |
| One Wilshire | ||
The Borrower. The borrower is GI TC One Wilshire, LLC, a Delaware limited liability company. The borrower is structured to be a single purpose bankruptcy-remote entity, having at least two independent directors in its organizational structure. Legal counsel to the borrower delivered a non-consolidation opinion in connection with the origination of the One Wilshire Whole Loan.
The Loan Sponsor. The loan sponsor and non-recourse guarantor is TechCore, LLC (“TechCore”), a joint venture between GI Partners (“GI”) and the California Public Employees’ Retirement System (“CalPERS”). GI is the manager of TechCore and fund manager. CalPERS is the non-controlling member. TechCore is an investment vehicle to invest in technology-advantaged real estate in the United States, including data centers, internet gateways, and corporate campuses for technology tenants, and life science properties located in primary MSAs, leased to industry leading tenants.
The Property. The One Wilshire Property is 30 story office building with a totaling 717,065 square feet of space with 661,553 square feet of net rentable area, located on an approximately 1.36-acre site at 624 South Grand Avenue in Los Angeles, California. The One Wilshire Property was originally constructed in 1967 and renovated in 1992. Additionally, there is also a 524 space five-level subterranean parking garage. As of November 1, 2021, the One Wilshire Property is 87.3% leased to a variety of tenants, the largest being CoreSite.
Major Tenants.
The largest tenant, CoreSite (176,685 square feet; 26.7% of net rentable area; 40.5% of underwritten base rent) currently operates 26 data centers across eight markets in the United States. CoreSite provides hybrid IT solutions that empower enterprises, cloud, network, and IT service providers to monetize and future-proof their digital business. CoreSite has been at the One Wilshire Property since 2007 and currently leases 35 suites. CoreSite extended its lease in August 2017. CoreSite’s lease expires in July 2029 and features three, five-year extension options each with 270-day notice periods. On December 28 2021, it was announced that American Tower, a telecommunication infrastructure focused REIT, had finalized its acquisition of CoreSite. CoreSite is now a subsidiary of American Tower and no information has been provided that there will be any proposed changes to the legal entity operating at the Property and on the relevant leases.
The second largest leased tenant, Musick Peeler (106,475 square feet; 16.1% of net rentable area; 8.4% of underwritten base rent) is a national law firm that offers representation in a wide variety of legal matters including appellate, banking and finance, corporate, business and technology, intellectual property, real estate, and trusts & estates and delivers legal services across the globe. Musick Peeler is a member of Ally Law, an alliance of international law firms. Musick Peeler has been at the One Wilshire Property since 1997 and expanded its space in 2004.
The third largest leased tenant, Verizon Global Networks (through its affiliated entities) (61,881 square feet; 9.4% of net rentable square feet; 13.4% of underwritten base rent) (“Verizon”) formed on June 30, 2000 and is one of the world’s leading providers of technology and communications services. Verizon is headquartered in New York City and in 2020 generated revenues of approximately $128.3 billion. Verizon offers voice, data and video services and solutions on its award-winning networks and platforms, delivering on customers’ demand for mobility, reliable network connectivity, security and control. Verizon has been at the One Wilshire Property since August 1982 and expanded its space in 1986, 1990, 1998, 2003, and 2012.
The Market. The One Wilshire Property is located in Los Angeles County in the Los Angeles-Long Beach-Anaheim metropolitan statistical area (“MSA”). Los Angeles County is the most populous county in the United States with a 2010 U.S. Census population of 9,818,605, and also has one of the largest economies in the world. Los Angeles is the sixth largest data center market in the United States by square footage. Los Angeles also benefits from a large number of technology, government, financial, and defense companies with large presences in the market.
The One Wilshire is within the Financial District of Downtown Los Angeles central business district submarket. The Downtown Los Angeles central business district submarket is home to a number of professional services companies including law firms, insurance companies and consulting firms. Notable companies with a presence in the area include Deloitte, Charles Schwab, Boston Consulting Group, Spotify and CBRE. The Downtown Los Angeles County Office submarket reported a vacancy level of 21.3% and average office asking rent of $41.70 per square foot as of the third quarter of 2021. The Los Angeles county office market reported a vacancy level of 19.2% and average office rents of $43.85 per square foot as of the third quarter of 2021.
According to the appraisal, the 2020 population, population growth from 2010-2020 and average household income are presented in the chart below:
| Los Angeles City | Los Angeles County | LA-Long Beach- Anaheim MSA | |
| Population | 3,967,152 | 10,173,432 | 13,403,861 |
| Population Growth | 4.60% | 3.61% | 4.48% |
| Average Household Income | $97,592 | $101,935 | $107,748 |
THE INFORMATION IN THIS STRUCTURAL AND COLLATERAL TERM SHEET IS NOT COMPLETE AND MAY BE AMENDED PRIOR TO THE TIME OF SALE. THIS TERM SHEET IS NOT AN OFFER TO SELL THESE SECURITIES AND IT IS NOT A SOLICITATION OF AN OFFER TO BUY THESE SECURITIES IN ANY JURISDICTION WHERE THE OFFER OR SALE IS NOT PERMITTED.
84 of 158
| Structural and Collateral Term Sheet | Benchmark 2022-B32 | |
| One Wilshire | ||
| Historical and Current Occupancy | ||
| 2019(1) | 2020(1) | Current(2) |
| 90.3% | 89.4% | 87.3% |
| (1) | Historical Occupancies are as of December 31 of each respective year. |
| (2) | Current Occupancy is as of November 1, 2021. |
COVID-19 Update. As of January 6, 2022, the One Wilshire Property is open and operating. Rent collections for the One Wilshire Property were 100.0% and 100.0% for November and December 2021, respectively. There has been no rent relief requested. As of January 6, 2022, no loan modification or forbearance requests have been made on the One Wilshire Whole Loan. The first payment date of the One Wilshire Whole Loan is February 6, 2022.
| Tenant Summary(1) | ||||||
| Tenant | Ratings Moody’s/Fitch/S&P(2) | Net Rentable Area (SF) | % of Total NRA | Base Rent PSF(3) | % of Total Base Rent(3) | Lease Expiration Date |
| CoreSite(4) | NR/NR/NR | 176,685 | 26.7% | $97.78 | 40.5% | 7/31/2029 |
| Musick Peeler | NR/NR/NR | 106,475 | 16.1 | $33.60 | 8.4 | 10/31/2023 |
| Verizon Global Networks(5) | NR/NR/NR | 61,881 | 9.4 | $92.57 | 13.4 | Various |
| Crowell, Weedon | NR/NR/NR | 43,301 | 6.5 | $33.81 | 3.4 | 12/31/2024 |
| Zayo | NR/NR/NR | 32,017 | 4.8 | $55.85 | 4.2 | 10/31/2033 |
| Crown Castle(6) | NR/NR/NR | 26,361 | 4.0 | $59.45 | 3.7 | Various |
| Qwest Communications | NR/NR/NR | 26,308 | 4.0 | $97.95 | 6.0 | 12/31/2025 |
| Level 3(7) | NR/NR/NR | 20,326 | 3.1 | $93.72 | 4.5 | Various |
| China Telecom | NR/NR/NR | 11,066 | 1.7 | $58.97 | 1.5 | 9/30/2022 |
| GI TC One Wilshire Services (MMR Operated by CoreSite) | NR/NR/NR | 10,848 | 1.6 | $106.33 | 2.7 | 7/31/2031 |
| Total | 515,268 | 77.9% | $73.15 | 88.3% | ||
| Remaining Tenants | 62,061 | 9.4 | $80.77 | 11.7 | ||
| Total Occupied | 577,329 | 87.3% | ||||
| Vacant | 84,224 | 12.7 | ||||
| Total | 661,553 | 100.0% | $73.96 | 100.0% |
| (1) | Based on the underwritten rent roll dated November 1, 2021. |
| (2) | In certain instances, ratings provided are those of the parent company of the entity shown, whether or not the parent company guarantees the lease. |
| (3) | Base Rent PSF is inclusive of contractual rent steps underwritten through the termination option per the tenant’s lease. |
| (4) | CoreSite subleases 10,848 square feet expiring on July 31, 2029 ($105.88 PSF) from GI TC One Wilshire Services, which brings its total footprint at the One Wilshire Property to 187,533 square feet. |
| (4) | Verizon Global Networks leases 24,283 square feet expiring July 31, 2029, 18,835 square feet expiring December 14, 2026, 7,905 square feet expiring December 14, 2023, 4,698 square feet expiring August 21, 2030, 3,907 square feet expiring July 15, 2025, 2,253 square feet expiring April 30, 2025 and antenna space expiring July 31, 2022. |
| (5) | Crown Castle leases 14,199 square feet expiring December 31, 2025 and 12,162 on a month to month basis. |
| (6) | Level 3 leases 10,318 square feet expiring April 30, 2023 and 10,008 square feet expiring November 30, 2026. |
THE INFORMATION IN THIS STRUCTURAL AND COLLATERAL TERM SHEET IS NOT COMPLETE AND MAY BE AMENDED PRIOR TO THE TIME OF SALE. THIS TERM SHEET IS NOT AN OFFER TO SELL THESE SECURITIES AND IT IS NOT A SOLICITATION OF AN OFFER TO BUY THESE SECURITIES IN ANY JURISDICTION WHERE THE OFFER OR SALE IS NOT PERMITTED.
85 of 158
| Structural and Collateral Term Sheet | Benchmark 2022-B32 | |
| One Wilshire | ||
| Lease Rollover Schedule(1)(2)(3) | |||||||||
| Year | Number of Tenant Leases Expiring | Net Rentable Area Expiring | % of NRA Expiring | Base Rent Expiring(4) | % of Base Rent Expiring | Cumulative Net Rentable Area Expiring | Cumulative % of NRA Expiring | Cumulative Base Rent Expiring | Cumulative % of Base Rent Expiring |
| Vacant | NAP | 84,224 | 12.7% | NAP | NAP | 84,224 | 12.7% | NAP | NAP |
| MTM | 6 | 12,162 | 1.8 % | $370,342 | 0.9 % | 96,386 | 14.6 % | $370,342 | 0.9 % |
| 2022 | 10 | 21,101 | 3.2 % | $1,393,624 | 3.3 % | 117,487 | 17.8 % | $1,763,965 | 4.1 % |
| 2023 | 15 | 137,204 | 20.7 % | $6,238,286 | 14.6 % | 254,691 | 38.5 % | $8,002,252 | 18.7 % |
| 2024 | 8 | 46,163 | 7.0 % | $1,645,896 | 3.9 % | 300,854 | 45.5 % | $9,648,148 | 22.6 % |
| 2025 | 16 | 63,034 | 9.5 % | $5,770,068 | 13.5 % | 363,888 | 55.0 % | $15,418,216 | 36.1 % |
| 2026 | 8 | 38,052 | 5.8 % | $3,488,714 | 8.2 % | 401,940 | 60.8 % | $18,906,930 | 44.3 % |
| 2027 | 1 | 0 | 0.0 % | $0 | 0.0 % | 401,940 | 60.8 % | $18,906,930 | 44.3 % |
| 2028 | 0 | 0 | 0.0 % | $0 | 0.0 % | 401,940 | 60.8 % | $18,906,930 | 44.3 % |
| 2029 | 36 | 200,968 | 30.4 % | $19,494,511 | 45.7 % | 602,908 | 91.1 % | $38,401,441 | 89.9 % |
| 2030 | 4 | 15,780 | 2.4 % | $1,358,824 | 3.2 % | 618,688 | 93.5 % | $39,760,265 | 93.1 % |
| 2031 | 1 | 10,848 | 1.6 % | $1,153,482 | 2.7 % | 629,536 | 95.2 % | $40,913,747 | 95.8 % |
| 2032 and Thereafter | 5 | 32,017 | 4.8 % | $1,788,285 | 4.2 % | 661,553 | 100.0 % | $42,702,032 | 100.0 % |
| Total | 110 | 661,553 | 100.0% | $42,702,032 | 100.0% | ||||
| (1) | Based on the underwritten rent roll dated November 1, 2021. |
| (2) | Lease Rollover Schedule is based on the lease expiration dates of all direct leases in place. |
| (3) | Certain tenants may have termination or contraction options (which may become exercisable prior to the originally stated expiration date of the tenant lease) that are not considered in the above Lease Rollover Schedule. See “Tenant Summary” above. |
| (4) | Base Rent Expiring is inclusive of contractual rent steps underwritten through the termination option per the tenant’s lease. |
| Operating History and Underwritten Net Cash Flow | ||||||
| 2019 | 2020 | TTM 9/30/2021 | Underwritten | Per Square Foot | %(1) | |
| Base Rent(2) | 38,070,245 | 40,022,711 | 40,990,035 | 42,702,032 | $64.55 | 69.4% |
| Other Income(3) | 7,507,780 | 7,717,265 | 7,842,263 | 8,182,721 | 12.37 | 13.3% |
| Potential Income from Vacant Space | 0 | 0 | 0 | 6,902,000 | 10.43 | 11.2% |
| Gross Potential Revenue | $48,100,800 | $51,060,178 | $52,501,081 | $61,511,882 | $92.98 | 100.0% |
| Total Reimbursements | 2,522,775 | 3,320,201 | 3,668,783 | 3,725,129 | $5.63 | 6.1% |
| (Vacancy/Credit Loss) | (968,281) | (195,262) | (336,103) | (6,902,000) | ($10.43) | (11.2%) |
| Effective Gross Income | $47,132,520 | $50,864,916 | $52,164,978 | $54,609,882 | $82.55 | 100.0% |
| Total Expenses | 15,521,713 | 16,294,726 | 16,537,821 | 17,099,493 | 25.85 | 31.3% |
| Net Operating Income | $31,610,806 | $34,570,190 | $35,627,157 | $37,510,389 | $56.70 | 68.7% |
| Total TI/LC, RR | 0 | 0 | 0 | 590,998 | $0.89 | 1.1% |
| Net Cash Flow | $31,610,806 | $34,570,190 | $35,627,157 | $36,919,391 | $55.81 | 67.6% |
| (1) | % column represents percent of Net Rental Income for all revenue lines and represents percent of Effective Gross Income for the remainder of the fields. |
| (2) | Underwritten Base Rent is based on the underwritten rent roll as of November 1, 2021. |
| (3) | Other income includes Conduit, Generator, Condenser Water, Fluid Chiller, Junction Box, Roof & Antenna, Meet-Me-Room, Parking and Storage. |
Property Management. The One Wilshire Property is managed by GI Property Manager (CA) Inc., a Delaware corporation.
Escrows and Reserves. At loan origination, the borrower was not require to deposit reserves.
Tax Reserve - The borrower is required to deposit into a real estate tax reserve, on a monthly basis, 1/12th of the reasonably estimated annual real estate taxes unless the borrower timely pays such taxes and promptly provides to the lender evidence of such payment reasonably acceptable to the lender and there is no continuing material event of default for a period in excess of 30 or more consecutive days.
Insurance Reserve - The borrower is required to deposit into an insurance reserve, on a monthly basis, 1/12th of reasonably estimated insurance premiums unless the borrower maintains a blanket policy in accordance with the One Wilshire Whole Loan documents and the borrower provides proof of payment of the applicable insurance premiums.
Capital Expenditures Reserve - The borrower is required to deposit into a capital expenditures reserve during the continuance of a One Wilshire Cash Sweep Period (as defined below), an amount equal to approximately $9,923 for capital expenditures in accordance with the One Wilshire Whole Loan documents. Amounts are disbursed from the capital expenditures reserve for capitalized expenditures
THE INFORMATION IN THIS STRUCTURAL AND COLLATERAL TERM SHEET IS NOT COMPLETE AND MAY BE AMENDED PRIOR TO THE TIME OF SALE. THIS TERM SHEET IS NOT AN OFFER TO SELL THESE SECURITIES AND IT IS NOT A SOLICITATION OF AN OFFER TO BUY THESE SECURITIES IN ANY JURISDICTION WHERE THE OFFER OR SALE IS NOT PERMITTED.
86 of 158
| Structural and Collateral Term Sheet | Benchmark 2022-B32 | |
| One Wilshire | ||
(including expenditures for building improvements or major repairs, leasing commissions and tenant improvements) at the One Wilshire Property in accordance with the One Wilshire Whole Loan documents.
CoreSite Funds Reserve - Within 30 days after a binding decision is made in relation to the pending arbitration with tenant CoreSite regarding certain disputed prior CAM charges of approximately $1.8 million, the Borrower is required to (i) provide the lender with written evidence of such decision and (ii) to the extent the annual underwritable cash flow is less than the origination date net operating income (“NOI”) as of such date as a result of the decision from the related arbitration or any amendments to the leases entered with CoreSite as a consequence of the decision from the related arbitration, deposit with the lender into a CoreSite funds reserve an amount equivalent to the difference between the CoreSite underwritten annual expense reimbursements and the amount of any reduced annual expense reimbursements to be paid by CoreSite for the immediately subsequent 12 month period under the terms of its leases (the "Required Minimum Balance"). To the extent the amount of annual expense reimbursements to be paid by CoreSite are subject to adjustment under the terms of its leases, the borrower agrees to deposit with the lender within thirty 30 days of any adjustment any shortfall such that the balance maintained in the CoreSite funds reserve is always equal to Required Minimum Balance.
Operating Expense Funds Reserve - The borrower is required to deposit into an operating expense funds reserve during the continuance of a One Wilshire Cash Sweep Period, an amount equal to the aggregate amount of approved operating expenses and approved extraordinary expenses to be incurred by the borrower for the then current interest period in accordance with the One Wilshire Whole Loan documents. The lender is required to disburse the operating expense funds to the borrower to pay approved operating expenses and approved extraordinary expenses upon the borrower's request (which such request must be accompanied by an officer's certificate detailing the applicable expenses to which the requested disbursement relates and attesting that such expense will be paid with the requested disbursement).
Lease Sweep Reserve - The borrower is required to deposit into a lease sweep reserve during the continuance of a One Wilshire Cash Sweep Period, an amount equal to approximately $41,347 for leasing expenses in accordance with the One Wilshire Whole Loan documents. Amounts are disbursed from the lease sweep reserve for leasing space at the One Wilshire Property pursuant to leases entered into in accordance with the One Wilshire Whole Loan documents, including leasing commissions, concessions and improvements in accordance with the One Wilshire Whole Loan documents.
Excess Cash Flow Reserve - The borrower is required to deposit into an excess cash flow reserve during the continuance of a One Wilshire Cash Sweep Period, any excess cash flow in accordance with the One Wilshire Whole Loan documents. Amounts are disbursed from the excess cash flow reserve in accordance with the One Wilshire Whole Loan documents.
A "One Wilshire Cash Sweep Period" means a period (i) commencing upon any of (a) the occurrence and continuance of an event of default, (b) the debt yield falls below 7.0% as of the end of any fiscal quarter (each, a "Debt Yield Cash Sweep Trigger Event"), or (c) the exercise of the extension option; and (ii) expiring upon (x) with regard to any One Wilshire Cash Sweep Period commenced in connection with clause (a) above, the cure or waiver (if applicable) of such event of default, (y) with regard to any One Wilshire Cash Sweep Period commenced in connection with clause (b) above, at such time as the debt yield has equaled or exceeded 7.0% for two (2) consecutive fiscal quarters or, to the extent the borrower provides evidence that the sole reason a Debt Yield Cash Sweep Trigger Event occurs is a vacating data center underwriting adjustment or a vacating non-data center underwriting adjustment, each as more particularly described in the One Wilshire Whole Loan documents, the amount of funds deposited in the excess cash flow account as a result of the related Debt Yield Cash Sweep Trigger Event is equal to the applicable Excess Cash Flow Account Threshold Amount (as defined below) or (z) with regard to any One Wilshire Cash Sweep Period commenced in connection with clause (c) above, the payment in fully of the outstanding debt. Notwithstanding the foregoing, a One Wilshire Cash Sweep Period will not be deemed to expire in the event that a One Wilshire Cash Sweep Period then exists for any other reason.
"Excess Cash Flow Account Threshold Amount" means, (i) in the case of a vacating data center underwriting adjustment, $15.00 times the rentable square feet of the leased premises which is subject to a lease which caused the related vacating data center underwriting adjustment, and (ii) in the case of a vacating non-data center underwriting adjustment, $75.00 times the rentable square feet of the leased premises which is subject to a lease which caused the related vacating non-data center underwriting adjustment.
Lockbox / Cash Management. The One Wilshire Whole Loan is structured with a hard lockbox and springing cash management. The borrower was required to direct each tenant to remit all rents directly to a lender-controlled lockbox account. In addition, the borrower is required to cause all cash revenues relating to the One Wilshire Property and all other money received by the borrower or the property manager with respect to The One Wilshire Property to be deposited into the lockbox account within two business days of receipt. On each business day during the continuance of a One Wilshire Cash Sweep Period under the One Wilshire Whole Loan, all amounts in the lockbox account are required to be remitted to the cash management account. To the extent no One Wilshire Cash Sweep Period is continuing, all funds in the lockbox account are required to be transferred to the borrower’s operating account.
Prior to the ARD, on each due date during the continuance of a One Wilshire Cash Sweep Period under the One Wilshire Whole Loan, all funds on deposit in the cash management account after the application of such funds in accordance with the One Wilshire Whole Loan documents are required to be held by the lender in the excess cash flow reserve as additional collateral for the One Wilshire Loan and disbursed in accordance with the One Wilshire Whole Loan documents. If the One Wilshire Whole Loan is not paid by the ARD, from and after the ARD, the One Wilshire Whole Loan will accrue interest at the Adjusted Interest Rate; however, interest accrued at the excess of the Adjusted Interest Rate over the initial interest rate will be deferred. After the ARD, all amounts on deposit in the cash management
THE INFORMATION IN THIS STRUCTURAL AND COLLATERAL TERM SHEET IS NOT COMPLETE AND MAY BE AMENDED PRIOR TO THE TIME OF SALE. THIS TERM SHEET IS NOT AN OFFER TO SELL THESE SECURITIES AND IT IS NOT A SOLICITATION OF AN OFFER TO BUY THESE SECURITIES IN ANY JURISDICTION WHERE THE OFFER OR SALE IS NOT PERMITTED.
87 of 158
| Structural and Collateral Term Sheet | Benchmark 2022-B32 | |
| One Wilshire | ||
account after payment of debt service, required reserves and budgeted operating expenses will be required to be applied to the prepayment of the outstanding principal balance of the One Wilshire Whole Loan, until the outstanding principal balance has been reduced to zero, then to any excess interest until the excess interest has been reduced to zero and then to any other indebtedness due under the One Wilshire Whole Loan until the other indebtedness has been reduced to zero.
Current Mezzanine or Subordinate Indebtedness. None.
Future Mezzanine or Subordinate Indebtedness Permitted. None.
Partial Release. Not permitted.
THE INFORMATION IN THIS STRUCTURAL AND COLLATERAL TERM SHEET IS NOT COMPLETE AND MAY BE AMENDED PRIOR TO THE TIME OF SALE. THIS TERM SHEET IS NOT AN OFFER TO SELL THESE SECURITIES AND IT IS NOT A SOLICITATION OF AN OFFER TO BUY THESE SECURITIES IN ANY JURISDICTION WHERE THE OFFER OR SALE IS NOT PERMITTED.
88 of 158
(THIS PAGE INTENTIONALLY LEFT BLANK)
THE INFORMATION IN THIS STRUCTURAL AND COLLATERAL TERM SHEET IS NOT COMPLETE AND MAY BE AMENDED PRIOR TO THE TIME OF SALE. THIS TERM SHEET IS NOT AN OFFER TO SELL THESE SECURITIES AND IT IS NOT A SOLICITATION OF AN OFFER TO BUY THESE SECURITIES IN ANY JURISDICTION WHERE THE OFFER OR SALE IS NOT PERMITTED.
89 of 158
| Structural and Collateral Term Sheet | Benchmark 2022-B32 | |
| SVEA New Mexico Portfolio | ||
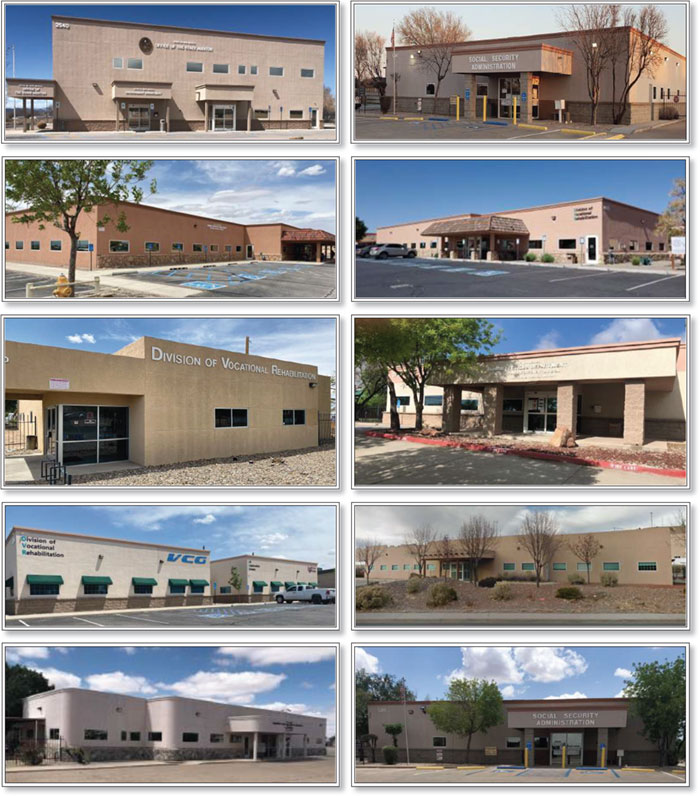
THE INFORMATION IN THIS STRUCTURAL AND COLLATERAL TERM SHEET IS NOT COMPLETE AND MAY BE AMENDED PRIOR TO THE TIME OF SALE. THIS TERM SHEET IS NOT AN OFFER TO SELL THESE SECURITIES AND IT IS NOT A SOLICITATION OF AN OFFER TO BUY THESE SECURITIES IN ANY JURISDICTION WHERE THE OFFER OR SALE IS NOT PERMITTED.
90 of 158
| Structural and Collateral Term Sheet | Benchmark 2022-B32 | |
| SVEA New Mexico Portfolio | ||

THE INFORMATION IN THIS STRUCTURAL AND COLLATERAL TERM SHEET IS NOT COMPLETE AND MAY BE AMENDED PRIOR TO THE TIME OF SALE. THIS TERM SHEET IS NOT AN OFFER TO SELL THESE SECURITIES AND IT IS NOT A SOLICITATION OF AN OFFER TO BUY THESE SECURITIES IN ANY JURISDICTION WHERE THE OFFER OR SALE IS NOT PERMITTED.
91 of 158
| Structural and Collateral Term Sheet | Benchmark 2022-B32 | |
| SVEA New Mexico Portfolio | ||
| Mortgage Loan Information | Property Information | |||
| Mortgage Loan Seller: | GACC | Single Asset / Portfolio: | Portfolio | |
| Original Principal Balance: | $78,550,000 | Title: | Fee | |
| Cut-off Date Principal Balance: | $78,550,000 | Property Type - Subtype: | Office – Suburban | |
| % of Pool by IPB: | 4.4% | Net Rentable Area (SF): | 652,850 | |
| Loan Purpose: | Acquisition | Location(1): | Various, NM | |
| Borrower: | SPONM DB LLC | Year Built / Renovated(1): | Various / NAP | |
| Guarantor: | SVEA Real Estate Group, LLC | Occupancy: | 97.2% | |
| Interest Rate: | 3.80700% | Occupancy Date: | 1/5/2022 | |
| Note Date: | 1/5/2022 | Number of Tenants: | 21 | |
| Maturity Date: | 1/6/2032 | Fourth Most Recent NOI: | $9,655,004 (December 31, 2018) | |
| Interest-only Period: | 120 months | Third Most Recent NOI: | $9,723,143 (December 31, 2019) | |
| Original Term: | 120 months | Second Most Recent NOI: | $10,416,305 (December 31, 2020) | |
| Original Amortization: | None | Most Recent NOI: | $10,128,341 (TTM October 31, 2021) | |
| Amortization Type: | Interest Only | UW Economic Occupancy: | 95.0% | |
| Call Protection: | L(25),D(90),O(5) | UW Revenues: | $13,459,517 | |
| Lockbox / Cash Management: | Hard / Springing | UW Expenses: | $3,743,620 | |
| Additional Debt: | N/A | UW NOI: | $9,715,898 | |
| Additional Debt Balance: | N/A | UW NCF: | $8,929,187 | |
| Additional Debt Type: | N/A | Appraised Value / Per SF: | $120,890,000 / $185 | |
| Appraisal Date: | 10/20/2021 | |||
| Escrows and Reserves(2) | Financial Information | |||||
| Initial | Monthly | Initial Cap | Cut-off Date Loan / SF: | $120 | ||
| Taxes: | $172,088 | $57,363 | N/A | Maturity Date Loan / SF: | $120 | |
| Insurance: | $18,166 | $18,166 | N/A | Cut-off Date LTV: | 65.0% | |
| Replacement Reserves: | $0 | $22,306 | $1,070,688 | Maturity Date LTV: | 65.0% | |
| TI/LC: | $500,000 | Springing | $7,834,197 | UW NCF DSCR: | 2.95x | |
| Other: | $571,303 | $0 | N/A | UW NOI Debt Yield: | 12.4% | |
| Sources and Uses | ||||||
| Sources | Proceeds | % of Total | Uses | Proceeds | % of Total | |
| Loan Amount | $78,550,000 | 63.5% | Purchase Price | $119,082,570 | 96.2% | |
| Sponsor Equity | 45,191,725 | 36.5 | Closing Costs | 3,397,597 | 2.7 | |
| Upfront Reserves | 1,261,558 | 1.0 | ||||
| Total Sources | $123,741,725 | 100.0% | Total Uses | $123,741,725 | 100.0% | |
| (1) | See “Portfolio Summary” table herein. |
| (2) | For a full description of Escrows and Reserves, please refer to “Escrows and Reserves” herein. |
The Loan. The SVEA New Mexico Portfolio mortgage loan (the “SVEA New Mexico Portfolio Loan”) is secured by the borrower’s fee interests in a portfolio of 40 suburban office properties totaling 652,850 square feet located across New Mexico (the “SVEA New Mexico Portfolio Properties”). The SVEA New Mexico Portfolio Loan was originated by DBR Investments Co. Limited on January 5, 2022 and accrues interest at 3.80700% per annum. The SVEA New Mexico Portfolio Loan has a 10-year term and is interest only for the entire term.
The Borrower. The borrower is SPONM DB LLC, a Delaware limited liability company with two independent directors. Legal counsel to the borrower delivered a non-consolidation opinion in connection with the origination of the SVEA New Mexico Portfolio Loan. The borrowing entity is owned by SPONM Holdings LLC, a Texas limited liability company (“Sole Member”) and managed by Harry J. Kuper Jr. SVEA NM LLC, a Texas limited liability company, along with two other equity partners, Goodland, LLC (36.9%) and CrowdOut Nuevo LLC (31.9%), own the Sole Member. SVEA NM LLC is 100% owned by SVEA Real Estate Group, LLC.
The Loan Sponsor. The loan sponsor and non-recourse carve-out guarantor is SVEA Real Estate Group, LLC. SVEA Real Estate Group, LLC is 100% indirectly owned by Netherlands entity, Dorco International B.V., which is 100% owned by Mikael Andersson, a citizen of Sweden. SVEA Real Estate Group, LLC, a Delaware limited liability company, is the American company in his portfolio which owns 49
THE INFORMATION IN THIS STRUCTURAL AND COLLATERAL TERM SHEET IS NOT COMPLETE AND MAY BE AMENDED PRIOR TO THE TIME OF SALE. THIS TERM SHEET IS NOT AN OFFER TO SELL THESE SECURITIES AND IT IS NOT A SOLICITATION OF AN OFFER TO BUY THESE SECURITIES IN ANY JURISDICTION WHERE THE OFFER OR SALE IS NOT PERMITTED.
92 of 158
| Structural and Collateral Term Sheet | Benchmark 2022-B32 | |
| SVEA New Mexico Portfolio | ||
total commercial and residential properties totaling approximately 597,000 square feet, which is not inclusive of the SVEA New Mexico Portfolio Properties.
The Properties. The SVEA New Mexico Portfolio Properties consists of 40 suburban office buildings totaling 652,850 square feet located across New Mexico. The SVEA New Mexico Portfolio Properties were built between 1997 and 2009 and range from 4,241 to 44,623 square feet, with an average size of 16,321 square feet. No single property accounts for more than 6.8% of the net rentable area and no property accounts for more than 8.3% of the UW base rent.
As of January 5, 2022, the SVEA New Mexico Portfolio Properties were 97.2% occupied by 21 tenants, with government tenants accounting for 91.8% of the net rentable area and 96.2% of the UW base rent. Within the SVEA New Mexico Portfolio, 86.7% of the net rentable area is leased to the State of New Mexico (Moody’s: Aa2; S&P: AA) and 5.1% of the net rentable area is leased to the United States General Services Administration (Moody’s: Aaa; Fitch: AAA; S&P: AA+).
THE INFORMATION IN THIS STRUCTURAL AND COLLATERAL TERM SHEET IS NOT COMPLETE AND MAY BE AMENDED PRIOR TO THE TIME OF SALE. THIS TERM SHEET IS NOT AN OFFER TO SELL THESE SECURITIES AND IT IS NOT A SOLICITATION OF AN OFFER TO BUY THESE SECURITIES IN ANY JURISDICTION WHERE THE OFFER OR SALE IS NOT PERMITTED.
93 of 158
| Structural and Collateral Term Sheet | Benchmark 2022-B32 | |
| SVEA New Mexico Portfolio | ||
The following table presents certain information relating to the SVEA New Mexico Portfolio Properties:
| Portfolio Summary | |||||||||
| Property Name | City | Year Built | SF | Occupancy | ALA | % of ALA | Appraised Value | UW Base Rent | % of UW Base Rent |
| 39 Plaza La Prensa | Santa Fe | 2001 | 38,493 | 98.7% | $6,302,713 | 8.0% | $9,700,000 | $1,145,157 | 8.3% |
| 1711 Randolph Road Southeast | Albuquerque | 2003 | 28,946 | 100.0% | $4,463,880 | 5.7% | 6,870,000 | $679,076 | 4.9% |
| 1920 Fifth Street | Santa Fe | 2004 | 29,269 | 100.0% | $4,190,979 | 5.3% | 6,450,000 | $705,383 | 5.1% |
| 445 Camino Del Rey Southwest | Los Lunas | 2002 | 44,623 | 100.0% | $4,190,979 | 5.3% | 6,450,000 | $750,264 | 5.5% |
| 3280 Bridge Boulevard Southwest | Albuquerque | 2000 | 35,032 | 100.0% | $3,768,633 | 4.8% | 5,800,000 | $594,713 | 4.3% |
| 37 Plaza La Prensa | Santa Fe | 2002 | 21,364 | 100.0% | $3,417,760 | 4.4% | 5,260,000 | $644,074 | 4.7% |
| 4363 Jager Drive Northeast | Rio Rancho | 2007 | 24,465 | 97.4% | $3,378,774 | 4.3% | 5,200,000 | $545,005 | 4.0% |
| 655 Utah Avenue | Las Cruces | 2002 | 21,871 | 100.0% | $3,346,286 | 4.3% | 5,150,000 | $629,243 | 4.6% |
| 2536 Ridge Runner Road | Las Vegas | 2001 | 25,061 | 100.0% | $2,813,479 | 3.6% | 4,330,000 | $566,278 | 4.1% |
| 653 Utah Avenue | Las Cruces | 2009 | 22,611 | 100.0% | $2,605,555 | 3.3% | 4,010,000 | $424,219 | 3.1% |
| 4359 Jager Drive Northeast | Rio Rancho | 1999 | 23,008 | 100.0% | $2,560,071 | 3.3% | 3,940,000 | $392,340 | 2.9% |
| 221 Llano Estacado | Clovis | 1997 | 21,412 | 96.6% | $2,241,687 | 2.9% | 3,450,000 | $389,683 | 2.8% |
| 1308 Gusdorf Road | Taos | 2004 | 16,512 | 100.0% | $2,046,757 | 2.6% | 3,150,000 | $343,938 | 2.5% |
| 2540 Camino Ortiz | Santa Fe | 2002 | 17,319 | 100.0% | $1,988,279 | 2.5% | 3,060,000 | $421,903 | 3.1% |
| 5500 San Antonio Drive Northeast | Albuquerque | 2004 | 20,017 | 100.0% | $1,949,293 | 2.5% | 3,000,000 | $328,895 | 2.4% |
| 2121 Summit Court | Las Cruces | 2007 | 12,774 | 100.0% | $1,936,297 | 2.5% | 2,980,000 | $377,705 | 2.7% |
| 2732 North Wilshire Boulevard | Roswell | 2007 | 11,612 | 97.2% | $1,864,823 | 2.4% | 2,870,000 | $313,917 | 2.3% |
| 41 Plaza La Prensa | Santa Fe | 2008 | 12,912 | 100.0% | $1,806,345 | 2.3% | 2,780,000 | $298,429 | 2.2% |
| 2800 Farmington Avenue | Farmington | 1999 | 14,000 | 100.0% | $1,793,349 | 2.3% | 2,760,000 | $304,371 | 2.2% |
| 1710 East Aztec Avenue | Gallup | 2006 | 13,168 | 97.7% | $1,741,368 | 2.2% | 2,680,000 | $313,241 | 2.3% |
| 5200 Oakland Avenue Northeast | Albuquerque | 2003 | 16,176 | 100.0% | $1,617,913 | 2.1% | 2,490,000 | $276,664 | 2.0% |
| 3316 North Main Street | Clovis | 2006 | 19,494 | 100.0% | $1,611,415 | 2.1% | 2,480,000 | $275,291 | 2.0% |
| 2141 Summit Court | Las Cruces | 2007 | 11,500 | 100.0% | $1,422,984 | 1.8% | 2,190,000 | $249,469 | 1.8% |
| 1014 North California Street | Socorro | 2003 | 10,241 | 100.0% | $1,416,486 | 1.8% | 2,180,000 | $243,776 | 1.8% |
| 912 Railroad Avenue | Espanola | 2005 | 16,099 | 74.1% | $1,319,021 | 1.7% | 2,030,000 | $281,016 | 2.0% |
| 1922 Fifth Street | Santa Fe | 2004 | 9,804 | 100.0% | $1,280,036 | 1.6% | 1,970,000 | $218,650 | 1.6% |
| 1017 East Roosevelt Avenue | Grants | 2001 | 9,742 | 100.0% | $1,202,064 | 1.5% | 1,850,000 | $222,048 | 1.6% |
| 145 Roy Road | Taos | 2007 | 13,771 | 94.1% | $1,202,064 | 1.5% | 1,850,000 | $240,461 | 1.7% |
| 1800 East 30th Street | Farmington | 2006 | 11,137 | 34.3% | $1,143,585 | 1.5% | 1,760,000 | $82,546 | 0.6% |
| 5205 Quail Road Northwest | Albuquerque | 2002 | 6,659 | 100.0% | $961,651 | 1.2% | 1,480,000 | $147,125 | 1.1% |
| 501 East Bender Boulevard | Hobbs | 2008 | 6,697 | 86.9% | $909,670 | 1.2% | 1,400,000 | $159,851 | 1.2% |
| 1233 Whittier Street | Raton | 2002 | 6,007 | 94.6% | $890,177 | 1.1% | 1,370,000 | $148,756 | 1.1% |
| 2520 Ridge Runner Road | Las Vegas | 2002 | 5,940 | 100.0% | $857,689 | 1.1% | 1,320,000 | $160,147 | 1.2% |
| 26387 US Highway 70 | Ruidoso Downs | 1998 | 12,907 | 100.0% | $857,689 | 1.1% | 1,320,000 | $165,440 | 1.2% |
| 475 Courthouse Road Southeast | Los Lunas | 2005 | 14,735 | 89.0% | $779,717 | 1.0% | 1,200,000 | $187,867 | 1.4% |
| 7905 Marble Avenue Northeast | Albuquerque | 2007 | 6,312 | 100.0% | $688,750 | 0.9% | 1,060,000 | $131,661 | 1.0% |
| 2215 West Main Street | Artesia | 2006 | 7,795 | 93.8% | $662,760 | 0.8% | 1,020,000 | $133,455 | 1.0% |
| 2522 Ridge Runner Road | Las Vegas | 2005 | 4,391 | 100.0% | $519,811 | 0.7% | 800,000 | $112,929 | 0.8% |
| 1710 Rio Bravo Boulevard Southwest | Albuquerque | 2004 | 4,733 | 100.0% | $493,821 | 0.6% | 760,000 | $88,412 | 0.6% |
| 312 East Nizhoni Boulevard | Gallup | 2004 | 4,241 | 92.4% | $305,389 | 0.4% | 470,000 | $67,020 | 0.5% |
| Total / Wtd. Avg. | 652,850 | 97.2% | $78,550,000 | 100.0% | $120,890,000 | $13,760,419 | 100.0% | ||
The top five tenants in the SVEA New Mexico Portfolio Properties are all government credit tenants, with the largest tenant being the State of New Mexico (86.7% of the NRA; Moody’s: Aa2, S&P: AA). The top four State of New Mexico agencies at the SVEA New Mexico Portfolio Properties are the following: NM Human Services Dept. (16 leases, 47.3% of total NRA), NM Children, Youth, & Families Dept. (“CYFD”; 10 leases, 22.6% of total NRA), NM Division of Vocational Rehab (six leases, 3.7% of total NRA), and NM Regulation & Licensing Dept. (one lease, 3.1% of total NRA). Included in the top tenants is GSA Social Security Admin (“SSA”; four leases, 5.1% of total NRA). Since 2011, the SVEA New Mexico Portfolio has had an average occupancy of 96.7%. The weighted average original lease term of the SVEA New Mexico Portfolio tenants is 16.2 years and the weighted average lease term as of the Cut-off Date is 4.2 years. Throughout the occupancy history of the SVEA New Mexico Portfolio, only 10 tenants have ever turned over with eight of those 10 tenants backfilled by switching from one state agency to another state agency.
THE INFORMATION IN THIS STRUCTURAL AND COLLATERAL TERM SHEET IS NOT COMPLETE AND MAY BE AMENDED PRIOR TO THE TIME OF SALE. THIS TERM SHEET IS NOT AN OFFER TO SELL THESE SECURITIES AND IT IS NOT A SOLICITATION OF AN OFFER TO BUY THESE SECURITIES IN ANY JURISDICTION WHERE THE OFFER OR SALE IS NOT PERMITTED.
94 of 158
| Structural and Collateral Term Sheet | Benchmark 2022-B32 | |
| SVEA New Mexico Portfolio | ||
COVID-19 Update. As of January 5, 2022, the SVEA New Mexico Portfolio Properties were open and operating. No rent relief has been requested. As of January 5, 2022, no loan modification or forbearance requests have been made on the SVEA New Mexico Portfolio Whole Loan. The first payment date of the SVEA New Mexico Portfolio Whole Loan is in February 2022. See “Risk Factors—Special Risks—Coronavirus Pandemic Has Adversely Affected the Global Economy and Will Likely Adversely Affect the Performance of the Mortgage Loans” in the Preliminary Prospectus.
The Market. The SVEA New Mexico Portfolio Properties are primarily located in four office markets: Albuquerque, Sante Fe, Las Cruces and Farmington.
The following table presents certain information relating to the SVEA New Mexico Portfolio Properties’ market statistics:
| Market Overview(1)(2) | ||||
| Market | NRA | Vacancy Rate | Market Rent | Net Absorption |
| Albuquerque | 38,675,892 | 6.7% | $17.47 | 146,800 |
| Santa Fe | 7,168,976 | 3.4% | $21.56 | 58,155 |
| Las Cruces | 4,375,703 | 6.7% | $18.45 | 42,418 |
| Farmington | 1,293,734 | 5.2% | $20.90 | 0 |
| (1) | Source: Appraisal. |
| (2) | Market statistics as of the third quarter of 2021. |
| Historical and Current Occupancy | |||
| 2018(1) | 2019(1) | 2020(1) | Current(2) |
| 96.0% | 96.0% | 96.0% | 97.2% |
| (1) | Historical Occupancies are as of December 31 of each respective year. |
| (2) | Current Occupancy is as of January 5, 2022. |
Tenant Summary(1) | |||||||
| Tenant | Building | Ratings | Net Rentable Area (SF) | % of | Base Rent PSF(3) | % of Total | Lease |
| Moody’s/Fitch/S&P(2) | Total NRA | Base Rent | Expiration Date | ||||
| NM Human Services Dept(3) | Various | Aa2 / NR / AA | 308,619 | 47.3% | $23.02 | 51.6% | Various |
| NM Children, Youth, & Families Dept(3) | Various | Aa2 / NR / AA | 147,257 | 22.6% | $20.69 | 22.1% | Various |
| Social Security Admin(4) | Various | Aaa / AAA / AA+ | 33,064 | 5.1% | $23.84 | 5.7% | Various |
| NM Division of Vocational Rehab(3) | Various | Aa2 / NR / AA | 23,844 | 3.7% | $19.31 | 3.3% | Various |
| NM Regulation & Licensing Dept(3) | 5500 San Antonio Dr. NE | Aa2 / NR / AA | 20,017 | 3.1% | $16.43 | 2.4% | 7/31/2025 |
| Valencia Shelter Services | 445 Camino Del Rey SW | NR / NR / NR | 13,763 | 2.1% | $15.25 | 1.5% | 8/31/2026 |
| NM Dept of Health(3) | Various | Aa2 / NR / AA | 13,233 | 2.0% | $25.13 | 2.4% | Various |
| NM Environment Dept(3) | Various | Aa2 / NR / AA | 13,225 | 2.0% | $20.17 | 1.9% | Various |
| NM State Investment Council(3) | 41 Plaza La Prensa | Aa2 / NR / AA | 12,912 | 2.0% | $23.11 | 2.2% | 7/31/2023 |
| NM Office of the State Auditor(3) | 2540 Camino Edward Ortiz | Aa2 / NR / AA | 9,362 | 1.4% | $23.20 | 1.6% | 8/14/2025 |
| Total/Wtd. Avg. | 595,296 | 91.2% | $21.93 | 94.9% | |||
| Other Occupied | 39,144 | 6.0% | $18.04 | 5.1% | |||
| Total Occupied | 634,440 | 97.2% | $21.69 | 100.0% | |||
| Vacant | 18,410 | 2.8% | |||||
| Total | 652,850 | 100.0% | |||||
| (1) | Based on the underwritten rent roll dated January 5, 2022. |
| (2) | In certain instances, ratings provided are those of the parent company or government of the entity shown, whether or not the parent company or government guarantees the lease. |
| (3) | The State of New Mexico leases will terminate prior to the end of the lease term, without penalty to the tenant and with 90 days’ notice to the landlord, upon the occurrence of one or more of the following events: (i) the New Mexico legislature fails to grant sufficient authority and appropriations to the tenant to carry out the terms and conditions of the lease, (ii) the governor of New Mexico, pursuant to executive order, or the New Mexico legislature, pursuant to statute, eliminates or transfers employees or functions of the tenant or (iii) the State of New Mexico builds a new building or purchases or otherwise acquires an existing building and includes space in such new or existing building for the tenant. |
| (4) | The tenant may terminate the following leases, in whole or in part, at any time effective after the firm term of the lease (as specified below), by providing not less than 90 days’ prior written notice to the landlord: (i) 2141 Summit Court property (February 17, 2026), (ii) 1922 Fifth Street property (January 31, 2029), (iii) 501 East Bender Boulevard property (November 30, 2032) and (iv) 2520 Ridge Runner Road (February 26, 2030). |
THE INFORMATION IN THIS STRUCTURAL AND COLLATERAL TERM SHEET IS NOT COMPLETE AND MAY BE AMENDED PRIOR TO THE TIME OF SALE. THIS TERM SHEET IS NOT AN OFFER TO SELL THESE SECURITIES AND IT IS NOT A SOLICITATION OF AN OFFER TO BUY THESE SECURITIES IN ANY JURISDICTION WHERE THE OFFER OR SALE IS NOT PERMITTED.
95 of 158
| Structural and Collateral Term Sheet | Benchmark 2022-B32 | |
| SVEA New Mexico Portfolio | ||
| Lease Rollover Schedule(1)(2) | |||||||||||
| Year | Number of Leases Expiring | Net Rentable Area Expiring | % of NRA Expiring | Base Rent Expiring | % of Base Rent Expiring | Cumulative Net Rentable Area Expiring | Cumulative % of NRA Expiring | Cumulative Base Rent Expiring | Cumulative % of Base Rent Expiring | ||
| Vacant | NAP | 18,410 | 2.8% | NAP | NAP | 18,410 | 2.8% | NAP | NAP | ||
| MTM & 2022 | 11 | 85,322 | 13.1% | $2,116,948 | 15.4% | 103,732 | 15.9% | $2,116,948 | 15.4% | ||
| 2023 | 8 | 131,915 | 20.2% | 3,474,367 | 25.2% | 235,646 | 36.1% | $5,591,316 | 40.6% | ||
| 2024 | 5 | 21,441 | 3.3% | 451,359 | 3.3% | 257,087 | 39.4% | $6,042,675 | 43.9% | ||
| 2025 | 4 | 51,863 | 7.9% | 859,832 | 6.2% | 308,950 | 47.3% | $6,902,507 | 50.2% | ||
| 2026 | 5 | 45,892 | 7.0% | 805,524 | 5.9% | 354,842 | 54.4% | $7,708,032 | 56.0% | ||
| 2027 | 8 | 139,518 | 21.4% | 2,644,634 | 19.2% | 494,360 | 75.7% | $10,352,665 | 75.2% | ||
| 2028 | 4 | 30,461 | 4.7% | 657,904 | 4.8% | 524,821 | 80.4% | $11,010,569 | 80.0% | ||
| 2029 | 9 | 65,088 | 10.0% | 1,344,798 | 9.8% | 589,909 | 90.4% | $12,355,367 | 89.8% | ||
| 2030 | 5 | 42,168 | 6.5% | 911,891 | 6.6% | 632,077 | 96.8% | $13,267,258 | 96.4% | ||
| 2031 | 3 | 14,953 | 2.3% | 333,310 | 2.4% | 647,030 | 99.1% | $13,600,568 | 98.8% | ||
| 2032 and Thereafter | 1 | 5,820 | 0.9% | 159,851 | 1.2% | 652,850 | 100.0% | $13,760,419 | 100.0% | ||
| Total | 63 | 652,850 | 100.0% | $13,760,419 | 100.0% | ||||||
| (1) | Based on the underwritten rent roll dated January 5, 2022. |
| (2) | Certain tenants may have termination or contraction options (which may become exercisable prior to the originally stated expiration date of the tenant lease) that are not considered in the above Lease Rollover Schedule. |
| Operating History and Underwritten Net Cash Flow | |||||||
| 2018 | 2019 | 2020 | TTM 10/31/2021 | Underwritten | Per Square Foot | %(1) | |
| Base Rent(2) | $13,183,721 | $13,372,993 | $13,731,039 | $13,639,089 | $13,760,419 | $21.08 | 97.1% |
| Rent Steps(3) | 0 | 0 | 0 | 0 | 12,747 | $0.02 | 0.1% |
| Potential Income from Vacant Space | 0 | 0 | 0 | 0 | 394,747 | $0.60 | 2.8% |
| Gross Potential Rent | $13,183,721 | $13,372,993 | $13,731,039 | $13,639,089 | $14,167,913 | $21.70 | 100.0% |
| Total Reimbursements | 0 | 0 | 0 | 0 | 0 | $0.00 | 0.0% |
| Total Other Income | 0 | 0 | 0 | 0 | 0 | $0.00 | 0.0% |
| Net Rental Income | $13,183,721 | $13,372,993 | $13,731,039 | $13,639,089 | $14,167,913 | $21.70 | 100.0% |
| (Vacancy/Credit Loss) | 0 | 0 | 0 | 0 | (708,396) | ($1.09) | (5.0%) |
| Effective Gross Income | $13,183,721 | $13,372,993 | $13,731,039 | $13,639,089 | $13,459,517 | $20.62 | 95.0% |
| Total Expenses | 3,528,717 | 3,649,850 | 3,314,734 | 3,510,748 | 3,743,620 | $5.73 | 27.8% |
| Net Operating Income | $9,655,004 | $9,723,143 | $10,416,305 | $10,128,341 | $9,715,898 | $14.88 | 72.2% |
| TI/LC | 0 | 0 | 0 | 0 | 519,043 | $0.80 | 3.9% |
| Capital Expenditures | 0 | 0 | 0 | 0 | 267,668 | $0.41 | 2.0% |
| Net Cash Flow | $9,655,004 | $9,723,143 | $10,416,305 | $10,128,341 | $8,929,187 | $13.68 | 66.3% |
| (1) | % column represents percent of Net Rental Income for all revenue lines and represents percent of Effective Gross Income for the remainder of the fields. |
| (2) | Underwritten Base Rent is based on the underwritten rent roll as of January 5, 2022. |
| (3) | Rent steps underwritten through November 2022. |
THE INFORMATION IN THIS STRUCTURAL AND COLLATERAL TERM SHEET IS NOT COMPLETE AND MAY BE AMENDED PRIOR TO THE TIME OF SALE. THIS TERM SHEET IS NOT AN OFFER TO SELL THESE SECURITIES AND IT IS NOT A SOLICITATION OF AN OFFER TO BUY THESE SECURITIES IN ANY JURISDICTION WHERE THE OFFER OR SALE IS NOT PERMITTED.
96 of 158
| Structural and Collateral Term Sheet | Benchmark 2022-B32 | |
| SVEA New Mexico Portfolio | ||
Property Management. The SVEA New Mexico Portfolio Properties are managed by SPONM Management LLC, an affiliate of the borrower.
Escrows and Reserves. At loan origination, the borrower deposited (i) approximately $172,088 into a real estate taxes reserve, (ii) approximately $18,166 into an insurance reserve, (iii) approximately $500,000 into a general leasing reserve, (iv) $492,473 into a reserve for current landlord leasing obligations and (v) $78,830 into an immediate repairs reserve.
Tax Reserve – The borrower is required to deposit into a real estate tax reserve, on a monthly basis, 1/12th of the estimated annual real estate taxes (initially estimated at approximately $57,363).
Insurance Reserve – The borrower is required to deposit into an insurance reserve, on a monthly basis, 1/12th of the estimated annual insurance premiums (initially estimated at approximately $18,166).
Replacement Reserve – The borrower is required to deposit into a replacement reserve, on a monthly basis, an amount equal to approximately $22,306 for replacement reserves, subject to a cap of $1,070,688. The borrower may post a letter of credit in an amount equal to the replacement reserve cap in lieu of the reserve.
TI/LC Reserve – The borrower is required to deposit into a rollover reserve, on a monthly basis, (i) if the debt service coverage ratio is below 1.80x, $68,005 and (ii) if the debt service coverage ratio is below 1.55x, $163,212, in each case subject to a cap of $7,834,197. The borrower may post a letter of credit in an amount equal to the TI/LC reserve cap in lieu of the reserve.
Lockbox / Cash Management. The SVEA New Mexico Portfolio Loan is structured with a hard lockbox and springing cash management. The borrower was required to cause all gross revenues to be transmitted directly by tenants of the SVEA New Mexico Portfolio into the lockbox account. All funds deposited into the lockbox account are required to be transferred on each business day to or at the direction of the borrower unless a Trigger Period (as defined below) exists. During the continuance of a Trigger Period, all funds in the lockbox account are required to be swept on each business day to a cash management account under the control of the lender to be applied and disbursed in accordance with the SVEA New Mexico Portfolio Loan documents to pay debt service on the SVEA New Mexico Portfolio Loan, required reserves and operating expenses, and all excess cash flow funds remaining in the cash management account after such application of funds are required to be held by the lender in an excess cash flow reserve account as additional collateral for the SVEA New Mexico Portfolio Loan during such Trigger Period.
A “Trigger Period” means a period (A) commencing upon the earliest to occur of (i) an event of default, (ii) the debt service coverage ratio falling below 1.25x for any calendar quarter, (iii) for so long as an approved mezzanine loan is outstanding or (iv) if the manager is an affiliate of the borrower and becomes insolvent or bankrupt and (B) expiring upon (1) with regard to any Trigger Period commenced in connection with clause (i) above, the cure (if applicable) of such event of default, (2) with regard to any Trigger Period commenced in connection with clause (ii) above, the date that the debt service coverage ratio is equal to or greater than 1.30x for two calendar quarters, (3) with regard to any Trigger Period commenced in connection with clause (iii) above, the mezzanine loan is no longer outstanding and (4) with regard to any Trigger Period commenced in connection with clause (iv) above, the manager is replaced with an unaffiliated qualified manager approved by lender.
Current Mezzanine or Subordinate Indebtedness. None.
Future Mezzanine or Subordinate Indebtedness Permitted. The related loan documents permit future mezzanine financing, subject to satisfaction of certain conditions, including among others, such mezzanine debt (i) is not in excess of $15.0 million, (ii) is subject to an intercreditor agreement acceptable to the lender, (iii) as of the date of its incurrence, does not cause the debt service coverage ratio to be less than 1.97x or the debt yield to be less than 11.0%, (iv) as of the date of its incurrence, does not cause the aggregate loan-to-value ratio, to be greater than 64.97% and (v) will be interest only and coterminous with the SVEA New Mexico Portfolio Loan. See “Description of the Mortgage Pool—Additional Indebtedness— Mezzanine Indebtedness” in the Preliminary Prospectus.
Partial Release. On any day upon not less than 30 days’ written notice, the borrower may obtain the release of a Release Parcel (as defined below), upon, but not limited to, the following conditions: (i) no event of default is continuing, (ii) the Release Parcel must be vacant and non-income producing land, (iii) the borrower must obtain a subdivision of the applicable property such that the applicable Release Parcel is a legally subdivided parcel from the applicable remaining property, (iv) with respect to the Bridge Boulevard Release Parcel (as defined below), the borrower must defease an amount of principal equal to $121,492 and satisfy the conditions in the loan documents to a defeasance, (v) with respect to the Grants Release Parcel (as defined below), (x) the borrower has delivered evidence that prior to the date of the proposed release 10 additional parking spaces are striped on the proposed remaining property to be legally conforming and/or (y) the borrower has obtained a variance or other approval for the Grants property from the applicable governmental authority causing the Grants property (excluding any parking spaces located on the Grants Release Parcel) to be legal conforming as to parking under applicable legal requirements and such variance or other approval must run with the land and (vi) satisfaction of REMIC related conditions.
THE INFORMATION IN THIS STRUCTURAL AND COLLATERAL TERM SHEET IS NOT COMPLETE AND MAY BE AMENDED PRIOR TO THE TIME OF SALE. THIS TERM SHEET IS NOT AN OFFER TO SELL THESE SECURITIES AND IT IS NOT A SOLICITATION OF AN OFFER TO BUY THESE SECURITIES IN ANY JURISDICTION WHERE THE OFFER OR SALE IS NOT PERMITTED.
97 of 158
| Structural and Collateral Term Sheet | Benchmark 2022-B32 | |
| SVEA New Mexico Portfolio | ||
A “Release Parcel” means (i) a portion of the 2520 Ridge Runner Road property to be reasonably approved by the lender, which consists of no more than 0.09 acres as depicted on a schedule to the loan agreement, (ii) a portion of the 3280 Bridge Boulevard Southwest property to be reasonably approved by the lender, which consists of no more than 2.72 acres as depicted on a schedule to the loan agreement (“Bridge Boulevard Release Parcel”) and (iii) a portion of the 1017 East Roosevelt Avenue property to be reasonably approved by the lender, which consists of no more than 0.30 acres as depicted on a schedule to the loan agreement (“Grants Release Parcel”).
THE INFORMATION IN THIS STRUCTURAL AND COLLATERAL TERM SHEET IS NOT COMPLETE AND MAY BE AMENDED PRIOR TO THE TIME OF SALE. THIS TERM SHEET IS NOT AN OFFER TO SELL THESE SECURITIES AND IT IS NOT A SOLICITATION OF AN OFFER TO BUY THESE SECURITIES IN ANY JURISDICTION WHERE THE OFFER OR SALE IS NOT PERMITTED.
98 of 158
(THIS PAGE INTENTIONALLY LEFT BLANK)
THE INFORMATION IN THIS STRUCTURAL AND COLLATERAL TERM SHEET IS NOT COMPLETE AND MAY BE AMENDED PRIOR TO THE TIME OF SALE. THIS TERM SHEET IS NOT AN OFFER TO SELL THESE SECURITIES AND IT IS NOT A SOLICITATION OF AN OFFER TO BUY THESE SECURITIES IN ANY JURISDICTION WHERE THE OFFER OR SALE IS NOT PERMITTED.
99 of 158
| Structural and Collateral Term Sheet | Benchmark 2022-B32 | |
| JW Marriott Desert Springs | ||

THE INFORMATION IN THIS STRUCTURAL AND COLLATERAL TERM SHEET IS NOT COMPLETE AND MAY BE AMENDED PRIOR TO THE TIME OF SALE. THIS TERM SHEET IS NOT AN OFFER TO SELL THESE SECURITIES AND IT IS NOT A SOLICITATION OF AN OFFER TO BUY THESE SECURITIES IN ANY JURISDICTION WHERE THE OFFER OR SALE IS NOT PERMITTED.
100 of 158
| Structural and Collateral Term Sheet | Benchmark 2022-B32 | |
| JW Marriott Desert Springs | ||
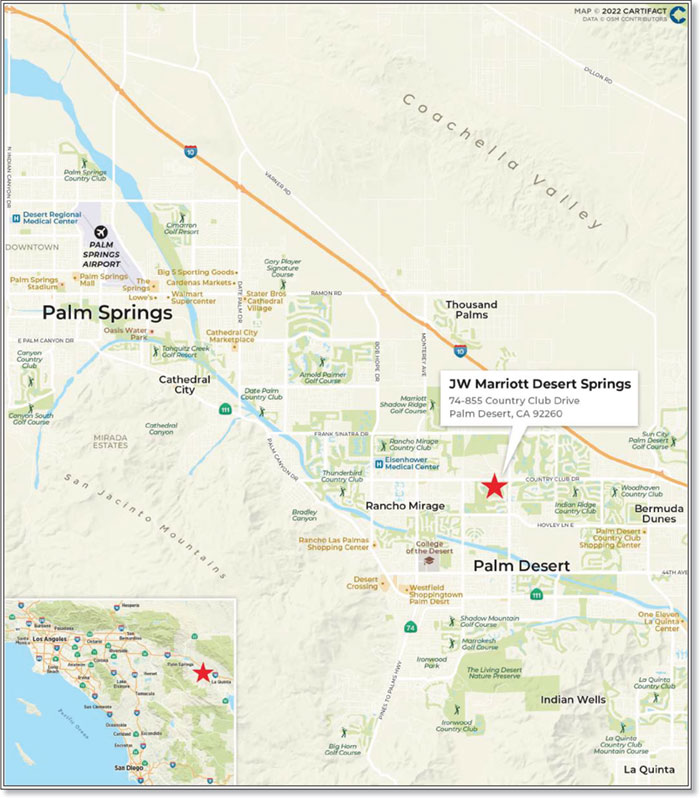
THE INFORMATION IN THIS STRUCTURAL AND COLLATERAL TERM SHEET IS NOT COMPLETE AND MAY BE AMENDED PRIOR TO THE TIME OF SALE. THIS TERM SHEET IS NOT AN OFFER TO SELL THESE SECURITIES AND IT IS NOT A SOLICITATION OF AN OFFER TO BUY THESE SECURITIES IN ANY JURISDICTION WHERE THE OFFER OR SALE IS NOT PERMITTED.
101 of 158
| Structural and Collateral Term Sheet | Benchmark 2022-B32 | |
| JW Marriott Desert Springs | ||
| Mortgage Loan Information | Property Information | |||
| Mortgage Loan Seller: | GSMC | Single Asset / Portfolio: | Single Asset | |
| Original Principal Balance(1): | $75,000,000 | Title: | Fee / Leasehold | |
| Cut-off Date Principal Balance(1): | $75,000,000 | Property Type - Subtype: | Hospitality – Full Service | |
| % of Pool by IPB: | 4.2% | Net Rentable Area (Rooms): | 884 | |
| Loan Purpose: | Refinance | Location: | Palm Desert, CA | |
| Borrower: | Newage Desert Springs, LLC | Year Built / Renovated: | 1987 / 2019 | |
| Guarantor: | Tiffany Lam | Occupancy: | 36.8% | |
| Interest Rate: | 4.99500% | Occupancy Date: | 12/31/2021 | |
| Note Date: | 12/22/2021 | Number of Tenants: | NAP | |
| Maturity Date: | 1/6/2027 | Fourth Most Recent NOI: | $23,174,262 (December 31, 2018) | |
| Interest-only Period: | 60 months | Third Most Recent NOI: | $20,804,350 (December 31, 2019) | |
| Original Term: | 60 months | Second Most Recent NOI: | ($54,690) (December 31, 2020) | |
| Original Amortization: | None | Most Recent NOI(5): | $12,620,916 (December 31, 2021) | |
| Amortization Type: | Interest Only | UW Economic Occupancy: | 63.5% | |
| Call Protection(2): | L(25),D(30),O(5) | UW Revenues: | $126,226,398 | |
| Lockbox / Cash Management: | Soft / Springing | UW Expenses: | $100,165,283 | |
| Additional Debt(1): | Yes | UW NOI(6): | $26,061,115 | |
| Additional Debt Balance(1): | $53,000,000 | UW NCF: | $20,380,927 | |
| Additional Debt Type(1): | Pari Passu | Appraised Value / Per Room: | $306,000,000/ $346,154 | |
| Appraisal Date: | 11/17/2021 | |||
| Escrows and Reserves(3) | Financial Information | |||||||||||
| Initial | Monthly | Initial Cap | Whole Loan | |||||||||
| Taxes: | $0 | Springing | N/A | Cut-off Date Loan / Room: | $144,796 | |||||||
| Insurance: | $0 | Springing | N/A | Maturity Date Loan / Room: | $144,796 | |||||||
| Replacement Reserves: | $0 | Springing | N/A | Cut-off Date LTV: | 41.8% | |||||||
| Upfront Debt Service Reserve: | $6,482,400 | $0 | N/A | Maturity Date LTV: | 41.8% | |||||||
| Other(4): | $0 | Springing | N/A | UW NCF DSCR: | 3.14x | |||||||
| UW NOI Debt Yield: | 20.4% | |||||||||||
| ||||||||||||
| Sources and Uses | ||||||||||||
| Sources | Proceeds | % of Total | Uses | Proceeds | % of Total | |||||||
| Loan Amount | $128,000,000 | 98.2% | Loan Payoff | $123,214,718 | 94.5% | |||||||
| Sponsor Equity | 2,366,918 | 1.8 | Upfront Reserves | 6,482,400 | 5.0 | |||||||
| Closing Costs | 669,880 | 0.5 | ||||||||||
| Total Sources | $130,366,918 | 100.0% | Total Uses | $130,366,918 | 100.0% | |||||||
| (1) | The JW Marriott Desert Springs Loan (as defined below) is part of a whole loan evidenced by two pari passu notes, with an aggregate outstanding principal balance as of the Cut-off Date of $128.0 million. The Financial Information in the chart above reflects the Cut-off Date Balance of the JW Marriott Desert Springs Whole Loan (as defined below). |
| (2) | The defeasance lockout period, with respect to a defeasance of the JW Marriott Desert Springs Whole Loan, will be at least 25 payment dates beginning with and including the first payment date on February 6, 2022. Defeasance of the full $128.0 million JW Marriott Desert Springs Whole Loan is permitted after the date that is earlier of (i) two years from the closing date of the securitization that includes the last note to be securitized and (ii) December 22, 2024. The assumed lockout of 25 may be longer. |
| (3) | For a full description of Escrows and Reserves, please refer to “Escrows and Reserves” below. |
| (4) | Other springing reserve represents a ground rent reserve, please refer to “Escrows and Reserves” below |
| (5) | The Most Recent NOI includes the trailing 11 month period ending November 2021 and the forecasted financials for December 2021. |
| (6) | The increase from the Most Recent NOI ($) to Underwritten Net Operating Income ($) is primarily attributable to underwriting to average occupancy levels prior to the 2019 renovation and COVID-19 pandemic at the post-renovation ADR observed between June 2021 and November 2021. The mortgaged property’s 2021 performance reflects recovery from the COVID-19 pandemic as stay-at-home orders were lifted and travel began to rebound. We cannot assure you that the JW Marriott Desert Springs Mortgaged Property will revert to pre-COVID-19 performance. |
The Loan. The JW Marriott Desert Springs loan (the “JW Marriott Desert Springs Loan”) is part of a whole loan consisting of two pari passu notes with an aggregate outstanding principal balance as of the Cut-off Date of $128.0 million (the “JW Marriott Desert Springs Whole Loan”). The JW Marriott Desert Springs Loan, which is evidenced by the controlling Note A-1, had an original balance and has an outstanding balance as of the Cut-off Date of $75.0 million. The non-controlling Note A-2 had an original balance and has an outstanding balance as of the Cut-off Date of $53.0 million.
The JW Marriott Desert Springs Whole Loan was originated by Goldman Sachs Bank USA on December 22, 2021. The JW Marriott Desert Springs Whole Loan has a 5-year interest only term and accrues interest at a fixed rate of 4.99500% per annum. The JW Marriott
THE INFORMATION IN THIS STRUCTURAL AND COLLATERAL TERM SHEET IS NOT COMPLETE AND MAY BE AMENDED PRIOR TO THE TIME OF SALE. THIS TERM SHEET IS NOT AN OFFER TO SELL THESE SECURITIES AND IT IS NOT A SOLICITATION OF AN OFFER TO BUY THESE SECURITIES IN ANY JURISDICTION WHERE THE OFFER OR SALE IS NOT PERMITTED.
102 of 158
| Structural and Collateral Term Sheet | Benchmark 2022-B32 | |
| JW Marriott Desert Springs | ||
Desert Springs Whole Loan proceeds were used to refinance the JW Marriott Desert Springs Property (as defined below), fund a debt service reserve and pay origination costs.
The JW Marriott Desert Springs Whole Loan had an initial term of 60 months and has a remaining term of 59 months as of the Cut-off Date. The scheduled maturity date of the JW Marriott Desert Springs Whole Loan is the due date in January 2027. Voluntary prepayment of the JW Marriott Desert Springs Whole Loan in whole (but not in part) is permitted on or after the due date occurring in March 2024 and without the payment of any prepayment premium. Defeasance of the JW Marriott Desert Springs Whole Loan in whole (but not in part) is permitted after the date that is the earlier of (i) two years from the closing date of the securitization that includes the last note to be securitized and (ii) December 22, 2024.
The table below summarizes the promissory notes that comprise the JW Marriott Desert Springs Whole Loan. The relationship between the holders of the JW Marriott Desert Springs Whole Loan will be governed by a co-lender agreement as described under “Description of the Mortgage Pool—The Whole Loans—The Serviced Pari Passu Whole Loans” in the Preliminary Prospectus.
| Whole Loan Summary | |||||
| Note | Original Balance | Cut-off Date Balance | Note Holder | Controlling Piece | |
| A-1 | $75,000,000 | $75,000,000 | Benchmark 2022-B32 | Yes | |
| A-2 | $53,000,000 | $53,000,000 | GSBI(1) | No | |
| Whole Loan | $128,000,000 | $128,000,000 | |||
| (1) | Expected to be contributed to one or more future securitization trusts. |
The Borrower. The borrower is Newage Desert Springs, LLC, a Delaware limited liability company. The borrower is structured to be a single purpose bankruptcy-remote entity, having two independent directors in its organizational structure. Legal counsel to the borrower delivered a non-consolidation opinion in connection with the origination of the JW Marriott Desert Springs Whole Loan.
The Loan Sponsor. The loan sponsor and non-recourse carveout guarantor is Tiffany Lam, CEO of Kam Sang Company, Inc. (“Kam Sang”).
The Property. The JW Marriott Desert Springs Property, located in north Palm Desert, is a full-service hospitality property built in 1987. The property is located in a resort and golf community within the Coachella Valley, southwest of the intersection formed by Cook Street and Country Club Drive. The JW Marriott Desert Springs Property encompasses approximately 286.30 acres and is comprised of a main hotel building (five to nine stories), a one-story spa and fitness center building, and a one-story semi-permanent pavilion tent. Parking is available in the two-level parking garage to the west of the main hotel building and several surface lots throughout the resort. Both self-park and valet parking are offered, and the valet parking operation is managed by a third-party company. Other site improvements include two golf courses, over 26 acres of waterways, various outdoor swimming pools and whirlpools, and well-maintained. The JW Marriott Desert Springs Property offers amenities including four restaurants, three bars, a poolside bar, and a coffee shop. The hotel also offers 12 indoor meeting rooms and four outdoor event spaces. The largest ballroom, the Sinatra Ballroom, is divisible into 14 separate rooms. The hotel also features a 12,000-square-foot semi-permanent pavilion tent. Recreational facilities consist of two 18-hole golf courses, a 47-treatment-room spa, 26 acres of waterways, 20 tennis courts, five outdoor pools, two outdoor whirlpools, a fitness center, a 12,000-square-foot entertainment zone, and various retail outlets. Additional amenities include a full-service business center and a rental car center. The JW Marriott Desert Springs Property carries the JW Marriott flag under a hotel management agreement that expires December 31, 2022 and may be automatically renewed for four successive 10-year periods unless terminated by the operator.
The Market. The JW Marriott Desert Springs Property is located within north Palm Desert, within the Coachella Valley lodging market within the state of California. According to the appraisal, the north Palm Desert area has historically benefited from a variety of tourism and leisure attractions in the area. Tourism in the Coachella Valley is typically strongest from January through April, when the area enjoys cooler desert temperatures but a warmer climate than most other cities; the weather is especially welcoming to those visiting from the northern regions. The area is popular as a resort, golf, and tennis destination. Other leisure demand generators include Downtown Palm Springs, Fantasy Springs Resort Casino, and Agua Caliente Casino. Special events also typically play a role during key weekends. The area’s major events usually occur in March or April. Over three weekends, Indio’s Empire Polo Club plays hosts to the world-renowned Coachella Valley Music & Arts Festival, as well as the Stagecoach Country Music Festival. Although the festivals were canceled in 2020 and 2021 due to a resurgence of COVID-19 cases within Riverside County, they have been rescheduled to April 2022. Other key events that take place in the Coachella Valley include the BNP Paribas Open tennis championships, which were recently held in October 2021, Palm Springs International Film Festival, and LPGA Kraft Nabisco Championships. No major changes related to these attributes of the market are expected over the long term.
The Coachella Valley lodging market is comprised of approximately 14,300 hotel rooms located. As of Q4-2020, hospitality occupancy in Coachella Valley plummeted 21.9%, largely due to the onset of the COVID-19 pandemic. Prior to COVID-19, the hospitality market occupancy was 58.6% as of YE 2019. Further, from 2009-2019, the compound annual growth rates (“CAGR”) for ADR and RevPAR in Desert Springs were 2.9% and 3.8%, respectively.
THE INFORMATION IN THIS STRUCTURAL AND COLLATERAL TERM SHEET IS NOT COMPLETE AND MAY BE AMENDED PRIOR TO THE TIME OF SALE. THIS TERM SHEET IS NOT AN OFFER TO SELL THESE SECURITIES AND IT IS NOT A SOLICITATION OF AN OFFER TO BUY THESE SECURITIES IN ANY JURISDICTION WHERE THE OFFER OR SALE IS NOT PERMITTED.
103 of 158
| Structural and Collateral Term Sheet | Benchmark 2022-B32 | |
| JW Marriott Desert Springs | ||
COVID-19 Update. As of January 6, 2022, The JW Marriott Desert Springs Property is open and operating. As of January 6, 2022, no loan modification or forbearance requests have been made on The JW Marriott Desert Springs Loan. The first payment date of The JW Marriott Desert Springs Loan is February 6, 2022.
| Operating History and Underwritten Net Cash Flow | ||||||||||
| 2018 | 2019 | 2020 | 2021 | Underwritten(1) | Per Room | % of Total Revenue | ||||
| Occupancy | 62.1% | 58.8% | 19.6% | 36.8% | 63.5% | |||||
| ADR | $224.70 | $225.66 | $250.16 | $273.74 | $267.71 | |||||
| RevPAR | $139.45 | $132.61 | $48.91 | $100.71 | $170.00 | |||||
| Room Revenue | $44,994,854 | $42,788,499 | $15,823,875 | $32,494,411 | $54,850,861 | $62,048 | 43.5% | |||
| Food & Beverage Revenue | 45,288,668 | 47,332,662 | 16,114,894 | 26,542,884 | 51,144,651 | 57,856 | 40.5% | |||
| Other Departmental Revenue(2) | 17,849,499 | 18,723,007 | 9,845,701 | 15,823,366 | 20,230,886 | 22,886 | 16.0% | |||
| Total Revenue | $108,133,021 | $108,844,168 | $41,784,470 | $74,860,661 | $126,226,398 | $142,790 | 100.0% | |||
| Room Expense | $10,930,362 | $10,711,086 | $4,412,952 | $7,338,460 | $13,730,612 | $15,532 | 10.9% | |||
| Food & Beverage Expense | 32,169,377 | 34,979,244 | 13,353,085 | 22,352,525 | 37,795,897 | 42,756 | 29.9% | |||
| Other Departmental Expense | 10,442,863 | 11,254,666 | 5,518,316 | 8,431,242 | 12,161,073 | 13,757 | 9.6% | |||
| Departmental Expenses | $53,542,602 | $56,944,996 | $23,284,353 | $38,122,227 | $63,687,583 | $72,045 | 50.5% | |||
| % | ||||||||||
| Departmental Profit | $54,590,419 | $51,899,172 | $18,500,117 | $36,738,434 | $62,538,815 | $70,745 | 49.5% | |||
| Admin & General | $6,546,262 | $7,289,923 | $4,442,493 | $5,322,291 | $8,454,111 | $9,563 | 6.7% | |||
| Maintenance & Repairs | 5,125,724 | 5,443,470 | 3,245,217 | 4,274,391 | 6,312,783 | 7,141 | 5.0% | |||
| Utility Costs | 2,568,169 | 2,466,965 | 1,752,945 | 2,799,468 | 2,860,935 | 3,236 | 2.3% | |||
| Marketing & Franchise Fee | 8,518,316 | 8,058,412 | 3,664,976 | 5,294,957 | 9,345,327 | 10,572 | 7.4% | |||
| Management Fee | 3,239,126 | 3,225,036 | 1,227,506 | 2,217,417 | 3,786,792 | 4,284 | 3.0% | |||
| Property Tax | 2,214,687 | 2,078,451 | 2,351,537 | 2,133,444 | 2,377,975 | 2,690 | 1.9% | |||
| Insurance | 991,646 | 835,554 | 702,818 | 884,604 | 1,113,052 | 1,259 | 0.9% | |||
| Other Expenses | 2,212,227 | 1,697,011 | 1,167,315 | 1,190,946 | 2,226,725 | 2,519 | 1.8% | |||
| Total Expenses | $31,416,157 | $31,094,822 | $18,554,807 | $24,117,518 | $36,477,700 | $41,264 | 28.9% | |||
| Net Operating Income(2) | $23,174,262 | $20,804,350 | ($54,690) | $12,620,916 | $26,061,115 | $29,481 | 20.6% | |||
| FF&E | 5,944,998 | 5,912,565 | 2,250,428 | 4,065,264 | 5,680,188 | 6,426 | 4.5% | |||
| Net Cash Flow | $17,229,264 | $14,891,785 | ($2,305,118) | $8,555,652 | $20,380,927 | $23,055 | 16.1% | |||
| (1) | The 2021 includes the trailing 11 month period ending November 2021 and the forecasted financials for December 2021. |
| (2) | The increase in Underwritten Net Operating Income is primarily attributable to underwriting to average occupancy levels prior to the 2019 renovation and COVID-19 pandemic at the post-renovation ADR observed between June 2021 and November 2021. The mortgaged property’s 2021 performance reflects recovery from the COVID-19 pandemic as stay-at-home orders were lifted and travel began to rebound. We cannot assure you that the JW Marriott Desert Springs Mortgaged Property will revert to pre-COVID-19 performance. |
Property Management. The JW Marriott Desert Springs Property is managed by Marriott Hotel Services, Inc., a third party management company.
Escrows and Reserves. At loan origination, the borrower deposited $6,482,400 into a debt service reserve. Provided no event of default is continuing, the debt service reserve will be reduced each month by 1/12th of the initial deposit. There is no ongoing debt service reserve in place.
Tax Reserve – The borrower is required to deposit into a real estate tax reserve, on a monthly basis, 1/12th of the reasonably estimated annual real estate taxes; provided, however, to the extent that amounts due for such taxes are reserved for in an account maintained by the Brand Manager (as defined below) pursuant to the Brand Management Agreement (as defined below) or are previously paid for by the Brand Manager pursuant to the Brand Management Agreement, the deposits required to be made by the borrower will be reduced on a dollar-for-dollar basis by such amounts.
Insurance Reserve – The borrower is required to deposit into an insurance reserve, on a monthly basis, 1/12th of reasonably estimated insurance premiums; provided, however, to the extent that amounts due for insurance premiums are reserved for in an account maintained by the Brand Manager pursuant to the Brand Management Agreement or are previously paid for by the Brand Manager pursuant to the Brand Management Agreement, the deposits required to be made by the borrower will be reduced on a dollar-for-dollar basis by such amounts.
Ground Rent Reserve - The borrower is required to deposit into a ground rent reserve, on a monthly basis, 1/12th of the reasonably estimated ground rents; provided, however, to the extent that amounts due for ground rents are reserved for in an account maintained by
THE INFORMATION IN THIS STRUCTURAL AND COLLATERAL TERM SHEET IS NOT COMPLETE AND MAY BE AMENDED PRIOR TO THE TIME OF SALE. THIS TERM SHEET IS NOT AN OFFER TO SELL THESE SECURITIES AND IT IS NOT A SOLICITATION OF AN OFFER TO BUY THESE SECURITIES IN ANY JURISDICTION WHERE THE OFFER OR SALE IS NOT PERMITTED.
104 of 158
| Structural and Collateral Term Sheet | Benchmark 2022-B32 | |
| JW Marriott Desert Springs | ||
the Brand Manager pursuant to the Brand Management Agreement or are previously paid for by the Brand Manager pursuant to the Brand Management Agreement, the deposits required to be made by the borrower will be reduced on a dollar-for-dollar basis by such amounts.
FF&E Reserve – The borrower is required to deposit into a furniture, fixtures and equipment (“FF&E”) reserve, on a monthly basis, an amount equal to either (i) the amount mandated to be deposited under the brand management agreement in effect as of the origination of the JW Marriott Desert Springs Loan or (ii) in the event the Brand Management Agreement (as defined below) has been terminated in accordance with the terms of the JW Marriott Desert Springs Loan documents, the greater of (a) any amount mandated by any replacement Brand Management Agreement or franchise agreement then in place with respect to the JW Marriott Desert Springs Property and (b) 5.5% of revenue over the immediately preceding 12-month period.
Seasonality Reserve – The borrower is required to deposit into a seasonality reserve, on a monthly basis, all amounts then remaining after the payment of basic carrying costs, hotel taxes, delinquent interest, operating expenses and FF&E expenses; provided, however, if the available amounts then on deposit in the seasonality reserve are equal to or exceed $2,701,000, then such deposit will be waived.
Lockbox / Cash Management. The JW Marriott Desert Springs Whole Loan is structured with a soft lockbox and springing cash management. So long as the JW Marriott Desert Springs Property is subject to the Brand Management Agreement with the Brand Manager, the borrower will cause the Brand Manager, pursuant to the Brand Management Agreement, to deposit all net income, after payment of certain property level expenses paid directly by the Brand Manager, into a lender controlled lockbox account within one business day of receipt. In the event that the Brand Management Agreement is terminated in accordance with the JW Marriott Desert Springs Whole Loan documents or the Brand Manager is in default under the Brand Management Agreement, all income will be required to be deposited into a lender controlled lockbox account within two business days of receipt. To the extent no JW Marriott Desert Springs Trigger Period (as defined below) is continuing, all funds in the lockbox account are required to be transferred to or at the direction of the lender.
On each due date during the continuance of a JW Marriott Desert Springs Trigger Period (or, at the lender’s discretion, during an event of default under the JW Marriott Desert Springs Whole Loan), all funds on deposit in the cash management account after payment of debt service on the JW Marriott Desert Springs Whole Loan, required reserves and budgeted operating expenses are required to be deposited into an excess cash flow reserve account as additional collateral for the JW Marriott Desert Springs Whole Loan.
The “Brand Management Agreement” means a certain amended and restated management agreement between DS Hotel LLC (the borrower’s predecessor-in-interest) and Marriott International, Inc. (the “Brand Manager”), dated as of December 29, 2001, as amended.
A “JW Marriott Desert Springs Trigger Period” means each period commencing (i) following December 22, 2022, when the Debt Yield (as calculated under the JW Marriott Desert Springs Whole Loan documents), as determined as of the last day of each of two consecutive fiscal quarters, is less than 8.0%, (ii) upon the borrower’s failure to deliver annual, quarterly or monthly financial reports as and when required under the JW Marriott Desert Springs Whole Loan documents and concluding when such reports are delivered and indicate that no other JW Marriott Desert Springs Trigger Period is continuing, or (iii) upon the occurrence of an event of default under any mezzanine loan created by the lender pursuant to the terms of the JW Marriott Desert Springs Whole Loan documents and concluding when such event of default is cured.
Current Mezzanine or Subordinate Indebtedness. None.
Future Mezzanine or Subordinate Indebtedness Permitted. None.
Partial Release. None.
THE INFORMATION IN THIS STRUCTURAL AND COLLATERAL TERM SHEET IS NOT COMPLETE AND MAY BE AMENDED PRIOR TO THE TIME OF SALE. THIS TERM SHEET IS NOT AN OFFER TO SELL THESE SECURITIES AND IT IS NOT A SOLICITATION OF AN OFFER TO BUY THESE SECURITIES IN ANY JURISDICTION WHERE THE OFFER OR SALE IS NOT PERMITTED.
105 of 158
| Structural and Collateral Term Sheet | Benchmark 2022-B32 | |
| Woodmore Towne Centre | ||

THE INFORMATION IN THIS STRUCTURAL AND COLLATERAL TERM SHEET IS NOT COMPLETE AND MAY BE AMENDED PRIOR TO THE TIME OF SALE. THIS TERM SHEET IS NOT AN OFFER TO SELL THESE SECURITIES AND IT IS NOT A SOLICITATION OF AN OFFER TO BUY THESE SECURITIES IN ANY JURISDICTION WHERE THE OFFER OR SALE IS NOT PERMITTED.
106 of 158
| Structural and Collateral Term Sheet | Benchmark 2022-B32 | |
| Woodmore Towne Centre | ||
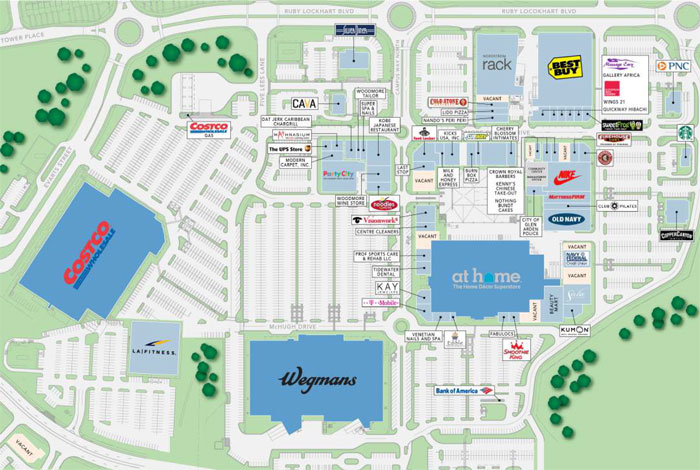
THE INFORMATION IN THIS STRUCTURAL AND COLLATERAL TERM SHEET IS NOT COMPLETE AND MAY BE AMENDED PRIOR TO THE TIME OF SALE. THIS TERM SHEET IS NOT AN OFFER TO SELL THESE SECURITIES AND IT IS NOT A SOLICITATION OF AN OFFER TO BUY THESE SECURITIES IN ANY JURISDICTION WHERE THE OFFER OR SALE IS NOT PERMITTED.
107 of 158
| Structural and Collateral Term Sheet | Benchmark 2022-B32 | |
| Woodmore Towne Centre | ||

THE INFORMATION IN THIS STRUCTURAL AND COLLATERAL TERM SHEET IS NOT COMPLETE AND MAY BE AMENDED PRIOR TO THE TIME OF SALE. THIS TERM SHEET IS NOT AN OFFER TO SELL THESE SECURITIES AND IT IS NOT A SOLICITATION OF AN OFFER TO BUY THESE SECURITIES IN ANY JURISDICTION WHERE THE OFFER OR SALE IS NOT PERMITTED.
108 of 158
| Structural and Collateral Term Sheet | Benchmark 2022-B32 | |
| Woodmore Towne Centre | ||
| Mortgage Loan Information | Property Information | |||
| Mortgage Loan Seller: | GSMC | Single Asset / Portfolio: | Single Asset | |
| Original Principal Balance(1): | $75,000,000 | Title: | Fee | |
| Cut-off Date Principal Balance(1): | $75,000,000 | Property Type - Subtype: | Retail - Anchored | |
| % of Pool by IPB: | 4.2% | Net Rentable Area (SF): | 712,091 | |
| Loan Purpose: | Acquisition | Location: | Glenarden, MD | |
| Borrowers: | UE Woodmore TC LLC and UE | Year Built / Renovated: | 2010-2012, 2015, 2017, 2019 / NAP | |
| Woodmore TC II LLC | Occupancy: | 96.7% | ||
| Guarantor: | Urban Edge Properties LP | Occupancy Date: | 11/30/2021 | |
| Interest Rate: | 3.39000% | Number of Tenants: | 64 | |
| Note Date: | 12/23/2021 | Fourth Most Recent NOI: | $11,816,888 (December 31, 2018) | |
| Maturity Date: | 1/6/2032 | Third Most Recent NOI: | $12,018,238 (December 31, 2019) | |
| Interest-only Period: | 120 months | Second Most Recent NOI: | $9,241,732 (December 31, 2020) | |
| Original Term: | 120 months | Most Recent NOI(3): | $8,690,348 (TTM October 31, 2021) | |
| Original Amortization: | None | UW Economic Occupancy: | 95.3% | |
| Amortization Type: | Interest Only | UW Revenues(4): | $17,221,570 | |
| Call Protection(2): | L(25),D(91),O(4) | UW Expenses: | $4,980,705 | |
| Lockbox / Cash Management: | Hard / Springing | UW NOI(3): | $12,240,865 | |
| Additional Debt(1): | Yes | UW NCF: | $11,909,419 | |
| Additional Debt Balance(1): | $42,200,000 | Appraised Value / Per SF(5): | $197,000,000 / $277 | |
| Additional Debt Type(1): | Pari Passu | Appraisal Date: | 11/22/2021 | |
| Escrows and Reserves(6) | Financial Information | ||||||
| Initial | Monthly | Initial Cap | |||||
| Taxes: | $189,670 | $189,670 | N/A | Cut-off Date Loan / SF: | $165 | ||
| Insurance: | $0 | Springing | N/A | Maturity Date Loan / SF: | $165 | ||
| Replacement Reserves: | $0 | $6,885 | $247,865 | Cut-off Date LTV(5): | 59.5% | ||
| TI/LC: | $0 | $29,672 | $1,068,179 | Maturity Date LTV(5): | 59.5% | ||
| Other(7): | $4,194,252 | $0 | N/A | UW NCF DSCR: | 2.96x | ||
| UW NOI Debt Yield: | 10.4% | ||||||
| Sources and Uses | |||||||
| Sources | Proceeds | % of Total | Uses | Proceeds | % of Total | ||
| Loan Amount | $117,200,000 | 59.5% | Purchase Price | $191,930,000 | 97.4% | ||
| Sponsor Equity | 79,793,357 | 40.5 | Upfront Reserves | 4,383,922 | 2.2 | ||
| Closing Costs | 679,435 | 0.3 | |||||
| Total Sources | $196,993,357 | 100.0% | Total Uses | $196,993,357 | 100.0% | ||
| (1) | The Woodmore Towne Centre Loan (as defined below) is part of a whole loan evidenced by three pari passu notes, with an aggregate outstanding principal balance as of the Cut-off Date of $117.2 million. The Financial Information in the chart above reflects the Cut-off Date Balance of the Woodmore Towne Centre Whole Loan (as defined below). |
| (2) | The defeasance lockout period will be at least 25 payment dates beginning with and including the first payment date on February 6, 2022. Defeasance of the full $117.2 million Woodmore Towne Centre Whole Loan is permitted after the date that is earlier of (i) two years from the closing date of the securitization that includes the last note to be securitized and (ii) December 23, 2024. |
| (3) | The increase from the Most Recent NOI $8,690,348 as of 10/31/2021 to Underwritten Net Operating Income $12,240,865 is primarily attributable to new leasing activity such as At Home Stores, LA Fitness, NIKE Retail Services, Inc., Club Pilates, Nothing Bundt Cakes, and Ledo Pizza. |
| (4) | Underwritten Revenues include annual income from the payout of a $17 million tax increment fund promissory note. Please see “Description of the Mortgage Pool-Real Estate and Other Tax Considerations” in the Preliminary Prospectus. |
| (5) | The appraised value of $197.0 million includes an extraordinary assumption assuming the total lease expense costs are assumed to be credited to the potential buyer of the Woodmore Towne Centre Property (as defined below). The “as-is” appraised value of the Woodmore Towne Centre is $192.0 million, which results in a Cut-off date and Maturity date LTV of 61.0%. |
| (6) | For a full description of Escrows and Reserves, please refer to “Escrows and Reserves” below. |
| (7) | Other initial reserves represent an unfunded obligations reserve for $4,194,252.00. |
The Loan. The Woodmore Towne Centre loan (the “Woodmore Towne Centre Loan”) is part of a whole loan consisting of three pari passu notes with an aggregate outstanding principal balance as of the Cut-off Date of $117.2 million (the “Woodmore Towne Centre Whole Loan”). The Woodmore Towne Centre Loan evidenced by the controlling Note A-1, had an original balance and has an outstanding balance as of the Cut-off Date of $75.0 million. The non-controlling Notes A-2 and A-3 have an aggregate original balance and have an aggregate outstanding balance as of the Cut-off Date of $42.2 million. Only the controlling Note A-1 will be included in the mortgage pool for the Benchmark 2022-B32 mortgage trust.
THE INFORMATION IN THIS STRUCTURAL AND COLLATERAL TERM SHEET IS NOT COMPLETE AND MAY BE AMENDED PRIOR TO THE TIME OF SALE. THIS TERM SHEET IS NOT AN OFFER TO SELL THESE SECURITIES AND IT IS NOT A SOLICITATION OF AN OFFER TO BUY THESE SECURITIES IN ANY JURISDICTION WHERE THE OFFER OR SALE IS NOT PERMITTED.
109 of 158
| Structural and Collateral Term Sheet | Benchmark 2022-B32 | |
| Woodmore Towne Centre | ||
The Woodmore Towne Centre Whole Loan was originated by Goldman Sachs Bank USA on December 23, 2021. The Woodmore Towne Centre Whole Loan has a 10-year interest only term and accrues interest at a fixed rate of 3.39000% per annum. The Woodmore Towne Centre Whole Loan proceeds were used to acquire the Woodmore Towne Centre Property (as defined below) and pay origination costs.
The Woodmore Towne Centre Whole Loan had an initial term of 120 months and has a remaining term of 119 months as of the Cut-off Date. The scheduled maturity date of the Woodmore Towne Centre Whole Loan is the due date in January 2032. Voluntary prepayment of the Woodmore Towne Centre Whole Loan in whole (but not in part) is permitted on or after the due date occurring in October 2031 without payment of any prepayment premium. Defeasance of the Woodmore Towne Centre Whole Loan in whole (but not in part) is permitted after the date that is earlier of (i) two years from the closing date of the securitization that includes the last note to be securitized and (ii) December 23, 2024.
The table below summarizes the promissory notes that comprise the Woodmore Towne Centre Whole Loan. The relationship between the holders of the Woodmore Towne Centre Whole Loan will be governed by a co-lender agreement as described under “Description of the Mortgage Pool—The Whole Loans—The Serviced Pari Passu Whole Loans” in the Preliminary Prospectus.
| Whole Loan Summary | |||||
| Note | Original Balance | Cut-off Date Balance | Note Holder | Controlling Piece | |
| A-1 | $75,000,000 | $75,000,000 | Benchmark 2022-B32 | Yes | |
| A-2 | $39,066,667 | $39,066,667 | GSBI(1) | No | |
| A-3 | $3,133,333 | $3,133,333 | GSBI(1) | No | |
| Whole Loan | $117,200,000 | $117,200,000 | |||
| (1) | Expected to be contributed to one or more future securitization trusts. |
The Borrowers. The borrowers are UE Woodmore TC LLC and UE Woodmore TC II LLC, each a Delaware limited liability company. The borrowers are structured to be single purpose bankruptcy-remote entities, each having two independent directors in its organizational structure. Legal counsel to the borrowers delivered a non-consolidation opinion in connection with the origination of the Woodmore Towne Centre Whole Loan.
The Loan Sponsor. The loan sponsor and non-recourse carveout guarantor is Urban Edge Properties LP (“Urban Edge”). Urban Edge is a real estate investment trust focused on managing, acquiring, developing and redeveloping retail real estate in urban communities across the east coast, primarily in New York, Washington DC, Philadelphia and New England, as well as California, Puerto Rico and other markets.
The Property. The Woodmore Towne Centre Property is a grocery anchored retail center consisting of 16 buildings totaling 712,091 square feet of space located at 2250 Petrie Lane, Glenarden, Maryland (the “Woodmore Towne Centre Property”). The site includes a total of 82.83-acres, of which 75.66-acres is allocated to the shopping center and 7.17-acres is considered excess land. The improvements were completed in between 2010-2012 (main shopping center), 2015 (fitness center), 2017 (Nordstrom Rack and adjacent shops), 2019 (Silver Diner and CAVA). Additionally, there are 3,096 surface and garage parking spaces, reflecting an overall parking ratio of 4.37 spaces per 1,000 square feet of gross leasable area. The Woodmore Towne Centre Property is located on the south side of Ruby Lockhart Boulevard, just west of Saint Joseph’s Drive and bounded by Landover Road (Maryland Route 202) in the south and Interstate 495 (Capital Beltway) in the west.
As of November 30, 2021, The Woodmore Towne Centre Property is 96.7% occupied to 64 unique tenants.
Major Tenants.
The largest tenant, Costco (148,628 square feet; 20.9% of net rentable area; 6.6% of underwritten base rent) is the largest wholesale club operator in the United States and the world. Costco offers discount prices on a variety of bulk products including food, appliances, pharmaceuticals, clothing, and electronics. Costco operates over 780 warehouse stores serving nearly 95 million cardholders. The company owns nearly 80% of its stores. Costco’s warehouses are located throughout the United States, Canada, Mexico, Japan, Taiwan, South Korea, the UK, and Spain. Costco aims to offer its members a broad range of high-quality merchandise at consistently lower prices than they can find elsewhere. To keep inventory costs low, its merchandising strategy is to limit certain items to fast-selling models, sizes, and colors. By doing this, Costco can limit its number of stock keeping units to about 3,700 per warehouse, enabling it to hold significantly fewer items than other discount retailers, supermarkets, and supercenters. Its product lines are not static however, as it continues to expand its own Kirkland Signature brand. Costco has been at the Woodmore Towne Centre Property since October 24, 2010 and has a lease expiration date of October 24, 2030.
THE INFORMATION IN THIS STRUCTURAL AND COLLATERAL TERM SHEET IS NOT COMPLETE AND MAY BE AMENDED PRIOR TO THE TIME OF SALE. THIS TERM SHEET IS NOT AN OFFER TO SELL THESE SECURITIES AND IT IS NOT A SOLICITATION OF AN OFFER TO BUY THESE SECURITIES IN ANY JURISDICTION WHERE THE OFFER OR SALE IS NOT PERMITTED.
110 of 158
| Structural and Collateral Term Sheet | Benchmark 2022-B32 | |
| Woodmore Towne Centre | ||
The second largest tenant, Wegmans Food Markets, Inc. (“Wegmans”) (128,813 square feet; 18.1% of net rentable area; 8.4% of underwritten base rent), was founded in 1916, is privately owned by the family of founder, John Wegman. The company is a major regional supermarket chain and private company in the U.S. Wegmans operates approximately 99 stores: 46 in New York, 18 in Pennsylvania, 12 in Virginia, nine in New Jersey, eight in Maryland, six in Massachusetts and one in North Carolina. The company generally opens two or three new stores per year, usually in the 100,000 to 140,000 square foot range, though it will build smaller stores when conditions warrant, such as the 74,000-square-foot store opened in 2019 in the heavily populated urban area of Brooklyn, NY. However, even Wegmans’ smaller stores easily exceed the industry median size of about 45,000 square feet. In addition, a typical Wegmans store features 50,000 to 70,000 products, higher than the roughly 40,000 found in a typical supermarket. Wegmans has been at the Woodmore Towne Centre Property since October 24, 2010 and has a lease expiration date of October 31, 2035.
The third largest tenant, At Home Stores, LLC (“At Home Stores”) (96,446 square feet; 13.5% of net rentable area; 7.9% of underwritten base rent), is a home décor superstore. The company owns and operates over 200 stores, each averaging 105,000 square feet and mostly located off major highways in 36 states from Florida to Michigan. At Home Stores stores sell hundreds of thousands of decorating items, such as seasonal décor, framed art, baskets, silk and dried flowers, furniture, home textiles, and pottery, as well as crafts and party supplies. Over 70% of its products are unbranded, private label or specifically designed for the company. At Home Stores, which began as a single store outside of San Antonio in 1979, was acquired by in 2011 by an investment group led by certain affiliates of AEA Investors LP. At Home Stores has been at the Woodmore Towne Centre Property since June 10, 2021 and has a lease expiration date of June 30, 2031.
The Market. The Woodmore Towne Centre Property is located in Glenarden, MD, approximately 10 miles east of downtown Washington, D.C. and within the Washington D.C. metropolitan statistical area (“MSA”). Washington, D.C. is situated along the banks of the Potomac and Anacostia rivers, and is the nation’s capital and anchor of the region. It encompasses approximately 61 square miles of land. Prince George’s County is a community of diverse neighborhoods with 27 unique municipalities ranging in population from fewer than 100 to as many as 50,000 people. Due to its proximity to Washington, D.C. the county also hosts many U.S. governmental facilities, such as Joint Base Andrews, a U.S. military airbase, as well as the headquarters of the United States Census Bureau. Prince George’s County has become an engine for economic growth and development including over $7 billion in infrastructure investment, retail redevelopment, significant GSA attention, tax incentives and initiatives, and a streamlined permitting and approval process to further the trends. The County has invested over $100 million into Suitland Federal Center, home to government agencies such as the US Census Bureau, Naval Maritime Intelligence Center, NOAA’s Satellite Operations, and the Bureau of Economic Analysis. Prince George’s County has received an influx of infrastructure and development investments beginning in 2013, when MGM announced the new site for their newest resort and casino, in south Prince George’s County next to National Harbor. Having opened in late 2016, the all-in cost was $1.3 billion and has created a major entertainment destination in Prince George’s County. Related to infrastructure, Prince George’s County is an integral part to the $5.6 billion MTA Purple Line contract as well as the already existing $2.4 billion Intercounty Connector.
The Woodmore Towne Centre Property is in the Northern Prince George’s County retail submarket within the larger Suburban Maryland retail market. The Northern Prince George’s County Submarket reported average retail asking rents of $23.82 per square foot as of the third quarter of 2021, an increase of 0.3% since 2020. Average asking rental rates in the Northern Prince George’s County submarket have increased, ranging from $23.16 per square foot in 2016 to $23.79 per square foot in 2020, demonstrating a compounded annual growth rate of 0.7%.
The Suburban Maryland retail market reported average retail rents of $27.84 per square foot as of the third quarter of 2021, an increase of 0.3% over asking rents in 2020. Average asking rental rates in the Suburban Maryland retail market have increased, ranging from $26.51 per square foot in 2016 to $27.84 per square foot in 2020, demonstrating a compounded annual growth rate of 1.2%.
The vacancy rate in the Northern Prince George’s County submarket at the end of the third quarter of 2021 was 6.7% and the vacancy rate of the greater Suburban Maryland retail market was 7.6%.
According to the appraisal, the 2021 population, population growth from 2000-2021 and average household income are presented in the chart below:
| 3 Mile Radius | 5 Mile Radius | 10 Mile Radius | |
| Population | 95,131 | 279,791 | 1,169,002 |
| Population Growth | 0.37% | 0.50% | 0.73% |
| Average Household Income | $101,602 | $101,267 | $109,088 |
| Historical and Current Occupancy | |||
| 2018(1) | 2019(1) | 2020(1) | Current(2) |
| 95.0% | 97.0% | 90.0% | 96.7% |
| (1) | Historical Occupancies are as of December 31 of each respective year. |
| (2) | Current Occupancy is as of November 30, 2021. |
THE INFORMATION IN THIS STRUCTURAL AND COLLATERAL TERM SHEET IS NOT COMPLETE AND MAY BE AMENDED PRIOR TO THE TIME OF SALE. THIS TERM SHEET IS NOT AN OFFER TO SELL THESE SECURITIES AND IT IS NOT A SOLICITATION OF AN OFFER TO BUY THESE SECURITIES IN ANY JURISDICTION WHERE THE OFFER OR SALE IS NOT PERMITTED.
111 of 158
| Structural and Collateral Term Sheet | Benchmark 2022-B32 | |
| Woodmore Towne Centre | ||
COVID-19 Update. As of January 6, 2022, The Woodmore Towne Centre Property is open and operating. There has been no rent relief requested. As of January 6, 2022, no loan modification or forbearance requests have been made on The Woodmore Towne Centre Whole Loan. The first payment date of The Woodmore Towne Centre Whole Loan is February 6, 2022.
| Tenant Summary(1) | |||||||||
| Tenant | Ratings Moody’s/Fitch/S&P(2) | Net Rentable Area (SF) | % of Total NRA | Base Rent PSF(3) | % of Total Base Rent(3) | TTM 10/31/2021 Sales PSF(4) | Occupancy Cost | Lease Expiration Date | |
| Costco | NR/NR/NR | 148,628 | 20.9% | $5.30 | 6.6% | $148,628,000 | 0.5% | 10/24/2030 | |
| Wegmans | NR/NR/NR | 128,813 | 18.1 | $7.76 | 8.4 | $99,830,075 | 1.0% | 10/31/2035 | |
| At Home Stores | NR/NR/NR | 96,446 | 13.5 | $9.75 | 7.9 | NAV | NAV | 6/30/2031 | |
| Best Buy | NR/NR/NR | 45,000 | 6.3 | $20.75 | 7.9 | $29,970,000 | 3.1% | 3/31/2024 | |
| LA Fitness | NR/NR/NR | 42,154 | 5.9 | $16.00 | 5.7 | NAV | NAV | 11/30/2036 | |
| Nordstrom Rack | NR/NR/NR | 30,139 | 4.2 | $18.00 | 4.6 | NAV | NAV | 9/30/2027 | |
| NIKE Retail Services, Inc. | NR/NR/NR | 15,000 | 2.1 | $23.00 | 2.9 | NAV | NAV | 10/31/2027 | |
| Old Navy | NR/NR/NR | 14,793 | 2.1 | $20.57 | 2.6 | $3,452,544 | 8.8% | 12/31/2024 | |
| Party City | NR/NR/NR | 13,372 | 1.9 | $18.17 | 2.0 | $2,742,129 | 8.9% | 1/31/2029 | |
| Beauty Mart | NR/NR/NR | 9,463 | 1.3 | $29.00 | 2.3 | $1,739,783 | 15.8% | 5/31/2031 | |
| Total | 543,808 | 76.4% | $11.12 | 50.9% | |||||
| Remaining Tenants | 144,630 | 20.3 | $40.39 | 49.1 | |||||
| Total Occupied | 688,438 | 96.7% | |||||||
| Vacant | 23,653 | 3.3 | |||||||
| Total | 712,091 | 100.0% | $17.27 | 100.0% | |||||
| (1) | Based on the underwritten rent roll dated November 30, 2021. |
| (2) | In certain instances, ratings provided are those of the parent company of the entity shown, whether or not the parent company guarantees the lease. |
| (3) | Base Rent PSF is inclusive of contractual rent steps underwritten through the termination option per the tenant’s lease. |
| (4) | As provided by the loan sponsor. |
THE INFORMATION IN THIS STRUCTURAL AND COLLATERAL TERM SHEET IS NOT COMPLETE AND MAY BE AMENDED PRIOR TO THE TIME OF SALE. THIS TERM SHEET IS NOT AN OFFER TO SELL THESE SECURITIES AND IT IS NOT A SOLICITATION OF AN OFFER TO BUY THESE SECURITIES IN ANY JURISDICTION WHERE THE OFFER OR SALE IS NOT PERMITTED.
112 of 158
| Structural and Collateral Term Sheet | Benchmark 2022-B32 | |
| Woodmore Towne Centre | ||
| Lease Rollover Schedule(1)(2)(3) | |||||||||
| Year | Number of Leases Expiring | Net Rentable Area Expiring | % of NRA Expiring | Base Rent Expiring | % of Base Rent Expiring | Cumulative Net Rentable Area Expiring | Cumulative % of NRA Expiring | Cumulative Base Rent Expiring | Cumulative % of Base Rent Expiring |
| Vacant | NAP | 23,653 | 3.3% | NAP | NAP | 23,653 | 3.3% | NAP | NAP |
| MTM | 0 | 0 | 0.0 | $0 | 0.0% | 23,653 | 3.3% | $0 | 0.0% |
| 2022 | 5 | 7,463 | 1.0 | 304,104 | 2.6 | 31,116 | 4.4% | $304,104 | 2.6% |
| 2023 | 3 | 6,265 | 0.9 | 198,382 | 1.7 | 37,381 | 5.2% | $502,486 | 4.2% |
| 2024 | 5 | 69,137 | 9.7 | 1,592,058 | 13.4 | 106,518 | 15.0% | $2,094,544 | 17.6% |
| 2025 | 6 | 13,098 | 1.8 | 598,169 | 5.0 | 119,616 | 16.8% | $2,692,713 | 22.7% |
| 2026 | 9 | 22,517 | 3.2 | 1,035,183 | 8.7 | 142,133 | 20.0% | $3,727,896 | 31.4% |
| 2027 | 10 | 75,431 | 10.6 | 1,769,066 | 14.9 | 217,564 | 30.6% | $5,496,962 | 46.2% |
| 2028 | 5 | 19,234 | 2.7 | 542,356 | 4.6 | 236,798 | 33.3% | $6,039,318 | 50.8% |
| 2029 | 4 | 17,792 | 2.5 | 404,770 | 3.4 | 254,590 | 35.8% | $6,444,088 | 54.2% |
| 2030 | 3 | 154,808 | 21.7 | 1,602,653 | 13.5 | 409,398 | 57.5% | $8,046,740 | 67.7% |
| 2031 | 4 | 109,700 | 15.4 | 1,374,584 | 11.6 | 519,098 | 72.9% | $9,421,324 | 79.3% |
| 2032 and Thereafter(4) | 12 | 192,993 | 27.1 | 2,465,848 | 20.7 | 712,091 | 100.0% | $11,887,171 | 100.0% |
| Total | 66 | 712,091 | 100.0% | $11,887,171 | 100.0% | ||||
| (1) | Based on the underwritten rent roll as of November 30, 2021 with rent steps through February 28, 2023 and excluding vacant units. |
| (2) | Lease Rollover Schedule is based on the lease expiration dates of all direct leases in place. |
| (3) | Certain tenants may have termination or contraction options (which may become exercisable prior to the originally stated expiration date of the tenant lease) that are not considered in the above Lease Rollover Schedule. |
| (4) | Includes Broadway Services (Security) for which no base rent was underwritten. |
| Operating History and Underwritten Net Cash Flow | |||||||
| 2018 | 2019 | 2020 | TTM 10/31/2021 | Underwritten | Per Square Foot | %(1) | |
| Base Rent(2) | $11,321,426 | $11,766,630 | $10,704,506 | $9,300,011 | $12,143,377 | $17.05 | 67.2% |
| Rent Steps(3) | 40,728 | 81,527 | (196) | 214,476 | 240,834 | $0.34 | 1.3% |
| Potential Income from Vacant Space | 0 | 0 | 0 | 0 | 284,158 | $0.40 | 1.6% |
| Gross Potential Rent(4) | $16,028,828 | $16,698,819 | $15,462,473 | $14,007,922 | $18,072,249 | $25.38 | 100.0% |
| Total Reimbursements | 3,140,777 | 3,447,944 | 3,206,480 | 2,883,582 | 3,622,156 | $5.09 | 20.0% |
| Net Rental Income | $16,140,832 | $16,698,819 | $13,890,485 | $13,876,148 | $17,221,570 | $24.18 | 100.0% |
| (Vacancy/Credit Loss) | 112,004 | 0 | (1,571,988) | (131,774) | (850,679) | ($1.19) | (4.7%) |
| Total Other Income | 79,477 | 23,782 | 28,098 | 5,700 | 12,000 | $0.02 | 0.1% |
| Effective Gross Income | $16,140,832 | $16,698,819 | $13,890,485 | $13,876,148 | $17,221,570 | $24.18 | 100.0% |
| Total Expenses | 4,323,944 | 4,680,581 | 4,648,753 | 5,185,800 | 4,980,705 | $6.99 | 28.9% |
| Net Operating Income(5) | $11,816,888 | $12,018,238 | $9,241,732 | $8,690,348 | $12,240,865 | $17.19 | 71.1% |
| Total TI/LC, RR | 0 | 0 | 0 | 0 | 331,446 | $0.47 | 1.9% |
| Net Cash Flow | $11,816,888 | $12,018,238 | $9,241,732 | $8,690,348 | $11,909,419 | $16.72 | 69.2% |
| (1) | % column represents percent of Gross Potential Rent for all revenue lines and represents percent of Effective Gross Income for the remainder of the fields. |
| (2) | Underwritten Base Rent is based on the underwritten rent roll as of November 30, 2021. |
| (3) | Rent steps underwritten through the termination option per the tenant’s lease. |
| (4) | Gross Potential Rent includes annual income from the payout of a $17 million tax increment fund promissory note. Please see “Description of the Mortgage Pool-Real Estate and Other Tax Considerations” in the Preliminary Prospectus. |
| (5) | The increase from the TTM 10/31/2021 NOI $8,690,348 to Underwritten Net Operating Income $12,240,865 is primarily attributable to new leasing activity such as At Home Stores, LA Fitness, NIKE Retail Services, Inc., Club Pilates, Nothing Bundt Cakes, and Ledo Pizza. |
Property Management. The Woodmore Towne Centre Property is managed by Heritage Partners, LLC, a third-party management company.
Escrows and Reserves. At origination, the borrowers deposited approximately (i) $189,669.57 into a real estate tax reserve and (ii) $4,194,252 for tenant improvement and leasing commissions, landlord work, gap rent and free rent into an unfunded obligations reserve.
Tax Reserve – The borrowers are required to deposit into a real estate tax reserve, on a monthly basis, 1/12th of the reasonably estimated annual real estate taxes; provided, however, that in lieu of remitting such amounts for deposit, the borrowers may fund the tax reserve by
THE INFORMATION IN THIS STRUCTURAL AND COLLATERAL TERM SHEET IS NOT COMPLETE AND MAY BE AMENDED PRIOR TO THE TIME OF SALE. THIS TERM SHEET IS NOT AN OFFER TO SELL THESE SECURITIES AND IT IS NOT A SOLICITATION OF AN OFFER TO BUY THESE SECURITIES IN ANY JURISDICTION WHERE THE OFFER OR SALE IS NOT PERMITTED.
113 of 158
| Structural and Collateral Term Sheet | Benchmark 2022-B32 | |
| Woodmore Towne Centre | ||
delivering to the lender (i) a qualifying letter of credit in such amount or (ii) so long as no event of default is continuing, a qualifying guaranty in such amount, in each case in accordance with the Woodmore Towne Centre Whole Loan documents.
Insurance Reserve – The borrowers are required to deposit into an insurance reserve, 1/12th of reasonably estimated insurance premiums unless the borrowers maintain a blanket policy in accordance with the Woodmore Towne Centre Whole Loan documents; provided, however, that in lieu of remitting such amounts for deposit, the borrowers may fund the insurance reserve by delivering to the lender (i) a qualifying letter of credit in such amount or (ii) so long as no event of default is continuing, a qualifying guaranty in such amount, in each case in accordance with the Woodmore Towne Centre Whole Loan documents.
TI/LC Reserve – The borrowers are required to deposit into a tenant improvement and leasing commission reserve, on a monthly basis, an amount equal to $29,671.63 if the balance of the TI/LC reserve falls below $1,068,178.68 minus any termination proceeds received in connection with the termination of any leases entered into by the borrowers; provided, however, that in lieu of remitting such amounts for deposit, the borrowers may fund the TI/LC reserve by delivering to the lender (i) a qualifying letter of credit in such amount or (ii) so long as no event of default is continuing, a qualifying guaranty in such amount, in each case in accordance with the Woodmore Towne Centre Whole Loan documents.
Capital Expenditures Reserve – The borrowers are required to deposit into a capital expenditures reserve, on a monthly basis, an amount equal to $6,885.13 (1/12th of $0.20 per square foot per annum) if the balance in the capital expenditures reserve falls below an amount equal to $0.60 per square foot (excluding outparcels and standalone buildings leased to tenants responsible for the maintenance of their space so long as all maintenance of such space is the sole responsibility of the applicable tenant under its lease); provided, however, that in lieu of remitting such amounts for deposit, the borrowers may fund the capital expenditures reserve by delivering to the lender (i) a qualifying letter of credit in such amount or (ii) so long as no event of default is continuing, a qualifying guaranty in such amount, in each case in accordance with the Woodmore Towne Centre Whole Loan documents
Lockbox / Cash Management. The Woodmore Towne Centre Whole Loan is structured with a hard lockbox and springing cash management. The borrowers were required to direct each tenant to remit all rents directly to a lender-controlled lockbox account. In addition, the borrowers are required to cause all cash revenues relating to the Woodmore Towne Centre Property and all other money received by the borrowers or the property manager with respect to the Woodmore Towne Centre Property (other than tenant security deposits and cash revenues properly released to the borrowers) to be deposited into the lockbox account or a lender-controlled cash management account by the end of the second business day following receipt. At the end of each business day during the continuance of a Woodmore Towne Centre Trigger Period, an Anchor Lease Reserve Period (as defined below) or event of default under the Woodmore Towne Centre Whole Loan documents, all amounts in the lockbox are required to be remitted to the cash management account. At the end of each business day that no Woodmore Towne Centre Trigger Period, Anchor Lease Reserve Period or an event of default under the Woodmore Towne Centre Whole Loan is continuing, all amounts in the lockbox account are required to be remitted to a borrower-controlled operating account.
On each due date during the continuance of a Woodmore Towne Centre Trigger Period or Anchor Release Reserve Period (or, at the lender’s discretion, during an event of default under the Woodmore Towne Centre Whole Loan), all funds on deposit in the cash management account after payment of debt service on the Woodmore Towne Centre Whole Loan, required reserves and budgeted operating expenses are required to be deposited into an excess cash flow reserve account as additional collateral for the Woodmore Towne Centre Whole Loan.
A “Woodmore Towne Centre Trigger Period” means (i) subject to the borrowers’ right to partially defease the Woodmore Towne Centre Whole Loan, each period commencing when the debt yield (as calculated under the Woodmore Towne Centre Whole Loan documents, as determined as of the first day of any fiscal quarter, is less than 7.0% and concluding when the debt yield, determined as of the first day of each of two consecutive fiscal quarters thereafter, is equal to or greater than 7.0%, (ii) following 10 days’ prior written notice to the borrowers, each period commencing upon the borrowers’ failure to deliver annual, quarterly or monthly financial reports as and when required under the Woodmore Towne Centre Whole Loan documents and concluding when such reports are delivered and indicate that no other Woodmore Towne Centre Trigger Period is continuing, (iii) each period commencing upon the occurrence of an event of default under any related mezzanine loan documents and concluding when such event of default is cured, and (iv) an Anchor Lease Reserve Period.
An “Anchor Lease Reserve Period” means each period that commences upon the occurrence of an Anchor Lease Trigger Event (as defined below) and concludes when an Anchor Release Replacement Event (as defined below) has occurred with respect to each Anchor Lease Trigger Event that has occurred.
An “Anchor Lease Trigger Event” means, in respect of any Anchor Lease (as defined below), (i) the occurrence of an event of default beyond any applicable grace or cure period under such Anchor Lease, (ii) the tenant thereunder or any guarantor thereof becomes the subject of a bankruptcy or similar insolvency proceedings, or (iii) the tenant thereunder delivers written notice to the borrowers of its intention to surrender, cancel or terminate a material portion of the space demised thereunder within the period equal to 12 months prior to lease expirations, or the tenant thereunder has not renewed its Anchor Lease at least 12 months prior to lease expiration.
THE INFORMATION IN THIS STRUCTURAL AND COLLATERAL TERM SHEET IS NOT COMPLETE AND MAY BE AMENDED PRIOR TO THE TIME OF SALE. THIS TERM SHEET IS NOT AN OFFER TO SELL THESE SECURITIES AND IT IS NOT A SOLICITATION OF AN OFFER TO BUY THESE SECURITIES IN ANY JURISDICTION WHERE THE OFFER OR SALE IS NOT PERMITTED.
114 of 158
| Structural and Collateral Term Sheet | Benchmark 2022-B32 | |
| Woodmore Towne Centre | ||
An “Anchor Lease Replacement Event” means, with respect to any Anchor Lease in respect of which an Anchor Lease Trigger Event has occurred, the occurrence of, (1) with respect to an Anchor Lease Trigger Event (a) under clause (i) above, the tenant under such Anchor Lease cures the applicable event of default under its Anchor Lease, (b) under clause (ii) above, the tenant under such Anchor Lease affirms such Anchor Lease or the applicable bankruptcy or insolvency proceeding terminates, (c) under clause (iii) above, the tenant under such Anchor Lease revokes or withdraws its written notice to surrender, cancel or terminate or exercises its right to renew such Anchor Lease pursuant to an extension option or execution of an amendment or restatement to such Anchor Lease to extend the term, or (2) (x) the borrowers have entered into one or more qualifying replacement leases with respect to at least 80% of the space demised under the Anchor Lease that caused such Anchor Lease Trigger Event to have occurred and (y) after giving effect to such qualifying replacement leases, the debt yield is at least equal to the debt yield at loan origination.
An “Anchor Lease” means (i) each major lease that has a term that expires prior to the Maturity Date, (ii) the At Home Stores LLC lease, (iii) the Costco lease and (iv) the Wegmans lease.
Current Mezzanine or Subordinate Indebtedness. A certain $78,000,000 reverse 1031 exchange Promissory Note was made by UE Woodmore TC LLC in favor of the guarantor. The guarantor entered into subordination and standstill terms with the lender applicable to this note.
Future Mezzanine or Subordinate Indebtedness Permitted. None.
Partial Release. None.
THE INFORMATION IN THIS STRUCTURAL AND COLLATERAL TERM SHEET IS NOT COMPLETE AND MAY BE AMENDED PRIOR TO THE TIME OF SALE. THIS TERM SHEET IS NOT AN OFFER TO SELL THESE SECURITIES AND IT IS NOT A SOLICITATION OF AN OFFER TO BUY THESE SECURITIES IN ANY JURISDICTION WHERE THE OFFER OR SALE IS NOT PERMITTED.
115 of 158
| Structural and Collateral Term Sheet | Benchmark 2022-B32 | |
| Dealertrack and Divvy | ||

THE INFORMATION IN THIS STRUCTURAL AND COLLATERAL TERM SHEET IS NOT COMPLETE AND MAY BE AMENDED PRIOR TO THE TIME OF SALE. THIS TERM SHEET IS NOT AN OFFER TO SELL THESE SECURITIES AND IT IS NOT A SOLICITATION OF AN OFFER TO BUY THESE SECURITIES IN ANY JURISDICTION WHERE THE OFFER OR SALE IS NOT PERMITTED.
116 of 158
| Structural and Collateral Term Sheet | Benchmark 2022-B32 | |
| Dealertrack and Divvy | ||
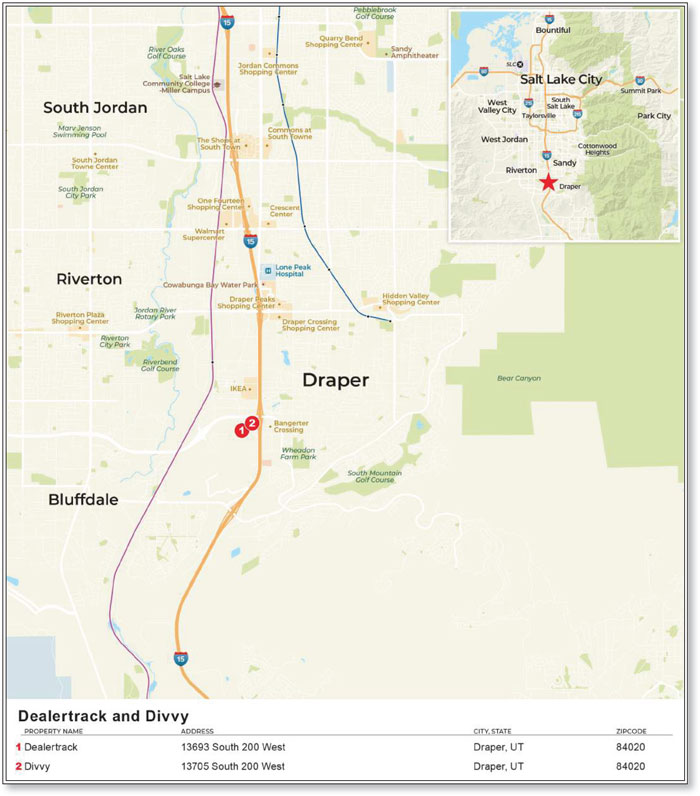
THE INFORMATION IN THIS STRUCTURAL AND COLLATERAL TERM SHEET IS NOT COMPLETE AND MAY BE AMENDED PRIOR TO THE TIME OF SALE. THIS TERM SHEET IS NOT AN OFFER TO SELL THESE SECURITIES AND IT IS NOT A SOLICITATION OF AN OFFER TO BUY THESE SECURITIES IN ANY JURISDICTION WHERE THE OFFER OR SALE IS NOT PERMITTED.
117 of 158
| Structural and Collateral Term Sheet | Benchmark 2022-B32 | |
| Dealertrack and Divvy | ||
| Mortgage Loan Information | Property Information | |||
| Mortgage Loan Seller: | CREFI | Single Asset / Portfolio: | Portfolio | |
| Original Principal Balance: | $74,500,000 | Title: | Fee | |
| Cut-off Date Principal Balance: | $74,500,000 | Property Type - Subtype: | Office - Suburban | |
| % of Pool by IPB: | 4.2% | Net Rentable Area (SF): | 318,832 | |
| Loan Purpose: | Acquisition | Location: | Draper, UT | |
| Borrower: | AREPIII DD Office Owner, LLC | Year Built / Renovated(1): | Various / NAP | |
| Guarantor: | Arden Real Estate Partners III, L.P. | Occupancy: | 100.0% | |
| Interest Rate: | 4.39000% | Occupancy Date(2): | Various | |
| Note Date: | 12/8/2021 | Number of Tenants: | 5 | |
| Maturity Date: | 1/6/2027 | Fourth Most Recent NOI(4): | NAV | |
| Interest-only Period: | 60 months | Third Most Recent NOI(4): | NAV | |
| Original Term: | 60 months | Second Most Recent NOI(4): | NAV | |
| Original Amortization: | None | Most Recent NOI: | $7,984,230 (TTM October 31, 2021) | |
| Amortization Type: | Interest Only | UW Economic Occupancy: | 95.0% | |
| Call Protection: | L(25),D(31),O(4) | UW Revenues: | $9,478,285 | |
| Lockbox / Cash Management: | Hard / Springing | UW Expenses: | $2,473,465 | |
| Additional Debt: | N/A | UW NOI: | $7,004,821 | |
| Additional Debt Balance: | N/A | UW NCF: | $6,496,185 | |
| Additional Debt Type: | N/A | Appraised Value / Per SF: | $109,500,000 / $343 | |
| Appraisal Date: | 11/19/2021 | |||
| Escrows and Reserves(3) | Financial Information | |||||
| Initial | Monthly | Initial Cap | Cut-off Date Loan / SF: | $234 | ||
| Taxes: | $228,726 | $76,242 | N/A | Maturity Date Loan / SF: | $234 | |
| Insurance: | $0 | Springing | N/A | Cut-off Date LTV: | 68.0% | |
| Replacement Reserves: | $0 | $5,314 | N/A | Maturity Date LTV: | 68.0% | |
| TI/LC: | $0 | $0 | N/A | UW NCF DSCR: | 1.96x | |
| Other: | $0 | $0 | N/A | UW NOI Debt Yield: | 9.4% | |
| Sources and Uses | ||||||
| Sources | Proceeds | % of Total | Uses | Proceeds | % of Total | |
| Loan Amount | $74,500,000 | 68.9% | Purchase Price | $106,290,000 | 98.2% | |
| Principal's New Cash Contribution | 33,463,734 | 30.9 | Closing Costs | 1,445,008 | 1.3 | |
| Other Sources(5) | 229,251 | 0.2 | Other Uses(5) | 229,251 | 0.2 | |
| Upfront Reserves | 228,726 | 0.2 | ||||
| Total Sources | $108,192,985 | 100.0% | Total Uses | $108,192,985 | 100.0% | |
| (1) | See “Portfolio Summary” table herein. |
| (2) | Based on the underwritten rent rolls dated November 3, 2021 and February 6, 2022. |
| (3) | For a full description of Escrows and Reserves, please refer to “Escrows and Reserves” below. |
| (4) | Historical cash flows are unavailable because the Dealertrack and Divvy Properties were recently acquired. |
| (5) | Other Sources and Other Uses relate to a $229,251 parking construction escrow held by the title company and reserved for adjacent parking included in the acquisition but not part of the DealerTrack and Divvy Properties (as defined below). |
The Loan. The Dealertrack and Divvy loan (the “Dealertrack and Divvy Loan”) is secured by a first mortgage lien on the borrower’s fee simple interests in two office properties located in Draper, Utah (collectively, the “Dealertrack and Divvy Properties”). The Dealertrack and Divvy Loan accrues interest at an interest rate of 4.39000% per annum, had an original term of 60 months, has a remaining term of 59 months as of the Cut-off Date and is interest only for the entire term.
The Borrower. The borrowing entity for the Dealertrack and Divvy Loan is AREPIII DD Office Owner, LLC, a Delaware limited liability company (the “Dealertrack and Divvy Borrower”).
The Loan Sponsor. The loan sponsor and non-recourse carveout guarantor is Arden Real Estate Partners III, L.P.
The Properties. The Dealertrack and Divvy Properties consist of two Class A office properties located in Draper, Utah, totaling 318,832 square feet of net rentable area. The Dealertrack property (the “Dealertrack Property”) is a 163,725 square foot, six-story multi-tenant office building that was built in 2018 and is situated on an 8.57-acre parcel. As of November 3, 2021, the Dealertrack Property was 100.0%
THE INFORMATION IN THIS STRUCTURAL AND COLLATERAL TERM SHEET IS NOT COMPLETE AND MAY BE AMENDED PRIOR TO THE TIME OF SALE. THIS TERM SHEET IS NOT AN OFFER TO SELL THESE SECURITIES AND IT IS NOT A SOLICITATION OF AN OFFER TO BUY THESE SECURITIES IN ANY JURISDICTION WHERE THE OFFER OR SALE IS NOT PERMITTED.
118 of 158
| Structural and Collateral Term Sheet | Benchmark 2022-B32 | |
| Dealertrack and Divvy | ||
occupied by four tenants. The Divvy property (the “Divvy Property”) is a 155,107 square foot, six-story single-tenant office building that was built in 2020 and is situated on a 7.83-acre parcel. As of February 6, 2022, the Divvy Property was 100.0% occupied by one tenant.
| Portfolio Summary | ||||||
| Property | Year Built / Renovated | Net Rentable Area (SF) | Occupancy %(1) | Allocated Loan Amount | Appraised | UW NOI % |
Dealertrack | 2018 / NAP | 163,725 | 100.0% | $37,760,274 | $55,500,000 | 52.6% |
Divvy | 2020 / NAP | 155,107 | 100.0% | 36,739,726 | 54,000,000 | 47.4% |
| Total / Wtd. Avg. | 318,832 | 100.0% | $74,500,000 | $109,500,000 | 100.0% | |
| (1) | Based on the underwritten rent rolls dated November 3, 2021 and February 6, 2022. |
The largest tenant at the Dealertrack and Divvy Properties is DivvyPay, Inc., (155,107 SF; 48.6% of NRA; 52.2% of UW Base Rent). Founded in 2016, DivvyPay, Inc. is a privately-owned company, which provides a secure financial platform for businesses to manage payments and subscriptions, build budgets, and eliminate expense reports. DivvyPay, Inc.’s fully-automated spending and expense management software is designed for small and medium size business and DivvyPay, Inc. utilizes the premises as its headquarters. DivvyPay, Inc. subleases the entire sixth floor to McGee Operations LLC.
The second largest tenant by underwritten base rent at the Dealertrack and Divvy Properties is Dealertrack, Inc. (Moody’s: Baa2; S&P: BBB; Fitch: BBB+) (112,900 SF; 35.4% of NRA; 31.2% of UW Base Rent). Dealertrack, Inc. is a provider of integrated automotive dealership software and systems. Dealertrack, Inc. offers an integrated suite of software to automotive dealerships and their lending partners designed to increase efficiency and decision making.
The third largest tenant by underwritten base rent at the Dealertrack and Divvy Properties is NAV Technologies (27,936 SF; 8.8% of NRA; 8.9% of UW Base Rent). Founded in 2012, NAV Technologies is a financial tech company with a platform that provides small and medium size business owners a path to financing. NAV Technologies provides free access to personal and business credit reports from major consumer and commercial credit bureaus.
COVID-19 Update. As of January 6, 2022, the Dealertrack and Divvy Properties are open and operating. As of February 6, 2022, there have been no loan modification or forbearance requests on the Dealertrack and Divvy Loan. The first payment date of the Dealertrack and Divvy Loan is the monthly due date in February 2022. See “Risk Factors—Special Risks—The Coronavirus Pandemic Has Adversely Affected the Global Economy and Will Likely Adversely Affect the Performance of the Mortgage Loans” in the Preliminary Prospectus.
| Historical and Current Occupancy | |||
| 2018(1) | 2019(1) | 2020(1) | Current(2) |
| NAV | NAV | NAV | 100.0% |
| (1) | Historical information is not available as the Dealertrack and Divvy Properties were recently acquired. |
| (2) | Current Occupancy is based on rent rolls dated November 3, 2021 and February 6, 2022. |
The Market. The Dealertrack and Divvy Properties are located in the southern portion of Salt Lake County, within the Southeast Valley submarket. According to the appraisal, as of the trailing four quarters ending third quarter of 2021, the Southeast Valley submarket had a total office inventory of 6,407,000 square feet with a vacancy rate of 15.6% and an average asking rent of $22.37 per square foot. According to the appraisal, as of 2021, the population within a one-, three-and five-mile radius of the Dealertrack and Divvy Properties was 9,364, 72,380 and 178,499, respectively. Additionally, over the same time period, the average household income within a one-, three- and five-mile radius was $119,693, $138,525 and $133,592, respectively.
THE INFORMATION IN THIS STRUCTURAL AND COLLATERAL TERM SHEET IS NOT COMPLETE AND MAY BE AMENDED PRIOR TO THE TIME OF SALE. THIS TERM SHEET IS NOT AN OFFER TO SELL THESE SECURITIES AND IT IS NOT A SOLICITATION OF AN OFFER TO BUY THESE SECURITIES IN ANY JURISDICTION WHERE THE OFFER OR SALE IS NOT PERMITTED.
119 of 158
| Structural and Collateral Term Sheet | Benchmark 2022-B32 | |
| Dealertrack and Divvy | ||
| Tenant Summary(1) | ||||||
| Tenant | Ratings Moody’s/S&P/Fitch | Net Rentable Area (SF) | % of Total NRA | UW Base Rent PSF | % of Total UW Base Rent | Lease Expiration Date |
| DivvyPay, Inc.(2) | NR / NR / NR | 155,107 | 48.6% | $30.47 | 52.2% | 5/31/2031 |
| Dealertrack, Inc.(3) | Baa2 / BBB / BBB+ | 112,900 | 35.4 | $24.97 | 31.2 | 12/31/2029 |
| NAV Technologies | NR / NR / NR | 27,936 | 8.8 | $28.89 | 8.9 | 10/31/2030 |
| Summit Sotheby's | NR / NR / NR | 12,500 | 3.9 | $29.80 | 4.1 | 9/30/2029 |
| Gold Standard Automotive | NR / NR / NR | 10,389 | 3.3 | $30.95 | 3.6 | 1/31/2024 |
| Subtotal / Weighted Average | 318,832 | 100.0% | $28.37 | 100.0% | ||
| Remaining Tenants | 0 | 0.0 | 0.00 | 0.0 | ||
| Vacant | 0 | 0.0 | ||||
| Total / Weighted Average | 318,832 | 100.0% | $28.37 | 100.0% | ||
| (1) | Based on the underwritten rent rolls dated November 3, 2021 and February 6, 2022. |
| (2) | DivvyPay, Inc. subleased the entire sixth floor (26,668 square feet) to McGee Operations LLC via a December 14, 2020 sublease for a 60-month term. |
| (3) | Dealertrack, Inc. has a contraction option to give back up to 50% of its space effective in October 2024 and April 2027 with 12 months of notice. |
| Lease Rollover Schedule(1)(2)(3) | |||||||||
| Year | Number of Leases Expiring | Net Rentable Area Expiring | % of NRA Expiring | Base Rent Expiring | % of Base Rent Expiring | Cumulative Net Rentable Area Expiring | Cumulative % of NRA Expiring | Cumulative Base Rent Expiring | Cumulative % of Base Rent Expiring |
| Vacant | NAP | 0 | 0.0% | NAP | NAP | 0 | 0.0% | NAP | NAP |
| MTM | 0 | 0 | 0 | $0 | 0.0% | 0 | 0.0% | $0 | 0.0% |
| 2022 | 0 | 0 | 0 | 0 | 0.0 | 0 | 0.0% | $0 | 0.0% |
| 2023 | 0 | 0 | 0 | 0 | 0.0 | 0 | 0.0% | $0 | 0.0% |
| 2024 | 1 | 10,389 | 3.3 | 321,532 | 3.6 | 10,389 | 3.3% | $321,532 | 3.6% |
| 2025 | 0 | 0 | 0.0 | 0 | 0.0 | 10,389 | 3.3% | $321,532 | 3.6% |
| 2026 | 0 | 0 | 0.0 | 0 | 0.0 | 10,389 | 3.3% | $321,532 | 3.6% |
| 2027 | 0 | 0 | 0.0 | 0 | 0.0 | 10,389 | 3.3% | $321,532 | 3.6% |
| 2028 | 0 | 0 | 0.0 | 0 | 0.0 | 10,389 | 3.3% | $321,532 | 3.6% |
| 2029 | 2 | 125,400 | 39.3 | 3,191,232 | 35.3 | 135,789 | 42.6% | $3,512,764 | 38.8% |
| 2030 | 1 | 27,936 | 8.8 | 807,132 | 8.9 | 163,725 | 51.4% | $4,319,896 | 47.8% |
| 2031 | 1 | 155,107 | 48.6 | 4,725,819 | 52.2 | 318,832 | 100.0% | $9,045,715 | 100.0% |
| 2032 & Thereafter | 0 | 0 | 0.0 | 0 | 0.0 | 318,832 | 100.0% | $9,045,715 | 100.0% |
| Total | 5 | 318,832 | 100.0% | $9,045,715 | 100.0% | ||||
| (1) | Based on the underwritten rent rolls dated November 3, 2021 and February 6, 2022. |
| (2) | Certain tenants may have termination options that are exercisable prior to the originally stated expiration date of the subject lease and that are not considered in the Lease Rollover Schedule. |
| (3) | Base Rent includes rent steps occurring through December 1, 2022 for the Dealertrack Property, June 1, 2022 for Divvy Property and the average rent over the lease term for investment grade tenants. |
THE INFORMATION IN THIS STRUCTURAL AND COLLATERAL TERM SHEET IS NOT COMPLETE AND MAY BE AMENDED PRIOR TO THE TIME OF SALE. THIS TERM SHEET IS NOT AN OFFER TO SELL THESE SECURITIES AND IT IS NOT A SOLICITATION OF AN OFFER TO BUY THESE SECURITIES IN ANY JURISDICTION WHERE THE OFFER OR SALE IS NOT PERMITTED.
120 of 158
| Structural and Collateral Term Sheet | Benchmark 2022-B32 | |
| Dealertrack and Divvy | ||
| Underwritten Net Cash Flow(1) | ||||
| TTM 10/31/2021 | Underwritten(2) | Per Square Foot | %(3) | |
| Base Rent | $8,489,427 | $8,594,200 | $26.96 | 86.1% |
| Rent Steps(4) | 0 | 451,515 | 1.42 | 4.5 |
| Gross Potential Rent | $8,489,427 | $9,045,715 | $28.37 | 90.7% |
| Total Reimbursements | 1,642,492 | 931,427 | 2.92 | 9.3 |
| Net Rental Income | $10,131,919 | $9,977,142 | $31.29 | 100.0% |
| (Vacancy/Credit Loss) | 0 | (498,857) | (1.56) | (5.0) |
| Other Income | 0 | 0 | 0.00 | 0.0 |
| Effective Gross Income | $10,131,919 | $9,478,285 | $29.73 | 95.0% |
| Real Estate Taxes | 846,758 | 871,337 | 2.73 | 9.2 |
| Insurance | 61,918 | 93,341 | 0.29 | 1.0 |
| Management Fee | 303,958 | 284,349 | 0.89 | 3.0 |
| Other Operating Expenses | 935,055 | 1,224,438 | 3.84 | 12.9 |
| Total Expenses | $2,147,689 | $2,473,465 | $7.76 | 26.1% |
| Net Operating Income | $7,984,230 | $7,004,821 | $21.97 | 73.9% |
| TI/LC | 0 | 444,869 | 1.40 | 4.7 |
| Capital Expenditures | 0 | 63,766 | 0.20 | 0.7 |
| Net Cash Flow | $7,984,230 | $6,496,185 | $20.37 | 68.5% |
| (1) | Historical cash flows are unavailable because the Divvy Property was built in 2020. |
| (2) | Based on the underwritten rent rolls dated November 3, 2021 and February 6, 2022. |
| (3) | % column represents percent of Net Rental Income for all revenue lines and represents percent of Effective Gross Income the remainder of the fields. |
| (4) | Rent Steps represent increases occurring through December 1, 2022 for the Dealertrack Property, June 1, 2022 for the Divvy Property and the average rent over the lease term for investment grade tenants. |
Property Management. The Dealertrack and Divvy Properties are managed by The Boyer Company, L.C., a Utah limited liability company.
Escrows and Reserves. At origination of the Dealertrack and Divvy Loan, the Dealertrack and Divvy Borrower deposited approximately $228,726 into a real estate taxes reserve.
Tax Reserve – The Dealertrack and Divvy Borrower is required to deposit into a real estate tax reserve, on a monthly basis, 1/12th of the real estate taxes that lender estimates will be payable during the ensuing 12 months (initially estimated to be approximately $76,242).
Insurance Reserve – The Dealertrack and Divvy Borrower is required to deposit into an insurance reserve, on a monthly basis, an amount equal to 1/12th of the insurance premiums that would be sufficient for the renewal of coverage unless the Dealertrack and Divvy Borrower maintains an acceptable blanket policy in accordance with the Dealertrack and Divvy Loan documents. As of the origination date, an acceptable blanket policy was in place.
Replacement Reserve– The Dealertrack and Divvy Borrower is required to deposit into a replacement reserve, on a monthly basis, an amount equal to approximately $5,314 for replacement reserves.
Lockbox / Cash Management. The Dealertrack and Divvy Loan is structured with a hard lockbox and springing cash management. At origination of the Dealertrack and Divvy Loan, the borrower was required to deliver a tenant direction letter to the existing tenants at the Dealertrack and Divvy Properties, directing them to remit their rent checks directly to the lender-controlled lockbox. The Dealertrack and Divvy Borrower is required to cause all revenue received by borrower or the property manager for the Dealertrack and Divvy Properties to be deposited into such lockbox immediately following receipt. All funds deposited into the lockbox are required to be transferred on each business day to or at the direction of borrower unless a Trigger Period (as defined below) exists. Upon the occurrence and during the continuance of a Trigger Period, all funds in the lockbox account are required to be swept on each business day to a cash management account under the control of the lender to be applied and disbursed in accordance with the Dealertrack and Divvy Loan documents, and all excess cash flow funds remaining in the cash management account after the application of such funds in accordance with the Dealertrack and Divvy Loan documents are required to be held by the lender in an excess cash flow reserve account as additional collateral for the Dealertrack and Divvy Loan. Upon the cure of the applicable Trigger Period, so long as no other Trigger Period exists, the lender is required to return any amounts remaining on deposit in the excess cash flow reserve account to the borrower. Upon an event of default under the Dealertrack and Divvy Loan documents, the lender will apply funds to the debt in such priority as it may determine.
THE INFORMATION IN THIS STRUCTURAL AND COLLATERAL TERM SHEET IS NOT COMPLETE AND MAY BE AMENDED PRIOR TO THE TIME OF SALE. THIS TERM SHEET IS NOT AN OFFER TO SELL THESE SECURITIES AND IT IS NOT A SOLICITATION OF AN OFFER TO BUY THESE SECURITIES IN ANY JURISDICTION WHERE THE OFFER OR SALE IS NOT PERMITTED.
121 of 158
| Structural and Collateral Term Sheet | Benchmark 2022-B32 | |
| Dealertrack and Divvy | ||
A “Trigger Period” means a period (A) commencing upon the earliest of (i) the occurrence and continuance of an event of default, (ii) the debt service coverage ratio falling below 1.50x (a “DSCR Trigger”) (provided, however, no DSCR Trigger will be deemed to exist during any period that the Collateral Cure Conditions (as defined below) are satisfied), and (iii) the occurrence of a Specified Tenant Trigger Period (as defined below); and (B) expiring upon (x) with regard to any Trigger Period commenced in connection with clause (i) above, the cure (if applicable) of such event of default, (y) with regard to any Trigger Period commenced in connection with clause (ii) above, the date that the debt service coverage ratio is equal to or greater than 1.50x for two consecutive calendar quarters and (z) with regard to any Trigger Period commenced in connection with clause (iii) above, a Specified Tenant Trigger Period ceasing to exist in accordance with the terms of the Dealertrack and Divvy Loan documents. Notwithstanding the foregoing, a Trigger Period will not be deemed to expire in the event that a Trigger Period then exists for any other reason.
“Collateral Cure Conditions” means Dealertrack and Divvy Borrower deposits cash into an account with lender or delivers to lender a letter of credit which, in either case, serves as additional collateral for the Dealertrack and Divvy Borrower Loan, equal to the amount which would cause the debt service coverage ratio to equal or exceed 1.50x. The collateral will be returned to Dealertrack and Divvy Borrower, provided no event of default is ongoing, at such time as the debt service coverage ratio (without taking into account the cash deposit and/or letter of credit) will equal or be greater than 1.50x for two consecutive calendar quarters.
A “Specified Tenant Trigger Period” means a period (A) commencing upon the first to occur (i) any Specified Tenant (as defined below) being in monetary or material non-monetary default under the applicable Specified Tenant lease (ii) any Specified Tenant (x) failing to be in actual, physical possession of the Specified Tenant space (or applicable portion thereof), and/or (y) other than in connection with a Permitted Go Dark Event, failing to be open to the public for business during customary hours and/or “going dark” in 50% or more of the Specified Tenant space, (iii) any Specified Tenant giving notice that it is terminating its lease for all or any portion of the Specified Tenant space (or applicable portion thereof), however this notice shall only be given 24 months prior to the date on which the Specified Tenant intends the applicable termination date, (iv) any termination or cancellation of any Specified Tenant lease (including, without limitation, rejection in any bankruptcy or similar insolvency proceeding) and/or any Specified Tenant lease failing to otherwise be in full force and effect, (v) any bankruptcy or similar insolvency of any Specified Tenant, (vi) any Specified Tenant failing to extend or renew its lease on or prior to the earlier of 12 months prior to the expiration of the then applicable term of such lease or the date set forth in such lease for which the applicable Specified Tenant is required to give its renewal notice; and (B) expiring upon the first to occur of lender’s receipt of reasonably satisfactory evidence of (1) satisfaction of the Specified Tenant Cure Conditions (as defined below) or (2) Dealertrack and Divvy Borrower leasing the Specified Tenant space (or portion thereof), the applicable tenant under such lease being in actual, physical occupancy of, and open to the public for business in, the space demised under its lease and paying the full amount of the rent due thereunder.
A “Specified Tenant” means, as applicable, (i) Dealertrack, Inc., a Delaware corporation, (ii) DivvyPay, LLC, a Delaware limited liability company, (iii) any other lessee(s) that lease (in the aggregate) at least 28,000 rentable square feet of the Specified Tenant space and (iv) any guarantor(s) of the applicable related Specified Tenant lease(s).
The “Specified Tenant Cure Conditions” means each of the following, as applicable: (i) the applicable Specified Tenant has cured all defaults under its lease, (ii) the applicable Specified Tenant is in actual, physical possession of the applicable Specified Tenant space (or applicable portion thereof), open to the public for business during customary hours and not “dark” in the applicable Specified Tenant space (or applicable portion thereof) or the Sublease Conditions (as defined below) are satisfied, (iii) the applicable Specified Tenant has revoked or rescinded all termination or cancellation notices with respect to the applicable Specified Tenant Lease and has re-affirmed the applicable Specified Tenant Lease as being in full force and effect, (iv) in the event the Specified Tenant Trigger Period is due to the applicable Specified Tenant’s failure to extend or renew the applicable Specified Tenant Lease in accordance with clause (v) of the definition of “Specified Tenant Trigger Period”, the applicable Specified Tenant has renewed or extended the applicable Specified Tenant Lease in accordance with the terms hereof and thereof for at least a five year term, (vi) with respect to any applicable bankruptcy or insolvency proceedings involving the applicable Specified Tenant, the applicable Specified Tenant is no longer insolvent or subject to any bankruptcy or insolvency proceedings and has affirmed its lease pursuant to final, non-appealable order of a court of competent jurisdiction, and (vii) the applicable Specified Tenant is paying full, unabated rent under its lease.
“Sublease Conditions” means that: (i) 75% or more of the applicable Specified Tenant space is demised to one or more subtenants pursuant to one or more subleases entered into in accordance with the Dealertrack and Divvy Loan, (ii) each such subtenant is open for business in the entirety of such space, (iii) each such sublease is co-terminus with the applicable Specified Tenant lease, (iv) each such sublease provides economic terms as favorable or better than the Specified Tenant Lease, (v) each such subtenant is paying full unabated rent pursuant, is not in default, and is not subject to a bankruptcy or insolvency proceeding, (vi) no such subtenant has sent any written notice indicating an intent to “go dark” and/or terminate its sublease and (vii) each such subtenant is of an equal or higher credit quality as the tenant pursuant to the applicable Specified Tenant lease.
Current Mezzanine or Subordinate Indebtedness. None.
Future Mezzanine or Subordinate Indebtedness Permitted. None.
Partial Release. None.
THE INFORMATION IN THIS STRUCTURAL AND COLLATERAL TERM SHEET IS NOT COMPLETE AND MAY BE AMENDED PRIOR TO THE TIME OF SALE. THIS TERM SHEET IS NOT AN OFFER TO SELL THESE SECURITIES AND IT IS NOT A SOLICITATION OF AN OFFER TO BUY THESE SECURITIES IN ANY JURISDICTION WHERE THE OFFER OR SALE IS NOT PERMITTED.
122 of 158
(THIS PAGE INTENTIONALLY LEFT BLANK)
THE INFORMATION IN THIS STRUCTURAL AND COLLATERAL TERM SHEET IS NOT COMPLETE AND MAY BE AMENDED PRIOR TO THE TIME OF SALE. THIS TERM SHEET IS NOT AN OFFER TO SELL THESE SECURITIES AND IT IS NOT A SOLICITATION OF AN OFFER TO BUY THESE SECURITIES IN ANY JURISDICTION WHERE THE OFFER OR SALE IS NOT PERMITTED.
123 of 158
| Structural and Collateral Term Sheet | Benchmark 2022-B32 | |
| The Summit | ||
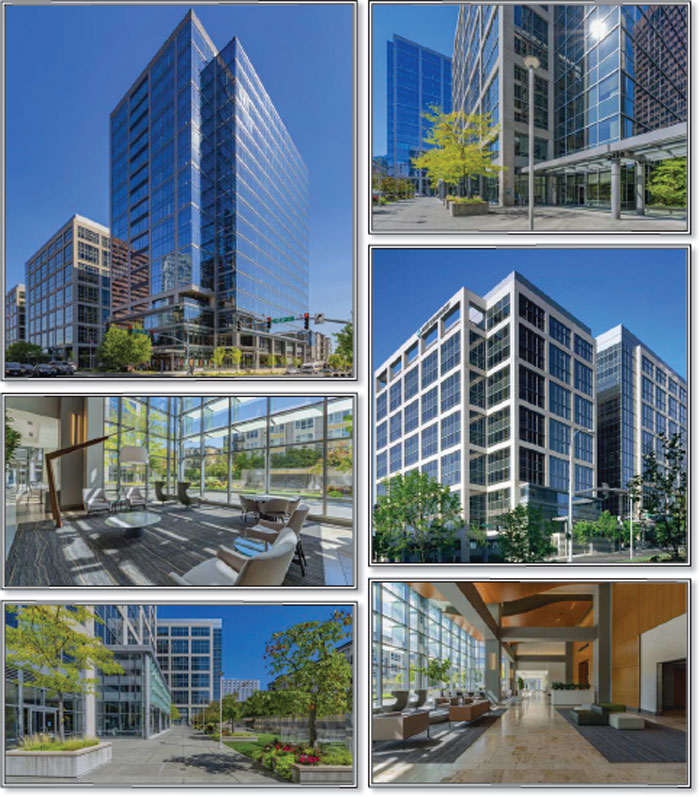
THE INFORMATION IN THIS STRUCTURAL AND COLLATERAL TERM SHEET IS NOT COMPLETE AND MAY BE AMENDED PRIOR TO THE TIME OF SALE. THIS TERM SHEET IS NOT AN OFFER TO SELL THESE SECURITIES AND IT IS NOT A SOLICITATION OF AN OFFER TO BUY THESE SECURITIES IN ANY JURISDICTION WHERE THE OFFER OR SALE IS NOT PERMITTED.
124 of 158
| Structural and Collateral Term Sheet | Benchmark 2022-B32 | |
| The Summit | ||
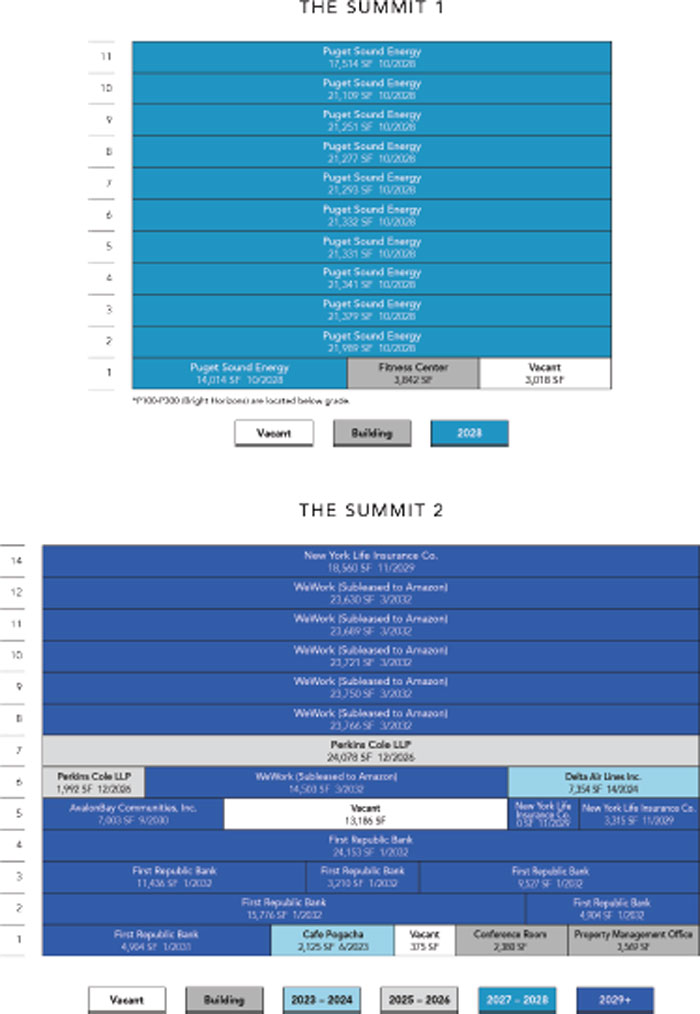
THE INFORMATION IN THIS STRUCTURAL AND COLLATERAL TERM SHEET IS NOT COMPLETE AND MAY BE AMENDED PRIOR TO THE TIME OF SALE. THIS TERM SHEET IS NOT AN OFFER TO SELL THESE SECURITIES AND IT IS NOT A SOLICITATION OF AN OFFER TO BUY THESE SECURITIES IN ANY JURISDICTION WHERE THE OFFER OR SALE IS NOT PERMITTED.
125 of 158
| Structural and Collateral Term Sheet | Benchmark 2022-B32 | |
| The Summit | ||
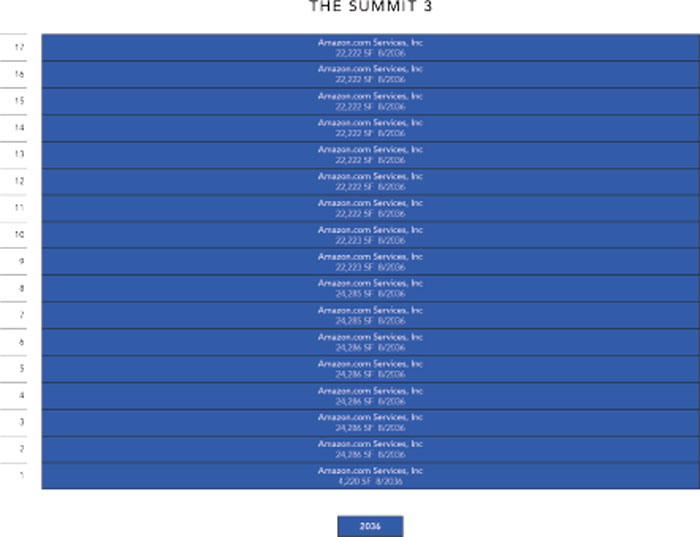
THE INFORMATION IN THIS STRUCTURAL AND COLLATERAL TERM SHEET IS NOT COMPLETE AND MAY BE AMENDED PRIOR TO THE TIME OF SALE. THIS TERM SHEET IS NOT AN OFFER TO SELL THESE SECURITIES AND IT IS NOT A SOLICITATION OF AN OFFER TO BUY THESE SECURITIES IN ANY JURISDICTION WHERE THE OFFER OR SALE IS NOT PERMITTED.
126 of 158
| Structural and Collateral Term Sheet | Benchmark 2022-B32 | |
| The Summit | ||
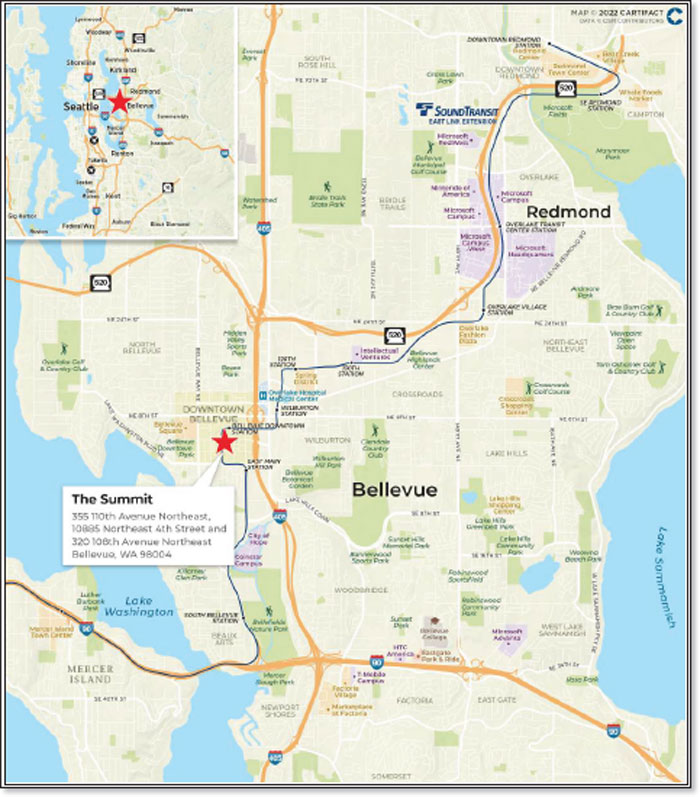
THE INFORMATION IN THIS STRUCTURAL AND COLLATERAL TERM SHEET IS NOT COMPLETE AND MAY BE AMENDED PRIOR TO THE TIME OF SALE. THIS TERM SHEET IS NOT AN OFFER TO SELL THESE SECURITIES AND IT IS NOT A SOLICITATION OF AN OFFER TO BUY THESE SECURITIES IN ANY JURISDICTION WHERE THE OFFER OR SALE IS NOT PERMITTED.
127 of 158
| Structural and Collateral Term Sheet | Benchmark 2022-B32 | |
| The Summit | ||
| Mortgage Loan Information | Property Information | |||
| Mortgage Loan Seller: | GSMC | Single Asset / Portfolio: | Single Asset | |
| Original Principal Balance(1): | $65,000,000 | Title: | Fee | |
| Cut-off Date Principal Balance(1): | $65,000,000 | Property Type - Subtype: | Office – CBD | |
| % of Pool by IPB: | 3.7% | Net Rentable Area (SF): | 907,306 | |
| Loan Purpose: | Refinance | Location: | Bellevue, WA | |
| Borrowers: | KRE Summit 1, 2, Owner LLC and | Year Built / Renovated: | 2002, 2005, 2021 / NAP | |
| KRE Summit 3 Owner LLC | Occupancy: | 98.2% | ||
| Guarantors: | KKR Property Partners Americas | Occupancy Date: | 1/1/2022 | |
| (EEA) SCSp and KKR Property | Number of Tenants: | 13 | ||
| Partners Americas L.P. | Fourth Most Recent NOI: | NAV | ||
| Interest Rate: | 2.95200% | Third Most Recent NOI: | $17,630,561 (December 31, 2018) | |
| Note Date: | 12/10/2021 | Second Most Recent NOI: | $16,395,672 (December 31, 2019) | |
| Maturity Date: | 2/6/2029 | Most Recent NOI(3): | $20,849,893 (December 31, 2020) | |
| Interest-only Period: | 86 months | UW Economic Occupancy: | 96.3% | |
| Original Term: | 86 months | UW Revenues: | $57,071,586 | |
| Original Amortization: | None | UW Expenses: | $15,970,440 | |
| Amortization Type: | Interest Only | UW NOI(3): | $41,101,145 | |
| Call Protection(2): | L(24),YM1(2),DorYM1(53),O(7) | UW NCF: | $40,230,920 | |
| Lockbox / Cash Management: | Hard / Springing | Appraised Value / Per SF: | $895,500,000 / $987 | |
| Additional Debt(1): | Yes | Appraisal Date: | 11/1/2021 | |
| Additional Debt Balance(1): | $262,000,000 / $198,000,000 | |||
| Additional Debt Type(1): | Pari Passu / Subordinate | |||
| Escrows and Reserves(4) | Financial Information | ||||||
| Initial | Monthly | Initial Cap | Senior Notes | Whole Loan | |||
| Taxes: | $0 | Springing | N/A | Cut-off Date Loan / SF: | $360 | $579 | |
| Insurance: | $0 | Springing | N/A | Maturity Date Loan / SF: | $360 | $579 | |
| Replacement Reserves: | $0 | Springing | N/A | Cut-off Date LTV: | 36.5% | 58.6% | |
| TI/LC: | $0 | $0 | N/A | Maturity Date LTV: | 36.5% | 58.6% | |
| Other(5): | $9,900,543 | Springing | N/A | UW NCF DSCR: | 4.11x | 2.56x | |
| UW NOI Debt Yield: | 12.6% | 7.8% | |||||
| Sources and Uses | ||||||
| Sources | Proceeds | % of Total | Uses | Proceeds | % of Total | |
| Loan Amount | $327,000,000 | 62.3% | Loan Payoff | $382,728,320 | 72.9% | |
| Subordinate Debt | 198,000,000 | 37.7 | Return of Equity | 129,305,151 | 24.6 | |
| Reserves | 9,900,543 | 1.9 | ||||
| Closing Costs | 3,065,986 | 0.6 | ||||
| Total Sources | $525,000,000 | 100.0% | Total Uses | $525,000,000 | 100.0% | |
| (1) | The Summit Whole Loan (as defined below) is part of a whole loan evidenced by (i) eight pari passu notes, with an aggregate outstanding principal balance as of the Cut-off Date of $327.0 million and (ii) two pari passu subordinate notes with an aggregate outstanding principal balance as of the Cut-off Date of $198.0 million. The Financial Information in the chart above reflects the Cut-off Date Balance of The Summit Whole Loan. |
| (2) | The defeasance lockout period, with respect to a defeasance of The Summit Whole Loan, will be at least 26 payment dates beginning with and including the first payment date on January 6, 2022. Defeasance of the full $525.0 million The Summit Whole Loan is permitted after the date that is earlier of (i) two years from the closing date of the securitization that includes the last note to be securitized and (ii) December 10, 2024. In addition, The Summit Whole Loan may be voluntarily prepaid in whole (but not in part, except to the extent permitted to cure certain trigger events described in The Summit Whole Loan documents) on the payment date in January 2024, and at any time thereafter, subject to payment of a prepayment fee equal to the greater of (a) the yield maintenance amount and (b) 1% of the principal balance that is being prepaid as of the prepayment date if such prepayment occurs prior to the payment date in August 2028. |
| (3) | The increase from the Most Recent NOI to Underwritten Net Operating Income is primarily attributable to the inclusion of the Amazon (as defined below) lease ($13,232,419 Underwritten Base Rent), as well as an increase in parking garage income per the Sponsor Budget ($2,979,702) and the straight-line rent for investment grade tenants ($1,614,740). |
| (4) | For a full description of Escrows and Reserves, please refer to “Escrows and Reserves” below. |
| (5) | Other initial reserves include (i) $2,958,400 into a reserve for free rent and outstanding or abated rent and/or any bridge/gap rent and (ii) $6,942,143 for outstanding tenant improvement allowances and leasing commissions. |
The Loan. The Summit mortgage loan (“The Summit Loan” or “The Summit Trust Senior Note”) is part of a whole loan with an aggregate outstanding principal balance as of the Cut-off Date of $525.0 million (the “The Summit Whole Loan”) consisting of (i) eight senior pari passu notes with an aggregate outstanding principal balance as of the Cut-off Date of $327.0 million (“The Summit Senior Notes”) and
THE INFORMATION IN THIS STRUCTURAL AND COLLATERAL TERM SHEET IS NOT COMPLETE AND MAY BE AMENDED PRIOR TO THE TIME OF SALE. THIS TERM SHEET IS NOT AN OFFER TO SELL THESE SECURITIES AND IT IS NOT A SOLICITATION OF AN OFFER TO BUY THESE SECURITIES IN ANY JURISDICTION WHERE THE OFFER OR SALE IS NOT PERMITTED.
128 of 158
| Structural and Collateral Term Sheet | Benchmark 2022-B32 | |
| The Summit | ||
(ii) two pari passu subordinate notes with an aggregate outstanding principal balance as of the Cut-off Date of $198.0 million (“The Summit Subordinate Loan”). The Summit Whole Loan is secured by the borrowers’ fee interest in a 907,306 square foot Class A, office campus which includes three buildings and a seven-level 2,197 space subterranean parking garage located in the central business district of Bellevue, Washington (the “The Summit Property”). The non-controlling Note A-2-1, with an outstanding principal balance as of the Cut-off Date of $65.0 million, will be included in the mortgage pool for the Benchmark 2022-B32 mortgage trust. The remaining seven senior pari passu notes (the “The Summit Non-Trust Senior Notes”) have an aggregate outstanding principal balance as of the Cut-off Date of $262.0 million and have been, or are expected to be, contributed to one or more future securitization trusts or may otherwise be transferred at any time.
The Summit Whole Loan, which accrues interest at an interest rate of 2.95200% per annum, was co-originated by Barclays Real Estate Capital Inc. and Goldman Sachs Bank USA on December 10, 2021, had an aggregate original principal balance of $525.0 million and has an aggregate outstanding principal balance as of the Cut-off Date of $525.0 million. The proceeds of The Summit Whole Loan were primarily used to refinance The Summit Property, pay origination costs, return equity to the loan sponsor and fund upfront reserves. The Summit Whole Loan was previously securitized in SUMIT 2022-BVUE. The relationship between the holders of The Summit Whole Loan is governed by a co-lender agreement as described under “Description of the Mortgage Pool—The Whole Loans—The Non-Serviced AB Whole Loans” in the Preliminary Prospectus. The Summit Whole Loan had an initial term of 86 months and has a remaining term of 84 months as of the Cut-off Date. The Summit Whole Loan requires monthly payments of interest only for the entire duration of the loan. The scheduled maturity date of The Summit Whole Loan is the due date in February 2029. Voluntary prepayment of The Summit Whole Loan in whole (but not in part) is permitted after the open prepayment date occurring in August 2028 without payment of any prepayment premium. Defeasance of the full $525.0 million The Summit Whole Loan is permitted after the date that is earlier of (i) two years from the closing date of the securitization that includes the last note to be securitized and (ii) December 10, 2024.
The table below summarizes the promissory notes that comprise the Summit Whole Loan. The relationship between the holders of the Summit Whole Loan will be governed by a co-lender agreement as described under “Description of the Mortgage Pool—The Whole Loans—The Non-Serviced AB Whole Loans” in the Preliminary Prospectus.
| Whole Loan Summary | |||||
| Note | Original Balance | Cut-off Date Balance | Note Holder | Controlling Piece | |
| A-1-S | $64,200,000 | $64,200,000 | SUMIT 2022-BVUE | Yes | |
| A-2-S | $42,800,000 | $42,800,000 | SUMIT 2022-BVUE | No | |
| A-1-1 | $50,000,000 | $50,000,000 | BCREI(1) | No | |
| A-1-2 | $50,000,000 | $50,000,000 | BCREI(1) | No | |
| A-1-3 | $25,000,000 | $25,000,000 | BCREI(1) | No | |
| A-1-4 | $7,000,000 | $7,000,000 | BCREI(1) | No | |
| A-2-1 | $65,000,000 | $65,000,000 | BMARK 2022-B32 | No | |
| A-2-2 | $23,000,000 | $23,000,000 | GSBI(1) | No | |
| Total Senior Notes | $327,000,000 | $327,000,000 | |||
| B-1-1 | $118,800,000 | $118,800,000 | SUMIT 2022-BVUE | No | |
| B-2-1 | $79,200,000 | $79,200,000 | SUMIT 2022-BVUE | No | |
| Whole Loan | $525,000,000 | $525,000,000 | |||
| (1) | Expected to be contributed to one or more future securitization trusts. |
THE INFORMATION IN THIS STRUCTURAL AND COLLATERAL TERM SHEET IS NOT COMPLETE AND MAY BE AMENDED PRIOR TO THE TIME OF SALE. THIS TERM SHEET IS NOT AN OFFER TO SELL THESE SECURITIES AND IT IS NOT A SOLICITATION OF AN OFFER TO BUY THESE SECURITIES IN ANY JURISDICTION WHERE THE OFFER OR SALE IS NOT PERMITTED.
129 of 158
| Structural and Collateral Term Sheet | Benchmark 2022-B32 | |
| The Summit | ||
The Summit Whole Loan capital structure is shown below:
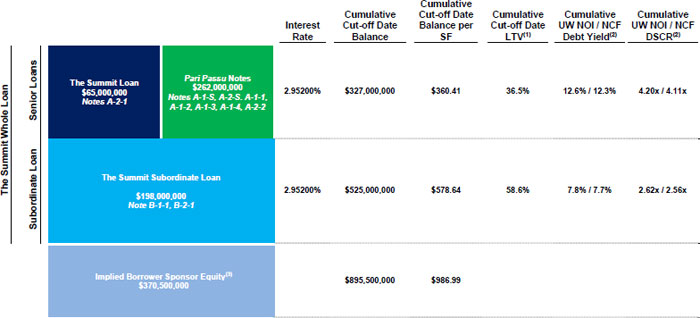
| (1) | Based on the “as-is” appraised value of $895,500,000 as of November 1, 2021. |
| (2) | Based on the UW NOI of $41,101,145 and the UW NCF of $40,230,920. |
| (3) | Based on the appraised value of $895,500,000, the Implied Borrower Sponsor Equity is $370,500,000. |
The Borrowers. The borrowers are KRE Summit 1, 2, Owner LLC and KRE Summit 3 Owner LLC, each a Delaware limited liability company. The borrowers are structured to be single purpose bankruptcy-remote entities, having at least two independent directors in their organizational structure. Legal counsel to the borrowers delivered a non-consolidation opinion in connection with the origination of The Summit Whole Loan.
The Loan Sponsors. The loan sponsors and non-recourse guarantors are KKR Property Partners Americas (EEA) SCSp and KKR Property Partners Americas L.P. (collectively, the “KKR Guarantor”).
The Property. The Summit Property is a Class A office campus consisting of three buildings: Summit 1 (242,180 SF, 26.7% of NRA) and Summit 2 (290,906 SF, 32.1% of NRA), which were constructed in 2005 and 2002, respectively, and are LEED Platinum certified, and Summit 3 (374,220 SF, 41.2% of NRA), which was constructed in 2021 and is LEED Gold certified. The Summit Property also includes a seven-level, 2,197 space subterranean Parking Garage. Per a third-party market research report, vacancy in the Bellevue CBD for properties of similar quality is approximately 4.5%. Located within a block of I-405, the Bellevue Transit Center and the Downtown Bellevue station of the planned East Link Light Rail, The Summit Property offers access to employees commuting via public transportation as well as car commuters, which can utilize The Summit Property’s 2,197 subterranean Parking Garage.
All but 0.6% of UW Base Rent is attributable to space leased or subleased by investment grade tenants or tenants on the Am Law 50. The majority of space is directly leased to investment grade tenants such as Amazon.com Services, Inc. (41.2% of NRA), Puget Sound Energy, Inc. (24.7% of NRA) and First Republic Bank (8.1% of NRA). Amazon also subleases 133,059 SF of space from WeWork (the entirety of WeWork’s presence at The Summit Property) through an enterprise lease, bringing its total footprint at The Summit Property to 507,279 SF (55.9% of NRA). The WeWork space was built to Amazon’s specs and the Amazon lease commenced at the same time as the WeWork lease. Perkins Coie LLP, ranked 42 on the Am Law 50, has been at The Summit Property since 2003 and leases 26,070 SF (2.9% of NRA) at The Summit Property. The Summit Property has a weighted average lease term (“WALT”) of 10.7 years and the majority of investment grade tenants have leases that run beyond the approximately seven-year loan term including Amazon (14.6 year WALT), First Republic Bank (10.0 year WALT) and New York Life Insurance Co. (7.8 year WALT).
THE INFORMATION IN THIS STRUCTURAL AND COLLATERAL TERM SHEET IS NOT COMPLETE AND MAY BE AMENDED PRIOR TO THE TIME OF SALE. THIS TERM SHEET IS NOT AN OFFER TO SELL THESE SECURITIES AND IT IS NOT A SOLICITATION OF AN OFFER TO BUY THESE SECURITIES IN ANY JURISDICTION WHERE THE OFFER OR SALE IS NOT PERMITTED.
130 of 158
| Structural and Collateral Term Sheet | Benchmark 2022-B32 | |
| The Summit | ||
Major Tenants.
The largest tenant, Amazon.com Services, Inc. (“Amazon”) (374,220 square feet; 41.2% of net rentable area; 39.6% of underwritten base rent), is a multinational technology conglomerate that recently surpassed Walmart as the world’s largest retailer outside of China. Amazon also operates in a diverse range of business segments including devices and services (Alexa, Fire TV, Fire Tablets etc.), Amazon Web Services, Delivery and Logistics and Entertainment and is the fifth largest company in the world by market capitalization. In 2021, Amazon surpassed Boeing to become Washington’s largest employer and plans to bring an estimated 25,000 jobs to Bellevue as part of the expansion of its Puget Sound headquarters. Amazon occupies the entirety of Summit 3 on a 15-year lease that commenced in September 2021 with one option to terminate any portion of its lease after September 30, 2033 (almost five years beyond the loan term) with 18 months’ notice and the payment of three-months’ rent and all unamortized TI/LC costs. Amazon has a right of first offer on any available space in Summit 1 or Summit 2. Amazon.com, Inc. provides a limited parent guarantee, with a maximum liability of approximately $44.2 million (approximately 3.4 years of UW Base Rent) for the first 151 months of the lease, which then burns off throughout the remainder of lease term.
The second largest tenant, Puget Sound Energy, Inc. (223,820 square feet; 24.7% of net rentable area; 24.4% of underwritten base rent), or its predecessors have been providing energy to Washington since 1873 and is now the largest energy utility in the state, providing electric power to 1.2 million customers and natural gas to 900,000 customers over 6,000 square miles primarily in the Puget Sound region of western Washington. Puget Sound Energy, Inc. utilizes The Summit Property as its corporate headquarters. Puget Sound Energy, Inc. is an office tenant of Summit 1 on a lease that expires October 31, 2028. Puget Sound Energy, Inc. has no termination options but the borrowers may, subject to no continuing event of default and debt yield tests, amend the Puget Sound Energy, Inc. lease to reduce the premises by up to 223,820 SF and re-lease that space provided the replacement lease (i) is not to an affiliate of the borrowers, (ii) the term of the lease is at least as long as the remaining term of the Puget Sound Energy, Inc. lease, (iii) is to a tenant that is rated BBB- or better by two agencies or is one of the following: Snowflake, Smartsheet Inc., Splunk Technology, Niantic, Inc., Snap Inc., DocuSign, Inc. or Discovery, Inc. The borrowers are also responsible for all leasing costs and must reserve all free and gap rent between the termination date and the rent commencement date of the replacement lease. Puget Sound Energy Inc. has two five-year extension options with 12-months’ notice at 95% of market rent.
The third largest tenant, WeWork (133,059 square feet; 14.7% of net rentable square feet; 15.6% of underwritten base rent), WeWork is a global flexible workspace provider with over 700 locations globally in 150 cities across 38 countries providing workplace solutions to members ranging from freelancers to Fortune 500 companies. WeWork was taken public in October 2021 through a $9 billion SPAC merger with BowX Acquisition. WeWork leases 133,059 SF at Summit 2 on a lease that expires March 31, 2032 with no extension options. The entirety of WeWork’s 133,059 SF footprint at The Summit Property, including floors 8-12 and suite 650 at Summit 2, is subleased to Amazon through an enterprise lease. Amazon has been the sole subtenant at the WeWork space. The terms of the sublease between WeWork and Amazon are not known to the Lender. WeWork has one, 5-year option to extend the term of the sublease upon written notice to the landlord not later than 12 months prior to the expiration date of the initial term.
The Market. The Summit Property is located in the Seattle-Bellevue-Everett metropolitan statistical area (“MSA”), which according to the appraisal is home to one of the most highly advanced and diversified economies in the country and the third highest share of information workers in the country, behind only Silicon Valley and San Francisco. In addition to tech companies like Amazon and Microsoft Corp., Boeing remains one of the largest private employers in the region with manufacturing jobs in large facilities through the Puget Sound region. The Summit Property is located in the Bellevue central business district office submarket of the Seattle office market, as defined by a third-party market research report.
Over the past three years, Seattle saw the largest growth in occupancy among large U.S. cities largely due to demand from tech tenants, which are attracted to its relative affordability compared to peer markets like San Francisco and the high concentration of talent in the area. The Seattle office market has added over 13.0 mm SF of space since 2018 but robust pre-leasing from tech companies like Amazon, Facebook and Google kept vacancy low and absorption positive prior to the pandemic. According to a third-party market research report, the Eastside office market saw absorption of 702,000 SF in the third quarter of 2021 which outpaced absorption for the entire calendar year of 2019 by 305,000 SF, driven by leases to Snowflake Computing, Robinhood and others. Current vacancy in the Seattle office market is 9.6%, higher than in recent years but remains below its ten year high of 10.6% and the U.S. index of 12.2%. Rents in the Seattle office market have increased YTD to $38.28 per square foot, less than $1.00 per square foot off the pre-pandemic peak of $39.11 per square foot in 2019 and higher than the previous high of $36.53 per square foot in 2018.
The Bellevue central business district offers the largest live/work/shop/play environment in Bellevue and lies in proximity to some of the region’s residential neighborhoods making it one of the office hubs in the area for tech tenants and companies expanding outside of Seattle. Bellevue has seen a surge in technology company expansions over the past two years, highlighted by industry leaders such as Facebook, Google, Salesforce, T-Mobile, Microsoft and Amazon. Since 2017, Amazon has committed to more than six million square feet of office space in the Bellevue central business district and has pledged to bring 25,000 jobs to the market in the coming years. As a result of high quality inventory and strong demand from tech employers as a result of its proximity and accessibility, the Bellevue central business district office market commands the highest rents in the Seattle area. Bellevue is a more convenient commute than Seattle for many area residents working in tech industries, and the planned light rail station expected to open in 2023 will improve connectivity making it even more accessible. Despite robust leasing activity over the past year, the vacancy in the Bellevue central business district office market has
THE INFORMATION IN THIS STRUCTURAL AND COLLATERAL TERM SHEET IS NOT COMPLETE AND MAY BE AMENDED PRIOR TO THE TIME OF SALE. THIS TERM SHEET IS NOT AN OFFER TO SELL THESE SECURITIES AND IT IS NOT A SOLICITATION OF AN OFFER TO BUY THESE SECURITIES IN ANY JURISDICTION WHERE THE OFFER OR SALE IS NOT PERMITTED.
131 of 158
| Structural and Collateral Term Sheet | Benchmark 2022-B32 | |
| The Summit | ||
increased to 7.4% from its pre-pandemic low of 3.6% but remains well below its ten year high of 16.3% and is below both the overall Seattle office market (9.6%) and the U.S. Index (12.2%).
| Historical and Current Occupancy | |||
| 2018 | 2019 | 2020 | Current(1) |
| NAV | NAV | NAV | 98.2% |
| (1) | Current Occupancy is as of January 1, 2022. |
COVID-19 Update. As of January 7, 2022, The Summit Property is open and operating. Rent collections for The Summit Property were 99.8% and 99.8% for November and December 2021, respectively. There has been no rent relief requested, except for ongoing negotiations with a retail tenant, Café Pogacha, who is currently engaging in lease extension discussions in exchange for restructured rent. As of January 7, 2022, no loan modification or forbearance requests have been made on The Summit Whole Loan. The first payment date of The Summit Loan was January 6, 2022.
| Tenant Summary(1) | |||||||
| Tenant | Ratings Moody’s/Fitch/S&P(2) | Net Rentable Area (SF) | % of Total NRA | Base Rent PSF(3) | % of Total Base Rent(3) | Lease Expiration Date | |
| Amazon.com Services, Inc. | A1/AA-/AA | 374,220 | 41.2% | $35.36 | 39.6% | 8/31/2036(4) | |
| Puget Sound Energy, Inc. | A2/A/BBB | 223,820 | 24.7 | $36.50 | 24.4 | 10/31/2028 | |
| WeWork(5) | NR/NR/NR | 133,059 | 14.7 | $39.30 | 15.6 | 3/31/2032 | |
| First Republic Bank(6) | Baa1/A-/A- | 73,910 | 8.1 | $46.51 | 10.3 | 1/31/2032 | |
| Perkins Coie LLP | NR/NR/NR | 26,070 | 2.9 | $53.00 | 4.1 | 12/31/2026 | |
| New York Life Insurance Co. | Aaa/AA+/AA+ | 21,875 | 2.4 | $53.00 | 3.5 | 11/30/2029 | |
| AvalonBay Communities, Inc. | A3/NR/A- | 7,003 | 0.8 | $46.23 | 1.0 | 9/30/2030 | |
| Delta Air Lines Inc. | Baa3/BB+/BB | 7,354 | 0.8 | $43.00 | 0.9 | 12/31/2024 | |
| Bright Horizons | B1/NR/B+ | 11,500 | 1.3 | $11.15 | 0.4 | 10/31/2028 | |
| Cafe Pogacha | NR/NR/NR | 2,125 | 0.2 | $29.26 | 0.2 | 6/30/2023 | |
| Total | 880,936 | 97.1% | $37.96 | 100.0% | |||
| Remaining Tenants(7) | 9,791 | 1.1% | $0.00 | 0.0% | |||
| Total Occupied | 890,727 | 98.2% | |||||
| Vacant | 16,579 | 1.8% | |||||
| Total | 907,306 | 100.0% | $37.54 | 100.0% | |||
| (1) | As of the January 1, 2022 rent roll which includes multiple rights of first offer exercised by First Republic Bank on spaces for which the leases have not yet commenced. All outstanding free and gap rent was reserved by the borrowers at origination. |
| (2) | In certain instances, ratings provided are those of the parent company of the entity shown, whether or not the parent company guarantees the lease. |
| (3) | Base Rent PSF includes $735,068 of rent steps through December 31, 2022 and excludes $1,614,740 of straight-line rent for investment grade tenants. |
| (4) | Amazon has the right to terminate any portion of its lease after September 30, 2033 with 18 months’ notice and the payment of three-months’ rent and all unamortized tenant improvements and leasing commissions. |
| (5) | WeWork is 100% enterprise subleased to Amazon. Amazon has been the sole subtenant at the WeWork space and the space was built to Amazon’s specifications. |
| (6) | First Republic Bank is currently in occupancy at 20,680 SF of space in Summit 2 and has exercised several rights of first offer which will bring its total footprint at The Summit Property to 73,910 SF with all leases expiring January 31, 2032. All free rent and gap rent has been reserved by the borrowers. |
| (7) | Includes Conference Room and Property Management Office for which no base rent was underwritten. |
THE INFORMATION IN THIS STRUCTURAL AND COLLATERAL TERM SHEET IS NOT COMPLETE AND MAY BE AMENDED PRIOR TO THE TIME OF SALE. THIS TERM SHEET IS NOT AN OFFER TO SELL THESE SECURITIES AND IT IS NOT A SOLICITATION OF AN OFFER TO BUY THESE SECURITIES IN ANY JURISDICTION WHERE THE OFFER OR SALE IS NOT PERMITTED.
132 of 158
| Structural and Collateral Term Sheet | Benchmark 2022-B32 | |
| The Summit | ||
| Lease Rollover Schedule(1)(2)(3) | |||||||||
| Year | Number of Tenant Leases Expiring | Net Rentable Area Expiring | % of NRA Expiring | Base Rent Expiring(4) | % of Base Rent Expiring | Cumulative Net Rentable Area Expiring | Cumulative % of NRA Expiring | Cumulative Base Rent Expiring | Cumulative % of Base Rent Expiring |
| Vacant | NAP | 16,579 | 1.8% | NAP | NAP | 16,579 | 1.8% | NAP | NAP |
| MTM | 0 | 0 | 0.0% | $0 | 0.0% | 16,579 | 1.8% | $0 | 0.0% |
| 2022 | 0 | 0 | 0.0% | $0 | 0.0% | 16,579 | 1.8% | $0 | 0.0% |
| 2023 | 1 | 2,125 | 0.2% | $62,178 | 0.2% | 18,704 | 2.1% | $62,178 | 0.2% |
| 2024 | 1 | 7,354 | 0.8% | $316,222 | 0.9% | 26,058 | 2.9% | $378,400 | 1.1% |
| 2025 | 0 | 0 | 0.0% | $0 | 0.0% | 26,058 | 2.9% | $378,400 | 1.1% |
| 2026 | 1 | 26,070 | 2.9% | $1,381,710 | 4.1% | 52,128 | 5.7% | $1,760,110 | 5.3% |
| 2027 | 0 | 0 | 0.0% | $0 | 0.0% | 52,128 | 5.7% | $1,760,110 | 5.3% |
| 2028 | 2 | 235,320 | 25.9% | $8,297,655 | 24.8% | 287,448 | 31.7% | $10,057,765 | 30.1% |
| 2029 | 1 | 21,875 | 2.4% | $1,159,375 | 3.5% | 309,323 | 34.1% | $11,217,140 | 33.5% |
| 2030 | 1 | 7,003 | 0.8% | $323,749 | 1.0% | 316,326 | 34.9% | $11,540,888 | 34.5% |
| 2031 | 0 | 0 | 0.0% | $0 | 0.0% | 316,326 | 34.9% | $11,540,888 | 34.5% |
| 2032 and Thereafter(5) | 6 | 590,980 | 65.1% | $21,898,307 | 65.5% | 907,306 | 100.0% | $33,439,195 | 100.0% |
| Total | 13 | 907,306 | 100.0% | $33,439,195 | 100.0% | ||||
| (1) | As of the January 1, 2022 rent roll which includes multiple rights of first offer exercised by First Republic Bank on spaces for which the leases have not yet commenced. All outstanding free and gap rent was reserved by the borrowers at origination. |
| (2) | Lease Rollover Schedule is based on the lease expiration dates of all direct leases in place. |
| (3) | Certain tenants may have termination or contraction options (which may become exercisable prior to the originally stated expiration date of the tenant lease) that are not considered in the above Lease Rollover Schedule. See “Tenant Summary” above. |
| (4) | UW Base Rent includes $735,068 of rent steps through December 31, 2022 and excludes $1,614,740 of straight-line rent for investment grade tenants. |
| (5) | Includes Fitness Center, Conference Room, and Property Management Office for which no base rent was underwritten. |
| Operating History and Underwritten Net Cash Flow(1)(2) | ||||||||
| 2018 | 2019 | 2020 | Budget / Year 1 | Underwritten(2) | Per Square Foot | %(3) | ||
| Base Rent(2) | 13,492,937 | 12,412,455 | 17,227,962 | 31,792,964 | 32,704,127 | $36.05 | 55.2% | |
| Other Income | 5,017,341 | 4,369,357 | 3,908,618 | 6,786,449 | 6,786,449 | $7.48 | 11.5% | |
| Expense Recoveries | 6,894,614 | 6,236,499 | 7,633,046 | 16,421,927 | $16,544,308 | $18.23 | 27.9% | |
| Gross Potential Revenue | $25,404,892 | $23,018,311 | $28,769,626 | $55,001,340 | $59,263,379 | 65.32 | 100.0% | |
| (Vacancy/Credit Loss) | 0 | 0 | 0 | 0 | (2,191,794) | ($2.42) | (3.7%) | |
| Effective Gross Income | $25,404,892 | $23,018,311 | $28,769,626 | $55,001,340 | $57,071,586 | $62.90 | 96.3% | |
| Total Expenses | 7,774,331 | 6,622,639 | 7,919,733 | 16,245,344 | 15,970,440 | $17.60 | 26.9% | |
| Net Operating Income | $17,630,561 | $16,395,672 | $20,849,893 | $38,755,996 | $41,101,145 | $45.30 | 69.4% | |
| Total TI/LC, RR | 0 | 0 | 0 | 0 | 870,225 | $0.96 | 1.5% | |
| Net Cash Flow | $17,630,561 | $16,395,672 | $20,849,893 | $38,755,996 | $40,230,920 | $44.34 | 67.9% | |
| (1) | Historical financials (2018-2020) are based on financials for Summit 1 and 2 only as Summit 3 is recently delivered. The 2018 – 2020 PSF figures are based on the total square footage of Summit 1 and 2 (533,086 SF). |
| (2) | The increase from historical financials is due to the inclusion of Summit 3 which was delivered in Q3 2021 and is fully leased to Amazon. |
| (3) | % column represents percent of Gross Potential Revenue for all revenue lines and represents percent of Effective Gross Revenue for the remainder of fields. |
Property Management. The Summit Property is managed by Urban Renaissance Property Company LLC, a third party management company, pursuant to a property management agreement with a current term that will expire on December 20, 2022, and will automatically renew for consecutive additional terms of one year unless otherwise terminated.
Escrows and Reserves. At loan origination, the borrowers deposited (i) $2,958,400 into a reserve for free rent and outstanding or abated rent and/or any bridge/gap rent and (ii) $6,942,143 for outstanding tenant improvement allowances and leasing commissions.
Tax Reserve – The borrowers are required to deposit into a real estate tax reserve, on a monthly basis during the continuance of a Summit Cash Sweep Period (as defined below), 1/12th of the reasonably estimated annual real estate taxes.
Insurance Reserve – The borrowers are required to deposit into an insurance reserve, on a monthly basis during the continuance of a Summit Cash Sweep Period, 1/12th of reasonably estimated insurance premiums unless the borrowers maintain a blanket policy in accordance with The Summit Whole Loan documents.
THE INFORMATION IN THIS STRUCTURAL AND COLLATERAL TERM SHEET IS NOT COMPLETE AND MAY BE AMENDED PRIOR TO THE TIME OF SALE. THIS TERM SHEET IS NOT AN OFFER TO SELL THESE SECURITIES AND IT IS NOT A SOLICITATION OF AN OFFER TO BUY THESE SECURITIES IN ANY JURISDICTION WHERE THE OFFER OR SALE IS NOT PERMITTED.
133 of 158
| Structural and Collateral Term Sheet | Benchmark 2022-B32 | |
| The Summit | ||
Replacement Reserves – During the continuance of a Summit Cash Sweep Period, borrowers are required to make monthly deposits in an amount equal to $15,121.77 to cover the costs of replacements incurred by the Borrower in accordance with The Summit Whole Loan documents.
Outstanding TI/LC Reserve - The borrowers are required to deposit into a replacement reserve during the continuance of a Summit Cash Sweep Period, an amount equal to approximately $113,413.25 ($1.50 per square foot annually) for approved tenant improvements and leasing commissions at The Summit Property in accordance with The Summit Whole Loan documents. Amounts are disbursed from the TI/LC Reserve Account for approved tenant improvements, leasing commissions, speculative tenant improvements, white box space, tenant amenities and the like at The Summit Property in accordance with The Summit Whole Loan documents; provided with respect to spec space, such disbursements will not exceed $75 per square foot, and the square footage will not exceed 10% of the square footage per building or 15% of the square footage for The Summit Property in the aggregate.
Lease Sweep Reserve – During the continuance of a Summit Lease Sweep Period (as defined below), all excess cash will be deposited into an account for purposes of re-tenanting the Amazon space (or any other space at The Summit Property under a Qualified Replacement Lease), and such approved leasing costs incurred in connection therewith in accordance with The Summit Whole Loan documents. During the continuance of a Summit Lease Sweep Period, so long as no other Summit Cash Sweep Period is then continuing, the borrowers will not be required to deposit into any reserve account (other than the tax and insurance escrow fund or the replacement reserve account) once the aggregate amount on reserve in all reserve accounts in account of any Summit Lease Sweep Lease or Summit Lease Sweep Trigger Event is equal to or greater the Summit Lease Sweep Reserve cap.
Replacement Lease Reserve Account – The borrowers are required to deposit all amounts in the event a lease is terminated in whole or in part (including a termination in respect of Recaptured Puget Sound Space as set forth below), or the tenant thereunder defaults, and in any such case borrowers receive or are permitted to retain any payment, fee, damages, forfeited security deposit, or proceeds of any bond or letter of credit given as security (excluding any such amounts applied by the borrowers to cure any default under such lease other than non-payment of rent that is not yet due and payable) (collectively, “Termination Proceeds”). To the extent the amounts contained in the replacement lease reserve account in respect of any terminated lease space exceed the aggregate remaining amount of leasing commissions, tenant improvement costs, gap rent and free rent under the applicable replacement leases for such terminated lease space, then provided no event of default is continuing, the borrowers will have the right to either (i) apply such excess toward the costs of speculative tenant improvements, white box space, tenant amenities and the like (including, without limitation, base building work in connection therewith), by including such costs in a disbursement request, or (ii) designate such excess to be held by the lender for purposes of calculating Debt Yield, or (iii) designate such excess as Excess Replacement Lease Reserve Funds pursuant to, and for application in accordance with the following: At the borrowers’ election, provided no event of default is continuing, all Excess Replacement Lease Reserve Funds remaining in the Replacement Lease Reserve Account in respect of such terminated lease space will from time to time be remitted to the borrowers (or, during a Summit Cash Sweep Period, to the Cash Management Account for application pursuant to the Cash Management Agreement) following written request from the borrowers (or, at the borrowers’ option, such Excess Replacement Lease Reserve Funds will be held by the lender for purposes of calculating Debt Yield).
Excess Cash Flow Reserve – During the continuance of a Summit Cash Sweep Period, other than a Summit Lease Sweep Period, all excess cash after disbursements for required reserve deposits, debt service, and property-level expenses in accordance with The Summit Loan documents will be deposited into the excess cash flow reserve account and held as additional collateral for The Summit Whole Loan.
“Summit Cash Sweep Event” means the occurrence of: (a) an event of default; (b) a Summit Lease Sweep Trigger Event; or (c) a Summit Debt Yield Trigger Event.
“Summit Cash Sweep Period” means each period commencing on the occurrence of a Summit Cash Sweep Event and continuing until the earlier of (a) the date that the related Summit Cash Sweep Event is cured in accordance with The Summit Whole Loan documents, or (b) until (x) payment in full of all principal and interest on The Summit Whole Loan and all other amounts payable under The Summit Whole Loan documents or (y) defeasance of The Summit Whole Loan.
“Summit Debt Yield Trigger Event” means a Debt Yield of less than 5.50% for the two (2) consecutive calendar quarters immediately preceding any date of determination.
“Summit Debt Yield Trigger Period” means the period commencing on the occurrence of a Summit Debt Yield Trigger Event and continuing until the date that the related Summit Debt Yield Trigger Event is cured in accordance with The Summit Whole Loan documents.
“Excess Replacement Lease Reserve Funds” means, as determined upon request of the borrowers following execution of one or more replacement Leases for any terminated lease space (including the Recaptured Puget Sound Space, as defined below), an amount equal to (1) all sums remaining in the Replacement Lease Reserve Account on account of such terminated lease, minus (2) solely to the extent rents under the replacement lease are not sufficient to replace rents under the terminated lease (it being understood that, if sufficient, no amount will be deducted pursuant this clause (2), the sum of the allocated vacant space leasing costs.
A “Summit Lease Sweep Period” will occur upon the first Payment Date following the occurrence of a Summit Lease Sweep Trigger Event and end upon the date such Summit Lease Sweep Trigger Event is cured in accordance with The Summit Whole Loan documents. A Summit Lease Sweep Period will not be triggered (or if triggered, will be terminated) if the borrowers deposit cash into the Lease Sweep
THE INFORMATION IN THIS STRUCTURAL AND COLLATERAL TERM SHEET IS NOT COMPLETE AND MAY BE AMENDED PRIOR TO THE TIME OF SALE. THIS TERM SHEET IS NOT AN OFFER TO SELL THESE SECURITIES AND IT IS NOT A SOLICITATION OF AN OFFER TO BUY THESE SECURITIES IN ANY JURISDICTION WHERE THE OFFER OR SALE IS NOT PERMITTED.
134 of 158
| Structural and Collateral Term Sheet | Benchmark 2022-B32 | |
| The Summit | ||
Reserve account or deliver a letter of credit, in an amount that, when aggregated with any Termination Proceeds deposited in the Replacement Lease Reserve account in respect of such Summit Lease Sweep Lease, equal to a cap of $60 per square foot to the lender.
A “Summit Lease Sweep Trigger Event” means the occurrence of any of the following: (a) a bankruptcy action of a tenant (or guarantor thereof) under a Summit Lease Sweep Lease, (b) any monetary default or material non-monetary default under a Summit Lease Sweep Lease that continues beyond any applicable grace, notice and cure period under such Summit Lease Sweep Lease, (c) a tenant under a Summit Lease Sweep Lease goes dark at 50% or more of its space, except as provided in The Summit loan agreement or (d) the earlier of the date upon which (i) a tenant under a Summit Lease Sweep Lease cancels or terminates its lease with respect to at least 25% of the square of space subject to the Amazon lease as of the loan origination date prior to the then-current expiration date under such lease or (2) such tenant gives written notice to the borrowers that it is cancelling or terminating its Summit Lease Sweep Lease with respect to at least 25% of the square footage of space subject to the Amazon lease as of the loan origination date prior to the then-current expiration date under such Summit Lease Sweep Lease.
“Summit Lease Sweep Lease” means the Amazon lease or any qualified replacement lease.
Puget Sound Recapture – the borrowers have the right, without the lender’s consent, to amend that certain leased space, pursuant to a lease agreement, dated as of May 11, 2018 (the “Puget Sound Energy Lease”) by and between Hines Global REIT Summit Holdings LLC and Puget Sound Energy, Inc. (“Puget Sound Energy Tenant”) from time to time to reduce the premises demised thereunder (any such space that is removed from the Puget Sound Energy Lease, until it is released in accordance with The Summit loan agreement, the “Recaptured Puget Sound Space”) and to make corresponding reductions to the Puget Sound Energy Tenant’s rent and other obligations thereunder, provided (a) no event of default is continuing, (b) the aggregate amount of all Recaptured Puget Sound Space will not exceed 223,820 square feet in the aggregate, and (c) the pro-forma Debt Yield is equal to or greater than the loan origination date Debt Yield, and the borrowers satisfy the if and only if (i) any such newly executed lease demising all or any portion of the Recaptured Puget Sound Space is a qualifying lease under The Summit loan agreement, and (ii) the borrowers have (A) remitted funds into the Replacement Lease Reserve Account or (B) delivered to the lender a letter of credit in the amount required to be remitted into the Replacement Lease Reserve Account as set forth in sub-clause (A), in each case in such aggregate amount as required under The Summit Whole Loan documents.
For purposes of calculating the pro-forma Debt Yield related to the Puget Sound Recapture, the pro-forma Debt Yield will reflect the increase in revenues from any newly executed leases demising such Recaptured Puget Sound Space (and without regard to the commencement date of such lease). The borrowers have the right to prepay The Summit Whole Loan, post cash collateral, or deliver to the lender a letter of credit in such amount which, if applied in reduction of outstanding principal of The Summit Whole Loan, would result in a Debt Yield equal to or exceeding the loan origination date Debt Yield.
Lockbox / Cash Management. The Summit Whole Loan is structured with a hard lockbox and springing cash management. The borrowers were required to direct each tenant to remit all rents directly to a lender-controlled lockbox account. In addition, the borrowers are required to cause all cash revenues relating to The Summit Property and all other money received by the borrowers or the property manager with respect to The Summit Property (other than tenant security deposits) to be deposited into the lockbox account or a lender-controlled cash management account within two business day of receipt. On each business day during the continuance of a Summit Cash Sweep Period or event of default under The Summit Whole Loan, all amounts in the lockbox account are required to be remitted to the cash management account. On each business day that no Summit Cash Sweep Period or event of default under The Summit Whole Loan is continuing, all amounts in the lockbox account are required to be remitted to a borrower-controlled operating account.
On each due date during the continuance of a Summit Cash Sweep Period or an event of default under The Summit Whole Loan, all funds on deposit in the cash management account after payment of debt service on The Summit Whole Loan, required reserves and budgeted operating expenses are required to be deposited into an excess cash flow reserve account as additional collateral for The Summit Whole Loan.
Current Mezzanine or Subordinate Indebtedness. None.
Future Mezzanine or Subordinate Indebtedness Permitted. None.
Partial Release. None.
THE INFORMATION IN THIS STRUCTURAL AND COLLATERAL TERM SHEET IS NOT COMPLETE AND MAY BE AMENDED PRIOR TO THE TIME OF SALE. THIS TERM SHEET IS NOT AN OFFER TO SELL THESE SECURITIES AND IT IS NOT A SOLICITATION OF AN OFFER TO BUY THESE SECURITIES IN ANY JURISDICTION WHERE THE OFFER OR SALE IS NOT PERMITTED.
135 of 158
| Structural and Collateral Term Sheet | Benchmark 2022-B32 | |
| Moonwater Office Portfolio | ||
| Mortgage Loan Information | Property Information | |||
| Mortgage Loan Seller: | CREFI | Single Asset / Portfolio: | Portfolio | |
| Original Principal Balance(1): | $63,000,000 | Title: | Fee | |
| Cut-off Date Principal Balance(1): | $63,000,000 | Property Type - Subtype: | Office - Suburban | |
| % of Pool by IPB: | 3.5% | Net Rentable Area (SF): | 611,320 | |
| Loan Purpose: | Recapitalization | Location: | Las Vegas, NV | |
| Borrowers: | PREH Power House TSSP LLC, | Year Built / Renovated: | Various / Various | |
| Power House TSSP, LLC and | Occupancy: | 96.3% | ||
| MRK Power House TSSP LLC | Occupancy Date(3): | Various | ||
| Guarantors: | Ofir Hagay, Ryan Tedder and Keith | Number of Tenants: | 7 | |
| Kantrowitz | Fourth Most Recent NOI(4): | NAV | ||
| Interest Rate: | 4.25000% | Third Most Recent NOI(4): | NAV | |
| Note Date: | 12/30/2021 | Second Most Recent NOI: | $8,186,241 (December 31, 2020) | |
| Maturity Date: | 1/6/2032 | Most Recent NOI: | $10,024,323 (TTM July 31, 2021) | |
| Interest-only Period: | 48 months | UW Economic Occupancy: | 91.9% | |
| Original Term: | 120 months | UW Revenues: | $13,231,194 | |
| Original Amortization: | 360 months | UW Expenses: | $2,754,101 | |
| Amortization Type: | Interest Only, Amortizing Balloon | UW NOI: | $10,477,093 | |
| Call Protection(2): | L(25),D(90),O(5) | UW NCF: | $9,707,007 | |
| Lockbox / Cash Management: | Hard / Springing | Appraised Value / Per SF: | $196,300,000 / $321 | |
| Additional Debt(1): | Yes | Appraisal Date: | 10/7/2021 | |
| Additional Debt Balance(1): | $53,000,000 | |||
| Additional Debt Type(1): | Pari Passu | |||
| Escrows and Reserves | Financial Information(1) | |||||
| Initial | Monthly | Initial Cap | Cut-off Date Loan / SF: | $190 | ||
| Taxes: | $95,265 | $47,633 | N/A | Maturity Date Loan / SF: | $169 | |
| Insurance: | $24,682 | $24,682 | N/A | Cut-off Date LTV: | 59.1% | |
| Replacement Reserves: | $0 | $13,231 | $366,750 | Maturity Date LTV: | 52.7% | |
| TI/LC: | $780,000 | $76,442 | $6,100,000 | UW NCF DSCR: | 1.42x | |
| Other(5): | $1,914,928 | $0 | N/A | UW NOI Debt Yield: | 9.0% | |
| Sources and Uses | ||||||
| Sources | Proceeds | % of Total | Uses | Proceeds | % of Total | |
| Whole Loan | $116,000,000 | 62.0% | Payoff Existing Debt | $96,470,412 | 51.6% | |
| Principal’s New Cash Contribution | 68,090,576 | 36.4 | Other Uses | 44,183,089 | 23.6 | |
| Other Sources | 3,031,154 | 1.6 | Principal Equity Distribution | 41,621,499 | 22.2 | |
| Upfront Reserves | 2,814,875 | 1.5 | ||||
| Closing Costs | 2,031,854 | 1.1 | ||||
| Total Sources | $187,121,730 | 100.0% | Total Uses | $187,121,730 | 100.0% | |
| (1) | The Moonwater Office Portfolio Loan (as defined below) is part of a whole loan evidenced by four pari passu notes with an aggregate original principal balance as of the Cut-off Date of $116.0 million. Financial information presented in the chart above reflects the aggregate Cut-off Date balance of the $116.0 million Moonwater Office Portfolio Whole Loan (as defined below). |
| (2) | The lockout period will be at least 25 payments beginning with and including the first payment date in February 2022. The borrowers have the option to defease the full $116.0 million Moonwater Office Portfolio Whole Loan after the earlier to occur of (i) two years after the closing date of the securitization that includes the last note to be securitized and (ii) December 30, 2024. The assumed defeasance lockout period of 25 payments is based on the expected closing date of the Benchmark 2022-B32 securitization in February 2022. The actual lockout period may be longer. |
| (3) | Occupancy is as of October 7, 2021 for the 9901-9921 Covington Cross Drive property and February 6, 2022 for the remaining properties. |
| (4) | Fourth Most Recent NOI and Third Most Recent NOI are unavailable as several of the Moonwater Office Portfolio Properties (as defined below) were recently acquired. |
| (5) | The Other Initial reserve consists of an unfunded obligation reserve of $1,884,865 and an immediate repairs reserve of $30,063. |
The Loan. The Moonwater Office Portfolio loan (the “Moonwater Office Portfolio Loan”) is part of a whole loan (the “Moonwater Office Portfolio Whole Loan”) evidenced by four pari passu notes that are together secured by a first mortgage encumbering the borrowers’ fee interests in a six-property office portfolio comprising 611,320 square feet located in Las Vegas, Nevada (the “Moonwater Office Portfolio Properties”). The Moonwater Office Portfolio Loan is evidenced by the controlling note A-1 and note A-2, with an aggregate outstanding principal balance as of the Cut-off Date of $63,000,000. The remaining notes which have an aggregate outstanding principal balance as of the Cut-off Date of $53,000,000, are expected to be contributed to one or more future securitization transactions. The Moonwater Office Portfolio Whole Loan, which accrues interest at an interest rate of 4.25000% per annum, was originated on December 30, 2021, has an
THE INFORMATION IN THIS STRUCTURAL AND COLLATERAL TERM SHEET IS NOT COMPLETE AND MAY BE AMENDED PRIOR TO THE TIME OF SALE. THIS TERM SHEET IS NOT AN OFFER TO SELL THESE SECURITIES AND IT IS NOT A SOLICITATION OF AN OFFER TO BUY THESE SECURITIES IN ANY JURISDICTION WHERE THE OFFER OR SALE IS NOT PERMITTED.
136 of 158
| Structural and Collateral Term Sheet | Benchmark 2022-B32 | |
| Moonwater Office Portfolio | ||
aggregate original principal balance of $116,000,000 and has an aggregate outstanding principal balance as of the Cut-off Date of $116,000,000. The relationship between the holders of the Moonwater Office Portfolio Whole Loan will be governed by a co-lender agreement as described under “Description of the Mortgage Pool—The Whole Loans—The Serviced Pari Passu Whole Loans” in the Preliminary Prospectus. The Moonwater Office Portfolio Whole Loan had an initial term of 120 months and has a remaining term of 119 months as of the Cut-off Date. The Moonwater Office Portfolio Whole Loan requires monthly payments of interest only for the first 48 months of the loan and will amortize on a 30-year amortization schedule thereafter. The scheduled maturity date of The Moonwater Office Portfolio Whole Loan is the due date in January 2032.
| Whole Loan Summary | ||||
| Note | Original Balance | Cut-off Date Balance | Note Holder | Controlling Piece |
| A-1, A-2 | $63,000,000 | $63,000,000 | Benchmark 2022-B32 | Yes |
| A-3 | $35,000,000 | $35,000,000 | BCREI(1) | No |
| A-4 | $18,000,000 | $18,000,000 | BCREI(1) | No |
| Total | $116,000,000 | $116,000,000 | ||
| (1) | The related note is currently held by the Note Holder identified in the table above and is expected to be contributed to one or more future securitization transactions. |
The Borrowers. The borrowing entities for the Moonwater Office Portfolio Whole Loan are PREH Power House TSSP LLC, Power House TSSP, LLC and MRK Power House TSSP LLC, each a Delaware limited liability company, as tenants-in-common.
The Loan Sponsors. The loan sponsors and non-recourse carveout guarantors are Ofir Hagay, Ryan Tedder and Keith Kantrowitz.
The Properties. The Moonwater Office Portfolio Properties consist of six suburban office properties comprising 611,320 square feet located in Las Vegas, Nevada. The Moonwater Office Portfolio Properties were originally constructed between 1982 and 2007. As of October 7, 2021 and February 6, 2022, the Moonwater Office Portfolio Properties were 96.3% leased by seven tenants.
| Portfolio Summary | |||||
| Property | Year Built / Renovated | Net Rentable Area (SF) | Occupancy %(1) | Allocated Whole | Appraised Value |
| 6543 Las Vegas Boulevard South | 2007 / 2018 | 102,276 | 100.0% | $24,782,897 | $66,700,000 |
| 6226 West Sahara Avenue | 1982 / NAP | 292,180 | 100.0% | 14,994,000 | 40,600,000 |
| 10190 Covington Cross Drive | 1997 / NAP | 75,588 | 100.0% | 7,223,276 | 26,600,000 |
| 1450 Center Crossing Road | 2004 / NAP | 52,975 | 100.0% | 7,196,121 | 26,500,000 |
| 9901-9921 Covington Cross Drive | 1998 / NAP | 57,196 | 60.1% | 3,780,000 | 17,400,000 |
| 6551 Las Vegas Boulevard South | 2007 / 2018 | 31,105 | 100.0% | 5,023,707 | 18,500,000 |
| Total / Wtd. Avg. | 611,320 | 96.3% | $63,000,000 | $196,300,000 | |
| (1) | Occupancy is as of October 7, 2021 for the 9901-9921 Covington Cross Drive property and February 6, 2022 for the remaining properties. |
The largest tenant at the Moonwater Office Portfolio Properties is WeWork (102,276 SF; 16.7% of NRA; 31.1% of UW Base Rent). WeWork was founded in 2010 with the vision to create environments where people and companies come together and do their best work. Since opening their first location in New York City, they’ve grown into a global flexible space provider committed to delivering technology-driven flexible solutions, inspiring spaces, and community experiences.
The second largest tenant at the Moonwater Office Portfolio Properties is Nevada Power Company (292,180 SF; 47.8% of NRA; 24.2% of UW Base Rent). Nevada Power Company provides a wide range of energy services to nearly 1.3 million electric customers throughout the state and more than 50 million tourists annually. Nevada Power Company has served citizens in northern Nevada for more than 150 years, and southern Nevada since 1906.
The third largest tenant at the Moonwater Office Portfolio Properties is Coin Cloud (75,588 SF; 12.4% of NRA; 14.7% of UW Base Rent). Coin Cloud is the world’s largest network of two-way digital currency machines, providing a way for people to buy and sell Bitcoin and other digital currencies.
THE INFORMATION IN THIS STRUCTURAL AND COLLATERAL TERM SHEET IS NOT COMPLETE AND MAY BE AMENDED PRIOR TO THE TIME OF SALE. THIS TERM SHEET IS NOT AN OFFER TO SELL THESE SECURITIES AND IT IS NOT A SOLICITATION OF AN OFFER TO BUY THESE SECURITIES IN ANY JURISDICTION WHERE THE OFFER OR SALE IS NOT PERMITTED.
137 of 158
| Structural and Collateral Term Sheet | Benchmark 2022-B32 | |
| Moonwater Office Portfolio | ||
COVID-19 Update. As of January 6, 2022, the Moonwater Office Portfolio Properties were open and operating. As of January 6, 2022, there have been no loan modification or forbearance requests on the Moonwater Office Portfolio Loan. The first payment date of the Moonwater Office Portfolio Loan is the monthly due date in February 2022. See “Risk Factors—Special Risks—The Coronavirus Pandemic Has Adversely Affected the Global Economy and Will Likely Adversely Affect the Performance of the Mortgage Loans” in the Preliminary Prospectus.
| Historical Occupancy(1) | |||
| 2018 | 2019 | 2020 | Current(2) |
| N/A | N/A | 93.5% | 96.3% |
| (1) | Historical occupancies are as of December 31 of each respective year. |
| (2) | Current occupancy is as of October 7, 2021 for the 9901-9921 Covington Cross Drive property and February 6, 2022 for the remaining properties. |
The Market. The Moonwater Office Portfolio Properties are located in Las Vegas, Nevada, within the West Las Vegas office submarket. According to the appraisal, as of the second quarter of 2021, the West Las Vegas office submarket had a total office inventory of 8,002,377 square feet with a vacancy rate of 14.7% and an average asking rent of $1.85 per square foot. According to the appraisal, as of 2021, the population within a one-, three- and five-mile radius of the Moonwater Office Portfolio Properties was 641, 63,492 and 356,130, respectively. Additionally, over the same time period, the average household income within a one-, three- and five-mile radius was $87,598, $87,195 and $76,385, respectively.
| Tenant Summary(1) | ||||||
| Tenant | Ratings Moody’s/S&P/Fitch(2) | Net Rentable Area (SF) | % of Total NRA | Base Rent PSF(3) | % of Total Base Rent | Lease Expiration Date |
| WeWork(4) | NR / NR / NR | 102,276 | 16.7% | $38.83 | 31.1% | 10/31/2034 |
| Nevada Power Company(5) | Baa1 / A / NR | 292,180 | 47.8 | $10.57 | 24.2 | 1/31/2029 |
| Coin Cloud(6) | NR / NR / NR | 75,588 | 12.4 | $24.72 | 14.7 | 7/31/2031 |
| Diamond Resort Corporation | NR / B+ / BB- | 52,975 | 8.7 | $30.81 | 12.8 | 12/31/2023 |
| Amazon.com Services, Inc.(7) | A1 / AA / AA- | 31,105 | 5.1 | $37.06 | 9.0 | 12/31/2026 |
| DeVry Education Group, Inc.(8) | NR / NR / NR | 23,381 | 3.8 | $29.64 | 5.4 | 7/31/2028 |
| Adtalem Global Education Inc.(9) | B1 / BB- / NR | 10,969 | 1.8 | $31.21 | 2.7 | 7/31/2028 |
| Subtotal / Weighted Average | 588,474 | 96.3% | $21.66 | 100.0% | ||
| Remaining Tenants | 0 | 0.0 | $0.00 | 0.0 | ||
| Vacant | 22,846 | 3.7 | ||||
| Total / Weighted Average | 611,320 | 100.0% | $21.66 | 100.0% | ||
| (1) | Based on the underwritten rent rolls dated October 7, 2021 for the 9901-9921 Covington Cross Drive property and February 6, 2022 for the remaining properties. |
| (2) | In certain instances, ratings provided are those of the parent company of the entity shown, whether or not the parent company guarantees the lease. |
| (3) | Base Rent PSF includes rent steps occurring through September 1, 2022 and the average rent over the lease term for investment grade tenants. |
| (4) | WeWork has two, five-year extension options. WeWork subleases approximately 50% of its space at the 6543 Las Vegas Boulevard South property (51,138 SF of its 102,276 SF) to DraftKings. |
| (5) | Nevada Power Company has two, five-year extension options. |
| (6) | Coin Cloud has two, five-year extension options. Additionally, Coin Cloud has the right to terminate its lease on July 31, 2028 with 12 months’ notice and payment of a termination fee. |
| (7) | Amazon.com Services, Inc. has three, five-year extension options. Additionally, Amazon.com Services, Inc. has the right to terminate its lease in December 2024 with 12 months’ notice and payment of a termination fee. |
| (8) | DeVry Education Group, Inc. has one, five-year extension option. |
| (9) | Adtalem Global Education Inc. has one, five-year extension option. |
THE INFORMATION IN THIS STRUCTURAL AND COLLATERAL TERM SHEET IS NOT COMPLETE AND MAY BE AMENDED PRIOR TO THE TIME OF SALE. THIS TERM SHEET IS NOT AN OFFER TO SELL THESE SECURITIES AND IT IS NOT A SOLICITATION OF AN OFFER TO BUY THESE SECURITIES IN ANY JURISDICTION WHERE THE OFFER OR SALE IS NOT PERMITTED.
138 of 158
| Structural and Collateral Term Sheet | Benchmark 2022-B32 | |
| Moonwater Office Portfolio | ||
| Lease Rollover Schedule(1)(2)(3) | |||||||||
| Year | Number of Leases Expiring | Net Rentable Area Expiring | % of NRA Expiring | Base Rent Expiring | % of Base Rent Expiring | Cumulative Net Rentable Area Expiring | Cumulative % of NRA Expiring | Cumulative Base Rent Expiring | Cumulative % of Base Rent Expiring |
| Vacant | NAP | 22,846 | 3.7% | NAP | NAP | 22,846 | 3.7% | NAP | NAP |
| MTM | 0 | 0 | 0.0 | $0 | 0.0% | 22,846 | 3.7% | $0 | 0.0% |
| 2022 | 0 | 0 | 0.0 | 0 | 0.0 | 22,846 | 3.7% | $0 | 0.0% |
| 2023 | 1 | 52,975 | 8.7 | 1,632,419 | 12.8 | 75,821 | 12.4% | $1,632,419 | 12.8% |
| 2024 | 0 | 0 | 0.0 | 0 | 0.0 | 75,821 | 12.4% | $1,632,419 | 12.8% |
| 2025 | 0 | 0 | 0.0 | 0 | 0.0 | 75,821 | 12.4% | $1,632,419 | 12.8% |
| 2026 | 1 | 31,105 | 5.1 | 1,152,646 | 9.0 | 106,926 | 17.5% | $2,785,065 | 21.8% |
| 2027 | 0 | 0 | 0.0 | 0 | 0.0 | 106,926 | 17.5% | $2,785,065 | 21.8% |
| 2028 | 2 | 34,350 | 5.6 | 1,035,393 | 8.1 | 141,276 | 23.1% | $3,820,458 | 30.0% |
| 2029 | 1 | 292,180 | 47.8 | 3,089,000 | 24.2 | 433,456 | 70.9% | $6,909,458 | 54.2% |
| 2030 | 0 | 0 | 0.0 | 0 | 0.0 | 433,456 | 70.9% | $6,909,458 | 54.2% |
| 2031 | 1 | 75,588 | 12.4 | 1,868,535 | 14.7 | 509,044 | 83.3% | $8,777,994 | 68.9% |
| 2032 & Thereafter | 1 | 102,276 | 16.7 | 3,971,269 | 31.1 | 611,320 | 100.0% | $12,749,263 | 100.0% |
| Total | 7 | 611,320 | 100.0% | $12,749,263 | 100.0% | ||||
| (1) | Based on the underwritten rent rolls dated October 7, 2021 for the 9901-9921 Covington Cross Drive property and February 6, 2022 for the remaining properties. |
| (2) | Certain tenants may have termination options that are exercisable prior to the originally stated expiration date of the subject lease and that are not considered in the Lease Rollover Schedule. |
| (3) | Base Rent includes rent steps occurring through September 1, 2022 and the average rent over the lease term for investment grade tenants. |
| Underwritten Net Cash Flow(1)(2) | |||||
| 2020 | TTM 7/31/2021 | Underwritten | Per Square Foot | %(3) | |
| Rents in Place | $10,466,529 | $12,255,375 | $12,417,999 | $20.31 | 86.2% |
| Rent Steps(4) | 0 | 0 | 331,263 | 0.54 | 2.3 |
| Potential Income from Vacant Space | 0 | 0 | 685,380 | 1.12 | 4.8 |
| Gross Potential Rent | $10,466,529 | $12,255,375 | $13,434,643 | $21.98 | 93.3% |
| Total Reimbursements | 189,072 | 175,803 | 967,226 | 1.58 | 6.7 |
| Net Rental Income | $10,655,601 | $12,431,178 | $14,401,868 | $23.56 | 100.0% |
| (Vacancy/Credit Loss) | 0 | 0 | (1,170,674) | (1.91) | (8.1) |
| Other Income | 0 | 0 | 0 | 0.00 | 0.0 |
| Effective Gross Income | $10,655,601 | $12,431,178 | $13,231,194 | $21.64 | 91.9% |
| Real Estate Taxes | $457,023 | $478,491 | $544,365 | $0.89 | 4.1% |
| Insurance | 88,593 | 93,207 | 282,082 | 0.46 | 2.1 |
| Management Fee | 285,485 | 304,438 | 396,936 | 0.65 | 3.0 |
| Other Operating Expenses | 1,638,259 | 1,530,719 | 1,530,719 | 2.50 | 11.6 |
| Total Expenses | $2,469,360 | $2,406,855 | $2,754,101 | $4.51 | 20.8% |
| Net Operating Income | $8,186,241 | $10,024,323 | $10,477,093 | $17.14 | 79.2% |
| TI/LC | 0 | 0 | 611,320 | 1.00 | 4.6 |
| Capital Expenditures | 0 | 0 | 158,766 | 0.26 | 1.2 |
| Net Cash Flow | $8,186,241 | $10,024,323 | $9,707,007 | $15.88 | 73.4% |
| (1) | Based on the underwritten rent rolls dated October 7, 2021 for the 9901-9921 Covington Cross Drive property and February 6, 2022 for the remaining properties. |
| (2) | Historical financial information prior to 2020 is unavailable as several of the Moonwater Office Portfolio Properties were recently acquired. |
| (3) | % column represents percent of Net Rental Income for all revenue lines and represents percent of Effective Gross Income the remainder of the fields. |
| (4) | Rent Steps represent increases occurring through September 1, 2022 and the average rent over the lease term for investment grade tenants. |
Property Management. The Moonwater Office Portfolio Properties are managed by SKR Real Estate Services, LLC.
THE INFORMATION IN THIS STRUCTURAL AND COLLATERAL TERM SHEET IS NOT COMPLETE AND MAY BE AMENDED PRIOR TO THE TIME OF SALE. THIS TERM SHEET IS NOT AN OFFER TO SELL THESE SECURITIES AND IT IS NOT A SOLICITATION OF AN OFFER TO BUY THESE SECURITIES IN ANY JURISDICTION WHERE THE OFFER OR SALE IS NOT PERMITTED.
139 of 158
| Structural and Collateral Term Sheet | Benchmark 2022-B32 | |
| Novo Nordisk HQ | ||
| Mortgage Loan Information | Property Information | |||
| Mortgage Loan Seller: | GACC | Single Asset / Portfolio: | Single Asset | |
| Original Principal Balance(1): | $60,000,000 | Title: | Fee | |
| Cut-off Date Principal Balance(1): | $60,000,000 | Property Type - Subtype: | Office - Suburban | |
| % of Pool by IPB: | 3.4% | Net Rentable Area (SF): | 731,104 | |
| Loan Purpose: | Refinance | Location: | Plainsboro, NJ | |
| Borrower: | Princeton HD Owner LLC | Year Built / Renovated: | 1985, 1989, 1994 / 2013 | |
| Guarantor: | NAP | Occupancy: | 77.0% | |
| Interest Rate(2): | 2.83800% | Occupancy Date: | 2/6/2022 | |
| Note Date: | 11/5/2021 | Number of Tenants: | 1 | |
| Anticipated Repayment Date(2): | 11/6/2026 | Fourth Most Recent NOI(4): | NAV | |
| Maturity Date(2): | 4/6/2031 | Third Most Recent NOI: | $16,675,696 (December 31, 2018) | |
| Interest-only Period: | 60 months | Second Most Recent NOI: | $17,367,282 (December 31, 2019) | |
| Original Term(2): | 60 months | Most Recent NOI: | $18,260,825 (December 31, 2020) | |
| Original Amortization: | None | UW Economic Occupancy: | 78.0% | |
| Amortization Type(2): | Interest Only - ARD | UW Revenues: | $32,650,130 | |
| Call Protection(3): | L(27),D(28),O(5) | UW Expenses: | $13,331,718 | |
| Lockbox / Cash Management: | Hard / Springing | UW NOI: | $19,318,412 | |
| Additional Debt(1): | Yes | UW NCF: | $19,172,191 | |
| Additional Debt Balance(1): | $150,667,000 | Appraised Value / Per SF(5): | $330,000,000 / $451 | |
| Additional Debt Type(1): | Pari Passu | Appraisal Date(5): | 9/21/2021 | |
| Escrows and Reserves | Financial Information(1) | |||||
| Initial | Monthly | Initial | Whole Loan | |||
| Taxes: | $525,310 | $525,310 | N/A | Cut-off Date Loan / SF(4): | $288 | |
| Insurance: | $90,983 | $22,746 | N/A | Maturity Date Loan / SF(4): | $288 | |
| Replacement Reserves: | $0 | $1,218 | N/A | Cut-off Date LTV: | 63.8% | |
| TI/LC: | $0 | $0 | N/A | Maturity Date LTV: | 63.8% | |
| Other(5) | $27,146,846 | $0 | N/A | UW NCF DSCR: | 3.16x | |
| UW NOI Debt Yield: | 9.2% | |||||
| Sources and Uses | ||||||
| Sources | Proceeds | % of Total | Uses | Proceeds | % of Total | |
| Whole Loan | $210,667,000 | 100.0% | Loan Payoff | $169,240,404 | 80.3% | |
| Upfront Reserves | 27,763,140 | 13.2% | ||||
| Return of Equity | 11,803,118 | 5.6 | ||||
| Closing Costs | 1,860,338 | 0.9% | ||||
| Total Sources | $210,667,000 | 100.0% | Total Uses | $210,667,000 | 100.0% | |
| (1) | The Novo Nordisk HQ Loan (as defined below) is part of the Novo Nordisk HQ Whole Loan (as defined below) evidenced by five pari passu notes with an aggregate outstanding principal balance as of the Cut-off Date of $210,667,000. The Financial Information in the chart above is calculated based on the outstanding balance of the Novo Nordisk HQ Whole Loan. |
| (2) | The Novo Nordisk HQ Whole Loan is structured with an Anticipated Repayment Date (“ARD”) of November 6, 2026 and a final maturity date of April 6, 2031. The initial interest rate for the Novo Nordisk HQ Whole Loan is 2.83800% per annum. From and after the ARD, the per annum interest rate will equal to the greater of (i) the initial interest rate plus 2.5000% and (ii) the swap rate in effect on the ARD plus 4.19000%. The metrics presented above are calculated based on the ARD. |
| (3) | The defeasance lockout period, with respect to a defeasance of the Novo Nordisk HQ Whole Loan, will be at least 27 payment dates beginning with and including the first payment date on December 6, 2021. Defeasance of the full $210,667,000 Novo Nordisk HQ Whole Loan is permitted after the date that is earlier of (i) two years from the closing date of the securitization that includes the last note to be securitized and (ii) November 5, 2024. |
(4) The borrower did not provide the Fourth Most Recent NOI.
| (5) | The appraisal concluded to a “go dark” appraised value of $205,000,000, which results in a Cut-off Date LTV and Maturity Date LTV of 102.8%. |
| (6) | Other upfront reserve includes an expansion reserve of approximately $14,146,846 and a seller credit reserve of $13,000,000. |
The Loan. The Novo Nordisk HQ loan (the “Novo Nordisk HQ Loan”) is part of a whole loan (the “Novo Nordisk HQ Whole Loan”) secured by a first mortgage encumbering the borrower’s fee simple interest in a Class A office building located in Plainsboro, New Jersey. The Novo Nordisk HQ Loan is evidenced by the non-controlling Note A-2 and Note A-3-1, which have an aggregate outstanding principal balance as of the Cut-off Date of approximately $60,000,000. The Novo Nordisk HQ Whole Loan is comprised of five pari passu notes with an aggregate principal balance as of the Cut-off Date of $210,667,000. The related companion notes have been contributed to or are anticipated to be contributed to one or more future securitization trusts or may be otherwise transferred at any time. The Novo Nordisk HQ Whole Loan is serviced under the Benchmark 2021-B31 pooling and servicing agreement.
THE INFORMATION IN THIS STRUCTURAL AND COLLATERAL TERM SHEET IS NOT COMPLETE AND MAY BE AMENDED PRIOR TO THE TIME OF SALE. THIS TERM SHEET IS NOT AN OFFER TO SELL THESE SECURITIES AND IT IS NOT A SOLICITATION OF AN OFFER TO BUY THESE SECURITIES IN ANY JURISDICTION WHERE THE OFFER OR SALE IS NOT PERMITTED.
140 of 158
| Structural and Collateral Term Sheet | Benchmark 2022-B32 | |
| Novo Nordisk HQ | ||
The Novo Nordisk HQ Whole Loan has a five-year interest-only term through the ARD of November 6, 2026 and a final maturity date of April 6, 2031. The Novo Nordisk HQ Whole Loan has a remaining term to the ARD of 57 months as of the Cut-off Date. The initial interest rate for the Novo Nordisk HQ Whole Loan is 2.83800% per annum (the “Initial Interest Rate”). From and after the ARD, the per annum interest rate will be equal to the greater of (i) the Initial Interest Rate plus 2.5000% and (ii) the swap rate (as calculated in the Novo Nordisk HQ Whole Loan documents) in effect on the ARD plus 4.19000% (the “Adjusted Interest Rate”); however, interest accrued at the excess of the Adjusted Interest Rate over the Initial Interest Rate will be deferred and paid following the payment in full of the Novo Nordisk HQ Whole Loan. Following the ARD, all excess cash flow will be applied to repay the Novo Nordisk HQ Whole Loan.
| Whole Loan Summary | |||||
| Note | Original Balance | Cut-off Date Balance | Note Holder | Controlling Piece | |
| A-1 | $75,000,000 | $75,000,000 | Benchmark 2021-B31 | Yes | |
| A-2, A-3-1 | $60,000,000 | $60,000,000 | Benchmark 2022-B32 | No | |
| A-3-2, A-4 | $75,667,000 | $75,667,000 | DBRI | No | |
| Whole Loan | $210,667,000 | $210,667,000 | |||
The Borrower. The borrower is Princeton HD Owner LLC, a Delaware limited liability company and single purpose entity with two independent directors. Legal counsel to the borrower delivered a non-consolidation opinion in connection with the origination of the Novo Nordisk HQ Whole Loan.
The Loan Sponsor. There is no non-recourse carveout guarantor or separate environmental indemnitor with respect to the Novo Nordisk HQ Whole Loan. The borrower sponsor is Hana Alternative Asset Management Co., Ltd (“Hana”). The Novo Nordisk HQ Property is indirectly owned by a joint venture between Mirae Asset Securities (27.78%), Hana Financial Investment (22.98%), Hyundai Motor Securities (19.15%), Heung Kuk Fire & Marine Insurance (19.03%) and Seoul Guaranty Insurance (10.05%). The borrower sponsor is ultimately controlled by Hana.
Hana, a subsidiary of Hana Financial Group, was founded in 2006 as the first asset management company to specialize in commercial real estate in Korea. As of November 2021, Hana had approximately $8.0 billion USD of assets under management of which 67.1% are investments in real estate
The Property. The Novo Nordisk HQ Property is a Class A office property totaling 731,104 SF across nine interconnected buildings on a 58.63-acre site located in Plainsboro, New Jersey. The Novo Nordisk HQ Property was originally built from 1985 to 1994 and in 2013 underwent a full redevelopment and modernization. The Novo Nordisk HQ Property is LEED Silver-certified and features modern technology, energy-efficient systems and design upgrades such as a new façade, 10-foot glass exterior walls and a two-story, 30-foot lobby with floor-to-ceiling glass. The campus amenities include a 267-seat full-service cafeteria, a fully-equipped fitness center, presidential suite and executive board room, a 4,000 SF rooftop terrace with kitchen and patio seating, concierge services, meeting spaces and 2,214 parking spaces (2.9 spaces per 1,000 SF), including a subterranean parking garage.
As of February 6, 2022, the Novo Nordisk HQ Property is 77.0% leased to its sole tenant, Novo Nordisk, Inc. (“Novo Nordisk” or the “Tenant”), the United States affiliate of the global healthcare company, Novo Nordisk A/S (NYSE: NVO; rated A1/AA- by Moody’s/S&P), which is the guarantor under the Novo Nordisk lease. Novo Nordisk occupies 563,289 SF or 100% of the SF of the space which it is obligated to lease under the terms of its lease. Novo Nordisk has the option to lease the remaining 167,815 SF at the Novo Nordisk HQ Property, which is located along the easterly side of the complex and is in “shell” condition. Novo Nordisk can exercise its right to expand into this space anytime during its lease term and as such, this expansion space cannot be marketed to another tenant without modifying the current Novo Nordisk lease. At loan origination, the borrower deposited approximately $14,146,846 into an expansion reserve and $13,000,000 into a seller credit reserve. The seller credit reserve was provided in connection with an agreement between the prior owner of the Novo Nordisk HQ Property (the “Novo Seller”) and the sole member of the borrower, pursuant to which the sole member has agreed to pay all or a pro rata portion of such amount to the Novo Seller if Novo Nordisk exercises all or a portion of its expansion option for 167,815 additional square feet. The sole member has pledged its equity interest in the borrower to the Novo Seller to secure such obligation. See “Description of the Mortgage Pool—Certain Terms of the Mortgage Loans—Additional Indebtedness—Other Indebtedness” in the Preliminary Prospectus.
Novo Nordisk has maintained its North American headquarters at the Novo Nordisk HQ Property since taking occupancy in 2013, originally as part of an approximately $215.0 million renovate-to-suit project. Novo Nordisk has recently completed an approximately $32.0 million capital expenditure program at the Novo Nordisk HQ Property, which included IT infrastructure improvements, a new teleconference center, office furniture upgrades, locker room improvements and mechanical and lighting upgrades.
Founded in 1923, Novo Nordisk A/S is a global healthcare company, headquartered in Copenhagen, Denmark with more than 45,000 employees in 80 offices around the world. As of the trailing 12-month period ending in the third quarter of 2021, Novo Nordisk A/S reported a total revenue of approximately $134.6 billion and a net income of approximately $46.2 billion. Novo Nordisk, the United States subsidiary and Tenant, is a developer and manufacturer of biological medicines specializing in diabetes care and other serious chronic conditions such as hemophilia, obesity and growth disorders. Novo Nordisk is headquartered at the Novo Nordisk HQ Property and has other locations in seven states and nearly 6,000 employees with approximately 4.0 million people in the United States using its medicines.
THE INFORMATION IN THIS STRUCTURAL AND COLLATERAL TERM SHEET IS NOT COMPLETE AND MAY BE AMENDED PRIOR TO THE TIME OF SALE. THIS TERM SHEET IS NOT AN OFFER TO SELL THESE SECURITIES AND IT IS NOT A SOLICITATION OF AN OFFER TO BUY THESE SECURITIES IN ANY JURISDICTION WHERE THE OFFER OR SALE IS NOT PERMITTED.
141 of 158
| Structural and Collateral Term Sheet | Benchmark 2022-B32 | |
| Novo Nordisk HQ | ||
Novo Nordisk occupies the Novo Nordisk HQ Property under a lease that expires in April 2031, with no termination options and one, 10-year renewal option. Novo Nordisk has a base rent of $32.81 per SF on a triple net basis with 2.00% annual rent steps.
According to information provided by the property manager as of January 19, 2022, as of November 15, 2021, all employees were required to return to the Novo Nordisk HQ Property at least three days per week; however, employees have been permitted to work from home until further notice due to the recent surge in COVID-19 variants, and the building is closed Fridays for maintenance and cleaning. The Novo Nordisk HQ Property typically had a pre-pandemic full-time workforce of approximately 1,700 employees.
COVID-19 Update. As of January 6, 2021, the Novo Nordisk HQ Whole Loan is not subject to any forbearance, modification or debt service relief request. The tenant has not made any requests for lease modifications or rent relief. The Novo Nordisk HQ Whole Loan is current as of the payment date in January 2022. See “Risk Factors—Special Risks—Coronavirus Pandemic Has Adversely Affected the Global Economy and Will Likely Adversely Affect the Performance of the Mortgage Loans” in the Preliminary Prospectus.
The Market. The Novo Nordisk HQ Property is located in Plainsboro Township in Middlesex County, New Jersey, a suburban community that offers convenient highway access, proximity to major universities, an educated labor pool, area amenities and a diverse housing base. The Novo Nordisk HQ Property is within the Princeton Forrestal Center Office and Research Complex, which is Princeton University’s corporate office and research complex. The Princeton Forrestal Center is in the Princeton business and pharmaceutical corridor as the municipality of Princeton is adjacent to Plainsboro Township. The Princeton Forrestal Center is home to a corporate presence which includes companies such as Bristol-Meyers Squibb, Bank of America Merrill Lynch, Johnson & Johnson, Dow Jones, and BlackRock. Novo Nordisk directly benefits from its relationships with numerous businesses, hospitals, and medical centers, which purchase, use, sell, or collaborate with Novo Nordisk on the development of the pharmaceutical and medicinal products that Novo Nordisk produces and are located within direct proximity to the Novo Nordisk HQ Property. Such institutions include the University Medical Center of Princeton at Plainsboro, a recently completed 369-bed facility located approximately 2 miles from the Novo Nordisk HQ Property, which includes a hospital, an education center, a skilled nursing facility, and a park and has been a strong demand driver for medical office space at Princeton Forrestal Village. The Novo Nordisk HQ Property location also offers Novo Nordisk and other employers direct access to an educational base of newly graduated talent from universities, such as Princeton University, Rutgers University, TCNJ, and Rider University. The Novo Nordisk HQ Property is equidistant from New York and Philadelphia, allowing Novo Nordisk and other surrounding companies the ability to draw residents from both metropolitan areas, as well as diverse and educated labor pools from Eastern Pennsylvania and Northern and Central New Jersey. The transit-oriented campus is less than one mile from Route 1, less than four miles from the Princeton Junction mass transit center and convenient to Interstates 95 and 295.
According to the appraisal, the Novo Nordisk HQ Property is located in the Brunswick West office submarket in Northern New Jersey. Over the past ten years the Brunswick West office submarket inventory slightly increased by 2.4% and had positive absorption of 2.4%. Over the same period, there was a 5.9% decrease in the vacancy rate and a 14.6% increase in the average asking rent. As of the second quarter of 2021, the Brunswick West submarket had a total office inventory of approximately 10.0 million SF with a vacancy rate of 21.5%. The average asking rent was $27.14 per SF.
The following table summarizes the comparable office leases in the surrounding market.
| Summary of Comparable Office Leases(1) | ||||||||||
| Property/Address | Location | Year Built / Renovated | Tenant Name | Lease Start Date | Term (yrs.) | Lease Type | Tenant Size (SF) | Base Rent PSF | Rent Steps | Free Rent (mos.) |
| Novo Nordisk HQ(2) | Plainsboro, NJ | 1985, 1989, 1994 / 2013 | Novo Nordisk | 7/2011 | 18 | NNN | 563,289 | $32.81 | 2.0% | 0 |
| 777 Scudders Mill Road | Plainsboro, NJ | 1992 / NAP | Croda, Inc. | 6/2020 | 12 | NNN | 225,000 | $31.00 | 3.0% | 6 |
| 200 Connell Drive | Berkeley Heights, NJ | 1987 / NAP | Hikma Pharmaceuticals | 12/2019 | 10 | MG | 44,267 | $34.50 | 2.0% | 0 |
| 445 South Street Ste. 300 | Morristown, NJ | 1984 / 2007 | Travelers Insurance | 2/2018 | 10 | NNN | 80,642 | $25.50 | 2.0% | 0 |
| 1 University Square Ste. 1, 3, 4 | Princeton, NJ | 2006 / NAP | Blackrock Financial | 10/2018 | 10 | NNN | 209,809 | $41.62 | 2.0% | 0 |
| 9 Roszel Road Ste. 1, 2, 3 | West Windsor, NJ | 1999 / NAP | Bristol-Myers Squibb | 3/2021 | 10 | MG | 118,110 | $35.00 | 2.0% | 0 |
| 440 Route 22 E, Ste 101 | Bridgewater, NJ | 1990 / 2019 | PF Compass | 1/2021 | 10 | MG | 199,279 | $27.00 | 2.0% | 0 |
| Total/Wtd. Avg.(3) | 10.5 | $32.84 | ||||||||
| (1) | Source: Appraisal |
| (2) | Based on the rent roll as of February 6, 2022. |
| (3) | Total/Wtd. Avg. does not include the Novo Nordisk HQ Property. |
THE INFORMATION IN THIS STRUCTURAL AND COLLATERAL TERM SHEET IS NOT COMPLETE AND MAY BE AMENDED PRIOR TO THE TIME OF SALE. THIS TERM SHEET IS NOT AN OFFER TO SELL THESE SECURITIES AND IT IS NOT A SOLICITATION OF AN OFFER TO BUY THESE SECURITIES IN ANY JURISDICTION WHERE THE OFFER OR SALE IS NOT PERMITTED.
142 of 158
| Structural and Collateral Term Sheet | Benchmark 2022-B32 | |
| Novo Nordisk HQ | ||
| Tenant Summary(1) | ||||||
| Tenant | Ratings Moody’s/S&P/Fitch(2) | Net Rentable Area (SF) | % of Total NRA | Base Rent PSF | % of Total Base Rent | Lease Expiration Date |
| Novo Nordisk | A1 / AA- / NR | 563,289 | 77.0% | $32.81 | 100.0% | 4/30/2031 |
| Total Occupied | 563,289 | 77.0% | $32.81 | 100.0% | ||
| Vacant | 167,815 | 23.0 | ||||
| Total / Weighted Average | 731,104 | 100.0% | ||||
| (1) | Based on the underwritten rent roll as of February 6, 2022. |
| (2) | The credit ratings are those of the direct parent company, Novo Nordisk A/S, which is the guarantor under the lease. |
| Lease Rollover Schedule(1) | |||||||||
| Year | Number of Leases Expiring | Net Rentable Area Expiring | % of NRA Expiring | Base Rent Expiring | % of Base Rent Expiring | Cumulative Net Rentable Area Expiring | Cumulative % of NRA Expiring | Cumulative Base Rent Expiring | Cumulative % of Base Rent Expiring |
| Vacant | NAP | 167,815 | 23.0% | NAP | NAP | 167,815 | 23.0% | NAP | NAP |
| MTM & 2022 | 0 | 0 | 0.0% | $0 | 0.0% | 167,815 | 23.0% | $0 | 0.0% |
| 2023 | 0 | 0 | 0.0% | 0 | 0.0 | 167,815 | 23.0% | $0 | 0.0% |
| 2024 | 0 | 0 | 0.0% | 0 | 0.0 | 167,815 | 23.0% | $0 | 0.0% |
| 2025 | 0 | 0 | 0.0% | 0 | 0.0 | 167,815 | 23.0% | $0 | 0.0% |
| 2026 | 0 | 0 | 0.0% | 0 | 0.0 | 167,815 | 23.0% | $0 | 0.0% |
| 2027 | 0 | 0 | 0.0% | 0 | 0.0 | 167,815 | 23.0% | $0 | 0.0% |
| 2028 | 0 | 0 | 0.0% | 0 | 0.0 | 167,815 | 23.0% | $0 | 0.0% |
| 2029 | 0 | 0 | 0.0% | 0 | 0.0 | 167,815 | 23.0% | $0 | 0.0% |
| 2030 | 0 | 0 | 0.0% | 0 | 0.0 | 167,815 | 23.0% | $0 | 0.0% |
| 2031 | 1 | 563,289 | 77.0% | $18,481,512 | 100.0 | 731,104 | 100.0% | $18,481,512 | 100.0% |
| 2032 & Thereafter | 0 | 0 | 0.0% | 0 | 0.0 | 731,104 | 100.0% | $18,481,512 | 100.0% |
| Total | 1 | 731,104 | 100.0% | $18,481,512 | 100.0% | ||||
| (1) | Based on the underwritten rent roll as of February 6, 2022. |
Operating History and Underwritten Net Cash Flow(1) | ||||||
2018 | 2019 | 2020 | Underwritten | Per Square Foot | %(2) | |
| Base Rent | $17,302,360 | $17,649,722 | $18,002,716 | $18,481,512 | $25.28 | 43.9% |
| Rent Steps(3) | 0 | 0 | 0 | 371,771 | $0.51 | 0.9% |
| IG Rent Step Credit(4) | 0 | 0 | 0 | 465,129 | $0.64 | 1.1% |
| Value of Vacant Space | 0 | 0 | 0 | 9,458,516 | $12.94 | 22.5% |
| Gross Potential Rent | $17,302,360 | $17,649,722 | $18,002,716 | $28,776,928 | $39.36 | 68.3% |
| Tenant Recoveries | 12,185,965 | 13,111,052 | 13,295,581 | 13,331,718 | $18.24 | 31.7% |
| Total Gross Income | $29,488,325 | $30,760,774 | $31,298,297 | $42,108,646 | $57.60 | 100.0% |
| Vacancy | 0 | 0 | 0 | (9,458,516) | ($12.94) | (22.5%) |
| Effective Gross Income | $29,488,325 | $30,760,774 | $31,298,297 | $32,650,130 | $44.66 | 77.5% |
| Total Fixed Expenses | 5,987,351 | 6,090,604 | 6,261,061 | 6,515,840 | $8.91 | 20.0% |
| Total Variable Expenses | 6,825,278 | 7,302,888 | 6,776,411 | 6,815,878 | $9.32 | 20.9% |
| Total Expenses | $12,812,629 | $13,393,492 | $13,037,472 | $13,331,718 | $18.24 | 40.8% |
| 0.0% | ||||||
| Net Operating Income | $16,675,696 | $17,367,282 | $18,260,825 | $19,318,412 | $26.42 | 59.2% |
| Replacement Reserve | 0 | 0 | 0 | 146,221 | $0.20 | 0.4% |
| TI / LC | 0 | 0 | 0 | 0 | $0.00 | 0.0% |
| Net Cash Flow | $16,675,696 | $17,367,282 | $18,260,825 | $19,172,191 | $26.22 | 58.7% |
| (1) | Based on the underwritten rent roll as of February 6, 2022. |
| (2) | % column represents percent of Net Rental Income for all revenue lines and represents percent of Effective Gross Income for the remainder of the fields. |
| (3) | Based on contractual rent steps through September 1, 2022. |
| (4) | Based on the straight-line rent steps through the final maturity date of the Novo Nordisk HQ Whole Loan. |
Property Management. The Novo Nordisk HQ property is managed by Ivy Realty Services, LLC, which is an unaffiliated manager.
THE INFORMATION IN THIS STRUCTURAL AND COLLATERAL TERM SHEET IS NOT COMPLETE AND MAY BE AMENDED PRIOR TO THE TIME OF SALE. THIS TERM SHEET IS NOT AN OFFER TO SELL THESE SECURITIES AND IT IS NOT A SOLICITATION OF AN OFFER TO BUY THESE SECURITIES IN ANY JURISDICTION WHERE THE OFFER OR SALE IS NOT PERMITTED.
143 of 158
| Structural and Collateral Term Sheet | Benchmark 2022-B32 | |
| The Kirby Collection | ||
| Mortgage Loan Information | Property Information | |||
| Mortgage Loan Seller: | CREFI | Single Asset / Portfolio: | Single Asset | |
| Original Principal Balance(1): | $55,000,000 | Title: | Fee | |
| Cut-off Date Principal Balance(1): | $55,000,000 | Property Type - Subtype: | Mixed Use - Multifamily/Office/Retail | |
| % of Pool by IPB: | 3.1% | Net Rentable Area (SF): | 534,338 | |
| Loan Purpose: | Recapitalization | Location: | Houston, TX | |
| Borrower: | CP5 Kirby Collection, LLC | Year Built / Renovated: | 2018 / NAP | |
| Guarantors: | FPA Core Plus Fund V-A, L.P., | Occupancy(3): | 92.0% | |
| FPA Core Plus Fund V, L.P. and | Occupancy Date(3): | 10/26/2021 | ||
| FPACP/REIT Holdings V, LLC | Number of Tenants(4): | 16 | ||
| Interest Rate: | 2.94000% | Fourth Most Recent NOI(5): | NAV | |
| Note Date: | 12/23/2021 | Third Most Recent NOI(5): | NAV | |
| Maturity Date: | 1/6/2032 | Second Most Recent NOI(5): | NAV | |
| Interest-only Period: | 120 months | Most Recent NOI: | $9,410,252 (TTM 9/30/2021) | |
| Original Term: | 120 months | UW Economic Occupancy: | 81.1% | |
| Original Amortization: | None | UW Revenues: | $20,864,412 | |
| Amortization Type: | Interest Only | UW Expenses: | $9,383,412 | |
| Call Protection(2): | L(25),D(90),O(5) | UW NOI(6): | $11,481,000 | |
| Lockbox / Cash Management: | Springing / Springing | UW NCF: | $11,017,340 | |
| Additional Debt(1): | Yes | Appraised Value / Per SF: | $199,000,000 / $372 | |
| Additional Debt Balance(1): | $40,661,369 | Appraisal Date: | 11/24/2021 | |
| Additional Debt Type(1): | Pari Passu | |||
| Escrows and Reserves | Financial Information(1) | |||||
| Initial | Monthly | Initial Cap | Cut-off Date Loan / SF: | $179 | ||
| Taxes: | $330,524 | $330,524 | N/A | Maturity Date Loan / SF: | $179 | |
| Insurance: | $372,786 | $37,279 | N/A | Cut-off Date LTV: | 48.1% | |
| Replacement Reserves: | $0 | Springing | N/A | Maturity Date LTV: | 48.1% | |
| TI/LC: | $0 | Springing | N/A | UW NCF DSCR: | 3.86x | |
| Other(7): | $1,727,967 | $0 | N/A | UW NOI Debt Yield: | 12.0% | |
| Sources and Uses | ||||||
| Sources | Proceeds | % of | Uses | Proceeds | % of Total | |
| Whole Loan | $95,661,369 | 50.4% | Purchase Price | $182,500,000 | 96.1% | |
| Principal’s New Cash Contribution | 88,184,651 | 46.4 | Other Uses(9) | 3,777,417 | 2.0 | |
| Other Sources(8) | 6,128,851 | 3.2 | Upfront Reserves | 2,431,278 | 1.3 | |
| Closing Costs | 1,266,178 | 0.7 | ||||
| Total Sources | $189,974,872 | 100.0% | Total Uses | $189,974,872 | 100.0% | |
| (1) | The Kirby Collection Loan consists of the controlling Note A-1 and is part of The Kirby Collection Whole Loan (as defined below) evidenced by two senior pari passu notes, with an aggregate outstanding principal balance as of the Cut-off Date of $95,661,369. For additional information, see “The Loan” herein. Financial information presented in the chart above reflects the aggregate Cut-off Date balance of the $95,661,369. |
| (2) | The lockout period will be at least 25 payments beginning with and including the first payment date of February 6, 2022. The borrower has the option to defease the full $95.7 million The Kirby Collection Whole Loan after the earlier to occur of (i) two years after the closing date of the securitization that includes the last note to be securitized and (ii) December 23, 2025. The assumed lockout period of 25 months is based on the expected closing date of the Benchmark 2022-B32 securitization in February 2022. The actual lockout period may be longer. |
| (3) | The multifamily component was 89.4% occupied as of October 26, 2021 and the office/retail component was 97.2% occupied as of December 7, 2021. |
| (4) | Represents the number of commercial tenants. |
| (5) | Fourth Most Recent NOI, Third Most Recent NOI, and Second Most Recent NOI are not available as The Kirby Collection Property (as defined below) was recently acquired. |
| (6) | The increase in UW NOI from Most Recent NOI is primarily driven by recent leasing activity and potential income from vacant space. |
| (7) | Other upfront reserves consist of outstanding TI/LCs ($1,221,322) and free rent ($506,646). |
| (8) | Other Sources primarily consists of the seller’s real estate tax proration of approximately $3.3 million and a TI/LC credit of approximately $2.2 million. |
| (9) | Other Uses consist of property taxes of approximately $3.8 million due. |
The Loan. The Kirby Collection loan (“The Kirby Collection Loan”) is part of a whole loan (“The Kirby Collection Whole Loan”) evidenced by two pari passu notes that are together secured by a first mortgage encumbering the borrower’s fee interest in a mixed use property comprising 534,338 square feet located in Houston, Texas (“The Kirby Collection Property”). The Kirby Collection Loan is evidenced by the controlling note A-1, with an outstanding principal balance as of the Cut-off Date of $55,000,000. The remaining note, which has an outstanding principal balance as of the Cut-off Date of $40,661,369, is expected to be contributed to one or more future securitization transactions. The Kirby Collection Whole Loan, which accrues interest at an interest rate of 2.94000% per annum, was originated on
THE INFORMATION IN THIS STRUCTURAL AND COLLATERAL TERM SHEET IS NOT COMPLETE AND MAY BE AMENDED PRIOR TO THE TIME OF SALE. THIS TERM SHEET IS NOT AN OFFER TO SELL THESE SECURITIES AND IT IS NOT A SOLICITATION OF AN OFFER TO BUY THESE SECURITIES IN ANY JURISDICTION WHERE THE OFFER OR SALE IS NOT PERMITTED.
144 of 158
| Structural and Collateral Term Sheet | Benchmark 2022-B32 | |
| The Kirby Collection | ||
December 23, 2021, has an aggregate original principal balance of $95,661,369 and has an aggregate outstanding principal balance as of the Cut-off Date of $95,661,369. The Kirby Collection Whole Loan had an initial term of 120 months and has a remaining term of 119 months as of the Cut-off Date and will be interest-only for the term of the loan. The scheduled maturity date of The Kirby Collection Whole Loan is January 6, 2032.
The table below summarizes the promissory notes that comprise The Kirby Collection Whole Loan. The relationship between the holders of The Kirby Collection Whole Loan is governed by a co-lender agreement as described under “Description of the Mortgage Pool—The Whole Loans—The Serviced Pari Passu Whole Loans” in the Preliminary Prospectus.
| Whole Loan Summary | |||||
| Note | Original Balance | Cut-off Date Balance | Note Holder | Controlling Piece | |
| Note A-1 | $55,000,000 | $55,000,000 | Benchmark 2022-B32 | Yes | |
| Note A-2 | $40,661,369 | $40,661,369 | CREFI(1) | No | |
| Whole Loan | $95,661,369 | $95,661,369 | |||
| (1) | The related note is currently held by the Note Holder identified in the table above and is expected to be contributed to one or more future securitization transactions. |
The Borrower. The borrowing entity for The Kirby Collection Whole Loan is CP5 Kirby Collection, LLC, a Delaware limited liability company.
The Loan Sponsors. The loan sponsors and non-recourse carveout guarantors are FPA Core Plus Fund V-A, L.P., FPA Core Plus Fund V, L.P. and FPACP/REIT Holdings V, LLC (together, “FPA”). Founded in 1985, FPA is a privately-held real estate investment firm focused on the acquisition of multifamily properties in select high growth markets in the United States. FPA is a manager of equity capital for ten of the Top 100 US foundations & endowments, foreign & domestic pension funds, family offices, and top tier fund of funds. FPA also has asset management, property management, development, and construction arms.
FPA’s total transactional history includes approximately 600 buildings in excess of 120,000 units for over $15.0 billion in value, which include realized investments of approximately 430 buildings totaling 118,000 units. Recognized on the NMHC’s Top 50 Apartment Owners list and Institutional Real Estate’s Top 150 Global Investment Managers, FPA currently owns and operates 99 properties throughout the United States, primarily in the western half of the country. FPA is led by Gregory Fowler, who has over 35 years of experience in the real estate industry with approximately $15 billion in total transactions, including over 600 apartment communities.
The Property. The Kirby Collection Property is comprised of a 25-story luxury multifamily building with 199 units (290,772 SF), a 13-story Class A office tower consisting of 182,685 SF, and a two-story retail building with 60,881 SF, for a combined 534,338 SF of net rentable area. Constructed in 2018, The Kirby Collection Property is situated on a 3.16-acre site that includes a 1,061-space, five-level parking garage connecting the multifamily, office and retail components.
Multifamily (54.4% of NRA; 55.2% of UW base rent). The multifamily component of The Kirby Collection Property, known as The Residences at Kirby Collection, is a 25-story luxury rental apartment building comprised of 199 units (290,772 SF) which are 89.4% leased as of the underwritten rent roll dated October 26, 2021. The unit mix is comprised of 94 1BR/1BA units (1,101 average SF) with average in place rents of $3,267/month, seven 1BR/1.5BA units (1,704 average SF) with average in-place rents of $4,361/month, 93 2BR/2BA units (1,754 average SF) with average in-place rents of $5,625/month, two 2BR/2.5BA units (1,908 average SF) with average in-place rents of $7,760/month, and three 3BR/3.5BA units (2,830 average SF) with average in-place rents of $11,212/month. Unit features include private balcony/patio, marble countertops, premium appliances, walk-in closets and in-unit washer/dryer. Common amenities include a BBQ/picnic area, business center, clubhouse, concierge, fitness center, game room, rooftop pool and garage parking (of which 311 spaces are allocated to residential and 33 allocated to valet).
Office (34.2% of NRA; 31.4% of UW base rent). The office component of The Kirby Collection Property consists of a 13-story tower comprised of 182,685 SF, which is 100.0% leased as of December 7, 2021. Major office tenants include PROS, Inc. (48.3% of commercial NRA, 44.8% of commercial UW rent), Hancock Whitney Bank (12.1% of commercial NRA, 11.8% of commercial underwritten rent) and Novum Energy Trading, Inc. (3.7% of commercial NRA, 3.8% of commercial underwritten rent). The building features floor to ceiling glass, four passenger elevators, one service elevator and an on-site fitness center. The office building shares 717 garage parking spaces with the retail component.
Retail (11.4% of NRA; 13.4% of UW base rent). The retail component of The Kirby Collection Property contains 60,881 SF and was 88.9% leased as of December 7, 2021. Major retail tenants include Pinstripes Texas, Inc. (13.9% of commercial NRA, 16.1% of commercial underwritten rent) and 1Life Healthcare, Inc. (2.3% of commercial NRA, 4.1% of commercial underwritten rent). The two-story building is situated between the office tower and the multifamily building and shares 717 garage parking spaces with the office component.
THE INFORMATION IN THIS STRUCTURAL AND COLLATERAL TERM SHEET IS NOT COMPLETE AND MAY BE AMENDED PRIOR TO THE TIME OF SALE. THIS TERM SHEET IS NOT AN OFFER TO SELL THESE SECURITIES AND IT IS NOT A SOLICITATION OF AN OFFER TO BUY THESE SECURITIES IN ANY JURISDICTION WHERE THE OFFER OR SALE IS NOT PERMITTED.
145 of 158
| Structural and Collateral Term Sheet | Benchmark 2022-B32 | |
| The Kirby Collection | ||
COVID-19 Update. As of January 6, 2022, The Kirby Collection Property is open and operating. Five tenants received rent abatements or deferrals as a result of the COVID-19 pandemic. As of January 6, 2022, there have been no loan modification or forbearance requests on The Kirby Collection Whole Loan. The first payment date of The Kirby Collection Whole Loan is the monthly due date in February 2022. See “Risk Factors—Special Risks—The Coronavirus Pandemic Has Adversely Affected the Global Economy and Will Likely Adversely Affect the Performance of the Mortgage Loans” in the Preliminary Prospectus.
The Market. The Kirby Collection Property is located within Harris County of the greater Houston market. As the largest city in the state of Texas and the fourth largest city in the US, Houston is recognized as the energy capital of the world and is home to 24 Fortune 500 companies. According to the appraisal, The Kirby Collection Property is located approximately five miles to the east of the Houston CBD and is situated in a well-established area referred to as “Upper Kirby.” Additionally, the Kirby Collection Property benefits from close proximity to major roadways such as Interstate Highway 69, IH-Loop 610, and Interstate Highway 45. According to the appraisal, the 2021 population within a one-, three- and five-mile radius of The Kirby Collection Property are 24,675, 206,941, and 530,390, respectively. Additionally, the average 2021 household income within a one-, three- and five-mile radius of The Kirby Collection Property are $155,803, $156,506 and $131,112, respectively.
The multifamily component of The Kirby Collection Property is located in the Greenway/Upper Kirby multifamily submarket, which had a total inventory of 18,867 units, vacancy rate of 5.7%, and market rent of $1,841 per unit as of the third quarter of 2021. According to the appraisal, there are 962 new units expected to deliver over the next four quarters. Effective rents have increased for high-rise properties over the past 12 months after being suppressed by COVID in 2020, while demand in the submarket has outpaced supply in three of the last four quarters.
The office component of The Kirby Collection Property is located within the Greenway Plaza office submarket, which had a total inventory of 12,894,007 SF, vacancy rate of 20.7%, and an average asking rent of $34.47 per square foot as of the third quarter of 2021. Over the past four quarters, the Greenway Plaza office submarket has experienced no growth in its supply.
The retail component of The Kirby Collection Property is located in the Inner Loop River Oaks retail submarket, which had a total inventory of 13,192,115 SF, vacancy rate of 4.5%, and an average asking rent of $34.90 per square foot as of the third quarter of 2021. Over the past four quarters, the submarket experienced a moderate increase of supply along with positive net absorption, a decrease in vacancy rates and a nominal increase of asking rent in the marketplace.
| Historical Occupancy(1) | |||
| 2018 | 2019 | 2020 | Current(2) |
| N/A | N/A | N/A | 92.0% |
| (1) | Historical occupancies are not available as The Kirby Collection Property was recently acquired. |
| (2) | The multifamily component was 89.4% occupied as of October 26, 2021 and the office/retail component was 97.2% occupied as of December 7, 2021. |
| Multifamily Unit Mix(1) | ||||||
| Unit Type | # of Units | % of Total Units | Occupancy | Average Unit Size (SF) | Average Rent Per Unit | Average Market Rent Per Month |
| 1 BD / 1 BA | 94 | 47.2% | 95.7% | 1,101 | $3,267 | $3,310 |
| 1 BD / 1.5 BA | 7 | 3.5% | 71.4% | 1,704 | $4,361 | $4,393 |
| 2 BD / 2 BA(2) | 93 | 46.7% | 84.8% | 1,754 | $5,625 | $5,601 |
| 2 BD / 2.5 BA | 2 | 1.0% | 50.0% | 1,908 | $7,760 | $7,893 |
| 3 BD / 3.5 BA | 3 | 1.5% | 100.0% | 2,830 | $11,212 | $11,583 |
| Total / Wtd. Avg. | 199 | 100.0% | 89.4% | 1,461 | $4,497 | $4,585 |
| (1) | Based on the underwritten rent roll dated October 26, 2021. |
| (2) | Includes one model unit which is excluded from available inventory. |
THE INFORMATION IN THIS STRUCTURAL AND COLLATERAL TERM SHEET IS NOT COMPLETE AND MAY BE AMENDED PRIOR TO THE TIME OF SALE. THIS TERM SHEET IS NOT AN OFFER TO SELL THESE SECURITIES AND IT IS NOT A SOLICITATION OF AN OFFER TO BUY THESE SECURITIES IN ANY JURISDICTION WHERE THE OFFER OR SALE IS NOT PERMITTED.
146 of 158
| Structural and Collateral Term Sheet | Benchmark 2022-B32 | |
| The Kirby Collection | ||
| Tenant Summary(1) | |||||||
| Tenant | Type | Ratings Moody’s/Fitch/S&P(2) | Net Rentable Area (SF) | % of Total NRA | Base Rent PSF(3) | % of Total Base Rent | Lease Expiration Date |
| PROS, Inc.(4) | Office | NR / NR / NR | 117,555 | 48.3% | $29.50 | 44.8% | 7/31/2033 |
| Pinstripes Texas, Inc. | Retail | NR / NR / NR | 33,830 | 13.9 | 36.95 | 16.1 | 10/31/2036 |
| Hancock Whitney Bank(5) | Office | Baa3 / NR / BBB | 29,465 | 12.1 | 31.00 | 11.8 | 8/31/2033 |
| 1Life Healthcare, Inc. | Retail | NR / NR / NR | 5,715 | 2.3 | 56.00 | 4.1 | 12/31/2031 |
| Novum Energy Trading, Inc. | Office | NR / NR / NR | 8,959 | 3.7 | 32.50 | 3.8 | 2/28/2025 |
| TXAT LLC(6) | Office | NR / NR / NR | 8,627 | 3.5 | 30.00 | 3.3 | 12/31/2029 |
| Se7en | Retail | NR / NR / NR | 5,141 | 2.1 | 38.00 | 2.5 | 10/31/2036 |
| S1K HTX-1, LP | Retail | NR / NR / NR | 2,998 | 1.2 | 60.00 | 2.3 | 8/31/2036 |
| Innovative Strategies | Office | NR / NR / NR | 5,984 | 2.5 | 30.00 | 2.3 | 2/28/2026 |
| LUKOIL Pan Americas, LLC | Office | Baa2 / NR /BBB | 5,862 | 2.4 | 30.50 | 2.3 | 3/31/2026 |
| Total Major Office and Retail | 224,136 | 92.0% | $32.28 | 93.4% | |||
| Other Occupied Office | 6,233 | 2.6 | 21.85 | 1.8 | |||
| Other Occupied Retail | 6,449 | 2.6 | 57.87 | 4.8 | |||
| Total Occupied Office and Retail | 236,818 | 97.2% | $32.70 | 100.0% | |||
| Vacant | 6,748 | 2.8 | |||||
| Total / Wtd. Avg. | 243,566 | 100.0% | |||||
| (1) | Based on the underwritten rent roll dated December 7, 2021. |
| (2) | In certain instances, ratings provided are those of the parent company of the entity shown, whether or not the parent company guarantees the lease. |
| (3) | Base Rent includes contractual rent steps through December 2022 and the average rent over the lease term for investment grade tenants. |
| (4) | PROS, Inc. has the option to terminate its lease on October 31, 2026 upon 9 months’ notice and payment of a termination fee. |
| (5) | Hancock Whitney Bank has the option to terminate its lease on August 31, 2028 upon 12 months’ notice and payment of a termination fee. |
| (6) | TXAT LLC has the option to terminate its lease in October 2026 upon 12 months’ notice and payment of a termination fee. |
| Lease Rollover Schedule(1) | |||||||||
| Year | Number of Leases Expiring | Net Rentable Area Expiring | % of NRA Expiring | Base Rent Expiring(2) | % of Base Rent Expiring(2) | Cumulative Net Rentable Area Expiring | Cumulative % of NRA Expiring | Cumulative Base Rent Expiring(2) | Cumulative % of Base Rent Expiring(2) |
| Vacant | NAP | 6,748 | 2.8% | NAP | NAP | 6,748 | 2.8% | NAP | NAP |
| MTM(3) | 0 | 2,306 | 0.9 | $0 | 0.0% | 9,054 | 3.7% | $0 | 0.0% |
| 2022 | 0 | 0 | 0.0 | 0 | 0.0 | 9,054 | 3.7% | $0 | 0.0% |
| 2023 | 2 | 0 | 0.0 | 13,482 | 0.2 | 9,054 | 3.7% | $13,482 | 0.2% |
| 2024 | 0 | 0 | 0.0 | 0 | 0.0 | 9,054 | 3.7% | $13,482 | 0.2% |
| 2025 | 1 | 8,959 | 3.7 | 291,168 | 3.8 | 18,013 | 7.4% | $304,650 | 3.9% |
| 2026 | 2 | 11,846 | 4.9 | 358,311 | 4.6 | 29,859 | 12.3% | $662,961 | 8.6% |
| 2027 | 0 | 0 | 0.0 | 0 | 0.0 | 29,859 | 12.3% | $662,961 | 8.6% |
| 2028 | 0 | 0 | 0.0 | 0 | 0.0 | 29,859 | 12.3% | $662,961 | 8.6% |
| 2029 | 2 | 12,554 | 5.2 | 381,529 | 4.9 | 42,413 | 17.4% | $1,044,489 | 13.5% |
| 2030 | 0 | 0 | 0.0 | 0 | 0.0 | 42,413 | 17.4% | $1,044,489 | 13.5% |
| 2031 & Thereafter | 9 | 201,153 | 82.6 | 6,699,748 | 86.5 | 243,566 | 100.0% | $7,744,237 | 100.0% |
| Total | 16 | 243,566 | 100.0% | $7,744,237 | 100.0% | ||||
| (1) | Based on the underwritten rent roll dated December 7, 2021. |
| (2) | Base Rent includes contractual rent steps through December 2022 and the average rent over the lease term for investment grade tenants. |
| (3) | MTM includes fitness center (2,306 SF). |
THE INFORMATION IN THIS STRUCTURAL AND COLLATERAL TERM SHEET IS NOT COMPLETE AND MAY BE AMENDED PRIOR TO THE TIME OF SALE. THIS TERM SHEET IS NOT AN OFFER TO SELL THESE SECURITIES AND IT IS NOT A SOLICITATION OF AN OFFER TO BUY THESE SECURITIES IN ANY JURISDICTION WHERE THE OFFER OR SALE IS NOT PERMITTED.
147 of 158
| Structural and Collateral Term Sheet | Benchmark 2022-B32 | |
| The Kirby Collection | ||
| Operating History and Underwritten Net Cash Flow(1) | ||||
| TTM 9/30/2021 | Underwritten | PSF | %(2) | |
| Apartment Income | ||||
| In-Place Base Rent | $10,704,291 | $9,551,064 | $17.87 | 45.8% |
| Potential Income from Vacant Units | 0 | 1,300,046 | 2.43 | 6.2 |
| Gross Potential Income - Apts. | $10,704,291 | $10,851,110 | $20.31 | 52.0% |
| (Vacancy/Credit Loss/Concessions) | (2,481,462) | (2,053,240) | (3.84) | (9.8) |
| EGI Before Other Income | $8,222,829 | $8,797,870 | $16.46 | 42.2% |
| Other Income - Apartments | 474,349 | 551,363 | 1.03 | 2.6 |
| Effective Gross Income - Apts. | $8,697,178 | $9,349,233 | $17.50 | 44.8% |
| Commercial Income | ||||
| Commercial Rental Income | $8,837,013 | $12,059,759 | $22.57 | 57.8% |
| Potential Income from Vacant Space | 0 | 480,042 | 0.90 | 2.3 |
| Other Commercial Income | 229,358 | 229,358 | 0.43 | 1.1 |
| Gross Potential Income - Commercial | $9,066,371 | $12,769,159 | $23.90 | 61.2% |
| (Vacancy/Credit Loss) | 0 | (1,253,980) | (2.35) | (6.0) |
| Effective Gross Income - Commercial | $9,066,371 | $11,515,179 | $21.55 | 55.2% |
| Total Effective Gross Income | $17,763,549 | $20,864,412 | $39.05 | 100.0% |
| Real Estate Taxes | $3,261,315 | $4,148,805 | $7.76 | 19.9% |
| Insurance | 376,442 | 426,042 | 0.80 | 2.0 |
| Management Fee | 532,906 | 625,932 | 1.17 | 3.0 |
| Other Operating Expenses | 4,182,633 | 4,182,633 | 7.83 | 20.0 |
| Total Operating Expenses | $8,353,296 | $9,383,412 | $17.56 | 45.0% |
| Net Operating Income | $9,410,252 | $11,481,000 | $21.49 | 55.0% |
| Capital Expenditures | 0 | 98,463 | 0.18 | 0.5 |
| TI/LC | 0 | 365,197 | 0.68 | 1.8 |
| Net Cash Flow | $9,410,252 | $11,017,340 | $20.62 | 52.8% |
| (1) | Based on the underwritten rent rolls dated October 26, 2021 and December 7, 2021. |
| (2) | % column represents percent of Total Effective Gross Income. |
Property Management. The Kirby Collection Property is managed by Trinity Property Consultants, LLC an affiliate of the loan sponsor.
THE INFORMATION IN THIS STRUCTURAL AND COLLATERAL TERM SHEET IS NOT COMPLETE AND MAY BE AMENDED PRIOR TO THE TIME OF SALE. THIS TERM SHEET IS NOT AN OFFER TO SELL THESE SECURITIES AND IT IS NOT A SOLICITATION OF AN OFFER TO BUY THESE SECURITIES IN ANY JURISDICTION WHERE THE OFFER OR SALE IS NOT PERMITTED.
148 of 158
(THIS PAGE INTENTIONALLY LEFT BLANK)
THE INFORMATION IN THIS STRUCTURAL AND COLLATERAL TERM SHEET IS NOT COMPLETE AND MAY BE AMENDED PRIOR TO THE TIME OF SALE. THIS TERM SHEET IS NOT AN OFFER TO SELL THESE SECURITIES AND IT IS NOT A SOLICITATION OF AN OFFER TO BUY THESE SECURITIES IN ANY JURISDICTION WHERE THE OFFER OR SALE IS NOT PERMITTED.
149 of 158
| Structural and Collateral Term Sheet | Benchmark 2022-B32 | |
| Leesburg Plaza | ||
| Mortgage Loan Information | Property Information | |||
| Mortgage Loan Seller: | CREFI | Single Asset / Portfolio: | Single Asset | |
| Original Principal Balance: | $48,490,000 | Title: | Fee | |
| Cut-off Date Principal Balance: | $48,490,000 | Property Type - Subtype: | Retail - Anchored | |
| % of Pool by IPB: | 2.7% | Net Rentable Area (SF): | 233,281 | |
| Loan Purpose: | Acquisition | Location: | Leesburg, VA | |
| Borrower: | Leesburg Plaza, LLC | Year Built / Renovated: | 1967 / 2005 | |
| Guarantor: | Abdolhossein Ejtemai | Occupancy: | 94.7% | |
| Interest Rate: | 3.17000% | Occupancy Date: | 11/23/2021 | |
| Note Date: | 12/17/2021 | Number of Tenants: | 34 | |
| Maturity Date: | 1/6/2032 | Fourth Most Recent NOI: | $4,614,691 (December 31, 2018) | |
| Interest-only Period: | 120 months | Third Most Recent NOI: | $4,599,377 (December 31, 2019) | |
| Original Term: | 120 months | Second Most Recent NOI: | $3,815,992 (December 31, 2020) | |
| Original Amortization: | None | Most Recent NOI(1): | $4,083,821 (T-9 Ann September 30, 2021) | |
| Amortization Type: | Interest Only | UW Economic Occupancy: | 93.1% | |
| Call Protection: | L(25),D(91),O(4) | UW Revenues: | $6,066,366 | |
| Lockbox / Cash Management: | Springing / Springing | UW Expenses: | $1,154,127 | |
| Additional Debt: | N/A | UW NOI(3): | $4,912,239 | |
| Additional Debt Balance: | N/A | UW NCF: | $4,749,081 | |
| Additional Debt Type: | N/A | Appraised Value / Per SF: | $73,600,000 / $315 | |
| Appraisal Date: | 10/26/2021 | |||
| Escrows and Reserves | Financial Information | ||||||
| Initial | Monthly | Initial Cap | Cut-off Date Loan / SF: | $208 | |||
| Taxes: | $85,072 | $28,357 | N/A | Maturity Date Loan / SF: | $208 | ||
| Insurance: | $21,728 | $10,864 | N/A | Cut-off Date LTV: | 65.9% | ||
| Replacement Reserves: | $625,000 | $0 | N/A | Maturity Date LTV: | 65.9% | ||
| TI/LC: | $881,900 | Springing | $881,900 | UW NCF DSCR: | 3.05x | ||
| Other(3): | $2,978,884 | $0 | N/A | UW NOI Debt Yield: | 10.1% | ||
| Sources and Uses | ||||||
| Sources | Proceeds | % of | Uses | Proceeds | % of Total | |
| Loan Amount | $48,490,000 | 62.2% | Purchase Price | $72,500,000 | 92.9% | |
| Principal’s New Cash Contribution | 26,676,842 | 34.2 | Upfront Reserves | 4,592,584 | 5.9 | |
| Other Sources | 2,853,884 | 3.7 | Closing Costs | 928,142 | 1.2 | |
| Total Sources | $78,020,726 | 100.0% | Total Uses | $78,020,726 | 100.0% | |
| (1) | Most Recent NOI reflects trailing nine months annualized as of September 30, 2021. |
| (2) | The Other Initial reserve consists of unfunded obligations ($2,853,884) and deferred maintenance ($125,000). The unfunded obligations reserves are held by a third party title company pursuant to certain post-closing escrow agreements which have been collaterally assigned to the lender. |
| (3) | The increase in UW NOI from Most Recent NOI is primarily driven by contractual rent steps and potential income from vacant space. |
The Loan. The Leesburg Plaza loan (the “Leesburg Plaza Loan”) is secured by a first mortgage lien on the borrower’s fee interest in a 233,281 square foot retail property located in Leesburg, Virginia (the “Leesburg Plaza Property”). The Leesburg Plaza Loan accrues interest at an interest rate of 3.17000% per annum, had an original term of 120 months, has a remaining term of 119 months as of the Cut-off Date and is interest only for the entire term. The scheduled maturity date of The Leesburg Plaza Loan is the due date in January 2032.
The Borrower. The borrowing entity for the Leesburg Plaza Loan is Leesburg Plaza, LLC, a Delaware limited liability company.
The Loan Sponsor. The loan sponsor and non-recourse carveout guarantor is Abdolhossein Ejtemai.
The Property. The Leesburg Plaza Property consists of a 233,281 square foot anchored retail center located in Leesburg, Virginia. Renovated in 2005, the Leesburg Plaza Property is situated on approximately 25.95 acres. The Leesburg Plaza Property has 1,166 surface parking spaces, resulting in a parking ratio of 5.0 per 1,000 square feet of net rentable area. As of November 23, 2021, the Leesburg Plaza Property was 94.7% leased to 34 tenants.
THE INFORMATION IN THIS STRUCTURAL AND COLLATERAL TERM SHEET IS NOT COMPLETE AND MAY BE AMENDED PRIOR TO THE TIME OF SALE. THIS TERM SHEET IS NOT AN OFFER TO SELL THESE SECURITIES AND IT IS NOT A SOLICITATION OF AN OFFER TO BUY THESE SECURITIES IN ANY JURISDICTION WHERE THE OFFER OR SALE IS NOT PERMITTED.
150 of 158
| Structural and Collateral Term Sheet | Benchmark 2022-B32 | |
| Leesburg Plaza | ||
The Leesburg Plaza Property is anchored by Giant Food (55,330 square feet, 23.7% of NRA, 15.2% of underwritten base rent), the largest tenant at the Leesburg Plaza Property. Giant Food has been at the Leesburg Plaza Property since 1987 and recently executed a 20-year lease extension with three, five-year renewal options. The second largest tenant based on net rentable area at the Leesburg Plaza Property is PetSmart (23,239 square feet, 10.0% of NRA, 9.8% of underwritten base rent). PetSmart has a lease expiration date of January 31, 2026 with no renewal options. The third largest tenant based on net rentable area at the Leesburg Plaza Property is Planet Fitness (17,321 square feet, 7.4% of NRA, 6.0% of underwritten base rent). Planet Fitness has a lease expiration date of May 31, 2031 with two, five-year renewal options.
COVID-19 Update. As of January 6, 2022 the Leesburg Plaza Property was open and operating. As of January 6, 2022, there have been no loan modification requests on the Leesburg Plaza Loan. Only one tenant, Hair Cuttery 0.7% of NRA and 1.4% of UW Base Rent is subject to repayment plan for approximately $3,900 through December 1, 2022 (a $325 monthly payment). The first payment date of the Leesburg Plaza Loan is the monthly due date in February 2022. See “Risk Factors—Special Risks—The Coronavirus Pandemic Has Adversely Affected the Global Economy and Will Likely Adversely Affect the Performance of the Mortgage Loans” in the Preliminary Prospectus.
The Market. The Leesburg Plaza Property is located in the Leesburg/West Loudoun County submarket of the Washington, DC metropolitan statistical area market. The Leesburg Plaza Property is situated along the north side of East Market Street between Plaza Street and Catoctin Circle Northeast, with access to major thoroughfares including Market Street (VA Route 7) and Plaza Street. Additionally, the Route 7 interchange with the Leesburg Bypass (US Route 15) is located less than a half mile southeast of the Leesburg Plaza Property.
According to the appraisal, occupancy rates have improved in the overall Washington, DC metropolitan statistical area retail market over the past six months, while rental rates have continued to increase over the past year in the overall market area and in the submarket. As of the third quarter of 2021, the Leesburg/West Loudoun County submarket had a total inventory of 7,231,099 square feet of retail space with a vacancy of 8.9% and an average asking rent of $33.56 per square foot. The 2021 estimated average household income within a one-, three- and five-mile radius of the Leesburg Plaza Property was approximately $111,381, $165,716, and $182,684, respectively; and within the same radii, the 2021 estimated population was 17,783, 59,692, and 91,782, respectively.
Tenant Summary(1) | ||||||
| Tenant | Ratings Moody’s/S&P/Fitch(2) | Net Rentable Area (SF) | % of Total NRA | Base Rent PSF(3) | % of Total Base Rent(3) | Lease Expiration Date |
| Giant Food(4) | Baa1 / BBB / NR | 55,330 | 23.7% | $14.29 | 15.2% | 12/31/2041 |
| PetSmart | B1 / B / NR | 23,239 | 10.0 | 21.96 | 9.8 | 1/31/2026 |
| Planet Fitness(5) | NR / NR / NR | 17,321 | 7.4 | 18.00 | 6.0 | 5/31/2031 |
| Office Depot(6) | NR / NR / NR | 16,100 | 6.9 | 12.00 | 3.7 | 12/31/2022 |
| Party City(7) | NR / NR / NR | 12,000 | 5.1 | 14.50 | 3.4 | 12/31/2026 |
| The Loudoun Kitchen & Bar | NR / NR / NR | 11,900 | 5.1 | 15.44 | 3.5 | 3/31/2026 |
| Advance Auto Parts | Baa2 / BBB- / NR | 8,828 | 3.8 | 27.33 | 4.6 | 8/31/2027 |
| Books-A-Million(8) | NR / NR / NR | 6,111 | 2.6 | 18.54 | 2.2 | 6/30/2024 |
| Blue Ridge Hospice Thrift Shop | NR / NR / NR | 5,573 | 2.4 | 22.28 | 2.4 | 7/31/2025 |
| Spanky’s Shenanigans | NR / NR / NR | 4,800 | 2.1 | 48.38 | 4.5 | 12/31/2027 |
| Subtotal / Weighted Average | 161,202 | 69.1% | $17.83 | 55.4% | ||
| Remaining Tenants | 59,622 | 25.6 | 38.85 | 44.6 | ||
| Vacant | 12,457 | 5.3 | ||||
| Total / Weighted Average | 233,281 | 100.0% | $23.51 | 100.0% | ||
| (1) | Based on the underwritten rent roll as of November 23, 2021. |
| (2) | In certain instances, ratings provided are those of the parent company of the entity shown, whether or not the parent company guarantees the lease. |
| (3) | Base Rent includes rent escalations for the average annual rent over the base terms for investment grade tenants. |
| (4) | Giant Food has three, five-year lease renewal options. |
| (5) | Planet Fitness has two, five-year lease renewal options. |
| (6) | Office Depot has one, one-year lease renewal option and one, five-year lease renewal option. |
| (7) | Party City has one, five-year lease renewal option. |
| (8) | Books-A-Million has one, five-year lease renewal option. |
THE INFORMATION IN THIS STRUCTURAL AND COLLATERAL TERM SHEET IS NOT COMPLETE AND MAY BE AMENDED PRIOR TO THE TIME OF SALE. THIS TERM SHEET IS NOT AN OFFER TO SELL THESE SECURITIES AND IT IS NOT A SOLICITATION OF AN OFFER TO BUY THESE SECURITIES IN ANY JURISDICTION WHERE THE OFFER OR SALE IS NOT PERMITTED.
151 of 158
| Structural and Collateral Term Sheet | Benchmark 2022-B32 | |
| Leesburg Plaza | ||
| Lease Rollover Schedule(1) | ||||||||||
| Year | Number of Leases Expiring | Net Rentable Area Expiring | % of NRA Expiring | Base Rent Expiring(2) | % of Base Rent Expiring(2) | Cumulative Net Rentable Area Expiring | Cumulative % of NRA Expiring | Cumulative Base Rent Expiring(2) | Cumulative % of Base Rent Expiring(2) | |
| Vacant | NAP | 12,457 | 5.3% | NAP | NAP | 12,457 | 5.3% | NAP | NAP | |
| MTM & 2022 | 4 | 22,679 | 9.7 | $325,218 | 6.3% | 35,136 | 15.1% | $325,218 | 6.3% | |
| 2023 | 1 | 1,600 | 0.7 | 52,128 | 1.0 | 36,736 | 15.7% | $377,346 | 7.3% | |
| 2024 | 1 | 6,111 | 2.6 | 113,298 | 2.2 | 42,847 | 18.4% | $490,644 | 9.5% | |
| 2025 | 6 | 19,033 | 8.2 | 612,137 | 11.8 | 61,880 | 26.5% | $1,102,781 | 21.2% | |
| 2026 | 8 | 60,240 | 25.8 | 1,299,092 | 25.0 | 122,120 | 52.3% | $2,401,873 | 46.3% | |
| 2027 | 7 | 26,425 | 11.3 | 1,203,710 | 23.2 | 148,545 | 63.7% | $3,605,583 | 69.5% | |
| 2028 | 2 | 3,819 | 1.6 | 137,890 | 2.7 | 152,364 | 65.3% | $3,743,473 | 72.1% | |
| 2029 | 0 | 0 | 0.0 | 0 | 0.0 | 152,364 | 65.3% | $3,743,473 | 72.1% | |
| 2030 | 0 | 0 | 0.0 | 0 | 0.0 | 152,364 | 65.3% | $3,743,473 | 72.1% | |
| 2031 | 2 | 20,413 | 8.8 | 385,986 | 7.4 | 172,777 | 74.1% | $4,129,459 | 79.6% | |
| 2032 & Thereafter | 3 | 60,504 | 25.9 | 1,061,479 | 20.4 | 233,281 | 100.0% | $5,190,938 | 100.0% | |
| Total | 34 | 233,281 | 100.0% | $5,190,938 | 100.0% | |||||
| (1) | Based on the underwritten rent roll as of November 23, 2021. |
| (2) | Base Rent includes rent escalations for the average annual rent over the base term for investment grade tenants. |
| Underwritten Net Cash Flow(1) | |||||||
| 2018 | 2019 | 2020 | T-9 Annualized 9/30/2021 | Underwritten | $ Per Square Foot | %(2) | |
| Rents in Place | $5,052,192 | $4,963,980 | $4,160,662 | $4,173,986 | $4,913,215 | $21.06 | 76.4% |
| Rent Steps(3) | 0 | 0 | 0 | 0 | 277,723 | 1.19 | 4.3 |
| Potential Income from Vacant Space | 0 | 0 | 0 | 0 | 446,356 | 1.91 | 6.9 |
| Gross Potential Rent | $5,052,192 | $4,963,980 | $4,160,662 | $4,173,986 | $5,637,293 | $24.17 | 87.7% |
| Total Reimbursements | 1,063,958 | 1,093,635 | 902,397 | 730,618 | 789,964 | 3.39 | 12.3 |
| Net Rental Income | $6,116,150 | $6,057,615 | $5,063,060 | $4,904,604 | $6,427,257 | $27.55 | 100.0% |
| (Vacancy/Credit Loss) | (162,747) | 0 | 0 | 0 | (446,356) | (1.91) | (6.9) |
| Other Income | 62,427 | 96,317 | 53,034 | 71,955 | 71,955 | 0.31 | 1.1 |
| Percentage Rent | 13,185 | 9,033 | 0 | 84,683 | 13,509 | 0.06 | 0.2 |
| Effective Gross Income | $6,029,015 | $6,162,966 | $5,116,094 | $5,061,243 | $6,066,366 | $26.00 | 94.4% |
| Real Estate Taxes | 768,926 | 740,647 | 671,786 | 261,750 | 340,288 | 1.46 | 5.6 |
| Insurance | 39,608 | 42,525 | 49,470 | 61,681 | 124,161 | 0.53 | 2.0 |
| Management Fee | 197,040 | 198,501 | 176,218 | 149,217 | 212,323 | 0.91 | 3.5 |
| Other Operating Expenses | 408,750 | 581,916 | 402,629 | 504,774 | 477,355 | 2.05 | 7.9 |
| Total Expenses | $1,414,324 | $1,563,589 | $1,300,102 | $977,421 | $1,154,127 | $4.95 | 19.0% |
| Net Operating Income | $4,614,691 | $4,599,377 | $3,815,992 | $4,083,821 | $4,912,239 | $21.06 | 81.0% |
| TI/LC | 0 | 0 | 0 | 0 | 125,519 | 0.54 | 2.1 |
| Capital Expenditures | 0 | 0 | 0 | 0 | 37,639 | 0.16 | 0.6 |
| Net Cash Flow | $4,614,691 | $4,599,377 | $3,815,992 | $4,083,821 | $4,749,081 | $20.36 | 78.3% |
| (1) | Based on the underwritten rent roll dated November 23, 2021. |
| (2) | % column represents percent of Net Rental Income for all revenue lines and represents percent of Effective Gross Income the remainder of the fields. |
| (3) | Rent Steps represent increases for the average annual rent over the base term terms for investment grade tenants. |
Property Management. The Leesburg Plaza Property is managed by Rappaport Management Company.
THE INFORMATION IN THIS STRUCTURAL AND COLLATERAL TERM SHEET IS NOT COMPLETE AND MAY BE AMENDED PRIOR TO THE TIME OF SALE. THIS TERM SHEET IS NOT AN OFFER TO SELL THESE SECURITIES AND IT IS NOT A SOLICITATION OF AN OFFER TO BUY THESE SECURITIES IN ANY JURISDICTION WHERE THE OFFER OR SALE IS NOT PERMITTED.
152 of 158
(THIS PAGE INTENTIONALLY LEFT BLANK)
THE INFORMATION IN THIS STRUCTURAL AND COLLATERAL TERM SHEET IS NOT COMPLETE AND MAY BE AMENDED PRIOR TO THE TIME OF SALE. THIS TERM SHEET IS NOT AN OFFER TO SELL THESE SECURITIES AND IT IS NOT A SOLICITATION OF AN OFFER TO BUY THESE SECURITIES IN ANY JURISDICTION WHERE THE OFFER OR SALE IS NOT PERMITTED.
153 of 158
| Structural and Collateral Term Sheet | Benchmark 2022-B32 | |
| ADS Corporate Headquarters | ||
| Mortgage Loan Information | Property Information | |||
| Mortgage Loan Seller: | CREFI | Single Asset / Portfolio: | Single Asset | |
| Original Principal Balance: | $47,400,000 | Title: | Fee | |
| Cut-off Date Principal Balance: | $47,400,000 | Property Type - Subtype: | Office - Suburban | |
| % of Pool by IPB: | 2.7% | Net Rentable Area (SF): | 326,354 | |
| Loan Purpose: | Refinance | Location: | Columbus, OH | |
| Borrower: | Easton Ally Property LLC | Year Built / Renovated: | 2016 / 2021 | |
| Guarantor: | USRA Net Lease II Capital Corp. | Occupancy: | 100.0% | |
| Interest Rate: | 3.83000% | Occupancy Date: | 2/6/2022 | |
| Note Date: | 12/14/2021 | Number of Tenants: | 1 | |
| Maturity Date: | 1/6/2032 | Fourth Most Recent NOI: | $4,279,055 (December 31, 2018) | |
| Interest-only Period: | 60 months | Third Most Recent NOI: | $4,324,841 (December 31, 2019) | |
| Original Term: | 120 months | Second Most Recent NOI: | $4,371,118 (December 31, 2020) | |
| Original Amortization: | 360 months | Most Recent NOI(1): | $4,407,421 (T-9 Ann September 30, 2021) | |
| Amortization Type: | Interest Only, Amortizing Balloon | UW Economic Occupancy: | 95.0% | |
| Call Protection: | L(25),D(88),O(7) | UW Revenues: | $4,486,923 | |
| Lockbox / Cash Management: | Hard / Springing | UW Expenses: | $231,452 | |
| Additional Debt: | N/A | UW NOI: | $4,255,471 | |
| Additional Debt Balance: | N/A | UW NCF: | $4,025,012 | |
| Additional Debt Type: | N/A | Appraised Value / Per SF: | $71,250,000 / $218 | |
| Appraisal Date: | 10/23/2021 | |||
| Escrows and Reserves | Financial Information | ||||||
| Initial | Monthly | Initial Cap | Cut-off Date Loan / SF: | $145 | |||
| Taxes: | $0 | Springing | N/A | Maturity Date Loan / SF: | $131 | ||
| Insurance: | $0 | Springing | N/A | Cut-off Date LTV: | 66.5% | ||
| Replacement Reserves: | $0 | Springing | N/A | Maturity Date LTV: | 60.2% | ||
| TI/LC: | $0 | Springing | N/A | UW NCF DSCR: | 1.51x | ||
| UW NOI Debt Yield: | 9.0% | ||||||
| Sources and Uses | ||||||
| Sources | Proceeds | % of Total | Uses | Proceeds | % of Total | |
| Loan Amount | $47,400,000 | 100.0% | Loan Payoff | $46,550,000 | 98.2% | |
| Closing Costs | 850,000 | 1.8 | ||||
| Total Sources | $47,400,000 | 100.0% | Total Uses | $47,400,000 | 100.0% | |
| (1) | Most Recent NOI reflects trailing nine months annualized as of September 30, 2021. |
The Loan. The ADS Corporate Headquarters loan (the “ADS Corporate Headquarters Loan”) is secured by a first mortgage lien on the borrower’s fee interest in a 326,354 square foot office building located in Columbus, Ohio (the “ADS Corporate Headquarters Property”). The ADS Corporate Headquarters Loan accrues interest at an interest rate of 3.83000% per annum, had an original term of 120 months, and has a remaining term of 119 months as of the Cut-off Date. The ADS Corporate Headquarters Loan requires monthly payments of interest only for the first 60 months of the loan and will amortize on a 30-year amortization schedule thereafter. The scheduled maturity date of The ADS Corporate Headquarters Loan is the due date in January 2032.
The Borrower. The borrowing entity for the ADS Corporate Headquarters Loan is Easton Ally Property LLC, a Delaware limited liability company.
The Property. The ADS Corporate Headquarters Property consists of one three-story office building and one four-story office building containing a total of 326,354 square feet located in Columbus, Ohio. The ADS Corporate Headquarters Property was built in 2016 and renovated in 2021 and is situated on approximately 24.4 acres. The ADS Corporate Headquarters Property has 1,612 surface parking spaces, resulting in a parking ratio of 4.94 per 1,000 square feet of net rentable area. As of February 6, 2022, the ADS Corporate Headquarters Property was 100.0% leased to one tenant, Alliance Data Systems (NYSE: ADS, - dba Comenity Servicing LLC) until September 2032.
THE INFORMATION IN THIS STRUCTURAL AND COLLATERAL TERM SHEET IS NOT COMPLETE AND MAY BE AMENDED PRIOR TO THE TIME OF SALE. THIS TERM SHEET IS NOT AN OFFER TO SELL THESE SECURITIES AND IT IS NOT A SOLICITATION OF AN OFFER TO BUY THESE SECURITIES IN ANY JURISDICTION WHERE THE OFFER OR SALE IS NOT PERMITTED.
154 of 158
| Structural and Collateral Term Sheet | Benchmark 2022-B32 | |
| ADS Corporate Headquarters | ||
The sole tenant at the ADS Corporate Headquarters Property, Comenity Servicing LLC, occupies 326,354 square feet (100.0% of net rentable area) and has a lease expiration date in September 2032. Alliance Data Systems (dba Comenity Servicing LLC) is a leading provider of data-driven marketing, loyalty and payment solutions serving large, consumer-based industries. Clients includes major retailers like Signet, IKEA, and Victoria’s Secret, as well as banks and brands in other large, consumer-based industries. The company also develops and operates customer loyalty programs such as its Canadian-focused AIR MILES program, and Netherlands-based BrandLoyalty, a provider of tailor-made loyalty programs for grocers. Dependent on domestic business, more than 80% of Alliance Data’s revenue comes from the United States.
COVID-19 Update. As of January 6, 2022, the ADS Corporate Headquarters Property was open and operating. As of January 6, 2022, there have been no loan modification or forbearance requests on the ADS Corporate Headquarters Loan. The first payment date of the ADS Corporate Headquarters Loan is the monthly due date in February 2022. See “Risk Factors—Special Risks—The Coronavirus Pandemic Has Adversely Affected the Global Economy and Will Likely Adversely Affect the Performance of the Mortgage Loans” in the Preliminary Prospectus.
The Market. The ADS Corporate Headquarters Property is located on the northeast side of Columbus in an area commonly referred to as Easton. The name comes from the neighborhood anchor, Easton Town Center, one of the nation’s first outdoor lifestyle centers, which is located less than one mile north of the ADS Corporate Headquarters Property. Easton Town Center is home to nearly 300 retailers and 8.3 million square feet of mixed-use development. The boundaries of the immediate area are Interstate 270, to the east, Morse Road to the north, Sunbury Road to the west and McCutcheon Road to the south. Other local landmarks include The Ohio State University six miles to the southwest and John Glenn Columbus International Airport five miles to the southeast. The Columbus Central Business District is approximately seven miles southwest of the ADS Corporate Headquarters Property.
Primary access to the ADS Corporate Headquarters Property is provided via several curb-cuts along Easton Square Place. Easton Square Place provides access to Easton Way, which provides a direct interchange with Interstate 270 1.6 miles north of the subject. Interstate 270 serves as the Columbus outer belt connecting, most notably, with Interstate 70, which traverses east and west through Central Ohio, and Interstate 71, which traverses north and south through Central Ohio.
The ADS Corporate Headquarters Property is located in the North Central office submarket. According to the appraisal, as of the second quarter of 2021, the submarket had a total inventory of 2,455,000 square feet, with no additional completions within the quarter. Vacancy rates within the submarket as of the second quarter of 2021 were 11.9%, compared to 12.3% in 2020, 11.8% in 2019, and 11.2% in 2018. Rental rates within the submarket as of the second quarter of 2021 were $19.31 per square foot, compared to $19.44 per square foot in 2020, $19.46 per square foot in 2019, and $18.99 per square foot in 2018. Additionally, within the same time period, the submarket saw a positive net absorption of 9,000 square feet.
Tenant Summary(1) | ||||||
| Tenant | Ratings Moody’s/S&P/Fitch(2) | Net Rentable Area (SF) | % of Total NRA | Base Rent PSF(3) | % of Total Base Rent(3) | Lease Expiration Date |
| Comenity Servicing LLC(4) | NR / NR / NR | 326,354 | 100.0% | $13.78 | 100.0% | 9/12/2032 |
| Subtotal / Weighted Average | 326,354 | 100.0% | $13.78 | 100.0% | ||
| Remaining Tenants | 0 | 0.0 | 0.00 | 0.0 | ||
| Vacant | 0 | 0.0 | ||||
| Total / Weighted Average | 326,354 | 100.0% | $13.78 | 100.0% | ||
| (1) | Based on the underwritten rent roll as of February 6, 2022. |
| (2) | In certain instances, ratings provided are those of the parent company of the entity shown, whether or not the parent company guarantees the lease. |
| (3) | Base Rent includes rent increases occurring through October 2022. |
| (4) | Comenity Servicing LLC has one, 10-year lease renewal option. |
THE INFORMATION IN THIS STRUCTURAL AND COLLATERAL TERM SHEET IS NOT COMPLETE AND MAY BE AMENDED PRIOR TO THE TIME OF SALE. THIS TERM SHEET IS NOT AN OFFER TO SELL THESE SECURITIES AND IT IS NOT A SOLICITATION OF AN OFFER TO BUY THESE SECURITIES IN ANY JURISDICTION WHERE THE OFFER OR SALE IS NOT PERMITTED.
155 of 158
| Structural and Collateral Term Sheet | Benchmark 2022-B32 | |
| ADS Corporate Headquarters | ||
| Lease Rollover Schedule(1) | |||||||||
| Year | Number of Leases Expiring | Net Rentable Area Expiring | % of NRA Expiring | Base Rent Expiring(2) | % of Base Rent Expiring(2) | Cumulative Net Rentable Area Expiring | Cumulative % of NRA Expiring | Cumulative Base Rent Expiring(2) | Cumulative % of Base Rent Expiring(2) |
| Vacant | NAP | 0 | 0.0% | NAP | NAP | 0 | 0.0% | NAP | NAP |
| MTM | 0 | 0 | 0.0 | $0 | 0.0% | 0 | 0.0% | $0 | 0.0% |
| 2022 | 0 | 0 | 0.0 | 0 | 0.0 | 0 | 0.0% | $0 | 0.0% |
| 2023 | 0 | 0 | 0.0 | 0 | 0.0 | 0 | 0.0% | $0 | 0.0% |
| 2024 | 0 | 0 | 0.0 | 0 | 0.0 | 0 | 0.0% | $0 | 0.0% |
| 2025 | 0 | 0 | 0.0 | 0 | 0.0 | 0 | 0.0% | $0 | 0.0% |
| 2026 | 0 | 0 | 0.0 | 0 | 0.0 | 0 | 0.0% | $0 | 0.0% |
| 2027 | 0 | 0 | 0.0 | 0 | 0.0 | 0 | 0.0% | $0 | 0.0% |
| 2028 | 0 | 0 | 0.0 | 0 | 0.0 | 0 | 0.0% | $0 | 0.0% |
| 2029 | 0 | 0 | 0.0 | 0 | 0.0 | 0 | 0.0% | $0 | 0.0% |
| 2030 | 0 | 0 | 0.0 | 0 | 0.0 | 0 | 0.0% | $0 | 0.0% |
| 2031 & Thereafter | 1 | 326,354 | 100.0 | 4,496,897 | 100.0 | 326,354 | 100.0% | $4,496,897 | 100.0% |
| Total | 1 | 326,354 | 100.0% | $4,496,897 | 100.0% | ||||
| (1) | Based on the underwritten rent roll as of February 6, 2022. |
| (2) | Rent Steps represent increases occurring through October 2022. |
| Underwritten Net Cash Flow(1) | |||||||
| 2018 | 2019 | 2020 | T-9 Annualized 9/30/2021 | Underwritten | $ Per Square Foot | %(2) | |
| Rents in Place | $4,279,055 | $4,324,841 | $4,371,118 | $4,407,421 | $4,449,290 | $13.63 | 94.2% |
| Rent Steps(3) | 0 | 0 | 0 | 0 | 47,607 | 0.15 | 1.0 |
| Gross Potential Rent | $4,279,055 | $4,324,841 | $4,371,118 | $4,407,421 | $4,496,897 | $13.78 | 95.2% |
| Total Reimbursements | 0 | 0 | 0 | 0 | 226,180 | 0.69 | 4.8 |
| Net Rental Income | $4,279,055 | $4,324,841 | $4,371,118 | $4,407,421 | $4,723,077 | $14.47 | 100.0% |
| (Vacancy/Credit Loss) | 0 | 0 | 0 | 0 | (236,154) | (0.72) | (5.0) |
| Effective Gross Income | $4,279,055 | $4,324,841 | $4,371,118 | $4,407,421 | $4,486,923 | $13.75 | 95.0% |
| Real Estate Taxes | 0 | 0 | 0 | 0 | 86,300 | 0.26 | 1.9 |
| Insurance | 0 | 0 | 0 | 0 | 5,272 | 0.02 | 0.1 |
| Management Fee | 0 | 0 | 0 | 0 | 134,608 | 0.41 | 3.0 |
| Other Operating Expenses | 0 | 0 | 0 | 0 | 5,272 | 0.02 | 0.1 |
| Total Expenses | $0 | $0 | $0 | $0 | $231,452 | $0.71 | 5.2% |
| Net Operating Income | $4,279,055 | $4,324,841 | $4,371,118 | $4,407,421 | $4,255,471 | $13.04 | 94.8% |
| TI/LC | 0 | 0 | 0 | 0 | 165,188 | 0.51 | 3.7 |
| Capital Expenditures | 0 | 0 | 0 | 0 | 65,271 | 0.20 | 1.5 |
| Net Cash Flow | $4,279,055 | $4,324,841 | $4,371,118 | $4,407,421 | $4,025,012 | $12.33 | 89.7% |
| (1) | Based on the underwritten rent roll dated February 6, 2022. |
| (2) | % column represents percent of Net Rental Income for all revenue lines and represents percent of Effective Gross Income the remainder of the fields. |
| (3) | Rent Steps represent increases occurring through October 2022. |
Property Management. The ADS Corporate Headquarters Property is self-managed by the borrower sponsor.
THE INFORMATION IN THIS STRUCTURAL AND COLLATERAL TERM SHEET IS NOT COMPLETE AND MAY BE AMENDED PRIOR TO THE TIME OF SALE. THIS TERM SHEET IS NOT AN OFFER TO SELL THESE SECURITIES AND IT IS NOT A SOLICITATION OF AN OFFER TO BUY THESE SECURITIES IN ANY JURISDICTION WHERE THE OFFER OR SALE IS NOT PERMITTED.
156 of 158
| Structural and Collateral Term Sheet | Benchmark 2022-B32 | |
| Contacts | ||
| J.P. Morgan CMBS Capital Markets & Banking | ||
| Contact | Phone Number | |
Kunal Singh Managing Director | kunal.k.singh@jpmorgan.com | (212) 834-5467 |
Brad Horn Executive Director | bradley.j.horn@jpmorgan.com | (212) 834-9708 |
| Harris Rendelstein Vice President | harris.rendelstein@jpmorgan.com | (212) 834-6737 |
| J.P. Morgan CMBS Trading | ||
| Contact | Phone Number | |
Avinash Sharma Managing Director | avinash.sharma@jpmorgan.com | (212) 834-3111 |
Derrick Fetzer Vice President | derrick.e.fetzer@jpmchase.com | (212) 834-3111 |
| J.P. Morgan Securitized Products Syndicate | ||
| Contact | Phone Number | |
Jennifer Kornblau Executive Director | jennifer.l.kornblau@jpmorgan.com | (212) 834-4154 |
Morgan Roach Vice President | morgan.c.roach@jpmchase.com | (212) 834-4154 |
| Deutsche Bank CMBS Capital Markets & Banking | ||
| Contact | Phone Number | |
Lainie Kaye Managing Director | lainie.kaye@db.com | (212) 250-5270 |
Cameron Cleveland Director | cameron.cleveland@db.com | (212) 250-9410 |
| Deutsche Bank CMBS Trading | ||
| Contact | Phone Number | |
Ryan Horvath Director | ryan.horvath@db.com | (212) 250-5149 |
| Deutsche Bank CMBS Structuring | ||
| Contact | Phone Number | |
Shaishav Agarwal Managing Director | shaishav.agarwal@db.com | (212) 250-6290 |
Dan Penn Director | daniel.penn@db.com | (212) 250-5149 |
| Citigroup CMBS Capital Markets & Securitization | ||
| Contact | Phone Number | |
Rick Simpson Managing Director | richard.simpson@citi.com | (212) 816-5343 |
Jason Mercandetti Director | jason.mercandetti@citi.com | (212) 816-6384 |
| Citigroup Structuring, Trading & Syndicate | ||
| Contact | Phone Number | |
Raul Orozco Managing Director | raul.d.orozco@citi.com | (212) 723-1295 |
Mattison Perry Director | mattison.perry@citi.com | (212) 723-1295 |
THE INFORMATION IN THIS STRUCTURAL AND COLLATERAL TERM SHEET IS NOT COMPLETE AND MAY BE AMENDED PRIOR TO THE TIME OF SALE. THIS TERM SHEET IS NOT AN OFFER TO SELL THESE SECURITIES AND IT IS NOT A SOLICITATION OF AN OFFER TO BUY THESE SECURITIES IN ANY JURISDICTION WHERE THE OFFER OR SALE IS NOT PERMITTED.
157 of 158
| Structural and Collateral Term Sheet | Benchmark 2022-B32 | |
| Contacts | ||
| Goldman Sachs & Co. LLC Banking | ||
Contact | Phone Number | |
Leah Nivison Managing Director | leah.nivison@gs.com | (212) 357-2702 |
Scott Epperson Managing Director | scott.epperson@gs.com | (212) 934-2882 |
Justin Peterson Vice President | justin.peterson@gs.com | (212) 902-4283 |
| Goldman Sachs & Co. LLC Capital Markets | ||
| Contact | Phone Number | |
Mark Romanczuk Managing Director | mark.romanczuk@gs.com | (212) 902-0290 |
Nitin Jagga Vice President | nitin.jagga@gs.com | (212) 855-9035 |
| Goldman Sachs & Co. LLC Syndicate | ||
| Contact | Phone Number | |
Scott Walter Managing Director | scott.walter@gs.com | (212) 357-8910 |
THE INFORMATION IN THIS STRUCTURAL AND COLLATERAL TERM SHEET IS NOT COMPLETE AND MAY BE AMENDED PRIOR TO THE TIME OF SALE. THIS TERM SHEET IS NOT AN OFFER TO SELL THESE SECURITIES AND IT IS NOT A SOLICITATION OF AN OFFER TO BUY THESE SECURITIES IN ANY JURISDICTION WHERE THE OFFER OR SALE IS NOT PERMITTED.
158 of 158