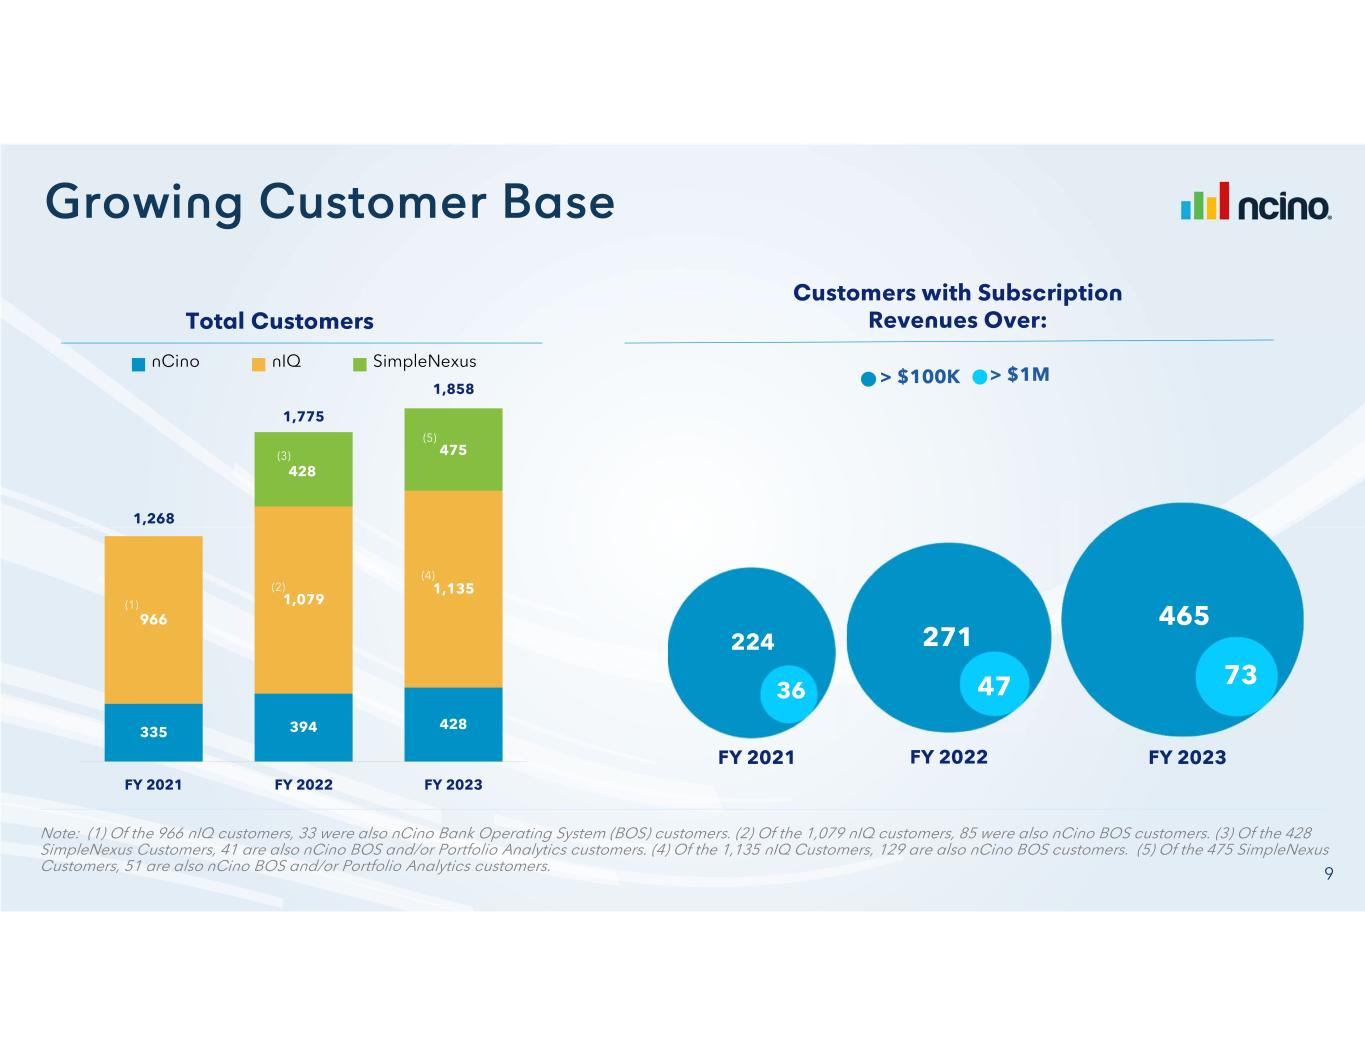
4Q FY23 Subscription Revenues (includes $16M from SimpleNexus) 4Q FY23 Total Revenues (includes $17M from SimpleNexus) Revenue: $109M Growth Rate: 46% FY2023 Total Revenues (includes $65M from SimpleNexus) Revenue: $408M Growth Rate: 49% FY2023 Subscription Revenues (includes $60M from SimpleNexus) Revenue: $93M Growth Rate: 48% Revenue: $345M Growth Rate: 53% 4Q FY23 Non-GAAP Operating Margin % FY2023 Non-GAAP Operating Margin % Margin %: 2% Margin %: (1%) 4Q FY23 Remaining Performance Obligations RPO: $944M FY2023 Subscription Revenue Retention Rate Retention Rate: 148% < 24 Mos RPO: $635M Organic: 125% Y/Y: +1300 bps Y/Y: +500 bps
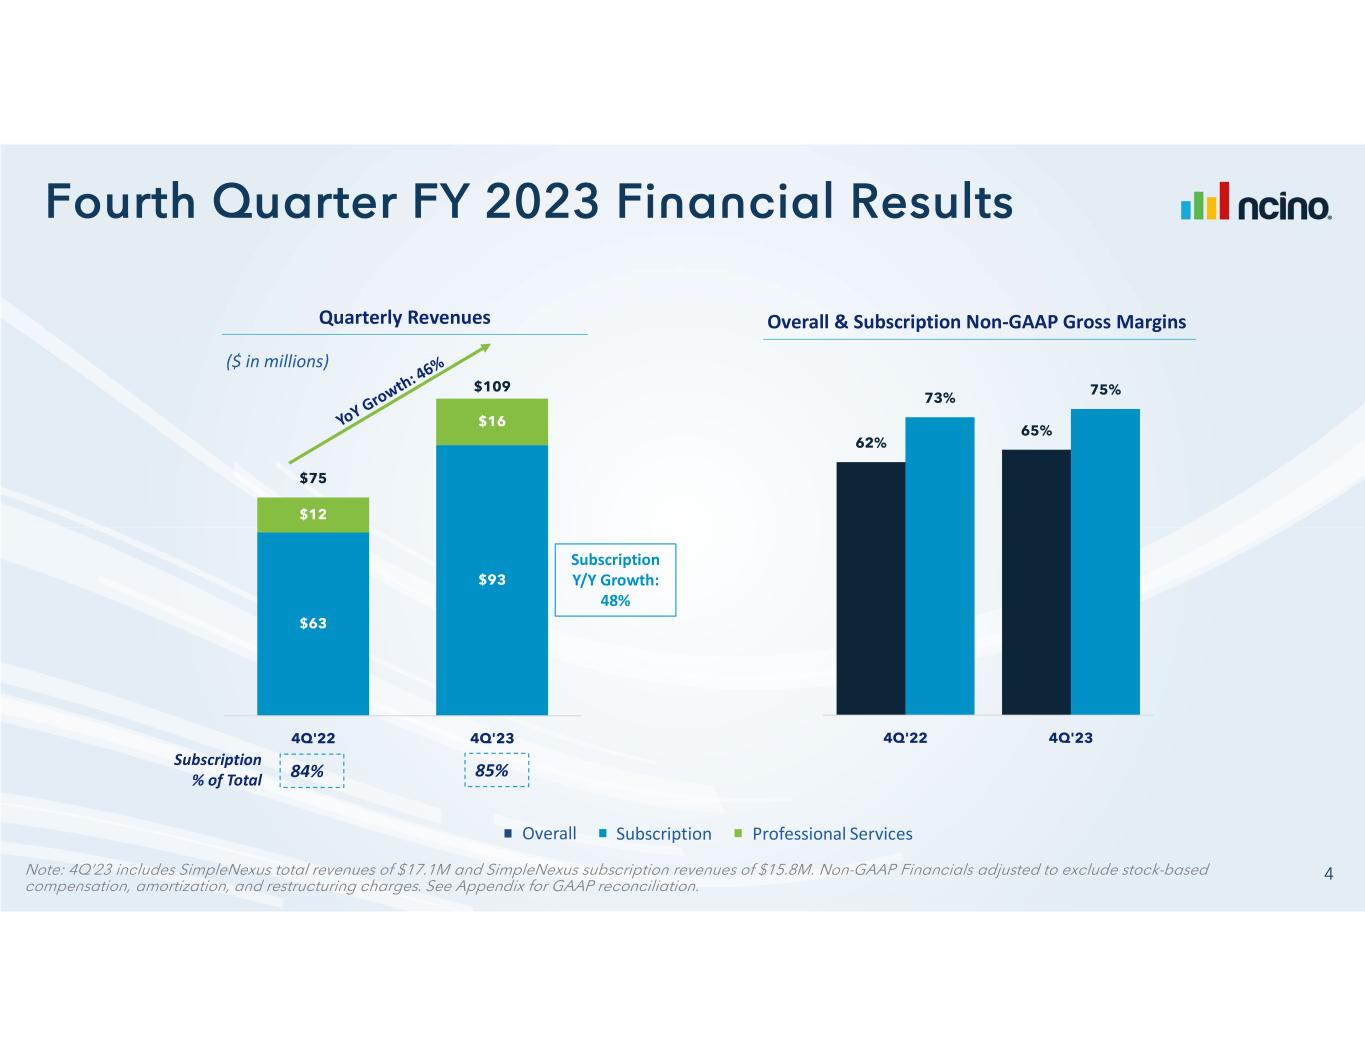
Quarterly Revenues ($ in millions) Subscription % of Total 85%84% Overall & Subscription Non-GAAP Gross Margins Overall Subscription Professional Services Subscription Y/Y Growth: 48%

Annual Revenues ($ in millions) Quarterly Subscription Revenues ($ in millions) Subscription Professional Services Subscription % of Total 80% 82% YoY % Growth 84% 66% 70% 56% 43% 47% 37% 32% 40% 55% 57% 55% 48%
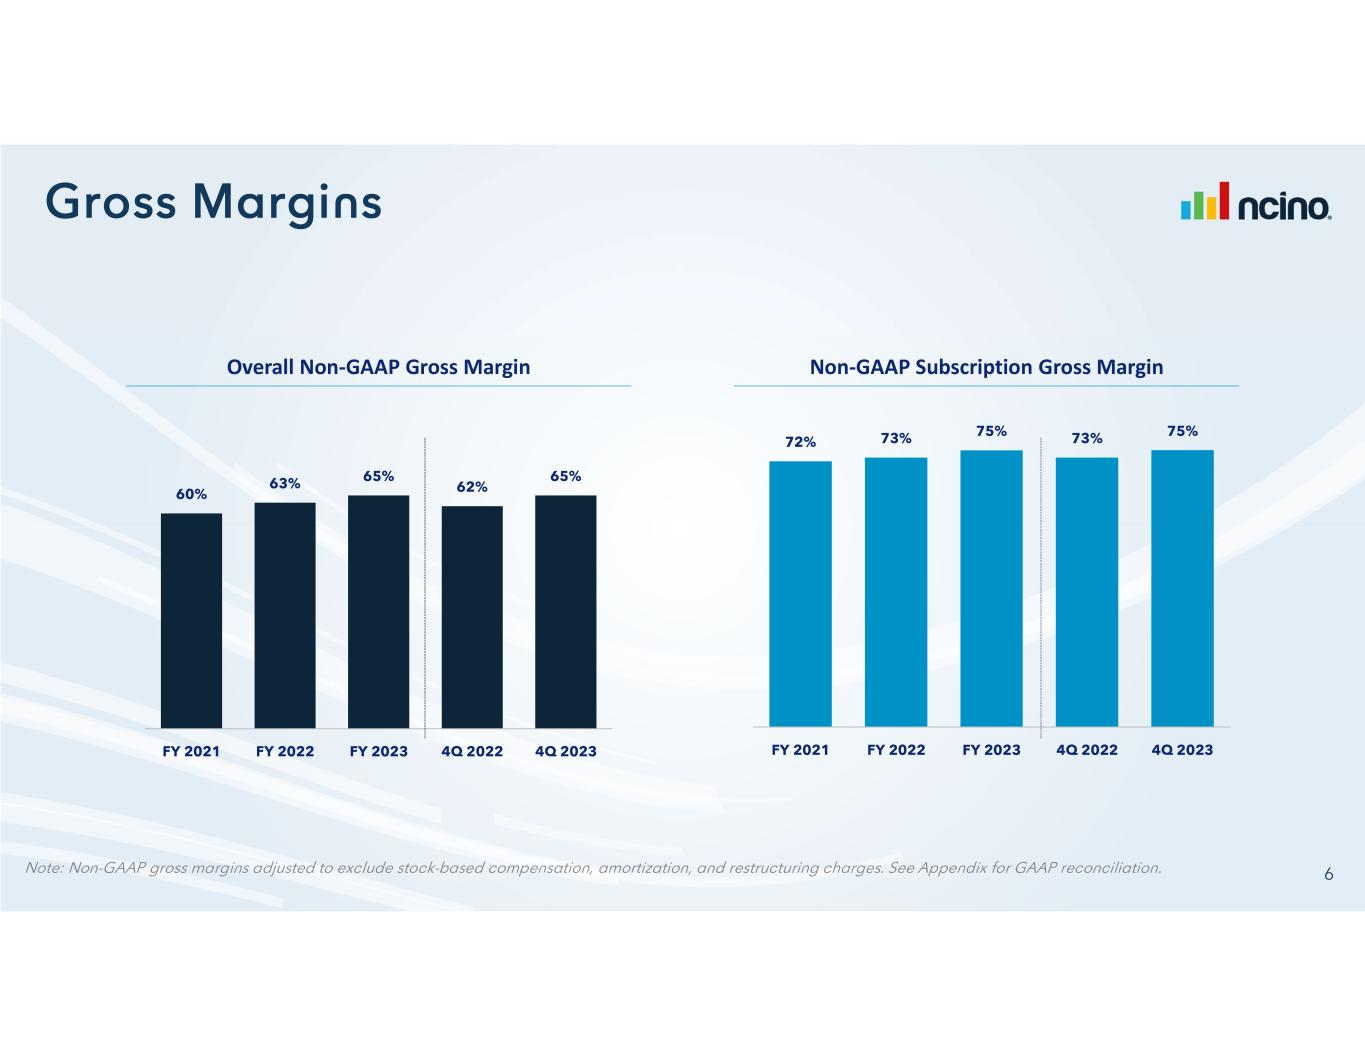
Overall Non-GAAP Gross Margin Non-GAAP Subscription Gross Margin

($ in millions)($ in millions) ($ in millions) S&M % of revenues R&D % of revenues G&A % of revenues Non-GAAP General & AdministrativeNon-GAAP Sales & Marketing Non-GAAP Research & Development
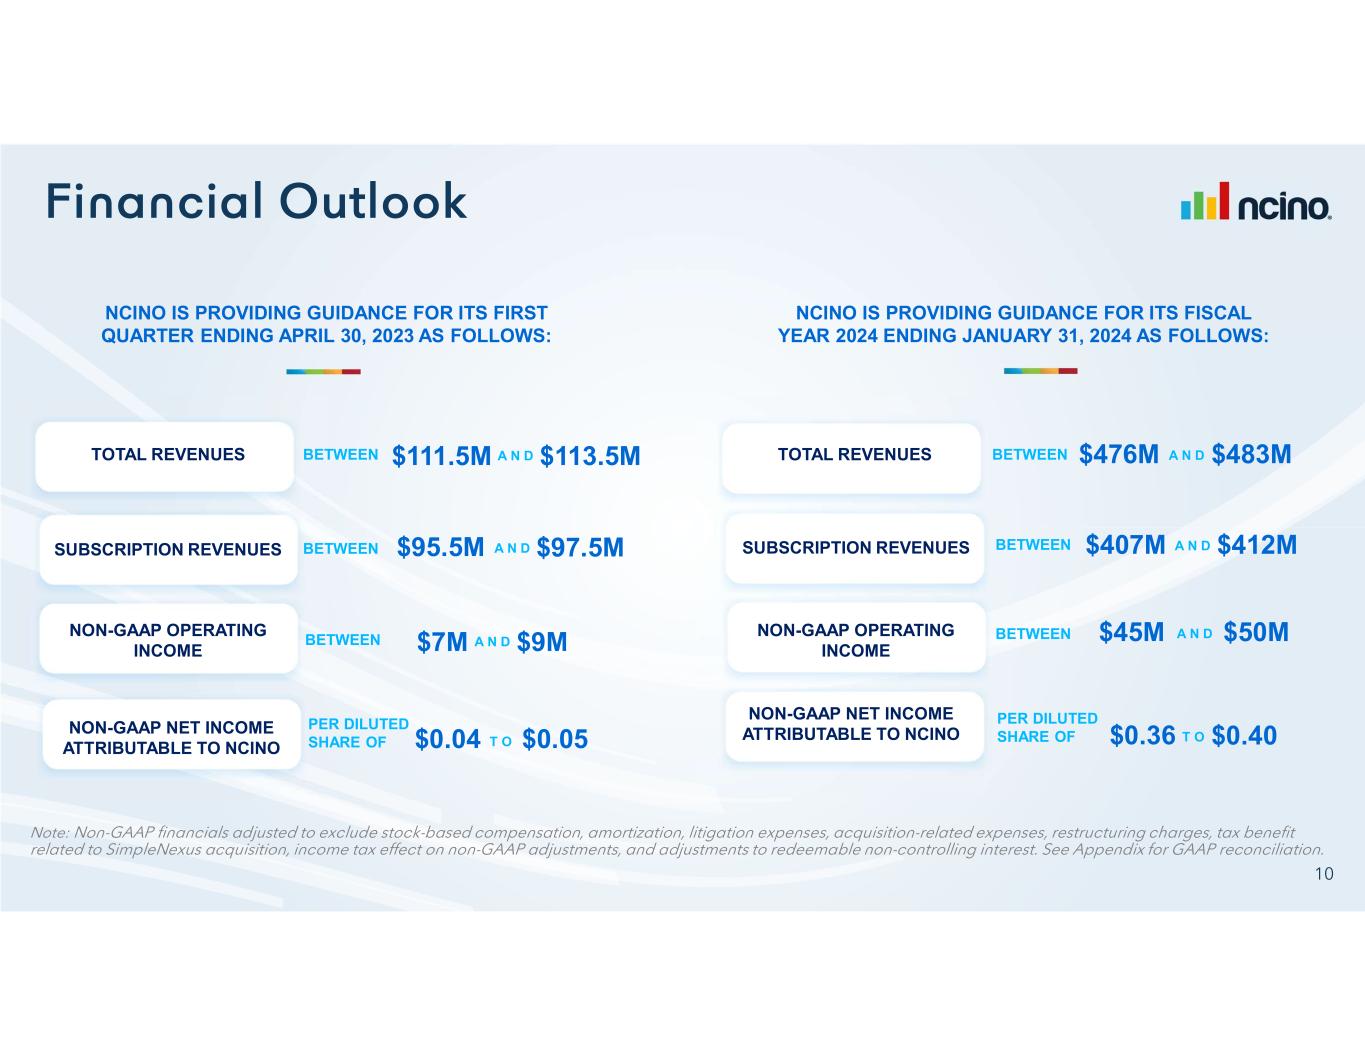
NCINO IS PROVIDING GUIDANCE FOR ITS FIRST QUARTER ENDING APRIL 30, 2023 AS FOLLOWS: NCINO IS PROVIDING GUIDANCE FOR ITS FISCAL YEAR 2024 ENDING JANUARY 31, 2024 AS FOLLOWS: TOTAL REVENUES NON-GAAP OPERATING INCOME NON-GAAP NET INCOME ATTRIBUTABLE TO NCINO BETWEEN BETWEEN BETWEEN PER DILUTED SHARE OF $111.5M $113.5MA N D $95.5M $97.5MA N D $7M $9MA N D $0.04 $0.05T O TOTAL REVENUES SUBSCRIPTION REVENUES NON-GAAP OPERATING INCOME NON-GAAP NET INCOME ATTRIBUTABLE TO NCINO BETWEEN BETWEEN BETWEEN PER DILUTED SHARE OF $476M $483MA N D $407M $412MA N D $45M $50MA N D $0.36 $0.40T O SUBSCRIPTION REVENUES
APPENDIX
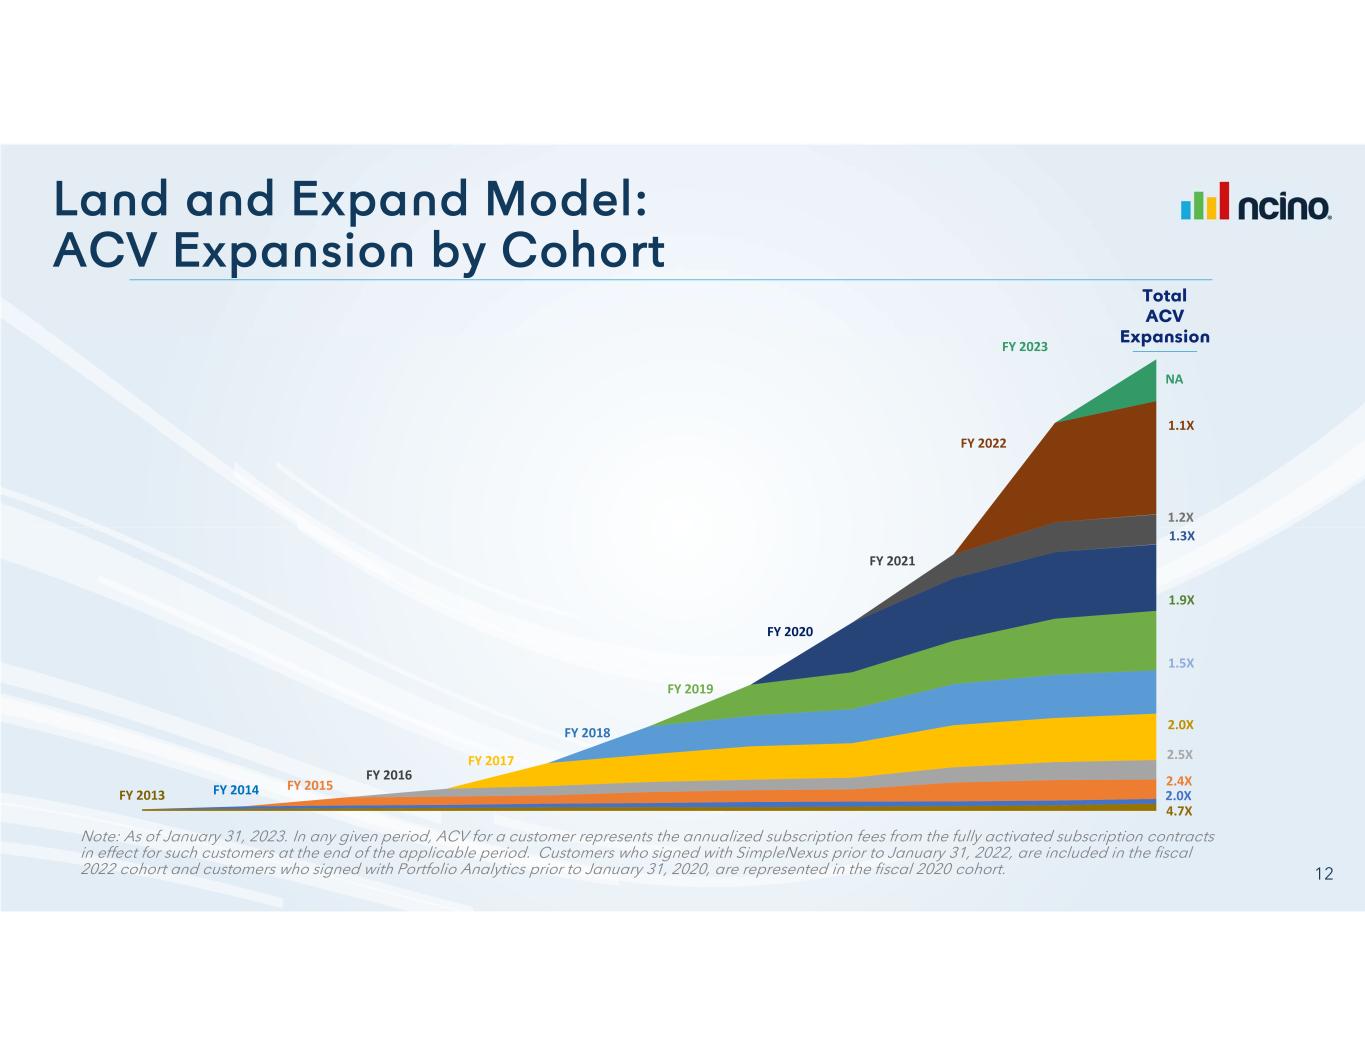
FY 2013 FY 2014 FY 2015 FY 2016 FY 2017 FY 2018 FY 2019 FY 2020 FY 2021 FY 2022 4.7X 2.0X 2.4X 2.5X 2.0X 1.5X 1.9X 1.3X 1.2X 1.1X NA FY 2023

($ in thousands) Subscription Gross Margin FY 2021 FY 2022 FY 2023 4Q'22 4Q'23 Subscription Revenues $162,439 $224,854 $344,752 $62,802 $92,828 GAAP Subscription Gross Profit 114,470 160,346 238,487 44,301 65,062 (+) Amortization 1,525 2,604 17,019 1,427 4,252 (+) Stock Based Compensation 576 960 1,430 239 310 (+) Restructuring charges -- -- 4 -- 4 Non-GAAP Subscription Gross Profit $116,571 $163,910 $256,940 $45,967 $69,628 Non-GAAP Subscription Gross Margin 72% 73% 75% 73% 75% Professional Services & Other Gross Margin FY 2021 FY 2022 FY 2023 4Q'22 4Q'23 Professional Services & Other Revenues $41,854 $49,011 $63,563 $12,153 $16,353 GAAP Professional Services Gross Profit 1,688 2,106 222 (631) (808) (+) Amortization -- -- 94 -- 47 (+) Stock Based Compensation 4,232 5,195 7,263 1,314 1,699 (+) Restructuring charges -- -- 333 -- 333 Non-GAAP Professional Services Gross Profit $5,920 $7,301 $7,912 $683 $1,271 Non-GAAP Professional Services Gross Margin 14% 15% 12% 6% 8% Overall Gross Margin FY 2021 FY 2022 FY 2023 4Q'22 4Q'23 Total Revenues $204,293 $273,865 $408,315 $74,955 $109,181 GAAP Gross Profit 116,158 162,452 238,709 43,670 64,254 (+) Amortization 1,525 2,604 17,113 1,427 4,299 (+) Stock Based Compensation 4,808 6,155 8,693 1,553 2,009 (+) Restructuring charges -- -- 337 -- 337 Non-GAAP Gross Profit $122,491 $171,211 $264,852 $46,650 $70,899 Non-GAAP Gross Margin 60% 63% 65% 62% 65%
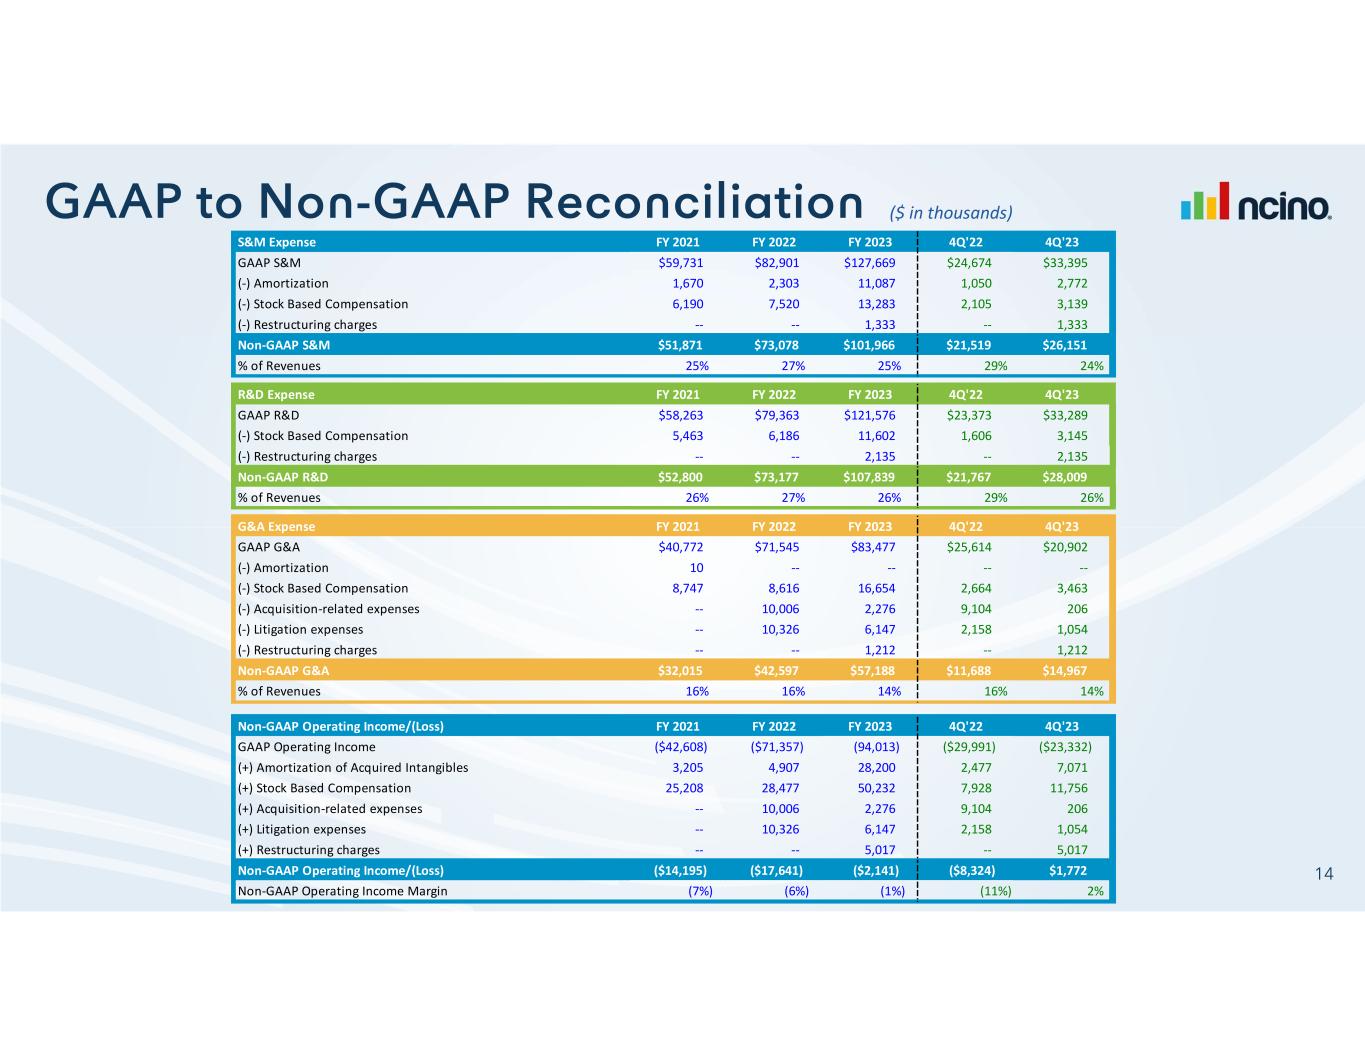
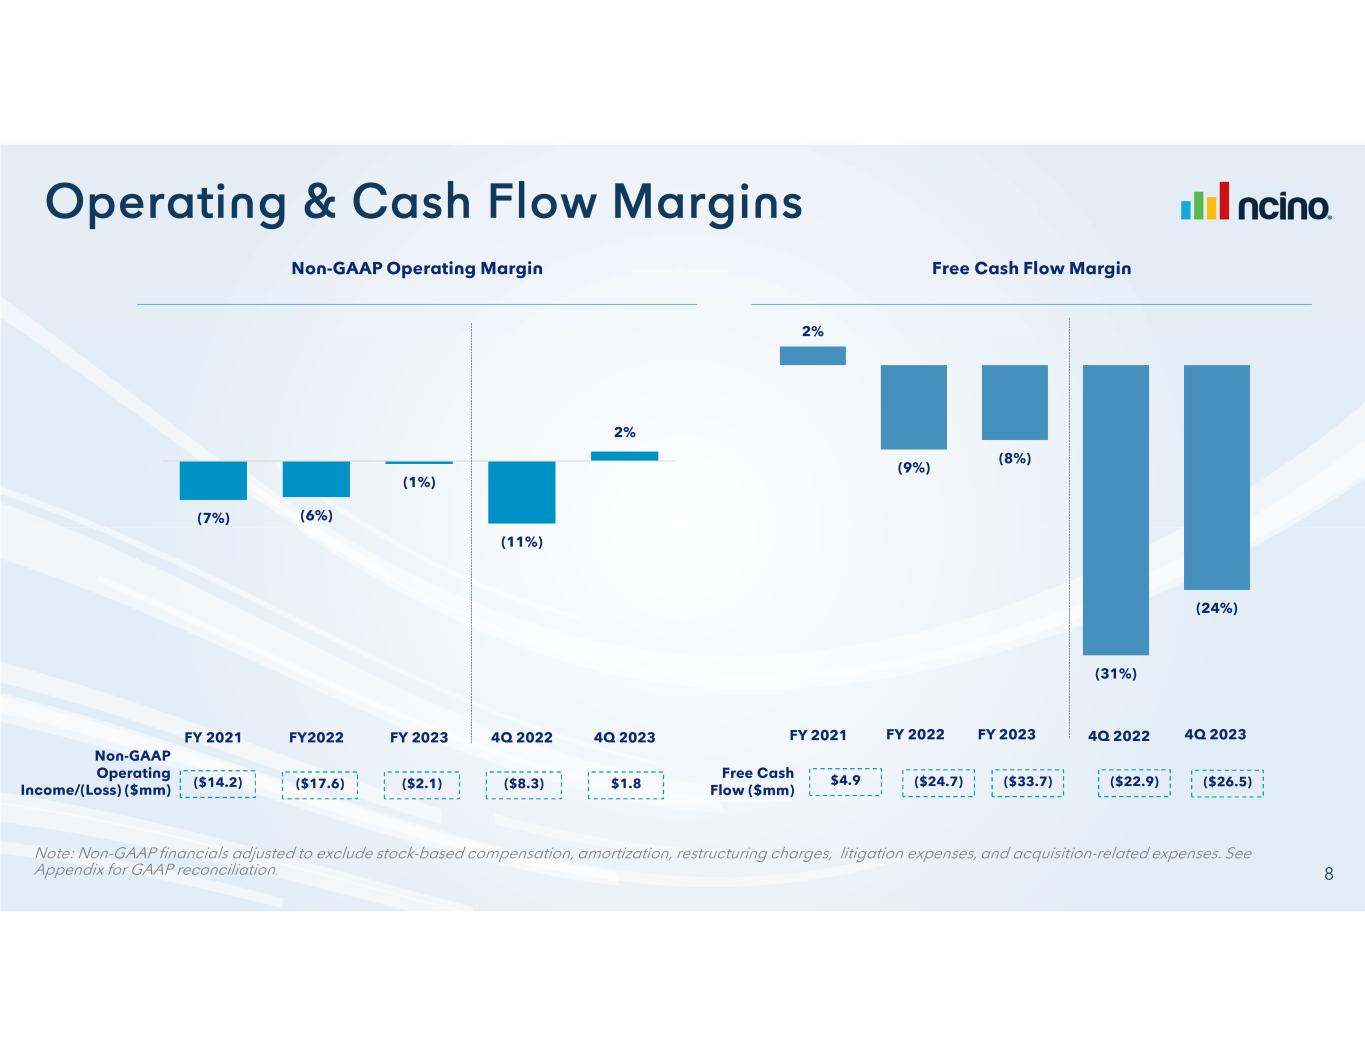
($ in thousands) S&M Expense FY 2021 FY 2022 FY 2023 4Q'22 4Q'23 GAAP S&M $59,731 $82,901 $127,669 $24,674 $33,395 (-) Amortization 1,670 2,303 11,087 1,050 2,772 (-) Stock Based Compensation 6,190 7,520 13,283 2,105 3,139 (-) Restructuring charges -- -- 1,333 -- 1,333 Non-GAAP S&M $51,871 $73,078 $101,966 $21,519 $26,151 % of Revenues 25% 27% 25% 29% 24% R&D Expense FY 2021 FY 2022 FY 2023 4Q'22 4Q'23 GAAP R&D $58,263 $79,363 $121,576 $23,373 $33,289 (-) Stock Based Compensation 5,463 6,186 11,602 1,606 3,145 (-) Restructuring charges -- -- 2,135 -- 2,135 Non-GAAP R&D $52,800 $73,177 $107,839 $21,767 $28,009 % of Revenues 26% 27% 26% 29% 26% G&A Expense FY 2021 FY 2022 FY 2023 4Q'22 4Q'23 GAAP G&A $40,772 $71,545 $83,477 $25,614 $20,902 (-) Amortization 10 -- -- -- -- (-) Stock Based Compensation 8,747 8,616 16,654 2,664 3,463 (-) Acquisition-related expenses -- 10,006 2,276 9,104 206 (-) Litigation expenses -- 10,326 6,147 2,158 1,054 (-) Restructuring charges -- -- 1,212 -- 1,212 Non-GAAP G&A $32,015 $42,597 $57,188 $11,688 $14,967 % of Revenues 16% 16% 14% 16% 14% Non-GAAP Operating Income/(Loss) FY 2021 FY 2022 FY 2023 4Q'22 4Q'23 GAAP Operating Income ($42,608) ($71,357) (94,013) ($29,991) ($23,332) (+) Amortization of Acquired Intangibles 3,205 4,907 28,200 2,477 7,071 (+) Stock Based Compensation 25,208 28,477 50,232 7,928 11,756 (+) Acquisition-related expenses -- 10,006 2,276 9,104 206 (+) Litigation expenses -- 10,326 6,147 2,158 1,054 (+) Restructuring charges -- -- 5,017 -- 5,017 Non-GAAP Operating Income/(Loss) ($14,195) ($17,641) ($2,141) ($8,324) $1,772 Non-GAAP Operating Income Margin (7%) (6%) (1%) (11%) 2%
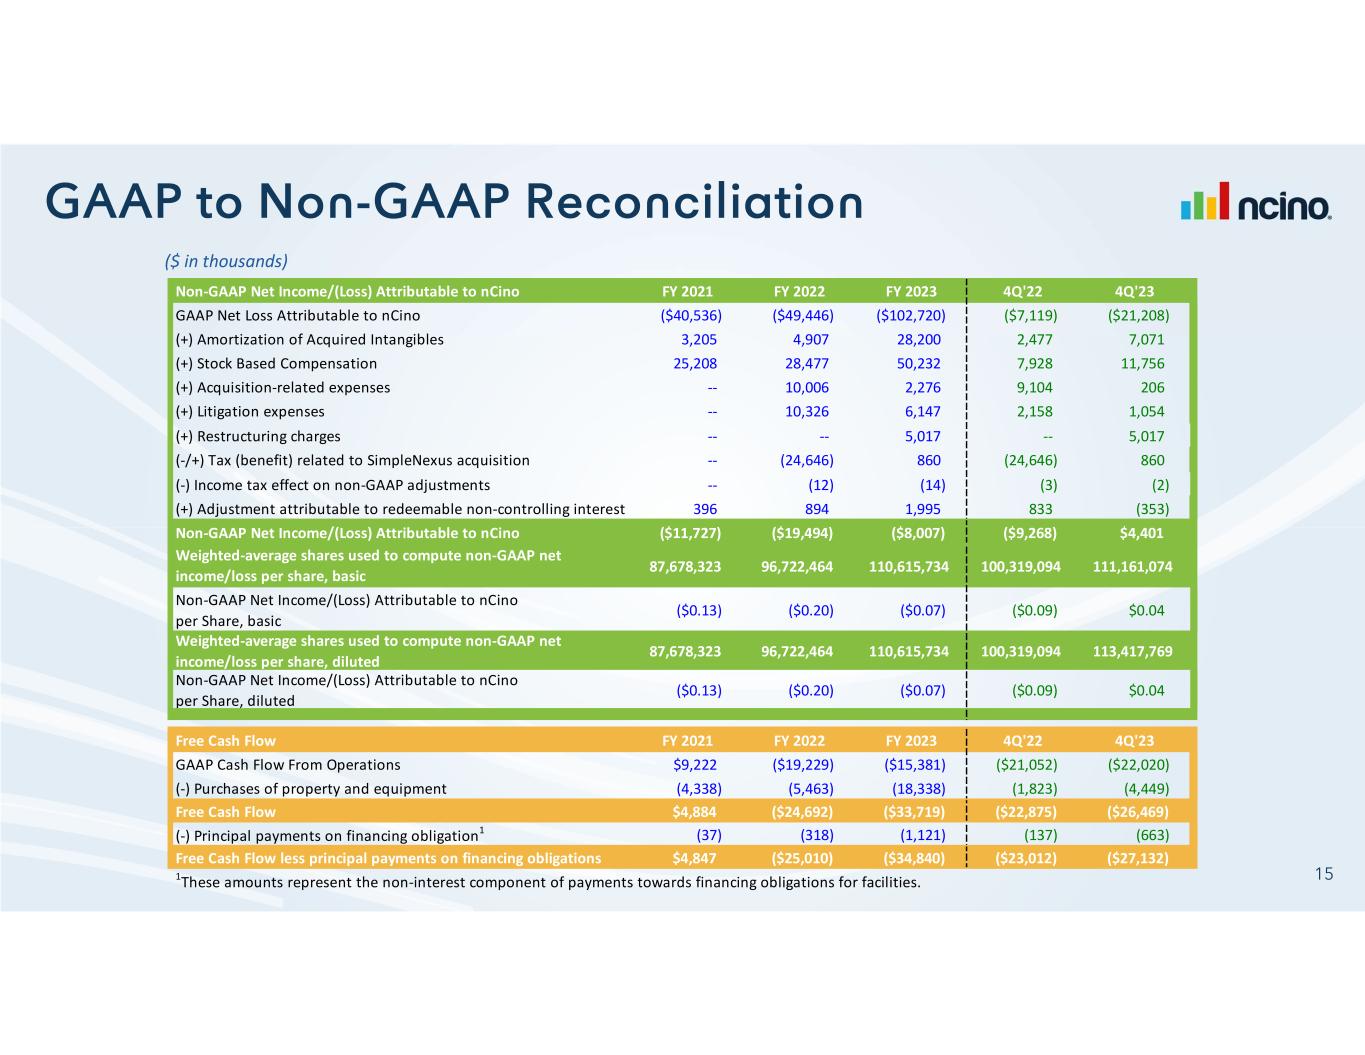
($ in thousands) Non-GAAP Net Income/(Loss) Attributable to nCino FY 2021 FY 2022 FY 2023 4Q'22 4Q'23 GAAP Net Loss Attributable to nCino ($40,536) ($49,446) ($102,720) ($7,119) ($21,208) (+) Amortization of Acquired Intangibles 3,205 4,907 28,200 2,477 7,071 (+) Stock Based Compensation 25,208 28,477 50,232 7,928 11,756 (+) Acquisition-related expenses -- 10,006 2,276 9,104 206 (+) Litigation expenses -- 10,326 6,147 2,158 1,054 (+) Restructuring charges -- -- 5,017 -- 5,017 (-/+) Tax (benefit) related to SimpleNexus acquisition -- (24,646) 860 (24,646) 860 (-) Income tax effect on non-GAAP adjustments -- (12) (14) (3) (2) (+) Adjustment attributable to redeemable non-controlling interest 396 894 1,995 833 (353) Non-GAAP Net Income/(Loss) Attributable to nCino ($11,727) ($19,494) ($8,007) ($9,268) $4,401 87,678,323 96,722,464 110,615,734 100,319,094 111,161,074 Non-GAAP Net Income/(Loss) Attributable to nCino per Share, basic ($0.13) ($0.20) ($0.07) ($0.09) $0.04 87,678,323 96,722,464 110,615,734 100,319,094 113,417,769 Non-GAAP Net Income/(Loss) Attributable to nCino per Share, diluted ($0.13) ($0.20) ($0.07) ($0.09) $0.04 Free Cash Flow FY 2021 FY 2022 FY 2023 4Q'22 4Q'23 GAAP Cash Flow From Operations $9,222 ($19,229) ($15,381) ($21,052) ($22,020) (-) Purchases of property and equipment (4,338) (5,463) (18,338) (1,823) (4,449) Free Cash Flow $4,884 ($24,692) ($33,719) ($22,875) ($26,469) (-) Principal payments on financing obligation1 (37) (318) (1,121) (137) (663) Free Cash Flow less principal payments on financing obligations $4,847 ($25,010) ($34,840) ($23,012) ($27,132) 1These amounts represent the non-interest component of payments towards financing obligations for facilities. Weighted-average shares used to compute non-GAAP net income/loss per share, basic Weighted-average shares used to compute non-GAAP net income/loss per share, diluted


