March 26, 2024 Fourth Quarter Fiscal Year 2024
This presentation contains forward-looking statements about nCino's financial and operating results, which include statements regarding nCino’s future performance, outlook, guidance, the assumptions underlying those statements, the benefits from the use of nCino’s solutions, our strategies, and general business conditions. Forward-looking statements generally include actions, events, results, strategies and expectations and are often identifiable by use of the words “believes,” “expects,” “intends,” “anticipates,” “plans,” “seeks,” “estimates,” “projects,” “may,” “will,” “could,” “might,” or “continues” or similar expressions and the negatives thereof. Any forward-looking statements contained in this presentation are based upon nCino’s historical performance and its current plans, estimates, and expectations and are not a representation that such plans, estimates, or expectations will be achieved. These forward-looking statements represent nCino’s expectations as of the date of this presentation. Subsequent events may cause these expectations to change and, except as may be required by law, nCino does not undertake any obligation to update or revise these forward-looking statements. These forward-looking statements are subject to known and unknown risks and uncertainties that may cause actual results to differ materially including, but not limited to risks associated with (i) adverse changes in the financial services industry, including as a result of customer consolidation or bank failures; (ii) adverse changes in economic, regulatory, or market conditions, including as a direct or indirect consequence of higher interest rates; (iii) risks associated with the acquisitions, (iv) breaches in our security measures or unauthorized access to our customers’ or their clients' data; (v) the accuracy of management’s assumptions and estimates; (vi) our ability to attract new customers and succeed in having current customers expand their use of our solution; (vii) competitive factors, including pricing pressures, consolidation among competitors, entry of new competitors, the launch of new products and marketing initiatives by our competitors, and difficulty securing rights to access or integrate with third party products or data used by our customers; (viii) the rate of adoption of our newer solutions and the results of our efforts to sustain or expand the use and adoption of our more established solutions; (ix) fluctuation of our results of operations, which may make period-to-period comparisons less meaningful; (x) our ability to manage our growth effectively including expanding outside of the United States; (xi) adverse changes in our relationship with Salesforce; (xii) our ability to successfully acquire new companies and/or integrate acquisitions into our existing organization; (xiii) the loss of one or more customers, particularly any of our larger customers, or a reduction in the number of users our customers purchase access and use rights for; (xiv) system unavailability, system performance problems, or loss of data due to disruptions or other problems with our computing infrastructure or the infrastructure we rely on that is operated by third parties; (xv) our ability to maintain our corporate culture and attract and retain highly skilled employees; and (xvi) the outcome and impact of legal proceedings and related fees and expenses. Additional risks and uncertainties that could affect nCino’s business and financial results are included in our reports filed with the U.S. Securities and Exchange Commission (available on our web site at www.ncino.com or the SEC's web site at www.sec.gov). Further information on potential risks that could affect actual results will be included in other filings nCino makes with the SEC from time to time. In addition to financial information presented in accordance with U.S. generally accepted accounting principles (“GAAP”), this presentation includes certain non-GAAP financial measures, including Non-GAAP Operating Loss. Any non-GAAP measure is presented for supplemental informational purposes only and should not be considered a substitute for financial information presented in accordance with GAAP. Non-GAAP measures have limitations as analytical tools and should not be considered in isolation or as substitutes for analysis of other GAAP financial measures. A reconciliation of these measures to the most directly comparable GAAP measures is included at the end of this presentation. This presentation also contains statistical data, estimates and forecasts that are based on independent industry publications or other publicly available information, as well as other information based on our internal sources. This information involves many assumptions and limitations, and you are cautioned not to give undue weight to such information. We have not independently verified the accuracy or completeness of the information contained in the industry publications and other publicly available information. Accordingly, we make no representations as to the accuracy or completeness of that information nor do we undertake to update such information after the date of this presentation. Cautionary Note Regarding Forward-Looking Statements, Disclaimers and Financial Measures
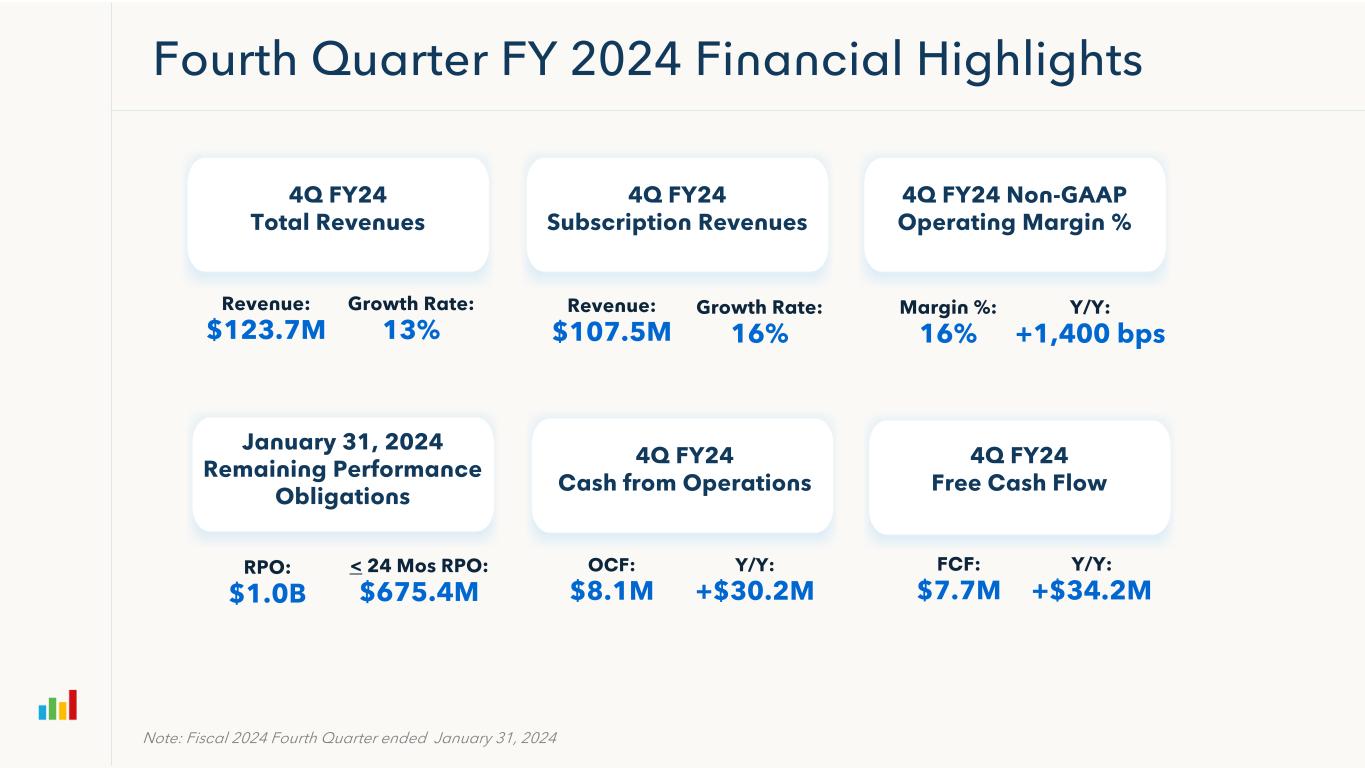
4Q FY24 Subscription Revenues Fourth Quarter FY 2024 Financial Highlights 4Q FY24 Total Revenues Revenue: $123.7M Growth Rate: 13% Note: Fiscal 2024 Fourth Quarter ended January 31, 2024 Revenue: $107.5M Growth Rate: 16% 4Q FY24 Non-GAAP Operating Margin % Margin %: 16% FCF: $7.7M January 31, 2024 Remaining Performance Obligations RPO: $1.0B OCF: $8.1M < 24 Mos RPO: $675.4M Y/Y: +$30.2M Y/Y: +1,400 bps Y/Y: +$34.2M 4Q FY24 Free Cash Flow 4Q FY24 Cash from Operations
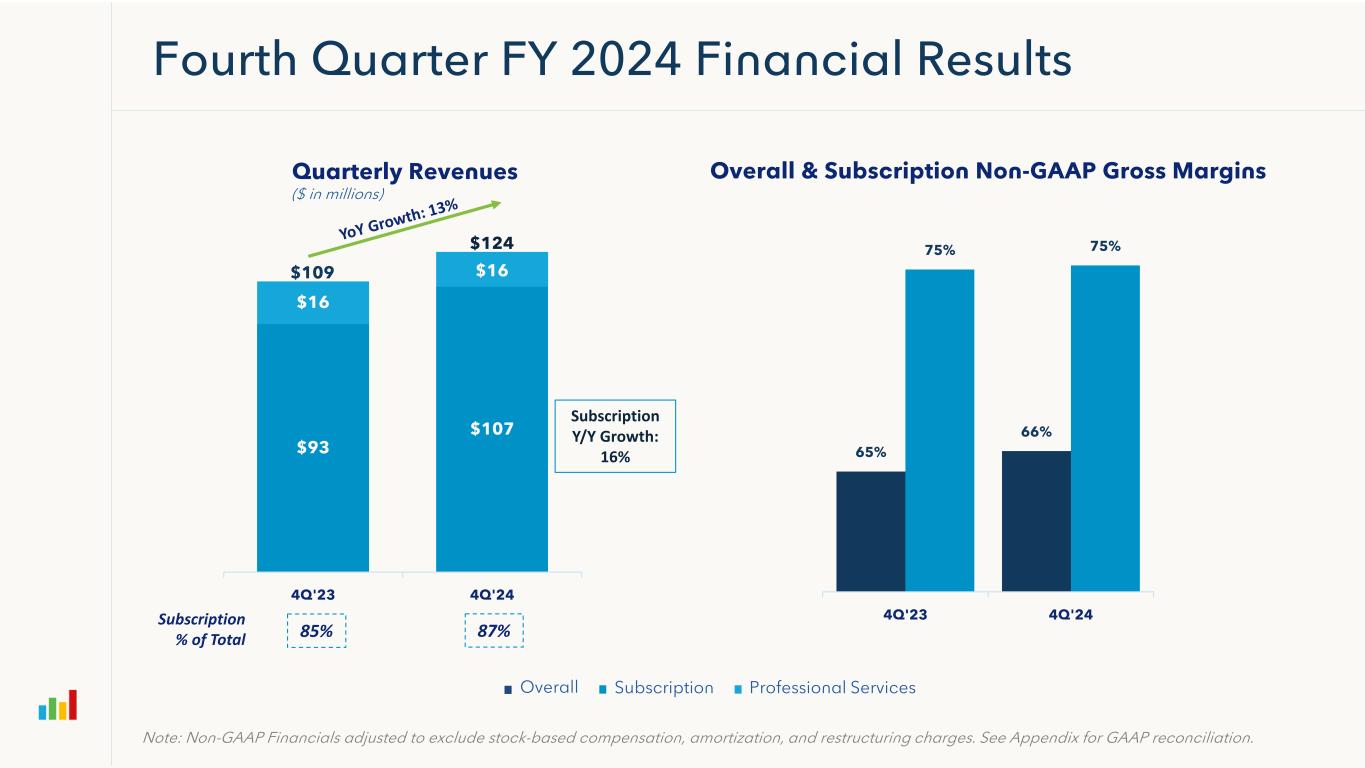
65% 66% 75% 75% 4Q'23 4Q'24 Fourth Quarter FY 2024 Financial Results Quarterly Revenues ($ in millions) $93 $107 $16 $16 4Q'23 4Q'24 Subscription % of Total 87%85% Overall & Subscription Non-GAAP Gross Margins Overall Subscription Professional Services Subscription Y/Y Growth: 16% Note: Non-GAAP Financials adjusted to exclude stock-based compensation, amortization, and restructuring charges. See Appendix for GAAP reconciliation. $109 $124
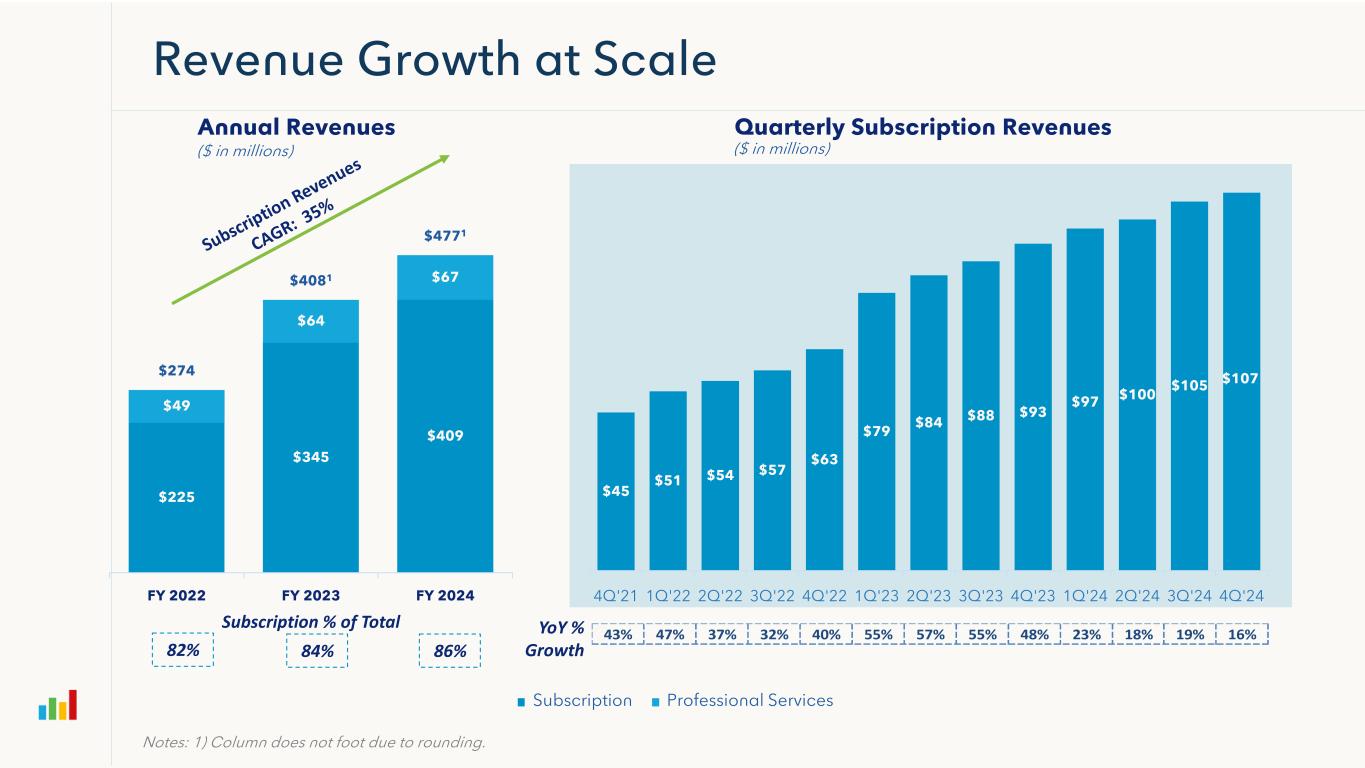
$225 $345 $409 $49 $64 $67 $274 $4081 $4771 FY 2022 FY 2023 FY 2024 $45 $51 $54 $57 $63 $79 $84 $88 $93 $97 $100 $105 $107 4Q'21 1Q'22 2Q'22 3Q'22 4Q'22 1Q'23 2Q'23 3Q'23 4Q'23 1Q'24 2Q'24 3Q'24 4Q'24 Revenue Growth at Scale Annual Revenues ($ in millions) Quarterly Subscription Revenues ($ in millions) Subscription Professional Services Subscription % of Total 82% 84% YoY % Growth86% Notes: 1) Column does not foot due to rounding. 43% 47% 37% 32% 40% 55% 57% 55% 48% 23% 18% 19% 16%
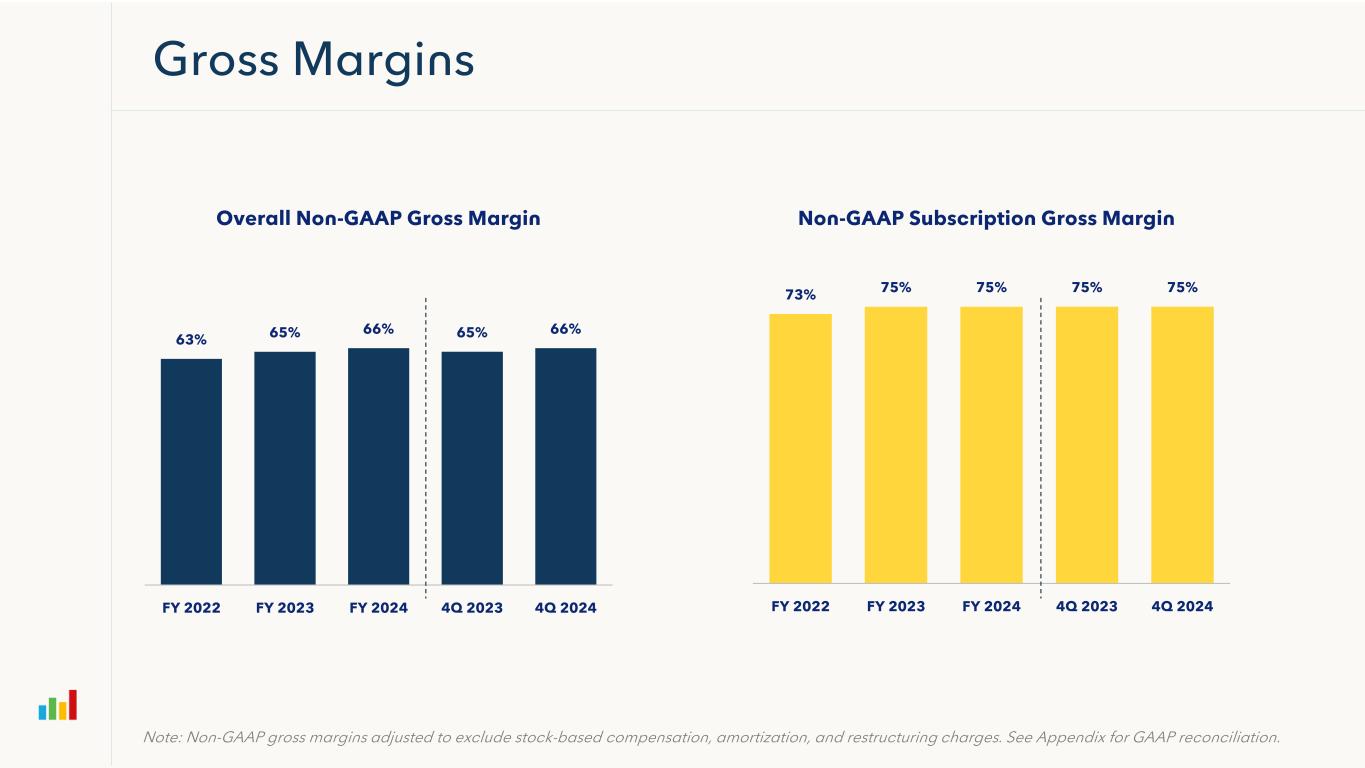
63% 65% 66% 65% 66% FY 2022 FY 2023 FY 2024 4Q 2023 4Q 2024 73% 75% 75% 75% 75% FY 2022 FY 2023 FY 2024 4Q 2023 4Q 2024 Gross Margins Overall Non-GAAP Gross Margin Non-GAAP Subscription Gross Margin Note: Non-GAAP gross margins adjusted to exclude stock-based compensation, amortization, and restructuring charges. See Appendix for GAAP reconciliation.
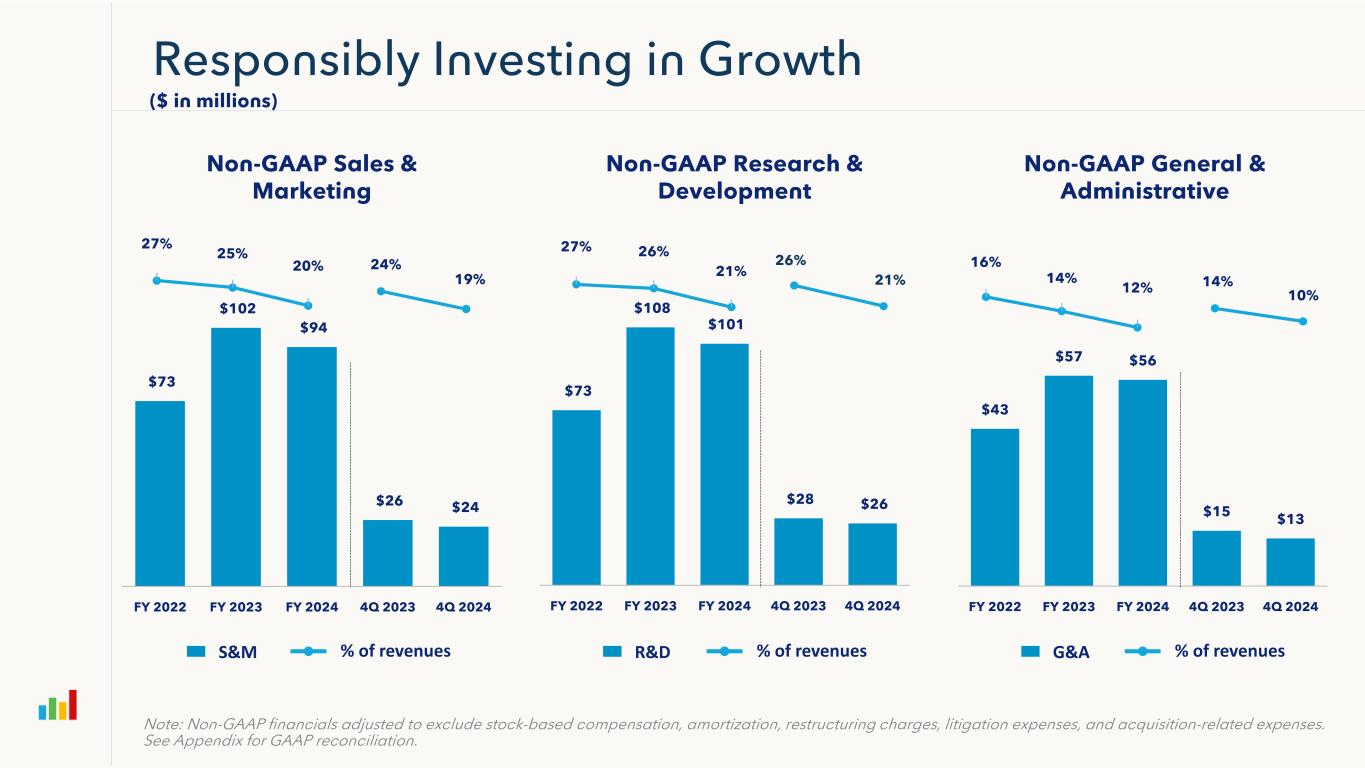
14% 10% $73 $108 $101 $28 $26 FY 2022 FY 2023 FY 2024 4Q 2023 4Q 2024 27% 25% 20% 27% 26% 21% $43 $57 $56 $15 $13 FY 2022 FY 2023 FY 2024 4Q 2023 4Q 2024 26% 21% 24% 19% $73 $102 $94 $26 $24 FY 2022 FY 2023 FY 2024 4Q 2023 4Q 2024 16% 14% 12% Responsibly Investing in Growth Note: Non-GAAP financials adjusted to exclude stock-based compensation, amortization, restructuring charges, litigation expenses, and acquisition-related expenses. See Appendix for GAAP reconciliation. ($ in millions) S&M % of revenues R&D % of revenues G&A % of revenues Non-GAAP General & Administrative Non-GAAP Sales & Marketing Non-GAAP Research & Development
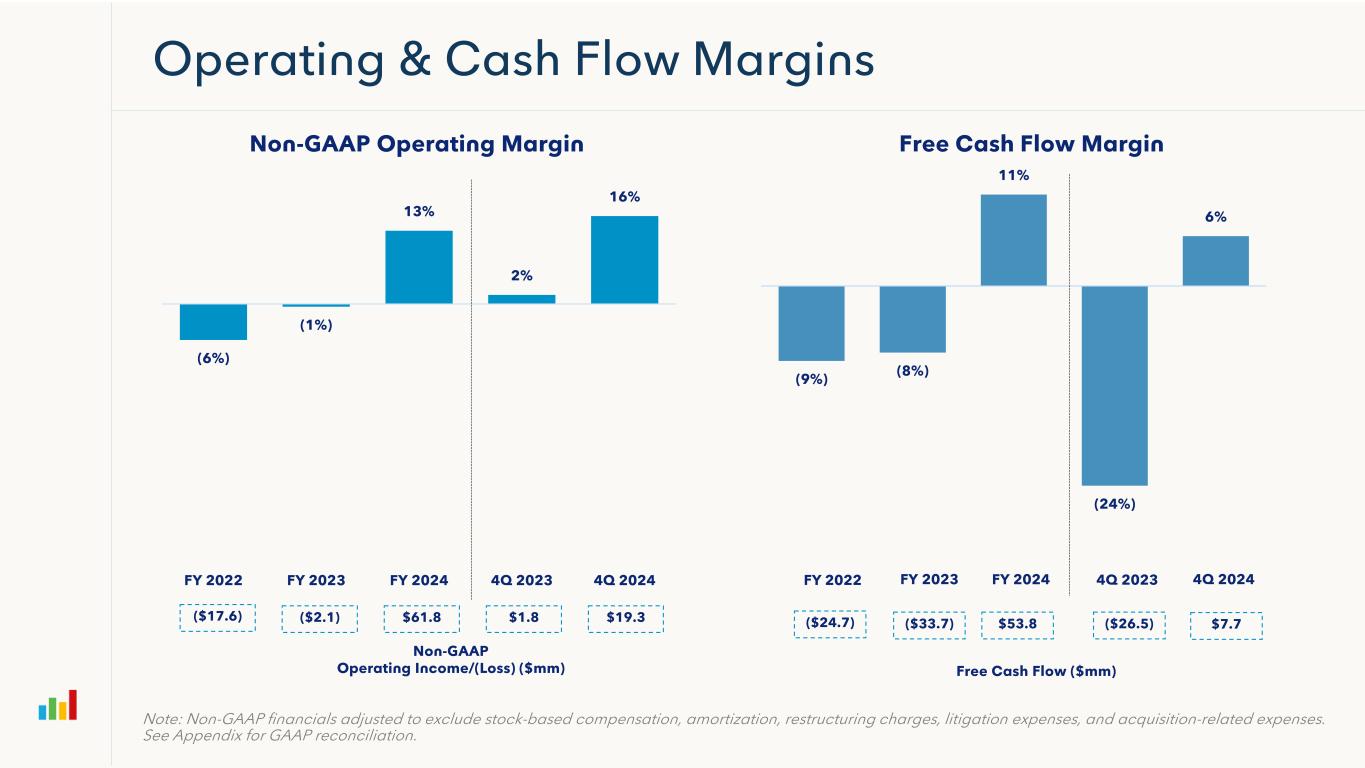
Operating & Cash Flow Margins (6%) (1%) 13% 2% 16% FY 2022 FY 2023 FY 2024 4Q 2023 4Q 2024 Non-GAAP Operating Margin Free Cash Flow Margin (9%) (8%) 11% (24%) 6% 4Q 20244Q 2023FY 2024FY 2023FY 2022 Note: Non-GAAP financials adjusted to exclude stock-based compensation, amortization, restructuring charges, litigation expenses, and acquisition-related expenses. See Appendix for GAAP reconciliation. ($17.6) ($2.1) Non-GAAP Operating Income/(Loss) ($mm) $61.8 $1.8 $19.3 ($24.7) ($33.7) Free Cash Flow ($mm) $53.8 ($26.5) $7.7
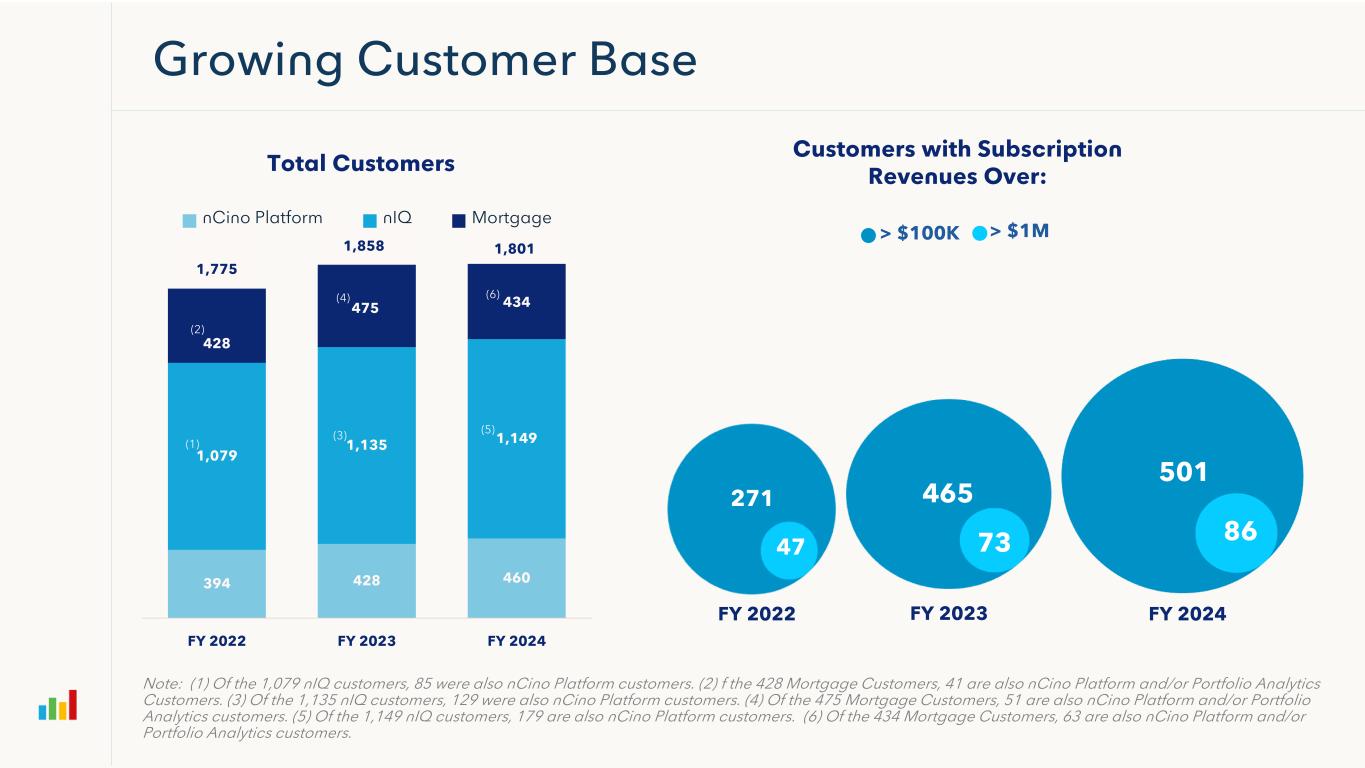
Growing Customer Base 394 428 460 1,079 1,135 1,149 428 475 434 1,775 1,858 1,801 FY 2022 FY 2023 FY 2024 nCino Platform nIQ Mortgage (5) (6) (1) Total Customers Customers with Subscription Revenues Over: > $1M > $100K 271 47 FY 2022 Note: (1) Of the 1,079 nIQ customers, 85 were also nCino Platform customers. (2) f the 428 Mortgage Customers, 41 are also nCino Platform and/or Portfolio Analytics Customers. (3) Of the 1,135 nIQ customers, 129 were also nCino Platform customers. (4) Of the 475 Mortgage Customers, 51 are also nCino Platform and/or Portfolio Analytics customers. (5) Of the 1,149 nIQ customers, 179 are also nCino Platform customers. (6) Of the 434 Mortgage Customers, 63 are also nCino Platform and/or Portfolio Analytics customers. FY 2023 73 465 (3) FY 2024 86 501 (4) (2)
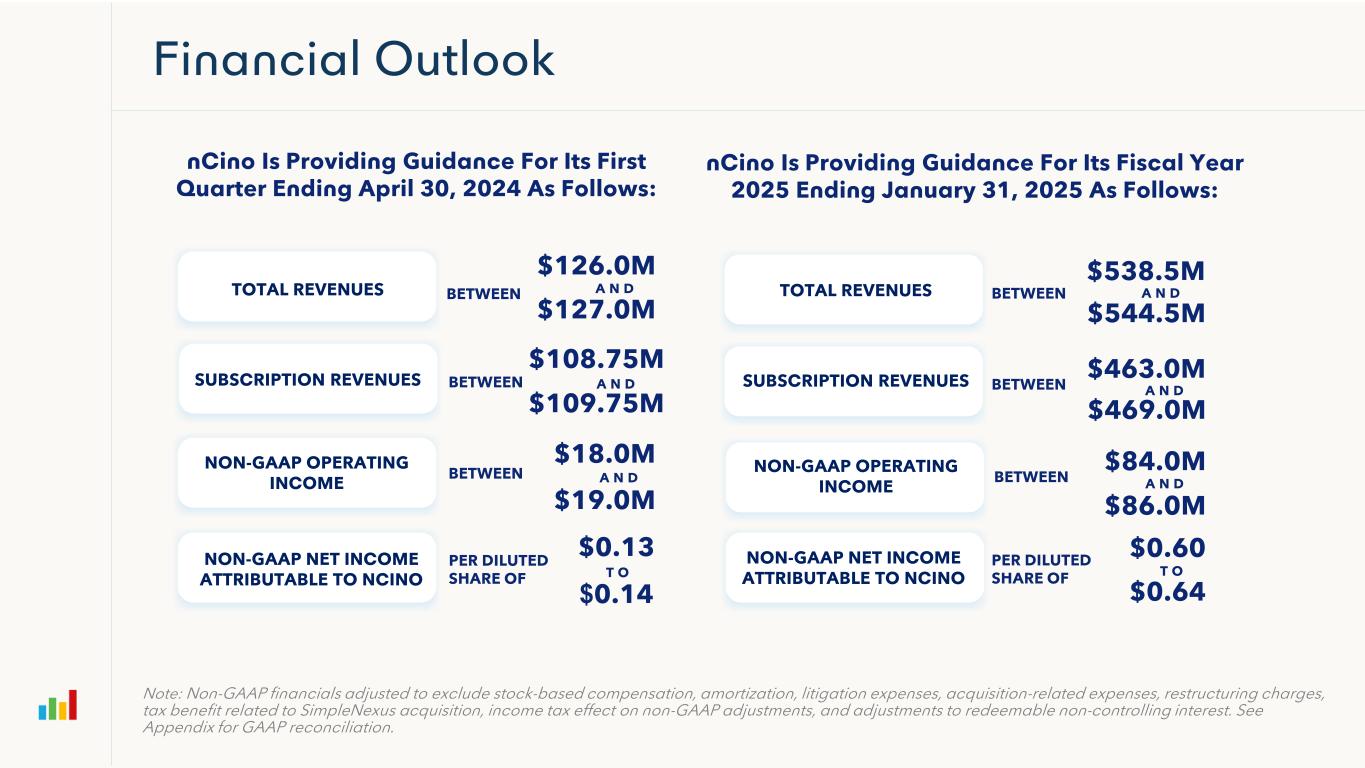
Financial Outlook nCino Is Providing Guidance For Its First Quarter Ending April 30, 2024 As Follows: nCino Is Providing Guidance For Its Fiscal Year 2025 Ending January 31, 2025 As Follows: TOTAL REVENUES NON-GAAP OPERATING INCOME NON-GAAP NET INCOME ATTRIBUTABLE TO NCINO BETWEEN BETWEEN BETWEEN PER DILUTED SHARE OF $126.0M $127.0M A N D $108.75M $109.75M A N D $18.0M $19.0M A N D $0.13 $0.14 T O TOTAL REVENUES SUBSCRIPTION REVENUES NON-GAAP OPERATING INCOME NON-GAAP NET INCOME ATTRIBUTABLE TO NCINO BETWEEN BETWEEN BETWEEN PER DILUTED SHARE OF $538.5M $544.5M A N D $463.0M $469.0M A N D $84.0M $86.0M A N D $0.60 $0.64 T O Note: Non-GAAP financials adjusted to exclude stock-based compensation, amortization, litigation expenses, acquisition-related expenses, restructuring charges, tax benefit related to SimpleNexus acquisition, income tax effect on non-GAAP adjustments, and adjustments to redeemable non-controlling interest. See Appendix for GAAP reconciliation. SUBSCRIPTION REVENUES
Appendix
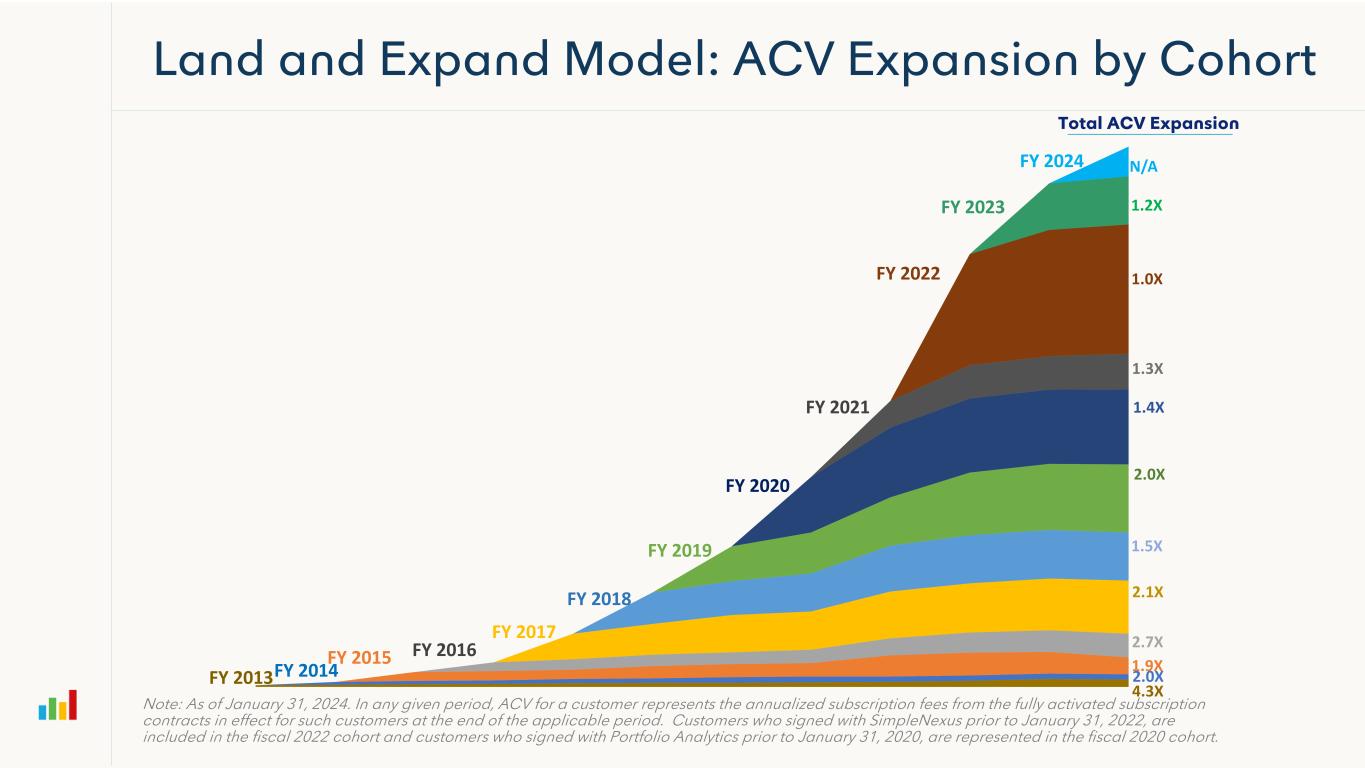
FY 2013FY 2014 FY 2015 FY 2016 FY 2017 FY 2018 FY 2019 FY 2020 FY 2021 FY 2022 4.3X 2.0X 1.9X 2.7X 2.1X 1.5X 2.0X 1.4X 1.3X 1.2X 1.0X N/A FY 2023 FY 2024 Land and Expand Model: ACV Expansion by Cohort Total ACV Expansion Note: As of January 31, 2024. In any given period, ACV for a customer represents the annualized subscription fees from the fully activated subscription contracts in effect for such customers at the end of the applicable period. Customers who signed with SimpleNexus prior to January 31, 2022, are included in the fiscal 2022 cohort and customers who signed with Portfolio Analytics prior to January 31, 2020, are represented in the fiscal 2020 cohort.

GAAP to Non-GAAP Reconciliation ($ in thousands) Subscription Gross Margin FY 2022 FY 2023 FY 2024 4Q'23 4Q'24 Subscription Revenues $224,854 $344,752 $409,479 $92,828 $107,483 GAAP Subscription Gross Profit 160,346 238,487 288,618 65,062 76,103 (+) Amortization 2,604 17,019 16,306 4,252 3,875 (+) Stock Based Compensation 960 1,430 1,847 310 533 (+) Restructuring Charges -- 4 51 4 -- Non-GAAP Subscription Gross Profit $163,910 $256,940 $306,822 $69,628 $80,511 Non-GAAP Subscription Gross Margin 73% 75% 75% 75% 75% Professional Services & Other Gross Margin FY 2022 FY 2023 FY 2024 4Q'23 4Q'24 Professional Services & Other Revenues $49,011 $63,563 $67,064 $16,353 $16,210 GAAP Professional Services Gross Profit 2,106 222 (3,545) (808) (1,620) (+) Amortization -- 94 330 47 83 (+) Stock Based Compensation 5,195 7,263 9,369 1,699 2,709 (+) Restructuring Charges -- 333 118 333 -- Non-GAAP Professional Services Gross Profit $7,301 $7,912 $6,272 $1,271 $1,172 Non-GAAP Professional Services Gross Margin 15% 12% 9% 8% 7% Overall Gross Margin FY 2022 FY 2023 FY 2024 4Q'23 4Q'24 Total Revenues $273,865 $408,315 $476,543 $109,181 $123,693 GAAP Gross Profit 162,452 238,709 285,073 64,254 74,483 (+) Amortization 2,604 17,113 16,636 4,299 3,958 (+) Stock Based Compensation 6,155 8,693 11,216 2,009 3,242 (+) Restructuring Charges -- 337 169 337 -- Non-GAAP Gross Profit $171,211 $264,852 $313,094 $70,899 $81,683 Non-GAAP Gross Margin 63% 65% 66% 65% 66%
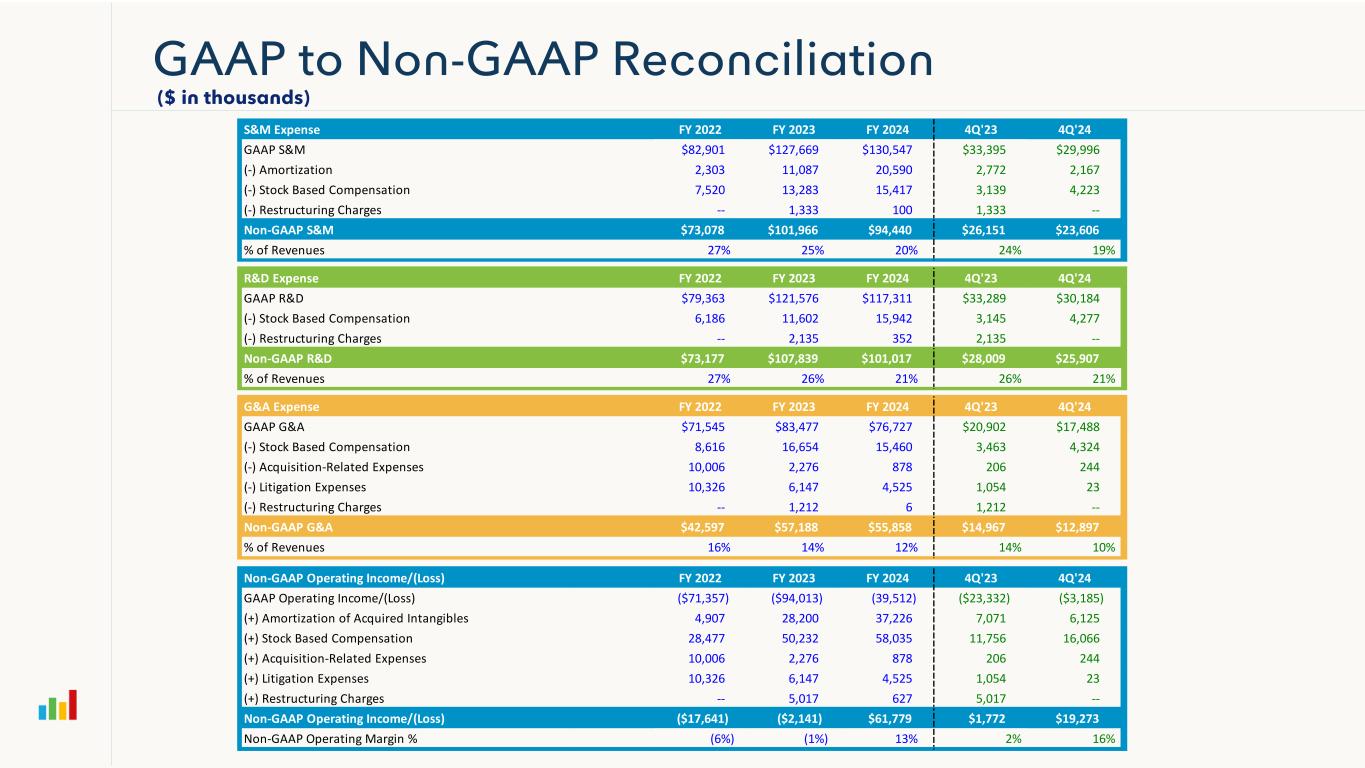
GAAP to Non-GAAP Reconciliation ($ in thousands) S&M Expense FY 2022 FY 2023 FY 2024 4Q'23 4Q'24 GAAP S&M $82,901 $127,669 $130,547 $33,395 $29,996 (-) Amortization 2,303 11,087 20,590 2,772 2,167 (-) Stock Based Compensation 7,520 13,283 15,417 3,139 4,223 (-) Restructuring Charges -- 1,333 100 1,333 -- Non-GAAP S&M $73,078 $101,966 $94,440 $26,151 $23,606 % of Revenues 27% 25% 20% 24% 19% R&D Expense FY 2022 FY 2023 FY 2024 4Q'23 4Q'24 GAAP R&D $79,363 $121,576 $117,311 $33,289 $30,184 (-) Stock Based Compensation 6,186 11,602 15,942 3,145 4,277 (-) Restructuring Charges -- 2,135 352 2,135 -- Non-GAAP R&D $73,177 $107,839 $101,017 $28,009 $25,907 % of Revenues 27% 26% 21% 26% 21% G&A Expense FY 2022 FY 2023 FY 2024 4Q'23 4Q'24 GAAP G&A $71,545 $83,477 $76,727 $20,902 $17,488 (-) Stock Based Compensation 8,616 16,654 15,460 3,463 4,324 (-) Acquisition-Related Expenses 10,006 2,276 878 206 244 (-) Litigation Expenses 10,326 6,147 4,525 1,054 23 (-) Restructuring Charges -- 1,212 6 1,212 -- Non-GAAP G&A $42,597 $57,188 $55,858 $14,967 $12,897 % of Revenues 16% 14% 12% 14% 10% Non-GAAP Operating Income/(Loss) FY 2022 FY 2023 FY 2024 4Q'23 4Q'24 GAAP Operating Income/(Loss) ($71,357) ($94,013) (39,512) ($23,332) ($3,185) (+) Amortization of Acquired Intangibles 4,907 28,200 37,226 7,071 6,125 (+) Stock Based Compensation 28,477 50,232 58,035 11,756 16,066 (+) Acquisition-Related Expenses 10,006 2,276 878 206 244 (+) Litigation Expenses 10,326 6,147 4,525 1,054 23 (+) Restructuring Charges -- 5,017 627 5,017 -- Non-GAAP Operating Income/(Loss) ($17,641) ($2,141) $61,779 $1,772 $19,273 Non-GAAP Operating Margin % (6%) (1%) 13% 2% 16%
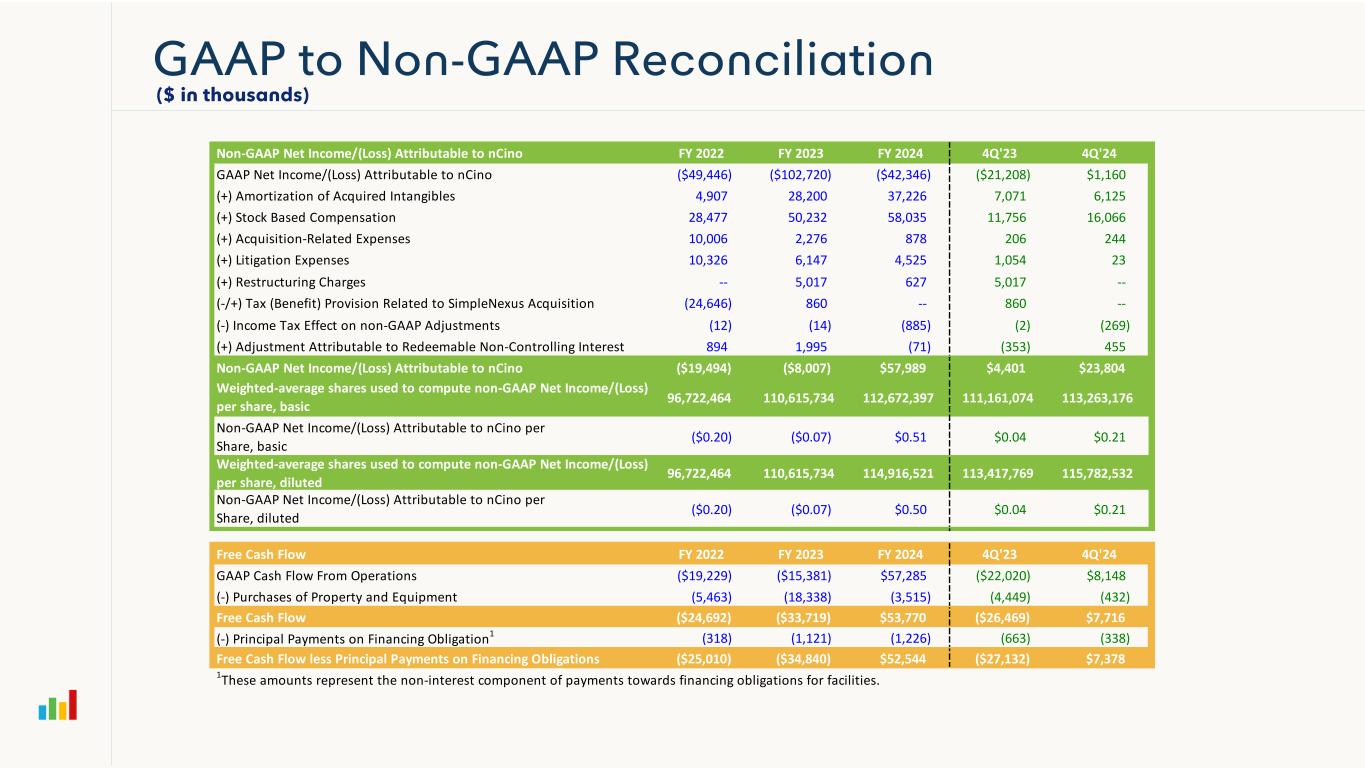
GAAP to Non-GAAP Reconciliation ($ in thousands) Non-GAAP Net Income/(Loss) Attributable to nCino FY 2022 FY 2023 FY 2024 4Q'23 4Q'24 GAAP Net Income/(Loss) Attributable to nCino ($49,446) ($102,720) ($42,346) ($21,208) $1,160 (+) Amortization of Acquired Intangibles 4,907 28,200 37,226 7,071 6,125 (+) Stock Based Compensation 28,477 50,232 58,035 11,756 16,066 (+) Acquisition-Related Expenses 10,006 2,276 878 206 244 (+) Litigation Expenses 10,326 6,147 4,525 1,054 23 (+) Restructuring Charges -- 5,017 627 5,017 -- (-/+) Tax (Benefit) Provision Related to SimpleNexus Acquisition (24,646) 860 -- 860 -- (-) Income Tax Effect on non-GAAP Adjustments (12) (14) (885) (2) (269) (+) Adjustment Attributable to Redeemable Non-Controlling Interest 894 1,995 (71) (353) 455 Non-GAAP Net Income/(Loss) Attributable to nCino ($19,494) ($8,007) $57,989 $4,401 $23,804 96,722,464 110,615,734 112,672,397 111,161,074 113,263,176 Non-GAAP Net Income/(Loss) Attributable to nCino per Share, basic ($0.20) ($0.07) $0.51 $0.04 $0.21 96,722,464 110,615,734 114,916,521 113,417,769 115,782,532 Non-GAAP Net Income/(Loss) Attributable to nCino per Share, diluted ($0.20) ($0.07) $0.50 $0.04 $0.21 Free Cash Flow FY 2022 FY 2023 FY 2024 4Q'23 4Q'24 GAAP Cash Flow From Operations ($19,229) ($15,381) $57,285 ($22,020) $8,148 (-) Purchases of Property and Equipment (5,463) (18,338) (3,515) (4,449) (432) Free Cash Flow ($24,692) ($33,719) $53,770 ($26,469) $7,716 (-) Principal Payments on Financing Obligation1 (318) (1,121) (1,226) (663) (338) Free Cash Flow less Principal Payments on Financing Obligations ($25,010) ($34,840) $52,544 ($27,132) $7,378 1These amounts represent the non-interest component of payments towards financing obligations for facilities. Weighted-average shares used to compute non-GAAP Net Income/(Loss) per share, basic Weighted-average shares used to compute non-GAAP Net Income/(Loss) per share, diluted


