|
| OMB APPROVAL |
OMB Number: 3235-0570 Expires: January 31, 2014 Estimated average burden hours per response: 20.6 |
UNITED STATES
SECURITIES AND EXCHANGE COMMISSION
Washington, D.C. 20549
FORM N-CSR
CERTIFIED SHAREHOLDER REPORT OF REGISTERED
MANAGEMENT INVESTMENT COMPANIES
Investment Company Act file number 811-01540
AIM Funds Group (Invesco Funds Group)
(Exact name of registrant as specified in charter)
11 Greenway Plaza, Suite 1000 Houston, Texas 77046
(Address of principal executive offices) (Zip code)
Philip A. Taylor 11 Greenway Plaza, Suite 1000 Houston, Texas 77046
(Name and address of agent for service)
Registrant’s telephone number, including area code: (713) 626-1919
Date of fiscal year end: 12/31
Date of reporting period: 12/31/12
| Item 1. | Reports to Stockholders. |
| | | | |
| | |
 | | Annual Report to Shareholders | | December 31, 2012 |
| | |
| | Invesco European Small Company Fund |
| | Nasdaq: A: ESMAX ¡ B: ESMBX ¡ C: ESMCX ¡ Y: ESMYX |

Letters to Shareholders
| | | | | | | | | |

Philip Taylor | | | | Dear Shareholders: This annual report contains information about your Fund and the factors that affected its performance during the reporting period. Inside, you’ll find a discussion from your portfolio managers about how they managed your Fund, performance data for your Fund, a complete list of your Fund’s investments as of the close of the reporting period and other important information. I hope you find this report of interest. The reporting period covered by this report was challenging. As the year began, investors cheered generally positive economic indicators, and markets generally rose. Soon, however, US economic data turned mixed and investors’ attention shifted to the efforts of eurozone governments to implement new policies intended to reduce debt levels, strengthen the banking system and stimulate economic growth. Later in the year, in the US, mixed economic data, | | |
competing proposals on how to reduce the federal budget deficit and a contentious presidential contest increased investor uncertainty and hindered market performance. Throughout the year, your Fund’s portfolio managers adhered to their long-term investment strategies, and later in this report they explain why your Fund performed as it did during the reporting period.
Adhering to your long-term investment plan can be difficult, particularly during periods of market volatility and economic uncertainty. That’s one reason Invesco suggests investors work with a skilled and trusted financial adviser who is familiar with their financial situation, investment goals and risk tolerance. A good financial adviser can provide insight and perspective when markets are volatile; motivation and reassurance when times are uncertain; and advice and recommendations when your financial situation or investment goals change.
Timely insight and information from many of Invesco’s investment professionals is available at our website, invesco.com/us. We offer in-depth articles, video clips and audio commentaries from many of our portfolio managers and other investment professionals on a wide range of topics of interest to investors. At invesco.com/us, you also can access information about your Invesco account at any time.
What we mean by Intentional Investing
At Invesco, all of our people and all of our resources are dedicated to helping investors achieve their financial objectives. It’s a philosophy we call Intentional Investing®, and it guides the way we:
| | n | | Manage investments – Our dedicated investment professionals search the world for the best opportunities, and each investment team follows a clear, disciplined process to build portfolios and mitigate risk. |
| | n | | Provide choices – We offer equity, fixed income, asset allocation and alternative strategies so you and your financial adviser can build an investment portfolio designed for your individual needs and goals. |
| | n | | Connect with you – We’re committed to giving you the expert insights you need to make informed investing decisions, and we are well-equipped to provide high-quality support for investors and advisers. |
Invesco believes in putting investors first, and that’s why investment management is all we do. Our sole focus on managing your money allows your financial adviser to build a portfolio of Invesco funds appropriate for your investment needs and goals now and when your circumstances change.
Have a question?
If you have a question about your account, please contact an Invesco client services representative at 800 959 4246. If you have an Invesco-related question or comment, feel free to email me directly at phil@invesco.com.
All of us at Invesco look forward to serving your investment management needs for many years to come. Thank you for investing with us.
Sincerely,

Philip Taylor
Senior Managing Director, Invesco Ltd.
2 Invesco European Small Company Fund
| | | | | | | | | |

Bruce Crockett | | | | Dear Fellow Shareholders: While short-term challenges for the financial markets regularly come and go, it’s clear that significant and longer term economic obstacles remain both here at home and abroad. There appear to be no easy solutions to many of these issues. As a result, the financial markets have had little conviction to respond to what has been slow, yet noticeable improvement in some economic benchmarks in recent months. No one likes uncertainty, especially financial markets. But even in these uncertain times, it appears that investors are still approaching the market with cautious optimism, with some taking on more risk in order to refocus on their long-term savings goals. Maybe this describes you, or perhaps you have been sitting on the sidelines thinking about getting back into the market, but are still a bit hesitant to act because of market uncertainty. | | |
Clearly, risk remains a primary focus for investors of all types. As Trustees of the Invesco Funds, one of our primary responsibilities is to ensure your fund’s adviser is cognizant of the risks in each of the funds it manages. A thoughtful risk management plan may help investors navigate through market turbulence or an economic downturn. This is why we make risk management a critical element of our annual contract renewal process, like the one we complete with Invesco every year.
To be sure, there will always be risks involved with investing, but you shouldn’t let short-term news or your emotions dictate your investments. Because no one can predict with 100% accuracy the movements of financial markets, I strongly encourage you to speak with a professional financial adviser who can assist you in building an investment portfolio that reflects your individual risk tolerance and is designed to help achieve your individual financial objectives.
You can be sure your Board remains committed to doing its part in helping you along the way. In addition to ensuring that your fund’s adviser is focused on the risks in the funds it manages, we also remain committed to managing fund costs and working with your fund’s adviser to provide a compelling and diversified product offering to potentially meet your investing goals.
In that regard, your Board approved a number of fund mergers and the launch of several new funds, including the first Invesco mutual fund available to US retail investors managed by investment professionals at Invesco Perpetual*, one of the largest independent investment managers in the UK.
Let me close by thanking Carl Frischling upon his retirement from the Invesco Funds Board for his 35 years of distinguished service and unwavering commitment to our funds’ shareholders. As always, please contact me at bruce@brucecrockett.com with any questions or concerns you may have.
On behalf of the Board, we look forward to continuing to represent your interests and serving your investment needs.
Sincerely,

Bruce L. Crockett
Independent Chair
Invesco Funds Board of Trustees
| * | Invesco Perpetual is a business name of Invesco Asset Management Limited (IAML), a registered investment adviser. IAML is a wholly owned, indirect subsidiary of Invesco Ltd. |
3 Invesco European Small Company Fund
Management’s Discussion of Fund Performance
Performance summary
For the year ended December 31, 2012, Invesco European Small Company Fund, at net asset value (NAV), delivered strong double-digit gains, outperforming its style-specific index, the MSCI Europe Small Cap Index. We believe strong stock selection and our willingness and ability to identify and purchase attractive stocks that are not followed by many analysts gave us a competitive edge over the style-specific Index.
Your Fund’s long-term performance appears later in this report.
Fund vs. Indexes
Total returns, 12/31/11 to 12/31/12, at net asset value (NAV). Performance shown does not include applicable contingent deferred sales charges (CDSC) or front-end sales charges, which would have reduced performance.
| | | | | |
| Class A Shares | | | | 31.04 | % |
| Class B Shares | | | | 30.14 | |
| Class C Shares | | | | 30.11 | |
| Class Y Shares | | | | 31.38 | |
| MSCI EAFE Index‚ (Broad Market Index) | | | | 17.32 | |
| MSCI Europe Small Cap Indexn (Style-Specific Index) | | | | 28.97 | |
| Lipper European Funds Indexn (Peer Group Index) | | | | 22.07 | |
| Source | (s): ‚Invesco, MSCI via FactSet Research Systems Inc.; nLipper Inc. |
How we invest
When selecting stocks for your Fund, we use a disciplined investment strategy that emphasizes fundamental research, supported by both quantitative analysis and portfolio construction techniques. Our EQV (earnings, quality, valuation) strategy focuses primarily on identifying quality companies that have experienced, or exhibit the potential for, accelerated or above-average earnings growth, but whose stock prices do not fully reflect these attributes.
While research responsibilities within the portfolio management team are focused by geographic region, we select investments for the Fund using a bottom-up investment approach, which means we construct the Fund primarily on a stock-by-stock basis. We focus on the strengths of individual companies rather than sectors, countries or market-cap trends.
We believe disciplined sell decisions are key to successful investing. We consider selling a stock for one of the following reasons:
| n | | A company’s fundamentals deteriorate or it posts disappointing earnings. |
| n | | A stock appears overvalued. |
| n | | A more attractive investment opportunity becomes available. |
Market conditions and your Fund
Global equity markets rebounded in the beginning of 2012 following a difficult and volatile year in 2011. Improvements in global economic indicators and continued accommodative policy measures from central banks provided support for the rally in stocks, with some of the worst performing areas of the market in recent years leading the way in the beginning of 2012.
During the year, macroeconomic concerns stemming largely from Greece and Spain eased somewhat as the pro-euro
party won the Greek elections and Spanish banks were provided a bailout of up to 100 billion euros. Eurozone leaders also took steps during their most recent summit to allow for the direct recapitalization of banks through the European Stability Mechanism (the bailout fund) and to move closer to a regional banking union. In addition, the European Central Bank (ECB) announced new measures to support eurozone economies through potentially unlimited purchases of sovereign debt, with ECB President Mario Draghi pledging to “do whatever it takes” to save the euro (although key details of the plan remain unresolved). The US Federal Reserve announced a third round of quantitative easing with a promise to continue until the labor market outlook improved materially, and the Bank of Japan took steps to increase its asset purchase program. These easing measures were well received by investors and helped to drive equity markets higher during the year.
In terms of performance during the year, the Fund delivered double-digit gains in each of its nine invested sectors. Relative and absolute performance was led by the Fund’s allocation in the materials sector, which was up almost 100% for the reporting period. Strong stock selection across this sector was the key driver of success.
A leading contributor to overall Fund performance was Koza Anadolu Metal Madencilik, a Turkish holding company whose main asset is a listed gold mining company. Koza offered a double discount last year. The underlying asset was very cheap despite excellent fundamentals and Koza was trading at a greater than 70% discount to its NAV. During the
year the gold miner did very well and the NAV discount shrunk to below 30%. We cut our position materially over the reporting period, given performance.
| | | | | |
| Portfolio Composition | | |
| By sector | | | | | |
| | | | | |
| Industrials | | | | 25.0 | % |
| Consumer Discretionary | | | | 14.4 | |
| Information Technology | | | | 11.7 | |
| Consumer Staples | | | | 9.5 | |
| Energy | | | | 6.8 | |
| Health Care | | | | 6.4 | |
| Financials | | | | 6.2 | |
| Materials | | | | 6.0 | |
| Telecommunication Services | | | | 0.5 | |
Money Market Funds Plus Other Assets Less Liabilities | | | | 13.5 | |
| | | | | |
| Top 10 Equity Holdings* | | |
| | | | | |
1. DCC PLC | | | | 3.5 | % |
2. Aryzta AG | | | | 2.6 | |
3. Prosafe S.E. | | | | 2.4 | |
4. Yazicilar Holding A.S.-Class A | | | | 2.2 | |
5. Origin Enterprises PLC | | | | 2.1 | |
6. MorphoSys AG | | | | 2.0 | |
7. United Drug PLC | | | | 1.9 | |
8. CPL Resources PLC | | | | 1.9 | |
9. Mediq N.V. | | | | 1.8 | |
10. Total Produce PLC | | | | 1.8 | |
| | | | | |
| Top Five Countries* | | |
| | | | | |
1. United Kingdom | | | | 23.8 | % |
2. Ireland | | | | 14.3 | |
3. Norway | | | | 9.9 | |
4. Germany | | | | 9.0 | |
5. France | | | | 6.8 | |
| | | | | |
| Total Net Assets | | | | $141.7 million | |
| |
| Total Number of Holdings* | | | | 71 | |
The Fund’s holdings are subject to change, and there is no assurance that the Fund will continue to hold any particular security.
*Excluding money market fund holdings.
4 Invesco European Small Company Fund
Stock selection in the health care and information technology (IT) sectors was a leading contributor as well. In the health care sector, particular strength was seen in holdings in Ireland, Germany and the Netherlands. While in the IT sector, strong results were supported by stock selection in the UK, Germany and France. Top performers included Diploma, the British supplier of specialized technical products. Diploma continued down the path of operational excellence, which throughout the year was increasingly rewarded by investors.
The Fund’s cash exposure increased over the year as we trimmed or sold out of certain holdings, taking profits. An average cash position throughout the fiscal year detracted from Fund performance as markets rebounded at the end of the year. It is important to note that we do not use cash for “top- down” tactical asset allocation purposes. Historically when the portfolio’s cash position has been higher than average, it has reflected a lack of good EQV investment opportunities in the marketplace, rather than an overall negative opinion on markets. However, concerns about further downside risk led us to be cautious investors throughout the year.
Although the Fund delivered solid gains across all invested sectors, relative results lagged across the consumer discretionary and financials sector.
Underperformance in these sectors was driven not by what the Fund owned, but more rather by what the Fund did not own.
Chemring Group, a UK-based defense manufacturer, was one of the Fund’s largest stock level detractors. Over the reporting period, Chemring Group had been approached to be taken over by a private equity company, The Carlyle Group (not a Fund holding). The Carlyle Group, however, decided against making a bid. Defense stocks have generally been under severe pressure in response to the environment of austerity and the US “fiscal cliff” debate. With Chemring Group’s new chief executive officer, the company’s share price appears to have stabilized. We continue to believe the company is attractively valued and expect it to re-rate as uncertainty relating to US and UK defense budgets is reduced and as company management cuts costs.
The Fund’s positioning is driven by our stock selection process as opposed to top-down allocation decisions. In terms of year-end sector positioning, the Fund’s largest absolute and overweight positions were in the industrials, IT and consumer discretionary sectors. The Fund’s largest underweight positions were in the financials, materials, utilities and health care sectors.
Geographically, the UK represented approximately a quarter of the Fund’s investments, with the remainder comprised of diverse exposure to smaller companies from over a dozen other countries.
We primarily focus on companies that have well-capitalized balance sheets with limited to no debt. Strong balance sheets give companies flexibility, which is always valuable but particularly so in today’s uncertain environment. As always, we have continued to emphasize strong cash flow generation and attractive valuations.
As previously mentioned, the Fund delivered double-digit returns for the year. While we are pleased to provide shareholders with this strong performance, it would be imprudent for us to suggest that such a level of performance is sustainable over the long term. With market volatility likely to continue for some time, our focus remains on ensuring that our portfolio is comprised of high-quality, reasonably valued companies capable of sustained earnings growth. We believe that this balanced EQV-focused approach may help deliver attractive returns over the long term.
We welcome new investors in the Fund and express our appreciation to all our shareholders for your continued investment in Invesco European Small Company Fund.
The views and opinions expressed in management’s discussion of Fund performance are those of Invesco Advisers, Inc. These views and opinions are subject to change at any time based on factors such as market and economic conditions. These views and opinions may not be relied upon as investment advice or recommendations, or as an offer for a particular security. The information is not a complete analysis of every aspect of any market, country, industry, security or the Fund. Statements of fact are from sources considered reliable, but Invesco Advisers, Inc. makes no representation or warranty as to their completeness or accuracy. Although historical performance is no guarantee of future results, these insights may help you understand our investment management philosophy.
See important Fund and, if applicable, index disclosures later in this report.
| | |
 | | Jason Holzer Chartered Financial Analyst, portfolio manager, is lead manager of Invesco European |
Small Company Fund. He joined Invesco in 1996. Mr. Holzer earned a BA in quantitative economics and an MS in engineering economic systems from Stanford University.
| | |
 | | Borge Endresen Chartered Financial Analyst, portfolio manager, is manager of Invesco European Small Company |
Fund. He joined Invesco in 1999. Mr. Endresen earned a BS in finance from the University of Oregon and an MBA from The University of Texas at Austin.
5 Invesco European Small Company Fund
Your Fund’s Long-Term Performance
Results of a $10,000 Investment – Oldest Share Class(es)
Fund and index data from 12/31/02
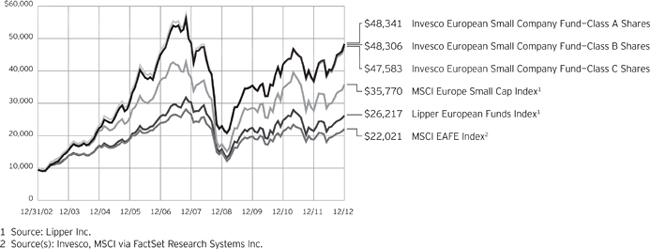
Past performance cannot guarantee comparable future results.
The data shown in the chart include reinvested distributions, applicable sales charges and Fund expenses including management fees. Results for Class B shares are calculated as if a hypothetical
shareholder had liquidated his entire investment in the Fund at the close of the reporting period and paid the contingent deferred sales charges, if applicable. Index results include reinvested dividends, but they do not reflect sales charges. Performance of the peer group,
if applicable, reflects fund expenses and management fees; performance of a market index does not. Performance shown in the chart and table(s) does not reflect deduction of taxes a shareholder would pay on Fund distributions or sale of Fund shares.
6 Invesco European Small Company Fund
| | | | | |
| Average Annual Total Returns | | |
| As of 12/31/12, including maximum applicable sales charges | | | | | |
| |
| Class A Shares | | | | | |
| Inception (8/31/00) | | | | 10.90 | % |
10 Years | | | | 17.07 | |
5 Years | | | | –1.20 | |
1 Year | | | | 23.87 | |
| |
| Class B Shares | | | | | |
| Inception (8/31/00) | | | | 10.90 | % |
10 Years | | | | 17.06 | |
5 Years | | | | –1.01 | |
1 Year | | | | 25.14 | |
| |
| Class C Shares | | | | | |
| Inception (8/31/00) | | | | 10.62 | % |
10 Years | | | | 16.88 | |
5 Years | | | | –0.81 | |
1 Year | | | | 29.11 | |
| |
| Class Y Shares | | | | | |
10 Years | | | | 17.87 | % |
5 Years | | | | 0.15 | |
1 Year | | | | 31.38 | |
Class Y shares incepted on October 3, 2008. Performance shown prior to that date is that of Class A shares and includes the 12b-1 fees applicable to Class A shares. Class A share performance reflects any applicable fee waivers or expense reimbursements.
The performance data quoted represent past performance and cannot guarantee comparable future results; current performance may be lower or higher. Please visit invesco.com/performance for the most recent month-end performance. Performance figures reflect reinvested distributions, changes in net asset value and the effect of the maximum sales charge unless otherwise stated. Investment return and principal value will fluctuate so that you may have a gain or loss when you sell shares.
The total annual Fund operating expense ratio set forth in the most recent Fund prospectus as of the date of this report for Class A, Class B, Class C and Class Y shares was 1.67%, 2.42%, 2.42% and 1.42%, respectively. The expense ratios presented above may vary from the expense ratios presented in other sections of this report that are based on expenses incurred during the period covered by this report.
Class A share performance reflects the maximum 5.50% sales charge, and Class B and Class C share performance reflects the applicable contingent deferred sales charge (CDSC) for the
period involved. The CDSC on Class B shares declines from 5% beginning at the time of purchase to 0% at the beginning of the seventh year. The CDSC on Class C shares is 1% for the first year after purchase. Class Y shares do not have a front-end sales charge or a CDSC; therefore, performance is at net asset value.
The performance of the Fund’s share classes will differ primarily due to different sales charge structures and class expenses.
Had the adviser not waived fees and/ or reimbursed expenses in the past, performance would have been lower.
continued from page 8
| | frequently and in smaller volumes, all of which may cause difficulty when establishing or closing a position at a desirable price. |
| n | | Synthetic securities risk. Fluctuations in the values of synthetic securities may not correlate perfectly with the instruments they are designed to replicate. Synthetic Securities may be subject to interest rate changes, market price fluctuations, counterparty risk and liquidity risk. |
About indexes used in this report
| n | | The MSCI EAFE® Index is an unmanaged index considered representative of stocks of Europe, Australasia and the Far East. |
| n | | The MSCI Europe Small Cap Index is an unmanaged index considered representative of small-cap European stocks. |
| n | | The Lipper European Funds Index is an unmanaged index considered representative of European funds tracked by Lipper. |
| n | | A direct investment cannot be made in an index. Unless otherwise indicated, index results include reinvested dividends, and they do not reflect sales charges. Performance of the peer group, if applicable, reflects fund expenses; performance of a market index does not. |
| n | | The Fund is not managed to track the performance of any particular index, including the index(es) defined here, and consequently, the performance of the Fund may deviate significantly from the performance of the index(es). |
Other information
| n | | The returns shown in management’s discussion of Fund performance are based on net asset values calculated for shareholder transactions. Generally accepted accounting principles require adjustments to be made to the net assets of the Fund at period end for financial reporting purposes, and as such, the net asset values for share-holder |
| | transactions and the returns based on those net asset values may differ from the net asset values and returns reported in the Financial Highlights. |
| n | | Industry classifications used in this report are generally according to the Global Industry Classification Standard, which was developed by and is the exclusive property and a service mark of MSCI Inc. and Standard & Poor’s. |
7 Invesco European Small Company Fund
Invesco European Small Company Fund’s investment objective is long-term growth of capital.
| n | | Unless otherwise stated, information presented in this report is as of December 31, 2012 ,and is based on total net assets. |
| n | | Unless otherwise noted, all data provided by Invesco. |
| n | | To access your Fund’s reports/prospectus, visit invesco.com/fundreports. |
About share classes
| n | | Class B shares may not be purchased for new or additional investments. Please see the prospectus for more information. |
| n | | Class Y shares are available to only certain investors. Please see the prospectus for more information. |
Principal risks of investing in the Fund
| n | | Derivatives risk. The performance of derivative instruments is tied to the performance of an underlying currency, security, index or other instrument. In addition to risks relating to their underlying instruments, the use of derivatives may include other, possibly greater, risks. Derivatives involve costs, may be volatile, and may involve a small initial investment relative to the risk assumed. Risks associated with the use of derivatives include counterparty, leverage, correlation, liquidity, tax, market, interest rate and management risks. Derivatives may also be more difficult to purchase, sell or value than other investments. The Fund may lose more than the cash amount invested on investments in derivatives. |
Investors should bear in mind that, while the Fund intends to use derivative strategies, it is not obligated to actively engage in these transactions, generally or in any particular kind of derivative, if the investment manager elects not to do so due to availability, cost, market conditions or other factors.
| n | | Developing/emerging markets securities risk. Securities issued by foreign companies and governments located in developing/emerging countries may be affected more negatively by inflation, devaluation of their currencies, higher transaction costs, delays in settlement, adverse political developments, the introduction of capital controls, withholding taxes, nationalization of private assets, expropriation, social unrest, war or lack of timely information than those in developed countries. |
| n | | Foreign securities risk. The Fund’s foreign investments may be affected by changes in a foreign country’s exchange rates, political and social instability, changes in economic or taxation policies, difficulties when enforcing obligations, decreased liquidity, and increased volatility. Foreign companies may be subject to less regulation resulting in less publicly available information about the companies. |
| n | | Geographic focus risk. From time to time the Fund may invest a substantial amount of its assets in securities of issuers located in a single country or a limited number of countries. If the Fund focuses its investments in this manner, it assumes the risk that economic, political and social conditions in those countries will have a significant impact on its investment performance. The Fund’s investment performance may also be more volatile if it focuses its investments in certain countries, especially emerging market countries. |
| n | | Growth investing risk. Growth stocks tend to be more expensive relative to their earnings or assets compared with other types of stock. As a result they tend to be more sensitive to changes in their earnings and can be more volatile. |
| n | | Investing in European Union risk. Many countries in the European Union are susceptible to high economic risks associated with high levels of debt, notably due to investments in sovereign debts of European countries such as Greece, Italy and Spain. One or more member states might exit the Euro-pean Union, placing its currency and banking system in jeopardy. The Euro-pean Union faces major issues involving its membership, structure, procedures and policies, including the |
adoption, abandonment or adjustment of the new constitutional treaty, the European Union’s enlargement to the south and east, and resolution of the European Union’s problematic fiscal and democratic accountability. Efforts of the member states to further unify their economic and monetary policies may increase the potential for the downward movement of one member state’s market to cause a similar effect on other member states’ markets. European countries that are part of the European Economic and Monetary Union may be significantly affected by the tight fiscal and monetary controls that the union seeks to impose on its members.
| n | | Management risk. The investment techniques and risk analysis used by the Fund’s portfolio managers may not produce the desired results. |
| n | | Market risk. The prices of and the income generated by the Fund’s securities may decline in response to, among other things, investor sentiment, general economic and market conditions, regional or global instability, and currency and interest rate fluctuations. |
| n | | Non-diversification risk. The Fund is non-diversified and can invest a greater portion of its assets in a single issuer. A change in the value of the issuer could affect the value of the Fund more than if it was a diversified fund. |
| n | | Small- and mid-capitalization risk. Stocks of small and mid-sized companies tend to be more vulnerable to adverse developments in the above factors and may have little or no operating history or track record of success, and limited product lines, markets, management and financial resources. The securities of small and mid-sized companies may be more volatile due to less market interest and less publicly available information about the issuer. They also may be illiquid or restricted as to resale, or may trade less |
continued on page 7
This report must be accompanied or preceded by a currently effective Fund prospectus, which contains more complete information, including sales charges and expenses. Investors should read it carefully before investing.
NOT FDIC INSURED | MAY LOSE VALUE | NO BANK GUARANTEE
| | | | | |
| Fund Nasdaq Symbols | | |
| Class A Shares | | | | ESMAX | |
| Class B Shares | | | | ESMBX | |
| Class C Shares | | | | ESMCX | |
| Class Y Shares | | | | ESMYX | |
8 Invesco European Small Company Fund
Schedule of Investments
December 31, 2012
| | | | | | | | |
| | | Shares | | | Value | |
Common Stocks & Other Equity Interests–86.52% | |
| Austria–0.82% | |
Semperit AG Holding | | | 28,181 | | | $ | 1,161,020 | |
|
| Belgium–2.65% | |
Kinepolis Group N.V. | | | 13,300 | | | | 1,444,115 | |
S.A. D’Ieteren N.V. | | | 30,937 | | | | 1,255,926 | |
Van De Velde N.V. | | | 23,234 | | | | 1,050,267 | |
| | | | | | | | 3,750,308 | |
|
| France–6.81% | |
Credit Agricole Ile de France | | | 10,200 | | | | 691,736 | |
Maisons France Confort | | | 35,000 | | | | 1,098,571 | |
Parrot S.A.(a) | | | 39,500 | | | | 1,470,812 | |
Plastic Omnium S.A. | | | 82,800 | | | | 2,496,849 | |
Sopra Group S.A. | | | 13,860 | | | | 891,023 | |
Tessi S.A. | | | 18,770 | | | | 1,986,440 | |
Trigano S.A.(a) | | | 75,100 | | | | 1,011,336 | |
| | | | | | | | 9,646,767 | |
|
| Germany–8.95% | |
Amadeus Fire AG | | | 32,300 | | | | 1,760,706 | |
CTS Eventim AG | | | 34,400 | | | | 1,209,346 | |
Kontron AG | | | 202,000 | | | | 1,096,458 | |
MorphoSys AG(a) | | | 75,047 | | | | 2,901,198 | |
Nemetschek AG | | | 35,400 | | | | 1,558,215 | |
Nexus AG | | | 75,000 | | | | 956,322 | |
SMT Scharf AG | | | 49,902 | | | | 1,395,724 | |
Takkt AG | | | 129,903 | | | | 1,807,779 | |
| | | | | | | | 12,685,748 | |
|
| Greece–3.08% | |
Jumbo S.A. | | | 261,216 | | | | 2,065,223 | |
Karelia Tobacco Co. Inc. S.A. | | | 5,000 | | | | 790,980 | |
Metka S.A. | | | 115,600 | | | | 1,506,606 | |
| | | | | | | | 4,362,809 | |
|
| Ireland–14.29% | |
Abbey PLC | | | 120,200 | | | | 1,006,583 | |
CPL Resources PLC | | | 582,792 | | | | 2,675,128 | |
DCC PLC | | | 154,020 | | | | 4,913,079 | |
Fyffes PLC | | | 1,970,000 | | | | 1,376,627 | |
IFG Group PLC | | | 923,500 | | | | 1,705,852 | |
Origin Enterprises PLC | | | 535,998 | | | | 2,919,780 | |
Paddy Power PLC | | | 5,077 | | | | 418,662 | |
Total Produce PLC | | | 3,158,000 | | | | 2,531,819 | |
United Drug PLC | | | 596,974 | | | | 2,704,369 | |
| | | | | | | | 20,251,899 | |
|
| Israel–1.23% | |
VIZRT Ltd. | | | 488,105 | | | | 1,747,057 | |
| | | | | | | | |
| | | Shares | | | Value | |
| Italy–2.38% | |
Danieli & C. Officine Meccaniche S.p.A.-RSP | | | 139,191 | | | $ | 2,343,951 | |
EI Towers S.p.A.(a) | | | 37,488 | | | | 1,027,208 | |
| | | | | | | | 3,371,159 | |
|
| Netherlands–2.61% | |
Mediq N.V. | | | 150,360 | | | | 2,556,673 | |
Sligro Food Group N.V. | | | 39,685 | | | | 1,142,222 | |
| | | | | | | | 3,698,895 | |
|
| Norway–9.89% | |
Bonheur ASA | | | 85,423 | | | | 2,095,376 | |
Borregaard ASA(a)(b) | | | 400,000 | | | | 1,496,457 | |
Copeinca ASA | | | 140,000 | | | | 1,032,411 | |
Ekornes ASA | | | 68,600 | | | | 1,141,318 | |
Ganger Rolf ASA | | | 75,027 | | | | 1,698,877 | |
Prosafe S.E. | | | 402,202 | | | | 3,457,909 | |
Telio Holding ASA | | | 155,000 | | | | 708,119 | |
TGS Nopec Geophysical Co. ASA | | | 72,937 | | | | 2,389,285 | |
| | | | | | | | 14,019,752 | |
|
| Spain–2.90% | |
Construcciones y Auxiliar de Ferrocarriles S.A. | | | 2,521 | | | | 1,160,846 | |
Duro Felguera, S.A. | | | 155,000 | | | | 992,001 | |
Miquel y Costas & Miquel, S.A. | | | 73,333 | | | | 1,955,066 | |
| | | | | | | | 4,107,913 | |
|
| Sweden–0.64% | |
Fenix Outdoor AB | | | 33,500 | | | | 913,998 | |
|
| Switzerland–2.58% | |
Aryzta AG | | | 71,194 | | | | 3,649,440 | |
|
| Turkey–3.93% | |
Koza Anadolu Metal Madencilik Isletmeleri A.S.(a) | | | 785,850 | | | | 2,502,620 | |
Yazicilar Holding A.S. -Class A | | | 341,421 | | | | 3,067,111 | |
| | | | | | | | 5,569,731 | |
|
| United Kingdom–23.76% | |
Amlin PLC | | | 255,057 | | | | 1,549,851 | |
Catlin Group Ltd. | | | 157,088 | | | | 1,269,885 | |
Chemring Group PLC | | | 323,585 | | | | 1,213,184 | |
Clarkson PLC | | | 117,233 | | | | 2,320,802 | |
Diploma PLC | | | 222,327 | | | | 2,003,182 | |
Filtrona PLC | | | 122,423 | | | | 1,104,695 | |
Halma PLC | | | 284,966 | | | | 2,148,207 | |
Hill & Smith Holdings PLC | | | 214,043 | | | | 1,404,903 | |
Homeserve PLC | | | 314,007 | | | | 1,185,803 | |
IG Group Holdings PLC | | | 293,351 | | | | 2,148,410 | |
Informa PLC | | | 309,868 | | | | 2,293,025 | |
Kier Group PLC | | | 114,141 | | | | 2,468,669 | |
Mears Group PLC | | | 448,962 | | | | 2,400,365 | |
See accompanying Notes to Financial Statements which are an integral part of the financial statements.
9 Invesco European Small Company Fund
| | | | | | | | |
| | | Shares | | | Value | |
| United Kingdom–(continued) | | | | | | | | |
Micro Focus International PLC | | | 197,093 | | | $ | 1,898,805 | |
Morgan Sindall Group PLC | | | 110,526 | | | | 906,272 | |
SDL PLC | | | 92,209 | | | | 753,885 | |
Tribal Group PLC | | | 1,145,117 | | | | 1,917,588 | |
Tullett Prebon PLC | | | 342,502 | | | | 1,421,478 | |
Ultra Electronics Holdings PLC | | | 92,522 | | | | 2,477,237 | |
Verips Inc.(a) | | | 198,250 | | | | 780,846 | |
| | | | | | | | 33,667,092 | |
Total Common Stocks & Other Equity Interests
(Cost $96,818,533) | | | | 122,603,588 | |
| | | | | | | | |
| | | Shares | | | Value | |
Money Market Funds–13.04% | |
Liquid Assets Portfolio–Institutional Class(c) | | | 9,234,621 | | | $ | 9,234,621 | |
Premier Portfolio–Institutional Class(c) | | | 9,234,622 | | | | 9,234,622 | |
Total Money Market Funds
(Cost $18,469,243) | | | | 18,469,243 | |
TOTAL INVESTMENTS–99.56%
(Cost $115,287,776) | | | | 141,072,831 | |
OTHER ASSETS LESS LIABILITIES–0.44% | | | | 627,051 | |
NET ASSETS–100.00% | | | $ | 141,699,882 | |
Investment Abbreviations:
Notes to Schedule of Investments:
| (a) | Non-income producing security. |
| (b) | Security purchased or received in a transaction exempt from registration under the Securities Act of 1933, as amended. The security may be resold pursuant to an exemption from registration under the 1933 Act, typically to qualified institutional buyers. The value of this security at December 31, 2012 represented 1.06% of the Fund’s Net Assets. |
| (c) | The money market fund and the Fund are affiliated by having the same investment adviser. |
See accompanying Notes to Financial Statements which are an integral part of the financial statements.
10 Invesco European Small Company Fund
Statement of Assets and Liabilities
December 31, 2012
| | | | |
Assets: | |
Investments, at value (Cost $96,818,533) | | $ | 122,603,588 | |
Investments in affiliated money market funds, at value and cost | | | 18,469,243 | |
Total investments, at value (Cost $115,287,776) | | | 141,072,831 | |
Foreign currencies, at value (Cost $68,812) | | | 68,740 | |
Receivable for: | | | | |
Investments sold | | | 58,385 | |
Fund shares sold | | | 863,026 | |
Dividends | | | 299,325 | |
Investment for trustee deferred compensation and retirement plans | | | 37,523 | |
Other assets | | | 23,292 | |
Total assets | | | 142,423,122 | |
|
Liabilities: | |
Payable for: | | | | |
Fund shares reacquired | | | 461,071 | |
Accrued fees to affiliates | | | 109,828 | |
Accrued other operating expenses | | | 79,269 | |
Trustee deferred compensation and retirement plans | | | 73,072 | |
Total liabilities | | | 723,240 | |
Net assets applicable to shares outstanding | | $ | 141,699,882 | |
|
Net assets consist of: | |
Shares of beneficial interest | | $ | 113,606,332 | |
Undistributed net investment income | | | (367,249 | ) |
Undistributed net realized gain | | | 2,671,354 | |
Unrealized appreciation | | | 25,789,445 | |
| | | $ | 141,699,882 | |
| | | | |
Net Assets: | | | | |
Class A | | $ | 91,979,581 | |
Class B | | $ | 6,737,697 | |
Class C | | $ | 15,197,539 | |
Class Y | | $ | 27,785,065 | |
|
Shares outstanding, $0.01 par value per share,
with an unlimited number of shares authorized: | |
Class A | | | 7,955,097 | |
Class B | | | 613,336 | |
Class C | | | 1,381,587 | |
Class Y | | | 2,397,488 | |
Class A: | | | | |
Net asset value per share | | $ | 11.56 | |
Maximum offering price per share | | | | |
(Net asset value of $11.56 ¸ 94.50%) | | $ | 12.23 | |
Class B: | | | | |
Net asset value and offering price per share | | $ | 10.99 | |
Class C: | | | | |
Net asset value and offering price per share | | $ | 11.00 | |
Class Y: | | | | |
Net asset value and offering price per share | | $ | 11.59 | |
See accompanying Notes to Financial Statements which are an integral part of the financial statements.
11 Invesco European Small Company Fund
Statement of Operations
For the year ended December 31, 2012
| | | | |
Investment income: | |
Dividends (net of foreign withholding taxes of $288,537) | | $ | 3,832,972 | |
Dividends from affiliated money market funds | | | 15,130 | |
Total investment income | | | 3,848,102 | |
| |
Expenses: | | | | |
Advisory fees | | | 1,105,346 | |
Administrative services fees | | | 50,000 | |
Custodian fees | | | 69,064 | |
Distribution fees: | | | | |
Class A | | | 198,418 | |
Class B | | | 77,481 | |
Class C | | | 133,664 | |
Transfer agent fees | | | 310,085 | |
Trustees’ and officers’ fees and benefits | | | 25,371 | |
Other | | | 158,062 | |
Total expenses | | | 2,127,491 | |
Less: Fees waived and expense offset arrangement(s) | | | (15,281 | ) |
Net expenses | | | 2,112,210 | |
Net investment income | | | 1,735,892 | |
| |
Realized and unrealized gain from: | | | | |
Net realized gain (loss) from: | | | | |
Investment securities | | | 7,137,861 | |
Foreign currencies | | | (111,173 | ) |
| | | | 7,026,688 | |
Change in net unrealized appreciation of: | | | | |
Investment securities | | | 23,255,325 | |
Foreign currencies | | | 9,710 | |
| | | | 23,265,035 | |
Net realized and unrealized gain | | | 30,291,723 | |
Net increase in net assets resulting from operations | | $ | 32,027,615 | |
See accompanying Notes to Financial Statements which are an integral part of the financial statements.
12 Invesco European Small Company Fund
Statement of Changes in Net Assets
For the years ended December 31, 2012 and 2011
| | | | | | | | |
| | | 2012 | | | 2011 | |
Operations: | | | | | |
Net investment income | | $ | 1,735,892 | | | $ | 2,050,848 | |
Net realized gain | | | 7,026,688 | | | | 6,672,770 | |
Change in net unrealized appreciation (depreciation) | | | 23,265,035 | | | | (25,078,057 | ) |
Net increase (decrease) in net assets resulting from operations | | | 32,027,615 | | | | (16,354,439 | ) |
| | |
Distributions to shareholders from net investment income: | | | | | | | | |
Class A | | | (1,101,980 | ) | | | (3,428,481 | ) |
Class B | | | (42,010 | ) | | | (220,923 | ) |
Class C | | | (85,920 | ) | | | (345,070 | ) |
Class Y | | | (372,285 | ) | | | (755,359 | ) |
Total distributions from net investment income | | | (1,602,195 | ) | | | (4,749,833 | ) |
| | |
Distributions to shareholders from net realized gains: | | | | | | | | |
Class A | | | (3,593,846 | ) | | | (2,395,097 | ) |
Class B | | | (306,343 | ) | | | (293,814 | ) |
Class C | | | (626,535 | ) | | | (458,929 | ) |
Class Y | | | (1,029,728 | ) | | | (492,744 | ) |
Total distributions from net realized gains | | | (5,556,452 | ) | | | (3,640,584 | ) |
| | |
Share transactions-net: | | | | | | | | |
Class A | | | 3,301,699 | | | | (11,770,053 | ) |
Class B | | | (3,123,719 | ) | | | (3,680,622 | ) |
Class C | | | (404,566 | ) | | | (3,044,912 | ) |
Class Y | | | 10,430,342 | | | | 694,009 | |
Net increase (decrease) in net assets resulting from share transactions | | | 10,203,756 | | | | (17,801,578 | ) |
Net increase (decrease) in net assets | | | 35,072,724 | | | | (42,546,434 | ) |
| | |
Net assets: | | | | | | | | |
Beginning of year | | | 106,627,158 | | | | 149,173,592 | |
End of year (includes undistributed net investment income of $(367,249) and $(1,839,963), respectively) | | $ | 141,699,882 | | | $ | 106,627,158 | |
Notes to Financial Statements
December 31, 2012
NOTE 1—Significant Accounting Policies
Invesco European Small Company Fund (the “Fund”) is a series portfolio of AIM Funds Group (Invesco Funds Group) (the “Trust”). The Trust is a Delaware statutory trust registered under the Investment Company Act of 1940, as amended (the “1940 Act”), as an open-end series management investment company consisting of four separate portfolios, each authorized to issue an unlimited number of shares of beneficial interest. The assets, liabilities and operations of each portfolio are accounted for separately. Information presented in these financial statements pertains only to the Fund. Matters affecting each portfolio or class will be voted on exclusively by the shareholders of such portfolio or class.
The Fund’s investment objective is long-term growth of capital.
The Fund currently consists of four different classes of shares: Class A, Class B, Class C and Class Y. Class A shares are sold with a front-end sales charge unless certain waiver criteria are met and under certain circumstances load waived shares may be subject to contingent deferred sales charges (“CDSC”). Class C shares are sold with a CDSC. Class Y shares are sold at net asset value. Effective November 30, 2010, new or additional investments in Class B shares are no longer permitted. Existing shareholders of Class B shares may continue to reinvest dividends and capital gains distributions in Class B shares until they convert to Class A shares. Also, shareholders in Class B shares will be able to exchange those shares for Class B shares of other Invesco Funds offering such shares until they convert to Class A shares. Generally, Class B shares will automatically convert to Class A shares on or about the month-end, which is at least eight years after the date of purchase. Redemption of Class B shares prior to the conversion date will be subject to a CDSC.
The following is a summary of the significant accounting policies followed by the Fund in the preparation of its financial statements.
| A. | Security Valuations — Securities, including restricted securities, are valued according to the following policy. |
A security listed or traded on an exchange (except convertible bonds) is valued at its last sales price or official closing price as of the close of the customary trading session on the exchange where the security is principally traded, or lacking any sales or official closing price on a particular day, the security may be valued at the closing bid price on that day. Securities traded in the over-the-counter market are valued based on prices
13 Invesco European Small Company Fund
furnished by independent pricing services or market makers. When such securities are valued by an independent pricing service they may be considered fair valued. Futures contracts are valued at the final settlement price set by an exchange on which they are principally traded. Listed options are valued at the mean between the last bid and ask prices from the exchange on which they are principally traded. Options not listed on an exchange are valued by an independent source at the mean between the last bid and ask prices. For purposes of determining net asset value per share, futures and option contracts generally are valued 15 minutes after the close of the customary trading session of the New York Stock Exchange (“NYSE”).
Investments in open-end and closed-end registered investment companies that do not trade on an exchange are valued at the end of day net asset value per share. Investments in open-end and closed-end registered investment companies that trade on an exchange are valued at the last sales price or official closing price as of the close of the customary trading session on the exchange where the security is principally traded.
Debt obligations (including convertible bonds) and unlisted equities are fair valued using an evaluated quote provided by an independent pricing service. Evaluated quotes provided by the pricing service may be determined without exclusive reliance on quoted prices, and may reflect appropriate factors such as institution-size trading in similar groups of securities, developments related to specific securities, dividend rate (for unlisted equities), yield (for debt obligations), quality, type of issue, coupon rate (for debt obligations), maturity (for debt obligations), individual trading characteristics and other market data. Debt obligations are subject to interest rate and credit risks. In addition, all debt obligations involve some risk of default with respect to interest and/or principal payments.
Foreign securities’ (including foreign exchange contracts) prices are converted into U.S. dollar amounts using the applicable exchange rates as of the close of the NYSE. If market quotations are available and reliable for foreign exchange-traded equity securities, the securities will be valued at the market quotations. Because trading hours for certain foreign securities end before the close of the NYSE, closing market quotations may become unreliable. If between the time trading ends on a particular security and the close of the customary trading session on the NYSE, events occur that the Adviser determines are significant and make the closing price unreliable, the Fund may fair value the security. If the event is likely to have affected the closing price of the security, the security will be valued at fair value in good faith using procedures approved by the Board of Trustees. Adjustments to closing prices to reflect fair value may also be based on a screening process of an independent pricing service to indicate the degree of certainty, based on historical data, that the closing price in the principal market where a foreign security trade is not the current value as of the close of the NYSE. Foreign securities’ prices meeting the approved degree of certainty that the price is not reflective of current value will be priced at the indication of fair value from the independent pricing service. Multiple factors may be considered by the independent pricing service in determining adjustments to reflect fair value and may include information relating to sector indices, American Depositary Receipts and domestic and foreign index futures. Foreign securities may have additional risks including exchange rate changes, potential for sharply devalued currencies and high inflation, political and economic upheaval, the relative lack of issuer information, relatively low market liquidity and the potential lack of strict financial and accounting controls and standards.
Securities for which market prices are not provided by any of the above methods may be valued based upon quotes furnished by independent sources. The last bid price may be used to value equity securities. The mean between the last bid and asked prices is used to value debt obligations, including corporate loans.
Securities for which market quotations are not readily available or became unreliable are valued at fair value as determined in good faith by or under the supervision of the Trust’s officers following procedures approved by the Board of Trustees. Issuer specific events, market trends, bid/ask quotes of brokers and information providers and other market data may be reviewed in the course of making a good faith determination of a security’s fair value.
Valuations change in response to many factors including the historical and prospective earnings of the issuer, the value of the issuer’s assets, general economic conditions, interest rates, investor perceptions and market liquidity. Because of the inherent uncertainties of valuation, the values reflected in the financial statements may materially differ from the value received upon actual sale of those investments.
| B. | Securities Transactions and Investment Income — Securities transactions are accounted for on a trade date basis. Realized gains or losses on sales are computed on the basis of specific identification of the securities sold. Interest income is recorded on the accrual basis from settlement date. Dividend income (net of withholding tax, if any) is recorded on the ex-dividend date. |
The Fund may periodically participate in litigation related to Fund investments. As such, the Fund may receive proceeds from litigation settlements. Any proceeds received are included in the Statement of Operations as realized gain (loss) for investments no longer held and as unrealized gain (loss) for investments still held.
Brokerage commissions and mark ups are considered transaction costs and are recorded as an increase to the cost basis of securities purchased and/or a reduction of proceeds on a sale of securities. Such transaction costs are included in the determination of net realized and unrealized gain (loss) from investment securities reported in the Statement of Operations and the Statement of Changes in Net Assets and the net realized and unrealized gains (losses) on securities per share in the Financial Highlights. Transaction costs are included in the calculation of the Fund’s net asset value and, accordingly, they reduce the Fund’s total returns. These transaction costs are not considered operating expenses and are not reflected in net investment income reported in the Statement of Operations and Statement of Changes in Net Assets, or the net investment income per share and ratios of expenses and net investment income reported in the Financial Highlights, nor are they limited by any expense limitation arrangements between the Fund and the investment adviser.
The Fund allocates income and realized and unrealized capital gains and losses to a class based on the relative net assets of each class.
| C. | Country Determination — For the purposes of making investment selection decisions and presentation in the Schedule of Investments, the investment adviser may determine the country in which an issuer is located and/or credit risk exposure based on various factors. These factors include the laws of the country under which the issuer is organized, where the issuer maintains a principal office, the country in which the issuer derives 50% or more of its total revenues and the country that has the primary market for the issuer’s securities, as well as other criteria. Among the other criteria that may be evaluated for making this determination are the country in which the issuer maintains 50% or more of its assets, the type of security, financial guarantees and enhancements, the nature of the collateral and the sponsor organization. Country of issuer and/or credit risk exposure has been determined to be the United States of America, unless otherwise noted. |
| D. | Distributions — Distributions from income and net realized capital gain, if any, are generally declared and paid annually and recorded on the ex-dividend date. The Fund may elect to treat a portion of the proceeds from redemptions as distributions for federal income tax purposes. |
14 Invesco European Small Company Fund
| E. | Federal Income Taxes — The Fund intends to comply with the requirements of Subchapter M of the Internal Revenue Code necessary to qualify as a regulated investment company and to distribute substantially all of the Fund’s taxable earnings to shareholders. As such, the Fund will not be subject to federal income taxes on otherwise taxable income (including net realized capital gain) that is distributed to shareholders. Therefore, no provision for federal income taxes is recorded in the financial statements. |
The Fund files tax returns in the U.S. Federal jurisdiction and certain other jurisdictions. Generally, the Fund is subject to examinations by such taxing authorities for up to three years after the filing of the return for the tax period.
| F. | Expenses — Fees provided for under the Rule 12b-1 plan of a particular class of the Fund and which are directly attributable to that class are charged to the operations of such class. All other expenses are allocated among the classes based on relative net assets. |
| G. | Accounting Estimates — The preparation of financial statements in conformity with accounting principles generally accepted in the United States of America (“GAAP”) requires management to make estimates and assumptions that affect the reported amounts of assets and liabilities at the date of the financial statements and the reported amounts of revenues and expenses during the reporting period including estimates and assumptions related to taxation. Actual results could differ from those estimates by a significant amount. In addition, the Fund monitors for material events or transactions that may occur or become known after the period-end date and before the date the financial statements are released to print. |
| H. | Indemnifications — Under the Trust’s organizational documents, each Trustee, officer, employee or other agent of the Trust is indemnified against certain liabilities that may arise out of the performance of their duties to the Fund. Additionally, in the normal course of business, the Fund enters into contracts, including the Fund’s servicing agreements, that contain a variety of indemnification clauses. The Fund’s maximum exposure under these arrangements is unknown as this would involve future claims that may be made against the Fund that have not yet occurred. The risk of material loss as a result of such indemnification claims is considered remote. |
| I. | Foreign Currency Translations — Foreign currency is valued at the close of the NYSE based on quotations posted by banks and major currency dealers. Portfolio securities and other assets and liabilities denominated in foreign currencies are translated into U.S. dollar amounts at date of valuation. Purchases and sales of portfolio securities (net of foreign taxes withheld on disposition) and income items denominated in foreign currencies are translated into U.S. dollar amounts on the respective dates of such transactions. The Fund does not separately account for the portion of the results of operations resulting from changes in foreign exchange rates on investments and the fluctuations arising from changes in market prices of securities held. The combined results of changes in foreign exchange rates and the fluctuation of market prices on investments (net of estimated foreign tax withholding) are included with the net realized and unrealized gain or loss from investments in the Statement of Operations. Reported net realized foreign currency gains or losses arise from (1) sales of foreign currencies, (2) currency gains or losses realized between the trade and settlement dates on securities transactions, and (3) the difference between the amounts of dividends, interest, and foreign withholding taxes recorded on the Fund’s books and the U.S. dollar equivalent of the amounts actually received or paid. Net unrealized foreign currency gains and losses arise from changes in the fair values of assets and liabilities, other than investments in securities at fiscal period end, resulting from changes in exchange rates. |
The Fund may invest in foreign securities which may be subject to foreign taxes on income, gains on investments or currency repatriation, a portion of which may be recoverable.
| J. | Foreign Currency Contracts — The Fund may enter into foreign currency contracts to manage or minimize currency or exchange rate risk. The Fund may also enter into foreign currency contracts for the purchase or sale of a security denominated in a foreign currency in order to “lock in” the U.S. dollar price of that security. A foreign currency contract is an obligation to purchase or sell a specific currency for an agreed-upon price at a future date. The use of foreign currency contracts does not eliminate fluctuations in the price of the underlying securities the Fund owns or intends to acquire but establishes a rate of exchange in advance. Fluctuations in the value of these contracts are measured by the difference in the contract date and reporting date exchange rates and are recorded as unrealized appreciation (depreciation) until the contracts are closed. When the contracts are closed, realized gains (losses) are recorded. Realized and unrealized gains (losses) on the contracts are included in the Statement of Operations. The primary risks associated with foreign currency contracts include failure of the counterparty to meet the terms of the contract and the value of the foreign currency changing unfavorably. These risks may be in excess of the amounts reflected in the Statement of Assets and Liabilities. |
NOTE 2—Advisory Fees and Other Fees Paid to Affiliates
The Trust has entered into a master investment advisory agreement with Invesco Advisers, Inc. (the “Adviser” or “Invesco”). Under the terms of the investment advisory agreement, the Fund pays an advisory fee to the Adviser based on the annual rate of the Fund’s average daily net assets as follows:
| | | | | | |
| Average Daily Net Assets | | Rate |
First $250 million | | | 0 | .935% | | |
Next $250 million | | | 0 | .91% | | |
Next $500 million | | | 0 | .885% | | |
Next $1.5 billion | | | 0 | .86% | | |
Next $2.5 billion | | | 0 | .835% | | |
Next $2.5 billion | | | 0 | .81% | | |
Next $2.5 billion | | | 0 | .785% | | |
Over $10 billion | | | 0 | .76% | | |
Under the terms of a master sub-advisory agreement between the Adviser and each of Invesco Asset Management Deutschland GmbH, Invesco Asset Management Limited, Invesco Asset Management (Japan) Limited, Invesco Australia Limited, Invesco Hong Kong Limited, Invesco Senior Secured Management, Inc. and Invesco Canada Ltd. (collectively, the “Affiliated Sub-Advisers”) the Adviser, not the Fund, may pay 40% of the fees paid to the Adviser to any such Affiliated Sub-Adviser(s) that provide discretionary investment management services to the Fund based on the percentage of assets allocated to such Sub-Adviser(s).
15 Invesco European Small Company Fund
The Adviser has contractually agreed, through at least June 30, 2013, to waive advisory fees and/or reimburse expenses of all shares to the extent necessary to limit total annual fund operating expenses after fee waiver and/or expense reimbursement (excluding certain items discussed below) of Class A, Class B, Class C and Class Y shares to 2.25%, 3.00%, 3.00% and 2.00%, respectively, of average daily net assets. In determining the Adviser’s obligation to waive advisory fees and/or reimburse expenses, the following expenses are not taken into account, and could cause the total annual fund operating expenses and/or expense reimbursement to exceed the numbers reflected above: (1) interest; (2) taxes; (3) dividend expense on short sales; (4) extraordinary or non-routine items, including litigation expenses; and (5) expenses that the Fund has incurred but did not actually pay because of an expense offset arrangement. Unless the Board of Trustees and Invesco mutually agree to amend or continue the fee waiver agreement, it will terminate on June 30, 2013. The Adviser did not waive fees and/or reimburse expenses during the period under this limitation.
Further, the Adviser has contractually agreed, through at least June 30, 2013, to waive the advisory fee payable by the Fund in an amount equal to 100% of the net advisory fees the Adviser receives from the affiliated money market funds on investments by the Fund of uninvested cash in such affiliated money market funds.
For the year ended December 31, 2012, the Adviser waived advisory fees of $14,459.
The Trust has entered into a master administrative services agreement with Invesco pursuant to which the Fund has agreed to pay Invesco for certain administrative costs incurred in providing accounting services to the Fund. For the year ended December 31, 2012, expenses incurred under the agreement are shown in the Statement of Operations as Administrative services fees.
The Trust has entered into a transfer agency and service agreement with Invesco Investment Services, Inc. (“IIS”) pursuant to which the Fund has agreed to pay IIS a fee for providing transfer agency and shareholder services to the Fund and reimburse IIS for certain expenses incurred by IIS in the course of providing such services. IIS may make payments to intermediaries that provide omnibus account services, sub-accounting services and/or networking services. All fees payable by IIS to intermediaries that provide omnibus account services or sub-accounting are charged back to the Fund, subject to certain limitations approved by the Trust’s Board of Trustees. For the year ended December 31, 2012, the expenses incurred under the agreement are shown in the Statement of Operations as Transfer agent fees.
The Trust has entered into master distribution agreements with Invesco Distributors, Inc. (“IDI”) to serve as the distributor for the Class A, Class B, Class C and Class Y shares of the Fund. The Trust has adopted plans pursuant to Rule 12b-1 under the 1940 Act with respect to the Fund’s Class A, Class B and Class C shares (collectively, the “Plans”). The Fund, pursuant to the Plans, pays IDI compensation at the annual rate of 0.25% of the Fund’s average daily net assets of Class A shares and 1.00% of the average daily net assets of each class of Class B and Class C shares. Of the Plan payments, up to 0.25% of the average daily net assets of each class of shares may be paid to furnish continuing personal shareholder services to customers who purchase and own shares of such classes. Any amounts not paid as a service fee under the Plans would constitute an asset-based sales charge. Rules of the Financial Industry Regulatory Authority (“FINRA”) impose a cap on the total sales charges, including asset-based sales charges, that may be paid by any class of shares of the Fund. For the year ended December 31, 2012, expenses incurred under the Plans are shown in the Statement of Operations as Distribution fees.
Front-end sales commissions and CDSC (collectively, the “sales charges”) are not recorded as expenses of the Fund. Front-end sales commissions are deducted from proceeds from the sales of Fund shares prior to investment in Class A shares of the Fund. CDSC are deducted from redemption proceeds prior to remittance to the shareholder. During the year ended December 31, 2012, IDI advised the Fund that IDI retained $23,813 in front-end sales commissions from the sale of Class A shares and $13, $7,979 and $1,005 from Class A, Class B and Class C shares, respectively, for CDSC imposed on redemptions by shareholders.
Certain officers and trustees of the Trust are officers and directors of the Adviser, IIS and/or IDI.
NOTE 3—Additional Valuation Information
GAAP defines fair value as the price that would be received to sell an asset or paid to transfer a liability in an orderly transaction between market participants at the measurement date, under current market conditions. GAAP establishes a hierarchy that prioritizes the inputs to valuation methods giving the highest priority to readily available unadjusted quoted prices in an active market for identical assets (Level 1) and the lowest priority to significant unobservable inputs (Level 3) generally when market prices are not readily available or are unreliable. Based on the valuation inputs, the securities or other investments are tiered into one of three levels. Changes in valuation methods may result in transfers in or out of an investment’s assigned level:
| | Level 1 — | Prices are determined using quoted prices in an active market for identical assets. |
| | Level 2 — | Prices are determined using other significant observable inputs. Observable inputs are inputs that other market participants may use in pricing a security. These may include quoted prices for similar securities, interest rates, prepayment speeds, credit risk, yield curves, loss severities, default rates, discount rates, volatilities and others. |
| | Level 3 — | Prices are determined using significant unobservable inputs. In situations where quoted prices or observable inputs are unavailable (for example, when there is little or no market activity for an investment at the end of the period), unobservable inputs may be used. Unobservable inputs reflect the Fund’s own assumptions about the factors market participants would use in determining fair value of the securities or instruments and would be based on the best available information. |
The following is a summary of the tiered valuation input levels, as of December 31, 2012. The level assigned to the securities valuations may not be an indication of the risk or liquidity associated with investing in those securities. Because of the inherent uncertainties of valuation, the values reflected in the financial statements may materially differ from the value received upon actual sale of those investments.
16 Invesco European Small Company Fund
During the year ended December 31, 2012, there were transfers from Level 1 to Level 2 of $49,081,974 and from Level 2 to Level 1 of $6,552,742, due to foreign fair value adjustments.
| | | | | | | | | | | | | | | | |
| | | Level 1 | | | Level 2 | | | Level 3 | | | Total | |
Austria | | $ | — | | | $ | 1,161,020 | | | $ | — | | | $ | 1,161,020 | |
Belgium | | | — | | | | 3,750,308 | | | | — | | | | 3,750,308 | |
France | | | 691,736 | | | | 8,955,031 | | | | — | | | | 9,646,767 | |
Germany | | | 6,967,708 | | | | 5,718,040 | | | | — | | | | 12,685,748 | |
Greece | | | 790,980 | | | | 3,571,829 | | | | — | | | | 4,362,809 | |
Ireland | | | 5,806,225 | | | | 14,445,674 | | | | — | | | | 20,251,899 | |
Israel | | | 1,747,057 | | | | — | | | | — | | | | 1,747,057 | |
Italy | | | — | | | | 3,371,159 | | | | — | | | | 3,371,159 | |
Netherlands | | | — | | | | 3,698,895 | | | | — | | | | 3,698,895 | |
Norway | | | 4,378,305 | | | | 9,641,447 | | | | — | | | | 14,019,752 | |
Spain | | | 1,160,846 | | | | 2,947,067 | | | | — | | | | 4,107,913 | |
Sweden | | | — | | | | 913,998 | | | | — | | | | 913,998 | |
Switzerland | | | — | | | | 3,649,440 | | | | — | | | | 3,649,440 | |
Turkey | | | — | | | | 5,569,731 | | | | — | | | | 5,569,731 | |
United Kingdom | | | 2,003,182 | | | | 31,663,910 | | | | — | | | | 33,667,092 | |
United States | | | 18,469,243 | | | | — | | | | — | | | | 18,469,243 | |
Total Investments | | $ | 42,015,282 | | | $ | 99,057,549 | | | $ | — | | | $ | 141,072,831 | |
NOTE 4—Expense Offset Arrangement(s)
The expense offset arrangement is comprised of transfer agency credits which result from balances in Demand Deposit Accounts (DDA) used by the transfer agent for clearing shareholder transactions. For the year ended December 31, 2012, the Fund received credits from this arrangement, which resulted in the reduction of the Fund’s total expenses of $822.
NOTE 5—Trustees’ and Officers’ Fees and Benefits
“Trustees’ and Officers’ Fees and Benefits” include amounts accrued by the Fund to pay remuneration to certain Trustees and Officers of the Fund. Trustees have the option to defer compensation payable by the Fund, and “Trustees’ and Officers’ Fees and Benefits” also include amounts accrued by the Fund to fund such deferred compensation amounts. Those Trustees who defer compensation have the option to select various Invesco Funds in which their deferral accounts shall be deemed to be invested. Finally, certain current Trustees are eligible to participate in a retirement plan that provides for benefits to be paid upon retirement to Trustees over a period of time based on the number of years of service. The Fund may have certain former Trustees who also participate in a retirement plan and receive benefits under such plan. “Trustees’ and Officers’ Fees and Benefits” include amounts accrued by the Fund to fund such retirement benefits. Obligations under the deferred compensation and retirement plans represent unsecured claims against the general assets of the Fund.
NOTE 6—Cash Balances
The Fund is permitted to temporarily carry a negative or overdrawn balance in its account with State Street Bank and Trust Company, the custodian bank. Such balances, if any at period end, are shown in the Statement of Assets and Liabilities under the payable caption Amount due custodian. To compensate the custodian bank for such overdrafts, the overdrawn Fund may either (1) leave funds as a compensating balance in the account so the custodian bank can be compensated by earning the additional interest; or (2) compensate by paying the custodian bank at a rate agreed upon by the custodian bank and Invesco, not to exceed the contractually agreed upon rate.
17 Invesco European Small Company Fund
NOTE 7—Distributions to Shareholders and Tax Components of Net Assets
Tax Character of Distributions to Shareholders Paid During the Years Ended December 31, 2012 and 2011:
| | | | | | | | |
| | | 2012 | | | 2011 | |
Ordinary income | | $ | 1,602,195 | | | $ | 4,657,531 | |
Long-term capital gain | | | 5,556,452 | | | | 3,732,886 | |
Total distributions | | $ | 7,158,647 | | | $ | 8,390,417 | |
Tax Components of Net Assets at Period-End:
| | | | |
| | | 2012 | |
Undistributed ordinary income | | $ | 434,902 | |
Undistributed long-term gain | | | 2,447,444 | |
Net unrealized appreciation — investments | | | 25,275,414 | |
Net unrealized appreciation — other investments | | | 4,390 | |
Temporary book/tax differences | | | (68,600 | ) |
Shares of beneficial interest | | | 113,606,332 | |
Total net assets | | $ | 141,699,882 | |
The difference between book-basis and tax-basis unrealized appreciation (depreciation) is due to differences in the timing of recognition of gains and losses on investments for tax and book purposes. The Fund’s net unrealized appreciation difference is attributable primarily to passive foreign investment companies.
The temporary book/tax differences are a result of timing differences between book and tax recognition of income and/or expenses. The Fund’s temporary book/tax differences are the result of the trustee deferral of compensation and retirement plan benefits.
Capital loss carryforward is calculated and reported as of a specific date. Results of transactions and other activity after that date may affect the amount of capital loss carryforward actually available for the Trust to utilize. The Regulated Investment Company Modernization Act of 2010 (the “Act”) eliminated the eight-year carryover period for capital losses that arise in taxable years beginning after its enactment date of December 22, 2010. Consequently, these capital losses can be carried forward for an unlimited period. However, capital losses with an expiration period may not be used to offset capital gains until all net capital losses without an expiration date have been utilized. Additionally, post-enactment capital loss carryovers will retain their character as either short-term or long-term capital losses instead of as short-term capital losses as under prior law. The ability to utilize capital loss carryforward in the future may be limited under the Internal Revenue Code and related regulations based on the results of future transactions.
The Fund does not have a capital loss carryforward at period-end.
NOTE 8—Investment Securities
The aggregate amount of investment securities (other than short-term securities, U.S. Treasury obligations and money market funds, if any) purchased and sold by the Fund during the year ended December 31, 2012 was $19,676,919 and $29,813,034, respectively. Cost of investments on a tax basis includes the adjustments for financial reporting purposes as of the most recently completed federal income tax reporting period-end.
| | | | |
| Unrealized Appreciation (Depreciation) of Investment Securities on a Tax Basis | |
Aggregate unrealized appreciation of investment securities | | $ | 29,071,729 | |
Aggregate unrealized (depreciation) of investment securities | | | (3,796,315 | ) |
Net unrealized appreciation of investment securities | | $ | 25,275,414 | |
Cost of investments for tax purposes is $115,797,417.
NOTE 9—Reclassification of Permanent Differences
Primarily as a result of differing book/tax treatment of passive foreign investment companies, on December 31, 2012, undistributed net investment income was increased by $1,339,017 and undistributed net realized gain was decreased by $1,339,017. This reclassification had no effect on the net assets of the Fund.
18 Invesco European Small Company Fund
NOTE 10—Share Information
| | | | | | | | | | | | | | | | |
| | | Summary of Share Activity | |
| | | Years ended December 31, | |
| | | 2012(a) | | | 2011 | |
| | | Shares | | | Amount | | | Shares | | | Amount | |
Sold: | | | | | | | | | | | | | | | | |
Class A | | | 1,871,577 | | | $ | 20,270,824 | | | | 1,433,697 | | | $ | 16,631,207 | |
Class B | | | 27,825 | | | | 286,596 | | | | 35,800 | | | | 396,711 | |
Class C | | | 231,609 | | | | 2,423,090 | | | | 216,710 | | | | 2,433,723 | |
Class Y | | | 939,806 | | | | 10,604,703 | | | | 280,074 | | | | 3,313,965 | |
| | | | |
Issued as reinvestment of dividends: | | | | | | | | | | | | | | | | |
Class A | | | 416,929 | | | | 4,623,659 | | | | 596,914 | | | | 5,724,405 | |
Class B | | | 32,080 | | | | 338,442 | | | | 54,947 | | | | 502,214 | |
Class C | | | 65,807 | | | | 694,924 | | | | 85,302 | | | | 780,512 | |
Class Y | | | 125,745 | | | | 1,398,284 | | | | 127,676 | | | | 1,225,687 | |
| | | | |
Automatic conversion of Class B shares to Class A shares: | | | | | | | | | | | | | | | | |
Class A | | | 177,683 | | | | 1,903,610 | | | | 101,806 | | | | 1,166,642 | |
Class B | | | (187,119 | ) | | | (1,903,610 | ) | | | (108,294 | ) | | | (1,166,642 | ) |
| | | | |
Reacquired(b) | | | | | | | | | | | | | | | | |
Class A | | | (2,209,577 | ) | | | (23,496,394 | ) | | | (3,130,987 | ) | | | (35,292,307 | ) |
Class B | | | (180,802 | ) | | | (1,845,147 | ) | | | (316,700 | ) | | | (3,412,905 | ) |
Class C | | | (349,838 | ) | | | (3,522,580 | ) | | | (599,088 | ) | | | (6,259,147 | ) |
Class Y | | | (148,624 | ) | | | (1,572,645 | ) | | | (365,876 | ) | | | (3,845,643 | ) |
Net increase (decrease) in share activity | | | 813,101 | | | $ | 10,203,756 | | | | (1,588,019 | ) | | $ | (17,801,578 | ) |
| (a) | There are entities that are record owners of more than 5% of the outstanding shares of the Fund and in the aggregate own 21% of the outstanding shares of the Fund. IDI has an agreement with these entities to sell Fund shares. The Fund, Invesco and/or Invesco affiliates may make payments to these entities, which are considered to be related to the Fund, for providing services to the Fund, Invesco and/or Invesco affiliates including but not limited to services such as securities brokerage, distribution, third party record keeping and account servicing. The Fund has no knowledge as to whether all or any portion of the shares owned of record by these entities are also owned beneficially. |
| (b) | Net of redemption fees of $3,685 allocated among the classes based on relative net assets of each class for the year ended December 31, 2011. |
19 Invesco European Small Company Fund
NOTE 11—Financial Highlights
The following schedule presents financial highlights for a share of the Fund outstanding throughout the periods indicated.
| | | | | | | | | | | | | | | | | | | | | | | | | | | | | | | | | | | | | | | | | | | | | | | | | | | | | | | | |
| | | Net asset
value,
beginning
of period | | | Net
investment
income(a) | | | Net gains
(losses) on securities
(both
realized and
unrealized) | | | Total from
investment
operations | | | Dividends
from net
investment
income | | | Distributions
from net
realized
gains | | | Total
distributions | | | Net asset
value, end
of period(b) | | | Total
return(c) | | | Net assets,
end of period
(000’s omitted) | | | Ratio of
expenses
to average
net assets
with fee waivers
and/or expenses
absorbed | | | Ratio of
expenses
to average net
assets without
fee waivers
and/or expenses
absorbed | | | Ratio of net
investment
income
to average
net assets | | | Portfolio
turnover(d) | |
Class A | | | | | | | | | | | | | | | | | | | | | | | | | | | | | | | | | | | | | | | | | | | | | | | | | | | | | | | | |
Year ended 12/31/12 | | $ | 9.33 | | | $ | 0.17 | | | $ | 2.70 | | | $ | 2.87 | | | $ | (0.15 | ) | | $ | (0.49 | ) | | $ | (0.64 | ) | | $ | 11.56 | | | | 31.04 | % | | $ | 91,980 | | | | 1.69 | %(e) | | | 1.70 | %(e) | | | 1.57 | %(e) | | | 18 | % |
Year ended 12/31/11 | | | 11.51 | | | | 0.18 | | | | (1.57 | ) | | | (1.39 | ) | | | (0.46 | ) | | | (0.33 | ) | | | (0.79 | ) | | | 9.33 | | | | (12.24 | ) | | | 71,829 | | | | 1.66 | | | | 1.67 | | | | 1.59 | | | | 20 | |
Year ended 12/31/10 | | | 9.88 | | | | 0.15 | | | | 1.68 | | | | 1.83 | | | | (0.20 | ) | | | — | | | | (0.20 | ) | | | 11.51 | | | | 18.55 | | | | 100,142 | | | | 1.70 | | | | 1.71 | | | | 1.42 | | | | 21 | |
Year ended 12/31/09 | | | 6.52 | | | | 0.14 | | | | 3.43 | | | | 3.57 | | | | (0.21 | ) | | | — | | | | (0.21 | ) | | | 9.88 | | | | 55.07 | | | | 109,963 | | | | 1.80 | | | | 1.81 | | | | 1.68 | | | | 43 | |
Year ended 12/31/08 | | | 22.87 | | | | 0.35 | | | | (12.60 | ) | | | (12.25 | ) | | | (0.47 | ) | | | (3.63 | ) | | | (4.10 | ) | | | 6.52 | | | | (52.80 | ) | | | 72,544 | | | | 1.63 | | | | 1.64 | | | | 1.92 | | | | 18 | |
Class B | | | | | | | | | | | | | | | | | | | | | | | | | | | | | | | | | | | | | | | | | | | | | | | | | | | | | | | | |
Year ended 12/31/12 | | | 8.89 | | | | 0.08 | | | | 2.58 | | | | 2.66 | | | | (0.07 | ) | | | (0.49 | ) | | | (0.56 | ) | | | 10.99 | | | | 30.14 | | | | 6,738 | | | | 2.44 | (e) | | | 2.45 | (e) | | | 0.82 | (e) | | | 18 | |
Year ended 12/31/11 | | | 10.85 | | | | 0.09 | | | | (1.48 | ) | | | (1.39 | ) | | | (0.24 | ) | | | (0.33 | ) | | | (0.57 | ) | | | 8.89 | | | | (12.94 | ) | | | 8,191 | | | | 2.41 | | | | 2.42 | | | | 0.84 | | | | 20 | |
Year ended 12/31/10 | | | 9.35 | | | | 0.07 | | | | 1.59 | | | | 1.66 | | | | (0.16 | ) | | | — | | | | (0.16 | ) | | | 10.85 | | | | 17.76 | | | | 13,621 | | | | 2.45 | | | | 2.46 | | | | 0.67 | | | | 21 | |
Year ended 12/31/09 | | | 6.18 | | | | 0.07 | | | | 3.23 | | | | 3.30 | | | | (0.13 | ) | | | — | | | | (0.13 | ) | | | 9.35 | | | | 53.73 | | | | 16,178 | | | | 2.55 | | | | 2.56 | | | | 0.93 | | | | 43 | |
Year ended 12/31/08 | | | 21.87 | | | | 0.20 | | | | (11.98 | ) | | | (11.78 | ) | | | (0.28 | ) | | | (3.63 | ) | | | (3.91 | ) | | | 6.18 | | | | (53.09 | ) | | | 12,541 | | | | 2.38 | | | | 2.39 | | | | 1.17 | | | | 18 | |
Class C | | | | | | | | | | | | | | | | | | | | | | | | | | | | | | | | | | | | | | | | | | | | | | | | | | | | | | | | |
Year ended 12/31/12 | | | 8.90 | | | | 0.08 | | | | 2.58 | | | | 2.66 | | | | (0.07 | ) | | | (0.49 | ) | | | (0.56 | ) | | | 11.00 | | | | 30.11 | | | | 15,198 | | | | 2.44 | (e) | | | 2.45 | (e) | | | 0.82 | (e) | | | 18 | |
Year ended 12/31/11 | | | 10.86 | | | | 0.09 | | | | (1.48 | ) | | | (1.39 | ) | | | (0.24 | ) | | | (0.33 | ) | | | (0.57 | ) | | | 8.90 | | | | (12.93 | ) | | | 12,765 | | | | 2.41 | | | | 2.42 | | | | 0.84 | | | | 20 | |
Year ended 12/31/10 | | | 9.36 | | | | 0.07 | | | | 1.59 | | | | 1.66 | | | | (0.16 | ) | | | — | | | | (0.16 | ) | | | 10.86 | | | | 17.74 | | | | 18,801 | | | | 2.45 | | | | 2.46 | | | | 0.67 | | | | 21 | |
Year ended 12/31/09 | | | 6.18 | | | | 0.07 | | | | 3.24 | | | | 3.31 | | | | (0.13 | ) | | | — | | | | (0.13 | ) | | | 9.36 | | | | 53.89 | | | | 20,556 | | | | 2.55 | | | | 2.56 | | | | 0.93 | | | | 43 | |
Year ended 12/31/08 | | | 21.88 | | | | 0.20 | | | | (11.99 | ) | | | (11.79 | ) | | | (0.28 | ) | | | (3.63 | ) | | | (3.91 | ) | | | 6.18 | | | | (53.15 | ) | | | 15,453 | | | | 2.38 | | | | 2.39 | | | | 1.17 | | | | 18 | |
Class Y | | | | | | | | | | | | | | | | | | | | | | | | | | | | | | | | | | | | | | | | | | | | | | | | | | | | | | | | |
Year ended 12/31/12 | | | 9.35 | | | | 0.20 | | | | 2.71 | | | | 2.91 | | | | (0.18 | ) | | | (0.49 | ) | | | (0.67 | ) | | | 11.59 | | | | 31.38 | | | | 27,785 | | | | 1.44 | (e) | | | 1.45 | (e) | | | 1.82 | (e) | | | 18 | |
Year ended 12/31/11 | | | 11.54 | | | | 0.21 | | | | (1.57 | ) | | | (1.36 | ) | | | (0.50 | ) | | | (0.33 | ) | | | (0.83 | ) | | | 9.35 | | | | (12.01 | ) | | | 13,842 | | | | 1.41 | | | | 1.42 | | | | 1.84 | | | | 20 | |
Year ended 12/31/10 | | | 9.90 | | | | 0.17 | | | | 1.69 | | | | 1.86 | | | | (0.22 | ) | | | — | | | | (0.22 | ) | | | 11.54 | | | | 18.89 | | | | 16,609 | | | | 1.45 | | | | 1.46 | | | | 1.67 | | | | 21 | |
Year ended 12/31/09 | | | 6.53 | | | | 0.16 | | | | 3.44 | | | | 3.60 | | | | (0.23 | ) | | | — | | | | (0.23 | ) | | | 9.90 | | | | 55.19 | | | | 12,514 | | | | 1.55 | | | | 1.56 | | | | 1.93 | | | | 43 | |
Year ended 12/31/08(f) | | | 14.54 | | | | 0.04 | | | | (3.95 | ) | | | (3.91 | ) | | | (0.47 | ) | | | (3.63 | ) | | | (4.10 | ) | | | 6.53 | | | | (25.69 | ) | | | 6,441 | | | | 1.67 | (g) | | | 1.67 | (g) | | | 1.90 | (g) | | | 18 | |
| (a) | Calculated using average shares outstanding. |
| (b) | Includes redemption fees added to shares of beneficial interest which were less than $0.005 per share for the years ended prior to January 1, 2012. |
| (c) | Includes adjustments in accordance with accounting principles generally accepted in the United States of America and as such, the net asset value for financial reporting purposes and the returns based upon those net asset values may differ from the net asset value and returns for shareholder transactions. Does not include sales charges and is not annualized for periods less than one year, if applicable. |
| (d) | Portfolio turnover is calculated at the fund level and is not annualized for periods less than one year, if applicable. |
| (e) | Ratios are based on average daily net assets (000’s) of $79,367, $7,748, $13,366 and $17,737 for Class A, Class B, Class C and Class Y shares, respectively. |
| (f) | Commencement date of October 3, 2008. |
20 Invesco European Small Company Fund
Report of Independent Registered Public Accounting Firm
To the Board of Trustees of AIM Funds Group (Invesco Funds Group)
and Shareholders of Invesco European Small Company Fund:
In our opinion, the accompanying statement of assets and liabilities, including the schedule of investments, and the related statements of operations and of changes in net assets and the financial highlights present fairly, in all material respects, the financial position of Invesco European Small Company Fund (one of the funds constituting AIM Funds Group (Invesco Funds Group), hereafter referred to as the “Fund”) at December 31, 2012, the results of its operations for the year then ended, the changes in its net assets for each of the two years in the period then ended and the financial highlights for each of the five years in the period then ended, in conformity with accounting principles generally accepted in the United States of America. These financial statements and financial highlights (hereafter referred to as “financial statements”) are the responsibility of the Fund’s management; our responsibility is to express an opinion on these financial statements based on our audits. We conducted our audits of these financial statements in accordance with the standards of the Public Company Accounting Oversight Board (United States). Those standards require that we plan and perform the audit to obtain reasonable assurance about whether the financial statements are free of material misstatement. An audit includes examining, on a test basis, evidence supporting the amounts and disclosures in the financial statements, assessing the accounting principles used and significant estimates made by management, and evaluating the overall financial statement presentation. We believe that our audits, which included confirmation of securities at December 31, 2012 by correspondence with the custodian, provide a reasonable basis for our opinion.
PRICEWATERHOUSECOOPERS LLP
February 25, 2013
Houston, Texas
21 Invesco European Small Company Fund
Calculating your ongoing Fund expenses
Example
As a shareholder of the Fund, you incur two types of costs: (1) transaction costs, which may include sales charges (loads) on purchase payments or contingent deferred sales charges on redemptions, and redemption fees, if any; and (2) ongoing costs, including management fees, distribution and/or service (12b-1) fees, and other Fund expenses. This example is intended to help you understand your ongoing costs (in dollars) of investing in the Fund and to compare these costs with ongoing costs of investing in other mutual funds. The example is based on an investment of $1,000 invested at the beginning of the period and held for the entire period July 1, 2012 through December 31, 2012.
Actual expenses
The table below provides information about actual account values and actual expenses. You may use the information in this table, together with the amount you invested, to estimate the expenses that you paid over the period. Simply divide your account value by $1,000 (for example, an $8,600 account value divided by $1,000 = 8.6), then multiply the result by the number in the table under the heading entitled “Actual Expenses Paid During Period” to estimate the expenses you paid on your account during this period.
Hypothetical example for comparison purposes
The table below also provides information about hypothetical account values and hypothetical expenses based on the Fund’s actual expense ratio and an assumed rate of return of 5% per year before expenses, which is not the Fund’s actual return.
The hypothetical account values and expenses may not be used to estimate the actual ending account balance or expenses you paid for the period. You may use this information to compare the ongoing costs of investing in the Fund and other funds. To do so, compare this 5% hypothetical example with the 5% hypothetical examples that appear in the shareholder reports of the other funds.
Please note that the expenses shown in the table are meant to highlight your ongoing costs only and do not reflect any transaction costs, such as sales charges (loads) on purchase payments, contingent deferred sales charges on redemptions, and redemption fees, if any. Therefore, the hypothetical information is useful in comparing ongoing costs only, and will not help you determine the relative total costs of owning different funds. In addition, if these transaction costs were included, your costs would have been higher.
| | | | | | | | | | | | | | | | | | | | | | | | |
| Class | | Beginning
Account Value
(07/01/12) | | | ACTUAL | | | HYPOTHETICAL (5% annual return before
expenses) | | | Annualized
Expense
Ratio | |
| | | Ending
Account Value
(12/31/12)1 | | | Expenses
Paid During
Period2 | | | Ending
Account Value
(12/31/12) | | | Expenses
Paid During Period2 | | |
A | | $ | 1,000.00 | | | $ | 1,196.30 | | | $ | 9.11 | | | $ | 1,016.84 | | | $ | 8.36 | | | | 1.65 | % |
B | | | 1,000.00 | | | | 1,192.70 | | | | 13.23 | | | | 1,013.07 | | | | 12.14 | | | | 2.40 | |
C | | | 1,000.00 | | | | 1,192.50 | | | | 13.23 | | | | 1,013.07 | | | | 12.14 | | | | 2.40 | |
Y | | | 1,000.00 | | | | 1,198.50 | | | | 7.74 | | | | 1,018.10 | | | | 7.10 | | | | 1.40 | |
| 1 | The actual ending account value is based on the actual total return of the Fund for the period July 1, 2012 through December 31, 2012, after actual expenses and will differ from the hypothetical ending account value which is based on the Fund’s expense ratio and a hypothetical annual return of 5% before expenses. |
| 2 | Expenses are equal to the Fund’s annualized expense ratio as indicated above multiplied by the average account value over the period, multiplied by 184/366 to reflect the most recent fiscal half year. |
22 Invesco European Small Company Fund
Tax Information
Form 1099-DIV, Form 1042-S and other year–end tax information provide shareholders with actual calendar year amounts that should be included in their tax returns. Shareholders should consult their tax advisors.
The following distribution information is being provided as required by the Internal Revenue Code or to meet a specific state’s requirement.
The Fund designates the following amounts or, if subsequently determined to be different, the maximum amount allowable for its fiscal year ended December 31, 2012:
| | | | |
Federal and State Income Tax | |
Long-Term Capital Gain Dividends | | $ | 5,556,452 | |
Qualified Dividend Income* | | | 100 | % |
Corporate Dividends Received Deduction* | | | 0 | % |
| | * | The above percentages are based on ordinary income dividends paid to shareholders during the Fund’s fiscal year. |
23 Invesco European Small Company Fund
Trustees and Officers
The address of each trustee and officer is AIM Funds Group (Invesco Funds Group) (the “Trust”), 11 Greenway Plaza, Suite 1000, Houston, Texas 77046-1173. The trustees serve for the life of the Trust, subject to their earlier death, incapacitation, resignation, retirement or removal as more specifically provided in the Trust’s organizational documents. Each officer serves for a one year term or until their successors are elected and qualified. Column two below includes length of time served with predecessor entities, if any.
| | | | | | | | |
Name, Year of Birth and
Position(s) Held with the Trust | | Trustee and/
or Officer Since | | Principal Occupation(s)
During Past 5 Years | | Number of
Funds in Fund
Complex
Overseen by
Trustee | | Other Directorship(s)
Held by Trustee During
Past 5 Years |
| Interested Persons | | | | | | | | |
| Martin L. Flanagan1 — 1960 Trustee | | 2007 | | Executive Director, Chief Executive Officer and President, Invesco Ltd. (ultimate parent of Invesco and a global investment management firm); Advisor to the Board, Invesco Advisers, Inc. (formerly known as Invesco Institutional (N.A.), Inc.); Trustee, The Invesco Funds; Vice Chair, Investment Company Institute; and Member of Executive Board, SMU Cox School of Business Formerly: Chairman and Chief Executive Officer, Invesco Advisers, Inc. (registered investment adviser); Director, Chairman, Chief Executive Officer and President, IVZ Inc. (holding company), INVESCO Group Services, Inc. (service provider) and Invesco North American Holdings, Inc. (holding company); Director, Chief Executive Officer and President, Invesco Holding Company Limited (parent of Invesco and a global investment management firm); Director, Invesco Ltd.; Chairman, Investment Company Institute and President, Co-Chief Executive Officer, Co-President, Chief Operating Officer and Chief Financial Officer, Franklin Resources, Inc. (global investment management organization) | | 124 | | None |
| Philip A. Taylor2 — 1954 Trustee, President and Principal Executive Officer | | 2006 | | Head of North American Retail and Senior Managing Director, Invesco Ltd.; Director, Co-Chairman, Co-President and Co-Chief Executive Officer, Invesco Advisers, Inc. (formerly known as Invesco Institutional (N.A.), Inc.) (registered investment adviser); Director, Chairman, Chief Executive Officer and President, Invesco Management Group, Inc. (formerly known as Invesco Aim Management Group, Inc.) (financial services holding company); Director and President, INVESCO Funds Group, Inc. (registered investment adviser and registered transfer agent); Director and Chairman, Invesco Investment Services, Inc. (formerly known as Invesco Aim Investment Services, Inc.) (registered transfer agent) and IVZ Distributors, Inc. (formerly known as INVESCO Distributors, Inc.) (registered broker dealer); Director, President and Chairman, Invesco Inc. (holding company) and Invesco Canada Holdings Inc. (holding company); Chief Executive Officer, Invesco Corporate Class Inc. (corporate mutual fund company) and Invesco Canada Fund Inc. (corporate mutual fund company); Director, Chairman and Chief Executive Officer, Invesco Canada Ltd. (formerly known as Invesco Trimark Ltd./Invesco Trimark Ltèe) (registered investment adviser and registered transfer agent); Trustee, President and Principal Executive Officer, The Invesco Funds (other than AIM Treasurer’s Series Trust (Invesco Treasurer’s Series Trust) and Short-Term Investments Trust); Trustee and Executive Vice President, The Invesco Funds (AIM Treasurer’s Series Trust (Invesco Treasurer’s Series Trust) and Short-Term Investments Trust only); Director, Invesco Investment Advisers LLC (formerly known as Van Kampen Asset Management); Director, Chief Executive Officer and President, Van Kampen Exchange Corp. Formerly: Director and Chairman, Van Kampen Investor Services Inc.: Director, Chief Executive Officer and President, 1371 Preferred Inc. (holding company); and Van Kampen Investments Inc.; Director and President, AIM GP Canada Inc. (general partner for limited partnerships); and Van Kampen Advisors, Inc.; Director and Chief Executive Officer, Invesco Trimark Dealer Inc. (registered broker dealer); Director, Invesco Distributors, Inc. (formerly known as Invesco Aim Distributors, Inc.) (registered broker dealer); Manager, Invesco PowerShares Capital Management LLC; Director, Chief Executive Officer and President, Invesco Advisers, Inc.; Director, Chairman, Chief Executive Officer and President, Invesco Aim Capital Management, Inc.; President, Invesco Trimark Dealer Inc. and Invesco Trimark Ltd./Invesco Trimark Ltèe; Director and President, AIM Trimark Corporate Class Inc. and AIM Trimark Canada Fund Inc.; Senior Managing Director, Invesco Holding Company Limited; Trustee and Executive Vice President, Tax-Free Investments Trust; Director and Chairman, Fund Management Company (former registered broker dealer); President and Principal Executive Officer, The Invesco Funds (AIM Treasurer’s Series Trust (Invesco Treasurer’s Series Trust), Short-Term Investments Trust and Tax-Free Investments Trust only); President, AIM Trimark Global Fund Inc. and AIM Trimark Canada Fund Inc. | | 124 | | None |
Wayne W. Whalen3 — 1939 Trustee | | 2010 | | Of Counsel, and prior to 2010, partner in the law firm of Skadden, Arps, Slate, Meagher & Flom LLP, legal counsel to certain funds in the Fund Complex | | 137 | | Director of the Mutual Fund Directors Forum, a nonprofit membership organization for investment directors; Chairman and Director of the Abraham Lincoln Presidential Library Foundation; and Director of the Stevenson Center for Democracy |
| 1 | Mr. Flanagan is considered an interested person of the Trust because he is an officer of the adviser to the Trust, and an officer and a director of Invesco Ltd., ultimate parent of the adviser to the Trust. |
| 2 | Mr. Taylor is considered an interested person of the Trust because he is an officer and a director of the adviser to, and a director of the principal underwriter of, the Trust. |
| 3 | Mr. Whalen is considered an “interested person” (within the meaning of Section 2(a)(19) of the 1940 Act) of certain Funds in the Invesco Fund Complex by reason of he and his firm currently providing legal services as legal counsel to such Funds in the Invesco Fund Complex. |
T-1 Invesco European Small Company Fund
Trustees and Officers—(continued)
| | | | | | | | |
Name, Year of Birth and
Position(s) Held with the Trust | | Trustee and/
or Officer Since | | Principal Occupation(s)
During Past 5 Years | | Number of
Funds in Fund
Complex
Overseen by
Trustee | | Other Directorship(s)
Held by Trustee During
Past 5 Years |
| Independent Trustees | | | | | | | | |
Bruce L. Crockett — 1944 Trustee and Chair | | 1987 | | Chairman, Crockett Technologies Associates (technology consulting company) Formerly: Director, Captaris (unified messaging provider); Director, President and Chief Executive Officer COMSAT Corporation; and Chairman, Board of Governors of INTELSAT (international communications company) | | 124 | | ACE Limited (insurance company); and Investment Company Institute |
David C. Arch — 1945 Trustee | | 2010 | | Chairman and Chief Executive Officer of Blistex Inc., (consumer health care products manufacturer) Formerly: Member of the Heartland Alliance Advisory Board, a nonprofit organization serving human needs based in Chicago | | 137 | | Board member of the Illinois Manufacturers’ Association; Member of the Board of Visitors, Institute for the Humanities, University of Michigan |
Frank S. Bayley — 1939 Trustee | | 2001 | | Retired Formerly: Director, Badgley Funds, Inc. (registered investment company) (2 portfolios) and General Partner and Of Counsel, law firm of Baker & McKenzie, LLP | | 124 | | Director and Chairman, C.D. Stimson Company (a real estate investment company); Trustee and Overseer, The Curtis institute of Music |
James T. Bunch — 1942 Trustee | | 2003 | | Managing Member, Grumman Hill Group LLC (family office private equity management) Formerly: Founder, Green, Manning & Bunch Ltd. (investment banking firm)(1988-2010); Executive Committee, United States Golf Association; and Director, Policy Studies, Inc. and Van Gilder Insurance Corporation | | 124 | | Chairman, Board of Governors, Western Golf Association; Chairman-elect, Evans Scholars Foundation; and Director, Denver Film Society |
Rodney F. Dammeyer — 1940 Trustee | | 2010 | | Chairman of CAC, LLC, (private company offering capital investment and management advisory services) Formerly: Prior to 2001, Managing Partner at Equity Group Corporate Investments; Prior to 1995, Vice Chairman of Anixter International; Prior to 1985, experience includes Senior Vice President and Chief Financial Officer of Household International, Inc., Executive Vice President and Chief Financial Officer of Northwest Industries, Inc. and Partner of Arthur Andersen & Co.; From 1987 to 2010, Director/Trustee of investment companies in the Van Kampen Funds complex | | 126 | | Director of Quidel Corporation and Stericycle, Inc.; Prior to May 2008, Trustee of The Scripps Research Institute; Prior to February 2008, Director of Ventana Medical Systems, Inc.; Prior to April 2007, Director of GATX Corporation; Prior to April 2004, Director of TheraSense, Inc. |
Albert R. Dowden — 1941 Trustee | | 2000 | | Director of a number of public and private business corporations, including the Boss Group, Ltd. (private investment and management); Reich & Tang Funds (5 portfolios) (registered investment company); and Homeowners of America Holding Corporation/ Homeowners of America Insurance Company (property casualty company) Formerly: Director, Continental Energy Services, LLC (oil and gas pipeline service); Director, CompuDyne Corporation (provider of product and services to the public security market) and Director, Annuity and Life Re (Holdings), Ltd. (reinsurance company); Director, President and Chief Executive Officer, Volvo Group North America, Inc.; Senior Vice President, AB Volvo; Director of various public and private corporations; Chairman, DHJ Media, Inc.; Director Magellan Insurance Company; and Director, The Hertz Corporation, Genmar Corporation (boat manufacturer), National Media Corporation; Advisory Board of Rotary Power International (designer, manufacturer, and seller of rotary power engines); and Chairman, Cortland Trust, Inc. (registered investment company) | | 124 | | Director of Nature’s Sunshine Products, Inc. |
Jack M. Fields — 1952 Trustee | | 1997 | | Chief Executive Officer, Twenty First Century Group, Inc. (government affairs company); Owner and Chief Executive Officer, Dos Angeles Ranch, L.P. (cattle, hunting, corporate entertainment); and Discovery Global Education Fund (non-profit) Formerly: Chief Executive Officer, Texana Timber LP (sustainable forestry company); Director of Cross Timbers Quail Research Ranch (non-profit); and member of the U.S. House of Representatives | | 124 | | Insperity, Inc. (formerly known as Administaff) |
Prema Mathai-Davis — 1950 Trustee | | 1998 | | Retired Formerly: Chief Executive Officer, YWCA of the U.S.A. | | 124 | | None |
Larry Soll — 1942 Trustee | | 2003 | | Retired Formerly: Chairman, Chief Executive Officer and President, Synergen Corp. (a biotechnology company) | | 124 | | None |
Hugo F. Sonnenschein — 1940 Trustee | | 2010 | | Distinguished Service Professor and President Emeritus of the University of Chicago and the Adam Smith Distinguished Service Professor in the Department of Economics at the University of Chicago Formerly: President of the University of Chicago | | 137 | | Trustee of the University of Rochester and a member of its investment committee. Member of the National Academy of Sciences, the American Philosophical Society and a fellow of the American Academy of Arts and Sciences |
T-2 Invesco European Small Company Fund
Trustees and Officers—(continued)
| | | | | | | | |
Name, Year of Birth and
Position(s) Held with the Trust | | Trustee and/
or Officer Since | | Principal Occupation(s)
During Past 5 Years | | Number of
Funds in Fund
Complex
Overseen by
Trustee | | Other Directorship(s)
Held by Trustee During
Past 5 Years |
| Independent Trustees—(continued) |
Raymond Stickel, Jr. — 1944 Trustee | | 2005 | | Retired Formerly: Director, Mainstay VP Series Funds, Inc. (25 portfolios) and Partner, Deloitte & Touche | | 124 | | None |
| Other Officers | | | | | | | | |
Russell C. Burk — 1958
Senior Vice President and Senior Officer | | 2005 | | Senior Vice President and Senior Officer, The Invesco Funds | | N/A | | N/A |
John M. Zerr — 1962
Senior Vice President, Chief Legal Officer and Secretary | | 2006 | | Director, Senior Vice President, Secretary and General Counsel, Invesco Management Group, Inc. (formerly known as Invesco Aim Management Group, Inc.) and Van Kampen Exchange Corp.; Senior Vice President, Invesco Advisers, Inc. (formerly known as Invesco Institutional (N.A.), Inc.) (registered investment adviser); Senior Vice President and Secretary, Invesco Distributors, Inc. (formerly known as Invesco Aim Distributors, Inc.); Director, Vice President and Secretary, Invesco Investment Services, Inc. (formerly known as Invesco Aim Investment Services, Inc.) and IVZ Distributors, Inc. (formerly known as INVESCO Distributors, Inc.); Director and Vice President, INVESCO Funds Group, Inc.; Senior Vice President, Chief Legal Officer and Secretary, The Invesco Funds; Manager, Invesco PowerShares Capital Management LLC; Director, Secretary and General Counsel, Invesco Investment Advisers LLC (formerly known as Van Kampen Asset Management); Secretary and General Counsel, Van Kampen Funds Inc. and Chief Legal Officer, PowerShares Exchange-Traded Fund Trust, PowerShares Exchange-Traded Fund Trust II, PowerShares India Exchange-Traded Fund Trust and PowerShares Actively Managed Exchange-Traded Fund Trust Formerly: Director and Vice President, Van Kampen Advisors Inc.; Director, Vice President, Secretary and General Counsel Van Kampen Investor Services Inc.; Director, Invesco Distributors, Inc. (formerly known as Invesco Aim Distributors, Inc.); Director, Senior Vice President, General Counsel and Secretary, Invesco Advisers, Inc. and Van Kampen Investments Inc.; Director, Vice President and Secretary, Fund Management Company; Director, Senior Vice President, Secretary, General Counsel and Vice President, Invesco Aim Capital Management, Inc.; Chief Operating Officer and General Counsel, Liberty Ridge Capital, Inc. (an investment adviser); Vice President and Secretary, PBHG Funds (an investment company) and PBHG Insurance Series Fund (an investment company); Chief Operating Officer, General Counsel and Secretary, Old Mutual Investment Partners (a broker-dealer); General Counsel and Secretary, Old Mutual Fund Services (an administrator) and Old Mutual Shareholder Services (a shareholder servicing center); Executive Vice President, General Counsel and Secretary, Old Mutual Capital, Inc. (an investment adviser); and Vice President and Secretary, Old Mutual Advisors Funds (an investment company) | | N/A | | N/A |
Karen Dunn Kelley — 1960
Vice President | | 1992 | | Head of Invesco’s World Wide Fixed Income and Cash Management Group; Senior Vice President, Invesco Management Group, Inc. (formerly known as Invesco Aim Management Group, Inc.) and Invesco Advisers, Inc. (formerly known as Invesco Institutional (N.A.), Inc.) (registered investment adviser); Executive Vice President, Invesco Distributors, Inc. (formerly known as Invesco Aim Distributors, Inc.); Director, Invesco Mortgage Capital Inc., INVESCO Global Asset Management Limited, Invesco Management Company Limited and INVESCO Management S.A.; Vice President, The Invesco Funds (other than AIM Treasurer’s Series Trust (Invesco Treasurer’s Series Trust) and Short-Term Investments Trust); and President and Principal Executive Officer, The Invesco Funds (AIM Treasurer’s Series Trust (Invesco Treasurer’s Series Trust) and Short-Term Investments Trust only) Formerly: Senior Vice President, Van Kampen Investments Inc.; Vice President, Invesco Advisers, Inc. (formerly known as Invesco Institutional (N.A.), Inc.); Director of Cash Management and Senior Vice President, Invesco Advisers, Inc. and Invesco Aim Capital Management, Inc.; President and Principal Executive Officer, Tax-Free Investments Trust; Director and President, Fund Management Company; Chief Cash Management Officer, Director of Cash Management, Senior Vice President, and Managing Director, Invesco Aim Capital Management, Inc.; Director of Cash Management, Senior Vice President, and Vice President, Invesco Advisers, Inc. and The Invesco Funds (AIM Treasurer’s Series Trust (Invesco Treasurer’s Series Trust), Short-Term Investments Trust and Tax-Free Investments Trust only) | | N/A | | N/A |
T-3 Invesco European Small Company Fund
Trustees and Officers—(continued)
| | | | | | | | |
Name, Year of Birth and
Position(s) Held with the Trust | | Trustee and/
or Officer Since | | Principal Occupation(s)
During Past 5 Years | | Number of
Funds in Fund
Complex
Overseen by
Trustee | | Other Directorship(s)
Held by Trustee During
Past 5 Years |
| Other Officers—(continued) | | | | | | | | |
Sheri Morris — 1964
Vice President, Treasurer and Principal Financial Officer | | 1999 | | Vice President, Treasurer and Principal Financial Officer, The Invesco Funds; Vice President, Invesco Advisers, Inc. (formerly known as Invesco Institutional (N.A.), Inc.) (registered investment adviser); and Vice President, PowerShares Exchange-Traded Fund Trust, PowerShares Exchange-Traded Fund Trust II, PowerShares India Exchange-Traded Fund Trust and PowerShares Actively Managed Exchange-Traded Fund Trust Formerly: Vice President, Invesco Aim Advisers, Inc., Invesco Aim Capital Management, Inc. and Invesco Aim Private Asset Management, Inc.; Assistant Vice President and Assistant Treasurer, The Invesco Funds and Assistant Vice President, Invesco Advisers, Inc., Invesco Aim Capital Management, Inc. and Invesco Aim Private Asset Management, Inc.; and Treasurer, PowerShares Exchange-Traded Fund Trust, PowerShares Exchange-Traded Fund Trust II, PowerShares India Exchange-Traded Fund Trust and PowerShares Actively Managed Exchange-Traded Fund Trust | | N/A | | N/A |
Yinka Akinsola — 1977 Anti-Money Laundering Compliance Officer | | 2011 | | Anti-Money Laundering Compliance Officer, Invesco Advisers, Inc. (formerly known as Invesco Institutional (N.A.), Inc.) (registered investment adviser); Invesco Distributors, Inc. (formerly known as Invesco Aim Distributors, Inc.), Invesco Investment Services, Inc. (formerly known as Invesco Aim Investment Services, Inc.), Invesco Management Group, Inc., The Invesco Funds, Invesco Van Kampen Closed-End Funds, Van Kampen Exchange Corp., Van Kampen Funds Inc., PowerShares Exchange-Traded Fund Trust, PowerShares Exchange-Traded Fund Trust II, PowerShares India Exchange-Traded Fund Trust, and PowerShares Actively Managed Exchange-Traded Fund Trust Formerly: Regulatory Analyst III, Financial Industry Regulatory Authority (FINRA) | | N/A | | N/A |
Todd L. Spillane — 1958
Chief Compliance Officer | | 2006 | | Senior Vice President, Invesco Management Group, Inc. (formerly known as Invesco Aim Management Group, Inc.) and Van Kampen Exchange Corp.; Senior Vice President and Chief Compliance Officer, Invesco Advisers, Inc. (registered investment adviser) (formerly known as Invesco Institutional (N.A.), Inc.); Chief Compliance Officer, The Invesco Funds; Vice President, Invesco Distributors, Inc. (formerly known as Invesco Aim Distributors, Inc.) and Invesco Investment Services, Inc. (formerly known as Invesco Aim Investment Services, Inc.) Formerly: Chief Compliance Officer, Invesco Van Kampen Closed-End Funds; Senior Vice President, Van Kampen Investments Inc.; Senior Vice President and Chief Compliance Officer, Invesco Aim Advisers, Inc. and Invesco Aim Capital Management, Inc.; Chief Compliance Officer, INVESCO Private Capital Investments, Inc. (holding company), Invesco Private Capital, Inc. (registered investment adviser), Invesco Global Asset Management (N.A.), Inc., Invesco Senior Secured Management, Inc. (registered investment adviser), Van Kampen Investor Services Inc., PowerShares Exchange-Traded Fund Trust, PowerShares Exchange-Traded Fund Trust II, PowerShares India Exchange-Traded Fund Trust and PowerShares Actively Managed Exchange-Traded Fund Trust; and Vice President, Invesco Aim Capital Management, Inc. and Fund Management Company | | N/A | | N/A |
The Statement of Additional Information of the Trust includes additional information about the Fund’s Trustees and is available upon request, without charge, by calling 1.800.959.4246. Please refer to the Fund’s prospectus for information on the Fund’s sub-advisers.
| | | | | | |
Office of the Fund 11 Greenway Plaza, Suite 1000 Houston, TX 77046-1173 | | Investment Adviser Invesco Advisers, Inc. 1555 Peachtree Street, N.E.
Atlanta, GA 30309 | | Distributor Invesco Distributors, Inc. 11 Greenway Plaza, Suite 1000 Houston, TX 77046-1173 | | Auditors PricewaterhouseCoopers LLP 1201 Louisiana Street, Suite 2900 Houston, TX 77002-5678 |
| | | |
| | | | | | |
Counsel to the Fund Stradley Ronon Stevens & Young, LLP 2005 Market Street, Suite 2600 Philadelphia, PA 19103-7018 | | Counsel to the Independent Trustees Goodwin Procter LLP
901 New York Avenue, N.W.
Washington, D.C. 20001 | | Transfer Agent Invesco Investment Services, Inc. 11 Greenway Plaza, Suite 1000 Houston, TX 77046-1173 | | Custodian State Street Bank and Trust Company 225 Franklin Street
Boston, MA 02110-2801 |
T-4 Invesco European Small Company Fund

Invesco mailing information
Send general correspondence to Invesco Investment Services, Inc., P.O. Box 219078, Kansas City, MO 64121-9078.
Invesco privacy policy
You share personal and financial information with us that is necessary for your transactions and your account records. We take very seriously the obligation to keep that information confidential and private.
Invesco collects nonpublic personal information about you from account applications or other forms you complete and from your transactions with us or our affiliates. We do not disclose information about you or our former customers to service providers or other third parties except to the extent necessary to service your account and in other limited circumstances as permitted by law. For example, we use this information to facilitate the delivery of transaction confirmations, financial reports, prospectuses and tax forms.
Even within Invesco, only people involved in the servicing of your accounts and compliance monitoring have access to your information. To ensure the highest level of confidentiality and security, Invesco maintains physical, electronic and procedural safeguards that meet or exceed federal standards. Special measures, such as data encryption and authentication, apply to your communications with us on our website. More detail is available to you at invesco.com/privacy.
Important notice regarding delivery of security holder documents
To reduce Fund expenses, only one copy of most shareholder documents may be mailed to shareholders with multiple accounts at the same address (Householding). Mailing of your shareholder documents may be householded indefinitely unless you instruct us otherwise. If you do not want the mailing of these documents to be combined with those for other members of your household, please contact Invesco Investment Services, Inc. at 800 959 4246 or contact your financial institution. We will begin sending you individual copies for each account within 30 days after receiving your request.
Fund holdings and proxy voting information
The Fund provides a complete list of its holdings four times in each fiscal year, at the quarter-ends. For the second and fourth quarters, the lists appear in the Fund’s semiannual and annual reports to shareholders. For the first and third quarters, the Fund files the lists with the Securities and Exchange Commission (SEC) on Form N-Q. The most recent list of portfolio holdings is available at invesco.com/completeqtrholdings. Shareholders can also look up the Fund’s Forms N-Q on the SEC website at sec.gov. Copies of the Fund’s Forms N-Q may be reviewed and copied at the SEC Public Reference Room in Washington, D.C. You can obtain information on the operation of the Public Reference Room, including information about duplicating fee charges, by calling 202 551 8090 or 800 732 0330, or by electronic request at the following email address: publicinfo@sec.gov. The SEC file numbers for the Fund are shown below.
A description of the policies and procedures that the Fund uses to determine how to vote proxies relating to portfolio securities is available without charge, upon request, from our Client Services department at 800 959 4246 or at invesco.com/proxyguidelines. The information is also available on the SEC website, sec.gov.
| | |
Information regarding how the Fund voted proxies related to its portfolio securities during the 12 months ended June 30, 2012, is available at invesco.com/proxysearch. The information is also available on the SEC website, sec.gov. Invesco Advisers, Inc. is an investment adviser; it provides investment advisory services to individual and institutional clients and does not sell securities. Invesco Distributors, Inc. is the US distributor for Invesco Ltd.’s retail mutual funds, exchange-traded funds and institutional money market funds. Both are wholly owned, indirect subsidiaries of Invesco Ltd. | |  |
| |
| SEC file numbers: 811-01540 and 002-27334 ESC-AR-1 Invesco Distributors, Inc. | | |
| | | | |
 | | Annual Report to Shareholders | | December 31, 2012 |
| | |
| | Invesco Global Core Equity Fund |
| | | | |
| | Nasdaq: A: AWSAX ¡ B: AWSBX ¡ C: AWSCX ¡ R: AWSRX ¡ Y: AWSYX ¡ R5: AWSIX |

Letters to Shareholders
| | | | | | | | | |

Philip Taylor | | | | Dear Shareholders: This annual report contains information about your Fund and the factors that affected its performance during the reporting period. Inside, you’ll find a discussion from your portfolio managers about how they managed your Fund, performance data for your Fund, a complete list of your Fund’s investments as of the close of the reporting period and other important information. I hope you find this report of interest. The reporting period covered by this report was challenging. As the year began, investors cheered generally positive economic indicators, and markets generally rose. Soon, however, US economic data turned mixed and investor’s attention shifted to the efforts of eurozone governments to implement new policies intended to reduce debt levels, strengthen the banking system and stimulate economic growth. Later in the year, in the US, mixed economic data, | | |
competing proposals on how to reduce the federal budget deficit and a contentious presidential contest increased investor uncertainty and hindered market performance. Throughout the year, your Fund’s portfolio managers adhered to their long-term investment strategies, and later in this report they explain why your Fund performed as it did during the reporting period.
Adhering to your long-term investment plan can be difficult, particularly during periods of market volatility and economic uncertainty. That’s one reason Invesco suggests investors work with a skilled and trusted financial adviser who is familiar with their financial situation, investment goals and risk tolerance. A good financial adviser can provide insight and perspective when markets are volatile; motivation and reassurance when times are uncertain; and advice and recommendations when your financial situation or investment goals change.
Timely insight and information from many of Invesco’s investment professionals is available at our website, invesco.com/us. We offer in-depth articles, video clips and audio commentaries from many of our portfolio managers and other investment professionals on a wide range of topics of interest to investors. At invesco.com/us, you also can access information about your Invesco account at any time.
What we mean by Intentional Investing
At Invesco, all of our people and all of our resources are dedicated to helping investors achieve their financial objectives. It’s a philosophy we call Intentional Investing®, and it guides the way we:
| | n | | Manage investments – Our dedicated investment professionals search the world for the best opportunities, and each investment team follows a clear, disciplined process to build portfolios and mitigate risk. |
| | n | | Provide choices – We offer equity, fixed income, asset allocation and alternative strategies so you and your financial adviser can build an investment portfolio designed for your individual needs and goals. |
| | n | | Connect with you – We’re committed to giving you the expert insights you need to make informed investing decisions, and we are well-equipped to provide high-quality support for investors and advisers. |
Invesco believes in putting investors first, and that’s why investment management is all we do. Our sole focus on managing your money allows your financial adviser to build a portfolio of Invesco funds appropriate for your investment needs and goals now and when your circumstances change.
Have a question?
If you have a question about your account, please contact an Invesco client services representative at 800 959 4246. If you have an Invesco-related question or comment, feel free to email me directly at phil@invesco.com.
All of us at Invesco look forward to serving your investment management needs for many years to come. Thank you for investing with us.
Sincerely,

Philip Taylor
Senior Managing Director, Invesco Ltd.
2 Invesco Global Core Equity Fund
| | | | | | | | | |

Bruce Crockett | | | | Dear Fellow Shareholders: While short-term challenges for the financial markets regularly come and go, it’s clear that significant and longer term economic obstacles remain both here at home and abroad. There appear to be no easy solutions to many of these issues. As a result, the financial markets have had little conviction to respond to what has been slow, yet noticeable improvement in some economic benchmarks in recent months. No one likes uncertainty, especially financial markets. But even in these uncertain times, it appears that investors are still approaching the market with cautious optimism, with some taking on more risk in order to refocus on their long-term savings goals. | | |
Maybe this describes you, or perhaps you have been sitting on the sidelines thinking about getting back into the market, but are still a bit hesitant to act because of market uncertainty. Clearly, risk remains a primary focus for investors of all types. As Trustees of the Invesco Funds, one of our primary responsibilities is to ensure your fund’s adviser is cognizant of the risks in each of the funds it manages. A thoughtful risk management plan may help investors navigate through market turbulence or an economic downturn. This is why we make risk management a critical element of our annual contract renewal process, like the one we complete with Invesco every year.
To be sure, there will always be risks involved with investing, but you shouldn’t let short-term news or your emotions dictate your investments. Because no one can predict with 100% accuracy the movements of financial markets, I strongly encourage you to speak with a professional financial adviser who can assist you in building an investment portfolio that reflects your individual risk tolerance and is designed to help achieve your individual financial objectives.
You can be sure your Board remains committed to doing its part in helping you along the way. In addition to ensuring that your fund’s adviser is focused on the risks in the funds it manages, we also remain committed to managing fund costs and working with your fund’s adviser to provide a compelling and diversified product offering to potentially meet your investing goals.
In that regard, your Board approved a number of fund mergers and the launch of several new funds, including the first Invesco mutual fund available to US retail investors managed by investment professionals at Invesco Perpetual*, one of the largest independent investment managers in the UK.
Let me close by thanking Carl Frischling upon his retirement from the Invesco Funds Board for his 35 years of distinguished service and unwavering commitment to our fund’s shareholders. As always, please contact me at bruce@brucecrockett.com with any questions or concerns you may have.
On behalf of the Board, we look forward to continuing to represent your interests and serving your investment needs.
Sincerely,

Bruce L. Crockett
Independent Chair
Invesco Funds Board of Trustees
| * | Invesco Perpetual is a business name of Invesco Asset Management Limited (IAML), a registered investment adviser. IAML is a wholly owned, indirect subsidiary of Invesco Ltd. |
3 Invesco Global Core Equity Fund
Management’s Discussion of Fund Performance
Performance summary
For the year ended December 31, 2012, Invesco Global Core Equity Fund underperformed the MSCI World Index and the Lipper Global Large-Cap Core Funds Index. Stock selection during the volatile fiscal year was a hindrance to the Fund’s performance. Stock selection within the energy, financials and utilities sectors contributed positively to Fund performance, while holdings in the consumer discretionary, consumer staples, industrials, health care and information technology (IT) sectors detracted during the reporting period.
Your Fund’s long-term performance appears later in this report.
Fund vs. Indexes
Total returns, 12/31/11 to 12/31/12, at net asset value (NAV). Performance shown does not include applicable contingent deferred sales charges (CDSC) or front-end sales charges, which would have reduced performance.
| | | | | |
| Class A Shares | | | | 13.22 | % |
| Class B Shares | | | | 12.94 | |
| Class C Shares | | | | 12.40 | |
| Class R Shares | | | | 12.98 | |
| Class Y Shares | | | | 13.53 | |
| Class R5 Shares* | | | | 13.59 | |
| MSCI World Index‚ (Broad Market/Style-Specific Index) | | | | 15.83 | |
| Lipper Global Large-Cap Core Funds Indexn (Peer Group Index) | | | | 18.64 | |
Source(s): ‚Invesco, MSCI via FactSet Research Systems Inc.; nLipper Inc.
| * | Effective September 24, 2012, Institutional Class shares were renamed Class R5 shares. |
How we invest
The Fund invests primarily in stocks of mid- and large-cap global companies with a record of stable earnings and strong balance sheets that are offering attractive valuations relative to the broad market and peers. We take a bottom-up, research driven approach. We begin with a universe of global equity securities with greater than $1 billion in market capitalization and up to 10 years of financial statement information from both developed and emerging markets. We make adjustments to each company’s financial history for inflation rates and select accounting conventions to create a comparable basis for analysis. We then rank the universe using a proprietary three-factor valuation ranking model that combines a company’s implied return, price/book ratio and price/earnings ratio.
Attractively ranked companies are then subjected to rigorous fundamental research focused on evaluating the sustainability of company profitability. The most attractive stocks from the valuation screen that have also successfully passed rigorous fundamental research are candidates for inclusion in the portfolio.
At the portfolio level, we seek to achieve appropriate diversification relative to the style-specific index and take a long-term investment horizon in evaluating companies, resulting in relatively low portfolio turnover. We strive to maintain a consistent investment discipline through varying market conditions and an appropriate level of overall portfolio diversification. Individual holdings are selected based on their own merits, however, and not on projections of country or sector performance.
Our sell discipline is a replication of the security selection process in that we look to trim or liquidate positions in the portfolio based on valuation, fundamentals or portfolio design considerations.
Market conditions and your Fund
Global equity markets rebounded in the beginning of 2012 following a difficult and volatile year in 2011. Improvements in global economic indicators and continued accommodative policy measures from central banks provided support for the rally in stocks, with some of the worst performing areas of the market in recent years leading the way in the beginning of 2012. During the year, macroeconomic concerns stemming largely from Greece and Spain eased somewhat as the pro-euro party won the Greek elections and Spanish banks were provided a bailout of up to 100 billion euros. Eurozone leaders also took steps during their most recent summit to allow for the direct recapitalization of banks through the European Stability Mechanism (the bailout fund) and to move closer to a regional banking union. In addition, the European Central Bank (ECB) announced new measures to support eurozone economies through potentially unlimited purchases of sovereign debt, with ECB President Mario Draghi pledging to “do whatever it takes” to save the euro (although key details of the plan remain unresolved). The US Federal Reserve announced a third round of quantitative easing with a promise to continue until the labor market outlook improved materially, and the Bank of Japan took steps to increase its asset purchase program. These easing measures were well received by investors and helped to drive equity markets higher during the year.
The Fund stayed true to its process and benefited from its quality orientation in stock selection. During the year, select
| | | | | |
| Portfolio Composition |
| By sector | |
|
| |
| Financials | | | | 20.6 | % |
| Information Technology | | | | 13.4 | |
| Energy | | | | 13.0 | |
| Health Care | | | | 9.7 | |
| Industrials | | | | 9.2 | |
| Materials | | | | 8.4 | |
| Consumer Discretionary | | | | 8.3 | |
| Consumer Staples | | | | 7.6 | |
| Telecommunication Services | | | | 5.3 | |
| Utilities | | | | 2.9 | |
| Money Market Funds Plus Other Assets Less Liabilities | | | | 1.6 | |
| | | | | |
Top 10 Equity Holdings* | |
| | | | | |
| 1. Corning Inc. | | | | 3.1 | % |
| 2. Western Digital Corp. | | | | 2.6 | |
| 3. ACE Ltd. | | | | 2.4 | |
| 4. Chevron Corp. | | | | 2.2 | |
| 5. Asahi Group Holdings, Ltd. | | | | 2.0 | |
| 6. Barclays PLC | | | | 1.9 | |
| 7. Imperial Tobacco Group PLC | | | | 1.9 | |
| 8. DeNA Co., Ltd. | | | | 1.8 | |
| 9. JPMorgan Chase & Co. | | | | 1.8 | |
| 10. Cisco Systems, Inc. | | | | 1.8 | |
| | | | | |
| Total Net Assets | | | | $1.2 billion | |
| |
| Total Number of Holdings* | | | | 119 | |
The Fund’s holdings are subject to change, and there is no assurance that the Fund will continue to hold any particular security.
*Excluding money market fund holdings.
4 Invesco Global Core Equity Fund
holdings in the energy, financials and utilities sectors contributed to Fund performance. In the energy sector, one of the leading performers was Valero Energy, a US-based petroleum refining company.
Also contributing to Fund performance was consumer discretionary sector holding Porsche. The German luxury manufacturer was the top contributor for the fourth quarter and a main contributor for the fiscal year. The company’s strong performance came on the back of its progress in a longstanding ownership saga with Volkswagen (not a Fund holding), positive legal rulings mitigating outstanding litigation expense risks and strong performance of Volkswagen shares of which Porsche owns a significant stake. We believe the stock remains undervalued with excess litigation risk priced in, despite the positive legal rulings.
From a geographic perspective, Fund returns were aided by holdings in Australia, Canada and Germany.
The largest detractors from Fund performance came from the consumer discretionary, consumer staples, industrials, health care and IT sectors. Within the IT sector, Hewlett Packard was one of the largest detractors for the year. The company struggled due to a year of management upheavals and disappointing earnings, mostly tied to its writing down approximately $8.8 billion of its acquisition of Autonomy (not a Fund holding).
Geographically, the UK and Japan were the weakest performing markets for the Fund, accounting for the majority of the underperformance for the year. Japan-based Yamada Denki and Nippon Telegraph and Telephone were some of the Fund’s larger detractors for the year. Holdings in Spain also weighed on Fund returns.
Shifts in sector and country weights, which are driven by our bottom-up stock selection approach, were relatively minor during the year. At the end of the reporting period, the Fund remained overweight in the energy and materials sectors, and underweight in the consumer discretionary, consumer staples and industrials sectors.
From a geographic perspective, the Fund maintained an overweight exposure to Japan and a meaningful underweight position in the US – positions that were in place throughout 2012. The Fund’s underweight position in the US was a detractor from Fund performance for the year relative to its style-specific benchmark.
Global markets ended 2012 on a strong note, with the MSCI World Index generating positive returns in six of the last seven months of the year.1 Accommodative monetary policy from global central banks is likely to continue, and market valuations remain attractive from a historic perspective. That said, underlying issues plaguing markets over the past several years such as high sovereign debt levels across the developed markets (particularly within Europe) have not been resolved, and could continue to weigh on global economic growth and add to market volatility.
Regardless of the macroeconomic environment, the Fund’s bottom-up approach to stock selection continues to provide us with attractive investment opportunities. Our focus on building portfolios with above-average profitability and valuation characteristics has not generated satisfactory returns for the full year, but we are encouraged by progress in the third and fourth quarters and continue to believe we are positioned well for the long term. We caution investors against making investment decisions based on short-term performance.
We welcome any new investors who joined the Fund during the year, and to all of our shareholders we say thank you for your continued investment in Invesco Global Core Equity Fund.
| 1 | Source: Invesco, MSCI via FactSet Research Systems Inc. |
The views and opinions expressed in management’s discussion of Fund performance are those of Invesco Advisers, Inc. These views and opinions are subject to change at any time based on factors such as market and economic conditions. These views and opinions may not be relied upon as investment advice or recommendations, or as an offer for a particular security. The information is not a complete analysis of every aspect of any market, country, industry, security or the Fund. Statements of fact are from sources considered reliable, but Invesco Advisers, Inc. makes no representation or warranty as to their completeness or accuracy. Although historical performance is no guarantee of future results, these insights may help you understand our investment management philosophy.
See important Fund and, if applicable, index disclosures later in this report.
| | |
 | | Ingrid Baker Chartered Financial Analyst, portfolio manager, is manager of Invesco Global Core Equity Fund. |
| She joined Invesco in 1999. Ms. Baker earned a BA in international politics from Oberlin College and an MBA in finance from the University of Navarra. |
| | |
 | | W. Lindsay Davidson Portfolio manager, is manager of Invesco Global Core Equity Fund. He joined Invesco in 1984. |
| Mr. Davidson earned an economics degree from Edinburgh University. |
| | |
 | | E. Sargent McGowan Chartered Financial Analyst, portfolio manager, is manager of Invesco Global Core Equity Fund. |
| He joined Invesco in 2002. Mr. McGowan earned a BS in commerce from the University of Virginia and an MBA in investment management from the University of North Carolina. |
| | |
 | | Anuja Singha Chartered Financial Analyst, portfolio manager, is manager of Invesco Global Core Equity Fund. |
| She joined Invesco in 1998. Ms. Singha earned a BA in economics from Mills College and a PhD in economics from Emory University. |
| | |
 | | Stephen Thomas Chartered Financial Analyst, portfolio manager, is manager of Invesco Global Core Equity Fund. |
| He joined Invesco in 2000. Mr. Thomas earned a BBA in banking and finance and an MBA from the University of Mississippi. |
5 Invesco Global Core Equity Fund
Your Fund’s Long-Term Performance
Results of a $10,000 Investment – Oldest Share Class(es)
Fund and index data from 12/31/02
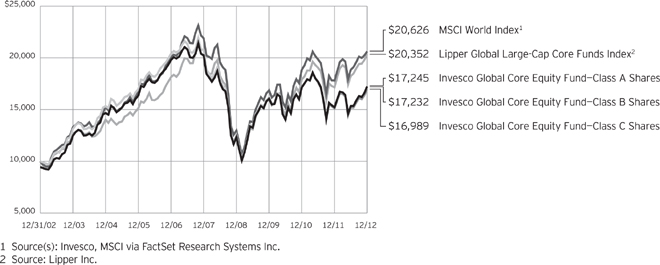
Past performance cannot guarantee comparable future results.
The data shown in the chart include reinvested distributions, applicable sales charges and Fund expenses including management fees. Results for Class B shares are calculated as if a hypothetical
shareholder had liquidated his entire investment in the Fund at the close of the reporting period and paid the contingent deferred sales charges, if applicable. Index results include reinvested dividends, but they do not reflect sales charges. Performance of the peer group,
if applicable, reflects fund expenses and management fees; performance of a market index does not. Performance shown in the chart and table(s) does not reflect deduction of taxes a shareholder would pay on Fund distributions or sale of Fund shares.
6 Invesco Global Core Equity Fund
| | | | | |
| Average Annual Total Returns |
| As of 12/31/12, including maximum applicable sales charges | |
| |
| Class A Shares | | | | | |
| Inception (12/29/00) | | | | 3.79 | % |
10 Years | | | | 5.60 | |
5 Years | | | | -4.25 | |
1 Year | | | | 6.98 | |
| |
| Class B Shares | | | | | |
| Inception (12/29/00) | | | | 3.80 | % |
10 Years | | | | 5.59 | |
5 Years | | | | -4.11 | |
1 Year | | | | 7.94 | |
| |
| Class C Shares | | | | | |
| Inception (12/29/00) | | | | 3.54 | % |
10 Years | | | | 5.44 | |
5 Years | | | | -3.88 | |
1 Year | | | | 11.40 | |
| |
| Class R Shares | | | | | |
10 Years | | | | 5.94 | % |
5 Years | | | | -3.40 | |
1 Year | | | | 12.98 | |
| |
| Class Y Shares | | | | | |
10 Years | | | | 6.30 | % |
5 Years | | | | -2.97 | |
1 Year | | | | 13.53 | |
| |
| Class R5 Shares | | | | | |
10 Years | | | | 6.60 | % |
5 Years | | | | -2.65 | |
1 Year | | | | 13.59 | |
Class R shares incepted on May 23, 2011. Performance shown prior to that date is that of Class A shares and includes the 12b-1 fees applicable to Class A shares. Class A share performance reflects any applicable fee waivers or expense reimbursements.
Class Y shares incepted on October 3, 2008. Performance shown prior to that date is that of Class A shares and includes the 12b-1 fees applicable to Class A shares. Class A share performance reflects any applicable fee waivers or expense reimbursements.
Class R5 shares incepted on October 25, 2005. Performance shown prior to that date is that of Class A shares and includes the 12b-1 fees applicable to Class A shares. Class A share performance reflects any applicable fee waivers or expense reimbursements.
The performance data quoted represent past performance and cannot guarantee comparable future results; current performance may be lower or higher. Please visit invesco.com/performance for the most recent month-end performance. Performance figures reflect reinvested distributions, changes in net asset value and the effect of the maximum sales charge unless otherwise stated. Investment return and principal value will fluctuate so that you may have a gain or loss when you sell shares.
The net annual Fund operating expense ratio set forth in the most recent Fund prospectus as of the date of this report for Class A, Class B, Class C, Class R, Class Y and Class R5 shares was 1.27%, 1.54%, 2.02%, 1.52%, 1.02% and 0.98%, respectively.1,2 The total annual Fund operating expense ratio set forth in the most recent Fund prospectus as of the date of this report for Class A, Class B, Class C, Class R, Class Y and Class R5 shares was 1.37%, 2.12%,
2.12%, 1.62%, 1.12% and 0.98%, respectively. The expense ratios presented above may vary from the expense ratios presented in other sections of this report that are based on expenses incurred during the period covered by this report.
Class A share performance reflects the maximum 5.50% sales charge, and Class B and Class C share performance reflects the applicable contingent deferred sales charge (CDSC) for the period involved. The CDSC on Class B shares declines from 5% beginning at
the time of purchase to 0% at the beginning of the seventh year. The CDSC on Class C shares is 1% for the first year after purchase. Class R, Class Y and Class R5 shares do not have a front-end sales charge or a CDSC; therefore, performance is at net asset value.
The performance of the Fund’s share classes will differ primarily due to different sales charge structures and class expenses.
Had the adviser not waived fees and/ or reimbursed expenses in the past for Class A, Class C, Class R, Class Y and Class R5 shares, performance would have been lower.
Had the adviser not waived fees and/or reimbursed expenses on Class B shares, performance would have been lower.
| 1 | Total annual Fund operating expenses after any contractual fee waivers and/or expense reimbursements by the adviser in effect through at least June 30, 2013. See current prospectus for more information. |
| 2 | Total annual Fund operating expenses after any contractual fee waivers by the distributor in effect through at least June 30, 2013. See current prospectus for more information. |
7 Invesco Global Core Equity Fund
Invesco Global Core Equity Fund’s investment objective is long-term growth of capital.
| n | | Unless otherwise stated, information presented in this report is as of December 31, 2012, and is based on total net assets. |
| n | | Unless otherwise noted, all data provided by Invesco. |
| n | | To access your Fund’s reports/prospectus, visit invesco.com/fundreports. |
About share classes
| n | | Class B shares may not be purchased for new or additional investments. Please see the prospectus for more information. |
| n | | Class R shares are generally available only to employer sponsored retirement and benefit plans. Please see the prospectus for more information. |
| n | | Class Y shares are available only to certain investors. Please see the prospectus for more information. |
| n | | Class R5 shares are primarily intended for employer sponsored retirement and benefit plans that meet certain standards and for institutional investors. On September 24, 2012, Institutional Class shares were renamed Class R5 shares. Please see the prospectus for more information. |
Principal risks of investing in the Fund
| n | | Developing/emerging markets securities risk. Securities issued by foreign companies and governments located in developing/emerging countries may be affected more negatively by inflation, devaluation of their currencies, higher transaction costs, delays in settlement, adverse political developments, the introduction of capital controls, withholding taxes, nationalization of private assets, expropriation, social unrest, war or lack of timely information than those in developed countries. |
| n | | Foreign securities risk. The Fund’s foreign investments may be affected by changes in a foreign country’s exchange rates, political and social instability, changes in economic or taxation policies, difficulties when enforcing obligations, decreased liquidity, and increased volatility. Foreign companies may be subject to less regulation resulting in less publicly available information about the companies. |
| n | | Geographic focus risk. From time to time the Fund may invest a substantial amount of its assets in securities of issuers located in a single country or a |
| | | limited number of countries. If the Fund focuses its investments in this manner, it assumes the risk that economic, political and social conditions in those countries will have a significant impact on its investment performance. The Fund’s investment performance may also be more volatile if it focuses its investments in certain countries, especially emerging market countries. |
| n | | Investing in the European Union risk. Many countries in the European Union are susceptible to high economic risks associa |
| n | | ted with high levels of debt, notably due to investments in sovereign debts of European countries such as Greece, Italy and Spain. One or more member states might exit the European Union, placing its currency and banking system in jeopardy. The European Union faces major issues involving its membership, structure, procedures and policies, including the adoption, abandonment or adjustment of the new constitutional treaty, the European Union’s enlargement to the south and east, and resolution of the European Union’s problematic fiscal and democratic accountability. Efforts of the member states to further unify their economic and monetary policies may increase the potential for the downward movement of one member state’s market to cause a similar effect on other member states’ markets. European countries that are part of the European Economic and Monetary Union may be significantly affected by the tight fiscal and monetary controls that the union seeks to impose on its members. |
| n | | Management risk. The investment techniques and risk analysis used by the Fund’s portfolio managers may not produce the desired results. |
| n | | Market risk. The prices of and the income generated by the Fund’s securities may decline in response to, among other things, investor sentiment, general economic and market conditions, regional or global instability, and currency and interest rate fluctuations. |
| n | | Synthetic securities risk. Fluctuations in the values of synthetic securities |
| | | may not correlate perfectly with the instruments they are designed to replicate. Synthetic securities may be subject to interest rate changes, market price fluctuations, counterparty risk and liquidity risk. |
About indexes used in this report
| n | | The MSCI World IndexSM is an unmanaged index considered representative of stocks of developed countries. |
| n | | The Lipper Global Large-Cap Core Funds Index is an unmanaged index considered representative of global large-cap core funds tracked by Lipper. |
| n | | The Fund is not managed to track the performance of any particular index, including the index(es) defined here, and consequently, the performance of the Fund may deviate significantly from the performance of the index(es). |
| n | | A direct investment cannot be made in an index. Unless otherwise indicated, index results include reinvested dividends, and they do not reflect sales charges. Performance of the peer group, if applicable, reflects fund expenses; performance of a market index does not. |
Other information
| n | | The returns shown in management’s discussion of Fund performance are based on net asset values calculated for shareholder transactions. Generally accepted accounting principles require adjustments to be made to the net assets of the Fund at period end for financial reporting purposes, and as such, the net asset values for shareholder transactions and the returns based on those net asset values may differ from the net asset values and returns reported in the Financial Highlights. |
| n | | Industry classifications used in this report are generally according to the Global Industry Classification Standard, which was developed by and is the exclusive property and a service mark of MSCI Inc. and Standard & Poor’s. |
This report must be accompanied or preceded by a currently effective Fund prospectus, which contains more complete information, including sales charges and expenses. Investors should read it carefully before investing.
NOT FDIC INSURED | MAY LOSE VALUE | NO BANK GUARANTEE
| | | | | |
Fund Nasdaq Symbols |
| Class A Shares | | | | AWSAX | |
| Class B Shares | | | | AWSBX | |
| Class C Shares | | | | AWSCX | |
| Class R Shares | | | | AWSRX | |
| Class Y Shares | | | | AWSYX | |
| Class R5 Shares | | | | AWSIX | |
8 Invesco Global Core Equity Fund
Schedule of Investments
December 31, 2012
| | | | | | | | |
| | | Shares | | | Value | |
Common Stocks & Other Equity Interests–98.41% | |
| Australia–5.13% | |
Australia & New Zealand Banking Group Ltd. | | | 451,118 | | | $ | 11,823,757 | |
BHP Billiton Ltd. | | | 501,875 | | | | 19,621,487 | |
Macquarie Group Ltd. | | | 463,394 | | | | 17,252,932 | |
Telstra Corp. Ltd. | | | 3,353,025 | | | | 15,291,644 | |
| | | | | | | | 63,989,820 | |
|
| Brazil–0.88% | |
Banco do Brasil S.A. | | | 133,300 | | | | 1,697,118 | |
Companhia Paranaense de Energia–Copel–Class B Preference Shares | | | 109,400 | | | | 1,682,018 | |
PDG Realty S.A. Empreendimentos e Participacoes | | | 542,900 | | | | 895,722 | |
Petroleo Brasileiro S.A.–ADR | | | 129,896 | | | | 2,529,075 | |
Telefonica Brasil S.A.–Preference Shares | | | 69,100 | | | | 1,663,019 | |
Vale S.A.–ADR | | | 120,265 | | | | 2,520,754 | |
| | | | | | | | 10,987,706 | |
|
| Canada–2.35% | |
Barrick Gold Corp. | | | 467,774 | | | | 16,407,667 | |
Toronto-Dominion Bank (The) | | | 153,081 | | | | 12,914,812 | |
| | | | | | | | 29,322,479 | |
|
| China–1.27% | |
China Agri-Industries Holdings Ltd. | | | 2,210,000 | | | | 1,242,913 | |
China Communications Construction Co. Ltd.–Class H | | | 2,036,000 | | | | 1,999,431 | |
China Construction Bank Corp.–Class H | | | 3,146,196 | | | | 2,564,345 | |
China Minsheng Banking Corp., Ltd.–Class H | | | 1,470,500 | | | | 1,738,672 | |
China Mobile Ltd. | | | 339,500 | | | | 3,977,135 | |
CNOOC Ltd. | | | 1,316,575 | | | | 2,891,083 | |
KWG Property Holding Ltd. | | | 1,793,000 | | | | 1,359,631 | |
| | | | | | | | 15,773,210 | |
|
| France–6.33% | |
BNP Paribas S.A. | | | 302,493 | | | | 17,043,555 | |
Bouygues S.A. | | | 455,274 | | | | 13,418,851 | |
Sanofi | | | 171,344 | | | | 16,242,664 | |
Total S.A. | | | 352,363 | | | | 18,229,833 | |
Vallourec S.A. | | | 269,478 | | | | 14,040,641 | |
| | | | | | | | 78,975,544 | |
|
| Germany–3.97% | |
Deutsche Lufthansa AG | | | 882,310 | | | | 16,577,066 | |
Porsche Automobil Holding SE–Preference Shares | | | 270,078 | | | | 21,998,525 | |
Salzgitter AG | | | 209,813 | | | | 10,928,867 | |
| | | | | | | | 49,504,458 | |
|
| Hong Kong–2.48% | |
Cheung Kong (Holdings) Ltd. | | | 763,000 | | | | 11,811,213 | |
First Pacific Co. Ltd. | | | 792,000 | | | | 874,482 | |
Standard Chartered PLC | | | 720,691 | | | | 18,273,618 | |
| | | | | | | | 30,959,313 | |
|
| India–0.61% | |
Canara Bank Ltd. | | | 221,137 | | | | 2,011,660 | |
Grasim Industries Ltd. | | | 29,800 | | | | 1,721,232 | |
| | | | | | | | |
| | | Shares | | | Value | |
| India–(continued) | |
Oil and Natural Gas Corp. Ltd. | | | 315,366 | | | $ | 1,556,172 | |
Tata Motors Ltd. | | | 406,499 | | | | 2,319,701 | |
| | | | | | | | 7,608,765 | |
|
| Indonesia–0.12% | |
PT Telekomunikasi Indonesia Persero Tbk | | | 1,573,500 | | | | 1,457,001 | |
|
| Ireland–0.00% | |
Irish Bank Resolution Corp. Ltd.(a) | | | 102,453 | | | | 0 | |
|
| Italy–1.03% | |
Eni S.p.A. | | | 522,924 | | | | 12,894,912 | |
|
| Japan–12.10% | |
Asahi Group Holdings, Ltd. | | | 1,148,800 | | | | 24,326,750 | |
DeNA Co., Ltd.(b) | | | 691,900 | | | | 22,720,107 | |
JSR Corp. | | | 635,700 | | | | 11,993,678 | |
Mitsubishi Corp. | | | 608,531 | | | | 11,681,505 | |
Mitsubishi UFJ Financial Group, Inc. | | | 2,872,131 | | | | 15,434,849 | |
Nippon Telegraph & Telephone Corp. | | | 342,000 | | | | 14,347,085 | |
Nippon Yusen Kabushiki Kaisha | | | 3,899,000 | | | | 9,164,057 | |
Nissan Motor Co., Ltd(b) | | | 2,006,504 | | | | 19,019,381 | |
Seven & I Holdings Co., Ltd. | | | 383,200 | | | | 10,764,938 | |
Yamada Denki Co., Ltd.(b) | | | 297,040 | | | | 11,439,516 | |
| | | | | | | | 150,891,866 | |
|
| Mexico–0.18% | |
America Movil S.A.B. de C.V.–Series L | | | 1,937,000 | | | | 2,243,548 | |
|
| Norway–2.30% | |
Statoil A.S.A. | | | 439,075 | | | | 11,014,121 | |
Yara International A.S.A. | | | 355,548 | | | | 17,641,559 | |
| | | | | | | | 28,655,680 | |
|
| Poland–0.18% | |
KGHM Polska Miedz S.A. | | | 35,479 | | | | 2,207,922 | |
|
| Russia–0.60% | |
Magnitogorsk Iron & Steel Works–
REGS–GDR(c) | | | 247,026 | | | | 1,096,151 | |
Rosneft Oil Co.–REGS–GDR(c) | | | 309,525 | | | | 2,794,782 | |
Sberbank of Russia–ADR | | | 145,406 | | | | 1,807,436 | |
JSFC Sistema–REGS–GDR(c) | | | 88,315 | | | | 1,789,390 | |
| | | | | | | | 7,487,759 | |
|
| South Africa–0.72% | |
Sasol Ltd. | | | 51,794 | | | | 2,254,981 | |
Standard Bank Group Ltd. | | | 141,424 | | | | 2,006,785 | |
Steinhoff International Holdings Ltd. | | | 836,553 | | | | 2,741,828 | |
Tiger Brands Ltd. | | | 51,774 | | | | 1,999,224 | |
| | | | | | | | 9,002,818 | |
|
| South Korea–1.53% | |
Dongbu Insurance Co., Ltd. | | | 46,947 | | | | 2,032,735 | |
Hyundai Department Store Co., Ltd. | | | 5,859 | | | | 878,060 | |
Hyundai Mipo Dockyard Co., Ltd. | | | 15,027 | | | | 1,814,677 | |
Hyundai Mobis | | | 11,932 | | | | 3,255,052 | |
KT&G Corp. | | | 31,620 | | | | 2,411,871 | |
POSCO | | | 4,998 | | | | 1,643,672 | |
Samsung Electronics Co., Ltd. | | | 2,506 | | | | 3,607,458 | |
See accompanying Notes to Financial Statements which are an integral part of the financial statements.
9 Invesco Global Core Equity Fund
| | | | | | | | |
| | | Shares | | | Value | |
| South Korea–(continued) | |
Shinhan Financial Group Co., Ltd. | | | 52,530 | | | $ | 1,921,819 | |
SK Telecom Co., Ltd. -ADR(b) | | | 92,592 | | | | 1,465,731 | |
| | | | | | | | 19,031,075 | |
|
| Spain–1.70% | |
Iberdrola S.A. | | | 1,943,264 | | | | 10,831,868 | |
Telefonica S.A. | | | 767,431 | | | | 10,416,394 | |
| | | | | | | | 21,248,262 | |
|
| Switzerland–3.09% | |
ABB Ltd. | | | 607,845 | | | | 12,609,518 | |
Swisscom AG | | | 30,248 | | | | 13,033,609 | |
Zurich Insurance Group AG | | | 48,473 | | | | 12,949,242 | |
| | | | | | | | 38,592,369 | |
|
| Taiwan–0.49% | |
Hon Hai Precision Industry Co., Ltd. | | | 574,000 | | | | 1,769,831 | |
Powertech Technology Inc. | | | 642,320 | | | | 1,054,277 | |
TPK Holding Co. Ltd. | | | 51,000 | | | | 911,104 | |
Unimicron Technology Corp. | | | 1,272,000 | | | | 1,356,675 | |
Wistron Corp. | | | 1,018,900 | | | | 1,061,824 | |
| | | | | | | | 6,153,711 | |
|
| Thailand–0.31% | |
Bangkok Bank PCL–NVDR | | | 343,100 | | | | 2,203,222 | |
PTT PCL | | | 152,400 | | | | 1,672,329 | |
| | | | | | | | 3,875,551 | |
|
| Turkey–0.12% | |
Asya Katilim Bankasi AS(a) | | | 1,239,276 | | | | 1,544,422 | |
|
| United Arab Emirates–0.17% | |
Dragon Oil PLC | | | 228,933 | | | | 2,075,265 | |
|
| United Kingdom–8.97% | |
Barclays PLC | | | 5,438,441 | | | | 23,491,780 | |
Eurasian Natural Resources Corp. | | | 227,682 | | | | 1,095,695 | |
Gazprom OAO–ADR | | | 162,164 | | | | 1,554,970 | |
GlaxoSmithKline PLC | | | 490,740 | | | | 10,657,695 | |
Imperial Tobacco Group PLC | | | 599,543 | | | | 23,157,676 | |
National Grid PLC | | | 1,079,264 | | | | 12,365,777 | |
Rio Tinto PLC | | | 299,295 | | | | 17,445,486 | |
Royal Dutch Shell PLC–Class B | | | 623,123 | | | | 22,059,894 | |
| | | | | | | | 111,828,973 | |
|
| United States–41.78% | |
3M Co. | | | 145,784 | | | | 13,536,044 | |
ACE Ltd. | | | 373,890 | | | | 29,836,422 | |
Apache Corp. | | | 113,250 | | | | 8,890,125 | |
| | | | | | | | |
| | | Shares | | | Value | |
| United States–(continued) | |
Archer–Daniels–Midland Co. | | | 667,257 | | | $ | 18,276,169 | |
Bank of America Corp. | | | 1,192,806 | | | | 13,836,550 | |
Best Buy Co., Inc. | | | 500,405 | | | | 5,929,799 | |
Chevron Corp. | | | 251,371 | | | | 27,183,260 | |
Cisco Systems, Inc. | | | 1,122,832 | | | | 22,063,649 | |
Coach, Inc. | | | 279,008 | | | | 15,487,734 | |
ConocoPhillips | | | 293,342 | | | | 17,010,903 | |
Corning Inc. | | | 3,042,973 | | | | 38,402,319 | |
Energen Corp. | | | 248,141 | | | | 11,188,678 | |
Energizer Holdings, Inc. | | | 150,406 | | | | 12,029,472 | |
GameStop Corp.–Class A(b) | | | 793,223 | | | | 19,901,965 | |
General Dynamics Corp. | | | 296,136 | | | | 20,513,341 | |
Gilead Sciences, Inc.(a) | | | 280,196 | | | | 20,580,396 | |
Hewlett–Packard Co. | | | 599,818 | | | | 8,547,406 | |
Johnson & Johnson | | | 298,381 | | | | 20,916,508 | |
JPMorgan Chase & Co. | | | 509,399 | | | | 22,398,274 | |
Merck & Co., Inc. | | | 518,485 | | | | 21,226,776 | |
Microsoft Corp. | | | 422,592 | | | | 11,295,884 | |
NASDAQ OMX Group, Inc. (The) | | | 607,793 | | | | 15,200,903 | |
Oracle Corp. | | | 636,462 | | | | 21,206,914 | |
Phillips 66 | | | 170,386 | | | | 9,047,497 | |
PNC Financial Services Group, Inc. | | | 247,520 | | | | 14,432,891 | |
Stryker Corp. | | | 206,667 | | | | 11,329,485 | |
Valero Energy Corp. | | | 534,999 | | | | 18,254,166 | |
WellPoint, Inc. | | | 321,292 | | | | 19,573,109 | |
Western Digital Corp. | | | 775,195 | | | | 32,938,035 | |
| | | | | | | | 521,034,674 | |
Total Common Stocks & Other Equity Interests
(Cost $1,093,745,119) | | | | 1,227,347,103 | |
| |
Money Market Funds–1.67% | | | | | |
Liquid Assets Portfolio–Institutional Class(d) | | | 10,424,729 | | | | 10,424,729 | |
Premier Portfolio–Institutional Class(d) | | | 10,424,729 | | | | 10,424,729 | |
Total Money Market Funds
(Cost $20,849,458) | | | | 20,849,458 | |
TOTAL INVESTMENTS (excluding investments purchased with cash collateral from securities on loan)–100.08% (Cost $1,114,594,577) | | | | 1,248,196,561 | |
| |
Investments Purchased with Cash Collateral from Securities on Loan | | | | | |
Money Market Funds–3.64% | |
Liquid Assets Portfolio–Institutional Class (Cost $45,315,809)(d)(e) | | | 45,315,809 | | | | 45,315,809 | |
TOTAL INVESTMENTS–103.72%
(Cost $1,159,910,386) | | | | 1,293,512,370 | |
OTHER ASSETS LESS LIABILITIES–(3.72)% | | | | (46,364,284 | ) |
NET ASSETS–100.00% | | | $ | 1,247,148,086 | |
Investment Abbreviations:
| | |
| ADR | | – American Depositary Receipt |
| GDR | | – Global Depositary Receipt |
| NVDR | | – Non-Voting Depositary Receipt |
| REGS | | – Regulation S |
Notes to Schedule of Investments:
| (a) | Non-income producing security. |
| (b) | All or a portion of this security was out on loan at December 31, 2012. |
| (c) | Security purchased or received in a transaction exempt from registration under the Securities Act of 1933, as amended. The security may be resold pursuant to an exemption from registration under the 1933 Act, typically to qualified institutional buyers. The aggregate value of these securities at December 31, 2012 was $5,680,323, which represented less than 1% of the Fund’s Net Assets. |
| (d) | The money market fund and the Fund are affiliated by having the same investment adviser. |
| (e) | The security has been segregated to satisfy the commitment to return the cash collateral received in securities lending transactions upon the borrower’s return of the securities loaned. See Note 1J. |
See accompanying Notes to Financial Statements which are an integral part of the financial statements.
10 Invesco Global Core Equity Fund
Statement of Assets and Liabilities
December 31, 2012
| | | | |
Assets: | |
Investments, at value (Cost $1,093,745,119)* | | $ | 1,227,347,103 | |
Investments in affiliated money market funds, at value and cost | | | 66,165,267 | |
Total investments, at value (Cost $1,159,910,386) | | | 1,293,512,370 | |
Foreign currencies, at value (Cost $200,316) | | | 192,448 | |
Receivable for: | | | | |
Investments sold | | | 1,833,152 | |
Fund shares sold | | | 439,931 | |
Dividends | | | 2,418,786 | |
Deposits with sub custodian (Cost $1,261,830) | | | 1,270,889 | |
Investment for trustee deferred compensation and retirement plans | | | 72,822 | |
Other assets | | | 41,804 | |
Total assets | | | 1,299,782,202 | |
|
Liabilities: | |
Payable for: | | | | |
Fund shares reacquired | | | 5,054,173 | |
Amount due custodian | | | 16,453 | |
Collateral upon return of securities loaned | | | 45,315,809 | |
Accrued fees to affiliates | | | 1,459,797 | |
Accrued other operating expenses | | | 536,488 | |
Trustee deferred compensation and retirement plans | | | 251,396 | |
Total liabilities | | | 52,634,116 | |
Net assets applicable to shares outstanding | | $ | 1,247,148,086 | |
|
Net assets consist of: | |
Shares of beneficial interest | | $ | 1,339,500,410 | |
Undistributed net investment income | | | (48,528 | ) |
Undistributed net realized gain (loss) | | | (225,929,846 | ) |
Unrealized appreciation | | | 133,626,050 | |
| | | $ | 1,247,148,086 | |
| | | | |
Net Assets: | |
Class A | | $ | 1,038,231,703 | |
Class B | | $ | 56,812,698 | |
Class C | | $ | 134,387,489 | |
Class R | | $ | 794,271 | |
Class Y | | $ | 16,646,483 | |
Class R5 | | $ | 275,442 | |
|
Shares outstanding, $0.01 par value per share,
with an unlimited number of shares authorized: | |
Class A | | | 81,357,472 | |
Class B | | | 4,638,869 | |
Class C | | | 10,955,027 | |
Class R | | | 62,249 | |
Class Y | | | 1,304,688 | |
Class R5 | | | 21,351 | |
Class A: | | | | |
Net asset value per share | | $ | 12.76 | |
Maximum offering price per share | | | | |
(Net asset value of $12.76 ¸ 94.50%) | | $ | 13.50 | |
Class B: | | | | |
Net asset value and offering price per share | | $ | 12.25 | |
Class C: | | | | |
Net asset value and offering price per share | | $ | 12.27 | |
Class R: | | | | |
Net asset value and offering price per share | | $ | 12.76 | |
Class Y: | | | | |
Net asset value and offering price per share | | $ | 12.76 | |
Class R5: | | | | |
Net asset value and offering price per share | | $ | 12.90 | |
| * | At December 31, 2012, securities with an aggregate value of $43,598,716 were on loan to brokers. |
See accompanying Notes to Financial Statements which are an integral part of the financial statements.
11 Invesco Global Core Equity Fund
Statement of Operations
For the year ended December 31, 2012
| | | | |
Investment income: | |
Dividends (net of foreign withholding taxes of $2,219,941) | | $ | 40,116,219 | |
Dividends from affiliated money market funds (includes securities lending income of $841,037) | | | 876,422 | |
Interest | | | 180,386 | |
Total investment income | | | 41,173,027 | |
| |
Expenses: | | | | |
Advisory fees | | | 10,434,174 | |
Administrative services fees | | | 350,859 | |
Custodian fees | | | 327,436 | |
Distribution fees: | | | | |
Class A | | | 2,762,897 | |
Class B | | | 823,389 | |
Class C | | | 1,535,619 | |
Class R | | | 3,659 | |
Transfer agent fees — A, B, C, R and Y | | | 3,177,163 | |
Transfer agent fees — R5 | | | 299 | |
Trustees’ and officers’ fees and benefits | | | 81,478 | |
Other | | | 495,507 | |
Total expenses | | | 19,992,480 | |
Less: Fees waived, expenses reimbursed and expense offset arrangement(s) | | | (1,663,163 | ) |
Net expenses | | | 18,329,317 | |
Net investment income | | | 22,843,710 | |
| |
Realized and unrealized gain (loss) from: | | | | |
Net realized gain (loss) from: | | | | |
Investment securities (net of tax on the sale of foreign investments of $56,540) | | | (10,442,917 | ) |
Foreign currencies | | | (98,307 | ) |
| | | | (10,541,224 | ) |
Change in net unrealized appreciation of: | | | | |
Investment securities (net of foreign taxes on holdings of $(146,823)) | | | 154,945,859 | |
Foreign currencies | | | 36,328 | |
| | | | 154,982,187 | |
Net realized and unrealized gain | | | 144,440,963 | |
Net increase in net assets resulting from operations | | $ | 167,284,673 | |
See accompanying Notes to Financial Statements which are an integral part of the financial statements.
12 Invesco Global Core Equity Fund
Statement of Changes in Net Assets
For the years ended December 31, 2012 and 2011
| | | | | | | | |
| | | 2012 | | | 2011 | |
Operations: | | | | | |
Net investment income | | $ | 22,843,710 | | | $ | 14,860,869 | |
Net realized gain (loss) | | | (10,541,224 | ) | | | (12,593,053 | ) |
Change in net unrealized appreciation (depreciation) | | | 154,982,187 | | | | (304,158,188 | ) |
Net increase (decrease) in net assets resulting from operations | | | 167,284,673 | | | | (301,890,372 | ) |
| | |
Distributions to shareholders from net investment income: | | | | | | | | |
Class A | | | (19,686,280 | ) | | | (12,870,731 | ) |
Class B | | | (947,539 | ) | | | (1,072,684 | ) |
Class C | | | (1,489,729 | ) | | | (1,002,451 | ) |
Class R | | | (12,527 | ) | | | (6,014 | ) |
Class Y | | | (369,595 | ) | | | (322,155 | ) |
Class R5 | | | (5,832 | ) | | | (3,224 | ) |
Total distributions from net investment income | | | (22,511,502 | ) | | | (15,277,259 | ) |
| | |
Distributions to shareholders from net realized gains: | | | | | | | | |
Class A | | | (105,971 | ) | | | — | |
Class B | | | (6,138 | ) | | | — | |
Class C | | | (14,474 | ) | | | — | |
Class R | | | (80 | ) | | | — | |
Class Y | | | (1,739 | ) | | | — | |
Class R5 | | | (27 | ) | | | — | |
Total distributions from net realized gains | | | (128,429 | ) | | | — | |
| | |
Share transactions–net: | | | | | | | | |
Class A | | | (274,483,600 | ) | | | 1,382,892,765 | |
Class B | | | (66,755,257 | ) | | | 132,120,004 | |
Class C | | | (59,172,602 | ) | | | 205,938,884 | |
Class R | | | 56,198 | | | | 785,856 | |
Class Y | | | (10,289,779 | ) | | | 31,363,437 | |
Class R5 | | | (44,216 | ) | | | 259,501 | |
Net increase (decrease) in net assets resulting from share transactions | | | (410,689,256 | ) | | | 1,753,360,447 | |
Net increase (decrease) in net assets | | | (266,044,514 | ) | | | 1,436,192,816 | |
| | |
Net assets: | | | | | | | | |
Beginning of year | | | 1,513,192,600 | | | | 76,999,784 | |
End of year (includes undistributed net investment income of $(48,528) and $(256,789), respectively) | | $ | 1,247,148,086 | | | $ | 1,513,192,600 | |
Notes to Financial Statements
December 31, 2012
NOTE 1—Significant Accounting Policies
Invesco Global Core Equity Fund (the “Fund”) is a series portfolio of AIM Funds Group (Invesco Funds Group) (the “Trust”). The Trust is a Delaware statutory trust registered under the Investment Company Act of 1940, as amended (the “1940 Act”), as an open-end series management investment company consisting of four separate portfolios, each authorized to issue an unlimited number of shares of beneficial interest. The assets, liabilities and operations of each portfolio are accounted for separately. Information presented in these financial statements pertains only to the Fund. Matters affecting each portfolio or class will be voted on exclusively by the shareholders of such portfolio or class.
The Fund’s primary investment objective is long-term growth of capital.
The Fund currently consists of six different classes of shares: Class A, Class B, Class C, Class R, Class Y and Class R5. On September 24, 2012, Institutional Class shares were renamed Class R5 shares. Class A shares are sold with a front-end sales charge unless certain waiver criteria are met and under certain circumstances load waived shares may be subject to contingent deferred sales charges (“CDSC”). Class C shares are sold with a CDSC. Class R, Class Y and Class R5 shares are sold at net asset value. Effective November 30, 2010, new or additional investments in Class B shares are no longer permitted. Existing shareholders of Class B shares may continue to reinvest dividends and capital gains distributions in Class B shares until they convert to Class A shares. Also, shareholders in Class B shares will be able to exchange those shares for Class B shares of other Invesco
13 Invesco Global Core Equity Fund
Funds offering such shares until they convert to Class A shares. Generally, Class B shares will automatically convert to Class A shares on or about the month-end, which is at least eight years after the date of purchase. Redemption of Class B shares prior to the conversion date will be subject to a CDSC.
The following is a summary of the significant accounting policies followed by the Fund in the preparation of its financial statements.
| A. | Security Valuations — Securities, including restricted securities, are valued according to the following policy. |
A security listed or traded on an exchange (except convertible bonds) is valued at its last sales price or official closing price as of the close of the customary trading session on the exchange where the security is principally traded, or lacking any sales or official closing price on a particular day, the security may be valued at the closing bid price on that day. Securities traded in the over-the-counter market are valued based on prices furnished by independent pricing services or market makers. When such securities are valued by an independent pricing service they may be considered fair valued. Futures contracts are valued at the final settlement price set by an exchange on which they are principally traded. Listed options are valued at the mean between the last bid and ask prices from the exchange on which they are principally traded. Options not listed on an exchange are valued by an independent source at the mean between the last bid and ask prices. For purposes of determining net asset value per share, futures and option contracts generally are valued 15 minutes after the close of the customary trading session of the New York Stock Exchange (“NYSE”).
Investments in open-end and closed-end registered investment companies that do not trade on an exchange are valued at the end of day net asset value per share. Investments in open-end and closed-end registered investment companies that trade on an exchange are valued at the last sales price or official closing price as of the close of the customary trading session on the exchange where the security is principally traded.
Debt obligations (including convertible bonds) and unlisted equities are fair valued using an evaluated quote provided by an independent pricing service. Evaluated quotes provided by the pricing service may be determined without exclusive reliance on quoted prices, and may reflect appropriate factors such as institution-size trading in similar groups of securities, developments related to specific securities, dividend rate (for unlisted equities), yield (for debt obligations), quality, type of issue, coupon rate (for debt obligations), maturity (for debt obligations), individual trading characteristics and other market data. Debt obligations are subject to interest rate and credit risks. In addition, all debt obligations involve some risk of default with respect to interest and/or principal payments.
Foreign securities’ (including foreign exchange contracts) prices are converted into U.S. dollar amounts using the applicable exchange rates as of the close of the NYSE. If market quotations are available and reliable for foreign exchange-traded equity securities, the securities will be valued at the market quotations. Because trading hours for certain foreign securities end before the close of the NYSE, closing market quotations may become unreliable. If between the time trading ends on a particular security and the close of the customary trading session on the NYSE, events occur that the Adviser determines are significant and make the closing price unreliable, the Fund may fair value the security. If the event is likely to have affected the closing price of the security, the security will be valued at fair value in good faith using procedures approved by the Board of Trustees. Adjustments to closing prices to reflect fair value may also be based on a screening process of an independent pricing service to indicate the degree of certainty, based on historical data, that the closing price in the principal market where a foreign security trade is not the current value as of the close of the NYSE. Foreign securities’ prices meeting the approved degree of certainty that the price is not reflective of current value will be priced at the indication of fair value from the independent pricing service. Multiple factors may be considered by the independent pricing service in determining adjustments to reflect fair value and may include information relating to sector indices, American Depositary Receipts and domestic and foreign index futures. Foreign securities may have additional risks including exchange rate changes, potential for sharply devalued currencies and high inflation, political and economic upheaval, the relative lack of issuer information, relatively low market liquidity and the potential lack of strict financial and accounting controls and standards.
Securities for which market prices are not provided by any of the above methods may be valued based upon quotes furnished by independent sources. The last bid price may be used to value equity securities. The mean between the last bid and asked prices is used to value debt obligations, including corporate loans.
Securities for which market quotations are not readily available or became unreliable are valued at fair value as determined in good faith by or under the supervision of the Trust’s officers following procedures approved by the Board of Trustees. Issuer specific events, market trends, bid/ask quotes of brokers and information providers and other market data may be reviewed in the course of making a good faith determination of a security’s fair value.
Valuations change in response to many factors including the historical and prospective earnings of the issuer, the value of the issuer’s assets, general economic conditions, interest rates, investor perceptions and market liquidity. Because of the inherent uncertainties of valuation, the values reflected in the financial statements may materially differ from the value received upon actual sale of those investments.
| B. | Securities Transactions and Investment Income — Securities transactions are accounted for on a trade date basis. Realized gains or losses on sales are computed on the basis of specific identification of the securities sold. Interest income is recorded on the accrual basis from settlement date. Dividend income (net of withholding tax, if any) is recorded on the ex-dividend date. |
The Fund may periodically participate in litigation related to Fund investments. As such, the Fund may receive proceeds from litigation settlements. Any proceeds received are included in the Statement of Operations as realized gain (loss) for investments no longer held and as unrealized gain (loss) for investments still held.
Brokerage commissions and mark ups are considered transaction costs and are recorded as an increase to the cost basis of securities purchased and/or a reduction of proceeds on a sale of securities. Such transaction costs are included in the determination of net realized and unrealized gain (loss) from investment securities reported in the Statement of Operations and the Statement of Changes in Net Assets and the net realized and unrealized gains (losses) on securities per share in the Financial Highlights. Transaction costs are included in the calculation of the Fund’s net asset value and, accordingly, they reduce the Fund’s total returns. These transaction costs are not considered operating expenses and are not reflected in net investment income reported in the Statement of Operations and Statement of Changes in Net Assets, or the net investment income per share and ratios of expenses and net investment income reported in the Financial Highlights, nor are they limited by any expense limitation arrangements between the Fund and the investment adviser.
The Fund allocates income and realized and unrealized capital gains and losses to a class based on the relative net assets of each class.
| C. | Country Determination — For the purposes of making investment selection decisions and presentation in the Schedule of Investments, the investment adviser may determine the country in which an issuer is located and/or credit risk exposure based on various factors. These factors |
14 Invesco Global Core Equity Fund
| | include the laws of the country under which the issuer is organized, where the issuer maintains a principal office, the country in which the issuer derives 50% or more of its total revenues and the country that has the primary market for the issuer’s securities, as well as other criteria. Among the other criteria that may be evaluated for making this determination are the country in which the issuer maintains 50% or more of its assets, the type of security, financial guarantees and enhancements, the nature of the collateral and the sponsor organization. Country of issuer and/or credit risk exposure has been determined to be the United States of America, unless otherwise noted. |
| D. | Distributions — Distributions from income and net realized capital gain, if any, are generally declared and paid annually and recorded on the ex-dividend date. The Fund may elect to treat a portion of the proceeds from redemptions as distributions for federal income tax purposes. |
| E. | Federal Income Taxes — The Fund intends to comply with the requirements of Subchapter M of the Internal Revenue Code necessary to qualify as a regulated investment company and to distribute substantially all of the Fund’s taxable earnings to shareholders. As such, the Fund will not be subject to federal income taxes on otherwise taxable income (including net realized capital gain) that is distributed to shareholders. Therefore, no provision for federal income taxes is recorded in the financial statements. |
The Fund files tax returns in the U.S. Federal jurisdiction and certain other jurisdictions. Generally, the Fund is subject to examinations by such taxing authorities for up to three years after the filing of the return for the tax period.
| F. | Expenses — Fees provided for under the Rule 12b-1 plan of a particular class of the Fund are charged to the operations of such class. Transfer agency fees and expenses and other shareholder recordkeeping fees and expenses attributable to Class R5 are charged to such class. Transfer agency fees and expenses and other shareholder recordkeeping fees and expenses relating to all other classes are allocated among those classes based on relative net assets. All other expenses are allocated among the classes based on relative net assets. |
| G. | Accounting Estimates — The preparation of financial statements in conformity with accounting principles generally accepted in the United States of America (“GAAP”) requires management to make estimates and assumptions that affect the reported amounts of assets and liabilities at the date of the financial statements and the reported amounts of revenues and expenses during the reporting period including estimates and assumptions related to taxation. Actual results could differ from those estimates by a significant amount. In addition, the Fund monitors for material events or transactions that may occur or become known after the period-end date and before the date the financial statements are released to print. |
| H. | Indemnifications — Under the Trust’s organizational documents, each Trustee, officer, employee or other agent of the Trust is indemnified against certain liabilities that may arise out of the performance of their duties to the Fund. Additionally, in the normal course of business, the Fund enters into contracts, including the Fund’s servicing agreements, that contain a variety of indemnification clauses. The Fund’s maximum exposure under these arrangements is unknown as this would involve future claims that may be made against the Fund that have not yet occurred. The risk of material loss as a result of such indemnification claims is considered remote. |
| I. | Redemption Fees — The Fund had a 2% redemption fee that was retained by the Fund to offset transaction costs and other expenses associated with short-term redemptions and exchanges. The fee, subject to certain exceptions, was imposed on certain redemptions or exchanges of shares within 31 days of purchase. The redemption fee was recorded as an increase in shareholder capital and was allocated among the share classes based on the relative net assets of each class. Effective January 1, 2012, the Fund eliminated the 2% redemption fee assessed on shares of the Fund redeemed or exchanged within 31 days of purchase. |
| J. | Securities Lending — The Fund may lend portfolio securities having a market value up to one-third of the Fund’s total assets. Such loans are secured by collateral equal to no less than the market value of the loaned securities determined daily by the securities lending provider. Such collateral will be cash or debt securities issued or guaranteed by the U.S. Government or any of its sponsored agencies. Cash collateral received in connection with these loans is invested in short-term money market instruments or affiliated money market funds and is shown as such on the Schedule of Investments. It is the Fund’s policy to obtain additional collateral from or return excess collateral to the borrower by the end of the next business day, following the valuation date of the securities loaned. Therefore, the value of the collateral held may be temporarily less than the value of the securities on loan. Lending securities entails a risk of loss to the Fund if and to the extent that the market value of the securities loaned were to increase and the borrower did not increase the collateral accordingly, and the borrower fails to return the securities. Upon the failure of the borrower to return the securities, collateral may be liquidated and the securities may be purchased on the open market to replace the loaned securities. The Fund could experience delays and costs in gaining access to the collateral. The Fund bears the risk of any deficiency in the amount of the collateral available for return to the borrower due to any loss on the collateral invested. Dividends received on cash collateral investments for securities lending transactions, which are net of compensation to counterparties, is included in Dividends from affiliated money market funds on the Statement of Operations. The aggregate value of securities out on loan is shown as a footnote on the Statement of Assets and Liabilities, if any. |
| K. | Foreign Currency Translations — Foreign currency is valued at the close of the NYSE based on quotations posted by banks and major currency dealers. Portfolio securities and other assets and liabilities denominated in foreign currencies are translated into U.S. dollar amounts at date of valuation. Purchases and sales of portfolio securities (net of foreign taxes withheld on disposition) and income items denominated in foreign currencies are translated into U.S. dollar amounts on the respective dates of such transactions. The Fund does not separately account for the portion of the results of operations resulting from changes in foreign exchange rates on investments and the fluctuations arising from changes in market prices of securities held. The combined results of changes in foreign exchange rates and the fluctuation of market prices on investments (net of estimated foreign tax withholding) are included with the net realized and unrealized gain or loss from investments in the Statement of Operations. Reported net realized foreign currency gains or losses arise from (1) sales of foreign currencies, (2) currency gains or losses realized between the trade and settlement dates on securities transactions, and (3) the difference between the amounts of dividends, interest, and foreign withholding taxes recorded on the Fund’s books and the U.S. dollar equivalent of the amounts actually received or paid. Net unrealized foreign currency gains and losses arise from changes in the fair values of assets and liabilities, other than investments in securities at fiscal period end, resulting from changes in exchange rates. |
The Fund may invest in foreign securities which may be subject to foreign taxes on income, gains on investments or currency repatriation, a portion of which may be recoverable.
| L. | Foreign Currency Contracts — The Fund may enter into foreign currency contracts to manage or minimize currency or exchange rate risk. The Fund may also enter into foreign currency contracts for the purchase or sale of a security denominated in a foreign currency in order to “lock in” the U.S. dollar price of that security. A foreign currency contract is an obligation to purchase or sell a specific currency for an agreed-upon |
15 Invesco Global Core Equity Fund
| | price at a future date. The use of foreign currency contracts does not eliminate fluctuations in the price of the underlying securities the Fund owns or intends to acquire but establishes a rate of exchange in advance. Fluctuations in the value of these contracts are measured by the difference in the contract date and reporting date exchange rates and are recorded as unrealized appreciation (depreciation) until the contracts are closed. When the contracts are closed, realized gains (losses) are recorded. Realized and unrealized gains (losses) on the contracts are included in the Statement of Operations. The primary risks associated with foreign currency contracts include failure of the counterparty to meet the terms of the contract and the value of the foreign currency changing unfavorably. These risks may be in excess of the amounts reflected in the Statement of Assets and Liabilities. |
NOTE 2—Advisory Fees and Other Fees Paid to Affiliates
The Trust has entered into a master investment advisory agreement with Invesco Advisers, Inc. (the “Adviser” or “Invesco”). Under the terms of the investment advisory agreement, the Fund pays an advisory fee to the Adviser based on the annual rate of the Fund’s average daily net assets as follows:
| | | | |
| Average Daily Net Assets | | Rate | |
First $250 million | | | 0.80% | |
Next $250 million | | | 0.78% | |
Next $500 million | | | 0.76% | |
Next $1.5 billion | | | 0.74% | |
Next $2.5 billion | | | 0.72% | |
Next $2.5 billion | | | 0.70% | |
Next $2.5 billion | | | 0.68% | |
Over $10 billion | | | 0.66% | |
Under the terms of a master sub-advisory agreement between the Adviser and each of Invesco Asset Management Deutschland GmbH, Invesco Asset Management Limited, Invesco Asset Management (Japan) Limited, Invesco Australia Limited, Invesco Hong Kong Limited, Invesco Senior Secured Management, Inc. and Invesco Canada Ltd. (collectively, the “Affiliated Sub-Advisers”) the Adviser, not the Fund, may pay 40% of the fees paid to the Adviser to any such Affiliated Sub-Adviser(s) that provide discretionary investment management services to the Fund based on the percentage of assets allocated to such Sub-Adviser(s).
The Adviser has contractually agreed, through June 30, 2013, to waive advisory fees and/or reimburse expenses of all shares to the extent necessary to limit total annual fund operating expenses after fee waiver and/or expense reimbursement (excluding certain items discussed below) of Class A, Class B (after 12b-1 waivers), Class C, Class R, Class Y and Class R5 shares to 1.25%, 1.52% (after 12b-1 waivers), 2.00%, 1.50%, 1.00% and 1.00%, respectively, of average daily net assets. In determining the Adviser’s obligation to waive advisory fees and/or reimburse expenses, the following expenses are not taken into account, and could cause the total annual fund operating expenses after fee waiver and/or expense reimbursement to exceed the numbers reflected above: (1) interest; (2) taxes; (3) dividend expense on short sales; (4) extraordinary or non-routine items, including litigation expenses; and (5) expenses that the Fund has incurred but did not actually pay because of an expense offset arrangement.
Further, the Adviser has contractually agreed, through at least June 30, 2013, to waive the advisory fee payable by the Fund in an amount equal to 100% of the net advisory fees the Adviser receives from the affiliated money market funds on investments by the Fund of uninvested cash (excluding investments of cash collateral from securities lending) in such affiliated money market funds.
For the year ended December 31, 2012, the Adviser waived advisory fees of $37,339 and reimbursed class level expenses of $994,630, $74,104, $138,204, $658 and $18,572 for Class A, Class B, Class C, Class R and Class Y shares in proportion to the relative net assets of such classes.
The Trust has entered into a master administrative services agreement with Invesco pursuant to which the Fund has agreed to pay Invesco for certain administrative costs incurred in providing accounting services to the Fund. For the year ended December 31, 2012, expenses incurred under the agreement are shown in the Statement of Operations as Administrative services fees.
The Trust has entered into a transfer agency and service agreement with Invesco Investment Services, Inc. (“IIS”) pursuant to which the Fund has agreed to pay IIS a fee for providing transfer agency and shareholder services to the Fund and reimburse IIS for certain expenses incurred by IIS in the course of providing such services. IIS may make payments to intermediaries that provide omnibus account services, sub-accounting services and/or networking services. All fees payable by IIS to intermediaries that provide omnibus account services or sub-accounting are charged back to the Fund, subject to certain limitations approved by the Trust’s Board of Trustees. For the year ended December 31, 2012, expenses incurred under the agreement are shown in the Statement of Operations as Transfer agent fees.
Trust has entered into master distribution agreements with Invesco Distributors, Inc. (“IDI”) to serve as the distributor for the Class A, Class B, Class C, Class R, Class Y and Class R5 shares of the Fund. The Trust has adopted plans pursuant to Rule 12b-1 under the 1940 Act with respect to the Fund’s Class A, Class B and Class C shares (collectively the “Plans”). The Fund, pursuant to the Plans, pays IDI compensation at the annual rate of 0.25% of the Fund’s average daily net assets of Class A shares, 1.00% of the average daily net assets of Class B and Class C shares and 0.50% of the average daily net assets of Class R shares. Of the Plan payments, up to 0.25% of the average daily net assets of each class of shares may be paid to furnish continuing personal shareholder services to customers who purchase and own shares of such classes. Any amounts not paid as a service fee under the Plans would constitute an asset-based sales charge. Rules of the Financial Industry Regulatory Authority (“FINRA”) impose a cap on the total sales charges, including asset-based sales charges, that may be paid by any class of shares of the Fund. IDI has contractually agreed to limit Rule 12b-1 plan fees on Class B shares to 0.52% of average daily net assets through at least June 30, 2013. 12b-1 fees before fee waivers incurred under the Plan are detailed in the Statement of Operations of Distribution fees. For the year ended December 31, 2012, 12b-1 fees incurred for Class B shares were $428,162 after fee waivers of $395,227.
16 Invesco Global Core Equity Fund
Front-end sales commissions and CDSC (collectively, the “sales charges”) are not recorded as expenses of the Fund. Front-end sales commissions are deducted from proceeds from the sales of Fund shares prior to investment in Class A shares of the Fund. CDSC are deducted from redemption proceeds prior to remittance to the shareholder. During the year ended December 31, 2012, IDI advised the Fund that IDI retained $48,340 in front-end sales commissions from the sale of Class A shares and $6,352, $116,958 and $5,837 from Class A, Class B and Class C shares, respectively, for CDSC imposed on redemptions by shareholders.
Certain officers and trustees of the Trust are officers and directors of the Adviser, IIS and/or IDI.
NOTE 3—Additional Valuation Information
GAAP defines fair value as the price that would be received to sell an asset or paid to transfer a liability in an orderly transaction between market participants at the measurement date, under current market conditions. GAAP establishes a hierarchy that prioritizes the inputs to valuation methods giving the highest priority to readily available unadjusted quoted prices in an active market for identical assets (Level 1) and the lowest priority to significant unobservable inputs (Level 3) generally when market prices are not readily available or are unreliable. Based on the valuation inputs, the securities or other investments are tiered into one of three levels. Changes in valuation methods may result in transfers in or out of an investment’s assigned level:
| | Level 1 — | Prices are determined using quoted prices in an active market for identical assets. |
| | Level 2 — | Prices are determined using other significant observable inputs. Observable inputs are inputs that other market participants may use in pricing a security. These may include quoted prices for similar securities, interest rates, prepayment speeds, credit risk, yield curves, loss severities, default rates, discount rates, volatilities and others. |
| | Level 3 — | Prices are determined using significant unobservable inputs. In situations where quoted prices or observable inputs are unavailable (for example, when there is little or no market activity for an investment at the end of the period), unobservable inputs may be used. Unobservable inputs reflect the Fund’s own assumptions about the factors market participants would use in determining fair value of the securities or instruments and would be based on the best available information. |
The following is a summary of the tiered valuation input levels, as of December 31, 2012. The level assigned to the securities valuations may not be an indication of the risk or liquidity associated with investing in those securities. Because of the inherent uncertainties of valuation, the values reflected in the financial statements may materially differ from the value received upon actual sale of those investments.
During the year ended December 31, 2012, there were transfers from Level 1 to Level 2 of $233,545,432, due to foreign fair value adjustments.
| | | | | | | | | | | | | | | | |
| | | Level 1 | | | Level 2 | | | Level 3 | | | Total | |
Australia | | $ | — | | | $ | 63,989,820 | | | $ | — | | | $ | 63,989,820 | |
Brazil | | | 5,049,829 | | | | 5,937,877 | | | | — | | | | 10,987,706 | |
Canada | | | 29,322,479 | | | | — | | | | — | | | | 29,322,479 | |
China | | | — | | | | 15,773,210 | | | | — | | | | 15,773,210 | |
France | | | 14,040,641 | | | | 64,934,903 | | | | — | | | | 78,975,544 | |
Germany | | | 16,577,066 | | | | 32,927,392 | | | | — | | | | 49,504,458 | |
Hong Kong | | | — | | | | 30,959,313 | | | | — | | | | 30,959,313 | |
India | | | — | | | | 7,608,765 | | | | — | | | | 7,608,765 | |
Indonesia | | | — | | | | 1,457,001 | | | | — | | | | 1,457,001 | |
Ireland | | | — | | | | — | | | | 0 | | | | 0 | |
Italy | | | — | | | | 12,894,912 | | | | — | | | | 12,894,912 | |
Japan | | | 35,091,688 | | | | 115,800,178 | | | | — | | | | 150,891,866 | |
Mexico | | | 2,243,548 | | | | — | | | | — | | | | 2,243,548 | |
Norway | | | — | | | | 28,655,680 | | | | — | | | | 28,655,680 | |
Poland | | | — | | | | 2,207,922 | | | | — | | | | 2,207,922 | |
Russia | | | — | | | | 7,487,759 | | | | — | | | | 7,487,759 | |
South Africa | | | — | | | | 9,002,818 | | | | — | | | | 9,002,818 | |
South Korea | | | 1,465,731 | | | | 17,565,344 | | | | — | | | | 19,031,075 | |
Spain | | | — | | | | 21,248,262 | | | | — | | | | 21,248,262 | |
Switzerland | | | — | | | | 38,592,369 | | | | — | | | | 38,592,369 | |
Taiwan | | | — | | | | 6,153,711 | | | | — | | | | 6,153,711 | |
Thailand | | | — | | | | 3,875,551 | | | | — | | | | 3,875,551 | |
Turkey | | | — | | | | 1,544,422 | | | | — | | | | 1,544,422 | |
United Arab Emirates | | | — | | | | 2,075,265 | | | | — | | | | 2,075,265 | |
United Kingdom | | | — | | | | 111,828,973 | | | | — | | | | 111,828,973 | |
United States | | | 587,199,941 | | | | — | | | | — | | | | 587,199,941 | |
Total Investments | | $ | 690,990,923 | | | $ | 602,521,447 | | | $ | 0 | | | $ | 1,293,512,370 | |
17 Invesco Global Core Equity Fund
NOTE 4—Expense Offset Arrangement(s)
The expense offset arrangement is comprised of transfer agency credits which result from balances in Demand Deposit Accounts (DDA) used by the transfer agent for clearing shareholder transactions. For the year ended December 31, 2012, the Fund received credits from this arrangement, which resulted in the reduction of the Fund’s total expenses of $4,429.
NOTE 5—Trustees’ and Officers’ Fees and Benefits
“Trustees’ and Officers’ Fees and Benefits” include amounts accrued by the Fund to pay remuneration to certain Trustees and Officers of the Fund. Trustees have the option to defer compensation payable by the Fund, and “Trustees’ and Officers’ Fees and Benefits” also include amounts accrued by the Fund to fund such deferred compensation amounts. Those Trustees who defer compensation have the option to select various Invesco Funds in which their deferral accounts shall be deemed to be invested. Finally, certain current Trustees are eligible to participate in a retirement plan that provides for benefits to be paid upon retirement to Trustees over a period of time based on the number of years of service. The Fund may have certain former Trustees who also participate in a retirement plan and receive benefits under such plan. “Trustees’ and Officers’ Fees and Benefits” include amounts accrued by the Fund to fund such retirement benefits. Obligations under the deferred compensation and retirement plans represent unsecured claims against the general assets of the Fund.
During the year ended December 31, 2012, the Fund paid legal fees of $21 for services rendered by Kramer, Levin, Naftalis & Frankel LLP as counsel to the Independent Trustees. A partner of that firm is a Trustee of the Trust.
NOTE 6—Cash Balances
The Fund is permitted to temporarily carry a negative or overdrawn balance in its account with State Street Bank and Trust Company, the custodian bank. Such balances, if any at period end, are shown in the Statement of Assets and Liabilities under the payable caption Amount due custodian. To compensate the custodian bank for such overdrafts, the overdrawn Fund may either (1) leave funds as a compensating balance in the account so the custodian bank can be compensated by earning the additional interest; or (2) compensate by paying the custodian bank at a rate agreed upon by the custodian bank and Invesco, not to exceed the contractually agreed upon rate.
NOTE 7—Distributions to Shareholders and Tax Components of Net Assets
Tax Character of Distributions to Shareholders Paid During the Years Ended December 31, 2012 and 2011:
| | | | | | | | |
| | | 2012 | | | 2011 | |
Ordinary income | | $ | 22,519,425 | | | $ | 14,863,174 | |
Long-term capital gain | | | 120,506 | | | | 414,085 | |
Total distributions | | $ | 22,639,931 | | | $ | 15,277,259 | |
Tax Components of Net Assets at Period-End:
| | | | |
| | | 2012 | |
Undistributed ordinary income | | $ | 233,509 | |
Net unrealized appreciation — investments | | | 128,372,246 | |
Net unrealized appreciation — other investments | | | 24,066 | |
Temporary book/tax differences | | | (242,718 | ) |
Post-October deferrals | | | (35,364 | ) |
Late-year ordinary loss deferrals | | | (39,318 | ) |
Capital loss carryforward | | | (220,664,745 | ) |
Shares of beneficial interest | | | 1,339,500,410 | |
Total net assets | | $ | 1,247,148,086 | |
The difference between book-basis and tax-basis unrealized appreciation (depreciation) is due to differences in the timing of recognition of gains and losses on investments for tax and book purposes. The Fund’s net unrealized appreciation difference is attributable primarily to wash sales.
The temporary book/tax differences are a result of timing differences between book and tax recognition of income and/or expenses. The Fund’s temporary book/tax differences are the result of the trustee deferral of compensation and retirement plan benefits.
Capital loss carryforward is calculated and reported as of a specific date. Results of transactions and other activity after that date may affect the amount of capital loss carryforward actually available for the Fund to utilize. The Regulated Investment Company Modernization Act of 2010 (the “Act”) eliminated the eight-year carryover period for capital losses that arise in taxable years beginning after its enactment date of December 22, 2010. Consequently, these capital losses can be carried forward for an unlimited period. However, capital losses with an expiration period may not be used to offset capital gains until all net capital losses without an expiration date have been utilized. Additionally, post-enactment capital loss carryovers will retain their character as either short-term or long-term capital losses instead of as short-term capital losses as under prior law. The ability to utilize capital loss carryforward in the future may be limited under the Internal Revenue Code and related regulations based on the results of future transactions.
18 Invesco Global Core Equity Fund
The Fund has a capital loss carryforward as of December 31, 2012, which expires as follows:
| | | | | | | | | | | | |
| Capital Loss Carryforward* | |
| Expiration | | Short-Term | | | Long-Term | | | Total | |
December 31, 2016 | | $ | 156,101,515 | | | $ | — | | | $ | 156,101,515 | |
December 31, 2017 | | | 32,365,124 | | | | — | | | | 32,365,124 | |
Not subject to expiration | | | 26,371,373 | | | | 5,826,733 | | | | 32,198,106 | |
| | | $ | 214,838,012 | | | $ | 5,826,733 | | | $ | 220,664,745 | |
| * | Capital loss carryforward as of the date listed above is reduced for limitations, if any, to the extent required by the Internal Revenue Code. To the extent that unrealized gains as of May 23, 2011, the date of reorganization of Invesco Global Dividend Growth Securities Fund, Invesco Global Fund, Invesco Van Kampen Global Equity Allocation Fund and Invesco Van Kampen Global Franchise Fund into the Fund are realized on securities held in each fund at such date of reorganization, the capital loss carryforward may be further limited for up to five years from the date of the reorganization. |
NOTE 8—Investment Securities
The aggregate amount of investment securities (other than short-term securities, U.S. Treasury obligations and money market funds, if any) purchased and sold by the Fund during the year ended December 31, 2012 was $304,755,651 and $719,985,970, respectively. Cost of investments on a tax basis includes the adjustments for financial reporting purposes as of the most recently completed federal income tax reporting period-end.
| | | | |
| Unrealized Appreciation (Depreciation) of Investment Securities on a Tax Basis | |
Aggregate unrealized appreciation of investment securities | | $ | 184,586,320 | |
Aggregate unrealized (depreciation) of investment securities | | | (56,214,074 | ) |
Net unrealized appreciation of investment securities | | $ | 128,372,246 | |
Cost of investments for tax purposes is $1,165,140,124.
NOTE 9—Reclassification of Permanent Differences
Primarily as a result of differing book/tax treatment of foreign currency transactions, realized foreign capital gain taxes and fair funds settlements, on December 31, 2012, undistributed net investment income was decreased by $123,947 and undistributed net realized gain (loss) was increased by $123,947. This reclassification had no effect on the net assets of the Fund.
19 Invesco Global Core Equity Fund
NOTE 10—Share Information
| | | | | | | | | | | | | | | | |
| | | Summary of Share Activity | |
| | | Years ended December 31, | |
| | | 2012(a) | | | 2011 | |
| | | Shares | | | Amount | | | Shares | | | Amount | |
Sold: | | | | | | | | | | | | | | | | |
Class A | | | 2,138,267 | | | $ | 25,952,623 | | | | 2,544,323 | | | $ | 31,740,704 | |
Class B | | | 26,517 | | | | 311,731 | | | | 67,258 | | | | 824,011 | |
Class C | | | 217,700 | | | | 2,533,806 | | | | 389,671 | | | | 4,638,575 | |
Class R(b) | | | 7,712 | | | | 93,581 | | | | 7,087 | | | | 85,564 | |
Class Y | | | 390,816 | | | | 4,757,043 | | | | 291,554 | | | | 3,662,289 | |
Class R5 | | | 4,643 | | | | 58,097 | | | | 22,697 | | | | 258,766 | |
| | | | |
Issued as reinvestment of dividends: | | | | | | | | | | | | | | | | |
Class A | | | 1,445,343 | | | | 17,994,533 | | | | 1,004,337 | | | | 11,749,804 | |
Class B | | | 75,270 | | | | 899,472 | | | | 89,622 | | | | 1,009,005 | |
Class C | | | 111,934 | | | | 1,339,851 | | | | 80,509 | | | | 908,422 | |
Class R | | | 1,013 | | | | 12,607 | | | | 515 | | | | 6,014 | |
Class Y | | | 25,580 | | | | 318,473 | | | | 24,137 | | | | 282,033 | |
Class R5 | | | 434 | | | | 5,452 | | | | 252 | | | | 2,980 | |
| | | | |
Automatic conversion of Class B shares to Class A shares: | | | | | | | | | | | | | | | | |
Class A | | | 3,540,698 | | | | 42,781,734 | | | | 2,535,801 | | | | 30,942,917 | |
Class B | | | (3,693,245 | ) | | | (42,781,734 | ) | | | (2,642,806 | ) | | | (30,942,917 | ) |
| | | | |
Issued in connection with acquisitions:(c) | | | | | | | | | | | | | | | | |
Class A | | | — | | | | — | | | | 125,068,865 | | | | 1,689,820,674 | |
Class B | | | — | | | | — | | | | 15,457,247 | | | | 200,483,723 | |
Class C | | | — | | | | — | | | | 22,438,897 | | | | 291,205,521 | |
Class R | | | — | | | | — | | | | 62,480 | | | | 843,819 | |
Class Y | | | — | | | | — | | | | 4,738,188 | | | | 64,064,727 | |
Class R5 | | | — | | | | — | | | | 589 | | | | 8,035 | |
| | | | |
Reacquired:(d) | | | | | | | | | | | | | | | | |
Class A | | | (29,855,408 | ) | | | (361,212,490 | ) | | | (31,313,935 | ) | | | (381,361,334 | ) |
Class B | | | (2,164,602 | ) | | | (25,184,726 | ) | | | (3,329,529 | ) | | | (39,253,818 | ) |
Class C | | | (5,444,212 | ) | | | (63,046,259 | ) | | | (7,713,514 | ) | | | (90,813,634 | ) |
Class R | | | (4,089 | ) | | | (49,990 | ) | | | (12,469 | ) | | | (149,541 | ) |
Class Y | | | (1,262,853 | ) | | | (15,365,295 | ) | | | (2,955,251 | ) | | | (36,645,612 | ) |
Class R5 | | | (8,729 | ) | | | (107,765 | ) | | | (793 | ) | | | (10,280 | ) |
Net increase (decrease) in share activity | | | (34,447,211 | ) | | $ | (410,689,256 | ) | | | 126,855,732 | | | $ | 1,753,360,447 | |
| (a) | There are entities that are record owners of more than 5% of the outstanding shares of the Fund and in the aggregate own 50% of the outstanding shares of the Fund. IDI has an agreement with these entities to sell Fund shares. The Fund, Invesco and/or Invesco affiliates may make payments to these entities, which are considered to be related to the Fund, for providing services to the Fund, Invesco and/or Invesco affiliates including but not limited to services such as securities brokerage, distribution, third party record keeping and account servicing. The Fund has no knowledge as to whether all or any portion of the shares owned of record by these entities are also owned beneficially. |
| (b) | Commencement date of May 23, 2011. |
| (c) | As of the opening of business on May 23, 2011, the Fund acquired all of the net assets of Invesco Global Dividend Growth Securities Fund, Invesco Global Fund, Invesco Van Kampen Global Equity Allocation Fund and Invesco Van Kampen Global Franchise Fund (the “Target Funds”) pursuant to a plan of reorganization approved by the Trustees of the Fund on November 10, 2010 and by the shareholders of the Target Funds on April 14, 2011. The acquisition was accomplished by a tax-free exchange of 167,766,266 shares of the Fund for 35,013,132 shares outstanding of Invesco Global Dividend Growth Securities Fund, 1,577,538 shares outstanding of Invesco Global Fund, 11,100,636 shares outstanding of Invesco Van Kampen Global Equity Allocation Fund and 85,382,546 shares outstanding of Invesco Van Kampen Global Franchise Fund as of the close of business on May 20, 2011. Each class of shares of the Target Funds, with the exception of Class B Shares of Invesco Global Dividend Growth Securities Fund and Invesco Van Kampen Global Equity Allocation Fund, were exchanged for the like class of shares of the Fund based on the relative net asset value of the Target Funds to the net asset value of the Fund on the close of business, May 20, 2011. Class B Shares of Invesco Global Dividend Growth Securities Fund and Invesco Van Kampen Global Equity Allocation Fund were exchanged for Class A Shares of the Fund. Invesco Global Dividend Growth Securities Fund’s net assets at that date of $359,012,195, including $56,889,566 of unrealized appreciation, Invesco Global Fund’s net assets at that date of $17,754,131, including $1,508,865 of unrealized appreciation, Invesco Van Kampen Global Equity Allocation Fund’s net assets at that date of $196,249,902, including $25,187,697 of unrealized appreciation, and Invesco Van Kampen Global Franchise Fund’s net assets at that date of $1,673,410,271, including $192,749,625 of unrealized appreciation were combined with those of the Fund. The net assets of the Fund immediately before the acquisition were $73,994,151 and $2,320,420,649 immediately after the acquisition. |
| | The pro forma results of operations for the year ended December 31, 2011 assuming the reorganization had been completed on January 1, 2011, the beginning of the annual reporting period are as follows: |
| | | | |
Net investment income | | $ | 44,611,455 | |
Net realized/unrealized gains (losses) | | | (82,848,605 | ) |
Change in net assets resulting from operations | | $ | (38,237,150 | ) |
| | The combined investment portfolios have been managed as a single integrated portfolio since the acquisition was completed, it is not practicable to separate the amounts of revenue and earnings of each Target Fund that has been included in the Fund’s Statement of Operations since May 23, 2011. |
| (d) | Net of redemption fees of $123 and $54,242 allocated among the classes based on relative net assets of each class for the years ended December 31, 2012 and 2011, respectively. |
20 Invesco Global Core Equity Fund
NOTE 11—Financial Highlights
The following schedule presents financial highlights for a share of the Fund outstanding throughout the periods indicated.
| | | | | | | | | | | | | | | | | | | | | | | | | | | | | | | | | | | | | | | | | | | | | | | | | | | | | | | | |
| | | Net asset
value,
beginning
of period | | | Net
investment
income(a) | | | Net gains
(losses) on securities
(both
realized and
unrealized) | | | Total from
investment
operations | | | Dividends
from net
investment
income | | | Distributions
from net
realized
gains | | | Total
distributions | | | Net asset
value, end
of period(b) | | | Total
return(c) | | | Net assets,
end of period
(000’s omitted) | | | Ratio of
expenses
to average net assets
with fee waivers
and/or expenses
absorbed | | | Ratio of
expenses
to average net
assets without
fee waivers
and/or expenses
absorbed | | | Ratio of net
investment
income
to average
net assets | | | Portfolio
turnover(d) | |
Class A | | | | | | | | | | | | | | | | | | | | | | | | | | | | | | | | | | | | | | | | | | | | | | | | | | | | | | | | |
Year ended 12/31/12 | | $ | 11.49 | | | $ | 0.21 | | | $ | 1.30 | | | $ | 1.51 | | | $ | (0.24 | ) | | $ | (0.00 | ) | | $ | (0.24 | ) | | $ | 12.76 | | | | 13.22 | % | | $ | 1,038,232 | | | | 1.25 | %(e) | | | 1.34 | %(e) | | | 1.77 | %(e) | | | 23 | % |
Year ended 12/31/11 | | | 13.12 | | | | 0.17 | | | | (1.63 | ) | | | (1.46 | ) | | | (0.17 | ) | | | — | | | | (0.17 | ) | | | 11.49 | | | | (11.21 | ) | | | 1,195,593 | | | | 1.26 | | | | 1.35 | | | | 1.42 | | | | 104 | |
Year ended 12/31/10 | | | 12.36 | | | | 0.10 | | | | 0.74 | | | | 0.84 | | | | (0.08 | ) | | | — | | | | (0.08 | ) | | | 13.12 | | | | 6.85 | | | | 55,730 | | | | 1.78 | | | | 1.78 | | | | 0.84 | | | | 35 | |
Year ended 12/31/09 | | | 9.56 | | | | 0.12 | | | | 2.76 | | | | 2.88 | | | | (0.08 | ) | | | — | | | | (0.08 | ) | | | 12.36 | | | | 30.08 | | | | 65,333 | | | | 1.93 | | | | 1.93 | | | | 1.10 | | | | 43 | |
Year ended 12/31/08 | | | 15.75 | | | | 0.12 | | | | (6.27 | ) | | | (6.15 | ) | | | (0.04 | ) | | | — | | | | (0.04 | ) | | | 9.56 | | | | (39.03 | ) | | | 60,767 | | | | 1.58 | | | | 1.59 | | | | 0.96 | | | | 146 | |
Class B | | | | | | | | | | | | | | | | | | | | | | | | | | | | | | | | | | | | | | | | | | | | | | | | | | | | | | | | |
Year ended 12/31/12 | | | 11.03 | | | | 0.17 | | | | 1.25 | | | | 1.42 | | | | (0.20 | ) | | | (0.00 | ) | | | (0.20 | ) | | | 12.25 | | | | 12.94 | | | | 56,813 | | | | 1.52 | (e) | | | 2.09 | (e) | | | 1.50 | (e) | | | 23 | |
Year ended 12/31/11 | | | 12.63 | | | | 0.13 | | | | (1.59 | ) | | | (1.46 | ) | | | (0.14 | ) | | | — | | | | (0.14 | ) | | | 11.03 | | | | (11.60 | ) | | | 114,607 | | | | 1.55 | | | | 2.10 | | | | 1.13 | | | | 104 | |
Year ended 12/31/10 | | | 11.95 | | | | 0.01 | | | | 0.71 | | | | 0.72 | | | | (0.04 | ) | | | — | | | | (0.04 | ) | | | 12.63 | | | | 6.03 | | | | 9,509 | | | | 2.53 | | | | 2.53 | | | | 0.09 | | | | 35 | |
Year ended 12/31/09 | | | 9.26 | | | | 0.04 | | | | 2.65 | | | | 2.69 | | | | — | | | | — | | | | — | | | | 11.95 | | | | 29.05 | | | | 13,360 | | | | 2.68 | | | | 2.68 | | | | 0.35 | | | | 43 | |
Year ended 12/31/08 | | | 15.37 | | | | 0.03 | | | | (6.10 | ) | | | (6.07 | ) | | | (0.04 | ) | | | — | | | | (0.04 | ) | | | 9.26 | | | | (39.48 | ) | | | 15,675 | | | | 2.33 | | | | 2.34 | | | | 0.21 | | | | 146 | |
Class C | | | | | | | | | | | | | | | | | | | | | | | | | | | | | | | | | | | | | | | | | | | | | | | | | | | | | | | | |
Year ended 12/31/12 | | | 11.04 | | | | 0.12 | | | | 1.24 | | | | 1.36 | | | | (0.13 | ) | | | (0.00 | ) | | | (0.13 | ) | | | 12.27 | | | | 12.40 | | | | 134,387 | | | | 2.00 | (e) | | | 2.09 | (e) | | | 1.02 | (e) | | | 23 | |
Year ended 12/31/11 | | | 12.63 | | | | 0.08 | | | | (1.56 | ) | | | (1.48 | ) | | | (0.11 | ) | | | — | | | | (0.11 | ) | | | 11.04 | | | | (11.82 | ) | | | 177,330 | | | | 2.01 | | | | 2.10 | | | | 0.67 | | | | 104 | |
Year ended 12/31/10 | | | 11.96 | | | | 0.01 | | | | 0.70 | | | | 0.71 | | | | (0.04 | ) | | | — | | | | (0.04 | ) | | | 12.63 | | | | 5.95 | | | | 11,042 | | | | 2.53 | | | | 2.53 | | | | 0.09 | | | | 35 | |
Year ended 12/31/09 | | | 9.26 | | | | 0.04 | | | | 2.66 | | | | 2.70 | | | | — | | | | — | | | | — | | | | 11.96 | | | | 29.16 | | | | 12,900 | | | | 2.68 | | | | 2.68 | | | | 0.35 | | | | 43 | |
Year ended 12/31/08 | | | 15.38 | | | | 0.03 | | | | (6.11 | ) | | | (6.08 | ) | | | (0.04 | ) | | | — | | | | (0.04 | ) | | | 9.26 | | | | (39.52 | ) | | | 12,604 | | | | 2.33 | | | | 2.34 | | | | 0.21 | | | | 146 | |
Class R | | | | | | | | | | | | | | | | | | | | | | | | | | | | | | | | | | | | | | | | | | | | | | | | | | | | | | | | |
Year ended 12/31/12 | | | 11.48 | | | | 0.18 | | | | 1.30 | | | | 1.48 | | | | (0.20 | ) | | | (0.00 | ) | | | (0.20 | ) | | | 12.76 | | | | 12.98 | | | | 794 | | | | 1.50 | (e) | | | 1.59 | (e) | | | 1.52 | (e) | | | 23 | |
Year ended 12/31/11(f) | | | 13.30 | | | | 0.09 | | | | (1.80 | ) | | | (1.71 | ) | | | (0.11 | ) | | | — | | | | (0.11 | ) | | | 11.48 | | | | (12.89 | ) | | | 661 | | | | 1.50 | (g) | | | 1.59 | (g) | | | 1.18 | (g) | | | 104 | |
Class Y | | | | | | | | | | | | | | | | | | | | | | | | | | | | | | | | | | | | | | | | | | | | | | | | | | | | | | | | |
Year ended 12/31/12 | | | 11.49 | | | | 0.24 | | | | 1.31 | | | | 1.55 | | | | (0.28 | ) | | | (0.00 | ) | | | (0.28 | ) | | | 12.76 | | | | 13.53 | | | | 16,646 | | | | 1.00 | (e) | | | 1.09 | (e) | | | 2.02 | (e) | | | 23 | |
Year ended 12/31/11 | | | 13.11 | | | | 0.20 | | | | (1.63 | ) | | | (1.43 | ) | | | (0.19 | ) | | | — | | | | (0.19 | ) | | | 11.49 | | | | (10.99 | ) | | | 24,711 | | | | 1.01 | | | | 1.10 | | | | 1.67 | | | | 104 | |
Year ended 12/31/10 | | | 12.36 | | | | 0.13 | | | | 0.74 | | | | 0.87 | | | | (0.12 | ) | | | — | | | | (0.12 | ) | | | 13.11 | | | | 7.05 | | | | 689 | | | | 1.53 | | | | 1.53 | | | | 1.09 | | | | 35 | |
Year ended 12/31/09 | | | 9.56 | | | | 0.14 | | | | 2.76 | | | | 2.90 | | | | (0.10 | ) | | | — | | | | (0.10 | ) | | | 12.36 | | | | 30.39 | | | | 663 | | | | 1.68 | | | | 1.68 | | | | 1.35 | | | | 43 | |
Year ended 12/31/08(f) | | | 11.29 | | | | 0.02 | | | | (1.71 | ) | | | (1.69 | ) | | | (0.04 | ) | | | — | | | | (0.04 | ) | | | 9.56 | | | | (14.95 | ) | | | 345 | | | | 1.67 | (g) | | | 1.67 | (g) | | | 0.87 | (g) | | | 146 | |
Class R5 | | | | | | | | | | | | | | | | | | | | | | | | | | | | | | | | | | | | | | | | | | | | | | | | | | | | | | | | |
Year ended 12/31/12 | | | 11.61 | | | | 0.25 | | | | 1.32 | | | | 1.57 | | | | (0.28 | ) | | | (0.00 | ) | | | (0.28 | ) | | | 12.90 | | | | 13.59 | | | | 275 | | | | 0.96 | (e) | | | 0.96 | (e) | | | 2.06 | (e) | | | 23 | |
Year ended 12/31/11 | | | 13.21 | | | | 0.20 | | | | (1.61 | ) | | | (1.41 | ) | | | (0.19 | ) | | | — | | | | (0.19 | ) | | | 11.61 | | | | (10.76 | ) | | | 290 | | | | 0.96 | | | | 0.96 | | | | 1.72 | | | | 104 | |
Year ended 12/31/10 | | | 12.45 | | | | 0.17 | | | | 0.75 | | | | 0.92 | | | | (0.16 | ) | | | — | | | | (0.16 | ) | | | 13.21 | | | | 7.45 | | | | 30 | | | | 1.23 | | | | 1.23 | | | | 1.38 | | | | 35 | |
Year ended 12/31/09 | | | 9.61 | | | | 0.17 | | | | 2.82 | | | | 2.99 | | | | (0.15 | ) | | | — | | | | (0.15 | ) | | | 12.45 | | | | 31.17 | | | | 11 | | | | 1.24 | | | | 1.24 | | | | 1.79 | | | | 43 | |
Year ended 12/31/08 | | | 15.77 | | | | 0.22 | | | | (6.34 | ) | | | (6.12 | ) | | | (0.04 | ) | | | — | | | | (0.04 | ) | | | 9.61 | | | | (38.79 | ) | | | 118 | | | | 0.97 | | | | 0.98 | | | | 1.57 | | | | 146 | |
| (a) | Calculated using average shares outstanding. |
| (b) | Includes redemption fees added to shares of beneficial interest which were less than $0.005 per share. |
| (c) | Includes adjustments in accordance with accounting principles generally accepted in the United States of America and as such, the net asset value for financial reporting purposes and the returns based upon those net asset values may differ from the net asset value and returns for shareholder transactions. Does not include sales charges and is not annualized for periods less than one year, if applicable. |
| (d) | Portfolio turnover is calculated at the fund level and is not annualized for periods less than one year, if applicable. For the year ended December 31, 2011, the portfolio turnover calculation excludes the value of securities purchased of $1,736,154,552 and sold of $1,280,761,748 in the effort to realign the Fund’s portfolio holdings after the reorganization of Invesco Global Dividend Growth Securities Fund, Invesco Global Fund, Invesco Van Kampen Global Equity Allocation Fund and Invesco Van Kampen Global Franchise Fund into the Fund. |
| (e) | Ratios are based on average daily net assets (000’s) of $1,105,159, $82,339, $153,562, $732, $20,636 and $299 for Class A, Class B, Class C, Class R, Class Y and Class R5 shares, respectively. |
| (f) | Commencement date of May 23, 2011 and October 3, 2008 for Class R and Class Y shares, respectively. |
21 Invesco Global Core Equity Fund
Report of Independent Registered Public Accounting Firm
To the Board of Trustees of AIM Funds Group (Invesco Funds Group)
and Shareholders of Invesco Global Core Equity Fund:
In our opinion, the accompanying statement of assets and liabilities, including the schedule of investments, and the related statements of operations and of changes in net assets and the financial highlights present fairly, in all material respects, the financial position of Invesco Global Core Equity Fund (one of the funds constituting AIM Funds Group (Invesco Funds Group), hereafter referred to as the “Fund”) at December 31, 2012, the results of its operations for the year then ended, the changes in its net assets for each of the two years in the period then ended and the financial highlights for each of the five years in the period then ended, in conformity with accounting principles generally accepted in the United States of America. These financial statements and financial highlights (hereafter referred to as “financial statements”) are the responsibility of the Fund’s management; our responsibility is to express an opinion on these financial statements based on our audits. We conducted our audits of these financial statements in accordance with the standards of the Public Company Accounting Oversight Board (United States). Those standards require that we plan and perform the audit to obtain reasonable assurance about whether the financial statements are free of material misstatement. An audit includes examining, on a test basis, evidence supporting the amounts and disclosures in the financial statements, assessing the accounting principles used and significant estimates made by management, and evaluating the overall financial statement presentation. We believe that our audits, which included confirmation of securities at December 31, 2012 by correspondence with the custodian and brokers, provide a reasonable basis for our opinion.
PRICEWATERHOUSECOOPERS LLP
February 25, 2013
Houston, Texas
22 Invesco Global Core Equity Fund
Calculating your ongoing Fund expenses
Example
As a shareholder of the Fund, you incur two types of costs: (1) transaction costs, which may include sales charges (loads) on purchase payments or contingent deferred sales charges on redemptions, and redemption fees, if any; and (2) ongoing costs, including management fees, distribution and/or service (12b-1) fees, and other Fund expenses. This example is intended to help you understand your ongoing costs (in dollars) of investing in the Fund and to compare these costs with ongoing costs of investing in other mutual funds. The example is based on an investment of $1,000 invested at the beginning of the period and held for the entire period July 1, 2012 through December 31, 2012.
Actual expenses
The table below provides information about actual account values and actual expenses. You may use the information in this table, together with the amount you invested, to estimate the expenses that you paid over the period. Simply divide your account value by $1,000 (for example, an $8,600 account value divided by $1,000 = 8.6), then multiply the result by the number in the table under the heading entitled “Actual Expenses Paid During Period” to estimate the expenses you paid on your account during this period.
Hypothetical example for comparison purposes
The table below also provides information about hypothetical account values and hypothetical expenses based on the Fund’s actual expense ratio and an assumed rate of return of 5% per year before expenses, which is not the Fund’s actual return.
The hypothetical account values and expenses may not be used to estimate the actual ending account balance or expenses you paid for the period. You may use this information to compare the ongoing costs of investing in the Fund and other funds. To do so, compare this 5% hypothetical example with the 5% hypothetical examples that appear in the shareholder reports of the other funds.
Please note that the expenses shown in the table are meant to highlight your ongoing costs only and do not reflect any transaction costs, such as sales charges (loads) on purchase payments, contingent deferred sales charges on redemptions, and redemption fees, if any. Therefore, the hypothetical information is useful in comparing ongoing costs only, and will not help you determine the relative total costs of owning different funds. In addition, if these transaction costs were included, your costs would have been higher.
| | | | | | | | | | | | | | | | | | | | | | | | |
| Class | | Beginning
Account Value
(07/01/12) | | | ACTUAL | | | HYPOTHETICAL (5% annual return before expenses) | | | Annualized
Expense
Ratio | |
| | | Ending
Account Value
(12/31/12)1 | | | Expenses
Paid During
Period2 | | | Ending
Account Value
(12/31/12) | | | Expenses
Paid During
Period2 | | |
| A | | $ | 1,000.00 | | | $ | 1,122.40 | | | $ | 6.65 | | | $ | 1,018.87 | | | $ | 6.33 | | | | 1.25 | % |
| B | | | 1,000.00 | | | | 1,121.30 | | | | 8.09 | | | | 1,017.51 | | | | 7.69 | | | | 1.52 | |
| C | | | 1,000.00 | | | | 1,117.90 | | | | 10.63 | | | | 1,015.10 | | | | 10.12 | | | | 2.00 | |
| R | | | 1,000.00 | | | | 1,121.00 | | | | 7.98 | | | | 1,017.61 | | | | 7.59 | | | | 1.50 | |
| Y | | | 1,000.00 | | | | 1,123.60 | | | | 5.32 | | | | 1,020.12 | | | | 5.06 | | | | 1.00 | |
| R5 | | | 1,000.00 | | | | 1,123.30 | | | | 5.16 | | | | 1,020.28 | | | | 4.91 | | | | 0.97 | |
| 1 | The actual ending account value is based on the actual total return of the Fund for the period July 1, 2012 through December 31, 2012, after actual expenses and will differ from the hypothetical ending account value which is based on the Fund’s expense ratio and a hypothetical annual return of 5% before expenses. |
| 2 | Expenses are equal to the Fund’s annualized expense ratio as indicated above multiplied by the average account value over the period, multiplied by 184/366 to reflect the most recent fiscal half year. |
23 Invesco Global Core Equity Fund
Tax Information
Form 1099-DIV, Form 1042-S and other year—end tax information provide shareholders with actual calendar year amounts that should be included in their tax returns. Shareholders should consult their tax advisors.
The following distribution information is being provided as required by the Internal Revenue Code or to meet a specific state’s requirement.
The Fund designates the following amounts or, if subsequently determined to be different, the maximum amount allowable for its fiscal year ended December 31, 2012:
| | | | |
Federal and State Income Tax | |
Long-Term Capital Gain Dividends | | $ | 120,507 | |
Qualified Dividend Income* | | | 100 | % |
Corporate Dividends Received Deduction* | | | 54.14 | % |
| | * | The above percentages are based on ordinary income dividends paid to shareholders during the Fund’s fiscal year. |
24 Invesco Global Core Equity Fund
Trustees and Officers
The address of each trustee and officer is AIM Funds Group (Invesco Funds Group) (the “Trust”), 11 Greenway Plaza, Suite 1000, Houston, Texas 77046-1173. The trustees serve for the life of the Trust, subject to their earlier death, incapacitation, resignation, retirement or removal as more specifically provided in the Trust’s organizational documents. Each officer serves for a one year term or until their successors are elected and qualified. Column two below includes length of time served with predecessor entities, if any.
| | | | | | | | |
Name, Year of Birth and
Position(s) Held with the Trust | | Trustee and/
or Officer Since | | Principal Occupation(s)
During Past 5 Years | | Number of
Funds in Fund
Complex
Overseen by
Trustee | | Other Directorship(s)
Held by Trustee During
Past 5 Years |
| Interested Persons | | | | | | | | |
| Martin L. Flanagan1 — 1960 Trustee | | 2007 | | Executive Director, Chief Executive Officer and President, Invesco Ltd. (ultimate parent of Invesco and a global investment management firm); Advisor to the Board, Invesco Advisers, Inc. (formerly known as Invesco Institutional (N.A.), Inc.); Trustee, The Invesco Funds; Vice Chair, Investment Company Institute; and Member of Executive Board, SMU Cox School of Business Formerly: Chairman and Chief Executive Officer, Invesco Advisers, Inc. (registered investment adviser); Director, Chairman, Chief Executive Officer and President, IVZ Inc. (holding company), INVESCO Group Services, Inc. (service provider) and Invesco North American Holdings, Inc. (holding company); Director, Chief Executive Officer and President, Invesco Holding Company Limited (parent of Invesco and a global investment management firm); Director, Invesco Ltd.; Chairman, Investment Company Institute and President, Co-Chief Executive Officer, Co-President, Chief Operating Officer and Chief Financial Officer, Franklin Resources, Inc. (global investment management organization) | | 124 | | None |
| Philip A. Taylor2 — 1954 Trustee, President and Principal Executive Officer | | 2006 | | Head of North American Retail and Senior Managing Director, Invesco Ltd.; Director, Co-Chairman, Co-President and Co-Chief Executive Officer, Invesco Advisers, Inc. (formerly known as Invesco Institutional (N.A.), Inc.) (registered investment adviser); Director, Chairman, Chief Executive Officer and President, Invesco Management Group, Inc. (formerly known as Invesco Aim Management Group, Inc.) (financial services holding company); Director and President, INVESCO Funds Group, Inc. (registered investment adviser and registered transfer agent); Director and Chairman, Invesco Investment Services, Inc. (formerly known as Invesco Aim Investment Services, Inc.) (registered transfer agent) and IVZ Distributors, Inc. (formerly known as INVESCO Distributors, Inc.) (registered broker dealer); Director, President and Chairman, Invesco Inc. (holding company) and Invesco Canada Holdings Inc. (holding company); Chief Executive Officer, Invesco Corporate Class Inc. (corporate mutual fund company) and Invesco Canada Fund Inc. (corporate mutual fund company); Director, Chairman and Chief Executive Officer, Invesco Canada Ltd. (formerly known as Invesco Trimark Ltd./Invesco Trimark Ltèe) (registered investment adviser and registered transfer agent); Trustee, President and Principal Executive Officer, The Invesco Funds (other than AIM Treasurer’s Series Trust (Invesco Treasurer’s Series Trust) and Short-Term Investments Trust); Trustee and Executive Vice President, The Invesco Funds (AIM Treasurer’s Series Trust (Invesco Treasurer’s Series Trust) and Short-Term Investments Trust only); Director, Invesco Investment Advisers LLC (formerly known as Van Kampen Asset Management); Director, Chief Executive Officer and President, Van Kampen Exchange Corp. Formerly: Director and Chairman, Van Kampen Investor Services Inc.: Director, Chief Executive Officer and President, 1371 Preferred Inc. (holding company); and Van Kampen Investments Inc.; Director and President, AIM GP Canada Inc. (general partner for limited partnerships); and Van Kampen Advisors, Inc.; Director and Chief Executive Officer, Invesco Trimark Dealer Inc. (registered broker dealer); Director, Invesco Distributors, Inc. (formerly known as Invesco Aim Distributors, Inc.) (registered broker dealer); Manager, Invesco PowerShares Capital Management LLC; Director, Chief Executive Officer and President, Invesco Advisers, Inc.; Director, Chairman, Chief Executive Officer and President, Invesco Aim Capital Management, Inc.; President, Invesco Trimark Dealer Inc. and Invesco Trimark Ltd./Invesco Trimark Ltèe; Director and President, AIM Trimark Corporate Class Inc. and AIM Trimark Canada Fund Inc.; Senior Managing Director, Invesco Holding Company Limited; Trustee and Executive Vice President, Tax-Free Investments Trust; Director and Chairman, Fund Management Company (former registered broker dealer); President and Principal Executive Officer, The Invesco Funds (AIM Treasurer’s Series Trust (Invesco Treasurer’s Series Trust), Short-Term Investments Trust and Tax-Free Investments Trust only); President, AIM Trimark Global Fund Inc. and AIM Trimark Canada Fund Inc. | | 124 | | None |
Wayne W. Whalen3 — 1939 Trustee | | 2010 | | Of Counsel, and prior to 2010, partner in the law firm of Skadden, Arps, Slate, Meagher & Flom LLP, legal counsel to certain funds in the Fund Complex | | 137 | | Director of the Mutual Fund Directors Forum, a nonprofit membership organization for investment directors; Chairman and Director of the Abraham Lincoln Presidential Library Foundation; and Director of the Stevenson Center for Democracy |
| 1 | Mr. Flanagan is considered an interested person of the Trust because he is an officer of the adviser to the Trust, and an officer and a director of Invesco Ltd., ultimate parent of the adviser to the Trust. |
| 2 | Mr. Taylor is considered an interested person of the Trust because he is an officer and a director of the adviser to, and a director of the principal underwriter of, the Trust. |
| 3 | Mr. Whalen is considered an “interested person” (within the meaning of Section 2(a)(19) of the 1940 Act) of certain Funds in the Invesco Fund Complex by reason of he and his firm currently providing legal services as legal counsel to such Funds in the Invesco Fund Complex. |
T-1 Invesco Global Core Equity Fund
Trustees and Officers—(continued)
| | | | | | | | |
Name, Year of Birth and
Position(s) Held with the Trust | | Trustee and/
or Officer Since | | Principal Occupation(s)
During Past 5 Years | | Number of
Funds in Fund
Complex
Overseen by
Trustee | | Other Directorship(s)
Held by Trustee During
Past 5 Years |
| Independent Trustees | | | | | | | | |
Bruce L. Crockett — 1944 Trustee and Chair | | 1987 | | Chairman, Crockett Technologies Associates (technology consulting company) Formerly: Director, Captaris (unified messaging provider); Director, President and Chief Executive Officer COMSAT Corporation; and Chairman, Board of Governors of INTELSAT (international communications company) | | 124 | | ACE Limited (insurance company); and Investment Company Institute |
David C. Arch — 1945 Trustee | | 2010 | | Chairman and Chief Executive Officer of Blistex Inc., (consumer health care products manufacturer) Formerly: Member of the Heartland Alliance Advisory Board, a nonprofit organization serving human needs based in Chicago | | 137 | | Board member of the Illinois Manufacturers’ Association; Member of the Board of Visitors, Institute for the Humanities, University of Michigan |
Frank S. Bayley — 1939 Trustee | | 2001 | | Retired Formerly: Director, Badgley Funds, Inc. (registered investment company) (2 portfolios) and General Partner and Of Counsel, law firm of Baker & McKenzie, LLP | | 124 | | Director and Chairman, C.D. Stimson Company (a real estate investment company); Trustee and Overseer, The Curtis institute of Music |
James T. Bunch — 1942 Trustee | | 2003 | | Managing Member, Grumman Hill Group LLC (family office private equity management) Formerly: Founder, Green, Manning & Bunch Ltd. (investment banking firm)(1988-2010); Executive Committee, United States Golf Association; and Director, Policy Studies, Inc. and Van Gilder Insurance Corporation | | 124 | | Chairman, Board of Governors, Western Golf Association; Chairman-elect, Evans Scholars Foundation; and Director, Denver Film Society |
Rodney F. Dammeyer — 1940 Trustee | | 2010 | | Chairman of CAC, LLC, (private company offering capital investment and management advisory services) Formerly: Prior to 2001, Managing Partner at Equity Group Corporate Investments; Prior to 1995, Vice Chairman of Anixter International; Prior to 1985, experience includes Senior Vice President and Chief Financial Officer of Household International, Inc., Executive Vice President and Chief Financial Officer of Northwest Industries, Inc. and Partner of Arthur Andersen & Co.; From 1987 to 2010, Director/Trustee of investment companies in the Van Kampen Funds complex | | 126 | | Director of Quidel Corporation and Stericycle, Inc.; Prior to May 2008, Trustee of The Scripps Research Institute; Prior to February 2008, Director of Ventana Medical Systems, Inc.; Prior to April 2007, Director of GATX Corporation; Prior to April 2004, Director of TheraSense, Inc. |
Albert R. Dowden — 1941 Trustee | | 2000 | | Director of a number of public and private business corporations, including the Boss Group, Ltd. (private investment and management); Reich & Tang Funds (5 portfolios) (registered investment company); and Homeowners of America Holding Corporation/ Homeowners of America Insurance Company (property casualty company) Formerly: Director, Continental Energy Services, LLC (oil and gas pipeline service); Director, CompuDyne Corporation (provider of product and services to the public security market) and Director, Annuity and Life Re (Holdings), Ltd. (reinsurance company); Director, President and Chief Executive Officer, Volvo Group North America, Inc.; Senior Vice President, AB Volvo; Director of various public and private corporations; Chairman, DHJ Media, Inc.; Director Magellan Insurance Company; and Director, The Hertz Corporation, Genmar Corporation (boat manufacturer), National Media Corporation; Advisory Board of Rotary Power International (designer, manufacturer, and seller of rotary power engines); and Chairman, Cortland Trust, Inc. (registered investment company) | | 124 | | Director of Nature’s Sunshine Products, Inc. |
Jack M. Fields — 1952 Trustee | | 1997 | | Chief Executive Officer, Twenty First Century Group, Inc. (government affairs company); Owner and Chief Executive Officer, Dos Angeles Ranch, L.P. (cattle, hunting, corporate entertainment); and Discovery Global Education Fund (non-profit) Formerly: Chief Executive Officer, Texana Timber LP (sustainable forestry company); Director of Cross Timbers Quail Research Ranch (non-profit); and member of the U.S. House of Representatives | | 124 | | Insperity, Inc. (formerly known as Administaff) |
Prema Mathai-Davis — 1950 Trustee | | 1998 | | Retired Formerly: Chief Executive Officer, YWCA of the U.S.A. | | 124 | | None |
Larry Soll — 1942 Trustee | | 2003 | | Retired Formerly: Chairman, Chief Executive Officer and President, Synergen Corp. (a biotechnology company) | | 124 | | None |
Hugo F. Sonnenschein — 1940 Trustee | | 2010 | | Distinguished Service Professor and President Emeritus of the University of Chicago and the Adam Smith Distinguished Service Professor in the Department of Economics at the University of Chicago Formerly: President of the University of Chicago | | 137 | | Trustee of the University of Rochester and a member of its investment committee. Member of the National Academy of Sciences, the American Philosophical Society and a fellow of the American Academy of Arts and Sciences |
T-2 Invesco Global Core Equity Fund
Trustees and Officers—(continued)
| | | | | | | | |
Name, Year of Birth and
Position(s) Held with the Trust | | Trustee and/
or Officer Since | | Principal Occupation(s)
During Past 5 Years | | Number of
Funds in Fund
Complex
Overseen by
Trustee | | Other Directorship(s)
Held by Trustee During
Past 5 Years |
| Independent Trustees—(continued) |
Raymond Stickel, Jr. — 1944 Trustee | | 2005 | | Retired Formerly: Director, Mainstay VP Series Funds, Inc. (25 portfolios) and Partner, Deloitte & Touche | | 124 | | None |
| Other Officers | | | | | | | | |
Russell C. Burk — 1958
Senior Vice President and Senior Officer | | 2005 | | Senior Vice President and Senior Officer, The Invesco Funds | | N/A | | N/A |
John M. Zerr — 1962
Senior Vice President, Chief Legal Officer and Secretary | | 2006 | | Director, Senior Vice President, Secretary and General Counsel, Invesco Management Group, Inc. (formerly known as Invesco Aim Management Group, Inc.) and Van Kampen Exchange Corp.; Senior Vice President, Invesco Advisers, Inc. (formerly known as Invesco Institutional (N.A.), Inc.) (registered investment adviser); Senior Vice President and Secretary, Invesco Distributors, Inc. (formerly known as Invesco Aim Distributors, Inc.); Director, Vice President and Secretary, Invesco Investment Services, Inc. (formerly known as Invesco Aim Investment Services, Inc.) and IVZ Distributors, Inc. (formerly known as INVESCO Distributors, Inc.); Director and Vice President, INVESCO Funds Group, Inc.; Senior Vice President, Chief Legal Officer and Secretary, The Invesco Funds; Manager, Invesco PowerShares Capital Management LLC; Director, Secretary and General Counsel, Invesco Investment Advisers LLC (formerly known as Van Kampen Asset Management); Secretary and General Counsel, Van Kampen Funds Inc. and Chief Legal Officer, PowerShares Exchange-Traded Fund Trust, PowerShares Exchange-Traded Fund Trust II, PowerShares India Exchange-Traded Fund Trust and PowerShares Actively Managed Exchange-Traded Fund Trust Formerly: Director and Vice President, Van Kampen Advisors Inc.; Director, Vice President, Secretary and General Counsel Van Kampen Investor Services Inc.; Director, Invesco Distributors, Inc. (formerly known as Invesco Aim Distributors, Inc.); Director, Senior Vice President, General Counsel and Secretary, Invesco Advisers, Inc. and Van Kampen Investments Inc.; Director, Vice President and Secretary, Fund Management Company; Director, Senior Vice President, Secretary, General Counsel and Vice President, Invesco Aim Capital Management, Inc.; Chief Operating Officer and General Counsel, Liberty Ridge Capital, Inc. (an investment adviser); Vice President and Secretary, PBHG Funds (an investment company) and PBHG Insurance Series Fund (an investment company); Chief Operating Officer, General Counsel and Secretary, Old Mutual Investment Partners (a broker-dealer); General Counsel and Secretary, Old Mutual Fund Services (an administrator) and Old Mutual Shareholder Services (a shareholder servicing center); Executive Vice President, General Counsel and Secretary, Old Mutual Capital, Inc. (an investment adviser); and Vice President and Secretary, Old Mutual Advisors Funds (an investment company) | | N/A | | N/A |
Karen Dunn Kelley — 1960
Vice President | | 1992 | | Head of Invesco’s World Wide Fixed Income and Cash Management Group; Senior Vice President, Invesco Management Group, Inc. (formerly known as Invesco Aim Management Group, Inc.) and Invesco Advisers, Inc. (formerly known as Invesco Institutional (N.A.), Inc.) (registered investment adviser); Executive Vice President, Invesco Distributors, Inc. (formerly known as Invesco Aim Distributors, Inc.); Director, Invesco Mortgage Capital Inc., INVESCO Global Asset Management Limited, Invesco Management Company Limited and INVESCO Management S.A.; Vice President, The Invesco Funds (other than AIM Treasurer’s Series Trust (Invesco Treasurer’s Series Trust) and Short-Term Investments Trust); and President and Principal Executive Officer, The Invesco Funds (AIM Treasurer’s Series Trust (Invesco Treasurer’s Series Trust) and Short-Term Investments Trust only) Formerly: Senior Vice President, Van Kampen Investments Inc.; Vice President, Invesco Advisers, Inc. (formerly known as Invesco Institutional (N.A.), Inc.); Director of Cash Management and Senior Vice President, Invesco Advisers, Inc. and Invesco Aim Capital Management, Inc.; President and Principal Executive Officer, Tax-Free Investments Trust; Director and President, Fund Management Company; Chief Cash Management Officer, Director of Cash Management, Senior Vice President, and Managing Director, Invesco Aim Capital Management, Inc.; Director of Cash Management, Senior Vice President, and Vice President, Invesco Advisers, Inc. and The Invesco Funds (AIM Treasurer’s Series Trust (Invesco Treasurer’s Series Trust), Short-Term Investments Trust and Tax-Free Investments Trust only) | | N/A | | N/A |
T-3 Invesco Global Core Equity Fund
Trustees and Officers—(continued)
| | | | | | | | |
Name, Year of Birth and
Position(s) Held with the Trust | | Trustee and/
or Officer Since | | Principal Occupation(s)
During Past 5 Years | | Number of
Funds in Fund
Complex
Overseen by
Trustee | | Other Directorship(s)
Held by Trustee During
Past 5 Years |
| Other Officers—(continued) | | | | | | | | |
Sheri Morris — 1964
Vice President, Treasurer and Principal Financial Officer | | 1999 | | Vice President, Treasurer and Principal Financial Officer, The Invesco Funds; Vice President, Invesco Advisers, Inc. (formerly known as Invesco Institutional (N.A.), Inc.) (registered investment adviser); and Vice President, PowerShares Exchange-Traded Fund Trust, PowerShares Exchange-Traded Fund Trust II, PowerShares India Exchange-Traded Fund Trust and PowerShares Actively Managed Exchange-Traded Fund Trust Formerly: Vice President, Invesco Aim Advisers, Inc., Invesco Aim Capital Management, Inc. and Invesco Aim Private Asset Management, Inc.; Assistant Vice President and Assistant Treasurer, The Invesco Funds and Assistant Vice President, Invesco Advisers, Inc., Invesco Aim Capital Management, Inc. and Invesco Aim Private Asset Management, Inc.; and Treasurer, PowerShares Exchange-Traded Fund Trust, PowerShares Exchange-Traded Fund Trust II, PowerShares India Exchange-Traded Fund Trust and PowerShares Actively Managed Exchange-Traded Fund Trust | | N/A | | N/A |
Yinka Akinsola — 1977 Anti-Money Laundering Compliance Officer | | 2011 | | Anti-Money Laundering Compliance Officer, Invesco Advisers, Inc. (formerly known as Invesco Institutional (N.A.), Inc.) (registered investment adviser); Invesco Distributors, Inc. (formerly known as Invesco Aim Distributors, Inc.), Invesco Investment Services, Inc. (formerly known as Invesco Aim Investment Services, Inc.), Invesco Management Group, Inc., The Invesco Funds, Invesco Van Kampen Closed-End Funds, Van Kampen Exchange Corp., Van Kampen Funds Inc., PowerShares Exchange-Traded Fund Trust, PowerShares Exchange-Traded Fund Trust II, PowerShares India Exchange-Traded Fund Trust, and PowerShares Actively Managed Exchange-Traded Fund Trust Formerly: Regulatory Analyst III, Financial Industry Regulatory Authority (FINRA) | | N/A | | N/A |
Todd L. Spillane — 1958
Chief Compliance Officer | | 2006 | | Senior Vice President, Invesco Management Group, Inc. (formerly known as Invesco Aim Management Group, Inc.) and Van Kampen Exchange Corp.; Senior Vice President and Chief Compliance Officer, Invesco Advisers, Inc. (registered investment adviser) (formerly known as Invesco Institutional (N.A.), Inc.); Chief Compliance Officer, The Invesco Funds; Vice President, Invesco Distributors, Inc. (formerly known as Invesco Aim Distributors, Inc.) and Invesco Investment Services, Inc. (formerly known as Invesco Aim Investment Services, Inc.) Formerly: Chief Compliance Officer, Invesco Van Kampen Closed-End Funds; Senior Vice President, Van Kampen Investments Inc.; Senior Vice President and Chief Compliance Officer, Invesco Aim Advisers, Inc. and Invesco Aim Capital Management, Inc.; Chief Compliance Officer, INVESCO Private Capital Investments, Inc. (holding company), Invesco Private Capital, Inc. (registered investment adviser), Invesco Global Asset Management (N.A.), Inc., Invesco Senior Secured Management, Inc. (registered investment adviser), Van Kampen Investor Services Inc., PowerShares Exchange-Traded Fund Trust, PowerShares Exchange-Traded Fund Trust II, PowerShares India Exchange-Traded Fund Trust and PowerShares Actively Managed Exchange-Traded Fund Trust; and Vice President, Invesco Aim Capital Management, Inc. and Fund Management Company | | N/A | | N/A |
The Statement of Additional Information of the Trust includes additional information about the Fund’s Trustees and is available upon request, without charge, by calling 1.800.959.4246. Please refer to the Fund’s prospectus for information on the Fund’s sub-advisers.
| | | | | | |
Office of the Fund 11 Greenway Plaza, Suite 1000 Houston, TX 77046-1173 | | Investment Adviser Invesco Advisers, Inc. 1555 Peachtree Street, N.E.
Atlanta, GA 30309 | | Distributor Invesco Distributors, Inc. 11 Greenway Plaza, Suite 1000 Houston, TX 77046-1173 | | Auditors PricewaterhouseCoopers LLP 1201 Louisiana Street, Suite 2900 Houston, TX 77002-5678 |
| | | |
| | | | | | |
Counsel to the Fund Stradley Ronon Stevens & Young, LLP 2005 Market Street, Suite 2600 Philadelphia, PA 19103-7018 | | Counsel to the Independent Trustees Goodwin Procter LLP
901 New York Avenue, N.W.
Washington, D.C. 20001 | | Transfer Agent Invesco Investment Services, Inc. 11 Greenway Plaza, Suite 1000 Houston, TX 77046-1173 | | Custodian State Street Bank and Trust Company 225 Franklin Street
Boston, MA 02110-2801 |
T-4 Invesco Global Core Equity Fund

Invesco mailing information
Send general correspondence to Invesco Investment Services, Inc., P.O. Box 219078, Kansas City, MO 64121-9078.
Invesco privacy policy
You share personal and financial information with us that is necessary for your transactions and your account records. We take very seriously the obligation to keep that information confidential and private.
Invesco collects nonpublic personal information about you from account applications or other forms you complete and from your transactions with us or our affiliates. We do not disclose information about you or our former customers to service providers or other third parties except to the extent necessary to service your account and in other limited circumstances as permitted by law. For example, we use this information to facilitate the delivery of transaction confirmations, financial reports, prospectuses and tax forms.
Even within Invesco, only people involved in the servicing of your accounts and compliance monitoring have access to your information. To ensure the highest level of confidentiality and security, Invesco maintains physical, electronic and procedural safeguards that meet or exceed federal standards. Special measures, such as data encryption and authentication, apply to your communications with us on our website. More detail is available to you at invesco.com/privacy.
Important notice regarding delivery of security holder documents
To reduce Fund expenses, only one copy of most shareholder documents may be mailed to shareholders with multiple accounts at the same address (Householding). Mailing of your shareholder documents may be householded indefinitely unless you instruct us otherwise. If you do not want the mailing of these documents to be combined with those for other members of your household, please contact Invesco Investment Services, Inc. at 800 959 4246 or contact your financial institution. We will begin sending you individual copies for each account within 30 days after receiving your request.
Fund holdings and proxy voting information
The Fund provides a complete list of its holdings four times in each fiscal year, at the quarter-ends. For the second and fourth quarters, the lists appear in the Fund’s semiannual and annual reports to shareholders. For the first and third quarters, the Fund files the lists with the Securities and Exchange Commission (SEC) on Form N-Q. The most recent list of portfolio holdings is available at invesco.com/completeqtrholdings. Shareholders can also look up the Fund’s Forms N-Q on the SEC website at sec.gov. Copies of the Fund’s Forms N-Q may be reviewed and copied at the SEC Public Reference Room in Washington, D.C. You can obtain information on the operation of the Public Reference Room, including information about duplicating fee charges, by calling 202 551 8090 or 800 732 0330, or by electronic request at the following email address: publicinfo@sec.gov. The SEC file numbers for the Fund are shown below.
A description of the policies and procedures that the Fund uses to determine how to vote proxies relating to portfolio securities is available without charge, upon request, from our Client Services department at 800 959 4246 or at invesco.com/proxyguidelines. The information is also available on the SEC website, sec.gov.
| | |
Information regarding how the Fund voted proxies related to its portfolio securities during the 12 months ended June 30, 2012, is available at invesco.com/proxysearch. The information is also available on the SEC website, sec.gov. Invesco Advisers, Inc. is an investment adviser; it provides investment advisory services to individual and institutional clients and does not sell securities. Invesco Distributors, Inc. is the US distributor for Invesco Ltd.’s retail mutual funds, exchange-traded funds and institutional money market funds. Both are wholly owned, indirect subsidiaries of Invesco Ltd. | |  |
| |
| SEC file numbers: 811-01540 and 002-27334 GCE-AR-1 Invesco Distributors, Inc. | | |
| | | | | | |

| | | | |
| | | Annual Report to Shareholders | | December 31, 2012 |
| | | Invesco International Small Company Fund |
| | | Nasdaq: A: IEGAX § B: IEGBX § C: IEGCX § Y: IEGYX § R5: IEGIX § R6: IEGFX |

Letters to Shareholders
| | | | | | | | | |

Philip Taylor | | | | Dear Shareholders: This annual report contains information about your Fund and the factors that affected its performance during the reporting period. Inside, you’ll find a discussion from your portfolio managers about how they managed your Fund, performance data for your Fund, a complete list of your Fund’s investments as of the close of the reporting period and other important information. I hope you find this report of interest. The reporting period covered by this report was challenging. As the year began, investors cheered generally positive economic indicators, and markets generally rose. Soon, however, US economic data turned mixed and investors’ attention shifted to the efforts of eurozone governments to implement new policies intended to reduce debt levels, strengthen the banking system and stimulate economic growth. Later in the year, in the US, mixed economic | | |
| data, competing proposals on how to reduce the federal budget deficit and a contentious presidential contest increased investor uncertainty and hindered market performance. Throughout the year, your Fund’s portfolio managers adhered to their long-term investment strategies, and later in this report they explain why your Fund performed as it did during the reporting period. | | |
Adhering to your long-term investment plan can be difficult, particularly during periods of market volatility and economic uncertainty. That’s one reason Invesco suggests investors work with a skilled and trusted financial adviser who is familiar with their financial situation, investment goals and risk tolerance. A good financial adviser can provide insight and perspective when markets are volatile; motivation and reassurance when times are uncertain; and advice and recommendations when your financial situation or investment goals change.
Timely insight and information from many of Invesco’s investment professionals is available at our website, invesco.com/us. We offer in-depth articles, video clips and audio commentaries from many of our portfolio managers and other investment professionals on a wide range of topics of interest to investors. At invesco.com/us, you also can access information about your Invesco account at any time.
What we mean by Intentional Investing
At Invesco, all of our people and all of our resources are dedicated to helping investors achieve their financial objectives. It’s a philosophy we call Intentional Investing®, and it guides the way we:
| | n | | Manage investments – Our dedicated investment professionals search the world for the best opportunities, and each investment team follows a clear, disciplined process to build portfolios and mitigate risk. |
| | n | | Provide choices – We offer equity, fixed income, asset allocation and alternative strategies so you and your financial adviser can build an investment portfolio designed for your individual needs and goals. |
| | n | | Connect with you – We’re committed to giving you the expert insights you need to make informed investing decisions, and we are well-equipped to provide high-quality support for investors and advisers. |
Invesco believes in putting investors first, and that’s why investment management is all we do. Our sole focus on managing your money allows your financial adviser to build a portfolio of Invesco funds appropriate for your investment needs and goals now and when your circumstances change.
Have a question?
If you have a question about your account, please contact an Invesco client services representative at 800 959 4246. If you have an Invesco-related question or comment, feel free to email me directly at phil@invesco.com.
All of us at Invesco look forward to serving your investment management needs for many years to come. Thank you for investing with us.
Sincerely,

Philip Taylor
Senior Managing Director, Invesco Ltd.
2 Invesco International Small Company Fund
| | | | | | | | | |

Bruce Crockett | | | | Dear Fellow Shareholders: While short-term challenges for the financial markets regularly come and go, it’s clear that significant and longer term economic obstacles remain both here at home and abroad. There appear to be no easy solutions to many of these issues. As a result, the financial markets have had little conviction to respond to what has been slow, yet noticeable improvement in some economic benchmarks in recent months. No one likes uncertainty, especially financial markets. But even in these uncertain times, it appears that investors are still approaching the market with cautious optimism, with some taking on more risk in order to refocus on their long-term savings goals. Maybe this describes you, or perhaps you have been sitting on the sidelines thinking | | |
about getting back into the market, but are still a bit hesitant to act because of market uncertainty. Clearly, risk remains a primary focus for investors of all types. As Trustees of the Invesco Funds, one of our primary responsibilities is to ensure your fund’s adviser is cognizant of the risks in each of the funds it manages. A thoughtful risk management plan may help investors navigate through market turbulence or an economic downturn. This is why we make risk management a critical element of our annual contract renewal process, like the one we complete with Invesco every year.
To be sure, there will always be risks involved with investing, but you shouldn’t let short-term news or your emotions dictate your investments. Because no one can predict with 100% accuracy the movements of financial markets, I strongly encourage you to speak with a professional financial adviser who can assist you in building an investment portfolio that reflects your individual risk tolerance and is designed to help achieve your individual financial objectives.
You can be sure your Board remains committed to doing its part in helping you along the way. In addition to ensuring that your fund’s adviser is focused on the risks in the funds it manages, we also remain committed to managing fund costs and working with your fund’s adviser to provide a compelling and diversified product offering to potentially meet your investing goals.
In that regard, your Board approved a number of fund mergers and the launch of several new funds, including the first Invesco mutual fund available to US retail investors managed by investment professionals at Invesco Perpetual*, one of the largest independent investment managers in the UK.
Let me close by thanking Carl Frischling upon his retirement from the Invesco Funds Board for his 35 years of distinguished service and unwavering commitment to our funds’ shareholders. As always, please contact me at bruce@brucecrockett.com with any questions or concerns you may have.
On behalf of the Board, we look forward to continuing to represent your interests and serving your investment needs.
Sincerely,

Bruce L. Crockett
Independent Chair
Invesco Funds Board of Trustees
| * | Invesco Perpetual is a business name of Invesco Asset Management Limited (IAML), a registered investment adviser. IAML is a wholly owned, indirect subsidiary of Invesco Ltd. |
3 Invesco International Small Company Fund
Management’s Discussion of Fund Performance
Performance summary
For the year ended December 31, 2012, Invesco International Small Company Fund, at net asset value (NAV), delivered double-digit gains but underperformed its style-specific index, the MSCI World Ex-US Small Cap Index. The Fund’s high single-digit cash position throughout the year detracted from performance as markets rebounded at the end of the reporting period.
Your Fund’s long-term performance appears later in this report.
Fund vs. Indexes
Total returns, 12/31/11 to 12/31/12, at net asset value (NAV). Performance shown does not include applicable contingent deferred sales charges (CDSC) or front-end sales charges, which would have reduced performance.
| | | | | |
| Class A Shares | | | | 16.24 | % |
| Class B Shares | | | | 15.38 | |
| Class C Shares | | | | 15.38 | |
| Class Y Shares | | | | 16.56 | |
| Class R5 Shares* | | | | 16.66 | |
| Class R6 Shares** | | | | 16.38 | |
| MSCI EAFE Index‚ (Broad Market Index) | | | | 17.32 | |
| MSCI World Ex-US Small Cap Index¡ (Style-Specific Index) | | | | 17.48 | |
| Lipper International Small/Mid-Cap Growth Funds Index¡ (Peer Group Index) | | | | 23.38 | |
| Source | (s): ‚Invesco, MSCI via FactSet Research Systems Inc.; ¡ Lipper Inc. |
| * | Effective September 24, 2012, Institutional Class shares were renamed Class R5 shares. |
| ** | Share class incepted during the reporting period. See page 6 for a detailed explanation of Fund performance. |
How we invest
When selecting stocks for your Fund, we use a disciplined investment strategy that emphasizes fundamental research, supported by both quantitative analysis and portfolio construction techniques. Our EQV (earnings, quality, valuation) strategy focuses primarily on identifying quality companies that have experienced, or exhibit the potential for, accelerated or above-average earnings growth, but whose stock prices do not fully reflect these attributes.
While research responsibilities within the portfolio management team are focused by geographic region, we select investments for the Fund using a bottom-up investment approach, which means we construct the Fund primarily on a stock-by-stock basis. We focus on
the strengths of individual companies rather than sectors, countries or market-cap trends. Under normal circumstances, the Fund invests the bulk of its assets, plus any borrowings for investment purposes, in securities of small international issuers. The Fund is non-diversified, which means it can invest a greater percentage of its assets in any one issuer than a diversified fund can.
We believe disciplined sell decisions are key to successful investing. We consider selling a stock for one of the following reasons:
| n | | A company’s fundamentals deteriorate, or it posts disappointing earnings. |
| n | | A stock appears overvalued. |
| n | | A more attractive investment opportunity becomes available. |
Market conditions and your Fund
Global equity markets rebounded in the beginning of 2012 following a difficult and volatile year in 2011. Improvements in global economic indicators and continued accommodative policy measures from central banks provided support for the rally in stocks, with some of the worst performing areas of the market in recent years leading the way in the beginning of 2012.
During the year, macroeconomic concerns stemming largely from Greece and Spain eased somewhat as the pro-euro party won the Greek elections and Spanish banks were provided a bailout of up to 100 billion euros. Eurozone leaders also took steps during their most recent summit to allow for the direct recapitalization of banks through the European Stability Mechanism (the bailout fund) and to move closer to a regional banking union. In addition, the European Central Bank (ECB) announced new measures to support eurozone economies through potentially unlimited purchases of sovereign debt, with ECB President Mario Draghi pledging to “do whatever it takes” to save the euro (although key details of the plan remain unresolved). The US Federal Reserve announced a third round of quantitative easing with a promise to continue until the labor market outlook improved materially, and the Bank of Japan took steps to increase its asset purchase program. These easing measures were well received by investors and helped to drive equity markets higher during the year.
In terms of performance during the fiscal year, the Fund delivered double-digit gains in seven of its nine invested sectors. The largest contribution to absolute results came from holdings in the utilities, industrials and financials sectors. Relative performance versus the style-specific index was supported by
| | | | | |
Portfolio Composition By sector | | |
| | | | | |
| Energy | | | | 16.7 | % |
| Financials | | | | 14.4 | |
| Industrials | | | | 13.4 | |
| Consumer Discretionary | | | | 11.5 | |
| Utilities | | | | 8.3 | |
| Information Technology | | | | 8.1 | |
| Health Care | | | | 6.1 | |
| Consumer Staples | | | | 5.3 | |
| Materials | | | | 3.9 | |
Money Market Funds Plus Other Assets Less Liabilities | | | | 12.3 | |
| | | | | |
| Top 10 Holdings* | | |
| |
| | | | | |
1. First Gen Corp. | | | | 4.7 | % |
2. IGB Corp. Berhad | | | | 3.7 | |
3. First Pacific Co. Ltd. | | | | 2.9 | |
4. Total Energy Services Inc. | | | | 2.9 | |
5. TGS Nopec Geophysical Co. A.S.A. | | | | 2.1 | |
6. Manila Water Co. | | | | 2.0 | |
7. DCC PLC | | | | 1.9 | |
8. Paramount Resources Ltd.- Class A | | | | 1.9 | |
9. Glentel, Inc. | | | | 1.8 | |
10. Aryzta AG | | | | 1.8 | |
| | | | | |
| Top Five Countries* | | |
| |
| | | | | |
1. Canada | | | | 24.5 | % |
2. United Kingdom | | | | 14.5 | |
3. Philippines | | | | 8.3 | |
4. Malaysia | | | | 6.2 | |
5. Norway | | | | 4.9 | |
| | | | | |
| Total Net Assets | | | | $531.0 million | |
| |
| Total Number of Holdings* | | | | 73 | |
The Fund’s holdings are subject to change, and there is no assurance that the Fund will continue to hold any particular security.
*Excluding money market fund holdings.
4 Invesco International Small Company Fund
strong stock selection in the materials sector enabling the Fund to meaningfully outperform the index in this sector. An underweight exposure to this relatively weak sector was supportive on a relative basis as well. A leading contributor to overall Fund performance was Koza Anadolu Metal Madencilik, a Turkish holding company whose main asset is a listed gold mining company. Koza offered a double discount last year. The underlying asset was very cheap despite excellent fundamentals, and Koza was trading at a greater than 70% discount to its NAV. During the year the gold miner did very well and the NAV discount shrunk to below 30%. We cut our position pretty materially over the reporting period, given performance.
Relative results were also supported by stock selection in the utilities and industrials sectors. In the utilities sector, particular strength was seen in Fund holdings in the Philippines, including First Generation Corporation and Manila Water Company. In the industrials sectors, strong results were seen in Fund holdings in Brazil, Italy and Ireland.
The Fund’s cash exposure increased over the year as we trimmed or sold out of certain holdings, taking profits. This higher-than-average cash position detracted from Fund performance as markets rebounded at the end of the reporting period. It is important to note that we do not use cash for “top-down” tactical asset allocation purposes. Historically, when the portfolio’s cash position has been higher than average, it has reflected a lack of good EQV investment opportunities in the marketplace, rather than an overall negative opinion on markets. However, concerns about further downside risk led us to be cautious investors throughout the reporting period.
Although the Fund delivered solid gains across all invested sectors, relative results lagged across the financials, consumer discretionary and energy sectors. Under-performance in these sectors was driven not by what the Fund owned, but rather by what the Fund did not own. From a regional perspective, select holdings in the UK and Canada were a drag on relative results. Fund exposure in Malaysia, which was down for the year, detracted as well. The style-specific index does not have any exposure to the Malaysian market.
Again, the Fund’s positioning is driven by our stock selection process as opposed to top-down allocation decisions. Over the year, the Fund’s health care, financials and utilities sector holdings saw modest increases as we identified and added
opportunistically to these segments. In contrast, we trimmed or sold out of several holdings in the industrials and consumer discretionary sectors, decreasing our exposure to these sectors down over the year.
Geographically, the UK and Canada represented over a third of the Fund’s investments with the remainder comprised of diverse exposure to smaller countries from over a dozen across Asia, Latin America and Europe.
We primarily focus on companies that have well-capitalized balance sheets, with limited to no debt. Strong balance sheets give companies flexibility, which is always valuable but particularly so in today’s uncertain environment. As always, we have continued to emphasize strong cash flow generation and attractive valuations.
Over the year, the Fund at NAV, has experienced double-digit returns. While we are pleased to provide shareholders with this strong performance, it would be imprudent for us to suggest that such a level of performance is sustainable over the long term. With market volatility likely to continue for some time, our focus remains on ensuring that our portfolio is comprised of high-quality, reasonably valued companies capable of sustained earnings growth. We believe that this balanced EQV-focused approach may help deliver attractive returns over the long term.
We welcome new investors in the Fund and express our appreciation to all our shareholders for your continued investment in Invesco International Small Company Fund.
The views and opinions expressed in management’s discussion of Fund performance are those of Invesco Advisers, Inc. These views and opinions are subject to change at any time based on factors such as market and economic conditions. These views and opinions may not be relied upon as investment advice or recommendations, or as an offer for a particular security. The information is not a complete analysis of every aspect of any market, country, industry, security or the Fund. Statements of fact are from sources considered reliable, but Invesco Advisers, Inc. makes no representation or warranty as to their completeness or accuracy. Although historical performance is no guarantee of future results, these insights may help you understand our investment management philosophy.
See important Fund and, if applicable, index disclosures later in this report.
| | |
 | | Steve Cao Chartered Financial Analyst, portfolio manager, is lead manager of Invesco International Small |
| Company Fund with respect to the Fund’s investments in Asia Pacific and Latin America. He joined Invesco in 1997. Mr. Cao earned a BA in English from the Tianjin Foreign Language Institute and an MBA from Texas A&M University. He is also a Certified Public Accountant. |
| | |
 | | Jason Holzer Chartered Financial Analyst, portfolio manager, is lead manager of Invesco International Small |
| Company Fund with respect to the Fund’s investments in Europe and Canada. He joined Invesco in 1996. Mr. Holzer earned a BA in quantitative economics and an MS in engineering economic systems from Stanford University. |
| | |
 | | Borge Endresen Chartered Financial Analyst, portfolio manager, is manager of Invesco International Small Company Fund. |
| He joined Invesco in 1999. Mr. Endresen earned a BS in finance from the University of Oregon and an MBA from The University of Texas at Austin. |
5 Invesco International Small Company Fund
Your Fund’s Long-Term Performance
Results of a $10,000 Investment – Oldest Share Class(es)
Fund and index data from 12/31/02
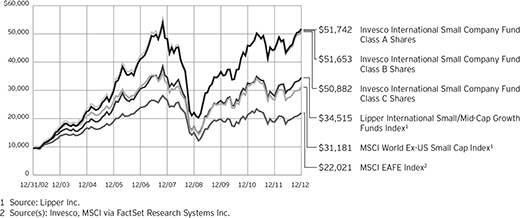
Past performance cannot guarantee comparable future results.
The data shown in the chart include reinvested distributions, applicable sales charges and Fund expenses including management fees. Results for Class B shares are calculated as if a hypothetical
shareholder had liquidated his entire investment in the Fund at the close of the reporting period and paid the contingent deferred sales charges, if applicable. Index results include reinvested dividends, but they do not reflect sales charges. Performance of the peer group,
if applicable, reflects fund expenses and management fees; performance of a market index does not. Performance shown in the chart and table(s) does not reflect deduction of taxes a shareholder would pay on Fund distributions or sale of Fund shares.
6 Invesco International Small Company Fund
| | | | | |
| Average Annual Total Returns | | | | | |
As of 12/31/12, including maximum applicable sales charges | |
| | | | | |
| Class A Shares | | | | | |
| Inception (8/31/00) | | | | 10.92 | % |
| 10 Years | | | | 17.86 | |
| 5 Years | | | | 0.28 | |
| 1 Year | | | | 9.87 | |
| |
| Class B Shares | | | | | |
| Inception (8/31/00) | | | | 10.92 | % |
| 10 Years | | | | 17.84 | |
| 5 Years | | | | 0.29 | |
| 1 Year | | | | 10.38 | |
| |
| Class C Shares | | | | | |
| Inception (8/31/00) | | | | 10.64 | % |
| 10 Years | | | | 17.67 | |
| 5 Years | | | | 0.67 | |
| 1 Year | | | | 14.38 | |
| |
| Class Y Shares | | | | | |
| 10 Years | | | | 18.66 | % |
| 5 Years | | | | 1.65 | |
| 1 Year | | | | 16.56 | |
| |
| Class R5 Shares | | | | | |
| 10 Years | | | | 18.90 | % |
| 5 Years | | | | 1.88 | |
| 1 Year | | | | 16.66 | |
| |
| Class R6 Shares | | | | | |
| 10 Years | | | | 18.54 | % |
| 5 Years | | | | 1.45 | |
| 1 Year | | | | 16.38 | |
Class Y shares incepted on October 3, 2008. Performance shown prior to that date is that of Class A shares and includes the 12b-1 fees applicable to Class A shares. Class A share performance reflects any applicable fee waivers or expense reimbursements.
Class R5 shares incepted on October 25, 2005. Performance shown prior to that date is that of Class A shares and includes the 12b-1 fees applicable to Class A shares. Class A share performance reflects any applicable fee waivers or expense reimbursements.
Class R6 shares incepted on September 24, 2012. Performance shown prior to that date is that of Class A shares and includes the 12b-1 fees applicable to Class A shares. Class A share performance reflects any applicable fee waivers or expense reimbursements.
The performance data quoted represent past performance and cannot guarantee comparable future results; current performance may be lower or higher. Please visit invesco.com/performance for the most recent month-end performance. Performance figures reflect reinvested distributions, changes in net asset value and the effect of the maximum sales charge unless otherwise stated. Investment return and principal value will fluctuate so that you may have a gain or loss when you sell shares.
The total annual Fund operating expense ratio set forth in the most recent Fund prospectus as of the date of this report for Class A, Class B, Class C, Class Y, Class R5 and Class R6 shares was 1.50%, 2.25%, 2.25%, 1.25%, 1.12% and 1.07%, respectively. The expense ratios presented above may vary from the expense ratios presented in other sections of this report that are based on expenses incurred during the period covered by this report.
Class A share performance reflects the maximum 5.50% sales charge, and Class B and Class C share performance reflects the applicable contingent deferred sales charge (CDSC) for the period involved. The CDSC on Class B shares declines from 5% beginning at the time of purchase to 0% at the beginning of the seventh year. The CDSC on Class C shares is 1% for the first year after purchase. Class Y, Class R5 and Class R6 shares do not have a front-end sales charge or a CDSC; therefore, performance is at net asset value.
The performance of the Fund’s share classes will differ primarily due to different sales charge structures and class expenses.
Had the adviser not waived fees and/ or reimbursed expenses in the past, performance would have been lower.
continued from page 8
Other information
| n | | CPA® and Certified Public Accountant® are trademarks owned by the American Institute of Certified Public Accountants. |
| n | | The returns shown in management’s discussion of Fund performance are based on net asset values calculated for shareholder transactions. |
| | | Generally accepted accounting principles require adjustments to be made to the net assets of the Fund at period end for financial reporting purposes, and as such, the net asset values for shareholder transactions and the returns based on those net asset values may differ from the net asset values and |
returns reported in the Financial Highlights.
| n | | Industry classifications used in this report are generally according to the Global Industry Classification Standard, which was developed by and is the exclusive property and a service mark of MSCI Inc. and Standard & Poor’s. |
7 Invesco International Small Company Fund
Invesco International Small Company Fund’s investment objective is long-term growth of capital.
| n | | Unless otherwise stated, information presented in this report is as of December 31, 2012, and is based on total net assets. |
| n | | Unless otherwise noted, all data provided by Invesco. |
| n | | To access your Fund’s reports/prospectus, visit invesco.com/fundreports. |
About share classes
| n | | Class B shares may not be purchased for new or additional investments. Please see the prospectus for more information. |
| n | | Class Y shares are available only to certain investors. Please see the prospectus for more information. |
| n | | Class R5 shares and Class R6 shares are primarily intended for employer sponsored retirement and benefit plans that meet certain standards and for institutional investors. On September 24, 2012, Institutional Class shares were renamed Class R5 shares. Please see the prospectus for more information. |
Principal risks of investing in the Fund
| n | | Derivatives risk. The performance of derivative instruments is tied to the performance of an underlying currency, security, index or other instrument. In addition to risks relating to their underlying instruments, the use of derivatives may include other, possibly greater, risks. Derivatives involve costs, may be volatile, and may involve a small initial investment relative to the risk assumed. Risks associated with the use of derivatives include counterparty, leverage, correlation, liquidity, tax, market, interest rate and management risks. Derivatives may also be more difficult to purchase, sell or value than other investments. The Fund may lose more than the cash amount invested on investments in derivatives. |
Investors should bear in mind that, while the Fund intends to use derivative strategies, it is not obligated to actively engage in these transactions, generally or in any particular kind of derivative, if the investment manager elects not to do so due to availability, cost, market conditions or other factors.
| n | | Developing/emerging markets securities risk. Securities issued by foreign companies and governments located in |
| | developing/emerging countries may be affected more negatively by inflation, devaluation of their currencies, higher transaction costs, delays in settlement, adverse political developments, the introduction of capital controls, withholding taxes, nationalization of private assets, expropriation, social unrest, war or lack of timely information than those in developed countries. |
| n | | Foreign securities risk. The Fund’s foreign investments may be affected by changes in a foreign country’s exchange rates, political and social instability, changes in economic or taxation policies, difficulties when enforcing obligations, decreased liquidity, and increased volatility. Foreign companies may be subject to less regulation resulting in less publicly available information about the companies. |
| n | | Growth investing risk. Growth stocks tend to be more expensive relative to their earnings or assets compared with other types of stock. As a result they tend to be more sensitive to changes in their earnings and can be more volatile. |
| n | | Management risk. The investment techniques and risk analysis used by the Fund’s portfolio managers may not produce the desired results. |
| n | | Market risk. The prices of and the income generated by the Fund’s securities may decline in response to, among other things, investor sentiment, general economic and market conditions, regional or global instability, and currency and interest rate fluctuations. |
| n | | Non-diversification risk. The Fund is non-diversified and can invest a greater portion of its assets in a single issuer. A change in the value of the issuer could affect the value of the Fund more than if it was a diversified fund. |
| n | | Small- and mid-capitalization risk. Stocks of small and mid-sized companies tend to be more vulnerable to adverse developments in the above factors and may have little or no operating history or track record of |
| | success, and limited product lines, markets, management and financial resources. The securities of small and mid-sized companies may be more volatile due to less market interest and less publicly available information about the issuer. They also may be illiquid or restricted as to resale, or may trade less frequently and in smaller volumes, all of which may cause difficulty when establishing or closing a position at a desirable price. |
| n | | Synthetic securities risk. Fluctuations in the values of synthetic securities may not correlate perfectly with the instruments they are designed to replicate. Synthetic Securities may be subject to interest rate changes, market price fluctuations, counterparty risk and liquidity risk. |
About indexes used in this report
| n | | The MSCI EAFE® Index is an unmanaged index considered representative of stocks of Europe, Australasia and the Far East. |
| n | | The MSCI World Ex-US Small Cap Index is an unmanaged index considered representative of small-cap stocks of global developed markets, excluding the US. |
| n | | The Lipper International Small/ Mid-Cap Growth Funds Index is an unmanaged index considered representative of international small/mid-cap growth funds tracked by Lipper. |
| n | | The Fund is not managed to track the performance of any particular index, including the index(es) defined here, and consequently, the performance of the Fund may deviate significantly from the performance of the index(es). |
| n | | A direct investment cannot be made in an index. Unless otherwise indicated, index results include reinvested dividends, and they do not reflect sales charges. Performance of the peer group, if applicable, reflects fund expenses; performance of a market index does not. |
continued on page 7
This report must be accompanied or preceded by a currently effective Fund prospectus, which contains more complete information, including sales charges and expenses. Investors should read it carefully before investing.
NOT FDIC INSURED | MAY LOSE VALUE | NO BANK GUARANTEE
| | | | | |
| Fund Nasdaq Symbols | | |
| Class A Shares | | | | IEGAX | |
| Class B Shares | | | | IEGBX | |
| Class C Shares | | | | IEGCX | |
| Class Y Shares | | | | IEGYX | |
| Class R5 Shares | | | | IEGIX | |
| Class R6 Shares | | | | IEGFX | |
8 Invesco International Small Company Fund
Schedule of Investments
December 31, 2012
| | | | | | | | |
| | | Shares | | | Value | |
Common Stocks & Other Equity Interests–87.74% | |
| Belgium–0.83% | |
S.A. D’Ieteren N.V. | | | 108,815 | | | $ | 4,417,481 | |
|
| Brazil–2.68% | |
Diagnosticos da America S.A. | | | 1,222,600 | | | | 7,929,242 | |
Valid Solucoes e Servicos de Seguranca em Meios de Pagamento e Identificacao S.A. | | | 284,870 | | | | 6,317,793 | |
| | | | | | | | 14,247,035 | |
|
| Canada–24.47% | |
Aastra Technologies Ltd. | | | 239,100 | | | | 3,991,022 | |
Brookfield Real Estate Services, Inc. | | | 149,300 | | | | 1,898,022 | |
Calian Technologies Ltd. | | | 142,000 | | | | 2,996,776 | |
Calvalley Petroleum Inc.–Class A(a) | | | 2,579,124 | | | | 4,676,562 | |
Canyon Services Group, Inc. | | | 403,000 | | | | 4,607,686 | |
Cequence Energy Ltd.(a) | | | 2,260,000 | | | | 3,278,332 | |
Descartes Systems Group Inc.(The)(a) | | | 500,000 | | | | 4,664,048 | |
Dorel Industries Inc.–Class B | | | 134,355 | | | | 4,865,581 | |
Epsilon Energy Ltd.(a) | | | 1,204,800 | | | | 4,636,180 | |
Glentel, Inc. | | | 529,800 | | | | 9,606,528 | |
Granite REIT(a) | | | 237,000 | | | | 9,008,370 | |
Hammond Power Solutions Inc. | | | 249,800 | | | | 2,060,907 | |
Horizon North Logistics Inc. | | | 786,000 | | | | 5,439,529 | |
Mart Resources, Inc. | | | 1,525,000 | | | | 2,611,564 | |
Northern Dynasty Minerals Ltd.(a) | | | 499,777 | | | | 1,585,874 | |
Onex Corp. | | | 181,599 | | | | 7,659,464 | |
Painted Pony Petroleum Ltd.(a) | | | 305,692 | | | | 3,233,370 | |
Paramount Resources Ltd.–Class A(a) | | | 308,455 | | | | 9,943,145 | |
Sandstorm Metals & Energy Ltd.(a) | | | 13,684,500 | | | | 6,685,789 | |
Total Energy Services Inc. | | | 1,014,790 | | | | 15,323,564 | |
TransGlobe Energy Corp.(a) | | | 632,980 | | | | 5,949,132 | |
Trilogy Energy Corp. | | | 290,500 | | | | 8,518,641 | |
Wi-LAN Inc. | | | 1,473,700 | | | | 6,724,953 | |
| | | | | | | | 129,965,039 | |
|
| China–1.76% | |
Fook Woo Group Holdings Ltd.(a) | | | 21,094,000 | | | | 932,183 | |
Franshion Properties China Ltd. | | | 14,500,000 | | | | 5,263,321 | |
Vinda International Holdings Ltd. | | | 2,294,000 | | | | 3,167,256 | |
| | | | | | | | 9,362,760 | |
|
| Germany–2.04% | |
CTS Eventim AG | | | 92,000 | | | | 3,234,298 | |
MorphoSys AG(a) | | | 197,230 | | | | 7,624,600 | |
| | | | | | | | 10,858,898 | |
|
| Greece–0.97% | |
Jumbo S.A.(a) | | | 654,575 | | | | 5,175,195 | |
|
| Hong Kong–2.94% | |
First Pacific Co. Ltd. | | | 14,124,000 | | | | 15,594,923 | |
| | | | | | | | |
| | | Shares | | | Value | |
| Ireland–4.02% | |
DCC PLC | | | 318,895 | | | $ | 10,172,422 | |
Paddy Power PLC | | | 42,702 | | | | 3,521,314 | |
United Drug PLC | | | 1,683,926 | | | | 7,628,401 | |
| | | | | | | | 21,322,137 | |
|
| Italy–1.81% | |
Ansaldo STS S.p.A. | | | 193,405 | | | | 1,809,853 | |
Danieli & C. Officine Meccaniche S.p.A. | | | 463,298 | | | | 7,801,853 | |
| | | | | | | | 9,611,706 | |
|
| Japan–3.92% | |
EXEDY Corp. | | | 225,500 | | | | 4,965,965 | |
Nippon Ceramic Co., Ltd. | | | 617,100 | | | | 9,290,289 | |
THK Co., Ltd. | | | 365,900 | | | | 6,566,385 | |
| | | | | | | | 20,822,639 | |
|
| Malaysia–6.19% | |
IGB Corp. Berhard | | | 25,677,171 | | | | 19,383,276 | |
Parkson Holdings Berhard | | | 5,303,929 | | | | 9,055,148 | |
Top Glove Corp. Berhard | | | 2,417,100 | | | | 4,457,208 | |
| | | | | | | | 32,895,632 | |
|
| Netherlands–1.38% | |
Aalberts Industries N.V. | | | 121,823 | | | | 2,574,278 | |
Mediq N.V. | | | 278,100 | | | | 4,728,723 | |
| | | | | | | | 7,303,001 | |
|
| New Zealand–1.18% | |
Freightways Ltd. | | | 1,770,681 | | | | 6,263,723 | |
|
| Norway–4.87% | |
Bonheur ASA | | | 241,727 | | | | 5,929,421 | |
Prosafe S.E. | | | 1,001,901 | | | | 8,613,786 | |
TGS Nopec Geophysical Co. A.S.A. | | | 344,858 | | | | 11,296,930 | |
| | | | | | | | 25,840,137 | |
|
| Philippines–8.33% | |
Energy Development Corp. | | | 53,503,850 | | | | 8,817,395 | |
First Gen Corp.(a) | | | 45,767,041 | | | | 24,915,705 | |
Manila Water Co. | | | 13,424,400 | | | | 10,491,860 | |
| | | | | | | | 44,224,960 | |
|
| Switzerland–1.79% | |
Aryzta AG | | | 185,041 | | | | 9,485,294 | |
| | |
| Thailand–1.97% | | | | | | | | |
Major Cineplex Group PCL | | | 8,476,400 | | | | 5,288,133 | |
Siam Commercial Bank PCL | | | 875,500 | | | | 5,198,295 | |
| | | | | | | | 10,486,428 | |
|
| Turkey–1.65% | |
Koza Anadolu Metal Madencilik
Isletmeleri A.S.(a) | | | 2,748,623 | | | | 8,753,270 | |
See accompanying Notes to Financial Statements which are an integral part of the financial statements.
9 Invesco International Small Company Fund
| | | | | | | | |
| | | Shares | | | Value | |
| United Kingdom–14.46% | |
Amlin PLC | | | 693,960 | | | $ | 4,216,837 | |
Catlin Group Ltd. | | | 558,877 | | | | 4,517,910 | |
Chemring Group PLC | | | 694,575 | | | | 2,604,098 | |
Clarkson PLC | | | 142,000 | | | | 2,811,101 | |
Filtrona PLC | | | 319,800 | | | | 2,885,745 | |
Halma PLC | | | 736,283 | | | | 5,550,446 | |
Homeserve PLC | | | 883,342 | | | | 3,335,816 | |
IG Group Holdings PLC | | | 901,373 | | | | 6,601,371 | |
Informa PLC | | | 1,166,809 | | | | 8,634,395 | |
Kier Group PLC | | | 391,670 | | | | 8,471,134 | |
Lancashire Holdings Ltd. | | | 594,413 | | | | 7,490,257 | |
Micro Focus International PLC | | | 671,643 | | | | 6,470,646 | |
SDL PLC | | | 368,623 | | | | 3,013,797 | |
Tullett Prebon PLC | | | 1,306,698 | | | | 5,423,158 | |
Ultra Electronics Holdings PLC | | | 178,278 | | | | 4,773,318 | |
| | | | | | | | 76,800,029 | |
| | | | | | | | |
| | | Shares | | | Value | |
| United States–0.48% | | | | | | | | |
Bauer Performance Sports Ltd.(a) | | | 237,500 | | | $ | 2,533,620 | |
Total Common Stocks & Other Equity Interests
(Cost $329,070,034) | | | | 465,963,907 | |
|
Money Market Funds–12.10% | |
Liquid Assets Portfolio–Institutional Class(b) | | | 32,116,929 | | | | 32,116,929 | |
Premier Portfolio–Institutional
Class(b) | | | 32,116,929 | | | | 32,116,929 | |
Total Money Market Funds
(Cost $64,233,858) | | | | | | | 64,233,858 | |
TOTAL INVESTMENTS–99.84%
(Cost $393,303,892) | | | | 530,197,765 | |
OTHER ASSETS LESS LIABILITIES–0.16% | | | | 850,860 | |
NET ASSETS–100.00% | | | $ | 531,048,625 | |
Investment Abbreviations:
| | |
| REIT | | – Real Estate Investment Trust |
Notes to Schedule of Investments:
| (a) | Non-income producing security. |
| (b) | The money market fund and the Fund are affiliated by having the same investment adviser. |
See accompanying Notes to Financial Statements which are an integral part of the financial statements.
10 Invesco International Small Company Fund
Statement of Assets and Liabilities
December 31, 2012
| | | | |
Assets: | | | | |
Investments, at value (Cost $329,070,034) | | $ | 465,963,907 | |
Investments in affiliated money market funds, at value and cost | | | 64,233,858 | |
Total investments, at value (Cost $393,303,892) | | | 530,197,765 | |
Foreign currencies, at value (Cost $646,278) | | | 645,381 | |
Receivable for: | | | | |
Investments sold | | | 546,061 | |
Fund shares sold | | | 3,244,585 | |
Dividends | | | 649,373 | |
Investment for trustee deferred compensation and retirement plans | | | 42,356 | |
Other assets | | | 42,695 | |
Total assets | | | 535,368,216 | |
| |
Liabilities: | | | | |
Payable for: | | | | |
Investments purchased | | | 985,828 | |
Fund shares reacquired | | | 1,636,898 | |
Accrued fees to affiliates | | | 331,926 | |
Accrued foreign taxes | | | 1,111,477 | |
Accrued other operating expenses | | | 138,388 | |
Trustee deferred compensation and retirement plans | | | 115,074 | |
Total liabilities | | | 4,319,591 | |
Net assets applicable to shares outstanding | | $ | 531,048,625 | |
| |
Net assets consist of: | | | | |
Shares of beneficial interest | | $ | 399,620,629 | |
Undistributed net investment income | | | (117,443 | ) |
Undistributed net realized gain (loss) | | | (5,345,711 | ) |
Unrealized appreciation | | | 136,891,150 | |
| | | $ | 531,048,625 | |
| | | | |
Net Assets: | | | | |
Class A | | $ | 295,767,030 | |
Class B | | $ | 10,352,455 | |
Class C | | $ | 36,135,584 | |
Class Y | | $ | 90,843,491 | |
Class R5 | | $ | 79,911,054 | |
Class R6 | | $ | 18,039,011 | |
|
Shares outstanding, $0.01 par value per share,
with an unlimited number of shares authorized: | |
Class A | | | 14,212,723 | |
Class B | | | 516,880 | |
Class C | | | 1,803,783 | |
Class Y | | | 4,358,070 | |
Class R5 | | | 3,858,018 | |
Class R6 | | | 870,747 | |
Class A: | | | | |
Net asset value per share | | $ | 20.81 | |
Maximum offering price per share | | | | |
(Net asset value of $20.81 ¸ 94.50%) | | $ | 22.02 | |
Class B: | | | | |
Net asset value and offering price per share | | $ | 20.03 | |
Class C: | | | | |
Net asset value and offering price per share | | $ | 20.03 | |
Class Y: | | | | |
Net asset value and offering price per share | | $ | 20.84 | |
Class R5: | | | | |
Net asset value and offering price per share | | $ | 20.71 | |
Class R6: | | | | |
Net asset value and offering price per share | | $ | 20.72 | |
See accompanying Notes to Financial Statements which are an integral part of the financial statements.
11 Invesco International Small Company Fund
Statement of Operations
For the year ended December 31, 2012
| | | | |
Investment income: | | | | |
Dividends (net of foreign withholding taxes of $936,313) | | $ | 12,298,901 | |
Dividends from affiliated money market funds | | | 68,653 | |
Total investment income | | | 12,367,554 | |
| |
Expenses: | | | | |
Advisory fees | | | 4,610,130 | |
Administrative services fees | | | 146,238 | |
Custodian fees | | | 291,074 | |
Distribution fees: | | | | |
Class A | | | 745,425 | |
Class B | | | 139,175 | |
Class C | | | 366,938 | |
Transfer agent fees — A, B, C and Y | | | 816,961 | |
Transfer agent fees — R5 | | | 56,315 | |
Transfer agent fees — R6 | | | 237 | |
Trustees’ and officers’ fees and benefits | | | 40,233 | |
Other | | | 245,905 | |
Total expenses | | | 7,458,631 | |
Less: Fees waived and expense offset arrangement(s) | | | (67,978 | ) |
Net expenses | | | 7,390,653 | |
Net investment income | | | 4,976,901 | |
| |
Realized and unrealized gain (loss) from: | | | | |
Net realized gain (loss) from: | | | | |
Investment securities (Net of tax on the sale of foreign investments of $762,112) | | | 31,885,695 | |
Foreign currencies | | | (160,873 | ) |
| | | | 31,724,822 | |
Change in net unrealized appreciation (depreciation) of: | | | | |
Investment securities (net of foreign taxes on holdings of $46,469) | | | 38,373,704 | |
Foreign currencies | | | (37,848 | ) |
| | | | 38,335,856 | |
Net realized and unrealized gain | | | 70,060,678 | |
Net increase in net assets resulting from operations | | $ | 75,037,579 | |
See accompanying Notes to Financial Statements which are an integral part of the financial statements.
12 Invesco International Small Company Fund
Statement of Changes in Net Assets
For the years ended December 31, 2012 and 2011
| | | | | | | | |
| | | 2012 | | | 2011 | |
Operations: | | | | | | | | |
Net investment income | | $ | 4,976,901 | | | $ | 5,253,670 | |
Net realized gain | | | 31,724,822 | | | | 21,271,836 | |
Change in net unrealized appreciation (depreciation) | | | 38,335,856 | | | | (42,862,730 | ) |
Net increase (decrease) in net assets resulting from operations | | | 75,037,579 | | | | (16,337,224 | ) |
| | |
Distributions to shareholders from net investment income: | | | | | | | | |
Class A | | | (613,597 | ) | | | (4,186,703 | ) |
Class B | | | (6,168 | ) | | | (86,616 | ) |
Class C | | | (20,190 | ) | | | (191,556 | ) |
Class Y | | | (388,967 | ) | | | (864,313 | ) |
Class R5 | | | (434,585 | ) | | | (1,178,017 | ) |
Class R6 | | | (101,743 | ) | | | — | |
Total distributions from net investment income | | | (1,565,250 | ) | | | (6,507,205 | ) |
| | |
Share transactions-net: | | | | | | | | |
Class A | | | (58,986,705 | ) | | | (55,842,765 | ) |
Class B | | | (8,843,460 | ) | | | (7,033,912 | ) |
Class C | | | (7,352,476 | ) | | | (9,393,599 | ) |
Class Y | | | 27,908,527 | | | | 22,894,089 | |
Class R5 | | | (3,191,597 | ) | | | 12,464,729 | |
Class R6 | | | 17,091,745 | | | | — | |
Net increase (decrease) in net assets resulting from share transactions | | | (33,373,966 | ) | | | (36,911,458 | ) |
Net increase (decrease) in net assets | | | 40,098,363 | | | | (59,755,887 | ) |
| | |
Net assets: | | | | | | | | |
Beginning of year | | | 490,950,262 | | | | 550,706,149 | |
End of year (includes undistributed net investment income of $(117,443) and $(2,611,514), respectively) | | $ | 531,048,625 | | | $ | 490,950,262 | |
Notes to Financial Statements
December 31, 2012
NOTE 1—Significant Accounting Policies
Invesco International Small Company Fund (the “Fund”) is a series portfolio of AIM Funds Group (Invesco Funds Group) (the “Trust”). The Trust is a Delaware statutory trust registered under the Investment Company Act of 1940, as amended (the “1940 Act”), as an open-end series management investment company consisting of four separate portfolios, each authorized to issue an unlimited number of shares of beneficial interest. The assets, liabilities and operations of each portfolio are accounted for separately. Information presented in these financial statements pertains only to the Fund. Matters affecting each portfolio or class will be voted on exclusively by the shareholders of such portfolio or class.
The Fund’s investment objective is long-term growth of capital.
The Fund currently consists of six different classes of shares: Class A, Class B, Class C, Class Y, Class R5 and Class R6. On September 24, 2012, Institutional Class shares were renamed Class R5 shares and the Fund began offering Class R6 shares. Class A shares are sold with a front-end sales charge unless certain waiver criteria are met and under certain circumstances load waived shares may be subject to contingent deferred sales charges (“CDSC”). Class C shares are sold with a CDSC. Class Y, Class R5 and Class R6 shares are sold at net asset value. Effective November 30, 2010, new or additional investments in Class B shares are no longer permitted. Existing shareholders of Class B shares may continue to reinvest dividends and capital gains distributions in Class B shares until they convert to Class A shares. Also, shareholders in Class B shares will be able to exchange those shares for Class B shares of other Invesco Funds offering such shares until they convert to Class A shares. Generally, Class B shares will automatically convert to Class A shares on or about the month-end, which is at least eight years after the date of purchase. Redemption of Class B shares prior to the conversion date will be subject to a CDSC.
As of the close of business on January 29, 2010, the Fund limited public sales of its shares to new investors.
The following is a summary of the significant accounting policies followed by the Fund in the preparation of its financial statements.
| A. | Security Valuations — Securities, including restricted securities, are valued according to the following policy. |
A security listed or traded on an exchange (except convertible bonds) is valued at its last sales price or official closing price as of the close of the customary trading session on the exchange where the security is principally traded, or lacking any sales or official closing price on a particular day, the security may be valued at the closing bid price on that day. Securities traded in the over-the-counter market are valued based on prices furnished by independent pricing services or market makers. When such securities are valued by an independent pricing service they may be
13 Invesco International Small Company Fund
considered fair valued. Futures contracts are valued at the final settlement price set by an exchange on which they are principally traded. Listed options are valued at the mean between the last bid and ask prices from the exchange on which they are principally traded. Options not listed on an exchange are valued by an independent source at the mean between the last bid and ask prices. For purposes of determining net asset value per share, futures and option contracts generally are valued 15 minutes after the close of the customary trading session of the New York Stock Exchange (“NYSE”).
Investments in open-end and closed-end registered investment companies that do not trade on an exchange are valued at the end of day net asset value per share. Investments in open-end and closed-end registered investment companies that trade on an exchange are valued at the last sales price or official closing price as of the close of the customary trading session on the exchange where the security is principally traded.
Debt obligations (including convertible bonds) and unlisted equities are fair valued using an evaluated quote provided by an independent pricing service. Evaluated quotes provided by the pricing service may be determined without exclusive reliance on quoted prices, and may reflect appropriate factors such as institution-size trading in similar groups of securities, developments related to specific securities, dividend rate (for unlisted equities), yield (for debt obligations), quality, type of issue, coupon rate (for debt obligations), maturity (for debt obligations), individual trading characteristics and other market data. Debt obligations are subject to interest rate and credit risks. In addition, all debt obligations involve some risk of default with respect to interest and/or principal payments.
Foreign securities’ (including foreign exchange contracts) prices are converted into U.S. dollar amounts using the applicable exchange rates as of the close of the NYSE. If market quotations are available and reliable for foreign exchange-traded equity securities, the securities will be valued at the market quotations. Because trading hours for certain foreign securities end before the close of the NYSE, closing market quotations may become unreliable. If between the time trading ends on a particular security and the close of the customary trading session on the NYSE, events occur that the Adviser determines are significant and make the closing price unreliable, the Fund may fair value the security. If the event is likely to have affected the closing price of the security, the security will be valued at fair value in good faith using procedures approved by the Board of Trustees. Adjustments to closing prices to reflect fair value may also be based on a screening process of an independent pricing service to indicate the degree of certainty, based on historical data, that the closing price in the principal market where a foreign security trade is not the current value as of the close of the NYSE. Foreign securities’ prices meeting the approved degree of certainty that the price is not reflective of current value will be priced at the indication of fair value from the independent pricing service. Multiple factors may be considered by the independent pricing service in determining adjustments to reflect fair value and may include information relating to sector indices, American Depositary Receipts and domestic and foreign index futures. Foreign securities may have additional risks including exchange rate changes, potential for sharply devalued currencies and high inflation, political and economic upheaval, the relative lack of issuer information, relatively low market liquidity and the potential lack of strict financial and accounting controls and standards.
Securities for which market prices are not provided by any of the above methods may be valued based upon quotes furnished by independent sources. The last bid price may be used to value equity securities. The mean between the last bid and asked prices is used to value debt obligations, including corporate loans.
Securities for which market quotations are not readily available or became unreliable are valued at fair value as determined in good faith by or under the supervision of the Trust’s officers following procedures approved by the Board of Trustees. Issuer specific events, market trends, bid/ask quotes of brokers and information providers and other market data may be reviewed in the course of making a good faith determination of a security’s fair value.
Valuations change in response to many factors including the historical and prospective earnings of the issuer, the value of the issuer’s assets, general economic conditions, interest rates, investor perceptions and market liquidity. Because of the inherent uncertainties of valuation, the values reflected in the financial statements may materially differ from the value received upon actual sale of those investments.
| B. | Securities Transactions and Investment Income — Securities transactions are accounted for on a trade date basis. Realized gains or losses on sales are computed on the basis of specific identification of the securities sold. Interest income is recorded on the accrual basis from settlement date. Dividend income (net of withholding tax, if any) is recorded on the ex-dividend date. |
The Fund may periodically participate in litigation related to Fund investments. As such, the Fund may receive proceeds from litigation settlements. Any proceeds received are included in the Statement of Operations as realized gain (loss) for investments no longer held and as unrealized gain (loss) for investments still held.
Brokerage commissions and mark ups are considered transaction costs and are recorded as an increase to the cost basis of securities purchased and/or a reduction of proceeds on a sale of securities. Such transaction costs are included in the determination of net realized and unrealized gain (loss) from investment securities reported in the Statement of Operations and the Statement of Changes in Net Assets and the net realized and unrealized gains (losses) on securities per share in the Financial Highlights. Transaction costs are included in the calculation of the Fund’s net asset value and, accordingly, they reduce the Fund’s total returns. These transaction costs are not considered operating expenses and are not reflected in net investment income reported in the Statement of Operations and Statement of Changes in Net Assets, or the net investment income per share and ratios of expenses and net investment income reported in the Financial Highlights, nor are they limited by any expense limitation arrangements between the Fund and the investment adviser.
The Fund allocates income and realized and unrealized capital gains and losses to a class based on the relative net assets of each class.
| C. | Country Determination — For the purposes of making investment selection decisions and presentation in the Schedule of Investments, the investment adviser may determine the country in which an issuer is located and/or credit risk exposure based on various factors. These factors include the laws of the country under which the issuer is organized, where the issuer maintains a principal office, the country in which the issuer derives 50% or more of its total revenues and the country that has the primary market for the issuer’s securities, as well as other criteria. Among the other criteria that may be evaluated for making this determination are the country in which the issuer maintains 50% or more of its assets, the type of security, financial guarantees and enhancements, the nature of the collateral and the sponsor organization. Country of issuer and/or credit risk exposure has been determined to be the United States of America, unless otherwise noted. |
| D. | Distributions — Distributions from income and net realized capital gain, if any, are generally declared and paid annually and recorded on the ex-dividend date. The Fund may elect to treat a portion of the proceeds from redemptions as distributions for federal income tax purposes. |
| E. | Federal Income Taxes — The Fund intends to comply with the requirements of Subchapter M of the Internal Revenue Code necessary to qualify as a regulated investment company and to distribute substantially all of the Fund’s taxable earnings to shareholders. As such, the Fund will not be subject to federal income taxes on otherwise taxable income (including net realized capital gain) that is distributed to shareholders. Therefore, no provision for federal income taxes is recorded in the financial statements. |
14 Invesco International Small Company Fund
The Fund files tax returns in the U.S. Federal jurisdiction and certain other jurisdictions. Generally, the Fund is subject to examinations by such taxing authorities for up to three years after the filing of the return for the tax period.
| F. | Expenses — Fees provided for under the Rule 12b-1 plan of a particular class of the Fund are charged to the operations of such class. Transfer agency fees and expenses and other shareholder recordkeeping fees and expenses attributable to Class R5 and Class R6 are allocated to each share class based on relative net assets. Sub-accounting fees attributable to Class R5 are charged to the operations of the class. Transfer agency fees and expenses and other shareholder recordkeeping fees and expenses relating to all other classes are allocated among those classes based on relative net assets. All other expenses are allocated among the classes based on relative net assets. |
| G. | Accounting Estimates — The preparation of financial statements in conformity with accounting principles generally accepted in the United States of America (“GAAP”) requires management to make estimates and assumptions that affect the reported amounts of assets and liabilities at the date of the financial statements and the reported amounts of revenues and expenses during the reporting period including estimates and assumptions related to taxation. Actual results could differ from those estimates by a significant amount. In addition, the Fund monitors for material events or transactions that may occur or become known after the period-end date and before the date the financial statements are released to print. |
| H. | Indemnifications — Under the Trust’s organizational documents, each Trustee, officer, employee or other agent of the Trust is indemnified against certain liabilities that may arise out of the performance of their duties to the Fund. Additionally, in the normal course of business, the Fund enters into contracts, including the Fund’s servicing agreements, that contain a variety of indemnification clauses. The Fund’s maximum exposure under these arrangements is unknown as this would involve future claims that may be made against the Fund that have not yet occurred. The risk of material loss as a result of such indemnification claims is considered remote. |
| I. | Redemption Fees — The Fund had a 2% redemption fee that was retained by the Fund to offset transaction costs and other expenses associated with short-term redemptions and exchanges. The fee, subject to certain exceptions, was imposed on certain redemptions or exchanges of shares within 31 days of purchase. The redemption fee was recorded as an increase in shareholder capital and was allocated among the share classes based on the relative net assets of each class. Effective January 1, 2012, the Fund eliminated the 2% redemption fee assessed on shares of the Fund redeemed or exchanged within 31 days of purchase. |
| J. | Foreign Currency Translations — Foreign currency is valued at the close of the NYSE based on quotations posted by banks and major currency dealers. Portfolio securities and other assets and liabilities denominated in foreign currencies are translated into U.S. dollar amounts at date of valuation. Purchases and sales of portfolio securities (net of foreign taxes withheld on disposition) and income items denominated in foreign currencies are translated into U.S. dollar amounts on the respective dates of such transactions. The Fund does not separately account for the portion of the results of operations resulting from changes in foreign exchange rates on investments and the fluctuations arising from changes in market prices of securities held. The combined results of changes in foreign exchange rates and the fluctuation of market prices on investments (net of estimated foreign tax withholding) are included with the net realized and unrealized gain or loss from investments in the Statement of Operations. Reported net realized foreign currency gains or losses arise from (1) sales of foreign currencies, (2) currency gains or losses realized between the trade and settlement dates on securities transactions, and (3) the difference between the amounts of dividends, interest, and foreign withholding taxes recorded on the Fund’s books and the U.S. dollar equivalent of the amounts actually received or paid. Net unrealized foreign currency gains and losses arise from changes in the fair values of assets and liabilities, other than investments in securities at fiscal period end, resulting from changes in exchange rates. |
The Fund may invest in foreign securities which may be subject to foreign taxes on income, gains on investments or currency repatriation, a portion of which may be recoverable.
| K. | Foreign Currency Contracts — The Fund may enter into foreign currency contracts to manage or minimize currency or exchange rate risk. The Fund may also enter into foreign currency contracts for the purchase or sale of a security denominated in a foreign currency in order to “lock in” the U.S. dollar price of that security. A foreign currency contract is an obligation to purchase or sell a specific currency for an agreed-upon price at a future date. The use of foreign currency contracts does not eliminate fluctuations in the price of the underlying securities the Fund owns or intends to acquire but establishes a rate of exchange in advance. Fluctuations in the value of these contracts are measured by the difference in the contract date and reporting date exchange rates and are recorded as unrealized appreciation (depreciation) until the contracts are closed. When the contracts are closed, realized gains (losses) are recorded. Realized and unrealized gains (losses) on the contracts are included in the Statement of Operations. The primary risks associated with foreign currency contracts include failure of the counterparty to meet the terms of the contract and the value of the foreign currency changing unfavorably. These risks may be in excess of the amounts reflected in the Statement of Assets and Liabilities. |
NOTE 2—Advisory Fees and Other Fees Paid to Affiliates
The Trust has entered into a master investment advisory agreement with Invesco Advisers, Inc. (the “Adviser” or “Invesco”). Under the terms of the investment advisory agreement, the Fund pays an advisory fee to the Adviser based on the annual rate of the Fund’s average daily net assets as follows:
| | | | | | |
| Average Daily Net Assets | | Rate |
First $250 million | | | 0 | .935% | | |
Next $250 million | | | 0 | .910% | | |
Next $500 million | | | 0 | .885% | | |
Next $1.5 billion | | | 0 | .860% | | |
Next $2.5 billion | | | 0 | .835% | | |
Next $2.5 billion | | | 0 | .810% | | |
Next $2.5 billion | | | 0 | .785% | | |
Over $10 billion | | | 0 | .760% | | |
15 Invesco International Small Company Fund
Under the terms of a master sub-advisory agreement between the Adviser and each of Invesco Asset Management Deutschland GmbH, Invesco Asset Management Limited, Invesco Asset Management (Japan) Limited, Invesco Australia Limited, Invesco Hong Kong Limited, Invesco Senior Secured Management, Inc. and Invesco Canada Ltd. (collectively, the “Affiliated Sub-Advisers”) the Adviser, not the Fund, may pay 40% of the fees paid to the Adviser to any such Affiliated Sub-Adviser(s) that provide discretionary investment management services to the Fund based on the percentage of assets allocated to such Sub-Adviser(s).
The Adviser has contractually agreed, through at least June 30, 2013, to waive advisory fees and/or reimburse expenses of all shares to the extent necessary to limit total annual fund operating expenses after fee waivers and/or expense reimbursements (excluding certain items discussed below) of Class A, Class B, Class C, Class Y, Class R5 and Class R6 shares to 2.25%, 3.00%, 3.00%, 2.00%, 2.00% and 2.00% of average daily net assets, respectively. In determining the Adviser’s obligation to waive advisory fees and/or reimburse expenses, the following expenses are not taken into account, and could cause the total annual fund operating expenses after fee waivers and/or expense reimbursements to exceed the numbers reflected above: (1) interest; (2) taxes; (3) dividend expense on short sales; (4) extraordinary or non-routine items, including litigation expenses; and (5) expenses that the Fund has incurred but did not actually pay because of an expense offset arrangement. Unless the Board of Trustees and Invesco mutually agree to amend or continue the fee waiver agreement, it will terminate on June 30, 2013. The Adviser did not waive fees and/or reimburse expenses during the period under the expense limitation.
Further, the Adviser has contractually agreed, through at least June 30, 2013, to waive the advisory fee payable by the Fund in an amount equal to 100% of the net advisory fees the Adviser receives from the affiliated money market funds on investments by the Fund of uninvested cash in such affiliated money market funds.
For the year ended December 31, 2012, the Adviser waived advisory fees of $67,032.
The Trust has entered into a master administrative services agreement with Invesco pursuant to which the Fund has agreed to pay Invesco for certain administrative costs incurred in providing accounting services to the Fund. For the year ended December 31, 2012, expenses incurred under the agreement are shown in the Statement of Operations as Administrative services fees.
The Trust has entered into a transfer agency and service agreement with Invesco Investment Services, Inc. (“IIS”) pursuant to which the Fund has agreed to pay IIS a fee for providing transfer agency and shareholder services to the Fund and reimburse IIS for certain expenses incurred by IIS in the course of providing such services. IIS may make payments to intermediaries that provide omnibus account services, sub-accounting services and/or networking services. All fees payable by IIS to intermediaries that provide omnibus account services or sub-accounting are charged back to the Fund, subject to certain limitations approved by the Trust’s Board of Trustees. For the year ended December 31, 2012, expenses incurred under the agreement are shown in the Statement of Operations as Transfer agent fees.
The Trust has entered into master distribution agreements with Invesco Distributors, Inc. (“IDI”) to serve as the distributor for the Class A, Class B, Class C, Class Y, Class R5 and Class R6 shares of the Fund. The Trust has adopted plans pursuant to Rule 12b-1 under the 1940 Act with respect to the Fund’s Class A, Class B and Class C shares (collectively, the “Plans”). The Fund, pursuant to the Plans, pays IDI compensation at the annual rate of 0.25% of the Fund’s average daily net assets of Class A shares and 1.00% of the average daily net assets of Class B and Class C shares. Of the Plan payments, up to 0.25% of the average daily net assets of each class of shares may be paid to furnish continuing personal shareholder services to customers who purchase and own shares of such classes. Any amounts not paid as a service fee under the Plans would constitute an asset-based sales charge. Rules of the Financial Industry Regulatory Authority (“FINRA”) impose a cap on the total sales charges, including asset-based sales charges, that may be paid by any class of shares of the Fund. For the year ended December 31, 2012, expenses incurred under the Plans are shown in the Statement of Operations as Distribution fees.
Front-end sales commissions and CDSC (collectively, the “sales charges”) are not recorded as expenses of the Fund. Front-end sales commissions are deducted from proceeds from the sales of Fund shares prior to investment in Class A shares of the Fund. CDSC are deducted from redemption proceeds prior to remittance to the shareholder. During the year ended December 31, 2012, IDI advised the Fund that IDI retained $7,014 in front-end sales commissions from the sale of Class A shares and $12, $8,922 and $589 from Class A, Class B and Class C shares, respectively, for CDSC imposed on redemptions by shareholders.
Certain officers and trustees of the Trust are officers and directors of the Adviser, IIS and/or IDI.
NOTE 3—Additional Valuation Information
GAAP defines fair value as the price that would be received to sell an asset or paid to transfer a liability in an orderly transaction between market participants at the measurement date, under current market conditions. GAAP establishes a hierarchy that prioritizes the inputs to valuation methods giving the highest priority to readily available unadjusted quoted prices in an active market for identical assets (Level 1) and the lowest priority to significant unobservable inputs (Level 3) generally when market prices are not readily available or are unreliable. Based on the valuation inputs, the securities or other investments are tiered into one of three levels. Changes in valuation methods may result in transfers in or out of an investment’s assigned level:
| | Level 1 — | Prices are determined using quoted prices in an active market for identical assets. |
| | Level 2 — | Prices are determined using other significant observable inputs. Observable inputs are inputs that other market participants may use in pricing a security. These may include quoted prices for similar securities, interest rates, prepayment speeds, credit risk, yield curves, loss severities, default rates, discount rates, volatilities and others. |
| | Level 3 — | Prices are determined using significant unobservable inputs. In situations where quoted prices or observable inputs are unavailable (for example, when there is little or no market activity for an investment at the end of the period), unobservable inputs may be used. Unobservable inputs reflect the Fund’s own assumptions about the factors market participants would use in determining fair value of the securities or instruments and would be based on the best available information. |
The following is a summary of the tiered valuation input levels, as of December 31, 2012. The level assigned to the securities valuations may not be an indication of the risk or liquidity associated with investing in those securities. Because of the inherent uncertainties of valuation, the values reflected in the financial statements may materially differ from the value received upon actual sale of those investments.
16 Invesco International Small Company Fund
During the year ended December 31, 2012, there were transfers from Level 1 to Level 2 of $155,159,074 and from Level 2 to Level 1 of $6,755,612, due to foreign fair value adjustments.
| | | | | | | | | | | | | | | | |
| | | Level 1 | | | Level 2 | | | Level 3 | | | Total | |
Belgium | | $ | — | | | $ | 4,417,481 | | | $ | — | | | $ | 4,417,481 | |
Brazil | | | 6,317,793 | | | | 7,929,242 | | | | — | | | | 14,247,035 | |
Canada | | | 129,965,039 | | | | — | | | | — | | | | 129,965,039 | |
China | | | — | | | | 8,430,577 | | | | 932,183 | | | | 9,362,760 | |
Germany | | | 10,858,898 | | | | — | | | | — | | | | 10,858,898 | |
Greece | | | — | | | | 5,175,195 | | | | — | | | | 5,175,195 | |
Hong Kong | | | — | | | | 15,594,923 | | | | — | | | | 15,594,923 | |
Ireland | | | 3,521,314 | | | | 17,800,823 | | | | — | | | | 21,322,137 | |
Italy | | | — | | | | 9,611,706 | | | | — | | | | 9,611,706 | |
Japan | | | 9,290,289 | | | | 11,532,350 | | | | — | | | | 20,822,639 | |
Malaysia | | | — | | | | 32,895,632 | | | | — | | | | 32,895,632 | |
Netherlands | | | — | | | | 7,303,001 | | | | — | | | | 7,303,001 | |
New Zealand | | | — | | | | 6,263,723 | | | | — | | | | 6,263,723 | |
Norway | | | — | | | | 25,840,137 | | | | — | | | | 25,840,137 | |
Philippines | | | — | | | | 44,224,960 | | | | — | | | | 44,224,960 | |
Switzerland | | | — | | | | 9,485,294 | | | | — | | | | 9,485,294 | |
Thailand | | | — | | | | 10,486,428 | | | | — | | | | 10,486,428 | |
Turkey | | | — | | | | 8,753,270 | | | | — | | | | 8,753,270 | |
United Kingdom | | | 7,490,257 | | | | 69,309,772 | | | | — | | | | 76,800,029 | |
United States | | | 66,767,478 | | | | — | | | | — | | | | 66,767,478 | |
| | | $ | 234,211,068 | | | $ | 295,054,514 | | | $ | 932,183 | | | $ | 530,197,765 | |
NOTE 4—Expense Offset Arrangement(s)
The expense offset arrangement is comprised of transfer agency credits which result from balances in Demand Deposit Accounts (DDA) used by the transfer agent for clearing shareholder transactions. For the year ended December 31, 2012, the Fund received credits from this arrangement, which resulted in the reduction of the Fund’s total expenses of $946.
NOTE 5—Trustees’ and Officers’ Fees and Benefits
“Trustees’ and Officers’ Fees and Benefits” include amounts accrued by the Fund to pay remuneration to certain Trustees and Officers of the Fund. Trustees have the option to defer compensation payable by the Fund, and “Trustees’ and Officers’ Fees and Benefits” also include amounts accrued by the Fund to fund such deferred compensation amounts. Those Trustees who defer compensation have the option to select various Invesco Funds in which their deferral accounts shall be deemed to be invested. Finally, certain current Trustees are eligible to participate in a retirement plan that provides for benefits to be paid upon retirement to Trustees over a period of time based on the number of years of service. The Fund may have certain former Trustees who also participate in a retirement plan and receive benefits under such plan. “Trustees’ and Officers’ Fees and Benefits” include amounts accrued by the Fund to fund such retirement benefits. Obligations under the deferred compensation and retirement plans represent unsecured claims against the general assets of the Fund.
NOTE 6—Cash Balances
The Fund is permitted to temporarily carry a negative or overdrawn balance in its account with State Street Bank and Trust Company, the custodian bank. Such balances, if any at period end, are shown in the Statement of Assets and Liabilities under the payable caption Amount due custodian. To compensate the custodian bank for such overdrafts, the overdrawn Fund may either (1) leave funds as a compensating balance in the account so the custodian bank can be compensated by earning the additional interest; or (2) compensate by paying the custodian bank at a rate agreed upon by the custodian bank and Invesco, not to exceed the contractually agreed upon rate.
17 Invesco International Small Company Fund
NOTE 7—Distributions to Shareholders and Tax Components of Net Assets
Tax Character of Distributions to Shareholders Paid During the Years Ended December 31, 2012 and 2011:
| | | | | | | | |
| | | 2012 | | | 2011 | |
Ordinary income | | $ | 1,565,250 | | | $ | 6,507,205 | |
Tax Components of Net Assets at Period-End:
| | | | |
| | | 2012 | |
Undistributed ordinary income | | $ | 756,974 | |
Net unrealized appreciation — investments | | | 135,114,257 | |
Net unrealized appreciation (depreciation) — other investments | | | (2,723 | ) |
Temporary book/tax differences | | | (110,031 | ) |
Capital loss carryforward | | | (4,330,481 | ) |
Shares of beneficial interest | | | 399,620,629 | |
Total net assets | | $ | 531,048,625 | |
The difference between book-basis and tax-basis unrealized appreciation (depreciation) is due to differences in the timing of recognition of gains and losses on investments for tax and book purposes. The Fund’s net unrealized appreciation difference is attributable primarily to wash sales and passive foreign investment companies.
The temporary book/tax differences are a result of timing differences between book and tax recognition of income and/or expenses. The Fund’s temporary book/tax differences are the result of passive foreign investment companies, trustee deferral of compensation and retirement plan benefits.
Capital loss carryforward is calculated and reported as of a specific date. Results of transactions and other activity after that date may affect the amount of capital loss carryforward actually available for the Fund to utilize. The Regulated Investment Company Modernization Act of 2010 (the “Act”) eliminated the eight-year carryover period for capital losses that arise in taxable years beginning after its enactment date of December 22, 2010. Consequently, these capital losses can be carried forward for an unlimited period. However, capital losses with an expiration period may not be used to offset capital gains until all net capital losses without an expiration date have been utilized. Additionally, post-enactment capital loss carryovers will retain their character as either short-term or long-term capital losses instead of as short-term capital losses as under prior law. The ability to utilize capital loss carryforward in the future may be limited under the Internal Revenue Code and related regulations based on the results of future transactions.
The Fund utilized $32,647,806 of capital loss carryforward in the current period to offset net realized capital gain for federal income tax purposes. The Fund has a capital loss carryforward as of December 31, 2012, which expires as follows:
| | | | | | | | | | | | |
| Capital Loss Carryforward* | |
| Expiration | | Short-Term | | | Long-Term | | | Total | |
December 31, 2017 | | $ | 4,330,481 | | | $ | — | | | $ | 4,330,481 | |
| * | Capital loss carryforward as of the date listed above is reduced for limitations, if any, to the extent required by the Internal Revenue Code. |
NOTE 8—Investment Securities
The aggregate amount of investment securities (other than short-term securities, U.S. Treasury obligations and money market funds, if any) purchased and sold by the Fund during the year ended December 31, 2012 was $67,868,880 and $121,240,596, respectively. Cost of investments on a tax basis includes the adjustments for financial reporting purposes as of the most recently completed federal income tax reporting period-end.
| | | | |
| Unrealized Appreciation (Depreciation) of Investment Securities on a Tax Basis | |
Aggregate unrealized appreciation of investment securities | | $ | 157,185,824 | |
Aggregate unrealized (depreciation) of investment securities | | | (22,071,567 | ) |
Net unrealized appreciation of investment securities | | $ | 135,114,257 | |
Cost of investments for tax purposes is $395,083,508.
NOTE 9—Reclassification of Permanent Differences
Primarily as a result of differing book/tax treatment of foreign currency transactions and capital gains, on December 31, 2012, undistributed net investment income was decreased by $917,580, undistributed net realized gain (loss) was increased by $922,981 and shares of beneficial interest was decreased by $5,401. This reclassification had no effect on the net assets of the Fund.
18 Invesco International Small Company Fund
NOTE 10—Share Information
| | | | | | | | | | | | | | | | |
| | | Summary of Share Activity | |
| | | Years ended December 31, | |
| | | 2012(a) | | | 2011 | |
| | | Shares | | | Amount | | | Shares | | | Amount | |
Sold: | | | | | | | | | | | | | | | | |
Class A | | | 3,155,033 | | | $ | 60,176,317 | | | | 4,552,994 | | | $ | 86,697,772 | |
Class B | | | 7,313 | | | | 135,704 | | | | 18,289 | | | | 336,966 | |
Class C | | | 86,777 | | | | 1,622,677 | | | | 148,816 | | | | 2,734,177 | |
Class Y | | | 3,120,840 | | | | 60,671,259 | | | | 2,059,955 | | | | 37,610,281 | |
Class R5 | | | 1,569,022 | | | | 29,376,800 | | | | 2,003,632 | | | | 37,558,744 | |
Class R6(b) | | | 919,157 | | | | 18,072,042 | | | | — | | | | — | |
| | | | |
Issued as reinvestment of dividends: | | | | | | | | | | | | | | | | |
Class A | | | 26,658 | | | | 544,365 | | | | 222,596 | | | | 3,991,071 | |
Class B | | | 289 | | | | 5,691 | | | | 4,681 | | | | 82,064 | |
Class C | | | 947 | | | | 18,639 | | | | 10,345 | | | | 180,649 | |
Class Y | | | 17,258 | | | | 353,100 | | | | 43,559 | | | | 786,878 | |
Class R5 | | | 21,080 | | | | 428,336 | | | | 66,026 | | | | 1,177,907 | |
Class R6 | | | 5,005 | | | | 101,743 | | | | — | | | | — | |
| | | | |
Automatic conversion of Class B shares to Class A shares: | | | | | | | | | | | | | | | | |
Class A | | | 293,006 | | | | 5,649,653 | | | | 119,595 | | | | 2,245,810 | |
Class B | | | (303,824 | ) | | | (5,649,653 | ) | | | (124,072 | ) | | | (2,245,810 | ) |
| | | | |
Reacquired:(c) | | | | | | | | | | | | | | | | |
Class A | | | (6,625,228 | ) | | | (125,357,040 | ) | | | (7,956,428 | ) | | | (148,777,418 | ) |
Class B | | | (182,950 | ) | | | (3,335,202 | ) | | | (286,010 | ) | | | (5,207,132 | ) |
Class C | | | (489,675 | ) | | | (8,993,792 | ) | | | (681,357 | ) | | | (12,308,425 | ) |
Class Y | | | (1,727,384 | ) | | | (33,115,832 | ) | | | (847,431 | ) | | | (15,503,070 | ) |
Class R5 | | | (1,708,841 | ) | | | (32,996,733 | ) | | | (1,381,853 | ) | | | (26,271,922 | ) |
Class R6 | | | (53,415 | ) | | | (1,082,040 | ) | | | — | | | | — | |
Net increase (decrease) in share activity | | | (1,868,932 | ) | | $ | (33,373,966 | ) | | | (2,026,663 | ) | | $ | (36,911,458 | ) |
| (a) | There are entities that are record owners of more than 5% of the outstanding shares of the Fund and in the aggregate own 34% of the outstanding shares of the Fund. IDI has an agreement with these entities to sell Fund shares. The Fund, Invesco and/or Invesco affiliates may make payments to these entities, which are considered to be related to the Fund, for providing services to the Fund, Invesco and/or Invesco affiliates including but not limited to services such as securities brokerage, distribution, third party record keeping and account servicing. The Fund has no knowledge as to whether all or any portion of the shares owned of record by these entities are also owned beneficially. |
| (b) | Commencement date of September 24, 2012. |
| (c) | Net of redemption fees of $2,473 and $27,270 allocated among the classes based on relative net assets of each class for the years ended December 31, 2012 and 2011, respectively. |
19 Invesco International Small Company Fund
NOTE 11—Financial Highlights
The following schedule presents financial highlights for a share of the Fund outstanding throughout the periods indicated.
| | | | | | | | | | | | | | | | | | | | | | | | | | | | | | | | | | | | | | | | | | | | | | | | | | | | | | | | |
| | | Net asset
value,
beginning of period | | | Net
investment
income(a) | | | Net gains
(losses)
on securities
(both
realized and
unrealized) | | | Total from
investment
operations | | | Dividends
from net
investment
income | | | Distributions
from net
realized
gains | | | Total
distributions | | | Net asset
value, end
of period(b) | | | Total
return(c) | | | Net assets, end of period
(000’s omitted) | | | Ratio of
expenses
to average net assets
with fee waivers
and/or expenses
absorbed | | | Ratio of
expenses
to average net
assets without
fee waivers
and/or expenses
absorbed | | | Ratio of net
investment
income to average
net assets | | | Portfolio
turnover(d) | |
Class A | | | | | | | | | | | | | | | | | | | | | | | | | | | | | | | | | | | | | | | | | | | | | | | | | | | | | | | | |
Year ended 12/31/12 | | $ | 17.93 | | | $ | 0.18 | | | $ | 2.74 | | | $ | 2.92 | | | $ | (0.04 | ) | | $ | — | | | $ | (0.04 | ) | | $ | 20.81 | | | | 16.31 | % | | $ | 295,767 | | | | 1.50 | %(e) | | | 1.51 | %(e) | | | 0.97 | %(e) | | | 15 | % |
Year ended 12/31/11 | | | 18.75 | | | | 0.19 | | | | (0.77 | ) | | | (0.58 | ) | | | (0.24 | ) | | | — | | | | (0.24 | ) | | | 17.93 | | | | (3.08 | ) | | | 311,409 | | | | 1.49 | | | | 1.50 | | | | 1.02 | | | | 18 | |
Year ended 12/31/10 | | | 15.05 | | | | 0.16 | | | | 3.69 | | | | 3.85 | | | | (0.15 | ) | | | — | | | | (0.15 | ) | | | 18.75 | | | | 25.60 | | | | 382,960 | | | | 1.57 | | | | 1.58 | | | | 1.01 | | | | 20 | |
Year ended 12/31/09 | | | 9.19 | | | | 0.21 | | | | 5.82 | | | | 6.03 | | | | (0.17 | ) | | | — | | | | (0.17 | ) | | | 15.05 | | | | 65.63 | | | | 354,624 | | | | 1.60 | | | | 1.61 | | | | 1.76 | | | | 26 | |
Year ended 12/31/08 | | | 22.45 | | | | 0.24 | | | | (12.47 | ) | | | (12.23 | ) | | | (0.34 | ) | | | (0.69 | ) | | | (1.03 | ) | | | 9.19 | | | | (54.24 | ) | | | 189,189 | | | | 1.57 | | | | 1.58 | | | | 1.38 | | | | 19 | |
Class B | | | | | | | | | | | | | | | | | | | | | | | | | | | | | | | | | | | | | | | | | | | | | | | | | | | | | | | | |
Year ended 12/31/12 | | | 17.36 | | | | 0.04 | | | | 2.64 | | | | 2.68 | | | | (0.01 | ) | | | — | | | | (0.01 | ) | | | 20.03 | | | | 15.44 | | | | 10,352 | | | | 2.25 | (e) | | | 2.26 | (e) | | | 0.22 | (e) | | | 15 | |
Year ended 12/31/11 | | | 18.14 | | | | 0.05 | | | | (0.74 | ) | | | (0.69 | ) | | | (0.09 | ) | | | — | | | | (0.09 | ) | | | 17.36 | | | | (3.83 | ) | | | 17,296 | | | | 2.24 | | | | 2.25 | | | | 0.27 | | | | 18 | |
Year ended 12/31/10 | | | 14.57 | | | | 0.04 | | | | 3.55 | | | | 3.59 | | | | (0.02 | ) | | | — | | | | (0.02 | ) | | | 18.14 | | | | 24.65 | | | | 25,086 | | | | 2.32 | | | | 2.33 | | | | 0.26 | | | | 20 | |
Year ended 12/31/09 | | | 8.91 | | | | 0.12 | | | | 5.62 | | | | 5.74 | | | | (0.08 | ) | | | — | | | | (0.08 | ) | | | 14.57 | | | | 64.48 | | | | 26,946 | | | | 2.35 | | | | 2.36 | | | | 1.01 | | | | 26 | |
Year ended 12/31/08 | | | 21.58 | | | | 0.11 | | | | (11.94 | ) | | | (11.83 | ) | | | (0.15 | ) | | | (0.69 | ) | | | (0.84 | ) | | | 8.91 | | | | (54.61 | ) | | | 19,323 | | | | 2.32 | | | | 2.33 | | | | 0.63 | | | | 19 | |
Class C | | | | | | | | | | | | | | | | | | | | | | | | | | | | | | | | | | | | | | | | | | | | | | | | | | | | | | | | |
Year ended 12/31/12 | | | 17.37 | | | | 0.04 | | | | 2.63 | | | | 2.67 | | | | (0.01 | ) | | | — | | | | (0.01 | ) | | | 20.03 | | | | 15.38 | | | | 36,136 | | | | 2.25 | (e) | | | 2.26 | (e) | | | 0.22 | (e) | | | 15 | |
Year ended 12/31/11 | | | 18.14 | | | | 0.05 | | | | (0.73 | ) | | | (0.68 | ) | | | (0.09 | ) | | | — | | | | (0.09 | ) | | | 17.37 | | | | (3.77 | ) | | | 38,311 | | | | 2.24 | | | | 2.25 | | | | 0.27 | | | | 18 | |
Year ended 12/31/10 | | | 14.57 | | | | 0.04 | | | | 3.55 | | | | 3.59 | | | | (0.02 | ) | | | — | | | | (0.02 | ) | | | 18.14 | | | | 24.65 | | | | 49,484 | | | | 2.32 | | | | 2.33 | | | | 0.26 | | | | 20 | |
Year ended 12/31/09 | | | 8.91 | | | | 0.12 | | | | 5.62 | | | | 5.74 | | | | (0.08 | ) | | | — | | | | (0.08 | ) | | | 14.57 | | | | 64.48 | | | | 46,646 | | | | 2.35 | | | | 2.36 | | | | 1.01 | | | | 26 | |
Year ended 12/31/08 | | | 21.57 | | | | 0.11 | | | | (11.93 | ) | | | (11.82 | ) | | | (0.15 | ) | | | (0.69 | ) | | | (0.84 | ) | | | 8.91 | | | | (54.58 | ) | | | 28,391 | | | | 2.32 | | | | 2.33 | | | | 0.63 | | | | 19 | |
Class Y | | | | | | | | | | | | | | | | | | | | | | | | | | | | | | | | | | | | | | | | | | | | | | | | | | | | | | | | |
Year ended 12/31/12 | | | 17.97 | | | | 0.23 | | | | 2.73 | | | | 2.96 | | | | (0.09 | ) | | | — | | | | (0.09 | ) | | | 20.84 | | | | 16.51 | | | | 90,843 | | | | 1.25 | (e) | | | 1.26 | (e) | | | 1.22 | (e) | | | 15 | |
Year ended 12/31/11 | | | 18.79 | | | | 0.24 | | | | (0.77 | ) | | | (0.53 | ) | | | (0.29 | ) | | | — | | | | (0.29 | ) | | | 17.97 | | | | (2.79 | ) | | | 52,959 | | | | 1.24 | | | | 1.25 | | | | 1.27 | | | | 18 | |
Year ended 12/31/10 | | | 15.08 | | | | 0.20 | | | | 3.70 | | | | 3.90 | | | | (0.19 | ) | | | — | | | | (0.19 | ) | | | 18.79 | | | | 25.89 | | | | 31,780 | | | | 1.32 | | | | 1.33 | | | | 1.26 | | | | 20 | |
Year ended 12/31/09 | | | 9.20 | | | | 0.26 | | | | 5.81 | | | | 6.07 | | | | (0.19 | ) | | | — | | | | (0.19 | ) | | | 15.08 | | | | 66.09 | | | | 20,216 | | | | 1.35 | | | | 1.36 | | | | 2.01 | | | | 26 | |
Year ended 12/31/08(f) | | | 13.37 | | | | 0.03 | | | | (3.17 | ) | | | (3.14 | ) | | | (0.34 | ) | | | (0.69 | ) | | | (1.03 | ) | | | 9.20 | | | | (23.08 | ) | | | 6,638 | | | | 1.63 | (g) | | | 1.63 | (g) | | | 1.32 | (g) | | | 19 | |
Class R5 | | | | | | | | | | | | | | | | | | | | | | | | | | | | | | | | | | | | | | | | | | | | | | | | | | | | | | | | |
Year ended 12/31/12 | | | 17.85 | | | | 0.25 | | | | 2.72 | | | | 2.97 | | | | (0.11 | ) | | | — | | | | (0.11 | ) | | | 20.71 | | | | 16.66 | | | | 79,911 | | | | 1.13 | (e) | | | 1.14 | (e) | | | 1.34 | (e) | | | 15 | |
Year ended 12/31/11 | | | 18.67 | | | | 0.26 | | | | (0.76 | ) | | | (0.50 | ) | | | (0.32 | ) | | | — | | | | (0.32 | ) | | | 17.85 | | | | (2.66 | ) | | | 70,976 | | | | 1.11 | | | | 1.12 | | | | 1.40 | | | | 18 | |
Year ended 12/31/10 | | | 14.98 | | | | 0.24 | | | | 3.68 | | | | 3.92 | | | | (0.23 | ) | | | — | | | | (0.23 | ) | | | 18.67 | | | | 26.20 | | | | 61,396 | | | | 1.10 | | | | 1.11 | | | | 1.48 | | | | 20 | |
Year ended 12/31/09 | | | 9.13 | | | | 0.28 | | | | 5.79 | | | | 6.07 | | | | (0.22 | ) | | | — | | | | (0.22 | ) | | | 14.98 | | | | 66.56 | | | | 34,269 | | | | 1.10 | | | | 1.11 | | | | 2.26 | | | | 26 | |
Year ended 12/31/08 | | | 22.47 | | | | 0.32 | | | | (12.52 | ) | | | (12.20 | ) | | | (0.45 | ) | | | (0.69 | ) | | | (1.14 | ) | | | 9.13 | | | | (54.02 | ) | | | 15,762 | | | | 1.13 | | | | 1.14 | | | | 1.82 | | | | 19 | |
Class R6 | | | | | | | | | | | | | | | | | | | | | | | | | | | | | | | | | | | | | | | | | | | | | | | | | | | | | | | | |
Year ended 12/31/12(f) | | | 19.66 | | | | 0.08 | | | | 1.09 | | | | 1.17 | | | | (0.11 | ) | | | — | | | | (0.11 | ) | | | 20.72 | | | | 5.99 | | | | 18,039 | | | | 1.05 | (e)(g) | | | 1.06 | (e)(g) | | | 1.42 | (e)(g) | | | 15 | |
| (a) | Calculated using average shares outstanding. |
| (b) | Includes redemption fees added to shares of beneficial interest which were less than $0.005 per share. |
| (c) | Includes adjustments in accordance with accounting principles generally accepted in the United States of America and as such, the net asset value for financial reporting purposes and the returns based upon those net asset values may differ from the net asset value and returns for shareholder transactions. Does not include sales charges and is not annualized for periods less than one year, if applicable. |
| (d) | Portfolio turnover is calculated at the fund level and is not annualized for periods less than one year, if applicable. |
| (e) | Ratios are based on average daily net assets (000’s omitted) of $298,170, $13,918, $36,694, $69,859, $76,261 and $17,884 for Class A, Class B, Class C, Class Y, Class R5 and Class R6 shares, respectively. |
| (f) | Commencement date of October 3, 2008 and September 24, 2012 for Class Y and Class R6 shares, respectively. |
20 Invesco International Small Company Fund
Report of Independent Registered Public Accounting Firm
To the Board of Trustees of AIM Funds Group (Invesco Funds Group)
and Shareholders of Invesco International Small Company Fund:
In our opinion, the accompanying statement of assets and liabilities, including the schedule of investments, and the related statements of operations and of changes in net assets and the financial highlights present fairly, in all material respects, the financial position of Invesco International Small Company Fund (one of the funds constituting AIM Funds Group (Invesco Funds Group), hereafter referred to as the “Fund”) at December 31, 2012, the results of its operations for the year then ended, the changes in its net assets for each of the two years in the period then ended and the financial highlights for each of the five years in the period then ended, in conformity with accounting principles generally accepted in the United States of America. These financial statements and financial highlights (hereafter referred to as “financial statements”) are the responsibility of the Fund’s management; our responsibility is to express an opinion on these financial statements based on our audits. We conducted our audits of these financial statements in accordance with the standards of the Public Company Accounting Oversight Board (United States). Those standards require that we plan and perform the audit to obtain reasonable assurance about whether the financial statements are free of material misstatement. An audit includes examining, on a test basis, evidence supporting the amounts and disclosures in the financial statements, assessing the accounting principles used and significant estimates made by management, and evaluating the overall financial statement presentation. We believe that our audits, which included confirmation of securities at December 31, 2012 by correspondence with the custodian and brokers, provide a reasonable basis for our opinion.
PRICEWATERHOUSECOOPERS LLP
February 25, 2013
Houston, Texas
21 Invesco International Small Company Fund
Calculating your ongoing Fund expenses
Example
As a shareholder of the Fund, you incur two types of costs: (1) transaction costs, which may include sales charges (loads) on purchase payments or contingent deferred sales charges on redemptions, and redemption fees, if any; and (2) ongoing costs, including management fees, distribution and/or service (12b-1) fees, and other Fund expenses. This example is intended to help you understand your ongoing costs (in dollars) of investing in the Fund and to compare these costs with ongoing costs of investing in other mutual funds. With the exception of the actual ending account value and expenses of the Class R6 shares, the example is based on an investment of $1,000 invested at the beginning of the period and held for the entire period July 1, 2012 through December 31, 2012. The actual ending account value and expenses of the Class R6 shares in the example below are based on an investment of $1,000 invested as of close of business September 24, 2012 (commencement date) and held through December 31, 2012.
Actual expenses
The table below provides information about actual account values and actual expenses. You may use the information in this table, together with the amount you invested, to estimate the expenses that you paid over the period. Simply divide your account value by $1,000 (for example, an $8,600 account value divided by $1,000 = 8.6), then multiply the result by the number in the table under the heading entitled “Actual Expenses Paid During Period” to estimate the expenses you paid on your account during this period (as of close of business September 24, 2012 through December 31, 2012 for the Class R6 shares). Because the actual ending account value and expense information in the example is not based upon a six month period for the Class R6 shares, the ending account value and expense information may not provide a meaningful comparison to mutual funds that provide such information for a full six month period.
Hypothetical example for comparison purposes
The table below also provides information about hypothetical account values and hypothetical expenses based on the Fund’s actual expense ratio and an assumed rate of return of 5% per year before expenses, which is not the Fund’s actual return.
The hypothetical account values and expenses may not be used to estimate the actual ending account balance or expenses you paid for the period. You may use this information to compare the ongoing costs of investing in the Fund and other funds. To do so, compare this 5% hypothetical example with the 5% hypothetical examples that appear in the shareholder reports of the other funds.
Please note that the expenses shown in the table are meant to highlight your ongoing costs only and do not reflect any transaction costs, such as sales charges (loads) on purchase payments, contingent deferred sales charges on redemptions, and redemption fees, if any. Therefore, the hypothetical information is useful in comparing ongoing costs only, and will not help you determine the relative total costs of owning different funds. In addition, if these transaction costs were included, your costs would have been higher.
| | | | | | | | | | | | | | | | | | | | | | | | |
| Class | | Beginning
Account Value
(07/01/12) | | | ACTUAL | | | HYPOTHETICAL (5% annual return before expenses) | | | Annualized
Expense
Ratio | |
| | | Ending
Account Value
(12/31/12)1 | | | Expenses
Paid During
Period2 | | | Ending
Account Value
(12/31/12) | | | Expenses
Paid During
Period3 | | |
| A | | $ | 1,000.00 | | | $ | 1,162.40 | | | $ | 8.21 | | | $ | 1,017.55 | | | $ | 7.66 | | | | 1.51 | % |
| B | | | 1,000.00 | | | | 1,157.80 | | | | 12.26 | | | | 1,013.77 | | | | 11.44 | | | | 2.26 | |
| C | | | 1,000.00 | | | | 1,157.80 | | | | 12.26 | | | | 1,013.77 | | | | 11.44 | | | | 2.26 | |
| Y | | | 1,000.00 | | | | 1,163.70 | | | | 6.85 | | | | 1,018.80 | | | | 6.39 | | | | 1.26 | |
| R5 | | | 1,000.00 | | | | 1,164.00 | | | | 6.20 | | | | 1,019.41 | | | | 5.79 | | | | 1.14 | |
| R6 | | | 1,000.00 | | | | 1,059.90 | | | | 2.93 | | | | 1,019.86 | | | | 5.33 | | | | 1.05 | |
| 1 | The actual ending account value is based on the actual total return of the Fund for the period July 1, 2012, through December 31, 2012 (as of close of business September 24, 2012 through December 31, 2012 for the Class R6 shares), after actual expenses and will differ from the hypothetical ending account value which is based on the Fund’s expense ratio and a hypothetical annual return of 5% before expenses. |
| 2 | Actual expenses are equal to the Fund’s annualized expense ratio as indicated above multiplied by the average account value over the period, multiplied by 184/366 to reflect the most recent fiscal half year. For the Class R6 shares actual expenses are equal to the annualized expense ratio indicated above multiplied by the average account value over the period, multiplied by 99 (as of close of business September 24, 2012 through December 31, 2012)/366. Because the Class R6 shares have not been in existence for a full six month period, the actual ending account value and expense information shown may not provide a meaningful comparison to fund expense information of classes that show such data for a full six month period and, because the actual ending account value and expense information in the expense example covers a short time period, return and expense data may not be indicative of return and expense data for longer time periods. |
| 3 | Hypothetical expenses are equal to the annualized expense ratio indicated above multiplied by the average account value over the period, multiplied by 184/366 to reflect a one-half year period. The hypothetical ending account value and expenses may be used to compare ongoing costs of investing in Class R6 shares of the Fund and other funds because such data is based on a full six month period. |
22 Invesco International Small Company Fund
Tax Information
Form 1099-DIV, Form 1042-S and other year–end tax information provide shareholders with actual calendar year amounts that should be included in their tax returns. Shareholders should consult their tax advisors.
The following distribution information is being provided as required by the Internal Revenue Code or to meet a specific state’s requirement.
The Fund designates the following amounts or, if subsequently determined to be different, the maximum amount allowable for its fiscal year ended December 31, 2012:
| | | | |
Federal and State Income Tax | |
Qualified Dividend Income* | | | 100 | % |
Corporate Dividends Received Deduction* | | | 1.55 | % |
Foreign Taxes | | $ | 0.0624 | per share |
Foreign Source Income | | $ | 0.4983 | per share |
| | * | The above percentages are based on ordinary income dividends paid to shareholders during the Fund’s fiscal year. |
23 Invesco International Small Company Fund
Trustees and Officers
The address of each trustee and officer is AIM Funds Group (Invesco Funds Group) (the “Trust”), 11 Greenway Plaza, Suite 1000, Houston, Texas 77046-1173. The trustees serve for the life of the Trust, subject to their earlier death, incapacitation, resignation, retirement or removal as more specifically provided in the Trust’s organizational documents. Each officer serves for a one year term or until their successors are elected and qualified. Column two below includes length of time served with predecessor entities, if any.
| | | | | | | | |
Name, Year of Birth and
Position(s) Held with the Trust | | Trustee and/
or Officer Since | | Principal Occupation(s)
During Past 5 Years | | Number of
Funds in Fund
Complex
Overseen by
Trustee | | Other Directorship(s)
Held by Trustee During
Past 5 Years |
| Interested Persons | | | | | | | | |
| Martin L. Flanagan1 — 1960 Trustee | | 2007 | | Executive Director, Chief Executive Officer and President, Invesco Ltd. (ultimate parent of Invesco and a global investment management firm); Advisor to the Board, Invesco Advisers, Inc. (formerly known as Invesco Institutional (N.A.), Inc.); Trustee, The Invesco Funds; Vice Chair, Investment Company Institute; and Member of Executive Board, SMU Cox School of Business Formerly: Chairman and Chief Executive Officer, Invesco Advisers, Inc. (registered investment adviser); Director, Chairman, Chief Executive Officer and President, IVZ Inc. (holding company), INVESCO Group Services, Inc. (service provider) and Invesco North American Holdings, Inc. (holding company); Director, Chief Executive Officer and President, Invesco Holding Company Limited (parent of Invesco and a global investment management firm); Director, Invesco Ltd.; Chairman, Investment Company Institute and President, Co-Chief Executive Officer, Co-President, Chief Operating Officer and Chief Financial Officer, Franklin Resources, Inc. (global investment management organization) | | 124 | | None |
| Philip A. Taylor2 — 1954 Trustee, President and Principal Executive Officer | | 2006 | | Head of North American Retail and Senior Managing Director, Invesco Ltd.; Director, Co-Chairman, Co-President and Co-Chief Executive Officer, Invesco Advisers, Inc. (formerly known as Invesco Institutional (N.A.), Inc.) (registered investment adviser); Director, Chairman, Chief Executive Officer and President, Invesco Management Group, Inc. (formerly known as Invesco Aim Management Group, Inc.) (financial services holding company); Director and President, INVESCO Funds Group, Inc. (registered investment adviser and registered transfer agent); Director and Chairman, Invesco Investment Services, Inc. (formerly known as Invesco Aim Investment Services, Inc.) (registered transfer agent) and IVZ Distributors, Inc. (formerly known as INVESCO Distributors, Inc.) (registered broker dealer); Director, President and Chairman, Invesco Inc. (holding company) and Invesco Canada Holdings Inc. (holding company); Chief Executive Officer, Invesco Corporate Class Inc. (corporate mutual fund company) and Invesco Canada Fund Inc. (corporate mutual fund company); Director, Chairman and Chief Executive Officer, Invesco Canada Ltd. (formerly known as Invesco Trimark Ltd./Invesco Trimark Ltèe) (registered investment adviser and registered transfer agent); Trustee, President and Principal Executive Officer, The Invesco Funds (other than AIM Treasurer’s Series Trust (Invesco Treasurer’s Series Trust) and Short-Term Investments Trust); Trustee and Executive Vice President, The Invesco Funds (AIM Treasurer’s Series Trust (Invesco Treasurer’s Series Trust) and Short-Term Investments Trust only); Director, Invesco Investment Advisers LLC (formerly known as Van Kampen Asset Management); Director, Chief Executive Officer and President, Van Kampen Exchange Corp. Formerly: Director and Chairman, Van Kampen Investor Services Inc.: Director, Chief Executive Officer and President, 1371 Preferred Inc. (holding company); and Van Kampen Investments Inc.; Director and President, AIM GP Canada Inc. (general partner for limited partnerships); and Van Kampen Advisors, Inc.; Director and Chief Executive Officer, Invesco Trimark Dealer Inc. (registered broker dealer); Director, Invesco Distributors, Inc. (formerly known as Invesco Aim Distributors, Inc.) (registered broker dealer); Manager, Invesco PowerShares Capital Management LLC; Director, Chief Executive Officer and President, Invesco Advisers, Inc.; Director, Chairman, Chief Executive Officer and President, Invesco Aim Capital Management, Inc.; President, Invesco Trimark Dealer Inc. and Invesco Trimark Ltd./Invesco Trimark Ltèe; Director and President, AIM Trimark Corporate Class Inc. and AIM Trimark Canada Fund Inc.; Senior Managing Director, Invesco Holding Company Limited; Trustee and Executive Vice President, Tax-Free Investments Trust; Director and Chairman, Fund Management Company (former registered broker dealer); President and Principal Executive Officer, The Invesco Funds (AIM Treasurer’s Series Trust (Invesco Treasurer’s Series Trust), Short-Term Investments Trust and Tax-Free Investments Trust only); President, AIM Trimark Global Fund Inc. and AIM Trimark Canada Fund Inc. | | 124 | | None |
Wayne W. Whalen3 — 1939 Trustee | | 2010 | | Of Counsel, and prior to 2010, partner in the law firm of Skadden, Arps, Slate, Meagher & Flom LLP, legal counsel to certain funds in the Fund Complex | | 137 | | Director of the Mutual Fund Directors Forum, a nonprofit membership organization for investment directors; Chairman and Director of the Abraham Lincoln Presidential Library Foundation; and Director of the Stevenson Center for Democracy |
| 1 | Mr. Flanagan is considered an interested person of the Trust because he is an officer of the adviser to the Trust, and an officer and a director of Invesco Ltd., ultimate parent of the adviser to the Trust. |
| 2 | Mr. Taylor is considered an interested person of the Trust because he is an officer and a director of the adviser to, and a director of the principal underwriter of, the Trust. |
| 3 | Mr. Whalen is considered an “interested person” (within the meaning of Section 2(a)(19) of the 1940 Act) of certain Funds in the Invesco Fund Complex by reason of he and his firm currently providing legal services as legal counsel to such Funds in the Invesco Fund Complex. |
T-1 Invesco International Small Company Fund
Trustees and Officers—(continued)
| | | | | | | | |
Name, Year of Birth and
Position(s) Held with the Trust | | Trustee and/
or Officer Since | | Principal Occupation(s)
During Past 5 Years | | Number of
Funds in Fund
Complex
Overseen by
Trustee | | Other Directorship(s)
Held by Trustee During
Past 5 Years |
| Independent Trustees | | | | | | | | |
Bruce L. Crockett — 1944 Trustee and Chair | | 1987 | | Chairman, Crockett Technologies Associates (technology consulting company) Formerly: Director, Captaris (unified messaging provider); Director, President and Chief Executive Officer COMSAT Corporation; and Chairman, Board of Governors of INTELSAT (international communications company) | | 124 | | ACE Limited (insurance company); and Investment Company Institute |
David C. Arch — 1945 Trustee | | 2010 | | Chairman and Chief Executive Officer of Blistex Inc., (consumer health care products manufacturer) Formerly: Member of the Heartland Alliance Advisory Board, a nonprofit organization serving human needs based in Chicago | | 137 | | Board member of the Illinois Manufacturers’ Association; Member of the Board of Visitors, Institute for the Humanities, University of Michigan |
Frank S. Bayley — 1939 Trustee | | 2001 | | Retired Formerly: Director, Badgley Funds, Inc. (registered investment company) (2 portfolios) and General Partner and Of Counsel, law firm of Baker & McKenzie, LLP | | 124 | | Director and Chairman, C.D. Stimson Company (a real estate investment company); Trustee and Overseer, The Curtis institute of Music |
James T. Bunch — 1942 Trustee | | 2003 | | Managing Member, Grumman Hill Group LLC (family office private equity management) Formerly: Founder, Green, Manning & Bunch Ltd. (investment banking firm) (1988-2010); Executive Committee, United States Golf Association; and Director, Policy Studies, Inc. and Van Gilder Insurance Corporation | | 124 | | Chairman, Board of Governors, Western Golf Association; Chairman-elect, Evans Scholars Foundation; and Director, Denver Film Society |
Rodney F. Dammeyer — 1940 Trustee | | 2010 | | Chairman of CAC, LLC, (private company offering capital investment and management advisory services) Formerly: Prior to 2001, Managing Partner at Equity Group Corporate Investments; Prior to 1995, Vice Chairman of Anixter International; Prior to 1985, experience includes Senior Vice President and Chief Financial Officer of Household International, Inc., Executive Vice President and Chief Financial Officer of Northwest Industries, Inc. and Partner of Arthur Andersen & Co.; From 1987 to 2010, Director/Trustee of investment companies in the Van Kampen Funds complex | | 126 | | Director of Quidel Corporation and Stericycle, Inc.; Prior to May 2008, Trustee of The Scripps Research Institute; Prior to February 2008, Director of Ventana Medical Systems, Inc.; Prior to April 2007, Director of GATX Corporation; Prior to April 2004, Director of TheraSense, Inc. |
Albert R. Dowden — 1941 Trustee | | 2000 | | Director of a number of public and private business corporations, including the Boss Group, Ltd. (private investment and management); Reich & Tang Funds (5 portfolios) (registered investment company); and Homeowners of America Holding Corporation/ Homeowners of America Insurance Company (property casualty company) Formerly: Director, Continental Energy Services, LLC (oil and gas pipeline service); Director, CompuDyne Corporation (provider of product and services to the public security market) and Director, Annuity and Life Re (Holdings), Ltd. (reinsurance company); Director, President and Chief Executive Officer, Volvo Group North America, Inc.; Senior Vice President, AB Volvo; Director of various public and private corporations; Chairman, DHJ Media, Inc.; Director Magellan Insurance Company; and Director, The Hertz Corporation, Genmar Corporation (boat manufacturer), National Media Corporation; Advisory Board of Rotary Power International (designer, manufacturer, and seller of rotary power engines); and Chairman, Cortland Trust, Inc. (registered investment company) | | 124 | | Director of Nature’s Sunshine Products, Inc. |
Jack M. Fields — 1952 Trustee | | 1997 | | Chief Executive Officer, Twenty First Century Group, Inc. (government affairs company); Owner and Chief Executive Officer, Dos Angeles Ranch, L.P. (cattle, hunting, corporate entertainment); and Discovery Global Education Fund (non-profit) Formerly: Chief Executive Officer, Texana Timber LP (sustainable forestry company); Director of Cross Timbers Quail Research Ranch (non-profit); and member of the U.S. House of Representatives | | 124 | | Insperity, Inc. (formerly known as Administaff) |
Prema Mathai-Davis — 1950 Trustee | | 1998 | | Retired Formerly: Chief Executive Officer, YWCA of the U.S.A. | | 124 | | None |
Larry Soll — 1942 Trustee | | 2003 | | Retired Formerly: Chairman, Chief Executive Officer and President, Synergen Corp. (a biotechnology company) | | 124 | | None |
Hugo F. Sonnenschein — 1940 Trustee | | 2010 | | Distinguished Service Professor and President Emeritus of the University of Chicago and the Adam Smith Distinguished Service Professor in the Department of Economics at the University of Chicago Formerly: President of the University of Chicago | | 137 | | Trustee of the University of Rochester and a member of its investment committee. Member of the National Academy of Sciences, the American Philosophical Society and a fellow of the American Academy of Arts and Sciences |
T-2 Invesco International Small Company Fund
Trustees and Officers—(continued)
| | | | | | | | |
Name, Year of Birth and
Position(s) Held with the Trust | | Trustee and/
or Officer Since | | Principal Occupation(s)
During Past 5 Years | | Number of
Funds in Fund
Complex
Overseen by
Trustee | | Other Directorship(s)
Held by Trustee During
Past 5 Years |
| Independent Trustees—(continued) |
Raymond Stickel, Jr. — 1944 Trustee | | 2005 | | Retired Formerly: Director, Mainstay VP Series Funds, Inc. (25 portfolios) and Partner, Deloitte & Touche | | 124 | | None |
| Other Officers | | | | | | | | |
Russell C. Burk — 1958
Senior Vice President and Senior Officer | | 2005 | | Senior Vice President and Senior Officer, The Invesco Funds | | N/A | | N/A |
John M. Zerr — 1962
Senior Vice President, Chief Legal Officer and Secretary | | 2006 | | Director, Senior Vice President, Secretary and General Counsel, Invesco Management Group, Inc. (formerly known as Invesco Aim Management Group, Inc.) and Van Kampen Exchange Corp.; Senior Vice President, Invesco Advisers, Inc. (formerly known as Invesco Institutional (N.A.), Inc.) (registered investment adviser); Senior Vice President and Secretary, Invesco Distributors, Inc. (formerly known as Invesco Aim Distributors, Inc.); Director, Vice President and Secretary, Invesco Investment Services, Inc. (formerly known as Invesco Aim Investment Services, Inc.) and IVZ Distributors, Inc. (formerly known as INVESCO Distributors, Inc.); Director and Vice President, INVESCO Funds Group, Inc.; Senior Vice President, Chief Legal Officer and Secretary, The Invesco Funds; Manager, Invesco PowerShares Capital Management LLC; Director, Secretary and General Counsel, Invesco Investment Advisers LLC (formerly known as Van Kampen Asset Management); Secretary and General Counsel, Van Kampen Funds Inc. and Chief Legal Officer, PowerShares Exchange-Traded Fund Trust, PowerShares Exchange-Traded Fund Trust II, PowerShares India Exchange-Traded Fund Trust and PowerShares Actively Managed Exchange-Traded Fund Trust Formerly: Director and Vice President, Van Kampen Advisors Inc.; Director, Vice President, Secretary and General Counsel Van Kampen Investor Services Inc.; Director, Invesco Distributors, Inc. (formerly known as Invesco Aim Distributors, Inc.); Director, Senior Vice President, General Counsel and Secretary, Invesco Advisers, Inc. and Van Kampen Investments Inc.; Director, Vice President and Secretary, Fund Management Company; Director, Senior Vice President, Secretary, General Counsel and Vice President, Invesco Aim Capital Management, Inc.; Chief Operating Officer and General Counsel, Liberty Ridge Capital, Inc. (an investment adviser); Vice President and Secretary, PBHG Funds (an investment company) and PBHG Insurance Series Fund (an investment company); Chief Operating Officer, General Counsel and Secretary, Old Mutual Investment Partners (a broker-dealer); General Counsel and Secretary, Old Mutual Fund Services (an administrator) and Old Mutual Shareholder Services (a shareholder servicing center); Executive Vice President, General Counsel and Secretary, Old Mutual Capital, Inc. (an investment adviser); and Vice President and Secretary, Old Mutual Advisors Funds (an investment company) | | N/A | | N/A |
Karen Dunn Kelley — 1960
Vice President | | 1992 | | Head of Invesco’s World Wide Fixed Income and Cash Management Group; Senior Vice President, Invesco Management Group, Inc. (formerly known as Invesco Aim Management Group, Inc.) and Invesco Advisers, Inc. (formerly known as Invesco Institutional (N.A.), Inc.) (registered investment adviser); Executive Vice President, Invesco Distributors, Inc. (formerly known as Invesco Aim Distributors, Inc.); Director, Invesco Mortgage Capital Inc., INVESCO Global Asset Management Limited, Invesco Management Company Limited and INVESCO Management S.A.; Vice President, The Invesco Funds (other than AIM Treasurer’s Series Trust (Invesco Treasurer’s Series Trust) and Short-Term Investments Trust); and President and Principal Executive Officer, The Invesco Funds (AIM Treasurer’s Series Trust (Invesco Treasurer’s Series Trust) and Short-Term Investments Trust only) Formerly: Senior Vice President, Van Kampen Investments Inc.; Vice President, Invesco Advisers, Inc. (formerly known as Invesco Institutional (N.A.), Inc.); Director of Cash Management and Senior Vice President, Invesco Advisers, Inc. and Invesco Aim Capital Management, Inc.; President and Principal Executive Officer, Tax-Free Investments Trust; Director and President, Fund Management Company; Chief Cash Management Officer, Director of Cash Management, Senior Vice President, and Managing Director, Invesco Aim Capital Management, Inc.; Director of Cash Management, Senior Vice President, and Vice President, Invesco Advisers, Inc. and The Invesco Funds (AIM Treasurer’s Series Trust (Invesco Treasurer’s Series Trust), Short-Term Investments Trust and Tax-Free Investments Trust only) | | N/A | | N/A |
T-3 Invesco International Small Company Fund
Trustees and Officers—(continued)
| | | | | | | | |
Name, Year of Birth and
Position(s) Held with the Trust | | Trustee and/
or Officer Since | | Principal Occupation(s)
During Past 5 Years | | Number of
Funds in Fund
Complex
Overseen by
Trustee | | Other Directorship(s)
Held by Trustee During
Past 5 Years |
| Other Officers—(continued) | | | | | | | | |
Sheri Morris — 1964
Vice President, Treasurer and Principal Financial Officer | | 1999 | | Vice President, Treasurer and Principal Financial Officer, The Invesco Funds; Vice President, Invesco Advisers, Inc. (formerly known as Invesco Institutional (N.A.), Inc.) (registered investment adviser); and Vice President, PowerShares Exchange-Traded Fund Trust, PowerShares Exchange-Traded Fund Trust II, PowerShares India Exchange-Traded Fund Trust and PowerShares Actively Managed Exchange-Traded Fund Trust Formerly: Vice President, Invesco Aim Advisers, Inc., Invesco Aim Capital Management, Inc. and Invesco Aim Private Asset Management, Inc.; Assistant Vice President and Assistant Treasurer, The Invesco Funds and Assistant Vice President, Invesco Advisers, Inc., Invesco Aim Capital Management, Inc. and Invesco Aim Private Asset Management, Inc.; and Treasurer, PowerShares Exchange-Traded Fund Trust, PowerShares Exchange-Traded Fund Trust II, PowerShares India Exchange-Traded Fund Trust and PowerShares Actively Managed Exchange-Traded Fund Trust | | N/A | | N/A |
Yinka Akinsola — 1977 Anti-Money Laundering Compliance Officer | | 2011 | | Anti-Money Laundering Compliance Officer, Invesco Advisers, Inc. (formerly known as Invesco Institutional (N.A.), Inc.) (registered investment adviser); Invesco Distributors, Inc. (formerly known as Invesco Aim Distributors, Inc.), Invesco Investment Services, Inc. (formerly known as Invesco Aim Investment Services, Inc.), Invesco Management Group, Inc., The Invesco Funds, Invesco Van Kampen Closed-End Funds, Van Kampen Exchange Corp., Van Kampen Funds Inc., PowerShares Exchange-Traded Fund Trust, PowerShares Exchange-Traded Fund Trust II, PowerShares India Exchange-Traded Fund Trust, and PowerShares Actively Managed Exchange-Traded Fund Trust Formerly: Regulatory Analyst III, Financial Industry Regulatory Authority (FINRA) | | N/A | | N/A |
Todd L. Spillane — 1958
Chief Compliance Officer | | 2006 | | Senior Vice President, Invesco Management Group, Inc. (formerly known as Invesco Aim Management Group, Inc.) and Van Kampen Exchange Corp.; Senior Vice President and Chief Compliance Officer, Invesco Advisers, Inc. (registered investment adviser) (formerly known as Invesco Institutional (N.A.), Inc.); Chief Compliance Officer, The Invesco Funds; Vice President, Invesco Distributors, Inc. (formerly known as Invesco Aim Distributors, Inc.) and Invesco Investment Services, Inc. (formerly known as Invesco Aim Investment Services, Inc.) Formerly: Chief Compliance Officer, Invesco Van Kampen Closed-End Funds; Senior Vice President, Van Kampen Investments Inc.; Senior Vice President and Chief Compliance Officer, Invesco Aim Advisers, Inc. and Invesco Aim Capital Management, Inc.; Chief Compliance Officer, INVESCO Private Capital Investments, Inc. (holding company), Invesco Private Capital, Inc. (registered investment adviser), Invesco Global Asset Management (N.A.), Inc., Invesco Senior Secured Management, Inc. (registered investment adviser), Van Kampen Investor Services Inc., PowerShares Exchange-Traded Fund Trust, PowerShares Exchange-Traded Fund Trust II, PowerShares India Exchange-Traded Fund Trust and PowerShares Actively Managed Exchange-Traded Fund Trust; and Vice President, Invesco Aim Capital Management, Inc. and Fund Management Company | | N/A | | N/A |
The Statement of Additional Information of the Trust includes additional information about the Fund’s Trustees and is available upon request, without charge, by calling 1.800.959.4246. Please refer to the Fund’s prospectus for information on the Fund’s sub-advisers.
| | | | | | |
Office of the Fund 11 Greenway Plaza, Suite 1000 Houston, TX 77046-1173 | | Investment Adviser Invesco Advisers, Inc. 1555 Peachtree Street, N.E.
Atlanta, GA 30309 | | Distributor Invesco Distributors, Inc. 11 Greenway Plaza, Suite 1000 Houston, TX 77046-1173 | | Auditors PricewaterhouseCoopers LLP 1201 Louisiana Street, Suite 2900 Houston, TX 77002-5678 |
| | | |
| | | | | | |
Counsel to the Fund Stradley Ronon Stevens & Young, LLP 2005 Market Street, Suite 2600 Philadelphia, PA 19103-7018 | | Counsel to the Independent Trustees Goodwin Procter LLP
901 New York Avenue, N.W.
Washington, D.C. 20001 | | Transfer Agent Invesco Investment Services, Inc. 11 Greenway Plaza, Suite 1000 Houston, TX 77046-1173 | | Custodian State Street Bank and Trust Company 225 Franklin Street
Boston, MA 02110-2801 |
T-4 Invesco International Small Company Fund

Invesco mailing information
Send general correspondence to Invesco Investment Services, Inc., P.O. Box 219078, Kansas City, MO 64121-9078.
Invesco privacy policy
You share personal and financial information with us that is necessary for your transactions and your account records. We take very seriously the obligation to keep that information confidential and private.
Invesco collects nonpublic personal information about you from account applications or other forms you complete and from your transactions with us or our affiliates. We do not disclose information about you or our former customers to service providers or other third parties except to the extent necessary to service your account and in other limited circumstances as permitted by law. For example, we use this information to facilitate the delivery of transaction confirmations, financial reports, prospectuses and tax forms.
Even within Invesco, only people involved in the servicing of your accounts and compliance monitoring have access to your information. To ensure the highest level of confidentiality and security, Invesco maintains physical, electronic and procedural safeguards that meet or exceed federal standards. Special measures, such as data encryption and authentication, apply to your communications with us on our website. More detail is available to you at invesco.com/privacy.
Important notice regarding delivery of security holder documents
To reduce Fund expenses, only one copy of most shareholder documents may be mailed to shareholders with multiple accounts at the same address (Householding). Mailing of your shareholder documents may be householded indefinitely unless you instruct us otherwise. If you do not want the mailing of these documents to be combined with those for other members of your household, please contact Invesco Investment Services, Inc. at 800 959 4246 or contact your financial institution. We will begin sending you individual copies for each account within 30 days after receiving your request.
Fund holdings and proxy voting information
The Fund provides a complete list of its holdings four times in each fiscal year, at the quarter-ends. For the second and fourth quarters, the lists appear in the Fund’s semiannual and annual reports to shareholders. For the first and third quarters, the Fund files the lists with the Securities and Exchange Commission (SEC) on Form N-Q. The most recent list of portfolio holdings is available at invesco.com/completeqtrholdings. Shareholders can also look up the Fund’s Forms N-Q on the SEC website at sec.gov. Copies of the Fund’s Forms N-Q may be reviewed and copied at the SEC Public Reference Room in Washington, D.C. You can obtain information on the operation of the Public Reference Room, including information about duplicating fee charges, by calling 202 551 8090 or 800 732 0330, or by electronic request at the following email address: publicinfo@sec.gov. The SEC file numbers for the Fund are shown below.
A description of the policies and procedures that the Fund uses to determine how to vote proxies relating to portfolio securities is available without charge, upon request, from our Client Services department at 800 959 4246 or at invesco.com/proxyguidelines. The information is also available on the SEC website, sec.gov.
| | |
Information regarding how the Fund voted proxies related to its portfolio securities during the 12 months ended June 30, 2012, is available at invesco.com/proxysearch. The information is also available on the SEC website, sec.gov. Invesco Advisers, Inc. is an investment adviser; it provides investment advisory services to individual and institutional clients and does not sell securities. Invesco Distributors, Inc. is the US distributor for Invesco Ltd.’s retail mutual funds, exchange-traded funds and institutional money market funds. Both are wholly owned, indirect subsidiaries of Invesco Ltd. | |  |
| |
| SEC file numbers: 811-01540 and 002-27334 ISC-AR-1 Invesco Distributors, Inc. | | |
Annual Report to Shareholders December 31, 2012
Invesco Small Cap Equity Fund
Nasdaq:
A: SMEAX ¡ B: SMEBX ¡ C: SMECX ¡ R: SMERX ¡ Y: SMEYX ¡ R5: SMEIX ¡ R6: SMEFX

Letters to Shareholders
| | | | | | | | | |

Philip Taylor | | | | Dear Shareholders: This annual report contains information about your Fund and the factors that affected its performance during the reporting period. Inside, you’ll find a discussion from your portfolio managers about how they managed your Fund, performance data for your Fund, a complete list of your Fund’s investments as of the close of the reporting period and other important information. I hope you find this report of interest. The reporting period covered by this report was challenging. As the year began, investors cheered generally positive economic indicators, and markets generally rose. Soon, however, US economic data turned mixed and investors’ attention shifted to the efforts of eurozone governments to implement new policies intended to reduce debt levels, strengthen the banking system and stimulate economic growth. Later in the year, in the US, mixed economic data, | | |
competing proposals on how to reduce the federal budget deficit and a contentious presidential contest increased investor uncertainty and hindered market performance. Throughout the year, your Fund’s portfolio managers adhered to their long-term investment strategies, and later in this report they explain why your Fund performed as it did during the reporting period.
Adhering to your long-term investment plan can be difficult, particularly during periods of market volatility and economic uncertainty. That’s one reason Invesco suggests investors work with a skilled and trusted financial adviser who is familiar with their financial situation, investment goals and risk tolerance. A good financial adviser can provide insight and perspective when markets are volatile; motivation and reassurance when times are uncertain; and advice and recommendations when your financial situation or investment goals change.
Timely insight and information from many of Invesco’s investment professionals is available at our website, invesco.com/us. We offer in-depth articles, video clips and audio commentaries from many of our portfolio managers and other investment professionals on a wide range of topics of interest to investors. At invesco.com/us, you also can access information about your Invesco account at any time.
What we mean by Intentional Investing
At Invesco, all of our people and all of our resources are dedicated to helping investors achieve their financial objectives. It’s a philosophy we call Intentional Investing®, and it guides the way we:
| | n | | Manage investments – Our dedicated investment professionals search the world for the best opportunities, and each investment team follows a clear, disciplined process to build portfolios and mitigate risk. |
| | n | | Provide choices – We offer equity, fixed income, asset allocation and alternative strategies so you and your financial adviser can build an investment portfolio designed for your individual needs and goals. |
| | n | | Connect with you – We’re committed to giving you the expert insights you need to make informed investing decisions, and we are well-equipped to provide high-quality support for investors and advisers. |
Invesco believes in putting investors first, and that’s why investment management is all we do. Our sole focus on managing your money allows your financial adviser to build a portfolio of Invesco funds appropriate for your investment needs and goals now and when your circumstances change.
Have a question?
If you have a question about your account, please contact an Invesco client services representative at 800 959 4246. If you have an Invesco-related question or comment, feel free to email me directly at phil@invesco.com.
All of us at Invesco look forward to serving your investment management needs for many years to come. Thank you for investing with us.
Sincerely,

PhilipTaylor
Senior Managing Director, Invesco Ltd.
2 Invesco Small Cap Equity Fund
| | | | | | | | | |

Bruce Crockett | | | | Dear Fellow Shareholders: While short-term challenges for the financial markets regularly come and go, it’s clear that significant and longer term economic obstacles remain both here at home and abroad. There appear to be no easy solutions to many of these issues. As a result, the financial markets have had little conviction to respond to what has been slow, yet noticeable improvement in some economic benchmarks in recent months. No one likes uncertainty, especially financial markets. But even in these uncertain times, it appears that investors are still approaching the market with cautious optimism, with some taking on more risk in order to refocus on their long-term savings goals. Maybe this describes you, or perhaps you have been sitting on the sidelines thinking about getting back into the market, but are still a bit hesitant to act because of market | | |
uncertainty. Clearly, risk remains a primary focus for investors of all types. As Trustees of the Invesco Funds, one of our primary responsibilities is to ensure your fund’s adviser is cognizant of the risks in each of the funds it manages. A thoughtful risk management plan may help investors navigate through market turbulence or an economic downturn. This is why we make risk management a critical element of our annual contract renewal process, like the one we complete with Invesco every year.
To be sure, there will always be risks involved with investing, but you shouldn’t let short-term news or your emotions dictate your investments. Because no one can predict with 100% accuracy the movements of financial markets, I strongly encourage you to speak with a professional financial adviser who can assist you in building an investment portfolio that reflects your individual risk tolerance and is designed to help achieve your individual financial objectives.
You can be sure your Board remains committed to doing its part in helping you along the way. In addition to ensuring that your fund’s adviser is focused on the risks in the funds it manages, we also remain committed to managing fund costs and working with your fund’s adviser to provide a compelling and diversified product offering to potentially meet your investing goals.
In that regard, your Board approved a number of fund mergers and the launch of several new funds, including the first Invesco mutual fund available to US retail investors managed by investment professionals at Invesco Perpetual*, one of the largest independent investment managers in the UK.
Let me close by thanking Carl Frischling upon his retirement from the Invesco Funds Board for his 35 years of distinguished service and unwavering commitment to our funds’ shareholders. As always, please contact me at bruce@brucecrockett.com with any questions or concerns you may have.
On behalf of the Board, we look forward to continuing to represent your interests and serving your investment needs.
Sincerely,

Bruce L. Crockett
Independent Chair
Invesco Funds Board of Trustees
| * | Invesco Perpetual is a business name of Invesco Asset Management Limited (IAML), a registered investment adviser. IAML is a wholly owned, indirect subsidiary of Invesco Ltd. |
3 Invesco Small Cap Equity Fund
Management’s Discussion of Fund Performance
Performance summary
For the year ended December 31, 2012, Invesco Small Cap Equity Fund had positive returns but underperformed the Fund’s style-specific index, the Russell 2000 Index.
Your Fund’s long-term performance appears later in this report.
Fund vs. Indexes
Total returns, 12/31/11 to 12/31/12, at net asset value (NAV). Performance shown does not include applicable contingent deferred sales charges (CDSC) or front-end sales charges, which would have reduced performance.
| | | | | |
| Class A Shares | | | | 13.50 | % |
| Class B Shares | | | | 12.68 | |
| Class C Shares | | | | 12.68 | |
| Class R Shares | | | | 13.30 | |
| Class Y Shares | | | | 13.79 | |
| Class R5 Shares* | | | | 14.04 | |
| Class R6 Shares** | | | | 13.67 | |
| S&P 500 Index‚ (Broad Market Index) | | | | 16.00 | |
| Russell 2000 Indexn (Style-Specific Index) | | | | 16.35 | |
| Lipper Small-Cap Core Funds Index¨ (Peer Group Index) | | | | 15.94 | |
Source(s): ‚Invesco, S&P-Dow Jones via FactSet Research Systems Inc.;
| | n Invesco, | Russell via FactSet Research Systems Inc.; ¨Lipper Inc. |
* Effective September 24, 2012, Institutional Class shares were renamed Class R5 shares.
| ** | Share class incepted during the reporting period. See page 7 for a detailed explanation of Fund performance. |
How we invest
Our investment process seeks to identify attractively valued small-cap companies with high growth potential, demonstrated by consistent and accelerating revenue and earnings growth.
We begin with a quantitative model that ranks companies based on a set of fundamental, valuation and timeliness factors. This proprietary model provides an objective approach to identifying new investment opportunities, as the highest ranked stocks become the primary focus of our research efforts.
Our stock selection process is based on a rigorous three-step process that includes fundamental, valuation and timeliness analysis.
| 1. | Fundamental analysis. Building financial models and conducting in-depth interviews with company management. |
| 2. | Valuation analysis. Identifying attractively valued stocks given their growth potential over a one- to two-year horizon. |
| 3. | Timeliness analysis. Identifying the timeliness of a stock purchase. We review trading volume characteristics and trend analysis to make sure there are no signs of the stock deteriorating. This also serves as a risk management measure that helps us confirm our high conviction candidates. |
Portfolio construction plays an important role in risk management. We align the Fund with the S&P SmallCap 600 Index, the benchmark we believe represents the small-cap core asset class. We seek to manage risk by keeping the Fund’s sector weightings in line with the benchmark by staying fully diversified in all those sectors. We also seek to limit stock-specific risk by investing in typically 120 to 130 holdings.
We consider selling a stock when it no longer meets our investment criteria, for the following reasons:
| n | | Our original investment thesis is not valid because the fundamentals are no longer intact. |
| n | | The price target set at purchase is exceeded. |
| n | | The company’s timelines profile deteriorates. |
Market conditions and your Fund
The year 2012 began with improving economic data in the US and a rally in equities that continued almost uninterrupted into the spring. However, the ongoing eurozone sovereign debt crisis intensified in April and May, dominating headlines and creating significant volatility in global equity markets.
This negative news from overseas precipitated a slowdown in the US, where economic data began to decelerate as manufacturing, employment, consumer spending and consumer confidence weakened over the summer. While corporate earnings remained solid until late in the year, financial markets were influenced negatively by these weakening economic data. Fears about the fate of the eurozone began to subside after the European Central Bank announced new measures to support member economies through potentially unlimited purchases of sovereign debt, among other measures. At the same time, continued risk aversion among investors and corporations, along with tepid employment growth, prompted the US Federal Reserve to initiate a third round of quantitative easing and to promise to remain accommodative until the labor market outlook improved materially. Near year end, market psychology turned negative – first, due to uncertainty about the outcome of the presidential election, and then due to the apparent inability of the White House and Congress to reach an agreement on legislation averting the “fiscal cliff” – a variety of tax increases
| | | | | |
| Portfolio Composition |
| By sector | | | | | |
| | | | | |
| Financials | | | | 19.2 | % |
| Industrials | | | | 19.2 | |
| Information Technology | | | | 15.0 | |
| Consumer Discretionary | | | | 13.9 | |
| Health Care | | | | 10.2 | |
| Materials | | | | 8.6 | |
| Energy | | | | 5.5 | |
| Consumer Staples | | | | 2.8 | |
| Utilities | | | | 1.9 | |
| Money Market Funds Plus Other Assets Less Liabilities | | | | 3.7 | |
| | | | | |
| Top 10 Equity Holdings* |
| | | | | |
| | | | | |
| 1. Cymer, Inc. | | | | 1.6 | % |
| 2. PolyOne Corp. | | | | 1.3 | |
| 3. Valmont Industries, Inc. | | | | 1.3 | |
| 4. TriMas Corp. | | | | 1.3 | |
| 5. Beacon Roofing Supply, Inc. | | | | 1.2 | |
| 6. Belden Inc. | | | | 1.2 | |
| 7. PVH Corp. | | | | 1.2 | |
| 8. Team, Inc. | | | | 1.2 | |
| 9. Interface, Inc. | | | | 1.2 | |
| 10. Graphic Packaging Holding Co. | | | | 1.2 | |
| | | | | |
| Top Five Industries* |
| | | | | |
| | | | | |
1. Regional Banks | | | | 8.1 | % |
2. Industrial Machinery | | | | 5.4 | |
3. Oil and Gas Equipment and Services | | | | 4.6 | |
4. Application Software | | | | 4.0 | |
5. Environmental and Facilities Services | | | | 3.1 | |
| | | | | |
| Total Net Assets | | | | $858.6 million | |
| |
| Total Number of Holdings* | | | | 106 | |
The Fund’s holdings are subject to change, and there is no assurance that the Fund will continue to hold any particular security.
*Excluding money market fund holdings.
4 Invesco Small Cap Equity Fund
and spending cuts scheduled to take effect in January 2013.
Despite volatility for much of the year, major equity market indexes delivered double-digit gains, and all 10 sectors of the S&P 500 Index had positive returns.1
The Fund had strong positive returns but underperformed the Russell 2000 Index, its style-specific benchmark, due primarily to stock selection in the financials and health care sectors where performance also was hindered by underweight allocations to the strong performing real estate and biotechnology industries. A modest cash position also detracted from relative performance since the small-cap market was up significantly during the year. The Fund actually outperformed its style-specific benchmark in most sectors, including materials, consumer staples, utilities, information technology (IT) and energy.
The Fund underperformed the Russell 2000 Index by the widest margin in the financials sector due primarily to stock selection. Two holdings that detracted from Fund performance in this sector were northeastern regional banks Webster and FNB. In addition, underperformance stemmed somewhat from a moderate underweight position in real estate investment trusts (REITs), which saw very strong performance due to the market’s appetite for higher yielding, dividend paying securities. Most REITs struggle to grow their business organically. Because they must distribute the majority of their income to shareholders, they often don’t represent attractive long-term growth investments.
The Fund also was challenged in the health care sector due both to stock selection and an underweight position in this relatively strong market sector. One significant detractor was Auxilium. The stock was hurt when the company missed third quarter revenue expectations for an older product; however, its newest product enjoyed substantial sales growth, which may be sustainable as the product potentially may be approved for treatment of additional diseases.
For much of the year, biotechnology stocks outperformed other health care stocks. Their prospects were less subject to the uncertainty resulting from the US Supreme Court’s decision on health care reform, therefore relative performance of the Fund’s biotechnology stocks versus the Russell 2000 Index was hampered by our slight underweight allocation to the industry.
The Fund outperformed its style - specific benchmark by the widest margin in the materials sector. Eagle Materials is a producer of cement and wallboard
products that benefited from a rebound in the housing market as well as from industry regulations that enhanced the firm’s pricing power. Our position in the stock returned more than 100% during the reporting period and was the strongest contributor to Fund performance. Another contributor in this sector was specialty polymer materials and color company Polyone, which benefited from successfully integrating an acquired company. The acquisition broadened the company’s product line with faster growing and more profitable products.
IT was another contributing sector for the Fund, driven by strong stock selection. The leading contributor in this sector and one of the top Fund contributors during the reporting period was Cymer. A leading producer of lasers for semiconductor manufacturing, Cymer’s stock was up strongly late in the year when the company agreed in principle to be acquired for a substantial premium, although the stock was still a holding at the end of the year. Ariba was a leading software provider that was acquired during the year. We sold the stock on the acquisition news, locking in gains for shareholders and benefiting Fund performance.
Throughout the year the Fund maintained its “barbell” strategy in positioning that provided exposure to cyclical growth opportunities as well as more defensive areas of the market. Changes during the reporting period were moderate within this framework; however, the most significant changes included reductions in the health care and information technology sectors. Exposure to the financials, industrials and materials sectors increased.
As we’ve discussed, the stock market experienced significant volatility during the fiscal year. We would like to caution investors against making investment decisions based on short-term performance. We thank you for your commitment to Invesco Small Cap Equity Fund.
The views and opinions expressed in management’s discussion of Fund performance are those of Invesco Advisers, Inc. These views and opinions are subject to change at any time based on factors such as market and economic conditions. These views and opinions may not be relied upon as investment advice or recommendations, or as an offer for a particular security. The information is not a complete analysis of every aspect of any market, country, industry, security or the Fund. Statements of fact are from sources considered reliable, but Invesco Advisers, Inc. makes no representation or warranty as to their completeness or accuracy. Although historical performance is no guarantee of future results, these insights may help you understand our investment management philosophy.
See important Fund and, if applicable, index disclosures later in this report.
| | |
 | | Juliet Ellis Chartered Financial Analyst, portfolio manager and chief investment officer of Invesco’s domestic |
| growth investments team, is lead manager of Invesco Small Cap Equity Fund. She joined Invesco in 2004. Ms. Ellis earned a BA in economics and political science from Indiana University. |
| | |
 | | Juan Hartsfield Chartered Financial Analyst, portfolio manager, is manager of Invesco Small Cap Equity Fund. He |
| joined Invesco in 2004. Mr. Hartsfield earned a BS in petroleum engineering from The University of Texas at Austin and an MBA from the University of Michigan. |
5 Invesco Small Cap Equity Fund
Your Fund’s Long-Term Performance
Results of a $10,000 Investment – Oldest Share Class(es)
Fund and index data from 12/31/02
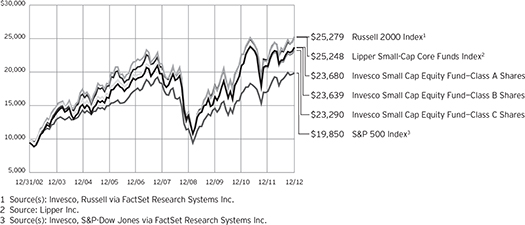
Past performance cannot guarantee comparable future results.
The data shown in the chart include reinvested distributions, applicable sales charges and Fund expenses including management fees. Results for Class B shares are calculated as if a hypothetical
shareholder had liquidated his entire investment in the Fund at the close of the reporting period and paid the contingent deferred sales charges, if applicable. Index results include reinvested dividends, but they do not reflect sales charges. Performance of the peer group,
if applicable, reflects fund expenses and management fees; performance of a market index does not. Performance shown in the chart and table(s) does not reflect deduction of taxes a shareholder would pay on Fund distributions or sale of Fund shares.
6 Invesco Small Cap Equity Fund
| | | | | |
| Average Annual Total Returns |
| As of 12/31/12, including maximum applicable sales charges | |
| | | | | |
| Class A Shares | | | | | |
| Inception (8/31/00) | | | | 5.57 | % |
| 10 Years | | | | 9.00 | |
| 5 Years | | | | 2.53 | |
| 1 Year | | | | 7.26 | |
| |
| Class B Shares | | | | | |
| Inception (8/31/00) | | | | 5.57 | % |
| 10 Years | | | | 8.98 | |
| 5 Years | | | | 2.57 | |
| 1 Year | | | | 7.68 | |
| |
| Class C Shares | | | | | |
| Inception (8/31/00) | | | | 5.29 | % |
| 10 Years | | | | 8.82 | |
| 5 Years | | | | 2.93 | |
| 1 Year | | | | 11.68 | |
| |
| Class R Shares | | | | | |
| Inception (6/3/02) | | | | 6.26 | % |
| 10 Years | | | | 9.36 | |
| 5 Years | | | | 3.46 | |
| 1 Year | | | | 13.30 | |
| |
| Class Y Shares | | | | | |
| 10 Years | | | | 9.75 | % |
| 5 Years | | | | 3.94 | |
| 1 Year | | | | 13.79 | |
| |
| Class R5 Shares | | | | | |
| 10 Years | | | | 10.10 | % |
| 5 Years | | | | 4.25 | |
| 1 Year | | | | 14.04 | |
| |
| Class R6 Shares | | | | | |
| 10 Years | | | | 9.64 | % |
| 5 Years | | | | 3.73 | |
| 1 Year | | | | 13.67 | |
Class Y shares incepted on October 3, 2008. Performance shown prior to that date is that of Class A shares and includes the 12b-1 fees applicable to Class A shares. Class A share performance reflects any applicable fee waivers or expense reimbursements.
Class R5 shares incepted on April 29, 2005. Performance shown prior to that date is that of Class A shares and includes the 12b-1 fees applicable to Class A shares. Class A share performance reflects any applicable fee waivers or expense reimbursements.
Class R6 shares incepted on September 24, 2012. Performance shown prior to that date is that of Class A shares and includes the 12b-1 fees applicable to Class A shares. Class A share performance reflects any applicable fee waivers or expense reimbursements.
The performance data quoted represent past performance and cannot guarantee comparable future results; current performance may be lower or higher. Please visit invesco.com/performance for the most recent month-end performance. Performance figures reflect reinvested distributions, changes in net asset value and the effect of the maximum sales charge unless otherwise stated. Investment return and principal value will fluctuate so that you may have a gain or loss when you sell shares.
The total annual Fund operating expense ratio set forth in the most recent Fund prospectus as of the date of this report for Class A, Class B, Class C, Class R, Class Y, Class R5 and Class R6 shares was 1.35%, 2.10%, 2.10%, 1.60%, 1.10%, 0.85% and 0.81%, respectively. The expense ratios presented above may vary from the expense ratios presented in other sections of this report that are based on expenses incurred during the period covered by this report.
Class A share performance reflects the maximum 5.50% sales charge, and Class B and Class C share performance reflects the applicable contingent deferred sales charge (CDSC) for the period involved. The CDSC on Class B shares declines from 5% beginning at the time of purchase to 0% at the beginning of the seventh year. The CDSC on Class C shares is 1% for the first year after purchase. Class R, Class Y, Class R5 and Class R6 shares do not have a front-end sales charge or a CDSC; therefore, performance is at net asset value.
The performance of the Fund’s share classes will differ primarily due to different sales charge structures and class expenses.
7 Invesco Small Cap Equity Fund
Invesco Small Cap Equity Fund’s investment objective is long-term growth of capital.
| n | | Unless otherwise stated, information presented in this report is as of December 31, 2012, and is based on total net assets. |
| n | | Unless otherwise noted, all data provided by Invesco. |
| n | | To access your Fund’s reports/prospectus, visit invesco.com/fundreports. |
About share classes
| n | | Class B shares may not be purchased for new or additional investments. Please see the prospectus for more information. |
| n | | Class R shares are generally available only to employer sponsored retirement and benefit plans. Please see the prospectus for more information. |
| n | | Class R5 shares and Class R6 shares are primarily intended for employer sponsored retirement and benefit plans that meet certain standards and for institutional investors. On September 24, 2012, Institutional Class shares were renamed Class R5 shares. Please see the prospectus for more information. |
Principal risks of investing in the Fund
| n | | Foreign securities risk. The Fund’s foreign investments may be affected by changes in a foreign country’s exchange rates, political and social instability, changes in economic or taxation policies, difficulties when enforcing obligations, decreased liquidity, and increased volatility. Foreign companies may be subject to less regulation resulting in less publicly available information about the companies. |
| n | | Initial public offerings (IPO) risk. The prices of IPO securities fluctuate more than prices of equity securities of companies with longer trading histories. In addition, companies offering securities in IPOs may have less experienced management or limited operating histories. There can be no assurance that the Fund will have favorable IPO investment opportunities. |
| n | | Management risk. The investment techniques and risk analysis used by the Fund’s portfolio managers may not produce the desired results. |
| n | | Market risk. The prices of and the income generated by the Fund’s securities may decline in response to, among other things, investor sentiment, |
| | general economic and market conditions, regional or global instability, and currency and interest rate fluctuations. |
| n | | Small and mid-capitalization risk. Stocks of small and mid-sized companies tend to be more vulnerable to adverse developments in the above factors and may have little or no operating history or track record of success, and limited product lines, markets, management and financial resources. The securities of small and mid-sized companies may be more volatile due to less market interest and less publicly available information about the issuer. They also may be illiquid or restricted as to resale, or may trade less frequently and in smaller volumes, all of which may cause difficulty when establishing or closing a position at a desirable price |
| n | | Synthetic securities risk. Fluctuations in the values of synthetic securities may not correlate perfectly with the instruments they are designed to replicate. Synthetic securities may be subject to interest rate changes, market price fluctuations, counterparty risk and liquidity risk. |
About indexes used in this report
| n | | The S&P 500® Index is an unmanaged index considered representative of the US stock market. |
| n | | The Russell 2000® Index is an unmanaged index considered representative of small-cap stocks. The Russell 2000 Index is a trademark/service mark of the Frank Russell Co. Russell® is a trademark of the Frank Russell Co. |
| n | | The Lipper Small-Cap Core Funds Index is an unmanaged index considered representative of small-cap core funds tracked by Lipper. |
| n | | The S&P SmallCap 600® Index is a market-value weighted index that consists of 600 small-cap US stocks chosen for market size, liquidity and industry group representation. |
| n | | The Fund is not managed to track the performance of any particular index, including the index(es) defined here, and consequently, the performance of the Fund may deviate significantly from the performance of the index(es). |
| n | | A direct investment cannot be made in an index. Unless otherwise indicated, index results include reinvested dividends, and they do not reflect sales charges. Performance of the peer group, if applicable, reflects fund expenses; performance of a market index does not. |
Other information
| n | | The returns shown in management’s discussion of Fund performance are based on net asset values calculated for shareholder transactions. Generally accepted accounting principles require adjustments to be made to the net assets of the Fund at period end for financial reporting purposes, and as such, the net asset values for shareholder transactions and the returns based on those net asset values may differ from the net asset values and returns reported in the Financial Highlights. Additionally, the returns and net asset values shown throughout this report are at the Fund level only and do not include variable product issuer charges. If such charges were included, the total returns would be lower. |
| n | | Industry classifications used in this report are generally according to the Global Industry Classification Standard, which was developed by and is the exclusive property and a service mark of MSCI Inc. and Standard & Poor’s. |
This report must be accompanied or preceded by a currently effective Fund prospectus, which contains more complete information, including sales charges and expenses. Investors should read it carefully before investing.
NOT FDIC INSURED | MAY LOSE VALUE | NO BANK GUARANTEE
| | | | | |
Fund Nasdaq Symbols |
| Class A Shares | | | | SMEAX | |
| Class B Shares | | | | SMEBX | |
| Class C Shares | | | | SMECX | |
| Class R Shares | | | | SMERX | |
| Class Y Shares | | | | SMEYX | |
| Class R5 Shares | | | | SMEIX | |
| Class R6 Shares | | | | SMEFX | |
8 Invesco Small Cap Equity Fund
Schedule of Investments(a)
December 31, 2012
| | | | | | | | |
| | | Shares | | | Value | |
Common Stocks & Other Equity Interests–96.26% | |
| Advertising–1.04% | |
Interpublic Group of Cos., Inc. (The) | | | 808,138 | | | $ | 8,905,681 | |
|
| Aerospace & Defense–1.70% | |
Aerovironment Inc.(b) | | | 258,223 | | | | 5,613,768 | |
Triumph Group, Inc. | | | 137,163 | | | | 8,956,744 | |
| | | | | | | | 14,570,512 | |
| | |
| Agricultural Products–1.14% | | | | | | | | |
Ingredion Inc. | | | 151,298 | | | | 9,748,130 | |
|
| Air Freight & Logistics–0.61% | |
UTi Worldwide, Inc. | | | 389,578 | | | | 5,220,345 | |
| | |
| Apparel Retail–1.21% | | | | | | | | |
bebe stores, inc. | | | 861,820 | | | | 3,438,662 | |
Genesco Inc.(b) | | | 126,174 | | | | 6,939,570 | |
| | | | | | | | 10,378,232 | |
|
| Apparel, Accessories & Luxury Goods–1.23% | |
PVH Corp. | | | 94,863 | | | | 10,530,742 | |
|
| Application Software–4.04% | |
Actuate Corp.(b) | | | 590,479 | | | | 3,306,682 | |
Cadence Design Systems, Inc.(b) | | | 735,181 | | | | 9,932,295 | |
MicroStrategy Inc.–Class A(b) | | | 61,944 | | | | 5,784,331 | |
Parametric Technology Corp.(b) | | | 322,192 | | | | 7,252,542 | |
SS&C Techonologies Holdings, Inc.(b) | | | 365,014 | | | | 8,439,124 | |
| | | | | | | | 34,714,974 | |
|
| Asset Management & Custody Banks–0.95% | |
Affiliated Managers Group, Inc.(b) | | | 62,943 | | | | 8,192,031 | |
|
| Auto Parts & Equipment–1.86% | |
Dana Holding Corp. | | | 477,513 | | | | 7,453,978 | |
TRW Automotive Holdings Corp.(b) | | | 159,194 | | | | 8,534,390 | |
| | | | | | | | 15,988,368 | |
|
| Automobile Manufacturers–1.07% | |
Thor Industries, Inc.(c) | | | 245,127 | | | | 9,175,104 | |
| | |
| Automotive Retail–1.03% | | | | | | | | |
Penske Automotive Group, Inc. | | | 292,758 | | | | 8,809,088 | |
| | |
| Biotechnology–0.87% | | | | | | | | |
Cubist Pharmaceuticals, Inc.(b) | | | 177,612 | | | | 7,470,361 | |
| | |
| Building Products–1.09% | | | | | | | | |
Trex Co., Inc.(b) | | | 251,142 | | | | 9,350,017 | |
| | |
| Casinos & Gaming–0.73% | | | | | | | | |
Bally Technologies Inc.(b) | | | 139,382 | | | | 6,231,769 | |
|
| Communications Equipment–2.00% | |
Arris Group Inc.(b) | | | 584,650 | | | | 8,734,671 | |
JDS Uniphase Corp.(b) | | | 626,408 | | | | 8,481,564 | |
| | | | | | | | 17,216,235 | |
| | | | | | | | |
| | | Shares | | | Value | |
| Construction & Farm Machinery & Heavy Trucks–0.96% | |
Titan International, Inc.(c) | | | 377,698 | | | $ | 8,203,601 | |
|
| Construction Materials–1.05% | |
Eagle Materials Inc. | | | 153,653 | | | | 8,988,700 | |
|
| Data Processing & Outsourced Services–1.03% | |
Jack Henry & Associates, Inc. | | | 224,456 | | | | 8,812,143 | |
| | |
| Diversified Chemicals–1.08% | | | | | | | | |
FMC Corp. | | | 157,984 | | | | 9,245,224 | |
|
| Diversified Metals & Mining–0.71% | |
Compass Minerals International, Inc. | | | 81,671 | | | | 6,101,640 | |
| | |
| Diversified REIT’s–0.24% | | | | | | | | |
Lexington Realty Trust(c) | | | 200,008 | | | | 2,090,084 | |
|
| Electrical Components & Equipment–2.00% | |
Belden Inc. | | | 234,597 | | | | 10,554,519 | |
EnerSys(b) | | | 176,884 | | | | 6,656,145 | |
| | | | | | | | 17,210,664 | |
|
| Electronic Equipment & Instruments–0.59% | |
Electro Scientific Industries, Inc. | | | 508,734 | | | | 5,061,903 | |
|
| Electronic Manufacturing Services–0.97% | |
Sanmina Corp.(b) | | | 750,499 | | | | 8,308,024 | |
|
| Environmental & Facilities Services–3.06% | |
ABM Industries Inc. | | | 312,716 | | | | 6,238,684 | |
Team, Inc.(b) | | | 275,809 | | | | 10,491,775 | |
Waste Connections, Inc. | | | 282,580 | | | | 9,548,378 | |
| | | | | | | | 26,278,837 | |
| | |
| Food Distributors–0.90% | | | | | | | | |
United Natural Foods, Inc.(b) | | | 144,184 | | | | 7,726,821 | |
| | |
| Gas Utilities–1.10% | | | | | | | | |
UGI Corp. | | | 288,838 | | | | 9,447,891 | |
| | |
| Gold–0.43% | | | | | | | | |
Allied Nevada Gold Corp.(b) | | | 60,980 | | | | 1,837,328 | |
Detour Gold Corp. (Canada)(b) | | | 74,284 | | | | 1,862,525 | |
| | | | | | | | 3,699,853 | |
|
| Health Care Equipment–2.28% | |
Orthofix International N.V.(b) | | | 96,273 | | | | 3,786,417 | |
Teleflex Inc. | | | 99,872 | | | | 7,121,872 | |
Wright Medical Group, Inc.(b)(c) | | | 414,714 | | | | 8,704,847 | |
| | | | | | | | 19,613,136 | |
| | |
| Health Care Facilities–2.15% | | | | | | | | |
Amsurg Corp.(b) | | | 298,484 | | | | 8,957,505 | |
Universal Health Services, Inc.–Class B | | | 196,460 | | | | 9,498,841 | |
| | | | | | | | 18,456,346 | |
See accompanying Notes to Financial Statements which are an integral part of the financial statements.
9 Invesco Small Cap Equity Fund
| | | | | | | | |
| | | Shares | | | Value | |
| Health Care Services–0.80% | |
IPC The Hospitalist Co.(b) | | | 172,627 | | | $ | 6,855,018 | |
| | |
| Health Care Supplies–1.04% | | | | | | | | |
Haemonetics Corp.(b) | | | 218,376 | | | | 8,918,476 | |
| | |
| Home Furnishings–0.86% | | | | | | | | |
La-Z-Boy Inc. | | | 524,742 | | | | 7,425,099 | |
| | |
| Homebuilding–1.02% | | | | | | | | |
Meritage Homes Corp.(b) | | | 235,688 | | | | 8,802,947 | |
| | |
| Homefurnishing Retail–0.98% | | | | | | | | |
Pier 1 Imports, Inc. | | | 421,378 | | | | 8,427,560 | |
| | |
| Industrial Machinery–5.39% | | | | | | | | |
Gardner Denver Inc. | | | 93,420 | | | | 6,399,270 | |
IDEX Corp. | | | 182,927 | | | | 8,511,593 | |
TriMas Corp.(b) | | | 388,465 | | | | 10,861,482 | |
Valmont Industries, Inc. | | | 82,764 | | | | 11,301,424 | |
Watts Water Technologies, Inc.–Class A | | | 213,366 | | | | 9,172,604 | |
| | | | | | | | 46,246,373 | |
| | |
| Industrial REIT’s–1.12% | | | | | | | | |
DCT Industrial Trust Inc. | | | 1,482,200 | | | | 9,619,478 | |
| | |
| Insurance Brokers–1.02% | | | | | | | | |
Arthur J. Gallagher & Co. | | | 252,205 | | | | 8,738,903 | |
|
| Internet Software & Services–1.19% | |
ValueClick, Inc.(b) | | | 528,188 | | | | 10,252,129 | |
|
| Investment Banking & Brokerage–0.81% | |
Evercore Partners Inc.–Class A | | | 230,716 | | | | 6,965,316 | |
|
| IT Consulting & Other Services–0.98% | |
MAXIMUS, Inc. | | | 132,521 | | | | 8,377,978 | |
|
| Life Sciences Tools & Services–1.72% | |
Bio-Rad Laboratories, Inc.–Class A(b) | | | 69,742 | | | | 7,326,397 | |
Charles River Laboratories International, Inc.(b) | | | 198,950 | | | | 7,454,657 | |
| | | | | | | | 14,781,054 | |
| | |
| Multi-Line Insurance–0.97% | | | | | | | | |
American Financial Group, Inc. | | | 211,740 | | | | 8,367,965 | |
| | |
| Office REIT’s–0.97% | | | | | | | | |
Douglas Emmett, Inc. | | | 356,400 | | | | 8,304,120 | |
|
| Office Services & Supplies–1.22% | |
Interface, Inc. | | | 650,562 | | | | 10,461,037 | |
|
| Oil & Gas Equipment & Services–4.58% | |
Dresser-Rand Group, Inc.(b) | | | 147,431 | | | | 8,276,776 | |
Helix Energy Solutions Group Inc.(b) | | | 450,513 | | | | 9,298,588 | |
Lufkin Industries, Inc. | | | 89,571 | | | | 5,206,762 | |
Oceaneering International, Inc. | | | 165,760 | | | | 8,916,231 | |
Oil States International, Inc.(b) | | | 107,164 | | | | 7,666,513 | |
| | | | | | | | 39,364,870 | |
| | | | | | | | |
| | | Shares | | | Value | |
| Oil & Gas Exploration & Production–1.66% | |
Energen Corp. | | | 147,919 | | | $ | 6,669,667 | |
Rosetta Resources, Inc.(b) | | | 166,391 | | | | 7,547,496 | |
| | | | | | | | 14,217,163 | |
|
| Packaged Foods & Meats–0.74% | |
TreeHouse Foods, Inc.(b) | | | 122,578 | | | | 6,389,991 | |
| | |
| Paper Packaging–1.20% | | | | | | | | |
Graphic Packaging Holding Co.(b) | | | 1,596,408 | | | | 10,312,796 | |
| | |
| Paper Products–1.08% | | | | | | | | |
Schweitzer-Mauduit International, Inc. | | | 237,665 | | | | 9,276,065 | |
| | |
| Pharmaceuticals–1.31% | | | | | | | | |
Auxilium Pharmaceuticals Inc.(b) | | | 296,300 | | | | 5,490,439 | |
Endo Health Solutions Inc.(b) | | | 220,037 | | | | 5,780,372 | |
| | | | | | | | 11,270,811 | |
|
| Property & Casualty Insurance–1.88% | |
Markel Corp.(b) | | | 17,868 | | | | 7,744,348 | |
W. R. Berkley Corp. | | | 222,585 | | | | 8,400,358 | |
| | | | | | | | 16,144,706 | |
| | |
| Real Estate Services–1.04% | | | | | | | | |
Jones Lang LaSalle Inc. | | | 106,762 | | | | 8,961,602 | |
| | |
| Regional Banks–8.11% | | | | | | | | |
Boston Private Financial Holdings, Inc. | | | 800,799 | | | | 7,215,199 | |
Commerce Bancshares, Inc. | | | 42,012 | | | | 1,472,953 | |
CVB Financial Corp. | | | 758,492 | | | | 7,888,317 | |
East West Bancorp, Inc. | | | 353,274 | | | | 7,591,858 | |
F.N.B. Corp. | | | 652,935 | | | | 6,934,170 | |
Susquehanna Bancshares, Inc. | | | 876,985 | | | | 9,190,803 | |
Texas Capital Bancshares, Inc.(b) | | | 178,451 | | | | 7,998,174 | |
Webster Financial Corp. | | | 357,682 | | | | 7,350,365 | |
Wintrust Financial Corp. | | | 219,942 | | | | 8,071,871 | |
Zions Bancorp. | | | 275,015 | | | | 5,885,321 | |
| | | | | | | | 69,599,031 | |
| | |
| Residential REIT’s–1.06% | | | | | | | | |
Education Realty Trust, Inc. | | | 444,789 | | | | 4,732,555 | |
Mid-America Apartment Communities, Inc. | | | 67,200 | | | | 4,351,200 | |
| | | | | | | | 9,083,755 | |
| | |
| Restaurants–2.10% | | | | | | | | |
DineEquity, Inc.(b) | | | 144,843 | | | | 9,704,481 | |
Papa John’s International, Inc.(b) | | | 151,877 | | | | 8,344,122 | |
| | | | | | | | 18,048,603 | |
|
| Semiconductor Equipment–2.44% | |
Cymer, Inc.(b) | | | 154,536 | | | | 13,974,690 | |
Veeco Instruments Inc.(b)(c) | | | 235,803 | | | | 6,960,905 | |
| | | | | | | | 20,935,595 | |
See accompanying Notes to Financial Statements which are an integral part of the financial statements.
10 Invesco Small Cap Equity Fund
| | | | | | | | |
| | | Shares | | | Value | |
| Semiconductors–1.75% | | | | | | | | |
Lattice Semiconductor Corp.(b) | | | 1,319,591 | | | $ | 5,265,168 | |
Semtech Corp.(b) | | | 338,571 | | | | 9,801,631 | |
| | | | | | | | 15,066,799 | |
| | |
| Specialized REIT’s–1.02% | | | | | | | | |
LaSalle Hotel Properties | | | 344,096 | | | | 8,736,597 | |
| | |
| Specialty Chemicals–2.24% | | | | | | | | |
Innophos Holdings, Inc. | | | 168,032 | | | | 7,813,488 | |
PolyOne Corp. | | | 560,583 | | | | 11,447,105 | |
| | | | | | | | 19,260,593 | |
| | |
| Specialty Stores–0.83% | | | | | | | | |
GNC Holdings, Inc.–Class A | | | 213,858 | | | | 7,117,194 | |
| | |
| Steel–0.84% | | | | | | | | |
Haynes International, Inc. | | | 138,816 | | | | 7,200,386 | |
|
| Trading Companies & Distributors–1.24% | |
Beacon Roofing Supply, Inc.(b) | | | 319,415 | | | | 10,630,131 | |
| | |
| Trucking–1.93% | | | | | | | | |
Landstar System, Inc. | | | 132,911 | | | | 6,972,511 | |
Old Dominion Freight Line, Inc.(b) | | | 280,300 | | | | 9,608,684 | |
| | | | | | | | 16,581,195 | |
Total Common Stocks & Other Equity Interests
(Cost $655,833,331) | | | | 826,487,792 | |
| | | | | | | | |
| | | Shares | | | Value | |
Money Market Funds–3.12% | | | | | | | | |
Liquid Assets Portfolio–Institutional Class(d) | | | 13,420,174 | | | $ | 13,420,174 | |
Premier Portfolio–Institutional Class(d) | | | 13,420,174 | | | | 13,420,174 | |
Total Money Market Funds
(Cost $26,840,348) | | | | 26,840,348 | |
TOTAL INVESTMENTS (excluding investments purchased with cash collateral from securities on loan)–99.38%
(Cost $682,673,679) | | | | 853,328,140 | |
| |
Investments Purchased with Cash
Collateral from Securities on Loan | | | | | |
Money Market Funds–2.21% | | | | | | | | |
Liquid Assets Portfolio–Institutional Class (Cost $18,934,765)(d)(e) | | | 18,934,765 | | | | 18,934,765 | |
TOTAL INVESTMENTS–101.59%
(Cost $701,608,444) | | | | | | | 872,262,905 | |
OTHER ASSETS LESS LIABILITIES–(1.59)% | | | | | | | (13,630,145 | ) |
NET ASSETS–100.00% | | | | | | $ | 858,632,760 | |
Investment Abbreviations:
| | |
| REIT | | – Real Estate Investment Trust |
Notes to Schedule of Investments:
| (a) | Industry and/or sector classifications used in this report are generally according to the Global Industry Classification Standard, which was developed by and is the exclusive property and a service mark of MSCI Inc. and Standard & Poor’s. |
| (b) | Non-income producing security. |
| (c) | All or a portion of this security was out on loan at December 31, 2012. |
| (d) | The money market fund and the Fund are affiliated by having the same investment adviser. |
| (e) | The security has been segregated to satisfy the commitment to return the cash collateral received in securities lending transactions upon the borrower’s return of the securities loaned. See Note 1I. |
See accompanying Notes to Financial Statements which are an integral part of the financial statements.
11 Invesco Small Cap Equity Fund
Statement of Assets and Liabilities
December 31, 2012
| | | | |
Assets: | |
Investments, at value (Cost $655,833,331)* | | $ | 826,487,792 | |
Investments in affiliated money market funds, at value and cost | | | 45,775,113 | |
Total investments, at value (Cost $701,608,444) | | | 872,262,905 | |
Receivable for: | | | | |
Investments sold | | | 3,363,879 | |
Fund shares sold | | | 9,231,088 | |
Dividends | | | 455,396 | |
Investment for trustee deferred compensation and retirement plans | | | 73,472 | |
Other assets | | | 43,290 | |
Total assets | | | 885,430,030 | |
|
Liabilities: | |
Payable for: | | | | |
Investments purchased | | | 2,783,074 | |
Fund shares reacquired | | | 4,203,684 | |
Collateral upon return of securities loaned | | | 18,934,765 | |
Accrued fees to affiliates | | | 597,939 | |
Accrued other operating expenses | | | 104,650 | |
Trustee deferred compensation and retirement plans | | | 173,158 | |
Total liabilities | | | 26,797,270 | |
Net assets applicable to shares outstanding | | $ | 858,632,760 | |
|
Net assets consist of: | |
Shares of beneficial interest | | $ | 675,721,011 | |
Undistributed net investment income (loss) | | | (168,635 | ) |
Undistributed net realized gain | | | 12,425,923 | |
Unrealized appreciation | | | 170,654,461 | |
| | | $ | 858,632,760 | |
| | | | |
Net Assets: | |
Class A | | $ | 397,304,544 | |
Class B | | $ | 12,620,400 | |
Class C | | $ | 49,995,118 | |
Class R | | $ | 80,485,786 | |
Class Y | | $ | 107,440,092 | |
Class R5 | | $ | 140,109,680 | |
Class R6 | | $ | 70,677,140 | |
|
Shares outstanding, $0.01 par value per share,
with an unlimited number of shares authorized: | |
Class A | | | 30,004,766 | |
Class B | | | 1,068,609 | |
Class C | | | 4,234,355 | |
Class R | | | 6,272,800 | |
Class Y | | | 8,016,427 | |
Class R5 | | | 10,072,919 | |
Class R6 | | | 5,078,764 | |
Class A: | | | | |
Net asset value per share | | $ | 13.24 | |
Maximum offering price per share | | | | |
(Net asset value of $13.24 ¸ 94.50%) | | $ | 14.01 | |
Class B: | | | | |
Net asset value and offering price per share | | $ | 11.81 | |
Class C: | | | | |
Net asset value and offering price per share | | $ | 11.81 | |
Class R: | | | | |
Net asset value and offering price per share | | $ | 12.83 | |
Class Y: | | | | |
Net asset value and offering price per share | | $ | 13.40 | |
Class R5: | | | | |
Net asset value and offering price per share | | $ | 13.91 | |
Class R6: | | | | |
Net asset value and offering price per share | | $ | 13.92 | |
| * | At December 31, 2012, securities with an aggregate value of $19,101,565 were on loan to brokers. |
See accompanying Notes to Financial Statements which are an integral part of the financial statements.
12 Invesco Small Cap Equity Fund
Statement of Operations
For the year ended December 31, 2012
| | | | |
Investment income: | |
Dividends | | $ | 8,917,882 | |
Dividends from affiliated money market funds (includes securities lending income of $183,254) | | | 205,786 | |
Total investment income | | | 9,123,668 | |
| |
Expenses: | | | | |
Advisory fees | | | 5,886,161 | |
Administrative services fees | | | 224,510 | |
Custodian fees | | | 30,452 | |
Distribution fees: | | | | |
Class A | | | 980,225 | |
Class B | | | 151,606 | |
Class C | | | 499,015 | |
Class R | | | 412,410 | |
Transfer agent fees — A, B, C, R and Y | | | 1,746,528 | |
Transfer agent fees — R5 | | | 125,160 | |
Transfer agent fees — R6 | | | 456 | |
Trustees’ and officers’ fees and benefits | | | 51,246 | |
Other | | | 307,608 | |
Total expenses | | | 10,415,377 | |
Less: Fees waived and expense offset arrangement(s) | | | (25,567 | ) |
Net expenses | | | 10,389,810 | |
Net investment income (loss) | | | (1,266,142 | ) |
| |
Realized and unrealized gain from: | | | | |
Net realized gain from: | | | | |
Investment securities (includes net gains (losses) from securities sold to affiliates of $(5,010,479)) | | | 54,277,715 | |
Foreign currencies | | | 40 | |
| | | | 54,277,755 | |
Change in net unrealized appreciation of investment securities | | | 48,970,980 | |
Net realized and unrealized gain | | | 103,248,735 | |
Net increase in net assets resulting from operations | | $ | 101,982,593 | |
See accompanying Notes to Financial Statements which are an integral part of the financial statements.
13 Invesco Small Cap Equity Fund
Statement of Changes in Net Assets
For the years ended December 31, 2012 and 2011
| | | | | | | | |
| | | 2012 | | | 2011 | |
Operations: | | | | | |
Net investment income (loss) | | $ | (1,266,142 | ) | | $ | (4,184,739 | ) |
Net realized gain | | | 54,277,755 | | | | 46,774,623 | |
Change in net unrealized appreciation (depreciation) | | | 48,970,980 | | | | (51,867,640 | ) |
Net increase (decrease) in net assets resulting from operations | | | 101,982,593 | | | | (9,277,756 | ) |
| | |
Distributions to shareholders from net realized gains: | | | | | | | | |
Class A | | | (16,950,006 | ) | | | — | |
Class B | | | (605,656 | ) | | | — | |
Class C | | | (2,355,135 | ) | | | — | |
Class R | | | (3,499,424 | ) | | | — | |
Class Y | | | (4,347,910 | ) | | | — | |
Class R5 | | | (5,650,612 | ) | | | — | |
Class R6 | | | (2,597,584 | ) | | | — | |
Total distributions from net realized gains | | | (36,006,327 | ) | | | — | |
| | |
Share transactions-net: | | | | | | | | |
Class A | | | (5,137,198 | ) | | | 10,444,780 | |
Class B | | | (6,327,463 | ) | | | (14,173,058 | ) |
Class C | | | (1,717,888 | ) | | | 2,758,755 | |
Class R | | | (3,637,921 | ) | | | 2,542,248 | |
Class Y | | | 41,323,516 | | | | 35,374,232 | |
Class R5 | | | (47,528,336 | ) | | | 49,053,128 | |
Class R6 | | | 72,351,379 | | | | — | |
Net increase in net assets resulting from share transactions | | | 49,326,089 | | | | 86,000,085 | |
Net increase in net assets | | | 115,302,355 | | | | 76,722,329 | |
| | |
Net assets: | | | | | | | | |
Beginning of year | | | 743,330,405 | | | | 666,608,076 | |
End of year (includes undistributed net investment income (loss) of $(168,635) and $(566,406), respectively) | | $ | 858,632,760 | | | $ | 743,330,405 | |
Notes to Financial Statements
December 31, 2012
NOTE 1—Significant Accounting Policies
Invesco Small Cap Equity Fund (the “Fund”) is a series portfolio of AIM Funds Group (Invesco Funds Group) (the “Trust”). The Trust is a Delaware statutory trust registered under the Investment Company Act of 1940, as amended (the “1940 Act”), as an open-end series management investment company consisting of four separate portfolios, each authorized to issue an unlimited number of shares of beneficial interest. The assets, liabilities and operations of each portfolio are accounted for separately. Information presented in these financial statements pertains only to the Fund. Matters affecting each portfolio or class will be voted on exclusively by the shareholders of such portfolio or class.
The Fund’s primary investment objective is long-term growth of capital.
The Fund currently consists of seven different classes of shares: Class A, Class B, Class C, Class R, Class Y, Class R5 and Class R6. On September 24, 2012, Institutional Class shares were renamed Class R5 shares and the Fund began offering Class R6 shares. Class A shares are sold with a front-end sales charge unless certain waiver criteria are met and under certain circumstances load waived shares may be subject to contingent deferred sales charges (“CDSC”). Class C shares are sold with a CDSC. Class R, Class Y, Class R5 and Class R6 shares are sold at net asset value. Effective November 30, 2010, new or additional investments in Class B shares are no longer permitted. Existing shareholders of Class B shares may continue to reinvest dividends and capital gains distributions in Class B shares until they convert to Class A shares. Also, shareholders in Class B shares will be able to exchange those shares for Class B shares of other Invesco Funds offering such shares until they convert to Class A shares. Generally, Class B shares will automatically convert to Class A shares on or about the month-end, which is at least eight years after the date of purchase. Redemption of Class B shares prior to the conversion date will be subject to a CDSC.
The following is a summary of the significant accounting policies followed by the Fund in the preparation of its financial statements.
| A. | Security Valuations — Securities, including restricted securities, are valued according to the following policy. |
A security listed or traded on an exchange (except convertible bonds) is valued at its last sales price or official closing price as of the close of the customary trading session on the exchange where the security is principally traded, or lacking any sales or official closing price on a particular
14 Invesco Small Cap Equity Fund
day, the security may be valued at the closing bid price on that day. Securities traded in the over-the-counter market are valued based on prices furnished by independent pricing services or market makers. When such securities are valued by an independent pricing service they may be considered fair valued. Futures contracts are valued at the final settlement price set by an exchange on which they are principally traded. Listed options are valued at the mean between the last bid and ask prices from the exchange on which they are principally traded. Options not listed on an exchange are valued by an independent source at the mean between the last bid and ask prices. For purposes of determining net asset value per share, futures and option contracts generally are valued 15 minutes after the close of the customary trading session of the New York Stock Exchange (“NYSE”).
Investments in open-end and closed-end registered investment companies that do not trade on an exchange are valued at the end of day net asset value per share. Investments in open-end and closed-end registered investment companies that trade on an exchange are valued at the last sales price or official closing price as of the close of the customary trading session on the exchange where the security is principally traded.
Debt obligations (including convertible bonds) and unlisted equities are fair valued using an evaluated quote provided by an independent pricing service. Evaluated quotes provided by the pricing service may be determined without exclusive reliance on quoted prices, and may reflect appropriate factors such as institution-size trading in similar groups of securities, developments related to specific securities, dividend rate (for unlisted equities), yield (for debt obligations), quality, type of issue, coupon rate (for debt obligations), maturity (for debt obligations), individual trading characteristics and other market data. Debt obligations are subject to interest rate and credit risks. In addition, all debt obligations involve some risk of default with respect to interest and/or principal payments.
Foreign securities’ (including foreign exchange contracts) prices are converted into U.S. dollar amounts using the applicable exchange rates as of the close of the NYSE. If market quotations are available and reliable for foreign exchange-traded equity securities, the securities will be valued at the market quotations. Because trading hours for certain foreign securities end before the close of the NYSE, closing market quotations may become unreliable. If between the time trading ends on a particular security and the close of the customary trading session on the NYSE, events occur that the Adviser determines are significant and make the closing price unreliable, the Fund may fair value the security. If the event is likely to have affected the closing price of the security, the security will be valued at fair value in good faith using procedures approved by the Board of Trustees. Adjustments to closing prices to reflect fair value may also be based on a screening process of an independent pricing service to indicate the degree of certainty, based on historical data, that the closing price in the principal market where a foreign security trade is not the current value as of the close of the NYSE. Foreign securities’ prices meeting the approved degree of certainty that the price is not reflective of current value will be priced at the indication of fair value from the independent pricing service. Multiple factors may be considered by the independent pricing service in determining adjustments to reflect fair value and may include information relating to sector indices, American Depositary Receipts and domestic and foreign index futures. Foreign securities may have additional risks including exchange rate changes, potential for sharply devalued currencies and high inflation, political and economic upheaval, the relative lack of issuer information, relatively low market liquidity and the potential lack of strict financial and accounting controls and standards.
Securities for which market prices are not provided by any of the above methods may be valued based upon quotes furnished by independent sources. The last bid price may be used to value equity securities. The mean between the last bid and asked prices is used to value debt obligations, including corporate loans.
Securities for which market quotations are not readily available or became unreliable are valued at fair value as determined in good faith by or under the supervision of the Trust’s officers following procedures approved by the Board of Trustees. Issuer specific events, market trends, bid/ask quotes of brokers and information providers and other market data may be reviewed in the course of making a good faith determination of a security’s fair value.
Valuations change in response to many factors including the historical and prospective earnings of the issuer, the value of the issuer’s assets, general economic conditions, interest rates, investor perceptions and market liquidity. Because of the inherent uncertainties of valuation, the values reflected in the financial statements may materially differ from the value received upon actual sale of those investments.
| B. | Securities Transactions and Investment Income — Securities transactions are accounted for on a trade date basis. Realized gains or losses on sales are computed on the basis of specific identification of the securities sold. Interest income is recorded on the accrual basis from settlement date. Dividend income (net of withholding tax, if any) is recorded on the ex-dividend date. |
The Fund may periodically participate in litigation related to Fund investments. As such, the Fund may receive proceeds from litigation settlements. Any proceeds received are included in the Statement of Operations as realized gain (loss) for investments no longer held and as unrealized gain (loss) for investments still held.
Brokerage commissions and mark ups are considered transaction costs and are recorded as an increase to the cost basis of securities purchased and/or a reduction of proceeds on a sale of securities. Such transaction costs are included in the determination of net realized and unrealized gain (loss) from investment securities reported in the Statement of Operations and the Statement of Changes in Net Assets and the net realized and unrealized gains (losses) on securities per share in the Financial Highlights. Transaction costs are included in the calculation of the Fund’s net asset value and, accordingly, they reduce the Fund’s total returns. These transaction costs are not considered operating expenses and are not reflected in net investment income reported in the Statement of Operations and Statement of Changes in Net Assets, or the net investment income per share and ratios of expenses and net investment income reported in the Financial Highlights, nor are they limited by any expense limitation arrangements between the Fund and the investment adviser.
The Fund allocates income and realized and unrealized capital gains and losses to a class based on the relative net assets of each class.
| C. | Country Determination — For the purposes of making investment selection decisions and presentation in the Schedule of Investments, the investment adviser may determine the country in which an issuer is located and/or credit risk exposure based on various factors. These factors include the laws of the country under which the issuer is organized, where the issuer maintains a principal office, the country in which the issuer derives 50% or more of its total revenues and the country that has the primary market for the issuer’s securities, as well as other criteria. Among the other criteria that may be evaluated for making this determination are the country in which the issuer maintains 50% or more of its assets, the type of security, financial guarantees and enhancements, the nature of the collateral and the sponsor organization. Country of issuer and/or credit risk exposure has been determined to be the United States of America, unless otherwise noted. |
| D. | Distributions — Distributions from income and net realized capital gain, if any, are generally declared and paid annually and recorded on the ex-dividend date. The Fund may elect to treat a portion of the proceeds from redemptions as distributions for federal income tax purposes. |
15 Invesco Small Cap Equity Fund
| E. | Federal Income Taxes — The Fund intends to comply with the requirements of Subchapter M of the Internal Revenue Code necessary to qualify as a regulated investment company and to distribute substantially all of the Fund’s taxable earnings to shareholders. As such, the Fund will not be subject to federal income taxes on otherwise taxable income (including net realized capital gain) that is distributed to shareholders. Therefore, no provision for federal income taxes is recorded in the financial statements. |
The Fund files tax returns in the U.S. Federal jurisdiction and certain other jurisdictions. Generally, the Fund is subject to examinations by such taxing authorities for up to three years after the filing of the return for the tax period.
| F. | Expenses — Fees provided for under the Rule 12b-1 plan of a particular class of the Fund are charged to the operations of such class. Transfer agency fees and expenses and other shareholder recordkeeping fees and expenses attributable to Class R5 and Class R6 are allocated to each share class based on relative net assets. Sub-accounting fees attributable to Class R5 are charged to the operations of the class. Transfer agency fees and expenses and other shareholder recordkeeping fees and expenses relating to all other classes are allocated among those classes based on relative net assets. All other expenses are allocated among the classes based on relative net assets. |
| G. | Accounting Estimates — The preparation of financial statements in conformity with accounting principles generally accepted in the United States of America (“GAAP”) requires management to make estimates and assumptions that affect the reported amounts of assets and liabilities at the date of the financial statements and the reported amounts of revenues and expenses during the reporting period including estimates and assumptions related to taxation. Actual results could differ from those estimates by a significant amount. In addition, the Fund monitors for material events or transactions that may occur or become known after the period-end date and before the date the financial statements are released to print. |
| H. | Indemnifications — Under the Trust’s organizational documents, each Trustee, officer, employee or other agent of the Trust is indemnified against certain liabilities that may arise out of the performance of their duties to the Fund. Additionally, in the normal course of business, the Fund enters into contracts, including the Fund’s servicing agreements, that contain a variety of indemnification clauses. The Fund’s maximum exposure under these arrangements is unknown as this would involve future claims that may be made against the Fund that have not yet occurred. The risk of material loss as a result of such indemnification claims is considered remote. |
| I. | Securities Lending — The Fund may lend portfolio securities having a market value up to one-third of the Fund’s total assets. Such loans are secured by collateral equal to no less than the market value of the loaned securities determined daily by the securities lending provider. Such collateral will be cash or debt securities issued or guaranteed by the U.S. Government or any of its sponsored agencies. Cash collateral received in connection with these loans is invested in short-term money market instruments or affiliated money market funds and is shown as such on the Schedule of Investments. It is the Fund’s policy to obtain additional collateral from or return excess collateral to the borrower by the end of the next business day, following the valuation date of the securities loaned. Therefore, the value of the collateral held may be temporarily less than the value of the securities on loan. Lending securities entails a risk of loss to the Fund if and to the extent that the market value of the securities loaned were to increase and the borrower did not increase the collateral accordingly, and the borrower fails to return the securities. Upon the failure of the borrower to return the securities, collateral may be liquidated and the securities may be purchased on the open market to replace the loaned securities. The Fund could experience delays and costs in gaining access to the collateral. The Fund bears the risk of any deficiency in the amount of the collateral available for return to the borrower due to any loss on the collateral invested. Dividends received on cash collateral investments for securities lending transactions, which are net of compensation to counterparties, is included in Dividends from affiliated money market funds on the Statement of Operations. The aggregate value of securities out on loan is shown as a footnote on the Statement of Assets and Liabilities, if any. |
| J. | Foreign Currency Translations — Foreign currency is valued at the close of the NYSE based on quotations posted by banks and major currency dealers. Portfolio securities and other assets and liabilities denominated in foreign currencies are translated into U.S. dollar amounts at date of valuation. Purchases and sales of portfolio securities (net of foreign taxes withheld on disposition) and income items denominated in foreign currencies are translated into U.S. dollar amounts on the respective dates of such transactions. The Fund does not separately account for the portion of the results of operations resulting from changes in foreign exchange rates on investments and the fluctuations arising from changes in market prices of securities held. The combined results of changes in foreign exchange rates and the fluctuation of market prices on investments (net of estimated foreign tax withholding) are included with the net realized and unrealized gain or loss from investments in the Statement of Operations. Reported net realized foreign currency gains or losses arise from (1) sales of foreign currencies, (2) currency gains or losses realized between the trade and settlement dates on securities transactions, and (3) the difference between the amounts of dividends, interest, and foreign withholding taxes recorded on the Fund’s books and the U.S. dollar equivalent of the amounts actually received or paid. Net unrealized foreign currency gains and losses arise from changes in the fair values of assets and liabilities, other than investments in securities at fiscal period end, resulting from changes in exchange rates. |
The Fund may invest in foreign securities which may be subject to foreign taxes on income, gains on investments or currency repatriation, a portion of which may be recoverable.
| K. | Foreign Currency Contracts — The Fund may enter into foreign currency contracts to manage or minimize currency or exchange rate risk. The Fund may also enter into foreign currency contracts for the purchase or sale of a security denominated in a foreign currency in order to “lock in” the U.S. dollar price of that security. A foreign currency contract is an obligation to purchase or sell a specific currency for an agreed-upon price at a future date. The use of foreign currency contracts does not eliminate fluctuations in the price of the underlying securities the Fund owns or intends to acquire but establishes a rate of exchange in advance. Fluctuations in the value of these contracts are measured by the difference in the contract date and reporting date exchange rates and are recorded as unrealized appreciation (depreciation) until the contracts are closed. When the contracts are closed, realized gains (losses) are recorded. Realized and unrealized gains (losses) on the contracts are included in the Statement of Operations. The primary risks associated with foreign currency contracts include failure of the counterparty to meet the terms of the contract and the value of the foreign currency changing unfavorably. These risks may be in excess of the amounts reflected in the Statement of Assets and Liabilities. |
16 Invesco Small Cap Equity Fund
NOTE 2—Advisory Fees and Other Fees Paid to Affiliates
The Trust has entered into a master investment advisory agreement with Invesco Advisers, Inc. (the “Adviser” or “Invesco”). Under the terms of the investment advisory agreement, the Fund pays an advisory fee to the Adviser based on the annual rate of the Fund’s average daily net assets as follows:
| | | | | | |
| Average Daily Net Assets | | Rate |
First $250 million | | | 0 | .745% | | |
Next $250 million | | | 0 | .73% | | |
Next $500 million | | | 0 | .715% | | |
Next $1.5 billion | | | 0 | .70% | | |
Next $2.5 billion | | | 0 | .685% | | |
Next $2.5 billion | | | 0 | .67% | | |
Next $2.5 billion | | | 0 | .655% | | |
Over $10 billion | | | 0 | .64% | | |
Under the terms of a master sub-advisory agreement between the Adviser and each of Invesco Asset Management Deutschland GmbH, Invesco Asset Management Limited, Invesco Asset Management (Japan) Limited, Invesco Australia Limited, Invesco Hong Kong Limited, Invesco Senior Secured Management, Inc. and Invesco Canada Ltd. (collectively, the “Affiliated Sub-Advisers”) the Adviser, not the Fund, may pay 40% of the fees paid to the Adviser to any such Affiliated Sub-Adviser(s) that provide discretionary investment management services to the Fund based on the percentage of assets allocated to such Sub-Adviser(s).
The Adviser has contractually agreed, through at least June 30, 2013, to waive advisory fees and/or reimburse expenses of all shares to the extent necessary to limit total annual fund operating expenses after fee waiver and/or expense reimbursement (excluding certain items discussed below) of Class A, Class B, Class C, Class R, Class Y, Class R5 and Class R6 shares to 2.00%, 2.75%, 2.75%, 2.25%, 1.75%, 1.75% and 1.75%, respectively, of average daily net assets. In determining the Adviser’s obligation to waive advisory fees and/or reimburse expenses, the following expenses are not taken into account, and could cause the total annual fund operating expenses after fee waiver and/or expense reimbursement to exceed the numbers reflected above: (1) interest; (2) taxes; (3) dividend expense on short sales; (4) extraordinary or non-routine items, including litigation expenses; and (5) expenses that the Fund has incurred but did not actually pay because of an expense offset arrangement. Unless the Board of Trustees and Invesco mutually agree to amend or continue the fee waiver agreement, it will terminate on June 30, 2013. The Adviser did not waive fees and/or reimburse expenses during the period under this expense limitation.
Further, the Adviser has contractually agreed, through at least June 30, 2013, to waive the advisory fee payable by the Fund in an amount equal to 100% of the net advisory fees the Adviser receives from the affiliated money market funds on investments by the Fund of uninvested cash (excluding investments of cash collateral from securities lending) in such affiliated money market funds.
For the year ended December 31, 2012, the Adviser waived advisory fees of $22,911.
The Trust has entered into a master administrative services agreement with Invesco pursuant to which the Fund has agreed to pay Invesco for certain administrative costs incurred in providing accounting services to the Fund. For the year ended December 31, 2012, expenses incurred under the agreement are shown in the Statement of Operations as Administrative services fees.
The Trust has entered into a transfer agency and service agreement with Invesco Investment Services, Inc. (“IIS”) pursuant to which the Fund has agreed to pay IIS a fee for providing transfer agency and shareholder services to the Fund and reimburse IIS for certain expenses incurred by IIS in the course of providing such services. IIS may make payments to intermediaries that provide omnibus account services, sub-accounting services and/or networking services. All fees payable by IIS to intermediaries that provide omnibus account services or sub-accounting are charged back to the Fund, subject to certain limitations approved by the Trust’s Board of Trustees. For the year ended December 31, 2012, expenses incurred under the agreement are shown in the Statement of Operations as Transfer agent fees.
The Trust has entered into master distribution agreements with Invesco Distributors, Inc. (“IDI”) to serve as the distributor for the Class A, Class B, Class C, Class R, Class Y, Class R5 and Class R6 shares of the Fund. The Trust has adopted plans pursuant to Rule 12b-1 under the 1940 Act with respect to the Fund’s Class A, Class B, Class C and Class R shares (collectively, the “Plans”). The Fund, pursuant to the Plans, pays IDI compensation at the annual rate of 0.25% of the Fund’s average daily net assets of Class A shares, 1.00% of the average daily net assets of Class B and Class C shares and 0.50% of the average daily net assets of Class R shares. Of the Plan payments, up to 0.25% of the average daily net assets of each class of shares may be paid to furnish continuing personal shareholder services to customers who purchase and own shares of such classes. Any amounts not paid as a service fee under the Plans would constitute an asset-based sales charge. Rules of the Financial Industry Regulatory Authority (“FINRA”) impose a cap on the total sales charges, including asset-based sales charges, that may be paid by any class of shares of the Fund. For the year ended December 31, 2012, expenses incurred under the Plans are shown in the Statement of Operations as Distribution fees.
Front-end sales commissions and CDSC (collectively, the “sales charges”) are not recorded as expenses of the Fund. Front-end sales commissions are deducted from proceeds from the sales of Fund shares prior to investment in Class A shares of the Fund. CDSC are deducted from redemption proceeds prior to remittance to the shareholder. During the year ended December 31, 2012, IDI advised the Fund that IDI retained $133,110 in front-end sales commissions from the sale of Class A shares and $2,492, $16,886 and $3,144 from Class A, Class B and Class C shares, respectively, for CDSC imposed on redemptions by shareholders.
NOTE 3—Additional Valuation Information
GAAP defines fair value as the price that would be received to sell an asset or paid to transfer a liability in an orderly transaction between market participants at the measurement date, under current market conditions. GAAP establishes a hierarchy that prioritizes the inputs to valuation methods giving the highest priority to readily available unadjusted quoted prices in an active market for identical assets (Level 1) and the lowest priority to significant unobservable inputs (Level 3) generally when market prices are not readily available or are unreliable. Based on the valuation inputs, the
17 Invesco Small Cap Equity Fund
securities or other investments are tiered into one of three levels. Changes in valuation methods may result in transfers in or out of an investment’s assigned level:
| | Level 1 — | Prices are determined using quoted prices in an active market for identical assets. |
| | Level 2 — | Prices are determined using other significant observable inputs. Observable inputs are inputs that other market participants may use in pricing a security. These may include quoted prices for similar securities, interest rates, prepayment speeds, credit risk, yield curves, loss severities, default rates, discount rates, volatilities and others. |
| | Level 3 — | Prices are determined using significant unobservable inputs. In situations where quoted prices or observable inputs are unavailable (for example, when there is little or no market activity for an investment at the end of the period), unobservable inputs may be used. Unobservable inputs reflect the Fund’s own assumptions about the factors market participants would use in determining fair value of the securities or instruments and would be based on the best available information. |
The following is a summary of the tiered valuation input levels, as of December 31, 2012. The level assigned to the securities valuations may not be an indication of the risk or liquidity associated with investing in those securities. Because of the inherent uncertainties of valuation, the values reflected in the financial statements may materially differ from the value received upon actual sale of those investments.
| | | | | | | | | | | | | | | | |
| | | Level 1 | | | Level 2 | | | Level 3 | | | Total | |
Equity Securities | | $ | 872,262,905 | | | $ | — | | | $ | — | | | $ | 872,262,905 | |
NOTE 4—Security Transactions with Affiliated Funds
The Fund is permitted to purchase or sell securities from or to certain other Invesco Funds under specified conditions outlined in procedures adopted by the Board of Trustees of the Trust. The procedures have been designed to ensure that any purchase or sale of securities by the Fund from or to another fund or portfolio that is or could be considered an affiliate by virtue of having a common investment adviser (or affiliated investment advisers), common Trustees and/or common officers complies with Rule 17a-7 of the 1940 Act. Further, as defined under the procedures, each transaction is effected at the current market price. Pursuant to these procedures, for the year ended December 31, 2012, the Fund engaged in securities purchases of $6,634,329 and securities sales of $3,141,137, which resulted in net realized gains (losses) of $(5,010,479).
NOTE 5—Expense Offset Arrangement(s)
The expense offset arrangement is comprised of transfer agency credits which result from balances in Demand Deposit Accounts (DDA) used by the transfer agent for clearing shareholder transactions. For the year ended December 31, 2012, the Fund received credits from this arrangement, which resulted in the reduction of the Fund’s total expenses of $2,656.
NOTE 6—Trustees’ and Officers’ Fees and Benefits
“Trustees’ and Officers’ Fees and Benefits” include amounts accrued by the Fund to pay remuneration to certain Trustees and Officers of the Fund. Trustees have the option to defer compensation payable by the Fund, and “Trustees’ and Officers’ Fees and Benefits” also include amounts accrued by the Fund to fund such deferred compensation amounts. Those Trustees who defer compensation have the option to select various Invesco Funds in which their deferral accounts shall be deemed to be invested. Finally, certain current Trustees are eligible to participate in a retirement plan that provides for benefits to be paid upon retirement to Trustees over a period of time based on the number of years of service. The Fund may have certain former Trustees who also participate in a retirement plan and receive benefits under such plan. “Trustees’ and Officers’ Fees and Benefits” include amounts accrued by the Fund to fund such retirement benefits. Obligations under the deferred compensation and retirement plans represent unsecured claims against the general assets of the Fund.
NOTE 7—Cash Balances
The Fund is permitted to temporarily carry a negative or overdrawn balance in its account with State Street Bank and Trust Company, the custodian bank. Such balances, if any at period end, are shown in the Statement of Assets and Liabilities under the payable caption Amount due custodian. To compensate the custodian bank for such overdrafts, the overdrawn Fund may either (1) leave funds as a compensating balance in the account so the custodian bank can be compensated by earning the additional interest; or (2) compensate by paying the custodian bank at a rate agreed upon by the custodian bank and Invesco, not to exceed the contractually agreed upon rate.
18 Invesco Small Cap Equity Fund
NOTE 8—Distributions to Shareholders and Tax Components of Net Assets
Tax Character of Distributions to Shareholders Paid During the Years Ended December 31, 2012 and 2011:
| | | | | | | | |
| | | 2012 | | | 2011 | |
Long-term capital gain | | $ | 36,006,327 | | | $ | — | |
Tax Components of Net Assets at Period-End:
| | | | |
| | | 2012 | |
Undistributed ordinary income | | $ | 3,091,160 | |
Undistributed long-term gain | | | 10,134,014 | |
Net unrealized appreciation — investments | | | 169,850,979 | |
Temporary book/tax differences | | | (164,404 | ) |
Shares of beneficial interest | | | 675,721,011 | |
Total net assets | | $ | 858,632,760 | |
The difference between book-basis and tax-basis unrealized appreciation (depreciation) is due to differences in the timing of recognition of gains and losses on investments for tax and book purposes. The Fund’s net unrealized appreciation difference is attributable primarily to wash sales and passive foreign investment companies.
The temporary book/tax differences are a result of timing differences between book and tax recognition of income and/or expenses. The Fund’s temporary book/tax differences are the result of the trustee deferral of compensation and retirement plan benefits.
Capital loss carryforward is calculated and reported as of a specific date. Results of transactions and other activity after that date may affect the amount of capital loss carryforward actually available for the Fund to utilize. The Regulated Investment Company Modernization Act of 2010 (the “Act”) eliminated the eight-year carryover period for capital losses that arise in taxable years beginning after its enactment date of December 22, 2010. Consequently, these capital losses can be carried forward for an unlimited period. However, capital losses with an expiration period may not be used to offset capital gains until all net capital losses without an expiration date have been utilized. Additionally, post-enactment capital loss carryovers will retain their character as either short-term or long-term capital losses instead of as short-term capital losses as under prior law. The ability to utilize capital loss carryforward in the future may be limited under the Internal Revenue Code and related regulations based on the results of future transactions.
The Fund utilized $3,060,878 of capital loss carryforward in the current period to offset net realized capital gain for federal income tax purposes. The Fund does not have a capital loss carryforward as of December 31, 2012.
NOTE 9—Investment Securities
The aggregate amount of investment securities (other than short-term securities, U.S. Treasury obligations and money market funds, if any) purchased and sold by the Fund during the year ended December 31, 2012 was $309,004,322 and $305,865,595, respectively. Cost of investments on a tax basis includes the adjustments for financial reporting purposes as of the most recently completed federal income tax reporting period-end.
| | | | |
| Unrealized Appreciation (Depreciation) of Investment Securities on a Tax Basis | |
Aggregate unrealized appreciation of investment securities | | $ | 201,756,656 | |
Aggregate unrealized (depreciation) of investment securities | | | (31,905,677 | ) |
Net unrealized appreciation of investment securities | | $ | 169,850,979 | |
Cost of investments for tax purposes is $702,411,926.
NOTE 10—Reclassification of Permanent Differences
Primarily as a result of differing book/tax treatment of net operating losses, on December 31, 2012, undistributed net investment income (loss) was increased by $1,663,913 and undistributed net realized gain was decreased by $1,663,913. This reclassification had no effect on the net assets of the Fund.
19 Invesco Small Cap Equity Fund
NOTE 11—Share Information
| | | | | | | | | | | | | | | | |
| | | Summary of Share Activity | |
| | | Years ended December 31, | |
| | | 2012(a) | | | 2011 | |
| | | Shares | | | Amount | | | Shares | | | Amount | |
Sold: | | | | | | | | | | | | | | | | |
Class A | | | 6,584,212 | | | $ | 86,038,583 | | | | 10,313,343 | | | $ | 129,954,562 | |
Class B | | | 90,920 | | | | 1,079,403 | | | | 216,556 | | | | 2,536,478 | |
Class C | | | 655,445 | | | | 7,708,762 | | | | 1,484,032 | | | | 17,362,990 | |
Class R | | | 2,481,300 | | | | 31,444,184 | | | | 3,457,626 | | | | 42,190,199 | |
Class Y | | | 4,222,608 | | | | 55,637,145 | | | | 3,408,967 | | | | 43,155,570 | |
Class R5 | | | 4,030,956 | | | | 54,953,834 | | | | 7,224,968 | | | | 94,176,377 | |
Class R6(b) | | | 4,979,690 | | | | 71,044,307 | | | | — | | | | — | |
| | | | |
Issued as reinvestment of dividends: | | | | | | | | | | | | | | | | |
Class A | | | 1,205,002 | | | | 15,568,632 | | | | — | | | | — | |
Class B | | | 50,783 | | | | 585,533 | | | | — | | | | — | |
Class C | | | 193,021 | | | | 2,225,531 | | | | — | | | | — | |
Class R | | | 279,169 | | | | 3,497,986 | | | | — | | | | — | |
Class Y | | | 273,655 | | | | 3,579,411 | | | | — | | | | — | |
Class R5 | | | 413,834 | | | | 5,615,729 | | | | — | | | | — | |
Class R6 | | | 191,280 | | | | 2,597,584 | | | | — | | | | — | |
| | | | |
Automatic conversion of Class B shares to Class A shares: | | | | | | | | | | | | | | | | |
Class A | | | 344,607 | | | | 4,547,250 | | | | 801,204 | | | | 10,020,528 | |
Class B | | | (382,774 | ) | | | (4,547,250 | ) | | | (883,627 | ) | | | (10,020,528 | ) |
| | | | |
Reacquired: | | | | | | | | | | | | | | | | |
Class A | | | (8,485,977 | ) | | | (111,291,663 | ) | | | (10,510,328 | ) | | | (129,530,310 | ) |
Class B | | | (292,392 | ) | | | (3,445,149 | ) | | | (594,585 | ) | | | (6,689,008 | ) |
Class C | | | (994,442 | ) | | | (11,652,181 | ) | | | (1,309,006 | ) | | | (14,604,235 | ) |
Class R | | | (3,059,503 | ) | | | (38,580,091 | ) | | | (3,263,856 | ) | | | (39,647,951 | ) |
Class Y | | | (1,363,022 | ) | | | (17,893,040 | ) | | | (625,861 | ) | | | (7,781,338 | ) |
Class R5 | | | (7,707,706 | ) | | | (108,097,899 | ) | | | (3,458,126 | ) | | | (45,123,249 | ) |
Class R6 | | | (92,206 | ) | | | (1,290,512 | ) | | | — | | | | — | |
Net increase in share activity | | | 3,618,460 | | | $ | 49,326,089 | | | | 6,261,307 | | | $ | 86,000,085 | |
| (a) | There are entities that are record owners of more than 5% of the outstanding shares of the Fund and in the aggregate own 18% of the outstanding shares of the Fund. IDI has an agreement with these entities to sell Fund shares. The Fund, Invesco and/or Invesco affiliates may make payments to these entities, which are considered to be related to the Fund, for providing services to the Fund, Invesco and/or Invesco affiliates including but not limited to services such as securities brokerage, distribution, third party record keeping and account servicing. The Fund has no knowledge as to whether all or any portion of the shares owned of record by these entities are also owned beneficially. |
| | In addition, 7% of the outstanding shares of the Fund are owned by affiliated mutual funds. Affiliated mutual funds are other mutual funds that are also advised by Invesco. |
| (b) | Commencement date of September 24, 2012. |
20 Invesco Small Cap Equity Fund
NOTE 12 — Financial Highlights
The following schedule presents financial highlights for a share of the Fund outstanding throughout the periods indicated.
| | | | | | | | | | | | | | | | | | | | | | | | | | | | | | | | | | | | | | | | | | | | | | | | |
| | | Net asset
value,
beginning
of period | | | Net
investment
income
(loss)(a) | | | Net gains
(losses)
on securities
(both
realized and
unrealized) | | | Total from
investment
operations | | | Distributions
from net
realized
gains | | | Net asset value, end of period | | | Total
return(b) | | | Net assets,
end of period
(000’s omitted) | | | Ratio of
expenses
to average
net assets
with fee waivers
and/or expenses
absorbed | | | Ratio of
expenses
to average net
assets without
fee waivers
and/or expenses
absorbed | | | Ratio of net
investment
income (loss)
to average
net assets | | | Portfolio
turnover(c) | |
Class A | | | | | | | | | | | | | | | | | | | | | | | | | | | | | | | | | | | | | | | | | | | | | | | | |
Year ended 12/31/12 | | $ | 12.19 | | | $ | (0.03 | )(g) | | $ | 1.66 | | | $ | 1.63 | | | $ | (0.58 | ) | | $ | 13.24 | | | | 13.50 | % | | $ | 397,305 | | | | 1.34 | %(d) | | | 1.34 | %(d) | | | (0.21 | )%(d)(g) | | | 39 | % |
Year ended 12/31/11 | | | 12.24 | | | | (0.07 | ) | | | 0.02 | | | | (0.05 | ) | | | — | | | | 12.19 | | | | (0.41 | ) | | | 369,938 | | | | 1.35 | | | | 1.35 | | | | (0.59 | ) | | | 42 | |
Year ended 12/31/10 | | | 9.52 | | | | (0.04 | ) | | | 2.76 | | | | 2.72 | | | | — | | | | 12.24 | | | | 28.57 | | | | 364,210 | | | | 1.38 | | | | 1.38 | | | | (0.41 | ) | | | 36 | |
Year ended 12/31/09 | | | 7.91 | | | | (0.03 | ) | | | 1.64 | | | | 1.61 | | | | — | | | | 9.52 | | | | 20.35 | | | | 273,744 | | | | 1.52 | | | | 1.52 | | | | (0.41 | ) | | | 40 | |
Year ended 12/31/08 | | | 11.72 | | | | (0.02 | ) | | | (3.67 | ) | | | (3.69 | ) | | | (0.12 | ) | | | 7.91 | | | | (31.45 | ) | | | 227,885 | | | | 1.41 | | | | 1.41 | | | | (0.19 | ) | | | 51 | |
Class B | | | | | | | | | | | | | | | | | | | | | | | | | | | | | | | | | | | | | | | | | | | | | | | | |
Year ended 12/31/12 | | | 11.01 | | | | (0.11 | )(g) | | | 1.49 | | | | 1.38 | | | | (0.58 | ) | | | 11.81 | | | | 12.68 | | | | 12,620 | | | | 2.09 | (d) | | | 2.09 | (d) | | | (0.96 | )(d)(g) | | | 39 | |
Year ended 12/31/11 | | | 11.14 | | | | (0.15 | ) | | | 0.02 | | | | (0.13 | ) | | | — | | | | 11.01 | | | | (1.17 | ) | | | 17,635 | | | | 2.10 | | | | 2.10 | | | | (1.34 | ) | | | 42 | |
Year ended 12/31/10 | | | 8.73 | | | | (0.11 | ) | | | 2.52 | | | | 2.41 | | | | — | | | | 11.14 | | | | 27.61 | | | | 31,908 | | | | 2.13 | | | | 2.13 | | | | (1.16 | ) | | | 36 | |
Year ended 12/31/09 | | | 7.30 | | | | (0.09 | ) | | | 1.52 | | | | 1.43 | | | | — | | | | 8.73 | | | | 19.59 | | | | 41,092 | | | | 2.27 | | | | 2.27 | | | | (1.16 | ) | | | 40 | |
Year ended 12/31/08 | | | 10.92 | | | | (0.09 | ) | | | (3.41 | ) | | | (3.50 | ) | | | (0.12 | ) | | | 7.30 | | | | (32.01 | ) | | | 50,220 | | | | 2.16 | | | | 2.16 | | | | (0.94 | ) | | | 51 | |
Class C | | | | | | | | | | | | | | | | | | | | | | | | | | | | | | | | | | | | | | | | | | | | | | | | |
Year ended 12/31/12 | | | 11.00 | | | | (0.11 | )(g) | | | 1.50 | | | | 1.39 | | | | (0.58 | ) | | | 11.81 | | | | 12.78 | | | | 49,995 | | | | 2.09 | (d) | | | 2.09 | (d) | | | (0.96 | )(d)(g) | | | 39 | |
Year ended 12/31/11 | | | 11.14 | | | | (0.15 | ) | | | 0.01 | | | | (0.14 | ) | | | — | | | | 11.00 | | | | (1.26 | ) | | | 48,204 | | | | 2.10 | | | | 2.10 | | | | (1.34 | ) | | | 42 | |
Year ended 12/31/10 | | | 8.72 | | | | (0.11 | ) | | | 2.53 | | | | 2.42 | | | | — | | | | 11.14 | | | | 27.75 | | | | 46,838 | | | | 2.13 | | | | 2.13 | | | | (1.16 | ) | | | 36 | |
Year ended 12/31/09 | | | 7.30 | | | | (0.09 | ) | | | 1.51 | | | | 1.42 | | | | — | | | | 8.72 | | | | 19.45 | | | | 40,466 | | | | 2.27 | | | | 2.27 | | | | (1.16 | ) | | | 40 | |
Year ended 12/31/08 | | | 10.92 | | | | (0.09 | ) | | | (3.41 | ) | | | (3.50 | ) | | | (0.12 | ) | | | 7.30 | | | | (32.01 | ) | | | 36,470 | | | | 2.16 | | | | 2.16 | | | | (0.94 | ) | | | 51 | |
Class R | | | | | | | | | | | | | | | | | | | | | | | | | | | | | | | | | | | | | | | | | | | | | | | | |
Year ended 12/31/12 | | | 11.85 | | | | (0.06 | )(g) | | | 1.62 | | | | 1.56 | | | | (0.58 | ) | | | 12.83 | | | | 13.30 | | | | 80,486 | | | | 1.59 | (d) | | | 1.59 | (d) | | | (0.46 | )(d)(g) | | | 39 | |
Year ended 12/31/11 | | | 11.94 | | | | (0.10 | ) | | | 0.01 | | | | (0.09 | ) | | | — | | | | 11.85 | | | | (0.75 | ) | | | 77,904 | | | | 1.60 | | | | 1.60 | | | | (0.84 | ) | | | 42 | |
Year ended 12/31/10 | | | 9.30 | | | | (0.07 | ) | | | 2.71 | | | | 2.64 | | | | — | | | | 11.94 | | | | 28.39 | | | | 76,136 | | | | 1.63 | | | | 1.63 | | | | (0.66 | ) | | | 36 | |
Year ended 12/31/09 | | | 7.75 | | | | (0.05 | ) | | | 1.60 | | | | 1.55 | | | | — | | | | 9.30 | | | | 20.00 | | | | 54,795 | | | | 1.77 | | | | 1.77 | | | | (0.66 | ) | | | 40 | |
Year ended 12/31/08 | | | 11.51 | | | | (0.04 | ) | | | (3.60 | ) | | | (3.64 | ) | | | (0.12 | ) | | | 7.75 | | | | (31.59 | ) | | | 23,879 | | | | 1.66 | | | | 1.66 | | | | (0.44 | ) | | | 51 | |
Class Y | | | | | | | | | | | | | | | | | | | | | | | | | | | | | | | | | | | | | | | | | | | | | | | | |
Year ended 12/31/12 | | | 12.30 | | | | 0.01 | (g) | | | 1.67 | | | | 1.68 | | | | (0.58 | ) | | | 13.40 | | | | 13.79 | | | | 107,440 | | | | 1.09 | (d) | | | 1.09 | (d) | | | 0.04 | (d)(g) | | | 39 | |
Year ended 12/31/11 | | | 12.32 | | | | (0.04 | ) | | | 0.02 | | | | (0.02 | ) | | | — | | | | 12.30 | | | | (0.16 | ) | | | 60,049 | | | | 1.10 | | | | 1.10 | | | | (0.34 | ) | | | 42 | |
Year ended 12/31/10 | | | 9.56 | | | | (0.02 | ) | | | 2.78 | | | | 2.76 | | | | — | | | | 12.32 | | | | 28.87 | | | | 25,875 | | | | 1.13 | | | | 1.13 | | | | (0.16 | ) | | | 36 | |
Year ended 12/31/09 | | | 7.91 | | | | (0.01 | ) | | | 1.66 | | | | 1.65 | | | | — | | | | 9.56 | | | | 20.86 | | | | 11,957 | | | | 1.27 | | | | 1.27 | | | | (0.16 | ) | | | 40 | |
Year ended 12/31/08(e) | | | 9.62 | | | | (0.00 | ) | | | (1.59 | ) | | | (1.59 | ) | | | (0.12 | ) | | | 7.91 | | | | (16.48 | ) | | | 3,534 | | | | 1.29 | (f) | | | 1.30 | (f) | | | (0.07 | )(f) | | | 51 | |
Class R5 | | | | | | | | | | | | | | | | | | | | | | | | | | | | | | | | | | | | | | | | | | | | | | | | |
Year ended 12/31/12 | | | 12.72 | | | | 0.03 | (g) | | | 1.74 | | | | 1.77 | | | | (0.58 | ) | | | 13.91 | | | | 14.04 | | | | 140,110 | | | | 0.88 | (d) | | | 0.88 | (d) | | | 0.25 | (d)(g) | | | 39 | |
Year ended 12/31/11 | | | 12.71 | | | | (0.01 | ) | | | 0.02 | | | | 0.01 | | | | — | | | | 12.72 | | | | 0.08 | | | | 169,600 | | | | 0.85 | | | | 0.85 | | | | (0.09 | ) | | | 42 | |
Year ended 12/31/10 | | | 9.83 | | | | 0.01 | | | | 2.87 | | | | 2.88 | | | | — | | | | 12.71 | | | | 29.30 | | | | 121,641 | | | | 0.89 | | | | 0.89 | | | | 0.08 | | | | 36 | |
Year ended 12/31/09 | | | 8.12 | | | | 0.02 | | | | 1.69 | | | | 1.71 | | | | — | | | | 9.83 | | | | 21.06 | | | | 38,971 | | | | 0.90 | | | | 0.90 | | | | 0.21 | | | | 40 | |
Year ended 12/31/08 | | | 11.96 | | | | 0.04 | | | | (3.76 | ) | | | (3.72 | ) | | | (0.12 | ) | | | 8.12 | | | | (31.07 | ) | | | 23,957 | | | | 0.84 | | | | 0.84 | | | | 0.37 | | | | 51 | |
Class R6 | | | | | | | | | | | | | | | | | | | | | | | | | | | | | | | | | | | | | | | | | | | | | | | | |
Year ended 12/31/12(e) | | | 14.30 | | | | 0.01 | (g) | | | 0.19 | | | | 0.20 | | | | (0.58 | ) | | | 13.92 | | | | 1.51 | | | | 70,677 | | | | 0.81 | (d)(f) | | | 0.81 | (d)(f) | | | 0.32 | (d)(f)(g) | | | 39 | |
| (a) | Calculated using average shares outstanding. |
| (b) | Includes adjustments in accordance with accounting principles generally accepted in the United States of America and as such, the net asset value for financial reporting purposes and the returns based upon those net asset values may differ from the net asset value and returns for shareholder transactions. Does not include sales charges and is not annualized for periods less than one year, if applicable. |
| (c) | Portfolio turnover is calculated at the fund level and is not annualized for periods less than one year, if applicable. |
| (d) | Ratios are based on average daily net assets (000’s) of $392,090, $15,161, $49,902, $82,482, $81,027, $169,994 and $62,292 for Class A, Class B, Class C, Class R, Class Y, Class R5 and Class R6 shares, respectively. |
| (e) | Commencement date of October 3, 2008 and September 24, 2012 for Class Y and Class R6 shares, respectively. |
| (g) | Net investment income (loss) per share and the ratio of net investment income (loss) to average net assets includes special cash dividends received during the period. Net investment income (loss) per share and the ratio of net investment income (loss) to average net assets excluding the special dividends are $(0.06) and (0.44)%, $(0.14) and (1.19)%, $(0.14) and (1.19)%, $(0.09) and (0.69)%, $(0.03) and (0.19)%, $0.00 and 0.02% and $0.00 and 0.09% for Class A, Class B, Class C, Class R, Class Y, Class R5 and Class R6 shares, respectively. |
21 Invesco Small Cap Equity Fund
Report of Independent Registered Public Accounting Firm
To the Board of Trustees of AIM Funds Group (Invesco Funds Group)
and Shareholders of Invesco Small Cap Equity Fund:
In our opinion, the accompanying statement of assets and liabilities, including the schedule of investments, and the related statements of operations and of changes in net assets and the financial highlights present fairly, in all material respects, the financial position of Invesco Small Cap Equity Fund (one of the funds constituting AIM Funds Group (Invesco Funds Group), hereafter referred to as the “Fund”) at December 31, 2012, the results of its operations for the year then ended, the changes in its net assets for each of the two years in the period then ended and the financial highlights for each of the five years in the period then ended, in conformity with accounting principles generally accepted in the United States of America. These financial statements and financial highlights (hereafter referred to as “financial statements”) are the responsibility of the Fund’s management; our responsibility is to express an opinion on these financial statements based on our audits. We conducted our audits of these financial statements in accordance with the standards of the Public Company Accounting Oversight Board (United States). Those standards require that we plan and perform the audit to obtain reasonable assurance about whether the financial statements are free of material misstatement. An audit includes examining, on a test basis, evidence supporting the amounts and disclosures in the financial statements, assessing the accounting principles used and significant estimates made by management, and evaluating the overall financial statement presentation. We believe that our audits, which included confirmation of securities at December 31, 2012 by correspondence with the custodian and brokers, provide a reasonable basis for our opinion.
PRICEWATERHOUSECOOPERS LLP
February 25, 2013
Houston, Texas
22 Invesco Small Cap Equity Fund
Calculating your ongoing Fund expenses
Example
As a shareholder of the Fund, you incur two types of costs: (1) transaction costs, which may include sales charges (loads) on purchase payments or contingent deferred sales charges on redemptions, and redemption fees, if any; and (2) ongoing costs, including management fees, distribution and/or service (12b-1) fees, and other Fund expenses. This example is intended to help you understand your ongoing costs (in dollars) of investing in the Fund and to compare these costs with ongoing costs of investing in other mutual funds. With the exception of the actual ending account value and expenses of the Class R6 shares, the example is based on an investment of $1,000 invested at the beginning of the period and held for the entire period July 1, 2012 through December 31, 2012. The actual ending account value and expenses of the Class R6 shares in the example below are based on an investment of $1,000 invested as of close of business September 24, 2012 (commencement date) and held through December 31, 2012.
Actual expenses
The table below provides information about actual account values and actual expenses. You may use the information in this table, together with the amount you invested, to estimate the expenses that you paid over the period. Simply divide your account value by $1,000 (for example, an $8,600 account value divided by $1,000 = 8.6), then multiply the result by the number in the table under the heading entitled “Actual Expenses Paid During Period” to estimate the expenses you paid on your account during this period (as of close of business September 24, 2012 through December 31, 2012 for the Class R6 shares). Because the actual ending account value and expense information in the example is not based upon a six month period for the Class R6 shares, the ending account value and expense information may not provide a meaningful comparison to mutual funds that provide such information for a full six month period.
Hypothetical example for comparison purposes
The table below also provides information about hypothetical account values and hypothetical expenses based on the Fund’s actual expense ratio and an assumed rate of return of 5% per year before expenses, which is not the Fund’s actual return.
The hypothetical account values and expenses may not be used to estimate the actual ending account balance or expenses you paid for the period. You may use this information to compare the ongoing costs of investing in the Fund and other funds. To do so, compare this 5% hypothetical example with the 5% hypothetical examples that appear in the shareholder reports of the other funds.
Please note that the expenses shown in the table are meant to highlight your ongoing costs only and do not reflect any transaction costs, such as sales charges (loads) on purchase payments, contingent deferred sales charges on redemptions, and redemption fees, if any. Therefore, the hypothetical information is useful in comparing ongoing costs only, and will not help you determine the relative total costs of owning different funds. In addition, if these transaction costs were included, your costs would have been higher.
| | | | | | | | | | | | | | | | | | | | | | | | |
| Class | | Beginning
Account Value
(07/01/12) | | | ACTUAL | | | HYPOTHETICAL (5% annual return before
expenses) | | | Annualized
Expense
Ratio | |
| | | Ending
Account Value
(12/31/12)1 | | | Expenses
Paid During
Period2 | | | Ending
Account Value
(12/31/12) | | | Expenses
Paid During
Period3 | | |
A | | $ | 1,000.00 | | | $ | 1,087.70 | | | $ | 7.08 | | | $ | 1,018.35 | | | $ | 6.85 | | �� | | 1.35 | % |
B | | | 1,000.00 | | | | 1,083.50 | | | | 11.00 | | | | 1,014.58 | | | | 10.63 | | | | 2.10 | |
C | | | 1,000.00 | | | | 1,083.50 | | | | 11.00 | | | | 1,014.58 | | | | 10.63 | | | | 2.10 | |
R | | | 1,000.00 | | | | 1,086.20 | | | | 8.39 | | | | 1,017.09 | | | | 8.11 | | | | 1.60 | |
Y | | | 1,000.00 | | | | 1,088.30 | | | | 5.77 | | | | 1,019.61 | | | | 5.58 | | | | 0.80 | |
R5 | | | 1,000.00 | | | | 1,089.90 | | | | 4.78 | | | | 1,020.56 | | | | 4.62 | | | | 0.91 | |
R6 | | | 1,000.00 | | | | 1,015.10 | | | | 2.21 | | | | 1,021.06 | | | | 4.12 | | | | 0.81 | |
| 1 | The actual ending account value is based on the actual total return of the Fund for the period July 1, 2012 through December 31, 2012 (as of close of business September 24, 2012 through December 31, 2012 for the Class R6 shares), after actual expenses and will differ from the hypothetical ending account value which is based on the Fund’s expense ratio and a hypothetical annual return of 5% before expenses. |
| 2 | Actual expenses are equal to the annualized expense ratio as indicated above multiplied by the average account value over the period, multiplied by 184/366 to reflect the most recent fiscal half year. For Class R6 shares actual expenses are equal to the annualized expense ratio indicated above multiplied by the average account value over the period, multiplied by 99 (as of close of business September 24, 2012 through December 31, 2012)/366. Because the Class R6 shares have not been in existence for a full six month period, the actual ending |
| | account value and expense information shown may not provide a meaningful comparison to fund expense information of classes that show such data for a full six month period and, because the actual ending account value and expense information in the expense example covers a short time period, return and expense data may not be indicative of return and expense data for longer time periods. |
| 3 | Hypothetical expenses are equal to the annualized expense ratio indicated above multiplied by the average account value over the period, multiplied by 184/366 to reflect the most recent fiscal half year. The hypothetical ending account value and expenses may be used to compare ongoing costs of investing in the Class R6 shares of the Fund and other funds because such data is based on a full six-month period. |
23 Invesco Small Cap Equity Fund
Tax Information
Form 1099-DIV, Form 1042-S and other year–end tax information provide shareholders with actual calendar year amounts that should be included in their tax returns. Shareholders should consult their tax advisors.
The following distribution information is being provided as required by the Internal Revenue Code or to meet a specific state’s requirement.
The Fund designates the following amounts or, if subsequently determined to be different, the maximum amount allowable for its fiscal year ended December 31, 2012:
| | | | |
Federal and State Income Tax | |
Long-Term Capital Gain Distributions | | $ | 36,006,327 | |
Qualified Dividend Income* | | | 0 | % |
Corporate Dividends Received Deduction* | | | 0 | % |
| | * | The above percentages are based on ordinary income dividends paid to shareholders during the Fund’s fiscal year. |
24 Invesco Small Cap Equity Fund
Trustees and Officers
The address of each trustee and officer is AIM Funds Group (Invesco Funds Group) (the “Trust”), 11 Greenway Plaza, Suite 1000, Houston, Texas 77046-1173. The trustees serve for the life of the Trust, subject to their earlier death, incapacitation, resignation, retirement or removal as more specifically provided in the Trust’s organizational documents. Each officer serves for a one year term or until their successors are elected and qualified. Column two below includes length of time served with predecessor entities, if any.
| | | | | | | | |
Name, Year of Birth and
Position(s) Held with the Trust | | Trustee and/
or Officer Since | | Principal Occupation(s)
During Past 5 Years | | Number of
Funds in Fund
Complex
Overseen by
Trustee | | Other Directorship(s)
Held by Trustee During
Past 5 Years |
| Interested Persons | | | | | | | | |
| Martin L. Flanagan1 — 1960 Trustee | | 2007 | | Executive Director, Chief Executive Officer and President, Invesco Ltd. (ultimate parent of Invesco and a global investment management firm); Advisor to the Board, Invesco Advisers, Inc. (formerly known as Invesco Institutional (N.A.), Inc.); Trustee, The Invesco Funds; Vice Chair, Investment Company Institute; and Member of Executive Board, SMU Cox School of Business Formerly: Chairman and Chief Executive Officer, Invesco Advisers, Inc. (registered investment adviser); Director, Chairman, Chief Executive Officer and President, IVZ Inc. (holding company), INVESCO Group Services, Inc. (service provider) and Invesco North American Holdings, Inc. (holding company); Director, Chief Executive Officer and President, Invesco Holding Company Limited (parent of Invesco and a global investment management firm); Director, Invesco Ltd.; Chairman, Investment Company Institute and President, Co-Chief Executive Officer, Co-President, Chief Operating Officer and Chief Financial Officer, Franklin Resources, Inc. (global investment management organization) | | 124 | | None |
| Philip A. Taylor2 — 1954 Trustee, President and Principal Executive Officer | | 2006 | | Head of North American Retail and Senior Managing Director, Invesco Ltd.; Director, Co-Chairman, Co-President and Co-Chief Executive Officer, Invesco Advisers, Inc. (formerly known as Invesco Institutional (N.A.), Inc.) (registered investment adviser); Director, Chairman, Chief Executive Officer and President, Invesco Management Group, Inc. (formerly known as Invesco Aim Management Group, Inc.) (financial services holding company); Director and President, INVESCO Funds Group, Inc. (registered investment adviser and registered transfer agent); Director and Chairman, Invesco Investment Services, Inc. (formerly known as Invesco Aim Investment Services, Inc.) (registered transfer agent) and IVZ Distributors, Inc. (formerly known as INVESCO Distributors, Inc.) (registered broker dealer); Director, President and Chairman, Invesco Inc. (holding company) and Invesco Canada Holdings Inc. (holding company); Chief Executive Officer, Invesco Corporate Class Inc. (corporate mutual fund company) and Invesco Canada Fund Inc. (corporate mutual fund company); Director, Chairman and Chief Executive Officer, Invesco Canada Ltd. (formerly known as Invesco Trimark Ltd./Invesco Trimark Ltèe) (registered investment adviser and registered transfer agent); Trustee, President and Principal Executive Officer, The Invesco Funds (other than AIM Treasurer’s Series Trust (Invesco Treasurer’s Series Trust) and Short-Term Investments Trust); Trustee and Executive Vice President, The Invesco Funds (AIM Treasurer’s Series Trust (Invesco Treasurer’s Series Trust) and Short-Term Investments Trust only); Director, Invesco Investment Advisers LLC (formerly known as Van Kampen Asset Management); Director, Chief Executive Officer and President, Van Kampen Exchange Corp. Formerly: Director and Chairman, Van Kampen Investor Services Inc.: Director, Chief Executive Officer and President, 1371 Preferred Inc. (holding company); and Van Kampen Investments Inc.; Director and President, AIM GP Canada Inc. (general partner for limited partnerships); and Van Kampen Advisors, Inc.; Director and Chief Executive Officer, Invesco Trimark Dealer Inc. (registered broker dealer); Director, Invesco Distributors, Inc. (formerly known as Invesco Aim Distributors, Inc.) (registered broker dealer); Manager, Invesco PowerShares Capital Management LLC; Director, Chief Executive Officer and President, Invesco Advisers, Inc.; Director, Chairman, Chief Executive Officer and President, Invesco Aim Capital Management, Inc.; President, Invesco Trimark Dealer Inc. and Invesco Trimark Ltd./Invesco Trimark Ltèe; Director and President, AIM Trimark Corporate Class Inc. and AIM Trimark Canada Fund Inc.; Senior Managing Director, Invesco Holding Company Limited; Trustee and Executive Vice President, Tax-Free Investments Trust; Director and Chairman, Fund Management Company (former registered broker dealer); President and Principal Executive Officer, The Invesco Funds (AIM Treasurer’s Series Trust (Invesco Treasurer’s Series Trust), Short-Term Investments Trust and Tax-Free Investments Trust only); President, AIM Trimark Global Fund Inc. and AIM Trimark Canada Fund Inc. | | 124 | | None |
Wayne W. Whalen3 — 1939 Trustee | | 2010 | | Of Counsel, and prior to 2010, partner in the law firm of Skadden, Arps, Slate, Meagher & Flom LLP, legal counsel to certain funds in the Fund Complex | | 137 | | Director of the Mutual Fund Directors Forum, a nonprofit membership organization for investment directors; Chairman and Director of the Abraham Lincoln Presidential Library Foundation; and Director of the Stevenson Center for Democracy |
| 1 | Mr. Flanagan is considered an interested person of the Trust because he is an officer of the adviser to the Trust, and an officer and a director of Invesco Ltd., ultimate parent of the adviser to the Trust. |
| 2 | Mr. Taylor is considered an interested person of the Trust because he is an officer and a director of the adviser to, and a director of the principal underwriter of, the Trust. |
| 3 | Mr. Whalen is considered an “interested person” (within the meaning of Section 2(a)(19) of the 1940 Act) of certain Funds in the Invesco Fund Complex by reason of he and his firm currently providing legal services as legal counsel to such Funds in the Invesco Fund Complex. |
T-1 Invesco Small Cap Equity Fund
Trustees and Officers—(continued)
| | | | | | | | |
Name, Year of Birth and
Position(s) Held with the Trust | | Trustee and/
or Officer Since | | Principal Occupation(s)
During Past 5 Years | | Number of
Funds in Fund
Complex
Overseen by
Trustee | | Other Directorship(s)
Held by Trustee During
Past 5 Years |
| Independent Trustees | | | | | | | | |
Bruce L. Crockett — 1944 Trustee and Chair | | 1987 | | Chairman, Crockett Technologies Associates (technology consulting company) Formerly: Director, Captaris (unified messaging provider); Director, President and Chief Executive Officer COMSAT Corporation; and Chairman, Board of Governors of INTELSAT (international communications company) | | 124 | | ACE Limited (insurance company); and Investment Company Institute |
David C. Arch — 1945 Trustee | | 2010 | | Chairman and Chief Executive Officer of Blistex Inc., (consumer health care products manufacturer) Formerly: Member of the Heartland Alliance Advisory Board, a nonprofit organization serving human needs based in Chicago | | 137 | | Board member of the Illinois Manufacturers’ Association; Member of the Board of Visitors, Institute for the Humanities, University of Michigan |
Frank S. Bayley — 1939 Trustee | | 2001 | | Retired Formerly: Director, Badgley Funds, Inc. (registered investment company) (2 portfolios) and General Partner and Of Counsel, law firm of Baker & McKenzie, LLP | | 124 | | Director and Chairman, C.D. Stimson Company (a real estate investment company); Trustee and Overseer, The Curtis institute of Music |
James T. Bunch — 1942 Trustee | | 2003 | | Managing Member, Grumman Hill Group LLC (family office private equity management) Formerly: Founder, Green, Manning & Bunch Ltd. (investment banking firm)(1988-2010); Executive Committee, United States Golf Association; and Director, Policy Studies, Inc. and Van Gilder Insurance Corporation | | 124 | | Chairman, Board of Governors, Western Golf Association; Chairman-elect, Evans Scholars Foundation; and Director, Denver Film Society |
Rodney F. Dammeyer — 1940 Trustee | | 2010 | | Chairman of CAC, LLC, (private company offering capital investment and management advisory services) Formerly: Prior to 2001, Managing Partner at Equity Group Corporate Investments; Prior to 1995, Vice Chairman of Anixter International; Prior to 1985, experience includes Senior Vice President and Chief Financial Officer of Household International, Inc., Executive Vice President and Chief Financial Officer of Northwest Industries, Inc. and Partner of Arthur Andersen & Co.; From 1987 to 2010, Director/Trustee of investment companies in the Van Kampen Funds complex | | 126 | | Director of Quidel Corporation and Stericycle, Inc.; Prior to May 2008, Trustee of The Scripps Research Institute; Prior to February 2008, Director of Ventana Medical Systems, Inc.; Prior to April 2007, Director of GATX Corporation; Prior to April 2004, Director of TheraSense, Inc. |
Albert R. Dowden — 1941 Trustee | | 2000 | | Director of a number of public and private business corporations, including the Boss Group, Ltd. (private investment and management); Reich & Tang Funds (5 portfolios) (registered investment company); and Homeowners of America Holding Corporation/ Homeowners of America Insurance Company (property casualty company) Formerly: Director, Continental Energy Services, LLC (oil and gas pipeline service); Director, CompuDyne Corporation (provider of product and services to the public security market) and Director, Annuity and Life Re (Holdings), Ltd. (reinsurance company); Director, President and Chief Executive Officer, Volvo Group North America, Inc.; Senior Vice President, AB Volvo; Director of various public and private corporations; Chairman, DHJ Media, Inc.; Director Magellan Insurance Company; and Director, The Hertz Corporation, Genmar Corporation (boat manufacturer), National Media Corporation; Advisory Board of Rotary Power International (designer, manufacturer, and seller of rotary power engines); and Chairman, Cortland Trust, Inc. (registered investment company) | | 124 | | Director of Nature’s Sunshine Products, Inc. |
Jack M. Fields — 1952 Trustee | | 1997 | | Chief Executive Officer, Twenty First Century Group, Inc. (government affairs company); Owner and Chief Executive Officer, Dos Angeles Ranch, L.P. (cattle, hunting, corporate entertainment); and Discovery Global Education Fund (non-profit) Formerly: Chief Executive Officer, Texana Timber LP (sustainable forestry company); Director of Cross Timbers Quail Research Ranch (non-profit); and member of the U.S. House of Representatives | | 124 | | Insperity, Inc. (formerly known as Administaff) |
Prema Mathai-Davis — 1950 Trustee | | 1998 | | Retired Formerly: Chief Executive Officer, YWCA of the U.S.A. | | 124 | | None |
Larry Soll — 1942 Trustee | | 2003 | | Retired Formerly: Chairman, Chief Executive Officer and President, Synergen Corp. (a biotechnology company) | | 124 | | None |
Hugo F. Sonnenschein — 1940 Trustee | | 2010 | | Distinguished Service Professor and President Emeritus of the University of Chicago and the Adam Smith Distinguished Service Professor in the Department of Economics at the University of Chicago Formerly: President of the University of Chicago | | 137 | | Trustee of the University of Rochester and a member of its investment committee. Member of the National Academy of Sciences, the American Philosophical Society and a fellow of the American Academy of Arts and Sciences |
T-2 Invesco Small Cap Equity Fund
Trustees and Officers—(continued)
| | | | | | | | |
Name, Year of Birth and
Position(s) Held with the Trust | | Trustee and/
or Officer Since | | Principal Occupation(s)
During Past 5 Years | | Number of
Funds in Fund
Complex
Overseen by
Trustee | | Other Directorship(s)
Held by Trustee During
Past 5 Years |
| Independent Trustees—(continued) |
Raymond Stickel, Jr. — 1944 Trustee | | 2005 | | Retired Formerly: Director, Mainstay VP Series Funds, Inc. (25 portfolios) and Partner, Deloitte & Touche | | 124 | | None |
| Other Officers | | | | | | | | |
Russell C. Burk — 1958
Senior Vice President and Senior Officer | | 2005 | | Senior Vice President and Senior Officer, The Invesco Funds | | N/A | | N/A |
John M. Zerr — 1962
Senior Vice President, Chief Legal Officer and Secretary | | 2006 | | Director, Senior Vice President, Secretary and General Counsel, Invesco Management Group, Inc. (formerly known as Invesco Aim Management Group, Inc.) and Van Kampen Exchange Corp.; Senior Vice President, Invesco Advisers, Inc. (formerly known as Invesco Institutional (N.A.), Inc.) (registered investment adviser); Senior Vice President and Secretary, Invesco Distributors, Inc. (formerly known as Invesco Aim Distributors, Inc.); Director, Vice President and Secretary, Invesco Investment Services, Inc. (formerly known as Invesco Aim Investment Services, Inc.) and IVZ Distributors, Inc. (formerly known as INVESCO Distributors, Inc.); Director and Vice President, INVESCO Funds Group, Inc.; Senior Vice President, Chief Legal Officer and Secretary, The Invesco Funds; Manager, Invesco PowerShares Capital Management LLC; Director, Secretary and General Counsel, Invesco Investment Advisers LLC (formerly known as Van Kampen Asset Management); Secretary and General Counsel, Van Kampen Funds Inc. and Chief Legal Officer, PowerShares Exchange-Traded Fund Trust, PowerShares Exchange-Traded Fund Trust II, PowerShares India Exchange-Traded Fund Trust and PowerShares Actively Managed Exchange-Traded Fund Trust Formerly: Director and Vice President, Van Kampen Advisors Inc.; Director, Vice President, Secretary and General Counsel Van Kampen Investor Services Inc.; Director, Invesco Distributors, Inc. (formerly known as Invesco Aim Distributors, Inc.); Director, Senior Vice President, General Counsel and Secretary, Invesco Advisers, Inc. and Van Kampen Investments Inc.; Director, Vice President and Secretary, Fund Management Company; Director, Senior Vice President, Secretary, General Counsel and Vice President, Invesco Aim Capital Management, Inc.; Chief Operating Officer and General Counsel, Liberty Ridge Capital, Inc. (an investment adviser); Vice President and Secretary, PBHG Funds (an investment company) and PBHG Insurance Series Fund (an investment company); Chief Operating Officer, General Counsel and Secretary, Old Mutual Investment Partners (a broker-dealer); General Counsel and Secretary, Old Mutual Fund Services (an administrator) and Old Mutual Shareholder Services (a shareholder servicing center); Executive Vice President, General Counsel and Secretary, Old Mutual Capital, Inc. (an investment adviser); and Vice President and Secretary, Old Mutual Advisors Funds (an investment company) | | N/A | | N/A |
Karen Dunn Kelley — 1960
Vice President | | 1992 | | Head of Invesco’s World Wide Fixed Income and Cash Management Group; Senior Vice President, Invesco Management Group, Inc. (formerly known as Invesco Aim Management Group, Inc.) and Invesco Advisers, Inc. (formerly known as Invesco Institutional (N.A.), Inc.) (registered investment adviser); Executive Vice President, Invesco Distributors, Inc. (formerly known as Invesco Aim Distributors, Inc.); Director, Invesco Mortgage Capital Inc., INVESCO Global Asset Management Limited, Invesco Management Company Limited and INVESCO Management S.A.; Vice President, The Invesco Funds (other than AIM Treasurer’s Series Trust (Invesco Treasurer’s Series Trust) and Short-Term Investments Trust); and President and Principal Executive Officer, The Invesco Funds (AIM Treasurer’s Series Trust (Invesco Treasurer’s Series Trust) and Short-Term Investments Trust only) Formerly: Senior Vice President, Van Kampen Investments Inc.; Vice President, Invesco Advisers, Inc. (formerly known as Invesco Institutional (N.A.), Inc.); Director of Cash Management and Senior Vice President, Invesco Advisers, Inc. and Invesco Aim Capital Management, Inc.; President and Principal Executive Officer, Tax-Free Investments Trust; Director and President, Fund Management Company; Chief Cash Management Officer, Director of Cash Management, Senior Vice President, and Managing Director, Invesco Aim Capital Management, Inc.; Director of Cash Management, Senior Vice President, and Vice President, Invesco Advisers, Inc. and The Invesco Funds (AIM Treasurer’s Series Trust (Invesco Treasurer’s Series Trust), Short-Term Investments Trust and Tax-Free Investments Trust only) | | N/A | | N/A |
T-3 Invesco Small Cap Equity Fund
Trustees and Officers—(continued)
| | | | | | | | |
Name, Year of Birth and
Position(s) Held with the Trust | | Trustee and/
or Officer Since | | Principal Occupation(s)
During Past 5 Years | | Number of
Funds in Fund
Complex
Overseen by
Trustee | | Other Directorship(s)
Held by Trustee During
Past 5 Years |
| Other Officers—(continued) | | | | | | | | |
Sheri Morris — 1964
Vice President, Treasurer and Principal Financial Officer | | 1999 | | Vice President, Treasurer and Principal Financial Officer, The Invesco Funds; Vice President, Invesco Advisers, Inc. (formerly known as Invesco Institutional (N.A.), Inc.) (registered investment adviser); and Vice President, PowerShares Exchange-Traded Fund Trust, PowerShares Exchange-Traded Fund Trust II, PowerShares India Exchange-Traded Fund Trust and PowerShares Actively Managed Exchange-Traded Fund Trust Formerly: Vice President, Invesco Aim Advisers, Inc., Invesco Aim Capital Management, Inc. and Invesco Aim Private Asset Management, Inc.; Assistant Vice President and Assistant Treasurer, The Invesco Funds and Assistant Vice President, Invesco Advisers, Inc., Invesco Aim Capital Management, Inc. and Invesco Aim Private Asset Management, Inc.; and Treasurer, PowerShares Exchange-Traded Fund Trust, PowerShares Exchange-Traded Fund Trust II, PowerShares India Exchange-Traded Fund Trust and PowerShares Actively Managed Exchange-Traded Fund Trust | | N/A | | N/A |
Yinka Akinsola — 1977 Anti-Money Laundering Compliance Officer | | 2011 | | Anti-Money Laundering Compliance Officer, Invesco Advisers, Inc. (formerly known as Invesco Institutional (N.A.), Inc.) (registered investment adviser); Invesco Distributors, Inc. (formerly known as Invesco Aim Distributors, Inc.), Invesco Investment Services, Inc. (formerly known as Invesco Aim Investment Services, Inc.), Invesco Management Group, Inc., The Invesco Funds, Invesco Van Kampen Closed-End Funds, Van Kampen Exchange Corp., Van Kampen Funds Inc., PowerShares Exchange-Traded Fund Trust, PowerShares Exchange-Traded Fund Trust II, PowerShares India Exchange-Traded Fund Trust, and PowerShares Actively Managed Exchange-Traded Fund Trust Formerly: Regulatory Analyst III, Financial Industry Regulatory Authority (FINRA) | | N/A | | N/A |
Todd L. Spillane — 1958
Chief Compliance Officer | | 2006 | | Senior Vice President, Invesco Management Group, Inc. (formerly known as Invesco Aim Management Group, Inc.) and Van Kampen Exchange Corp.; Senior Vice President and Chief Compliance Officer, Invesco Advisers, Inc. (registered investment adviser) (formerly known as Invesco Institutional (N.A.), Inc.); Chief Compliance Officer, The Invesco Funds; Vice President, Invesco Distributors, Inc. (formerly known as Invesco Aim Distributors, Inc.) and Invesco Investment Services, Inc. (formerly known as Invesco Aim Investment Services, Inc.) Formerly: Chief Compliance Officer, Invesco Van Kampen Closed-End Funds; Senior Vice President, Van Kampen Investments Inc.; Senior Vice President and Chief Compliance Officer, Invesco Aim Advisers, Inc. and Invesco Aim Capital Management, Inc.; Chief Compliance Officer, INVESCO Private Capital Investments, Inc. (holding company), Invesco Private Capital, Inc. (registered investment adviser), Invesco Global Asset Management (N.A.), Inc., Invesco Senior Secured Management, Inc. (registered investment adviser), Van Kampen Investor Services Inc., PowerShares Exchange-Traded Fund Trust, PowerShares Exchange-Traded Fund Trust II, PowerShares India Exchange-Traded Fund Trust and PowerShares Actively Managed Exchange-Traded Fund Trust; and Vice President, Invesco Aim Capital Management, Inc. and Fund Management Company | | N/A | | N/A |
The Statement of Additional Information of the Trust includes additional information about the Fund’s Trustees and is available upon request, without charge, by calling 1.800.959.4246. Please refer to the Fund’s prospectus for information on the Fund’s sub-advisers.
| | | | | | |
Office of the Fund 11 Greenway Plaza, Suite 1000 Houston, TX 77046-1173 | | Investment Adviser Invesco Advisers, Inc. 1555 Peachtree Street, N.E.
Atlanta, GA 30309 | | Distributor Invesco Distributors, Inc. 11 Greenway Plaza, Suite 1000 Houston, TX 77046-1173 | | Auditors PricewaterhouseCoopers LLP 1201 Louisiana Street, Suite 2900 Houston, TX 77002-5678 |
| | | |
| | | | | | |
Counsel to the Fund Stradley Ronon Stevens & Young, LLP 2005 Market Street, Suite 2600 Philadelphia, PA 19103-7018 | | Counsel to the Independent Trustees Goodwin Procter LLP
901 New York Avenue, N.W.
Washington, D.C. 20001 | | Transfer Agent Invesco Investment Services, Inc. 11 Greenway Plaza, Suite 1000 Houston, TX 77046-1173 | | Custodian State Street Bank and Trust Company 225 Franklin Street
Boston, MA 02110-2801 |
T-4 Invesco Small Cap Equity Fund

Invesco mailing information
Send general correspondence to Invesco Investment Services, Inc., P.O. Box 219078, Kansas City, MO 64121-9078.
Invesco privacy policy
You share personal and financial information with us that is necessary for your transactions and your account records. We take very seriously the obligation to keep that information confidential and private.
Invesco collects nonpublic personal information about you from account applications or other forms you complete and from your transactions with us or our affiliates. We do not disclose information about you or our former customers to service providers or other third parties except to the extent necessary to service your account and in other limited circumstances as permitted by law. For example, we use this information to facilitate the delivery of transaction confirmations, financial reports, prospectuses and tax forms.
Even within Invesco, only people involved in the servicing of your accounts and compliance monitoring have access to your information. To ensure the highest level of confidentiality and security, Invesco maintains physical, electronic and procedural safeguards that meet or exceed federal standards. Special measures, such as data encryption and authentication, apply to your communications with us on our website. More detail is available to you at invesco.com/privacy.
Important notice regarding delivery of security holder documents
To reduce Fund expenses, only one copy of most shareholder documents may be mailed to shareholders with multiple accounts at the same address (Householding). Mailing of your shareholder documents may be householded indefinitely unless you instruct us otherwise. If you do not want the mailing of these documents to be combined with those for other members of your household, please contact Invesco Investment Services, Inc. at 800 959 4246 or contact your financial institution. We will begin sending you individual copies for each account within 30 days after receiving your request.
Fund holdings and proxy voting information
The Fund provides a complete list of its holdings four times in each fiscal year, at the quarter-ends. For the second and fourth quarters, the lists appear in the Fund’s semiannual and annual reports to shareholders. For the first and third quarters, the Fund files the lists with the Securities and Exchange Commission (SEC) on Form N-Q. The most recent list of portfolio holdings is available at invesco.com/completeqtrholdings. Shareholders can also look up the Fund’s Forms N-Q on the SEC website at sec.gov. Copies of the Fund’s Forms N-Q may be reviewed and copied at the SEC Public Reference Room in Washington, D.C. You can obtain information on the operation of the Public Reference Room, including information about duplicating fee charges, by calling 202 551 8090 or 800 732 0330, or by electronic request at the following email address: publicinfo@sec.gov. The SEC file numbers for the Fund are shown below.
A description of the policies and procedures that the Fund uses to determine how to vote proxies relating to portfolio securities is available without charge, upon request, from our Client Services department at 800 959 4246 or at invesco.com/proxyguidelines. The information is also available on the SEC website, sec.gov.
| | |
Information regarding how the Fund voted proxies related to its portfolio securities during the 12 months ended June 30, 2012, is available at invesco.com/proxysearch. The information is also available on the SEC website, sec.gov. Invesco Advisers, Inc. is an investment adviser; it provides investment advisory services to individual and institutional clients and does not sell securities. Invesco Distributors, Inc. is the US distributor for Invesco Ltd.’s retail mutual funds, exchange-traded funds and institutional money market funds. Both are wholly owned, indirect subsidiaries of Invesco Ltd. | |  |
| |
| SEC file numbers: 811-01540 and 002-27334 SCE-AR-1 Invesco Distributors, Inc. | | |
As of the end of the period covered by this report, the Registrant had adopted a code of ethics (the “Code”) that applies to the Registrant’s principal executive officer (“PEO”) and principal financial officer (“PFO”). There were no amendments to the Code during the period covered by the report. The Registrant did not grant any waivers, including implicit waivers, from any provisions of the Code to the PEO or PFO during the period covered by this report.
| ITEM 3. | AUDIT COMMITTEE FINANCIAL EXPERT. |
The Board of Trustees has determined that the Registrant has at least one audit committee financial expert serving on its Audit Committee. The Audit Committee financial expert is Raymond Stickel, Jr. Mr. Stickel is “independent” within the meaning of that term as used in Form N-CSR.
| ITEM 4. | PRINCIPAL ACCOUNTANT FEES AND SERVICES. |
Fees Billed by PWC Related to the Registrant
PWC billed the Registrant aggregate fees for services rendered to the Registrant for the last two fiscal years as follows:
| | | | | | | | | | | | | | | | |
| | | Fees Billed for
Services Rendered to
the Registrant for
fiscal year end 2012 | | | Percentage of Fees
Billed Applicable to
Non-Audit Services
Provided for fiscal
year end 2012
Pursuant to Waiver of
Pre-Approval
Requirement(1) | | | Fees Billed for
Services Rendered to
the Registrant for
fiscal year end 2011 | | | Percentage of Fees
Billed Applicable to
Non-Audit Services
Provided for fiscal
year end 2011
Pursuant to Waiver of
Pre-Approval
Requirement(1) | |
Audit Fees | | $ | 139,900 | | | | N/A | | | $ | 122,900 | | | | N/A | |
Audit-Related Fees(2) | | $ | 0 | | | | 0 | % | | $ | 4,250 | | | | 0 | % |
Tax Fees(3) | | $ | 32,200 | | | | 0 | % | | $ | 47,200 | | | | 0 | % |
All Other Fees | | $ | 0 | | | | 0 | % | | $ | 0 | | | | 0 | % |
| | | | | | | | | | | | | | | | |
Total Fees | | $ | 172,100 | | | | 0 | % | | $ | 174,350 | | | | 0 | % |
PWC billed the Registrant aggregate non-audit fees of $32,200 for the fiscal year ended 2012, and $51,450 for the fiscal year ended 2011, for non-audit services rendered to the Registrant.
| (1) | With respect to the provision of non-audit services, the pre-approval requirement is waived pursuant to a de minimis exception if (i) such services were not recognized as non-audit services by the Registrant at the time of engagement, (ii) the aggregate amount of all such services provided is no more than 5% of the aggregate audit and non-audit fees paid by the Registrant to PWC during a fiscal year; and (iii) such services are promptly brought to the attention of the Registrant’s Audit Committee and approved by the Registrant’s Audit Committee prior to the completion of the audit. |
| (2) | Audit-Related fees for the fiscal year end December 31, 2011 includes fees billed for agreed upon procedures related to fund mergers. |
| (3) | Tax fees for the fiscal year end December 31, 2012 includes fees billed for reviewing tax returns. Tax fees for fiscal year end December 31, 2011 includes fees billed for reviewing tax returns. |
Fees Billed by PWC Related to Invesco and Invesco Affiliates
PWC billed Invesco Advisers, Inc. (“Invesco”), the Registrant’s adviser, and any entity controlling, controlled by or under common control with Invesco that provides ongoing services to the Registrant (“Invesco Affiliates”) aggregate fees for pre-approved non-audit services rendered to Invesco and Invesco Affiliates for the last two fiscal years as follows:
| | | | | | | | | | | | | | | | |
| | | Fees Billed for Non-
Audit Services
Rendered to Invesco
and Invesco Affiliates
for fiscal year end
2012 That Were
Required
to be Pre-Approved
by the Registrant’s
Audit Committee | | | Percentage of Fees
Billed Applicable to
Non-Audit Services
Provided for fiscal year
end 2012 Pursuant to
Waiver of Pre-
Approval
Requirement(1) | | | Fees Billed for Non-
Audit Services
Rendered to Invesco
and Invesco Affiliates
for fiscal year end
2011 That Were
Required
to be Pre-Approved
by the Registrant’s
Audit Committee | | | Percentage of Fees
Billed Applicable to
Non-Audit Services
Provided for fiscal year
end 2011 Pursuant to
Waiver of Pre-
Approval
Requirement(1) | |
Audit-Related Fees | | $ | 0 | | | | 0 | % | | $ | 0 | | | | 0 | % |
Tax Fees | | $ | 0 | | | | 0 | % | | $ | 0 | | | | 0 | % |
All Other Fees | | $ | 0 | | | | 0 | % | | $ | 0 | | | | 0 | % |
| | | | | | | | | | | | | | | | |
Total Fees(2) | | $ | 0 | | | | 0 | % | | $ | 0 | | | | 0 | % |
| (1) | With respect to the provision of non-audit services, the pre-approval requirement is waived pursuant to a de minimis exception if (i) such services were not recognized as non-audit services by the Registrant at the time of engagement, (ii) the aggregate amount of all such services provided is no more than 5% of the aggregate audit and non-audit fees paid by the Registrant, Invesco and Invesco Affiliates to PWC during a fiscal year; and (iii) such services are promptly brought to the attention of the Registrant’s Audit Committee and approved by the Registrant’s Audit Committee prior to the completion of the audit. |
| (2) | Including the fees for services not required to be pre-approved by the registrant’s audit committee, PWC billed Invesco and Invesco Affiliates aggregate non-audit fees of $0 for the fiscal year ended 2012, and $0 for the fiscal year ended 2011, for non-audit services rendered to Invesco and Invesco Affiliates. |
The Audit Committee also has considered whether the provision of non-audit services that were rendered to Invesco and Invesco Affiliates that were not required to be pre-approved pursuant to SEC regulations, if any, is compatible with maintaining PWC’s independence.
PRE-APPROVAL OF AUDIT AND NON-AUDIT SERVICES
POLICIES AND PROCEDURES
As adopted by the Audit Committees of
the Invesco Funds (the “Funds”)
Last Amended May 4, 2010
Statement of Principles
Under the Sarbanes-Oxley Act of 2002 and rules adopted by the Securities and Exchange Commission (“SEC”) (“Rules”), the Audit Committees of the Funds’ (the “Audit Committees”) Board of Trustees (the “Board”) are responsible for the appointment, compensation and oversight of the work of independent accountants (an “Auditor”). As part of this responsibility and to assure that the Auditor’s independence is not impaired, the Audit Committees pre-approve the audit and non-audit services provided to the Funds by each Auditor, as well as all non-audit services provided by the Auditor to the Funds’ investment adviser and to affiliates of the adviser that provide ongoing services to the Funds (“Service Affiliates”) if the services directly impact the Funds’ operations or financial reporting. The SEC Rules also specify the types of services that an Auditor may not provide to its audit client. The following policies and procedures comply with the requirements for pre-approval and provide a mechanism by which management of the Funds may request and secure pre-approval of audit and non-audit services in an orderly manner with minimal disruption to normal business operations.
Proposed services either may be pre-approved without consideration of specific case-by-case services by the Audit Committees (“general pre-approval”) or require the specific pre-approval of the Audit Committees (“specific pre-approval”). As set forth in these policies and procedures, unless a type of service has received general pre-approval, it will require specific pre-approval by the Audit Committees. Additionally, any fees exceeding 110% of estimated pre-approved fee levels provided at the time the service was pre-approved will also require specific approval by the Audit Committees before payment is made. The Audit Committees will also consider the impact of additional fees on the Auditor’s independence when determining whether to approve any additional fees for previously pre-approved services.
The Audit Committees will annually review and generally pre-approve the services that may be provided by each Auditor without obtaining specific pre-approval from the Audit Committee generally on an annual basis. The term of any general pre-approval runs from the date of such pre-approval through September 30th of the following year, unless the Audit Committees consider a different period and state otherwise. The Audit Committees will add to or subtract from the list of general pre-approved services from time to time, based on subsequent determinations.
The purpose of these policies and procedures is to set forth the guidelines to assist the Audit Committees in fulfilling their responsibilities.
Delegation
The Audit Committees may from time to time delegate pre-approval authority to one or more of its members who are Independent Trustees. All decisions to pre-approve a service by a delegated member shall be reported to the Audit Committees at the next quarterly meeting.
Audit Services
The annual audit services engagement terms will be subject to specific pre-approval of the Audit Committees. Audit services include the annual financial statement audit and other procedures such as tax provision work that is required to be performed by the independent auditor to be able to form an opinion on the Funds’ financial statements. The Audit Committees will obtain, review and consider sufficient information concerning the proposed Auditor to make a reasonable evaluation of the Auditor’s qualifications and independence.
In addition to the annual Audit services engagement, the Audit Committees may grant either general or specific pre-approval of other audit services, which are those services that only the independent auditor reasonably can provide. Other Audit services may include services such as issuing consents for the inclusion of audited financial statements with SEC registration statements, periodic reports and other documents filed with the SEC or other documents issued in connection with securities offerings.
Non-Audit Services
The Audit Committees may provide either general or specific pre-approval of any non-audit services to the Funds and its Service Affiliates if the Audit Committees believe that the provision of the service will not impair the independence of the Auditor, is consistent with the SEC’s Rules on auditor independence, and otherwise conforms to the Audit Committees’ general principles and policies as set forth herein.
Audit-Related Services
“Audit-related services” are assurance and related services that are reasonably related to the performance of the audit or review of the Fund’s financial statements or that are traditionally performed by the independent auditor. Audit-related services include, among others, accounting consultations related to accounting, financial reporting or disclosure matters not classified as “Audit services”; assistance with understanding and implementing new accounting and financial reporting guidance from rulemaking authorities; and agreed-upon procedures related to mergers, compliance with ratings agency requirements and interfund lending activities.
Tax Services
“Tax services” include, but are not limited to, the review and signing of the Funds’ federal tax returns, the review of required distributions by the Funds and consultations regarding tax matters such as the tax treatment of new investments or the impact of new regulations. The Audit Committees will scrutinize carefully the retention of the Auditor in connection with a transaction initially recommended by the Auditor, the major business purpose of which may be tax avoidance or the tax treatment of which may not be supported in the Internal Revenue Code and related regulations. The Audit Committees will consult with the Funds’ Treasurer (or his or her designee) and may consult with outside counsel or advisors as necessary to ensure the consistency of Tax services rendered by the Auditor with the foregoing policy.
No Auditor shall represent any Fund or any Service Affiliate before a tax court, district court or federal court of claims.
Under rules adopted by the Public Company Accounting Oversight Board and approved by the SEC, in connection with seeking Audit Committees’ pre-approval of permissible Tax services, the Auditor shall:
| | 1. | Describe in writing to the Audit Committees, which writing may be in the form of the proposed engagement letter: |
| | a. | The scope of the service, the fee structure for the engagement, and any side letter or amendment to the engagement letter, or any other agreement between the Auditor and the Fund, relating to the service; and |
| | b. | Any compensation arrangement or other agreement, such as a referral agreement, a referral fee or fee-sharing arrangement, between the Auditor and any person (other than the Fund) with respect to the promoting, marketing, or recommending of a transaction covered by the service; |
| | 2. | Discuss with the Audit Committees the potential effects of the services on the independence of the Auditor; and |
| | 3. | Document the substance of its discussion with the Audit Committees. |
All Other Auditor Services
The Audit Committees may pre-approve non-audit services classified as “All other services” that are not categorically prohibited by the SEC, as listed in Exhibit 1 to this policy.
Pre-Approval Fee Levels or Established Amounts
Pre-approval of estimated fees or established amounts for services to be provided by the Auditor under general or specific pre-approval policies will be set periodically by the Audit Committees. Any proposed fees exceeding 110% of the maximum estimated pre-approved fees or established amounts for pre-approved audit and non-audit services will be reported to the Audit Committees at the quarterly Audit Committees meeting and will require specific approval by the Audit Committees before payment is made. The Audit Committees will always factor in the overall relationship of fees for audit and non-audit services in determining whether to pre-approve any such services and in determining whether to approve any additional fees exceeding 110% of the maximum pre-approved fees or established amounts for previously pre-approved services.
Procedures
Generally on an annual basis, Invesco Advisers, Inc. (“Invesco”) will submit to the Audit Committees for general pre-approval, a list of non-audit services that the Funds or Service Affiliates of the Funds may request from the Auditor. The list will describe the non-audit services in reasonable detail and will include an estimated range of fees and such other information as the Audit Committee may request.
Each request for services to be provided by the Auditor under the general pre-approval of the Audit Committees will be submitted to the Funds’ Treasurer (or his or her designee) and must include a detailed description of the services to be rendered. The Treasurer or his or her designee will ensure that such services are included within the list of services that have received the general pre-approval of the Audit Committees. The Audit Committees will be informed at the next quarterly scheduled Audit Committees meeting of any such services for which the Auditor rendered an invoice and whether such services and fees had been pre-approved and if so, by what means.
Each request to provide services that require specific approval by the Audit Committees shall be submitted to the Audit Committees jointly by the Fund’s Treasurer or his or her designee and the Auditor, and must include a joint statement that, in their view, such request is consistent with the policies and procedures and the SEC Rules.
Each request to provide tax services under either the general or specific pre-approval of the Audit Committees will describe in writing: (i) the scope of the service, the fee structure for the engagement, and any side letter or amendment to the engagement letter, or any other agreement between the Auditor and the audit client, relating to the service; and (ii) any compensation arrangement or other agreement between the Auditor and any person (other than the audit client) with respect to the promoting, marketing, or recommending of a transaction covered by the service. The Auditor will discuss with the Audit Committees the potential effects of the services on the Auditor’s independence and will document the substance of the discussion.
Non-audit services pursuant to the de minimis exception provided by the SEC Rules will be promptly brought to the attention of the Audit Committees for approval, including documentation that each of the conditions for this exception, as set forth in the SEC Rules, has been satisfied.
On at least an annual basis, the Auditor will prepare a summary of all the services provided to any entity in the investment company complex as defined in section 2-01(f)(14) of Regulation S-X in sufficient detail as to the nature of the engagement and the fees associated with those services.
The Audit Committees have designated the Funds’ Treasurer to monitor the performance of all services provided by the Auditor and to ensure such services are in compliance with these policies and procedures. The Funds’ Treasurer will report to the Audit Committees on a periodic basis as to the results of such monitoring. Both the Funds’ Treasurer and management of Invesco will immediately report to the chairman of the Audit Committees any breach of these policies and procedures that comes to the attention of the Funds’ Treasurer or senior management of Invesco.
Exhibit 1 to Pre-Approval of Audit and Non-Audit Services Policies and Procedures
Conditionally Prohibited Non-Audit Services (not prohibited if the Fund can reasonably conclude that the results of the service would not be subject to audit procedures in connection with the audit of the Fund’s financial statements)
| | • | Bookkeeping or other services related to the accounting records or financial statements of the audit client |
| | • | Financial information systems design and implementation |
| | • | Appraisal or valuation services, fairness opinions, or contribution-in-kind reports |
| | • | Internal audit outsourcing services |
Categorically Prohibited Non-Audit Services
| | • | Broker-dealer, investment adviser, or investment banking services |
| | • | Expert services unrelated to the audit |
| | • | Any service or product provided for a contingent fee or a commission |
| | • | Services related to marketing, planning, or opining in favor of the tax treatment of confidential transactions or aggressive tax position transactions, a significant purpose of which is tax avoidance |
| | • | Tax services for persons in financial reporting oversight roles at the Fund |
| | • | Any other service that the Public Company Oversight Board determines by regulation is impermissible. |
| ITEM 5. | AUDIT COMMITTEE OF LISTED REGISTRANTS. |
Not applicable.
| ITEM 6. | SCHEDULE OF INVESTMENTS. |
Investments in securities of unaffiliated issuers is included as part of the reports to stockholders filed under Item 1 of this Form.
| ITEM 7. | DISCLOSURE OF PROXY VOTING POLICIES AND PROCEDURES FOR CLOSED-END MANAGEMENT INVESTMENT COMPANIES. |
Not applicable.
| ITEM 8. | PORTFOLIO MANAGERS OF CLOSED-END MANAGEMENT COMPANIES. |
Not applicable.
| ITEM 9. | PURCHASES OF EQUITY SECURITIES BY CLOSED-END MANAGEMENT INVESTMENT COMPANY AND AFFILIATED PURCHASERS. |
Not applicable.
| ITEM 10. | SUBMISSION OF MATTERS TO A VOTE OF SECURITY HOLDERS. |
None
| ITEM 11. | CONTROLS AND PROCEDURES. |
| (a) | As of February 12, 2013, an evaluation was performed under the supervision and with the participation of the officers of the Registrant, including the PEO and PFO, to assess the effectiveness of the Registrant’s disclosure controls and procedures, as that term is defined in Rule 30a-3(c) under the Investment Company Act of 1940 (the “Act”), as amended. Based on that evaluation, the Registrant’s officers, including the PEO and PFO, concluded that, as of February 12, 2013, the Registrant’s disclosure controls and procedures were reasonably designed to ensure: (1) that information required to be disclosed by the Registrant on Form N-CSR is recorded, processed, summarized and reported within the time periods specified by the rules and forms of the Securities and Exchange Commission; and (2) that material information relating to the Registrant is made known to the PEO and PFO as appropriate to allow timely decisions regarding required disclosure. |
| (b) | There have been no changes in the Registrant’s internal control over financial reporting (as defined in Rule 30a-3(d) under the Act) that occurred during the second fiscal quarter of the period covered by this report that have materially affected, or are reasonably likely to materially affect, the Registrant’s internal control over financial reporting. |
| | |
| 12(a) (1) | | Code of Ethics. |
| |
| 12(a) (2) | | Certifications of principal executive officer and principal financial officer as required by Rule 30a-2(a) under the Investment Company Act of 1940. |
| |
| 12(a) (3) | | Not applicable. |
| |
| 12(b) | | Certifications of principal executive officer and principal financial officer as required by Rule 30a-2(b) under the Investment Company Act of 1940. |
SIGNATURES
Pursuant to the requirements of the Securities Exchange Act of 1934 and the Investment Company Act of 1940, the Registrant has duly caused this report to be signed on its behalf by the undersigned, thereunto duly authorized.
Registrant: AIM Funds Group (Invesco Funds Group)
| | |
| By: | | /s/ Philip A. Taylor |
| | Philip A. Taylor |
| | Principal Executive Officer |
| |
| Date: | | March 8, 2013 |
Pursuant to the requirements of the Securities and Exchange Act of 1934 and the Investment Company Act of 1940, this report has been signed below by the following persons on behalf of the Registrant and in the capacities and on the dates indicated.
| | |
| By: | | /s/ Philip A. Taylor |
| | Philip A. Taylor |
| | Principal Executive Officer |
| |
| Date: | | March 8, 2013 |
| | |
| By: | | /s/ Sheri Morris |
| | Sheri Morris |
| | Principal Financial Officer |
| |
| Date: | | March 8, 2013 |
EXHIBIT INDEX
| | |
| 12(a) (1) | | Code of Ethics. |
| |
| 12(a) (2) | | Certifications of principal executive officer and principal financial officer as required by Rule 30a-2(a) under the Investment Company Act of 1940. |
| |
| 12(a) (3) | | Not applicable. |
| |
| 12(b) | | Certifications of principal executive officer and principal financial officer as required by Rule 30a-2(b) under the Investment Company Act of 1940. |
