| | | | |
OMB APPROVAL |
| OMB Number: | | 3235-0570 |
| Expires: | | January 31, 2017 |
| Estimated average burden |
| hours per response: | | 20.6 |
UNITED STATES
SECURITIES AND EXCHANGE COMMISSION
Washington, D.C. 20549
FORM N-CSR
CERTIFIED SHAREHOLDER REPORT OF REGISTERED
MANAGEMENT INVESTMENT COMPANIES
Investment Company Act file number 811-01540
AIM Funds Group (Invesco Funds Group)
(Exact name of registrant as specified in charter)
11 Greenway Plaza, Suite 1000 Houston, Texas 77046
(Address of principal executive offices) (Zip code)
Philip A. Taylor
11 Greenway Plaza,
Suite 1000 Houston, Texas 77046
(Name and address of agent for service)
Registrant’s telephone number, including area code: (713) 626-1919
Date of fiscal year end: 12/31
Date of reporting period: 12/31/14
Item 1. Report to Stockholders.
Letters to Shareholders
| | |

Philip Taylor | | Dear Shareholders: This annual report includes information about your Fund, including performance data and a complete list of its investments as of the close of the reporting period. Inside, your Fund’s portfolio managers discuss how they managed your Fund and the factors that affected its performance during the reporting period. I hope you find this report of interest. During the reporting period, the US economy showed unmistakable signs of improvement. After contracting in the first quarter of 2014, the economy expanded strongly in the second and third quarters as employment data improved markedly. Given continuing positive economic trends, the US Federal Reserve (the Fed) ended its extraordinary asset purchase program in October – but it pledged in December to be “patient” before raising interest rates. Overseas, the story was much different. Concerns about economic stagnation and the potential for deflation depressed European markets, while the Chinese economy was |
| hurt by a slowdown in manufacturing. |
Political change in Washington, DC; changes to monetary policy by the Fed and other central banks; the future direction of oil prices; and unexpected geopolitical events are likely to affect markets in the US and overseas in 2015. This may make some investors hesitant to begin to save for their long-term financial goals. That’s why Invesco has always encouraged investors to work with a professional financial adviser who can stress the importance of starting to save and invest early and the importance of adhering to a disciplined investment plan – when times are good and when they’re uncertain. A financial adviser who knows your unique financial situation, investment goals and risk tolerance can be an invaluable partner as you seek to achieve your financial goals. He or she can offer a long-term perspective when markets are volatile and time-tested advice and guidance when your financial situation or investment goals change.
Timely information when and where you want it
Invesco’s efforts to help investors achieve their financial objectives include providing individual investors and financial professionals with timely information about the markets, the economy and investing – whenever and wherever they want it.
Our website, invesco.com/us, offers a wide range of market insights and investment perspectives. On the website, you’ll find detailed information about our funds, including prices, performance, holdings and portfolio manager commentaries. You can access information about your individual Invesco account whenever it’s convenient for you; just complete a simple, secure online registration. Use the “Log In” box on our home page to get started.
Invesco’s mobile apps for iPhone® and iPad® (both available free from the App StoreSM) allow you to obtain the same detailed information, monitor your account and create customizable watch lists. Also, they allow you to access investment insights from our investment leaders, market strategists, economists and retirement experts. You can sign up to be alerted when new commentary is added, and you can watch portfolio manager videos and have instant access to Invesco news and updates wherever you may be.
In addition to the resources accessible on our website and through our mobile app, you can obtain timely updates to help you stay informed about the markets, the economy and investing by connecting with Invesco on Twitter, LinkedIn or Facebook. You can access our blog at blog.invesco.us.com. Our goal is to provide you the information you want, when and where you want it.
Have questions?
For questions about your account, feel free to contact an Invesco client services representative at 800 959 4246. For Invesco-related questions or comments, please email me directly at phil@invesco.com.
All of us at Invesco look forward to serving your investment management needs for many years to come. Thank you for investing with us.
Sincerely,

Philip Taylor
Senior Managing Director, Invesco Ltd.
iPhone and iPad are trademarks of Apple Inc., registered in the US and other countries. App Store is a service mark of Apple Inc. Invesco Distributors, Inc. is not affiliated with Apple Inc.
| | |
| 2 | | Invesco European Small Company Fund |
| | | | |

Bruce Crockett | | Dear Fellow Shareholders: Among the many important lessons I’ve learned in more than 40 years in a variety of business endeavors is the value of a trusted advocate. As independent chair of the Invesco Funds Board, I can assure you that the members of the Board are strong advocates for the interests of investors in Invesco’s mutual funds. We work hard to represent your interests through oversight of the quality of the investment management services your funds receive and other matters important to your investment, including but not limited to: |
| | n | | Ensuring that Invesco offers a diverse lineup of mutual funds that your financial adviser can use to strive to meet your financial needs as your investment goals change over time. |
| | n | | Monitoring how the portfolio management teams of the Invesco funds are performing in light of changing economic and market conditions. |
| n | | Assessing each portfolio management team’s investment performance within the context of the investment strategy described in the fund’s prospectus. |
| n | | Monitoring for potential conflicts of interests that may impact the nature of the services that your funds receive. |
We believe one of the most important services we provide our fund shareholders is the annual review of the funds’ advisory and sub-advisory contracts with Invesco Advisers and its affiliates. This review is required by the Investment Company Act of 1940 and focuses on the nature and quality of the services Invesco provides as the adviser to the Invesco funds and the reasonableness of the fees that it charges for those services. Each year, we spend months carefully reviewing information received from Invesco and a variety of independent sources, such as performance and fee data prepared by Lipper Inc., an independent, third-party firm widely recognized as a leader in its field. We also meet with our independent legal counsel and other independent advisers to review and help us assess the information that we have received. Our goal is to assure that you receive quality investment management services for a reasonable fee.
I trust the measures outlined above provide assurance that you have a worthy advocate when it comes to choosing the Invesco Funds.
As always, please contact me at bruce@brucecrockett.com with any questions or concerns you may have. On behalf of the Board, we look forward to continuing to represent your interests and serving your needs.
Sincerely,

Bruce L. Crockett
Independent Chair
Invesco Funds Board of Trustees
| | |
| 3 | | Invesco European Small Company Fund |
Management’s Discussion of Fund Performance
| | | | | | | | | | | | | | | | |
Performance summary | | | | strong stock selection decisions enabled the Fund to deliver strong gains versus the style-specific index, which declined in the sector. Top performing companies in the sector included Aryzta and Total Produce. Arzyta, a Switzerland-based global food company and par-baking leader, executed well over the year and enjoyed robust revenue growth and margin expansion. We sold out position in Aryzta during the reporting period. Total Produce is an Irish producer of fresh produce. Stock selection was supportive in the IT sector as well. German-based Nemetschek Group was a top performer in the sector. The Nemetschek Group is a vendor of software for the architectural, engineering and construction industries. The company primarily develops and distributes solutions for designing, building and managing buildings and real estate. In addition, not having exposure to several weak-performing companies in the IT sector helped Fund performance. In geographic terms, the Fund benefited most significantly from strong outperformance in Germany, Ireland and the Netherlands. Additionally, during a volatile reporting period, having a higher-than-average cash position was supportive to Fund performance. It is important to note that we do not use cash for top-down tactical asset allocation purposes. In contrast, Fund exposure in the financials, energy and industrials sectors detracted from both absolute and relative returns. In the financials sector, stock selection and underweight exposure to this sector, which performed well for the style-specific index, was a drag on Fund returns. Overweight exposure in the energy and industrials sectors, two of the weakest performing sectors, detracted from both relative and absolute results during the reporting period. |
For the year ended December 31, 2014, Invesco European Small Company Fund underperformed the MSCI Europe Small Cap Index, its style-specific benchmark. Fund exposure to the financials, energy and industrials sectors drove relative results. | | | |
Your Fund’s long-term performance appears later in this report. | | | |
Fund vs. Indexes | | | | | | | | | | | | | | | |
Total returns, 12/31/13 to 12/31/14, at net asset value (NAV). Performance shown does not include applicable contingent deferred sales charges (CDSC) or front-end sales charges, which would have reduced performance. | | | |
Class A Shares | | –7.02% | | | |
Class B Shares | | –7.71 | | | |
Class C Shares | | –7.70 | | | |
Class Y Shares | | –6.73 | | | |
MSCI EAFE Indexq (Broad Market Index) | | –4.90 | | | |
MSCI Europe Small Cap Indexq (Style-Specific Index) | | –6.50 | | | |
Lipper European Funds Indexn (Peer Group Index) | | –6.46 | | | |
Source(s): qFactSet Research Systems Inc.; nLipper Inc. | | | |
Market conditions and your Fund While 2014 began on an optimistic note, global equity markets pulled back at various points during the year in reaction to economic and geopolitical concerns. In the US, concerns centered around the potential negative effects of the US Federal Reserve reducing the scope of its asset purchase program beginning in early 2014; it ended all purchases in October. Global equity markets also declined in response to an Argentine sovereign bond default, eurozone banking concerns and geopolitical tensions in Ukraine and the Middle East, which weakened the outlook for global economic growth. Advanced economies such as the UK and US saw an economic rebound that, while modest, was stronger than in Europe, where a nascent recovery stalled. While a more supportive monetary policy in the eurozone failed to ignite dramatic economic recovery, it briefly boosted European equity prices despite having little effect on corporate earnings. Meanwhile, | | | | the Bank of Japan remained committed to extraordinary monetary stimulus. Emerging markets slightly outperformed developed international markets (ex-US) for the year, but performance was mixed. In Russia, markets declined significantly as a result of a sharp drop in the price of energy, recession concerns and a sharp decline in the value of the ruble. China continued to face headwinds and struggled to balance structural reforms with its desire to maintain satisfactory growth, while equity markets in other Asian countries, including India, Indonesia and the Philippines, rose. Our strategy continues to focus on bottom-up analysis of the strengths of individual companies. We believe that strong, high-quality businesses with strong balance sheets and attractive valuations should do well over the long term. The Fund outperformed its style-specific index by the widest margin in the consumer staples and information technology (IT) sectors. In the consumer staples sector, | | | |
| | | | | | | | | | | | | | | | | | | | | | | | |
Portfolio Composition | | | | | | | | Top 10 Equity Holdings* | | | | | Top Five Countries* | |
By sector | | | | | | | | | | | | | | | | | | | | | | | | |
| | | | | | | | |
Industrials | | | 30.2% | | | | | 1. | | Linedata Services | | | 3.8% | | | | | 1. France | | | 27.6% | |
Information Technology | | | 20.2 | | | | | 2. | | Danieli & C. Officine | | | | | | | | 2. United Kingdom | | | 15.6 | |
Consumer Discretionary | | | 13.8 | | | | | | | Meccaniche S.p.A.-Savings | | | | | | | | 3. Germany | | | 11.5 | |
Financials | | | 13.3 | | | | | | | Shares | | | 3.5 | | | | | 4. Ireland | | | 10.5 | |
Consumer Staples | | | 8.4 | | | | | 3. | | Total Produce PLC | | | 3.0 | | | | | 5. Norway | | | 8.7 | |
Health Care | | | 5.1 | | | | | 4. | | MorphoSys AG | | | 3.0 | | | | | | | | | | | |
Energy | |
| 3.7
|
| | | | 5. | | Tessi S.A. | | | 2.2 | | | | | Total Net Assets | | $ | 351.9 million | |
Telecommunication Services | |
| 1.4
|
| | | | 6. | | Constuctions Industrielles de | | | | | | | | Total Number of Holdings* | | | 75 | |
Materials | | | 0.4 | | | | | | | la Mediterranee S.A. | | | 2.1 | | | | | | |
Money Market Funds | | | | | | | | 7. | | Yazicilar Holding A.S.-Class A | | | 2.1 | | | | | The Fund’s holdings are subject to change, and there is no assurance that the Fund will continue to hold any particular security. *Excluding money market fund holdings. | |
Plus Other Assets Less Liabilities | | | 3.5 | | | | | 8. | | Origin Enterprises PLC | | | 2.0 | | | | |
| | | | | | | | 9. | | Kardex AG | | | 1.9 | | | | |
| | | | | | | | 10. | | Gerard Perrier Industrie S.A. | | | 1.9 | | | | | | |
| | |
| 4 | | Invesco European Small Company Fund |
Stock selection in Norway was the largest detractor from Fund results versus the style-specific index. Particular weakness was seen in the Fund’s exposure to Norwegian energy companies that were hard hit over the year. The top detractors in Norway included Prosafe, Ganger Rolf and Bonheur. Prosafe operates accommodation rigs for the oil and gas industry, while both Ganger Rolf and Bonheur are holding companies with interests in shipping and offshore services. Regardless of volatility in the energy sector, the Fund’s energy holdings continued to have attractive valuations.
The Fund’s positioning is driven by our stock selection process as opposed to top-down allocation decisions. In terms of year-end sector positioning, the Fund’s largest overweight positions relative to the Fund’s style-specific benchmark were in the industrials, IT and consumer discretionary sectors. The Fund’s largest underweight positions were in the financials, materials, utilities and health care sectors.
France, the UK and Germany accounted for approximately 54% of the Fund’s investments, with the remainder consisting of diverse exposure to smaller companies from more than a dozen other countries.
Because we believe market volatility is likely to continue, our focus remains on ensuring that our portfolio is comprised of quality, reasonably valued companies capable of sustained earnings growth. We continue to look for quality growth companies that exhibit the following characteristics: strong organic revenue growth, high returns on capital, pricing power, strong balance sheets, cash generation and reasonable valuations. In addition, we continue to favor companies that are able to consistently generate cash during weak economic environments. We believe that our focus on earnings, quality and valuation (EQV) may help deliver attractive returns over the long term.
We thank you for your continued investment in Invesco European Small Company Fund.
The views and opinions expressed in management’s discussion of Fund performance are those of Invesco Advisers, Inc. These views and opinions are subject to change at any time based on factors such as market and economic conditions. These views and opinions may not be relied upon as investment advice or recommendations, or as an offer for a particular security. The information is not a complete analysis of every aspect of any market, country, industry, security or the Fund. Statements of fact are from sources considered reliable, but Invesco Advisers, Inc. makes no representation or warranty as to their completeness or accuracy. Although historical performance is no guarantee of future results, these insights may help you understand our investment management philosophy.
See important Fund and, if applicable, index disclosures later in this report.
| | |

| | Jason Holzer Chartered Financial Analyst, Portfolio Manager, is lead manager of Invesco European Small |
Company Fund. He joined Invesco in 1996. Mr. Holzer earned a BA in quantitative economics and an MS in engineering economic systems from Stanford University. |
| |

| | Borge Endresen Chartered Financial Analyst, Portfolio Manager, is manager of Invesco European Small Company Fund. He |
joined Invesco in 1999. Mr. Endresen earned a BS in finance from the University of Oregon and an MBA from The University of Texas at Austin. |
| | |
| 5 | | Invesco European Small Company Fund |
Your Fund’s Long-Term Performance
Results of a $10,000 Investment – Oldest Share Class(es)
Fund and index data from 12/31/04
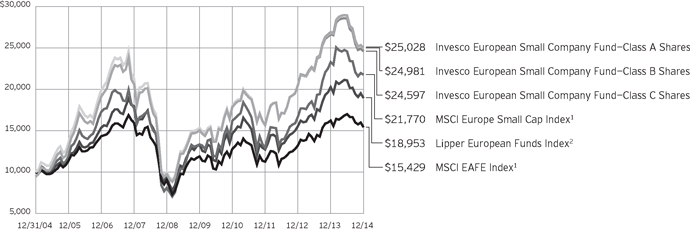
| 1 | Source: FactSet Research Systems Inc. |
Past performance cannot guarantee comparable future results.
The data shown in the chart include reinvested distributions, applicable sales charges and Fund expenses including management fees. Results for Class B shares are calculated as if a hypothetical
shareholder had liquidated his entire investment in the Fund at the close of the reporting period and paid the contingent deferred sales charges, if applicable. Index results include reinvested dividends, but they do not reflect sales charges. Performance of the peer group,
if applicable, reflects fund expenses and management fees; performance of a market index does not. Performance shown in the chart and table(s) does not reflect deduction of taxes a shareholder would pay on Fund distributions or sale of Fund shares.
continued from page 8
| | report the distribution on its tax returns, even though it may not have received this income. Further, preferred securities may lose substantial value due to the omission or deferment of dividend payments. |
| n | | Small- and mid-capitalization risks. Stocks of small- and mid-sized companies tend to be more vulnerable to adverse developments and may have little or no operating history or track record of success, and limited product lines, markets, management and financial resources. The securities of small- and mid-sized companies may be more volatile due to less market interest and less publicly available information about the issuer. They also may be illiquid or restricted as to resale, or may trade less frequently and in smaller volumes, all of which may cause difficulty when establishing or closing a position at a desirable price. |
About indexes used in this report
| n | | The MSCI EAFE® Index is an unmanaged index considered representative of stocks of Europe, Australasia and the Far East. The index is computed using the net return, which withholds applicable taxes for non-resident investors. |
| n | | The MSCI Europe Small Cap Index is an unmanaged index considered representative of small-cap European stocks. The index is computed using the net return, which withholds applicable taxes for non-resident investors. |
| n | | The Lipper European Funds Index is an unmanaged index considered representative of European funds tracked by Lipper. |
| n | | The Fund is not managed to track the performance of any particular index, including the index(es) described here, and consequently, the performance of the Fund may deviate significantly from the performance of the index(es). |
| n | | A direct investment cannot be made in an index. Unless otherwise indicated, index results include reinvested dividends, |
| | | and they do not reflect sales charges. Performance of the peer group, if applicable, reflects fund expenses; performance of a market index does not. |
Other information
| n | | The returns shown in management’s discussion of Fund performance are based on net asset values (NAVs) calculated for shareholder transactions. Generally accepted accounting principles require adjustments to be made to the net assets of the Fund at period end for financial reporting purposes, and as such, the NAVs for shareholder transactions and the returns based on those NAVs may differ from the NAVs and returns reported in the Financial Highlights. |
| n | | Industry classifications used in this report are generally according to the Global Industry Classification Standard, which was developed by and is the exclusive property and a service mark of MSCI Inc. and Standard & Poor’s. |
| | |
| 6 | | Invesco European Small Company Fund |
| | | | |
Average Annual Total Returns | |
As of 12/31/14, including maximum applicable sales charges | |
| |
Class A Shares | | | | |
Inception (8/31/00) | | | 10.83 | % |
10 Years | | | 9.61 | |
5 Years | | | 9.45 | |
1 Year | | | -12.11 | |
| |
Class B Shares | | | | |
Inception (8/31/00) | | | 10.84 | % |
10 Years | | | 9.59 | |
5 Years | | | 9.61 | |
1 Year | | | -11.86 | |
| |
Class C Shares | | | | |
Inception (8/31/00) | | | 10.48 | % |
10 Years | | | 9.42 | |
5 Years | | | 9.90 | |
1 Year | | | -8.53 | |
| |
Class Y Shares | | | | |
10 Years | | | 10.41 | % |
5 Years | | | 11.00 | |
1 Year | | | -6.73 | |
Class Y shares incepted on October 3, 2008. Performance shown prior to that date is that of Class A shares and includes the 12b-1 fees applicable to Class A shares. Class A share performance reflects any applicable fee waivers or expense reimbursements.
The performance data quoted represent past performance and cannot guarantee comparable future results; current performance may be lower or higher. Please visit invesco.com/performance for the most recent month-end performance. Performance figures reflect reinvested distributions, changes in net asset value and the effect of the maximum sales charge unless otherwise stated. Investment return and principal value will fluctuate so that you may have a gain or loss when you sell shares.
The net annual Fund operating expense ratio set forth in the most recent Fund prospectus as of the date of this report for Class A, Class B, Class C and Class Y shares was 1.49%, 2.24%, 2.24% and 1.24%, respectively.1 The total annual Fund operating expense ratio set forth in the most recent Fund prospectus as of the date of this report for Class A, Class B, Class C and Class Y shares was 1.52%, 2.27%, 2.27% and 1.27%, respectively. The expense ratios presented above may vary from the expense
ratios presented in other sections of this report that are based on expenses incurred during the period covered by this report.
Class A share performance reflects the maximum 5.50% sales charge, and Class B and Class C share performance reflects the applicable contingent deferred sales charge (CDSC) for the period involved. The CDSC on Class B shares declines from 5% beginning at the time of purchase to 0% at the beginning of the seventh year. The CDSC on Class C shares is 1% for the first year after purchase. Class Y shares do not have a front-end sales charge or a CDSC; therefore, performance is at net asset value.
The performance of the Fund’s share classes will differ primarily due to different sales charge structures and class expenses.
Had the adviser not waived fees and/ or reimbursed expenses in the past, performance would have been lower.
| 1 | Total annual Fund operating expenses after any contractual fee waivers and/or expense reimbursements by the adviser in effect through at least June 30, 2016. See current prospectus for more information. |
| | |
| 7 | | Invesco European Small Company Fund |
Invesco European Small Company Fund’s investment objective is long-term growth of capital.
| n | | Unless otherwise stated, information presented in this report is as of December 31, 2014, and is based on total net assets. |
| n | | Unless otherwise noted, all data provided by Invesco. |
| n | | To access your Fund’s reports/prospectus, visit invesco.com/fundreports. |
About share classes
| n | | Class B shares may not be purchased for new or additional investments. Please see the prospectus for more information. |
| n | | Class Y shares are available to only certain investors. Please see the prospectus for more information. |
Principal risks of investing in the Fund
| n | | Depositary receipts risk. Depositary receipts involve many of the same risks as those associated with direct investment in foreign securities. In addition, the underlying issuers of certain depositary receipts, particularly unsponsored or unregistered depositary receipts, are under no obligation to distribute shareholder communications to the holders of such receipts or to pass through to them any voting rights with respect to the deposited securities. |
| n | | Derivatives risk. The value of a derivative instrument depends largely on (and is derived from) the value of an underlying security, currency, commodity, interest rate, index or other asset (each referred to as an underlying asset). In addition to risks relating to the underlying assets, the use of derivatives may include other, possibly greater, risks, including counterparty, leverage and liquidity risks. Counterparty risk is the risk that the counterparty to the derivative contract will default on its obligation to pay the Fund the amount owed or otherwise perform under the derivative contract. Derivatives create leverage risk because they do not require payment up front equal to the economic exposure created by owning the derivative. As a result, an adverse change in the value of the underlying asset could result in the Fund sustaining a loss that is substantially greater than the amount invested in the derivative, which may make the Fund’s returns more volatile and increase the risk of loss. Derivative instruments may also be less liquid than |
| | | more traditional investments and the Fund may be unable to sell or close out its derivative positions at a desirable time or price. This risk may be more acute under adverse market conditions, during which the Fund may be most in need of liquidating its derivative positions. Derivatives may also be harder to value, less tax efficient and subject to changing government regulation that could impact the Fund’s ability to use certain derivatives or their cost. Also, derivatives used for hedging or to gain or limit exposure to a particular market segment may not provide the expected benefits, particularly during adverse market conditions. |
| n | | Developing/emerging markets securities risk. The prices of securities issued by foreign companies and governments located in developing/emerging market countries may be affected more negatively by inflation, devaluation of their currencies, higher transaction costs, delays in settlement, adverse political developments, the introduction of capital controls, withholding taxes, nationalization of private assets, expropriation, social unrest, war or lack of timely information than those in developed countries. |
| n | | Foreign securities risk. The Fund’s foreign investments may be affected by changes in a foreign country’s exchange rates, political and social instability, changes in economic or taxation policies, difficulties when enforcing obligations, decreased liquidity, and increased volatility. Foreign companies may be subject to less regulation resulting in less publicly available information about the companies. |
| n | | Geographic focus risk. From time to time the Fund may invest a substantial amount of its assets in securities of issuers located in a single country or a limited number of countries. If the Fund focuses its investments in this manner, it assumes the risk that economic, political and social conditions in those countries will have a significant impact on its investment performance. The |
| | | Fund’s investment performance may also be more volatile if it focuses its investments in certain countries, especially emerging markets countries. |
| n | | Growth investing risk. Growth stocks tend to be more expensive relative to their earnings or assets compared with other types of stock. As a result they tend to be more sensitive to changes in their earnings and can be more volatile. |
| n | | Investing in the European Union risk. Many countries in the European Union are susceptible to high economic risks associated with high levels of debt, notably due to investments in sovereign debts of European countries such as Greece, Italy and Spain. One or more member states might exit the European Union, placing its currency and banking system in jeopardy. The European Union faces major issues involving its membership, structure, procedures and policies, including the adoption, abandonment or adjustment of the new constitutional treaty, the European Union’s enlargement to the south and east, and resolution of the European Union’s problematic fiscal and democratic accountability. Efforts of the member states to further unify their economic and monetary policies may increase the potential for the downward movement of one member state’s market to cause a similar effect on other member states’ markets. European countries that are part of the European Economic and Monetary Union may be significantly affected by the tight fiscal and monetary controls that the union seeks to impose on its members. |
| n | | Management risk. The investment techniques and risk analysis used by the Fund’s portfolio managers may not produce the desired results. |
| n | | Market risk. The prices of and the income generated by the Fund’s securities may decline in response to, among other things, investor sentiment, general economic and market conditions, regional or global instability, and currency and interest rate fluctuations. |
| n | | Preferred securities risk. Preferred securities may include provisions that permit the issuer, in its discretion, to defer or omit distributions for a certain period of time. If the Fund owns a security that is deferring or omitting its distributions, the Fund may be required to |
| | |
This report must be accompanied or preceded by a currently effective Fund prospectus, which contains more complete information, including sales charges and expenses. Investors should read it carefully before investing. | | |
NOT FDIC INSURED | MAY LOSE VALUE | NO BANK GUARANTEE | | continued on page 6 |
| | |
| 8 | | Invesco European Small Company Fund |
Schedule of Investments
December 31, 2014
| | | | | | | | |
| | | Shares | | | Value | |
Common Stocks & Other Equity Interests–96.51% | |
| Austria–1.37% | |
Semperit AG Holding | | | 99,881 | | | $ | 4,833,449 | |
|
| Belgium–0.99% | |
Van de Velde N.V. | | | 73,906 | | | | 3,482,546 | |
|
| Finland–0.50% | |
Saga Furs Oyj | | | 67,000 | | | | 1,783,687 | |
|
| France–27.58% | |
Assystem | | | 150,793 | | | | 3,193,306 | |
Caisse Regionale de Credit Agricole d’Ile-de-France | | | 55,078 | | | | 4,513,530 | |
Caisse Regionale de Credit Agricole Mutuel Brie Picardie–CCI | | | 94,000 | | | | 2,988,423 | |
Caisse Regionale de Credit Agricole Mutuel de Normandie-Seine–CCI | | | 42,988 | | | | 5,670,156 | |
Caisse Regionale de Credit Agricole Mutuel Nord de France–CCI | | | 312,270 | | | | 5,970,471 | |
Caisse Regionale de Credit Agricole Mutuel Sud Rhone Alpes–CCI | | | 17,300 | | | | 3,247,640 | |
Cegid Group | | | 135,000 | | | | 4,924,305 | |
Constuctions Industrielles de la Mediterranee S.A. | | | 80,972 | | | | 7,405,753 | |
GEA | | | 39,000 | | | | 3,935,971 | |
Gerard Perrier Industrie S.A. | | | 163,600 | | | | 6,639,993 | |
Linedata Services(a) | | | 486,700 | | | | 13,192,331 | |
Maisons France Confort S.A. | | | 112,990 | | | | 3,997,962 | |
Manutan International | | | 93,000 | | | | 4,614,111 | |
Metropole Television S.A. | | | 212,460 | | | | 3,998,481 | |
Neurones | | | 168,000 | | | | 2,817,694 | |
Sopra Steria Group | | | 40,191 | | | | 3,080,594 | |
Tessi S.A. | | | 68,094 | | | | 7,556,130 | |
Total Gabon | | | 8,432 | | | | 3,000,562 | |
Trigano S.A. | | | 184,988 | | | | 4,974,537 | |
Vicat S.A. | | | 18,318 | | | | 1,321,130 | |
| | | | | 97,043,080 | |
|
| Germany–11.46% | |
Amadeus Fire AG | | | 41,000 | | | | 3,084,211 | |
CANCOM S.E. | | | 124,670 | | | | 5,352,625 | |
CENIT AG(a) | | | 463,575 | | | | 6,613,861 | |
MorphoSys AG(b) | | | 112,509 | | | | 10,417,410 | |
Nemetschek AG | | | 51,075 | | | | 5,185,566 | |
Nexus AG | | | 230,566 | | | | 3,375,996 | |
SMT Scharf AG | | | 89,110 | | | | 1,489,160 | |
Softing AG | | | 62,799 | | | | 1,109,651 | |
Takkt AG | | | 223,690 | | | | 3,684,054 | |
| | | | | 40,312,534 | |
|
| Greece–1.45% | |
Autohellas S.A.(b) | | | 207,551 | | | | 2,330,741 | |
Karelia Tobacco Co. Inc. S.A. | | | 7,255 | | | | 1,799,752 | |
| | | | | | | | |
| | | Shares | | | Value | |
| Greece–(continued) | |
Metka S.A. | | | 96,438 | | | $ | 976,644 | |
| | | | | 5,107,137 | |
|
| Ireland–10.50% | |
Abbey PLC | | | 94,397 | | | | 1,240,536 | |
CPL Resources PLC | | | 582,792 | | | | 4,619,300 | |
DCC PLC | | | 111,326 | | | | 6,118,877 | |
Fyffes PLC | | | 4,410,483 | | | | 5,429,246 | |
IFG Group PLC | | | 1,096,500 | | | | 2,025,534 | |
Origin Enterprises PLC | | | 672,112 | | | | 6,872,577 | |
Total Produce PLC | | | 8,216,323 | | | | 10,638,553 | |
| | | | | 36,944,623 | |
|
| Israel–2.70% | |
Hilan Ltd. | | | 517,409 | | | | 3,706,680 | |
Vizrt Ltd. | | | 1,221,772 | | | | 5,803,130 | |
| | | | | 9,509,810 | |
|
| Italy–5.85% | |
Danieli & C. Officine Meccaniche S.p.A.–Savings Shares | | | 733,532 | | | | 12,187,394 | |
El.En. S.p.A. | | | 132,000 | | | | 4,237,722 | |
Vianini Lavori S.p.A. | | | 615,570 | | | | 4,148,304 | |
| | | | | 20,573,420 | |
|
| Norway–8.74% | |
Bonheur ASA | | | 283,997 | | | | 2,786,640 | |
Ekornes ASA | | | 505,214 | | | | 6,439,733 | |
Ganger Rolf ASA | | | 320,785 | | | | 3,077,436 | |
Kongsberg Gruppen ASA | | | 256,721 | | | | 4,236,775 | |
Prosafe S.E. | | | 1,335,528 | | | | 4,086,060 | |
Telio Holding ASA | | | 894,256 | | | | 5,058,438 | |
Wilh. Wilhelmsen Holding ASA–Class A | | | 223,153 | | | | 5,056,326 | |
| | | | | 30,741,408 | |
|
| Portugal–0.30% | |
Conduril—Engenharia S.A. | | | 14,192 | | | | 1,047,598 | |
|
| Spain–3.26% | |
Baron de Ley, S.A.(b) | | | 55,000 | | | | 4,991,663 | |
Construcciones y Auxiliar de Ferrocarriles S.A. | | | 9,251 | | | | 3,374,642 | |
Duro Felguera, S.A. | | | 766,300 | | | | 3,096,808 | |
| | | | | 11,463,113 | |
|
| Switzerland–4.11% | |
Carlo Gavazzi Holding AG | | | 14,425 | | | | 3,061,739 | |
Kardex AG | | | 146,348 | | | | 6,808,767 | |
Kuoni Reisen Holding AG | | | 15,190 | | | | 4,588,609 | |
| | | | | 14,459,115 | |
|
| Turkey–2.06% | |
Yazicilar Holding A.S.–Class A | | | 864,364 | | | | 7,238,206 | |
See accompanying Notes to Financial Statements which are an integral part of the financial statements.
9 Invesco European Small Company Fund
| | | | | | | | |
| | | Shares | | | Value | |
| United Kingdom–15.64% | |
Chime Communications PLC | | | 724,538 | | | $ | 3,193,447 | |
City of London Investment Group PLC | | | 900,000 | | | | 4,631,093 | |
Clarkson PLC | | | 124,788 | | | | 3,686,881 | |
Diploma PLC | | | 222,327 | | | | 2,456,976 | |
Fairpoint Group PLC | | | 1,852,500 | | | | 3,421,678 | |
Hargreaves Services PLC | | | 339,000 | | | | 3,408,176 | |
IG Group Holdings PLC | | | 591,373 | | | | 6,591,879 | |
Micro Focus International PLC | | | 317,047 | | | | 5,307,450 | |
SafeStyle UK PLC | | | 1,450,000 | | | | 3,878,922 | |
Savills PLC | | | 616,600 | | | | 6,501,327 | |
Tribal Group PLC | | | 1,145,117 | | | | 2,857,795 | |
Tullett Prebon PLC | | | 1,054,902 | | | | 4,633,658 | |
Ultra Electronics Holdings PLC | | | 159,908 | | | | 4,460,664 | |
| | | | | | | | 55,029,946 | |
Total Common Stocks & Other Equity Interests
(Cost $327,368,890) | | | | 339,569,672 | |
| | | | | | | | |
| | | Shares | | | Value | |
Money Market Funds–2.52% | | | | | | | | |
Liquid Assets Portfolio–Institutional Class(c) | | | 4,425,770 | | | $ | 4,425,770 | |
Premier Portfolio–Institutional Class(c) | | | 4,425,770 | | | | 4,425,770 | |
Total Money Market Funds
(Cost $8,851,540) | | | | 8,851,540 | |
TOTAL INVESTMENTS–99.03%
(Cost $336,220,430) | | | | 348,421,212 | |
OTHER ASSETS LESS LIABILITIES–0.97% | | | | 3,430,456 | |
NET ASSETS–100.00% | | | | | | $ | 351,851,668 | |
Notes to Schedule of Investments:
| (a) | Affiliated company during the period. The Investment Company Act of 1940 defines affiliates as those companies in which a fund holds 5% or more of the outstanding voting securities. The Fund has not owned enough of the outstanding voting securities of the issuer to have control (as defined in the Investment Company Act of 1940) of that issuer. The aggregate value of these securities as of December 31, 2014 was $19,806,192, which represented 5.63% of the Fund’s Net Assets. See Note 4. |
| (b) | Non-income producing security. |
| (c) | The money market fund and the Fund are affiliated by having the same investment adviser. |
See accompanying Notes to Financial Statements which are an integral part of the financial statements.
10 Invesco European Small Company Fund
Statement of Assets and Liabilities
December 31, 2014
| | | | |
Assets: | | | | |
Investments, at value (Cost $308,136,232) | | $ | 319,763,480 | |
Investments in affiliates, at value (Cost $28,084,198) | | | 28,657,732 | |
Total investments, at value (Cost $336,220,430) | | | 348,421,212 | |
Foreign currencies, at value (Cost $437,922) | | | 429,842 | |
Receivable for: | | | | |
Investments sold | | | 2,711,612 | |
Fund shares sold | | | 5,615,824 | |
Dividends | | | 265,783 | |
Investment for trustee deferred compensation and retirement plans | | | 82,323 | |
Other assets | | | 26,259 | |
Total assets | | | 357,552,855 | |
|
Liabilities: | |
Payable for: | | | | |
Investments purchased | | | 22,051 | |
Fund shares reacquired | | | 5,315,741 | |
Accrued fees to affiliates | | | 187,569 | |
Accrued trustees’ and officers’ fees and benefits | | | 583 | |
Accrued other operating expenses | | | 83,206 | |
Trustee deferred compensation and retirement plans | | | 92,037 | |
Total liabilities | | | 5,701,187 | |
Net assets applicable to shares outstanding | | $ | 351,851,668 | |
|
Net assets consist of: | |
Shares of beneficial interest | | $ | 326,901,522 | |
Undistributed net investment income | | | 1,214,692 | |
Undistributed net realized gain | | | 11,564,333 | |
Net unrealized appreciation | | | 12,171,121 | |
| | | $ | 351,851,668 | |
| | | | |
Net Assets: | |
Class A | | $ | 173,809,215 | |
Class B | | $ | 2,937,671 | |
Class C | | $ | 34,194,927 | |
Class Y | | $ | 140,909,855 | |
|
Shares outstanding, $0.01 par value per share,
with an unlimited number of shares authorized: | |
Class A | | | 14,064,436 | |
Class B | | | 252,218 | |
Class C | | | 2,931,569 | |
Class Y | | | 11,368,619 | |
Class A: | | | | |
Net asset value per share | | $ | 12.36 | |
Maximum offering price per share | | | | |
(Net asset value of $12.36 ¸ 94.50%) | | $ | 13.08 | |
Class B: | | | | |
Net asset value and offering price per share | | $ | 11.65 | |
Class C: | | | | |
Net asset value and offering price per share | | $ | 11.66 | |
Class Y: | | | | |
Net asset value and offering price per share | | $ | 12.39 | |
See accompanying Notes to Financial Statements which are an integral part of the financial statements.
11 Invesco European Small Company Fund
Statement of Operations
For the year ended December 31, 2014
| | | | |
Investment income: | |
Dividends (net of foreign withholding taxes of $2,069,431) | | $ | 16,182,775 | |
Dividends from affiliates | | | 561,921 | |
Total investment income | | | 16,744,696 | |
| |
Expenses: | | | | |
Advisory fees | | | 4,950,248 | |
Administrative services fees | | | 138,778 | |
Custodian fees | | | 166,276 | |
Distribution fees: | | | | |
Class A | | | 656,677 | |
Class B | | | 42,318 | |
Class C | | | 475,207 | |
Transfer agent fees | | | 709,388 | |
Trustees’ and officers’ fees and benefits | | | 31,485 | |
Other | | | 266,437 | |
Total expenses | | | 7,436,814 | |
Less: Fees waived and expense offset arrangement(s) | | | (131,050 | ) |
Net expenses | | | 7,305,764 | |
Net investment income | | | 9,438,932 | |
| |
Realized and unrealized gain (loss) from: | | | | |
Net realized gain (loss) from: | | | | |
Investment securities | | | 41,484,683 | |
Foreign currencies | | | (166,065 | ) |
| | | | 41,318,618 | |
Change in net unrealized appreciation (depreciation) of: | | | | |
Investment securities | | | (82,651,814 | ) |
Foreign currencies | | | (33,810 | ) |
| | | | (82,685,624 | ) |
Net realized and unrealized gain (loss) | | | (41,367,006 | ) |
Net increase (decrease) in net assets resulting from operations | | $ | (31,928,074 | ) |
See accompanying Notes to Financial Statements which are an integral part of the financial statements.
12 Invesco European Small Company Fund
Statement of Changes in Net Assets
For the years ended December 31, 2014 and 2013
| | | | | | | | |
| | | 2014 | | | 2013 | |
Operations: | | | | | |
Net investment income | | $ | 9,438,932 | | | $ | 2,758,379 | |
Net realized gain | | | 41,318,618 | | | | 8,491,955 | |
Change in net unrealized appreciation (depreciation) | | | (82,685,624 | ) | | | 69,067,300 | |
Net increase (decrease) in net assets resulting from operations | | | (31,928,074 | ) | | | 80,317,634 | |
| | |
Distributions to shareholders from net investment income: | | | | | | | | |
Class A | | | (3,787,104 | ) | | | (1,401,176 | ) |
Class B | | | (35,980 | ) | | | (2,715 | ) |
Class C | | | (425,925 | ) | | | (25,995 | ) |
Class Y | | | (3,218,418 | ) | | | (1,672,334 | ) |
Total distributions from net investment income | | | (7,467,427 | ) | | | (3,102,220 | ) |
| | |
Distributions to shareholders from net realized gains: | | | | | | | | |
Class A | | | (15,612,360 | ) | | | (4,965,535 | ) |
Class B | | | (275,650 | ) | | | (89,950 | ) |
Class C | | | (3,263,075 | ) | | | (861,086 | ) |
Class Y | | | (11,303,522 | ) | | | (4,595,065 | ) |
Total distributions from net realized gains | | | (30,454,607 | ) | | | (10,511,636 | ) |
| | |
Share transactions–net: | | | | | | | | |
Class A | | | (101,634,479 | ) | | | 177,723,935 | |
Class B | | | (1,828,646 | ) | | | (2,810,850 | ) |
Class C | | | (10,214,729 | ) | | | 29,861,691 | |
Class Y | | | (118,118,178 | ) | | | 240,319,372 | |
Net increase (decrease) in net assets resulting from share transactions | | | (231,796,032 | ) | | | 445,094,148 | |
Net increase (decrease) in net assets | | | (301,646,140 | ) | | | 511,797,926 | |
| | |
Net assets: | | | | | | | | |
Beginning of year | | | 653,497,808 | | | | 141,699,882 | |
End of year (includes undistributed net investment income of $1,214,692 and $(590,748), respectively) | | $ | 351,851,668 | | | $ | 653,497,808 | |
Notes to Financial Statements
December 31, 2014
NOTE 1—Significant Accounting Policies
Invesco European Small Company Fund (the “Fund”) is a series portfolio of AIM Funds Group (Invesco Funds Group) (the “Trust”). The Trust is a Delaware statutory trust registered under the Investment Company Act of 1940, as amended (the “1940 Act”), as an open-end series management investment company consisting of four separate portfolios, each authorized to issue an unlimited number of shares of beneficial interest. The assets, liabilities and operations of each portfolio are accounted for separately. Information presented in these financial statements pertains only to the Fund. Matters affecting each portfolio or class will be voted on exclusively by the shareholders of such portfolio or class.
The Fund’s investment objective is long-term growth of capital.
The Fund currently consists of four different classes of shares: Class A, Class B, Class C and Class Y. Class A shares are sold with a front-end sales charge unless certain waiver criteria are met and under certain circumstances load waived shares may be subject to contingent deferred sales charges (“CDSC”). Class C shares are sold with a CDSC. Class Y shares are sold at net asset value. Effective November 30, 2010, new or additional investments in Class B shares are no longer permitted. Existing shareholders of Class B shares may continue to reinvest dividends and capital gains distributions in Class B shares until they convert to Class A shares. Also, shareholders in Class B shares will be able to exchange those shares for Class B shares of other Invesco Funds offering such shares until they convert to Class A shares. Generally, Class B shares will automatically convert to Class A shares on or about the month-end, which is at least eight years after the date of purchase. Redemption of Class B shares prior to the conversion date will be subject to a CDSC.
As of the open of business on November 19, 2014, the Fund began permitting limited public sales of its shares to certain investors.
The following is a summary of the significant accounting policies followed by the Fund in the preparation of its financial statements.
| A. | Security Valuations — Securities, including restricted securities, are valued according to the following policy. |
A security listed or traded on an exchange (except convertible securities) is valued at its last sales price or official closing price as of the close of the customary trading session on the exchange where the security is principally traded, or lacking any sales or official closing price on a
13 Invesco European Small Company Fund
particular day, the security may be valued at the closing bid price on that day. Securities traded in the over-the-counter market are valued based on prices furnished by independent pricing services or market makers. When such securities are valued by an independent pricing service they may be considered fair valued. Futures contracts are valued at the final settlement price set by an exchange on which they are principally traded. Listed options are valued at the mean between the last bid and ask prices from the exchange on which they are principally traded. Options not listed on an exchange are valued by an independent source at the mean between the last bid and ask prices. For purposes of determining net asset value per share, futures and option contracts generally are valued 15 minutes after the close of the customary trading session of the New York Stock Exchange (“NYSE”).
Investments in open-end and closed-end registered investment companies that do not trade on an exchange are valued at the end of day net asset value per share. Investments in open-end and closed-end registered investment companies that trade on an exchange are valued at the last sales price or official closing price as of the close of the customary trading session on the exchange where the security is principally traded.
Debt obligations (including convertible securities) and unlisted equities are fair valued using an evaluated quote provided by an independent pricing service. Evaluated quotes provided by the pricing service may be determined without exclusive reliance on quoted prices, and may reflect appropriate factors such as institution-size trading in similar groups of securities, developments related to specific securities, dividend rate (for unlisted equities), yield (for debt obligations), quality, type of issue, coupon rate (for debt obligations), maturity (for debt obligations), individual trading characteristics and other market data. Debt obligations are subject to interest rate and credit risks. In addition, all debt obligations involve some risk of default with respect to interest and/or principal payments.
Foreign securities’ (including foreign exchange contracts) prices are converted into U.S. dollar amounts using the applicable exchange rates as of the close of the NYSE. If market quotations are available and reliable for foreign exchange-traded equity securities, the securities will be valued at the market quotations. Because trading hours for certain foreign securities end before the close of the NYSE, closing market quotations may become unreliable. If between the time trading ends on a particular security and the close of the customary trading session on the NYSE, events occur that the Adviser determines are significant and make the closing price unreliable, the Fund may fair value the security. If the event is likely to have affected the closing price of the security, the security will be valued at fair value in good faith using procedures approved by the Board of Trustees. Adjustments to closing prices to reflect fair value may also be based on a screening process of an independent pricing service to indicate the degree of certainty, based on historical data, that the closing price in the principal market where a foreign security trades is not the current value as of the close of the NYSE. Foreign securities’ prices meeting the approved degree of certainty that the price is not reflective of current value will be priced at the indication of fair value from the independent pricing service. Multiple factors may be considered by the independent pricing service in determining adjustments to reflect fair value and may include information relating to sector indices, American Depositary Receipts and domestic and foreign index futures. Foreign securities may have additional risks including exchange rate changes, potential for sharply devalued currencies and high inflation, political and economic upheaval, the relative lack of issuer information, relatively low market liquidity and the potential lack of strict financial and accounting controls and standards.
Securities for which market prices are not provided by any of the above methods may be valued based upon quotes furnished by independent sources. The last bid price may be used to value equity securities. The mean between the last bid and ask prices is used to value debt obligations, including corporate loans.
Securities for which market quotations are not readily available or became unreliable are valued at fair value as determined in good faith by or under the supervision of the Trust’s officers following procedures approved by the Board of Trustees. Issuer specific events, market trends, bid/ask quotes of brokers and information providers and other market data may be reviewed in the course of making a good faith determination of a security’s fair value.
The Fund may invest in securities that are subject to interest rate risk, meaning the risk that the prices will generally fall as interest rates rise and, conversely, the prices will generally rise as interest rates fall. Specific securities differ in their sensitivity to changes in interest rates depending on their individual characteristics. Changes in interest rates may result in increased market volatility, which may affect the value and/or liquidity of certain of the Fund’s investments.
Valuations change in response to many factors including the historical and prospective earnings of the issuer, the value of the issuer’s assets, general economic conditions, interest rates, investor perceptions and market liquidity. Because of the inherent uncertainties of valuation, the values reflected in the financial statements may materially differ from the value received upon actual sale of those investments.
| B. | Securities Transactions and Investment Income — Securities transactions are accounted for on a trade date basis. Realized gains or losses on sales are computed on the basis of specific identification of the securities sold. Interest income (net of withholding tax, if any) is recorded on the accrual basis from settlement date. Dividend income (net of withholding tax, if any) is recorded on the ex-dividend date. |
The Fund may periodically participate in litigation related to Fund investments. As such, the Fund may receive proceeds from litigation settlements. Any proceeds received are included in the Statement of Operations as realized gain (loss) for investments no longer held and as unrealized gain (loss) for investments still held.
Brokerage commissions and mark ups are considered transaction costs and are recorded as an increase to the cost basis of securities purchased and/or a reduction of proceeds on a sale of securities. Such transaction costs are included in the determination of net realized and unrealized gain (loss) from investment securities reported in the Statement of Operations and the Statement of Changes in Net Assets and the net realized and unrealized gains (losses) on securities per share in the Financial Highlights. Transaction costs are included in the calculation of the Fund’s net asset value and, accordingly, they reduce the Fund’s total returns. These transaction costs are not considered operating expenses and are not reflected in net investment income reported in the Statement of Operations and Statement of Changes in Net Assets, or the net investment income per share and ratios of expenses and net investment income reported in the Financial Highlights, nor are they limited by any expense limitation arrangements between the Fund and the investment adviser.
The Fund allocates income and realized and unrealized capital gains and losses to a class based on the relative net assets of each class.
| C. | Country Determination — For the purposes of making investment selection decisions and presentation in the Schedule of Investments, the investment adviser may determine the country in which an issuer is located and/or credit risk exposure based on various factors. These factors include the laws of the country under which the issuer is organized, where the issuer maintains a principal office, the country in which the issuer derives 50% or more of its total revenues and the country that has the primary market for the issuer’s securities, as well as other criteria. Among the other criteria that may be evaluated for making this determination are the country in which the issuer maintains 50% or more of its assets, |
14 Invesco European Small Company Fund
| | the type of security, financial guarantees and enhancements, the nature of the collateral and the sponsor organization. Country of issuer and/or credit risk exposure has been determined to be the United States of America, unless otherwise noted. |
| D. | Distributions — Distributions from net investment income and net realized capital gain, if any, are generally declared and paid annually and recorded on the ex-dividend date. The Fund may elect to treat a portion of the proceeds from redemptions as distributions for federal income tax purposes. |
| E. | Federal Income Taxes — The Fund intends to comply with the requirements of Subchapter M of the Internal Revenue Code of 1986, as amended (the “Internal Revenue Code”), necessary to qualify as a regulated investment company and to distribute substantially all of the Fund’s taxable earnings to shareholders. As such, the Fund will not be subject to federal income taxes on otherwise taxable income (including net realized capital gain) that is distributed to shareholders. Therefore, no provision for federal income taxes is recorded in the financial statements. |
The Fund recognizes the tax benefits of uncertain tax positions only when the position is more likely than not to be sustained. Management has analyzed the Fund’s uncertain tax positions and concluded that no liability for unrecognized tax benefits should be recorded related to uncertain tax positions. Management is not aware of any tax positions for which it is reasonably possible that the total amounts of unrecognized tax benefits will change materially in the next 12 months.
The Fund files tax returns in the U.S. Federal jurisdiction and certain other jurisdictions. Generally, the Fund is subject to examinations by such taxing authorities for up to three years after the filing of the return for the tax period.
| F. | Expenses — Fees provided for under the Rule 12b-1 plan of a particular class of the Fund and which are directly attributable to that class are charged to the operations of such class. All other expenses are allocated among the classes based on relative net assets. |
| G. | Accounting Estimates — The preparation of financial statements in conformity with accounting principles generally accepted in the United States of America (“GAAP”) requires management to make estimates and assumptions that affect the reported amounts of assets and liabilities at the date of the financial statements and the reported amounts of revenues and expenses during the reporting period including estimates and assumptions related to taxation. Actual results could differ from those estimates by a significant amount. In addition, the Fund monitors for material events or transactions that may occur or become known after the period-end date and before the date the financial statements are released to print. |
| H. | Indemnifications — Under the Trust’s organizational documents, each Trustee, officer, employee or other agent of the Trust is indemnified against certain liabilities that may arise out of the performance of their duties to the Fund. Additionally, in the normal course of business, the Fund enters into contracts, including the Fund’s servicing agreements, that contain a variety of indemnification clauses. The Fund’s maximum exposure under these arrangements is unknown as this would involve future claims that may be made against the Fund that have not yet occurred. The risk of material loss as a result of such indemnification claims is considered remote. |
| I. | Foreign Currency Translations — Foreign currency is valued at the close of the NYSE based on quotations posted by banks and major currency dealers. Portfolio securities and other assets and liabilities denominated in foreign currencies are translated into U.S. dollar amounts at date of valuation. Purchases and sales of portfolio securities (net of foreign taxes withheld on disposition) and income items denominated in foreign currencies are translated into U.S. dollar amounts on the respective dates of such transactions. The Fund does not separately account for the portion of the results of operations resulting from changes in foreign exchange rates on investments and the fluctuations arising from changes in market prices of securities held. The combined results of changes in foreign exchange rates and the fluctuation of market prices on investments (net of estimated foreign tax withholding) are included with the net realized and unrealized gain or loss from investments in the Statement of Operations. Reported net realized foreign currency gains or losses arise from (1) sales of foreign currencies, (2) currency gains or losses realized between the trade and settlement dates on securities transactions, and (3) the difference between the amounts of dividends, interest, and foreign withholding taxes recorded on the Fund’s books and the U.S. dollar equivalent of the amounts actually received or paid. Net unrealized foreign currency gains and losses arise from changes in the fair values of assets and liabilities, other than investments in securities at fiscal period end, resulting from changes in exchange rates. |
The Fund may invest in foreign securities, which may be subject to foreign taxes on income, gains on investments or currency repatriation, a portion of which may be recoverable. Foreign taxes, if any, are recorded based on the tax regulations and rates that exist in the foreign markets in which the Fund invests and are shown in the Statement of Operations.
| J. | Forward Foreign Currency Contracts — The Fund may engage in foreign currency transactions either on a spot (i.e. for prompt delivery and settlement) basis or through forward foreign currency contracts to manage or minimize currency or exchange rate risk. |
The Fund may also enter into forward foreign currency contracts for the purchase or sale of a security denominated in a foreign currency in order to “lock in” the U.S. dollar price of that security, or the Fund may also enter into forward foreign currency contracts that do not provide for physical settlement of the two currencies, but instead are settled by a single cash payment calculated as the difference between the agreed upon exchange rate and the spot rate at settlement based upon an agreed upon notional amount (non-deliverable forwards). The Fund will set aside liquid assets in an amount equal to daily mark-to-market obligation for forward foreign currency contracts.
A forward foreign currency contract is an obligation between two parties (“Counterparties”) to purchase or sell a specific currency for an agreed-upon price at a future date. The use of forward foreign currency contracts does not eliminate fluctuations in the price of the underlying securities the Fund owns or intends to acquire but establishes a rate of exchange in advance. Fluctuations in the value of these contracts are measured by the difference in the contract date and reporting date exchange rates and are recorded as unrealized appreciation (depreciation) until the contracts are closed. When the contracts are closed, realized gains (losses) are recorded. Realized and unrealized gains (losses) on the contracts are included in the Statement of Operations. The primary risks associated with forward foreign currency contracts include failure of the Counterparty to meet the terms of the contract and the value of the foreign currency changing unfavorably. These risks may be in excess of the amounts reflected in the Statement of Assets and Liabilities.
15 Invesco European Small Company Fund
NOTE 2—Advisory Fees and Other Fees Paid to Affiliates
The Trust has entered into a master investment advisory agreement with Invesco Advisers, Inc. (the “Adviser” or “Invesco”). Under the terms of the investment advisory agreement, the Fund pays an advisory fee to the Adviser based on the annual rate of the Fund’s average daily net assets as follows:
| | | | | | |
| Average Daily Net Assets | | Rate |
First $250 million | | | 0 | .935% | | |
Next $250 million | | | 0 | .91% | | |
Next $500 million | | | 0 | .885% | | |
Next $1.5 billion | | | 0 | .86% | | |
Next $2.5 billion | | | 0 | .835% | | |
Next $2.5 billion | | | 0 | .81% | | |
Next $2.5 billion | | | 0 | .785% | | |
Over $10 billion | | | 0 | .76% | | |
For the year ended December 31, 2014, the effective advisory fees incurred by the Fund was 0.92%.
Under the terms of a master sub-advisory agreement between the Adviser and each of Invesco Asset Management Deutschland GmbH, Invesco Asset Management Limited, Invesco Asset Management (Japan) Limited, Invesco Australia Limited, Invesco Hong Kong Limited, Invesco Senior Secured Management, Inc. and Invesco Canada Ltd. (collectively, the “Affiliated Sub-Advisers”) the Adviser, not the Fund, may pay 40% of the fees paid to the Adviser to any such Affiliated Sub-Adviser(s) that provide(s) discretionary investment management services to the Fund based on the percentage of assets allocated to such Sub-Adviser(s).
The Adviser has contractually agreed, through at least June 30, 2015, to waive advisory fees and/or reimburse expenses of all shares to the extent necessary to limit total annual fund operating expenses after fee waiver and/or expense reimbursement (excluding certain items discussed below) of Class A, Class B, Class C and Class Y shares to 2.25%, 3.00%, 3.00% and 2.00%, respectively, of average daily net assets. In determining the Adviser’s obligation to waive advisory fees and/or reimburse expenses, the following expenses are not taken into account, and could cause the total annual fund operating expenses after fee waiver and/or expense reimbursement to exceed the numbers reflected above: (1) interest; (2) taxes; (3) dividend expense on short sales; (4) extraordinary or non-routine items, including litigation expenses; and (5) expenses that the Fund has incurred but did not actually pay because of an expense offset arrangement. Unless Invesco continues the fee waiver agreement, it will terminate on June 30, 2015. The fee waiver agreement cannot be terminated during its term. The Adviser did not waive fees and/or reimburse expenses during the period under this limitation.
Further, the Adviser has contractually agreed, through at least June 30, 2016, to waive the advisory fee payable by the Fund in an amount equal to 100% of the net advisory fees the Adviser receives from the affiliated money market funds on investments by the Fund of uninvested cash in such affiliated money market funds.
For the year ended December 31, 2014, the Adviser waived advisory fees of $129,952.
The Trust has entered into a master administrative services agreement with Invesco pursuant to which the Fund has agreed to pay Invesco for certain administrative costs incurred in providing accounting services to the Fund. For the year ended December 31, 2014, expenses incurred under the agreement are shown in the Statement of Operations as Administrative services fees.
The Trust has entered into a transfer agency and service agreement with Invesco Investment Services, Inc. (“IIS”) pursuant to which the Fund has agreed to pay IIS a fee for providing transfer agency and shareholder services to the Fund and reimburse IIS for certain expenses incurred by IIS in the course of providing such services. IIS may make payments to intermediaries that provide omnibus account services, sub-accounting services and/or networking services. All fees payable by IIS to intermediaries that provide omnibus account services or sub-accounting are charged back to the Fund, subject to certain limitations approved by the Trust’s Board of Trustees. For the year ended December 31, 2014, the expenses incurred under the agreement are shown in the Statement of Operations as Transfer agent fees.
The Trust has entered into master distribution agreements with Invesco Distributors, Inc. (“IDI”) to serve as the distributor for the Class A, Class B, Class C and Class Y shares of the Fund. The Trust has adopted plans pursuant to Rule 12b-1 under the 1940 Act with respect to the Fund’s Class A, Class B and Class C shares (collectively, the “Plans”). The Fund, pursuant to the Plans, pays IDI compensation at the annual rate of 0.25% of the Fund’s average daily net assets of Class A shares and 1.00% of the average daily net assets of each class of Class B and Class C shares. Of the Plan payments, up to 0.25% of the average daily net assets of each class of shares may be paid to furnish continuing personal shareholder services to customers who purchase and own shares of such classes. Any amounts not paid as a service fee under the Plans would constitute an asset-based sales charge. Rules of the Financial Industry Regulatory Authority (“FINRA”) impose a cap on the total sales charges, including asset-based sales charges, that may be paid by any class of shares of the Fund. For the year ended December 31, 2014, expenses incurred under the Plans are shown in the Statement of Operations as Distribution fees.
Front-end sales commissions and CDSC (collectively, the “sales charges”) are not recorded as expenses of the Fund. Front-end sales commissions are deducted from proceeds from the sales of Fund shares prior to investment in Class A shares of the Fund. CDSC are deducted from redemption proceeds prior to remittance to the shareholder. During the year ended December 31, 2014, IDI advised the Fund that IDI retained $1,290 in front-end sales commissions from the sale of Class A shares and $3,706, $5,114 and $10,544 from Class A, Class B and Class C shares, respectively, for CDSC imposed on redemptions by shareholders.
Certain officers and trustees of the Trust are officers and directors of the Adviser, IIS and/or IDI.
16 Invesco European Small Company Fund
NOTE 3—Additional Valuation Information
GAAP defines fair value as the price that would be received to sell an asset or paid to transfer a liability in an orderly transaction between market participants at the measurement date, under current market conditions. GAAP establishes a hierarchy that prioritizes the inputs to valuation methods, giving the highest priority to readily available unadjusted quoted prices in an active market for identical assets (Level 1) and the lowest priority to significant unobservable inputs (Level 3), generally when market prices are not readily available or are unreliable. Based on the valuation inputs, the securities or other investments are tiered into one of three levels. Changes in valuation methods may result in transfers in or out of an investment’s assigned level:
| | Level 1 — | Prices are determined using quoted prices in an active market for identical assets. |
| | Level 2 — | Prices are determined using other significant observable inputs. Observable inputs are inputs that other market participants may use in pricing a security. These may include quoted prices for similar securities, interest rates, prepayment speeds, credit risk, yield curves, loss severities, default rates, discount rates, volatilities and others. |
| | Level 3 — | Prices are determined using significant unobservable inputs. In situations where quoted prices or observable inputs are unavailable (for example, when there is little or no market activity for an investment at the end of the period), unobservable inputs may be used. Unobservable inputs reflect the Fund’s own assumptions about the factors market participants would use in determining fair value of the securities or instruments and would be based on the best available information. |
The following is a summary of the tiered valuation input levels, as of December 31, 2014. The level assigned to the securities valuations may not be an indication of the risk or liquidity associated with investing in those securities. Because of the inherent uncertainties of valuation, the values reflected in the financial statements may materially differ from the value received upon actual sale of those investments.
During the year ended December 31, 2014, there were transfers from Level 1 to Level 2 of $72,440,637 and from Level 2 to Level 1 of $50,657,228, due to foreign fair value adjustments.
| | | | | | | | | | | | | | | | |
| | | Level 1 | | | Level 2 | | | Level 3 | | | Total | |
Austria | | $ | — | | | $ | 4,833,449 | | | $ | — | | | $ | 4,833,449 | |
Belgium | | | 3,482,546 | | | | — | | | | — | | | | 3,482,546 | |
Finland | | | 1,783,687 | | | | — | | | | — | | | | 1,783,687 | |
France | | | 53,231,016 | | | | 43,812,064 | | | | — | | | | 97,043,080 | |
Germany | | | 20,515,696 | | | | 19,796,838 | | | | — | | | | 40,312,534 | |
Greece | | | 4,130,493 | | | | 976,644 | | | | — | | | | 5,107,137 | |
Ireland | | | 23,370,966 | | | | 13,573,657 | | | | — | | | | 36,944,623 | |
Israel | | | 9,509,810 | | | | — | | | | — | | | | 9,509,810 | |
Italy | | | 16,425,116 | | | | 4,148,304 | | | | — | | | | 20,573,420 | |
Norway | | | 13,753,944 | | | | 16,987,464 | | | | — | | | | 30,741,408 | |
Portugal | | | 1,047,598 | | | | — | | | | — | | | | 1,047,598 | |
Spain | | | 4,991,663 | | | | 6,471,450 | | | | — | | | | 11,463,113 | |
Switzerland | | | 9,870,506 | | | | 4,588,609 | | | | — | | | | 14,459,115 | |
Turkey | | | 7,238,206 | | | | — | | | | — | | | | 7,238,206 | |
United Kingdom | | | 21,483,726 | | | | 33,546,220 | | | | — | | | | 55,029,946 | |
United States | | | 8,851,540 | | | | — | | | | — | | | | 8,851,540 | |
Total Investments | | $ | 199,686,513 | | | $ | 148,734,699 | | | $ | — | | | $ | 348,421,212 | |
NOTE 4—Investments in Other Affiliates
The 1940 Act defines affiliates as those issuances in which a fund holds 5% or more of the outstanding voting securities. The Fund has not owned enough of the outstanding voting securities of the issuer to have control (as defined in the 1940 Act) of that issuer. The following is a summary of the investments in other affiliates for the year ended December 31, 2014.
| | | | | | | | | | | | | | | | | | | | | | | | | | | | |
| | | Value 12/31/13 | | | Purchases
at Cost | | | Proceeds
from Sales | | | Change in
Unrealized
Appreciation (Depreciation) | | | Realized
Gain (Loss) | | | Value 12/31/14 | | | Interest/
Dividend
Income | |
CENIT AG | | $ | 5,245,462 | | | $ | 1,454,022 | | | $ | — | | | $ | (85,623 | ) | | $ | — | | | $ | 6,613,861 | | | $ | 163,633 | |
Linedata Services | | | 15,226,746 | | | | — | | | | — | | | | (2,034,415 | ) | | | — | | | | 13,192,331 | | | | 367,804 | |
Total | | $ | 20,472,208 | | | $ | 1,454,022 | | | $ | — | | | $ | (2,120,038 | ) | | $ | — | | | $ | 19,806,192 | | | $ | 531,437 | |
NOTE 5—Expense Offset Arrangement(s)
The expense offset arrangement is comprised of transfer agency credits which result from balances in demand deposit accounts used by the transfer agent for clearing shareholder transactions. For the year ended December 31, 2014, the Fund received credits from this arrangement, which resulted in the reduction of the Fund’s total expenses of $1,098.
17 Invesco European Small Company Fund
NOTE 6—Trustees’ and Officers’ Fees and Benefits
Trustees’ and Officers’ Fees and Benefits include amounts accrued by the Fund to pay remuneration to certain Trustees and Officers of the Fund. Trustees have the option to defer compensation payable by the Fund, and Trustees’ and Officers’ Fees and Benefits also include amounts accrued by the Fund to fund such deferred compensation amounts. Those Trustees who defer compensation have the option to select various Invesco Funds in which their deferral accounts shall be deemed to be invested. Finally, certain current Trustees were eligible to participate in a retirement plan that provided for benefits to be paid upon retirement to Trustees over a period of time based on the number of years of service. The Fund may have certain former Trustees who also participate in a retirement plan and receive benefits under such plan. Trustees’ and Officers’ Fees and Benefits include amounts accrued by the Fund to fund such retirement benefits. Obligations under the deferred compensation and retirement plans represent unsecured claims against the general assets of the Fund.
NOTE 7—Cash Balances
The Fund is permitted to temporarily carry a negative or overdrawn balance in its account with State Street Bank and Trust Company, the custodian bank. Such balances, if any at period end, are shown in the Statement of Assets and Liabilities under the payable caption Amount due custodian. To compensate the custodian bank for such overdrafts, the overdrawn Fund may either (1) leave funds as a compensating balance in the account so the custodian bank can be compensated by earning the additional interest; or (2) compensate by paying the custodian bank at a rate agreed upon by the custodian bank and Invesco, not to exceed the contractually agreed upon rate.
NOTE 8—Distributions to Shareholders and Tax Components of Net Assets
Tax Character of Distributions to Shareholders Paid During the Fiscal Years Ended December 31, 2014 and 2013:
| | | | | | | | |
| | | 2014 | | | 2013 | |
Ordinary income | | $ | 7,467,427 | | | $ | 3,335,812 | |
Long-term capital gain | | | 30,454,607 | | | | 10,278,044 | |
Total distributions | | $ | 37,922,034 | | | $ | 13,613,856 | |
Tax Components of Net Assets at Period-End:
| | | | |
| | | 2014 | |
Undistributed ordinary income | | $ | 2,107,398 | |
Undistributed long-term gain | | | 11,564,333 | |
Net unrealized appreciation — investments | | | 11,394,084 | |
Net unrealized appreciation (depreciation) — other investments | | | (29,661 | ) |
Temporary book/tax differences | | | (86,008 | ) |
Shares of beneficial interest | | | 326,901,522 | |
Total net assets | | $ | 351,851,668 | |
The difference between book-basis and tax-basis unrealized appreciation (depreciation) is due to differences in the timing of recognition of gains and losses on investments for tax and book purposes. The Fund’s net unrealized appreciation difference is attributable primarily to passive foreign investment companies.
The temporary book/tax differences are a result of timing differences between book and tax recognition of income and/or expenses. The Fund’s temporary book/tax differences are the result of the trustee deferral of compensation and retirement plan benefits.
Capital loss carryforward is calculated and reported as of a specific date. Results of transactions and other activity after that date may affect the amount of capital loss carryforward actually available for the Fund to utilize. Capital losses generated in years beginning after December 22, 2010 can be carried forward for an unlimited period, whereas previous losses expire in eight tax years. Capital losses with an expiration period may not be used to offset capital gains until all net capital losses without an expiration date have been utilized. Capital loss carryforwards with no expiration date will retain their character as either short-term or long-term capital losses instead of as short-term capital losses as under prior law. The ability to utilize capital loss carryforwards in the future may be limited under the Internal Revenue Code and related regulations based on the results of future transactions.
The Fund does not have a capital loss carryforward as of December 31, 2014.
NOTE 9—Investment Securities
The aggregate amount of investment securities (other than short-term securities, U.S. Treasury obligations and money market funds, if any) purchased and sold by the Fund during the year ended December 31, 2014 was $65,882,726 and $167,177,584, respectively. Cost of investments on a tax basis includes the adjustments for financial reporting purposes as of the most recently completed federal income tax reporting period-end.
| | | | |
| Unrealized Appreciation (Depreciation) of Investment Securities on a Tax Basis | |
Aggregate unrealized appreciation of investment securities | | $ | 50,057,697 | |
Aggregate unrealized (depreciation) of investment securities | | | (38,663,613 | ) |
Net unrealized appreciation of investment securities | | $ | 11,394,084 | |
Cost of investments for tax purposes is $ 337,027,128.
18 Invesco European Small Company Fund
NOTE 10—Reclassification of Permanent Differences
Primarily as a result of differing book/tax treatment of foreign currency transactions, on December 31, 2014, undistributed net investment income was decreased by $166,065 and undistributed net realized gain was increased by $166,065. This reclassification had no effect on the net assets of the Fund.
NOTE 11—Share Information
| | | | | | | | | | | | | | | | |
| | | Summary of Share Activity | |
| | | Years ended December 31, | |
| | | 2014(a) | | | 2013 | |
| | | Shares | | | Amount | | | Shares | | | Amount | |
Sold: | | | | | | | | | | | | | | | | |
Class A | | | 171,206 | | | $ | 2,315,482 | | | | 16,278,047 | | | $ | 224,911,234 | |
Class B | | | 2,691 | | | | 37,777 | | | | 46,513 | | | | 582,192 | |
Class C | | | 10,795 | | | | 136,553 | | | | 2,574,241 | | | | 33,591,569 | |
Class Y | | | 4,888,149 | | | | 67,521,219 | | | | 20,103,040 | | | | 283,458,412 | |
| | | | |
Issued as reinvestment of dividends: | | | | | | | | | | | | | | | | |
Class A | | | 1,453,648 | | | | 17,850,801 | | | | 437,330 | | | | 6,323,790 | |
Class B | | | 23,882 | | | | 276,556 | | | | 6,444 | | | | 88,157 | |
Class C | | | 298,929 | | | | 3,467,581 | | | | 64,276 | | | | 880,574 | |
Class Y | | | 1,030,082 | | | | 12,690,602 | | | | 395,302 | | | | 5,735,830 | |
| | | | |
Automatic conversion of Class B shares to Class A shares: | | | | | | | | | | | | | | | | |
Class A | | | 64,307 | | | | 962,022 | | | | 193,685 | | | | 2,421,977 | |
Class B | | | (68,207 | ) | | | (962,022 | ) | | | (204,428 | ) | | | (2,421,977 | ) |
| | | | |
Reacquired: | | | | | | | | | | | | | | | | |
Class A | | | (8,407,365 | ) | | | (122,762,784 | ) | | | (4,081,519 | ) | | | (55,933,066 | ) |
Class B | | | (83,323 | ) | | | (1,180,957 | ) | | | (84,690 | ) | | | (1,059,222 | ) |
Class C | | | (1,030,443 | ) | | | (13,818,863 | ) | | | (367,816 | ) | | | (4,610,452 | ) |
Class Y | | | (13,885,483 | ) | | | (198,329,999 | ) | | | (3,559,959 | ) | | | (48,874,870 | ) |
Net increase (decrease) in share activity | | | (15,531,132 | ) | | $ | (231,796,032 | ) | | | 31,800,466 | | | $ | 445,094,148 | |
| (a) | There are entities that are record owners of more than 5% of the outstanding shares of the Fund and in the aggregate own 42% of the outstanding shares of the Fund. IDI has an agreement with these entities to sell Fund shares. The Fund, Invesco and/or Invesco affiliates may make payments to these entities, which are considered to be related to the Fund, for providing services to the Fund, Invesco and/or Invesco affiliates including but not limited to services such as securities brokerage, distribution, third party record keeping and account servicing. The Fund has no knowledge as to whether all or any portion of the shares owned of record by these entities are also owned beneficially. |
19 Invesco European Small Company Fund
NOTE 12—Financial Highlights
The following schedule presents financial highlights for a share of the Fund outstanding throughout the periods indicated.
| | | | | | | | | | | | | | | | | | | | | | | | | | | | | | | | | | | | | | | | | | | | | | | | | | | | | | | | |
| | | Net asset
value,
beginning
of period | | | Net
investment
income(a) | | | Net gains
(losses)
on securities
(both
realized and
unrealized) | | | Total from
investment
operations | | | Dividends
from net
investment
income | | | Distributions
from net
realized
gains | | | Total
distributions | | | Net asset
value, end
of period(b) | | | Total
return(c) | | | Net assets,
end of period
(000’s omitted) | | | Ratio of
expenses
to average
net assets
with fee waivers
and/or expenses
absorbed | | | Ratio of
expenses
to average net
assets without
fee waivers
and/or expenses
absorbed | | | Ratio of net
investment
income
to average
net assets | | | Portfolio
turnover(d) | |
Class A | | | | | | | | | | | | | | | | | | | | | | | | | | | | | | | | | | | | | | | | | | | | | | | | | | | | | | | | |
Year ended 12/31/14 | | $ | 14.85 | | | $ | 0.26 | (e) | | $ | (1.31 | ) | | $ | (1.05 | ) | | $ | (0.28 | ) | | $ | (1.16 | ) | | $ | (1.44 | ) | | $ | 12.36 | | | | (7.02 | )% | | $ | 173,809 | | | | 1.39 | %(f) | | | 1.41 | %(f) | | | 1.72 | %(e)(f) | | | 14 | % |
Year ended 12/31/13 | | | 11.56 | | | | 0.12 | | | | 3.48 | | | | 3.60 | | | | (0.07 | ) | | | (0.24 | ) | | | (0.31 | ) | | | 14.85 | | | | 31.18 | | | | 308,622 | | | | 1.46 | | | | 1.49 | | | | 0.88 | | | | 9 | |
Year ended 12/31/12 | | | 9.33 | | | | 0.17 | | | | 2.70 | | | | 2.87 | | | | (0.15 | ) | | | (0.49 | ) | | | (0.64 | ) | | | 11.56 | | | | 31.04 | | | | 91,980 | | | | 1.69 | | | | 1.70 | | | | 1.57 | | | | 18 | |
Year ended 12/31/11 | | | 11.51 | | | | 0.18 | | | | (1.57 | ) | | | (1.39 | ) | | | (0.46 | ) | | | (0.33 | ) | | | (0.79 | ) | | | 9.33 | �� | | | (12.24 | ) | | | 71,829 | | | | 1.66 | | | | 1.67 | | | | 1.59 | | | | 20 | |
Year ended 12/31/10 | | | 9.88 | | | | 0.15 | | | | 1.68 | | | | 1.83 | | | | (0.20 | ) | | | — | | | | (0.20 | ) | | | 11.51 | | | | 18.55 | | | | 100,142 | | | | 1.70 | | | | 1.71 | | | | 1.42 | | | | 21 | |
Class B | | | | | | | | | | | | | | | | | | | | | | | | | | | | | | | | | | | | | | | | | | | | | | | | | | | | | | | | |
Year ended 12/31/14 | | | 14.05 | | | | 0.14 | (e) | | | (1.23 | ) | | | (1.09 | ) | | | (0.15 | ) | | | (1.16 | ) | | | (1.31 | ) | | | 11.65 | | | | (7.71 | ) | | | 2,938 | | | | 2.14 | (f) | | | 2.16 | (f) | | | 0.97 | (e)(f) | | | 14 | |
Year ended 12/31/13 | | | 10.99 | | | | 0.02 | | | | 3.29 | | | | 3.31 | | | | (0.01 | ) | | | (0.24 | ) | | | (0.25 | ) | | | 14.05 | | | | 30.14 | | | | 5,299 | | | | 2.21 | | | | 2.24 | | | | 0.13 | | | | 9 | |
Year ended 12/31/12 | | | 8.89 | | | | 0.08 | | | | 2.58 | | | | 2.66 | | | | (0.07 | ) | | | (0.49 | ) | | | (0.56 | ) | | | 10.99 | | | | 30.14 | | | | 6,738 | | | | 2.44 | | | | 2.45 | | | | 0.82 | | | | 18 | |
Year ended 12/31/11 | | | 10.85 | | | | 0.09 | | | | (1.48 | ) | | | (1.39 | ) | | | (0.24 | ) | | | (0.33 | ) | | | (0.57 | ) | | | 8.89 | | | | (12.94 | ) | | | 8,191 | | | | 2.41 | | | | 2.42 | | | | 0.84 | | | | 20 | |
Year ended 12/31/10 | | | 9.35 | | | | 0.07 | | | | 1.59 | | | | 1.66 | | | | (0.16 | ) | | | — | | | | (0.16 | ) | | | 10.85 | | | | 17.76 | | | | 13,621 | | | | 2.45 | | | | 2.46 | | | | 0.67 | | | | 21 | |
Class C | | | | | | | | | | | | | | | | | | | | | | | | | | | | | | | | | | | | | | | | | | | | | | | | | | | | | | | | |
Year ended 12/31/14 | | | 14.07 | | | | 0.14 | (e) | | | (1.24 | ) | | | (1.10 | ) | | | (0.15 | ) | | | (1.16 | ) | | | (1.31 | ) | | | 11.66 | | | | (7.78 | ) | | | 34,195 | | | | 2.14 | (f) | | | 2.16 | (f) | | | 0.97 | (e)(f) | | | 14 | |
Year ended 12/31/13 | | | 11.00 | | | | 0.02 | | | | 3.30 | | | | 3.32 | | | | (0.01 | ) | | | (0.24 | ) | | | (0.25 | ) | | | 14.07 | | | | 30.20 | | | | 51,379 | | | | 2.21 | | | | 2.24 | | | | 0.13 | | | | 9 | |
Year ended 12/31/12 | | | 8.90 | | | | 0.08 | | | | 2.58 | | | | 2.66 | | | | (0.07 | ) | | | (0.49 | ) | | | (0.56 | ) | | | 11.00 | | | | 30.11 | | | | 15,198 | | | | 2.44 | | | | 2.45 | | | | 0.82 | | | | 18 | |
Year ended 12/31/11 | | | 10.86 | | | | 0.09 | | | | (1.48 | ) | | | (1.39 | ) | | | (0.24 | ) | | | (0.33 | ) | | | (0.57 | ) | | | 8.90 | | | | (12.93 | ) | | | 12,765 | | | | 2.41 | | | | 2.42 | | | | 0.84 | | | | 20 | |
Year ended 12/31/10 | | | 9.36 | | | | 0.07 | | | | 1.59 | | | | 1.66 | | | | (0.16 | ) | | | — | | | | (0.16 | ) | | | 10.86 | | | | 17.74 | | | | 18,801 | | | | 2.45 | | | | 2.46 | | | | 0.67 | | | | 21 | |
Class Y | | | | | | | | | | | | | | | | | | | | | | | | | | | | | | | | | | | | | | | | | | | | | | | | | | | | | | | | |
Year ended 12/31/14 | | | 14.90 | | | | 0.30 | (e) | | | (1.32 | ) | | | (1.02 | ) | | | (0.33 | ) | | | (1.16 | ) | | | (1.49 | ) | | | 12.39 | | | | (6.81 | ) | | | 140,910 | | | | 1.14 | (f) | | | 1.16 | (f) | | | 1.97 | (e)(f) | | | 14 | |
Year ended 12/31/13 | | | 11.59 | | | | 0.16 | | | | 3.48 | | | | 3.64 | | | | (0.09 | ) | | | (0.24 | ) | | | (0.33 | ) | | | 14.90 | | | | 31.44 | | | | 288,198 | | | | 1.21 | | | | 1.24 | | | | 1.13 | | | | 9 | |
Year ended 12/31/12 | | | 9.35 | | | | 0.20 | | | | 2.71 | | | | 2.91 | | | | (0.18 | ) | | | (0.49 | ) | | | (0.67 | ) | | | 11.59 | | | | 31.38 | | | | 27,785 | | | | 1.44 | | | | 1.45 | | | | 1.82 | | | | 18 | |
Year ended 12/31/11 | | | 11.54 | | | | 0.21 | | | | (1.57 | ) | | | (1.36 | ) | | | (0.50 | ) | | | (0.33 | ) | | | (0.83 | ) | | | 9.35 | | | | (12.01 | ) | | | 13,842 | | | | 1.41 | | | | 1.42 | | | | 1.84 | | | | 20 | |
Year ended 12/31/10 | | | 9.90 | | | | 0.17 | | | | 1.69 | | | | 1.86 | | | | (0.22 | ) | | | — | | | | (0.22 | ) | | | 11.54 | | | | 18.89 | | | | 16,609 | | | | 1.45 | | | | 1.46 | | | | 1.67 | | | | 21 | |
| (a) | Calculated using average shares outstanding. |
| (b) | Includes redemption fees added to shares of beneficial interest which were less than $0.005 per share for the fiscal years ended prior to December 31, 2012. |
| (c) | Includes adjustments in accordance with accounting principles generally accepted in the United States of America and as such, the net asset value for financial reporting purposes and the returns based upon those net asset values may differ from the net asset value and returns for shareholder transactions. Does not include sales charges and is not annualized for periods less than one year, if applicable. |
| (d) | Portfolio turnover is calculated at the fund level and is not annualized for periods less than one year, if applicable. |
| (e) | Net investment income per share and the ratio of net investment income to average net assets include significant dividends received during the period. Net investment income per share and the ratio of net investment income to average net assets excluding the significant dividends are $0.18 and 1.23%, $0.07 and 0.48%, $0.07 and 0.48% and 0.22 and 1.48% for Class A, Class B, Class C and Class Y shares, respectively. |
| (f) | Ratios are based on average daily net assets (000’s omitted) of $262,671, $4,232, $47,521 and $223,740 for Class A, Class B, Class C and Class Y shares, respectively. |
20 Invesco European Small Company Fund
Report of Independent Registered Public Accounting Firm
To the Board of Trustees of AIM Funds Group (Invesco Funds Group)
and Shareholders of Invesco European Small Company Fund:
In our opinion, the accompanying statement of assets and liabilities, including the schedule of investments, and the related statements of operations and of changes in net assets and the financial highlights present fairly, in all material respects, the financial position of Invesco European Small Company Fund (one of the funds constituting AIM Funds Group (Invesco Funds Group), hereafter referred to as the “Fund”) at December 31, 2014, the results of its operations for the year then ended, the changes in its net assets for each of the two years in the period then ended and the financial highlights for each of the five years in the period then ended, in conformity with accounting principles generally accepted in the United States of America. These financial statements and financial highlights (hereafter referred to as “financial statements”) are the responsibility of the Fund’s management. Our responsibility is to express an opinion on these financial statements based on our audits. We conducted our audits of these financial statements in accordance with the standards of the Public Company Accounting Oversight Board (United States). Those standards require that we plan and perform the audit to obtain reasonable assurance about whether the financial statements are free of material misstatement. An audit includes examining, on a test basis, evidence supporting the amounts and disclosures in the financial statements, assessing the accounting principles used and significant estimates made by management, and evaluating the overall financial statement presentation. We believe that our audits, which included confirmation of securities at December 31, 2014 by correspondence with the custodian and brokers, and the application of alternative auditing procedures where confirmations of security purchases have not been received, provide a reasonable basis for our opinion.
PRICEWATERHOUSECOOPERS LLP
Houston, Texas
February 23, 2015
21 Invesco European Small Company Fund
Calculating your ongoing Fund expenses
Example
As a shareholder of the Fund, you incur two types of costs: (1) transaction costs, which may include sales charges (loads) on purchase payments or contingent deferred sales charges on redemptions, if any; and (2) ongoing costs, including management fees, distribution and/or service (12b-1) fees, and other Fund expenses. This example is intended to help you understand your ongoing costs (in dollars) of investing in the Fund and to compare these costs with ongoing costs of investing in other mutual funds. The example is based on an investment of $1,000 invested at the beginning of the period and held for the entire period July 1, 2014 through December 31, 2014.
Actual expenses
The table below provides information about actual account values and actual expenses. You may use the information in this table, together with the amount you invested, to estimate the expenses that you paid over the period. Simply divide your account value by $1,000 (for example, an $8,600 account value divided by $1,000 = 8.6), then multiply the result by the number in the table under the heading entitled “Actual Expenses Paid During Period” to estimate the expenses you paid on your account during this period.
Hypothetical example for comparison purposes
The table below also provides information about hypothetical account values and hypothetical expenses based on the Fund’s actual expense ratio and an assumed rate of return of 5% per year before expenses, which is not the Fund’s actual return.
The hypothetical account values and expenses may not be used to estimate the actual ending account balance or expenses you paid for the period. You may use this information to compare the ongoing costs of investing in the Fund and other funds. To do so, compare this 5% hypothetical example with the 5% hypothetical examples that appear in the shareholder reports of the other funds.
Please note that the expenses shown in the table are meant to highlight your ongoing costs only and do not reflect any transaction costs, such as sales charges (loads) on purchase payments or contingent deferred sales charges on redemptions, if any. Therefore, the hypothetical information is useful in comparing ongoing costs only, and will not help you determine the relative total costs of owning different funds. In addition, if these transaction costs were included, your costs would have been higher.
| | | | | | | | | | | | | | | | | | | | | | | | |
| Class | | Beginning
Account Value
(07/01/14) | | | ACTUAL | | | HYPOTHETICAL (5% annual return before expenses) | | | Annualized
Expense
Ratio | |
| | | Ending
Account Value
(12/31/14)1 | | | Expenses
Paid During
Period2 | | | Ending
Account Value
(12/31/14) | | | Expenses
Paid During
Period2 | | |
| A | | $ | 1,000.00 | | | $ | 865.20 | | | $ | 6.63 | | | $ | 1,018.10 | | | $ | 7.17 | | | | 1.41 | % |
| B | | | 1,000.00 | | | | 861.60 | | | | 10.14 | | | | 1,014.32 | | | | 10.97 | | | | 2.16 | |
| C | | | 1,000.00 | | | | 861.70 | | | | 10.14 | | | | 1,014.32 | | | | 10.97 | | | | 2.16 | |
| Y | | | 1,000.00 | | | | 866.40 | | | | 5.46 | | | | 1,019.36 | | | | 5.90 | | | | 1.16 | |
| 1 | The actual ending account value is based on the actual total return of the Fund for the period July 1, 2014 through December 31, 2014, after actual expenses and will differ from the hypothetical ending account value which is based on the Fund’s expense ratio and a hypothetical annual return of 5% before expenses. |
| 2 | Expenses are equal to the Fund’s annualized expense ratio as indicated above multiplied by the average account value over the period, multiplied by 184/365 to reflect the most recent fiscal half year. |
22 Invesco European Small Company Fund
Tax Information
Form 1099-DIV, Form 1042-S and other year—end tax information provide shareholders with actual calendar year amounts that should be included in their tax returns. Shareholders should consult their tax advisors.
The following distribution information is being provided as required by the Internal Revenue Code or to meet a specific state’s requirement.
The Fund designates the following amounts or, if subsequently determined to be different, the maximum amount allowable for its fiscal year ended December 31, 2014:
| | | | |
Federal and State Income Tax | |
Long-Term Capital Gain Distributions | | $ | 30,454,607 | |
Qualified Dividend Income* | | | 100 | % |
Corporate Dividends Received Deduction* | | | 0.00 | % |
U.S. Treasury Obligations* | | | 0.00 | % |
Foreign Taxes | | $ | 0.0786 per s | hare |
Foreign Source Income | | $ | 0.7132 per s | hare |
| | * | The above percentages are based on ordinary income dividends paid to shareholders during the Fund’s fiscal year. |
23 Invesco European Small Company Fund
Trustees and Officers
The address of each trustee and officer is AIM Funds Group (Invesco Funds Group) (the “Trust”), 11 Greenway Plaza, Suite 1000, Houston, Texas 77046-1173. The trustees serve for the life of the Trust, subject to their earlier death, incapacitation, resignation, retirement or removal as more specifically provided in the Trust’s organizational documents. Each officer serves for a one year term or until their successors are elected and qualified. Column two below includes length of time served with predecessor entities, if any.
| | | | | | | | |
Name, Year of Birth and
Position(s) Held with the Trust | | Trustee and/
or Officer Since | | Principal Occupation(s)
During Past 5 Years | | Number of
Funds in Fund
Complex
Overseen by
Trustee | | Other Directorship(s)
Held by Trustee During
Past 5 Years |
| Interested Persons | | | | | | | | |
| Martin L. Flanagan1 — 1960 Trustee | | 2007 | | Executive Director, Chief Executive Officer and President, Invesco Ltd. (ultimate parent of Invesco and a global investment management firm); Advisor to the Board, Invesco Advisers, Inc. (formerly known as Invesco Institutional (N.A.), Inc.); Trustee, The Invesco Funds; Vice Chair, Investment Company Institute; and Member of Executive Board, SMU Cox School of Business Formerly: Chairman and Chief Executive Officer, Invesco Advisers, Inc. (registered investment adviser); Director, Chairman, Chief Executive Officer and President, IVZ Inc. (holding company), INVESCO Group Services, Inc. (service provider) and Invesco North American Holdings, Inc. (holding company); Director, Chief Executive Officer and President, Invesco Holding Company Limited (parent of Invesco and a global investment management firm); Director, Invesco Ltd.; Chairman, Investment Company Institute and President, Co-Chief Executive Officer, Co-President, Chief Operating Officer and Chief Financial Officer, Franklin Resources, Inc. (global investment management organization). | | 144 | | None |
Philip A. Taylor2 — 1954
Trustee, President and Principal Executive Officer | | 2006 | | Head of North American Retail and Senior Managing Director, Invesco Ltd.; Director, Co-Chairman, Co-President and Co-Chief Executive Officer, Invesco Advisers, Inc. (formerly known as Invesco Institutional (N.A.), Inc.) (registered investment adviser); Director, Chairman, Chief Executive Officer and President, Invesco Management Group, Inc. (formerly known as Invesco Aim Management Group, Inc.) (financial services holding company); Director and President, INVESCO Funds Group, Inc. (registered investment adviser and registered transfer agent); Director and Chairman, Invesco Investment Services, Inc. (formerly known as Invesco Aim Investment Services, Inc.) (registered transfer agent) and IVZ Distributors, Inc. (formerly known as INVESCO Distributors, Inc.) (registered broker dealer); Director, President and Chairman, Invesco Inc. (holding company) and Invesco Canada Holdings Inc. (holding company); Chief Executive Officer, Invesco Corporate Class Inc. (corporate mutual fund company) and Invesco Canada Fund Inc. (corporate mutual fund company); Director, Chairman and Chief Executive Officer, Invesco Canada Ltd. (formerly known as Invesco Trimark Ltd./Invesco Trimark Ltèe) (registered investment adviser and registered transfer agent); Trustee, President and Principal Executive Officer, The Invesco Funds (other than AIM Treasurer’s Series Trust (Invesco Treasurer’s Series Trust) and Short-Term Investments Trust); Trustee and Executive Vice President, The Invesco Funds (AIM Treasurer’s Series Trust (Invesco Treasurer’s Series Trust) and Short-Term Investments Trust only); Director, Invesco Investment Advisers LLC (formerly known as Van Kampen Asset Management); Director, Chief Executive Officer and President, Van Kampen Exchange Corp. Formerly: Director and Chairman, Van Kampen Investor Services Inc.; Director, Chief Executive Officer and President, 1371 Preferred Inc. (holding company) and Van Kampen Investments Inc.; Director and President, AIM GP Canada Inc. (general partner for limited partnerships) and Van Kampen Advisors, Inc.; Director and Chief Executive Officer, Invesco Trimark Dealer Inc. (registered broker dealer); Director, Invesco Distributors, Inc. (formerly known as Invesco Aim Distributors, Inc.) (registered broker dealer); Manager, Invesco PowerShares Capital Management LLC; Director, Chief Executive Officer and President, Invesco Advisers, Inc.; Director, Chairman, Chief Executive Officer and President, Invesco Aim Capital Management, Inc.; President, Invesco Trimark Dealer Inc. and Invesco Trimark Ltd./Invesco Trimark Ltèe; Director and President, AIM Trimark Corporate Class Inc. and AIM Trimark Canada Fund Inc.; Senior Managing Director, Invesco Holding Company Limited; Director and Chairman, Fund Management Company (former registered broker dealer); President and Principal Executive Officer, The Invesco Funds (AIM Treasurer’s Series Trust (Invesco Treasurer’s Series Trust), and Short-Term Investments Trust only); President, AIM Trimark Global Fund Inc. and AIM Trimark Canada Fund Inc. | | 144 | | None |
| Independent Trustees | | | | | | | | |
Bruce L. Crockett — 1944 Trustee and Chair | | 1987 | | Chairman, Crockett Technologies Associates (technology consulting company) Formerly: Director, Captaris (unified messaging provider); Director, President and Chief Executive Officer, COMSAT Corporation; Chairman, Board of Governors of INTELSAT (international communications company); ACE Limited (insurance company); and Investment Company Institute | | 144 | | ALPS (Attorneys Liability Protection Society) (insurance company) |
| 1 | Mr. Flanagan is considered an interested person (within the meaning of Section 2(a)(19) of the 1940 Act) of the Trust because he is an officer of the Adviser to the Trust, and an officer and a director of Invesco Ltd., ultimate parent of the Adviser. |
| 2 | Mr. Taylor is considered an interested person (within the meaning of Section 2(a)(19) of the 1940 Act) of the Trust because he is an officer and a director of the Adviser. |
T-1 Invesco European Small Company Fund
Trustees and Officers—(continued)
| | | | | | | | |
Name, Year of Birth and
Position(s) Held with the Trust | | Trustee and/
or Officer Since | | Principal Occupation(s)
During Past 5 Years | | Number of
Funds in Fund
Complex
Overseen by
Trustee | | Other Directorship(s)
Held by Trustee During
Past 5 Years |
| Independent Trustees—(continued) |
David C. Arch — 1945 Trustee | | 2010 | | Chairman of Blistex Inc., a consumer health care products manufacturer | | 144 | | Board member of the Illinois Manufacturers’ Association; Member of the Board of Visitors, Institute for the Humanities, University of Michigan; Member of the Audit Committee of the Edward-Elmhurst Hospital |
James T. Bunch — 1942 Trustee | | 2003 | | Managing Member, Grumman Hill Group LLC (family office private equity investments) Formerly: Founder, Green Manning & Bunch Ltd. (investment banking firm) (1988-2010); Executive Committee, United States Golf Association; and Director, Policy Studies, Inc. and Van Gilder Insurance Corporation | | 144 | | Chairman, Board of Governors, Western Golf Association; Chairman, Evans Scholars Foundation; and Director, Denver Film Society |
Rodney F. Dammeyer — 1940 Trustee | | 2010 | | Chairman of CAC, LLC, (private company offering capital investment and management advisory services) Formerly: Prior to 2001, Managing Partner at Equity Group Corporate Investments; Prior to 1995, Chief Executive Officer of Itel Corporation (formerly Anixter International); Prior to 1985, experience includes Senior Vice President and Chief Financial Officer of Household International, Inc., Executive Vice President and Chief Financial Officer of Northwest Industries, Inc. and Partner of Arthur Andersen & Co.; From 1987 to 2010, Director/Trustee of investment companies in the Van Kampen Funds complex | | 144 | | Director of Quidel Corporation and Stericycle, Inc. |
Albert R. Dowden — 1941 Trustee | | 2000 | | Director of a number of public and private business corporations, including the Boss Group, Ltd. (private investment and management); Nature’s Sunshine Products, Inc. and Reich & Tang Funds (5 portfolios) (registered investment company) Formerly: Director, Homeowners of America Holding Corporation/Homeowners of America Insurance Company (property casualty company); Director, Continental Energy Services, LLC (oil and gas pipeline service); Director, CompuDyne Corporation (provider of product and services to the public security market) and Director, Annuity and Life Re (Holdings), Ltd. (reinsurance company); Director, President and Chief Executive Officer, Volvo Group North America, Inc.; Senior Vice President, AB Volvo; Director of various public and private corporations; Chairman, DHJ Media, Inc.; Director, Magellan Insurance Company; and Director, The Hertz Corporation, Genmar Corporation (boat manufacturer), National Media Corporation; Advisory Board of Rotary Power International (designer, manufacturer, and seller of rotary power engines); and Chairman, Cortland Trust, Inc. (registered investment company) | | 144 | | Director of: Nature’s Sunshine Products, Inc., Reich & Tang Funds, Homeowners of America Holding Corporation/ Homeowners of America Insurance Company, the Boss Group |
Jack M. Fields — 1952 Trustee | | 1997 | | Chief Executive Officer, Twenty First Century Group, Inc. (government affairs company); Owner and Chief Executive Officer, Dos Angeles Ranch, L.P. (cattle, hunting, corporate entertainment); and Discovery Global Education Fund (non-profit) Formerly: Chief Executive Officer, Texana Timber LP (sustainable forestry company); Director of Cross Timbers Quail Research Ranch (non-profit); and member of the U.S. House of Representatives | | 144 | | Insperity, Inc. (formerly known as Administaff) |
Prema Mathai-Davis — 1950 Trustee | | 1998 | | Retired. Formerly: Chief Executive Officer, YWCA of the U.S.A. | | 144 | | None |
Larry Soll — 1942 Trustee | | 2003 | | Retired. Formerly: Chairman, Chief Executive Officer and President, Synergen Corp. (a biotechnology company) | | 144 | | None |
Hugo F. Sonnenschein — 1940 Trustee | | 2010 | | President Emeritus and Honorary Trustee of the University of Chicago and the Adam Smith Distinguished Service Professor in the Department of Economics at the University of Chicago. Prior to 2000, President of the University of Chicago | | 144 | | Trustee of the University of Rochester and a member of its investment committee; Member of the National Academy of Sciences and the American Philosophical Society; Fellow of the American Academy of Arts and Sciences |
Raymond Stickel, Jr. — 1944 Trustee | | 2005 | | Retired. Formerly: Director, Mainstay VP Series Funds, Inc. (25 portfolios) and Partner, Deloitte & Touche | | 144 | | None |
T-2 Invesco European Small Company Fund
Trustees and Officers—(continued)
| | | | | | | | |
Name, Year of Birth and
Position(s) Held with the Trust | | Trustee and/
or Officer Since | | Principal Occupation(s)
During Past 5 Years | | Number of
Funds in Fund
Complex
Overseen by
Trustee | | Other Directorship(s)
Held by Trustee During
Past 5 Years |
| Independent Trustees—(continued) |
Suzanne H. Woolsey — 1941 Trustee | | 2014 | | Chief Executive Officer of Woolsey Partners LLC | | 144 | | Emeritus Chair of the Board of Trustees of the Institute for Defense Analyses; Trustee of Colorado College; Trustee of California Institute of Technology; Prior to 2014, Director of Fluor Corp.; Prior to 2010, Trustee of the German Marshall Fund of the United States; Prior to 2010 Trustee of the Rocky Mountain Institute |
| Other Officers | | | | | | | | |
Russell C. Burk — 1958
Senior Vice President and Senior Officer | | 2005 | | Senior Vice President and Senior Officer, The Invesco Funds | | N/A | | N/A |
John M. Zerr — 1962
Senior Vice President, Chief Legal Officer and Secretary | | 2006 | | Director, Senior Vice President, Secretary and General Counsel, Invesco Management Group, Inc. (formerly known as Invesco Aim Management Group, Inc.) and Van Kampen Exchange Corp.; Senior Vice President, Invesco Advisers, Inc. (formerly known as Invesco Institutional (N.A.), Inc.) (registered investment adviser); Senior Vice President and Secretary, Invesco Distributors, Inc. (formerly known as Invesco Aim Distributors, Inc.); Director, Vice President and Secretary, Invesco Investment Services, Inc. (formerly known as Invesco Aim Investment Services, Inc.) and IVZ Distributors, Inc. (formerly known as INVESCO Distributors, Inc.); Director and Vice President, INVESCO Funds Group, Inc.; Senior Vice President, Chief Legal Officer and Secretary, The Invesco Funds; Manager, Invesco PowerShares Capital Management LLC; Director, Secretary and General Counsel, Invesco Investment Advisers LLC (formerly known as Van Kampen Asset Management); Secretary and General Counsel, Invesco Capital Markets, Inc. (formerly known as Van Kampen Funds Inc.) and Chief Legal Officer, PowerShares Exchange-Traded Fund Trust, PowerShares Exchange-Traded Fund Trust II, PowerShares India Exchange-Traded Fund Trust , PowerShares Actively Managed Exchange-Traded Fund Trust; and PowerShares Actively Managed Exchange-Traded Commodity Fund Trust Formerly: Director and Vice President, Van Kampen Advisors Inc.; Director, Vice President, Secretary and General Counsel, Van Kampen Investor Services Inc.; Director, Invesco Distributors, Inc. (formerly known as Invesco Aim Distributors, Inc.); Director, Senior Vice President, General Counsel and Secretary, Invesco Aim Advisers, Inc. and Van Kampen Investments Inc.; Director, Vice President and Secretary, Fund Management Company; Director, Senior Vice President, Secretary, General Counsel and Vice President, Invesco Aim Capital Management, Inc.; Chief Operating Officer and General Counsel, Liberty Ridge Capital, Inc. (an investment adviser); Vice President and Secretary, PBHG Funds (an investment company) and PBHG Insurance Series Fund (an investment company); Chief Operating Officer, General Counsel and Secretary, Old Mutual Investment Partners (a broker-dealer); General Counsel and Secretary, Old Mutual Fund Services (an administrator) and Old Mutual Shareholder Services (a shareholder servicing center); Executive Vice President, General Counsel and Secretary, Old Mutual Capital, Inc. (an investment adviser); and Vice President and Secretary, Old Mutual Advisors Funds (an investment company) | | N/A | | N/A |
Sheri Morris — 1964
Vice President, Treasurer and Principal Financial Officer | | 1999 | | Vice President, Treasurer and Principal Financial Officer, The Invesco Funds; Vice President, Invesco Advisers, Inc. (formerly known as Invesco Institutional (N.A.), Inc.) (registered investment adviser); and Vice President, PowerShares Exchange-Traded Fund Trust, PowerShares Exchange-Traded Fund Trust II, PowerShares India Exchange-Traded Fund Trust, PowerShares Actively Managed Exchange-Traded Fund Trust, and PowerShares Actively Managed Exchange-Traded Commodity Fund Trust Formerly: Vice President, Invesco Aim Advisers, Inc., Invesco Aim Capital Management, Inc. and Invesco Aim Private Asset Management, Inc.; Assistant Vice President and Assistant Treasurer, The Invesco Funds and Assistant Vice President, Invesco Advisers, Inc., Invesco Aim Capital Management, Inc. and Invesco Aim Private Asset Management, Inc.; and Treasurer, PowerShares Exchange-Traded Fund Trust, PowerShares Exchange-Traded Fund Trust II, PowerShares India Exchange-Traded Fund Trust and PowerShares Actively Managed Exchange-Traded Fund Trust | | N/A | | N/A |
T-3 Invesco European Small Company Fund
Trustees and Officers—(continued)
| | | | | | | | |
Name, Year of Birth and
Position(s) Held with the Trust | | Trustee and/
or Officer Since | | Principal Occupation(s)
During Past 5 Years | | Number of
Funds in Fund
Complex
Overseen by
Trustee | | Other Directorship(s)
Held by Trustee During
Past 5 Years |
| Other Officers—(continued) | | | | | | | | |
Karen Dunn Kelley — 1960
Vice President | | 1992 | | Senior Managing Director, Investments; Director, Co-President, Co-Chief Executive Officer, and Co-Chairman, Invesco Advisers, Inc. (formerly known as Invesco Institutional (N.A.), Inc.) (registered investment adviser); Chairman, Invesco Senior Secured Management, Inc.; Senior Vice President, Invesco Management Group, Inc. (formerly known as Invesco Aim Management Group, Inc.); Executive Vice President, Invesco Distributors, Inc. (formerly known as Invesco Aim Distributors, Inc.); Director, Invesco Mortgage Capital Inc. and Invesco Management Company Limited; Director and President, INVESCO Asset Management (Bermuda) Ltd., Vice President, The Invesco Funds (other than AIM Treasurer’s Series Trust (Invesco Treasurer’s Series Trust) and Short-Term Investments Trust); and President and Principal Executive Officer, The Invesco Funds (AIM Treasurer’s Series Trust (Invesco Treasurer’s Series Trust) and Short-Term Investments Trust only) Formerly: Director, INVESCO Global Asset Management Limited and INVESCO Management S.A.; Senior Vice President, Van Kampen Investments Inc. and Invesco Advisers, Inc. (formerly known as Invesco Institutional (N.A.), Inc.) (registered investment adviser); Vice President, Invesco Advisers, Inc. (formerly known as Invesco Institutional (N.A.), Inc.); Director of Cash Management and Senior Vice President, Invesco Advisers, Inc. and Invesco Aim Capital Management, Inc.; Director and President, Fund Management Company; Chief Cash Management Officer, Director of Cash Management, Senior Vice President, and Managing Director, Invesco Aim Capital Management, Inc.; Director of Cash Management, Senior Vice President, and Vice President, Invesco Advisers, Inc. and The Invesco Funds (AIM Treasurer’s Series Trust (Invesco Treasurer’s Series Trust), and Short-Term Investments Trust only) | | N/A | | N/A |
Crissie M. Wisdom — 1969
Anti-Money Laundering Compliance Officer | | 2013 | | Anti-Money Laundering Compliance Officer, Invesco Advisers, Inc. (formerly known as Invesco Institutional (N.A.), Inc.) (registered investment adviser), Invesco Capital Markets, Inc. (formerly known as Van Kampen Funds Inc.), Invesco Distributors, Inc., Invesco Investment Services, Inc., Invesco Management Group, Inc., Van Kampen Exchange Corp., The Invesco Funds, and PowerShares Exchange-Traded Fund Trust, PowerShares Exchange-Traded Fund Trust II, PowerShares India Exchange-Traded Fund Trust, PowerShares Actively Managed Exchange-Traded Fund Trust and PowerShares Actively Managed Exchange-Traded Commodity Fund Trust; and Fraud Prevention Manager and Controls and Risk Analysis Manager for Invesco Investment Services, Inc. | | N/A | | N/A |
Todd L. Spillane — 1958
Chief Compliance Officer | | 2006 | | Senior Vice President, Invesco Management Group, Inc. (formerly known as Invesco Aim Management Group, Inc.) and Van Kampen Exchange Corp.; Senior Vice President and Chief Compliance Officer, Invesco Advisers, Inc. (registered investment adviser) (formerly known as Invesco Institutional (N.A.), Inc.); Chief Compliance Officer, The Invesco Funds; Vice President, Invesco Distributors, Inc. (formerly known as Invesco Aim Distributors, Inc.) and Invesco Investment Services, Inc. (formerly known as Invesco Aim Investment Services, Inc.) Formerly: Chief Compliance Officer, Invesco Funds (Chicago); Senior Vice President, Van Kampen Investments Inc.; Senior Vice President and Chief Compliance Officer, Invesco Aim Advisers, Inc. and Invesco Aim Capital Management, Inc.; Chief Compliance Officer, INVESCO Private Capital Investments, Inc. (holding company), Invesco Private Capital, Inc. (registered investment adviser), Invesco Global Asset Management (N.A.), Inc., Invesco Senior Secured Management, Inc. (registered investment adviser), Van Kampen Investor Services Inc., PowerShares Exchange-Traded Fund Trust, PowerShares Exchange-Traded Fund Trust II, PowerShares India Exchange-Traded Fund Trust and PowerShares Actively Managed Exchange-Traded Fund Trust; and Vice President, Invesco Aim Capital Management, Inc. and Fund Management Company | | N/A | | N/A |
The Statement of Additional Information of the Trust includes additional information about the Fund’s Trustees and is available upon request, without charge, by calling 1.800.959.4246. Please refer to the Fund’s prospectus for information on the Fund’s sub-advisers.
| | | | | | |
Office of the Fund 11 Greenway Plaza, Suite 1000 Houston, TX 77046-1173 | | Investment Adviser Invesco Advisers, Inc.
1555 Peachtree Street, N.E.
Atlanta, GA 30309 | | Distributor Invesco Distributors, Inc. 11 Greenway Plaza, Suite 1000 Houston, TX 77046-1173 | | Auditors PricewaterhouseCoopers LLP 1000 Louisiana Street, Suite 5800 Houston, TX 77002-5678 |
| | | |
| | | | | | |
Counsel to the Fund Stradley Ronon Stevens & Young, LLP 2005 Market Street, Suite 2600 Philadelphia, PA 19103-7018 | | Counsel to the Independent Trustees Goodwin Procter LLP 901 New York Avenue, N.W. Washington, D.C. 20001 | | Transfer Agent Invesco Investment Services, Inc. 11 Greenway Plaza, Suite 1000 Houston, TX 77046-1173 | | Custodian State Street Bank and Trust Company 225 Franklin Street Boston, MA 02110-2801 |
T-4 Invesco European Small Company Fund

Invesco mailing information
Send general correspondence to Invesco Investment Services, Inc., P.O. Box 219078, Kansas City, MO 64121-9078.
Important notice regarding delivery of security holder documents
To reduce Fund expenses, only one copy of most shareholder documents may be mailed to shareholders with multiple accounts at the same address (Householding). Mailing of your shareholder documents may be householded indefinitely unless you instruct us otherwise. If you do not want the mailing of these documents to be combined with those for other members of your household, please contact Invesco Investment Services, Inc. at 800 959 4246 or contact your financial institution. We will begin sending you individual copies for each account within 30 days after receiving your request.
Fund holdings and proxy voting information
The Fund provides a complete list of its holdings four times in each fiscal year, at the quarter ends. For the second and fourth quarters, the lists appear in the Fund’s semiannual and annual reports to shareholders. For the first and third quarters, the Fund files the lists with the Securities and Exchange Commission (SEC) on Form N-Q. The most recent list of portfolio holdings is available at invesco.com/completeqtrholdings. Shareholders can also look up the Fund’s Forms N-Q on the SEC website at sec.gov. Copies of the Fund’s Forms N-Q may be reviewed and copied at the SEC Public Reference Room in Washington, D.C. You can obtain information on the operation of the Public Reference Room, including information about duplicating fee charges, by calling 202 551 8090 or 800 732 0330, or by electronic request at the following email address: publicinfo@sec.gov. The SEC file numbers for the Fund are shown below.
| | |
A description of the policies and procedures that the Fund uses to determine how to vote proxies relating to portfolio securities is available without charge, upon request, from our Client Services department at 800 959 4246 or at invesco.com/proxyguidelines. The information is also available on the SEC website, sec.gov. |
Information regarding how the Fund voted proxies related to its portfolio securities during the most recent 12-month period ended June 30 is available at invesco.com/proxysearch. The information is also available on the SEC website, sec.gov. Invesco Advisers, Inc. is an investment adviser; it provides investment advisory services to individual and institutional clients and does not sell securities. Invesco Distributors, Inc. is the US distributor for Invesco Ltd.’s retail mutual funds, exchange-traded funds and institutional money market funds. Both are wholly owned, indirect subsidiaries of Invesco Ltd. | |  |
| |
| | | | |
| SEC file numbers: 811-01540 and 002-27334 | | ESC-AR-1 | | Invesco Distributors, Inc. |
| | | | |
| | |
 | | Annual Report to Shareholders | | December 31, 2014 |
| | |
| Invesco Global Core Equity Fund Nasdaq: A: AWSAX n B: AWSBX n C: AWSCX n R: AWSRX n Y: AWSYX n R5: AWSIX |

Letters to Shareholders
| | | | |

Philip Taylor | | | | Dear Shareholders: This annual report includes information about your Fund, including performance data and a complete list of its investments as of the close of the reporting period. Inside, your Fund’s portfolio managers discuss how they managed your Fund and the factors that affected its performance during the reporting period. I hope you find this report of interest. During the reporting period, the US economy showed unmistakable signs of improvement. After contracting in the first quarter of 2014, the economy expanded strongly in the second and third quarters as employment data improved markedly. Given continuing positive economic trends, the US Federal Reserve (the Fed) ended its extraordinary asset purchase program in October – but it pledged in December to be “patient” before raising interest rates. Overseas, the story was much different. Concerns about economic stagnation and the potential for |
deflation depressed European markets, while the Chinese economy was hurt by a slowdown in manufacturing.
Political change in Washington, DC; changes to monetary policy by the Fed and other central banks; the future direction of oil prices; and unexpected geopolitical events are likely to affect markets in the US and overseas in 2015. This may make some investors hesitant to begin to save for their long-term financial goals. That’s why Invesco has always encouraged investors to work with a professional financial adviser who can stress the importance of starting to save and invest early and the importance of adhering to a disciplined investment plan – when times are good and when they’re uncertain. A financial adviser who knows your unique financial situation, investment goals and risk tolerance can be an invaluable partner as you seek to achieve your financial goals. He or she can offer a long-term perspective when markets are volatile and time-tested advice and guidance when your financial situation or investment goals change.
Timely information when and where you want it
Invesco’s efforts to help investors achieve their financial objectives include providing individual investors and financial professionals with timely information about the markets, the economy and investing – whenever and wherever they want it.
Our website, invesco.com/us, offers a wide range of market insights and investment perspectives. On the website, you’ll find detailed information about our funds, including prices, performance, holdings and portfolio manager commentaries. You can access information about your individual Invesco account whenever it’s convenient for you; just complete a simple, secure online registration. Use the “Log In” box on our home page to get started.
Invesco’s mobile apps for iPhone® and iPad® (both available free from the App StoreSM) allow you to obtain the same detailed information, monitor your account and create customizable watch lists. Also, they allow you to access investment insights from our investment leaders, market strategists, economists and retirement experts. You can sign up to be alerted when new commentary is added, and you can watch portfolio manager videos and have instant access to Invesco news and updates wherever you may be.
In addition to the resources accessible on our website and through our mobile app, you can obtain timely updates to help you stay informed about the markets, the economy and investing by connecting with Invesco on Twitter, LinkedIn or Facebook. You can access our blog at blog.invesco.us.com. Our goal is to provide you the information you want, when and where you want it.
Have questions?
For questions about your account, feel free to contact an Invesco client services representative at 800 959 4246. For Invesco-related questions or comments, please email me directly at phil@invesco.com.
All of us at Invesco look forward to serving your investment management needs for many years to come. Thank you for investing with us.
Sincerely,

Philip Taylor
Senior Managing Director, Invesco Ltd.
iPhone and iPad are trademarks of Apple Inc., registered in the US and other countries. App Store is a service mark of Apple Inc. Invesco Distributors, Inc. is not affiliated with Apple Inc.
2 Invesco Global Core Equity Fund
| | | | |

Bruce Crockett | | | | Dear Fellow Shareholders: Among the many important lessons I’ve learned in more than 40 years in a variety of business endeavors is the value of a trusted advocate. As independent chair of the Invesco Funds Board, I can assure you that the members of the Board are strong advocates for the interests of investors in Invesco’s mutual funds. We work hard to represent your interests through oversight of the quality of the investment management services your funds receive and other matters important to your investment, including but not limited to: n Ensuring that Invesco offers a diverse lineup of mutual funds that your financial adviser can use to strive to meet your financial needs as your investment goals change over time. n Monitoring how the portfolio management teams of the Invesco funds are performing in light of changing economic and market conditions. |
| n | | Assessing each portfolio management team’s investment performance within the context of the investment strategy described in the fund’s prospectus. |
| n | | Monitoring for potential conflicts of interests that may impact the nature of the services that your funds receive. |
We believe one of the most important services we provide our fund shareholders is the annual review of the funds’ advisory and sub-advisory contracts with Invesco Advisers and its affiliates. This review is required by the Investment Company Act of 1940 and focuses on the nature and quality of the services Invesco provides as the adviser to the Invesco funds and the reasonableness of the fees that it charges for those services. Each year, we spend months carefully reviewing information received from Invesco and a variety of independent sources, such as performance and fee data prepared by Lipper Inc., an independent, third-party firm widely recognized as a leader in its field. We also meet with our independent legal counsel and other independent advisers to review and help us assess the information that we have received. Our goal is to assure that you receive quality investment management services for a reasonable fee.
I trust the measures outlined above provide assurance that you have a worthy advocate when it comes to choosing the Invesco Funds.
As always, please contact me at bruce@brucecrockett.com with any questions or concerns you may have. On behalf of the Board, we look forward to continuing to represent your interests and serving your needs.
Sincerely,

Bruce L. Crockett
Independent Chair
Invesco Funds Board of Trustees
3 Invesco Global Core Equity Fund
Management’s Discussion of Fund Performance
Performance summary
For the year ended December 31, 2014, Invesco Global Core Equity Fund underperformed its broad market/style-specific benchmark, the MSCI World Index. Stock selection during the volatile year was a hindrance to the Fund’s performance. Stock selection within the financials and telecommunication services sectors generally contributed to Fund performance, while holdings in the consumer discretionary, industrials, information technology (IT) and materials sectors generally detracted from Fund performance during the reporting period.
Your Fund’s long-term performance appears later in this report.
Fund vs. Indexes
Total returns, 12/31/13 to 12/31/14, at net asset value (NAV). Performance shown does not include applicable contingent deferred sales charges (CDSC) or front-end sales charges, which would have reduced performance.
| | | | | |
| Class A Shares | | | | 0.38 | % |
| Class B Shares | | | | -0.33 | |
| Class C Shares | | | | -0.33 | |
| Class R Shares | | | | 0.24 | |
| Class Y Shares | | | | 0.73 | |
| Class R5 Shares | | | | 0.83 | |
| MSCI World Index‚ (Broad Market/Style-Specific Index) | | | | 4.94 | |
| Lipper Global Large-Cap Core Funds Indexn (Peer Group Index) | | | | 3.98 | |
Source(s): ‚FactSet Research Systems Inc.; nLipper Inc.
Market conditions and your Fund
Following a robust 2013, global equity markets began 2014 in a relatively quiet fashion. But then volatility returned as investors began to worry that stocks may have risen too far, too fast in 2013. Stocks rallied through the summer despite political upheaval in Ukraine and signs of economic sluggishness in China. Also, equity markets in Europe continued to show momentum, supported by the continent’s economic rebound. European Central Bank President Mario Draghi became the first major central banker to cut a key interest rate below zero and signaled a willingness to employ quantitative easing programs to prevent deflation. Investors appeared to interpret these measures as an indication that global interest rates would likely remain low longer than expected. As investors
wrestled with evidence that US growth appeared to be on stronger footing than the rest of the world, in mid-September the price of oil began a sharp decline, along with global equities. Despite the unknown economic impact of significantly lower oil prices for an extended period, global equity markets stabilized and recovered, ending the year in positive territory.
For the reporting period, the MSCI World Index delivered a positive return, with seven of the index’s 10 sectors posting positive returns. The energy, materials and telecommunication services sectors generated negative returns for the year. The health care sector had the highest return followed closely by the IT and utilities sectors.
The Fund stayed true to its process and benefited in certain sectors from its
quality orientation in stock selection. During 2014, select holdings in the financials and telecommunication services sectors contributed to Fund performance.
Hospital operator HCA Holdings was a top contributor for the reporting period. HCA owns and operates approximately 165 hospitals and approximately 115 freestanding surgery centers in the US and the UK. Citing higher patient admissions and benefits from the Affordable Care Act, HCA reported better-than-expected earnings and raised its earnings outlook during the year.
Also contributing to Fund results for the reporting period was Celgene, a biopharmaceutical company engaged in the research, development and commercialization of therapies designed to treat cancer and immune-inflammatory-related diseases. Celgene performed strongly during the reporting period due to general strength in the biotechnology group, a positive earnings report and growing evidence that patent issues affecting a key drug would be settled.
Berkshire Hathaway, Teva Pharmaceuticals and Kroger were other top performers for the Fund during the year. During 2014, Berkshire Hathaway entered into agreements to acquire numerous companies, which included Charter Brokerage, Duracell Battery, and Van Tuyl Group.
From a geographic perspective, Fund returns were aided by holdings in France, Germany, the Netherlands and the UK. During the reporting period, stock selection in Australia, Canada, Sweden and the US failed to keep pace with the MSCI World Index.
The largest detractors from Fund performance came from the consumer discretionary, industrials, IT and materials sectors.
| | | | | |
| Portfolio Composition | | |
By sector | | | | | |
| Financials | | | | 21.1 | % |
| Consumer Discretionary | | | | 16.8 | |
| Health Care | | | | 13.3 | |
| Industrials | | | | 13.3 | |
| Information Technology | | | | 12.6 | |
| Consumer Staples | | | | 10.4 | |
| Energy | | | | 7.7 | |
| Telecommunication Services | | | | 2.2 | |
| Materials | | | | 1.8 | |
| Money Market Funds Plus Other Assets Less Liabilities | | | | 0.8 | |
| | | | | |
| Top 10 Equity Holdings* |
| |
1. American Express Co. | | | | 3.0 | % |
2. Berkshire Hathaway Inc.- Class A | | | | 3.0 | |
3. International Business Machines Corp. | | | | 2.3 | |
4. QUALCOMM, Inc. | | | | 2.2 | |
5. ABB Ltd. | | | | 2.2 | |
6. Danone | | | | 2.0 | |
7. Progressive Corp. (The) | | | | 1.9 | |
8. Northern Trust Corp. | | | | 1.9 | |
9. ResMed Inc. | | | | 1.9 | |
10. Rio Tinto PLC | | | | 1.8 | |
| | | | | |
| Top Five Countries* |
| |
| 1. United States | | | | 51.5 | % |
2. United Kingdom | | | | 12.9 | |
3. Japan | | | | 8.6 | |
4. France | | | | 7.2 | |
5. Switzerland | | | | 5.3 | |
| | | | | |
| Total Net Assets | | | | $1.1 billion | |
| |
| Total Number of Holdings* | | | | 89 | |
The Fund’s holdings are subject to change, and there is no assurance that the Fund will continue to hold any particular security.
*Excluding money market fund holdings.
4 Invesco Global Core Equity Fund
One of the biggest individual detractors from Fund performance during the reporting period was Coach. Sales and pricing power at the luxury goods company remained weak, and we liquidated the Fund’s position during the reporting period.
Another notable detractor was Halliburton, which was significantly affected by the sharp decline in oil prices, as the energy sector was one of the worst-performing sectors for the reporting period on an absolute basis.
Shifts in sector and country weights were driven by our bottom-up stock selection approach. At the end of the reporting period, sectors in which the Fund had its greatest overweight exposure (relative to its broad market/style-specific index) included consumer discretionary, consumer staples and health care. Sectors in which the Fund was most underweight included energy, materials, telecommunication services and utilities.
During the year, the Fund decreased its exposure to Japan and had moderately underweight exposure to the US. The Fund’s largest overweight exposure compared to the MSCI World Index was in France and the UK.
We remain focused on companies that provide an attractive return on their invested capital, maintain a long-term perspective and trade at attractive valuations. Though markets are likely to remain volatile, we believe such companies may be better positioned to weather market volatility.
We welcome new investors who joined the Fund during the year, and we thank all our shareholders for your continued investment in Invesco Global Core Equity Fund.
The views and opinions expressed in management’s discussion of Fund performance are those of Invesco Advisers, Inc. These views and opinions are subject to change at any time based on factors such as market and economic conditions. These views and opinions may not be relied upon as investment advice or recommendations, or as an offer for a particular security. The information is not a complete analysis of every aspect of any market, country, industry, security or the Fund. Statements of fact are from sources considered reliable, but Invesco Advisers, Inc. makes no representation or warranty as to their completeness or accuracy. Although historical performance is no guarantee of future results, these insights may help you understand our investment management philosophy.
See important Fund and, if applicable, index disclosures later in this report.
| | |
 | | Erik Esselink Portfolio Manager, is manager of Invesco Global Core Equity Fund. He joined Invesco in 2007. |
| Mr. Esselink earned a Bachelor of Science degree from the Rotterdam School of Economics, where he studied commercial economics. |
| |
 | | Brian Nelson Chartered Financial Analyst, Portfolio Manager, is manager of Invesco Global Core Equity Fund. |
| He joined Invesco in 2004. Mr. Nelson earned a BA from the University of California, Santa Barbara. |
Assisted by Invesco’s Global Core
Equity team
5 Invesco Global Core Equity Fund
Your Fund’s Long-Term Performance
Results of a $10,000 Investment – Oldest Share Class(es)
Fund and index data from 12/31/04
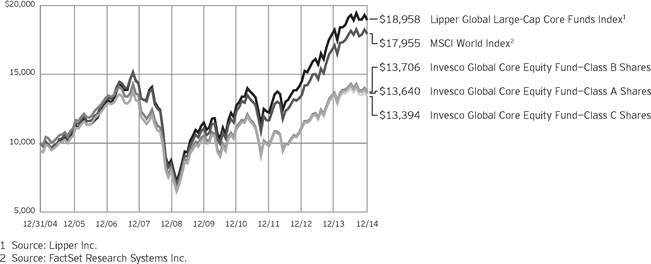
Past performance cannot guarantee comparable future results.
The data shown in the chart include reinvested distributions, applicable sales charges and Fund expenses including management fees. Results for Class B shares are calculated as if a hypothetical
shareholder had liquidated his entire investment in the Fund at the close of the reporting period and paid the contingent deferred sales charges, if applicable. Index results include reinvested dividends, but they do not reflect sales charges. Performance of the peer group,
if applicable, reflects fund expenses and management fees; performance of a market index does not. Performance shown in the chart and table(s) does not reflect deduction of taxes a shareholder would pay on Fund distributions or sale of Fund shares.
continued from page 8
and interest rate fluctuations.
| n | | Preferred securities risk. Preferred securities may include provisions that permit the issuer, in its discretion, to defer or omit distributions for a certain period of time. If the Fund owns a security that is deferring or omitting its distributions, the Fund may be required to report the distribution on its tax returns, even though it may not have received this income. Further, preferred securities may lose substantial value due to the omission or deferment of dividend payments. |
About indexes used in this report
| n | | The MSCI World IndexSM is an unmanaged index considered representative of stocks of developed countries. The index is computed using the net return, which withholds applicable taxes for non-resident investors. |
| n | | The Lipper Global Large-Cap Core Funds Index is an unmanaged index considered representative of global large-cap core funds tracked by Lipper. |
| n | | The Fund is not managed to track the performance of any particular index, including the index(es) described here, and consequently, the performance of the Fund may deviate significantly from the performance of the index(es). |
| n | | A direct investment cannot be made in an index. Unless otherwise indicated, index results include reinvested dividends, and they do not reflect sales charges. Performance of the peer group, if applicable, reflects fund expenses; performance of a market index does not. |
Other information
| n | | The returns shown in management’s discussion of Fund performance are based on net asset values (NAVs) calculated for shareholder transactions. Generally accepted accounting principles require adjustments to be made to the net assets of the Fund at period end for financial reporting purposes, and as such, the NAVs for shareholder transactions and the returns based on those |
| | | NAVs may differ from the NAVs and returns reported in the Financial Highlights. |
| n | | Industry classifications used in this report are generally according to the Global Industry Classification Standard, which was developed by and is the exclusive property and a service mark of MSCI Inc. and Standard & Poor’s. |
6 Invesco Global Core Equity Fund
| | | | | |
| Average Annual Total Returns |
| As of 12/31/14, including maximum applicable sales charges | | | | | |
| |
| Class A Shares | | | | | |
| Inception (12/29/00) | | | | 4.76 | % |
| 10 Years | | | | 3.15 | |
| 5 Years | | | | 4.49 | |
| 1 Year | | | | -5.12 | |
| |
| Class B Shares | | | | | |
| Inception (12/29/00) | | | | 4.77 | % |
| 10 Years | | | | 3.20 | |
| 5 Years | | | | 4.79 | |
| 1 Year | | | | -4.75 | |
| |
| Class C Shares | | | | | |
| Inception (12/29/00) | | | | 4.44 | % |
| 10 Years | | | | 2.97 | |
| 5 Years | | | | 4.89 | |
| 1 Year | | | | -1.21 | |
| |
| Class R Shares | | | | | |
| 10 Years | | | | 3.48 | % |
| 5 Years | | | | 5.43 | |
| 1 Year | | | | 0.24 | |
| |
| Class Y Shares | | | | | |
| 10 Years | | | | 3.89 | % |
| 5 Years | | | | 5.95 | |
| 1 Year | | | | 0.73 | |
| |
| Class R5 Shares | | | | | |
| 10 Years | | | | 4.20 | % |
| 5 Years | | | | 6.13 | |
| 1 Year | | | | 0.83 | |
Class R shares incepted on May 23, 2011. Performance shown prior to that date is that of Class A shares and includes the 12b-1 fees applicable to Class A shares. Class A share performance reflects any applicable fee waivers or expense reimbursements.
Class Y shares incepted on October 3, 2008. Performance shown prior to that date is that of Class A shares and includes the 12b-1 fees applicable to Class A shares. Class A share performance reflects any applicable fee waivers or expense reimbursements.
Class R5 shares incepted on October 25, 2005. Performance shown prior to that date is that of Class A shares and includes the 12b-1 fees applicable to Class A shares. Class A share performance reflects any applicable fee waivers or expense reimbursements.
The performance data quoted represent past performance and cannot guarantee comparable future results; current performance may be lower or
higher. Please visit invesco.com/performance for the most recent month-end performance. Performance figures reflect reinvested distributions, changes in net asset value and the effect of the maximum sales charge unless otherwise stated. Investment return and principal value will fluctuate so that you may have a gain or loss when you sell shares.
The total annual Fund operating expense ratio set forth in the most recent Fund prospectus as of the date of this report for Class A, Class B, Class C, Class R, Class Y and Class R5 shares was 1.30%, 2.05%, 2.05%, 1.55%, 1.05% and 0.95% respectively. The expense ratios presented above may vary from the expense ratios presented in other sections of this report that are based on expenses incurred during the period covered by this report.
Class A share performance reflects the maximum 5.50% sales charge, and Class B and Class C share performance reflects the applicable contingent deferred sales charge (CDSC) for the period involved. The CDSC on Class B shares declines from 5% beginning at the time of purchase to 0% at the beginning of the seventh year. The CDSC on Class C shares is 1% for the first year after purchase. Class R, Class Y and Class R5 shares do not have a front-end sales charge or a CDSC; therefore, performance is at net asset value.
The performance of the Fund’s share classes will differ primarily due to different sales charge structures and class expenses.
Had the adviser not waived fees and/ or reimbursed expenses in the past, performance would have been lower.
7 Invesco Global Core Equity Fund
Invesco Global Core Equity Fund’s investment objective is long-term growth of capital.
| n | | Unless otherwise stated, information presented in this report is as of December 31, 2014, and is based on total net assets. |
| n | | Unless otherwise noted, all data provided by Invesco. |
| n | | To access your Fund’s reports/prospectus, visit invesco.com/fundreports. |
About share classes
| n | | Class B shares may not be purchased for new or additional investments. Please see the prospectus for more information. |
| n | | Class R shares are generally available only to employer sponsored retirement and benefit plans. Please see the prospectus for more information. |
| n | | Class Y shares are available only to certain investors. Please see the prospectus for more information. |
| n | | Class R5 shares are primarily intended for employer sponsored retirement and benefit plans that meet certain standards and for institutional investors. Please see the prospectus for more information. |
Principal risks of investing in the Fund
| n | | Active trading risk. The Fund engages in frequent trading of portfolio securities. Active trading results in added expenses and may result in a lower return and increased tax liability. |
| n | | Depositary receipts risk. Depositary receipts involve many of the same risks as those associated with direct investment in foreign securities. In addition, the underlying issuers of certain depositary receipts, particularly unsponsored or unregistered depositary receipts, are under no obligation to distribute shareholder communications to the holders of such receipts or to pass through to them any voting rights with respect to the deposited securities. |
| n | | Derivatives risk. The value of a derivative instrument depends largely on (and is derived from) the value of an underlying security, currency, commodity, interest rate, index or other asset (each referred to as an underlying asset). In addition to risks relating to the underlying assets, the use of derivatives may include other, possibly greater, risks, including counterparty, leverage and liquidity risks. Counterparty risk is the risk that the counterparty to the derivative contract will default on its obligation to pay the |
| | | Fund the amount owed or otherwise perform under the derivative contract. Derivatives create leverage risk because they do not require payment up front equal to the economic exposure created by owning the derivative. As a result, an adverse change in the value of the underlying asset could result in the Fund sustaining a loss that is substantially greater than the amount invested in the derivative, which may make the Fund’s returns more volatile and increase the risk of loss. Derivative instruments may also be less liquid than more traditional investments and the Fund may be unable to sell or close out its derivative positions at a desirable time or price. This risk may be more acute under adverse market conditions, during which the Fund may be most in need of liquidating its derivative positions. Derivatives may also be harder to value, less tax efficient and subject to changing government regulation that could impact the Fund’s ability to use certain derivatives or their cost. Also, derivatives used for hedging or to gain or limit exposure to a particular market segment may not provide the expected benefits, particularly during adverse market conditions. |
| n | | Developing/emerging markets securities risk. The prices of securities issued by foreign companies and governments located in developing/emerging market countries may be affected more negatively by inflation, devaluation of their currencies, higher transaction costs, delays in settlement, adverse political developments, the introduction of capital controls, withholding taxes, nationalization of private assets, expropriation, social unrest, war or lack of timely information than those in developed countries. |
| n | | Foreign securities risk. The Fund’s foreign investments may be affected by changes in a foreign country’s exchange rates, political and social instability, changes in economic or taxation policies, difficulties when enforcing obligations, decreased liquidity, and increased volatility. Foreign companies |
This report must be accompanied or preceded by a currently effective Fund prospectus, which contains more complete information, including sales charges and expenses. Investors should read it carefully before investing.
NOT FDIC INSURED | MAY LOSE VALUE | NO BANK GUARANTEE
| | may be subject to less regulation resulting in less publicly available information about the companies. |
| n | | Geographic focus risk. From time to time an underlying fund may invest a substantial amount of its assets in securities of issuers located in a single country or a limited number of countries. If an underlying fund focuses its investments in this manner, it assumes the risk that economic, political and social conditions in those countries will have a significant impact on its investment performance. An underlying fund’s investment performance may also be more volatile if it focuses its investments in certain countries, especially emerging market countries. |
| n | | Investing in the European Union risk. Many countries in the European Union are susceptible to high economic risks associated with high levels of debt, notably due to investments in sovereign debts of European countries such as Greece, Italy and Spain. One or more member states might exit the European Union, placing its currency and banking system in jeopardy. The European Union faces major issues involving its membership, structure, procedures and policies, including the adoption, abandonment or adjustment of the new constitutional treaty, the European Union’s enlargement to the south and east, and resolution of the European Union’s problematic fiscal and democratic accountability. Efforts of the member states to further unify their economic and monetary policies may increase the potential for the downward movement of one member state’s market to cause a similar effect on other member states’ markets. European countries that are part of the European Economic and Monetary Union may be significantly affected by the tight fiscal and monetary controls that the union seeks to impose on its members. |
| n | | Management risk. The investment techniques and risk analysis used by the Fund’s portfolio managers may not produce the desired results. |
| n | | Market risk. The prices of and the income generated by the Fund’s securities may decline in response to, among other things, investor sentiment, general economic and market conditions, regional or global instability, and currency |
continued on page 6
8 Invesco Global Core Equity Fund
Schedule of Investments
December 31, 2014
| | | | | | | | |
| | | Shares | | | Value | |
Common Stocks & Other Equity Interests–99.24% | |
| Canada–2.09% | |
Canadian Natural Resources Ltd. | | | 314,007 | | | $ | 9,708,325 | |
Suncor Energy, Inc. | | | 128,324 | | | | 4,075,706 | |
Toronto-Dominion Bank (The) | | | 192,573 | | | | 9,201,005 | |
| | | | | | | | 22,985,036 | |
|
| Finland–1.43% | |
Sampo Oyj–Class A | | | 334,407 | | | | 15,680,854 | |
|
| France–7.18% | |
Casino Guichard-Perrachon S.A. | | | 78,295 | | | | 7,205,328 | |
Danone | | | 336,579 | | | | 22,143,263 | |
Hermes International | | | 4,588 | | | | 1,636,711 | |
LVMH Moet Hennessy Louis Vuitton S.A. | | | 94,058 | | | | 14,874,387 | |
Publicis Groupe S.A. | | | 259,536 | | | | 18,589,559 | |
Rexel S.A. | | | 392,258 | | | | 7,004,780 | |
Sanofi | | | 83,267 | | | | 7,588,927 | |
| | | | | | | | 79,042,955 | |
|
| Ireland–0.72% | |
Shire PLC–ADR | | | 37,431 | | | | 7,955,585 | |
|
| Israel–1.30% | |
Teva Pharmaceutical Industries Ltd.–ADR | | | 247,977 | | | | 14,261,157 | |
|
| Italy–0.63% | |
Prada S.p.A. | | | 1,227,200 | | | | 6,955,283 | |
|
| Japan–8.56% | |
Asahi Group Holdings, Ltd. | | | 309,529 | | | | 9,555,583 | |
FANUC Corp. | | | 32,400 | | | | 5,348,145 | |
Isuzu Motors Ltd. | | | 1,124,000 | | | | 13,715,800 | |
KDDI Corp. | | | 151,400 | | | | 9,474,714 | |
Komatsu Ltd. | | | 667,300 | | | | 14,796,198 | |
Mitsubishi Corp. | | | 673,400 | | | | 12,352,132 | |
Mitsubishi UFJ Financial Group, Inc. | | | 2,167,631 | | | | 11,883,080 | |
Sumitomo Corp. | | | 650,900 | | | | 6,686,505 | |
Tokio Marine Holdings, Inc. | | | 320,800 | | | | 10,419,642 | |
| | | | | | | | 94,231,799 | |
|
| Netherlands–3.79% | |
Arcadis N.V. | | | 227,552 | | | | 6,805,019 | |
Heineken N.V. | | | 105,343 | | | | 7,483,799 | |
Koninklijke Philips N.V. | | | 514,900 | | | | 14,950,820 | |
Randstad Holding N.V. | | | 259,944 | | | | 12,501,628 | |
| | | | | | | | 41,741,266 | |
|
| Spain–0.53% | |
Repsol S.A. | | | 305,370 | | | | 5,676,499 | |
Repsol S.A. Rts.(a) | | | 253,704 | | | | 140,302 | |
| | | | | | | | 5,816,801 | |
| | | | | | | | |
| | | Shares | | | Value | |
| Sweden–1.97% | |
Sandvik AB | | | 597,214 | | | $ | 5,815,000 | |
SKF AB–Class B | | | 753,199 | | | | 15,845,325 | |
| | | | | | | | 21,660,325 | |
|
| Switzerland–5.30% | |
ABB Ltd. | | | 1,125,462 | | | | 23,807,823 | |
Roche Holding AG | | | 73,362 | | | | 19,886,071 | |
TE Connectivity Ltd. | | | 151,009 | | | | 9,551,319 | |
UBS Group AG | | | 297,972 | | | | 5,122,565 | |
| | | | | | | | 58,367,778 | |
|
| Taiwan–1.34% | |
Taiwan Semiconductor Manufacturing Co. Ltd. | | | 3,353,000 | | | | 14,770,647 | |
|
| United Kingdom–12.86% | |
British American Tobacco PLC | | | 163,548 | | | | 8,886,760 | |
Diageo PLC | | | 373,064 | | | | 10,700,584 | |
Fiat Chrysler Automobiles N.V.(a) | | | 822,171 | | | | 9,551,128 | |
GlaxoSmithKline PLC–ADR | | | 295,413 | | | | 12,625,952 | |
Imperial Tobacco Group PLC | | | 178,666 | | | | 7,824,843 | |
Kingfisher PLC | | | 3,641,854 | | | | 19,192,373 | |
Liberty Global PLC–Series A(a) | | | 200,773 | | | | 10,079,808 | |
Liberty Global PLC–Series C(a) | | | 162,203 | | | | 7,836,027 | |
Rio Tinto PLC | | | 439,685 | | | | 20,258,699 | |
Sky PLC | | | 809,980 | | | | 11,274,199 | |
Standard Chartered PLC | | | 558,105 | | | | 8,377,313 | |
Vodafone Group PLC–ADR | | | 434,838 | | | | 14,858,414 | |
| | | | | | | | 141,466,100 | |
|
| United States–51.54% | |
Abercrombie & Fitch Co.–Class A | | | 223,079 | | | | 6,388,983 | |
ACE Ltd. | | | 89,139 | | | | 10,240,288 | |
Amazon.com, Inc.(a) | | | 35,715 | | | | 11,084,150 | |
American Express Co. | | | 357,905 | | | | 33,299,481 | |
Amphenol Corp.–Class A | | | 195,848 | | | | 10,538,581 | |
Archer-Daniels-Midland Co. | | | 205,582 | | | | 10,690,264 | |
Berkshire Hathaway Inc.–Class A(a) | | | 145 | | | | 32,770,000 | |
Cabot Oil & Gas Corp. | | | 398,066 | | | | 11,786,734 | |
Cameron International Corp.(a) | | | 115,780 | | | | 5,783,211 | |
Celgene Corp.(a) | | | 155,196 | | | | 17,360,225 | |
Cisco Systems, Inc. | | | 350,429 | | | | 9,747,183 | |
Concho Resources Inc.(a) | | | 158,830 | | | | 15,843,293 | |
Dick’s Sporting Goods, Inc. | | | 199,959 | | | | 9,927,964 | |
Eaton Corp. PLC(a) | | | 164,306 | | | | 11,166,236 | |
EMC Corp. | | | 654,592 | | | | 19,467,566 | |
EOG Resources, Inc. | | | 176,463 | | | | 16,246,948 | |
Express Scripts Holding Co.(a) | | | 127,745 | | | | 10,816,169 | |
First Republic Bank | | | 387,425 | | | | 20,192,591 | |
GameStop Corp.–Class A | | | 329,425 | | | | 11,134,565 | |
Gilead Sciences, Inc.(a) | | | 43,057 | | | | 4,058,553 | |
See accompanying Notes to Financial Statements which are an integral part of the financial statements.
9 Invesco Global Core Equity Fund
| | | | | | | | |
| | | Shares | | | Value | |
| United States–(continued) | |
Google Inc.–Class C(a) | | | 14,188 | | | $ | 7,468,563 | |
Halliburton Co. | | | 390,388 | | | | 15,353,960 | |
HCA Holdings, Inc.(a) | | | 259,262 | | | | 19,027,238 | |
International Business Machines Corp. | | | 159,556 | | | | 25,599,165 | |
Johnson Controls, Inc. | | | 176,403 | | | | 8,527,321 | |
Kroger Co. (The) | | | 176,512 | | | | 11,333,836 | |
Las Vegas Sands Corp. | | | 107,845 | | | | 6,272,265 | |
Linear Technology Corp. | | | 187,949 | | | | 8,570,474 | |
Macy’s, Inc. | | | 176,271 | | | | 11,589,818 | |
Marsh & McLennan Cos., Inc. | | | 253,480 | | | | 14,509,195 | |
Microsoft Corp. | | | 192,924 | | | | 8,961,320 | |
Moody’s Corp. | | | 195,406 | | | | 18,721,849 | |
Northern Trust Corp. | | | 307,617 | | | | 20,733,386 | |
Parker Hannifin Corp. | | | 70,298 | | | | 9,064,927 | |
Philip Morris International Inc. | | | 104,004 | | | | 8,471,126 | |
Progressive Corp. (The) | | | 790,616 | | | | 21,338,726 | |
QUALCOMM, Inc. | | | 329,334 | | | | 24,479,396 | |
| | | | | | | | |
| | | Shares | | | Value | |
| United States–(continued) | |
ResMed Inc. | | | 367,535 | | | $ | 20,604,012 | |
Rite Aid Corp.(a) | | | 1,284,789 | | | | 9,661,613 | |
Tenet Healthcare Corp.(a) | | | 245,042 | | | | 12,416,278 | |
Yum! Brands, Inc. | | | 82,277 | | | | 5,993,880 | |
| | | | | | | | 567,241,333 | |
Total Common Stocks & Other Equity Interests (Cost $1,049,630,575) | | | | 1,092,176,919 | |
| | |
Money Market Funds–0.81% | | | | | | | | |
Liquid Assets Portfolio–Institutional Class(b) | | | 4,483,678 | | | | 4,483,678 | |
Premier Portfolio–Institutional
Class(b) | | | 4,483,678 | | | | 4,483,678 | |
Total Money Market Funds
(Cost $8,967,356) | | | | 8,967,356 | |
TOTAL INVESTMENTS–100.05%
(Cost $1,058,597,931) | | | | 1,101,144,275 | |
OTHER ASSETS LESS LIABILITIES–(0.05)% | | | | (547,816 | ) |
NET ASSETS–100.00% | | | $ | 1,100,596,459 | |
Investment Abbreviations:
| | |
| ADR | | – American Depositary Receipt |
| Rts. | | – Rights |
Notes to Schedule of Investments:
| (a) | Non-income producing security. |
| (b) | The money market fund and the Fund are affiliated by having the same investment adviser. |
See accompanying Notes to Financial Statements which are an integral part of the financial statements.
10 Invesco Global Core Equity Fund
Statement of Assets and Liabilities
December 31, 2014
| | | | |
Assets: | |
Investments, at value (Cost $1,049,630,575) | | $ | 1,092,176,919 | |
Investments in affiliated money market funds, at value and cost | | | 8,967,356 | |
Total investments, at value (Cost $1,058,597,931) | | | 1,101,144,275 | |
Foreign currencies, at value (Cost $2,718,765) | | | 2,720,516 | |
Receivable for: | | | | |
Investments sold | | | 6,826,090 | |
Fund shares sold | | | 699,881 | |
Dividends | | | 2,172,428 | |
Investment for trustee deferred compensation and retirement plans | | | 211,070 | |
Other assets | | | 43,280 | |
Total assets | | | 1,113,817,540 | |
|
Liabilities: | |
Payable for: | | | | |
Investments purchased | | | 8,566,826 | |
Fund shares reacquired | | | 3,231,625 | |
Accrued fees to affiliates | | | 1,015,633 | |
Accrued trustees’ and officers’ fees and benefits | | | 714 | |
Accrued other operating expenses | | | 106,388 | |
Trustee deferred compensation and retirement plans | | | 299,895 | |
Total liabilities | | | 13,221,081 | |
Net assets applicable to shares outstanding | | $ | 1,100,596,459 | |
|
Net assets consist of: | |
Shares of beneficial interest | | $ | 1,081,570,877 | |
Undistributed net investment income | | | 744,999 | |
Undistributed net realized gain (loss) | | | (24,077,203 | ) |
Net unrealized appreciation | | | 42,357,786 | |
| | | $ | 1,100,596,459 | |
| | | | |
Net Assets: | |
Class A | | $ | 934,892,966 | |
Class B | | $ | 31,846,045 | |
Class C | | $ | 111,551,768 | |
Class R | | $ | 807,498 | |
Class Y | | $ | 21,136,333 | |
Class R5 | | $ | 361,849 | |
|
Shares outstanding, $0.01 par value per share,
with an unlimited number of shares authorized: | |
Class A | | | 68,484,988 | |
Class B | | | 2,443,206 | |
Class C | | | 8,538,189 | |
Class R | | | 59,149 | |
Class Y | | | 1,549,070 | |
Class R5 | | | 26,198 | |
Class A: | | | | |
Net asset value per share | | $ | 13.65 | |
Maximum offering price per share | | | | |
(Net asset value of $13.65 ¸ 94.50%) | | $ | 14.44 | |
Class B: | | | | |
Net asset value and offering price per share | | $ | 13.03 | |
Class C: | | | | |
Net asset value and offering price per share | | $ | 13.07 | |
Class R: | | | | |
Net asset value and offering price per share | | $ | 13.65 | |
Class Y: | | | | |
Net asset value and offering price per share | | $ | 13.64 | |
Class R5: | | | | |
Net asset value and offering price per share | | $ | 13.81 | |
See accompanying Notes to Financial Statements which are an integral part of the financial statements.
11 Invesco Global Core Equity Fund
Statement of Operations
For the year ended December 31, 2014
| | | | |
Investment income: | |
Dividends (net of foreign withholding taxes of $1,860,705) | | $ | 27,329,692 | |
Dividends from affiliated money market funds (includes securities lending income of $648,417) | | | 652,925 | |
Total investment income | | | 27,982,617 | |
| |
Expenses: | | | | |
Advisory fees | | | 9,270,300 | |
Administrative services fees | | | 302,252 | |
Custodian fees | | | 154,810 | |
Distribution fees: | | | | |
Class A | | | 2,557,451 | |
Class B | | | 386,546 | |
Class C | | | 1,239,531 | |
Class R | | | 4,246 | |
Transfer agent fees — A, B, C, R and Y | | | 2,426,258 | |
Transfer agent fees — R5 | | | 556 | |
Trustees’ and officers’ fees and benefits | | | 47,561 | |
Other | | | 354,813 | |
Total expenses | | | 16,744,324 | |
Less: Fees waived and expense offset arrangement(s) | | | (20,878 | ) |
Net expenses | | | 16,723,446 | |
Net investment income | | | 11,259,171 | |
| |
Realized and unrealized gain (loss) from: | | | | |
Net realized gain (loss) from: | | | | |
Investment securities | | | 232,081,523 | |
Foreign currencies | | | (444,484 | ) |
| | | | 231,637,039 | |
Change in net unrealized appreciation (depreciation) of: | | | | |
Investment securities | | | (237,533,916 | ) |
Foreign currencies | | | (241,948 | ) |
| | | | (237,775,864 | ) |
Net realized and unrealized gain (loss) | | | (6,138,825 | ) |
Net increase in net assets resulting from operations | | $ | 5,120,346 | |
See accompanying Notes to Financial Statements which are an integral part of the financial statements.
12 Invesco Global Core Equity Fund
Statement of Changes in Net Assets
For the years ended December 31, 2014 and 2013
| | | | | | | | |
| | | 2014 | | | 2013 | |
Operations: | | | | | |
Net investment income | | $ | 11,259,171 | | | $ | 18,846,858 | |
Net realized gain | | | 231,637,039 | | | | 84,374,633 | |
Change in net unrealized appreciation (depreciation) | | | (237,775,864 | ) | | | 146,507,600 | |
Net increase in net assets resulting from operations | | | 5,120,346 | | | | 249,729,091 | |
| | |
Distributions to shareholders from net investment income: | | | | | | | | |
Class A | | | (10,354,486 | ) | | | (16,175,276 | ) |
Class B | | | (98,319 | ) | | | (498,746 | ) |
Class C | | | (341,925 | ) | | | (1,089,550 | ) |
Class R | | | (6,559 | ) | | | (10,955 | ) |
Class Y | | | (288,362 | ) | | | (291,648 | ) |
Class R5 | | | (8,185 | ) | | | (9,062 | ) |
Total distributions from net investment income | | | (11,097,836 | ) | | | (18,075,237 | ) |
| | |
Distributions to shareholders from net realized gains: | | | | | | | | |
Class A | | | (96,456,763 | ) | | | — | |
Class B | | | (3,472,967 | ) | | | — | |
Class C | | | (12,078,006 | ) | | | — | |
Class R | | | (81,021 | ) | | | — | |
Class Y | | | (2,153,131 | ) | | | — | |
Class R5 | | | (56,570 | ) | | | — | |
Total distributions from net realized gains | | | (114,298,458 | ) | | | — | |
| | |
Share transactions–net: | | | | | | | | |
Class A | | | (41,539,834 | ) | | | (155,172,755 | ) |
Class B | | | (9,488,550 | ) | | | (21,105,312 | ) |
Class C | | | (8,976,808 | ) | | | (25,642,408 | ) |
Class R | | | 10,707 | | | | (68,529 | ) |
Class Y | | | 6,545,331 | | | | (2,567,573 | ) |
Class R5 | | | (91,940 | ) | | | 168,138 | |
Net increase (decrease) in net assets resulting from share transactions | | | (53,541,094 | ) | | | (204,388,439 | ) |
Net increase (decrease) in net assets | | | (173,817,042 | ) | | | 27,265,415 | |
| | |
Net assets: | | | | | | | | |
Beginning of year | | | 1,274,413,501 | | | | 1,247,148,086 | |
End of year (includes undistributed net investment income of $744,999 and $1,035,526, respectively) | | $ | 1,100,596,459 | | | $ | 1,274,413,501 | |
Notes to Financial Statements
December 31, 2014
NOTE 1—Significant Accounting Policies
Invesco Global Core Equity Fund (the “Fund”) is a series portfolio of AIM Funds Group (Invesco Funds Group) (the “Trust”). The Trust is a Delaware statutory trust registered under the Investment Company Act of 1940, as amended (the “1940 Act”), as an open-end series management investment company consisting of four separate portfolios, each authorized to issue an unlimited number of shares of beneficial interest. The assets, liabilities and operations of each portfolio are accounted for separately. Information presented in these financial statements pertains only to the Fund. Matters affecting each portfolio or class will be voted on exclusively by the shareholders of such portfolio or class.
The Fund’s investment objective is long-term growth of capital.
The Fund currently consists of six different classes of shares: Class A, Class B, Class C, Class R, Class Y and Class R5. Class A shares are sold with a front-end sales charge unless certain waiver criteria are met and under certain circumstances load waived shares may be subject to contingent deferred sales charges (“CDSC”). Class C shares are sold with a CDSC. Class R, Class Y and Class R5 shares are sold at net asset value. Effective November 30, 2010, new or additional investments in Class B shares are no longer permitted. Existing shareholders of Class B shares may continue to reinvest dividends and capital gains distributions in Class B shares until they convert to Class A shares. Also, shareholders in Class B shares will be able to exchange those shares for Class B shares of other Invesco Funds offering such shares until they convert to Class A shares. Generally,
13 Invesco Global Core Equity Fund
Class B shares will automatically convert to Class A shares on or about the month-end, which is at least eight years after the date of purchase. Redemption of Class B shares prior to the conversion date will be subject to a CDSC.
The following is a summary of the significant accounting policies followed by the Fund in the preparation of its financial statements.
| A. | Security Valuations — Securities, including restricted securities, are valued according to the following policy. |
A security listed or traded on an exchange (except convertible securities) is valued at its last sales price or official closing price as of the close of the customary trading session on the exchange where the security is principally traded, or lacking any sales or official closing price on a particular day, the security may be valued at the closing bid price on that day. Securities traded in the over-the-counter market are valued based on prices furnished by independent pricing services or market makers. When such securities are valued by an independent pricing service they may be considered fair valued. Futures contracts are valued at the final settlement price set by an exchange on which they are principally traded. Listed options are valued at the mean between the last bid and ask prices from the exchange on which they are principally traded. Options not listed on an exchange are valued by an independent source at the mean between the last bid and ask prices. For purposes of determining net asset value per share, futures and option contracts generally are valued 15 minutes after the close of the customary trading session of the New York Stock Exchange (“NYSE”).
Investments in open-end and closed-end registered investment companies that do not trade on an exchange are valued at the end of day net asset value per share. Investments in open-end and closed-end registered investment companies that trade on an exchange are valued at the last sales price or official closing price as of the close of the customary trading session on the exchange where the security is principally traded.
Debt obligations (including convertible securities) and unlisted equities are fair valued using an evaluated quote provided by an independent pricing service. Evaluated quotes provided by the pricing service may be determined without exclusive reliance on quoted prices, and may reflect appropriate factors such as institution-size trading in similar groups of securities, developments related to specific securities, dividend rate (for unlisted equities), yield (for debt obligations), quality, type of issue, coupon rate (for debt obligations), maturity (for debt obligations), individual trading characteristics and other market data. Debt obligations are subject to interest rate and credit risks. In addition, all debt obligations involve some risk of default with respect to interest and/or principal payments.
Foreign securities’ (including foreign exchange contracts) prices are converted into U.S. dollar amounts using the applicable exchange rates as of the close of the NYSE. If market quotations are available and reliable for foreign exchange-traded equity securities, the securities will be valued at the market quotations. Because trading hours for certain foreign securities end before the close of the NYSE, closing market quotations may become unreliable. If between the time trading ends on a particular security and the close of the customary trading session on the NYSE, events occur that the Adviser determines are significant and make the closing price unreliable, the Fund may fair value the security. If the event is likely to have affected the closing price of the security, the security will be valued at fair value in good faith using procedures approved by the Board of Trustees. Adjustments to closing prices to reflect fair value may also be based on a screening process of an independent pricing service to indicate the degree of certainty, based on historical data, that the closing price in the principal market where a foreign security trades is not the current value as of the close of the NYSE. Foreign securities’ prices meeting the approved degree of certainty that the price is not reflective of current value will be priced at the indication of fair value from the independent pricing service. Multiple factors may be considered by the independent pricing service in determining adjustments to reflect fair value and may include information relating to sector indices, American Depositary Receipts and domestic and foreign index futures. Foreign securities may have additional risks including exchange rate changes, potential for sharply devalued currencies and high inflation, political and economic upheaval, the relative lack of issuer information, relatively low market liquidity and the potential lack of strict financial and accounting controls and standards.
Securities for which market prices are not provided by any of the above methods may be valued based upon quotes furnished by independent sources. The last bid price may be used to value equity securities. The mean between the last bid and ask prices is used to value debt obligations, including corporate loans.
Securities for which market quotations are not readily available or became unreliable are valued at fair value as determined in good faith by or under the supervision of the Trust’s officers following procedures approved by the Board of Trustees. Issuer specific events, market trends, bid/ask quotes of brokers and information providers and other market data may be reviewed in the course of making a good faith determination of a security’s fair value.
The Fund may invest in securities that are subject to interest rate risk, meaning the risk that the prices will generally fall as interest rates rise and, conversely, the prices will generally rise as interest rates fall. Specific securities differ in their sensitivity to changes in interest rates depending on their individual characteristics. Changes in interest rates may result in increased market volatility, which may affect the value and/or liquidity of certain of the Fund’s investments.
Valuations change in response to many factors including the historical and prospective earnings of the issuer, the value of the issuer’s assets, general economic conditions, interest rates, investor perceptions and market liquidity. Because of the inherent uncertainties of valuation, the values reflected in the financial statements may materially differ from the value received upon actual sale of those investments.
| B. | Securities Transactions and Investment Income — Securities transactions are accounted for on a trade date basis. Realized gains or losses on sales are computed on the basis of specific identification of the securities sold. Interest income (net of withholding tax, if any) is recorded on the accrual basis from settlement date. Dividend income (net of withholding tax, if any) is recorded on the ex-dividend date. |
The Fund may periodically participate in litigation related to Fund investments. As such, the Fund may receive proceeds from litigation settlements. Any proceeds received are included in the Statement of Operations as realized gain (loss) for investments no longer held and as unrealized gain (loss) for investments still held.
Brokerage commissions and mark ups are considered transaction costs and are recorded as an increase to the cost basis of securities purchased and/or a reduction of proceeds on a sale of securities. Such transaction costs are included in the determination of net realized and unrealized gain (loss) from investment securities reported in the Statement of Operations and the Statement of Changes in Net Assets and the net realized and unrealized gains (losses) on securities per share in the Financial Highlights. Transaction costs are included in the calculation of the Fund’s net asset value and, accordingly, they reduce the Fund’s total returns. These transaction costs are not considered operating expenses and are not reflected in net investment income reported in the Statement of Operations and Statement of Changes in Net Assets, or the net investment income per share and ratios of expenses and net investment income reported in the Financial Highlights, nor are they limited by any expense limitation arrangements between the Fund and the investment adviser.
14 Invesco Global Core Equity Fund
The Fund allocates income and realized and unrealized capital gains and losses to a class based on the relative net assets of each class.
| C. | Country Determination — For the purposes of making investment selection decisions and presentation in the Schedule of Investments, the investment adviser may determine the country in which an issuer is located and/or credit risk exposure based on various factors. These factors include the laws of the country under which the issuer is organized, where the issuer maintains a principal office, the country in which the issuer derives 50% or more of its total revenues and the country that has the primary market for the issuer’s securities, as well as other criteria. Among the other criteria that may be evaluated for making this determination are the country in which the issuer maintains 50% or more of its assets, the type of security, financial guarantees and enhancements, the nature of the collateral and the sponsor organization. Country of issuer and/or credit risk exposure has been determined to be the United States of America, unless otherwise noted. |
| D. | Distributions — Distributions from net investment income and net realized capital gain, if any, are generally declared and paid annually and recorded on the ex-dividend date. The Fund may elect to treat a portion of the proceeds from redemptions as distributions for federal income tax purposes. |
| E. | Federal Income Taxes — The Fund intends to comply with the requirements of Subchapter M of the Internal Revenue Code of 1986, as amended (the “Internal Revenue Code”), necessary to qualify as a regulated investment company and to distribute substantially all of the Fund’s taxable earnings to shareholders. As such, the Fund will not be subject to federal income taxes on otherwise taxable income (including net realized capital gain) that is distributed to shareholders. Therefore, no provision for federal income taxes is recorded in the financial statements. |
The Fund recognizes the tax benefits of uncertain tax positions only when the position is more likely than not to be sustained. Management has analyzed the Fund’s uncertain tax positions and concluded that no liability for unrecognized tax benefits should be recorded related to uncertain tax positions. Management is not aware of any tax positions for which it is reasonably possible that the total amounts of unrecognized tax benefits will change materially in the next 12 months.
The Fund files tax returns in the U.S. Federal jurisdiction and certain other jurisdictions. Generally, the Fund is subject to examinations by such taxing authorities for up to three years after the filing of the return for the tax period.
| F. | Expenses — Fees provided for under the Rule 12b-1 plan of a particular class of the Fund are charged to the operations of such class. Transfer agency fees and expenses and other shareholder recordkeeping fees and expenses attributable to Class R5 are charged to such class. Transfer agency fees and expenses and other shareholder recordkeeping fees and expenses relating to all other classes are allocated among those classes based on relative net assets. All other expenses are allocated among the classes based on relative net assets. |
| G. | Accounting Estimates – The preparation of financial statements in conformity with accounting principles generally accepted in the United States of America (“GAAP”) requires management to make estimates and assumptions that affect the reported amounts of assets and liabilities at the date of the financial statements and the reported amounts of revenues and expenses during the reporting period including estimates and assumptions related to taxation. Actual results could differ from those estimates by a significant amount. In addition, the Fund monitors for material events or transactions that may occur or become known after the period-end date and before the date the financial statements are released to print. |
| H. | Indemnifications — Under the Trust’s organizational documents, each Trustee, officer, employee or other agent of the Trust is indemnified against certain liabilities that may arise out of the performance of their duties to the Fund. Additionally, in the normal course of business, the Fund enters into contracts, including the Fund’s servicing agreements, that contain a variety of indemnification clauses. The Fund’s maximum exposure under these arrangements is unknown as this would involve future claims that may be made against the Fund that have not yet occurred. The risk of material loss as a result of such indemnification claims is considered remote. |
| I. | Securities Lending — The Fund may lend portfolio securities having a market value up to one-third of the Fund’s total assets. Such loans are secured by collateral equal to no less than the market value of the loaned securities determined daily by the securities lending provider. Such collateral will be cash or debt securities issued or guaranteed by the U.S. Government or any of its sponsored agencies. Cash collateral received in connection with these loans is invested in short-term money market instruments or affiliated money market funds and is shown as such on the Schedule of Investments. It is the Fund’s policy to obtain additional collateral from or return excess collateral to the borrower by the end of the next business day, following the valuation date of the securities loaned. Therefore, the value of the collateral held may be temporarily less than the value of the securities on loan. Lending securities entails a risk of loss to the Fund if, and to the extent that, the market value of the securities loaned were to increase and the borrower did not increase the collateral accordingly, and the borrower failed to return the securities. Upon the failure of the borrower to return the securities, collateral may be liquidated and the securities may be purchased on the open market to replace the loaned securities. The Fund could experience delays and costs in gaining access to the collateral. The Fund bears the risk of any deficiency in the amount of the collateral available for return to the borrower due to any loss on the collateral invested. Dividends received on cash collateral investments for securities lending transactions, which are net of compensation to counterparties, is included in Dividends from affiliated money market funds on the Statement of Operations. The aggregate value of securities out on loan is shown as a footnote on the Statement of Assets and Liabilities, if any. |
| J. | Foreign Currency Translations — Foreign currency is valued at the close of the NYSE based on quotations posted by banks and major currency dealers. Portfolio securities and other assets and liabilities denominated in foreign currencies are translated into U.S. dollar amounts at date of valuation. Purchases and sales of portfolio securities (net of foreign taxes withheld on disposition) and income items denominated in foreign currencies are translated into U.S. dollar amounts on the respective dates of such transactions. The Fund does not separately account for the portion of the results of operations resulting from changes in foreign exchange rates on investments and the fluctuations arising from changes in market prices of securities held. The combined results of changes in foreign exchange rates and the fluctuation of market prices on investments (net of estimated foreign tax withholding) are included with the net realized and unrealized gain or loss from investments in the Statement of Operations. Reported net realized foreign currency gains or losses arise from (1) sales of foreign currencies, (2) currency gains or losses realized between the trade and settlement dates on securities transactions, and (3) the difference between the amounts of dividends, interest, and foreign withholding taxes recorded on the Fund’s books and the U.S. dollar equivalent of the amounts actually received or paid. Net unrealized foreign currency gains and losses arise from changes in the fair values of assets and liabilities, other than investments in securities at fiscal period end, resulting from changes in exchange rates. |
15 Invesco Global Core Equity Fund
The Fund may invest in foreign securities, which may be subject to foreign taxes on income, gains on investments or currency repatriation, a portion of which may be recoverable. Foreign taxes, if any, are recorded based on the tax regulations and rates that exist in the foreign markets in which the Fund invests and are shown in the Statement of Operations.
| K. | Forward Foreign Currency Contracts — The Fund may engage in foreign currency transactions either on a spot (i.e. for prompt delivery and settlement) basis or through forward foreign currency contracts to manage or minimize currency or exchange rate risk. |
The Fund may also enter into forward foreign currency contracts for the purchase or sale of a security denominated in a foreign currency in order to “lock in” the U.S. dollar price of that security, or the Fund may also enter into forward foreign currency contracts that do not provide for physical settlement of the two currencies, but instead are settled by a single cash payment calculated as the difference between the agreed upon exchange rate and the spot rate at settlement based upon an agreed upon notional amount (non-deliverable forwards). The Fund will set aside liquid assets in an amount equal to daily mark-to-market obligation for forward foreign currency contracts.
A forward foreign currency contract is an obligation between two parties (“Counterparties”) to purchase or sell a specific currency for an agreed-upon price at a future date. The use of forward foreign currency contracts does not eliminate fluctuations in the price of the underlying securities the Fund owns or intends to acquire but establishes a rate of exchange in advance. Fluctuations in the value of these contracts are measured by the difference in the contract date and reporting date exchange rates and are recorded as unrealized appreciation (depreciation) until the contracts are closed. When the contracts are closed, realized gains (losses) are recorded. Realized and unrealized gains (losses) on the contracts are included in the Statement of Operations. The primary risks associated with forward foreign currency contracts include failure of the Counterparty to meet the terms of the contract and the value of the foreign currency changing unfavorably. These risks may be in excess of the amounts reflected in the Statement of Assets and Liabilities.
NOTE 2—Advisory Fees and Other Fees Paid to Affiliates
The Trust has entered into a master investment advisory agreement with Invesco Advisers, Inc. (the “Adviser” or “Invesco”). Under the terms of the investment advisory agreement, the Fund pays an advisory fee to the Adviser based on the annual rate of the Fund’s average daily net assets as follows:
| | | | | | |
| Average Daily Net Assets | | Rate |
First $250 million | | | 0 | .80% | | |
Next $250 million | | | 0 | .78% | | |
Next $500 million | | | 0 | .76% | | |
Next $1.5 billion | | | 0 | .74% | | |
Next $2.5 billion | | | 0 | .72% | | |
Next $2.5 billion | | | 0 | .70% | | |
Next $2.5 billion | | | 0 | .68% | | |
Over $10 billion | | | 0 | .66% | | |
For the year ended December 31, 2014, the effective advisory fees incurred by the Fund was 0.77%.
Under the terms of a master sub-advisory agreement between the Adviser and each of Invesco Asset Management Deutschland GmbH, Invesco Asset Management Limited, Invesco Asset Management (Japan) Limited, Invesco Australia Limited, Invesco Hong Kong Limited, Invesco Senior Secured Management, Inc. and Invesco Canada Ltd. (collectively, the “Affiliated Sub-Advisers”) the Adviser, not the Fund, may pay 40% of the fees paid to the Adviser to any such Affiliated Sub-Adviser(s) that provide(s) discretionary investment management services to the Fund based on the percentage of assets allocated to such Sub-Adviser(s).
The Adviser has contractually agreed, through at least June 30, 2015, to waive advisory fees and/or reimburse expenses of all shares to the extent necessary to limit total annual fund operating expenses after fee waiver and/or expense reimbursement (excluding certain items discussed below) of Class A, Class B, Class C, Class R, Class Y and Class R5 shares to 2.25%, 3.00%, 3.00%, 2.50%, 2.00% and 2.00%, respectively, of average daily net assets. In determining the Adviser’s obligation to waive advisory fees and/or reimburse expenses, the following expenses are not taken into account, and could cause the total annual fund operating expenses after fee waiver and/or expense reimbursement to exceed the numbers reflected above: (1) interest; (2) taxes; (3) dividend expense on short sales; (4) extraordinary or non-routine items, including litigation expenses; and (5) expenses that the Fund has incurred but did not actually pay because of an expense offset arrangement. Unless Invesco continues the fee waiver agreement, it will terminate on June 30, 2015. The fee waiver agreement cannot be terminated during its term. The Advisor did not waive fees and/or reimburse expenses during the period under this expense limitation.
Further, the Adviser has contractually agreed, through at least June 30, 2016, to waive the advisory fee payable by the Fund in an amount equal to 100% of the net advisory fees the Adviser receives from the affiliated money market funds on investments by the Fund of uninvested cash (excluding investments of cash collateral from securities lending) in such affiliated money market funds.
For the year ended December 31, 2014, the Adviser waived advisory fees of $17,192.
The Trust has entered into a master administrative services agreement with Invesco pursuant to which the Fund has agreed to pay Invesco for certain administrative costs incurred in providing accounting services to the Fund. For the year ended December 31, 2014, expenses incurred under the agreement are shown in the Statement of Operations as Administrative services fees.
The Trust has entered into a transfer agency and service agreement with Invesco Investment Services, Inc. (“IIS”) pursuant to which the Fund has agreed to pay IIS a fee for providing transfer agency and shareholder services to the Fund and reimburse IIS for certain expenses incurred by IIS in the course of providing such services. IIS may make payments to intermediaries that provide omnibus account services, sub-accounting services and/or networking services. All fees payable by IIS to intermediaries that provide omnibus account services or sub-accounting are charged back to the Fund, subject to certain limitations approved by the Trust’s Board of Trustees. For the year ended December 31, 2014, expenses incurred under the agreement are shown in the Statement of Operations as Transfer agent fees.
16 Invesco Global Core Equity Fund
The Trust has entered into master distribution agreements with Invesco Distributors, Inc. (“IDI”) to serve as the distributor for the Class A, Class B, Class C, Class R, Class Y and Class R5 shares of the Fund. The Trust has adopted plans pursuant to Rule 12b-1 under the 1940 Act with respect to the Fund’s Class A, Class B, Class C and Class R shares (collectively the “Plans”). The Fund, pursuant to the Plans, pays IDI compensation at the annual rate of 0.25% of the Fund’s average daily net assets of Class A shares, 1.00% of the average daily net assets of Class B and Class C shares and 0.50% of the average daily net assets of Class R shares. Of the Plan payments, up to 0.25% of the average daily net assets of each class of shares may be paid to furnish continuing personal shareholder services to customers who purchase and own shares of such classes. Any amounts not paid as a service fee under the Plans would constitute an asset-based sales charge. Rules of the Financial Industry Regulatory Authority (“FINRA”) impose a cap on the total sales charges, including asset-based sales charges, that may be paid by any class of shares of the Fund. IDI has contractually agreed to limit Rule 12b-1 plan fees on Class B shares to 0.52% of average daily net assets through June 30, 2013. 12b-1 fees before fee waivers incurred under the Plan are detailed in the Statement of Operations as Distribution fees. For the year ended December 31, 2014, expenses incurred under the Plan are detailed in the Statement of Operations as Distribution fees.
Front-end sales commissions and CDSC (collectively, the “sales charges”) are not recorded as expenses of the Fund. Front-end sales commissions are deducted from proceeds from the sales of Fund shares prior to investment in Class A shares of the Fund. CDSC are deducted from redemption proceeds prior to remittance to the shareholder. During the year ended December 31, 2014, IDI advised the Fund that IDI retained $50,269 in front-end sales commissions from the sale of Class A shares and $122, $27,962 and $1,927 from Class A, Class B and Class C shares, respectively, for CDSC imposed on redemptions by shareholders.
Certain officers and trustees of the Trust are officers and directors of the Adviser, IIS and/or IDI.
NOTE 3—Additional Valuation Information
GAAP defines fair value as the price that would be received to sell an asset or paid to transfer a liability in an orderly transaction between market participants at the measurement date, under current market conditions. GAAP establishes a hierarchy that prioritizes the inputs to valuation methods, giving the highest priority to readily available unadjusted quoted prices in an active market for identical assets (Level 1) and the lowest priority to significant unobservable inputs (Level 3), generally when market prices are not readily available or are unreliable. Based on the valuation inputs, the securities or other investments are tiered into one of three levels. Changes in valuation methods may result in transfers in or out of an investment’s assigned level:
| | Level 1 — | Prices are determined using quoted prices in an active market for identical assets. |
| | Level 2 — | Prices are determined using other significant observable inputs. Observable inputs are inputs that other market participants may use in pricing a security. These may include quoted prices for similar securities, interest rates, prepayment speeds, credit risk, yield curves, loss severities, default rates, discount rates, volatilities and others. |
| | Level 3 — | Prices are determined using significant unobservable inputs. In situations where quoted prices or observable inputs are unavailable (for example, when there is little or no market activity for an investment at the end of the period), unobservable inputs may be used. Unobservable inputs reflect the Fund’s own assumptions about the factors market participants would use in determining fair value of the securities or instruments and would be based on the best available information. |
The following is a summary of the tiered valuation input levels, as of December 31, 2014. The level assigned to the securities valuations may not be an indication of the risk or liquidity associated with investing in those securities. Because of the inherent uncertainties of valuation, the values reflected in the financial statements may materially differ from the value received upon actual sale of those investments.
| | | | | | | | | | | | | | | | |
| | | Level 1 | | | Level 2 | | | Level 3 | | | Total | |
Canada | | $ | 22,985,036 | | | $ | — | | | $ | — | | | $ | 22,985,036 | |
Finland | | | — | | | | 15,680,854 | | | | — | | | | 15,680,854 | |
France | | | 1,636,711 | | | | 77,406,244 | | | | — | | | | 79,042,955 | |
Ireland | | | 7,955,585 | | | | — | | | | — | | | | 7,955,585 | |
Israel | | | 14,261,157 | | | | — | | | | — | | | | 14,261,157 | |
Italy | | | 6,955,283 | | | | — | | | | — | | | | 6,955,283 | |
Japan | | | — | | | | 94,231,799 | | | | — | | | | 94,231,799 | |
Netherlands | | | — | | | | 41,741,266 | | | | — | | | | 41,741,266 | |
Spain | | | 140,302 | | | | 5,676,499 | | | | — | | | | 5,816,801 | |
Sweden | | | — | | | | 21,660,325 | | | | — | | | | 21,660,325 | |
Switzerland | | | 14,673,884 | | | | 43,693,894 | | | | — | | | | 58,367,778 | |
Taiwan | | | — | | | | 14,770,647 | | | | — | | | | 14,770,647 | |
United Kingdom | | | 63,328,642 | | | | 78,137,458 | | | | — | | | | 141,466,100 | |
United States | | | 576,208,689 | | | | — | | | | — | | | | 576,208,689 | |
Total Investments | | $ | 708,145,289 | | | $ | 392,998,986 | | | $ | — | | | $ | 1,101,144,275 | |
NOTE 4—Expense Offset Arrangement(s)
The expense offset arrangement is comprised of transfer agency credits which result from balances in demand deposit accounts used by the transfer agent for clearing shareholder transactions. For the year ended December 31, 2014, the Fund received credits from this arrangement, which resulted in the reduction of the Fund’s total expenses of $3,686.
17 Invesco Global Core Equity Fund
NOTE 5—Trustees’ and Officers’ Fees and Benefits
Trustees’ and Officers’ Fees and Benefits include amounts accrued by the Fund to pay remuneration to certain Trustees and Officers of the Fund. Trustees have the option to defer compensation payable by the Fund, and Trustees’ and Officers’ Fees and Benefits also include amounts accrued by the Fund to fund such deferred compensation amounts. Those Trustees who defer compensation have the option to select various Invesco Funds in which their deferral accounts shall be deemed to be invested. Finally, certain current Trustees were eligible to participate in a retirement plan that provided for benefits to be paid upon retirement to Trustees over a period of time based on the number of years of service. The Fund may have certain former Trustees who also participate in a retirement plan and receive benefits under such plan. Trustees’ and Officers’ Fees and Benefits include amounts accrued by the Fund to fund such retirement benefits. Obligations under the deferred compensation and retirement plans represent unsecured claims against the general assets of the Fund.
NOTE 6—Cash Balances
The Fund is permitted to temporarily carry a negative or overdrawn balance in its account with State Street Bank and Trust Company, the custodian bank. Such balances, if any at period end, are shown in the Statement of Assets and Liabilities under the payable caption Amount due custodian. To compensate the custodian bank for such overdrafts, the overdrawn Fund may either (1) leave funds as a compensating balance in the account so the custodian bank can be compensated by earning the additional interest; or (2) compensate by paying the custodian bank at a rate agreed upon by the custodian bank and Invesco, not to exceed the contractually agreed upon rate.
NOTE 7—Distributions to Shareholders and Tax Components of Net Assets
Tax Character of Distributions to Shareholders Paid During the Fiscal Years Ended December 31, 2014 and 2013:
| | | | | | | | |
| | | 2014 | | | 2013 | |
Ordinary income | | $ | 11,097,836 | | | $ | 18,075,237 | |
Long-term capital gain | | | 114,298,458 | | | | — | |
Total distributions | | $ | 125,396,294 | | | $ | 18,075,237 | |
Tax Components of Net Assets at Period-End:
| | | | |
| | | 2014 | |
Undistributed ordinary income | | $ | 1,033,891 | |
Undistributed long-term gain | | | 3,787,010 | |
Net unrealized appreciation — investments | | | 42,271,311 | |
Net unrealized appreciation (depreciation) — other investments | | | (188,561 | ) |
Temporary book/tax differences | | | (288,892 | ) |
Capital loss carryforward | | | (27,589,177 | ) |
Shares of beneficial interest | | | 1,081,570,877 | |
Total net assets | | $ | 1,100,596,459 | |
The difference between book-basis and tax-basis unrealized appreciation (depreciation) is due to differences in the timing of recognition of gains and losses on investments for tax and book purposes. The Fund’s net unrealized appreciation difference is attributable primarily to wash sales.
The temporary book/tax differences are a result of timing differences between book and tax recognition of income and/or expenses. The Fund’s temporary book/tax differences are the result of the trustee deferral of compensation and retirement plan benefits.
Capital loss carryforward is calculated and reported as of a specific date. Results of transactions and other activity after that date may affect the amount of capital loss carryforward actually available for the Fund to utilize. Capital losses generated in years beginning after December 22, 2010 can be carried forward for an unlimited period, whereas previous losses expire in eight tax years. Capital losses with an expiration period may not be used to offset capital gains until all net capital losses without an expiration date have been utilized. Capital loss carryforwards with no expiration date will retain their character as either short-term or long-term capital losses instead of as short-term capital losses as under prior law. The ability to utilize capital loss carryforwards in the future may be limited under the Internal Revenue Code and related regulations based on the results of future transactions.
The Fund utilized $110,323,708 of capital loss carryforward in the current period to offset net realized capital gain for federal income tax purposes. The Fund has a capital loss carryforward as of December 31, 2014, which expires as follows:
| | | | | | | | | | | | |
| Capital Loss Carryforward* | |
| Expiration | | Short-Term | | | Long-Term | | | Total | |
December 31, 2016 | | $ | 17,488,979 | | | $ | — | | | $ | 17,488,979 | |
December 31, 2017 | | | 10,100,198 | | | | — | | | | 10,100,198 | |
| | | $ | 27,589,177 | | | $ | — | | | $ | 27,589,177 | |
| * | Capital loss carryforward as of the date listed above is reduced for limitations, if any, to the extent required by the Internal Revenue Code and may be further limited depending upon a variety of factors, including the realization of net unrealized gains or losses as of the date of any reorganization. |
18 Invesco Global Core Equity Fund
NOTE 8—Investment Securities
The aggregate amount of investment securities (other than short-term securities, U.S. Treasury obligations and money market funds, if any) purchased and sold by the Fund during the year ended December 31, 2014 was $1,452,374,987 and $1,607,802,868, respectively. Cost of investments on a tax basis includes the adjustments for financial reporting purposes as of the most recently completed federal income tax reporting period-end.
| | | | |
| Unrealized Appreciation (Depreciation) of Investment Securities on a Tax Basis | |
Aggregate unrealized appreciation of investment securities | | $ | 106,009,351 | |
Aggregate unrealized (depreciation) of investment securities | | | (63,738,040 | ) |
Net unrealized appreciation of investment securities | | $ | 42,271,311 | |
Cost of investments for tax purposes is $1,058,872,964.
NOTE 9—Reclassification of Permanent Differences
Primarily as a result of differing book/tax treatment of foreign currency transactions, on December 31, 2014, undistributed net investment income was decreased by $451,862 and undistributed net realized gain (loss) was increased by $451,862. This reclassification had no effect on the net assets of the Fund.
NOTE 10—Share Information
| | | | | | | | | | | | | | | | |
| | | Summary of Share Activity | |
| | | Years ended December 31, | |
| | | 2014(a) | | | 2013 | |
| | | Shares | | | Amount | | | Shares | | | Amount | |
Sold: | | | | | | | | | | | | | | | | |
Class A | | | 1,414,943 | | | $ | 21,709,785 | | | | 1,721,232 | | | $ | 24,226,537 | |
Class B | | | 16,081 | | | | 234,995 | | | | 22,596 | | | | 302,679 | |
Class C | | | 183,386 | | | | 2,710,795 | | | | 264,245 | | | | 3,542,608 | |
Class R | | | 5,150 | | | | 78,352 | | | | 14,419 | | | | 204,017 | |
Class Y | | | 729,591 | | | | 11,389,011 | | | | 363,193 | | | | 5,129,215 | |
Class R5 | | | 7,955 | | | | 124,009 | | | | 18,169 | | | | 257,255 | |
| | | | |
Issued as reinvestment of dividends: | | | | | | | | | | | | | | | | |
Class A | | | 7,371,671 | | | | 98,411,825 | | | | 978,435 | | | | 14,343,849 | |
Class B | | | 268,943 | | | | 3,429,026 | | | | 33,730 | | | | 474,589 | |
Class C | | | 887,752 | | | | 11,345,476 | | | | 69,551 | | | | 979,974 | |
Class R | | | 6,560 | | | | 87,579 | | | | 747 | | | | 10,955 | |
Class Y | | | 157,098 | | | | 2,095,691 | | | | 17,074 | | | | 250,303 | |
Class R5 | | | 4,605 | | | | 62,162 | | | | 584 | | | | 8,653 | |
| | | | |
Automatic conversion of Class B shares to Class A shares: | | | | | | | | | | | | | | | | |
Class A | | | 438,903 | | | | 6,768,594 | | | | 863,323 | | | | 11,996,932 | |
Class B | | | (459,292 | ) | | | (6,768,594 | ) | | | (900,847 | ) | | | (11,996,932 | ) |
| | | | |
Reacquired: | | | | | | | | | | | | | | | | |
Class A | | | (10,926,368 | ) | | | (168,430,038 | ) | | | (14,734,623 | ) | | | (205,740,073 | ) |
Class B | | | (434,089 | ) | | | (6,383,977 | ) | | | (742,785 | ) | | | (9,885,648 | ) |
Class C | | | (1,558,112 | ) | | | (23,033,079 | ) | | | (2,263,660 | ) | | | (30,164,990 | ) |
Class R | | | (10,038 | ) | | | (155,224 | ) | | | (19,938 | ) | | | (283,501 | ) |
Class Y | | | (453,002 | ) | | | (6,939,371 | ) | | | (569,572 | ) | | | (7,947,091 | ) |
Class R5 | | | (19,403 | ) | | | (278,111 | ) | | | (7,063 | ) | | | (97,770 | ) |
Net increase (decrease) in share activity | | | (2,367,666 | ) | | $ | (53,541,094 | ) | | | (14,871,190 | ) | | $ | (204,388,439 | ) |
| (a) | There are entities that are record owners of more than 5% of the outstanding shares of the Fund and in the aggregate own 46% of the outstanding shares of the Fund. IDI has an agreement with these entities to sell Fund shares. The Fund, Invesco and/or Invesco affiliates may make payments to these entities, which are considered to be related to the Fund, for providing services to the Fund, Invesco and/or Invesco affiliates including but not limited to services such as securities brokerage, distribution, third party record keeping and account servicing. The Fund has no knowledge as to whether all or any portion of the shares owned of record by these entities are also owned beneficially. |
19 Invesco Global Core Equity Fund
NOTE 11—Financial Highlights
The following schedule presents financial highlights for a share of the Fund outstanding throughout the periods indicated.
| | | | | | | | | | | | | | | | | | | | | | | | | | | | | | | | | | | | | | | | | | | | | | | | | | | | | | | | |
| | | Net asset
value,
beginning
of period | | | Net
investment
income(a) | | | Net gains
(losses)
on securities
(both
realized and
unrealized) | | | Total from
investment
operations | | | Dividends
from net
investment
income | | | Distributions
from net
realized
gains | | | Total
distributions | | | Net asset
value, end
of period(b) | | | Total
return(c) | | | Net assets,
end of period
(000’s omitted) | | | Ratio of
expenses
to average
net assets
with fee waivers
and/or expenses
absorbed | | | Ratio of
expenses
to average net
assets without
fee waivers
and/or expenses
absorbed | | | Ratio of net
investment
income
to average
net assets | | | Portfolio
turnover(d) | |
Class A | | | | | | | | | | | | | | | | | | | | | | | | | | | | | | | | | | | | | | | | | | | | | | | | | | | | | | | | |
Year ended 12/31/14 | | $ | 15.36 | | | $ | 0.16 | | | $ | (0.14 | ) | | $ | 0.02 | | | $ | (0.17 | ) | | $ | (1.56 | ) | | $ | (1.73 | ) | | $ | 13.65 | | | | 0.38 | % | | $ | 934,893 | | | | 1.29 | %(e) | | | 1.29 | %(e) | | | 1.03 | %(e) | | | 122 | % |
Year ended 12/31/13 | | | 12.76 | | | | 0.22 | | | | 2.61 | | | | 2.83 | | | | (0.23 | ) | | | — | | | | (0.23 | ) | | | 15.36 | | | | 22.28 | | | | 1,077,776 | | | | 1.27 | | | | 1.30 | | | | 1.61 | | | | 33 | |
Year ended 12/31/12 | | | 11.49 | | | | 0.21 | | | | 1.30 | | | | 1.51 | | | | (0.24 | ) | | | (0.00 | ) | | | (0.24 | ) | | | 12.76 | | | | 13.22 | | | | 1,038,232 | | | | 1.25 | | | | 1.34 | | | | 1.77 | | | | 23 | |
Year ended 12/31/11 | | | 13.12 | | | | 0.17 | | | | (1.63 | ) | | | (1.46 | ) | | | (0.17 | ) | | | — | | | | (0.17 | ) | | | 11.49 | | | | (11.21 | ) | | | 1,195,593 | | | | 1.26 | | | | 1.35 | | | | 1.42 | | | | 104 | |
Year ended 12/31/10 | | | 12.36 | | | | 0.10 | | | | 0.74 | | | | 0.84 | | | | (0.08 | ) | | | — | | | | (0.08 | ) | | | 13.12 | | | | 6.85 | | | | 55,730 | | | | 1.78 | | | | 1.78 | | | | 0.84 | | | | 35 | |
Class B | | | | | | | | | | | | | | | | | | | | | | | | | | | | | | | | | | | | | | | | | | | | | | | | | | | | | | | | |
Year ended 12/31/14 | | | 14.73 | | | | 0.04 | | | | (0.14 | ) | | | (0.10 | ) | | | (0.04 | ) | | | (1.56 | ) | | | (1.60 | ) | | | 13.03 | | | | (0.40 | ) | | | 31,846 | | | | 2.04 | (e) | | | 2.04 | (e) | | | 0.28 | (e) | | | 122 | |
Year ended 12/31/13 | | | 12.25 | | | | 0.15 | | | | 2.49 | | | | 2.64 | | | | (0.16 | ) | | | — | | | | (0.16 | ) | | | 14.73 | | | | 21.63 | | | | 44,937 | | | | 1.77 | | | | 2.05 | | | | 1.11 | | | | 33 | |
Year ended 12/31/12 | | | 11.03 | | | | 0.17 | | | | 1.25 | | | | 1.42 | | | | (0.20 | ) | | | (0.00 | ) | | | (0.20 | ) | | | 12.25 | | | | 12.94 | | | | 56,813 | | | | 1.52 | | | | 2.09 | | | | 1.50 | | | | 23 | |
Year ended 12/31/11 | | | 12.63 | | | | 0.13 | | | | (1.59 | ) | | | (1.46 | ) | | | (0.14 | ) | | | — | | | | (0.14 | ) | | | 11.03 | | | | (11.60 | ) | | | 114,607 | | | | 1.55 | | | | 2.10 | | | | 1.13 | | | | 104 | |
Year ended 12/31/10 | | | 11.95 | | | | 0.01 | | | | 0.71 | | | | 0.72 | | | | (0.04 | ) | | | — | | | | (0.04 | ) | | | 12.63 | | | | 6.03 | | | | 9,509 | | | | 2.53 | | | | 2.53 | | | | 0.09 | | | | 35 | |
Class C | | | | | | | | | | | | | | | | | | | | | | | | | | | | | | | | | | | | | | | | | | | | | | | | | | | | | | | | |
Year ended 12/31/14 | | | 14.76 | | | | 0.04 | | | | (0.13 | ) | | | (0.09 | ) | | | (0.04 | ) | | | (1.56 | ) | | | (1.60 | ) | | | 13.07 | | | | (0.33 | ) | | | 111,552 | | | | 2.04 | (e) | | | 2.04 | (e) | | | 0.28 | (e) | | | 122 | |
Year ended 12/31/13 | | | 12.27 | | | | 0.11 | | | | 2.50 | | | | 2.61 | | | | (0.12 | ) | | | — | | | | (0.12 | ) | | | 14.76 | | | | 21.32 | | | | 133,181 | | | | 2.02 | | | | 2.05 | | | | 0.86 | | | | 33 | |
Year ended 12/31/12 | | | 11.04 | | | | 0.12 | | | | 1.24 | | | | 1.36 | | | | (0.13 | ) | | | (0.00 | ) | | | (0.13 | ) | | | 12.27 | | | | 12.40 | | | | 134,387 | | | | 2.00 | | | | 2.09 | | | | 1.02 | | | | 23 | |
Year ended 12/31/11 | | | 12.63 | | | | 0.08 | | | | (1.56 | ) | | | (1.48 | ) | | | (0.11 | ) | | | — | | | | (0.11 | ) | | | 11.04 | | | | (11.82 | ) | | | 177,330 | | | | 2.01 | | | | 2.10 | | | | 0.67 | | | | 104 | |
Year ended 12/31/10 | | | 11.96 | | | | 0.01 | | | | 0.70 | | | | 0.71 | | | | (0.04 | ) | | | — | | | | (0.04 | ) | | | 12.63 | | | | 5.95 | | | | 11,042 | | | | 2.53 | | | | 2.53 | | | | 0.09 | | | | 35 | |
Class R | | | | | | | | | | | | | | | | | | | | | | | | | | | | | | | | | | | | | | | | | | | | | | | | | | | | | | | | |
Year ended 12/31/14 | | | 15.35 | | | | 0.12 | | | | (0.13 | ) | | | (0.01 | ) | | | (0.13 | ) | | | (1.56 | ) | | | (1.69 | ) | | | 13.65 | | | | 0.17 | | | | 807 | | | | 1.54 | (e) | | | 1.54 | (e) | | | 0.78 | (e) | | | 122 | |
Year ended 12/31/13 | | | 12.76 | | | | 0.19 | | | | 2.59 | | | | 2.78 | | | | (0.19 | ) | | | — | | | | (0.19 | ) | | | 15.35 | | | | 21.89 | | | | 882 | | | | 1.52 | | | | 1.55 | | | | 1.36 | | | | 33 | |
Year ended 12/31/12 | | | 11.48 | | | | 0.18 | | | | 1.30 | | | | 1.48 | | | | (0.20 | ) | | | (0.00 | ) | | | (0.20 | ) | | | 12.76 | | | | 12.98 | | | | 794 | | | | 1.50 | | | | 1.59 | | | | 1.52 | | | | 23 | |
Year ended 12/31/11(f) | | | 13.30 | | | | 0.09 | | | | (1.80 | ) | | | (1.71 | ) | | | (0.11 | ) | | | — | | | | (0.11 | ) | | | 11.48 | | | | (12.89 | ) | | | 661 | | | | 1.50 | (g) | | | 1.59 | (g) | | | 1.18 | (g) | | | 104 | |
Class Y | | | | | | | | | | | | | | | | | | | | | | | | | | | | | | | | | | | | | | | | | | | | | | | | | | | | | | | | |
Year ended 12/31/14 | | | 15.35 | | | | 0.20 | | | | (0.14 | ) | | | 0.06 | | | | (0.21 | ) | | | (1.56 | ) | | | (1.77 | ) | | | 13.64 | | | | 0.65 | | | | 21,136 | | | | 1.04 | (e) | | | 1.04 | (e) | | | 1.28 | (e) | | | 122 | |
Year ended 12/31/13 | | | 12.76 | | | | 0.26 | | | | 2.60 | | | | 2.86 | | | | (0.27 | ) | | | — | | | | (0.27 | ) | | | 15.35 | | | | 22.51 | | | | 17,125 | | | | 1.02 | | | | 1.05 | | | | 1.86 | | | | 33 | |
Year ended 12/31/12 | | | 11.49 | | | | 0.24 | | | | 1.31 | | | | 1.55 | | | | (0.28 | ) | | | (0.00 | ) | | | (0.28 | ) | | | 12.76 | | | | 13.53 | | | | 16,646 | | | | 1.00 | | | | 1.09 | | | | 2.02 | | | | 23 | |
Year ended 12/31/11 | | | 13.11 | | | | 0.20 | | | | (1.63 | ) | | | (1.43 | ) | | | (0.19 | ) | | | — | | | | (0.19 | ) | | | 11.49 | | | | (10.99 | ) | | | 24,711 | | | | 1.01 | | | | 1.10 | | | | 1.67 | | | | 104 | |
Year ended 12/31/10 | | | 12.36 | | | | 0.13 | | | | 0.74 | | | | 0.87 | | | | (0.12 | ) | | | — | | | | (0.12 | ) | | | 13.11 | | | | 7.05 | | | | 689 | | | | 1.53 | | | | 1.53 | | | | 1.09 | | | | 35 | |
Class R5 | | | | | | | | | | | | | | | | | | | | | | | | | | | | | | | | | | | | | | | | | | | | | | | | | | | | | | | | |
Year ended 12/31/14 | | | 15.52 | | | | 0.22 | | | | (0.14 | ) | | | 0.08 | | | | (0.23 | ) | | | (1.56 | ) | | | (1.79 | ) | | | 13.81 | | | | 0.76 | | | | 362 | | | | 0.94 | (e) | | | 0.94 | (e) | | | 1.38 | (e) | | | 122 | |
Year ended 12/31/13 | | | 12.90 | | | | 0.28 | | | | 2.62 | | | | 2.90 | | | | (0.28 | ) | | | — | | | | (0.28 | ) | | | 15.52 | | | | 22.60 | | | | 513 | | | | 0.95 | | | | 0.95 | | | | 1.93 | | | | 33 | |
Year ended 12/31/12 | | | 11.61 | | | | 0.25 | | | | 1.32 | | | | 1.57 | | | | (0.28 | ) | | | (0.00 | ) | | | (0.28 | ) | | | 12.90 | | | | 13.59 | | | | 275 | | | | 0.96 | | | | 0.96 | | | | 2.06 | | | | 23 | |
Year ended 12/31/11 | | | 13.21 | | | | 0.20 | | | | (1.61 | ) | | | (1.41 | ) | | | (0.19 | ) | | | — | | | | (0.19 | ) | | | 11.61 | | | | (10.76 | ) | | | 290 | | | | 0.96 | | | | 0.96 | | | | 1.72 | | | | 104 | |
Year ended 12/31/10 | | | 12.45 | | | | 0.17 | | | | 0.75 | | | | 0.92 | | | | (0.16 | ) | | | — | | | | (0.16 | ) | | | 13.21 | | | | 7.45 | | | | 30 | | | | 1.23 | | | | 1.23 | | | | 1.38 | | | | 35 | |
| (a) | Calculated using average shares outstanding. |
| (b) | Includes redemption fees added to shares of beneficial interest which were less than $0.005 per share for fiscal years December 31, 2012 and prior. |
| (c) | Includes adjustments in accordance with accounting principles generally accepted in the United States of America and as such, the net asset value for financial reporting purposes and the returns based upon those net asset values may differ from the net asset value and returns for shareholder transactions. Does not include sales charges and is not annualized for periods less than one year, if applicable. |
| (d) | Portfolio turnover is calculated at the fund level and is not annualized for periods less than one year, if applicable. For the period ended December 31, 2011, the portfolio turnover calculation excludes the value of securities purchased of $1,736,154,552 and sold of $1,280,761,748 in the effort to realign the Fund’s portfolio holdings after the reorganization of Invesco Global Dividend Growth Securities Fund, Invesco Global Fund, Invesco Van Kampen Global Equity Allocation Fund and Invesco Van Kampen Global Franchise Fund into the Fund. |
| (e) | Ratios are based on average daily net assets (000’s omitted) of $1,022,981, $38,655, $123,953, $849, $18,452, and $557 for Class A, Class B, Class C, Class R, Class Y, and Class R5 shares, respectively. |
| (f) | Commencement date of May 23, 2011. |
20 Invesco Global Core Equity Fund
Report of Independent Registered Public Accounting Firm
To the Board of Trustees of AIM Funds Group (Invesco Funds Group)
and Shareholders of Invesco Global Core Equity Fund:
In our opinion, the accompanying statement of assets and liabilities, including the schedule of investments, and the related statements of operations and of changes in net assets and the financial highlights present fairly, in all material respects, the financial position of Invesco Global Core Equity Fund (one of the funds constituting AIM Funds Group (Invesco Funds Group), hereafter referred to as the “Fund”) at December 31, 2014, the results of its operations for the year then ended, the changes in its net assets for each of the two years in the period then ended and the financial highlights for each of the five years in the period then ended, in conformity with accounting principles generally accepted in the United States of America. These financial statements and financial highlights (hereafter referred to as “financial statements”) are the responsibility of the Fund’s management. Our responsibility is to express an opinion on these financial statements based on our audits. We conducted our audits of these financial statements in accordance with the standards of the Public Company Accounting Oversight Board (United States). Those standards require that we plan and perform the audit to obtain reasonable assurance about whether the financial statements are free of material misstatement. An audit includes examining, on a test basis, evidence supporting the amounts and disclosures in the financial statements, assessing the accounting principles used and significant estimates made by management, and evaluating the overall financial statement presentation. We believe that our audits, which included confirmation of securities at December 31, 2014 by correspondence with the custodian and brokers, and the application of alternative auditing procedures where confirmations of security purchases have not been received, provide a reasonable basis for our opinion.
Houston, Texas
February 23, 2015
21 Invesco Global Core Equity Fund
Calculating your ongoing Fund expenses
Example
As a shareholder of the Fund, you incur two types of costs: (1) transaction costs, which may include sales charges (loads) on purchase payments or contingent deferred sales charges on redemptions, if any; and (2) ongoing costs, including management fees, distribution and/or service (12b-1) fees, and other Fund expenses. This example is intended to help you understand your ongoing costs (in dollars) of investing in the Fund and to compare these costs with ongoing costs of investing in other mutual funds. The example is based on an investment of $1,000 invested at the beginning of the period and held for the entire period July 1, 2014 through December 31, 2014.
Actual expenses
The table below provides information about actual account values and actual expenses. You may use the information in this table, together with the amount you invested, to estimate the expenses that you paid over the period. Simply divide your account value by $1,000 (for example, an $8,600 account value divided by $1,000 = 8.6), then multiply the result by the number in the table under the heading entitled “Actual Expenses Paid During Period” to estimate the expenses you paid on your account during this period.
Hypothetical example for comparison purposes
The table below also provides information about hypothetical account values and hypothetical expenses based on the Fund’s actual expense ratio and an assumed rate of return of 5% per year before expenses, which is not the Fund’s actual return.
The hypothetical account values and expenses may not be used to estimate the actual ending account balance or expenses you paid for the period. You may use this information to compare the ongoing costs of investing in the Fund and other funds. To do so, compare this 5% hypothetical example with the 5% hypothetical examples that appear in the shareholder reports of the other funds.
Please note that the expenses shown in the table are meant to highlight your ongoing costs only and do not reflect any transaction costs, such as sales charges (loads) on purchase payments or contingent deferred sales charges on redemptions, if any. Therefore, the hypothetical information is useful in comparing ongoing costs only, and will not help you determine the relative total costs of owning different funds. In addition, if these transaction costs were included, your costs would have been higher.
| | | | | | | | | | | | | | | | | | | | | | | | |
| Class | | Beginning
Account Value
(07/01/14) | | | ACTUAL | | | HYPOTHETICAL (5% annual return before expenses) | | | Annualized
Expense
Ratio | |
| | | Ending
Account Value
(12/31/14)1 | | | Expenses
Paid During
Period2 | | | Ending
Account Value
(12/31/14) | | | Expenses
Paid During
Period2 | | |
| A | | $ | 1,000.00 | | | $ | 958.80 | | | $ | 6.37 | | | $ | 1,018.70 | | | $ | 6.56 | | | | 1.29 | % |
| B | | | 1,000.00 | | | | 955.90 | | | | 10.06 | | | | 1,014.92 | | | | 10.36 | | | | 2.04 | |
| C | | | 1,000.00 | | | | 955.90 | | | | 10.06 | | | | 1,014.92 | | | | 10.36 | | | | 2.04 | |
| R | | | 1,000.00 | | | | 958.70 | | | | 7.60 | | | | 1,017.44 | | | | 7.83 | | | | 1.54 | |
| Y | | | 1,000.00 | | | | 960.90 | | | | 5.14 | | | | 1,019.96 | | | | 5.30 | | | | 1.04 | |
| R5 | | | 1,000.00 | | | | 961.30 | | | | 4.65 | | | | 1,020.47 | | | | 4.79 | | | | 0.94 | |
| 1 | The actual ending account value is based on the actual total return of the Fund for the period July 1, 2014 through December 31, 2014, after actual expenses and will differ from the hypothetical ending account value which is based on the Fund’s expense ratio and a hypothetical annual return of 5% before expenses. |
| 2 | Expenses are equal to the Fund’s annualized expense ratio as indicated above multiplied by the average account value over the period, multiplied by 184/365 to reflect the most recent fiscal half year. |
22 Invesco Global Core Equity Fund
Tax Information
Form 1099-DIV, Form 1042-S and other year–end tax information provide shareholders with actual calendar year amounts that should be included in their tax returns. Shareholders should consult their tax advisors.
The following distribution information is being provided as required by the Internal Revenue Code or to meet a specific state’s requirement.
The Fund designates the following amounts or, if subsequently determined to be different, the maximum amount allowable for its fiscal year ended December 31, 2014:
| | | | |
Federal and State Income Tax | |
Long-Term Capital Gain Distributions | | $ | 114,298,458 | |
Qualified Dividend Income* | | | 100 | % |
Corporate Dividends Received Deduction* | | | 76.21 | % |
| | * | The above percentages are based on ordinary income dividends paid to shareholders during the Fund’s fiscal year. |
23 Invesco Global Core Equity Fund
Trustees and Officers
The address of each trustee and officer is AIM Funds Group (Invesco Funds Group) (the “Trust”), 11 Greenway Plaza, Suite 1000, Houston, Texas 77046-1173. The trustees serve for the life of the Trust, subject to their earlier death, incapacitation, resignation, retirement or removal as more specifically provided in the Trust’s organizational documents. Each officer serves for a one year term or until their successors are elected and qualified. Column two below includes length of time served with predecessor entities, if any.
| | | | | | | | |
Name, Year of Birth and
Position(s) Held with the Trust | | Trustee and/
or Officer Since | | Principal Occupation(s)
During Past 5 Years | | Number of
Funds in Fund
Complex
Overseen by
Trustee | | Other Directorship(s)
Held by Trustee During
Past 5 Years |
| Interested Persons | | | | | | | | |
| Martin L. Flanagan1 — 1960 Trustee | | 2007 | | Executive Director, Chief Executive Officer and President, Invesco Ltd. (ultimate parent of Invesco and a global investment management firm); Advisor to the Board, Invesco Advisers, Inc. (formerly known as Invesco Institutional (N.A.), Inc.); Trustee, The Invesco Funds; Vice Chair, Investment Company Institute; and Member of Executive Board, SMU Cox School of Business Formerly: Chairman and Chief Executive Officer, Invesco Advisers, Inc. (registered investment adviser); Director, Chairman, Chief Executive Officer and President, IVZ Inc. (holding company), INVESCO Group Services, Inc. (service provider) and Invesco North American Holdings, Inc. (holding company); Director, Chief Executive Officer and President, Invesco Holding Company Limited (parent of Invesco and a global investment management firm); Director, Invesco Ltd.; Chairman, Investment Company Institute and President, Co-Chief Executive Officer, Co-President, Chief Operating Officer and Chief Financial Officer, Franklin Resources, Inc. (global investment management organization). | | 144 | | None |
Philip A. Taylor2 — 1954
Trustee, President and Principal Executive Officer | | 2006 | | Head of North American Retail and Senior Managing Director, Invesco Ltd.; Director, Co-Chairman, Co-President and Co-Chief Executive Officer, Invesco Advisers, Inc. (formerly known as Invesco Institutional (N.A.), Inc.) (registered investment adviser); Director, Chairman, Chief Executive Officer and President, Invesco Management Group, Inc. (formerly known as Invesco Aim Management Group, Inc.) (financial services holding company); Director and President, INVESCO Funds Group, Inc. (registered investment adviser and registered transfer agent); Director and Chairman, Invesco Investment Services, Inc. (formerly known as Invesco Aim Investment Services, Inc.) (registered transfer agent) and IVZ Distributors, Inc. (formerly known as INVESCO Distributors, Inc.) (registered broker dealer); Director, President and Chairman, Invesco Inc. (holding company) and Invesco Canada Holdings Inc. (holding company); Chief Executive Officer, Invesco Corporate Class Inc. (corporate mutual fund company) and Invesco Canada Fund Inc. (corporate mutual fund company); Director, Chairman and Chief Executive Officer, Invesco Canada Ltd. (formerly known as Invesco Trimark Ltd./Invesco Trimark Ltèe) (registered investment adviser and registered transfer agent); Trustee, President and Principal Executive Officer, The Invesco Funds (other than AIM Treasurer’s Series Trust (Invesco Treasurer’s Series Trust) and Short-Term Investments Trust); Trustee and Executive Vice President, The Invesco Funds (AIM Treasurer’s Series Trust (Invesco Treasurer’s Series Trust) and Short-Term Investments Trust only); Director, Invesco Investment Advisers LLC (formerly known as Van Kampen Asset Management); Director, Chief Executive Officer and President, Van Kampen Exchange Corp. Formerly: Director and Chairman, Van Kampen Investor Services Inc.; Director, Chief Executive Officer and President, 1371 Preferred Inc. (holding company) and Van Kampen Investments Inc.; Director and President, AIM GP Canada Inc. (general partner for limited partnerships) and Van Kampen Advisors, Inc.; Director and Chief Executive Officer, Invesco Trimark Dealer Inc. (registered broker dealer); Director, Invesco Distributors, Inc. (formerly known as Invesco Aim Distributors, Inc.) (registered broker dealer); Manager, Invesco PowerShares Capital Management LLC; Director, Chief Executive Officer and President, Invesco Advisers, Inc.; Director, Chairman, Chief Executive Officer and President, Invesco Aim Capital Management, Inc.; President, Invesco Trimark Dealer Inc. and Invesco Trimark Ltd./Invesco Trimark Ltèe; Director and President, AIM Trimark Corporate Class Inc. and AIM Trimark Canada Fund Inc.; Senior Managing Director, Invesco Holding Company Limited; Director and Chairman, Fund Management Company (former registered broker dealer); President and Principal Executive Officer, The Invesco Funds (AIM Treasurer’s Series Trust (Invesco Treasurer’s Series Trust), and Short-Term Investments Trust only); President, AIM Trimark Global Fund Inc. and AIM Trimark Canada Fund Inc. | | 144 | | None |
| Independent Trustees | | | | | | | | |
Bruce L. Crockett — 1944 Trustee and Chair | | 1987 | | Chairman, Crockett Technologies Associates (technology consulting company) Formerly: Director, Captaris (unified messaging provider); Director, President and Chief Executive Officer, COMSAT Corporation; Chairman, Board of Governors of INTELSAT (international communications company); ACE Limited (insurance company); and Investment Company Institute | | 144 | | ALPS (Attorneys Liability Protection Society) (insurance company) |
| 1 | Mr. Flanagan is considered an interested person (within the meaning of Section 2(a)(19) of the 1940 Act) of the Trust because he is an officer of the Adviser to the Trust, and an officer and a director of Invesco Ltd., ultimate parent of the Adviser. |
| 2 | Mr. Taylor is considered an interested person (within the meaning of Section 2(a)(19) of the 1940 Act) of the Trust because he is an officer and a director of the Adviser. |
T-1 Invesco Global Core Equity Fund
Trustees and Officers—(continued)
| | | | | | | | |
Name, Year of Birth and
Position(s) Held with the Trust | | Trustee and/
or Officer Since | | Principal Occupation(s)
During Past 5 Years | | Number of
Funds in Fund
Complex
Overseen by
Trustee | | Other Directorship(s)
Held by Trustee During
Past 5 Years |
| Independent Trustees—(continued) |
David C. Arch — 1945 Trustee | | 2010 | | Chairman of Blistex Inc., a consumer health care products manufacturer | | 144 | | Board member of the Illinois Manufacturers’ Association; Member of the Board of Visitors, Institute for the Humanities, University of Michigan; Member of the Audit Committee of the Edward-Elmhurst Hospital |
James T. Bunch — 1942 Trustee | | 2003 | | Managing Member, Grumman Hill Group LLC (family office private equity investments) Formerly: Founder, Green Manning & Bunch Ltd. (investment banking firm) (1988-2010); Executive Committee, United States Golf Association; and Director, Policy Studies, Inc. and Van Gilder Insurance Corporation | | 144 | | Chairman, Board of Governors, Western Golf Association; Chairman, Evans Scholars Foundation; and Director, Denver Film Society |
Rodney F. Dammeyer — 1940 Trustee | | 2010 | | Chairman of CAC, LLC, (private company offering capital investment and management advisory services) Formerly: Prior to 2001, Managing Partner at Equity Group Corporate Investments; Prior to 1995, Chief Executive Officer of Itel Corporation (formerly Anixter International); Prior to 1985, experience includes Senior Vice President and Chief Financial Officer of Household International, Inc., Executive Vice President and Chief Financial Officer of Northwest Industries, Inc. and Partner of Arthur Andersen & Co.; From 1987 to 2010, Director/Trustee of investment companies in the Van Kampen Funds complex | | 144 | | Director of Quidel Corporation and Stericycle, Inc. |
Albert R. Dowden — 1941 Trustee | | 2000 | | Director of a number of public and private business corporations, including the Boss Group, Ltd. (private investment and management); Nature’s Sunshine Products, Inc. and Reich & Tang Funds (5 portfolios) (registered investment company) Formerly: Director, Homeowners of America Holding Corporation/Homeowners of America Insurance Company (property casualty company); Director, Continental Energy Services, LLC (oil and gas pipeline service); Director, CompuDyne Corporation (provider of product and services to the public security market) and Director, Annuity and Life Re (Holdings), Ltd. (reinsurance company); Director, President and Chief Executive Officer, Volvo Group North America, Inc.; Senior Vice President, AB Volvo; Director of various public and private corporations; Chairman, DHJ Media, Inc.; Director, Magellan Insurance Company; and Director, The Hertz Corporation, Genmar Corporation (boat manufacturer), National Media Corporation; Advisory Board of Rotary Power International (designer, manufacturer, and seller of rotary power engines); and Chairman, Cortland Trust, Inc. (registered investment company) | | 144 | | Director of: Nature’s Sunshine Products, Inc., Reich & Tang Funds, Homeowners of America Holding Corporation/ Homeowners of America Insurance Company, the Boss Group |
Jack M. Fields — 1952 Trustee | | 1997 | | Chief Executive Officer, Twenty First Century Group, Inc. (government affairs company); Owner and Chief Executive Officer, Dos Angeles Ranch, L.P. (cattle, hunting, corporate entertainment); and Discovery Global Education Fund (non-profit) Formerly: Chief Executive Officer, Texana Timber LP (sustainable forestry company); Director of Cross Timbers Quail Research Ranch (non-profit); and member of the U.S. House of Representatives | | 144 | | Insperity, Inc. (formerly known as Administaff) |
Prema Mathai-Davis — 1950 Trustee | | 1998 | | Retired. Formerly: Chief Executive Officer, YWCA of the U.S.A. | | 144 | | None |
Larry Soll — 1942 Trustee | | 2003 | | Retired. Formerly: Chairman, Chief Executive Officer and President, Synergen Corp. (a biotechnology company) | | 144 | | None |
Hugo F. Sonnenschein — 1940 Trustee | | 2010 | | President Emeritus and Honorary Trustee of the University of Chicago and the Adam Smith Distinguished Service Professor in the Department of Economics at the University of Chicago. Prior to 2000, President of the University of Chicago | | 144 | | Trustee of the University of Rochester and a member of its investment committee; Member of the National Academy of Sciences and the American Philosophical Society; Fellow of the American Academy of Arts and Sciences |
Raymond Stickel, Jr. — 1944 Trustee | | 2005 | | Retired. Formerly: Director, Mainstay VP Series Funds, Inc. (25 portfolios) and Partner, Deloitte & Touche | | 144 | | None |
T-2 Invesco Global Core Equity Fund
Trustees and Officers—(continued)
| | | | | | | | |
Name, Year of Birth and
Position(s) Held with the Trust | | Trustee and/
or Officer Since | | Principal Occupation(s)
During Past 5 Years | | Number of
Funds in Fund
Complex
Overseen by
Trustee | | Other Directorship(s)
Held by Trustee During
Past 5 Years |
| Independent Trustees—(continued) |
Suzanne H. Woolsey — 1941 Trustee | | 2014 | | Chief Executive Officer of Woolsey Partners LLC | | 144 | | Emeritus Chair of the Board of Trustees of the Institute for Defense Analyses; Trustee of Colorado College; Trustee of California Institute of Technology; Prior to 2014, Director of Fluor Corp.; Prior to 2010, Trustee of the German Marshall Fund of the United States; Prior to 2010 Trustee of the Rocky Mountain Institute |
| Other Officers | | | | | | | | |
Russell C. Burk — 1958
Senior Vice President and Senior Officer | | 2005 | | Senior Vice President and Senior Officer, The Invesco Funds | | N/A | | N/A |
John M. Zerr — 1962
Senior Vice President, Chief Legal Officer and Secretary | | 2006 | | Director, Senior Vice President, Secretary and General Counsel, Invesco Management Group, Inc. (formerly known as Invesco Aim Management Group, Inc.) and Van Kampen Exchange Corp.; Senior Vice President, Invesco Advisers, Inc. (formerly known as Invesco Institutional (N.A.), Inc.) (registered investment adviser); Senior Vice President and Secretary, Invesco Distributors, Inc. (formerly known as Invesco Aim Distributors, Inc.); Director, Vice President and Secretary, Invesco Investment Services, Inc. (formerly known as Invesco Aim Investment Services, Inc.) and IVZ Distributors, Inc. (formerly known as INVESCO Distributors, Inc.); Director and Vice President, INVESCO Funds Group, Inc.; Senior Vice President, Chief Legal Officer and Secretary, The Invesco Funds; Manager, Invesco PowerShares Capital Management LLC; Director, Secretary and General Counsel, Invesco Investment Advisers LLC (formerly known as Van Kampen Asset Management); Secretary and General Counsel, Invesco Capital Markets, Inc. (formerly known as Van Kampen Funds Inc.) and Chief Legal Officer, PowerShares Exchange-Traded Fund Trust, PowerShares Exchange-Traded Fund Trust II, PowerShares India Exchange-Traded Fund Trust , PowerShares Actively Managed Exchange-Traded Fund Trust; and PowerShares Actively Managed Exchange-Traded Commodity Fund Trust Formerly: Director and Vice President, Van Kampen Advisors Inc.; Director, Vice President, Secretary and General Counsel, Van Kampen Investor Services Inc.; Director, Invesco Distributors, Inc. (formerly known as Invesco Aim Distributors, Inc.); Director, Senior Vice President, General Counsel and Secretary, Invesco Aim Advisers, Inc. and Van Kampen Investments Inc.; Director, Vice President and Secretary, Fund Management Company; Director, Senior Vice President, Secretary, General Counsel and Vice President, Invesco Aim Capital Management, Inc.; Chief Operating Officer and General Counsel, Liberty Ridge Capital, Inc. (an investment adviser); Vice President and Secretary, PBHG Funds (an investment company) and PBHG Insurance Series Fund (an investment company); Chief Operating Officer, General Counsel and Secretary, Old Mutual Investment Partners (a broker-dealer); General Counsel and Secretary, Old Mutual Fund Services (an administrator) and Old Mutual Shareholder Services (a shareholder servicing center); Executive Vice President, General Counsel and Secretary, Old Mutual Capital, Inc. (an investment adviser); and Vice President and Secretary, Old Mutual Advisors Funds (an investment company) | | N/A | | N/A |
Sheri Morris — 1964
Vice President, Treasurer and Principal Financial Officer | | 1999 | | Vice President, Treasurer and Principal Financial Officer, The Invesco Funds; Vice President, Invesco Advisers, Inc. (formerly known as Invesco Institutional (N.A.), Inc.) (registered investment adviser); and Vice President, PowerShares Exchange-Traded Fund Trust, PowerShares Exchange-Traded Fund Trust II, PowerShares India Exchange-Traded Fund Trust, PowerShares Actively Managed Exchange-Traded Fund Trust, and PowerShares Actively Managed Exchange-Traded Commodity Fund Trust Formerly: Vice President, Invesco Aim Advisers, Inc., Invesco Aim Capital Management, Inc. and Invesco Aim Private Asset Management, Inc.; Assistant Vice President and Assistant Treasurer, The Invesco Funds and Assistant Vice President, Invesco Advisers, Inc., Invesco Aim Capital Management, Inc. and Invesco Aim Private Asset Management, Inc.; and Treasurer, PowerShares Exchange-Traded Fund Trust, PowerShares Exchange-Traded Fund Trust II, PowerShares India Exchange-Traded Fund Trust and PowerShares Actively Managed Exchange-Traded Fund Trust | | N/A | | N/A |
T-3 Invesco Global Core Equity Fund
Trustees and Officers—(continued)
| | | | | | | | |
Name, Year of Birth and
Position(s) Held with the Trust | | Trustee and/
or Officer Since | | Principal Occupation(s)
During Past 5 Years | | Number of
Funds in Fund
Complex
Overseen by
Trustee | | Other Directorship(s)
Held by Trustee During
Past 5 Years |
| Other Officers—(continued) | | | | | | | | |
Karen Dunn Kelley — 1960
Vice President | | 1992 | | Senior Managing Director, Investments; Director, Co-President, Co-Chief Executive Officer, and Co-Chairman, Invesco Advisers, Inc. (formerly known as Invesco Institutional (N.A.), Inc.) (registered investment adviser); Chairman, Invesco Senior Secured Management, Inc.; Senior Vice President, Invesco Management Group, Inc. (formerly known as Invesco Aim Management Group, Inc.); Executive Vice President, Invesco Distributors, Inc. (formerly known as Invesco Aim Distributors, Inc.); Director, Invesco Mortgage Capital Inc. and Invesco Management Company Limited; Director and President, INVESCO Asset Management (Bermuda) Ltd., Vice President, The Invesco Funds (other than AIM Treasurer’s Series Trust (Invesco Treasurer’s Series Trust) and Short-Term Investments Trust); and President and Principal Executive Officer, The Invesco Funds (AIM Treasurer’s Series Trust (Invesco Treasurer’s Series Trust) and Short-Term Investments Trust only) Formerly: Director, INVESCO Global Asset Management Limited and INVESCO Management S.A.; Senior Vice President, Van Kampen Investments Inc. and Invesco Advisers, Inc. (formerly known as Invesco Institutional (N.A.), Inc.) (registered investment adviser); Vice President, Invesco Advisers, Inc. (formerly known as Invesco Institutional (N.A.), Inc.); Director of Cash Management and Senior Vice President, Invesco Advisers, Inc. and Invesco Aim Capital Management, Inc.; Director and President, Fund Management Company; Chief Cash Management Officer, Director of Cash Management, Senior Vice President, and Managing Director, Invesco Aim Capital Management, Inc.; Director of Cash Management, Senior Vice President, and Vice President, Invesco Advisers, Inc. and The Invesco Funds (AIM Treasurer’s Series Trust (Invesco Treasurer’s Series Trust), and Short-Term Investments Trust only) | | N/A | | N/A |
Crissie M. Wisdom — 1969
Anti-Money Laundering Compliance Officer | | 2013 | | Anti-Money Laundering Compliance Officer, Invesco Advisers, Inc. (formerly known as Invesco Institutional (N.A.), Inc.) (registered investment adviser), Invesco Capital Markets, Inc. (formerly known as Van Kampen Funds Inc.), Invesco Distributors, Inc., Invesco Investment Services, Inc., Invesco Management Group, Inc., Van Kampen Exchange Corp., The Invesco Funds, and PowerShares Exchange-Traded Fund Trust, PowerShares Exchange-Traded Fund Trust II, PowerShares India Exchange-Traded Fund Trust, PowerShares Actively Managed Exchange-Traded Fund Trust and PowerShares Actively Managed Exchange-Traded Commodity Fund Trust; and Fraud Prevention Manager and Controls and Risk Analysis Manager for Invesco Investment Services, Inc. | | N/A | | N/A |
Todd L. Spillane — 1958
Chief Compliance Officer | | 2006 | | Senior Vice President, Invesco Management Group, Inc. (formerly known as Invesco Aim Management Group, Inc.) and Van Kampen Exchange Corp.; Senior Vice President and Chief Compliance Officer, Invesco Advisers, Inc. (registered investment adviser) (formerly known as Invesco Institutional (N.A.), Inc.); Chief Compliance Officer, The Invesco Funds; Vice President, Invesco Distributors, Inc. (formerly known as Invesco Aim Distributors, Inc.) and Invesco Investment Services, Inc. (formerly known as Invesco Aim Investment Services, Inc.) Formerly: Chief Compliance Officer, Invesco Funds (Chicago); Senior Vice President, Van Kampen Investments Inc.; Senior Vice President and Chief Compliance Officer, Invesco Aim Advisers, Inc. and Invesco Aim Capital Management, Inc.; Chief Compliance Officer, INVESCO Private Capital Investments, Inc. (holding company), Invesco Private Capital, Inc. (registered investment adviser), Invesco Global Asset Management (N.A.), Inc., Invesco Senior Secured Management, Inc. (registered investment adviser), Van Kampen Investor Services Inc., PowerShares Exchange-Traded Fund Trust, PowerShares Exchange-Traded Fund Trust II, PowerShares India Exchange-Traded Fund Trust and PowerShares Actively Managed Exchange-Traded Fund Trust; and Vice President, Invesco Aim Capital Management, Inc. and Fund Management Company | | N/A | | N/A |
The Statement of Additional Information of the Trust includes additional information about the Fund’s Trustees and is available upon request, without charge, by calling 1.800.959.4246. Please refer to the Fund’s prospectus for information on the Fund’s sub-advisers.
| | | | | | |
Office of the Fund 11 Greenway Plaza, Suite 1000 Houston, TX 77046-1173 | | Investment Adviser Invesco Advisers, Inc.
1555 Peachtree Street, N.E.
Atlanta, GA 30309 | | Distributor Invesco Distributors, Inc. 11 Greenway Plaza, Suite 1000 Houston, TX 77046-1173 | | Auditors PricewaterhouseCoopers LLP 1000 Louisiana Street, Suite 5800 Houston, TX 77002-5678 |
| | | |
| | | | | | |
Counsel to the Fund Stradley Ronon Stevens & Young, LLP 2005 Market Street, Suite 2600 Philadelphia, PA 19103-7018 | | Counsel to the Independent Trustees Goodwin Procter LLP 901 New York Avenue, N.W. Washington, D.C. 20001 | | Transfer Agent Invesco Investment Services, Inc. 11 Greenway Plaza, Suite 1000 Houston, TX 77046-1173 | | Custodian State Street Bank and Trust Company 225 Franklin Street Boston, MA 02110-2801 |
T-4 Invesco Global Core Equity Fund

Invesco mailing information
Send general correspondence to Invesco Investment Services, Inc., P.O. Box 219078, Kansas City, MO 64121-9078.
Important notice regarding delivery of security holder documents
To reduce Fund expenses, only one copy of most shareholder documents may be mailed to shareholders with multiple accounts at the same address (Householding). Mailing of your shareholder documents may be householded indefinitely unless you instruct us otherwise. If you do not want the mailing of these documents to be combined with those for other members of your household, please contact Invesco Investment Services, Inc. at 800 959 4246 or contact your financial institution. We will begin sending you individual copies for each account within 30 days after receiving your request.
Fund holdings and proxy voting information
The Fund provides a complete list of its holdings four times in each fiscal year, at the quarter ends. For the second and fourth quarters, the lists appear in the Fund’s semiannual and annual reports to shareholders. For the first and third quarters, the Fund files the lists with the Securities and Exchange Commission (SEC) on Form N-Q. The most recent list of portfolio holdings is available at invesco.com/completeqtrholdings. Shareholders can also look up the Fund’s Forms N-Q on the SEC website at sec.gov. Copies of the Fund’s Forms N-Q may be reviewed and copied at the SEC Public Reference Room in Washington, D.C. You can obtain information on the operation of the Public Reference Room, including information about duplicating fee charges, by calling 202 551 8090 or 800 732 0330, or by electronic request at the following email address: publicinfo@sec.gov. The SEC file numbers for the Fund are shown below.
A description of the policies and procedures that the Fund uses to determine how to vote proxies relating to portfolio securities is available without charge, upon request, from our Client Services department at 800 959 4246 or at invesco.com/proxyguidelines. The information is also available on the SEC website, sec.gov.
| | |
Information regarding how the Fund voted proxies related to its portfolio securities during the most recent 12-month period ended June 30 is available at invesco.com/proxysearch. The information is also available on the SEC website, sec.gov. Invesco Advisers, Inc. is an investment adviser; it provides investment advisory services to individual and institutional clients and does not sell securities. Invesco Distributors, Inc. is the US distributor for Invesco Ltd.’s retail mutual funds, exchange-traded funds and institutional money market funds. Both are wholly owned, indirect subsidiaries of Invesco Ltd. | |  |
| |
SEC file numbers: 811-01540 and 002-27334 GCE-AR-1 Invesco Distributors, Inc. | | |
| | | | |
| | |
 | | Annual Report to Shareholders | | December 31, 2014 |
| | |
| Invesco International Small Company Fund Nasdaq: A: IEGAX n B: IEGBX n C: IEGCX n Y: IEGYX n R5: IEGIX n R6: IEGFX |

Letters to Shareholders
| | | | |

Philip Taylor | | | | Dear Shareholders: This annual report includes information about your Fund, including performance data and a complete list of its investments as of the close of the reporting period. Inside, your Fund’s portfolio managers discuss how they managed your Fund and the factors that affected its performance during the reporting period. I hope you find this report of interest. During the reporting period, the US economy showed unmistakable signs of improvement. After contracting in the first quarter of 2014, the economy expanded strongly in the second and third quarters as employment data improved markedly. Given continuing positive economic trends, the US Federal Reserve (the Fed) ended its extraordinary asset purchase program in October – but it pledged in December to be “patient” before raising interest rates. Overseas, the |
story was much different. Concerns about economic stagnation and the potential for deflation depressed European markets, while the Chinese economy was hurt by a slowdown in manufacturing.
Political change in Washington, DC; changes to monetary policy by the Fed and other central banks; the future direction of oil prices; and unexpected geopolitical events are likely to affect markets in the US and overseas in 2015. This may make some investors hesitant to begin to save for their long-term financial goals. That’s why Invesco has always encouraged investors to work with a professional financial adviser who can stress the importance of starting to save and invest early and the importance of adhering to a disciplined investment plan – when times are good and when they’re uncertain. A financial adviser who knows your unique financial situation, investment goals and risk tolerance can be an invaluable partner as you seek to achieve your financial goals. He or she can offer a long-term perspective when markets are volatile and time-tested advice and guidance when your financial situation or investment goals change.
Timely information when and where you want it
Invesco’s efforts to help investors achieve their financial objectives include providing individual investors and financial professionals with timely information about the markets, the economy and investing – whenever and wherever they want it.
Our website, invesco.com/us, offers a wide range of market insights and investment perspectives. On the website, you’ll find detailed information about our funds, including prices, performance, holdings and portfolio manager commentaries. You can access information about your individual Invesco account whenever it’s convenient for you; just complete a simple, secure online registration. Use the “Log In” box on our home page to get started.
Invesco’s mobile apps for iPhone® and iPad® (both available free from the App StoreSM) allow you to obtain the same detailed information, monitor your account and create customizable watch lists. Also, they allow you to access investment insights from our investment leaders, market strategists, economists and retirement experts. You can sign up to be alerted when new commentary is added, and you can watch portfolio manager videos and have instant access to Invesco news and updates wherever you may be.
In addition to the resources accessible on our website and through our mobile app, you can obtain timely updates to help you stay informed about the markets, the economy and investing by connecting with Invesco on Twitter, LinkedIn or Facebook. You can access our blog at blog.invesco.us.com. Our goal is to provide you the information you want, when and where you want it.
Have questions?
For questions about your account, feel free to contact an Invesco client services representative at 800 959 4246. For Invesco-related questions or comments, please email me directly at phil@invesco.com.
All of us at Invesco look forward to serving your investment management needs for many years to come. Thank you for investing with us.
Sincerely,

Philip Taylor
Senior Managing Director, Invesco Ltd.
iPhone and iPad are trademarks of Apple Inc., registered in the US and other countries. App Store is a service mark of Apple Inc. Invesco Distributors, Inc. is not affiliated with Apple Inc.
2 Invesco International Small Company Fund
| | | | |

Bruce Crockett | | | | Dear Fellow Shareholders: Among the many important lessons I’ve learned in more than 40 years in a variety of business endeavors is the value of a trusted advocate. As independent chair of the Invesco Funds Board, I can assure you that the members of the Board are strong advocates for the interests of investors in Invesco’s mutual funds. We work hard to represent your interests through oversight of the quality of the investment management services your funds receive and other matters important to your investment, including but not limited to: n Ensuring that Invesco offers a diverse lineup of mutual funds that your financial adviser can use to strive to meet your financial needs as your investment goals change over time. n Monitoring how the portfolio management teams of the Invesco funds are performing in light of changing economic and market conditions. |
| n | | Assessing each portfolio management team’s investment performance within the context of the investment strategy described in the fund’s prospectus. |
| n | | Monitoring for potential conflicts of interests that may impact the nature of the services that your funds receive. |
We believe one of the most important services we provide our fund shareholders is the annual review of the funds’ advisory and sub-advisory contracts with Invesco Advisers and its affiliates. This review is required by the Investment Company Act of 1940 and focuses on the nature and quality of the services Invesco provides as the adviser to the Invesco funds and the reasonableness of the fees that it charges for those services. Each year, we spend months carefully reviewing information received from Invesco and a variety of independent sources, such as performance and fee data prepared by Lipper Inc., an independent, third-party firm widely recognized as a leader in its field. We also meet with our independent legal counsel and other independent advisers to review and help us assess the information that we have received. Our goal is to assure that you receive quality investment management services for a reasonable fee.
I trust the measures outlined above provide assurance that you have a worthy advocate when it comes to choosing the Invesco Funds.
As always, please contact me at bruce@brucecrockett.com with any questions or concerns you may have. On behalf of the Board, we look forward to continuing to represent your interests and serving your needs.
Sincerely,

Bruce L. Crockett
Independent Chair
Invesco Funds Board of Trustees
3 Invesco International Small Company Fund
Management’s Discussion of Fund Performance
Performance summary
For the year ended December 31, 2014, Invesco International Small Company Fund delivered negative returns, but Class A shares at net asset value modestly outperformed the Fund’s style-specific benchmark, the MSCI World ex-U.S. Small Cap Index. The Fund’s exposure in the Philippines added to both its absolute and relative returns. A high single-digit cash position was supportive as well. In contrast, the Fund’s exposure in Canada, particularly in the energy sector, was a drag on both relative and absolute returns.
Your Fund’s long-term performance appears later in this report.
Fund vs. Indexes
Total returns, 12/31/13 to 12/31/14, at net asset value (NAV). Performance shown does not include applicable contingent deferred sales charges (CDSC) or front-end sales charges, which would have reduced performance.
| | | | | |
| Class A Shares | | | | -5.01 | % |
| Class B Shares | | | | -5.78 | |
| Class C Shares | | | | -5.73 | |
| Class Y Shares | | | | -4.84 | |
| Class R5 Shares | | | | -4.74 | |
| Class R6 Shares | | | | -4.68 | |
| MSCI EAFE Index‚ (Broad Market Index) | | | | -4.90 | |
| MSCI World ex-U.S. Small Cap Index‚ (Style-Specific Index) | | | | -5.35 | |
| Lipper International Small/Mid-Cap Growth Funds Index¢ (Peer Group Index) | | | | -5.65 | |
Source(s): ‚FactSet Research Systems Inc.; ¢Lipper Inc.
Market conditions and your Fund
While 2014 began on an optimistic note, global equity markets pulled back at various points during the year in reaction to economic and geopolitical concerns. In the US, concerns centered around the potential negative effects of the US Federal Reserve reducing the scope of its asset purchase program beginning in early 2014; it ended all purchases in October. Global equity markets also declined in response to an Argentine sovereign bond default, eurozone banking concerns and geopolitical tensions in Ukraine and the Middle East, which weakened the outlook for global economic growth.
Advanced economies such as the UK and US saw an economic rebound that, while modest, was stronger than in
Europe, where a nascent recovery stalled. While a more supportive monetary policy in the eurozone failed to ignite dramatic economic recovery, it briefly boosted European equity prices despite having little effect on corporate earnings. Meanwhile, the Bank of Japan remained committed to extraordinary monetary stimulus.
Emerging markets slightly outperformed developed international markets (ex-US) for the year, but performance was mixed. In Russia, markets declined significantly as a result of a sharp drop in the price of energy, recession concerns and a sharp decline in the value of the ruble. China continued to face headwinds and struggled to balance structural reforms with its desire to maintain satisfactory
growth, while equity markets in other Asian countries, including India, Indonesia and the Philippines, rose.
A focus on bottom-up analysis of the strengths of individual companies versus where they are located led the Fund to have over 16% exposure to emerging markets versus a less than 0.5% exposure in the Fund’s style-specific index. This overweight exposure to emerging markets was supportive over the year. Within emerging markets, the Fund saw particular strength in its holdings in the Philippines, Thailand, Egypt and Malaysia. None of these markets are represented in the Fund’s style-specific index.
In the Philippines, the Fund’s exposure to the utilities sector saw particular strength with holdings in the sector delivering strong gains. Philippines-based First Gen, a power generation company, was one of the largest contributors to Fund results over the reporting period. The company, which had a choppy 2013 due to a temporary shut down, saw a sharp earnings rebound during the reporting period.
In Thailand, Major Cineplex was a key contributor to both absolute results and relative results versus the Fund’s style-specific index. Major Cineplex has a dominant movie theater franchise in Thailand. The company posted improving revenues and earnings trends due to a stabilized political environment and a strong movie lineup during the year.
The Fund’s high single-digit cash position, in a market that was relatively choppy over the reporting period, contributed favorably to relative results versus the Fund’s style-specific index. It is important to note that we do not use cash for top-down tactical asset allocation purposes. Historically, when the portfolio’s cash position has been higher
| | | | | |
| Portfolio Composition | | |
By sector | | | | | |
| Industrials | | | | 20.1 | % |
| Financials | | | | 14.8 | |
| Information Technology | | | | 13.7 | |
| Energy | | | | 10.4 | |
| Consumer Discretionary | | | | 10.2 | |
| Health Care | | | | 8.5 | |
| Consumer Staples | | | | 5.9 | |
| Utilities | | | | 4.0 | |
| Materials | | | | 2.9 | |
Money Market Funds | | | | | |
| Plus Other Assets Less Liabilities | | | | 9.5 | |
| | | | | |
| Top 10 Equity Holdings* |
| |
1. MorphoSys AG | | | | 4.2 | % |
2. DCC PLC | | | | 3.2 | |
3. First Pacific Co. Ltd. | | | | 2.7 | |
4. Mitel Networks Corp. | | | | 2.6 | |
5. Wilson Sons Ltd.-BDR | | | | 2.6 | |
6. Energy Development Corp. | | | | 2.5 | |
7. IG Group Holdings PLC | | | | 2.5 | |
8. Danieli & C. Officine Meccaniche S.p.A.-Savings Shares | | | | 2.4 | |
9. Fleury S.A. | | | | 2.4 | |
10. Micro Focus International PLC | | | | 2.2 | |
| | | | | |
| Top Five Countries* |
| |
| 1. United Kingdom | | | | 18.5 | % |
2. Canada | | | | 17.5 | |
3. Brazil | | | | 5.7 | |
4. Germany | | | | 5.7 | |
5. Japan | | | | 5.4 | |
| | | | | |
| Total Net Assets | | | | $445.6 million | |
| |
| Total Number of Holdings* | | | | 68 | |
The Fund’s holdings are subject to change, and there is no assurance that the Fund will continue to hold any particular security.
*Excluding money market fund holdings.
4 Invesco International Small Company Fund
than average, it has reflected a lack of investment opportunities focused on earnings, quality and valuation (EQV), rather than an overall negative opinion on markets.
In contrast, stock selections and overweight exposure in Canada detracted from both absolute returns and relative returns versus the Fund’s style-specific index. Particular weakness was seen in the Fund’s Canadian energy holdings, which were significantly hurt by sharply declining oil prices. We saw this price weakness as an opportunity to add Canadian energy holdings to the Fund, with a focus on companies with attractive valuations and superior balance sheets to ride out the storm. The Fund’s Canadian energy holdings have attractive valuations, long-life reserves (for exploration and production companies) and generally strong balance sheets – even in a depressed environment for commodities. Key detractors from Fund performance in Canada included Total Energy Services and Trilogy Energy.
As mentioned above, stock selection decisions are driven by the underlying fundamentals of each individual company, not by any top-down macroeconomic views. This focus on bottom-up stock selection is the key driver of the Fund’s overall profile. As of the end of the year, the Fund’s largest sector exposures were in the financials, energy and industrials sectors. Geographically, the UK and Canada represented over a third of the Fund’s investments with the remainder consisting of diverse exposures to smaller countries from Asia, Latin America and Europe.
Because we believe market volatility is likely to continue, our focus remains on ensuring that our portfolio is comprised of quality, reasonably valued companies capable of sustained earnings growth. We continue to look for quality growth companies that exhibit the following characteristics: strong organic revenue growth, high returns on capital, pricing power, strong balance sheets, cash generation and reasonable valuations. We believe that this balanced EQV-focused approach may help deliver attractive returns over the long term.
We thank you for your continued investment in Invesco International Small Company Fund.
The views and opinions expressed in management’s discussion of Fund performance are those of Invesco Advisers, Inc. These views and opinions are subject to change at any time based on factors such as market and economic conditions. These views and opinions may not be relied upon as investment advice or recommendations, or as an offer for a particular security. The information is not a complete analysis of every aspect of any market, country, industry, security or the Fund. Statements of fact are from sources considered reliable, but Invesco Advisers, Inc. makes no representation or warranty as to their completeness or accuracy. Although historical performance is no guarantee of future results, these insights may help you understand our investment management philosophy.
See important Fund and, if applicable, index disclosures later in this report.
| | |
 | | Shuxin (Steve) Cao Chartered Financial Analyst, Portfolio Manager, is lead manager of Invesco International Small |
| Company Fund. He joined Invesco in 1997. Mr. Cao earned a BA in English from the Tianjin Foreign Language Institute and an MBA from Texas A&M University. He is also a Certified Public Accountant. |
| |
 | | Jason Holzer Chartered Financial Analyst, Portfolio Manager, is manager of Invesco International Small Company Fund. |
| He joined Invesco in 1996. Mr. Holzer earned a BA in quantitative economics and an MS in engineering economic systems from Stanford University. |
| |
 | | Borge Endresen Chartered Financial Analyst, Portfolio Manager, is manager of Invesco International Small Company Fund. |
| He joined Invesco in 1999. Mr. Endresen earned a BS in finance from the University of Oregon and an MBA from The University of Texas at Austin. |
5 Invesco International Small Company Fund
Your Fund’s Long-Term Performance
Results of a $10,000 Investment – Oldest Share Class(es)
Fund and index data from 12/31/04
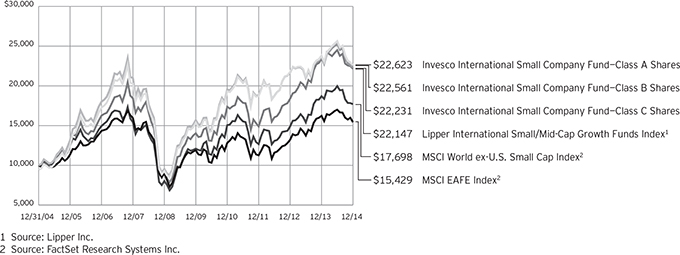
Past performance cannot guarantee comparable future results.
The data shown in the chart include reinvested distributions, applicable sales charges and Fund expenses including management fees. Results for Class B shares are calculated as if a hypothetical
shareholder had liquidated his entire investment in the Fund at the close of the reporting period and paid the contingent deferred sales charges, if applicable. Index results include reinvested dividends, but they do not refiect sales charges. Performance of the peer group,
if applicable, reflects fund expenses and management fees; performance of a market index does not. Performance shown in the chart and table(s) does not reflect deduction of taxes a shareholder would pay on Fund distributions or sale of Fund shares.
continued from page 8
| n | | Preferred securities risk. Preferred securities may include provisions that permit the issuer, in its discretion, to defer or omit distributions for a certain period of time. If the Fund owns a security that is deferring or omitting its distributions, the Fund may be required to report the distribution on its tax returns, even though it may not have received this income. Further, preferred securities may lose substantial value due to the omission or deferment of dividend payments. |
| n | | Small- and mid-capitalization risks. Stocks of small- and mid-sized companies tend to be more vulnerable to adverse developments and may have little or no operating history or track record of success, and limited product lines, markets, management and financial resources. The securities of small- and mid-sized companies may be more volatile due to less market interest and less publicly available information about the issuer. They also may be illiquid or restricted as to resale, or may trade less frequently and in smaller volumes, all of which may cause difficulty when establishing or closing a position at a desirable price. |
About indexes used in this report
| n | | The MSCI EAFE® Index is an unmanaged index considered representative of stocks of Europe, Australasia and the Far East. The index is computed using the net return, which withholds applicable taxes for non-resident investors. |
| n | | The MSCI World ex-U.S. Small Cap Index is an unmanaged index considered representative of small-cap stocks of global developed markets, excluding the US. The index is computed using the net return, which withholds applicable taxes for non-resident investors. |
| n | | The Lipper International Small/Mid-Cap Growth Funds Index is an unmanaged index considered representative of international small/mid-cap growth funds tracked by Lipper. |
| n | | The Fund is not managed to track the performance of any particular index, including the index(es) described here, and consequently, the performance of the Fund may deviate significantly from the performance of the
index(es). |
| n | | A direct investment cannot be made in an index. Unless otherwise indicated, index results include reinvested dividends, and they do not reflect sales charges. |
| | Performance of the peer group, if applicable, reflects fund expenses; performance of a market index does not. |
Other information
| n | | CPA® and Certified Public Accountant® are trademarks owned by the American Institute of Certified Public Accountants. |
| n | | The returns shown in management’s discussion of Fund performance are based on net asset values (NAVs) calculated for shareholder transactions. Generally accepted accounting principles require adjustments to be made to the net assets of the Fund at period end for financial reporting purposes, and as such, the NAVs for shareholder transactions and the returns based on those NAVs may differ from the NAVs and returns reported in the Financial Highlights. |
| n | | Industry classifications used in thiseport are generally according to the Global Industry Classification Standard, which was developed by and is the exclusive property and a service mark of MSCI Inc. and Standard & Poor’s. |
6 Invesco International Small Company Fund
| | | | | |
| Average Annual Total Returns |
| As of 12/31/14, including maximum applicable sales charges | |
| |
| Class A Shares | | | | | |
| Inception (8/31/00) | | | | 9.63 | % |
| 10 Years | | | | 8.51 | |
| 5 Years | | | | 6.83 | |
| 1 Year | | | | –10.22 | |
| |
| Class B Shares | | | | | |
| Inception (8/31/00) | | | | 9.63 | % |
| 10 Years | | | | 8.48 | |
| 5 Years | | | | 6.92 | |
| 1 Year | | | | –10.08 | |
| |
| Class C Shares | | | | | |
| Inception (8/31/00) | | | | 9.28 | % |
| 10 Years | | | | 8.32 | |
| 5 Years | | | | 7.24 | |
| 1 Year | | | | –6.59 | |
| |
| Class Y Shares | | | | | |
| 10 Years | | | | 9.29 | % |
| 5 Years | | | | 8.30 | |
| 1 Year | | | | –4.84 | |
| |
| Class R5 Shares | | | | | |
| 10 Years | | | | 9.53 | % |
| 5 Years | | | | 8.45 | |
| 1 Year | | | | –4.74 | |
| |
| Class R6 Shares | | | | | |
| 10 Years | | | | 9.22 | % |
| 5 Years | | | | 8.24 | |
| 1 Year | | | | –4.68 | |
Class Y shares incepted on October 3, 2008. Performance shown prior to that date is that of Class A shares and includes the 12b-1 fees applicable to Class A shares. Class A share performance reflects any applicable fee waivers or expense reimbursements.
Class R5 shares incepted on October 25, 2005. Performance shown prior to that date is that of Class A shares and includes the 12b-1 fees applicable to Class A shares. Class A share performance reflects any applicable fee waivers or expense reimbursements.
Class R6 shares incepted on September 24, 2012. Performance shown prior to that date is that of Class A shares and includes the 12b-1 fees applicable to Class A shares. Class A share performance reflects any applicable fee waivers or expense reimbursements.
The performance data quoted represent past performance and cannot guarantee comparable future results; current performance may be lower or higher. Please visit invesco.com/performance for the most recent month-end performance. Performance figures reflect reinvested distributions, changes in net asset value and the effect of the maximum sales charge unless otherwise stated. Investment return and principal value will fluctuate so that you may have a gain or loss when you sell shares.
The net annual Fund operating expense ratio set forth in the most recent Fund prospectus as of the date of this report for Class A, Class B, Class C, Class Y, Class R5 and Class R6 shares was 1.47%, 2.22%, 2.22%, 1.22%, 1.15% and 1.06%, respectively.1 The total annual Fund operating expense ratio set forth in the most recent Fund prospectus as of the date of this report for Class A, Class B, Class C, Class Y, Class R5 and Class R6 shares was 1.49%, 2.24%, 2.24%, 1.24%, 1.17% and 1.08%, respectively. The expense ratios presented above may vary from the expense ratios presented in other sections of this report that are based on expenses incurred during the period covered by this report.
Class A share performance reflects the maximum 5.50% sales charge, and Class B and Class C share performance reflects the applicable contingent deferred sales charge (CDSC) for the period involved. The CDSC on Class B shares declines from 5% beginning at the time of purchase to 0% at the beginning of the seventh year. The CDSC on Class C shares is 1% for the first year after purchase. Class Y, Class R5 and Class R6 shares do not have a front-end sales charge or a CDSC; therefore, performance is at net asset value.
The performance of the Fund’s share classes will differ primarily due to different sales charge structures and class expenses.
Had the adviser not waived fees and/ or reimbursed expenses in the past, performance would have been lower.
| 1 | Total annual Fund operating expenses after any contractual fee waivers and/or expense reimbursements by the adviser in effect through at least June 30, 2016. See current prospectus for more information. |
7 Invesco International Small Company Fund
Invesco International Small Company Fund’s investment objective is long-term growth of capital.
| n | | Unless otherwise stated, information presented in this report is as of December 31, 2014, and is based on total net assets. |
| n | | Unless otherwise noted, all data provided by Invesco. |
| n | | To access your Fund’s reports/prospectus, visit invesco.com/fundreports. |
About share classes
| n | | Class B shares may not be purchased for new or additional investments. Please see the prospectus for more information. |
| n | | Class Y shares are available to only certain investors. Please see the prospectus for more information. |
| n | | Class R5 shares and Class R6 shares are primarily intended for employer sponsored retirement and benefit plans that meet certain standards and for institutional investors. Please see the prospectus for more information. |
Principal risks of investing in the Fund
| n | | Depositary receipts risk. Depositary receipts involve many of the same risks as those associated with direct investment in foreign securities. In addition, the underlying issuers of certain depositary receipts, particularly unsponsored or unregistered depositary receipts, are under no obligation to distribute shareholder communications to the holders of such receipts or to pass through to them any voting rights with respect to the deposited securities. |
| n | | Derivatives risk. The value of a derivative instrument depends largely on (and is derived from) the value of an underlying security, currency, commodity, interest rate, index or other asset (each referred to as an underlying asset). In addition to risks relating to the underlying assets, the use of derivatives may include other, possibly greater, risks, including counterparty, leverage and liquidity risks. Counterparty risk is the risk that the counterparty to the derivative contract will default on its obligation to pay the Fund the amount owed or otherwise perform under the derivative contract. Derivatives create leverage risk because they do not require payment up front equal to the economic exposure created by owning the derivative. As a result, an adverse change in the value of the underlying asset could result in the Fund |
| | | sustaining a loss that is substantially greater than the amount invested in the derivative, which may make the Fund’s returns more volatile and increase the risk of loss. Derivative instruments may also be less liquid than more traditional investments and the Fund may be unable to sell or close out its derivative positions at a desirable time or price. This risk may be more acute under adverse market conditions, during which the Fund may be most in need of liquidating its derivative positions. Derivatives may also be harder to value, less tax efficient and subject to changing government regulation that could impact the Fund’s ability to use certain derivatives or their cost. Also, derivatives used for hedging or to gain or limit exposure to a particular market segment may not provide the expected benefits, particularly during adverse market conditions. |
| n | | Developing/emerging markets securities risk. The prices of securities issued by foreign companies and governments located in developing/emerging market countries may be affected more negatively by inflation, devaluation of their currencies, higher transaction costs, delays in settlement, adverse political developments, the introduction of capital controls, withholding taxes, nationalization of private assets, expropriation, social unrest, war or lack of timely information than those in developed countries. |
| n | | Foreign securities risk. The Fund’s foreign investments may be affected by changes in a foreign country’s exchange rates, political and social instability, changes in economic or taxation policies, difficulties when enforcing obligations, decreased liquidity, and increased volatility. Foreign companies may be subject to less regulation resulting in less publicly available information about the companies. |
| n | | Geographic focus risk. From time to time the Fund may invest a substantial amount of its assets in securities of issuers located in a single country or a |
This report must be accompanied or preceded by a currently effective Fund prospectus, which contains more complete information, including sales charges and expenses. Investors should read it carefully before investing.
NOT FDIC INSURED | MAY LOSE VALUE | NO BANK GUARANTEE
| | limited number of countries. If the Fund focuses its investments in this manner, it assumes the risk that economic, political and social conditions in those countries will have a significant impact on its investment performance. The Fund’s investment performance may also be more volatile if it focuses its investments in certain countries, especially emerging markets countries. |
| n | | Growth investing risk. Growth stocks tend to be more expensive relative to their earnings or assets compared with other types of stock. As a result they tend to be more sensitive to changes in their earnings and can be more volatile. |
| n | | Investing in the European Union risk. Many countries in the European Union are susceptible to high economic risks associated with high levels of debt, notably due to investments in sovereign debts of European countries such as Greece, Italy and Spain. One or more member states might exit the European Union, placing its currency and banking system in jeopardy. The European Union faces major issues involving its membership, structure, procedures and policies, including the adoption, abandonment or adjustment of the new constitutional treaty, the European Union’s enlargement to the south and east, and resolution of the European Union’s problematic fiscal and democratic accountability. Efforts of the member states to further unify their economic and monetary policies may increase the potential for the downward movement of one member state’s market to cause a similar effect on other member states’ markets. European countries that are part of the European Economic and Monetary Union may be significantly affected by the tight fiscal and monetary controls that the union seeks to impose on its members. |
| n | | Management risk. The investment techniques and risk analysis used by the Fund’s portfolio managers may not produce the desired results. |
| n | | Market risk. The prices of and the income generated by the Fund’s securities may decline in response to, among other things, investor sentiment, general economic and market conditions, regional or global instability, and currency and interest rate fluctuations. |
continued on page 6
8 Invesco International Small Company Fund
Schedule of Investments
December 31, 2014
| | | | | | | | |
| | | Shares | | | Value | |
Common Stocks & Other Equity Interests–90.55% | |
| Bermuda–2.56% | |
Wilson Sons Ltd.–BDR | | | 945,700 | | | $ | 11,387,116 | |
|
| Brazil–5.73% | |
Diagnosticos da America S.A. | | | 900,700 | | | | 3,775,511 | |
Duratex S.A. | | | 1,342,000 | | | | 4,054,884 | |
Fleury S.A. | | | 1,749,000 | | | | 10,714,073 | |
Totvs S.A. | | | 529,323 | | | | 6,971,066 | |
| | | | | | | | 25,515,534 | |
|
| Canada–17.50% | |
Brookfield Real Estate Services, Inc. | | | 375,300 | | | | 4,186,511 | |
Calian Technologies Ltd. | | | 367,000 | | | | 5,575,443 | |
Calvalley Petroleum Inc.–Class A | | | 3,618,821 | | | | 2,927,950 | |
Cequence Energy Ltd.(a) | | | 3,788,000 | | | | 3,456,085 | |
COM DEV International Ltd. | | | 1,755,900 | | | | 6,030,333 | |
Dorel Industries Inc.–Class B | | | 134,355 | | | | 4,628,066 | |
Epsilon Energy Ltd.(a) | | | 1,204,800 | | | | 4,303,598 | |
Glentel, Inc. | | | 105,300 | | | | 2,283,101 | |
Hammond Power Solutions Inc. | | | 249,800 | | | | 1,578,182 | |
Horizon North Logistics Inc. | | | 786,000 | | | | 1,786,056 | |
Major Drilling Group International Inc. | | | 643,284 | | | | 3,161,604 | |
Onex Corp. | | | 122,587 | | | | 7,118,023 | |
Paramount Resources Ltd.–Class A(a) | | | 237,026 | | | | 5,736,935 | |
Total Energy Services Inc. | | | 742,790 | | | | 8,298,687 | |
TransGlobe Energy Corp. | | | 1,895,422 | | | | 7,863,603 | |
Trilogy Energy Corp. | | | 365,871 | | | | 2,490,996 | |
Wi-LAN Inc. | | | 2,189,700 | | | | 6,558,922 | |
| | | | | | | | 77,984,095 | |
|
| Egypt–1.32% | |
Eastern Tobacco | | | 192,320 | | | | 5,887,424 | |
|
| France–4.94% | |
Caisse Regionale de Credit Agricole Mutuel Nord de France CCI | | | 125,000 | | | | 2,389,948 | |
Constuctions Industrielles de la Mediterranee S.A. | | | 25,804 | | | | 2,360,051 | |
Metropole Television S.A. | | | 373,600 | | | | 7,031,123 | |
Precia S.A.(b) | | | 35,321 | | | | 4,531,073 | |
Vicat S.A. | | | 79,300 | | | | 5,719,272 | |
| | | | | | | | 22,031,467 | |
|
| Germany–5.73% | |
CTS Eventim AG & Co. KGaA | | | 151,000 | | | | 4,488,127 | |
MorphoSys AG(a) | | | 199,514 | | | | 18,473,360 | |
Takkt AG | | | 157,000 | | | | 2,585,705 | |
| | | | | | | | 25,547,192 | |
|
| Greece–0.40% | |
Metka S.A. | | | 175,097 | | | | 1,773,237 | |
| | | | | | | | |
| | | Shares | | | Value | |
| Hong Kong–2.66% | |
First Pacific Co. Ltd. | | | 11,988,000 | | | $ | 11,833,531 | |
| | |
| Ireland–4.20% | | | | | | | | |
DCC PLC | | | 255,895 | | | | 14,064,909 | |
Total Produce PLC | | | 3,600,000 | | | | 4,661,305 | |
| | | | | | | | 18,726,214 | |
|
| Italy–3.15% | |
Ansaldo STS S.p.A. | | | 318,422 | | | | 3,209,736 | |
Danieli & C. Officine Meccaniche S.p.A.–Savings Shares | | | 650,910 | | | | 10,814,657 | |
| | | | | | | | 14,024,393 | |
|
| Japan–5.41% | |
EXEDY Corp. | | | 225,500 | | | | 5,435,821 | |
Nippon Ceramic Co., Ltd. | | | 617,100 | | | | 9,145,462 | |
THK Co., Ltd. | | | 395,000 | | | | 9,538,239 | |
| | | | | | | | 24,119,522 | |
|
| Netherlands–0.81% | |
Aalberts Industries N.V. | | | 121,823 | | | | 3,599,305 | |
|
| New Zealand–1.52% | |
Freightways Ltd. | | | 1,492,274 | | | | 6,751,913 | |
|
| Norway–2.50% | |
Bonheur ASA | | | 313,995 | | | | 3,080,987 | |
Prosafe S.E. | | | 1,345,985 | | | | 4,118,054 | |
TGS Nopec Geophysical Co. ASA | | | 183,066 | | | | 3,960,878 | |
| | | | | | | | 11,159,919 | |
|
| Philippines–4.04% | |
Energy Development Corp. | | | 61,851,350 | | | | 11,276,194 | |
First Gen Corp. | | | 11,807,541 | | | | 6,710,143 | |
| | | | | | | | 17,986,337 | |
|
| Spain–0.34% | |
Duro Felguera, S.A. | | | 377,000 | | | | 1,523,550 | |
|
| Switzerland–3.22% | |
Aryzta AG | | | 50,913 | | | | 3,941,007 | |
Kuoni Reisen Holding AG | | | 17,902 | | | | 5,407,853 | |
Tecan Group AG | | | 44,029 | | | | 5,004,805 | |
| | | | | | | | 14,353,665 | |
|
| Thailand–2.79% | |
Major Cineplex Group PCL | | | 9,097,600 | | | | 7,614,542 | |
Siam Commercial Bank PCL (The) | | | 875,500 | | | | 4,838,516 | |
| | | | | | | | 12,453,058 | |
|
| Turkey–0.67% | |
Yazicilar Holding A.S.–Class A | | | 358,400 | | | | 3,001,251 | |
See accompanying Notes to Financial Statements which are an integral part of the financial statements.
9 Invesco International Small Company Fund
| | | | | | | | |
| | | Shares | | | Value | |
| United Kingdom–18.44% | |
Amlin PLC | | | 607,216 | | | $ | 4,492,135 | |
Catlin Group Ltd. | | | 881,771 | | | | 9,169,721 | |
Clarkson PLC | | | 142,000 | | | | 4,195,413 | |
Halma PLC | | | 519,249 | | | | 5,535,905 | |
HomeServe PLC | | | 883,342 | | | | 4,618,975 | |
IG Group Holdings PLC | | | 985,373 | | | | 10,983,693 | |
Informa PLC | | | 781,491 | | | | 5,702,821 | |
Jupiter Fund Management PLC. | | | 778,948 | | | | 4,373,449 | |
Lancashire Holdings Ltd. | | | 640,465 | | | | 5,551,519 | |
Micro Focus International PLC | | | 575,649 | | | | 9,636,515 | |
Savills PLC | | | 635,866 | | | | 6,704,465 | |
Tullett Prebon PLC | | | 1,417,698 | | | | 6,227,239 | |
Ultra Electronics Holdings PLC | | | 178,278 | | | | 4,973,099 | |
| | | | | | | | 82,164,949 | |
| | | | | | | | |
| | | Shares | | | Value | |
| United States–2.62% | |
Mitel Networks Corp.(a) | | | 1,094,760 | | | $ | 11,656,207 | |
Total Common Stocks & Other Equity Interests
(Cost $339,778,739) | | | | 403,479,879 | |
|
Money Market Funds–5.19% | |
Liquid Assets Portfolio–Institutional Class(c) | | | 11,560,372 | | | | 11,560,372 | |
Premier Portfolio–Institutional
Class(c) | | | 11,560,372 | | | | 11,560,372 | |
Total Money Market Funds
(Cost $23,120,744) | | | | 23,120,744 | |
TOTAL INVESTMENTS–95.74%
(Cost $362,899,483) | | | | 426,600,623 | |
OTHER ASSETS LESS LIABILITIES–4.26% | | | | 18,988,549 | |
NET ASSETS–100.00% | | | $ | 445,589,172 | |
Investment Abbreviations:
| | |
| BDR | | – British Deposit Receipt |
Notes to Schedule of Investments:
| (a) | Non-income producing security. |
| (b) | Affiliated company during the period. The Investment Company Act of 1940 defines affiliates as those issuances in which a fund holds 5% or more of the outstanding voting securities. The Fund has not owned enough of the outstanding voting securities of the issuer to have control (as defined in the Investment Company Act of 1940) of that issuer. The value of this security as of December 31, 2014 represented 1.02% of the Fund’s Net Assets. See Note 4. |
| (c) | The money market fund and the Fund are affiliated by having the same investment adviser. |
See accompanying Notes to Financial Statements which are an integral part of the financial statements.
10 Invesco International Small Company Fund
Statement of Assets and Liabilities
December 31, 2014
| | | | |
Assets: | |
Investments, at value (Cost $335,406,105) | | $ | 398,948,806 | |
Investments in affiliates, at value (Cost $27,493,378) | | | 27,651,817 | |
Total investments, at value (Cost $362,899,483) | | | 426,600,623 | |
Foreign currencies, at value (Cost $14,207,965) | | | 13,521,690 | |
Receivable for: | | | | |
Investments sold | | | 7,723,128 | |
Fund shares sold | | | 1,178,412 | |
Dividends | | | 591,873 | |
Investment for trustee deferred compensation and retirement plans | | | 124,843 | |
Other assets | | | 35,241 | |
Total assets | | | 449,775,810 | |
|
Liabilities: | |
Payable for: | | | | |
Investments purchased | | | 40,050 | |
Fund shares reacquired | | | 2,280,702 | |
Accrued foreign taxes | | | 1,392,417 | |
Accrued fees to affiliates | | | 242,568 | |
Accrued trustees’ and officers’ fees and benefits | | | 584 | |
Accrued other operating expenses | | | 88,013 | |
Trustee deferred compensation and retirement plans | | | 142,304 | |
Total liabilities | | | 4,186,638 | |
Net assets applicable to shares outstanding | | $ | 445,589,172 | |
|
Net assets consist of: | |
Shares of beneficial interest | | $ | 367,079,791 | |
Undistributed net investment income | | | (224,688 | ) |
Undistributed net realized gain | | | 15,720,941 | |
Net unrealized appreciation | | | 63,013,128 | |
| | | $ | 445,589,172 | |
| | | | |
Net Assets: | |
Class A | | $ | 185,379,993 | |
Class B | | $ | 2,827,517 | |
Class C | | $ | 26,458,261 | |
Class Y | | $ | 121,932,576 | |
Class R5 | | $ | 63,044,466 | |
Class R6 | | $ | 45,946,359 | |
|
Shares outstanding, $0.01 par value per share,
with an unlimited number of shares authorized: | |
Class A | | | 10,077,406 | |
Class B | | | 160,097 | |
Class C | | | 1,497,725 | |
Class Y | | | 6,621,336 | |
Class R5 | | | 3,450,399 | |
Class R6 | | | 2,514,476 | |
Class A: | | | | |
Net asset value per share | | $ | 18.40 | |
Maximum offering price per share | | | | |
(Net asset value of $18.40 ¸ 94.50%) | | $ | 19.47 | |
Class B: | | | | |
Net asset value and offering price per share | | $ | 17.66 | |
Class C: | | | | |
Net asset value and offering price per share | | $ | 17.67 | |
Class Y: | | | | |
Net asset value and offering price per share | | $ | 18.42 | |
Class R5: | | | | |
Net asset value and offering price per share | | $ | 18.27 | |
Class R6: | | | | |
Net asset value and offering price per share | | $ | 18.27 | |
See accompanying Notes to Financial Statements which are an integral part of the financial statements.
11 Invesco International Small Company Fund
Statement of Operations
For the year ended December 31, 2014
| | | | |
Investment income: | |
Dividends (net of foreign withholding taxes of $1,300,240) | | $ | 14,534,480 | |
Dividends from affiliates | | | 49,056 | |
Total investment income | | | 14,583,536 | |
| |
Expenses: | | | | |
Advisory fees | | | 4,856,548 | |
Administrative services fees | | | 146,343 | |
Custodian fees | | | 234,271 | |
Distribution fees: | | | | |
Class A | | | 596,669 | |
Class B | | | 40,076 | |
Class C | | | 318,255 | |
Transfer Agent Fees — A, B, C and Y | | | 706,544 | |
Transfer agent fees — R5 | | | 76,857 | |
Transfer agent fees — R6 | | | 5,708 | |
Trustees’ and officers’ fees and benefits | | | 32,643 | |
Other | | | 227,842 | |
Total expenses | | | 7,241,756 | |
Less: Fees waived and expense offset arrangement(s) | | | (75,171 | ) |
Net expenses | | | 7,166,585 | |
Net investment income | | | 7,416,951 | |
| |
Realized and unrealized gain (loss) from: | | | | |
Net realized gain (loss) from: | | | | |
Investment securities | | | 52,125,052 | |
Foreign currencies | | | (182,275 | ) |
| | | | 51,942,777 | |
Change in net unrealized appreciation (depreciation) of: | | | | |
Investment securities (net of foreign taxes on holdings of $565,084) | | | (84,200,359 | ) |
Foreign currencies | | | (693,340 | ) |
| | | | (84,893,699 | ) |
Net realized and unrealized gain (loss) | | | (32,950,922 | ) |
Net increase (decrease) in net assets resulting from operations | | $ | (25,533,971 | ) |
See accompanying Notes to Financial Statements which are an integral part of the financial statements.
12 Invesco International Small Company Fund
Statement of Changes in Net Assets
For the years ended December 31, 2014 and 2013
| | | | | | | | |
| | | 2014 | | | 2013 | |
Operations: | | | | | |
Net investment income | | $ | 7,416,951 | | | $ | 7,805,976 | |
Net realized gain | | | 51,942,777 | | | | 31,111,627 | |
Change in net unrealized appreciation (depreciation) | | | (84,893,699 | ) | | | 11,015,677 | |
Net increase (decrease) in net assets resulting from operations | | | (25,533,971 | ) | | | 49,933,280 | |
| | |
Distributions to shareholders from net investment income: | | | | | | | | |
Class A | | | (2,620,259 | ) | | | (3,820,191 | ) |
Class B | | | (16,009 | ) | | | (26,632 | ) |
Class C | | | (150,436 | ) | | | (160,654 | ) |
Class Y | | | (2,073,781 | ) | | | (1,917,351 | ) |
Class R5 | | | (1,181,254 | ) | | | (1,546,839 | ) |
Class R6 | | | (813,866 | ) | | | (646,296 | ) |
Total distributions from net investment income | | | (6,855,605 | ) | | | (8,117,963 | ) |
| | |
Distributions to shareholders from net realized gains: | | | | | | | | |
Class A | | | (14,618,194 | ) | | | (13,562,737 | ) |
Class B | | | (235,534 | ) | | | (282,918 | ) |
Class C | | | (2,213,267 | ) | | | (1,706,654 | ) |
Class Y | | | (9,413,978 | ) | | | (5,731,040 | ) |
Class R5 | | | (5,095,786 | ) | | | (4,408,571 | ) |
Class R6 | | | (3,317,308 | ) | | | (1,760,133 | ) |
Total distributions from net realized gains | | | (34,894,067 | ) | | | (27,452,053 | ) |
| | |
Share transactions–net: | | | | | | | | |
Class A | | | (74,433,158 | ) | | | (18,143,521 | ) |
Class B | | | (2,042,246 | ) | | | (5,326,242 | ) |
Class C | | | (3,228,359 | ) | | | (3,336,151 | ) |
Class Y | | | 19,692,693 | | | | 28,969,482 | |
Class R5 | | | (17,915,350 | ) | | | 8,949,355 | |
Class R6 | | | 16,010,567 | | | | 18,263,856 | |
Net increase (decrease) in net assets resulting from share transactions | | | (61,915,853 | ) | | | 29,376,779 | |
Net increase (decrease) in net assets | | | (129,199,496 | ) | | | 43,740,043 | |
| | |
Net assets: | | | | | | | | |
Beginning of year | | | 574,788,668 | | | | 531,048,625 | |
End of year (includes undistributed net investment income of $(224,688) and $(597,497), respectively) | | $ | 445,589,172 | | | $ | 574,788,668 | |
Notes to Financial Statements
December 31, 2014
NOTE 1—Significant Accounting Policies
Invesco International Small Company Fund (the “Fund”) is a series portfolio of AIM Funds Group (Invesco Funds Group) (the “Trust”). The Trust is a Delaware statutory trust registered under the Investment Company Act of 1940, as amended (the “1940 Act”), as an open-end series management investment company consisting of four separate portfolios, each authorized to issue an unlimited number of shares of beneficial interest. The assets, liabilities and operations of each portfolio are accounted for separately. Information presented in these financial statements pertains only to the Fund. Matters affecting each portfolio or class will be voted on exclusively by the shareholders of such portfolio or class.
The Fund’s investment objective is long-term growth of capital.
The Fund currently consists of six different classes of shares: Class A, Class B, Class C, Class Y, Class R5 and Class R6. Class A shares are sold with a front-end sales charge unless certain waiver criteria are met and under certain circumstances load waived shares may be subject to contingent deferred sales charges (“CDSC”). Class C shares are sold with a CDSC. Class Y, Class R5 and Class R6 shares are sold at net asset value. Effective November 30, 2010, new or additional investments in Class B shares are no longer permitted. Existing shareholders of Class B shares may continue to reinvest dividends and capital gains distributions in Class B shares until they convert to Class A shares. Also, shareholders in Class B shares will be able to exchange those shares for Class B shares of other Invesco Funds offering such shares until they convert to Class A shares. Generally,
13 Invesco International Small Company Fund
Class B shares will automatically convert to Class A shares on or about the month-end, which is at least eight years after the date of purchase. Redemption of Class B shares prior to the conversion date will be subject to a CDSC.
As of the close of business on January 29, 2010, the Fund limited public sales of its shares to new investors.
The following is a summary of the significant accounting policies followed by the Fund in the preparation of its financial statements.
| A. | Security Valuations — Securities, including restricted securities, are valued according to the following policy. |
A security listed or traded on an exchange (except convertible securities) is valued at its last sales price or official closing price as of the close of the customary trading session on the exchange where the security is principally traded, or lacking any sales or official closing price on a particular day, the security may be valued at the closing bid price on that day. Securities traded in the over-the-counter market are valued based on prices furnished by independent pricing services or market makers. When such securities are valued by an independent pricing service they may be considered fair valued. Futures contracts are valued at the final settlement price set by an exchange on which they are principally traded. Listed options are valued at the mean between the last bid and ask prices from the exchange on which they are principally traded. Options not listed on an exchange are valued by an independent source at the mean between the last bid and ask prices. For purposes of determining net asset value per share, futures and option contracts generally are valued 15 minutes after the close of the customary trading session of the New York Stock Exchange (“NYSE”).
Investments in open-end and closed-end registered investment companies that do not trade on an exchange are valued at the end of day net asset value per share. Investments in open-end and closed-end registered investment companies that trade on an exchange are valued at the last sales price or official closing price as of the close of the customary trading session on the exchange where the security is principally traded.
Debt obligations (including convertible securities) and unlisted equities are fair valued using an evaluated quote provided by an independent pricing service. Evaluated quotes provided by the pricing service may be determined without exclusive reliance on quoted prices, and may reflect appropriate factors such as institution-size trading in similar groups of securities, developments related to specific securities, dividend rate (for unlisted equities), yield (for debt obligations), quality, type of issue, coupon rate (for debt obligations), maturity (for debt obligations), individual trading characteristics and other market data. Debt obligations are subject to interest rate and credit risks. In addition, all debt obligations involve some risk of default with respect to interest and/or principal payments.
Foreign securities’ (including foreign exchange contracts) prices are converted into U.S. dollar amounts using the applicable exchange rates as of the close of the NYSE. If market quotations are available and reliable for foreign exchange-traded equity securities, the securities will be valued at the market quotations. Because trading hours for certain foreign securities end before the close of the NYSE, closing market quotations may become unreliable. If between the time trading ends on a particular security and the close of the customary trading session on the NYSE, events occur that the Adviser determines are significant and make the closing price unreliable, the Fund may fair value the security. If the event is likely to have affected the closing price of the security, the security will be valued at fair value in good faith using procedures approved by the Board of Trustees. Adjustments to closing prices to reflect fair value may also be based on a screening process of an independent pricing service to indicate the degree of certainty, based on historical data, that the closing price in the principal market where a foreign security trades is not the current value as of the close of the NYSE. Foreign securities’ prices meeting the approved degree of certainty that the price is not reflective of current value will be priced at the indication of fair value from the independent pricing service. Multiple factors may be considered by the independent pricing service in determining adjustments to reflect fair value and may include information relating to sector indices, American Depositary Receipts and domestic and foreign index futures. Foreign securities may have additional risks including exchange rate changes, potential for sharply devalued currencies and high inflation, political and economic upheaval, the relative lack of issuer information, relatively low market liquidity and the potential lack of strict financial and accounting controls and standards.
Securities for which market prices are not provided by any of the above methods may be valued based upon quotes furnished by independent sources. The last bid price may be used to value equity securities. The mean between the last bid and ask prices is used to value debt obligations, including corporate loans.
Securities for which market quotations are not readily available or became unreliable are valued at fair value as determined in good faith by or under the supervision of the Trust’s officers following procedures approved by the Board of Trustees. Issuer specific events, market trends, bid/ask quotes of brokers and information providers and other market data may be reviewed in the course of making a good faith determination of a security’s fair value.
The Fund may invest in securities that are subject to interest rate risk, meaning the risk that the prices will generally fall as interest rates rise and, conversely, the prices will generally rise as interest rates fall. Specific securities differ in their sensitivity to changes in interest rates depending on their individual characteristics. Changes in interest rates may result in increased market volatility, which may affect the value and/or liquidity of certain of the Fund’s investments.
Valuations change in response to many factors including the historical and prospective earnings of the issuer, the value of the issuer’s assets, general economic conditions, interest rates, investor perceptions and market liquidity. Because of the inherent uncertainties of valuation, the values reflected in the financial statements may materially differ from the value received upon actual sale of those investments.
| B. | Securities Transactions and Investment Income — Securities transactions are accounted for on a trade date basis. Realized gains or losses on sales are computed on the basis of specific identification of the securities sold. Interest income (net of withholding tax, if any) is recorded on the accrual basis from settlement date. Dividend income (net of withholding tax, if any) is recorded on the ex-dividend date. |
The Fund may periodically participate in litigation related to Fund investments. As such, the Fund may receive proceeds from litigation settlements. Any proceeds received are included in the Statement of Operations as realized gain (loss) for investments no longer held and as unrealized gain (loss) for investments still held.
Brokerage commissions and mark ups are considered transaction costs and are recorded as an increase to the cost basis of securities purchased and/or a reduction of proceeds on a sale of securities. Such transaction costs are included in the determination of net realized and unrealized gain (loss) from investment securities reported in the Statement of Operations and the Statement of Changes in Net Assets and the net realized and unrealized gains (losses) on securities per share in the Financial Highlights. Transaction costs are included in the calculation of the Fund’s net asset value and, accordingly, they reduce the Fund’s total returns. These transaction costs are not considered operating expenses and are not reflected in net investment income reported in the Statement of Operations and Statement of Changes in Net Assets, or the net investment
14 Invesco International Small Company Fund
income per share and ratios of expenses and net investment income reported in the Financial Highlights, nor are they limited by any expense limitation arrangements between the Fund and the investment adviser.
The Fund allocates income and realized and unrealized capital gains and losses to a class based on the relative net assets of each class.
| C. | Country Determination — For the purposes of making investment selection decisions and presentation in the Schedule of Investments, the investment adviser may determine the country in which an issuer is located and/or credit risk exposure based on various factors. These factors include the laws of the country under which the issuer is organized, where the issuer maintains a principal office, the country in which the issuer derives 50% or more of its total revenues and the country that has the primary market for the issuer’s securities, as well as other criteria. Among the other criteria that may be evaluated for making this determination are the country in which the issuer maintains 50% or more of its assets, the type of security, financial guarantees and enhancements, the nature of the collateral and the sponsor organization. Country of issuer and/or credit risk exposure has been determined to be the United States of America, unless otherwise noted. |
| D. | Distributions — Distributions from net investment income and net realized capital gain, if any, are generally declared and paid annually and recorded on the ex-dividend date. The Fund may elect to treat a portion of the proceeds from redemptions as distributions for federal income tax purposes. |
| E. | Federal Income Taxes — The Fund intends to comply with the requirements of Subchapter M of the Internal Revenue Code of 1986, as amended (the “Internal Revenue Code”), necessary to qualify as a regulated investment company and to distribute substantially all of the Fund’s taxable earnings to shareholders. As such, the Fund will not be subject to federal income taxes on otherwise taxable income (including net realized capital gain) that is distributed to shareholders. Therefore, no provision for federal income taxes is recorded in the financial statements. |
The Fund recognizes the tax benefits of uncertain tax positions only when the position is more likely than not to be sustained. Management has analyzed the Fund’s uncertain tax positions and concluded that no liability for unrecognized tax benefits should be recorded related to uncertain tax positions. Management is not aware of any tax positions for which it is reasonably possible that the total amounts of unrecognized tax benefits will change materially in the next 12 months.
The Fund files tax returns in the U.S. Federal jurisdiction and certain other jurisdictions. Generally, the Fund is subject to examinations by such taxing authorities for up to three years after the filing of the return for the tax period.
| F. | Expenses — Fees provided for under the Rule 12b-1 plan of a particular class of the Fund are charged to the operations of such class. Transfer agency fees and expenses and other shareholder recordkeeping fees and expenses attributable to Class R5 and Class R6 are allocated to each share class based on relative net assets. Sub-accounting fees attributable to Class R5 are charged to the operations of the class. Transfer agency fees and expenses and other shareholder recordkeeping fees and expenses relating to all other classes are allocated among those classes based on relative net assets. All other expenses are allocated among the classes based on relative net assets. |
| G. | Accounting Estimates — The preparation of financial statements in conformity with accounting principles generally accepted in the United States of America (“GAAP”) requires management to make estimates and assumptions that affect the reported amounts of assets and liabilities at the date of the financial statements and the reported amounts of revenues and expenses during the reporting period including estimates and assumptions related to taxation. Actual results could differ from those estimates by a significant amount. In addition, the Fund monitors for material events or transactions that may occur or become known after the period-end date and before the date the financial statements are released to print. |
| H. | Indemnifications — Under the Trust’s organizational documents, each Trustee, officer, employee or other agent of the Trust is indemnified against certain liabilities that may arise out of the performance of their duties to the Fund. Additionally, in the normal course of business, the Fund enters into contracts, including the Fund’s servicing agreements, that contain a variety of indemnification clauses. The Fund’s maximum exposure under these arrangements is unknown as this would involve future claims that may be made against the Fund that have not yet occurred. The risk of material loss as a result of such indemnification claims is considered remote. |
| I. | Foreign Currency Translations — Foreign currency is valued at the close of the NYSE based on quotations posted by banks and major currency dealers. Portfolio securities and other assets and liabilities denominated in foreign currencies are translated into U.S. dollar amounts at date of valuation. Purchases and sales of portfolio securities (net of foreign taxes withheld on disposition) and income items denominated in foreign currencies are translated into U.S. dollar amounts on the respective dates of such transactions. The Fund does not separately account for the portion of the results of operations resulting from changes in foreign exchange rates on investments and the fluctuations arising from changes in market prices of securities held. The combined results of changes in foreign exchange rates and the fluctuation of market prices on investments (net of estimated foreign tax withholding) are included with the net realized and unrealized gain or loss from investments in the Statement of Operations. Reported net realized foreign currency gains or losses arise from (1) sales of foreign currencies, (2) currency gains or losses realized between the trade and settlement dates on securities transactions, and (3) the difference between the amounts of dividends, interest, and foreign withholding taxes recorded on the Fund’s books and the U.S. dollar equivalent of the amounts actually received or paid. Net unrealized foreign currency gains and losses arise from changes in the fair values of assets and liabilities, other than investments in securities at fiscal period end, resulting from changes in exchange rates. |
The Fund may invest in foreign securities, which may be subject to foreign taxes on income, gains on investments or currency repatriation, a portion of which may be recoverable. Foreign taxes, if any, are recorded based on the tax regulations and rates that exist in the foreign markets in which the Fund invests and are shown in the Statement of Operations.
| J. | Forward Foreign Currency Contracts — The Fund may engage in foreign currency transactions either on a spot (i.e. for prompt delivery and settlement) basis or through forward foreign currency contracts to manage or minimize currency or exchange rate risk. |
The Fund may also enter into forward foreign currency contracts for the purchase or sale of a security denominated in a foreign currency in order to “lock in” the U.S. dollar price of that security, or the Fund may also enter into forward foreign currency contracts that do not provide for physical settlement of the two currencies, but instead are settled by a single cash payment calculated as the difference between the agreed upon exchange rate and the spot rate at settlement based upon an agreed upon notional amount (non-deliverable forwards). The Fund will set aside liquid assets in an amount equal to daily mark-to-market obligation for forward foreign currency contracts.
A forward foreign currency contract is an obligation between two parties (“Counterparties”) to purchase or sell a specific currency for an agreed-upon price at a future date. The use of forward foreign currency contracts does not eliminate fluctuations in the price of the underlying securities the Fund owns or intends to acquire but establishes a rate of exchange in advance. Fluctuations in the value of these contracts are
15 Invesco International Small Company Fund
measured by the difference in the contract date and reporting date exchange rates and are recorded as unrealized appreciation (depreciation) until the contracts are closed. When the contracts are closed, realized gains (losses) are recorded. Realized and unrealized gains (losses) on the contracts are included in the Statement of Operations. The primary risks associated with forward foreign currency contracts include failure of the Counterparty to meet the terms of the contract and the value of the foreign currency changing unfavorably. These risks may be in excess of the amounts reflected in the Statement of Assets and Liabilities.
NOTE 2—Advisory Fees and Other Fees Paid to Affiliates
The Trust has entered into a master investment advisory agreement with Invesco Advisers, Inc. (the “Adviser” or “Invesco”). Under the terms of the investment advisory agreement, the Fund pays an advisory fee to the Adviser based on the annual rate of the Fund’s average daily net assets as follows:
| | | | | | |
| Average Daily Net Assets | | Rate |
First $250 million | | | 0 | .935% | | |
Next $250 million | | | 0 | .91% | | |
Next $500 million | | | 0 | .885% | | |
Next $1.5 billion | | | 0 | .86% | | |
Next $2.5 billion | | | 0 | .835% | | |
Next $2.5 billion | | | 0 | .81% | | |
Next $2.5 billion | | | 0 | .785% | | |
Over $10 billion | | | 0 | .76% | | |
For the year ended December 31, 2014, the effective advisory fees incurred by the Fund was 0.92%.
Under the terms of a master sub-advisory agreement between the Adviser and each of Invesco Asset Management Deutschland GmbH, Invesco Asset Management Limited, Invesco Asset Management (Japan) Limited, Invesco Australia Limited, Invesco Hong Kong Limited, Invesco Senior Secured Management, Inc. and Invesco Canada Ltd. (collectively, the “Affiliated Sub-Advisers”) the Adviser, not the Fund, may pay 40% of the fees paid to the Adviser to any such Affiliated Sub-Adviser(s) that provide(s) discretionary investment management services to the Fund based on the percentage of assets allocated to such Sub-Adviser(s).
The Adviser has contractually agreed, through at least June 30, 2015, to waive advisory fees and/or reimburse expenses of all shares to the extent necessary to limit total annual fund operating expenses after fee waiver and/or expense reimbursement (excluding certain items discussed below) of Class A, Class B, Class C, Class Y, Class R5 and Class R6 shares to 2.25%, 3.00%, 3.00%, 2.00%, 2.00% and 2.00% of average daily net assets, respectively. In determining the Adviser’s obligation to waive advisory fees and/or reimburse expenses, the following expenses are not taken into account, and could cause the total annual fund operating expenses after fee waiver and/or expense reimbursement to exceed the numbers reflected above: (1) interest; (2) taxes; (3) dividend expense on short sales; (4) extraordinary or non-routine items, including litigation expenses; and (5) expenses that the Fund has incurred but did not actually pay because of an expense offset arrangement. Unless Invesco continues the fee waiver agreement, it will terminate on June 30, 2015. The fee waiver agreement cannot be terminated during its term. The Adviser did not waive fees and/or reimburse expenses during the period under the expense limitation.
Further, the Adviser has contractually agreed, through at least June 30, 2016, to waive the advisory fee payable by the Fund in an amount equal to 100% of the net advisory fees the Adviser receives from the affiliated money market funds on investments by the Fund of uninvested cash in such affiliated money market funds.
For the year ended December 31, 2014, the Adviser waived advisory fees of $74,297.
The Trust has entered into a master administrative services agreement with Invesco pursuant to which the Fund has agreed to pay Invesco for certain administrative costs incurred in providing accounting services to the Fund. For the year ended December 31, 2014, expenses incurred under the agreement are shown in the Statement of Operations as Administrative services fees.
The Trust has entered into a transfer agency and service agreement with Invesco Investment Services, Inc. (“IIS”) pursuant to which the Fund has agreed to pay IIS a fee for providing transfer agency and shareholder services to the Fund and reimburse IIS for certain expenses incurred by IIS in the course of providing such services. IIS may make payments to intermediaries that provide omnibus account services, sub-accounting services and/or networking services. All fees payable by IIS to intermediaries that provide omnibus account services or sub-accounting are charged back to the Fund, subject to certain limitations approved by the Trust’s Board of Trustees. For the year ended December 31, 2014, expenses incurred under the agreement are shown in the Statement of Operations as Transfer agent fees.
The Trust has entered into master distribution agreements with Invesco Distributors, Inc. (“IDI”) to serve as the distributor for the Class A, Class B, Class C, Class Y, Class R5 and Class R6 shares of the Fund. The Trust has adopted plans pursuant to Rule 12b-1 under the 1940 Act with respect to the Fund’s Class A, Class B and Class C shares (collectively, the “Plans”). The Fund, pursuant to the Plans, pays IDI compensation at the annual rate of 0.25% of the Fund’s average daily net assets of Class A shares and 1.00% of the average daily net assets of Class B and Class C shares. Of the Plan payments, up to 0.25% of the average daily net assets of each class of shares may be paid to furnish continuing personal shareholder services to customers who purchase and own shares of such classes. Any amounts not paid as a service fee under the Plans would constitute an asset-based sales charge. Rules of the Financial Industry Regulatory Authority (“FINRA”) impose a cap on the total sales charges, including asset-based sales charges, that may be paid by any class of shares of the Fund. For the year ended December 31, 2014, expenses incurred under the Plans are shown in the Statement of Operations as Distribution fees.
Front-end sales commissions and CDSC (collectively, the “sales charges”) are not recorded as expenses of the Fund. Front-end sales commissions are deducted from proceeds from the sales of Fund shares prior to investment in Class A shares of the Fund. CDSC are deducted from redemption proceeds prior to remittance to the shareholder. During the year ended December 31, 2014, IDI advised the Fund that IDI retained $5,042 in front-end sales commissions from the sale of Class A shares and $3, $5,697 and $365 from Class A, Class B and Class C shares, respectively, for CDSC imposed on redemptions by shareholders.
Certain officers and trustees of the Trust are officers and directors of the Adviser, IIS and/or IDI.
16 Invesco International Small Company Fund
NOTE 3—Additional Valuation Information
GAAP defines fair value as the price that would be received to sell an asset or paid to transfer a liability in an orderly transaction between market participants at the measurement date, under current market conditions. GAAP establishes a hierarchy that prioritizes the inputs to valuation methods, giving the highest priority to readily available unadjusted quoted prices in an active market for identical assets (Level 1) and the lowest priority to significant unobservable inputs (Level 3), generally when market prices are not readily available or are unreliable. Based on the valuation inputs, the securities or other investments are tiered into one of three levels. Changes in valuation methods may result in transfers in or out of an investment’s assigned level:
| | Level 1 — | Prices are determined using quoted prices in an active market for identical assets. |
| | Level 2 — | Prices are determined using other significant observable inputs. Observable inputs are inputs that other market participants may use in pricing a security. These may include quoted prices for similar securities, interest rates, prepayment speeds, credit risk, yield curves, loss severities, default rates, discount rates, volatilities and others. |
| | Level 3 — | Prices are determined using significant unobservable inputs. In situations where quoted prices or observable inputs are unavailable (for example, when there is little or no market activity for an investment at the end of the period), unobservable inputs may be used. Unobservable inputs reflect the Fund’s own assumptions about the factors market participants would use in determining fair value of the securities or instruments and would be based on the best available information. |
The following is a summary of the tiered valuation input levels, as of December 31, 2014. The level assigned to the securities valuations may not be an indication of the risk or liquidity associated with investing in those securities. Because of the inherent uncertainties of valuation, the values reflected in the financial statements may materially differ from the value received upon actual sale of those investments.
During the year ended December 31, 2014, there were transfers from Level 1 to Level 2 of $45,778,966 and from Level 2 to Level 1 of $20,474,936, due to foreign fair value adjustments.
| | | | | | | | | | | | | | | | |
| | | Level 1 | | | Level 2 | | | Level 3 | | | Total | |
Bermuda | | $ | 11,387,116 | | | $ | — | | | $ | — | | | $ | 11,387,116 | |
Brazil | | | 25,515,534 | | | | — | | | | — | | | | 25,515,534 | |
Canada | | | 77,984,096 | | | | — | | | | — | | | | 77,984,096 | |
Egypt | | | 5,887,424 | | | | — | | | | — | | | | 5,887,424 | |
France | | | 12,640,292 | | | | 9,391,174 | | | | — | | | | 22,031,466 | |
Germany | | | 2,585,705 | | | | 22,961,487 | | | | — | | | | 25,547,192 | |
Greece | | | — | | | | 1,773,237 | | | | — | | | | 1,773,237 | |
Hong Kong | | | — | | | | 11,833,531 | | | | — | | | | 11,833,531 | |
Ireland | | | 4,661,305 | | | | 14,064,909 | | | | — | | | | 18,726,214 | |
Italy | | | 14,024,393 | | | | — | | | | — | | | | 14,024,393 | |
Japan | | | — | | | | 24,119,522 | | | | — | | | | 24,119,522 | |
Netherlands | | | — | | | | 3,599,305 | | | | — | | | | 3,599,305 | |
New Zealand | | | 6,751,913 | | | | — | | | | — | | | | 6,751,913 | |
Norway | | | — | | | | 11,159,919 | | | | — | | | | 11,159,919 | |
Philippines | | | — | | | | 17,986,337 | | | | — | | | | 17,986,337 | |
Spain | | | — | | | | 1,523,550 | | | | — | | | | 1,523,550 | |
Switzerland | | | 8,945,813 | | | | 5,407,853 | | | | — | | | | 14,353,666 | |
Thailand | | | — | | | | 12,453,058 | | | | — | | | | 12,453,058 | |
Turkey | | | 3,001,251 | | | | — | | | | — | | | | 3,001,251 | |
United Kingdom | | | 4,195,412 | | | | 77,969,536 | | | | — | | | | 82,164,948 | |
United States | | | 34,776,951 | | | | — | | | | — | | | | 34,776,951 | |
| | | $ | 212,357,205 | | | $ | 214,243,418 | | | $ | — | | | $ | 426,600,623 | |
NOTE 4—Investments in Affiliates
The 1940 Act defines affiliates as those issuances in which a fund holds 5% or more of the outstanding voting securities. The Fund has not owned enough of the outstanding voting securities of the issuer to have control (as defined in the 1940 Act) of that issuer. The following is a summary of the investments in other affiliates for the year ended December 31, 2014.
| | | | | | | | | | | | | | | | | | | | | | | | | | | | |
| | | Value 12/31/13 | | | Purchases
at Cost | | | Proceeds
from Sales | | | Change in
Unrealized
Appreciation | | | Realized
Gain (Loss) | | | Value 12/31/14 | | | Dividend
Income | |
Precia S.A. | | $ | — | | | $ | 4,372,634 | | | $ | — | | | $ | 158,439 | | | $ | — | | | $ | 4,531,073 | | | $ | 29,716 | |
NOTE 5—Expense Offset Arrangement(s)
The expense offset arrangement is comprised of transfer agency credits which result from balances in demand deposit accounts used by the transfer agent for clearing shareholder transactions. For the year ended December 31, 2014, the Fund received credits from this arrangement, which resulted in the reduction of the Fund’s total expenses of $874.
17 Invesco International Small Company Fund
NOTE 6—Trustees’ and Officers’ Fees and Benefits
Trustees’ and Officers’ Fees and Benefits include amounts accrued by the Fund to pay remuneration to certain Trustees and Officers of the Fund. Trustees have the option to defer compensation payable by the Fund, and Trustees’ and Officers’ Fees and Benefits also include amounts accrued by the Fund to fund such deferred compensation amounts. Those Trustees who defer compensation have the option to select various Invesco Funds in which their deferral accounts shall be deemed to be invested. Finally, certain current Trustees were eligible to participate in a retirement plan that provided for benefits to be paid upon retirement to Trustees over a period of time based on the number of years of service. The Fund may have certain former Trustees who also participate in a retirement plan and receive benefits under such plan. Trustees’ and Officers’ Fees and Benefits include amounts accrued by the Fund to fund such retirement benefits. Obligations under the deferred compensation and retirement plans represent unsecured claims against the general assets of the Fund.
NOTE 7—Cash Balances
The Fund is permitted to temporarily carry a negative or overdrawn balance in its account with State Street Bank and Trust Company, the custodian bank. Such balances, if any at period end, are shown in the Statement of Assets and Liabilities under the payable caption Amount due custodian. To compensate the custodian bank for such overdrafts, the overdrawn Fund may either (1) leave funds as a compensating balance in the account so the custodian bank can be compensated by earning the additional interest; or (2) compensate by paying the custodian bank at a rate agreed upon by the custodian bank and Invesco, not to exceed the contractually agreed upon rate.
NOTE 8—Distributions to Shareholders and Tax Components of Net Assets
Tax Character of Distributions to Shareholders Paid During the Fiscal Years Ended December 31, 2014 and 2013:
| | | | | | | | |
| | | 2014 | | | 2013 | |
Ordinary income | | $ | 11,707,526 | | | $ | 8,117,963 | |
Long-term capital gain | | | 30,042,146 | | | | 27,452,053 | |
Total distributions | | $ | 41,749,672 | | | $ | 35,570,016 | |
Tax Components of Net Assets at Period-End:
| | | | |
| | | 2014 | |
Undistributed ordinary income | | $ | 476,414 | |
Undistributed long-term gain | | | 16,726,818 | |
Net unrealized appreciation — investments | | | 62,129,950 | |
Net unrealized appreciation (depreciation) — other investments | | | (688,012 | ) |
Temporary book/tax differences | | | (135,789 | ) |
Shares of beneficial interest | | | 367,079,791 | |
Total net assets | | $ | 445,589,172 | |
The difference between book-basis and tax-basis unrealized appreciation (depreciation) is due to differences in the timing of recognition of gains and losses on investments for tax and book purposes. The Fund’s net unrealized appreciation difference is attributable primarily to wash sales and passive foreign investment companies.
The temporary book/tax differences are a result of timing differences between book and tax recognition of income and/or expenses. The Fund’s temporary book/tax differences are the result of the trustee deferral of compensation and retirement plan benefits.
Capital loss carryforward is calculated and reported as of a specific date. Results of transactions and other activity after that date may affect the amount of capital loss carryforward actually available for the Fund to utilize. Capital losses generated in years beginning after December 22, 2010 can be carried forward for an unlimited period, whereas previous losses expire in eight tax years. Capital losses with an expiration period may not be used to offset capital gains until all net capital losses without an expiration date have been utilized. Capital loss carryforwards with no expiration date will retain their character as either short-term or long-term capital losses instead of as short-term capital losses as under prior law. The ability to utilize capital loss carryforwards in the future may be limited under the Internal Revenue Code and related regulations based on the results of future transactions.
The Fund does not have a capital loss carryforward as of December 31, 2014.
NOTE 9—Investment Securities
The aggregate amount of investment securities (other than short-term securities, U.S. Treasury obligations and money market funds, if any) purchased and sold by the Fund during the year ended December 31, 2014 was $95,944,792 and $175,251,679, respectively. Cost of investments on a tax basis includes the adjustments for financial reporting purposes as of the most recently completed federal income tax reporting period-end.
| | | | |
| Unrealized Appreciation (Depreciation) of Investment Securities on a Tax Basis | |
Aggregate unrealized appreciation of investment securities | | $ | 109,959,381 | |
Aggregate unrealized (depreciation) of investment securities | | | (47,829,431 | ) |
Net unrealized appreciation of investment securities | | $ | 62,129,950 | |
Cost of investments for tax purposes is $364,470,673.
18 Invesco International Small Company Fund
NOTE 10—Reclassification of Permanent Differences
Primarily as a result of differing book/tax treatment of foreign currency transactions, on December 31, 2014, undistributed net investment income was decreased by $188,537 and undistributed net realized gain was increased by $188,537. This reclassification had no effect on the net assets of the Fund.
NOTE 11—Share Information
| | | | | | | | | | | | | | | | |
| | | Summary of Share Activity | |
| | | Years ended December 31, | |
| | | 2014(a) | | | 2013 | |
| | | Shares | | | Amount | | | Shares | | | Amount | |
Sold: | | | | | | | | | | | | | | | | |
Class A | | | 1,238,175 | | | $ | 26,516,415 | | | | 2,974,887 | | | $ | 63,332,134 | |
Class B | | | 2,506 | | | | 53,233 | | | | 10,272 | | | | 210,586 | |
Class C | | | 48,001 | | | | 997,971 | | | | 104,480 | | | | 2,143,858 | |
Class Y | | | 3,490,086 | | | | 75,061,635 | | | | 3,035,226 | | | | 65,339,788 | |
Class R5 | | | 713,883 | | | | 15,353,206 | | | | 1,366,216 | | | | 29,014,911 | |
Class R6 | | | 966,227 | | | | 20,122,692 | | | | 873,972 | | | | 18,874,053 | |
| | | | |
Issued as reinvestment of dividends: | | | | | | | | | | | | | | | | |
Class A | | | 896,718 | | | | 16,060,218 | | | | 751,005 | | | | 15,485,727 | |
Class B | | | 14,041 | | | | 241,642 | | | | 14,875 | | | | 295,267 | |
Class C | | | 129,428 | | | | 2,227,461 | | | | 87,815 | | | | 1,743,126 | |
Class Y | | | 518,396 | | | | 9,294,840 | | | | 292,911 | | | | 6,048,614 | |
Class R5 | | | 296,575 | | | | 5,276,064 | | | | 254,438 | | | | 5,218,528 | |
Class R6 | | | 232,219 | | | | 4,131,173 | | | | 117,330 | | | | 2,406,429 | |
| | | | |
Automatic conversion of Class B shares to Class A shares: | | | | | | | | | | | | | | | | |
Class A | | | 57,799 | | | | 1,245,152 | | | | 208,787 | | | | 4,458,501 | |
Class B | | | (60,258 | ) | | | (1,245,152 | ) | | | (217,356 | ) | | | (4,458,501 | ) |
| | | | |
Reacquired: | | | | | | | | | | | | | | | | |
Class A | | | (5,504,576 | ) | | | (118,254,943 | ) | | | (4,758,112 | ) | | | (101,419,883 | ) |
Class B | | | (53,372 | ) | | | (1,091,969 | ) | | | (67,491 | ) | | | (1,373,594 | ) |
Class C | | | (323,368 | ) | | | (6,453,791 | ) | | | (352,414 | ) | | | (7,223,135 | ) |
Class Y | | | (3,101,106 | ) | | | (64,663,782 | ) | | | (1,972,247 | ) | | | (42,418,920 | ) |
Class R5 | | | (1,857,030 | ) | | | (38,544,620 | ) | | | (1,181,701 | ) | | | (25,284,084 | ) |
Class R6 | | | (405,204 | ) | | | (8,243,298 | ) | | | (140,815 | ) | | | (3,016,626 | ) |
Net increase (decrease) in share activity | | | (2,700,860 | ) | | $ | (61,915,853 | ) | | | 1,402,078 | | | $ | 29,376,779 | |
| (a) | There are entities that are record owners of more than 5% of the outstanding shares of the Fund and in the aggregate own 27% of the outstanding shares of the Fund. IDI has an agreement with these entities to sell Fund shares. The Fund, Invesco and/or Invesco affiliates may make payments to these entities, which are considered to be related to the Fund, for providing services to the Fund, Invesco and/or Invesco affiliates including but not limited to services such as securities brokerage, distribution, third party record keeping and account servicing. The Fund has no knowledge as to whether all or any portion of the shares owned of record by these entities are also owned beneficially. |
19 Invesco International Small Company Fund
NOTE 12—Financial Highlights
The following schedule presents financial highlights for a share of the Fund outstanding throughout the periods indicated.
| | | | | | | | | | | | | | | | | | | | | | | | | | | | | | | | | | | | | | | | | | | | | | | | | | | | | | | | |
| | | Net asset
value,
beginning
of period | | | Net
investment
income(a) | | | Net gains
(losses)
on securities
(both
realized and
unrealized) | | | Total from
investment
operations | | | Dividends
from net
investment
income | | | Distributions
from net
realized
gains | | | Total
distributions | | | Net asset
value, end
of period(b) | | | Total
return(c) | | | Net assets,
end of period
(000’s omitted) | | | Ratio of
expenses
to average
net assets
with fee waivers
and/or expenses
absorbed | | | Ratio of
expenses
to average net
assets without
fee waivers
and/or expenses
absorbed | | | Ratio of net
investment
income
to average
net assets | | | Portfolio
turnover(d) | |
Class A | | | | | | | | | | | | | | | | | | | | | | | | | | | | | | | | | | | | | | | | | | | | | | | | | | | | | | | | |
Year ended 12/31/14 | | $ | 21.34 | | | $ | 0.28 | | | $ | (1.40 | ) | | $ | (1.12 | ) | | $ | (0.28 | ) | | $ | (1.54 | ) | | $ | (1.82 | ) | | $ | 18.40 | | | | (5.01 | )% | | $ | 185,380 | | | | 1.45 | %(e) | | | 1.46 | %(e) | | | 1.31 | %(e) | | | 20 | % |
Year ended 12/31/13 | | | 20.81 | | | | 0.29 | | | | 1.64 | | | | 1.93 | | | | (0.31 | ) | | | (1.09 | ) | | | (1.40 | ) | | | 21.34 | | | | 9.50 | | | | 285,785 | | | | 1.45 | | | | 1.47 | | | | 1.37 | | | | 17 | |
Year ended 12/31/12 | | | 17.93 | | | | 0.18 | | | | 2.74 | | | | 2.92 | | | | (0.04 | ) | | | — | | | | (0.04 | ) | | | 20.81 | | | | 16.31 | | | | 295,767 | | | | 1.50 | | | | 1.51 | | | | 0.97 | | | | 15 | |
Year ended 12/31/11 | | | 18.75 | | | | 0.19 | | | | (0.77 | ) | | | (0.58 | ) | | | (0.24 | ) | | | — | | | | (0.24 | ) | | | 17.93 | | | | (3.08 | ) | | | 311,409 | | | | 1.49 | | | | 1.50 | | | | 1.02 | | | | 18 | |
Year ended 12/31/10 | | | 15.05 | | | | 0.16 | | | | 3.69 | | | | 3.85 | | | | (0.15 | ) | | | — | | | | (0.15 | ) | | | 18.75 | | | | 25.60 | | | | 382,960 | | | | 1.57 | | | | 1.58 | | | | 1.01 | | | | 20 | |
Class B | | | | | | | | | | | | | | | | | | | | | | | | | | | | | | | | | | | | | | | | | | | | | | | | | | | | | | | | |
Year ended 12/31/14 | | | 20.54 | | | | 0.12 | | | | (1.35 | ) | | | (1.23 | ) | | | (0.11 | ) | | | (1.54 | ) | | | (1.65 | ) | | | 17.66 | | | | (5.78 | ) | | | 2,828 | | | | 2.20 | (e) | | | 2.21 | (e) | | | 0.56 | (e) | | | 20 | |
Year ended 12/31/13 | | | 20.03 | | | | 0.12 | | | | 1.58 | | | | 1.70 | | | | (0.10 | ) | | | (1.09 | ) | | | (1.19 | ) | | | 20.54 | | | | 8.71 | | | | 5,282 | | | | 2.20 | | | | 2.22 | | | | 0.62 | | | | 17 | |
Year ended 12/31/12 | | | 17.36 | | | | 0.04 | | | | 2.64 | | | | 2.68 | | | | (0.01 | ) | | | — | | | | (0.01 | ) | | | 20.03 | | | | 15.44 | | | | 10,352 | | | | 2.25 | | | | 2.26 | | | | 0.22 | | | | 15 | |
Year ended 12/31/11 | | | 18.14 | | | | 0.05 | | | | (0.74 | ) | | | (0.69 | ) | | | (0.09 | ) | | | — | | | | (0.09 | ) | | | 17.36 | | | | (3.83 | ) | | | 17,296 | | | | 2.24 | | | | 2.25 | | | | 0.27 | | | | 18 | |
Year ended 12/31/10 | | | 14.57 | | | | 0.04 | | | | 3.55 | | | | 3.59 | | | | (0.02 | ) | | | — | | | | (0.02 | ) | | | 18.14 | | | | 24.65 | | | | 25,086 | | | | 2.32 | | | | 2.33 | | | | 0.26 | | | | 20 | |
Class C | | | | | | | | | | | | | | | | | | | | | | | | | | | | | | | | | | | | | | | | | | | | | | | | | | | | | | | | |
Year ended 12/31/14 | | | 20.54 | | | | 0.12 | | | | (1.34 | ) | | | (1.22 | ) | | | (0.11 | ) | | | (1.54 | ) | | | (1.65 | ) | | | 17.67 | | | | (5.73 | ) | | | 26,458 | | | | 2.20 | (e) | | | 2.21 | (e) | | | 0.56 | (e) | | | 20 | |
Year ended 12/31/13 | | | 20.03 | | | | 0.12 | | | | 1.58 | | | | 1.70 | | | | (0.10 | ) | | | (1.09 | ) | | | (1.19 | ) | | | 20.54 | | | | 8.71 | | | | 33,764 | | | | 2.20 | | | | 2.22 | | | | 0.62 | | | | 17 | |
Year ended 12/31/12 | | | 17.37 | | | | 0.04 | | | | 2.63 | | | | 2.67 | | | | (0.01 | ) | | | — | | | | (0.01 | ) | | | 20.03 | | | | 15.38 | | | | 36,136 | | | | 2.25 | | | | 2.26 | | | | 0.22 | | | | 15 | |
Year ended 12/31/11 | | | 18.14 | | | | 0.05 | | | | (0.73 | ) | | | (0.68 | ) | | | (0.09 | ) | | | — | | | | (0.09 | ) | | | 17.37 | | | | (3.77 | ) | | | 38,311 | | | | 2.24 | | | | 2.25 | | | | 0.27 | | | | 18 | |
Year ended 12/31/10 | | | 14.57 | | | | 0.04 | | | | 3.55 | | | | 3.59 | | | | (0.02 | ) | | | — | | | | (0.02 | ) | | | 18.14 | | | | 24.65 | | | | 49,484 | | | | 2.32 | | | | 2.33 | | | | 0.26 | | | | 20 | |
Class Y | | | | | | | | | | | | | | | | | | | | | | | | | | | | | | | | | | | | | | | | | | | | | | | | | | | | | | | | |
Year ended 12/31/14 | | | 21.38 | | | | 0.34 | | | | (1.42 | ) | | | (1.08 | ) | | | (0.34 | ) | | | (1.54 | ) | | | (1.88 | ) | | | 18.42 | | | | (4.79 | ) | | | 121,933 | | | | 1.20 | (e) | | | 1.21 | (e) | | | 1.56 | (e) | | | 20 | |
Year ended 12/31/13 | | | 20.84 | | | | 0.35 | | | | 1.65 | | | | 2.00 | | | | (0.37 | ) | | | (1.09 | ) | | | (1.46 | ) | | | 21.38 | | | | 9.82 | | | | 122,163 | | | | 1.20 | | | | 1.22 | | | | 1.62 | | | | 17 | |
Year ended 12/31/12 | | | 17.97 | | | | 0.23 | | | | 2.73 | | | | 2.96 | | | | (0.09 | ) | | | — | | | | (0.09 | ) | | | 20.84 | | | | 16.51 | | | | 90,843 | | | | 1.25 | | | | 1.26 | | | | 1.22 | | | | 15 | |
Year ended 12/31/11 | | | 18.79 | | | | 0.24 | | | | (0.77 | ) | | | (0.53 | ) | | | (0.29 | ) | | | — | | | | (0.29 | ) | | | 17.97 | | | | (2.79 | ) | | | 52,959 | | | | 1.24 | | | | 1.25 | | | | 1.27 | | | | 18 | |
Year ended 12/31/10 | | | 15.08 | | | | 0.20 | | | | 3.70 | | | | 3.90 | | | | (0.19 | ) | | | — | | | | (0.19 | ) | | | 18.79 | | | | 25.89 | | | | 31,780 | | | | 1.32 | | | | 1.33 | | | | 1.26 | | | | 20 | |
Class R5 | | | | | | | | | | | | | | | | | | | | | | | | | | | | | | | | | | | | | | | | | | | | | | | | | | | | | | | | |
Year ended 12/31/14 | | | 21.23 | | | | 0.35 | | | | (1.41 | ) | | | (1.06 | ) | | | (0.36 | ) | | | (1.54 | ) | | | (1.90 | ) | | | 18.27 | | | | (4.74 | ) | | | 63,044 | | | | 1.13 | (e) | | | 1.14 | (e) | | | 1.63 | (e) | | | 20 | |
Year ended 12/31/13 | | | 20.71 | | | | 0.36 | | | | 1.63 | | | | 1.99 | | | | (0.38 | ) | | | (1.09 | ) | | | (1.47 | ) | | | 21.23 | | | | 9.88 | | | | 91,240 | | | | 1.13 | | | | 1.15 | | | | 1.69 | | | | 17 | |
Year ended 12/31/12 | | | 17.85 | | | | 0.25 | | | | 2.72 | | | | 2.97 | | | | (0.11 | ) | | | — | | | | (0.11 | ) | | | 20.71 | | | | 16.66 | | | | 79,911 | | | | 1.13 | | | | 1.14 | | | | 1.34 | | | | 15 | |
Year ended 12/31/11 | | | 18.67 | | | | 0.26 | | | | (0.76 | ) | | | (0.50 | ) | | | (0.32 | ) | | | — | | | | (0.32 | ) | | | 17.85 | | | | (2.66 | ) | | | 70,976 | | | | 1.11 | | | | 1.12 | | | | 1.40 | | | | 18 | |
Year ended 12/31/10 | | | 14.98 | | | | 0.24 | | | | 3.68 | | | | 3.92 | | | | (0.23 | ) | | | — | | | | (0.23 | ) | | | 18.67 | | | | 26.20 | | | | 61,396 | | | | 1.10 | | | | 1.11 | | | | 1.48 | | | | 20 | |
Class R6 | | | | | | | | | | | | | | | | | | | | | | | | | | | | | | | | | | | | | | | | | | | | | | | | | | | | | | | | |
Year ended 12/31/14 | | | 21.24 | | | | 0.37 | | | | (1.42 | ) | | | (1.05 | ) | | | (0.38 | ) | | | (1.54 | ) | | | (1.92 | ) | | | 18.27 | | | | (4.68 | ) | | | 45,946 | | | | 1.04 | (e) | | | 1.05 | (e) | | | 1.72 | (e) | | | 20 | |
Year ended 12/31/13 | | | 20.72 | | | | 0.38 | | | | 1.63 | | | | 2.01 | | | | (0.40 | ) | | | (1.09 | ) | | | (1.49 | ) | | | 21.24 | | | | 9.97 | | | | 36,554 | | | | 1.04 | | | | 1.06 | | | | 1.78 | | | | 17 | |
Year ended 12/31/12(f) | | | 19.66 | | | | 0.08 | | | | 1.09 | | | | 1.17 | | | | (0.11 | ) | | | — | | | | (0.11 | ) | | | 20.72 | | | | 5.99 | | | | 18,039 | | | | 1.04 | (g) | | | 1.06 | (g) | | | 1.42 | (g) | | | 15 | |
| (a) | Calculated using average shares outstanding. |
| (b) | Includes redemption fees added to shares of beneficial interest which were less than $0.005 per share, for fiscal years prior to December 31, 2012. |
| (c) | Includes adjustments in accordance with accounting principles generally accepted in the United States of America and as such, the net asset value for financial reporting purposes and the returns based upon those net asset values may differ from the net asset value and returns for shareholder transactions. Not annualized for periods less than one year, if applicable. |
| (d) | Portfolio turnover is calculated at the fund level and is not annualized for periods less than one year, if applicable. |
| (e) | Ratios are based on average daily net assets (000’s omitted) of $238,668, $4,008, $31,826, $132,235, $76,866, and $43,974 for Class A, Class B, Class C, Class Y, Class R5 and Class R6 shares, respectively. |
| (f) | Commencement date of September 24, 2012 |
20 Invesco International Small Company Fund
Report of Independent Registered Public Accounting Firm
To the Board of Trustees of AIM Funds Group (Invesco Funds Group)
and Shareholders of Invesco International Small Company Fund:
In our opinion, the accompanying statement of assets and liabilities, including the schedule of investments, and the related statements of operations and of changes in net assets and the financial highlights present fairly, in all material respects, the financial position of Invesco International Small Company Fund (one of the funds constituting AIM Funds Group (Invesco Funds Group), hereafter referred to as the “Fund”) at December 31, 2014, the results of its operations for the year then ended, the changes in its net assets for each of the two years in the period then ended and the financial highlights for each of the five years in the period then ended, in conformity with accounting principles generally accepted in the United States of America. These financial statements and financial highlights (hereafter referred to as “financial statements”) are the responsibility of the Fund’s management. Our responsibility is to express an opinion on these financial statements based on our audits. We conducted our audits of these financial statements in accordance with the standards of the Public Company Accounting Oversight Board (United States). Those standards require that we plan and perform the audit to obtain reasonable assurance about whether the financial statements are free of material misstatement. An audit includes examining, on a test basis, evidence supporting the amounts and disclosures in the financial statements, assessing the accounting principles used and significant estimates made by management, and evaluating the overall financial statement presentation. We believe that our audits, which included confirmation of securities at December 31, 2014 by correspondence with the custodian and brokers, and the application of alternative auditing procedures where confirmations of security purchases have not been received, provide a reasonable basis for our opinion.
PRICEWATERHOUSECOOPERS LLP
Houston, Texas
February 23, 2015
21 Invesco International Small Company Fund
Calculating your ongoing Fund expenses
Example
As a shareholder of the Fund, you incur two types of costs: (1) transaction costs, which may include sales charges (loads) on purchase payments or contingent deferred sales charges on redemptions, if any; and (2) ongoing costs, including management fees, distribution and/or service (12b-1) fees, and other Fund expenses. This example is intended to help you understand your ongoing costs (in dollars) of investing in the Fund and to compare these costs with ongoing costs of investing in other mutual funds. The example is based on an investment of $1,000 invested at the beginning of the period and held for the entire period July 1, 2014 through December 31, 2014.
Actual expenses
The table below provides information about actual account values and actual expenses. You may use the information in this table, together with the amount you invested, to estimate the expenses that you paid over the period. Simply divide your account value by $1,000 (for example, an $8,600 account value divided by $1,000 = 8.6), then multiply the result by the number in the table under the heading entitled “Actual Expenses Paid During Period” to estimate the expenses you paid on your account during this period.
Hypothetical example for comparison purposes
The table below also provides information about hypothetical account values and hypothetical expenses based on the Fund’s actual expense ratio and an assumed rate of return of 5% per year before expenses, which is not the Fund’s actual return.
The hypothetical account values and expenses may not be used to estimate the actual ending account balance or expenses you paid for the period. You may use this information to compare the ongoing costs of investing in the Fund and other funds. To do so, compare this 5% hypothetical example with the 5% hypothetical examples that appear in the shareholder reports of the other funds.
Please note that the expenses shown in the table are meant to highlight your ongoing costs only and do not reflect any transaction costs, such as sales charges (loads) on purchase payments or contingent deferred sales charges on redemptions, if any. Therefore, the hypothetical information is useful in comparing ongoing costs only, and will not help you determine the relative total costs of owning different funds. In addition, if these transaction costs were included, your costs would have been higher.
| | | | | | | | | | | | | | | | | | | | | | | | |
| Class | | Beginning
Account Value
(07/01/14) | | | ACTUAL | | | HYPOTHETICAL (5% annual return before expenses) | | | Annualized
Expense
Ratio | |
| | | Ending
Account Value
(12/31/14)1 | | | Expenses
Paid During
Period2 | | | Ending
Account Value
(12/31/14) | | | Expenses
Paid During
Period2 | | |
| A | | $ | 1,000.00 | | | $ | 882.10 | | | $ | 6.88 | | | $ | 1,017.90 | | | $ | 7.38 | | | | 1.45 | % |
| B | | | 1,000.00 | | | | 878.50 | | | | 10.42 | | | | 1,014.12 | | | | 11.17 | | | | 2.20 | |
| C | | | 1,000.00 | | | | 879.00 | | | | 10.42 | | | | 1,014.12 | | | | 11.17 | | | | 2.20 | |
| Y | | | 1,000.00 | | | | 883.10 | | | | 5.70 | | | | 1,019.16 | | | | 6.11 | | | | 1.20 | |
| R5 | | | 1,000.00 | | | | 883.20 | | | | 5.36 | | | | 1,019.51 | | | | 5.75 | | | | 1.13 | |
| R6 | | | 1,000.00 | | | | 883.70 | | | | 4.94 | | | | 1,019.96 | | | | 5.30 | | | | 1.04 | |
| 1 | The actual ending account value is based on the actual total return of the Fund for the period July 1, 2014 through December 31, 2014, after actual expenses and will differ from the hypothetical ending account value which is based on the Fund’s expense ratio and a hypothetical annual return of 5% before expenses. |
| 2 | Expenses are equal to the Fund’s annualized expense ratio as indicated above multiplied by the average account value over the period, multiplied by 184/365 to reflect the most recent fiscal half year. |
22 Invesco International Small Company Fund
Tax Information
Form 1099-DIV, Form 1042-S and other year–end tax information provide shareholders with actual calendar year amounts that should be included in their tax returns. Shareholders should consult their tax advisors.
The following distribution information is being provided as required by the Internal Revenue Code or to meet a specific state’s requirement.
The Fund designates the following amounts or, if subsequently determined to be different, the maximum amount allowable for its fiscal year ended December 31, 2014:
| | | | |
Federal and State Income Tax | |
Long-Term Capital Gain Distributions | | $ | 30,042,146 | |
Qualified Dividend Income* | | | 87.35 | % |
Corporate Dividends Received Deduction* | | | 0.00 | % |
U.S. Treasury Obligations* | | | 0.00 | % |
Foreign Taxes | | $ | 0.0575 per s | hare |
Foreign Source Income | | $ | 0.7023 per s | hare |
| | * | The above percentages are based on ordinary income dividends paid to shareholders during the Fund’s fiscal year. |
| | | | |
Non-Resident Alien Shareholders | |
Qualified Short-Term Gains | | $ | 4,845,659 | |
23 Invesco International Small Company Fund
Trustees and Officers
The address of each trustee and officer is AIM Funds Group (Invesco Funds Group) (the “Trust”), 11 Greenway Plaza, Suite 1000, Houston, Texas 77046-1173. The trustees serve for the life of the Trust, subject to their earlier death, incapacitation, resignation, retirement or removal as more specifically provided in the Trust’s organizational documents. Each officer serves for a one year term or until their successors are elected and qualified. Column two below includes length of time served with predecessor entities, if any.
| | | | | | | | |
Name, Year of Birth and
Position(s) Held with the Trust | | Trustee and/
or Officer Since | | Principal Occupation(s)
During Past 5 Years | | Number of
Funds in Fund
Complex
Overseen by
Trustee | | Other Directorship(s)
Held by Trustee During
Past 5 Years |
| Interested Persons | | | | | | | | |
| Martin L. Flanagan1 — 1960 Trustee | | 2007 | | Executive Director, Chief Executive Officer and President, Invesco Ltd. (ultimate parent of Invesco and a global investment management firm); Advisor to the Board, Invesco Advisers, Inc. (formerly known as Invesco Institutional (N.A.), Inc.); Trustee, The Invesco Funds; Vice Chair, Investment Company Institute; and Member of Executive Board, SMU Cox School of Business Formerly: Chairman and Chief Executive Officer, Invesco Advisers, Inc. (registered investment adviser); Director, Chairman, Chief Executive Officer and President, IVZ Inc. (holding company), INVESCO Group Services, Inc. (service provider) and Invesco North American Holdings, Inc. (holding company); Director, Chief Executive Officer and President, Invesco Holding Company Limited (parent of Invesco and a global investment management firm); Director, Invesco Ltd.; Chairman, Investment Company Institute and President, Co-Chief Executive Officer, Co-President, Chief Operating Officer and Chief Financial Officer, Franklin Resources, Inc. (global investment management organization). | | 144 | | None |
Philip A. Taylor2 — 1954
Trustee, President and Principal Executive Officer | | 2006 | | Head of North American Retail and Senior Managing Director, Invesco Ltd.; Director, Co-Chairman, Co-President and Co-Chief Executive Officer, Invesco Advisers, Inc. (formerly known as Invesco Institutional (N.A.), Inc.) (registered investment adviser); Director, Chairman, Chief Executive Officer and President, Invesco Management Group, Inc. (formerly known as Invesco Aim Management Group, Inc.) (financial services holding company); Director and President, INVESCO Funds Group, Inc. (registered investment adviser and registered transfer agent); Director and Chairman, Invesco Investment Services, Inc. (formerly known as Invesco Aim Investment Services, Inc.) (registered transfer agent) and IVZ Distributors, Inc. (formerly known as INVESCO Distributors, Inc.) (registered broker dealer); Director, President and Chairman, Invesco Inc. (holding company) and Invesco Canada Holdings Inc. (holding company); Chief Executive Officer, Invesco Corporate Class Inc. (corporate mutual fund company) and Invesco Canada Fund Inc. (corporate mutual fund company); Director, Chairman and Chief Executive Officer, Invesco Canada Ltd. (formerly known as Invesco Trimark Ltd./Invesco Trimark Ltèe) (registered investment adviser and registered transfer agent); Trustee, President and Principal Executive Officer, The Invesco Funds (other than AIM Treasurer’s Series Trust (Invesco Treasurer’s Series Trust) and Short-Term Investments Trust); Trustee and Executive Vice President, The Invesco Funds (AIM Treasurer’s Series Trust (Invesco Treasurer’s Series Trust) and Short-Term Investments Trust only); Director, Invesco Investment Advisers LLC (formerly known as Van Kampen Asset Management); Director, Chief Executive Officer and President, Van Kampen Exchange Corp. Formerly: Director and Chairman, Van Kampen Investor Services Inc.; Director, Chief Executive Officer and President, 1371 Preferred Inc. (holding company) and Van Kampen Investments Inc.; Director and President, AIM GP Canada Inc. (general partner for limited partnerships) and Van Kampen Advisors, Inc.; Director and Chief Executive Officer, Invesco Trimark Dealer Inc. (registered broker dealer); Director, Invesco Distributors, Inc. (formerly known as Invesco Aim Distributors, Inc.) (registered broker dealer); Manager, Invesco PowerShares Capital Management LLC; Director, Chief Executive Officer and President, Invesco Advisers, Inc.; Director, Chairman, Chief Executive Officer and President, Invesco Aim Capital Management, Inc.; President, Invesco Trimark Dealer Inc. and Invesco Trimark Ltd./Invesco Trimark Ltèe; Director and President, AIM Trimark Corporate Class Inc. and AIM Trimark Canada Fund Inc.; Senior Managing Director, Invesco Holding Company Limited; Director and Chairman, Fund Management Company (former registered broker dealer); President and Principal Executive Officer, The Invesco Funds (AIM Treasurer’s Series Trust (Invesco Treasurer’s Series Trust), and Short-Term Investments Trust only); President, AIM Trimark Global Fund Inc. and AIM Trimark Canada Fund Inc. | | 144 | | None |
| Independent Trustees | | | | | | | | |
Bruce L. Crockett — 1944 Trustee and Chair | | 1987 | | Chairman, Crockett Technologies Associates (technology consulting company) Formerly: Director, Captaris (unified messaging provider); Director, President and Chief Executive Officer, COMSAT Corporation; Chairman, Board of Governors of INTELSAT (international communications company); ACE Limited (insurance company); and Investment Company Institute | | 144 | | ALPS (Attorneys Liability Protection Society) (insurance company) |
| 1 | Mr. Flanagan is considered an interested person (within the meaning of Section 2(a)(19) of the 1940 Act) of the Trust because he is an officer of the Adviser to the Trust, and an officer and a director of Invesco Ltd., ultimate parent of the Adviser. |
| 2 | Mr. Taylor is considered an interested person (within the meaning of Section 2(a)(19) of the 1940 Act) of the Trust because he is an officer and a director of the Adviser. |
T-1 Invesco International Small Company Fund
Trustees and Officers—(continued)
| | | | | | | | |
Name, Year of Birth and
Position(s) Held with the Trust | | Trustee and/
or Officer Since | | Principal Occupation(s)
During Past 5 Years | | Number of
Funds in Fund
Complex
Overseen by
Trustee | | Other Directorship(s)
Held by Trustee During
Past 5 Years |
| Independent Trustees—(continued) |
David C. Arch — 1945 Trustee | | 2010 | | Chairman of Blistex Inc., a consumer health care products manufacturer | | 144 | | Board member of the Illinois Manufacturers’ Association; Member of the Board of Visitors, Institute for the Humanities, University of Michigan; Member of the Audit Committee of the Edward-Elmhurst Hospital |
James T. Bunch — 1942 Trustee | | 2003 | | Managing Member, Grumman Hill Group LLC (family office private equity investments) Formerly: Founder, Green Manning & Bunch Ltd. (investment banking firm) (1988-2010); Executive Committee, United States Golf Association; and Director, Policy Studies, Inc. and Van Gilder Insurance Corporation | | 144 | | Chairman, Board of Governors, Western Golf Association; Chairman, Evans Scholars Foundation; and Director, Denver Film Society |
Rodney F. Dammeyer — 1940 Trustee | | 2010 | | Chairman of CAC, LLC, (private company offering capital investment and management advisory services) Formerly: Prior to 2001, Managing Partner at Equity Group Corporate Investments; Prior to 1995, Chief Executive Officer of Itel Corporation (formerly Anixter International); Prior to 1985, experience includes Senior Vice President and Chief Financial Officer of Household International, Inc., Executive Vice President and Chief Financial Officer of Northwest Industries, Inc. and Partner of Arthur Andersen & Co.; From 1987 to 2010, Director/Trustee of investment companies in the Van Kampen Funds complex | | 144 | | Director of Quidel Corporation and Stericycle, Inc. |
Albert R. Dowden — 1941 Trustee | | 2000 | | Director of a number of public and private business corporations, including the Boss Group, Ltd. (private investment and management); Nature’s Sunshine Products, Inc. and Reich & Tang Funds (5 portfolios) (registered investment company) Formerly: Director, Homeowners of America Holding Corporation/Homeowners of America Insurance Company (property casualty company); Director, Continental Energy Services, LLC (oil and gas pipeline service); Director, CompuDyne Corporation (provider of product and services to the public security market) and Director, Annuity and Life Re (Holdings), Ltd. (reinsurance company); Director, President and Chief Executive Officer, Volvo Group North America, Inc.; Senior Vice President, AB Volvo; Director of various public and private corporations; Chairman, DHJ Media, Inc.; Director, Magellan Insurance Company; and Director, The Hertz Corporation, Genmar Corporation (boat manufacturer), National Media Corporation; Advisory Board of Rotary Power International (designer, manufacturer, and seller of rotary power engines); and Chairman, Cortland Trust, Inc. (registered investment company) | | 144 | | Director of: Nature’s Sunshine Products, Inc., Reich & Tang Funds, Homeowners of America Holding Corporation/ Homeowners of America Insurance Company, the Boss Group |
Jack M. Fields — 1952 Trustee | | 1997 | | Chief Executive Officer, Twenty First Century Group, Inc. (government affairs company); Owner and Chief Executive Officer, Dos Angeles Ranch, L.P. (cattle, hunting, corporate entertainment); and Discovery Global Education Fund (non-profit) Formerly: Chief Executive Officer, Texana Timber LP (sustainable forestry company); Director of Cross Timbers Quail Research Ranch (non-profit); and member of the U.S. House of Representatives | | 144 | | Insperity, Inc. (formerly known as Administaff) |
Prema Mathai-Davis — 1950 Trustee | | 1998 | | Retired. Formerly: Chief Executive Officer, YWCA of the U.S.A. | | 144 | | None |
Larry Soll — 1942 Trustee | | 2003 | | Retired. Formerly: Chairman, Chief Executive Officer and President, Synergen Corp. (a biotechnology company) | | 144 | | None |
Hugo F. Sonnenschein — 1940 Trustee | | 2010 | | President Emeritus and Honorary Trustee of the University of Chicago and the Adam Smith Distinguished Service Professor in the Department of Economics at the University of Chicago. Prior to 2000, President of the University of Chicago | | 144 | | Trustee of the University of Rochester and a member of its investment committee; Member of the National Academy of Sciences and the American Philosophical Society; Fellow of the American Academy of Arts and Sciences |
Raymond Stickel, Jr. — 1944 Trustee | | 2005 | | Retired. Formerly: Director, Mainstay VP Series Funds, Inc. (25 portfolios) and Partner, Deloitte & Touche | | 144 | | None |
T-2 Invesco International Small Company Fund
Trustees and Officers—(continued)
| | | | | | | | |
Name, Year of Birth and
Position(s) Held with the Trust | | Trustee and/
or Officer Since | | Principal Occupation(s)
During Past 5 Years | | Number of
Funds in Fund
Complex
Overseen by
Trustee | | Other Directorship(s)
Held by Trustee During
Past 5 Years |
| Independent Trustees—(continued) |
Suzanne H. Woolsey — 1941 Trustee | | 2014 | | Chief Executive Officer of Woolsey Partners LLC | | 144 | | Emeritus Chair of the Board of Trustees of the Institute for Defense Analyses; Trustee of Colorado College; Trustee of California Institute of Technology; Prior to 2014, Director of Fluor Corp.; Prior to 2010, Trustee of the German Marshall Fund of the United States; Prior to 2010 Trustee of the Rocky Mountain Institute |
| Other Officers | | | | | | | | |
Russell C. Burk — 1958
Senior Vice President and Senior Officer | | 2005 | | Senior Vice President and Senior Officer, The Invesco Funds | | N/A | | N/A |
John M. Zerr — 1962
Senior Vice President, Chief Legal Officer and Secretary | | 2006 | | Director, Senior Vice President, Secretary and General Counsel, Invesco Management Group, Inc. (formerly known as Invesco Aim Management Group, Inc.) and Van Kampen Exchange Corp.; Senior Vice President, Invesco Advisers, Inc. (formerly known as Invesco Institutional (N.A.), Inc.) (registered investment adviser); Senior Vice President and Secretary, Invesco Distributors, Inc. (formerly known as Invesco Aim Distributors, Inc.); Director, Vice President and Secretary, Invesco Investment Services, Inc. (formerly known as Invesco Aim Investment Services, Inc.) and IVZ Distributors, Inc. (formerly known as INVESCO Distributors, Inc.); Director and Vice President, INVESCO Funds Group, Inc.; Senior Vice President, Chief Legal Officer and Secretary, The Invesco Funds; Manager, Invesco PowerShares Capital Management LLC; Director, Secretary and General Counsel, Invesco Investment Advisers LLC (formerly known as Van Kampen Asset Management); Secretary and General Counsel, Invesco Capital Markets, Inc. (formerly known as Van Kampen Funds Inc.) and Chief Legal Officer, PowerShares Exchange-Traded Fund Trust, PowerShares Exchange-Traded Fund Trust II, PowerShares India Exchange-Traded Fund Trust , PowerShares Actively Managed Exchange-Traded Fund Trust; and PowerShares Actively Managed Exchange-Traded Commodity Fund Trust Formerly: Director and Vice President, Van Kampen Advisors Inc.; Director, Vice President, Secretary and General Counsel, Van Kampen Investor Services Inc.; Director, Invesco Distributors, Inc. (formerly known as Invesco Aim Distributors, Inc.); Director, Senior Vice President, General Counsel and Secretary, Invesco Aim Advisers, Inc. and Van Kampen Investments Inc.; Director, Vice President and Secretary, Fund Management Company; Director, Senior Vice President, Secretary, General Counsel and Vice President, Invesco Aim Capital Management, Inc.; Chief Operating Officer and General Counsel, Liberty Ridge Capital, Inc. (an investment adviser); Vice President and Secretary, PBHG Funds (an investment company) and PBHG Insurance Series Fund (an investment company); Chief Operating Officer, General Counsel and Secretary, Old Mutual Investment Partners (a broker-dealer); General Counsel and Secretary, Old Mutual Fund Services (an administrator) and Old Mutual Shareholder Services (a shareholder servicing center); Executive Vice President, General Counsel and Secretary, Old Mutual Capital, Inc. (an investment adviser); and Vice President and Secretary, Old Mutual Advisors Funds (an investment company) | | N/A | | N/A |
Sheri Morris — 1964
Vice President, Treasurer and Principal Financial Officer | | 1999 | | Vice President, Treasurer and Principal Financial Officer, The Invesco Funds; Vice President, Invesco Advisers, Inc. (formerly known as Invesco Institutional (N.A.), Inc.) (registered investment adviser); and Vice President, PowerShares Exchange-Traded Fund Trust, PowerShares Exchange-Traded Fund Trust II, PowerShares India Exchange-Traded Fund Trust, PowerShares Actively Managed Exchange-Traded Fund Trust, and PowerShares Actively Managed Exchange-Traded Commodity Fund Trust Formerly: Vice President, Invesco Aim Advisers, Inc., Invesco Aim Capital Management, Inc. and Invesco Aim Private Asset Management, Inc.; Assistant Vice President and Assistant Treasurer, The Invesco Funds and Assistant Vice President, Invesco Advisers, Inc., Invesco Aim Capital Management, Inc. and Invesco Aim Private Asset Management, Inc.; and Treasurer, PowerShares Exchange-Traded Fund Trust, PowerShares Exchange-Traded Fund Trust II, PowerShares India Exchange-Traded Fund Trust and PowerShares Actively Managed Exchange-Traded Fund Trust | | N/A | | N/A |
T-3 Invesco International Small Company Fund
Trustees and Officers—(continued)
| | | | | | | | |
Name, Year of Birth and
Position(s) Held with the Trust | | Trustee and/
or Officer Since | | Principal Occupation(s)
During Past 5 Years | | Number of
Funds in Fund
Complex
Overseen by
Trustee | | Other Directorship(s)
Held by Trustee During
Past 5 Years |
| Other Officers—(continued) | | | | | | | | |
Karen Dunn Kelley — 1960
Vice President | | 1992 | | Senior Managing Director, Investments; Director, Co-President, Co-Chief Executive Officer, and Co-Chairman, Invesco Advisers, Inc. (formerly known as Invesco Institutional (N.A.), Inc.) (registered investment adviser); Chairman, Invesco Senior Secured Management, Inc.; Senior Vice President, Invesco Management Group, Inc. (formerly known as Invesco Aim Management Group, Inc.); Executive Vice President, Invesco Distributors, Inc. (formerly known as Invesco Aim Distributors, Inc.); Director, Invesco Mortgage Capital Inc. and Invesco Management Company Limited; Director and President, INVESCO Asset Management (Bermuda) Ltd., Vice President, The Invesco Funds (other than AIM Treasurer’s Series Trust (Invesco Treasurer’s Series Trust) and Short-Term Investments Trust); and President and Principal Executive Officer, The Invesco Funds (AIM Treasurer’s Series Trust (Invesco Treasurer’s Series Trust) and Short-Term Investments Trust only) Formerly: Director, INVESCO Global Asset Management Limited and INVESCO Management S.A.; Senior Vice President, Van Kampen Investments Inc. and Invesco Advisers, Inc. (formerly known as Invesco Institutional (N.A.), Inc.) (registered investment adviser); Vice President, Invesco Advisers, Inc. (formerly known as Invesco Institutional (N.A.), Inc.); Director of Cash Management and Senior Vice President, Invesco Advisers, Inc. and Invesco Aim Capital Management, Inc.; Director and President, Fund Management Company; Chief Cash Management Officer, Director of Cash Management, Senior Vice President, and Managing Director, Invesco Aim Capital Management, Inc.; Director of Cash Management, Senior Vice President, and Vice President, Invesco Advisers, Inc. and The Invesco Funds (AIM Treasurer’s Series Trust (Invesco Treasurer’s Series Trust), and Short-Term Investments Trust only) | | N/A | | N/A |
Crissie M. Wisdom — 1969
Anti-Money Laundering Compliance Officer | | 2013 | | Anti-Money Laundering Compliance Officer, Invesco Advisers, Inc. (formerly known as Invesco Institutional (N.A.), Inc.) (registered investment adviser), Invesco Capital Markets, Inc. (formerly known as Van Kampen Funds Inc.), Invesco Distributors, Inc., Invesco Investment Services, Inc., Invesco Management Group, Inc., Van Kampen Exchange Corp., The Invesco Funds, and PowerShares Exchange-Traded Fund Trust, PowerShares Exchange-Traded Fund Trust II, PowerShares India Exchange-Traded Fund Trust, PowerShares Actively Managed Exchange-Traded Fund Trust and PowerShares Actively Managed Exchange-Traded Commodity Fund Trust; and Fraud Prevention Manager and Controls and Risk Analysis Manager for Invesco Investment Services, Inc. | | N/A | | N/A |
Todd L. Spillane — 1958
Chief Compliance Officer | | 2006 | | Senior Vice President, Invesco Management Group, Inc. (formerly known as Invesco Aim Management Group, Inc.) and Van Kampen Exchange Corp.; Senior Vice President and Chief Compliance Officer, Invesco Advisers, Inc. (registered investment adviser) (formerly known as Invesco Institutional (N.A.), Inc.); Chief Compliance Officer, The Invesco Funds; Vice President, Invesco Distributors, Inc. (formerly known as Invesco Aim Distributors, Inc.) and Invesco Investment Services, Inc. (formerly known as Invesco Aim Investment Services, Inc.) Formerly: Chief Compliance Officer, Invesco Funds (Chicago); Senior Vice President, Van Kampen Investments Inc.; Senior Vice President and Chief Compliance Officer, Invesco Aim Advisers, Inc. and Invesco Aim Capital Management, Inc.; Chief Compliance Officer, INVESCO Private Capital Investments, Inc. (holding company), Invesco Private Capital, Inc. (registered investment adviser), Invesco Global Asset Management (N.A.), Inc., Invesco Senior Secured Management, Inc. (registered investment adviser), Van Kampen Investor Services Inc., PowerShares Exchange-Traded Fund Trust, PowerShares Exchange-Traded Fund Trust II, PowerShares India Exchange-Traded Fund Trust and PowerShares Actively Managed Exchange-Traded Fund Trust; and Vice President, Invesco Aim Capital Management, Inc. and Fund Management Company | | N/A | | N/A |
The Statement of Additional Information of the Trust includes additional information about the Fund’s Trustees and is available upon request, without charge, by calling 1.800.959.4246. Please refer to the Fund’s prospectus for information on the Fund’s sub-advisers.
| | | | | | |
Office of the Fund 11 Greenway Plaza, Suite 1000 Houston, TX 77046-1173 | | Investment Adviser Invesco Advisers, Inc.
1555 Peachtree Street, N.E.
Atlanta, GA 30309 | | Distributor Invesco Distributors, Inc. 11 Greenway Plaza, Suite 1000 Houston, TX 77046-1173 | | Auditors PricewaterhouseCoopers LLP 1000 Louisiana Street, Suite 5800 Houston, TX 77002-5678 |
| | | |
| | | | | | |
Counsel to the Fund Stradley Ronon Stevens & Young, LLP 2005 Market Street, Suite 2600 Philadelphia, PA 19103-7018 | | Counsel to the Independent Trustees Goodwin Procter LLP 901 New York Avenue, N.W. Washington, D.C. 20001 | | Transfer Agent Invesco Investment Services, Inc. 11 Greenway Plaza, Suite 1000 Houston, TX 77046-1173 | | Custodian State Street Bank and Trust Company 225 Franklin Street Boston, MA 02110-2801 |
T-4 Invesco International Small Company Fund

Invesco mailing information
Send general correspondence to Invesco Investment Services, Inc., P.O. Box 219078, Kansas City, MO 64121-9078.
Important notice regarding delivery of security holder documents
To reduce Fund expenses, only one copy of most shareholder documents may be mailed to shareholders with multiple accounts at the same address (Householding). Mailing of your shareholder documents may be householded indefinitely unless you instruct us otherwise. If you do not want the mailing of these documents to be combined with those for other members of your household, please contact Invesco Investment Services, Inc. at 800 959 4246 or contact your financial institution. We will begin sending you individual copies for each account within 30 days after receiving your request.
Fund holdings and proxy voting information
The Fund provides a complete list of its holdings four times in each fiscal year, at the quarter ends. For the second and fourth quarters, the lists appear in the Fund’s semiannual and annual reports to shareholders. For the first and third quarters, the Fund files the lists with the Securities and Exchange Commission (SEC) on Form N-Q. The most recent list of portfolio holdings is available at invesco.com/completeqtrholdings. Shareholders can also look up the Fund’s
Forms N-Q on the SEC website at sec.gov. Copies of the Fund’s Forms N-Q may be reviewed and copied at the SEC Public Reference Room in Washington, D.C. You can obtain information on the operation of the Public Reference Room, including information about duplicating fee charges, by calling 202 551 8090 or 800 732 0330, or by electronic request at the following email address: publicinfo@sec.gov. The SEC file numbers for the Fund are shown below.
A description of the policies and procedures that the Fund uses to determine how to vote proxies relating to portfolio securities is available without charge, upon request, from our Client Services department at 800 959 4246 or at invesco.com/proxyguidelines. The information is also available on the SEC website, sec.gov.
| | |
Information regarding how the Fund voted proxies related to its portfolio securities during the most recent 12-month period ended June 30 is available at invesco.com/proxysearch. The information is also available on the SEC website, sec.gov. Invesco Advisers, Inc. is an investment adviser; it provides investment advisory services to individual and institutional clients and does not sell securities. Invesco Distributors, Inc. is the US distributor for Invesco Ltd.’s retail mutual funds, exchange-traded funds and institutional money market funds. Both are wholly owned, indirect subsidiaries of Invesco Ltd. | |  |
| |
SEC file numbers: 811-01540 and 002-27334 ISC-AR-1 Invesco Distributors, Inc. | | |
| | | | |
| | |
 | | Annual Report to Shareholders | | December 31, 2014 |
| | |
| Invesco Small Cap Equity Fund Nasdaq: A: SMEAX n B: SMEBX n C: SMECX n R: SMERX n Y: SMEYX n R5: SMEIX n R6: SMEFX |

Letters to Shareholders
| | | | |

Philip Taylor | | | | Dear Shareholders: This annual report includes information about your Fund, including performance data and a complete list of its investments as of the close of the reporting period. Inside, your Fund’s portfolio managers discuss how they managed your Fund and the factors that affected its performance during the reporting period. I hope you find this report of interest. During the reporting period, the US economy showed unmistakable signs of improvement. After contracting in the first quarter of 2014, the economy expanded strongly in the second and third quarters as employment data improved markedly. Given continuing positive economic trends, the US Federal Reserve (the Fed) ended its extraordinary asset purchase program in October – but it pledged in December to be “patient” before raising interest rates. Overseas, the story was much different. Concerns about economic stagnation and the potential for deflation |
depressed European markets, while the Chinese economy was hurt by a slowdown in manufacturing.
Political change in Washington, DC; changes to monetary policy by the Fed and other central banks; the future direction of oil prices; and unexpected geopolitical events are likely to affect markets in the US and overseas in 2015. This may make some investors hesitant to begin to save for their long-term financial goals. That’s why Invesco has always encouraged investors to work with a professional financial adviser who can stress the importance of starting to save and invest early and the importance of adhering to a disciplined investment plan – when times are good and when they’re uncertain. A financial adviser who knows your unique financial situation, investment goals and risk tolerance can be an invaluable partner as you seek to achieve your financial goals. He or she can offer a long-term perspective when markets are volatile and time-tested advice and guidance when your financial situation or investment goals change.
Timely information when and where you want it
Invesco’s efforts to help investors achieve their financial objectives include providing individual investors and financial professionals with timely information about the markets, the economy and investing – whenever and wherever they want it.
Our website, invesco.com/us, offers a wide range of market insights and investment perspectives. On the website, you’ll find detailed information about our funds, including prices, performance, holdings and portfolio manager commentaries. You can access information about your individual Invesco account whenever it’s convenient for you; just complete a simple, secure online registration. Use the “Log In” box on our home page to get started.
Invesco’s mobile apps for iPhone® and iPad® (both available free from the App StoreSM) allow you to obtain the same detailed information, monitor your account and create customizable watch lists. Also, they allow you to access investment insights from our investment leaders, market strategists, economists and retirement experts. You can sign up to be alerted when new commentary is added, and you can watch portfolio manager videos and have instant access to Invesco news and updates wherever you may be.
In addition to the resources accessible on our website and through our mobile app, you can obtain timely updates to help you stay informed about the markets, the economy and investing by connecting with Invesco on Twitter, LinkedIn or Facebook. You can access our blog at blog.invesco.us.com. Our goal is to provide you the information you want, when and where you want it.
Have questions?
For questions about your account, feel free to contact an Invesco client services representative at 800 959 4246. For Invesco-related questions or comments, please email me directly at phil@invesco.com.
All of us at Invesco look forward to serving your investment management needs for many years to come. Thank you for investing with us.
Sincerely,

Philip Taylor
Senior Managing Director, Invesco Ltd.
iPhone and iPad are trademarks of Apple Inc., registered in the US and other countries. App Store is a service mark of Apple Inc. Invesco Distributors, Inc. is not affiliated with Apple Inc.
2 Invesco Small Cap Equity Fund
| | | | |

Bruce Crockett | | | | Dear Fellow Shareholders: Among the many important lessons I’ve learned in more than 40 years in a variety of business endeavors is the value of a trusted advocate. As independent chair of the Invesco Funds Board, I can assure you that the members of the Board are strong advocates for the interests of investors in Invesco’s mutual funds. We work hard to represent your interests through oversight of the quality of the investment management services your funds receive and other matters important to your investment, including but not limited to: n Ensuring that Invesco offers a diverse lineup of mutual funds that your financial adviser can use to strive to meet your financial needs as your investment goals change over time. n Monitoring how the portfolio management teams of the Invesco funds are performing in light of changing economic and market conditions. |
| n | | Assessing each portfolio management team’s investment performance within the context of the investment strategy described in the fund’s prospectus. |
| n | | Monitoring for potential conflicts of interests that may impact the nature of the services that your funds receive. |
We believe one of the most important services we provide our fund shareholders is the annual review of the funds’ advisory and sub-advisory contracts with Invesco Advisers and its affiliates. This review is required by the Investment Company Act of 1940 and focuses on the nature and quality of the services Invesco provides as the adviser to the Invesco funds and the reasonableness of the fees that it charges for those services. Each year, we spend months carefully reviewing information received from Invesco and a variety of independent sources, such as performance and fee data prepared by Lipper Inc., an independent, third-party firm widely recognized as a leader in its field. We also meet with our independent legal counsel and other independent advisers to review and help us assess the information that we have received. Our goal is to assure that you receive quality investment management services for a reasonable fee.
I trust the measures outlined above provide assurance that you have a worthy advocate when it comes to choosing the Invesco Funds.
As always, please contact me at bruce@brucecrockett.com with any questions or concerns you may have. On behalf of the Board, we look forward to continuing to represent your interests and serving your needs.
Sincerely,

Bruce L. Crockett
Independent Chair
Invesco Funds Board of Trustees
3 ��Invesco Small Cap Equity Fund
Management’s Discussion of Fund Performance
Performance summary
For the year ended December 31, 2014, Invesco Small Cap Equity Fund had positive returns at net asset value, but underperformed its style-specific benchmark, the Russell 2000 Index. The Fund outperformed its style-specific benchmark in the energy, materials and information technology (IT) sectors, but underperformed in the health care, financials and industrials sectors.
Your Fund’s long-term performance appears later in this report.
Fund vs. Indexes
Total returns, 12/31/13 to 12/31/14, at net asset value (NAV). Performance shown does not include applicable contingent deferred sales charges (CDSC) or front-end sales charges, which would have reduced performance.
| | | | | |
| Class A Shares | | | | 2.17 | % |
| Class B Shares | | | | 1.39 | |
| Class C Shares | | | | 1.40 | |
| Class R Shares | | | | 1.89 | |
| Class Y Shares | | | | 2.36 | |
| Class R5 Shares | | | | 2.55 | |
| Class R6 Shares | | | | 2.60 | |
| S&P 500 Index‚ (Broad Market Index) | | | | 13.69 | |
| Russell 2000 Index‚ (Style-Specific Index) | | | | 4.89 | |
| Lipper Small-Cap Core Funds Indexn (Peer Group Index) | | | | 4.09 | |
Source(s): ‚FactSet Research Systems Inc.; nLipper Inc.
Market conditions and your Fund
Slow and steady improvement in the US economy and historically low interest rates led the US equity market higher during the year ended December 31, 2014. As the US economy continued along a slow growth path, the US Federal Reserve reduced its asset purchase program throughout 2014, finally ending all purchases in October. In the early months of 2014, the stock market turned volatile, pulling back as investors began to worry that stocks may have risen too far, too fast in 2013. Unusually cold winter weather also impacted consumers, but only briefly. Relatively quickly, corporate earnings bounced back and remained generally strong through the rest of the year. Stocks rallied through the summer
despite political upheaval in Ukraine and signs of economic sluggishness in China.
As investors wrestled with evidence that US growth appeared to be on stronger footing than the rest of the world, in mid-September the price of oil began a sharp decline, along with US equities. Despite the unknown economic impact of significantly lower oil prices for an extended period, the US equity market stabilized and recovered, ending the year in positive territory.
During the reporting period, the Fund navigated this environment well though it trailed its style-specific benchmark. The Fund outperformed its style-specific benchmark in several sectors due to positive stock selection decisions, including the energy, materials and IT sectors. These contributions to the Fund were
offset by underperformance in other areas, especially in the health care, financials and industrials sectors.
The area of greatest challenge for the Fund was the health care sector. Many small-cap biotechnology companies own unproven drugs which have yet to make a profit. Based on drug trials that are impossible to forecast and the market’s ever-changing appetite for riskier stocks, prices for small-cap biotechnology stocks can be significantly impacted in a positive or negative way. The Fund targets higher quality companies, so in order to prudently manage these volatile stocks, we set very high hurdles before investing in biotechnology companies, which often leads to a modest underweight position in these companies relative to the Fund’s style-specific index. During the reporting period, biotechnology stocks generally outperformed, so our underweight position hurt the Fund’s relative performance. The sector’s holdings that underperformed included Medicines Company. In early February, an FDA panel voted not to approve one of the company’s new drugs, and shortly afterwards a patent trial opened the door for an eventual generic competition to its primary drug. We sold our position in the company during the reporting period. Additionally, PharMerica pulled back as litigation with the company’s largest supplier cast uncertainty over its future earnings.
The Fund also modestly underperformed its style-specific benchmark in the financials sector, due mostly to an underweight exposure to real estate investment trusts, which outperformed during the year as the economy continued to recover and interest rates remained favorable throughout the year.
The Fund outperformed its style-specific benchmark by the widest margin in
| | | | | |
| Portfolio Composition | | |
By sector | | | | | |
| |
| Information Technology | | | | 19.3 | % |
| Industrials | | | | 18.6 | |
| Financials | | | | 16.7 | |
| Consumer Discretionary | | | | 15.6 | |
| Health Care | | | | 15.0 | |
| Materials | | | | 5.6 | |
| Energy | | | | 4.3 | |
| Consumer Staples | | | | 1.7 | |
| Utilities | | | | 1.2 | |
| Money Market Funds Plus Other Assets Less Liabilities | | | | 2.0 | |
| | | | | |
| Top 10 Equity Holdings* |
| |
1. Cray, Inc. | | | | 1.6 | % |
2. Graphic Packaging Holding Co. | | | | 1.5 | |
3. Old Dominion Freight Line, Inc. | | | | 1.5 | |
4. Papa John’s International, Inc. | | | | 1.4 | |
5. Jones Lang LaSalle Inc. | | | | 1.4 | |
6. SS&C Technologies Holdings, Inc. | | | | 1.3 | |
7. Integrated Device Technology, Inc. | | | | 1.3 | |
8. Heartland Express, Inc. | | | | 1.3 | |
9. Sonic Corp. | | | | 1.2 | |
10. Impax Laboratories, Inc. | | | | 1.2 | |
| | | | | |
| Top Five Industries* |
| |
| 1. Regional Banks | | | | 6.2 | % |
2. Restaurants | | | | 6.1 | |
3. Application Software | | | | 5.4 | |
4. Trucking | | | | 5.0 | |
5. Semiconductors | | | | 4.0 | |
| | | | | |
| Total Net Assets | | | | $1.4 billion | |
| |
| Total Number of Holdings* | | | | 101 | |
The Fund’s holdings are subject to change, and there is no assurance that the Fund will continue to hold any particular security.
*Excluding money market fund holdings.
4 Invesco Small Cap Equity Fund
the energy sector. In the fall, the impact of unexpected new oil supply and decreased global demand hit oil markets simultaneously. As commodity prices tumbled, energy stocks fell and energy was the worst-performing sector of the style-specific index by a wide margin. Despite modest overweight exposure to this troubled sector, the Fund was able to outperform as the Fund’s energy stocks held up better than those of the style-specific index. Additionally, significant contributors to the Fund included Targa Resources, which was sold during the year after it appreciated on strong earnings and unconfirmed acquisition rumors. Dresser Rand Group also benefited performance and was sold for substantial gains during the year.
Fund positioning did not change significantly during the year, and is based on a disciplined investment process, which keeps the portfolio diversified across industry groups and uses rigorous fundamental research to identify attractive individual stocks.
As we’ve discussed, the stock market experienced positive performance during the reporting period. However, stocks remained volatile and we caution investors against making investment decisions based on short-term performance.
We thank you for your commitment to Invesco Small Cap Equity Fund.
The views and opinions expressed in management’s discussion of Fund performance are those of Invesco Advisers, Inc. These views and opinions are subject to change at any time based on factors such as market and economic conditions. These views and opinions may not be relied upon as investment advice or recommendations, or as an offer for a particular security. The information is not a complete analysis of every aspect of any market, country, industry, security or the Fund. Statements of fact are from sources considered reliable, but Invesco Advisers, Inc. makes no representation or warranty as to their completeness or accuracy. Although historical performance is no guarantee of future results, these insights may help you understand our investment management philosophy.
See important Fund and, if applicable, index disclosures later in this report.
| | |
 | | Juliet Ellis Chartered Financial Analyst, Portfolio Manager and chief investment officer of Invesco’s domestic |
| growth investments team, is lead manager of Invesco Small Cap Equity Fund. She joined Invesco in 2004. Ms. Ellis earned a BA in economics and political science from Indiana University. |
| |
 | | Juan Hartsfield Chartered Financial Analyst, Portfolio Manager, is manager of Invesco Small Cap Equity Fund. He joined |
| Invesco in 2004. Mr. Hartsfield earned a BS in petroleum engineering from The University of Texas at Austin and an MBA from the University of Michigan. |
5 Invesco Small Cap Equity Fund
Your Fund’s Long-Term Performance
Results of a $10,000 Investment – Oldest Share Class(es)
Fund and index data from 12/31/04
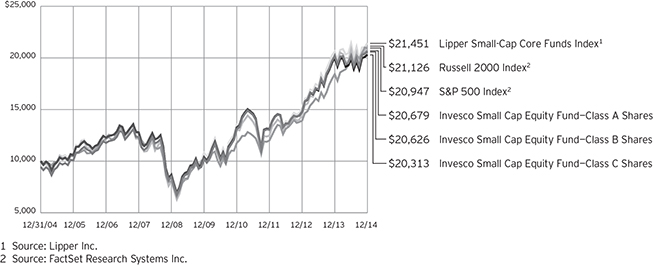
Past performance cannot guarantee comparable future results.
The data shown in the chart include reinvested distributions, applicable sales charges and Fund expenses including management fees. Results for Class B shares are calculated as if a hypothetical shareholder had liquidated his entire investment in the Fund at the close of the reporting period and paid the contingent deferred sales charges, if applicable.
Index results include reinvested dividends, but they do not reflect sales charges. Performance of the peer group, if applicable, reflects fund expenses and management fees; performance of a market index does not. Performance shown in the chart and table(s) does not reflect deduction of taxes a shareholder would pay on Fund distributions or sale of Fund shares.
6 Invesco Small Cap Equity Fund
| | | | | |
| Average Annual Total Returns |
| As of 12/31/14, including maximum applicable sales charges | |
| |
| Class A Shares | | | | | |
| Inception (8/31/00) | | | | 7.24 | % |
| 10 Years | | | | 7.54 | |
| 5 Years | | | | 13.92 | |
| 1 Year | | | | -3.46 | |
| |
| Class B Shares | | | | | |
| Inception (8/31/00) | | | | 7.24 | % |
| 10 Years | | | | 7.51 | |
| 5 Years | | | | 14.10 | |
| 1 Year | | | | -2.94 | |
| |
| Class C Shares | | | | | |
| Inception (8/31/00) | | | | 6.89 | % |
| 10 Years | | | | 7.34 | |
| 5 Years | | | | 14.36 | |
| 1 Year | | | | 0.53 | |
| |
| Class R Shares | | | | | |
| Inception (6/3/02) | | | | 8.03 | % |
| 10 Years | | | | 7.89 | |
| 5 Years | | | | 14.94 | |
| 1 Year | | | | 1.89 | |
| |
| Class Y Shares | | | | | |
| 10 Years | | | | 8.32 | % |
| 5 Years | | | | 15.48 | |
| 1 Year | | | | 2.36 | |
| |
| Class R5 Shares | | | | | |
| 10 Years | | | | 8.70 | % |
| 5 Years | | | | 15.74 | |
| 1 Year | | | | 2.55 | |
| |
| Class R6 Shares | | | | | |
| 10 Years | | | | 8.26 | % |
| 5 Years | | | | 15.45 | |
| 1 Year | | | | 2.60 | |
Class Y shares incepted on October 3, 2008. Performance shown prior to that date is that of Class A shares and includes the 12b-1 fees applicable to Class A shares. Class A share performance reflects any applicable fee waivers or expense reimbursements.
Class R5 shares incepted on April 29, 2005. Performance shown prior to that date is that of Class A shares and includes the 12b-1 fees applicable to Class A shares. Class A share performance reflects any applicable fee waivers or expense reimbursements.
Class R6 shares incepted on September 24, 2012. Performance shown prior to that date is that of Class A shares and includes the 12b-1 fees applicable to Class A shares. Class A share performance reflects any applicable fee waivers or expense reimbursements.
The performance data quoted represent past performance and cannot guarantee comparable future results; current performance may be lower or higher. Please visit invesco.com/performance for the most recent month-end performance. Performance figures reflect reinvested distributions, changes in net asset value and the effect of the maximum sales charge unless otherwise stated. Investment return and principal value will fluctuate so that you may have a gain or loss when you sell shares.
The total annual Fund operating expense ratio set forth in the most recent Fund prospectus as of the date of this report for Class A, Class B, Class C, Class R, Class Y, Class R5 and Class R6 shares was 1.29%, 2.04%, 2.04%, 1.54%, 1.04%, 0.88% and 0.80%, respectively. The expense ratios presented above may vary from the expense ratios presented in other sections of this report that are based on expenses incurred during the period covered by this report.
Class A share performance reflects the maximum 5.50% sales charge, and Class B and Class C share performance reflects the applicable contingent deferred sales charge (CDSC) for the period involved. The CDSC on Class B shares declines from 5% beginning at the time of purchase to 0% at the beginning of the seventh year. The CDSC on Class C shares is 1% for the first year after purchase. Class R, Class Y, Class R5 and Class R6 shares do not have a front-end sales charge or a CDSC; therefore, performance is at net asset value.
The performance of the Fund’s share classes will differ primarily due to different sales charge structures and class expenses.
7 Invesco Small Cap Equity Fund
Invesco Small Cap Equity Fund’s investment objective is long-term growth of capital.
| n | | Unless otherwise stated, information presented in this report is as of December 31, 2014, and is based on total net assets. |
| n | | Unless otherwise noted, all data provided by Invesco. |
| n | | To access your Fund’s reports/prospectus, visit invesco.com/fundreports. |
About share classes
| n | | Class B shares may not be purchased for new or additional investments. Please see the prospectus for more information. |
| n | | Class R shares are generally available only to employer sponsored retirement and benefit plans. Please see the prospectus for more information. |
| n | | Class Y shares are available only to certain investors. Please see the prospectus for more information. |
| n | | Class R5 shares and Class R6 shares are primarily intended for employer sponsored retirement and benefit plans that meet certain standards and for institutional investors. Please see the prospectus for more information. |
Principal risks of investing in the Fund
| n | | Foreign securities risk. The Fund’s foreign investments may be affected by changes in a foreign country’s exchange rates, political and social instability, changes in economic or taxation policies, difficulties when enforcing obligations, decreased liquidity, and increased volatility. Foreign companies may be subject to less regulation resulting in less publicly available information about the companies. |
| n | | Management risk. The investment techniques and risk analysis used by the Fund’s portfolio managers may not produce the desired results. |
| n | | Market risk. The prices of and the income generated by the Fund’s securities may decline in response to, among other things, investor sentiment, general economic and market conditions, regional or global instability, and currency and interest rate fluctuations. |
| n | | Small- and mid-capitalization risks. Stocks of small- and mid-sized companies tend to be more vulnerable to adverse developments and may have little or no operating history or track record of success, and limited product lines, markets, management and financial resources. The securities of small- and mid-sized companies may be more volatile due to less market interest and less publicly available information about the issuer. They also may be illiquid or restricted as to resale, or may trade less frequently and in smaller volumes, all of which may cause difficulty when establishing or closing a position at a desirable price. |
About indexes used in this report
| n | | The S&P 500® Index is an unmanaged index considered representative of the U.S. stock market. |
| n | | The Russell 2000® Index is an unmanaged index considered representative of small-cap stocks. The Russell 2000 Index is a trademark/service mark of the Frank Russell Co. Russell® is a trademark of the Frank Russell Co. |
| n | | The Lipper Small-Cap Core Funds Index is an unmanaged index considered representative of small-cap core funds tracked by Lipper. |
| n | | The Fund is not managed to track the performance of any particular index, including the index(es) described here, and consequently, the performance of the Fund may deviate significantly from the performance of the index(es). |
| n | | A direct investment cannot be made in an index. Unless otherwise indicated, index results include reinvested dividends, and they do not reflect sales charges. Performance of the peer group, if applicable, reflects fund expenses; performance of a market index does not. |
This report must be accompanied or preceded by a currently effective Fund prospectus, which contains more complete information, including sales charges and expenses. Investors should read it carefully before investing.
NOT FDIC INSURED | MAY LOSE VALUE | NO BANK GUARANTEE
Other information
| n | | The returns shown in management’s discussion of Fund performance are based on net asset values (NAVs) calculated for shareholder transactions. Generally accepted accounting principles require adjustments to be made to the net assets of the Fund at period end for financial reporting purposes, and as such, the NAVs for shareholder transactions and the returns based on those NAVs may differ from the NAVs and returns reported in the Financial Highlights. |
| n | | Industry classifications used in this report are generally according to the Global Industry Classification Standard, which was developed by and is the exclusive property and a service mark of MSCI Inc. and Standard & Poor’s. |
8 Invesco Small Cap Equity Fund
Schedule of Investments(a)
December 31, 2014
| | | | | | | | |
| | | Shares | | | Value | |
Common Stocks & Other Equity Interests–98.01% | |
Apparel Retail–0.89% | |
ANN Inc.(b) | | | 334,673 | | | $ | 12,208,871 | |
|
| Apparel, Accessories & Luxury Goods–1.22% | |
Columbia Sportswear Co. | | | 376,823 | | | | 16,783,696 | |
|
| Application Software–5.41% | |
Bottomline Technologies (de), Inc.(b) | | | 396,613 | | | | 10,026,377 | |
Cadence Design Systems, Inc.(b) | | | 827,481 | | | | 15,697,314 | |
MicroStrategy Inc.–Class A(b) | | | 101,269 | | | | 16,446,086 | |
SS&C Technologies Holdings, Inc. | | | 307,930 | | | | 18,010,826 | |
Verint Systems Inc.(b) | | | 240,243 | | | | 14,001,362 | |
| | | | | | | | 74,181,965 | |
|
| Asset Management & Custody Banks–1.19% | |
Janus Capital Group Inc. | | | 1,015,164 | | | | 16,374,595 | |
|
| Automobile Manufacturers–1.02% | |
Thor Industries, Inc. | | | 249,946 | | | | 13,964,483 | |
|
| Automotive Retail–1.16% | |
Penske Automotive Group, Inc. | | | 324,590 | | | | 15,927,631 | |
|
| Biotechnology–0.86% | |
AMAG Pharmaceuticals, Inc.(b) | | | 275,530 | | | | 11,743,089 | |
|
| Broadcasting–0.95% | |
Nexstar Broadcasting Group, Inc.–Class A(c) | | | 251,648 | | | | 13,032,850 | |
|
| Building Products–2.19% | |
Apogee Enterprises, Inc. | | | 389,977 | | | | 16,523,325 | |
Trex Co., Inc.(b) | | | 318,724 | | | | 13,571,268 | |
| | | | | | | | 30,094,593 | |
|
| Communications Equipment–1.77% | |
ARRIS Group Inc.(b) | | | 482,088 | | | | 14,554,237 | |
Finisar Corp.(b) | | | 503,383 | | | | 9,770,664 | |
| | | | | | | | 24,324,901 | |
|
| Construction & Engineering–1.90% | |
Dycom Industries, Inc.(b) | | | 426,328 | | | | 14,959,849 | |
Primoris Services Corp. | | | 475,765 | | | | 11,056,779 | |
| | | | | | | | 26,016,628 | |
|
| Construction Materials–0.92% | |
Eagle Materials Inc. | | | 166,015 | | | | 12,622,120 | |
|
| Data Processing & Outsourced Services–1.14% | |
Jack Henry & Associates, Inc. | | | 252,633 | | | | 15,698,615 | |
|
| Diversified REIT’s–0.85% | |
Cousins Properties, Inc. | | | 1,017,500 | | | | 11,619,850 | |
|
| Diversified Support Services–1.06% | |
Mobile Mini, Inc. | | | 359,078 | | | | 14,546,250 | |
| | | | | | | | |
| | | Shares | | | Value | |
| Electrical Components & Equipment–1.17% | |
EnerSys | | | 260,815 | | | $ | 16,097,502 | |
|
| Electronic Components–1.03% | |
Belden Inc. | | | 178,394 | | | | 14,059,231 | |
|
| Electronic Equipment & Instruments–1.54% | |
Coherent, Inc.(b) | | | 183,731 | | | | 11,156,146 | |
FEI Co. | | | 109,501 | | | | 9,893,416 | |
| | | | | 21,049,562 | |
|
| Electronic Manufacturing Services–0.27% | |
Sanmina Corp.(b) | | | 159,022 | | | | 3,741,788 | |
|
| Environmental & Facilities Services–1.84% | |
Team, Inc.(b) | | | 292,573 | | | | 11,837,504 | |
Waste Connections, Inc. | | | 304,680 | | | | 13,402,873 | |
| | | | | 25,240,377 | |
|
| Food Distributors–0.92% | |
United Natural Foods, Inc.(b) | | | 162,285 | | | | 12,548,688 | |
|
| Gas Utilities–1.22% | |
UGI Corp. | | | 439,944 | | | | 16,709,073 | |
|
| Health Care Distributors–0.44% | |
PharMerica Corp.(b) | | | 291,852 | | | | 6,044,255 | |
|
| Health Care Equipment–2.83% | |
Globus Medical, Inc.–Class A(b) | | | 556,875 | | | | 13,236,919 | |
Hill-Rom Holdings, Inc. | | | 306,451 | | | | 13,980,295 | |
Wright Medical Group, Inc.(b) | | | 431,803 | | | | 11,602,546 | |
| | | | | 38,819,760 | |
|
| Health Care Facilities–2.14% | |
Community Health Systems Inc.(b) | | | 233,063 | | | | 12,566,757 | |
LifePoint Hospitals, Inc.(b) | | | 232,790 | | | | 16,739,929 | |
| | | | | 29,306,686 | |
|
| Health Care Services–1.01% | |
Team Health Holdings, Inc.(b) | | | 240,982 | | | | 13,863,694 | |
|
| Health Care Supplies–1.75% | |
Alere, Inc.(b) | | | 388,571 | | | | 14,765,698 | |
Haemonetics Corp.(b) | | | 245,787 | | | | 9,197,350 | |
| | | | | 23,963,048 | |
|
| Health Care Technology–0.97% | |
HMS Holdings Corp.(b) | | | 628,896 | | | | 13,294,861 | |
|
| Home Furnishings–0.94% | |
La-Z-Boy Inc. | | | 478,252 | | | | 12,836,284 | |
|
| Homebuilding–0.88% | |
Beazer Homes USA, Inc.(b) | | | 623,960 | | | | 12,079,866 | |
See accompanying Notes to Financial Statements which are an integral part of the financial statements.
9 Invesco Small Cap Equity Fund
| | | | | | | | |
| | | Shares | | | Value | |
| Homefurnishing Retail–0.53% | |
Pier 1 Imports, Inc. | | | 474,278 | | | $ | 7,303,881 | |
|
| Hotel and Resort REIT’s–1.00% | |
LaSalle Hotel Properties | | | 340,196 | | | | 13,767,732 | |
|
| Industrial Machinery–3.91% | |
Albany International Corp.–Class A | | | 375,417 | | | | 14,262,092 | |
Rexnord Corp.(b) | | | 461,708 | | | | 13,024,783 | |
TriMas Corp.(b) | | | 374,785 | | | | 11,727,023 | |
Watts Water Technologies, Inc.–Class A | | | 229,151 | | | | 14,537,339 | |
| | | | | 53,551,237 | |
|
| Internet Software & Services–0.34% | |
SciQuest, Inc.(b) | | | 319,311 | | | | 4,614,044 | |
|
| Investment Banking & Brokerage–2.15% | |
E*TRADE Financial Corp.(b) | | | 677,666 | | | | 16,436,789 | |
Evercore Partners Inc.–Class A | | | 249,985 | | | | 13,091,714 | |
| | | | | 29,528,503 | |
|
| IT Consulting & Other Services–1.17% | |
CACI International Inc.–Class A (b) | | | 186,695 | | | | 16,089,375 | |
|
| Life & Health Insurance–1.01% | |
StanCorp Financial Group, Inc. | | | 197,257 | | | | 13,780,374 | |
|
| Life Sciences Tools & Services–3.02% | |
Affymetrix, Inc.(b) | | | 655,976 | | | | 6,474,483 | |
Bio-Techne Corp. | | | 147,442 | | | | 13,623,641 | |
Charles River Laboratories International, Inc.(b) | | | 214,204 | | | | 13,631,943 | |
ICON PLC (Ireland)(b) | | | 149,973 | | | | 7,647,123 | |
| | | | | 41,377,190 | |
|
| Multi-Line Insurance–1.01% | |
American Financial Group, Inc. | | | 227,658 | | | | 13,823,394 | |
|
| Office Services & Supplies–0.60% | |
Pitney Bowes Inc. | | | 335,582 | | | | 8,178,133 | |
|
| Oil & Gas Drilling–0.24% | |
Precision Drilling Corp. (Canada)(c) | | | 533,466 | | | | 3,232,804 | |
|
| Oil & Gas Equipment & Services–1.41% | |
Forum Energy Technologies Inc.(b) | | | 399,974 | | | | 8,291,461 | |
Helix Energy Solutions Group Inc.(b) | | | 507,071 | | | | 11,003,441 | |
| | | | | 19,294,902 | |
|
| Oil & Gas Exploration & Production–0.86% | |
Rosetta Resources, Inc.(b) | | | 204,791 | | | | 4,568,887 | |
Ultra Petroleum Corp.(b)(c) | | | 547,651 | | | | 7,207,087 | |
| | | | | 11,775,974 | |
|
| Oil & Gas Storage & Transportation–1.81% | |
Scorpio Tankers Inc. (Monaco) | | | 1,435,090 | | | | 12,470,932 | |
SemGroup Corp.–Class A | | | 179,838 | | | | 12,299,121 | |
| | | | | 24,770,053 | |
| | | | | | | | |
| | | Shares | | | Value | |
| Packaged Foods & Meats–0.81% | |
TreeHouse Foods, Inc.(b) | | | 130,186 | | | $ | 11,134,809 | |
|
| Paper Packaging–1.51% | |
Graphic Packaging Holding Co.(b) | | | 1,520,515 | | | | 20,709,414 | |
|
| Pharmaceuticals–1.98% | |
Endo International PLC(b) | | | 140,769 | | | | 10,152,260 | |
Impax Laboratories, Inc.(b) | | | 535,916 | | | | 16,977,819 | |
| | | | | 27,130,079 | |
|
| Real Estate Services–2.36% | |
Jones Lang LaSalle Inc. | | | 125,751 | | | | 18,853,847 | |
Kennedy-Wilson Holdings Inc. | | | 536,617 | | | | 13,576,410 | |
| | | | | 32,430,257 | |
|
| Regional Banks–6.18% | |
CVB Financial Corp. | | | 853,716 | | | | 13,676,530 | |
East West Bancorp, Inc. | | | 379,395 | | | | 14,686,381 | |
Glacier Bancorp, Inc. | | | 517,355 | | | | 14,366,948 | |
IBERIABANK Corp. | | | 202,355 | | | | 13,122,722 | |
PacWest Bancorp | | | 295,342 | | | | 13,426,247 | |
Western Alliance Bancorp(b) | | | 556,750 | | | | 15,477,650 | |
| | | | | 84,756,478 | |
|
| Restaurants–6.07% | |
Brinker International, Inc. | | | 253,013 | | | | 14,849,333 | |
Cracker Barrel Old Country Store, Inc. | | | 118,192 | | | | 16,636,706 | |
Papa John’s International, Inc. | | | 341,883 | | | | 19,077,071 | |
Red Robin Gourmet Burgers Inc.(b) | | | 203,438 | | | | 15,659,640 | |
Sonic Corp. | | | 625,486 | | | | 17,031,984 | |
| | | | | 83,254,734 | |
|
| Semiconductor Equipment–0.98% | |
Entegris Inc.(b) | | | 1,022,154 | | | | 13,502,654 | |
|
| Semiconductors–3.98% | |
Fairchild Semiconductor
International, Inc.(b) | | | 696,452 | | | | 11,756,110 | |
Integrated Device Technology, Inc.(b) | | | 907,423 | | | | 17,785,491 | |
Intersil Corp.–Class A | | | 930,671 | | | | 13,466,809 | |
Power Integrations, Inc. | | | 224,268 | | | | 11,603,626 | |
| | | | | 54,612,036 | |
|
| Specialized REIT’s–0.94% | |
Geo Group Inc. (The) | | | 320,599 | | | | 12,939,376 | |
| | |
| Specialty Chemicals–2.23% | | | | | | | | |
Minerals Technologies Inc. | | | 240,785 | | | | 16,722,518 | |
PolyOne Corp. | | | 366,697 | | | | 13,901,483 | |
| | | | | 30,624,001 | |
|
| Specialty Stores–1.90% | |
GNC Holdings, Inc.–Class A | | | 240,707 | | | | 11,303,601 | |
Michaels Cos., Inc. (The)(b) | | | 597,232 | | | | 14,769,547 | |
| | | | | 26,073,148 | |
See accompanying Notes to Financial Statements which are an integral part of the financial statements.
10 Invesco Small Cap Equity Fund
| | | | | | | | |
| | | Shares | | | Value | |
| Steel–0.93% | |
Haynes International, Inc. | | | 264,102 | | | $ | 12,808,947 | |
| |
| Technology Distributors–1.01% | | | | | |
Tech Data Corp.(b) | | | 220,056 | | | | 13,914,141 | |
|
| Technology Hardware, Storage & Peripherals–1.64% | |
Cray, Inc.(b) | | | 652,339 | | | | 22,492,649 | |
| | |
| Trucking–4.95% | | | | | | | | |
Celadon Group, Inc. | | | 613,775 | | | | 13,926,555 | |
Heartland Express, Inc. | | | 644,804 | | | | 17,416,156 | |
Landstar System, Inc. | | | 229,157 | | | | 16,620,757 | |
Old Dominion Freight Line, Inc.(b) | | | 255,817 | | | | 19,861,632 | |
| | | | | 67,825,100 | |
Total Common Stocks & Other Equity Interests
(Cost $1,056,211,570) | | | | 1,344,090,231 | |
| | | | | | | | |
| | | Shares | | | Value | |
Money Market Funds–1.70% | | | | | | | | |
Liquid Assets Portfolio–Institutional Class(d) | | | 11,657,395 | | | $ | 11,657,395 | |
Premier Portfolio–Institutional Class(d) | | | 11,657,396 | | | | 11,657,396 | |
Total Money Market Funds
(Cost $23,314,791) | | | | | | | 23,314,791 | |
TOTAL INVESTMENTS (excluding investments purchased with cash collateral from securities on loan)–99.71%
(Cost $1,079,526,361) | | | | 1,367,405,022 | |
| |
Investments Purchased with Cash Collateral from Securities on Loan | | | | | |
Money Market Funds–0.71% | | | | | | | | |
Liquid Assets Portfolio–Institutional Class
(Cost $9,798,675)(d)(e) | | | 9,798,675 | | | | 9,798,675 | |
TOTAL INVESTMENTS–100.42%
(Cost $1,089,325,036) | | | | 1,377,203,697 | |
OTHER ASSETS LESS LIABILITIES–(0.42)% | | | | (5,768,678 | ) |
NET ASSETS–100.00% | | | $ | 1,371,435,019 | |
Investment Abbreviations:
| | |
| REIT | | – Real Estate Investment Trust |
Notes to Schedule of Investments:
| (a) | Industry and/or sector classifications used in this report are generally according to the Global Industry Classification Standard, which was developed by and is the exclusive property and a service mark of MSCI Inc. and Standard & Poor’s. |
| (b) | Non-income producing security. |
| (c) | All or a portion of this security was out on loan at December 31, 2014. |
| (d) | The money market fund and the Fund are affiliated by having the same investment adviser. |
| (e) | The security has been segregated to satisfy the commitment to return the cash collateral received in securities lending transactions upon the borrower’s return of the securities loaned. See Note 1I. The following table presents the Fund’s gross and net amount of assets available for offset by the Fund as of December 31, 2014. |
| | | | | | | | | | | | |
| Counterparty | | Gross
Amount of
Securities on
Loan at Value | | | Cash
Collateral
Received for
Securities
Loaned* | | | Net
Amount | |
Brown Brothers Harriman | | $ | 9,538,872 | | | $ | (9,538,872 | ) | | $ | — | |
| | * | Amount does not include excess collateral received. |
See accompanying Notes to Financial Statements which are an integral part of the financial statements.
11 Invesco Small Cap Equity Fund
Statement of Assets and Liabilities
December 31, 2014
| | | | |
Assets: | |
Investments, at value (Cost $1,056,211,570)* | | $ | 1,344,090,231 | |
Investments in affiliated money market funds, at value and cost | | | 33,113,466 | |
Total investments, at value (Cost $1,089,325,036) | | | 1,377,203,697 | |
Receivable for: | | | | |
Investments sold | | | 12,048,886 | |
Fund shares sold | | | 3,084,840 | |
Dividends | | | 635,624 | |
Investment for trustee deferred compensation and retirement plans | | | 191,059 | |
Other assets | | | 45,379 | |
Total assets | | | 1,393,209,485 | |
|
Liabilities: | |
Payable for: | | | | |
Investments purchased | | | 935,154 | |
Fund shares reacquired | | | 9,908,854 | |
Collateral upon return of securities loaned | | | 9,798,675 | |
Accrued fees to affiliates | | | 861,346 | |
Accrued trustees’ and officers’ fees and benefits | | | 804 | |
Accrued other operating expenses | | | 53,819 | |
Trustee deferred compensation and retirement plans | | | 215,814 | |
Total liabilities | | | 21,774,466 | |
Net assets applicable to shares outstanding | | $ | 1,371,435,019 | |
|
Net assets consist of: | |
Shares of beneficial interest | | $ | 1,056,305,687 | |
Undistributed net investment income (loss) | | | (205,325 | ) |
Undistributed net realized gain | | | 27,455,996 | |
Net unrealized appreciation | | | 287,878,661 | |
| | | $ | 1,371,435,019 | |
| | | | |
Net Assets: | |
Class A | | $ | 561,244,209 | |
Class B | | $ | 8,623,900 | |
Class C | | $ | 64,347,996 | |
Class R | | $ | 99,240,786 | |
Class Y | | $ | 354,120,544 | |
Class R5 | | $ | 168,876,229 | |
Class R6 | | $ | 114,981,355 | |
|
Shares outstanding, $0.01 par value per share,
with an unlimited number of shares authorized: | |
Class A | | | 37,030,653 | |
Class B | | | 667,382 | |
Class C | | | 4,981,654 | |
Class R | | | 6,845,891 | |
Class Y | | | 22,888,482 | |
Class R5 | | | 10,396,757 | |
Class R6 | | | 7,060,797 | |
Class A: | | | | |
Net asset value per share | | $ | 15.16 | |
Maximum offering price per share | | | | |
(Net asset value of $15.16 ¸ 94.50%) | | $ | 16.04 | |
Class B: | | | | |
Net asset value and offering price per share | | $ | 12.92 | |
Class C: | | | | |
Net asset value and offering price per share | | $ | 12.92 | |
Class R: | | | | |
Net asset value and offering price per share | | $ | 14.50 | |
Class Y: | | | | |
Net asset value and offering price per share | | $ | 15.47 | |
Class R5: | | | | |
Net asset value and offering price per share | | $ | 16.24 | |
Class R6: | | | | |
Net asset value and offering price per share | | $ | 16.28 | |
| * | At December 31, 2014, securities with an aggregate value of $9,538,872 were on loan to brokers. |
See accompanying Notes to Financial Statements which are an integral part of the financial statements.
12 Invesco Small Cap Equity Fund
Statement of Operations
For the year ended December 31, 2014
| | | | |
Investment income: | |
Dividends (net of foreign withholding taxes of $31,401) | | $ | 10,619,632 | |
Dividends from affiliated money market funds (includes securities lending income of $203,269) | | | 212,740 | |
Interest | | | 11,456 | |
Total investment income | | | 10,843,828 | |
| |
Expenses: | | | | |
Advisory fees | | | 9,752,384 | |
Administrative services fees | | | 341,811 | |
Custodian fees | | | 36,636 | |
Distribution fees: | | | | |
Class A | | | 1,410,954 | |
Class B | | | 103,386 | |
Class C | | | 664,300 | |
Class R | | | 522,573 | |
Transfer agent fees — A, B, C, R and Y | | | 2,776,539 | |
Transfer agent fees — R5 | | | 182,604 | |
Transfer agent fees — R6 | | | 7,938 | |
Trustees’ and officers’ fees and benefits | | | 44,943 | |
Other | | | 357,061 | |
Total expenses | | | 16,201,129 | |
Less: Fees waived and expense offset arrangement(s) | �� | | (38,691 | ) |
Net expenses | | | 16,162,438 | |
Net investment income (loss) | | | (5,318,610 | ) |
| |
Realized and unrealized gain (loss) from: | | | | |
Net realized gain from investment securities | | | 189,888,858 | |
Change in net unrealized appreciation (depreciation) of investment securities | | | (155,395,571 | ) |
Net realized and unrealized gain | | | 34,493,287 | |
Net increase in net assets resulting from operations | | $ | 29,174,677 | |
See accompanying Notes to Financial Statements which are an integral part of the financial statements.
13 Invesco Small Cap Equity Fund
Statement of Changes in Net Assets
For the years ended December 31, 2014 and 2013
| | | | | | | | |
| | | 2014 | | | 2013 | |
Operations: | | | | | |
Net investment income (loss) | | $ | (5,318,610 | ) | | $ | (3,305,356 | ) |
Net realized gain | | | 189,888,858 | | | | 78,897,743 | |
Change in net unrealized appreciation (depreciation) | | | (155,395,571 | ) | | | 272,619,771 | |
Net increase in net assets resulting from operations | | | 29,174,677 | | | | 348,212,158 | |
| | |
Distributions to shareholders from net realized gains: | | | | | | | | |
Class A | | | (70,077,121 | ) | | | (33,978,435 | ) |
Class B | | | (1,254,714 | ) | | | (851,482 | ) |
Class C | | | (9,171,705 | ) | | | (4,781,730 | ) |
Class R | | | (12,728,773 | ) | | | (6,849,268 | ) |
Class Y | | | (42,837,100 | ) | | | (15,175,198 | ) |
Class R5 | | | (20,382,058 | ) | | | (11,125,015 | ) |
Class R6 | | | (13,188,999 | ) | | | (6,772,222 | ) |
Total distributions from net realized gains | | | (169,640,470 | ) | | | (79,533,350 | ) |
| | |
Share transactions–net: | | | | | | | | |
Class A | | | 33,648,615 | | | | 71,632,219 | |
Class B | | | (2,855,674 | ) | | | (2,923,413 | ) |
Class C | | | 321,713 | | | | 8,782,315 | |
Class R | | | (3,329,410 | ) | | | 10,056,676 | |
Class Y | | | 117,968,798 | | | | 118,928,712 | |
Class R5 | | | (14,817,942 | ) | | | 16,278,974 | |
Class R6 | | | 5,408,965 | | | | 25,488,696 | |
Net increase in net assets resulting from share transactions | | | 136,345,065 | | | | 248,244,179 | |
Net increase (decrease) in net assets | | | (4,120,728 | ) | | | 516,922,987 | |
| | |
Net assets: | | | | | | | | |
Beginning of year | | | 1,375,555,747 | | | | 858,632,760 | |
End of year (includes undistributed net investment income (loss) of $(205,325) and $279,796, respectively) | | $ | 1,371,435,019 | | | $ | 1,375,555,747 | |
Notes to Financial Statements
December 31, 2014
NOTE 1—Significant Accounting Policies
Invesco Small Cap Equity Fund (the “Fund”) is a series portfolio of AIM Funds Group (Invesco Funds Group) (the “Trust”). The Trust is a Delaware statutory trust registered under the Investment Company Act of 1940, as amended (the “1940 Act”), as an open-end series management investment company consisting of four separate portfolios, each authorized to issue an unlimited number of shares of beneficial interest. The assets, liabilities and operations of each portfolio are accounted for separately. Information presented in these financial statements pertains only to the Fund. Matters affecting each portfolio or class will be voted on exclusively by the shareholders of such portfolio or class.
The Fund’s investment objective is long-term growth of capital.
The Fund currently consists of seven different classes of shares: Class A, Class B, Class C, Class R, Class Y, Class R5 and Class R6. Class A shares are sold with a front-end sales charge unless certain waiver criteria are met and under certain circumstances load waived shares may be subject to contingent deferred sales charges (“CDSC”). Class C shares are sold with a CDSC. Class R, Class Y, Class R5 and Class R6 shares are sold at net asset value. Effective November 30, 2010, new or additional investments in Class B shares are no longer permitted. Existing shareholders of Class B shares may continue to reinvest dividends and capital gains distributions in Class B shares until they convert to Class A shares. Also, shareholders in Class B shares will be able to exchange those shares for Class B shares of other Invesco Funds offering such shares until they convert to Class A shares. Generally, Class B shares will automatically convert to Class A shares on or about the month-end, which is at least eight years after the date of purchase. Redemption of Class B shares prior to the conversion date will be subject to a CDSC.
The following is a summary of the significant accounting policies followed by the Fund in the preparation of its financial statements.
A. Security Valuations — Securities, including restricted securities, are valued according to the following policy.
A security listed or traded on an exchange (except convertible securities) is valued at its last sales price or official closing price as of the close of the customary trading session on the exchange where the security is principally traded, or lacking any sales or official closing price on a particular day, the security may be valued at the closing bid price on that day. Securities traded in the over-the-counter market are valued based on prices furnished by independent pricing services or market makers. When such securities are valued by an independent pricing service they
14 Invesco Small Cap Equity Fund
may be considered fair valued. Futures contracts are valued at the final settlement price set by an exchange on which they are principally traded. Listed options are valued at the mean between the last bid and ask prices from the exchange on which they are principally traded. Options not listed on an exchange are valued by an independent source at the mean between the last bid and ask prices. For purposes of determining net asset value per share, futures and option contracts generally are valued 15 minutes after the close of the customary trading session of the New York Stock Exchange (“NYSE”).
Investments in open-end and closed-end registered investment companies that do not trade on an exchange are valued at the end of day net asset value per share. Investments in open-end and closed-end registered investment companies that trade on an exchange are valued at the last sales price or official closing price as of the close of the customary trading session on the exchange where the security is principally traded.
Debt obligations (including convertible securities) and unlisted equities are fair valued using an evaluated quote provided by an independent pricing service. Evaluated quotes provided by the pricing service may be determined without exclusive reliance on quoted prices, and may reflect appropriate factors such as institution-size trading in similar groups of securities, developments related to specific securities, dividend rate (for unlisted equities), yield (for debt obligations), quality, type of issue, coupon rate (for debt obligations), maturity (for debt obligations), individual trading characteristics and other market data. Debt obligations are subject to interest rate and credit risks. In addition, all debt obligations involve some risk of default with respect to interest and/or principal payments.
Foreign securities’ (including foreign exchange contracts) prices are converted into U.S. dollar amounts using the applicable exchange rates as of the close of the NYSE. If market quotations are available and reliable for foreign exchange-traded equity securities, the securities will be valued at the market quotations. Because trading hours for certain foreign securities end before the close of the NYSE, closing market quotations may become unreliable. If between the time trading ends on a particular security and the close of the customary trading session on the NYSE, events occur that the Adviser determines are significant and make the closing price unreliable, the Fund may fair value the security. If the event is likely to have affected the closing price of the security, the security will be valued at fair value in good faith using procedures approved by the Board of Trustees. Adjustments to closing prices to reflect fair value may also be based on a screening process of an independent pricing service to indicate the degree of certainty, based on historical data, that the closing price in the principal market where a foreign security trades is not the current value as of the close of the NYSE. Foreign securities’ prices meeting the approved degree of certainty that the price is not reflective of current value will be priced at the indication of fair value from the independent pricing service. Multiple factors may be considered by the independent pricing service in determining adjustments to reflect fair value and may include information relating to sector indices, American Depositary Receipts and domestic and foreign index futures. Foreign securities may have additional risks including exchange rate changes, potential for sharply devalued currencies and high inflation, political and economic upheaval, the relative lack of issuer information, relatively low market liquidity and the potential lack of strict financial and accounting controls and standards.
Securities for which market prices are not provided by any of the above methods may be valued based upon quotes furnished by independent sources. The last bid price may be used to value equity securities. The mean between the last bid and ask prices is used to value debt obligations, including corporate loans.
Securities for which market quotations are not readily available or became unreliable are valued at fair value as determined in good faith by or under the supervision of the Trust’s officers following procedures approved by the Board of Trustees. Issuer specific events, market trends, bid/ask quotes of brokers and information providers and other market data may be reviewed in the course of making a good faith determination of a security’s fair value.
The Fund may invest in securities that are subject to interest rate risk, meaning the risk that the prices will generally fall as interest rates rise and, conversely, the prices will generally rise as interest rates fall. Specific securities differ in their sensitivity to changes in interest rates depending on their individual characteristics. Changes in interest rates may result in increased market volatility, which may affect the value and/or liquidity of certain of the Fund’s investments.
Valuations change in response to many factors including the historical and prospective earnings of the issuer, the value of the issuer’s assets, general economic conditions, interest rates, investor perceptions and market liquidity. Because of the inherent uncertainties of valuation, the values reflected in the financial statements may materially differ from the value received upon actual sale of those investments.
| B. | Securities Transactions and Investment Income — Securities transactions are accounted for on a trade date basis. Realized gains or losses on sales are computed on the basis of specific identification of the securities sold. Interest income (net of withholding tax, if any) is recorded on the accrual basis from settlement date. Dividend income (net of withholding tax, if any) is recorded on the ex-dividend date. |
The Fund may periodically participate in litigation related to Fund investments. As such, the Fund may receive proceeds from litigation settlements. Any proceeds received are included in the Statement of Operations as realized gain (loss) for investments no longer held and as unrealized gain (loss) for investments still held.
Brokerage commissions and mark ups are considered transaction costs and are recorded as an increase to the cost basis of securities purchased and/or a reduction of proceeds on a sale of securities. Such transaction costs are included in the determination of net realized and unrealized gain (loss) from investment securities reported in the Statement of Operations and the Statement of Changes in Net Assets and the net realized and unrealized gains (losses) on securities per share in the Financial Highlights. Transaction costs are included in the calculation of the Fund’s net asset value and, accordingly, they reduce the Fund’s total returns. These transaction costs are not considered operating expenses and are not reflected in net investment income reported in the Statement of Operations and Statement of Changes in Net Assets, or the net investment income per share and ratios of expenses and net investment income reported in the Financial Highlights, nor are they limited by any expense limitation arrangements between the Fund and the investment adviser.
The Fund allocates income and realized and unrealized capital gains and losses to a class based on the relative net assets of each class.
| C. | Country Determination — For the purposes of making investment selection decisions and presentation in the Schedule of Investments, the investment adviser may determine the country in which an issuer is located and/or credit risk exposure based on various factors. These factors include the laws of the country under which the issuer is organized, where the issuer maintains a principal office, the country in which the issuer derives 50% or more of its total revenues and the country that has the primary market for the issuer’s securities, as well as other criteria. Among the other criteria that may be evaluated for making this determination are the country in which the issuer maintains 50% or more of its assets, the type of security, financial guarantees and enhancements, the nature of the collateral and the sponsor organization. Country of issuer and/or credit risk exposure has been determined to be the United States of America, unless otherwise noted. |
15 Invesco Small Cap Equity Fund
| D. | Distributions — Distributions from net investment income and net realized capital gain, if any, are generally declared and paid annually and recorded on the ex-dividend date. The Fund may elect to treat a portion of the proceeds from redemptions as distributions for federal income tax purposes. |
| E. | Federal Income Taxes — The Fund intends to comply with the requirements of Subchapter M of the Internal Revenue Code of 1986, as amended (the “Internal Revenue Code”), necessary to qualify as a regulated investment company and to distribute substantially all of the Fund’s taxable earnings to shareholders. As such, the Fund will not be subject to federal income taxes on otherwise taxable income (including net realized capital gain) that is distributed to shareholders. Therefore, no provision for federal income taxes is recorded in the financial statements. |
The Fund recognizes the tax benefits of uncertain tax positions only when the position is more likely than not to be sustained. Management has analyzed the Fund’s uncertain tax positions and concluded that no liability for unrecognized tax benefits should be recorded related to uncertain tax positions. Management is not aware of any tax positions for which it is reasonably possible that the total amounts of unrecognized tax benefits will change materially in the next 12 months.
The Fund files tax returns in the U.S. Federal jurisdiction and certain other jurisdictions. Generally, the Fund is subject to examinations by such taxing authorities for up to three years after the filing of the return for the tax period.
| F. | Expenses — Fees provided for under the Rule 12b-1 plan of a particular class of the Fund are charged to the operations of such class. Transfer agency fees and expenses and other shareholder recordkeeping fees and expenses attributable to Class R5 and Class R6 are allocated to each share class based on relative net assets. Sub-accounting fees attributable to Class R5 are charged to the operations of the class. Transfer agency fees and expenses and other shareholder recordkeeping fees and expenses relating to all other classes are allocated among those classes based on relative net assets. All other expenses are allocated among the classes based on relative net assets. |
| G. | Accounting Estimates — The preparation of financial statements in conformity with accounting principles generally accepted in the United States of America (“GAAP”) requires management to make estimates and assumptions that affect the reported amounts of assets and liabilities at the date of the financial statements and the reported amounts of revenues and expenses during the reporting period including estimates and assumptions related to taxation. Actual results could differ from those estimates by a significant amount. In addition, the Fund monitors for material events or transactions that may occur or become known after the period-end date and before the date the financial statements are released to print. |
| H. | Indemnifications — Under the Trust’s organizational documents, each Trustee, officer, employee or other agent of the Trust is indemnified against certain liabilities that may arise out of the performance of their duties to the Fund. Additionally, in the normal course of business, the Fund enters into contracts, including the Fund’s servicing agreements, that contain a variety of indemnification clauses. The Fund’s maximum exposure under these arrangements is unknown as this would involve future claims that may be made against the Fund that have not yet occurred. The risk of material loss as a result of such indemnification claims is considered remote. |
| I. | Securities Lending — The Fund may lend portfolio securities having a market value up to one-third of the Fund’s total assets. Such loans are secured by collateral equal to no less than the market value of the loaned securities determined daily by the securities lending provider. Such collateral will be cash or debt securities issued or guaranteed by the U.S. Government or any of its sponsored agencies. Cash collateral received in connection with these loans is invested in short-term money market instruments or affiliated money market funds and is shown as such on the Schedule of Investments. It is the Fund’s policy to obtain additional collateral from or return excess collateral to the borrower by the end of the next business day, following the valuation date of the securities loaned. Therefore, the value of the collateral held may be temporarily less than the value of the securities on loan. Lending securities entails a risk of loss to the Fund if, and to the extent that, the market value of the securities loaned were to increase and the borrower did not increase the collateral accordingly, and the borrower failed to return the securities. Upon the failure of the borrower to return the securities, collateral may be liquidated and the securities may be purchased on the open market to replace the loaned securities. The Fund could experience delays and costs in gaining access to the collateral. The Fund bears the risk of any deficiency in the amount of the collateral available for return to the borrower due to any loss on the collateral invested. Dividends received on cash collateral investments for securities lending transactions, which are net of compensation to counterparties, is included in Dividends from affiliated money market funds on the Statement of Operations. The aggregate value of securities out on loan is shown as a footnote on the Statement of Assets and Liabilities, if any. |
NOTE 2—Advisory Fees and Other Fees Paid to Affiliates
The Trust has entered into a master investment advisory agreement with Invesco Advisers, Inc. (the “Adviser” or “Invesco”). Under the terms of the investment advisory agreement, the Fund pays an advisory fee to the Adviser based on the annual rate of the Fund’s average daily net assets as follows:
| | | | | | |
| Average Daily Net Assets | | Rate |
First $250 million | | | 0 | .745% | | |
Next $250 million | | | 0 | .73% | | |
Next $500 million | | | 0 | .715% | | |
Next $1.5 billion | | | 0 | .70% | | |
Next $2.5 billion | | | 0 | .685% | | |
Next $2.5 billion | | | 0 | .67% | | |
Next $2.5 billion | | | 0 | .655% | | |
Over $10 billion | | | 0 | .64% | | |
For the year ended December 31, 2014, the effective advisory fees incurred by the Fund was 0.72%.
Under the terms of a master sub-advisory agreement between the Adviser and each of Invesco Asset Management Deutschland GmbH, Invesco Asset Management Limited, Invesco Asset Management (Japan) Limited, Invesco Australia Limited, Invesco Hong Kong Limited, Invesco Senior Secured Management, Inc. and Invesco Canada Ltd. (collectively, the “Affiliated Sub-Advisers”) the Adviser, not the Fund, may pay 40% of the fees paid to the
16 Invesco Small Cap Equity Fund
Adviser to any such Affiliated Sub-Adviser(s) that provide(s) discretionary investment management services to the Fund based on the percentage of assets allocated to such Sub-Adviser(s).
The Adviser has contractually agreed, through at least June 30, 2015, to waive advisory fees and/or reimburse expenses of all shares to the extent necessary to limit total annual fund operating expenses after fee waiver and/or expense reimbursement (excluding certain items discussed below) of Class A, Class B, Class C, Class R, Class Y, Class R5 and Class R6 shares to 2.00%, 2.75%, 2.75%, 2.25%, 1.75%, 1.75% and 1.75%, respectively, of average daily net assets. In determining the Adviser’s obligation to waive advisory fees and/or reimburse expenses, the following expenses are not taken into account, and could cause the total annual fund operating expenses after fee waiver and/or expense reimbursement to exceed the numbers reflected above: (1) interest; (2) taxes; (3) dividend expense on short sales; (4) extraordinary or non-routine items, including litigation expenses; and (5) expenses that the Fund has incurred but did not actually pay because of an expense offset arrangement. Unless Invesco continues the fee waiver agreement, it will terminate on June 30, 2015. The fee waiver agreement cannot be terminated during its term. The Adviser did not waive fees and/or reimburse expenses during the period under this expense limitation.
Further, the Adviser has contractually agreed, through at least June 30, 2016, to waive the advisory fee payable by the Fund in an amount equal to 100% of the net advisory fees the Adviser receives from the affiliated money market funds on investments by the Fund of uninvested cash (excluding investments of cash collateral from securities lending) in such affiliated money market funds.
For the year ended December 31, 2014, the Adviser waived advisory fees of $35,755.
The Trust has entered into a master administrative services agreement with Invesco pursuant to which the Fund has agreed to pay Invesco for certain administrative costs incurred in providing accounting services to the Fund. For the year ended December 31, 2014, expenses incurred under the agreement are shown in the Statement of Operations as Administrative services fees.
The Trust has entered into a transfer agency and service agreement with Invesco Investment Services, Inc. (“IIS”) pursuant to which the Fund has agreed to pay IIS a fee for providing transfer agency and shareholder services to the Fund and reimburse IIS for certain expenses incurred by IIS in the course of providing such services. IIS may make payments to intermediaries that provide omnibus account services, sub-accounting services and/or networking services. All fees payable by IIS to intermediaries that provide omnibus account services or sub-accounting are charged back to the Fund, subject to certain limitations approved by the Trust’s Board of Trustees. For the year ended December 31, 2014, expenses incurred under the agreement are shown in the Statement of Operations as Transfer agent fees.
The Trust has entered into master distribution agreements with Invesco Distributors, Inc. (“IDI”) to serve as the distributor for the Class A, Class B, Class C, Class R, Class Y, Class R5 and Class R6 shares of the Fund. The Trust has adopted plans pursuant to Rule 12b-1 under the 1940 Act with respect to the Fund’s Class A, Class B, Class C and Class R shares (collectively, the “Plans”). The Fund, pursuant to the Plans, pays IDI compensation at the annual rate of 0.25% of the Fund’s average daily net assets of Class A shares, 1.00% of the average daily net assets of Class B and Class C shares and 0.50% of the average daily net assets of Class R shares. Of the Plan payments, up to 0.25% of the average daily net assets of each class of shares may be paid to furnish continuing personal shareholder services to customers who purchase and own shares of such classes. Any amounts not paid as a service fee under the Plans would constitute an asset-based sales charge. Rules of the Financial Industry Regulatory Authority (“FINRA”) impose a cap on the total sales charges, including asset-based sales charges, that may be paid by any class of shares of the Fund. For the year ended December 31, 2014, expenses incurred under the Plans are shown in the Statement of Operations as Distribution fees.
Front-end sales commissions and CDSC (collectively, the “sales charges”) are not recorded as expenses of the Fund. Front-end sales commissions are deducted from proceeds from the sales of Fund shares prior to investment in Class A shares of the Fund. CDSC are deducted from redemption proceeds prior to remittance to the shareholder. During the year ended December 31, 2014, IDI advised the Fund that IDI retained $258,776 in front-end sales commissions from the sale of Class A shares and $2,027, $3,571 and $3,354 from Class A, Class B and Class C shares, respectively, for CDSC imposed on redemptions by shareholders.
Certain officers and trustees of the Trust are officers and directors of the Adviser, IIS and/or IDI.
NOTE 3—Additional Valuation Information
GAAP defines fair value as the price that would be received to sell an asset or paid to transfer a liability in an orderly transaction between market participants at the measurement date, under current market conditions. GAAP establishes a hierarchy that prioritizes the inputs to valuation methods, giving the highest priority to readily available unadjusted quoted prices in an active market for identical assets (Level 1) and the lowest priority to significant unobservable inputs (Level 3), generally when market prices are not readily available or are unreliable. Based on the valuation inputs, the securities or other investments are tiered into one of three levels. Changes in valuation methods may result in transfers in or out of an investment’s assigned level:
| | Level 1 — | Prices are determined using quoted prices in an active market for identical assets. |
| | Level 2 — | Prices are determined using other significant observable inputs. Observable inputs are inputs that other market participants may use in pricing a security. These may include quoted prices for similar securities, interest rates, prepayment speeds, credit risk, yield curves, loss severities, default rates, discount rates, volatilities and others. |
| | Level 3 — | Prices are determined using significant unobservable inputs. In situations where quoted prices or observable inputs are unavailable (for example, when there is little or no market activity for an investment at the end of the period), unobservable inputs may be used. Unobservable inputs reflect the Fund’s own assumptions about the factors market participants would use in determining fair value of the securities or instruments and would be based on the best available information. |
As of December 31, 2014, all of the securities in this Fund were valued based on Level 1 inputs (see the Schedule of Investments for security categories). The level assigned to the securities valuations may not be an indication of the risk or liquidity associated with investing in those securities. Because of the inherent uncertainties of valuation, the values reflected in the financial statements may materially differ from the value received upon actual sale of those investments.
17 Invesco Small Cap Equity Fund
NOTE 4—Security Transactions with Affiliated Funds
The Fund is permitted to purchase or sell securities from or to certain other Invesco Funds under specified conditions outlined in procedures adopted by the Board of Trustees of the Trust. The procedures have been designed to ensure that any purchase or sale of securities by the Fund from or to another fund or portfolio that is or could be considered an affiliate by virtue of having a common investment adviser (or affiliated investment advisers), common Trustees and/or common officers complies with Rule 17a-7 of the 1940 Act. Further, as defined under the procedures, each transaction is effected at the current market price. Pursuant to these procedures, for the year ended December 31, 2014, the Fund engaged in securities purchases of $7,006,034.
NOTE 5—Expense Offset Arrangement(s)
The expense offset arrangement is comprised of transfer agency credits which result from balances in demand deposit accounts used by the transfer agent for clearing shareholder transactions. For the year ended December 31, 2014, the Fund received credits from this arrangement, which resulted in the reduction of the Fund’s total expenses of $2,936.
NOTE 6—Trustees’ and Officers’ Fees and Benefits
Trustees’ and Officers’ Fees and Benefits include amounts accrued by the Fund to pay remuneration to certain Trustees and Officers of the Fund. Trustees have the option to defer compensation payable by the Fund, and Trustees’ and Officers’ Fees and Benefits also include amounts accrued by the Fund to fund such deferred compensation amounts. Those Trustees who defer compensation have the option to select various Invesco Funds in which their deferral accounts shall be deemed to be invested. Finally, certain current Trustees were eligible to participate in a retirement plan that provided for benefits to be paid upon retirement to Trustees over a period of time based on the number of years of service. The Fund may have certain former Trustees who also participate in a retirement plan and receive benefits under such plan. Trustees’ and Officers’ Fees and Benefits include amounts accrued by the Fund to fund such retirement benefits. Obligations under the deferred compensation and retirement plans represent unsecured claims against the general assets of the Fund.
NOTE 7—Cash Balances
The Fund is permitted to temporarily carry a negative or overdrawn balance in its account with State Street Bank and Trust Company, the custodian bank. Such balances, if any at period end, are shown in the Statement of Assets and Liabilities under the payable caption Amount due custodian. To compensate the custodian bank for such overdrafts, the overdrawn Fund may either (1) leave funds as a compensating balance in the account so the custodian bank can be compensated by earning the additional interest; or (2) compensate by paying the custodian bank at a rate agreed upon by the custodian bank and Invesco, not to exceed the contractually agreed upon rate.
NOTE 8—Distributions to Shareholders and Tax Components of Net Assets
Tax Character of Distributions to Shareholders Paid During the Fiscal Years Ended December 31, 2014 and 2013:
| | | | | | | | |
| | | 2014 | | | 2013 | |
Ordinary income | | $ | 1,283,750 | | | $ | 3,097,814 | |
Long-term capital gain | | | 168,356,720 | | | | 76,435,536 | |
Total distributions | | $ | 169,640,470 | | | $ | 79,533,350 | |
Tax Components of Net Assets at Period-End:
| | | | |
| | | 2014 | |
Undistributed long-term gain | | $ | 35,190,524 | |
Net unrealized appreciation — investments | | | 287,498,347 | |
Temporary book/tax differences | | | (205,325 | ) |
Post-October deferrals | | | (7,354,214 | ) |
Shares of beneficial interest | | | 1,056,305,687 | |
Total net assets | | $ | 1,371,435,019 | |
The difference between book-basis and tax-basis unrealized appreciation (depreciation) is due to differences in the timing of recognition of gains and losses on investments for tax and book purposes. The Fund’s net unrealized appreciation difference is attributable primarily to wash sales.
The temporary book/tax differences are a result of timing differences between book and tax recognition of income and/or expenses. The Fund’s temporary book/tax differences are the result of the trustee deferral of compensation and retirement plan benefits.
Capital loss carryforward is calculated and reported as of a specific date. Results of transactions and other activity after that date may affect the amount of capital loss carryforward actually available for the Fund to utilize. Capital losses generated in years beginning after December 22, 2010 can be carried forward for an unlimited period, whereas previous losses expire in eight tax years. Capital losses with an expiration period may not be used to offset capital gains until all net capital losses without an expiration date have been utilized. Capital loss carryforwards with no expiration date will retain their character as either short-term or long-term capital losses instead of as short-term capital losses as under prior law. The ability to utilize capital loss carryforwards in the future may be limited under the Internal Revenue Code and related regulations based on the results of future transactions.
The Fund does not have a capital loss carryforward as of December 31,2014.
18 Invesco Small Cap Equity Fund
NOTE 9—Investment Securities
The aggregate amount of investment securities (other than short-term securities, U.S. Treasury obligations and money market funds, if any) purchased and sold by the Fund during the year ended December 31, 2014 was $606,791,584 and $647,231,755, respectively. Cost of investments on a tax basis includes the adjustments for financial reporting purposes as of the most recently completed federal income tax reporting period-end.
| | | | |
| Unrealized Appreciation (Depreciation) of Investment Securities on a Tax Basis | |
Aggregate unrealized appreciation of investment securities | | $ | 341,373,054 | |
Aggregate unrealized (depreciation) of investment securities | | | (53,874,707 | ) |
Net unrealized appreciation of investment securities | | $ | 287,498,347 | |
Cost of investments for tax purposes is $1,089,705,350.
NOTE 10—Reclassification of Permanent Differences
Primarily as a result of differing book/tax treatment of net operating losses, on December 31, 2014, undistributed net investment income (loss) was increased by $4,833,489, undistributed net realized gain was decreased by $828,921 and shares of beneficial interest was decreased by $4,004,568. This reclassification had no effect on the net assets of the Fund.
NOTE 11—Share Information
| | | | | | | | | | | | | | | | |
| | | Summary of Share Activity | |
| | | Years ended December 31, | |
| | | 2014(a) | | | 2013 | |
| | | Shares | | | Amount | | | Shares | | | Amount | |
Sold: | | | | | | | | | | | | | | | | |
Class A | | | 7,248,232 | | | $ | 119,565,830 | | | | 9,471,807 | | | $ | 146,995,397 | |
Class B | | | 37,136 | | | | 538,103 | | | | 80,690 | | | | 1,115,997 | |
Class C | | | 667,763 | | | | 9,633,692 | | | | 1,251,931 | | | | 17,235,530 | |
Class R | | | 1,409,390 | | | | 22,402,001 | | | | 2,248,483 | | | | 33,312,865 | |
Class Y | | | 8,236,349 | | | | 137,925,903 | | | | 8,599,482 | | | | 135,135,310 | |
Class R5 | | | 2,259,682 | | | | 39,846,828 | | | | 3,979,577 | | | | 63,634,781 | |
Class R6 | | | 823,331 | | | | 14,220,016 | | | | 2,461,390 | | | | 40,217,835 | |
| | | | |
Issued as reinvestment of dividends: | | | | | | | | | | | | | | | | |
Class A | | | 4,542,055 | | | | 66,404,858 | | | | 1,969,317 | | | | 31,981,693 | |
Class B | | | 98,468 | | | | 1,227,899 | | | | 57,782 | | | | 823,971 | |
Class C | | | 699,736 | | | | 8,718,642 | | | | 317,214 | | | | 4,550,558 | |
Class R | | | 910,262 | | | | 12,725,459 | | | | 437,111 | | | | 6,845,170 | |
Class Y | | | 2,612,812 | | | | 38,983,158 | | | | 750,020 | | | | 12,367,836 | |
Class R5 | | | 1,283,984 | | | | 20,107,195 | | | | 642,729 | | | | 11,042,088 | |
Class R6 | | | 840,063 | | | | 13,188,999 | | | | 393,734 | | | | 6,772,222 | |
| | | | |
Automatic conversion of Class B shares to Class A shares: | | | | | | | | | | | | | | | | |
Class A | | | 166,217 | | | | 2,743,502 | | | | 190,002 | | | | 2,943,979 | |
Class B | | | (190,299 | ) | | | (2,743,502 | ) | | | (213,896 | ) | | | (2,943,979 | ) |
| | | | |
Reacquired: | | | | | | | | | | | | | | | | |
Class A | | | (9,440,417 | ) | | | (155,065,575 | ) | | | (7,121,326 | ) | | | (110,288,850 | ) |
Class B | | | (130,400 | ) | | | (1,878,174 | ) | | | (140,708 | ) | | | (1,919,402 | ) |
Class C | | | (1,255,947 | ) | | | (18,030,621 | ) | | | (933,398 | ) | | | (13,003,773 | ) |
Class R | | | (2,429,002 | ) | | | (38,456,870 | ) | | | (2,003,153 | ) | | | (30,101,359 | ) |
Class Y | | | (3,541,971 | ) | | | (58,940,263 | ) | | | (1,784,637 | ) | | | (28,574,434 | ) |
Class R5 | | | (4,300,633 | ) | | | (74,771,965 | ) | | | (3,541,501 | ) | | | (58,397,895 | ) |
Class R6 | | | (1,243,021 | ) | | | (22,000,050 | ) | | | (1,293,464 | ) | | | (21,501,361 | ) |
Net increase in share activity | | | 9,303,790 | | | $ | 136,345,065 | | | | 15,819,186 | | | $ | 248,244,179 | |
| (a) | There are entities that are record owners of more than 5% of the outstanding shares of the Fund and in aggregate own 36% of the outstanding shares of the Fund. IDI has an agreement with these entities to sell Fund shares. The Fund, Invesco and/or Invesco affiliates may make payments to these entities, which are considered to be related to the Fund, for providing services to the Fund, Invesco and/or Invesco affiliates including but not limited to services such as, securities brokerage, distribution, third party record keeping and account servicing. The Fund has no knowledge as to whether all or any portion of the shares owned of record by these entities are also owned beneficially. |
| | In addition, 5% of the outstanding shares of the Fund are owned by affiliated mutual funds. Affiliated mutual funds are other mutual funds that are also advised by Invesco. |
19 Invesco Small Cap Equity Fund
NOTE 12—Financial Highlights
The following schedule presents financial highlights for a share of the Fund outstanding throughout the periods indicated.
| | | | | | | | | | | | | | | | | | | | | | | | | | | | | | | | | | | | | | | | | | | | | | | | |
| | | Net asset
value,
beginning
of period | | | Net
investment
income
(loss)(a) | | | Net gains
on securities
(both
realized and
unrealized) | | | Total from
investment
operations | | | Distributions
from net
realized
gains | | | Net asset
value, end
of period | | | Total
return(b) | | | Net assets,
end of period
(000’s omitted) | | | Ratio of
expenses
to average
net assets
with fee waivers
and/or expenses
absorbed | | | Ratio of
expenses
to average net
assets without
fee waivers
and/or expenses
absorbed | | | Ratio of net
investment
income (loss)
to average
net assets | | | Portfolio
turnover(c) | |
Class A | | | | | | | | | | | | | | | | | | | | | | | | | | | | | | | | | | | | | | | | | | | | | | | | |
Year ended 12/31/14 | | $ | 17.00 | | | $ | (0.08 | ) | | $ | 0.37 | | | $ | 0.29 | | | $ | (2.13 | ) | | $ | 15.16 | | | | 2.17 | % | | $ | 561,244 | | | | 1.29 | %(d) | | | 1.29 | %(d) | | | (0.49 | )%(d) | | | 45 | % |
Year ended 12/31/13 | | | 13.24 | | | | (0.06 | ) | | | 4.87 | | | | 4.81 | | | | (1.05 | ) | | | 17.00 | | | | 36.68 | | | | 586,779 | | | | 1.29 | | | | 1.29 | | | | (0.38 | ) | | | 28 | |
Year ended 12/31/12 | | | 12.19 | | | | (0.03 | )(e) | | | 1.66 | | | | 1.63 | | | | (0.58 | ) | | | 13.24 | | | | 13.50 | | | | 397,305 | | | | 1.34 | | | | 1.34 | | | | (0.21 | )(e) | | | 39 | |
Year ended 12/31/11 | | | 12.24 | | | | (0.07 | ) | | | 0.02 | | | | (0.05 | ) | | | — | | | | 12.19 | | | | (0.41 | ) | | | 369,938 | | | | 1.35 | | | | 1.35 | | | | (0.59 | ) | | | 42 | |
Year ended 12/31/10 | | | 9.52 | | | | (0.04 | ) | | | 2.76 | | | | 2.72 | | | | — | | | | 12.24 | | | | 28.57 | | | | 364,210 | | | | 1.38 | | | | 1.38 | | | | (0.41 | ) | | | 36 | |
Class B | | | | | | | | | | | | | | | | | | | | | | | | | | | | | | | | | | | | | | | | | | | | | | | | |
Year ended 12/31/14 | | | 14.92 | | | | (0.18 | ) | | | 0.31 | | | | 0.13 | | | | (2.13 | ) | | | 12.92 | | | | 1.39 | | | | 8,624 | | | | 2.04 | (d) | | | 2.04 | (d) | | | (1.24 | )(d) | | | 45 | |
Year ended 12/31/13 | | | 11.81 | | | | (0.15 | ) | | | 4.31 | | | | 4.16 | | | | (1.05 | ) | | | 14.92 | | | | 35.61 | | | | 12,723 | | | | 2.04 | | | | 2.04 | | | | (1.13 | ) | | | 28 | |
Year ended 12/31/12 | | | 11.01 | | | | (0.11 | )(e) | | | 1.49 | | | | 1.38 | | | | (0.58 | ) | | | 11.81 | | | | 12.68 | | | | 12,620 | | | | 2.09 | | | | 2.09 | | | | (0.96 | )(e) | | | 39 | |
Year ended 12/31/11 | | | 11.14 | | | | (0.15 | ) | | | 0.02 | | | | (0.13 | ) | | | — | | | | 11.01 | | | | (1.17 | ) | | | 17,635 | | | | 2.10 | | | | 2.10 | | | | (1.34 | ) | | | 42 | |
Year ended 12/31/10 | | | 8.73 | | | | (0.11 | ) | | | 2.52 | | | | 2.41 | | | | — | | | | 11.14 | | | | 27.61 | | | | 31,908 | | | | 2.13 | | | | 2.13 | | | | (1.16 | ) | | | 36 | |
Class C | | | | | | | | | | | | | | | | | | | | | | | | | | | | | | | | | | | | | | | | | | | | | | | | |
Year ended 12/31/14 | | | 14.92 | | | | (0.18 | ) | | | 0.31 | | | | 0.13 | | | | (2.13 | ) | | | 12.92 | | | | 1.40 | | | | 64,348 | | | | 2.04 | (d) | | | 2.04 | (d) | | | (1.24 | )(d) | | | 45 | |
Year ended 12/31/13 | | | 11.81 | | | | (0.15 | ) | | | 4.31 | | | | 4.16 | | | | (1.05 | ) | | | 14.92 | | | | 35.62 | | | | 72,662 | | | | 2.04 | | | | 2.04 | | | | (1.13 | ) | | | 28 | |
Year ended 12/31/12 | | | 11.00 | | | | (0.11 | )(e) | | | 1.50 | | | | 1.39 | | | | (0.58 | ) | | | 11.81 | | | | 12.78 | | | | 49,995 | | | | 2.09 | | | | 2.09 | | | | (0.96 | )(e) | | | 39 | |
Year ended 12/31/11 | | | 11.14 | | | | (0.15 | ) | | | 0.01 | | | | (0.14 | ) | | | — | | | | 11.00 | | | | (1.26 | ) | | | 48,204 | | | | 2.10 | | | | 2.10 | | | | (1.34 | ) | | | 42 | |
Year ended 12/31/10 | | | 8.72 | | | | (0.11 | ) | | | 2.53 | | | | 2.42 | | | | — | | | | 11.14 | | | | 27.75 | | | | 46,838 | | | | 2.13 | | | | 2.13 | | | | (1.16 | ) | | | 36 | |
Class R | | | | | | | | | | | | | | | | | | | | | | | | | | | | | | | | | | | | | | | | | | | | | | | | |
Year ended 12/31/14 | | | 16.40 | | | | (0.12 | ) | | | 0.35 | | | | 0.23 | | | | (2.13 | ) | | | 14.50 | | | | 1.89 | | | | 99,241 | | | | 1.54 | (d) | | | 1.54 | (d) | | | (0.74 | )(d) | | | 45 | |
Year ended 12/31/13 | | | 12.83 | | | | (0.09 | ) | | | 4.71 | | | | 4.62 | | | | (1.05 | ) | | | 16.40 | | | | 36.38 | | | | 114,041 | | | | 1.54 | | | | 1.54 | | | | (0.63 | ) | | | 28 | |
Year ended 12/31/12 | | | 11.85 | | | | (0.06 | )(e) | | | 1.62 | | | | 1.56 | | | | (0.58 | ) | | | 12.83 | | | | 13.30 | | | | 80,486 | | | | 1.59 | | | | 1.59 | | | | (0.46 | )(e) | | | 39 | |
Year ended 12/31/11 | | | 11.94 | | | | (0.10 | ) | | | 0.01 | | | | (0.09 | ) | | | — | | | | 11.85 | | | | (0.75 | ) | | | 77,904 | | | | 1.60 | | | | 1.60 | | | | (0.84 | ) | | | 42 | |
Year ended 12/31/10 | | | 9.30 | | | | (0.07 | ) | | | 2.71 | | | | 2.64 | | | | — | | | | 11.94 | | | | 28.39 | | | | 76,136 | | | | 1.63 | | | | 1.63 | | | | (0.66 | ) | | | 36 | |
Class Y | | | | | | | | | | | | | | | | | | | | | | | | | | | | | | | | | | | | | | | | | | | | | | | | |
Year ended 12/31/14 | | | 17.27 | | | | (0.04 | ) | | | 0.37 | | | | 0.33 | | | | (2.13 | ) | | | 15.47 | | | | 2.36 | | | | 354,121 | | | | 1.04 | (d) | | | 1.04 | (d) | | | (0.24 | )(d) | | | 45 | |
Year ended 12/31/13 | | | 13.40 | | | | (0.02 | ) | | | 4.94 | | | | 4.92 | | | | (1.05 | ) | | | 17.27 | | | | 37.07 | | | | 269,044 | | | | 1.04 | | | | 1.04 | | | | (0.13 | ) | | | 28 | |
Year ended 12/31/12 | | | 12.30 | | | | 0.01 | (e) | | | 1.67 | | | | 1.68 | | | | (0.58 | ) | | | 13.40 | | | | 13.79 | | | | 107,440 | | | | 1.09 | | | | 1.09 | | | | 0.04 | (e) | | | 39 | |
Year ended 12/31/11 | | | 12.32 | | | | (0.04 | ) | | | 0.02 | | | | (0.02 | ) | | | — | | | | 12.30 | | | | (0.16 | ) | | | 60,049 | | | | 1.10 | | | | 1.10 | | | | (0.34 | ) | | | 42 | |
Year ended 12/31/10 | | | 9.56 | | | | (0.02 | ) | | | 2.78 | | | | 2.76 | | | | — | | | | 12.32 | | | | 28.87 | | | | 25,875 | | | | 1.13 | | | | 1.13 | | | | (0.16 | ) | | | 36 | |
Class R5 | | | | | | | | | | | | | | | | | | | | | | | | | | | | | | | | | | | | | | | | | | | | | | | | |
Year ended 12/31/14 | | | 17.99 | | | | (0.01 | ) | | | 0.39 | | | | 0.38 | | | | (2.13 | ) | | | 16.24 | | | | 2.55 | | | | 168,876 | | | | 0.87 | (d) | | | 0.87 | (d) | | | (0.07 | )(d) | | | 45 | |
Year ended 12/31/13 | | | 13.91 | | | | 0.01 | | | | 5.12 | | | | 5.13 | | | | (1.05 | ) | | | 17.99 | | | | 37.22 | | | | 200,674 | | | | 0.88 | | | | 0.88 | | | | 0.03 | | | | 28 | |
Year ended 12/31/12 | | | 12.72 | | | | 0.03 | (e) | | | 1.74 | | | | 1.77 | | | | (0.58 | ) | | | 13.91 | | | | 14.04 | | | | 140,110 | | | | 0.88 | | | | 0.88 | | | | 0.25 | (e) | | | 39 | |
Year ended 12/31/11 | | | 12.71 | | | | (0.01 | ) | | | 0.02 | | | | 0.01 | | | | — | | | | 12.72 | | | | 0.08 | | | | 169,600 | | | | 0.85 | | | | 0.85 | | | | (0.09 | ) | | | 42 | |
Year ended 12/31/10 | | | 9.83 | | | | 0.01 | | | | 2.87 | | | | 2.88 | | | | — | | | | 12.71 | | | | 29.30 | | | | 121,641 | | | | 0.89 | | | | 0.89 | | | | 0.08 | | | | 36 | |
Class R6 | | | | | | | | | | | | | | | | | | | | | | | | | | | | | | | | | | | | | | | | | | | | | | | | |
Year ended 12/31/14 | | | 18.02 | | | | 0.00 | | | | 0.39 | | | | 0.39 | | | | (2.13 | ) | | | 16.28 | | | | 2.60 | | | | 114,981 | | | | 0.78 | (d) | | | 0.78 | (d) | | | 0.02 | (d) | | | 45 | |
Year ended 12/31/13 | | | 13.92 | | | | 0.02 | | | | 5.13 | | | | 5.15 | | | | (1.05 | ) | | | 18.02 | | | | 37.34 | | | | 119,633 | | | | 0.80 | | | | 0.80 | | | | 0.11 | | | | 28 | |
Year ended 12/31/12(f) | | | 14.30 | | | | 0.01 | (e) | | | 0.19 | | | | 0.20 | | | | (0.58 | ) | | | 13.92 | | | | 1.51 | | | | 70,677 | | | | 0.81 | (g) | | | 0.81 | (g) | | | 0.32 | (e)(g) | | | 39 | |
| (a) | Calculated using average shares outstanding. |
| (b) | Includes adjustments in accordance with accounting principles generally accepted in the United States of America and as such, the net asset value for financial reporting purposes and the returns based upon those net asset values may differ from the net asset value and returns for shareholder transactions. Does not include sales charges and is not annualized for periods less than one year, if applicable. |
| (c) | Portfolio turnover is calculated at the fund level and is not annualized for periods less than one year, if applicable. |
| (d) | Ratios are based on average daily net assets (000’s omitted) of $564,382, $10,339, $66,430, $104,515, $311,490, $182,646 and $115,898 for Class A, Class B, Class C, Class R, Class Y, Class R5 and Class R6 shares, respectively. |
| (e) | Net investment income (loss) per share and the ratio of net investment income (loss) to average net assets includes significant dividends received during the period. Net investment income (loss) per share and the ratio of net investment income (loss) to average net assets excluding the significant dividends are $(0.06) and (0.44)%, $(0.14) and (1.19)%, $(0.14) and (1.19)%, $(0.09) and (0.69)%, $(0.03) and (0.19)%, $0.00 and 0.02% and $0.00 and 0.09% for Class A, Class B, Class C, Class R, Class Y, Class R5 and Class R6 shares, respectively. |
| (f) | Commencement date of September 24, 2012. |
20 Invesco Small Cap Equity Fund
Report of Independent Registered Public Accounting Firm
To the Board of Trustees of AIM Funds Group (Invesco Funds Group)
and Shareholders of Invesco Small Cap Equity Fund:
In our opinion, the accompanying statement of assets and liabilities, including the schedule of investments, and the related statements of operations and of changes in net assets and the financial highlights present fairly, in all material respects, the financial position of Invesco Small Cap Equity Fund (one of the funds constituting AIM Funds Group (Invesco Funds Group), hereafter referred to as the “Fund”) at December 31, 2014, the results of its operations for the year then ended, the changes in its net assets for each of the two years in the period then ended and the financial highlights for each of the five years in the period then ended, in conformity with accounting principles generally accepted in the United States of America. These financial statements and financial highlights (hereafter referred to as “financial statements”) are the responsibility of the Fund’s management. Our responsibility is to express an opinion on these financial statements based on our audits. We conducted our audits of these financial statements in accordance with the standards of the Public Company Accounting Oversight Board (United States). Those standards require that we plan and perform the audit to obtain reasonable assurance about whether the financial statements are free of material misstatement. An audit includes examining, on a test basis, evidence supporting the amounts and disclosures in the financial statements, assessing the accounting principles used and significant estimates made by management, and evaluating the overall financial statement presentation. We believe that our audits, which included confirmation of securities at December 31, 2014 by correspondence with the custodian and brokers, and the application of alternative auditing procedures where confirmations of security purchases have not been received, provide a reasonable basis for our opinion.
PRICEWATERHOUSECOOPERS LLP
Houston, Texas
February 23, 2015
21 Invesco Small Cap Equity Fund
Calculating your ongoing Fund expenses
Example
As a shareholder of the Fund, you incur two types of costs: (1) transaction costs, which may include sales charges (loads) on purchase payments or contingent deferred sales charges on redemptions, if any; and (2) ongoing costs, including management fees, distribution and/or service (12b-1) fees, and other Fund expenses. This example is intended to help you understand your ongoing costs (in dollars) of investing in the Fund and to compare these costs with ongoing costs of investing in other mutual funds. The example is based on an investment of $1,000 invested at the beginning of the period and held for the entire period July 1, 2014 through December 31, 2014.
Actual expenses
The table below provides information about actual account values and actual expenses. You may use the information in this table, together with the amount you invested, to estimate the expenses that you paid over the period. Simply divide your account value by $1,000 (for example, an $8,600 account value divided by $1,000 = 8.6), then multiply the result by the number in the table under the heading entitled “Actual Expenses Paid During Period” to estimate the expenses you paid on your account during this period.
Hypothetical example for comparison purposes
The table below also provides information about hypothetical account values and hypothetical expenses based on the Fund’s actual expense ratio and an assumed rate of return of 5% per year before expenses, which is not the Fund’s actual return.
The hypothetical account values and expenses may not be used to estimate the actual ending account balance or expenses you paid for the period. You may use this information to compare the ongoing costs of investing in the Fund and other funds. To do so, compare this 5% hypothetical example with the 5% hypothetical examples that appear in the shareholder reports of the other funds.
Please note that the expenses shown in the table are meant to highlight your ongoing costs only and do not reflect any transaction costs, such as sales charges (loads) on purchase payments or contingent deferred sales charges on redemptions, if any. Therefore, the hypothetical information is useful in comparing ongoing costs only, and will not help you determine the relative total costs of owning different funds. In addition, if these transaction costs were included, your costs would have been higher.
| | | | | | | | | | | | | | | | | | | | | | | | |
| Class | | Beginning
Account Value
(07/01/14) | | | ACTUAL | | | HYPOTHETICAL (5% annual return before expenses) | | | Annualized
Expense
Ratio | |
| | | Ending
Account Value
(12/31/14)1 | | | Expenses
Paid During
Period2 | | | Ending
Account Value
(12/31/14) | | | Expenses
Paid During
Period2 | | |
| A | | $ | 1,000.00 | | | $ | 1,022.90 | | | $ | 6.58 | | | $ | 1,018.70 | | | $ | 6.56 | | | | 1.29 | % |
| B | | | 1,000.00 | | | | 1,018.60 | | | | 10.38 | | | | 1,014.92 | | | | 10.36 | | | | 2.04 | |
| C | | | 1,000.00 | | | | 1,018.80 | | | | 10.38 | | | | 1,014.92 | | | | 10.36 | | | | 2.04 | |
| R | | | 1,000.00 | | | | 1,021.40 | | | | 7.85 | | | | 1,017.44 | | | | 7.83 | | | | 1.54 | |
| Y | | | 1,000.00 | | | | 1,023.60 | | | | 5.30 | | | | 1,019.96 | | | | 5.30 | | | | 1.04 | |
| R5 | | | 1,000.00 | | | | 1,024.40 | | | | 4.49 | | | | 1,020.77 | | | | 4.48 | | | | 0.88 | |
| R6 | | | 1,000.00 | | | | 1,024.90 | | | | 4.03 | | | | 1,021.22 | | | | 4.02 | | | | 0.79 | |
| 1 | The actual ending account value is based on the actual total return of the Fund for the period July 1, 2014 through December 31, 2014, after actual expenses and will differ from the hypothetical ending account value which is based on the Fund’s expense ratio and a hypothetical annual return of 5% before expenses. |
| 2 | Expenses are equal to the Fund’s annualized expense ratio as indicated above multiplied by the average account value over the period, multiplied by 184/365 to reflect the most recent fiscal half year. |
22 Invesco Small Cap Equity Fund
Tax Information
Form 1099-DIV, Form 1042-S and other year–end tax information provide shareholders with actual calendar year amounts that should be included in their tax returns. Shareholders should consult their tax advisors.
The following distribution information is being provided as required by the Internal Revenue Code or to meet a specific state’s requirement.
The Fund designates the following amounts or, if subsequently determined to be different, the maximum amount allowable for its fiscal year ended December 31, 2014:
| | | | |
Federal and State Income Tax | |
Long-Term Capital Gain Distributions | | $ | 168,356,720 | |
Qualified Dividend Income* | | | 100 | % |
Corporate Dividends Received Deduction* | | | 100 | % |
U.S. Treasury Obligations* | | | 0 | % |
| | * | The above percentages are based on ordinary income dividends paid to shareholders during the Fund’s fiscal year. |
| | | | |
Non-Resident Alien Shareholders | |
Qualified Short-Term Gains | | $ | 1,283,750 | |
23 Invesco Small Cap Equity Fund
Trustees and Officers
The address of each trustee and officer is AIM Funds Group (Invesco Funds Group) (the “Trust”), 11 Greenway Plaza, Suite 1000, Houston, Texas 77046-1173. The trustees serve for the life of the Trust, subject to their earlier death, incapacitation, resignation, retirement or removal as more specifically provided in the Trust’s organizational documents. Each officer serves for a one year term or until their successors are elected and qualified. Column two below includes length of time served with predecessor entities, if any.
| | | | | | | | |
Name, Year of Birth and
Position(s) Held with the Trust | | Trustee and/
or Officer Since | | Principal Occupation(s)
During Past 5 Years | | Number of
Funds in Fund
Complex
Overseen by
Trustee | | Other Directorship(s)
Held by Trustee During
Past 5 Years |
| Interested Persons | | | | | | | | |
| Martin L. Flanagan1 — 1960 Trustee | | 2007 | | Executive Director, Chief Executive Officer and President, Invesco Ltd. (ultimate parent of Invesco and a global investment management firm); Advisor to the Board, Invesco Advisers, Inc. (formerly known as Invesco Institutional (N.A.), Inc.); Trustee, The Invesco Funds; Vice Chair, Investment Company Institute; and Member of Executive Board, SMU Cox School of Business Formerly: Chairman and Chief Executive Officer, Invesco Advisers, Inc. (registered investment adviser); Director, Chairman, Chief Executive Officer and President, IVZ Inc. (holding company), INVESCO Group Services, Inc. (service provider) and Invesco North American Holdings, Inc. (holding company); Director, Chief Executive Officer and President, Invesco Holding Company Limited (parent of Invesco and a global investment management firm); Director, Invesco Ltd.; Chairman, Investment Company Institute and President, Co-Chief Executive Officer, Co-President, Chief Operating Officer and Chief Financial Officer, Franklin Resources, Inc. (global investment management organization). | | 144 | | None |
Philip A. Taylor2 — 1954
Trustee, President and Principal Executive Officer | | 2006 | | Head of North American Retail and Senior Managing Director, Invesco Ltd.; Director, Co-Chairman, Co-President and Co-Chief Executive Officer, Invesco Advisers, Inc. (formerly known as Invesco Institutional (N.A.), Inc.) (registered investment adviser); Director, Chairman, Chief Executive Officer and President, Invesco Management Group, Inc. (formerly known as Invesco Aim Management Group, Inc.) (financial services holding company); Director and President, INVESCO Funds Group, Inc. (registered investment adviser and registered transfer agent); Director and Chairman, Invesco Investment Services, Inc. (formerly known as Invesco Aim Investment Services, Inc.) (registered transfer agent) and IVZ Distributors, Inc. (formerly known as INVESCO Distributors, Inc.) (registered broker dealer); Director, President and Chairman, Invesco Inc. (holding company) and Invesco Canada Holdings Inc. (holding company); Chief Executive Officer, Invesco Corporate Class Inc. (corporate mutual fund company) and Invesco Canada Fund Inc. (corporate mutual fund company); Director, Chairman and Chief Executive Officer, Invesco Canada Ltd. (formerly known as Invesco Trimark Ltd./Invesco Trimark Ltèe) (registered investment adviser and registered transfer agent); Trustee, President and Principal Executive Officer, The Invesco Funds (other than AIM Treasurer’s Series Trust (Invesco Treasurer’s Series Trust) and Short-Term Investments Trust); Trustee and Executive Vice President, The Invesco Funds (AIM Treasurer’s Series Trust (Invesco Treasurer’s Series Trust) and Short-Term Investments Trust only); Director, Invesco Investment Advisers LLC (formerly known as Van Kampen Asset Management); Director, Chief Executive Officer and President, Van Kampen Exchange Corp. Formerly: Director and Chairman, Van Kampen Investor Services Inc.; Director, Chief Executive Officer and President, 1371 Preferred Inc. (holding company) and Van Kampen Investments Inc.; Director and President, AIM GP Canada Inc. (general partner for limited partnerships) and Van Kampen Advisors, Inc.; Director and Chief Executive Officer, Invesco Trimark Dealer Inc. (registered broker dealer); Director, Invesco Distributors, Inc. (formerly known as Invesco Aim Distributors, Inc.) (registered broker dealer); Manager, Invesco PowerShares Capital Management LLC; Director, Chief Executive Officer and President, Invesco Advisers, Inc.; Director, Chairman, Chief Executive Officer and President, Invesco Aim Capital Management, Inc.; President, Invesco Trimark Dealer Inc. and Invesco Trimark Ltd./Invesco Trimark Ltèe; Director and President, AIM Trimark Corporate Class Inc. and AIM Trimark Canada Fund Inc.; Senior Managing Director, Invesco Holding Company Limited; Director and Chairman, Fund Management Company (former registered broker dealer); President and Principal Executive Officer, The Invesco Funds (AIM Treasurer’s Series Trust (Invesco Treasurer’s Series Trust), and Short-Term Investments Trust only); President, AIM Trimark Global Fund Inc. and AIM Trimark Canada Fund Inc. | | 144 | | None |
| Independent Trustees | | | | | | | | |
Bruce L. Crockett — 1944 Trustee and Chair | | 1987 | | Chairman, Crockett Technologies Associates (technology consulting company) Formerly: Director, Captaris (unified messaging provider); Director, President and Chief Executive Officer, COMSAT Corporation; Chairman, Board of Governors of INTELSAT (international communications company); ACE Limited (insurance company); and Investment Company Institute | | 144 | | ALPS (Attorneys Liability Protection Society) (insurance company) |
| 1 | Mr. Flanagan is considered an interested person (within the meaning of Section 2(a)(19) of the 1940 Act) of the Trust because he is an officer of the Adviser to the Trust, and an officer and a director of Invesco Ltd., ultimate parent of the Adviser. |
| 2 | Mr. Taylor is considered an interested person (within the meaning of Section 2(a)(19) of the 1940 Act) of the Trust because he is an officer and a director of the Adviser. |
T-1 Invesco Small Cap Equity Fund
Trustees and Officers—(continued)
| | | | | | | | |
Name, Year of Birth and
Position(s) Held with the Trust | | Trustee and/
or Officer Since | | Principal Occupation(s)
During Past 5 Years | | Number of
Funds in Fund
Complex
Overseen by
Trustee | | Other Directorship(s)
Held by Trustee During
Past 5 Years |
| Independent Trustees—(continued) |
David C. Arch — 1945 Trustee | | 2010 | | Chairman of Blistex Inc., a consumer health care products manufacturer | | 144 | | Board member of the Illinois Manufacturers’ Association; Member of the Board of Visitors, Institute for the Humanities, University of Michigan; Member of the Audit Committee of the Edward-Elmhurst Hospital |
James T. Bunch — 1942 Trustee | | 2003 | | Managing Member, Grumman Hill Group LLC (family office private equity investments) Formerly: Founder, Green Manning & Bunch Ltd. (investment banking firm) (1988-2010); Executive Committee, United States Golf Association; and Director, Policy Studies, Inc. and Van Gilder Insurance Corporation | | 144 | | Chairman, Board of Governors, Western Golf Association; Chairman, Evans Scholars Foundation; and Director, Denver Film Society |
Rodney F. Dammeyer — 1940 Trustee | | 2010 | | Chairman of CAC, LLC, (private company offering capital investment and management advisory services) Formerly: Prior to 2001, Managing Partner at Equity Group Corporate Investments; Prior to 1995, Chief Executive Officer of Itel Corporation (formerly Anixter International); Prior to 1985, experience includes Senior Vice President and Chief Financial Officer of Household International, Inc., Executive Vice President and Chief Financial Officer of Northwest Industries, Inc. and Partner of Arthur Andersen & Co.; From 1987 to 2010, Director/Trustee of investment companies in the Van Kampen Funds complex | | 144 | | Director of Quidel Corporation and Stericycle, Inc. |
Albert R. Dowden — 1941 Trustee | | 2000 | | Director of a number of public and private business corporations, including the Boss Group, Ltd. (private investment and management); Nature’s Sunshine Products, Inc. and Reich & Tang Funds (5 portfolios) (registered investment company) Formerly: Director, Homeowners of America Holding Corporation/Homeowners of America Insurance Company (property casualty company); Director, Continental Energy Services, LLC (oil and gas pipeline service); Director, CompuDyne Corporation (provider of product and services to the public security market) and Director, Annuity and Life Re (Holdings), Ltd. (reinsurance company); Director, President and Chief Executive Officer, Volvo Group North America, Inc.; Senior Vice President, AB Volvo; Director of various public and private corporations; Chairman, DHJ Media, Inc.; Director, Magellan Insurance Company; and Director, The Hertz Corporation, Genmar Corporation (boat manufacturer), National Media Corporation; Advisory Board of Rotary Power International (designer, manufacturer, and seller of rotary power engines); and Chairman, Cortland Trust, Inc. (registered investment company) | | 144 | | Director of: Nature’s Sunshine Products, Inc., Reich & Tang Funds, Homeowners of America Holding Corporation/ Homeowners of America Insurance Company, the Boss Group |
Jack M. Fields — 1952 Trustee | | 1997 | | Chief Executive Officer, Twenty First Century Group, Inc. (government affairs company); Owner and Chief Executive Officer, Dos Angeles Ranch, L.P. (cattle, hunting, corporate entertainment); and Discovery Global Education Fund (non-profit) Formerly: Chief Executive Officer, Texana Timber LP (sustainable forestry company); Director of Cross Timbers Quail Research Ranch (non-profit); and member of the U.S. House of Representatives | | 144 | | Insperity, Inc. (formerly known as Administaff) |
Prema Mathai-Davis — 1950 Trustee | | 1998 | | Retired. Formerly: Chief Executive Officer, YWCA of the U.S.A. | | 144 | | None |
Larry Soll — 1942 Trustee | | 2003 | | Retired. Formerly: Chairman, Chief Executive Officer and President, Synergen Corp. (a biotechnology company) | | 144 | | None |
Hugo F. Sonnenschein — 1940 Trustee | | 2010 | | President Emeritus and Honorary Trustee of the University of Chicago and the Adam Smith Distinguished Service Professor in the Department of Economics at the University of Chicago. Prior to 2000, President of the University of Chicago | | 144 | | Trustee of the University of Rochester and a member of its investment committee; Member of the National Academy of Sciences and the American Philosophical Society; Fellow of the American Academy of Arts and Sciences |
Raymond Stickel, Jr. — 1944 Trustee | | 2005 | | Retired. Formerly: Director, Mainstay VP Series Funds, Inc. (25 portfolios) and Partner, Deloitte & Touche | | 144 | | None |
T-2 Invesco Small Cap Equity Fund
Trustees and Officers—(continued)
| | | | | | | | |
Name, Year of Birth and
Position(s) Held with the Trust | | Trustee and/
or Officer Since | | Principal Occupation(s)
During Past 5 Years | | Number of
Funds in Fund
Complex
Overseen by
Trustee | | Other Directorship(s)
Held by Trustee During
Past 5 Years |
| Independent Trustees—(continued) |
Suzanne H. Woolsey — 1941 Trustee | | 2014 | | Chief Executive Officer of Woolsey Partners LLC | | 144 | | Emeritus Chair of the Board of Trustees of the Institute for Defense Analyses; Trustee of Colorado College; Trustee of California Institute of Technology; Prior to 2014, Director of Fluor Corp.; Prior to 2010, Trustee of the German Marshall Fund of the United States; Prior to 2010 Trustee of the Rocky Mountain Institute |
| Other Officers | | | | | | | | |
Russell C. Burk — 1958
Senior Vice President and Senior Officer | | 2005 | | Senior Vice President and Senior Officer, The Invesco Funds | | N/A | | N/A |
John M. Zerr — 1962
Senior Vice President, Chief Legal Officer and Secretary | | 2006 | | Director, Senior Vice President, Secretary and General Counsel, Invesco Management Group, Inc. (formerly known as Invesco Aim Management Group, Inc.) and Van Kampen Exchange Corp.; Senior Vice President, Invesco Advisers, Inc. (formerly known as Invesco Institutional (N.A.), Inc.) (registered investment adviser); Senior Vice President and Secretary, Invesco Distributors, Inc. (formerly known as Invesco Aim Distributors, Inc.); Director, Vice President and Secretary, Invesco Investment Services, Inc. (formerly known as Invesco Aim Investment Services, Inc.) and IVZ Distributors, Inc. (formerly known as INVESCO Distributors, Inc.); Director and Vice President, INVESCO Funds Group, Inc.; Senior Vice President, Chief Legal Officer and Secretary, The Invesco Funds; Manager, Invesco PowerShares Capital Management LLC; Director, Secretary and General Counsel, Invesco Investment Advisers LLC (formerly known as Van Kampen Asset Management); Secretary and General Counsel, Invesco Capital Markets, Inc. (formerly known as Van Kampen Funds Inc.) and Chief Legal Officer, PowerShares Exchange-Traded Fund Trust, PowerShares Exchange-Traded Fund Trust II, PowerShares India Exchange-Traded Fund Trust , PowerShares Actively Managed Exchange-Traded Fund Trust; and PowerShares Actively Managed Exchange-Traded Commodity Fund Trust Formerly: Director and Vice President, Van Kampen Advisors Inc.; Director, Vice President, Secretary and General Counsel, Van Kampen Investor Services Inc.; Director, Invesco Distributors, Inc. (formerly known as Invesco Aim Distributors, Inc.); Director, Senior Vice President, General Counsel and Secretary, Invesco Aim Advisers, Inc. and Van Kampen Investments Inc.; Director, Vice President and Secretary, Fund Management Company; Director, Senior Vice President, Secretary, General Counsel and Vice President, Invesco Aim Capital Management, Inc.; Chief Operating Officer and General Counsel, Liberty Ridge Capital, Inc. (an investment adviser); Vice President and Secretary, PBHG Funds (an investment company) and PBHG Insurance Series Fund (an investment company); Chief Operating Officer, General Counsel and Secretary, Old Mutual Investment Partners (a broker-dealer); General Counsel and Secretary, Old Mutual Fund Services (an administrator) and Old Mutual Shareholder Services (a shareholder servicing center); Executive Vice President, General Counsel and Secretary, Old Mutual Capital, Inc. (an investment adviser); and Vice President and Secretary, Old Mutual Advisors Funds (an investment company) | | N/A | | N/A |
Sheri Morris — 1964
Vice President, Treasurer and Principal Financial Officer | | 1999 | | Vice President, Treasurer and Principal Financial Officer, The Invesco Funds; Vice President, Invesco Advisers, Inc. (formerly known as Invesco Institutional (N.A.), Inc.) (registered investment adviser); and Vice President, PowerShares Exchange-Traded Fund Trust, PowerShares Exchange-Traded Fund Trust II, PowerShares India Exchange-Traded Fund Trust, PowerShares Actively Managed Exchange-Traded Fund Trust, and PowerShares Actively Managed Exchange-Traded Commodity Fund Trust Formerly: Vice President, Invesco Aim Advisers, Inc., Invesco Aim Capital Management, Inc. and Invesco Aim Private Asset Management, Inc.; Assistant Vice President and Assistant Treasurer, The Invesco Funds and Assistant Vice President, Invesco Advisers, Inc., Invesco Aim Capital Management, Inc. and Invesco Aim Private Asset Management, Inc.; and Treasurer, PowerShares Exchange-Traded Fund Trust, PowerShares Exchange-Traded Fund Trust II, PowerShares India Exchange-Traded Fund Trust and PowerShares Actively Managed Exchange-Traded Fund Trust | | N/A | | N/A |
T-3 Invesco Small Cap Equity Fund
Trustees and Officers—(continued)
| | | | | | | | |
Name, Year of Birth and
Position(s) Held with the Trust | | Trustee and/
or Officer Since | | Principal Occupation(s)
During Past 5 Years | | Number of
Funds in Fund
Complex
Overseen by
Trustee | | Other Directorship(s)
Held by Trustee During
Past 5 Years |
| Other Officers—(continued) | | | | | | | | |
Karen Dunn Kelley — 1960
Vice President | | 1992 | | Senior Managing Director, Investments; Director, Co-President, Co-Chief Executive Officer, and Co-Chairman, Invesco Advisers, Inc. (formerly known as Invesco Institutional (N.A.), Inc.) (registered investment adviser); Chairman, Invesco Senior Secured Management, Inc.; Senior Vice President, Invesco Management Group, Inc. (formerly known as Invesco Aim Management Group, Inc.); Executive Vice President, Invesco Distributors, Inc. (formerly known as Invesco Aim Distributors, Inc.); Director, Invesco Mortgage Capital Inc. and Invesco Management Company Limited; Director and President, INVESCO Asset Management (Bermuda) Ltd., Vice President, The Invesco Funds (other than AIM Treasurer’s Series Trust (Invesco Treasurer’s Series Trust) and Short-Term Investments Trust); and President and Principal Executive Officer, The Invesco Funds (AIM Treasurer’s Series Trust (Invesco Treasurer’s Series Trust) and Short-Term Investments Trust only) Formerly: Director, INVESCO Global Asset Management Limited and INVESCO Management S.A.; Senior Vice President, Van Kampen Investments Inc. and Invesco Advisers, Inc. (formerly known as Invesco Institutional (N.A.), Inc.) (registered investment adviser); Vice President, Invesco Advisers, Inc. (formerly known as Invesco Institutional (N.A.), Inc.); Director of Cash Management and Senior Vice President, Invesco Advisers, Inc. and Invesco Aim Capital Management, Inc.; Director and President, Fund Management Company; Chief Cash Management Officer, Director of Cash Management, Senior Vice President, and Managing Director, Invesco Aim Capital Management, Inc.; Director of Cash Management, Senior Vice President, and Vice President, Invesco Advisers, Inc. and The Invesco Funds (AIM Treasurer’s Series Trust (Invesco Treasurer’s Series Trust), and Short-Term Investments Trust only) | | N/A | | N/A |
Crissie M. Wisdom — 1969
Anti-Money Laundering Compliance Officer | | 2013 | | Anti-Money Laundering Compliance Officer, Invesco Advisers, Inc. (formerly known as Invesco Institutional (N.A.), Inc.) (registered investment adviser), Invesco Capital Markets, Inc. (formerly known as Van Kampen Funds Inc.), Invesco Distributors, Inc., Invesco Investment Services, Inc., Invesco Management Group, Inc., Van Kampen Exchange Corp., The Invesco Funds, and PowerShares Exchange-Traded Fund Trust, PowerShares Exchange-Traded Fund Trust II, PowerShares India Exchange-Traded Fund Trust, PowerShares Actively Managed Exchange-Traded Fund Trust and PowerShares Actively Managed Exchange-Traded Commodity Fund Trust; and Fraud Prevention Manager and Controls and Risk Analysis Manager for Invesco Investment Services, Inc. | | N/A | | N/A |
Todd L. Spillane — 1958
Chief Compliance Officer | | 2006 | | Senior Vice President, Invesco Management Group, Inc. (formerly known as Invesco Aim Management Group, Inc.) and Van Kampen Exchange Corp.; Senior Vice President and Chief Compliance Officer, Invesco Advisers, Inc. (registered investment adviser) (formerly known as Invesco Institutional (N.A.), Inc.); Chief Compliance Officer, The Invesco Funds; Vice President, Invesco Distributors, Inc. (formerly known as Invesco Aim Distributors, Inc.) and Invesco Investment Services, Inc. (formerly known as Invesco Aim Investment Services, Inc.) Formerly: Chief Compliance Officer, Invesco Funds (Chicago); Senior Vice President, Van Kampen Investments Inc.; Senior Vice President and Chief Compliance Officer, Invesco Aim Advisers, Inc. and Invesco Aim Capital Management, Inc.; Chief Compliance Officer, INVESCO Private Capital Investments, Inc. (holding company), Invesco Private Capital, Inc. (registered investment adviser), Invesco Global Asset Management (N.A.), Inc., Invesco Senior Secured Management, Inc. (registered investment adviser), Van Kampen Investor Services Inc., PowerShares Exchange-Traded Fund Trust, PowerShares Exchange-Traded Fund Trust II, PowerShares India Exchange-Traded Fund Trust and PowerShares Actively Managed Exchange-Traded Fund Trust; and Vice President, Invesco Aim Capital Management, Inc. and Fund Management Company | | N/A | | N/A |
The Statement of Additional Information of the Trust includes additional information about the Fund’s Trustees and is available upon request, without charge, by calling 1.800.959.4246. Please refer to the Fund’s prospectus for information on the Fund’s sub-advisers.
| | | | | | |
Office of the Fund 11 Greenway Plaza, Suite 1000 Houston, TX 77046-1173 | | Investment Adviser Invesco Advisers, Inc.
1555 Peachtree Street, N.E.
Atlanta, GA 30309 | | Distributor Invesco Distributors, Inc. 11 Greenway Plaza, Suite 1000 Houston, TX 77046-1173 | | Auditors PricewaterhouseCoopers LLP 1000 Louisiana Street, Suite 5800 Houston, TX 77002-5678 |
| | | |
| | | | | | |
Counsel to the Fund Stradley Ronon Stevens & Young, LLP 2005 Market Street, Suite 2600 Philadelphia, PA 19103-7018 | | Counsel to the Independent Trustees Goodwin Procter LLP 901 New York Avenue, N.W. Washington, D.C. 20001 | | Transfer Agent Invesco Investment Services, Inc. 11 Greenway Plaza, Suite 1000 Houston, TX 77046-1173 | | Custodian State Street Bank and Trust Company 225 Franklin Street Boston, MA 02110-2801 |
T-4 Invesco Small Cap Equity Fund

Invesco mailing information
Send general correspondence to Invesco Investment Services, Inc., P.O. Box 219078, Kansas City, MO 64121-9078.
Important notice regarding delivery of security holder documents
To reduce Fund expenses, only one copy of most shareholder documents may be mailed to shareholders with multiple accounts at the same address (Householding). Mailing of your shareholder documents may be householded indefinitely unless you instruct us otherwise. If you do not want the mailing of these documents to be combined with those for other members of your household, please contact Invesco Investment Services, Inc. at 800 959 4246 or contact your financial institution. We will begin sending you individual copies for each account within 30 days after receiving your request.
Fund holdings and proxy voting information
The Fund provides a complete list of its holdings four times in each fiscal year, at the quarter ends. For the second and fourth quarters, the lists appear in the Fund’s semiannual and annual reports to shareholders. For the first and third quarters, the Fund files the lists with the Securities and Exchange Commission (SEC) on Form N-Q. The most recent list of portfolio holdings is available at invesco.com/completeqtrholdings. Shareholders can also look up the Fund’s Forms N-Q on the SEC website at sec.gov. Copies of the Fund’s Forms N-Q may be reviewed and copied at the SEC Public Reference Room in Washington, D.C. You can obtain information on the operation of the Public Reference Room, including information about duplicating fee charges, by calling 202 551 8090 or 800 732 0330, or by electronic request at the following email address: publicinfo@sec.gov. The SEC file numbers for the Fund are shown below.
A description of the policies and procedures that the Fund uses to determine how to vote proxies relating to portfolio securities is available without charge, upon request, from our Client Services department at 800 959 4246 or at invesco.com/proxyguidelines. The information is also available on the SEC website, sec.gov.
| | |
Information regarding how the Fund voted proxies related to its portfolio securities during the most recent 12-month period ended June 30 is available at invesco.com/proxysearch. The information is also available on the SEC website, sec.gov. Invesco Advisers, Inc. is an investment adviser; it provides investment advisory services to individual and institutional clients and does not sell securities. Invesco Distributors, Inc. is the US distributor for Invesco Ltd.’s retail mutual funds, exchange-traded funds and institutional money market funds. Both are wholly owned, indirect subsidiaries of Invesco Ltd. | |  |
| | | | |
| SEC file numbers: 811-01540 and 002-27334 | | SCE-AR-1 | | Invesco Distributors, Inc. |
As of the end of the period covered by this report, the Registrant had adopted a code of ethics (the “Code”) that applies to the Registrant’s principal executive officer (“PEO”) and principal financial officer (“PFO”). There were no amendments to the Code during the period covered by the report. The Registrant did not grant any waivers, including implicit waivers, from any provisions of the Code to the PEO or PFO during the period covered by this report.
| ITEM 3. | AUDIT COMMITTEE FINANCIAL EXPERT. |
The Board of Trustees has determined that the Registrant has at least one audit committee financial expert serving on its Audit Committee. The Audit Committee financial expert is Raymond Stickel, Jr. Mr. Stickel is “independent” within the meaning of that term as used in Form N-CSR.
| ITEM 4. | PRINCIPAL ACCOUNTANT FEES AND SERVICES. |
(a) to (d)
Fees Billed by PWC Related to the Registrant
PWC billed the Registrant aggregate fees for services rendered to the Registrant for the last two fiscal years as follows:
| | | | | | | | | | | | | | | | |
| | | Fees Billed for
Services Rendered to
the Registrant for
fiscal year end 2014 | | | (e)(2)
Percentage of Fees
Billed Applicable to
Non-Audit Services
Provided for fiscal
year end 2014
Pursuant to Waiver of
Pre-Approval
Requirement(1) | | | Fees Billed for
Services Rendered to
the Registrant for
fiscal year end 2013 | | | (e)(2)
Percentage of Fees
Billed Applicable to
Non-Audit Services
Provided for fiscal
year end 2013
Pursuant to Waiver
of Pre-Approval
Requirement(1) | |
Audit Fees | | $ | 112,250 | | | | N/A | | | $ | 109,000 | | | | N/A | |
Audit-Related Fees | | $ | 0 | | | | 0 | % | | $ | 0 | | | | 0 | % |
Tax Fees(2) | | $ | 36,992 | | | | 0 | % | | $ | 33,140 | | | | 0 | % |
All Other Fees | | $ | 0 | | | | 0 | % | | $ | 0 | | | | 0 | % |
| | | | | | | | | | | | | | | | |
Total Fees | | $ | 149,242 | | | | 0 | % | | $ | 142,140 | | | | 0 | % |
(g) PWC billed the Registrant aggregate non-audit fees of $36,992 for the fiscal year ended 2014, and $33,140 for the fiscal year ended 2013, for non-audit services rendered to the Registrant.
| (1) | With respect to the provision of non-audit services, the pre-approval requirement is waived pursuant to a de minimis exception if (i) such services were not recognized as non-audit services by the Registrant at the time of engagement, (ii) the aggregate amount of all such services provided is no more than 5% of the aggregate audit and non-audit fees paid by the Registrant to PWC during a fiscal year; and (iii) such services are promptly brought to the attention of the Registrant’s Audit Committee and approved by the Registrant’s Audit Committee prior to the completion of the audit. |
| (2) | Tax fees for the fiscal year end December 31, 2014 includes fees billed for reviewing tax returns. Tax fees for fiscal year end December 31, 2013 includes fees billed for reviewing tax returns. |
Fees Billed by PWC Related to Invesco and Invesco Affiliates
PWC billed Invesco Advisers, Inc. (“Invesco”), the Registrant’s adviser, and any entity controlling, controlled by or under common control with Invesco that provides ongoing services to the Registrant (“Invesco Affiliates”) aggregate fees for pre-approved non-audit services rendered to Invesco and Invesco Affiliates for the last two fiscal years as follows:
| | | | | | | | | | | | | | | | |
| | | Fees Billed for Non-
Audit Services
Rendered to Invesco
and Invesco Affiliates
for fiscal year end
2014 That Were
Required
to be Pre-Approved
by the Registrant’s
Audit Committee | | | (e)(2)
Percentage of Fees
Billed Applicable to
Non-Audit Services
Provided for fiscal year
end 2014 Pursuant to
Waiver of Pre-
Approval
Requirement(1) | | | Fees Billed for Non-
Audit Services
Rendered to Invesco
and Invesco Affiliates
for fiscal year end
2013 That Were
Required
to be Pre-Approved
by the Registrant’s
Audit Committee | | | (e)(2)
Percentage of Fees
Billed Applicable to
Non-Audit Services
Provided for fiscal year
end 2013 Pursuant to
Waiver of Pre-
Approval
Requirement(1) | |
Audit-Related Fees | | $ | 574,000 | | | | 0 | % | | $ | 574,000 | | | | 0 | % |
Tax Fees | | $ | 0 | | | | 0 | % | | $ | 0 | | | | 0 | % |
All Other Fees | | $ | 0 | | | | 0 | % | | $ | 0 | | | | 0 | % |
| | | | | | | | | | | | | | | | |
Total Fees(2) | | $ | 574,000 | | | | 0 | % | | $ | 574,000 | | | | 0 | % |
| (1) | With respect to the provision of non-audit services, the pre-approval requirement is waived pursuant to a de minimis exception if (i) such services were not recognized as non-audit services by the Registrant at the time of engagement, (ii) the aggregate amount of all such services provided is no more than 5% of the aggregate audit and non-audit fees paid by the Registrant, Invesco and Invesco Affiliates to PWC during a fiscal year; and (iii) such services are promptly brought to the attention of the Registrant’s Audit Committee and approved by the Registrant’s Audit Committee prior to the completion of the audit. |
| (2) | Audit-Related fees for the year end 2014 include fees billed related to reviewing controls at a service organization. |
(g) Including the fees for services not required to be pre-approved by the registrant’s audit committee, PWC billed Invesco and Invesco Affiliates aggregate non-audit fees of $4,009,694 for the fiscal year ended 2014, and $1,645,309 for the fiscal year ended 2013, for non-audit services rendered to Invesco and Invesco Affiliates.
(h) The Audit Committee also has considered whether the provision of non-audit services that were rendered to Invesco and Invesco Affiliates that were not required to be pre-approved pursuant to SEC regulations, if any, is compatible with maintaining PWC’s independence.
(f) Not applicable.
(e)(1)
PRE-APPROVAL OF AUDIT AND NON-AUDIT SERVICE
SPOLICIES AND PROCEDURES
As adopted by the Audit Committees of
the Invesco Funds (the “Funds”)
Last Amended May 4, 2010
Statement of Principles
Under the Sarbanes-Oxley Act of 2002 and rules adopted by the Securities and Exchange Commission (“SEC”) (“Rules”), the Audit Committees of the Funds’ (the “Audit Committees”) Board of Trustees (the “Board”) are responsible for the appointment, compensation and oversight of the work of independent accountants (an “Auditor”). As part of this responsibility and to assure that the Auditor’s independence is not impaired, the Audit Committees pre-approve the audit and non-audit services provided to the Funds by each Auditor, as well as all non-audit services provided by the Auditor to the Funds’ investment adviser and to affiliates of the adviser that provide ongoing services to the Funds (“Service Affiliates”) if the services directly impact the Funds’ operations or financial reporting. The SEC Rules also specify the types of services that an Auditor may not provide to its audit client. The following policies and procedures comply with the requirements for pre-approval and provide a mechanism by which management of the Funds may request and secure pre-approval of audit and non-audit services in an orderly manner with minimal disruption to normal business operations.
Proposed services either may be pre-approved without consideration of specific case-by-case services by the Audit Committees (“general pre-approval”) or require the specific pre-approval of the Audit Committees (“specific pre-approval”). As set forth in these policies and procedures, unless a type of service has received general pre-approval, it will require specific pre-approval by the Audit Committees. Additionally, any fees exceeding 110% of estimated pre-approved fee levels provided at the time the service was pre-approved will also require specific approval by the Audit Committees before payment is made. The Audit Committees will also consider the impact of additional fees on the Auditor’s independence when determining whether to approve any additional fees for previously pre-approved services.
The Audit Committees will annually review and generally pre-approve the services that may be provided by each Auditor without obtaining specific pre-approval from the Audit Committee generally on an annual basis. The term of any general pre-approval runs from the date of such pre-approval through September 30th of the following year, unless the Audit Committees consider a different period and state otherwise. The Audit Committees will add to or subtract from the list of general pre-approved services from time to time, based on subsequent determinations.
The purpose of these policies and procedures is to set forth the guidelines to assist the Audit Committees in fulfilling their responsibilities.
Delegation
The Audit Committees may from time to time delegate pre-approval authority to one or more of its members who are Independent Trustees. All decisions to pre-approve a service by a delegated member shall be reported to the Audit Committees at the next quarterly meeting.
Audit Services
The annual audit services engagement terms will be subject to specific pre-approval of the Audit Committees. Audit services include the annual financial statement audit and other procedures such as tax provision work that is required to be performed by the independent auditor to be able to form an opinion on the Funds’ financial statements. The Audit Committees will obtain, review and consider sufficient information concerning the proposed Auditor to make a reasonable evaluation of the Auditor’s qualifications and independence.
In addition to the annual Audit services engagement, the Audit Committees may grant either general or specific pre-approval of other audit services, which are those services that only the independent auditor reasonably can provide. Other Audit services may include services such as issuing consents for the inclusion of audited financial statements with SEC registration statements, periodic reports and other documents filed with the SEC or other documents issued in connection with securities offerings.
Non-Audit Services
The Audit Committees may provide either general or specific pre-approval of any non-audit services to the Funds and its Service Affiliates if the Audit Committees believe that the provision of the service will not impair the independence of the Auditor, is consistent with the SEC’s Rules on auditor independence, and otherwise conforms to the Audit Committees’ general principles and policies as set forth herein.
Audit-Related Services
“Audit-related services” are assurance and related services that are reasonably related to the performance of the audit or review of the Fund’s financial statements or that are traditionally performed by the independent auditor. Audit-related services include, among others, accounting consultations related to accounting, financial reporting or disclosure matters not classified as “Audit services”; assistance with understanding and implementing new accounting and financial reporting guidance from rulemaking authorities; and agreed-upon procedures related to mergers, compliance with ratings agency requirements and interfund lending activities.
Tax Services
“Tax services” include, but are not limited to, the review and signing of the Funds’ federal tax returns, the review of required distributions by the Funds and consultations regarding tax matters such as the tax treatment of new investments or the impact of new regulations. The Audit Committees will scrutinize carefully the retention of the Auditor in connection with a transaction initially recommended by the Auditor, the major business purpose of which may be tax avoidance or the tax treatment of which may not be supported in the Internal Revenue Code and related regulations. The Audit Committees will consult with the Funds’ Treasurer (or his or her designee) and may consult with outside counsel or advisors as necessary to ensure the consistency of Tax services rendered by the Auditor with the foregoing policy.
No Auditor shall represent any Fund or any Service Affiliate before a tax court, district court or federal court of claims.
Under rules adopted by the Public Company Accounting Oversight Board and approved by the SEC, in connection with seeking Audit Committees’ pre-approval of permissible Tax services, the Auditor shall:
| | 1. | Describe in writing to the Audit Committees, which writing may be in the form of the proposed engagement letter: |
| | a. | The scope of the service, the fee structure for the engagement, and any side letter or amendment to the engagement letter, or any other agreement between the Auditor and the Fund, relating to the service; and |
| | b. | Any compensation arrangement or other agreement, such as a referral agreement, a referral fee or fee-sharing arrangement, between the Auditor and any person (other than the Fund) with respect to the promoting, marketing, or recommending of a transaction covered by the service; |
| | 2. | Discuss with the Audit Committees the potential effects of the services on the independence of the Auditor; and |
| | 3. | Document the substance of its discussion with the Audit Committees. |
All Other Auditor Services
The Audit Committees may pre-approve non-audit services classified as “All other services” that are not categorically prohibited by the SEC, as listed in Exhibit 1 to this policy.
Pre-Approval Fee Levels or Established Amounts
Pre-approval of estimated fees or established amounts for services to be provided by the Auditor under general or specific pre-approval policies will be set periodically by the Audit Committees. Any proposed fees exceeding 110% of the maximum estimated pre-approved fees or established amounts for pre-approved audit and non-audit services will be reported to the Audit Committees at the quarterly Audit Committees meeting and will require specific approval by the Audit Committees before payment is made. The Audit Committees will always factor in the overall relationship of fees for audit and non-audit services in determining whether to pre-approve any such services and in determining whether to approve any additional fees exceeding 110% of the maximum pre-approved fees or established amounts for previously pre-approved services.
Procedures
Generally on an annual basis, Invesco Advisers, Inc. (“Invesco”) will submit to the Audit Committees for general pre-approval, a list of non-audit services that the Funds or Service Affiliates of the Funds may request from the Auditor. The list will describe the non-audit services in reasonable detail and will include an estimated range of fees and such other information as the Audit Committee may request.
Each request for services to be provided by the Auditor under the general pre-approval of the Audit Committees will be submitted to the Funds’ Treasurer (or his or her designee) and must include a detailed description of the services to be rendered. The Treasurer or his or her designee will ensure that such services are included within the list of services that have received the general pre-approval of the Audit Committees. The Audit Committees will be informed at the next quarterly scheduled Audit Committees meeting of any such services for which the Auditor rendered an invoice and whether such services and fees had been pre-approved and if so, by what means.
Each request to provide services that require specific approval by the Audit Committees shall be submitted to the Audit Committees jointly by the Fund’s Treasurer or his or her designee and the Auditor, and must include a joint statement that, in their view, such request is consistent with the policies and procedures and the SEC Rules.
Each request to provide tax services under either the general or specific pre-approval of the Audit Committees will describe in writing: (i) the scope of the service, the fee structure for the engagement, and any side letter or amendment to the engagement letter, or any other agreement between the Auditor and the audit client, relating to the service; and (ii) any compensation arrangement or other agreement between the Auditor and any person (other than the audit client) with respect to the promoting, marketing, or recommending of a transaction covered by the service. The Auditor will discuss with the Audit Committees the potential effects of the services on the Auditor’s independence and will document the substance of the discussion.
Non-audit services pursuant to the de minimis exception provided by the SEC Rules will be promptly brought to the attention of the Audit Committees for approval, including documentation that each of the conditions for this exception, as set forth in the SEC Rules, has been satisfied.
On at least an annual basis, the Auditor will prepare a summary of all the services provided to any entity in the investment company complex as defined in section 2-01(f)(14) of Regulation S-X in sufficient detail as to the nature of the engagement and the fees associated with those services.
The Audit Committees have designated the Funds’ Treasurer to monitor the performance of all services provided by the Auditor and to ensure such services are in compliance with these policies and procedures. The Funds’ Treasurer will report to the Audit Committees on a periodic basis as to the results of such monitoring. Both the Funds’ Treasurer and management of Invesco will immediately report to the chairman of the Audit Committees any breach of these policies and procedures that comes to the attention of the Funds’ Treasurer or senior management of Invesco.
Exhibit 1 to Pre-Approval of Audit and Non-Audit Services Policies and Procedures
Conditionally Prohibited Non-Audit Services (not prohibited if the Fund can reasonably conclude that the results of the service would not be subject to audit procedures in connection with the audit of the Fund’s financial statements)
| | • | | Bookkeeping or other services related to the accounting records or financial statements of the audit client |
| | • | | Financial information systems design and implementation |
| | • | | Appraisal or valuation services, fairness opinions, or contribution-in-kind reports |
| | • | | Internal audit outsourcing services |
Categorically Prohibited Non-Audit Services
| | • | | Broker-dealer, investment adviser, or investment banking services |
| | • | | Expert services unrelated to the audit |
| | • | | Any service or product provided for a contingent fee or a commission |
| | • | | Services related to marketing, planning, or opining in favor of the tax treatment of confidential transactions or aggressive tax position transactions, a significant purpose of which is tax avoidance |
| | • | | Tax services for persons in financial reporting oversight roles at the Fund |
| | • | | Any other service that the Public Company Oversight Board determines by regulation is impermissible. |
| ITEM 5. | AUDIT COMMITTEE OF LISTED REGISTRANTS. |
Not applicable.
| ITEM 6. | SCHEDULE OF INVESTMENTS. |
Investments in securities of unaffiliated issuers is included as part of the reports to stockholders filed under Item 1 of this Form.
| ITEM 7. | DISCLOSURE OF PROXY VOTING POLICIES AND PROCEDURES FOR CLOSED-END MANAGEMENT INVESTMENT COMPANIES. |
Not applicable.
| ITEM 8. | PORTFOLIO MANAGERS OF CLOSED-END MANAGEMENT COMPANIES. |
Not applicable.
| ITEM 9. | PURCHASES OF EQUITY SECURITIES BY CLOSED-END MANAGEMENT INVESTMENT COMPANY AND AFFILIATED PURCHASERS. |
Not applicable.
| ITEM 10. | SUBMISSION OF MATTERS TO A VOTE OF SECURITY HOLDERS. |
None
| ITEM 11. | CONTROLS AND PROCEDURES. |
| (a) | As of February 12, 2015, an evaluation was performed under the supervision and with the participation of the officers of the Registrant, including the PEO and PFO, to assess the effectiveness of the Registrant’s disclosure controls and procedures, as that term is defined in Rule 30a-3(c) under the Investment Company Act of 1940 (the “Act”), as amended. Based on that evaluation, the Registrant’s officers, including the PEO and PFO, concluded that, as of February 12, 2015, the Registrant’s disclosure controls and procedures were reasonably designed to ensure: (1) that information required to be disclosed by the Registrant on Form N-CSR is recorded, processed, summarized and reported within the time periods specified by the rules and forms of the Securities and Exchange Commission; and (2) that material information relating to the Registrant is made known to the PEO and PFO as appropriate to allow timely decisions regarding required disclosure. |
| (b) | There have been no changes in the Registrant’s internal control over financial reporting (as defined in Rule 30a-3(d) under the Act) that occurred during the second fiscal quarter of the period covered by this report that have materially affected, or are reasonably likely to materially affect, the Registrant’s internal control over financial reporting. |
| 12(a) (2) | Certifications of principal executive officer and principal financial officer as required by Rule 30a-2(a) under the Investment Company Act of 1940. |
| 12(b) | Certifications of principal executive officer and principal financial officer as required by Rule 30a-2(b) under the Investment Company Act of 1940. |
SIGNATURES
Pursuant to the requirements of the Securities Exchange Act of 1934 and the Investment Company Act of 1940, the Registrant has duly caused this report to be signed on its behalf by the undersigned, thereunto duly authorized.
Registrant: AIM Funds Group (Invesco Funds Group)
| | |
| By: | | /s/ Philip A. Taylor |
| | Philip A. Taylor |
| | Principal Executive Officer |
| |
| Date: | | March 6, 2015 |
Pursuant to the requirements of the Securities and Exchange Act of 1934 and the Investment Company Act of 1940, this report has been signed below by the following persons on behalf of the Registrant and in the capacities and on the dates indicated.
| | |
| By: | | /s/ Philip A. Taylor |
| | Philip A. Taylor |
| | Principal Executive Officer |
| |
| Date: | | March 6, 2015 |
| | |
| By: | | /s/ Sheri Morris |
| | Sheri Morris |
| | Principal Financial Officer |
| |
| Date: | | March 6, 2015 |
EXHIBIT INDEX
| | |
| 12(a) (1) | | Code of Ethics. |
| |
| 12(a) (2) | | Certifications of principal executive officer and principal financial officer as required by Rule 30a-2(a) under the Investment Company Act of 1940. |
| |
| 12(a) (3) | | Not applicable. |
| |
| 12(b) | | Certifications of principal executive officer and principal financial officer as required by Rule 30a-2(b) under the Investment Company Act of 1940. |