| | | | |
| | | | OMB APPROVAL |
| | | | OMB Number: 3235-0570 |
| | | | Expires: March 31, 2017 |
| | | | Estimated average burden |
| | | | hours per response: 20. 6 |
UNITED STATES
SECURITIES AND EXCHANGE COMMISSION
Washington, D.C. 20549
FORM N-CSR
CERTIFIED SHAREHOLDER REPORT OF REGISTERED
MANAGEMENT INVESTMENT COMPANIES
Investment Company Act file number 811-01540
AIM Funds Group (Invesco Funds Group)
(Exact name of registrant as specified in charter)
11 Greenway Plaza, Suite 1000 Houston, Texas 77046
(Address of principal executive offices) (Zip code)
Sheri Morris 11 Greenway Plaza, Suite 1000 Houston, Texas 77046
(Name and address of agent for service)
Registrant’s telephone number, including area code: (713) 626-1919
Date of fiscal year end: 12/31
Date of reporting period: 12/31/16
Item 1. Report to Stockholders.
| | | | |
 | | Annual Report to Shareholders | | December 31, 2016 |
| | Invesco European Small Company Fund Nasdaq: A: ESMAX ∎ B: ESMBX ∎ C: ESMCX ∎ Y: ESMYX |

Letters to Shareholders
| | | | |

Philip Taylor | | | | Dear Shareholders: This annual report includes information about your Fund, including performance data and a complete list of its investments as of the close of the reporting period. Inside is a discussion of how your Fund was managed and the factors that affected its performance during the reporting period. The reporting period began with significant stock market volatility in the US and abroad; this volatility was the result of investor uncertainty about global economic growth and monetary policy. After recovering, markets declined sharply following UK voters’ decision in June to leave the European Union. Relatively quickly, however, markets recovered, reaching record highs later in the summer. Demand was strong for income-producing investments, particularly those |
perceived to be lower risk; this benefited bonds as well as dividend-paying stocks for much of the reporting period. While economic news in the US was generally positive during the reporting period, news overseas was less upbeat. The European Central Bank and central banks in China and Japan – as well as other countries – maintained extraordinarily accommodative monetary policies in response to economic weakness. After months of uncertainty, the surprise outcome of the US presidential election in November triggered a major stock market rally, with most market indexes reaching new record highs in December. As expected, the US Federal Reserve raised interest rates in December – its only rate increase during the reporting period and only its second increase since 2006. The Fed cited optimistic economic data for its decision, and Fed-watchers suggested that future rate increases might be announced more quickly than previously forecast.
Short-term market volatility can prompt some investors to abandon their investment plans – and can cause others to settle for whatever returns the market has to offer. The investment professionals at Invesco, in contrast, invest with high conviction. This means that, no matter the asset class or the strategy, each investment team has a passion to exceed. We want to help investors achieve better outcomes, such as seeking higher returns, helping mitigate risk and generating income. Of course, investing with high conviction can’t guarantee a profit or ensure success; no investment strategy can. To learn more about how we invest with high conviction, visit invesco.com/HighConviction.
You, too, can invest with high conviction by maintaining a long-term investment perspective and by working with your financial adviser on a regular basis. During periods of short-term market volatility or uncertainty, your financial adviser can keep you focused on your long-term investment goals – a new home, a child’s college education or a secure retirement. He or she also can share research about the economy, the markets and individual investment options.
Visit our website for more information on your investments
Our website, invesco.com/us, offers a wide range of market insights and investment perspectives. On the website, you’ll find detailed information about our funds, including performance, holdings and portfolio manager commentaries. You can access information about your account by completing a simple, secure online registration. Click on the “Need to register” link in the “Account Access” box on our homepage to get started.
In addition to the resources accessible on our website and through our mobile app, you can obtain timely updates to help you stay informed about the markets, the economy and investing by connecting with Invesco on Twitter, LinkedIn or Facebook. You can access our blog at blog.invesco.us.com. Our goal is to provide you the information you want, when and where you want it.
Finally, I’m pleased to share with you Invesco’s commitment to both the Principles for Responsible Investment and to considering environmental, social and governance issues in our robust investment process. I invite you to learn more at invesco.com/esg.
Have questions?
For questions about your account, contact an Invesco client services representative at 800 959 4246. For Invesco-related questions or comments, please email me directly at phil@invesco.com.
All of us at Invesco look forward to serving your investment management needs. Thank you for investing with us.
Sincerely,

Philip Taylor
Senior Managing Director, Invesco Ltd.
2 Invesco European Small Company Fund
| | | | |

Bruce Crockett | | | | Dear Fellow Shareholders: Among the many important lessons I’ve learned in more than 40 years in a variety of business endeavors is the value of a trusted advocate. As independent chair of the Invesco Funds Board, I can assure you that the members of the Board are strong advocates for the interests of investors in Invesco’s mutual funds. We work hard to represent your interests through oversight of the quality of the investment management services your funds receive and other matters important to your investment, including but not limited to: ∎ Ensuring that Invesco offers a diverse lineup of mutual funds that your financial adviser can use to strive to meet your financial needs as your investment goals change over time. ∎ Monitoring how the portfolio management teams of the Invesco funds are performing in light of changing economic and market conditions. |
| ∎ | | Assessing each portfolio management team’s investment performance within the context of the investment strategy described in the fund’s prospectus. |
| ∎ | | Monitoring for potential conflicts of interests that may impact the nature of the services that your funds receive. |
We believe one of the most important services we provide our fund shareholders is the annual review of the funds’ advisory and sub-advisory contracts with Invesco Advisers and its affiliates. This review is required by the Investment Company Act of 1940 and focuses on the nature and quality of the services Invesco provides as the adviser to the Invesco funds and the reasonableness of the fees that it charges for those services. Each year, we spend months carefully reviewing information received from Invesco and a variety of independent sources, such as performance and fee data prepared by Lipper, Inc. (a subsidiary of Broadridge Financial Solutions, Inc.), an independent, third-party firm widely recognized as a leader in its field. We also meet with our independent legal counsel and other independent advisers to review and help us assess the information that we have received. Our goal is to assure that you receive quality investment management services for a reasonable fee.
I trust the measures outlined above provide assurance that you have a worthy advocate when it comes to choosing the Invesco Funds. As always, please contact me at bruce@brucecrockett.com with any questions or concerns you may have. On behalf of the Board, we look forward to continuing to represent your interests and serving your needs.
Sincerely,

Bruce L. Crockett
Independent Chair
Invesco Funds Board of Trustees
3 Invesco European Small Company Fund
Management’s Discussion of Fund Performance
Performance summary
For the year ended December 31, 2016, Class A shares of Invesco European Small Company Fund (the Fund), at net asset value (NAV), outperformed the MSCI Europe Small Cap Index, the Fund’s style-specific benchmark.
Your Fund’s long-term performance appears later in this report.
Fund vs. Indexes
Total returns, 12/31/15 to 12/31/16, at net asset value (NAV). Performance shown does not include applicable contingent deferred sales charges (CDSC) or front-end sales charges, which would have reduced performance.
| | | | | |
| Class A Shares | | | | 8.61 | % |
| Class B Shares | | | | 7.88 | |
| Class C Shares | | | | 7.87 | |
| Class Y Shares | | | | 8.95 | |
| MSCI Europe Index▼ (Broad Market Index) | | | | -0.40 | |
| MSCI Europe Small Cap Index▼ (Style-Specific Index) | | | | -2.07 | |
| Lipper European Funds Index⬛ (Peer Group Index) | | | | -3.20 | |
Source(s): ▼FactSet Research Systems Inc.; ⬛Lipper Inc.
Market conditions and your Fund
Global equities began 2016 on a negative note, driven by investor concerns about economic weakness in China, falling oil prices and uncertainty over the US Federal Reserve’s (the Fed) monetary policy. Equity markets rebounded strongly in February. Central banks, including the Fed, the European Central Bank and the Bank of Japan, soothed investors’ nerves throughout the reporting period with accommodative policies and dovish rhetoric. Other factors contributing to investor sentiment included rebounding oil prices and, in the US, an improving housing market and employment picture. But 2016 was volatile and full of surprises – several of them involving elections.
In June, the Brexit – the decision by UK voters to leave the European Union – caused global markets to decline sharply, but only briefly. Stocks in economically sensitive sectors, including energy and financials, were hardest hit, and investors flocked to the perceived safety of US
Treasuries and more defensive, dividend-paying equities. Following the surprise outcome of the US presidential election in November, US stocks surged, led by the health care and financials sectors, which might benefit from reduced regulation in these sectors. Non-US equities, particularly emerging market equities, traded lower on the news due to currency weakness and the prospect of a less favorable trade environment.
Also in November, OPEC agreed to cut production for the first time in eight years; the agreement helped support higher oil prices and energy stocks. As expected, the Fed raised interest rates in December 2016, its only rate hike during the reporting period. For the reporting period as a whole, US equities outperformed non-US equities. Emerging markets, supported by the Fed’s delayed interest rate increases and a rally in commodities, outperformed their developed-market counterparts (excluding the US) – a reversal from previous years.
During the reporting period, the Fund’s overweight exposure to the information technology (IT) sector strongly contributed to the Fund’s performance relative to its style-specific benchmark. Stock selection in the consumer discretionary and financials sectors also contributed to the Fund’s relative results. The Fund’s meaningful underweight allocation in the materials sector detracted from the Fund’s relative performance. Fund holdings in the energy sector and an underweight allocation in the utilities sector also detracted from relative results during the year.
On a geographic basis, Fund holdings in France and Italy outperformed those of the Fund’s style-specific benchmark, and were among the most significant contributors to the Fund’s relative performance. The Fund’s underweight exposure to Finland and stock selection in Norway and Germany were among the most significant detractors from relative results during the year. As a reminder, the Fund’s country and sector exposures are shaped by the stocks we select based on individual investment merits, rather than by making top-down/macroeconomic-based allocation decisions.
From an individual securities perspective, Linedata Services was the most significant contributor to Fund performance during the year. Linedata Services is a French company that provides financial software for the investment management, banking and credit industries. The company has a substantial customer base with several well-known asset managers as clients. The company has what we believe to be an effective management team, which has increased profit margins while growing recurring revenues.
| | | | | |
| By sector | | % of total net assets |
| | | | | |
| |
| Industrials | | | | 26.3 | % |
| Information Technology | | | | 20.3 | |
| Financials | | | | 13.0 | |
| Consumer Discretionary | | | | 10.9 | |
| Consumer Staples | | | | 9.5 | |
| Energy | | | | 6.3 | |
| Health Care | | | | 3.5 | |
| Real Estate | | | | 1.8 | |
| Telecommunication Services | | | | 0.6 | |
Money Market Funds Plus Other Assets Less Liabilities | | | | 7.8 | |
| | | | | | | |
| | |
| 1. | | Linedata Services | | | | 5.2 | % |
| 2. | | Total Produce PLC | | | | 3.3 | |
| 3. | | Kardex AG | | | | 3.1 | |
| 4. | | Tessi S.A. | | | | 3.1 | |
| 5. | | Danieli & C. Officine Meccaniche S.p.A.-Savings Shares | | | | 3.1 | |
| 6. | | Israel Discount Bank Ltd.-Class A | | | | 2.4 | |
| 7. | | Micro Focus International PLC | | | | 2.4 | |
| 8. | | Societatea Nationala de Gaze Naturale ROMGAZ S.A. | | | | 2.3 | |
| 9. | | Fyffes PLC | | | | 2.2 | |
| 10. | | Constuctions Industrielles de la Mediterranee S.A. | | | | 2.0 | |
| | | | | |
| Total Net Assets | | | $ | 481.1 million | |
| |
| Total Number of Holdings* | | | | 74 | |
The Fund’s holdings are subject to change, and there is no assurance that the Fund will continue to hold any particular security.
*Excluding money market fund holdings.
Data presented here are as of December 31, 2016.
4 Invesco European Small Company Fund
In contrast, Fairpoint Group was the most significant detractor from Fund performance over the year. The UK-based company provides professional services including, legal services, claims management services and debt solutions. Fair-point Group’s shares declined in December after the company announced that its 2016 results would likely be below market expectations and that the company may consider suspending future dividend payments. At the end of December, the company’s chief executive officer stepped down from the board.
Over the year, we continued to look for opportunities to improve the growth and quality characteristics of the Fund. As disconcerting as volatility may be, we believe it creates long-term opportunities for our shareholders. It’s rare to find a thriving business at a compelling valuation when everything is going right; rather, those valuations typically occur when fear dominates the market. We added several new holdings to the portfolio during the year, including UK outsourcing company Staffline Group, Swiss industrial company OC Oerlikon, French marine engineering company Gaztransport et Technigaz, online marketing company Xlmedia, UK manufacturer Eurocell, UK engineering services company Renew Holdings and German financials company Hypoport. We also trimmed or sold Fund holdings with earnings, quality and valuation (EQV) characteristics that were no longer as compelling as when we first initiated positions in them, including Nemetschek, Semperit, IFG Group, Tribal Group and Prosafe.
As always, regardless of the macroeconomic environment, we remain focused on a bottom-up investment approach of identifying attractive companies that fit our EQV-focused investment process. We continue to look for high-quality growth companies that exhibit the following characteristics: strong organic revenue growth, high returns on capital, pricing power, strong balance sheets, cash generation, effective capital allocation and reasonable valuations. In addition, we continue to favor companies that are resilient in weak economic environments. We believe that this balanced EQV-focused approach may help deliver attractive returns over the long term.
We thank you for your continued investment in Invesco European Small Company Fund.
The views and opinions expressed in management’s discussion of Fund performance are those of Invesco Advisers, Inc. These views and opinions are subject to change at any time based on factors such as market and economic conditions. These views and opinions may not be relied upon as investment advice or recommendations, or as an offer for a particular security. The information is not a complete analysis of every aspect of any market, country, industry, security or the Fund. Statements of fact are from sources considered reliable, but Invesco Advisers, Inc. makes no representation or warranty as to their completeness or accuracy. Although historical performance is no guarantee of future results, these insights may help you understand our investment management philosophy.
See important Fund and, if applicable, index disclosures later in this report.
| | |
 | | Jason Holzer Chartered Financial Analyst, Portfolio Manager, is lead manager of Invesco European Small |
| Company Fund. He joined Invesco in 1996. Mr. Holzer earned a BA in quantitative economics and an MS in engineering economic systems from Stanford University. |
| |
 | | Borge Endresen Chartered Financial Analyst, Portfolio Manager, is manager of Invesco European Small Company Fund. He |
joined Invesco in 1999. Mr. Endresen earned a BS in finance from the University of Oregon and an MBA from The University of Texas at Austin. |
5 Invesco European Small Company Fund
Your Fund’s Long-Term Performance
Results of a $10,000 Investment – Oldest Share Class(es)
Fund and index data from 12/31/06
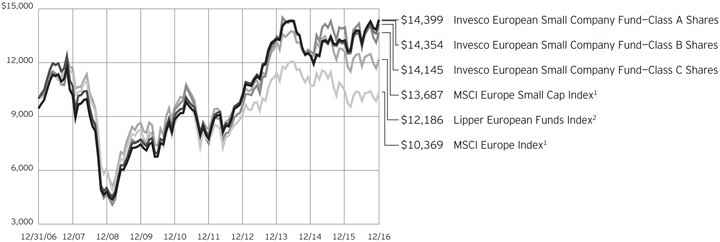
| 1 | Source: FactSet Research Systems Inc. |
Past performance cannot guarantee comparable future results.
The data shown in the chart include reinvested distributions, applicable sales charges and Fund expenses including management fees. Results for Class B shares are calculated as if a hypothetical
shareholder had liquidated his entire investment in the Fund at the close of the reporting period and paid the contingent deferred sales charges, if applicable. Index results include reinvested dividends, but they do not reflect sales charges. Performance of the peer group,
if applicable, reflects fund expenses and management fees; performance of a market index does not. Performance shown in the chart and table(s) does not reflect deduction of taxes a shareholder would pay on Fund distributions or sale of Fund shares.
6 Invesco European Small Company Fund
| | | | | |
Average Annual Total Returns | | | | | |
| As of 12/31/16, including maximum applicable sales charges | | | | | |
| | | | | |
| |
| Class A Shares | | | | | |
| Inception (8/31/00) | | | | 10.46 | % |
| 10 Years | | | | 3.71 | |
| 5 Years | | | | 11.92 | |
| 1 Year | | | | 2.64 | |
| |
| Class B Shares | | | | | |
| Inception (8/31/00) | | | | 10.46 | % |
| 10 Years | | | | 3.68 | |
| 5 Years | | | | 12.10 | |
| 1 Year | | | | 2.88 | |
| |
| Class C Shares | | | | | |
| Inception (8/31/00) | | | | 10.05 | % |
| 10 Years | | | | 3.53 | |
| 5 Years | | | | 12.35 | |
| 1 Year | | | | 6.87 | |
| |
| Class Y Shares | | | | | |
| 10 Years | | | | 4.53 | % |
| 5 Years | | | | 13.48 | |
| 1 Year | | | | 8.95 | |
Class Y shares incepted on October 3, 2008. Performance shown prior to that date is that of Class A shares and includes the 12b-1 fees applicable to Class A shares.
The performance data quoted represent past performance and cannot guarantee comparable future results; current performance may be lower or higher. Please visit invesco.com/performance for the most recent month-end performance. Performance figures reflect reinvested distributions, changes in net asset value and the effect of the maximum sales charge unless otherwise stated. Investment return and principal value will fluctuate so that you may have a gain or loss when you sell shares.
The net annual Fund operating expense ratio set forth in the most recent Fund prospectus as of the date of this report for Class A, Class B, Class C and Class Y shares was 1.46%, 2.21%, 2.21% and 1.21%, respectively.1 The total annual Fund operating expense ratio set forth in the most recent Fund prospectus as of the date of this report for Class A, Class B, Class C and Class Y shares was 1.48%, 2.23%, 2.23% and 1.23%, respectively. The expense ratios presented above may vary from
the expense ratios presented in other sections of this report that are based on expenses incurred during the period covered by this report.
Class A share performance reflects the maximum 5.50% sales charge, and Class B and Class C share performance reflects the applicable contingent deferred sales charge (CDSC) for the period involved. The CDSC on Class B shares declines from 5% beginning at the time of purchase to 0% at the beginning of the seventh year. The CDSC on Class C shares is 1% for the first year after purchase. Class Y shares do not have a front-end sales charge or a CDSC; therefore, performance is at net asset value.
The performance of the Fund’s share classes will differ primarily due to different sales charge structures and class expenses.
Fund performance reflects any applicable fee waivers and/or expense reimbursements. Had the adviser not waived fees and/or reimbursed expenses currently or in the past, returns would have been lower. See current prospectus for more information.
| 1 | Total annual Fund operating expenses after any contractual fee waivers and/or expense reimbursements by the adviser in effect through at least June 30, 2018. See current prospectus for more information. |
7 Invesco European Small Company Fund
Invesco European Small Company Fund’s investment objective is long-term growth of capital.
| ∎ | | Unless otherwise stated, information presented in this report is as of December 31, 2016, and is based on total net assets. |
| ∎ | | Unless otherwise noted, all data provided by Invesco. |
| ∎ | | To access your Fund’s reports/prospectus, visit invesco.com/fundreports. |
About share classes
| ∎ | | Class B shares may not be purchased for new or additional investments. Please see the prospectus for more information. |
| ∎ | | Class Y shares are available to only certain investors. Please see the prospectus for more information. |
Principal risks of investing in the Fund
| ∎ | | Depositary receipts risk. Investing in depositary receipts involves the same risks as direct investments in foreign securities. In addition, the underlying issuers of certain depositary receipts are under no obligation to distribute shareholder communications or pass through any voting rights with respect to the deposited securities to the holders of such receipts. The Fund may therefore receive less timely information or have less control than if it invested directly in the foreign issuer. |
| ∎ | | Derivatives risk. The value of a derivative instrument depends largely on (and is derived from) the value of an underlying security, currency, commodity, interest rate, index or other asset (each referred to as an underlying asset). In addition to risks relating to the underlying assets, the use of derivatives may include other, possibly greater, risks, including counterparty, leverage and liquidity risks. Counter-party risk is the risk that the counter-party to the derivative contract will default on its obligation to pay the Fund the amount owed or otherwise perform under the derivative contract. Derivatives create leverage risk because they do not require payment up front equal to the economic exposure created by owning the derivative. As a result, an adverse change in the value of the underlying asset could result in the Fund sustaining a loss that is substantially greater than the amount invested in the derivative, which may make the Fund’s returns more volatile and increase the risk of loss. Derivative instruments may also be less liquid than |
| | | more traditional investments and the Fund may be unable to sell or close out its derivative positions at a desirable time or price. This risk may be more acute under adverse market conditions, during which the Fund may be most in need of liquidating its derivative positions. Derivatives may also be harder to value, less tax efficient and subject to changing government regulation that could impact the Fund’s ability to use certain derivatives or their cost. Also, derivatives used for hedging or to gain or limit exposure to a particular market segment may not provide the expected benefits, particularly during adverse market conditions. |
| ∎ | | Emerging markets securities risk. Emerging markets (also referred to as developing markets) are generally subject to greater market volatility, political, social and economic instability, uncertain trading markets and more governmental limitations on foreign investment than more developed markets. In addition, companies operating in emerging markets may be subject to lower trading volume and greater price fluctuations than companies in more developed markets. Securities law and the enforcement of systems of taxation in many emerging market countries may change quickly and unpredictably. In addition, investments in emerging markets securities may also be subject to additional transaction costs, delays in settlement procedures, and lack of timely information. |
| ∎ | | Foreign securities risk. The Fund’s foreign investments may be adversely affected by political and social instability, changes in economic or taxation policies, difficulty in enforcing obligations, decreased liquidity or increased volatility. Foreign investments also involve the risk of the possible seizure, nationalization or expropriation of the issuer or foreign deposits (in which the Fund could lose its entire investments in a certain market) and the possible adoption of foreign governmental restrictions such as exchange controls. |
This report must be accompanied or preceded by a currently effective Fund prospectus, which contains more complete information, including sales charges and expenses. Investors should read it carefully before investing.
NOT FDIC INSURED | MAY LOSE VALUE | NO BANK GUARANTEE
| | | Unless the Fund has hedged its foreign securities risk, foreign securities risk also involves the risk of negative foreign currency rate fluctuations, which may cause the value of securities denominated in such foreign currency (or other instruments through which the Fund has exposure to foreign currencies) to decline in value. Currency exchange rates may fluctuate significantly over short periods of time. Currency hedging strategies, if used, are not always successful. |
| ∎ | | Geographic focus risk. The Fund may from time to time invest a substantial amount of its assets in securities of issuers located in a single country or a limited number of countries. Adverse economic, political or social conditions in those countries may therefore have a significant negative impact on the Fund’s investment performance. |
| ∎ | | Growth investing risk. Growth stocks tend to be more expensive relative to the issuing company’s earnings or assets compared with other types of stock. As a result, they tend to be more sensitive to changes in, or investors’ expectations of, the issuing company’s earnings and can be more volatile. |
| ∎ | | Investing in the European Union risk. Investments in certain countries in the European Union are susceptible to high economic risks associated with high levels of debt, such as investments in sovereign debt of Greece, Italy and Spain. Efforts of the member states to further unify their economic and monetary policies may increase the potential for the downward movement of one member state’s market to cause a similar effect on other member states’ markets. Separately, the European Union faces issues involving its membership, structure, procedures and policies. The exit of one or more member states from the European Union, such as the United Kingdom (UK) which has announced its intention to exit, would place its currency and banking system in jeopardy. The exit by the UK or other member states will likely result in increased volatility, illiquidity and potentially lower economic growth in the affected markets, which will adversely affect the Fund’s investments. |
8 Invesco European Small Company Fund
| ∎ | | Management risk. The Fund is actively managed and depends heavily on the Adviser’s judgment about markets, interest rates or the attractiveness, relative values, liquidity, or potential appreciation of particular investments made for the Fund’s portfolio. The Fund could experience losses if these judgments prove to be incorrect. Additionally, legislative, regulatory, or tax developments may adversely affect management of the Fund and, therefore, the ability of the Fund to achieve its investment objective. |
| ∎ | | Market risk. The market values of the Fund’s investments, and therefore the value of the Fund’s shares, will go up and down, sometimes rapidly or unpredictably. Market risk may affect a single issuer, industry or section of the economy, or it may affect the market as a whole. Individual stock prices tend to go up and down more dramatically than those of certain other types of investments, such as bonds. During a general downturn in the financial markets, multiple asset classes may decline in value. When markets perform well, there can be no assurance that specific investments held by the Fund will rise in value. |
| ∎ | | Preferred securities risk. Preferred securities are subject to issuer-specific and market risks applicable generally to equity securities. Preferred securities also may be subordinated to bonds or other debt instruments, subjecting them to a greater risk of non-payment, may be less liquid than many other securities, such as common stocks, and generally offer no voting rights with respect to the issuer. |
| ∎ | | Small- and mid-capitalization companies risks. Small- and mid-capitalization companies tend to be more vulnerable to changing market conditions, may have little or no operating history or track record of success, and may have more limited product lines and markets, less experienced management and fewer financial resources than larger companies. These companies’ securities may be more volatile and less liquid than those of more established companies, and their returns may vary, sometimes significantly, from the overall securities market. |
About indexes used in this report
| ∎ | | The MSCI Europe Index is an unmanaged index considered representative of stocks of developed European countries. The index is computed using the net return, which withholds applicable taxes for non-resident investors. |
| ∎ | | The MSCI Europe Small Cap Index is an unmanaged index considered representative of small-cap European stocks. The index is computed using the net return, which withholds applicable taxes for non-resident investors. |
| ∎ | | The Lipper European Funds Index is an unmanaged index considered representative of European funds tracked by Lipper. |
| ∎ | | The Fund is not managed to track the performance of any particular index, including the index(es) described here, and consequently, the performance of the Fund may deviate significantly from the performance of the index(es). |
| ∎ | | A direct investment cannot be made in an index. Unless otherwise indicated, index results include reinvested dividends, and they do not reflect sales charges. Performance of the peer group, if applicable, reflects fund expenses; performance of a market index does not. |
Other information
| ∎ | | The returns shown in management’s discussion of Fund performance are based on net asset values (NAVs) calculated for shareholder transactions. Generally accepted accounting principles require adjustments to be made to the net assets of the Fund at period end for financial reporting purposes, and as such, the NAVs for shareholder transactions and the returns based on those NAVs may differ from the NAVs and returns reported in the Financial Highlights. |
| ∎ | | Industry classifications used in this report are generally according to the Global Industry Classification Standard, which was developed by and is the exclusive property and a service mark of MSCI Inc. and Standard & Poor’s. |
9 Invesco European Small Company Fund
Schedule of Investments
December 31, 2016
| | | | | | | | |
| | | Shares | | | Value | |
Common Stocks & Other Equity Interests–92.21% | |
| Belgium–2.44% | |
Sioen Industries N.V. | | | 251,000 | | | $ | 7,397,322 | |
Van de Velde N.V. | | | 62,106 | | | | 4,324,857 | |
| | | | | | | | 11,722,179 | |
|
| France–27.58% | |
Caisse Regionale de Credit Agricole Mutuel Brie Picardie — CCI | | | 94,000 | | | | 2,313,210 | |
Caisse Regionale de Credit Agricole Mutuel d’Ile-de-France | | | 55,078 | | | | 4,590,830 | |
Caisse Regionale de Credit Agricole Mutuel de Normandie-Seine — CCI | | | 46,988 | | | | 5,062,441 | |
Caisse Regionale de Credit Agricole Mutuel Nord de France — CCI | | | 365,844 | | | | 7,046,765 | |
Caisse Regionale de Credit Agricole Mutuel Sud Rhone Alpes — CCI | | | 19,700 | | | | 3,406,592 | |
Constuctions Industrielles de la Mediterranee S.A. | | | 80,972 | | | | 9,751,682 | |
Gaztransport & Technigaz S.A. | | | 120,000 | | | | 5,178,498 | |
GEA | | | 49,000 | | | | 4,783,577 | |
Gerard Perrier Industrie S.A. | | | 169,171 | | | | 7,140,244 | |
Infotel S.A. | | | 165,142 | | | | 7,095,341 | |
Linedata Services(a) | | | 506,159 | | | | 24,917,076 | |
Maisons France Confort S.A. | | | 112,990 | | | | 5,647,873 | |
Manutan International | | | 93,000 | | | | 6,822,734 | |
Metropole Television S.A. | | | 237,302 | | | | 4,413,475 | |
Neurones | | | 280,000 | | | | 6,589,805 | |
Tessi S.A. | | | 88,294 | | | | 14,984,524 | |
Total Gabon | | | 6,432 | | | | 1,056,459 | |
Trigano S.A. | | | 100,188 | | | | 7,838,313 | |
Wavestone | | | 42,444 | | | | 4,056,438 | |
| | | | | | | | 132,695,877 | |
|
| Germany–5.60% | |
CANCOM S.E. | | | 50,310 | | | | 2,373,496 | |
CENIT AG | | | 230,151 | | | | 4,837,641 | |
HolidayCheck Group AG(b) | | | 560,501 | | | | 1,384,568 | |
Hypoport AG(b) | | | 31,030 | | | | 2,539,364 | |
MorphoSys AG(b) | | | 101,912 | | | | 5,229,289 | |
Nexus AG | | | 230,566 | | | | 4,344,012 | |
SMT Scharf AG(b) | | | 89,110 | | | | 1,299,029 | |
Takkt AG | | | 218,690 | | | | 4,955,813 | |
| | | | | | | | 26,963,212 | |
|
| Greece–3.23% | |
Autohellas S.A. | | | 207,551 | | | | 2,571,248 | |
Hellenic Exchanges — Athens Stock Exchange S.A. | | | 940,000 | | | | 4,838,151 | |
Karelia Tobacco Co. Inc. S.A. | | | 7,255 | | | | 1,982,371 | |
Metka Industrial-Construction S.A. | | | 914,192 | | | | 6,139,045 | |
| | | | | | | | 15,530,815 | |
| | | | | | | | |
| | | Shares | | | Value | |
| Ireland–8.36% | |
CPL Resources PLC | | | 929,792 | | | $ | 5,245,578 | |
Fyffes PLC | | | 4,410,483 | | | | 10,491,494 | |
Origin Enterprises PLC | | | 1,330,237 | | | | 8,654,271 | |
Total Produce PLC | | | 7,646,323 | | | | 15,814,590 | |
| | | | | | | | 40,205,933 | |
|
| Israel–4.65% | |
Hilan Ltd. | | | 517,409 | | | | 7,799,592 | |
Israel Discount Bank Ltd.–Class A(b) | | | 5,598,000 | | | | 11,618,458 | |
MIND C.T.I. Ltd.(a) | | | 1,200,000 | | | | 2,928,000 | |
| | | | | | | | 22,346,050 | |
|
| Italy–4.61% | |
Danieli & C. Officine Meccaniche S.p.A. — Savings Shares | | | 920,532 | | | | 14,669,236 | |
El.En. S.p.A. | | | 304,683 | | | | 7,526,691 | |
| | | | | | | | 22,195,927 | |
|
| Norway–5.31% | |
Bonheur ASA | | | 461,206 | | | | 3,858,180 | |
Ekornes ASA | | | 590,214 | | | | 7,277,945 | |
Kongsberg Gruppen ASA | | | 296,721 | | | | 4,277,276 | |
NextGenTel Holding ASA(b) | | | 903,998 | | | | 2,941,192 | |
Wilh. Wilhelmsen Holding ASA–Class A | | | 314,539 | | | | 7,210,898 | |
| | | | | | | | 25,565,491 | |
|
| Portugal–0.20% | |
Conduril — Engenharia S.A. | | | 31,412 | | | | 958,818 | |
|
| Romania–5.20% | |
Banca Transilvania S.A. | | | 10,862,551 | | | | 6,009,274 | |
Societatea Nationala de Gaze Naturale ROMGAZ S.A. | | | 1,931,512 | | | | 11,200,547 | |
Transgaz SA Medias | | | 114,300 | | | | 7,794,628 | |
| | | | | | | | 25,004,449 | |
|
| Spain–1.78% | |
Baron de Ley, S.A.(b) | | | 68,000 | | | | 8,553,021 | |
|
| Switzerland–5.11% | |
Carlo Gavazzi Holding AG | | | 18,625 | | | | 4,444,322 | |
Kardex AG | | | 161,048 | | | | 15,028,808 | |
OC Oerlikon Corp. AG | | | 521,945 | | | | 5,125,399 | |
| | | | | | | | 24,598,529 | |
|
| Turkey–0.97% | |
Yazicilar Holding A.S.–Class A | | | 1,251,313 | | | | 4,665,239 | |
|
| United Kingdom–17.17% | |
City of London Investment Group PLC | | | 900,000 | | | | 3,801,185 | |
Clarkson PLC | | | 188,808 | | | | 5,057,519 | |
DCC PLC | | | 58,026 | | | | 4,302,591 | |
Diploma PLC | | | 458,327 | | | | 5,870,139 | |
Eurocell PLC | | | 1,265,000 | | | | 2,786,904 | |
See accompanying Notes to Financial Statements which are an integral part of the financial statements.
10 Invesco European Small Company Fund
| | | | | | | | |
| | | Shares | | | Value | |
| United Kingdom–(continued) | |
Fairpoint Group PLC(a) | | | 2,296,500 | | | $ | 477,153 | |
Hargreaves Services PLC | | | 311,886 | | | | 1,045,736 | |
IG Group Holdings PLC | | | 326,567 | | | | 1,989,045 | |
Jupiter Fund Management PLC | | | 867,000 | | | | 4,725,618 | |
Micro Focus International PLC | | | 430,709 | | | | 11,557,423 | |
NAHL Group PLC | | | 2,014,183 | | | | 3,327,064 | |
Renew Holdings PLC | | | 600,000 | | | | 3,276,176 | |
SafeStyle UK PLC | | | 1,802,000 | | | | 6,447,397 | |
Savills PLC | | | 981,600 | | | | 8,454,674 | |
Staffline Group PLC | | | 610,000 | | | | 6,350,193 | |
TP ICAP PLC | | | 876,220 | | | | 4,680,144 | |
Ultra Electronics Holdings PLC | | | 168,512 | | | | 4,031,937 | |
XLMedia PLC | | | 3,875,000 | | | | 4,442,343 | |
| | | | | | | | 82,623,241 | |
Total Common Stocks & Other Equity Interests
(Cost $389,233,139) | | | | 443,628,781 | |
| | | | | | | | |
| | | Shares | | | Value | |
Money Market Funds–7.71% | |
Government & Agency Portfolio–Institutional Class, 0.43%(c) | | | 22,251,451 | | | $ | 22,251,451 | |
Treasury Portfolio–Institutional Class,
0.37%(c) | | | 14,834,301 | | | | 14,834,301 | |
Total Money Market Funds
(Cost $37,085,752) | | | | 37,085,752 | |
TOTAL INVESTMENTS–99.92%
(Cost $426,318,891) | | | | 480,714,533 | |
OTHER ASSETS LESS LIABILITIES–0.08% | | | | 371,022 | |
NET ASSETS–100.00% | | | $ | 481,085,555 | |
Investment Abbreviations:
| | |
| CCI | | – Chambre-de-Commerce-et-d’Industrie |
Notes to Schedule of Investments:
| (a) | Affiliated company during the period. The Investment Company Act of 1940 defines an “affiliated person” as an issuance in which a fund holds 5% or more of the outstanding voting securities. The Fund has not owned enough of the outstanding voting securities of the issuer to have control (as defined in the Investment Company Act of 1940) of that issuer. The aggregate value of these securities as of December 31, 2016 was $28,322,229, which represented 5.89% of the Fund’s Net Assets. See Note 4. |
| (b) | Non-income producing security. |
| (c) | The money market fund and the Fund are affiliated by having the same investment adviser. The rate shown is the 7-day SEC standardized yield as of December 31, 2016. |
See accompanying Notes to Financial Statements which are an integral part of the financial statements.
11 Invesco European Small Company Fund
Statement of Assets and Liabilities
December 31, 2016
| | | | |
Assets: | |
Investments, at value (Cost $368,001,250) | | $ | 415,306,552 | |
Investments in affiliates, at value (Cost $58,317,641) | | | 65,407,981 | |
Total investments, at value (Cost $426,318,891) | | | 480,714,533 | |
Foreign currencies, at value (Cost $433,226) | | | 435,905 | |
Receivable for: | | | | |
Investments sold | | | 75,370 | |
Fund shares sold | | | 904,116 | |
Dividends | | | 683,404 | |
Investment for trustee deferred compensation and retirement plans | | | 80,655 | |
Other assets | | | 38,533 | |
Total assets | | | 482,932,516 | |
|
Liabilities: | |
Payable for: | | | | |
Investments purchased | | | 155,132 | |
Fund shares reacquired | | | 1,309,931 | |
Accrued fees to affiliates | | | 169,255 | |
Accrued trustees’ and officers’ fees and benefits | | | 186 | |
Accrued other operating expenses | | | 121,192 | |
Trustee deferred compensation and retirement plans | | | 91,265 | |
Total liabilities | | | 1,846,961 | |
Net assets applicable to shares outstanding | | $ | 481,085,555 | |
|
Net assets consist of: | |
Shares of beneficial interest | | $ | 429,977,190 | |
Undistributed net investment income | | | (878,412 | ) |
Undistributed net realized gain (loss) | | | (2,369,046 | ) |
Net unrealized appreciation | | | 54,355,823 | |
| | | $ | 481,085,555 | |
| | | | |
Net Assets: | |
Class A | | $ | 184,023,905 | |
Class B | | $ | 1,102,175 | |
Class C | | $ | 30,709,295 | |
Class Y | | $ | 265,250,180 | |
|
Shares outstanding, no par value,
with an unlimited number of shares authorized: | |
Class A | | | 13,780,695 | |
Class B | | | 88,107 | |
Class C | | | 2,451,227 | |
Class Y | | | 19,787,163 | |
Class A: | | | | |
Net asset value per share | | $ | 13.35 | |
Maximum offering price per share | | | | |
(Net asset value of $13.35 ¸ 94.50%) | | $ | 14.13 | |
Class B: | | | | |
Net asset value and offering price per share | | $ | 12.51 | |
Class C: | | | | |
Net asset value and offering price per share | | $ | 12.53 | |
Class Y: | | | | |
Net asset value and offering price per share | | $ | 13.41 | |
See accompanying Notes to Financial Statements which are an integral part of the financial statements.
12 Invesco European Small Company Fund
Statement of Operations
For the year ended December 31, 2016
| | | | |
Investment income: | |
Dividends (net of foreign withholding taxes of $1,679,617) | | $ | 13,197,485 | |
Dividends from affiliates | | | 3,175,874 | |
Total investment income | | | 16,373,359 | |
| |
Expenses: | | | | |
Advisory fees | | | 4,711,984 | |
Administrative services fees | | | 132,585 | |
Custodian fees | | | 171,754 | |
Distribution fees: | | | | |
Class A | | | 492,987 | |
Class B | | | 16,797 | |
Class C | | | 335,729 | |
Transfer agent fees | | | 722,304 | |
Trustees’ and officers’ fees and benefits | | | 26,985 | |
Registration and filing fees | | | 105,624 | |
Reports to shareholders | | | 49,135 | |
Professional services fees | | | 59,912 | |
Other | | | 23,388 | |
Total expenses | | | 6,849,184 | |
Less: Fees waived and expense offset arrangement(s) | | | (128,220 | ) |
Net expenses | | | 6,720,964 | |
Net investment income | | | 9,652,395 | |
| |
Realized and unrealized gain (loss) from: | | | | |
Net realized gain (loss) from: | | | | |
Investment securities | | | (2,353,531 | ) |
Foreign currencies | | | 12,758 | |
| | | | (2,340,773 | ) |
Change in net unrealized appreciation (depreciation) of: | | | | |
Investment securities | | | 32,285,937 | |
Foreign currencies | | | (15,432 | ) |
| | | | 32,270,505 | |
Net realized and unrealized gain | | | 29,929,732 | |
Net increase in net assets resulting from operations | | $ | 39,582,127 | |
See accompanying Notes to Financial Statements which are an integral part of the financial statements.
13 Invesco European Small Company Fund
Statement of Changes in Net Assets
For the years ended December 31, 2016 and 2015
| | | | | | | | |
| | | 2016 | | | 2015 | |
Operations: | | | | | | | | |
Net investment income | | $ | 9,652,395 | | | $ | 4,703,579 | |
Net realized gain (loss) | | | (2,340,773 | ) | | | 7,146,804 | |
Change in net unrealized appreciation | | | 32,270,505 | | | | 9,914,197 | |
Net increase in net assets resulting from operations | | | 39,582,127 | | | | 21,764,580 | |
| | |
Distributions to shareholders from net investment income: | | | | | | | | |
Class A | | | (3,773,796 | ) | | | (2,906,436 | ) |
Class B | | | (17,578 | ) | | | (22,058 | ) |
Class C | | | (435,160 | ) | | | (354,102 | ) |
Class Y | | | (5,958,274 | ) | | | (3,958,363 | ) |
Total distributions from net investment income | | | (10,184,808 | ) | | | (7,240,959 | ) |
| | |
Distributions to shareholders from net realized gains: | | | | | | | | |
Class A | | | — | | | | (7,683,968 | ) |
Class B | | | — | | | | (92,043 | ) |
Class C | | | — | | | | (1,477,571 | ) |
Class Y | | | — | | | | (9,346,821 | ) |
Total distributions from net realized gains | | | — | | | | (18,600,403 | ) |
| | |
Share transactions–net: | | | | | | | | |
Class A | | | (33,174,854 | ) | | | 32,487,591 | |
Class B | | | (1,249,534 | ) | | | (709,689 | ) |
Class C | | | (7,848,151 | ) | | | 2,517,984 | |
Class Y | | | (7,712,297 | ) | | | 119,602,300 | |
Net increase (decrease) in net assets resulting from share transactions | | | (49,984,836 | ) | | | 153,898,186 | |
Net increase (decrease) in net assets | | | (20,587,517 | ) | | | 149,821,404 | |
| | |
Net assets: | | | | | | | | |
Beginning of year | | | 501,673,072 | | | | 351,851,668 | |
End of year (includes undistributed net investment income of $(878,412) and $(1,189,575), respectively) | | $ | 481,085,555 | | | $ | 501,673,072 | |
Notes to Financial Statements
December 31, 2016
NOTE 1—Significant Accounting Policies
Invesco European Small Company Fund (the “Fund”) is a series portfolio of AIM Funds Group (Invesco Funds Group) (the “Trust”). The Trust is a Delaware statutory trust registered under the Investment Company Act of 1940, as amended (the “1940 Act”), as an open-end series management investment company consisting of four separate portfolios, each authorized to issue an unlimited number of shares of beneficial interest. The assets, liabilities and operations of each portfolio are accounted for separately. Information presented in these financial statements pertains only to the Fund. Matters affecting each portfolio or class will be voted on exclusively by the shareholders of such portfolio or class.
The Fund’s investment objective is long-term growth of capital.
The Fund currently consists of four different classes of shares: Class A, Class B, Class C and Class Y. Class Y shares are available only to certain investors. Class A shares are sold with a front-end sales charge unless certain waiver criteria are met and under certain circumstances load waived shares may be subject to contingent deferred sales charges (“CDSC”). Class C shares are sold with a CDSC. Class Y shares are sold at net asset value. Effective November 30, 2010, new or additional investments in Class B shares are no longer permitted. Existing shareholders of Class B shares may continue to reinvest dividends and capital gains distributions in Class B shares until they convert to Class A shares. Also, shareholders in Class B shares will be able to exchange those shares for Class B shares of other Invesco Funds offering such shares until they convert to Class A shares. Generally, Class B shares will automatically convert to Class A shares on or about the month-end, which is at least eight years after the date of purchase. Redemption of Class B shares prior to the conversion date will be subject to a CDSC.
The Fund is an investment company and accordingly follows the investment company accounting and reporting guidance in accordance with Financial Accounting Standards Board Accounting Standards Codification Topic 946, Financial Services — Investment Companies.
As of the open of business on November 30, 2015, the Fund has closed public sales of its shares to new investors.
The following is a summary of the significant accounting policies followed by the Fund in the preparation of its financial statements.
14 Invesco European Small Company Fund
| A. | Security Valuations — Securities, including restricted securities, are valued according to the following policy. |
A security listed or traded on an exchange (except convertible securities) is valued at its last sales price or official closing price as of the close of the customary trading session on the exchange where the security is principally traded, or lacking any sales or official closing price on a particular day, the security may be valued at the closing bid price on that day. Securities traded in the over-the-counter market are valued based on prices furnished by independent pricing services or market makers. When such securities are valued by an independent pricing service they may be considered fair valued. Futures contracts are valued at the final settlement price set by an exchange on which they are principally traded. Listed options are valued at the mean between the last bid and asked prices from the exchange on which they are principally traded. Options not listed on an exchange are valued by an independent source at the mean between the last bid and asked prices. For purposes of determining net asset value (“NAV”) per share, futures and option contracts generally are valued 15 minutes after the close of the customary trading session of the New York Stock Exchange (“NYSE”).
Investments in open-end and closed-end registered investment companies that do not trade on an exchange are valued at the end-of-day net asset value per share. Investments in open-end and closed-end registered investment companies that trade on an exchange are valued at the last sales price or official closing price as of the close of the customary trading session on the exchange where the security is principally traded.
Debt obligations (including convertible securities) and unlisted equities are fair valued using an evaluated quote provided by an independent pricing service. Evaluated quotes provided by the pricing service may be determined without exclusive reliance on quoted prices, and may reflect appropriate factors such as institution-size trading in similar groups of securities, developments related to specific securities, dividend rate (for unlisted equities), yield (for debt obligations), quality, type of issue, coupon rate (for debt obligations), maturity (for debt obligations), individual trading characteristics and other market data. Debt obligations are subject to interest rate and credit risks. In addition, all debt obligations involve some risk of default with respect to interest and/or principal payments.
Foreign securities’ (including foreign exchange contracts) prices are converted into U.S. dollar amounts using the applicable exchange rates as of the close of the NYSE. If market quotations are available and reliable for foreign exchange-traded equity securities, the securities will be valued at the market quotations. Because trading hours for certain foreign securities end before the close of the NYSE, closing market quotations may become unreliable. If between the time trading ends on a particular security and the close of the customary trading session on the NYSE, events occur that the Adviser determines are significant and make the closing price unreliable, the Fund may fair value the security. If the event is likely to have affected the closing price of the security, the security will be valued at fair value in good faith using procedures approved by the Board of Trustees. Adjustments to closing prices to reflect fair value may also be based on a screening process of an independent pricing service to indicate the degree of certainty, based on historical data, that the closing price in the principal market where a foreign security trades is not the current value as of the close of the NYSE. Foreign securities’ prices meeting the approved degree of certainty that the price is not reflective of current value will be priced at the indication of fair value from the independent pricing service. Multiple factors may be considered by the independent pricing service in determining adjustments to reflect fair value and may include information relating to sector indices, American Depositary Receipts and domestic and foreign index futures. Foreign securities may have additional risks including exchange rate changes, potential for sharply devalued currencies and high inflation, political and economic upheaval, the relative lack of issuer information, relatively low market liquidity and the potential lack of strict financial and accounting controls and standards.
Securities for which market prices are not provided by any of the above methods may be valued based upon quotes furnished by independent sources. The last bid price may be used to value equity securities. The mean between the last bid and asked prices is used to value debt obligations, including corporate loans.
Securities for which market quotations are not readily available or became unreliable are valued at fair value as determined in good faith by or under the supervision of the Trust’s officers following procedures approved by the Board of Trustees. Issuer specific events, market trends, bid/asked quotes of brokers and information providers and other market data may be reviewed in the course of making a good faith determination of a security’s fair value.
The Fund may invest in securities that are subject to interest rate risk, meaning the risk that the prices will generally fall as interest rates rise and, conversely, the prices will generally rise as interest rates fall. Specific securities differ in their sensitivity to changes in interest rates depending on their individual characteristics. Changes in interest rates may result in increased market volatility, which may affect the value and/or liquidity of certain Fund investments.
Valuations change in response to many factors including the historical and prospective earnings of the issuer, the value of the issuer’s assets, general economic conditions, interest rates, investor perceptions and market liquidity. Because of the inherent uncertainties of valuation, the values reflected in the financial statements may materially differ from the value received upon actual sale of those investments.
| B. | Securities Transactions and Investment Income — Securities transactions are accounted for on a trade date basis. Realized gains or losses on sales are computed on the basis of specific identification of the securities sold. Interest income (net of withholding tax, if any) is recorded on the accrual basis from settlement date. Dividend income (net of withholding tax, if any) is recorded on the ex-dividend date. |
The Fund may periodically participate in litigation related to Fund investments. As such, the Fund may receive proceeds from litigation settlements. Any proceeds received are included in the Statement of Operations as realized gain (loss) for investments no longer held and as unrealized gain (loss) for investments still held.
Brokerage commissions and mark ups are considered transaction costs and are recorded as an increase to the cost basis of securities purchased and/or a reduction of proceeds on a sale of securities. Such transaction costs are included in the determination of net realized and unrealized gain (loss) from investment securities reported in the Statement of Operations and the Statement of Changes in Net Assets and the net realized and unrealized gains (losses) on securities per share in the Financial Highlights. Transaction costs are included in the calculation of the Fund’s net asset value and, accordingly, they reduce the Fund’s total returns. These transaction costs are not considered operating expenses and are not reflected in net investment income reported in the Statement of Operations and the Statement of Changes in Net Assets, or the net investment income per share and the ratios of expenses and net investment income reported in the Financial Highlights, nor are they limited by any expense limitation arrangements between the Fund and the investment adviser.
The Fund allocates income and realized and unrealized capital gains and losses to a class based on the relative net assets of each class.
| C. | Country Determination — For the purposes of making investment selection decisions and presentation in the Schedule of Investments, the investment adviser may determine the country in which an issuer is located and/or credit risk exposure based on various factors. These factors |
15 Invesco European Small Company Fund
| | include the laws of the country under which the issuer is organized, where the issuer maintains a principal office, the country in which the issuer derives 50% or more of its total revenues and the country that has the primary market for the issuer’s securities, as well as other criteria. Among the other criteria that may be evaluated for making this determination are the country in which the issuer maintains 50% or more of its assets, the type of security, financial guarantees and enhancements, the nature of the collateral and the sponsor organization. Country of issuer and/or credit risk exposure has been determined to be the United States of America, unless otherwise noted. |
| D. | Distributions — Distributions from net investment income and net realized capital gain, if any, are generally declared and paid annually and recorded on the ex-dividend date. The Fund may elect to treat a portion of the proceeds from redemptions as distributions for federal income tax purposes. |
| E. | Federal Income Taxes — The Fund intends to comply with the requirements of Subchapter M of the Internal Revenue Code of 1986, as amended (the “Internal Revenue Code”), necessary to qualify as a regulated investment company and to distribute substantially all of the Fund’s taxable earnings to shareholders. As such, the Fund will not be subject to federal income taxes on otherwise taxable income (including net realized capital gain) that is distributed to shareholders. Therefore, no provision for federal income taxes is recorded in the financial statements. |
The Fund recognizes the tax benefits of uncertain tax positions only when the position is more likely than not to be sustained. Management has analyzed the Fund’s uncertain tax positions and concluded that no liability for unrecognized tax benefits should be recorded related to uncertain tax positions. Management is not aware of any tax positions for which it is reasonably possible that the total amounts of unrecognized tax benefits will change materially in the next 12 months.
The Fund files tax returns in the U.S. Federal jurisdiction and certain other jurisdictions. Generally, the Fund is subject to examinations by such taxing authorities for up to three years after the filing of the return for the tax period.
| F. | Expenses — Fees provided for under the Rule 12b-1 plan of a particular class of the Fund and which are directly attributable to that class are charged to the operations of such class. All other expenses are allocated among the classes based on relative net assets. |
| G. | Accounting Estimates — The preparation of financial statements in conformity with accounting principles generally accepted in the United States of America (“GAAP”) requires management to make estimates and assumptions that affect the reported amounts of assets and liabilities at the date of the financial statements and the reported amounts of revenues and expenses during the reporting period including estimates and assumptions related to taxation. Actual results could differ from those estimates by a significant amount. In addition, the Fund monitors for material events or transactions that may occur or become known after the period-end date and before the date the financial statements are released to print. |
| H. | Indemnifications — Under the Trust’s organizational documents, each Trustee, officer, employee or other agent of the Trust is indemnified against certain liabilities that may arise out of the performance of their duties to the Fund. Additionally, in the normal course of business, the Fund enters into contracts, including the Fund’s servicing agreements, that contain a variety of indemnification clauses. The Fund’s maximum exposure under these arrangements is unknown as this would involve future claims that may be made against the Fund that have not yet occurred. The risk of material loss as a result of such indemnification claims is considered remote. |
| I. | Foreign Currency Translations — Foreign currency is valued at the close of the NYSE based on quotations posted by banks and major currency dealers. Portfolio securities and other assets and liabilities denominated in foreign currencies are translated into U.S. dollar amounts at date of valuation. Purchases and sales of portfolio securities (net of foreign taxes withheld on disposition) and income items denominated in foreign currencies are translated into U.S. dollar amounts on the respective dates of such transactions. The Fund does not separately account for the portion of the results of operations resulting from changes in foreign exchange rates on investments and the fluctuations arising from changes in market prices of securities held. The combined results of changes in foreign exchange rates and the fluctuation of market prices on investments (net of estimated foreign tax withholding) are included with the net realized and unrealized gain or loss from investments in the Statement of Operations. Reported net realized foreign currency gains or losses arise from (1) sales of foreign currencies, (2) currency gains or losses realized between the trade and settlement dates on securities transactions, and (3) the difference between the amounts of dividends, interest, and foreign withholding taxes recorded on the Fund’s books and the U.S. dollar equivalent of the amounts actually received or paid. Net unrealized foreign currency gains and losses arise from changes in the fair values of assets and liabilities, other than investments in securities at fiscal period end, resulting from changes in exchange rates. |
The Fund may invest in foreign securities, which may be subject to foreign taxes on income, gains on investments or currency repatriation, a portion of which may be recoverable. Foreign taxes, if any, are recorded based on the tax regulations and rates that exist in the foreign markets in which the Fund invests and are shown in the Statement of Operations.
| J. | Forward Foreign Currency Contracts — The Fund may engage in foreign currency transactions either on a spot (i.e. for prompt delivery and settlement) basis, or through forward foreign currency contracts, to manage or minimize currency or exchange rate risk. |
The Fund may also enter into forward foreign currency contracts for the purchase or sale of a security denominated in a foreign currency in order to “lock in” the U.S. dollar price of that security, or the Fund may also enter into forward foreign currency contracts that do not provide for physical settlement of the two currencies, but instead are settled by a single cash payment calculated as the difference between the agreed upon exchange rate and the spot rate at settlement based upon an agreed upon notional amount (non-deliverable forwards). The Fund will set aside liquid assets in an amount equal to the daily mark-to-market obligation for forward foreign currency contracts.
A forward foreign currency contract is an obligation between two parties (“Counterparties”) to purchase or sell a specific currency for an agreed-upon price at a future date. The use of forward foreign currency contracts does not eliminate fluctuations in the price of the underlying securities the Fund owns or intends to acquire but establishes a rate of exchange in advance. Fluctuations in the value of these contracts are measured by the difference in the contract date and reporting date exchange rates and are recorded as unrealized appreciation (depreciation) until the contracts are closed. When the contracts are closed, realized gains (losses) are recorded. Realized and unrealized gains (losses) on the contracts are included in the Statement of Operations. The primary risks associated with forward foreign currency contracts include failure of the Counterparty to meet the terms of the contract and the value of the foreign currency changing unfavorably. These risks may be in excess of the amounts reflected in the Statement of Assets and Liabilities.
16 Invesco European Small Company Fund
NOTE 2—Advisory Fees and Other Fees Paid to Affiliates
The Trust has entered into a master investment advisory agreement with Invesco Advisers, Inc. (the “Adviser” or “Invesco”). Under the terms of the investment advisory agreement, the Fund pays an advisory fee to the Adviser based on the annual rate of the Fund’s average daily net assets as follows:
| | | | | | | | |
| Average Daily Net Assets | | Rate | |
First $250 million | | | 0 | .935% | | | | |
Next $250 million | | | 0 | .91% | | | | |
Next $500 million | | | 0 | .885% | | | | |
Next $1.5 billion | | | 0 | .86% | | | | |
Next $2.5 billion | | | 0 | .835% | | | | |
Next $2.5 billion | | | 0 | .81% | | | | |
Next $2.5 billion | | | 0 | .785% | | | | |
Over $10 billion | | | 0 | .76% | | | | |
For the year ended December 31, 2016, the effective advisory fees incurred by the Fund was 0.92%.
Under the terms of a master sub-advisory agreement between the Adviser and each of Invesco Asset Management Deutschland GmbH, Invesco Asset Management Limited, Invesco Asset Management (Japan) Limited, Invesco Hong Kong Limited, Invesco Senior Secured Management, Inc. and Invesco Canada Ltd. (collectively, the “Affiliated Sub-Advisers”) the Adviser, not the Fund, will pay 40% of the fees paid to the Adviser to any such Affiliated Sub-Adviser(s) that provide(s) discretionary investment management services to the Fund based on the percentage of assets allocated to such Affiliated Sub-Adviser(s).
The Adviser has contractually agreed, through at least June 30, 2017, to waive advisory fees and/or reimburse expenses of all shares to the extent necessary to limit total annual fund operating expenses after fee waiver and/or expense reimbursement (excluding certain items discussed below) of Class A, Class B, Class C and Class Y shares to 2.25%, 3.00%, 3.00% and 2.00%, respectively, of average daily net assets (the “expense limits”). In determining the Adviser’s obligation to waive advisory fees and/or reimburse expenses, the following expenses are not taken into account, and could cause the total annual fund operating expenses after fee waiver and/or expense reimbursement to exceed the numbers reflected above: (1) interest; (2) taxes; (3) dividend expense on short sales; (4) extraordinary or non-routine items, including litigation expenses; and (5) expenses that the Fund has incurred but did not actually pay because of an expense offset arrangement. Unless Invesco continues the fee waiver agreement, it will terminate on June 30, 2017. During its term, the fee waiver agreement cannot be terminated or amended to increase the expense limits without approval of the Board of Trustees. The Adviser did not waive fees and/or reimburse expenses during the period under these expense limits.
Further, the Adviser has contractually agreed, through at least June 30, 2018, to waive the advisory fee payable by the Fund in an amount equal to 100% of the net advisory fees the Adviser receives from the affiliated money market funds on investments by the Fund of uninvested cash in such affiliated money market funds.
For the year ended December 31, 2016, the Adviser waived advisory fees of $125,450.
The Trust has entered into a master administrative services agreement with Invesco pursuant to which the Fund has agreed to pay Invesco for certain administrative costs incurred in providing accounting services to the Fund. For the year ended December 31, 2016, expenses incurred under the agreement are shown in the Statement of Operations as Administrative services fees.
The Trust has entered into a transfer agency and service agreement with Invesco Investment Services, Inc. (“IIS”) pursuant to which the Fund has agreed to pay IIS a fee for providing transfer agency and shareholder services to the Fund and reimburse IIS for certain expenses incurred by IIS in the course of providing such services. IIS may make payments to intermediaries that provide omnibus account services, sub-accounting services and/or networking services. All fees payable by IIS to intermediaries that provide omnibus account services or sub-accounting are charged back to the Fund, subject to certain limitations approved by the Trust’s Board of Trustees. For the year ended December 31, 2016, the expenses incurred under the agreement are shown in the Statement of Operations as Transfer agent fees.
The Trust has entered into master distribution agreements with Invesco Distributors, Inc. (“IDI”) to serve as the distributor for the Class A, Class B, Class C and Class Y shares of the Fund. The Trust has adopted plans pursuant to Rule 12b-1 under the 1940 Act with respect to the Fund’s Class A, Class B and Class C shares (collectively, the “Plans”). The Fund, pursuant to the Plans, pays IDI compensation at the annual rate of 0.25% of the Fund’s average daily net assets of Class A shares and 1.00% of the average daily net assets of each class of Class B and Class C shares. Of the Plan payments, up to 0.25% of the average daily net assets of each class of shares may be paid to furnish continuing personal shareholder services to customers who purchase and own shares of such classes. Any amounts not paid as a service fee under the Plans would constitute an asset-based sales charge. Rules of the Financial Industry Regulatory Authority (“FINRA”) impose a cap on the total sales charges, including asset-based sales charges, that may be paid by any class of shares of the Fund. For the year ended December 31, 2016, expenses incurred under the Plans are shown in the Statement of Operations as Distribution fees.
Front-end sales commissions and CDSC (collectively, the “sales charges”) are not recorded as expenses of the Fund. Front-end sales commissions are deducted from proceeds from the sales of Fund shares prior to investment in Class A shares of the Fund. CDSC are deducted from redemption proceeds prior to remittance to the shareholder. During the year ended December 31, 2016, IDI advised the Fund that IDI retained $15,073 in front-end sales commissions from the sale of Class A shares and $2,535, $250 and $4,080 from Class A, Class B and Class C shares, respectively, for CDSC imposed on redemptions by shareholders.
Certain officers and trustees of the Trust are officers and directors of the Adviser, IIS and/or IDI.
17 Invesco European Small Company Fund
NOTE 3—Additional Valuation Information
GAAP defines fair value as the price that would be received to sell an asset or paid to transfer a liability in an orderly transaction between market participants at the measurement date, under current market conditions. GAAP establishes a hierarchy that prioritizes the inputs to valuation methods, giving the highest priority to readily available unadjusted quoted prices in an active market for identical assets (Level 1) and the lowest priority to significant unobservable inputs (Level 3), generally when market prices are not readily available or are unreliable. Based on the valuation inputs, the securities or other investments are tiered into one of three levels. Changes in valuation methods may result in transfers in or out of an investment’s assigned level:
| | Level 1 — | Prices are determined using quoted prices in an active market for identical assets. |
| | Level 2 — | Prices are determined using other significant observable inputs. Observable inputs are inputs that other market participants may use in pricing a security. These may include quoted prices for similar securities, interest rates, prepayment speeds, credit risk, yield curves, loss severities, default rates, discount rates, volatilities and others. |
| | Level 3 — | Prices are determined using significant unobservable inputs. In situations where quoted prices or observable inputs are unavailable (for example, when there is little or no market activity for an investment at the end of the period), unobservable inputs may be used. Unobservable inputs reflect the Fund’s own assumptions about the factors market participants would use in determining fair value of the securities or instruments and would be based on the best available information. |
The following is a summary of the tiered valuation input levels, as of December 31, 2016. The level assigned to the securities valuations may not be an indication of the risk or liquidity associated with investing in those securities. Because of the inherent uncertainties of valuation, the values reflected in the financial statements may materially differ from the value received upon actual sale of those investments.
During the year ended December 31, 2016, there were transfers from Level 1 to Level 2 of $36,264,295 and from Level 2 to Level 1 of $106,444,122, due to foreign fair value adjustments.
| | | | | | | | | | | | | | | | |
| | | Level 1 | | | Level 2 | | | Level 3 | | | Total | |
Belgium | | $ | 11,722,179 | | | $ | — | | | $ | — | | | $ | 11,722,179 | |
France | | | 112,532,855 | | | | 20,163,022 | | | | — | | | | 132,695,877 | |
Germany | | | 18,249,335 | | | | 8,713,877 | | | | — | | | | 26,963,212 | |
Greece | | | 15,530,815 | | | | — | | | | — | | | | 15,530,815 | |
Ireland | | | 40,205,933 | | | | — | | | | — | | | | 40,205,933 | |
Israel | | | 2,928,000 | | | | 19,418,050 | | | | — | | | | 22,346,050 | |
Italy | | | 22,195,927 | | | | — | | | | — | | | | 22,195,927 | |
Norway | | | 25,565,491 | | | | — | | | | — | | | | 25,565,491 | |
Portugal | | | 958,818 | | | | — | | | | — | | | | 958,818 | |
Romania | | | 25,004,449 | | | | — | | | | — | | | | 25,004,449 | |
Spain | | | 8,553,021 | | | | — | | | | — | | | | 8,553,021 | |
Switzerland | | | 9,569,721 | | | | 15,028,808 | | | | — | | | | 24,598,529 | |
Turkey | | | 4,665,239 | | | | — | | | | — | | | | 4,665,239 | |
United Kingdom | | | 47,042,702 | | | | 35,580,539 | | | | — | | | | 82,623,241 | |
Money Market Funds | | | 37,085,752 | | | | — | | | | — | | | | 37,085,752 | |
Total Investments | | $ | 381,810,237 | | | $ | 98,904,296 | | | $ | — | | | $ | 480,714,533 | |
NOTE 4—Investments in Other Affiliates
The 1940 Act defines an “affiliated person” as an issuance in which a fund holds 5% or more of the outstanding voting securities. The Fund has not owned enough of the outstanding voting securities of the issuer to have control (as defined in the 1940 Act) of that issuer. The following is a summary of the investments in other affiliates for the year ended December 31, 2016.
| | | | | | | | | | | | | | | | | | | | | | | | | | | | |
| | | Value
12/31/15 | | | Purchases
at Cost | | | Proceeds
from Sales | | | Change in
Unrealized
Appreciation
(Depreciation) | | | Realized
Gain | | | Value
12/31/16 | | | Dividend
Income | |
CENIT AG(a) | | $ | 10,307,546 | | | $ | — | | | $ | (5,124,640 | ) | | $ | (2,256,928 | ) | | $ | 1,911,663 | | | $ | 4,837,641 | | | $ | 528,730 | |
Fairpoint Group PLC | | | 3,713,973 | | | | 147,078 | | | | — | | | | (3,383,898 | ) | | | — | | | | 477,153 | | | | 207,558 | |
Linedata Services | | | 18,020,237 | | | | — | | | | — | | | | 6,896,839 | | | | — | | | | 24,917,076 | | | | 2,464,843 | |
Mind CTI Ltd | | | 2,403,500 | | | | 505,008 | | | | — | | | | 19,492 | | | | — | | | | 2,928,000 | | | | 195,453 | |
Total | | $ | 34,445,256 | | | $ | 652,086 | | | $ | (5,124,640 | ) | | $ | 1,275,505 | | | $ | 1,911,663 | | | $ | 33,159,870 | | | $ | 3,396,584 | |
| (a) | As of December 31, 2016, this security is no longer considered as an affiliate of the Fund. |
NOTE 5—Expense Offset Arrangement(s)
The expense offset arrangement is comprised of transfer agency credits which result from balances in demand deposit accounts used by the transfer agent for clearing shareholder transactions. For the year ended December 31, 2016, the Fund received credits from this arrangement, which resulted in the reduction of the Fund’s total expenses of $2,770.
18 Invesco European Small Company Fund
NOTE 6—Trustees’ and Officers’ Fees and Benefits
Trustees’ and Officers’ Fees and Benefits include amounts accrued by the Fund to pay remuneration to certain Trustees and Officers of the Fund. Trustees have the option to defer compensation payable by the Fund, and Trustees’ and Officers’ Fees and Benefits also include amounts accrued by the Fund to fund such deferred compensation amounts. Those Trustees who defer compensation have the option to select various Invesco Funds in which their deferral accounts shall be deemed to be invested. Finally, certain current Trustees were eligible to participate in a retirement plan that provided for benefits to be paid upon retirement to Trustees over a period of time based on the number of years of service. The Fund may have certain former Trustees who also participate in a retirement plan and receive benefits under such plan. Trustees’ and Officers’ Fees and Benefits include amounts accrued by the Fund to fund such retirement benefits. Obligations under the deferred compensation and retirement plans represent unsecured claims against the general assets of the Fund.
NOTE 7—Cash Balances
The Fund is permitted to temporarily carry a negative or overdrawn balance in its account with State Street Bank and Trust Company, the custodian bank. Such balances, if any at period-end, are shown in the Statement of Assets and Liabilities under the payable caption Amount due custodian. To compensate the custodian bank for such overdrafts, the overdrawn Fund may either (1) leave funds as a compensating balance in the account so the custodian bank can be compensated by earning the additional interest; or (2) compensate by paying the custodian bank at a rate agreed upon by the custodian bank and Invesco, not to exceed the contractually agreed upon rate.
NOTE 8—Distributions to Shareholders and Tax Components of Net Assets
Tax Character of Distributions to Shareholders Paid During the Fiscal Years Ended December 31, 2016 and 2015:
| | | | | | | | |
| | | 2016 | | | 2015 | |
Ordinary income | | $ | 10,184,808 | | | $ | 7,240,959 | |
Long-term capital gain | | | — | | | | 18,600,403 | |
Total distributions | | $ | 10,184,808 | | | $ | 25,841,362 | |
Tax Components of Net Assets at Period-End:
| | | | |
| | | 2016 | |
Net unrealized appreciation — investments | | $ | 53,606,903 | |
Net unrealized appreciation (depreciation) — other investments | | | (39,819 | ) |
Temporary book/tax differences | | | (89,673 | ) |
Capital loss carryforward | | | (2,369,046 | ) |
Shares of beneficial interest | | | 429,977,190 | |
Total net assets | | $ | 481,085,555 | |
The difference between book-basis and tax-basis unrealized appreciation (depreciation) is due to differences in the timing of recognition of gains and losses on investments for tax and book purposes. The Fund’s net unrealized appreciation difference is attributable primarily to the tax treatment of passive foreign investment companies.
The temporary book/tax differences are a result of timing differences between book and tax recognition of income and/or expenses. The Fund’s temporary book/tax differences are the result of the trustee deferral of compensation and retirement plan benefits.
Capital loss carryforward is calculated and reported as of a specific date. Results of transactions and other activity after that date may affect the amount of capital loss carryforward actually available for the Fund to utilize. Capital losses generated in years beginning after December 22, 2010 can be carried forward for an unlimited period, whereas previous losses expire in eight tax years. Capital losses with an expiration period may not be used to offset capital gains until all net capital losses without an expiration date have been utilized. Capital loss carryforwards with no expiration date will retain their character as either short-term or long-term capital losses instead of as short-term capital losses as under prior law. The ability to utilize capital loss carryforwards in the future may be limited under the Internal Revenue Code and related regulations based on the results of future transactions.
The Fund has a capital loss carryforward as of December 31, 2016 as follows:
| | | | | | | | | | | | |
| Capital Loss Carryforward* | |
| Expiration | | Short-Term | | | Long-Term | | | Total | |
Not subject to expiration | | $ | — | | | $ | 2,369,046 | | | $ | 2,369,046 | |
| * | Capital loss carryforward as of the date listed above is reduced for limitations, if any, to the extent required by the Internal Revenue Code and may be further limited depending upon a variety of factors, including the realization of net unrealized gains or losses as of the date of any reorganization. |
NOTE 9—Investment Securities
The aggregate amount of investment securities (other than short-term securities, U.S. Treasury obligations and money market funds, if any) purchased and sold by the Fund during the year ended December 31, 2016 was $71,126,397 and $49,180,439, respectively. Cost of investments on a tax basis includes the adjustments for financial reporting purposes as of the most recently completed federal income tax reporting period-end.
| | | | |
| Unrealized Appreciation (Depreciation) of Investment Securities on a Tax Basis | |
Aggregate unrealized appreciation of investment securities | | $ | 105,959,879 | |
Aggregate unrealized (depreciation) of investment securities | | | (52,352,976 | ) |
Net unrealized appreciation of investment securities | | $ | 53,606,903 | |
Cost of investments for tax purposes is $427,107,630.
19 Invesco European Small Company Fund
NOTE 10—Reclassification of Permanent Differences
Primarily as a result of differing book/tax treatment of overdistributions and foreign currency transactions, on December 31, 2016, undistributed net investment income was increased by $843,576, undistributed net realized gain (loss) was decreased by $28,273 and shares of beneficial interest was decreased by $815,303. This reclassification had no effect on the net assets of the Fund.
NOTE 11—Share Information
| | | | | | | | | | | | | | | | |
| | | Summary of Share Activity | |
| | | Years ended December 31, | |
| | | 2016(a) | | | 2015 | |
| | | Shares | | | Amount | | | Shares | | | Amount | |
Sold: | | | | | | | | | | | | | | | | |
Class A | | | 2,449,599 | | | $ | 31,160,859 | | | | 7,706,389 | | | $ | 101,845,450 | |
Class B | | | 584 | | | | 6,661 | | | | 15,505 | | | | 194,138 | |
Class C | | | 100,118 | | | | 1,198,481 | | | | 909,649 | | | | 11,284,007 | |
Class Y | | | 13,346,314 | | | | 169,981,683 | | | | 15,197,719 | | | | 198,082,162 | |
| | | | |
Issued as reinvestment of dividends: | | | | | | | | | | | | | | | | |
Class A | | | 261,879 | | | | 3,451,570 | | | | 790,732 | | | | 9,971,125 | |
Class B | | | 1,233 | | | | 15,240 | | | | 8,782 | | | | 103,887 | |
Class C | | | 33,043 | | | | 408,736 | | | | 147,439 | | | | 1,745,682 | |
Class Y | | | 350,899 | | | | 4,642,398 | | | | 890,013 | | | | 11,267,573 | |
| | | | |
Automatic conversion of Class B shares to Class A shares: | | | | | | | | | | | | | | | | |
Class A | | | 58,199 | | | | 746,406 | | | | 36,320 | | | | 461,774 | |
Class B | | | (62,277 | ) | | | (746,406 | ) | | | (38,649 | ) | | | (461,774 | ) |
| | | | |
Reacquired: | | | | | | | | | | | | | | | | |
Class A | | | (5,375,413 | ) | | | (68,533,689 | ) | | | (6,211,446 | ) | | | (79,790,758 | ) |
Class B | | | (43,726 | ) | | | (525,029 | ) | | | (45,563 | ) | | | (545,940 | ) |
Class C | | | (789,855 | ) | | | (9,455,368 | ) | | | (880,736 | ) | | | (10,511,705 | ) |
Class Y | | | (14,323,796 | ) | | | (182,336,378 | ) | | | (7,042,605 | ) | | | (89,747,435 | ) |
Net increase (decrease) in share activity | | | (3,993,199 | ) | | $ | (49,984,836 | ) | | | 11,483,549 | | | $ | 153,898,186 | |
| (a) | There are entities that are record owners of more than 5% of the outstanding shares of the Fund and in the aggregate own 58% of the outstanding shares of the Fund. IDI has an agreement with these entities to sell Fund shares. The Fund, Invesco and/or Invesco affiliates may make payments to these entities, which are considered to be related to the Fund, for providing services to the Fund, Invesco and/or Invesco affiliates including but not limited to services such as securities brokerage, distribution, third party record keeping and account servicing. The Fund has no knowledge as to whether all or any portion of the shares owned of record by these entities are also owned beneficially. |
20 Invesco European Small Company Fund
NOTE 12—Financial Highlights
The following schedule presents financial highlights for a share of the Fund outstanding throughout the periods indicated.
| | | | | | | | | | | | | | | | | | | | | | | | | | | | | | | | | | | | | | | | | | | | | | | | | | | | | | | | |
| | | Net asset
value,
beginning
of period | | | Net
investment
income(a) | | | Net gains
(losses)
on securities
(both
realized and
unrealized) | | | Total from
investment
operations | | | Dividends
from net
investment
income | | | Distributions
from net
realized
gains | | | Total
distributions | | | Net asset
value, end
of period | | | Total
return(b) | | | Net assets,
end of period
(000’s omitted) | | | Ratio of
expenses
to average
net assets
with fee waivers
and/or expenses
absorbed | | | Ratio of
expenses
to average net
assets without
fee waivers
and/or expenses
absorbed | | | Ratio of net
investment
income
to average
net assets | | | Portfolio
turnover(c) | |
Class A | | | | | | | | | | | | | | | | | | | | | | | | | | | | | | | | | | | | | | | | | | | | | | | | | | | | | | | | |
Year ended 12/31/16 | | $ | 12.55 | | | $ | 0.23 | | | $ | 0.85 | | | $ | 1.08 | | | $ | (0.28 | ) | | $ | — | | | $ | (0.28 | ) | | $ | 13.35 | | | | 8.61 | % | | $ | 184,024 | | | | 1.40 | %(d) | | | 1.42 | %(d) | | | 1.80 | %(d) | | | 11 | % |
Year ended 12/31/15 | | | 12.36 | | | | 0.14 | | | | 0.73 | | | | 0.87 | | | | (0.19 | ) | | | (0.49 | ) | | | (0.68 | ) | | | 12.55 | | | | 7.01 | | | | 205,621 | | | | 1.44 | | | | 1.46 | | | | 1.12 | | | | 19 | |
Year ended 12/31/14 | | | 14.85 | | | | 0.26 | (e) | | | (1.31 | ) | | | (1.05 | ) | | | (0.28 | ) | | | (1.16 | ) | | | (1.44 | ) | | | 12.36 | | | | (7.02 | ) | | | 173,809 | | | | 1.39 | | | | 1.41 | | | | 1.72 | (e) | | | 14 | |
Year ended 12/31/13 | | | 11.56 | | | | 0.12 | | | | 3.48 | | | | 3.60 | | | | (0.07 | ) | | | (0.24 | ) | | | (0.31 | ) | | | 14.85 | | | | 31.18 | | | | 308,622 | | | | 1.46 | | | | 1.49 | | | | 0.88 | | | | 9 | |
Year ended 12/31/12 | | | 9.33 | | | | 0.17 | | | | 2.70 | | | | 2.87 | | | | (0.15 | ) | | | (0.49 | ) | | | (0.64 | ) | | | 11.56 | | | | 31.04 | | | | 91,980 | | | | 1.69 | | | | 1.70 | | | | 1.57 | | | | 18 | |
Class B | | | | | | | | | | | | | | | | | | | | | | | | | | | | | | | | | | | | | | | | | | | | | | | | | | | | | | | | |
Year ended 12/31/16 | | | 11.76 | | | | 0.13 | | | | 0.79 | | | | 0.92 | | | | (0.17 | ) | | | — | | | | (0.17 | ) | | | 12.51 | | | | 7.88 | | | | 1,102 | | | | 2.15 | (d) | | | 2.17 | (d) | | | 1.05 | (d) | | | 11 | |
Year ended 12/31/15 | | | 11.65 | | | | 0.04 | | | | 0.68 | | | | 0.72 | | | | (0.12 | ) | | | (0.49 | ) | | | (0.61 | ) | | | 11.76 | | | | 6.16 | | | | 2,262 | | | | 2.19 | | | | 2.21 | | | | 0.37 | | | | 19 | |
Year ended 12/31/14 | | | 14.05 | | | | 0.14 | (e) | | | (1.23 | ) | | | (1.09 | ) | | | (0.15 | ) | | | (1.16 | ) | | | (1.31 | ) | | | 11.65 | | | | (7.71 | ) | | | 2,938 | | | | 2.14 | | | | 2.16 | | | | 0.97 | (e) | | | 14 | |
Year ended 12/31/13 | | | 10.99 | | | | 0.02 | | | | 3.29 | | | | 3.31 | | | | (0.01 | ) | | | (0.24 | ) | | | (0.25 | ) | | | 14.05 | | | | 30.14 | | | | 5,299 | | | | 2.21 | | | | 2.24 | | | | 0.13 | | | | 9 | |
Year ended 12/31/12 | | | 8.89 | | | | 0.08 | | | | 2.58 | | | | 2.66 | | | | (0.07 | ) | | | (0.49 | ) | | | (0.56 | ) | | | 10.99 | | | | 30.14 | | | | 6,738 | | | | 2.44 | | | | 2.45 | | | | 0.82 | | | | 18 | |
Class C | | | | | | | | | | | | | | | | | | | | | | | | | | | | | | | | | | | | | | | | | | | | | | | | | | | | | | | | |
Year ended 12/31/16 | | | 11.78 | | | | 0.13 | | | | 0.79 | | | | 0.92 | | | | (0.17 | ) | | | — | | | | (0.17 | ) | | | 12.53 | | | | 7.87 | | | | 30,709 | | | | 2.15 | (d) | | | 2.17 | (d) | | | 1.05 | (d) | | | 11 | |
Year ended 12/31/15 | | | 11.66 | | | | 0.04 | | | | 0.69 | | | | 0.73 | | | | (0.12 | ) | | | (0.49 | ) | | | (0.61 | ) | | | 11.78 | | | | 6.24 | | | | 36,613 | | | | 2.19 | | | | 2.21 | | | | 0.37 | | | | 19 | |
Year ended 12/31/14 | | | 14.07 | | | | 0.14 | (e) | | | (1.24 | ) | | | (1.10 | ) | | | (0.15 | ) | | | (1.16 | ) | | | (1.31 | ) | | | 11.66 | | | | (7.78 | ) | | | 34,195 | | | | 2.14 | | | | 2.16 | | | | 0.97 | (e) | | | 14 | |
Year ended 12/31/13 | | | 11.00 | | | | 0.02 | | | | 3.30 | | | | 3.32 | | | | (0.01 | ) | | | (0.24 | ) | | | (0.25 | ) | | | 14.07 | | | | 30.20 | | | | 51,379 | | | | 2.21 | | | | 2.24 | | | | 0.13 | | | | 9 | |
Year ended 12/31/12 | | | 8.90 | | | | 0.08 | | | | 2.58 | | | | 2.66 | | | | (0.07 | ) | | | (0.49 | ) | | | (0.56 | ) | | | 11.00 | | | | 30.11 | | | | 15,198 | | | | 2.44 | | | | 2.45 | | | | 0.82 | | | | 18 | |
Class Y | | | | | | | | | | | | | | | | | | | | | | | | | | | | | | | | | | | | | | | | | | | | | | | | | | | | | | | | |
Year ended 12/31/16 | | | 12.60 | | | | 0.27 | | | | 0.85 | | | | 1.12 | | | | (0.31 | ) | | | — | | | | (0.31 | ) | | | 13.41 | | | | 8.95 | | | | 265,250 | | | | 1.15 | (d) | | | 1.17 | (d) | | | 2.05 | (d) | | | 11 | |
Year ended 12/31/15 | | | 12.39 | | | | 0.18 | | | | 0.73 | | | | 0.91 | | | | (0.21 | ) | | | (0.49 | ) | | | (0.70 | ) | | | 12.60 | | | | 7.33 | | | | 257,177 | | | | 1.19 | | | | 1.21 | | | | 1.37 | | | | 19 | |
Year ended 12/31/14 | | | 14.90 | | | | 0.30 | (e) | | | (1.32 | ) | | | (1.02 | ) | | | (0.33 | ) | | | (1.16 | ) | | | (1.49 | ) | | | 12.39 | | | | (6.81 | ) | | | 140,910 | | | | 1.14 | | | | 1.16 | | | | 1.97 | (e) | | | 14 | |
Year ended 12/31/13 | | | 11.59 | | | | 0.16 | | | | 3.48 | | | | 3.64 | | | | (0.09 | ) | | | (0.24 | ) | | | (0.33 | ) | | | 14.90 | | | | 31.44 | | | | 288,198 | | | | 1.21 | | | | 1.24 | | | | 1.13 | | | | 9 | |
Year ended 12/31/12 | | | 9.35 | | | | 0.20 | | | | 2.71 | | | | 2.91 | | | | (0.18 | ) | | | (0.49 | ) | | | (0.67 | ) | | | 11.59 | | | | 31.38 | | | | 27,785 | | | | 1.44 | | | | 1.45 | | | | 1.82 | | | | 18 | |
| (a) | Calculated using average shares outstanding. |
| (b) | Includes adjustments in accordance with accounting principles generally accepted in the United States of America and as such, the net asset value for financial reporting purposes and the returns based upon those net asset values may differ from the net asset value and returns for shareholder transactions. Does not include sales charges and is not annualized for periods less than one year, if applicable. |
| (c) | Portfolio turnover is calculated at the fund level and is not annualized for periods less than one year, if applicable. |
| (d) | Ratios are based on average daily net assets (000’s omitted) of $197,195, $1,680, $33,573 and $278,794 for Class A, Class B, Class C and Class Y shares, respectively. |
| (e) | Net investment income per share and the ratio of net investment income to average net assets include significant dividends received during the period. Net investment income per share and the ratio of net investment income to average net assets excluding the significant dividends are $0.18 and 1.23%, $0.07 and 0.48%, $0.07 and 0.48%, $0.22 and 1.48% for Class A, Class B, Class C and Class Y shares, respectively. |
21 Invesco European Small Company Fund
Report of Independent Registered Public Accounting Firm
To the Board of Trustees of AIM Funds Group (Invesco Funds Group)
and Shareholders of the Invesco European Small Company Fund:
In our opinion, the accompanying statement of assets and liabilities, including the schedule of investments, and the related statements of operations and of changes in net assets and the financial highlights present fairly, in all material respects, the financial position of the Invesco European Small Company Fund (one of the portfolios constituting the AIM Funds Group (Invesco Funds Group), hereafter referred to as the “Fund”) as of December 31, 2016, the results of its operations for the year then ended, the changes in its net assets for each of the two years in the period then ended and the financial highlights for each of the five years in the period then ended, in conformity with accounting principles generally accepted in the United States of America. These financial statements and financial highlights (hereafter referred to as “financial statements”) are the responsibility of the Fund’s management. Our responsibility is to express an opinion on these financial statements based on our audits. We conducted our audits of these financial statements in accordance with the standards of the Public Company Accounting Oversight Board (United States). Those standards require that we plan and perform the audit to obtain reasonable assurance about whether the financial statements are free of material misstatement. An audit includes examining, on a test basis, evidence supporting the amounts and disclosures in the financial statements, assessing the accounting principles used and significant estimates made by management, and evaluating the overall financial statement presentation. We believe that our audits, which included confirmation of securities as of December 31, 2016 by correspondence with the custodian and brokers, provide a reasonable basis for our opinion.
PricewaterhouseCoopers LLP
Houston, Texas
February 23, 2017
22 Invesco European Small Company Fund
Calculating your ongoing Fund expenses
Example
As a shareholder of the Fund, you incur two types of costs: (1) transaction costs, which may include sales charges (loads) on purchase payments or contingent deferred sales charges on redemptions, if any; and (2) ongoing costs, including management fees, distribution and/or service (12b-1) fees, and other Fund expenses. This example is intended to help you understand your ongoing costs (in dollars) of investing in the Fund and to compare these costs with ongoing costs of investing in other mutual funds. The example is based on an investment of $1,000 invested at the beginning of the period and held for the entire period July 1, 2016 through December 31, 2016.
Actual expenses
The table below provides information about actual account values and actual expenses. You may use the information in this table, together with the amount you invested, to estimate the expenses that you paid over the period. Simply divide your account value by $1,000 (for example, an $8,600 account value divided by $1,000 = 8.6), then multiply the result by the number in the table under the heading entitled “Actual Expenses Paid During Period” to estimate the expenses you paid on your account during this period.
Hypothetical example for comparison purposes
The table below also provides information about hypothetical account values and hypothetical expenses based on the Fund’s actual expense ratio and an assumed rate of return of 5% per year before expenses, which is not the Fund’s actual return.
The hypothetical account values and expenses may not be used to estimate the actual ending account balance or expenses you paid for the period. You may use this information to compare the ongoing costs of investing in the Fund and other funds. To do so, compare this 5% hypothetical example with the 5% hypothetical examples that appear in the shareholder reports of the other funds.
Please note that the expenses shown in the table are meant to highlight your ongoing costs only and do not reflect any transaction costs, such as sales charges (loads) on purchase payments or contingent deferred sales charges on redemptions, if any. Therefore, the hypothetical information is useful in comparing ongoing costs only, and will not help you determine the relative total costs of owning different funds. In addition, if these transaction costs were included, your costs would have been higher.
| | | | | | | | | | | | | | | | | | | | | | | | |
| Class | | Beginning
Account Value
(07/01/16) | | | ACTUAL | | | HYPOTHETICAL (5% annual return before
expenses) | | | Annualized
Expense
Ratio | |
| | | Ending
Account Value
(12/31/16)1 | | | Expenses
Paid During
Period2 | | | Ending
Account Value
(12/31/16) | | | Expenses
Paid During
Period2 | | |
| A | | $ | 1,000.00 | | | $ | 1,099.20 | | | $ | 7.39 | | | $ | 1,018.10 | | | $ | 7.10 | | | | 1.40 | % |
| B | | | 1,000.00 | | | | 1,095.60 | | | | 11.33 | | | | 1,014.33 | | | | 10.89 | | | | 2.15 | |
| C | | | 1,000.00 | | | | 1,095.40 | | | | 11.32 | | | | 1,014.33 | | | | 10.89 | | | | 2.15 | |
| Y | | | 1,000.00 | | | | 1,100.80 | | | | 6.07 | | | | 1,019.36 | | | | 5.84 | | | | 1.15 | |
| 1 | The actual ending account value is based on the actual total return of the Fund for the period July 1, 2016 through December 31, 2016, after actual expenses and will differ from the hypothetical ending account value which is based on the Fund’s expense ratio and a hypothetical annual return of 5% before expenses. |
| 2 | Expenses are equal to the Fund’s annualized expense ratio as indicated above multiplied by the average account value over the period, multiplied by 184/366 to reflect the most recent fiscal half year. |
23 Invesco European Small Company Fund
Tax Information
Form 1099-DIV, Form 1042-S and other year-end tax information provide shareholders with actual calendar year amounts that should be included in their tax returns. Shareholders should consult their tax advisors.
The following distribution information is being provided as required by the Internal Revenue Code or to meet a specific state’s requirement.
The Fund designates the following amounts or, if subsequently determined to be different, the maximum amount allowable for its fiscal year ended December 31, 2016:
| | | | |
Federal and State Income Tax | |
Qualified Dividend Income* | | | 100 | % |
Corporate Dividends Received Deduction* | | | 0.00 | % |
U.S. Treasury Obligations* | | | 0.00 | % |
Foreign Taxes | | $ | 0.0476 | per share |
Foreign Source Income | | $ | 0.5033 | per share |
| | * | The above percentages are based on ordinary income dividends paid to shareholders during the Fund’s fiscal year. |
24 Invesco European Small Company Fund
Trustees and Officers
The address of each trustee and officer is AIM Funds Group (Invesco Funds Group) (the “Trust”), 11 Greenway Plaza, Suite 1000, Houston, Texas 77046-1173. The trustees serve for the life of the Trust, subject to their earlier death, incapacitation, resignation, retirement or removal as more specifically provided in the Trust’s organizational documents. Each officer serves for a one year term or until their successors are elected and qualified. Column two below includes length of time served with predecessor entities, if any.
| | | | | | | | |
Name, Year of Birth and
Position(s) Held with the Trust | | Trustee and/
or Officer Since | | Principal Occupation(s)
During Past 5 Years | | Number of
Funds in Fund
Complex
Overseen by
Trustee | | Other Directorship(s)
Held by Trustee During Past 5 Years |
| Interested Persons | | | | | | | | |
| Martin L. Flanagan1 — 1960 Trustee | | 2007 | | Executive Director, Chief Executive Officer and President, Invesco Ltd. (ultimate parent of Invesco and a global investment management firm); Advisor to the Board, Invesco Advisers, Inc. (formerly known as Invesco Institutional (N.A.), Inc.); Trustee, The Invesco Funds; Vice Chair, Investment Company Institute; and Member of Executive Board, SMU Cox School of Business Formerly: Chairman and Chief Executive Officer, Invesco Advisers, Inc. (registered investment adviser); Director, Chairman, Chief Executive Officer and President, Invesco Holding Company (US) Inc. (formerly IVZ Inc.) (holding company), Invesco Group Services, Inc. (service provider) and Invesco North American Holdings, Inc. (holding company); Director, Chief Executive Officer and President, Invesco Holding Company Limited (parent of Invesco and a global investment management firm); Director, Invesco Ltd.; Chairman, Investment Company Institute and President, Co-Chief Executive Officer, Co-President, Chief Operating Officer and Chief Financial Officer, Franklin Resources, Inc. (global investment management organization) | | 144 | | None |
Philip A. Taylor2 — 1954 Trustee and Senior Vice President | | 2006 | | Head of the Americas and Senior Managing Director, Invesco Ltd.; Director, Co-Chairman, Co-President and Co-Chief Executive Officer, Invesco Advisers, Inc. (formerly known as Invesco Institutional (N.A.), Inc.) (registered investment adviser); Director, Chairman, Chief Executive Officer and President, Invesco Management Group, Inc. (formerly known as Invesco AIM Management Group, Inc.) (financial services holding company); Director and Chairman, Invesco Investment Services, Inc. (formerly known as Invesco AIM Investment Services, Inc.) (registered transfer agent) Chief Executive Officer, Invesco Corporate Class Inc. (corporate mutual fund company) Director, Chairman and Chief Executive Officer, Invesco Canada Ltd. (formerly known as Invesco Trimark Ltd./Invesco Trimark Ltèe) (registered investment adviser and registered transfer agent); Trustee and Senior Vice President, The Invesco Funds; Director, Invesco Investment Advisers LLC (formerly known as Van Kampen Asset Management). Formerly: Director, Chief Executive Officer and President, Van Kampen Exchange Corp.; President and Principal Executive Officer, The Invesco Funds (other than AIM Treasurer’s Series Trust (Invesco Treasurer’s Series Trust), Short-Term Investments Trust and Invesco Management Trust); Executive Vice President, The Invesco Funds (AIM Treasurer’s Series Trust (Invesco Treasurer’s Series Trust), Short-Term Investments Trust and Invesco Management Trust only); Director and President, INVESCO Funds Group, Inc. (registered investment adviser and registered transfer agent); Director and Chairman, IVZ Distributors, Inc. (formerly known as INVESCO Distributors, Inc.) (registered broker dealer); Director, President and Chairman, Invesco Inc. (holding company), Invesco Canada Holdings Inc. (holding company), Trimark Investments Ltd./Placements Trimark Ltèe and Invesco Financial Services Ltd/Services Financiers Invesco Ltèe; Chief Executive Officer, Invesco Canada Fund Inc. (corporate mutual fund company); Director and Chairman, Van Kampen Investor Services Inc.; Director, Chief Executive Officer and President, 1371 Preferred Inc. (holding company) and Van Kampen Investments Inc.; Director and President, AIM GP Canada Inc. (general partner for limited partnerships) and Van Kampen Advisors, Inc.; Director and Chief Executive Officer, Invesco Trimark Dealer Inc. (registered broker dealer); Director, Invesco Distributors, Inc. (formerly known as Invesco AIM Distributors, Inc.) (registered broker dealer); Manager, Invesco PowerShares Capital Management LLC; Director, Chief Executive Officer and President, Invesco Advisers, Inc.; Director, Chairman, Chief Executive Officer and President, Invesco AIM Capital Management, Inc.; President, Invesco Trimark Dealer Inc. and Invesco Trimark Ltd./Invesco Trimark Ltèe; Director and President, AIM Trimark Corporate Class Inc. and AIM Trimark Canada Fund Inc.; Senior Managing Director, Invesco Holding Company Limited; Director and Chairman, Fund Management Company (former registered broker dealer); President and Principal Executive Officer, The Invesco Funds (AIM Treasurer’s Series Trust (Invesco Treasurer’s Series Trust), and Short-Term Investments Trust only); President, AIM Trimark Global Fund Inc. and AIM Trimark Canada Fund Inc. | | 144 | | None |
| 1 | Mr. Flanagan is considered an interested person (within the meaning of Section 2(a)(19) of the 1940 Act) of the Trust because he is an officer of the Adviser to the Trust, and an officer and a director of Invesco Ltd., ultimate parent of the Adviser. |
| 2 | Mr. Taylor is considered an interested person (within the meaning of Section 2(a)(19) of the 1940 Act) of the Trust because he is an officer and a director of the Adviser. |
T-1 Invesco European Small Company Fund
Trustees and Officers—(continued)
| | | | | | | | |
Name, Year of Birth and
Position(s) Held with the Trust | | Trustee and/
or Officer Since | | Principal Occupation(s)
During Past 5 Years | | Number of
Funds in Fund
Complex
Overseen by
Trustee | | Other Directorship(s)
Held by Trustee During
Past 5 Years |
| Independent Trustees | | | | | | | | |
Bruce L. Crockett — 1944 Trustee and Chair | | 1987 | | Chairman, Crockett Technologies Associates (technology consulting company) Formerly: Director, Captaris (unified messaging provider); Director, President and Chief Executive Officer, COMSAT Corporation; Chairman, Board of Governors of INTELSAT (international communications company); ACE Limited (insurance company); Independent Directors Council and Investment Company Institute | | 144 | | Chairman of the Audit committee, ALPS (Attorneys Liability Protection Society) (insurance company): Member of the Audit Committee, Ferroglobe PLC (metallurgical company) and Investment Company Institute; Member of the Executive Committee and Chair of the Governance Committee, Independent Directors Council |
David C. Arch — 1945 Trustee | | 2010 | | Chairman of Blistex Inc., a consumer health care products manufacturer | | 144 | | Board member of the Illinois Manufacturers’ Association |
James T. Bunch — 1942 Trustee | | 2003 | | Managing Member, Grumman Hill Group LLC (family office/private equity investments) Formerly: Chairman of the Board, Denver Film Society, Chairman of the Board of Trustees, Evans Scholarship Foundation; Chairman, Board of Governors, Western Golf Association | | 144 | | Trustee, Evans Scholarship Foundation; Chairman of the Board, Denver Film Society |
Jack M. Fields — 1952 Trustee | | 1997 | | Chief Executive Officer, Twenty First Century Group, Inc. (government affairs company); and Discovery Learning Alliance (non-profit) Formerly: Owner and Chief Executive Officer, Dos Angeles Ranch L.P. (cattle, hunting, corporate entertainment); Director, Insperity, Inc. (formerly known as Administaff); Chief Executive Officer, Texana Timber LP (sustainable forestry company); Director of Cross Timbers Quail Research Ranch (non-profit); and member of the U.S. House of Representatives | | 144 | | None |
Eli Jones — 1961 Trustee | | 2016 | | Professor and Dean, Mays Business School — Texas A&M University Formerly: Professor and Dean, Walton College of Business, University of Arkansas and E.J. Ourso College of Business, Louisiana State University and Director, Arvest Bank | | 144 | | Director of Insperity, Inc. (formerly known as Administaff) |
Prema Mathai-Davis — 1950 Trustee | | 1998 | | Retired. Formerly: Chief Executive Officer, YWCA of the U.S.A. | | 144 | | None |
Larry Soll — 1942 Trustee | | 2003 | | Retired. Formerly: Chairman, Chief Executive Officer and President, Synergen Corp. (a biotechnology company) | | 144 | | None |
Raymond Stickel, Jr. — 1944 Trustee | | 2005 | | Retired. Formerly: Director, Mainstay VP Series Funds, Inc. (25 portfolios) and Partner, Deloitte & Touche | | 144 | | None |
Robert C. Troccoli — 1949 Trustee | | 2016 | | Adjunct Professor, University of Denver — Daniels College of Business Formerly: Senior Partner, KPMG LLP | | 144 | | None |
| Other Officers | | | | | | | | |
Sheri Morris — 1964 President, Principal Executive Officer and Treasurer | | 1999 | | President, Principal Executive Officer and Treasurer, The Invesco Funds; Vice President, Invesco Advisers, Inc. (formerly known as Invesco Institutional (N.A.), Inc.) (registered investment adviser); and Vice President, PowerShares Exchange-Traded Fund Trust, PowerShares Exchange-Traded Fund Trust II, PowerShares India Exchange-Traded Fund Trust, PowerShares Actively Managed Exchange-Traded Fund Trust, and PowerShares Actively Managed Exchange-Traded Commodity Fund Trust Formerly: Vice President and Principal Financial Officer, The Invesco Funds; Vice President, Invesco AIM Advisers, Inc., Invesco AIM Capital Management, Inc. and Invesco AIM Private Asset Management, Inc.; Assistant Vice President and Assistant Treasurer, The Invesco Funds and Assistant Vice President, Invesco Advisers, Inc., Invesco AIM Capital Management, Inc. and Invesco AIM Private Asset Management, Inc.; and Treasurer, PowerShares Exchange-Traded Fund Trust, PowerShares Exchange-Traded Fund Trust II, PowerShares India Exchange-Traded Fund Trust and PowerShares Actively Managed Exchange-Traded Fund Trust | | N/A | | N/A |
Russell C. Burk — 1958 Senior Vice President and Senior Officer | | 2005 | | Senior Vice President and Senior Officer, The Invesco Funds | | N/A | | N/A |
T-2 Invesco European Small Company Fund
Trustees and Officers—(continued)
| | | | | | | | |
Name, Year of Birth and
Position(s) Held with the Trust | | Trustee and/
or Officer Since | | Principal Occupation(s)
During Past 5 Years | | Number of
Funds in Fund
Complex
Overseen by
Trustee | | Other Directorship(s)
Held by Trustee During
Past 5 Years |
| Other Officers—(continued) | | | | | | | | |
John M. Zerr — 1962 Senior Vice President, Chief Legal Officer and Secretary | | 2006 | | Director, Senior Vice President, Secretary and General Counsel, Invesco Management Group, Inc. (formerly known as Invesco AIM Management Group, Inc.; Senior Vice President, Invesco Advisers, Inc. (formerly known as Invesco Institutional (N.A.), Inc.) (registered investment adviser); Senior Vice President and Secretary, Invesco Distributors, Inc. (formerly known as Invesco AIM Distributors, Inc.); Director, Vice President and Secretary, Invesco Investment Services, Inc. (formerly known as Invesco AIM Investment Services, Inc.) Senior Vice President, Chief Legal Officer and Secretary, The Invesco Funds; Managing Director, Invesco PowerShares Capital Management LLC; Director, Secretary and General Counsel, Invesco Investment Advisers LLC (formerly known as Van Kampen Asset Management); Secretary and General Counsel, Invesco Capital Markets, Inc. (formerly known as Van Kampen Funds Inc.) and Chief Legal Officer, PowerShares Exchange-Traded Fund Trust, PowerShares Exchange-Traded Fund Trust II, PowerShares India Exchange-Traded Fund Trust, PowerShares Actively Managed Exchange-Traded Fund Trust, and PowerShares Actively Managed Exchange-Traded Commodity Fund Trust Formerly: Director, Secretary, General Counsel and Senior Vice President, Van Kampen Exchange Corp.; Director, Vice President and Secretary, IVZ Distributors, Inc. (formerly known as INVESCO Distributors, Inc.); Director and Vice President, INVESCO Funds Group, Inc.; Director and Vice President, Van Kampen Advisors Inc.; Director, Vice President, Secretary and General Counsel, Van Kampen Investor Services Inc.; Director, Invesco Distributors, Inc. (formerly known as Invesco AIM Distributors, Inc.); Director, Senior Vice President, General Counsel and Secretary, Invesco AIM Advisers, Inc. and Van Kampen Investments Inc.; Director, Vice President and Secretary, Fund Management Company; Director, Senior Vice President, Secretary, General Counsel and Vice President, Invesco AIM Capital Management, Inc.; Chief Operating Officer and General Counsel, Liberty Ridge Capital, Inc. (an investment adviser); Vice President and Secretary, PBHG Funds (an investment company) and PBHG Insurance Series Fund (an investment company); Chief Operating Officer, General Counsel and Secretary, Old Mutual Investment Partners (a broker-dealer); General Counsel and Secretary, Old Mutual Fund Services (an administrator) and Old Mutual Shareholder Services (a shareholder servicing center); Executive Vice President, General Counsel and Secretary, Old Mutual Capital, Inc. (an investment adviser); and Vice President and Secretary, Old Mutual Advisors Funds (an investment company) | | N/A | | N/A |
| Karen Dunn Kelley — 1960 Senior Vice President | | 1992 | | Senior Managing Director, Investments, Invesco Ltd.; Director, Co-President, Co-Chief Executive Officer, and Co-Chairman, Invesco Advisers, Inc. (formerly known as Invesco Institutional (N.A.), Inc.) (registered investment adviser); Chairman and Director, Invesco Senior Secured Management, Inc.; Senior Vice President, Invesco Management Group, Inc. (formerly known as Invesco AIM Management Group, Inc.); Executive Vice President, Invesco Distributors, Inc. (formerly known as Invesco AIM Distributors, Inc.); Director, Invesco Mortgage Capital Inc.; Senior Vice President, The Invesco Funds Formerly: Director, Invesco Management Company Limited; Vice President, The Invesco Funds (other than AIM Treasurer’s Series Trust (Invesco Treasurer’s Series Trust), Short-Term Investments Trust and Invesco Management Trust); and President and Principal Executive Officer, The Invesco Funds (AIM Treasurer’s Series Trust (Invesco Treasurer’s Series Trust), Short-Term Investments Trust and Invesco Management Trust only); Director and President, INVESCO Asset Management (Bermuda) Ltd., Director, INVESCO Global Asset Management DAC (formerly known as INVESCO Global Asset Management Limited) and INVESCO Management S.A.; Senior Vice President, Van Kampen Investments Inc. and Invesco Advisers, Inc. (formerly known as Invesco Institutional (N.A.), Inc.) (registered investment adviser); Director and President, Fund Management Company; Chief Cash Management Officer, Director of Cash Management, Senior Vice President, and Managing Director, Invesco AIM Capital Management, Inc.; Director of Cash Management, Senior Vice President, and Vice President, Invesco Advisers, Inc. and Vice President, The Invesco Funds (AIM Treasurer’s Series Trust (Invesco Treasurer’s Series Trust), and Short-Term Investments Trust only) | | N/A | | N/A |
Kelli Gallegos — 1970 Vice President, Principal Financial Officer and Assistant Treasurer | | 2008 | | Vice President, Principal Financial Officer and Assistant Treasurer, The Invesco Funds; Assistant Treasurer, Invesco PowerShares Capital Management LLC, PowerShares Exchange-Traded Fund Trust, PowerShares Exchange-Traded Fund Trust II, PowerShares India Exchange-Traded Fund Trust, PowerShares Actively Managed Exchange-Traded Fund Trust, and PowerShares Actively Managed Exchange-Traded Commodity Fund Trust Formerly: Assistant Vice President, The Invesco Funds | | N/A | | N/A |
Tracy Sullivan — 1962 Vice President, Chief Tax Officer and Assistant Treasurer | | 2008 | | Vice President, Chief Tax Officer and Assistant Treasurer, The Invesco Funds; Assistant Treasurer, Invesco PowerShares Capital Management LLC, PowerShares Exchange-Traded Fund Trust, PowerShares Exchange-Traded Fund Trust II, PowerShares India Exchange-Traded Fund Trust, PowerShares Actively Managed Exchange-Traded Fund Trust, and PowerShares Actively Managed Exchange-Traded Commodity Fund Trust Formerly: Assistant Vice President, The Invesco Funds | | N/A | | N/A |
T-3 Invesco European Small Company Fund
Trustees and Officers—(continued)
| | | | | | | | |
Name, Year of Birth and
Position(s) Held with the Trust | | Trustee and/
or Officer Since | | Principal Occupation(s)
During Past 5 Years | | Number of
Funds in Fund
Complex
Overseen by
Trustee | | Other Directorship(s)
Held by Trustee During
Past 5 Years |
| Other Officers—(continued) | | | | | | | | |
Crissie M. Wisdom — 1969 Anti-Money Laundering Compliance Officer | | 2013 | | Anti-Money Laundering Compliance Officer, Invesco Advisers, Inc. (formerly known as Invesco Institutional (N.A.), Inc.) (registered investment adviser), Invesco Capital Markets, Inc. (formerly known as Van Kampen Funds Inc.), Invesco Distributors, Inc., Invesco Investment Services, Inc., Invesco Management Group, Inc., The Invesco Funds, and PowerShares Exchange-Traded Fund Trust, PowerShares Exchange-Traded Fund Trust II, PowerShares India Exchange-Traded Fund Trust, PowerShares Actively Managed Exchange-Traded Fund Trust and PowerShares Actively Managed Exchange-Traded Commodity Fund Trust; Anti-Money Laundering Compliance Officer and Bank Secrecy Act Officer, INVESCO National Trust Company and Invesco Trust Company; and Fraud Prevention Manager and Controls and Risk Analysis Manager for Invesco Investment Services, Inc. Formerly: Anti-Money Laundering Compliance Officer, Van Kampen Exchange Corp. | | N/A | | N/A |
Robert R. Leveille — 1969 Chief Compliance Officer | | 2016 | | Chief Compliance Officer, Invesco Advisers, Inc. (registered investment adviser); and Chief Compliance Officer, The Invesco Funds Formerly: Chief Compliance Officer, Putnam Investments and the Putnam Funds | | N/A | | N/A |
The Statement of Additional Information of the Trust includes additional information about the Fund’s Trustees and is available upon request, without charge, by calling 1.800.959.4246. Please refer to the Fund’s Statement of Additional Information for information on the Fund’s sub-advisers.
| | | | | | |
Office of the Fund 11 Greenway Plaza, Suite 1000 Houston, TX 77046-1173 | | Investment Adviser Invesco Advisers, Inc. 1555 Peachtree Street, N.E. Atlanta, GA 30309 | | Distributor Invesco Distributors, Inc. 11 Greenway Plaza, Suite 1000 Houston, TX 77046-1173 | | Auditors PricewaterhouseCoopers LLP 1000 Louisiana Street, Suite 5800 Houston, TX 77002-5678 |
| | | |
| | | | | | |
Counsel to the Fund Stradley Ronon Stevens & Young, LLP 2005 Market Street, Suite 2600 Philadelphia, PA 19103-7018 | | Counsel to the Independent Trustees Goodwin Procter LLP 901 New York Avenue, N.W. Washington, D.C. 20001 | | Transfer Agent Invesco Investment Services, Inc. 11 Greenway Plaza, Suite 1000 Houston, TX 77046-1173 | | Custodian State Street Bank and Trust Company 225 Franklin Street Boston, MA 02110-2801 |
T-4 Invesco European Small Company Fund
Explore High-Conviction Investing with Invesco

Invesco mailing information
Send general correspondence to Invesco Investment Services, Inc., P.O. Box 219078, Kansas City, MO 64121-9078.
Important notice regarding delivery of security holder documents
To reduce Fund expenses, only one copy of most shareholder documents may be mailed to shareholders with multiple accounts at the same address (Householding). Mailing of your shareholder documents may be householded indefinitely unless you instruct us otherwise. If you do not want the mailing of these documents to be combined with those for other members of your household, please contact Invesco Investment Services, Inc. at 800 959 4246 or contact your financial institution. We will begin sending you individual copies for each account within 30 days after receiving your request.
Fund holdings and proxy voting information
The Fund provides a complete list of its holdings four times in each fiscal year, at the quarter ends. For the second and fourth quarters, the lists appear in the Fund’s semiannual and annual reports to shareholders. For the first and third quarters, the Fund files the lists with the Securities and Exchange Commission (SEC) on Form N-Q. The most recent list of portfolio holdings is available at invesco.com/completeqtrholdings. Shareholders can also look up the Fund’s Forms N-Q on the SEC website at sec.gov. Copies of the Fund’s Forms N-Q may be reviewed and copied at the SEC Public Reference Room in Washington, D.C. You can obtain information on the operation of the Public Reference Room, including information about duplicating fee charges, by calling 202 551 8090 or 800 732 0330, or by electronic request at the following email address: publicinfo@sec.gov. The SEC file numbers for the Fund are shown below.
A description of the policies and procedures that the Fund uses to determine how to vote proxies relating to portfolio securities is available without charge, upon request, from our Client Services department at 800 959 4246 or at invesco.com/proxyguidelines. The information is also available on the SEC website, sec.gov.
Information regarding how the Fund voted proxies related to its portfolio securities during the most recent 12-month period ended June 30 is available at invesco.com/proxysearch. The information is also available on the SEC website, sec.gov.
| | |
| Invesco Advisers, Inc. is an investment adviser; it provides investment advisory services to individual and institutional clients and does not sell securities. Invesco Distributors, Inc. is the US distributor for Invesco Ltd.’s retail mutual funds, exchange-traded funds and institutional money market funds. Both are wholly owned, indirect subsidiaries of Invesco Ltd. | | 
|
| SEC file numbers: 811-01540 and 002-27334 ESC-AR-1 Invesco Distributors, Inc. | |
| | | | |
| | |
 | | Annual Report to Shareholders | | December 31, 2016 |
| | |
| | Invesco Global Core Equity Fund |
| | Nasdaq: |
| | A: AWSAX ◾ B: AWSBX ◾ C: AWSCX ◾ R: AWSRX ◾ Y: AWSYX ◾ R5: AWSIX |

Letters to Shareholders
| | |

Philip Taylor | | Dear Shareholders: This annual report includes information about your Fund, including performance data and a complete list of its investments as of the close of the reporting period. Inside is a discussion of how your Fund was managed and the factors that affected its performance during the reporting period. The reporting period began with significant stock market volatility in the US and abroad; this volatility was the result of investor uncertainty about global economic growth and monetary policy. After recovering, markets declined sharply following UK voters’ decision in June to leave the European Union. Relatively quickly, however, markets recovered, reaching record highs later in the summer. Demand was strong for income-producing investments, particularly those perceived to be lower risk; this benefited bonds as well as dividend-paying stocks for much of the reporting period. While economic news in the US was generally positive during the reporting period, news overseas was less upbeat. The European Central Bank and central |
banks in China and Japan – as well as other countries – maintained extraordinarily accommodative monetary policies in response to economic weakness. After months of uncertainty, the surprise outcome of the US presidential election in November triggered a major stock market rally, with most market indexes reaching new record highs in December. As expected, the US Federal Reserve raised interest rates in December – its only rate increase during the reporting period and only its second increase since 2006. The Fed cited optimistic economic data for its decision, and Fed-watchers suggested that future rate increases might be announced more quickly than previously forecast.
Short-term market volatility can prompt some investors to abandon their investment plans – and can cause others to settle for whatever returns the market has to offer. The investment professionals at Invesco, in contrast, invest with high conviction. This means that, no matter the asset class or the strategy, each investment team has a passion to exceed. We want to help investors achieve better outcomes, such as seeking higher returns, helping mitigate risk and generating income. Of course, investing with high conviction can’t guarantee a profit or ensure success; no investment strategy can. To learn more about how we invest with high conviction, visit invesco.com/HighConviction.
You, too, can invest with high conviction by maintaining a long-term investment perspective and by working with your financial adviser on a regular basis. During periods of short-term market volatility or uncertainty, your financial adviser can keep you focused on your long-term investment goals – a new home, a child’s college education or a secure retirement. He or she also can share research about the economy, the markets and individual investment options.
Visit our website for more information on your investments
Our website, invesco.com/us, offers a wide range of market insights and investment perspectives. On the website, you’ll find detailed information about our funds, including performance, holdings and portfolio manager commentaries. You can access information about your account by completing a simple, secure online registration. Click on the “Need to register” link in the “Account Access” box on our homepage to get started.
In addition to the resources accessible on our website and through our mobile app, you can obtain timely updates to help you stay informed about the markets, the economy and investing by connecting with Invesco on Twitter, LinkedIn or Facebook. You can access our blog at blog.invesco.us.com. Our goal is to provide you the information you want, when and where you want it.
Finally, I’m pleased to share with you Invesco’s commitment to both the Principles for Responsible Investment and to considering environmental, social and governance issues in our robust investment process. I invite you to learn more at invesco.com/esg.
Have questions?
For questions about your account, contact an Invesco client services representative at 800 959 4246. For Invesco-related questions or comments, please email me directly at phil@invesco.com.
All of us at Invesco look forward to serving your investment management needs. Thank you for investing with us.
Sincerely,

Philip Taylor
Senior Managing Director, Invesco Ltd.
| | |
| 2 | | Invesco Global Core Equity Fund |
| | | | |

Bruce Crockett | | Dear Fellow Shareholders: Among the many important lessons I’ve learned in more than 40 years in a variety of business endeavors is the value of a trusted advocate. As independent chair of the Invesco Funds Board, I can assure you that the members of the Board are strong advocates for the interests of investors in Invesco’s mutual funds. We work hard to represent your interests through oversight of the quality of the investment management services your funds receive and other matters important to your investment, including but not limited to: |
| | ∎ | | Ensuring that Invesco offers a diverse lineup of mutual funds that your financial adviser can use to strive to meet your financial needs as your investment goals change over time. |
| | ∎ | | Monitoring how the portfolio management teams of the Invesco funds are performing in light of changing economic and market conditions. |
| | |
| ∎ | | Assessing each portfolio management team’s investment performance within the context of the investment strategy described in the fund’s prospectus. |
| ∎ | | Monitoring for potential conflicts of interests that may impact the nature of the services that your funds receive. |
We believe one of the most important services we provide our fund shareholders is the annual review of the funds’ advisory and sub-advisory contracts with Invesco Advisers and its affiliates. This review is required by the Investment Company Act of 1940 and focuses on the nature and quality of the services Invesco provides as the adviser to the Invesco funds and the reasonableness of the fees that it charges for those services. Each year, we spend months carefully reviewing information received from Invesco and a variety of independent sources, such as performance and fee data prepared by Lipper, Inc. (a subsidiary of Broadridge Financial Solutions, Inc.), an independent, third-party firm widely recognized as a leader in its field. We also meet with our independent legal counsel and other independent advisers to review and help us assess the information that we have received. Our goal is to assure that you receive quality investment management services for a reasonable fee.
I trust the measures outlined above provide assurance that you have a worthy advocate when it comes to choosing the Invesco Funds.
As always, please contact me at bruce@brucecrockett.com with any questions or concerns you may have. On behalf of the Board, we look forward to continuing to represent your interests and serving your needs.
Sincerely,

Bruce L. Crockett
Independent Chair
Invesco Funds Board of Trustees
| | |
| 3 | | Invesco Global Core Equity Fund |
Management’s Discussion of Fund Performance
| | | | | | | | | | |
Performance summary For the year ended December 31, 2016, Class A shares of Invesco Global Core Equity Fund (the Fund), at net asset value (NAV), underperformed the MSCI World Index, the Fund’s broad market/style-specific benchmark. Your Fund’s long-term performance appears later in this report. | | | | interest rate increases and a rally in commodities, outperformed their developed-market counterparts (excluding the US) – a reversal from previous years. During the year, stock selection in the consumer staples, energy, industrials and real estate sectors benefited Fund performance relative to the broad market/style-specific benchmark. In addition, overweight exposure in the financials sector benefited Fund performance. The largest detractors from Fund performance relative to the broad market/style-specific index included stock selection in the consumer discretionary, health care, information technology (IT), materials and telecommunication services sectors. From a geographic perspective, stock selection in France, the Netherlands, Sweden and Switzerland was beneficial to the Fund’s relative performance. Conversely, stock selection in Hong Kong, Ireland, Israel, the UK and the US was the largest detractor from the Fund’s relative performance. First Republic Bank was the Fund’s top contributor for the year. The company experienced solid gains, reporting strong operational execution and growth, as well as increases in its loans and deposit balances. Also contributing to the Fund’s performance versus the broad market/style-specific benchmark was Taiwan Semiconductor Manufacturing Company, a parts supplier to the iPhone 7. The company benefited from a broader rally in technology companies and record profits as demand for new iPhones fueled orders for its processor chips. In the positive-performing energy sector, Halliburton performed strongly after reporting stronger-than-expected earnings and revenue growth. |
| Fund vs. Indexes | | |
Total returns, 12/31/15 to 12/31/16, at net asset value (NAV). Performance shown does not include applicable contingent deferred sales charges (CDSC) or front-end sales charges, which would have reduced performance. | | |
Class A Shares | | | | | | 6.70% | | |
Class B Shares | | | | | | 5.88 | | |
Class C Shares | | | | | | 5.87 | | |
Class R Shares | | | | | | 6.45 | | |
Class Y Shares | | | | | | 6.98 | | |
Class R5 Shares | | | | | | 7.07 | | |
MSCI World Indexq (Broad Market/Style-Specific Index) | | 7.51 | | |
Lipper Global Large-Cap Core Funds Index∎ (Peer Group Index) | | 6.91 | | |
Source(s): qFactSet Research Systems Inc.; ∎Lipper Inc. | | |
Market conditions and your Fund Global equities began calendar year 2016 on a negative note, driven by investor concerns about economic weakness in China, falling oil prices and uncertainty over the US Federal Reserve’s (the Fed) monetary policy. Equity markets rebounded strongly in February. Central banks, including the Fed, the European Central Bank and the Bank of Japan, soothed investors’ nerves throughout the reporting period with accommodative policies and dovish rhetoric. Other factors contributing to investor sentiment included rebounding oil prices and, in the US, an improving housing market and employment picture. But the year was volatile and full of surprises – several of them involving elections. In June, the Brexit – the decision by UK voters to leave the European Union – caused global markets to decline sharply, but only briefly. Stocks in economically | | | | sensitive sectors, including energy and financials, were hardest hit, and investors flocked to the perceived safety of US Treasuries and more defensive, dividend-paying equities. Following the surprise outcome of the US presidential election in November, US stocks surged, led by the health care and financials sectors, which might benefit from reduced regulation. Non-US equities, particularly emerging market equities, traded lower on the news due to currency weakness and the prospect of a less favorable trade environment. Also in November, OPEC agreed to cut production for the first time in eight years; the agreement helped support higher oil prices and energy stocks. As expected, the Fed raised interest rates in December 2016, its only rate hike during the reporting period. For the reporting period as a whole, US equities outperformed non-US equities. Emerging markets, supported by the Fed’s delayed | | |
| | | | | | |
| Portfolio Composition | |
| By sector | | % of total net assets | |
| |
Financials | | | 21.7% | |
| Health Care | | | 14.9 | |
| Industrials | | | 14.1 | |
| Information Technology | | | 13.3 | |
| Consumer Discretionary | | | 12.8 | |
| Energy | | | 8.1 | |
| Materials | | | 5.0 | |
| Consumer Staples | | | 4.2 | |
| Telecommunication Services | | | 3.7 | |
| Real Estate | | | 1.3 | |
Money Market Funds Plus Other Assets Less Liabilities | | | 0.9 | |
| | | | |
| Top 10 Equity Holdings* | |
| % of total net assets | |
| |
1. Alphabet Inc.-Class C | | | 2.9% | |
2. American Express Co. | | | 2.8 | |
3. First Republic Bank | | | 2.7 | |
4. General Electric Co. | | | 2.6 | |
5. Sherwin-Williams Co. (The) | | | 2.4 | |
6. Celgene Corp. | | | 2.3 | |
7. Royal Dutch Shell PLC-Class A-ADR | | | 2.2 | |
8. Vodafone Group PLC-ADR | | | 2.2 | |
9. Cognizant Technology Solutions Corp.-Class A | | | 2.1 | |
10. International Business Machines Corp. | | | 2.1 | |
| | | | |
Total Net Assets | | $ | 876.5 million | |
Total Number of Holdings* | | | 68 | |
The Fund’s holdings are subject to change, and there is no assurance that the Fund will continue to hold any particular security.
*Excluding money market fund holdings.
Data presented here are as of December 31, 2016.
| | |
| 4 | | Invesco Global Core Equity Fund |
Detracting from the Fund’s performance for the reporting period was Hertz Global Holdings. The stock’s performance was hurt after the company reported disappointing earnings following the separation of its car rental and equipment rental businesses. We sold our position in Hertz Global Holdings during the reporting period.
Another stock experiencing setbacks was Teva Pharmaceutical Industries, which fell after the company admitted to paying bribes in Russia, Ukraine and Mexico to boost sales and the surprise departure of its chief executive officer.
At the close of the reporting period, our largest overweight positions relative to the MSCI World Index were in the consumer discretionary, energy, financials, health care and industrials sectors. The Fund also had slightly overweight positions in the IT and telecommunication services sectors. The largest underweight positions were in the consumer staples, materials, real estate and utilities sectors.
As always, the Fund focuses on companies that provide an attractive return on invested capital, trade at attractive valuations and have management teams with a long-term perspective. In short, we seek to take advantage of the market’s volatile behavior and short-term focus. We believe our conservative approach should position the Fund to navigate the evolving economic backdrop.
We thank you for your continued investment in Invesco Global Core Equity Fund.
The views and opinions expressed in management’s discussion of Fund performance are those of Invesco Advisers, Inc. These views and opinions are subject to change at any time based on factors such as market and economic conditions. These views and opinions may not be relied upon as investment advice or recommendations, or as an offer for a particular security. The information is not a complete analysis of every aspect of any market, country, industry, security or the Fund. Statements of fact are from sources considered reliable, but Invesco Advisers, Inc. makes no representation or warranty as to their completeness or accuracy. Although historical performance is no guarantee of future results, these insights may help you understand our investment management philosophy.
See important Fund and, if applicable, index disclosures later in this report.
| | |
 | | Erik Esselink Portfolio Manager, is manager of Invesco Global Core Equity Fund. He joined Invesco in |
2007. Mr. Esselink earned a bachelor of science degree from the Rotterdam School of Economics, where he studied commercial economics. |
 | | Brian Nelson Chartered Financial Analyst, Portfolio Manager, is manager of Invesco Global Core Equity |
| Fund. He joined Invesco in 2004. Mr. Nelson earned a BA from the University of California, Santa Barbara. |
Assisted by Invesco’s Global Core Equity Team
| | |
| 5 | | Invesco Global Core Equity Fund |
Your Fund’s Long-Term Performance
Results of a $10,000 Investment – Oldest Share Class(es)
Fund and index data from 12/31/06
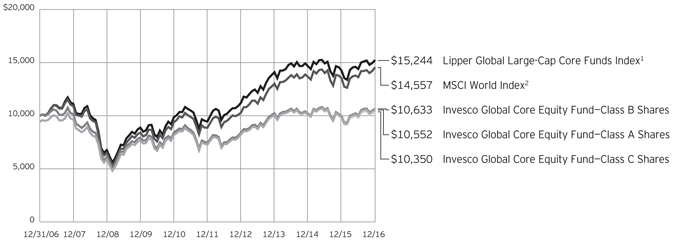
1 Source: Lipper Inc.
2 Source: FactSet Research Systems Inc.
Past performance cannot guarantee comparable future results.
The data shown in the chart include reinvested distributions, applicable sales charges and Fund expenses including management fees. Results for Class B shares are calculated as if a hypothetical
shareholder had liquidated his entire investment in the Fund at the close of the reporting period and paid the contingent deferred sales charges, if applicable. Index results include reinvested dividends, but they do not reflect sales charges. Performance of the peer group,
if applicable, reflects fund expenses and management fees; performance of a market index does not. Performance shown in the chart and table(s) does not reflect deduction of taxes a shareholder would pay on Fund distributions or sale of Fund shares.
continued from page 8
| | prove to be incorrect. Additionally, legislative, regulatory, or tax developments may adversely affect management of the Fund and, therefore, the ability of the Fund to achieve its investment objective. |
| ∎ | | Market risk. The market values of the Fund’s investments, and therefore the value of the Fund’s shares, will go up and down, sometimes rapidly or unpredictably. Market risk may affect a single issuer, industry or section of the economy, or it may affect the market as a whole. Individual stock prices tend to go up and down more dramatically than those of certain other types of investments, such as bonds. During a general downturn in the financial markets, multiple asset classes may decline in value. When markets perform well, there can be no assurance that specific investments held by the Fund will rise in value. |
| ∎ | | Preferred securities risk. Preferred securities are subject to issuer-specific and market risks applicable generally to equity securities. Preferred securities also may be subordinated to bonds or other debt instruments, subjecting |
| | | them to a greater risk of non-payment, may be less liquid than many other securities, such as common stocks, and generally offer no voting rights with respect to the issuer. |
About indexes used in this report
| ∎ | | The MSCI World IndexSM is an unmanaged index considered representative of stocks of developed countries. The index is computed using the net return, which withholds applicable taxes for non-resident investors. |
| ∎ | | The Lipper Global Large-Cap Core Funds Index is an unmanaged index considered representative of global large-cap core funds tracked by Lipper. |
| ∎ | | The Fund is not managed to track the performance of any particular index, including the index(es) described here, and consequently, the performance of the Fund may deviate significantly from the performance of the index(es). |
| ∎ | | A direct investment cannot be made in an index. Unless otherwise indicated, index results include reinvested dividends, and they do not reflect sales charges. Performance of the peer |
| | | group, if applicable, reflects fund expenses; performance of a market index does not. |
Other information
| ∎ | | The returns shown in management’s discussion of Fund performance are based on net asset values (NAVs) calculated for shareholder transactions. Generally accepted accounting principles require adjustments to be made to the net assets of the Fund at period end for financial reporting purposes, and as such, the NAVs for shareholder transactions and the returns based on those NAVs may differ from the NAVs and returns reported in the Financial Highlights. |
| ∎ | | Industry classifications used in this report are generally according to the Global Industry Classification Standard, which was developed by and is the exclusive property and a service mark of MSCI Inc. and Standard & Poor’s. |
| | |
| 6 | | Invesco Global Core Equity Fund |
| | | | |
Average Annual Total Returns As of 12/31/16, including maximum applicable sales charges | |
| |
Class A Shares | | | | |
Inception (12/29/00) | | | 4.43 | % |
10 Years | | | 0.54 | |
5 Years | | | 6.51 | |
1 Year | | | 0.82 | |
| |
Class B Shares | | | | |
Inception (12/29/00) | | | 4.44 | % |
10 Years | | | 0.62 | |
5 Years | | | 6.76 | |
1 Year | | | 0.88 | |
| |
Class C Shares | | | | |
Inception (12/29/00) | | | 4.05 | % |
10 Years | | | 0.34 | |
5 Years | | | 6.91 | |
1 Year | | | 4.87 | |
| |
Class R Shares | | | | |
10 Years | | | 0.85 | % |
5 Years | | | 7.46 | |
1 Year | | | 6.45 | |
| |
Class Y Shares | | | | |
10 Years | | | 1.30 | % |
5 Years | | | 7.99 | |
1 Year | | | 6.98 | |
| |
Class R5 Shares | | | | |
Inception (10/25/05) | | | 3.78 | % |
10 Years | | | 1.56 | |
5 Years | | | 8.09 | |
1 Year | | | 7.07 | |
Class R shares incepted on May 23, 2011. Performance shown prior to that date is that of Class A shares and includes the 12b-1 fees applicable to Class A shares.
Class Y shares incepted on October 3, 2008. Performance shown prior to that date is that of Class A shares and includes the 12b-1 fees applicable to Class A shares.
The performance data quoted represent past performance and cannot guarantee comparable future results; current performance may be lower or higher. Please visit invesco.com/performance for the most recent month-end performance. Performance figures reflect reinvested distributions, changes in net asset value and the effect of the maximum sales charge unless otherwise stated. Investment return and principal value will fluctuate so that you may have a gain or loss when you sell shares.
The net annual Fund operating expense ratio set forth in the most recent Fund prospectus as of the date of this report for Class A, Class B, Class C, Class R, Class Y and Class R5 shares was 1.22%, 1.97%, 1.97%, 1.47%, 0.97% and 0.95%, respectively.1 The total annual Fund operating expense ratio set forth in the most recent Fund prospectus as of the date of this report for Class A, Class B, Class C, Class R, Class Y and Class R5 shares was 1.32%, 2.07%, 2.07%, 1.57%, 1.07% and 0.95%, respectively. The expense ratios presented above may vary from the expense ratios presented in other sections of this report that are based on expenses incurred during the period covered by this report.
Class A share performance reflects the maximum 5.50% sales charge, and Class B and Class C share performance reflects the applicable contingent deferred sales charge (CDSC) for the period involved. The CDSC on Class B shares declines from 5% beginning at the time of purchase to 0% at the beginning of the seventh year. The CDSC on Class C shares is 1% for the first year after purchase. Class R, Class Y and Class R5 shares do not have a front-end sales charge or a CDSC; therefore, performance is at net asset value.
The performance of the Fund’s share classes will differ primarily due to different sales charge structures and class expenses.
Fund performance reflects any applicable fee waivers and/or expense reimbursements. Had the adviser not waived fees and/or reimbursed expenses currently or in the past, returns would have been lower. See current prospectus for more information.
| 1 | Total annual Fund operating expenses after any contractual fee waivers and/or expense reimbursements by the adviser in effect through at least April 30, 2018. See current prospectus for more information. |
| | |
| 7 | | Invesco Global Core Equity Fund |
Invesco Global Core Equity Fund’s investment objective is long-term growth of capital.
| ∎ | | Unless otherwise stated, information presented in this report is as of December 31, 2016, and is based on total net assets. |
| ∎ | | Unless otherwise noted, all data provided by Invesco. |
| ∎ | | To access your Fund’s reports/prospectus, visit invesco.com/fundreports. |
About share classes
| ∎ | | Class B shares may not be purchased for new or additional investments. Please see the prospectus for more information. |
| ∎ | | Class R shares are generally available only to employer sponsored retirement and benefit plans. Please see the prospectus for more information. |
| ∎ | | Class Y shares are available only to certain investors. Please see the prospectus for more information. |
| ∎ | | Class R5 shares are primarily intended for employer sponsored retirement and benefit plans that meet certain standards and for institutional investors. Please see the prospectus for more information. |
Principal risks of investing in the Fund
| ∎ | | Depositary receipts risk. Investing in depositary receipts involves the same risks as direct investments in foreign securities. In addition, the underlying issuers of certain depositary receipts are under no obligation to distribute shareholder communications or pass through any voting rights with respect to the deposited securities to the holders of such receipts. The Fund may therefore receive less timely information or have less control than if it invested directly in the foreign issuer. |
| ∎ | | Derivatives risk. The value of a derivative instrument depends largely on (and is derived from) the value of an underlying security, currency, commodity, interest rate, index or other asset (each referred to as an underlying asset). In addition to risks relating to the underlying assets, the use of derivatives may include other, possibly greater, risks, including counterparty, leverage and liquidity risks. Counterparty risk is the risk that the counterparty to the derivative contract will default on its obligation to pay the Fund the amount owed or otherwise perform under the derivative contract. Derivatives create leverage risk because they do not require payment up front equal to the economic exposure created by owning the derivative. As a result, an |
| | | adverse change in the value of the underlying asset could result in the Fund sustaining a loss that is substantially greater than the amount invested in the derivative, which may make the Fund’s returns more volatile and increase the risk of loss. Derivative instruments may also be less liquid than more traditional investments and the Fund may be unable to sell or close out its derivative positions at a desirable time or price. This risk may be more acute under adverse market conditions, during which the Fund may be most in need of liquidating its derivative positions. Derivatives may also be harder to value, less tax efficient and subject to changing government regulation that could impact the Fund’s ability to use certain derivatives or their cost. Also, derivatives used for hedging or to gain or limit exposure to a particular market segment may not provide the expected benefits, particularly during adverse market conditions. |
| ∎ | | Emerging markets securities risk. Emerging markets (also referred to as developing markets) are generally subject to greater market volatility, political, social and economic instability, uncertain trading markets and more governmental limitations on foreign investment than more developed markets. In addition, companies operating in emerging markets may be subject to lower trading volume and greater price fluctuations than companies in more developed markets. Securities law and the enforcement of systems of taxation in many emerging market countries may change quickly and unpredictably. In addition, investments in emerging markets securities may also be subject to additional transaction costs, delays in settlement procedures, and lack of timely information. |
| ∎ | | Foreign securities risk. The Fund’s foreign investments may be adversely affected by political and social instability, changes in economic or taxation policies, difficulty in enforcing obligations, decreased liquidity or increased volatility. Foreign investments also involve the risk of the possible seizure, nationalization or expropriation of the issuer |
| | | or foreign deposits (in which the Fund could lose its entire investments in a certain market) and the possible adoption of foreign governmental restrictions such as exchange controls. Unless the Fund has hedged its foreign securities risk, foreign securities risk also involves the risk of negative foreign currency rate fluctuations, which may cause the value of securities denominated in such foreign currency (or other instruments through which the Fund has exposure to foreign currencies) to decline in value. Currency exchange rates may fluctuate significantly over short periods of time. Currency hedging strategies, if used, are not always successful. |
| ∎ | | Geographic focus risk. The Fund may from time to time invest a substantial amount of its assets in securities of issuers located in a single country or a limited number of countries. Adverse economic, political or social conditions in those countries may therefore have a significant negative impact on the Fund’s investment performance. |
| ∎ | | Investing in the European Union risk. Investments in certain countries in the European Union are susceptible to high economic risks associated with high levels of debt, such as investments in sovereign debt of Greece, Italy and Spain. Efforts of the member states to further unify their economic and monetary policies may increase the potential for the downward movement of one member state’s market to cause a similar effect on other member states’ markets. Separately, the European Union faces issues involving its membership, structure, procedures and policies. The exit of one or more member states from the European Union, such as the United Kingdom (UK) which has announced its intention to exit, would place its currency and banking system in jeopardy. The exit by the UK or other member states will likely result in increased volatility, illiquidity and potentially lower economic growth in the affected markets, which will adversely affect the Fund’s investments. |
| ∎ | | Management risk. The Fund is actively managed and depends heavily on the Adviser’s judgment about markets, interest rates or the attractiveness, relative values, liquidity, or potential appreciation of particular investments made for the Fund’s portfolio. The Fund could experience losses if these judgments |
continued on page 6
| | |
This report must be accompanied or preceded by a currently effective Fund prospectus, which contains more complete information, including sales charges and expenses. Investors should read it carefully before investing. | | |
| | |
| NOT FDIC INSURED | MAY LOSE VALUE | NO BANK GUARANTEE | | |
| | |
| 8 | | Invesco Global Core Equity Fund |
Schedule of Investments
December 31, 2016
| | | | | | | | |
| | | Shares | | | Value | |
Common Stocks & Other Equity Interests–99.09% | |
| Australia–2.70% | |
Australia and New Zealand Banking Group Ltd. | | | 680,782 | | | $ | 14,904,550 | |
Qantas Airways Ltd. | | | 3,659,654 | | | | 8,769,660 | |
| | | | | | | | 23,674,210 | |
|
| Canada–1.97% | |
Suncor Energy, Inc. | | | 527,207 | | | | 17,235,274 | |
|
| China–1.05% | |
Baidu, Inc.–ADR(a) | | | 56,190 | | | | 9,238,198 | |
|
| France–3.98% | |
Danone | | | 182,513 | | | | 11,551,122 | |
LVMH Moet Hennessy Louis Vuitton S.E. | | | 57,122 | | | | 10,890,832 | |
Publicis Groupe S.A. | | | 180,781 | | | | 12,472,923 | |
| | | | | | | | 34,914,877 | |
|
| Germany–1.97% | |
Porsche Automobil Holding S.E.–Preference Shares | | | 316,886 | | | | 17,224,745 | |
|
| Hong Kong–2.01% | |
AIA Group Ltd. | | | 3,147,200 | | | | 17,612,679 | |
|
| India–0.74% | |
InterGlobe Aviation Ltd.–REGS(b) | | | 533,459 | | | | 6,451,497 | |
|
| Israel–1.01% | |
Teva Pharmaceutical Industries Ltd.–ADR | | | 244,733 | | | | 8,871,571 | |
|
| Japan–7.11% | |
Hitachi, Ltd. | | | 2,638,000 | | | | 14,214,232 | |
KDDI Corp. | | | 550,200 | | | | 13,891,994 | |
Komatsu Ltd. | | | 650,901 | | | | 14,692,229 | |
Mitsui O.S.K. Lines, Ltd. | | | 2,454,000 | | | | 6,778,549 | |
Toyota Motor Corp. | | | 218,700 | | | | 12,768,135 | |
| | | | | | | | 62,345,139 | |
|
| Netherlands–7.82% | |
GrandVision N.V.–REGS(b) | | | 421,094 | | | | 9,265,566 | |
ING Groep N.V. | | | 832,557 | | | | 11,716,236 | |
Koninklijke DSM N.V. | | | 185,492 | | | | 11,103,666 | |
Koninklijke Philips N.V. | | | 480,570 | | | | 14,646,862 | |
Philips Lighting N.V.–REGS(a)(b) | | | 223,820 | | | | 5,512,613 | |
Randstad Holding N.V. | | | 300,506 | | | | 16,274,628 | |
| | | | | | | | 68,519,571 | |
|
| Singapore–1.35% | |
DBS Group Holdings Ltd. | | | 992,300 | | | | 11,839,286 | |
|
| Sweden–0.51% | |
Sandvik AB | | | 363,048 | | | | 4,483,132 | |
| | | | | | | | |
| | | Shares | | | Value | |
| Switzerland–3.50% | |
ABB Ltd. | | | 398,672 | | | $ | 8,392,180 | |
Roche Holding AG | | | 59,554 | | | | 13,568,904 | |
UBS Group AG | | | 555,842 | | | | 8,705,926 | |
| | | | | 30,667,010 | |
|
| Taiwan–1.91% | |
Taiwan Semiconductor Manufacturing Co. Ltd. | | | 2,998,000 | | | | 16,738,792 | |
|
| United Kingdom–10.60% | |
British American Tobacco PLC | | | 145,849 | | | | 8,283,164 | |
Diageo PLC | | | 328,407 | | | | 8,498,319 | |
Liberty Global PLC–Series A(a) | | | 373,312 | | | | 11,419,614 | |
Rio Tinto PLC | | | 296,991 | | | | 11,312,359 | |
Royal Dutch Shell PLC–Class A–ADR | | | 357,755 | | | | 19,454,717 | |
St. James’s Place PLC | | | 1,213,454 | | | | 15,097,027 | |
Vodafone Group PLC–ADR | | | 771,149 | | | | 18,839,170 | |
| | | | | 92,904,370 | |
|
| United States–50.86% | |
AbbVie Inc. | | | 222,529 | | | | 13,934,766 | |
Allergan PLC(a) | | | 65,747 | | | | 13,807,527 | |
Alphabet Inc.–Class C(a) | | | 33,143 | | | | 25,580,430 | |
American Express Co. | | | 332,399 | | | | 24,624,118 | |
Berkshire Hathaway Inc.–Class A(a) | | | 72 | | | | 17,576,712 | |
Biogen Inc.(a) | | | 49,937 | | | | 14,161,134 | |
BioMarin Pharmaceutical Inc.(a) | | | 23,755 | | | | 1,967,864 | |
Celgene Corp.(a) | | | 176,607 | | | | 20,442,260 | |
Chevron Corp. | | | 140,456 | | | | 16,531,671 | |
Cognizant Technology Solutions Corp.– Class A(a) | | | 322,750 | | | | 18,083,682 | |
Comcast Corp.–Class A | | | 249,280 | | | | 17,212,784 | |
Concho Resources Inc.(a) | | | 64,458 | | | | 8,547,131 | |
Delphi Automotive PLC | | | 195,538 | | | | 13,169,484 | |
Eaton Corp. PLC | | | 130,381 | | | | 8,747,261 | |
First Republic Bank | | | 255,134 | | | | 23,508,047 | |
General Electric Co. | | | 712,563 | | | | 22,516,991 | |
General Growth Properties, Inc. | | | 445,840 | | | | 11,137,083 | |
Halliburton Co. | | | 165,254 | | | | 8,938,589 | |
HCA Holdings, Inc.(a) | | | 161,243 | | | | 11,935,207 | |
Incyte Corp.(a) | | | 18,397 | | | | 1,844,667 | |
International Business Machines Corp. | | | 108,332 | | | | 17,982,029 | |
Marsh & McLennan Cos., Inc. | | | 189,981 | | | | 12,840,816 | |
McKesson Corp. | | | 54,899 | | | | 7,710,565 | |
Moody’s Corp. | | | 159,241 | | | | 15,011,649 | |
Nielsen Holdings PLC | | | 154,688 | | | | 6,489,162 | |
Priceline Group Inc. (The)(a) | | | 5,173 | | | | 7,583,928 | |
Progressive Corp. (The) | | | 470,908 | | | | 16,717,234 | |
QUALCOMM, Inc. | | | 228,384 | | | | 14,890,637 | |
Sherwin-Williams Co. (The) | | | 78,290 | | | | 21,039,655 | |
See accompanying Notes to Financial Statements which are an integral part of the financial statements.
9 Invesco Global Core Equity Fund
| | | | | | | | |
| | | Shares | | | Value | |
| United States–(continued) | |
Shire PLC–ADR | | | 77,091 | | | $ | 13,134,765 | |
Thermo Fisher Scientific, Inc. | | | 58,070 | | | | 8,193,677 | |
Vertex Pharmaceuticals Inc.(a) | | | 18,753 | | | | 1,381,533 | |
Walgreens Boots Alliance, Inc. | | | 103,460 | | | | 8,562,350 | |
| | | | | 445,805,408 | |
Total Common Stocks & Other Equity Interests
(Cost $830,298,462) | | | | 868,525,759 | |
| | | | | | | | |
| | | Shares | | | Value | |
Money Market Funds–0.57% | |
Government & Agency Portfolio–Institutional Class, 0.43%(c) | | | 2,988,338 | | | $ | 2,988,338 | |
Treasury Portfolio–Institutional Class, 0.37%(c) | | | 1,992,225 | | | | 1,992,225 | |
Total Money Market Funds
(Cost $4,980,563) | | | | 4,980,563 | |
TOTAL INVESTMENTS–99.66%
(Cost $835,279,025) | | | | 873,506,322 | |
OTHER ASSETS LESS LIABILITIES–0.34% | | | | 3,009,229 | |
NET ASSETS–100.00% | | | $ | 876,515,551 | |
Investment Abbreviations:
| | |
| ADR | | – American Depositary Receipt |
| REGS | | – Regulation S |
Notes to Schedule of Investments:
| (a) | Non-income producing security. |
| (b) | Security purchased or received in a transaction exempt from registration under the Securities Act of 1933, as amended (the “1933 Act”). The security may be resold pursuant to an exemption from registration under the 1933 Act, typically to qualified institutional buyers. The aggregate value of these securities at December 31, 2016 was $21,229,676, which represented 2.42% of the Fund’s Net Assets. |
| (c) | The money market fund and the Fund are affiliated by having the same investment adviser. The rate shown is the 7-day SEC standardized yield as of December 31, 2016. |
See accompanying Notes to Financial Statements which are an integral part of the financial statements.
10 Invesco Global Core Equity Fund
Statement of Assets and Liabilities
December 31, 2016
| | | | |
Assets: | |
Investments, at value (Cost $830,298,462) | | $ | 868,525,759 | |
Investments in affiliated money market funds, at value and cost | | | 4,980,563 | |
Total investments, at value (Cost $835,279,025) | | | 873,506,322 | |
Foreign currencies, at value (Cost $726,146) | | | 722,568 | |
Receivable for: | | | | |
Investments sold | | | 493 | |
Fund shares sold | | | 1,186,938 | |
Dividends | | | 2,051,206 | |
Investment for trustee deferred compensation and retirement plans | | | 208,505 | |
Unrealized appreciation on forward foreign currency contracts outstanding | | | 2,664,490 | |
Other assets | | | 61,225 | |
Total assets | | | 880,401,747 | |
|
Liabilities: | |
Payable for: | | | | |
Fund shares reacquired | | | 2,870,390 | |
Accrued fees to affiliates | | | 589,527 | |
Accrued trustees’ and officers’ fees and benefits | | | 222 | |
Accrued other operating expenses | | | 140,230 | |
Trustee deferred compensation and retirement plans | | | 285,827 | |
Total liabilities | | | 3,886,196 | |
Net assets applicable to shares outstanding | | $ | 876,515,551 | |
|
Net assets consist of: | |
Shares of beneficial interest | | $ | 842,377,512 | |
Undistributed net investment income | | | 1,101,767 | |
Undistributed net realized gain (loss) | | | (7,734,133 | ) |
Net unrealized appreciation | | | 40,770,405 | |
| | | $ | 876,515,551 | |
| | | | |
Net Assets: | |
Class A | | $ | 749,810,065 | |
Class B | | $ | 15,389,613 | |
Class C | | $ | 83,864,446 | |
Class R | | $ | 1,054,411 | |
Class Y | | $ | 25,996,154 | |
Class R5 | | $ | 400,862 | |
|
Shares outstanding, no par value,
with an unlimited number of shares authorized: | |
Class A | | | 53,995,002 | |
Class B | | | 1,163,126 | |
Class C | | | 6,323,364 | |
Class R | | | 75,968 | |
Class Y | | | 1,872,646 | |
Class R5 | | | 28,511 | |
Class A: | | | | |
Net asset value per share | | $ | 13.89 | |
Maximum offering price per share | | | | |
(Net asset value of $13.89 ¸ 94.50%) | | $ | 14.70 | |
Class B: | | | | |
Net asset value and offering price per share | | $ | 13.23 | |
Class C: | | | | |
Net asset value and offering price per share | | $ | 13.26 | |
Class R: | | | | |
Net asset value and offering price per share | | $ | 13.88 | |
Class Y: | | | | |
Net asset value and offering price per share | | $ | 13.88 | |
Class R5: | | | | |
Net asset value and offering price per share | | $ | 14.06 | |
See accompanying Notes to Financial Statements which are an integral part of the financial statements.
11 Invesco Global Core Equity Fund
Statement of Operations
For the year ended December 31, 2016
| | | | |
Investment income: | |
Dividends (net of foreign withholding taxes of $1,125,472) | | $ | 19,476,368 | |
Dividends from affiliated money market funds | | | 28,625 | |
Other income | | | 880,644 | |
Total investment income | | | 20,385,637 | |
| |
Expenses: | | | | |
Advisory fees | | | 7,033,545 | |
Administrative services fees | | | 233,318 | |
Distribution fees: | | | | |
Class A | | | 1,946,707 | |
Class B | | | 180,322 | |
Class C | | | 882,871 | |
Class R | | | 5,366 | |
Transfer agent fees — A, B, C, R and Y | | | 1,920,960 | |
Transfer agent fees — R5 | | | 207 | |
Trustees’ and officers’ fees and benefits | | | 35,279 | |
Registration and filing fees | | | 92,047 | |
Reports to shareholders | | | 128,757 | |
Professional services fees | | | 65,010 | |
Other | | | 31,831 | |
Total expenses | | | 12,556,220 | |
Less: Fees waived and expense offset arrangement(s) | | | (20,538 | ) |
Net expenses | | | 12,535,682 | |
Net investment income | | | 7,849,955 | |
| |
Realized and unrealized gain (loss) from: | | | | |
Net realized gain from: | | | | |
Investment securities (includes net gains from securities sold to affiliates of $13,963) | | | 9,425,947 | |
Foreign currencies | | | 132,416 | |
| | | | 9,558,363 | |
Change in net unrealized appreciation (depreciation) of: | | | | |
Investment securities | | | 37,085,784 | |
Foreign currencies | | | (8,554 | ) |
Forward foreign currency contracts | | | 2,664,490 | |
| | | | 39,741,720 | |
Net realized and unrealized gain | | | 49,300,083 | |
Net increase in net assets resulting from operations | | $ | 57,150,038 | |
See accompanying Notes to Financial Statements which are an integral part of the financial statements.
12 Invesco Global Core Equity Fund
Statement of Changes in Net Assets
For the years ended December 31, 2016 and 2015
| | | | | | | | |
| | | 2016 | | | 2015 | |
Operations: | | | | | | | | |
Net investment income | | $ | 7,849,955 | | | $ | 6,538,931 | |
Net realized gain | | | 9,558,363 | | | | 14,858,110 | |
Change in net unrealized appreciation (depreciation) | | | 39,741,720 | | | | (41,329,101 | ) |
Net increase (decrease) in net assets resulting from operations | | | 57,150,038 | | | | (19,932,060 | ) |
| | |
Distributions to shareholders from net investment income: | | | | | | | | |
Class A | | | (7,430,231 | ) | | | (5,722,131 | ) |
Class B | | | (37,850 | ) | | | (24,901 | ) |
Class C | | | (203,316 | ) | | | (106,904 | ) |
Class R | | | (7,690 | ) | | | (4,732 | ) |
Class Y | | | (305,315 | ) | | | (175,337 | ) |
Class R5 | | | (2,852 | ) | | | (1,925 | ) |
Total distributions from net investment income | | | (7,987,254 | ) | | | (6,035,930 | ) |
| | |
Distributions to shareholders from net realized gains: | | | | | | | | |
Class A | | | (2,629,406 | ) | | | (4,251,489 | ) |
Class B | | | (57,903 | ) | | | (120,649 | ) |
Class C | | | (311,031 | ) | | | (517,958 | ) |
Class R | | | (3,633 | ) | | | (4,867 | ) |
Class Y | | | (85,628 | ) | | | (98,075 | ) |
Class R5 | | | (739 | ) | | | (959 | ) |
Total distributions from net realized gains | | | (3,088,340 | ) | | | (4,993,997 | ) |
| | |
Share transactions–net: | | | | | | | | |
Class A | | | (108,732,809 | ) | | | (89,885,580 | ) |
Class B | | | (7,151,077 | ) | | | (9,525,166 | ) |
Class C | | | (15,379,050 | ) | | | (13,413,384 | ) |
Class R | | | (38,622 | ) | | | 256,999 | |
Class Y | | | 6,741,127 | | | | (2,099,434 | ) |
Class R5 | | | 199,994 | | | | (166,363 | ) |
Net increase (decrease) in net assets resulting from share transactions | | | (124,360,437 | ) | | | (114,832,928 | ) |
Net increase (decrease) in net assets | | | (78,285,993 | ) | | | (145,794,915 | ) |
| | |
Net assets: | | | | | | | | |
Beginning of year | | | 954,801,544 | | | | 1,100,596,459 | |
End of year (includes undistributed net investment income of $1,101,767 and $1,070,293, respectively) | | $ | 876,515,551 | | | $ | 954,801,544 | |
Notes to Financial Statements
December 31, 2016
NOTE 1—Significant Accounting Policies
Invesco Global Core Equity Fund (the “Fund”) is a series portfolio of AIM Funds Group (Invesco Funds Group) (the “Trust”). The Trust is a Delaware statutory trust registered under the Investment Company Act of 1940, as amended (the “1940 Act”), as an open-end series management investment company consisting of four separate portfolios, each authorized to issue an unlimited number of shares of beneficial interest. The assets, liabilities and operations of each portfolio are accounted for separately. Information presented in these financial statements pertains only to the Fund. Matters affecting each portfolio or class will be voted on exclusively by the shareholders of such portfolio or class.
The Fund’s investment objective is long-term growth of capital.
The Fund currently consists of six different classes of shares: Class A, Class B, Class C, Class R, Class Y and Class R5. Class Y shares are available only to certain investors. Class A shares are sold with a front-end sales charge unless certain waiver criteria are met and under certain circumstances load waived shares may be subject to contingent deferred sales charges (“CDSC”). Class C shares are sold with a CDSC. Class R, Class Y and Class R5 shares are sold at net asset value. Effective November 30, 2010, new or additional investments in Class B shares are no longer permitted. Existing shareholders of Class B shares may continue to reinvest dividends and capital gains distributions in Class B shares until they convert to Class A shares.
13 Invesco Global Core Equity Fund
Also, shareholders in Class B shares will be able to exchange those shares for Class B shares of other Invesco Funds offering such shares until they convert to Class A shares. Generally, Class B shares will automatically convert to Class A shares on or about the month-end, which is at least eight years after the date of purchase. Redemption of Class B shares prior to the conversion date will be subject to a CDSC.
The Fund is an investment company and accordingly follows the investment company accounting and reporting guidance in accordance with Financial Accounting Standards Board Accounting Standards Codification Topic 946, Financial Services — Investment Companies.
The following is a summary of the significant accounting policies followed by the Fund in the preparation of its financial statements.
| A. | Security Valuations — Securities, including restricted securities, are valued according to the following policy. |
A security listed or traded on an exchange (except convertible securities) is valued at its last sales price or official closing price as of the close of the customary trading session on the exchange where the security is principally traded, or lacking any sales or official closing price on a particular day, the security may be valued at the closing bid price on that day. Securities traded in the over-the-counter market are valued based on prices furnished by independent pricing services or market makers. When such securities are valued by an independent pricing service they may be considered fair valued. Futures contracts are valued at the final settlement price set by an exchange on which they are principally traded. Listed options are valued at the mean between the last bid and asked prices from the exchange on which they are principally traded. Options not listed on an exchange are valued by an independent source at the mean between the last bid and asked prices. For purposes of determining net asset value (“NAV”) per share, futures and option contracts generally are valued 15 minutes after the close of the customary trading session of the New York Stock Exchange (“NYSE”).
Investments in open-end and closed-end registered investment companies that do not trade on an exchange are valued at the end-of-day net asset value per share. Investments in open-end and closed-end registered investment companies that trade on an exchange are valued at the last sales price or official closing price as of the close of the customary trading session on the exchange where the security is principally traded.
Debt obligations (including convertible securities) and unlisted equities are fair valued using an evaluated quote provided by an independent pricing service. Evaluated quotes provided by the pricing service may be determined without exclusive reliance on quoted prices, and may reflect appropriate factors such as institution-size trading in similar groups of securities, developments related to specific securities, dividend rate (for unlisted equities), yield (for debt obligations), quality, type of issue, coupon rate (for debt obligations), maturity (for debt obligations), individual trading characteristics and other market data. Debt obligations are subject to interest rate and credit risks. In addition, all debt obligations involve some risk of default with respect to interest and/or principal payments.
Foreign securities’ (including foreign exchange contracts) prices are converted into U.S. dollar amounts using the applicable exchange rates as of the close of the NYSE. If market quotations are available and reliable for foreign exchange-traded equity securities, the securities will be valued at the market quotations. Because trading hours for certain foreign securities end before the close of the NYSE, closing market quotations may become unreliable. If between the time trading ends on a particular security and the close of the customary trading session on the NYSE, events occur that the Adviser determines are significant and make the closing price unreliable, the Fund may fair value the security. If the event is likely to have affected the closing price of the security, the security will be valued at fair value in good faith using procedures approved by the Board of Trustees. Adjustments to closing prices to reflect fair value may also be based on a screening process of an independent pricing service to indicate the degree of certainty, based on historical data, that the closing price in the principal market where a foreign security trades is not the current value as of the close of the NYSE. Foreign securities’ prices meeting the approved degree of certainty that the price is not reflective of current value will be priced at the indication of fair value from the independent pricing service. Multiple factors may be considered by the independent pricing service in determining adjustments to reflect fair value and may include information relating to sector indices, American Depositary Receipts and domestic and foreign index futures. Foreign securities may have additional risks including exchange rate changes, potential for sharply devalued currencies and high inflation, political and economic upheaval, the relative lack of issuer information, relatively low market liquidity and the potential lack of strict financial and accounting controls and standards.
Securities for which market prices are not provided by any of the above methods may be valued based upon quotes furnished by independent sources. The last bid price may be used to value equity securities. The mean between the last bid and asked prices is used to value debt obligations, including corporate loans.
Securities for which market quotations are not readily available or became unreliable are valued at fair value as determined in good faith by or under the supervision of the Trust’s officers following procedures approved by the Board of Trustees. Issuer specific events, market trends, bid/asked quotes of brokers and information providers and other market data may be reviewed in the course of making a good faith determination of a security’s fair value.
The Fund may invest in securities that are subject to interest rate risk, meaning the risk that the prices will generally fall as interest rates rise and, conversely, the prices will generally rise as interest rates fall. Specific securities differ in their sensitivity to changes in interest rates depending on their individual characteristics. Changes in interest rates may result in increased market volatility, which may affect the value and/or liquidity of certain Fund investments.
Valuations change in response to many factors including the historical and prospective earnings of the issuer, the value of the issuer’s assets, general economic conditions, interest rates, investor perceptions and market liquidity. Because of the inherent uncertainties of valuation, the values reflected in the financial statements may materially differ from the value received upon actual sale of those investments.
| B. | Securities Transactions and Investment Income — Securities transactions are accounted for on a trade date basis. Realized gains or losses on sales are computed on the basis of specific identification of the securities sold. Interest income (net of withholding tax, if any) is recorded on the accrual basis from settlement date. Dividend income (net of withholding tax, if any) is recorded on the ex-dividend date. |
The Fund may periodically participate in litigation related to Fund investments. As such, the Fund may receive proceeds from litigation settlements. Any proceeds received are included in the Statement of Operations as realized gain (loss) for investments no longer held and as unrealized gain (loss) for investments still held.
Brokerage commissions and mark ups are considered transaction costs and are recorded as an increase to the cost basis of securities purchased and/or a reduction of proceeds on a sale of securities. Such transaction costs are included in the determination of net realized and unrealized gain (loss) from investment securities reported in the Statement of Operations and the Statement of Changes in Net Assets and the net realized and unrealized gains (losses) on securities per share in the Financial Highlights. Transaction costs are included in the calculation of the Fund’s net asset value and, accordingly, they reduce the Fund’s total returns. These transaction costs are not considered operating expenses and
14 Invesco Global Core Equity Fund
are not reflected in net investment income reported in the Statement of Operations and the Statement of Changes in Net Assets, or the net investment income per share and the ratios of expenses and net investment income reported in the Financial Highlights, nor are they limited by any expense limitation arrangements between the Fund and the investment adviser.
The Fund allocates income and realized and unrealized capital gains and losses to a class based on the relative net assets of each class.
| C. | Country Determination — For the purposes of making investment selection decisions and presentation in the Schedule of Investments, the investment adviser may determine the country in which an issuer is located and/or credit risk exposure based on various factors. These factors include the laws of the country under which the issuer is organized, where the issuer maintains a principal office, the country in which the issuer derives 50% or more of its total revenues and the country that has the primary market for the issuer’s securities, as well as other criteria. Among the other criteria that may be evaluated for making this determination are the country in which the issuer maintains 50% or more of its assets, the type of security, financial guarantees and enhancements, the nature of the collateral and the sponsor organization. Country of issuer and/or credit risk exposure has been determined to be the United States of America, unless otherwise noted. |
| D. | Distributions — Distributions from net investment income and net realized capital gain, if any, are generally declared and paid annually and recorded on the ex-dividend date. The Fund may elect to treat a portion of the proceeds from redemptions as distributions for federal income tax purposes. |
| E. | Federal Income Taxes — The Fund intends to comply with the requirements of Subchapter M of the Internal Revenue Code of 1986, as amended (the “Internal Revenue Code”), necessary to qualify as a regulated investment company and to distribute substantially all of the Fund’s taxable earnings to shareholders. As such, the Fund will not be subject to federal income taxes on otherwise taxable income (including net realized capital gain) that is distributed to shareholders. Therefore, no provision for federal income taxes is recorded in the financial statements. |
The Fund recognizes the tax benefits of uncertain tax positions only when the position is more likely than not to be sustained. Management has analyzed the Fund’s uncertain tax positions and concluded that no liability for unrecognized tax benefits should be recorded related to uncertain tax positions. Management is not aware of any tax positions for which it is reasonably possible that the total amounts of unrecognized tax benefits will change materially in the next 12 months.
The Fund files tax returns in the U.S. Federal jurisdiction and certain other jurisdictions. Generally, the Fund is subject to examinations by such taxing authorities for up to three years after the filing of the return for the tax period.
| F. | Expenses — Fees provided for under the Rule 12b-1 plan of a particular class of the Fund are charged to the operations of such class. Transfer agency fees and expenses and other shareholder recordkeeping fees and expenses attributable to Class R5 are charged to such class. Transfer agency fees and expenses and other shareholder recordkeeping fees and expenses relating to all other classes are allocated among those classes based on relative net assets. All other expenses are allocated among the classes based on relative net assets. |
| G. | Accounting Estimates — The preparation of financial statements in conformity with accounting principles generally accepted in the United States of America (“GAAP”) requires management to make estimates and assumptions that affect the reported amounts of assets and liabilities at the date of the financial statements and the reported amounts of revenues and expenses during the reporting period including estimates and assumptions related to taxation. Actual results could differ from those estimates by a significant amount. In addition, the Fund monitors for material events or transactions that may occur or become known after the period-end date and before the date the financial statements are released to print. |
| H. | Indemnifications — Under the Trust’s organizational documents, each Trustee, officer, employee or other agent of the Trust is indemnified against certain liabilities that may arise out of the performance of their duties to the Fund. Additionally, in the normal course of business, the Fund enters into contracts, including the Fund’s servicing agreements, that contain a variety of indemnification clauses. The Fund’s maximum exposure under these arrangements is unknown as this would involve future claims that may be made against the Fund that have not yet occurred. The risk of material loss as a result of such indemnification claims is considered remote. |
| I. | Foreign Currency Translations — Foreign currency is valued at the close of the NYSE based on quotations posted by banks and major currency dealers. Portfolio securities and other assets and liabilities denominated in foreign currencies are translated into U.S. dollar amounts at date of valuation. Purchases and sales of portfolio securities (net of foreign taxes withheld on disposition) and income items denominated in foreign currencies are translated into U.S. dollar amounts on the respective dates of such transactions. The Fund does not separately account for the portion of the results of operations resulting from changes in foreign exchange rates on investments and the fluctuations arising from changes in market prices of securities held. The combined results of changes in foreign exchange rates and the fluctuation of market prices on investments (net of estimated foreign tax withholding) are included with the net realized and unrealized gain or loss from investments in the Statement of Operations. Reported net realized foreign currency gains or losses arise from (1) sales of foreign currencies, (2) currency gains or losses realized between the trade and settlement dates on securities transactions, and (3) the difference between the amounts of dividends, interest, and foreign withholding taxes recorded on the Fund’s books and the U.S. dollar equivalent of the amounts actually received or paid. Net unrealized foreign currency gains and losses arise from changes in the fair values of assets and liabilities, other than investments in securities at fiscal period end, resulting from changes in exchange rates. |
The Fund may invest in foreign securities, which may be subject to foreign taxes on income, gains on investments or currency repatriation, a portion of which may be recoverable. Foreign taxes, if any, are recorded based on the tax regulations and rates that exist in the foreign markets in which the Fund invests and are shown in the Statement of Operations.
| J. | Forward Foreign Currency Contracts — The Fund may engage in foreign currency transactions either on a spot (i.e. for prompt delivery and settlement) basis, or through forward foreign currency contracts, to manage or minimize currency or exchange rate risk. |
The Fund may also enter into forward foreign currency contracts for the purchase or sale of a security denominated in a foreign currency in order to “lock in” the U.S. dollar price of that security, or the Fund may also enter into forward foreign currency contracts that do not provide for physical settlement of the two currencies, but instead are settled by a single cash payment calculated as the difference between the agreed upon exchange rate and the spot rate at settlement based upon an agreed upon notional amount (non-deliverable forwards). The Fund will set aside liquid assets in an amount equal to the daily mark-to-market obligation for forward foreign currency contracts.
A forward foreign currency contract is an obligation between two parties (“Counterparties”) to purchase or sell a specific currency for an agreed-upon price at a future date. The use of forward foreign currency contracts does not eliminate fluctuations in the price of the underlying securities the Fund owns or intends to acquire but establishes a rate of exchange in advance. Fluctuations in the value of these contracts are
15 Invesco Global Core Equity Fund
measured by the difference in the contract date and reporting date exchange rates and are recorded as unrealized appreciation (depreciation) until the contracts are closed. When the contracts are closed, realized gains (losses) are recorded. Realized and unrealized gains (losses) on the contracts are included in the Statement of Operations. The primary risks associated with forward foreign currency contracts include failure of the Counterparty to meet the terms of the contract and the value of the foreign currency changing unfavorably. These risks may be in excess of the amounts reflected in the Statement of Assets and Liabilities.
NOTE 2—Advisory Fees and Other Fees Paid to Affiliates
The Trust has entered into a master investment advisory agreement with Invesco Advisers, Inc. (the “Adviser” or “Invesco”). Under the terms of the investment advisory agreement, the Fund pays an advisory fee to the Adviser based on the annual rate of the Fund’s average daily net assets as follows:
| | | | |
| Average Daily Net Assets | | Rate | |
First $250 million | | | 0.80% | |
Next $250 million | | | 0.78% | |
Next $500 million | | | 0.76% | |
Next $1.5 billion | | | 0.74% | |
Next $2.5 billion | | | 0.72% | |
Next $2.5 billion | | | 0.70% | |
Next $2.5 billion | | | 0.68% | |
Over $10 billion | | | 0.66% | |
For the year ended December 31, 2016, the effective advisory fees incurred by the Fund was 0.78%.
Under the terms of a master sub-advisory agreement between the Adviser and each of Invesco Asset Management Deutschland GmbH, Invesco Asset Management Limited, Invesco Asset Management (Japan) Limited, Invesco Hong Kong Limited, Invesco Senior Secured Management, Inc. and Invesco Canada Ltd. (collectively, the “Affiliated Sub-Advisers”) the Adviser, not the Fund, will pay 40% of the fees paid to the Adviser to any such Affiliated Sub-Adviser(s) that provide(s) discretionary investment management services to the Fund based on the percentage of assets allocated to such Affiliated Sub-Adviser(s).
The Adviser had contractually agreed, through June 30, 2017, to waive advisory fees and/or reimburse expenses of all shares to the extent necessary to limit total annual fund operating expenses after fee waiver and/or expense reimbursement (excluding certain items discussed below) of Class A, Class B, Class C, Class R, Class Y and Class R5 shares to 2.25%, 3.00%, 3.00%, 2.50%, 2.00% and 2.00%, respectively, of average daily net assets (the “expense limits”). Effective January 1, 2017, the Adviser has contractually agreed, through at least April 30, 2018, to waive advisory fees and/or reimburse expenses of all shares to the extent necessary to limit total annual fund operating expenses after fee waiver and/or expense reimbursement of Class A, Class B, Class C, Class R, Class Y and Class R5 shares to 1.22%, 1.97%, 1.97%, 1.47%, 0.97% and 0.97%, respectively, of average daily net assets. In determining the Adviser’s obligation to waive advisory fees and/or reimburse expenses, the following expenses are not taken into account, and could cause the total annual fund operating expenses after fee waiver and/or expense reimbursement to exceed the numbers reflected above: (1) interest; (2) taxes; (3) dividend expense on short sales; (4) extraordinary or non-routine items, including litigation expenses; and (5) expenses that the Fund has incurred but did not actually pay because of an expense offset arrangement. Unless Invesco continues the fee waiver agreement, it will terminate on April 30, 2018. During its term, the fee waiver agreement cannot be terminated or amended to increase the expense limits without approval of the Board of Trustees. The Adviser did not waive fees and/or reimburse expenses during the period under these expense limits.
Further, the Adviser has contractually agreed, through at least June 30, 2018, to waive the advisory fee payable by the Fund in an amount equal to 100% of the net advisory fees the Adviser receives from the affiliated money market funds on investments by the Fund of uninvested cash in such affiliated money market funds.
For the year ended December 31, 2016, the Adviser waived advisory fees of $12,207.
The Trust has entered into a master administrative services agreement with Invesco pursuant to which the Fund has agreed to pay Invesco for certain administrative costs incurred in providing accounting services to the Fund. For the year ended December 31, 2016, expenses incurred under the agreement are shown in the Statement of Operations as Administrative services fees.
The Trust has entered into a transfer agency and service agreement with Invesco Investment Services, Inc. (“IIS”) pursuant to which the Fund has agreed to pay IIS a fee for providing transfer agency and shareholder services to the Fund and reimburse IIS for certain expenses incurred by IIS in the course of providing such services. IIS may make payments to intermediaries that provide omnibus account services, sub-accounting services and/or networking services. All fees payable by IIS to intermediaries that provide omnibus account services or sub-accounting are charged back to the Fund, subject to certain limitations approved by the Trust’s Board of Trustees. For the year ended December 31, 2016, expenses incurred under the agreement are shown in the Statement of Operations as Transfer agent fees.
The Trust has entered into master distribution agreements with Invesco Distributors, Inc. (“IDI”) to serve as the distributor for the Class A, Class B, Class C, Class R, Class Y and Class R5 shares of the Fund. The Trust has adopted plans pursuant to Rule 12b-1 under the 1940 Act with respect to the Fund’s Class A, Class B, Class C and Class R shares (collectively, the “Plans”). The Fund, pursuant to the Plans, pays IDI compensation at the annual rate of 0.25% of the Fund’s average daily net assets of Class A shares, 1.00% of the average daily net assets of Class B and Class C shares and 0.50% of the average daily net assets of Class R shares. Of the Plan payments, up to 0.25% of the average daily net assets of each class of shares may be paid to furnish continuing personal shareholder services to customers who purchase and own shares of such classes. Any amounts not paid as a service fee under the Plans would constitute an asset-based sales charge. Rules of the Financial Industry Regulatory Authority (“FINRA”) impose a cap on the total sales charges, including asset-based sales charges, that may be paid by any class of shares of the Fund. For the year ended December 31, 2016, expenses incurred under the Plans are shown in the Statement of Operations as Distribution fees.
Front-end sales commissions and CDSC (collectively, the “sales charges”) are not recorded as expenses of the Fund. Front-end sales commissions are deducted from proceeds from the sales of Fund shares prior to investment in Class A shares of the Fund. CDSC are deducted from redemption
16 Invesco Global Core Equity Fund
proceeds prior to remittance to the shareholder. During the year ended December 31, 2016, IDI advised the Fund that IDI retained $63,935 in front-end sales commissions from the sale of Class A shares and $4,850, $3,360 and $1,179 from Class A, Class B and Class C shares, respectively, for CDSC imposed on redemptions by shareholders.
For the year ended December 31, 2016, the Fund incurred $84 in brokerage commissions with Invesco Capital Markets, Inc., an affiliate of the Adviser and IDI, for portfolio transactions executed on behalf of the Fund.
Certain officers and trustees of the Trust are officers and directors of the Adviser, IIS and/or IDI.
NOTE 3—Additional Valuation Information
GAAP defines fair value as the price that would be received to sell an asset or paid to transfer a liability in an orderly transaction between market participants at the measurement date, under current market conditions. GAAP establishes a hierarchy that prioritizes the inputs to valuation methods, giving the highest priority to readily available unadjusted quoted prices in an active market for identical assets (Level 1) and the lowest priority to significant unobservable inputs (Level 3), generally when market prices are not readily available or are unreliable. Based on the valuation inputs, the securities or other investments are tiered into one of three levels. Changes in valuation methods may result in transfers in or out of an investment’s assigned level:
| | Level 1 — | Prices are determined using quoted prices in an active market for identical assets. |
| | Level 2 — | Prices are determined using other significant observable inputs. Observable inputs are inputs that other market participants may use in pricing a security. These may include quoted prices for similar securities, interest rates, prepayment speeds, credit risk, yield curves, loss severities, default rates, discount rates, volatilities and others. |
| | Level 3 — | Prices are determined using significant unobservable inputs. In situations where quoted prices or observable inputs are unavailable (for example, when there is little or no market activity for an investment at the end of the period), unobservable inputs may be used. Unobservable inputs reflect the Fund’s own assumptions about the factors market participants would use in determining fair value of the securities or instruments and would be based on the best available information. |
The following is a summary of the tiered valuation input levels, as of December 31, 2016. The level assigned to the securities valuations may not be an indication of the risk or liquidity associated with investing in those securities. Because of the inherent uncertainties of valuation, the values reflected in the financial statements may materially differ from the value received upon actual sale of those investments.
During the year ended December 31, 2016, there were transfers from Level 1 to Level 2 of $11,312,359 and from Level 2 to Level 1 of $21,738,488, due to foreign fair value adjustments.
| | | | | | | | | | | | | | | | |
| | | Level 1 | | | Level 2 | | | Level 3 | | | Total | |
Australia | | $ | — | | | $ | 23,674,210 | | | $ | — | | | $ | 23,674,210 | |
Canada | | | 17,235,274 | | | | — | | | | — | | | | 17,235,274 | |
China | | | 9,238,198 | | | | — | | | | — | | | | 9,238,198 | |
France | | | 12,472,922 | | | | 22,441,955 | | | | — | | | | 34,914,877 | |
Germany | | | — | | | | 17,224,745 | | | | — | | | | 17,224,745 | |
Hong Kong | | | — | | | | 17,612,679 | | | | — | | | | 17,612,679 | |
India | | | 6,451,497 | | | | — | | | | — | | | | 6,451,497 | |
Israel | | | 8,871,571 | | | | — | | | | — | | | �� | 8,871,571 | |
Japan | | | — | | | | 62,345,139 | | | | — | | | | 62,345,139 | |
Netherlands | | | 26,494,415 | | | | 42,025,156 | | | | — | | | | 68,519,571 | |
Singapore | | | — | | | | 11,839,286 | | | | — | | | | 11,839,286 | |
Sweden | | | — | | | | 4,483,132 | | | | — | | | | 4,483,132 | |
Switzerland | | | 8,705,926 | | | | 21,961,084 | | | | — | | | | 30,667,010 | |
Taiwan | | | — | | | | 16,738,792 | | | | — | | | | 16,738,792 | |
United Kingdom | | | 49,713,501 | | | | 43,190,869 | | | | — | | | | 92,904,370 | |
United States | | | 445,805,408 | | | | — | | | | — | | | | 445,805,408 | |
Money Market Funds | | | 4,980,563 | | | | — | | | | — | | | | 4,980,563 | |
| | | | 589,969,275 | | | | 283,537,047 | | | | — | | | | 873,506,322 | |
Forward Foreign Currency Contracts* | | | — | | | | 2,664,490 | | | | — | | | | 2,664,490 | |
Total Investments | | $ | 589,969,275 | | | $ | 286,201,537 | | | $ | — | | | $ | 876,170,812 | |
| * | Unrealized appreciation. |
NOTE 4—Derivative Investments
The Fund may enter into an International Swaps and Derivatives Association Master Agreement (“ISDA Master Agreement”) under which a Fund may trade OTC derivatives. An OTC transaction entered into under an ISDA Master Agreement typically involves a collateral posting arrangement, payment netting provisions and close-out netting provisions. These netting provisions allow for reduction of credit risk through netting of contractual obligations. The enforceability of the netting provisions of the ISDA Master Agreement depends on the governing law of the ISDA Master Agreement, among other factors.
For financial reporting purposes, the Fund does not offset OTC derivative assets or liabilities that are subject to ISDA Master Agreements in the Statement of Assets and Liabilities.
17 Invesco Global Core Equity Fund
Value of Derivative Investments at Period-End
The table below summarizes the value of the Fund’s derivative investments, detailed by primary risk exposure, held as of December 31, 2016:
| | | | |
| | | Value | |
| Derivative Assets | | Currency Risk | |
Unrealized appreciation on forward foreign currency contracts outstanding | | $ | 2,664,490 | |
Derivatives not subject to master netting agreements | | | — | |
Total derivative assets subject to master netting agreements | | $ | 2,664,490 | |
| | | | | | | | | | | | | | | | | | | | | | | | | | |
| Open Forward Foreign Currency Contracts | |
Settlement Date | | Counterparty | | Contract to | | | Notional Value | | | Unrealized Appreciation | |
| | | Deliver | | | Receive | | | |
02/17/17 | | Barclays Bank PLC | | | GPB | | | | 17,940,000 | | | | USD | | | | 22,197,001 | | | $ | 22,142,158 | | | $ | 54,843 | |
02/17/17 | | Goldman Sachs International | | | JPY | | | | 2,400,000,000 | | | | USD | | | | 21,713,542 | | | | 20,586,937 | | | | 1,126,605 | |
02/17/17 | | JPMorgan Chase Bank, N.A. | | | JPY | | | | 2,400,000,000 | | | | USD | | | | 22,069,980 | | | | 20,586,938 | | | | 1,483,042 | |
Total forward foreign currency contracts — currency risk | | | $ | 2,664,490 | |
Currency Abbreviations:
GBP – British Pound Sterling
JPY – Japanese Yen
USD – U.S. Dollar
Offsetting Assets and Liabilities
The table below reflects the Fund’s exposure to Counterparties subject to either an ISDA Master Agreement or other agreement for OTC derivative transactions as of December 31, 2016.
| | | | | | | | | | | | | | | | | | | | | | | | |
| | | Financial
Derivative
Assets | | | Financial
Derivative
Liabilities | | | Net Value of
Derivatives | | | Collateral
(Received)/Pledged | | | Net
Amount | |
| Counterparty | | Forward Foreign Currency Contracts | | | Forward Foreign Currency Contracts | | | | |
| | | | | Non-Cash | | | Cash | | |
Barclays Bank PLC | | $ | 54,843 | | | $ | — | | | $ | 54,843 | | | $ | — | | | $ | — | | | $ | 54,843 | |
Goldman Sachs International | | | 1,126,605 | | | | — | | | | 1,126,605 | | | | — | | | | — | | | | 1,126,605 | |
JPMorgan Chase Bank, N.A. | | | 1,483,042 | | | | — | | | | 1,483,042 | | | | — | | | | — | | | | 1,483,042 | |
Total | | $ | 2,664,490 | | | $ | — | | | $ | 2,664,490 | | | $ | — | | | $ | — | | | $ | 2,664,490 | |
Effect of Derivative Investments for the year ended December 31, 2016
The table below summarizes the gains on derivative investments, detailed by primary risk exposure, recognized in earnings during the period:
| | | | |
| | | Location of Gain on
Statement of Operations | |
| | Currency Risk | |
Change in Net Unrealized Appreciation: | | | | |
Forward foreign currency contracts | | $ | 2,664,490 | |
Total | | $ | 2,664,490 | |
The table below summarizes the average notional value of forward foreign currency contracts outstanding during a two month period.
| | | | |
| | | Forward Foreign
Currency Contracts | |
Average notional value | | $ | 63,316,033 | |
NOTE 5—Security Transactions with Affiliated Funds
The Fund is permitted to purchase or sell securities from or to certain other Invesco Funds under specified conditions outlined in procedures adopted by the Board of Trustees of the Trust. The procedures have been designed to ensure that any purchase or sale of securities by the Fund from or to another fund or portfolio that is or could be considered an affiliate by virtue of having a common investment adviser (or affiliated investment advisers), common Trustees and/or common officers complies with Rule 17a-7 of the 1940 Act. Further, as defined under the procedures, each transaction is effected at the current market price. Pursuant to these procedures, for the year ended December 31, 2016, the Fund engaged in securities sales of $374,949, which resulted in net realized gains of $13,963.
18 Invesco Global Core Equity Fund
NOTE 6—Expense Offset Arrangement(s)
The expense offset arrangement is comprised of transfer agency credits which result from balances in demand deposit accounts used by the transfer agent for clearing shareholder transactions. For the year ended December 31, 2016, the Fund received credits from this arrangement, which resulted in the reduction of the Fund’s total expenses of $8,331.
NOTE 7—Trustees’ and Officers’ Fees and Benefits
Trustees’ and Officers’ Fees and Benefits include amounts accrued by the Fund to pay remuneration to certain Trustees and Officers of the Fund. Trustees have the option to defer compensation payable by the Fund, and Trustees’ and Officers’ Fees and Benefits also include amounts accrued by the Fund to fund such deferred compensation amounts. Those Trustees who defer compensation have the option to select various Invesco Funds in which their deferral accounts shall be deemed to be invested. Finally, certain current Trustees were eligible to participate in a retirement plan that provided for benefits to be paid upon retirement to Trustees over a period of time based on the number of years of service. The Fund may have certain former Trustees who also participate in a retirement plan and receive benefits under such plan. Trustees’ and Officers’ Fees and Benefits include amounts accrued by the Fund to fund such retirement benefits. Obligations under the deferred compensation and retirement plans represent unsecured claims against the general assets of the Fund.
NOTE 8—Cash Balances
The Fund is permitted to temporarily carry a negative or overdrawn balance in its account with State Street Bank and Trust Company, the custodian bank. Such balances, if any at period-end, are shown in the Statement of Assets and Liabilities under the payable caption Amount due custodian. To compensate the custodian bank for such overdrafts, the overdrawn Fund may either (1) leave funds as a compensating balance in the account so the custodian bank can be compensated by earning the additional interest; or (2) compensate by paying the custodian bank at a rate agreed upon by the custodian bank and Invesco, not to exceed the contractually agreed upon rate.
NOTE 9—Distributions to Shareholders and Tax Components of Net Assets
Tax Character of Distributions to Shareholders Paid During the Fiscal Years Ended December 31, 2016 and 2015:
| | | | | | | | |
| | | 2016 | | | 2015 | |
Ordinary income | | $ | 7,996,016 | | | $ | 6,035,930 | |
Long-term capital gain | | | 3,079,578 | | | | 4,993,997 | |
Total distributions | | $ | 11,075,594 | | | $ | 11,029,927 | |
Tax Components of Net Assets at Period-End:
| | | | |
| | | 2016 | |
Undistributed ordinary income | | $ | 1,385,327 | |
Net unrealized appreciation — investments | | | 38,085,627 | |
Net unrealized appreciation (depreciation) — other investments | | | (121,382 | ) |
Temporary book/tax differences | | | (283,557 | ) |
Capital loss carryforward | | | (4,927,976 | ) |
Shares of beneficial interest | | | 842,377,512 | |
Total net assets | | $ | 876,515,551 | |
The difference between book-basis and tax-basis unrealized appreciation (depreciation) is due to differences in the timing of recognition of gains and losses on investments for tax and book purposes. The Fund’s net unrealized appreciation difference is attributable primarily to wash sales.
The temporary book/tax differences are a result of timing differences between book and tax recognition of income and/or expenses. The Fund’s temporary book/tax differences are the result of the trustee deferral of compensation and retirement plan benefits.
Capital loss carryforward is calculated and reported as of a specific date. Results of transactions and other activity after that date may affect the amount of capital loss carryforward actually available for the Fund to utilize. Capital losses generated in years beginning after December 22, 2010 can be carried forward for an unlimited period, whereas previous losses expire in eight tax years. Capital losses with an expiration period may not be used to offset capital gains until all net capital losses without an expiration date have been utilized. Capital loss carryforwards with no expiration date will retain their character as either short-term or long-term capital losses instead of as short-term capital losses as under prior law. The ability to utilize capital loss carryforwards in the future may be limited under the Internal Revenue Code and related regulations based on the results of future transactions.
19 Invesco Global Core Equity Fund
The Fund has a capital loss carryforward as of December 31, 2016, which expires as follows:
| | | | | | | | | | | | |
| Capital Loss Carryforward* | |
| Expiration | | Short-Term | | | Long-Term | | | Total | |
December 31, 2017 | | $ | (4,927,976 | ) | | $ | — | | | $ | (4,927,976 | ) |
| * | Capital loss carryforward as of the date listed above is reduced for limitations, if any, to the extent required by the Internal Revenue Code and may be further limited depending upon a variety of factors, including the realization of net unrealized gains or losses as of the date of any reorganization. |
NOTE 10—Investment Securities
The aggregate amount of investment securities (other than short-term securities, U.S. Treasury obligations and money market funds, if any) purchased and sold by the Fund during the year ended December 31, 2016 was $347,697,211 and $475,654,142, respectively. Cost of investments on a tax basis includes the adjustments for financial reporting purposes as of the most recently completed federal income tax reporting period-end.
| | | | |
| Unrealized Appreciation (Depreciation) of Investment Securities on a Tax Basis | |
Aggregate unrealized appreciation of investment securities | | $ | 81,042,111 | |
Aggregate unrealized (depreciation) of investment securities | | | (42,956,484 | ) |
Net unrealized appreciation of investment securities | | $ | 38,085,627 | |
Cost of investments for tax purposes is $835,420,695.
NOTE 11—Reclassification of Permanent Differences
Primarily as a result of differing book/tax treatment of foreign currency transactions, passive foreign investment companies and REITs, on December 31, 2016, undistributed net investment income was increased by $168,773, undistributed net realized gain (loss) was decreased by $168,773. This reclassification had no effect on the net assets of the Fund.
20 Invesco Global Core Equity Fund
NOTE 12—Share Information
| | | | | | | | | | | | | | | | |
| | | Summary of Share Activity | |
| | | Years ended December 31, | |
| | | 2016(a) | | | 2015 | |
| | | Shares | | | Amount | | | Shares | | | Amount | |
Sold: | | | | | | | | | | | | | | | | |
Class A | | | 1,882,024 | | | $ | 25,008,062 | | | | 2,280,471 | | | $ | 31,474,106 | |
Class B | | | 3,288 | | | | 42,316 | | | | 20,154 | | | | 270,420 | |
Class C | | | 205,952 | | | | 2,594,026 | | | | 245,748 | | | | 3,242,081 | |
Class R | | | 22,228 | | | | 291,901 | | | | 30,911 | | | | 416,961 | |
Class Y | | | 1,313,566 | | | | 18,147,390 | | | | 345,032 | | | | 4,816,441 | |
Class R5 | | | 14,805 | | | | 208,415 | | | | 1,873 | | | | 26,275 | |
| | | | |
Issued as reinvestment of dividends: | | | | | | | | | | | | | | | | |
Class A | | | 654,128 | | | | 9,216,675 | | | | 743,989 | | | | 9,627,220 | |
Class B | | | 6,848 | | | | 91,965 | | | | 11,464 | | | | 141,471 | |
Class C | | | 34,756 | | | | 467,814 | | | | 45,932 | | | | 568,174 | |
Class R | | | 804 | | | | 11,323 | | | | 576 | | | | 7,447 | |
Class Y | | | 23,691 | | | | 333,803 | | | | 17,701 | | | | 228,872 | |
Class R5 | | | 228 | | | | 3,247 | | | | 197 | | | | 2,583 | |
| | | | |
Automatic conversion of Class B shares to Class A shares: | | | | | | | | | | | | | | | | |
Class A | | | 222,211 | | | | 2,958,848 | | | | 323,938 | | | | 4,543,483 | |
Class B | | | (233,867 | ) | | | (2,958,848 | ) | | | (340,289 | ) | | | (4,543,483 | ) |
| | | | |
Reacquired: | | | | | | | | | | | | | | | | |
Class A | | | (10,840,010 | ) | | | (145,916,394 | ) | | | (9,756,737 | ) | | | (135,530,389 | ) |
Class B | | | (341,066 | ) | | | (4,326,510 | ) | | | (406,612 | ) | | | (5,393,574 | ) |
Class C | | | (1,446,491 | ) | | | (18,440,890 | ) | | | (1,300,722 | ) | | | (17,223,639 | ) |
Class R | | | (25,562 | ) | | | (341,846 | ) | | | (12,138 | ) | | | (167,409 | ) |
Class Y | | | (860,748 | ) | | | (11,740,066 | ) | | | (515,666 | ) | | | (7,144,747 | ) |
Class R5 | | | (830 | ) | | | (11,668 | ) | | | (13,960 | ) | | | (195,221 | ) |
Net increase (decrease) in share activity | | | (9,364,045 | ) | | $ | (124,360,437 | ) | | | (8,278,138 | ) | | $ | (114,832,928 | ) |
| (a) | There are entities that are record owners of more than 5% of the outstanding shares of the Fund and in the aggregate own 47% of the outstanding shares of the Fund. IDI has an agreement with these entities to sell Fund shares. The Fund, Invesco and/or Invesco affiliates may make payments to these entities, which are considered to be related to the Fund, for providing services to the Fund, Invesco and/or Invesco affiliates including but not limited to services such as securities brokerage, distribution, third party record keeping and account servicing. The Fund has no knowledge as to whether all or any portion of the shares owned of record by these entities are also owned beneficially. |
21 Invesco Global Core Equity Fund
NOTE 13—Financial Highlights
The following schedule presents financial highlights for a share of the Fund outstanding throughout the periods indicated.
| | | | | | | | | | | | | | | | | | | | | | | | | | | | | | | | | | | | | | | | | | | | | | | | | | | | | | | | |
| | | Net asset
value,
beginning
of period | | | Net
investment
income
(loss)(a) | | | Net gains
(losses)
on securities
(both
realized and
unrealized) | | | Total from
investment
operations | | | Dividends
from net
investment
income | | | Distributions
from net
realized
gains | | | Total
distributions | | | Net asset
value, end
of period(b) | | | Total
return(c) | | | Net assets,
end of period
(000’s omitted) | | | Ratio of
expenses
to average
net assets
with fee waivers
and/or expenses
absorbed | | | Ratio of
expenses
to average net
assets without
fee waivers
and/or expenses
absorbed | | | Ratio of net
investment
income (loss)
to average
net assets | | | Portfolio
turnover(d) | |
Class A | |
Year ended 12/31/16 | | $ | 13.19 | | | $ | 0.13 | | | $ | 0.76 | | | $ | 0.89 | | | $ | (0.14 | ) | | $ | (0.05 | ) | | $ | (0.19 | ) | | $ | 13.89 | | | | 6.70 | % | | $ | 749,810 | | | | 1.30 | %(e) | | | 1.30 | %(e) | | | 0.95 | %(e)(f) | | | 39 | % |
Year ended 12/31/15 | | | 13.65 | | | | 0.10 | | | | (0.40 | ) | | | (0.30 | ) | | | (0.09 | ) | | | (0.07 | ) | | | (0.16 | ) | | | 13.19 | | | | (2.16 | ) | | | 818,600 | | | | 1.32 | | | | 1.32 | | | | 0.70 | | | | 66 | |
Year ended 12/31/14 | | | 15.36 | | | | 0.16 | | | | (0.14 | ) | | | 0.02 | | | | (0.17 | ) | | | (1.56 | ) | | | (1.73 | ) | | | 13.65 | | | | 0.38 | | | | 934,893 | | | | 1.29 | | | | 1.29 | | | | 1.03 | | | | 122 | |
Year ended 12/31/13 | | | 12.76 | | | | 0.22 | | | | 2.61 | | | | 2.83 | | | | (0.23 | ) | | | — | | | | (0.23 | ) | | | 15.36 | | | | 22.28 | | | | 1,077,776 | | | | 1.27 | | | | 1.30 | | | | 1.61 | | | | 33 | |
Year ended 12/31/12 | | | 11.49 | | | | 0.21 | | | | 1.30 | | | | 1.51 | | | | (0.24 | ) | | | (0.00 | ) | | | (0.24 | ) | | | 12.76 | | | | 13.22 | | | | 1,038,232 | | | | 1.25 | | | | 1.34 | | | | 1.77 | | | | 23 | |
Class B | | | | | | | | | | | | | | | | | | | | | | | | | | | | | | | | | | | | | | | | | | | | | | | | | | | | | | | | |
Year ended 12/31/16 | | | 12.57 | | | | 0.03 | | | | 0.71 | | | | 0.74 | | | | (0.03 | ) | | | (0.05 | ) | | | (0.08 | ) | | | 13.23 | | | | 5.88 | | | | 15,390 | | | | 2.05 | (e) | | | 2.05 | (e) | | | 0.20 | (e)(f) | | | 39 | |
Year ended 12/31/15 | | | 13.03 | | | | (0.01 | ) | | | (0.37 | ) | | | (0.38 | ) | | | (0.01 | ) | | | (0.07 | ) | | | (0.08 | ) | | | 12.57 | | | | (2.88 | ) | | | 21,718 | | | | 2.07 | | | | 2.07 | | | | (0.05 | ) | | | 66 | |
Year ended 12/31/14 | | | 14.73 | | | | 0.04 | | | | (0.14 | ) | | | (0.10 | ) | | | (0.04 | ) | | | (1.56 | ) | | | (1.60 | ) | | | 13.03 | | | | (0.40 | ) | | | 31,846 | | | | 2.04 | | | | 2.04 | | | | 0.28 | | | | 122 | |
Year ended 12/31/13 | | | 12.25 | | | | 0.15 | | | | 2.49 | | | | 2.64 | | | | (0.16 | ) | | | — | | | | (0.16 | ) | | | 14.73 | | | | 21.63 | | | | 44,937 | | | | 1.77 | | | | 2.05 | | | | 1.11 | | | | 33 | |
Year ended 12/31/12 | | | 11.03 | | | | 0.17 | | | | 1.25 | | | | 1.42 | | | | (0.20 | ) | | | (0.00 | ) | | | (0.20 | ) | | | 12.25 | | | | 12.94 | | | | 56,813 | | | | 1.52 | | | | 2.09 | | | | 1.50 | | | | 23 | |
Class C | | | | | | | | | | | | | | | | | | | | | | | | | | | | | | | | | | | | | | | | | | | | | | | | | | | | | | | | |
Year ended 12/31/16 | | | 12.60 | | | | 0.03 | | | | 0.71 | | | | 0.74 | | | | (0.03 | ) | | | (0.05 | ) | | | (0.08 | ) | | | 13.26 | | | | 5.87 | | | | 83,864 | | | | 2.05 | (e) | | | 2.05 | (e) | | | 0.20 | (e)(f) | | | 39 | |
Year ended 12/31/15 | | | 13.07 | | | | (0.01 | ) | | | (0.38 | ) | | | (0.39 | ) | | | (0.01 | ) | | | (0.07 | ) | | | (0.08 | ) | | | 12.60 | | | | (2.95 | ) | | | 94,854 | | | | 2.07 | | | | 2.07 | | | | (0.05 | ) | | | 66 | |
Year ended 12/31/14 | | | 14.76 | | | | 0.04 | | | | (0.13 | ) | | | (0.09 | ) | | | (0.04 | ) | | | (1.56 | ) | | | (1.60 | ) | | | 13.07 | | | | (0.33 | ) | | | 111,552 | | | | 2.04 | | | | 2.04 | | | | 0.28 | | | | 122 | |
Year ended 12/31/13 | | | 12.27 | | | | 0.11 | | | | 2.50 | | | | 2.61 | | | | (0.12 | ) | | | — | | | | (0.12 | ) | | | 14.76 | | | | 21.32 | | | | 133,181 | | | | 2.02 | | | | 2.05 | | | | 0.86 | | | | 33 | |
Year ended 12/31/12 | | | 11.04 | | | | 0.12 | | | | 1.24 | | | | 1.36 | | | | (0.13 | ) | | | (0.00 | ) | | | (0.13 | ) | | | 12.27 | | | | 12.40 | | | | 134,387 | | | | 2.00 | | | | 2.09 | | | | 1.02 | | | | 23 | |
Class R | | | | | | | | | | | | | | | | | | | | | | | | | | | | | | | | | | | | | | | | | | | | | | | | | | | | | | | | |
Year ended 12/31/16 | | | 13.18 | | | | 0.09 | | | | 0.76 | | | | 0.85 | | | | (0.10 | ) | | | (0.05 | ) | | | (0.15 | ) | | | 13.88 | | | | 6.45 | | | | 1,054 | | | | 1.55 | (e) | | | 1.55 | (e) | | | 0.70 | (e)(f) | | | 39 | |
Year ended 12/31/15 | | | 13.65 | | | | 0.06 | | | | (0.39 | ) | | | (0.33 | ) | | | (0.07 | ) | | | (0.07 | ) | | | (0.14 | ) | | | 13.18 | | | | (2.43 | ) | | | 1,035 | | | | 1.57 | | | | 1.57 | | | | 0.45 | | | | 66 | |
Year ended 12/31/14 | | | 15.35 | | | | 0.12 | | | | (0.13 | ) | | | (0.01 | ) | | | (0.13 | ) | | | (1.56 | ) | | | (1.69 | ) | | | 13.65 | | | | 0.17 | | | | 807 | | | | 1.54 | | | | 1.54 | | | | 0.78 | | | | 122 | |
Year ended 12/31/13 | | | 12.76 | | | | 0.19 | | | | 2.59 | | | | 2.78 | | | | (0.19 | ) | | | — | | | | (0.19 | ) | | | 15.35 | | | | 21.89 | | | | 882 | | | | 1.52 | | | | 1.55 | | | | 1.36 | | | | 33 | |
Year ended 12/31/12 | | | 11.48 | | | | 0.18 | | | | 1.30 | | | | 1.48 | | | | (0.20 | ) | | | (0.00 | ) | | | (0.20 | ) | | | 12.76 | | | | 12.98 | | | | 794 | | | | 1.50 | | | | 1.59 | | | | 1.52 | | | | 23 | |
Class Y | | | | | | | | | | | | | | | | | | | | | | | | | | | | | | | | | | | | | | | | | | | | | | | | | | | | | | | | |
Year ended 12/31/16 | | | 13.18 | | | | 0.16 | | | | 0.76 | | | | 0.92 | | | | (0.17 | ) | | | (0.05 | ) | | | (0.22 | ) | | | 13.88 | | | | 6.98 | | | | 25,996 | | | | 1.05 | (e) | | | 1.05 | (e) | | | 1.20 | (e)(f) | | | 39 | |
Year ended 12/31/15 | | | 13.64 | | | | 0.13 | | | | (0.40 | ) | | | (0.27 | ) | | | (0.12 | ) | | | (0.07 | ) | | | (0.19 | ) | | | 13.18 | | | | (1.94 | ) | | | 18,405 | | | | 1.07 | | | | 1.07 | | | | 0.95 | | | | 66 | |
Year ended 12/31/14 | | | 15.35 | | | | 0.20 | | | | (0.14 | ) | | | 0.06 | | | | (0.21 | ) | | | (1.56 | ) | | | (1.77 | ) | | | 13.64 | | | | 0.65 | | | | 21,136 | | | | 1.04 | | | | 1.04 | | | | 1.28 | | | | 122 | |
Year ended 12/31/13 | | | 12.76 | | | | 0.26 | | | | 2.60 | | | | 2.86 | | | | (0.27 | ) | | | — | | | | (0.27 | ) | | | 15.35 | | | | 22.51 | | | | 17,125 | | | | 1.02 | | | | 1.05 | | | | 1.86 | | | | 33 | |
Year ended 12/31/12 | | | 11.49 | | | | 0.24 | | | | 1.31 | | | | 1.55 | | | | (0.28 | ) | | | (0.00 | ) | | | (0.28 | ) | | | 12.76 | | | | 13.53 | | | | 16,646 | | | | 1.00 | | | | 1.09 | | | | 2.02 | | | | 23 | |
Class R5 | | | | | | | | | | | | | | | | | | | | | | | | | | | | | | | | | | | | | | | | | | | | | | | | | | | | | | | | |
Year ended 12/31/16 | | | 13.35 | | | | 0.18 | | | | 0.77 | | | | 0.95 | | | | (0.19 | ) | | | (0.05 | ) | | | (0.24 | ) | | | 14.06 | | | | 7.07 | | | | 401 | | | | 0.94 | (e) | | | 0.94 | (e) | | | 1.31 | (e)(f) | | | 39 | |
Year ended 12/31/15 | | | 13.81 | | | | 0.15 | | | | (0.40 | ) | | | (0.25 | ) | | | (0.14 | ) | | | (0.07 | ) | | | (0.21 | ) | | | 13.35 | | | | (1.80 | ) | | | 191 | | | | 0.95 | | | | 0.95 | | | | 1.07 | | | | 66 | |
Year ended 12/31/14 | | | 15.52 | | | | 0.22 | | | | (0.14 | ) | | | 0.08 | | | | (0.23 | ) | | | (1.56 | ) | | | (1.79 | ) | | | 13.81 | | | | 0.76 | | | | 362 | | | | 0.94 | | | | 0.94 | | | | 1.38 | | | | 122 | |
Year ended 12/31/13 | | | 12.90 | | | | 0.28 | | | | 2.62 | | | | 2.90 | | | | (0.28 | ) | | | — | | | | (0.28 | ) | | | 15.52 | | | | 22.60 | | | | 513 | | | | 0.95 | | | | 0.95 | | | | 1.93 | | | | 33 | |
Year ended 12/31/12 | | | 11.61 | | | | 0.25 | | | | 1.32 | | | | 1.57 | | | | (0.28 | ) | | | (0.00 | ) | | | (0.28 | ) | | | 12.90 | | | | 13.59 | | | | 275 | | | | 0.96 | | | | 0.96 | | | | 2.06 | | | | 23 | |
| (a) | Calculated using average shares outstanding. |
| (b) | Includes redemption fees added to shares of beneficial interest which were less than $0.005 per share for the fiscal year ended December 31, 2012. |
| (c) | Includes adjustments in accordance with accounting principles generally accepted in the United States of America and as such, the net asset value for financial reporting purposes and the returns based upon those net asset values may differ from the net asset value and returns for shareholder transactions. Does not include sales charges and is not annualized for periods less than one year, if applicable. |
| (d) | Portfolio turnover is calculated at the fund level and is not annualized for periods less than one year, if applicable. |
| (e) | Ratios are based on average daily net assets (000’s omitted) of $778,683, $18,032, $88,287, $1,073, $19,448 and $206 for Class A, Class B, Class C, Class R, Class Y and Class R5 shares, respectively. |
| (f) | Amount includes the effect of a one-time reimbursement of custody expenses. The ratio of net investment income excluding these payments would have been 0.84%, 0.09%, 0.09%, 0.59%, 1.09% and 1.20% for Class A, Class B, Class C, Class R, Class Y and Class R5 shares, respectively. |
22 Invesco Global Core Equity Fund
Report of Independent Registered Public Accounting Firm
To the Board of Trustees of AIM Funds Group (Invesco Funds Group)
and Shareholders of the Invesco Global Core Equity Fund:
In our opinion, the accompanying statement of assets and liabilities, including the schedule of investments, and the related statements of operations and of changes in net assets and the financial highlights present fairly, in all material respects, the financial position of the Invesco Global Core Equity Fund (one of the portfolios constituting the AIM Funds Group (Invesco Funds Group), hereafter referred to as the “Fund”) as of December 31, 2016, the results of its operations for the year then ended, the changes in its net assets for each of the two years in the period then ended and the financial highlights for each of the five years in the period then ended, in conformity with accounting principles generally accepted in the United States of America. These financial statements and financial highlights (hereafter referred to as “financial statements”) are the responsibility of the Fund’s management. Our responsibility is to express an opinion on these financial statements based on our audits. We conducted our audits of these financial statements in accordance with the standards of the Public Company Accounting Oversight Board (United States). Those standards require that we plan and perform the audit to obtain reasonable assurance about whether the financial statements are free of material misstatement. An audit includes examining, on a test basis, evidence supporting the amounts and disclosures in the financial statements, assessing the accounting principles used and significant estimates made by management, and evaluating the overall financial statement presentation. We believe that our audits, which included confirmation of securities as of December 31, 2016 by correspondence with the custodian and brokers, provide a reasonable basis for our opinion.
PricewaterhouseCoopers LLP
Houston, Texas
February 23, 2017
23 Invesco Global Core Equity Fund
Calculating your ongoing Fund expenses
Example
As a shareholder of the Fund, you incur two types of costs: (1) transaction costs, which may include sales charges (loads) on purchase payments or contingent deferred sales charges on redemptions, if any; and (2) ongoing costs, including management fees, distribution and/or service (12b-1) fees, and other Fund expenses. This example is intended to help you understand your ongoing costs (in dollars) of investing in the Fund and to compare these costs with ongoing costs of investing in other mutual funds. The example is based on an investment of $1,000 invested at the beginning of the period and held for the entire period July 1, 2016 through December 31, 2016.
Actual expenses
The table below provides information about actual account values and actual expenses. You may use the information in this table, together with the amount you invested, to estimate the expenses that you paid over the period. Simply divide your account value by $1,000 (for example, an $8,600 account value divided by $1,000 = 8.6), then multiply the result by the number in the table under the heading entitled “Actual Expenses Paid During Period” to estimate the expenses you paid on your account during this period.
Hypothetical example for comparison purposes
The table below also provides information about hypothetical account values and hypothetical expenses based on the Fund’s actual expense ratio and an assumed rate of return of 5% per year before expenses, which is not the Fund’s actual return.
The hypothetical account values and expenses may not be used to estimate the actual ending account balance or expenses you paid for the period. You may use this information to compare the ongoing costs of investing in the Fund and other funds. To do so, compare this 5% hypothetical example with the 5% hypothetical examples that appear in the shareholder reports of the other funds.
Please note that the expenses shown in the table are meant to highlight your ongoing costs only and do not reflect any transaction costs, such as sales charges (loads) on purchase payments or contingent deferred sales charges on redemptions, if any. Therefore, the hypothetical information is useful in comparing ongoing costs only, and will not help you determine the relative total costs of owning different funds. In addition, if these transaction costs were included, your costs would have been higher.
| | | | | | | | | | | | | | | | | | | | | | | | |
| Class | | Beginning
Account Value
(07/01/16) | | | ACTUAL | | | HYPOTHETICAL
(5% annual return before
expenses) | | | Annualized
Expense
Ratio | |
| | | Ending
Account Value
(12/31/16)1 | | | Expenses
Paid During
Period2 | | | Ending
Account Value
(12/31/16) | | | Expenses
Paid During
Period2 | | |
| A | | $ | 1,000.00 | | | $ | 1,059.80 | | | $ | 6.68 | | | $ | 1,018.65 | | | $ | 6.55 | | | | 1.29 | % |
| B | | | 1,000.00 | | | | 1,055.50 | | | | 10.54 | | | | 1,014.88 | | | | 10.33 | | | | 2.04 | |
| C | | | 1,000.00 | | | | 1,055.30 | | | | 10.54 | | | | 1,014.88 | | | | 10.33 | | | | 2.04 | |
| R | | | 1,000.00 | | | | 1,058.10 | | | | 7.97 | | | | 1,017.39 | | | | 7.81 | | | | 1.54 | |
| Y | | | 1,000.00 | | | | 1,060.90 | | | | 5.39 | | | | 1,019.91 | | | | 5.28 | | | | 1.04 | |
| R5 | | | 1,000.00 | | | | 1,061.20 | | | | 4.77 | | | | 1,020.51 | | | | 4.67 | | | | 0.92 | |
| 1 | The actual ending account value is based on the actual total return of the Fund for the period July 1, 2016 through December 31, 2016, after actual expenses and will differ from the hypothetical ending account value which is based on the Fund’s expense ratio and a hypothetical annual return of 5% before expenses. |
| 2 | Expenses are equal to the Fund’s annualized expense ratio as indicated above multiplied by the average account value over the period, multiplied by 184/366 to reflect the most recent fiscal half year. Effective January 1, 2017, the Fund’s adviser has contractually agreed to waive advisory fees and/or reimburse expenses to the extent necessary to limit total annual fund operating expense of Class A, Class B, Class C, Class R, Class Y and Class R5 shares to 1.22%, 1.97%, 1.97%, 1.47%, 0.97% and 0.97% of average daily net assets, respectively. The annualized expense ratios restated as if these agreements had been in effect throughout the entire most recent fiscal half year are 1.22%, 1.97%, 1.97%, 1.47%, 0.97% and 0.85% for Class A, Class B, Class C, Class R, Class Y and Class R5 shares, respectively. |
| 3 | The actual expenses paid restated as if the changes discussed above had been in effect throughout the entire most recent fiscal half year are $6.32, $10.18, $10.18, $7.60, $5.02 and $4.40 for Class A, Class B, Class C, Class R, Class Y and Class R5 shares, respectively. |
| 4 | The hypothetical expenses paid restated as if the changes discussed above had been in effect throughout the entire most recent fiscal half year are $6.19, $9.98, $9.98, $7.46, $4.93 and $4.32 for Class A, Class B, Class C, Class R, Class Y and Class R5 shares, respectively. |
24 Invesco Global Core Equity Fund
Tax Information
Form 1099-DIV, Form 1042-S and other year-end tax information provide shareholders with actual calendar year amounts that should be included in their tax returns. Shareholders should consult their tax advisors.
The following distribution information is being provided as required by the Internal Revenue Code or to meet a specific state’s requirement.
The Fund designates the following amounts or, if subsequently determined to be different, the maximum amount allowable for its fiscal year ended December 31, 2016:
| | | | |
Federal and State Income Tax | |
Long-Term Capital Gain Distributions | | $ | 3,079,578 | |
Qualified Dividend Income* | | | 100.00 | % |
Corporate Dividends Received Deduction* | | | 91.59 | % |
U.S. Treasury Obligations* | | | 0.00 | % |
| | * | The above percentages are based on ordinary income dividends paid to shareholders during the Fund’s fiscal year. |
25 Invesco Global Core Equity Fund
Trustees and Officers
The address of each trustee and officer is AIM Funds Group (Invesco Funds Group) (the “Trust”), 11 Greenway Plaza, Suite 1000, Houston, Texas 77046-1173. The trustees serve for the life of the Trust, subject to their earlier death, incapacitation, resignation, retirement or removal as more specifically provided in the Trust’s organizational documents. Each officer serves for a one year term or until their successors are elected and qualified. Column two below includes length of time served with predecessor entities, if any.
| | | | | | | | |
Name, Year of Birth and
Position(s) Held with the Trust | | Trustee and/
or Officer Since | | Principal Occupation(s)
During Past 5 Years | | Number of
Funds in Fund
Complex
Overseen by
Trustee | | Other Directorship(s)
Held by Trustee During Past 5 Years |
| Interested Persons | | | | | | | | |
| Martin L. Flanagan1 — 1960 Trustee | | 2007 | | Executive Director, Chief Executive Officer and President, Invesco Ltd. (ultimate parent of Invesco and a global investment management firm); Advisor to the Board, Invesco Advisers, Inc. (formerly known as Invesco Institutional (N.A.), Inc.); Trustee, The Invesco Funds; Vice Chair, Investment Company Institute; and Member of Executive Board, SMU Cox School of Business Formerly: Chairman and Chief Executive Officer, Invesco Advisers, Inc. (registered investment adviser); Director, Chairman, Chief Executive Officer and President, Invesco Holding Company (US) Inc. (formerly IVZ Inc.) (holding company), Invesco Group Services, Inc. (service provider) and Invesco North American Holdings, Inc. (holding company); Director, Chief Executive Officer and President, Invesco Holding Company Limited (parent of Invesco and a global investment management firm); Director, Invesco Ltd.; Chairman, Investment Company Institute and President, Co-Chief Executive Officer, Co-President, Chief Operating Officer and Chief Financial Officer, Franklin Resources, Inc. (global investment management organization) | | 144 | | None |
Philip A. Taylor2 — 1954 Trustee and Senior Vice President | | 2006 | | Head of the Americas and Senior Managing Director, Invesco Ltd.; Director, Co-Chairman, Co-President and Co-Chief Executive Officer, Invesco Advisers, Inc. (formerly known as Invesco Institutional (N.A.), Inc.) (registered investment adviser); Director, Chairman, Chief Executive Officer and President, Invesco Management Group, Inc. (formerly known as Invesco AIM Management Group, Inc.) (financial services holding company); Director and Chairman, Invesco Investment Services, Inc. (formerly known as Invesco AIM Investment Services, Inc.) (registered transfer agent) Chief Executive Officer, Invesco Corporate Class Inc. (corporate mutual fund company) Director, Chairman and Chief Executive Officer, Invesco Canada Ltd. (formerly known as Invesco Trimark Ltd./Invesco Trimark Ltèe) (registered investment adviser and registered transfer agent); Trustee and Senior Vice President, The Invesco Funds; Director, Invesco Investment Advisers LLC (formerly known as Van Kampen Asset Management). Formerly: Director, Chief Executive Officer and President, Van Kampen Exchange Corp.; President and Principal Executive Officer, The Invesco Funds (other than AIM Treasurer’s Series Trust (Invesco Treasurer’s Series Trust), Short-Term Investments Trust and Invesco Management Trust); Executive Vice President, The Invesco Funds (AIM Treasurer’s Series Trust (Invesco Treasurer’s Series Trust), Short-Term Investments Trust and Invesco Management Trust only); Director and President, INVESCO Funds Group, Inc. (registered investment adviser and registered transfer agent); Director and Chairman, IVZ Distributors, Inc. (formerly known as INVESCO Distributors, Inc.) (registered broker dealer); Director, President and Chairman, Invesco Inc. (holding company), Invesco Canada Holdings Inc. (holding company), Trimark Investments Ltd./Placements Trimark Ltèe and Invesco Financial Services Ltd/Services Financiers Invesco Ltèe; Chief Executive Officer, Invesco Canada Fund Inc. (corporate mutual fund company); Director and Chairman, Van Kampen Investor Services Inc.; Director, Chief Executive Officer and President, 1371 Preferred Inc. (holding company) and Van Kampen Investments Inc.; Director and President, AIM GP Canada Inc. (general partner for limited partnerships) and Van Kampen Advisors, Inc.; Director and Chief Executive Officer, Invesco Trimark Dealer Inc. (registered broker dealer); Director, Invesco Distributors, Inc. (formerly known as Invesco AIM Distributors, Inc.) (registered broker dealer); Manager, Invesco PowerShares Capital Management LLC; Director, Chief Executive Officer and President, Invesco Advisers, Inc.; Director, Chairman, Chief Executive Officer and President, Invesco AIM Capital Management, Inc.; President, Invesco Trimark Dealer Inc. and Invesco Trimark Ltd./Invesco Trimark Ltèe; Director and President, AIM Trimark Corporate Class Inc. and AIM Trimark Canada Fund Inc.; Senior Managing Director, Invesco Holding Company Limited; Director and Chairman, Fund Management Company (former registered broker dealer); President and Principal Executive Officer, The Invesco Funds (AIM Treasurer’s Series Trust (Invesco Treasurer’s Series Trust), and Short-Term Investments Trust only); President, AIM Trimark Global Fund Inc. and AIM Trimark Canada Fund Inc. | | 144 | | None |
| 1 | Mr. Flanagan is considered an interested person (within the meaning of Section 2(a)(19) of the 1940 Act) of the Trust because he is an officer of the Adviser to the Trust, and an officer and a director of Invesco Ltd., ultimate parent of the Adviser. |
| 2 | Mr. Taylor is considered an interested person (within the meaning of Section 2(a)(19) of the 1940 Act) of the Trust because he is an officer and a director of the Adviser. |
T-1 Invesco Global Core Equity Fund
Trustees and Officers—(continued)
| | | | | | | | |
Name, Year of Birth and
Position(s) Held with the Trust | | Trustee and/
or Officer Since | | Principal Occupation(s)
During Past 5 Years | | Number of
Funds in Fund
Complex
Overseen by
Trustee | | Other Directorship(s)
Held by Trustee During
Past 5 Years |
| Independent Trustees | | | | | | | | |
Bruce L. Crockett — 1944 Trustee and Chair | | 1987 | | Chairman, Crockett Technologies Associates (technology consulting company) Formerly: Director, Captaris (unified messaging provider); Director, President and Chief Executive Officer, COMSAT Corporation; Chairman, Board of Governors of INTELSAT (international communications company); ACE Limited (insurance company); Independent Directors Council and Investment Company Institute | | 144 | | Chairman of the Audit committee, ALPS (Attorneys Liability Protection Society) (insurance company): Member of the Audit Committee, Ferroglobe PLC (metallurgical company) and Investment Company Institute; Member of the Executive Committee and Chair of the Governance Committee, Independent Directors Council |
David C. Arch — 1945 Trustee | | 2010 | | Chairman of Blistex Inc., a consumer health care products manufacturer | | 144 | | Board member of the Illinois Manufacturers’ Association |
James T. Bunch — 1942 Trustee | | 2003 | | Managing Member, Grumman Hill Group LLC (family office/private equity investments) Formerly: Chairman of the Board, Denver Film Society, Chairman of the Board of Trustees, Evans Scholarship Foundation; Chairman, Board of Governors, Western Golf Association | | 144 | | Trustee, Evans Scholarship Foundation; Chairman of the Board, Denver Film Society |
Jack M. Fields — 1952 Trustee | | 1997 | | Chief Executive Officer, Twenty First Century Group, Inc. (government affairs company); and Discovery Learning Alliance (non-profit) Formerly: Owner and Chief Executive Officer, Dos Angeles Ranch L.P. (cattle, hunting, corporate entertainment); Director, Insperity, Inc. (formerly known as Administaff); Chief Executive Officer, Texana Timber LP (sustainable forestry company); Director of Cross Timbers Quail Research Ranch (non-profit); and member of the U.S. House of Representatives | | 144 | | None |
Eli Jones — 1961 Trustee | | 2016 | | Professor and Dean, Mays Business School — Texas A&M University Formerly: Professor and Dean, Walton College of Business, University of Arkansas and E.J. Ourso College of Business, Louisiana State University and Director, Arvest Bank | | 144 | | Director of Insperity, Inc. (formerly known as Administaff) |
Prema Mathai-Davis — 1950 Trustee | | 1998 | | Retired. Formerly: Chief Executive Officer, YWCA of the U.S.A. | | 144 | | None |
Larry Soll — 1942 Trustee | | 2003 | | Retired. Formerly: Chairman, Chief Executive Officer and President, Synergen Corp. (a biotechnology company) | | 144 | | None |
Raymond Stickel, Jr. — 1944 Trustee | | 2005 | | Retired. Formerly: Director, Mainstay VP Series Funds, Inc. (25 portfolios) and Partner, Deloitte & Touche | | 144 | | None |
Robert C. Troccoli — 1949 Trustee | | 2016 | | Adjunct Professor, University of Denver — Daniels College of Business Formerly: Senior Partner, KPMG LLP | | 144 | | None |
| Other Officers | | | | | | | | |
Sheri Morris — 1964 President, Principal Executive Officer and Treasurer | | 1999 | | President, Principal Executive Officer and Treasurer, The Invesco Funds; Vice President, Invesco Advisers, Inc. (formerly known as Invesco Institutional (N.A.), Inc.) (registered investment adviser); and Vice President, PowerShares Exchange-Traded Fund Trust, PowerShares Exchange-Traded Fund Trust II, PowerShares India Exchange-Traded Fund Trust, PowerShares Actively Managed Exchange-Traded Fund Trust, and PowerShares Actively Managed Exchange-Traded Commodity Fund Trust Formerly: Vice President and Principal Financial Officer, The Invesco Funds; Vice President, Invesco AIM Advisers, Inc., Invesco AIM Capital Management, Inc. and Invesco AIM Private Asset Management, Inc.; Assistant Vice President and Assistant Treasurer, The Invesco Funds and Assistant Vice President, Invesco Advisers, Inc., Invesco AIM Capital Management, Inc. and Invesco AIM Private Asset Management, Inc.; and Treasurer, PowerShares Exchange-Traded Fund Trust, PowerShares Exchange-Traded Fund Trust II, PowerShares India Exchange-Traded Fund Trust and PowerShares Actively Managed Exchange-Traded Fund Trust | | N/A | | N/A |
Russell C. Burk — 1958 Senior Vice President and Senior Officer | | 2005 | | Senior Vice President and Senior Officer, The Invesco Funds | | N/A | | N/A |
T-2 Invesco Global Core Equity Fund
Trustees and Officers—(continued)
| | | | | | | | |
Name, Year of Birth and
Position(s) Held with the Trust | | Trustee and/
or Officer Since | | Principal Occupation(s)
During Past 5 Years | | Number of
Funds in Fund
Complex
Overseen by
Trustee | | Other Directorship(s)
Held by Trustee During
Past 5 Years |
| Other Officers—(continued) | | | | | | | | |
John M. Zerr — 1962 Senior Vice President, Chief Legal Officer and Secretary | | 2006 | | Director, Senior Vice President, Secretary and General Counsel, Invesco Management Group, Inc. (formerly known as Invesco AIM Management Group, Inc.; Senior Vice President, Invesco Advisers, Inc. (formerly known as Invesco Institutional (N.A.), Inc.) (registered investment adviser); Senior Vice President and Secretary, Invesco Distributors, Inc. (formerly known as Invesco AIM Distributors, Inc.); Director, Vice President and Secretary, Invesco Investment Services, Inc. (formerly known as Invesco AIM Investment Services, Inc.) Senior Vice President, Chief Legal Officer and Secretary, The Invesco Funds; Managing Director, Invesco PowerShares Capital Management LLC; Director, Secretary and General Counsel, Invesco Investment Advisers LLC (formerly known as Van Kampen Asset Management); Secretary and General Counsel, Invesco Capital Markets, Inc. (formerly known as Van Kampen Funds Inc.) and Chief Legal Officer, PowerShares Exchange-Traded Fund Trust, PowerShares Exchange-Traded Fund Trust II, PowerShares India Exchange-Traded Fund Trust, PowerShares Actively Managed Exchange-Traded Fund Trust, and PowerShares Actively Managed Exchange-Traded Commodity Fund Trust Formerly: Director, Secretary, General Counsel and Senior Vice President, Van Kampen Exchange Corp.; Director, Vice President and Secretary, IVZ Distributors, Inc. (formerly known as INVESCO Distributors, Inc.); Director and Vice President, INVESCO Funds Group, Inc.; Director and Vice President, Van Kampen Advisors Inc.; Director, Vice President, Secretary and General Counsel, Van Kampen Investor Services Inc.; Director, Invesco Distributors, Inc. (formerly known as Invesco AIM Distributors, Inc.); Director, Senior Vice President, General Counsel and Secretary, Invesco AIM Advisers, Inc. and Van Kampen Investments Inc.; Director, Vice President and Secretary, Fund Management Company; Director, Senior Vice President, Secretary, General Counsel and Vice President, Invesco AIM Capital Management, Inc.; Chief Operating Officer and General Counsel, Liberty Ridge Capital, Inc. (an investment adviser); Vice President and Secretary, PBHG Funds (an investment company) and PBHG Insurance Series Fund (an investment company); Chief Operating Officer, General Counsel and Secretary, Old Mutual Investment Partners (a broker-dealer); General Counsel and Secretary, Old Mutual Fund Services (an administrator) and Old Mutual Shareholder Services (a shareholder servicing center); Executive Vice President, General Counsel and Secretary, Old Mutual Capital, Inc. (an investment adviser); and Vice President and Secretary, Old Mutual Advisors Funds (an investment company) | | N/A | | N/A |
| Karen Dunn Kelley — 1960 Senior Vice President | | 1992 | | Senior Managing Director, Investments, Invesco Ltd.; Director, Co-President, Co-Chief Executive Officer, and Co-Chairman, Invesco Advisers, Inc. (formerly known as Invesco Institutional (N.A.), Inc.) (registered investment adviser); Chairman and Director, Invesco Senior Secured Management, Inc.; Senior Vice President, Invesco Management Group, Inc. (formerly known as Invesco AIM Management Group, Inc.); Executive Vice President, Invesco Distributors, Inc. (formerly known as Invesco AIM Distributors, Inc.); Director, Invesco Mortgage Capital Inc.; Senior Vice President, The Invesco Funds Formerly: Director, Invesco Management Company Limited; Vice President, The Invesco Funds (other than AIM Treasurer’s Series Trust (Invesco Treasurer’s Series Trust), Short-Term Investments Trust and Invesco Management Trust); and President and Principal Executive Officer, The Invesco Funds (AIM Treasurer’s Series Trust (Invesco Treasurer’s Series Trust), Short-Term Investments Trust and Invesco Management Trust only); Director and President, INVESCO Asset Management (Bermuda) Ltd., Director, INVESCO Global Asset Management DAC (formerly known as INVESCO Global Asset Management Limited) and INVESCO Management S.A.; Senior Vice President, Van Kampen Investments Inc. and Invesco Advisers, Inc. (formerly known as Invesco Institutional (N.A.), Inc.) (registered investment adviser); Director and President, Fund Management Company; Chief Cash Management Officer, Director of Cash Management, Senior Vice President, and Managing Director, Invesco AIM Capital Management, Inc.; Director of Cash Management, Senior Vice President, and Vice President, Invesco Advisers, Inc. and Vice President, The Invesco Funds (AIM Treasurer’s Series Trust (Invesco Treasurer’s Series Trust), and Short-Term Investments Trust only) | | N/A | | N/A |
Kelli Gallegos — 1970 Vice President, Principal Financial Officer and Assistant Treasurer | | 2008 | | Vice President, Principal Financial Officer and Assistant Treasurer, The Invesco Funds; Assistant Treasurer, Invesco PowerShares Capital Management LLC, PowerShares Exchange-Traded Fund Trust, PowerShares Exchange-Traded Fund Trust II, PowerShares India Exchange-Traded Fund Trust, PowerShares Actively Managed Exchange-Traded Fund Trust, and PowerShares Actively Managed Exchange-Traded Commodity Fund Trust Formerly: Assistant Vice President, The Invesco Funds | | N/A | | N/A |
Tracy Sullivan — 1962 Vice President, Chief Tax Officer and Assistant Treasurer | | 2008 | | Vice President, Chief Tax Officer and Assistant Treasurer, The Invesco Funds; Assistant Treasurer, Invesco PowerShares Capital Management LLC, PowerShares Exchange-Traded Fund Trust, PowerShares Exchange-Traded Fund Trust II, PowerShares India Exchange-Traded Fund Trust, PowerShares Actively Managed Exchange-Traded Fund Trust, and PowerShares Actively Managed Exchange-Traded Commodity Fund Trust Formerly: Assistant Vice President, The Invesco Funds | | N/A | | N/A |
T-3 Invesco Global Core Equity Fund
Trustees and Officers—(continued)
| | | | | | | | |
Name, Year of Birth and
Position(s) Held with the Trust | | Trustee and/
or Officer Since | | Principal Occupation(s)
During Past 5 Years | | Number of
Funds in Fund
Complex
Overseen by
Trustee | | Other Directorship(s)
Held by Trustee During
Past 5 Years |
| Other Officers—(continued) | | | | | | | | |
Crissie M. Wisdom — 1969 Anti-Money Laundering Compliance Officer | | 2013 | | Anti-Money Laundering Compliance Officer, Invesco Advisers, Inc. (formerly known as Invesco Institutional (N.A.), Inc.) (registered investment adviser), Invesco Capital Markets, Inc. (formerly known as Van Kampen Funds Inc.), Invesco Distributors, Inc., Invesco Investment Services, Inc., Invesco Management Group, Inc., The Invesco Funds, and PowerShares Exchange-Traded Fund Trust, PowerShares Exchange-Traded Fund Trust II, PowerShares India Exchange-Traded Fund Trust, PowerShares Actively Managed Exchange-Traded Fund Trust and PowerShares Actively Managed Exchange-Traded Commodity Fund Trust; Anti-Money Laundering Compliance Officer and Bank Secrecy Act Officer, INVESCO National Trust Company and Invesco Trust Company; and Fraud Prevention Manager and Controls and Risk Analysis Manager for Invesco Investment Services, Inc. Formerly: Anti-Money Laundering Compliance Officer, Van Kampen Exchange Corp. | | N/A | | N/A |
Robert R. Leveille — 1969 Chief Compliance Officer | | 2016 | | Chief Compliance Officer, Invesco Advisers, Inc. (registered investment adviser); and Chief Compliance Officer, The Invesco Funds Formerly: Chief Compliance Officer, Putnam Investments and the Putnam Funds | | N/A | | N/A |
The Statement of Additional Information of the Trust includes additional information about the Fund’s Trustees and is available upon request, without charge, by calling 1.800.959.4246. Please refer to the Fund’s Statement of Additional Information for information on the Fund’s sub-advisers.
| | | | | | |
Office of the Fund 11 Greenway Plaza, Suite 1000 Houston, TX 77046-1173 | | Investment Adviser Invesco Advisers, Inc. 1555 Peachtree Street, N.E. Atlanta, GA 30309 | | Distributor Invesco Distributors, Inc. 11 Greenway Plaza, Suite 1000 Houston, TX 77046-1173 | | Auditors PricewaterhouseCoopers LLP 1000 Louisiana Street, Suite 5800 Houston, TX 77002-5678 |
| | | |
| | | | | | |
Counsel to the Fund Stradley Ronon Stevens & Young, LLP 2005 Market Street, Suite 2600 Philadelphia, PA 19103-7018 | | Counsel to the Independent Trustees Goodwin Procter LLP 901 New York Avenue, N.W. Washington, D.C. 20001 | | Transfer Agent Invesco Investment Services, Inc. 11 Greenway Plaza, Suite 1000 Houston, TX 77046-1173 | | Custodian State Street Bank and Trust Company 225 Franklin Street Boston, MA 02110-2801 |
T-4 Invesco Global Core Equity Fund
Explore High-Conviction Investing with Invesco

Invesco mailing information
Send general correspondence to Invesco Investment Services, Inc., P.O. Box 219078, Kansas City, MO 64121-9078.
Important notice regarding delivery of security holder documents
To reduce Fund expenses, only one copy of most shareholder documents may be mailed to shareholders with multiple accounts at the same address (Householding). Mailing of your shareholder documents may be householded indefinitely unless you instruct us otherwise. If you do not want the mailing of these documents to be combined with those for other members of your household, please contact Invesco Investment Services, Inc. at 800 959 4246 or contact your financial institution. We will begin sending you individual copies for each account within 30 days after receiving your request.
Fund holdings and proxy voting information
The Fund provides a complete list of its holdings four times in each fiscal year, at the quarter ends. For the second and fourth quarters, the lists appear in the Fund’s semiannual and annual reports to shareholders. For the first and third quarters, the Fund files the lists with the Securities and Exchange Commission (SEC) on Form N-Q. The most recent list of portfolio holdings is available at invesco.com/completeqtrholdings. Shareholders can also look up the Fund’s Forms N-Q on the SEC website at sec.gov. Copies of the Fund’s Forms N-Q may be reviewed and copied at the SEC Public Reference Room in Washington, D.C. You can obtain information on the operation of the Public Reference Room, including information about duplicating fee charges, by calling 202 551 8090 or 800 732 0330, or by electronic request at the following email address: publicinfo@sec.gov. The SEC file numbers for the Fund are shown below.
A description of the policies and procedures that the Fund uses to determine how to vote proxies relating to portfolio securities is available without charge, upon request, from our Client Services department at 800 959 4246 or at invesco.com/proxyguidelines. The information is also available on the SEC website, sec.gov.
| | |
Information regarding how the Fund voted proxies related to its portfolio securities during the most recent 12-month period ended June 30 is available at invesco.com/proxysearch. The information is also available on the SEC website, sec.gov. Invesco Advisers, Inc. is an investment adviser; it provides investment advisory services to individual and institutional clients and does not sell securities. Invesco Distributors, Inc. is the US distributor for Invesco Ltd.’s retail mutual funds, exchange-traded funds and institutional money market funds. Both are wholly owned, indirect subsidiaries of Invesco Ltd. | |  |
| | | | |
| SEC file numbers: 811-01540 and 002-27334 | | GCE-AR-1 | | Invesco Distributors, Inc. |
| | | | |
| | |
 | | Annual Report to Shareholders | | December 31, 2016 |
| | |
| | Invesco International Small Company Fund Nasdaq: A: IEGAX ∎ B: IEGBX ∎ C: IEGCX ∎ Y: IEGYX ∎ R5: IEGIX ∎ R6: IEGFX |

Letters to Shareholders
| | |

Philip Taylor | | Dear Shareholders: This annual report includes information about your Fund, including performance data and a complete list of its investments as of the close of the reporting period. Inside is a discussion of how your Fund was managed and the factors that affected its performance during the reporting period. The reporting period began with significant stock market volatility in the US and abroad; this volatility was the result of investor uncertainty about global economic growth and monetary policy. After recovering, markets declined sharply following UK voters’ decision in June to leave the European Union. Relatively quickly, however, markets recovered, reaching record highs later in the summer. Demand was strong for income-producing investments, particularly those perceived to be lower risk; this benefited bonds as well as dividend-paying |
stocks for much of the reporting period. While economic news in the US was generally positive during the reporting period, news overseas was less upbeat. The European Central Bank and central banks in China and Japan – as well as other countries – maintained extraordinarily accommodative monetary policies in response to economic weakness. After months of uncertainty, the surprise outcome of the US presidential election in November triggered a major stock market rally, with most market indexes reaching new record highs in December. As expected, the US Federal Reserve raised interest rates in December – its only rate increase during the reporting period and only its second increase since 2006. The Fed cited optimistic economic data for its decision, and Fed-watchers suggested that future rate increases might be announced more quickly than previously forecast.
Short-term market volatility can prompt some investors to abandon their investment plans – and can cause others to settle for whatever returns the market has to offer. The investment professionals at Invesco, in contrast, invest with high conviction. This means that, no matter the asset class or the strategy, each investment team has a passion to exceed. We want to help investors achieve better outcomes, such as seeking higher returns, helping mitigate risk and generating income. Of course, investing with high conviction can’t guarantee a profit or ensure success; no investment strategy can. To learn more about how we invest with high conviction, visit invesco.com/HighConviction.
You, too, can invest with high conviction by maintaining a long-term investment perspective and by working with your financial adviser on a regular basis. During periods of short-term market volatility or uncertainty, your financial adviser can keep you focused on your long-term investment goals – a new home, a child’s college education or a secure retirement. He or she also can share research about the economy, the markets and individual investment options.
Visit our website for more information on your investments
Our website, invesco.com/us, offers a wide range of market insights and investment perspectives. On the website, you’ll find detailed information about our funds, including performance, holdings and portfolio manager commentaries. You can access information about your account by completing a simple, secure online registration. Click on the “Need to register” link in the “Account Access” box on our homepage to get started.
In addition to the resources accessible on our website and through our mobile app, you can obtain timely updates to help you stay informed about the markets, the economy and investing by connecting with Invesco on Twitter, LinkedIn or Facebook. You can access our blog at blog.invesco.us.com. Our goal is to provide you the information you want, when and where you want it.
Finally, I’m pleased to share with you Invesco’s commitment to both the Principles for Responsible Investment and to considering environmental, social and governance issues in our robust investment process. I invite you to learn more at invesco.com/esg.
Have questions?
For questions about your account, contact an Invesco client services representative at 800 959 4246. For Invesco-related questions or comments, please email me directly at phil@invesco.com.
All of us at Invesco look forward to serving your investment management needs. Thank you for investing with us.
Sincerely,

Philip Taylor
Senior Managing Director, Invesco Ltd.
| | |
| 2 | | Invesco International Small Company Fund |
| | |

Bruce Crockett | | Dear Fellow Shareholders: Among the many important lessons I’ve learned in more than 40 years in a variety of business endeavors is the value of a trusted advocate. As independent chair of the Invesco Funds Board, I can assure you that the members of the Board are strong advocates for the interests of investors in Invesco’s mutual funds. We work hard to represent your interests through oversight of the quality of the investment management services your funds receive and other matters important to your investment, including but not limited to: ∎ Ensuring that Invesco offers a diverse lineup of mutual funds that your financial adviser can use to strive to meet your financial needs as your investment goals change over time. ∎ Monitoring how the portfolio management teams of the Invesco funds are performing in light of changing economic and market conditions. |
∎ Assessing each portfolio management team’s investment performance within the context of the investment strategy described in the fund’s prospectus.
∎ Monitoring for potential conflicts of interests that may impact the nature of the services that your funds receive.
We believe one of the most important services we provide our fund shareholders is the annual review of the funds’ advisory and sub-advisory contracts with Invesco Advisers and its affiliates. This review is required by the Investment Company Act of 1940 and focuses on the nature and quality of the services Invesco provides as the adviser to the Invesco funds and the reasonableness of the fees that it charges for those services. Each year, we spend months carefully reviewing information received from Invesco and a variety of independent sources, such as performance and fee data prepared by Lipper, Inc. (a subsidiary of Broadridge Financial Solutions, Inc.), an independent, third-party firm widely recognized as a leader in its field. We also meet with our independent legal counsel and other independent advisers to review and help us assess the information that we have received. Our goal is to assure that you receive quality investment management services for a reasonable fee.
I trust the measures outlined above provide assurance that you have a worthy advocate when it comes to choosing the Invesco Funds.
As always, please contact me at bruce@brucecrockett.com with any questions or concerns you may have. On behalf of the Board, we look forward to continuing to represent your interests and serving your needs.
Sincerely,

Bruce L. Crockett
Independent Chair
Invesco Funds Board of Trustees
| | |
| 3 | | Invesco International Small Company Fund |
Management’s Discussion of Fund Performance
| | |
Performance summary For the year ended December 31, 2016, Class A shares of Invesco International Small Company Fund (the Fund), at net asset value (NAV), outperformed the MSCI All Country World ex-U.S. Small Cap Growth Index, the Fund’s style-specific benchmark. Your Fund’s long-term performance appears later in this report. |
| | |
Fund vs. Indexes Total returns, 12/31/15 to 12/31/16, at net asset value (NAV). Performance shown does not include applicable contingent deferred sales charges (CDSC) or front-end sales charges, which would have reduced performance. |
| | | | |
Class A Shares | | | 8.79 | % |
Class B Shares | | | 8.03 | |
Class C Shares | | | 7.96 | |
Class Y Shares | | | 9.10 | |
Class R5 Shares | | | 9.21 | |
Class R6 Shares | | | 9.22 | |
MSCI All Country World ex-U.S. Small Cap Indextq (Broad Market Index) | | | 3.91 | |
MSCI All Country World ex-U.S. Small Cap Growth Indexq (Style-Specific Index) | | | -0.28 | |
Lipper International Small/Mid-Cap Growth Funds Index⬛ (Peer Group Index) | | | -2.63 | |
Source(s): qFactSet Research Systems Inc; ⬛Lipper Inc. | |
Market conditions and your Fund
Global equities began 2016 on a negative note, driven by investor concerns about economic weakness in China, falling oil prices and the US Federal Reserve’s (the Fed) monetary policy. Equity markets rebounded strongly in February. Central banks, including the Fed, the European Central Bank and the Bank of Japan, soothed investors’ nerves throughout the reporting period with accommodative policies and dovish rhetoric. Other factors contributing to investor sentiment included rebounding oil prices and, in the US, an improving housing market and employment picture. But the year was volatile and full of surprises – several of them involving elections.
In June, the Brexit – the decision by UK voters to leave the European Union – caused global markets to decline sharply, but only briefly. Stocks in economically
sensitive sectors, including energy and financials, were hardest hit, and investors flocked to the perceived safety of US Treasuries and more defensive, dividend-paying equities. Following the surprise outcome of the US presidential election in November, US stocks surged, led by the health care and financials sectors, which might benefit from reduced regulation. Non-US equities, particularly emerging market equities, traded lower on the news due to currency weakness and the prospect of a less favorable trade environment.
Also in November, OPEC agreed to cut production for the first time in eight years; the agreement helped support higher oil prices and energy stocks. As expected, the Fed raised interest rates in December 2016, its only rate hike during the reporting period. For the reporting period as a whole, US equities
outperformed non-US equities. Emerging markets, supported by the Fed’s delayed interest rate increases and a rally in commodities, outperformed their developed-market counterparts (excluding the US) – a reversal from previous years.
Regardless of the macroeconomic environment, we remained focused on our bottom-up investment approach of identifying attractive companies that fit our earnings, quality and valuation (EQV) process. During the year, Fund holdings in the health care, information technology and consumer discretionary sectors outperformed those of the style-specific benchmark and were among the strongest contributors to the Fund’s relative performance. However, Fund holdings in the utilities and energy sectors underperformed and were the most significant detractors from the Fund’s relative performance.
On a geographic basis, Fund holdings in Brazil, France and Canada outperformed those of the style-specific benchmark and were among the most significant contributors to the Fund’s relative performance. Overweight exposure to Brazil, one of the strongest markets during the year, was supportive on a relative basis as well. Despite Brazil’s long, deep economic contraction, the Brazilian market rebounded strongly in 2016. Brazil saw renewed optimism on the strength of a change in government, a new economic team and signs of a shift in economic policy. Despite the political situation in Brazil, our strategy, as always, is to focus on underlying EQV company fundamentals. In contrast, the Fund’s holdings in Norway, the Philippines and Egypt underperformed those of the style-specific benchmark and were among the most significant detractors from relative Fund performance.
| | | | | | |
Portfolio Composition | |
| By sector | | % of total net assets | |
| |
Industrials | | | 26.1% | |
Information Technology | | | 14.0 | |
Financials | | | 12.8 | |
Energy | | | 9.7 | |
Consumer Discretionary | | | 7.1 | |
Health Care | | | 6.9 | |
Consumer Staples | | | 5.5 | |
Real Estate | | | 3.7 | |
Utilities | | | 2.6 | |
Money Market Funds Plus Other Assets Less Liabilities | | | 11.6 | |
| | | | | | |
Top 10 Equity Holdings* | |
| | | % of total net assets | |
| | |
1. | | Wilson Sons Ltd.-BDR | | | 4.3% | |
2. | | Micro Focus International PLC | | | 4.1 | |
3. | | Danieli & C. Officine | | | | |
| | Meccaniche S.p.A.-Savings | | | | |
| | | Shares | | | 3.8 | |
4. | | Total Energy Services Inc. | | | 3.5 | |
5. | | Fleury S.A. | | | 3.2 | |
6. | | Calian Group Ltd. | | | 3.0 | |
7. | | Total Produce PLC | | | 3.0 | |
8. | | MorphoSys AG | | | 2.8 | |
9. | | Precia S.A. | | | 2.8 | |
10. | | Energy Development Corp. | | | 2.6 | |
| | | | | | |
Total Net Assets | | $ | 221.9 million | |
| |
Total Number of Holdings* | | | 56 | |
The Fund’s holdings are subject to change, and there is no assurance that the Fund will continue to hold any particular security. *Excluding money market fund holdings.
Data presented here are as of December 31, 2016.
| | |
| 4 | | Invesco International Small Company Fund |
Fleury, a medical services provider based in Sao Paulo, Brazil, was the Fund’s top individual contributor during the year. Fleury is a dominant franchise in San Paulo, holding over 50% of market share in medical labs. The aging population in the region remains a secular tailwind for the company as well. In contrast, MorphoSys, a German-based biotechnology company, was among the most significant detractors from Fund performance for the reporting period. Despite a pullback earlier in the year, MorphoSys rose for the reporting period based in part on favorable clinical trials for its new psoriasis drug. Results were better than expected, suggesting the drug might generate income for the company in 2018. These results, which came after disappointing results for other compounds, instilled greater confidence in the company’s drug development technology (and by extension its very long list of compounds in development).
Over the reporting period, we continued to look for opportunities to improve the growth potential and quality of the Fund’s portfolio by adding companies based on our EQV outlook for each company. We added several new stocks to the portfolio, including 7-Eleven Malaysia Holdings, sole operator of 7-Elevens in Malaysia until 2033, South Africa-based payment technology company Net 1 UEPS Technologies and Estonia-based lingerie manufacturer Silvano Fashion Group. Weakening fundamentals led us to sell select names over the reporting period, including Cequence Energy, a Canadian oil and gas exploration and development company.
As always, regardless of the macroeconomic environment, we remain focused on a bottom-up investment approach of identifying attractive companies that fit our EQV-focused investment process. We continue to look for high-quality companies that exhibit the following characteristics: strong organic growth, high returns on capital, pricing power, strong balance sheets, cash generation and reasonable valuations. In addition, we continue to favor companies that are able to consistently generate cash during weak economic environments. We believe that this balanced EQV-focused approach may help deliver attractive returns over the long term.
We thank you for your continued investment in Invesco International Small Company Fund.
The views and opinions expressed in management’s discussion of Fund performance are those of Invesco Advisers, Inc. These views and opinions are subject to change at any time based on factors such as market and economic conditions. These views and opinions may not be relied upon as investment advice or recommendations, or as an offer for a particular security. The information is not a complete analysis of every aspect of any market, country, industry, security or the Fund. Statements of fact are from sources considered reliable, but Invesco Advisers, Inc. makes no representation or warranty as to their completeness or accuracy. Although historical performance is no guarantee of future results, these insights may help you understand our investment management philosophy.
See important Fund and, if applicable, index disclosures later in this report.
| | |
 | | Shuxin (Steve) Cao Chartered Financial Analyst, Portfolio Manager, is lead manager with respect to the Fund’s |
investments in Asia Pacific and Latin America of Invesco International Small Company Fund. He joined Invesco in 1997. Mr. Cao earned a BA in English from the Tianjin Foreign Language Institute and an MBA from Texas A&M University. He is also a Certified Public Accountant. |
| | |
 | | Jason Holzer Chartered Financial Analyst, Portfolio Manager, is lead manager with respect to the Fund’s |
investments in Europe, Canada, the Middle East and Africa of Invesco International Small Company Fund. He joined Invesco in 1996. Mr. Holzer earned a BA in quantitative economics and an MS in engineering economic systems from Stanford University. |
| | |
 | | Borge Endresen Chartered Financial Analyst, Portfolio Manager, is manager of Invesco International Small |
Company Fund. He joined Invesco in 1999. Mr. Endresen earned a BS in finance from the University of Oregon and an MBA from The University of Texas at Austin. |
| | |
| 5 | | Invesco International Small Company Fund |
|
| Your Fund’s Long-Term Performance |
Results of a $10,000 Investment – Oldest Share Class(es)
Fund and index data from 12/31/06
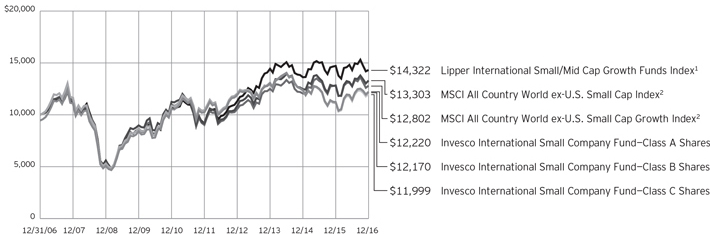
1 Source: Lipper Inc.
2 Source: FactSet Research Systems Inc.
Past performance cannot guarantee comparable future results.
The data shown in the chart include reinvested distributions, applicable sales charges and Fund expenses including management fees. Results for Class B shares are calculated as if a hypothetical shareholder had liquidated his entire investment in the Fund at the close of the reporting period and paid the contingent deferred sales charges, if applicable.
Index results include reinvested dividends, but they do not reflect sales charges. Performance of the peer group, if applicable, reflects fund expenses and management fees; performance of a market index does not. Performance shown in the chart and table(s) does not reflect deduction of taxes a shareholder would pay on Fund distributions or sale of Fund shares.
| | |
| 6 | | Invesco International Small Company Fund |
| | | | |
| Average Annual Total Returns | |
| As of 12/31/16, including maximum applicable sales charges | |
| |
Class A Shares | | | | |
Inception (8/31/00) | | | 8.32 | % |
10 Years | | | 2.02 | |
5 Years | | | 2.43 | |
1 Year | | | 2.79 | |
| |
Class B Shares | | | | |
Inception (8/31/00) | | | 8.32 | % |
10 Years | | | 1.98 | |
5 Years | | | 2.51 | |
1 Year | | | 3.04 | |
| |
Class C Shares | | | | |
Inception (8/31/00) | | | 7.91 | % |
10 Years | | | 1.84 | |
5 Years | | | 2.82 | |
1 Year | | | 6.96 | |
| |
Class Y Shares | | | | |
10 Years | | | 2.82 | % |
5 Years | | | 3.85 | |
1 Year | | | 9.10 | |
| |
Class R5 Shares | | | | |
Inception (10/25/05) | | | 7.00 | % |
10 Years | | | 3.02 | |
5 Years | | | 3.95 | |
1 Year | | | 9.21 | |
| |
Class R6 Shares | | | | |
10 Years | | | 2.78 | % |
5 Years | | | 3.96 | |
1 Year | | | 9.22 | |
Class Y shares incepted on October 3, 2008. Performance shown prior to that date is that of Class A shares and includes the 12b-1 fees applicable to Class A shares.
Class R6 shares incepted on September 24, 2012. Performance shown prior to that date is that of Class A shares and includes the 12b-1 fees applicable to Class A shares.
The performance data quoted represent past performance and cannot guarantee comparable future results; current performance may be lower or higher. Please visit invesco.com/performance for the most recent month-end performance. Performance figures reflect reinvested distributions, changes in net asset value and the effect of the maximum sales charge unless otherwise stated. Investment return and principal value will fluctuate so that you may have a gain or loss when you sell shares.
The net annual Fund operating expense ratio set forth in the most recent Fund prospectus as of the date of this report for Class A, Class B, Class C, Class Y, Class R5 and Class R6 shares was 1.53%, 2.28%, 2.28%, 1.28%, 1.18% and 1.10%, respectively.1 The total annual Fund operating expense ratio set forth in the most recent Fund prospectus as of the date of this report for Class A, Class B, Class C, Class Y, Class R5 and Class R6 shares was 1.54%, 2.29%, 2.29%, 1.29%, 1.19% and 1.11%, respectively. The expense ratios presented above may vary from the expense ratios presented in other sections of this report that are based on expenses incurred during the period covered by this report.
Class A share performance reflects the maximum 5.50% sales charge, and Class B and Class C share performance reflects the applicable contingent deferred sales charge (CDSC) for the period involved. The CDSC on Class B shares declines from 5% beginning at the time of purchase to 0% at the beginning of the seventh year. The CDSC on Class C shares is 1% for the first year after purchase. Class Y, Class R5 and Class R6 shares do not have a front-end sales charge or a CDSC; therefore, performance is at net asset value.
The performance of the Fund’s share classes will differ primarily due to different sales charge structures and class expenses.
Fund performance reflects any applicable fee waivers and/or expense reimbursements. Had the adviser not waived fees and/or reimbursed expenses currently or in the past, returns would have been lower. See current prospectus for more information.
| 1 | Total annual Fund operating expenses after any contractual fee waivers and/or expense reimbursements by the adviser in effect through at least June 30, 2018. See current prospectus for more information. |
| | |
| 7 | | Invesco International Small Company Fund |
Invesco International Small Company Fund’s investment objective is long-term growth of capital.
| ∎ | | Unless otherwise stated, information presented in this report is as of December 31, 2016, and is based on total net assets. |
| ∎ | | Unless otherwise noted, all data provided by Invesco. |
| ∎ | | To access your Fund’s reports/prospectus, visit invesco.com/fundreports. |
About share classes
| ∎ | | Class B shares may not be purchased for new or additional investments. Please see the prospectus for more information. |
| ∎ | | Class Y shares are available to only certain investors. Please see the prospectus for more information. |
| ∎ | | Class R5 shares and Class R6 shares are primarily intended for employer sponsored retirement and benefit plans that meet certain standards and for institutional investors. Please see the prospectus for more information. |
Principal risks of investing in the Fund
| ∎ | | Depositary receipts risk. Investing in depositary receipts involves the same risks as direct investments in foreign securities. In addition, the underlying issuers of certain depositary receipts are under no obligation to distribute shareholder communications or pass through any voting rights with respect to the deposited securities to the holders of such receipts. The Fund may therefore receive less timely information or have less control than if it invested directly in the foreign issuer. |
| ∎ | | Derivatives risk. The value of a derivative instrument depends largely on (and is derived from) the value of an underlying security, currency, commodity, interest rate, index or other asset (each referred to as an underlying asset). In addition to risks relating to the underlying assets, the use of derivatives may include other, possibly greater, risks, including counterparty, leverage and liquidity risks. Counterparty risk is the risk that the counterparty to the derivative contract will default on its obligation to pay the Fund the amount owed or otherwise perform under the derivative contract. Derivatives create leverage risk because they do not require payment up front equal to the economic exposure created by owning the derivative. As a result, an adverse change in the value of the underlying |
| | | asset could result in the Fund sustaining a loss that is substantially greater than the amount invested in the derivative, which may make the Fund’s returns more volatile and increase the risk of loss. Derivative instruments may also be less liquid than more traditional investments and the Fund may be unable to sell or close out its derivative positions at a desirable time or price. This risk may be more acute under adverse market conditions, during which the Fund may be most in need of liquidating its derivative positions. Derivatives may also be harder to value, less tax efficient and subject to changing government regulation that could impact the Fund’s ability to use certain derivatives or their cost. Also, derivatives used for hedging or to gain or limit exposure to a particular market segment may not provide the expected benefits, particularly during adverse market conditions. |
| ∎ | | Emerging markets securities risk. Emerging markets (also referred to as developing markets) are generally subject to greater market volatility, political, social and economic instability, uncertain trading markets and more governmental limitations on foreign investment than more developed markets. In addition, companies operating in emerging markets may be subject to lower trading volume and greater price fluctuations than companies in more developed markets. Securities law and the enforcement of systems of taxation in many emerging market countries may change quickly and unpredictably. In addition, investments in emerging markets securities may also be subject to additional transaction costs, delays in settlement procedures, and lack of timely information. |
| ∎ | | Foreign securities risk. The Fund’s foreign investments may be adversely affected by political and social instability, changes in economic or taxation policies, difficulty in enforcing obligations, decreased liquidity or increased volatility. |
| | | Foreign investments also involve the risk of the possible seizure, nationalization or expropriation of the issuer or foreign deposits (in which the Fund could lose its entire investments in a certain market) and the possible adoption of foreign governmental restrictions such as exchange controls. Unless the Fund has hedged its foreign securities risk, foreign securities risk also involves the risk of negative foreign currency rate fluctuations, which may cause the value of securities denominated in such foreign currency (or other instruments through which the Fund has exposure to foreign currencies) to decline in value. Currency exchange rates may fluctuate significantly over short periods of time. Currency hedging strategies, if used, are not always successful. |
| ∎ | | Geographic focus risk. The Fund may from time to time invest a substantial amount of its assets in securities of issuers located in a single country or a limited number of countries. Adverse economic, political or social conditions in those countries may therefore have a significant negative impact on the Fund’s investment performance. |
| ∎ | | Growth investing risk. Growth stocks tend to be more expensive relative to the issuing company’s earnings or assets compared with other types of stock. As a result, they tend to be more sensitive to changes in, or investors’ expectations of, the issuing company’s earnings and can be more volatile. |
| ∎ | | Investing in the European Union risk. Investments in certain countries in the European Union are susceptible to high economic risks associated with high levels of debt, such as investments in sovereign debt of Greece, Italy and Spain. Efforts of the member states to further unify their economic and monetary policies may increase the potential for the downward movement of one member state’s market to cause a similar effect on other member states’ markets. Separately, the European Union faces issues involving its membership, structure, procedures and policies. The exit of one or more member states from the European Union, such as the United Kingdom (UK) which has announced its intention to exit, would place its currency and banking system in jeopardy. The exit by the UK or other |
| | |
This report must be accompanied or preceded by a currently effective Fund prospectus, which contains more complete information, including sales charges and expenses. Investors should read it carefully before investing. | | |
NOT FDIC INSURED | MAY LOSE VALUE | NO BANK GUARANTEE | | |
| | |
| 8 | | Invesco International Small Company Fund |
| | member states will likely result in increased volatility, illiquidity and potentially lower economic growth in the affected markets, which will adversely affect the Fund’s investments. |
| ∎ | | Management risk. The Fund is actively managed and depends heavily on the Adviser’s judgment about markets, interest rates or the attractiveness, relative values, liquidity, or potential appreciation of particular investments made for the Fund’s portfolio. The Fund could experience losses if these judgments prove to be incorrect. Additionally, legislative, regulatory, or tax developments may adversely affect management of the Fund and, therefore, the ability of the Fund to achieve its investment objective. |
| ∎ | | Market risk. The market values of the Fund’s investments, and therefore the value of the Fund’s shares, will go up and down, sometimes rapidly or unpredictably. Market risk may affect a single issuer, industry or section of the economy, or it may affect the market as a whole. Individual stock prices tend to go up and down more dramatically than those of certain other types of investments, such as bonds. During a general downturn in the financial markets, multiple asset classes may decline in value. When markets perform well, there can be no assurance that specific investments held by the Fund will rise in value. |
| ∎ | | Preferred securities risk. Preferred securities are subject to issuer-specific and market risks applicable generally to equity securities. Preferred securities also may be subordinated to bonds or other debt instruments, subjecting them to a greater risk of non-payment, may be less liquid than many other securities, such as common stocks, and generally offer no voting rights with respect to the issuer. |
| ∎ | | Small- and mid-capitalization companies risks. Small- and mid-capitalization companies tend to be more vulnerable to changing market conditions, may have little or no operating history or track record of success, and may have more limited product lines and markets, less experienced management and fewer financial resources than larger companies. These companies’ securities may be more volatile and less liquid |
| | | than those of more established companies, and their returns may vary, sometimes significantly, from the overall securities market. |
About indexes used in this report
| ∎ | | The MSCI All Country World ex-U.S. Small Cap Index represents the performance of small-cap stocks in developed and emerging markets, excluding the US. The index is computed using the net return, which withholds applicable taxes for non-resident investors. |
| ∎ | | The MSCI All Country World ex-U.S. Small Cap Growth Index represents the performance of small-cap growth stocks in developed and emerging markets, excluding the US. The index is computed using the net return, which withholds applicable taxes for non-resident investors. |
| ∎ | | The Lipper International Small/Mid-Cap Growth Funds Index is an unmanaged index considered representative of international small/mid-cap growth funds tracked by Lipper. |
| ∎ | | The Fund is not managed to track the performance of any particular index, including the index(es) described here, and consequently, the performance of the Fund may deviate significantly from the performance of the index(es). |
| ∎ | | A direct investment cannot be made in an index. Unless otherwise indicated, index results include reinvested dividends, and they do not reflect sales charges. Performance of the peer group, if applicable, reflects fund expenses; performance of a market index does not. |
Other information
| ∎ | | CPA® and Certified Public Accountant® are trademarks owned by the American Institute of Certified Public Accountants. |
| ∎ | | The returns shown in management’s discussion of Fund performance are based on net asset values (NAVs) calculated for shareholder transactions. Generally accepted accounting principles require adjustments to be made to the net assets of the Fund at period end for financial reporting purposes, and as such, the NAVs for shareholder transactions and the returns based on those NAVs may differ from the NAVs and returns reported in the Financial Highlights. |
| ∎ | | Industry classifications used in this report are generally according to the Global Industry Classification Standard, which was developed by and is the exclusive property and a service mark of MSCI Inc. and Standard & Poor’s. |
| | |
| 9 | | Invesco International Small Company Fund |
Schedule of Investments
December 31, 2016
| | | | | | | | |
| | | Shares | | | Value | |
Common Stocks & Other Equity Interests–88.39% | |
| Brazil–7.92% | |
Fleury S.A. | | | 650,400 | | | $ | 7,122,882 | |
TOTVS S.A. | | | 128,900 | | | | 947,207 | |
Wilson Sons Ltd.–BDR | | | 922,700 | | | | 9,495,569 | |
| | | | | | | | 17,565,658 | |
|
| Canada–11.54% | |
Brookfield Real Estate Services, Inc. | | | 172,000 | | | | 2,019,913 | |
Calian Group Ltd. | | | 367,000 | | | | 6,701,299 | |
Epsilon Energy Ltd.(a) | | | 1,578,800 | | | | 3,421,311 | |
exactEarth Ltd.(a) | | | 385,656 | | | | 605,975 | |
Medical Facilities Corp. | | | 151,600 | | | | 1,983,551 | |
Total Energy Services Inc. | | | 722,190 | | | | 7,841,181 | |
TransGlobe Energy Corp.(a) | | | 1,789,922 | | | | 3,025,746 | |
| | | | | | | | 25,598,976 | |
|
| Egypt–1.67% | |
Eastern Tobacco | | | 241,320 | | | | 3,696,346 | |
|
| Estonia–0.59% | |
Silvano Fashion Group AS–Class A | | | 422,995 | | | | 1,317,861 | |
|
| France–10.87% | |
AURES Technologies SA | | | 67,164 | | | | 1,374,281 | |
Caisse Regionale de Credit Agricole Mutuel Nord de France–CCI | | | 206,000 | | | | 3,967,903 | |
Constuctions Industrielles de la Mediterranee S.A. | | | 25,804 | | | | 3,107,647 | |
Linedata Services | | | 58,928 | | | | 2,900,894 | |
Metropole Television S.A. | | | 252,758 | | | | 4,700,934 | |
Precia S.A.(b) | | | 35,321 | | | | 6,134,225 | |
Tessi S.A. | | | 11,400 | | | | 1,934,713 | |
| | | | | | | | 24,120,597 | |
|
| Germany–4.91% | |
Hypoport AG(a) | | | 14,078 | | | | 1,152,084 | |
MorphoSys AG(a) | | | 120,702 | | | | 6,193,438 | |
Takkt AG | | | 157,000 | | | | 3,557,834 | |
| | | | | | | | 10,903,356 | |
|
| Greece–1.38% | |
European Reliance General Insurance Co. S.A. | | | 196,408 | | | | 407,257 | |
METKA INDUSTRIAL-CONSTRUCTION S.A. | | | 397,000 | | | | 2,665,962 | |
| | | | | | | | 3,073,219 | |
|
| Indonesia–0.49% | |
PT Pakuwon Jati Tbk | | | 25,979,600 | | | | 1,085,036 | |
|
| Ireland–2.95% | |
Total Produce PLC | | | 3,165,000 | | | | 6,546,045 | |
|
| Israel–1.50% | |
Israel Discount Bank Ltd.–Class A(a) | | | 1,600,000 | | | | 3,320,746 | |
| | | | | | | | |
| | | Shares | | | Value | |
| Italy–3.76% | |
Danieli & C. Officine Meccaniche S.p.A.–Savings Shares | | | 523,910 | | | $ | 8,348,824 | |
|
| Japan–4.04% | |
EXEDY Corp. | | | 156,100 | | | | 4,384,597 | |
Nippon Ceramic Co., Ltd. | | | 268,100 | | | | 4,583,007 | |
| | | | | | | | 8,967,604 | |
|
| Malaysia–0.83% | |
7-Eleven Malaysia Holdings Bhd. | | | 5,849,000 | | | | 1,851,341 | |
|
| Mexico–1.68% | |
Bolsa Mexicana de Valores, S.A.B. de C.V. | | | 2,834,700 | | | | 3,727,961 | |
|
| Netherlands–1.78% | |
Aalberts Industries N.V. | | | 121,823 | | | | 3,947,699 | |
|
| New Zealand–1.71% | |
Freightways Ltd. | | | 812,632 | | | | 3,801,609 | |
|
| Norway–0.79% | |
Kongsberg Gruppen ASA | | | 120,919 | | | | 1,743,065 | |
|
| Philippines–2.57% | |
Energy Development Corp. | | | 54,981,350 | | | | 5,708,749 | |
|
| Romania–5.07% | |
Banca Transilvania | | | 7,225,957 | | | | 3,997,473 | |
Societatea Nationala de Gaze Naturale ROMGAZ S.A. | | | 706,000 | | | | 4,093,988 | |
Transgaz SA Medias | | | 46,200 | | | | 3,150,585 | |
| | | | | | | | 11,242,046 | |
|
| South Africa–1.58% | |
Cartrack Holdings Ltd. | | | 1,500,000 | | | | 1,201,267 | |
Net 1 UEPS Technologies, Inc.(a) | | | 200,000 | | | | 2,296,000 | |
| | | | | | | | 3,497,267 | |
|
| Switzerland–0.90% | |
Kardex AG | | | 21,300 | | | | 1,987,691 | |
|
| Thailand–0.82% | |
Major Cineplex Group PCL | | | 1,992,200 | | | | 1,814,905 | |
|
| Turkey–0.60% | |
Yazicilar Holding A.S.–Class A | | | 358,400 | | | | 1,336,214 | |
|
| United Kingdom–18.44% | |
Clarkson PLC | | | 142,000 | | | | 3,803,693 | |
DCC PLC | | | 75,551 | | | | 5,602,059 | |
Eurocell PLC | | | 930,000 | | | | 2,048,870 | |
Goodwin PLC | | | 40,000 | | | | 864,123 | |
HomeServe PLC | | | 327,805 | | | | 2,488,117 | |
IG Group Holdings PLC | | | 204,814 | | | | 1,247,475 | |
Jupiter Fund Management PLC | | | 873,948 | | | | 4,763,489 | |
Lancashire Holdings Ltd. | | | 148,165 | | | | 1,263,632 | |
See accompanying Notes to Financial Statements which are an integral part of the financial statements.
10 Invesco International Small Company Fund
| | | | | | | | |
| | | Shares | | | Value | |
| United Kingdom–(continued) | | | | | | | | |
Micro Focus International PLC | | | 341,149 | | | $ | 9,154,216 | |
Mortgage Advice Bureau (Holdings) Ltd. | | | 615,000 | | | | 2,624,958 | |
Savills PLC | | | 591,866 | | | | 5,097,834 | |
Tullett Prebon PLC | | | 366,680 | | | | 1,958,544 | |
| | | | | | | | 40,917,010 | |
Total Common Stocks & Other Equity Interests
(Cost $172,622,384) | | | | 196,119,825 | |
|
Money Market Funds–11.42% | |
Government & Agency Portfolio–Institutional Class, 0.43%(c) | | | 15,197,708 | | | | 15,197,708 | |
| | | | | | | | |
| | | Shares | | | Value | |
Treasury Portfolio–Institutional
Class, 0.37%(c) | | | 10,131,805 | | | $ | 10,131,805 | |
Total Money Market Funds
(Cost $25,329,513) | | | | 25,329,513 | |
TOTAL INVESTMENTS–99.81%
(Cost $197,951,897) | | | | 221,449,338 | |
OTHER ASSETS LESS LIABILITIES–0.19% | | | | 431,663 | |
NET ASSETS–100.00% | | | $ | 221,881,001 | |
Investment Abbreviations:
BDR – Brazilian Depositary Receipt
Notes to Schedule of Investments:
| (a) | Non-income producing security. |
| (b) | Affiliated company during the period. The Investment Company Act of 1940 defines an “affiliated person” as an issuance in which a fund holds 5% or more of the outstanding voting securities. The Fund has not owned enough of the outstanding voting securities of the issuer to have control (as defined in the Investment Company Act of 1940) of that issuer. The value of this security as of December 31, 2016 represented 2.76% of the Fund’s Net Assets. See Note 4. |
| (c) | The money market fund and the Fund are affiliated by having the same investment adviser. The rate shown is the 7-day SEC standardized yield as of December 31, 2016. |
See accompanying Notes to Financial Statements which are an integral part of the financial statements.
11 Invesco International Small Company Fund
Statement of Assets and Liabilities
December 31, 2016
| | | | |
Assets: | |
Investments, at value (Cost $168,249,750) | | $ | 189,985,600 | |
Investments in affiliates, at value (Cost $29,702,147) | | | 31,463,738 | |
Total investments, at value (Cost $197,951,897) | | | 221,449,338 | |
Foreign currencies, at value (Cost $452,130) | | | 447,350 | |
Receivable for: | | | | |
Investments sold | | | 3,147 | |
Fund shares sold | | | 1,266,327 | |
Dividends | | | 286,465 | |
Investment for trustee deferred compensation and retirement plans | | | 122,901 | |
Other assets | | | 56,194 | |
Total assets | | | 223,631,722 | |
|
Liabilities: | |
Payable for: | | | | |
Investments purchased | | | 599,728 | |
Fund shares reacquired | | | 583,670 | |
Accrued foreign taxes | | | 217,119 | |
Accrued fees to affiliates | | | 105,371 | |
Accrued trustees’ and officers’ fees and benefits | | | 606 | |
Accrued other operating expenses | | | 107,100 | |
Trustee deferred compensation and retirement plans | | | 137,127 | |
Total liabilities | | | 1,750,721 | |
Net assets applicable to shares outstanding | | $ | 221,881,001 | |
|
Net assets consist of: | |
Shares of beneficial interest | | $ | 202,340,520 | |
Undistributed net investment income | | | (956,636 | ) |
Undistributed net realized gain (loss) | | | (2,973,268 | ) |
Net unrealized appreciation | | | 23,470,385 | |
| | | $ | 221,881,001 | |
| | | | |
Net Assets: | |
Class A | | $ | 122,232,181 | |
Class B | | $ | 950,435 | |
Class C | | $ | 15,712,033 | |
Class Y | | $ | 57,810,055 | |
Class R5 | | $ | 9,740,321 | |
Class R6 | | $ | 15,435,976 | |
|
Shares outstanding, no par value,
with an unlimited number of shares authorized: | |
Class A | | | 7,917,887 | |
Class B | | | 64,517 | |
Class C | | | 1,066,678 | |
Class Y | | | 3,740,189 | |
Class R5 | | | 635,709 | |
Class R6 | | | 1,008,159 | |
Class A: | | | | |
Net asset value per share | | $ | 15.44 | |
Maximum offering price per share | | | | |
(Net asset value of $15.44 ¸ 94.50%) | | $ | 16.34 | |
Class B: | | | | |
Net asset value and offering price per share | | $ | 14.73 | |
Class C: | | | | |
Net asset value and offering price per share | | $ | 14.73 | |
Class Y: | | | | |
Net asset value and offering price per share | | $ | 15.46 | |
Class R5: | | | | |
Net asset value and offering price per share | | $ | 15.32 | |
Class R6: | | | | |
Net asset value and offering price per share | | $ | 15.31 | |
See accompanying Notes to Financial Statements which are an integral part of the financial statements.
12 Invesco International Small Company Fund
Statement of Operations
For the year ended December 31, 2016
| | | | |
Investment income: | |
Dividends (net of foreign withholding taxes of $614,548) | | $ | 7,858,340 | |
Dividends from affiliates | | | 124,296 | |
Total investment income | | | 7,982,636 | |
| |
Expenses: | | | | |
Advisory fees | | | 2,020,491 | |
Administrative services fees | | | 50,000 | |
Custodian fees | | | 101,107 | |
Distribution fees: | | | | |
Class A | | | 296,371 | |
Class B | | | 12,309 | |
Class C | | | 175,158 | |
Transfer agent Fees — A, B, C and Y | | | 384,183 | |
Transfer agent fees — R5 | | | 9,551 | |
Transfer agent fees — R6 | | | 3,540 | |
Trustees’ and officers’ fees and benefits | | | 24,488 | |
Registration and filing fees | | | 86,599 | |
Reports to shareholders | | | 51,151 | |
Professional services fees | | | 64,309 | |
Other | | | 23,715 | |
Total expenses | | | 3,302,972 | |
Less: Fees waived and expense offset arrangement(s) | | | (20,751 | ) |
Net expenses | | | 3,282,221 | |
Net investment income | | | 4,700,415 | |
| |
Realized and unrealized gain (loss) from: | | | | |
Net realized gain (loss) from: | | | | |
Investment securities (net of foreign taxes of $370,676) | | | (1,834,300 | ) |
Foreign currencies | | | (285,372 | ) |
| | | | (2,119,672 | ) |
Change in net unrealized appreciation of: | | | | |
Investment securities (net of foreign tax of $502,890) | | | 12,407,414 | |
Foreign currencies | | | 23,061 | |
| | | | 12,430,475 | |
Net realized and unrealized gain | | | 10,310,803 | |
Net increase in net assets resulting from operations | | $ | 15,011,218 | |
See accompanying Notes to Financial Statements which are an integral part of the financial statements.
13 Invesco International Small Company Fund
Statement of Changes in Net Assets
For the years ended December 31, 2016 and 2015
| | | | | | | | |
| | | 2016 | | | 2015 | |
Operations: | | | | | |
Net investment income | | $ | 4,700,415 | | | $ | 4,745,088 | |
Net realized gain (loss) | | | (2,119,672 | ) | | | 13,309,427 | |
Change in net unrealized appreciation (depreciation) | | | 12,430,475 | | | | (51,973,218 | ) |
Net increase (decrease) in net assets resulting from operations | | | 15,011,218 | | | | (33,918,703 | ) |
| | |
Distributions to shareholders from net investment income: | | | | | | | | |
Class A | | | (2,736,668 | ) | | | (1,374,459 | ) |
Class B | | | (14,978 | ) | | | (6,474 | ) |
Class C | | | (243,700 | ) | | | (77,963 | ) |
Class Y | | | (1,372,779 | ) | | | (995,474 | ) |
Class R5 | | | (247,330 | ) | | | (389,478 | ) |
Class R6 | | | (388,585 | ) | | | (737,638 | ) |
Total distributions from net investment income | | | (5,004,040 | ) | | | (3,581,486 | ) |
| | |
Distributions to shareholders from net realized gains: | | | | | | | | |
Class A | | | (7,214,109 | ) | | | (7,868,979 | ) |
Class B | | | (61,108 | ) | | | (105,165 | ) |
Class C | | | (994,248 | ) | | | (1,266,336 | ) |
Class Y | | | (3,262,401 | ) | | | (4,632,781 | ) |
Class R5 | | | (568,519 | ) | | | (1,669,035 | ) |
Class R6 | | | (866,954 | ) | | | (2,966,254 | ) |
Total distributions from net realized gains | | | (12,967,339 | ) | | | (18,508,550 | ) |
| | |
Share transactions–net: | | | | | | | | |
Class A | | | 3,286,000 | | | | (43,408,033 | ) |
Class B | | | (576,364 | ) | | | (991,295 | ) |
Class C | | | (2,531,801 | ) | | | (4,749,695 | ) |
Class Y | | | (1,300,669 | ) | | | (46,646,420 | ) |
Class R5 | | | (14,356,572 | ) | | | (31,812,749 | ) |
Class R6 | | | (21,989,867 | ) | | | 338,194 | |
Net increase (decrease) in net assets resulting from share transactions | | | (37,469,273 | ) | | | (127,269,998 | ) |
Net increase (decrease) in net assets | | | (40,429,434 | ) | | | (183,278,737 | ) |
| | |
Net assets: | | | | | | | | |
Beginning of year | | | 262,310,435 | | | | 445,589,172 | |
End of year (includes undistributed net investment income of $(956,636) and $(589,355), respectively) | | $ | 221,881,001 | | | $ | 262,310,435 | |
Notes to Financial Statements
December 31, 2016
NOTE 1—Significant Accounting Policies
Invesco International Small Company Fund (the “Fund”) is a series portfolio of AIM Funds Group (Invesco Funds Group) (the “Trust”). The Trust is a Delaware statutory trust registered under the Investment Company Act of 1940, as amended (the “1940 Act”), as an open-end series management investment company consisting of four separate portfolios, each authorized to issue an unlimited number of shares of beneficial interest. The assets, liabilities and operations of each portfolio are accounted for separately. Information presented in these financial statements pertains only to the Fund. Matters affecting each portfolio or class will be voted on exclusively by the shareholders of such portfolio or class.
The Fund’s investment objective is long-term growth of capital.
The Fund currently consists of six different classes of shares: Class A, Class B, Class C, Class Y, Class R5 and Class R6. Class Y shares are available only to certain investors. Class A shares are sold with a front-end sales charge unless certain waiver criteria are met and under certain circumstances load waived shares may be subject to contingent deferred sales charges (“CDSC”). Class C shares are sold with a CDSC. Class Y, Class R5 and Class R6 shares are sold at net asset value. Effective November 30, 2010, new or additional investments in Class B shares are no longer permitted. Existing shareholders of Class B shares may continue to reinvest dividends and capital gains distributions in Class B shares until they convert to Class A shares. Also, shareholders in Class B shares will be able to exchange those shares for Class B shares of other Invesco Funds offering such shares until they
14 Invesco International Small Company Fund
convert to Class A shares. Generally, Class B shares will automatically convert to Class A shares on or about the month-end, which is at least eight years after the date of purchase. Redemption of Class B shares prior to the conversion date will be subject to a CDSC.
The Fund is an investment company and accordingly follows the investment company accounting and reporting guidance in accordance with Financial Accounting Standards Board Accounting Standards Codification Topic 946, Financial Services — Investment Companies.
The following is a summary of the significant accounting policies followed by the Fund in the preparation of its financial statements.
A. Security Valuations — Securities, including restricted securities, are valued according to the following policy.
A security listed or traded on an exchange (except convertible securities) is valued at its last sales price or official closing price as of the close of the customary trading session on the exchange where the security is principally traded, or lacking any sales or official closing price on a particular day, the security may be valued at the closing bid price on that day. Securities traded in the over-the-counter market are valued based on prices furnished by independent pricing services or market makers. When such securities are valued by an independent pricing service they may be considered fair valued. Futures contracts are valued at the final settlement price set by an exchange on which they are principally traded. Listed options are valued at the mean between the last bid and asked prices from the exchange on which they are principally traded. Options not listed on an exchange are valued by an independent source at the mean between the last bid and asked prices. For purposes of determining net asset value (“NAV”) per share, futures and option contracts generally are valued 15 minutes after the close of the customary trading session of the New York Stock Exchange (“NYSE”).
Investments in open-end and closed-end registered investment companies that do not trade on an exchange are valued at the end-of-day net asset value per share. Investments in open-end and closed-end registered investment companies that trade on an exchange are valued at the last sales price or official closing price as of the close of the customary trading session on the exchange where the security is principally traded.
Debt obligations (including convertible securities) and unlisted equities are fair valued using an evaluated quote provided by an independent pricing service. Evaluated quotes provided by the pricing service may be determined without exclusive reliance on quoted prices, and may reflect appropriate factors such as institution-size trading in similar groups of securities, developments related to specific securities, dividend rate (for unlisted equities), yield (for debt obligations), quality, type of issue, coupon rate (for debt obligations), maturity (for debt obligations), individual trading characteristics and other market data. Debt obligations are subject to interest rate and credit risks. In addition, all debt obligations involve some risk of default with respect to interest and/or principal payments.
Foreign securities’ (including foreign exchange contracts) prices are converted into U.S. dollar amounts using the applicable exchange rates as of the close of the NYSE. If market quotations are available and reliable for foreign exchange-traded equity securities, the securities will be valued at the market quotations. Because trading hours for certain foreign securities end before the close of the NYSE, closing market quotations may become unreliable. If between the time trading ends on a particular security and the close of the customary trading session on the NYSE, events occur that the Adviser determines are significant and make the closing price unreliable, the Fund may fair value the security. If the event is likely to have affected the closing price of the security, the security will be valued at fair value in good faith using procedures approved by the Board of Trustees. Adjustments to closing prices to reflect fair value may also be based on a screening process of an independent pricing service to indicate the degree of certainty, based on historical data, that the closing price in the principal market where a foreign security trades is not the current value as of the close of the NYSE. Foreign securities’ prices meeting the approved degree of certainty that the price is not reflective of current value will be priced at the indication of fair value from the independent pricing service. Multiple factors may be considered by the independent pricing service in determining adjustments to reflect fair value and may include information relating to sector indices, American Depositary Receipts and domestic and foreign index futures. Foreign securities may have additional risks including exchange rate changes, potential for sharply devalued currencies and high inflation, political and economic upheaval, the relative lack of issuer information, relatively low market liquidity and the potential lack of strict financial and accounting controls and standards.
Securities for which market prices are not provided by any of the above methods may be valued based upon quotes furnished by independent sources. The last bid price may be used to value equity securities. The mean between the last bid and asked prices is used to value debt obligations, including corporate loans.
Securities for which market quotations are not readily available or became unreliable are valued at fair value as determined in good faith by or under the supervision of the Trust’s officers following procedures approved by the Board of Trustees. Issuer specific events, market trends, bid/asked quotes of brokers and information providers and other market data may be reviewed in the course of making a good faith determination of a security’s fair value.
The Fund may invest in securities that are subject to interest rate risk, meaning the risk that the prices will generally fall as interest rates rise and, conversely, the prices will generally rise as interest rates fall. Specific securities differ in their sensitivity to changes in interest rates depending on their individual characteristics. Changes in interest rates may result in increased market volatility, which may affect the value and/or liquidity of certain Fund investments.
Valuations change in response to many factors including the historical and prospective earnings of the issuer, the value of the issuer’s assets, general economic conditions, interest rates, investor perceptions and market liquidity. Because of the inherent uncertainties of valuation, the values reflected in the financial statements may materially differ from the value received upon actual sale of those investments.
| B. | Securities Transactions and Investment Income — Securities transactions are accounted for on a trade date basis. Realized gains or losses on sales are computed on the basis of specific identification of the securities sold. Interest income (net of withholding tax, if any) is recorded on the accrual basis from settlement date. Dividend income (net of withholding tax, if any) is recorded on the ex-dividend date. |
The Fund may periodically participate in litigation related to Fund investments. As such, the Fund may receive proceeds from litigation settlements. Any proceeds received are included in the Statement of Operations as realized gain (loss) for investments no longer held and as unrealized gain (loss) for investments still held.
Brokerage commissions and mark ups are considered transaction costs and are recorded as an increase to the cost basis of securities purchased and/or a reduction of proceeds on a sale of securities. Such transaction costs are included in the determination of net realized and unrealized gain (loss) from investment securities reported in the Statement of Operations and the Statement of Changes in Net Assets and the net realized and unrealized gains (losses) on securities per share in the Financial Highlights. Transaction costs are included in the calculation of the Fund’s net asset value and, accordingly, they reduce the Fund’s total returns. These transaction costs are not considered operating expenses and are not reflected in net investment income reported in the Statement of Operations and the Statement of Changes in Net Assets, or the net
15 Invesco International Small Company Fund
investment income per share and the ratios of expenses and net investment income reported in the Financial Highlights, nor are they limited by any expense limitation arrangements between the Fund and the investment adviser.
The Fund allocates income and realized and unrealized capital gains and losses to a class based on the relative net assets of each class.
| C. | Country Determination — For the purposes of making investment selection decisions and presentation in the Schedule of Investments, the investment adviser may determine the country in which an issuer is located and/or credit risk exposure based on various factors. These factors include the laws of the country under which the issuer is organized, where the issuer maintains a principal office, the country in which the issuer derives 50% or more of its total revenues and the country that has the primary market for the issuer’s securities, as well as other criteria. Among the other criteria that may be evaluated for making this determination are the country in which the issuer maintains 50% or more of its assets, the type of security, financial guarantees and enhancements, the nature of the collateral and the sponsor organization. Country of issuer and/or credit risk exposure has been determined to be the United States of America, unless otherwise noted. |
| D. | Distributions — Distributions from net investment income and net realized capital gain, if any, are generally declared and paid annually and recorded on the ex-dividend date. The Fund may elect to treat a portion of the proceeds from redemptions as distributions for federal income tax purposes. |
| E. | Federal Income Taxes — The Fund intends to comply with the requirements of Subchapter M of the Internal Revenue Code of 1986, as amended (the “Internal Revenue Code”), necessary to qualify as a regulated investment company and to distribute substantially all of the Fund’s taxable earnings to shareholders. As such, the Fund will not be subject to federal income taxes on otherwise taxable income (including net realized capital gain) that is distributed to shareholders. Therefore, no provision for federal income taxes is recorded in the financial statements. |
The Fund recognizes the tax benefits of uncertain tax positions only when the position is more likely than not to be sustained. Management has analyzed the Fund’s uncertain tax positions and concluded that no liability for unrecognized tax benefits should be recorded related to uncertain tax positions. Management is not aware of any tax positions for which it is reasonably possible that the total amounts of unrecognized tax benefits will change materially in the next 12 months.
The Fund files tax returns in the U.S. Federal jurisdiction and certain other jurisdictions. Generally, the Fund is subject to examinations by such taxing authorities for up to three years after the filing of the return for the tax period.
| F. | Expenses — Fees provided for under the Rule 12b-1 plan of a particular class of the Fund are charged to the operations of such class. Transfer agency fees and expenses and other shareholder recordkeeping fees and expenses attributable to Class R5 and Class R6 are allocated to each share class based on relative net assets. Sub-accounting fees attributable to Class R5 are charged to the operations of the class. Transfer agency fees and expenses and other shareholder recordkeeping fees and expenses relating to all other classes are allocated among those classes based on relative net assets. All other expenses are allocated among the classes based on relative net assets. |
| G. | Accounting Estimates — The preparation of financial statements in conformity with accounting principles generally accepted in the United States of America (“GAAP”) requires management to make estimates and assumptions that affect the reported amounts of assets and liabilities at the date of the financial statements and the reported amounts of revenues and expenses during the reporting period including estimates and assumptions related to taxation. Actual results could differ from those estimates by a significant amount. In addition, the Fund monitors for material events or transactions that may occur or become known after the period-end date and before the date the financial statements are released to print. |
| H. | Indemnifications — Under the Trust’s organizational documents, each Trustee, officer, employee or other agent of the Trust is indemnified against certain liabilities that may arise out of the performance of their duties to the Fund. Additionally, in the normal course of business, the Fund enters into contracts, including the Fund’s servicing agreements, that contain a variety of indemnification clauses. The Fund’s maximum exposure under these arrangements is unknown as this would involve future claims that may be made against the Fund that have not yet occurred. The risk of material loss as a result of such indemnification claims is considered remote. |
| I. | Foreign Currency Translations — Foreign currency is valued at the close of the NYSE based on quotations posted by banks and major currency dealers. Portfolio securities and other assets and liabilities denominated in foreign currencies are translated into U.S. dollar amounts at date of valuation. Purchases and sales of portfolio securities (net of foreign taxes withheld on disposition) and income items denominated in foreign currencies are translated into U.S. dollar amounts on the respective dates of such transactions. The Fund does not separately account for the portion of the results of operations resulting from changes in foreign exchange rates on investments and the fluctuations arising from changes in market prices of securities held. The combined results of changes in foreign exchange rates and the fluctuation of market prices on investments (net of estimated foreign tax withholding) are included with the net realized and unrealized gain or loss from investments in the Statement of Operations. Reported net realized foreign currency gains or losses arise from (1) sales of foreign currencies, (2) currency gains or losses realized between the trade and settlement dates on securities transactions, and (3) the difference between the amounts of dividends, interest, and foreign withholding taxes recorded on the Fund’s books and the U.S. dollar equivalent of the amounts actually received or paid. Net unrealized foreign currency gains and losses arise from changes in the fair values of assets and liabilities, other than investments in securities at fiscal period end, resulting from changes in exchange rates. |
The Fund may invest in foreign securities, which may be subject to foreign taxes on income, gains on investments or currency repatriation, a portion of which may be recoverable. Foreign taxes, if any, are recorded based on the tax regulations and rates that exist in the foreign markets in which the Fund invests and are shown in the Statement of Operations.
| J. | Forward Foreign Currency Contracts — The Fund may engage in foreign currency transactions either on a spot (i.e. for prompt delivery and settlement) basis, or through forward foreign currency contracts, to manage or minimize currency or exchange rate risk. |
The Fund may also enter into forward foreign currency contracts for the purchase or sale of a security denominated in a foreign currency in order to “lock in” the U.S. dollar price of that security, or the Fund may also enter into forward foreign currency contracts that do not provide for physical settlement of the two currencies, but instead are settled by a single cash payment calculated as the difference between the agreed upon exchange rate and the spot rate at settlement based upon an agreed upon notional amount (non-deliverable forwards). The Fund will set aside liquid assets in an amount equal to the daily mark-to-market obligation for forward foreign currency contracts.
A forward foreign currency contract is an obligation between two parties (“Counterparties”) to purchase or sell a specific currency for an agreed-upon price at a future date. The use of forward foreign currency contracts does not eliminate fluctuations in the price of the underlying securities the Fund owns or intends to acquire but establishes a rate of exchange in advance. Fluctuations in the value of these contracts are
16 Invesco International Small Company Fund
measured by the difference in the contract date and reporting date exchange rates and are recorded as unrealized appreciation (depreciation) until the contracts are closed. When the contracts are closed, realized gains (losses) are recorded. Realized and unrealized gains (losses) on the contracts are included in the Statement of Operations. The primary risks associated with forward foreign currency contracts include failure of the Counterparty to meet the terms of the contract and the value of the foreign currency changing unfavorably. These risks may be in excess of the amounts reflected in the Statement of Assets and Liabilities.
NOTE 2—Advisory Fees and Other Fees Paid to Affiliates
The Trust has entered into a master investment advisory agreement with Invesco Advisers, Inc. (the “Adviser” or “Invesco”). Under the terms of the investment advisory agreement, the Fund pays an advisory fee to the Adviser based on the annual rate of the Fund’s average daily net assets as follows:
| | | | | | | | |
| Average Daily Net Assets | | Rate | |
First $250 million | | | 0 | .935% | | | | |
Next $250 million | | | 0 | .91% | | | | |
Next $500 million | | | 0 | .885% | | | | |
Next $1.5 billion | | | 0 | .86% | | | | |
Next $2.5 billion | | | 0 | .835% | | | | |
Next $2.5 billion | | | 0 | .81% | | | | |
Next $2.5 billion | | | 0 | .785% | | | | |
Over $10 billion | | | 0 | .76% | | | | |
For the year ended December 31, 2016, the effective advisory fees incurred by the Fund was 0.935%.
Under the terms of a master sub-advisory agreement between the Adviser and each of Invesco Asset Management Deutschland GmbH, Invesco Asset Management Limited, Invesco Asset Management (Japan) Limited, Invesco Hong Kong Limited, Invesco Senior Secured Management, Inc. and Invesco Canada Ltd. (collectively, the “Affiliated Sub-Advisers”) the Adviser, not the Fund, will pay 40% of the fees paid to the Adviser to any such Affiliated Sub-Adviser(s) that provide(s) discretionary investment management services to the Fund based on the percentage of assets allocated to such Affiliated Sub-Adviser(s).
The Adviser has contractually agreed, through at least June 30, 2017, to waive advisory fees and/or reimburse expenses of all shares to the extent necessary to limit total annual fund operating expenses after fee waiver and/or expense reimbursement (excluding certain items discussed below) of Class A, Class B, Class C, Class Y, Class R5 and Class R6 shares to 2.25%, 3.00%, 3.00%, 2.00%, 2.00% and 2.00% of average daily net assets, respectively (the “expense limits”). In determining the Adviser’s obligation to waive advisory fees and/or reimburse expenses, the following expenses are not taken into account, and could cause the total annual fund operating expenses after fee waiver and/or expense reimbursement to exceed the numbers reflected above: (1) interest; (2) taxes; (3) dividend expense on short sales; (4) extraordinary or non-routine items, including litigation expenses; and (5) expenses that the Fund has incurred but did not actually pay because of an expense offset arrangement. Unless Invesco continues the fee waiver agreement, it will terminate on June 30, 2017. During its term, the fee waiver agreement cannot be terminated or amended to increase the expense limits without approval of the Board of Trustees. The Adviser did not waive fees and/or reimburse expenses during the period under these expense limits.
Further, the Adviser has contractually agreed, through at least June 30, 2018, to waive the advisory fee payable by the Fund in an amount equal to 100% of the net advisory fees the Adviser receives from the affiliated money market funds on investments by the Fund of uninvested cash in such affiliated money market funds.
For the year ended December 31, 2016, the Adviser waived advisory fees of $18,790.
The Trust has entered into a master administrative services agreement with Invesco pursuant to which the Fund has agreed to pay Invesco for certain administrative costs incurred in providing accounting services to the Fund. For the year ended December 31, 2016, expenses incurred under the agreement are shown in the Statement of Operations as Administrative services fees.
The Trust has entered into a transfer agency and service agreement with Invesco Investment Services, Inc. (“IIS”) pursuant to which the Fund has agreed to pay IIS a fee for providing transfer agency and shareholder services to the Fund and reimburse IIS for certain expenses incurred by IIS in the course of providing such services. IIS may make payments to intermediaries that provide omnibus account services, sub-accounting services and/or networking services. All fees payable by IIS to intermediaries that provide omnibus account services or sub-accounting are charged back to the Fund, subject to certain limitations approved by the Trust’s Board of Trustees. For the year ended December 31, 2016, expenses incurred under the agreement are shown in the Statement of Operations as Transfer agent fees.
The Trust has entered into master distribution agreements with Invesco Distributors, Inc. (“IDI”) to serve as the distributor for the Class A, Class B, Class C, Class Y, Class R5 and Class R6 shares of the Fund. The Trust has adopted plans pursuant to Rule 12b-1 under the 1940 Act with respect to the Fund’s Class A, Class B and Class C shares (collectively, the “Plans”). The Fund, pursuant to the Plans, pays IDI compensation at the annual rate of 0.25% of the Fund’s average daily net assets of Class A shares and 1.00% of the average daily net assets of Class B and Class C shares. Of the Plan payments, up to 0.25% of the average daily net assets of each class of shares may be paid to furnish continuing personal shareholder services to customers who purchase and own shares of such classes. Any amounts not paid as a service fee under the Plans would constitute an asset-based sales charge. Rules of the Financial Industry Regulatory Authority (“FINRA”) impose a cap on the total sales charges, including asset-based sales charges, that may be paid by any class of shares of the Fund. For the year ended December 31, 2016, expenses incurred under the Plans are shown in the Statement of Operations as Distribution fees.
Front-end sales commissions and CDSC (collectively, the “sales charges”) are not recorded as expenses of the Fund. Front-end sales commissions are deducted from proceeds from the sales of Fund shares prior to investment in Class A shares of the Fund. CDSC are deducted from redemption proceeds prior to remittance to the shareholder. During the year ended December 31, 2016, IDI advised the Fund that IDI retained $74,198 in front-end sales commissions from the sale of Class A shares and $2,109, $33 and $619 from Class A, Class B and Class C shares, respectively, for CDSC imposed on redemptions by shareholders.
17 Invesco International Small Company Fund
Certain officers and trustees of the Trust are officers and directors of the Adviser, IIS and/or IDI.
NOTE 3—Additional Valuation Information
GAAP defines fair value as the price that would be received to sell an asset or paid to transfer a liability in an orderly transaction between market participants at the measurement date, under current market conditions. GAAP establishes a hierarchy that prioritizes the inputs to valuation methods, giving the highest priority to readily available unadjusted quoted prices in an active market for identical assets (Level 1) and the lowest priority to significant unobservable inputs (Level 3), generally when market prices are not readily available or are unreliable. Based on the valuation inputs, the securities or other investments are tiered into one of three levels. Changes in valuation methods may result in transfers in or out of an investment’s assigned level:
| | Level 1 — | Prices are determined using quoted prices in an active market for identical assets. |
| | Level 2 — | Prices are determined using other significant observable inputs. Observable inputs are inputs that other market participants may use in pricing a security. These may include quoted prices for similar securities, interest rates, prepayment speeds, credit risk, yield curves, loss severities, default rates, discount rates, volatilities and others. |
| | Level 3 — | Prices are determined using significant unobservable inputs. In situations where quoted prices or observable inputs are unavailable (for example, when there is little or no market activity for an investment at the end of the period), unobservable inputs may be used. Unobservable inputs reflect the Fund’s own assumptions about the factors market participants would use in determining fair value of the securities or instruments and would be based on the best available information. |
The following is a summary of the tiered valuation input levels, as of December 31, 2016. The level assigned to the securities valuations may not be an indication of the risk or liquidity associated with investing in those securities. Because of the inherent uncertainties of valuation, the values reflected in the financial statements may materially differ from the value received upon actual sale of those investments.
During the year ended December 31, 2016, there were transfers from Level 1 to Level 2 of $8,887,400 and from Level 2 to Level 1 of $46,264,476 due to foreign fair value adjustments.
| | | | | | | | | | | | | | | | |
| | | Level 1 | | | Level 2 | | | Level 3 | | | Total | |
Brazil | | $ | 16,618,450 | | | $ | 947,207 | | | $ | — | | | $ | 17,565,657 | |
Canada | | | 25,598,978 | | | | — | | | | — | | | | 25,598,978 | |
Egypt | | | 3,696,346 | | | | — | | | | — | | | | 3,696,346 | |
Estonia | | | 1,317,861 | | | | — | | | | — | | | | 1,317,861 | |
France | | | 22,185,884 | | | | 1,934,713 | | | | — | | | | 24,120,597 | |
Germany | | | 7,345,522 | | | | 3,557,834 | | | | — | | | | 10,903,356 | |
Greece | | | 3,073,218 | | | | — | | | | — | | | | 3,073,218 | |
Indonesia | | | — | | | | 1,085,036 | | | | — | | | | 1,085,036 | |
Ireland | | | 6,546,045 | | | | — | | | | — | | | | 6,546,045 | |
Israel | | | | | | | 3,320,746 | | | | — | | | | 3,320,746 | |
Italy | | | 8,348,824 | | | | — | | | | — | | | | 8,348,824 | |
Japan | | | — | | | | 8,967,604 | | | | — | | | | 8,967,604 | |
Malaysia | | | 1,851,341 | | | | — | | | | — | | | | 1,851,341 | |
Mexico | | | 3,727,961 | | | | — | | | | — | | | | 3,727,961 | |
Netherlands | | | — | | | | 3,947,699 | | | | — | | | | 3,947,699 | |
New Zealand | | | — | | | | 3,801,609 | | | | — | | | | 3,801,609 | |
Norway | | | 1,743,065 | | | | | | | | — | | | | 1,743,065 | |
Philippines | | | 5,708,749 | | | | — | | | | — | | | | 5,708,749 | |
Romania | | | 11,242,046 | | | | — | | | | — | | | | 11,242,046 | |
South Africa | | | 3,497,267 | | | | — | | | | — | | | | 3,497,267 | |
Switzerland | | | — | | | | 1,987,691 | | | | — | | | | 1,987,691 | |
Thailand | | | — | | | | 1,814,905 | | | | — | | | | 1,814,905 | |
Turkey | | | 1,336,214 | | | | — | | | | — | | | | 1,336,214 | |
United Kingdom | | | 10,498,793 | | | | 30,418,217 | | | | — | | | | 40,917,010 | |
Money Market Funds | | | 25,329,513 | | | | — | | | | — | | | | 25,329,513 | |
Total Investments | | $ | 159,666,077 | | | $ | 61,783,261 | | | $ | — | | | $ | 221,449,338 | |
NOTE 4—Investments in Affiliates
The 1940 Act defines an “affiliated person” as an issuance in which a fund holds 5% or more of the outstanding voting securities. The Fund has not owned enough of the outstanding voting securities of the issuer to have control (as defined in the 1940 Act) of that issuer. The following is a summary of the investments in other affiliates for the year ended December 31, 2016.
| | | | | | | | | | | | | | | | | | | | | | | | | | | | | | | | |
| | | | | | Value 12/31/15 | | | Purchases
at Cost | | | Proceeds
from Sales | | | Change in
Unrealized
Appreciation | | | Realized
Gain (Loss) | | | Value 12/31/16 | | | Dividend
Income | |
Precia S.A. | | | | | | $ | 4,936,707 | | | $ | — | | | $ | — | | | $ | 1,197,518 | | | $ | — | | | $ | 6,134,225 | | | $ | 69,898 | |
18 Invesco International Small Company Fund
NOTE 5—Expense Offset Arrangement(s)
The expense offset arrangement is comprised of transfer agency credits which result from balances in demand deposit accounts used by the transfer agent for clearing shareholder transactions. For the year ended December 31, 2016, the Fund received credits from this arrangement, which resulted in the reduction of the Fund’s total expenses of $1,961.
NOTE 6—Trustees’ and Officers’ Fees and Benefits
Trustees’ and Officers’ Fees and Benefits include amounts accrued by the Fund to pay remuneration to certain Trustees and Officers of the Fund. Trustees have the option to defer compensation payable by the Fund, and Trustees’ and Officers’ Fees and Benefits also include amounts accrued by the Fund to fund such deferred compensation amounts. Those Trustees who defer compensation have the option to select various Invesco Funds in which their deferral accounts shall be deemed to be invested. Finally, certain current Trustees were eligible to participate in a retirement plan that provided for benefits to be paid upon retirement to Trustees over a period of time based on the number of years of service. The Fund may have certain former Trustees who also participate in a retirement plan and receive benefits under such plan. Trustees’ and Officers’ Fees and Benefits include amounts accrued by the Fund to fund such retirement benefits. Obligations under the deferred compensation and retirement plans represent unsecured claims against the general assets of the Fund.
NOTE 7—Cash Balances
The Fund is permitted to temporarily carry a negative or overdrawn balance in its account with State Street Bank and Trust Company, the custodian bank. Such balances, if any at period-end, are shown in the Statement of Assets and Liabilities under the payable caption Amount due custodian. To compensate the custodian bank for such overdrafts, the overdrawn Fund may either (1) leave funds as a compensating balance in the account so the custodian bank can be compensated by earning the additional interest; or (2) compensate by paying the custodian bank at a rate agreed upon by the custodian bank and Invesco, not to exceed the contractually agreed upon rate.
NOTE 8—Distributions to Shareholders and Tax Components of Net Assets
Tax Character of Distributions to Shareholders Paid During the Fiscal Years Ended December 31, 2016 and 2015:
| | | | | | | | |
| | | 2016 | | | 2015 | |
Ordinary income | | $ | 5,019,562 | | | $ | 3,581,486 | |
Long-term capital gain | | | 12,951,817 | | | | 18,508,550 | |
Total distributions | | $ | 17,971,379 | | | $ | 22,090,036 | |
Tax Components of Net Assets at Period-End:
| | | | |
| | | 2016 | |
Undistributed ordinary income | | $ | 139,871 | |
Net unrealized appreciation — investments | | | 21,852,508 | |
Net unrealized appreciation (depreciation) — other investments | | | (27,055 | ) |
Temporary book/tax differences | | | (135,790 | ) |
Capital loss carryover | | | (2,289,053 | ) |
Shares of beneficial interest | | | 202,340,520 | |
Total net assets | | $ | 221,881,001 | |
The difference between book-basis and tax-basis unrealized appreciation (depreciation) is due to differences in the timing of recognition of gains and losses on investments for tax and book purposes. The Fund’s net unrealized appreciation difference is attributable primarily to wash sales and passive foreign investment companies.
The temporary book/tax differences are a result of timing differences between book and tax recognition of income and/or expenses. The Fund’s temporary book/tax differences are the result of the trustee deferral of compensation and retirement plan benefits.
Capital loss carryforward is calculated and reported as of a specific date. Results of transactions and other activity after that date may affect the amount of capital loss carryforward actually available for the Fund to utilize. Capital losses generated in years beginning after December 22, 2010 can be carried forward for an unlimited period, whereas previous losses expire in eight tax years. Capital losses with an expiration period may not be used to offset capital gains until all net capital losses without an expiration date have been utilized. Capital loss carryforwards with no expiration date will retain their character as either short-term or long-term capital losses instead of as short-term capital losses as under prior law. The ability to utilize capital loss carryforwards in the future may be limited under the Internal Revenue Code and related regulations based on the results of future transactions.
The Fund has a capital loss carryforward as of December 31, 2016 which expires as follows:
| | | | | | | | | | | | |
| Capital Loss Carryforward* | |
| Expiration | | Short-Term | | | Long-Term | | | Total | |
Not Subject to Expiration | | $ | 432,556 | | | $ | 1,856,497 | | | $ | 2,289,053 | |
| * | Capital loss carryforward as of the date listed above is reduced for limitations, if any, to the extent required by the Internal Revenue Code and may be further limited depending upon a variety of factors, including the realization of net unrealized gains or losses as of the date of any reorganization. |
19 Invesco International Small Company Fund
NOTE 9—Investment Securities
The aggregate amount of investment securities (other than short-term securities, U.S. Treasury obligations and money market funds, if any) purchased and sold by the Fund during the year ended December 31, 2016 was $29,645,588 and $103,281,581, respectively. Cost of investments on a tax basis includes the adjustments for financial reporting purposes as of the most recently completed federal income tax reporting period-end.
| | | | |
| Unrealized Appreciation (Depreciation) of Investment Securities on a Tax Basis | |
Aggregate unrealized appreciation of investment securities | | $ | 43,857,469 | |
Aggregate unrealized (depreciation) of investment securities | | | (22,004,961 | ) |
Net unrealized appreciation of investment securities | | $ | 21,852,508 | |
Cost of investments for tax purposes is $199,596,830.
NOTE 10—Reclassification of Permanent Differences
Primarily as a result of differing book/tax treatment of passive foreign investment companies and foreign currency transactions, on December 31, 2016, undistributed net investment income (loss) was decreased by $63,656 and undistributed net realized gain (loss) was increased by $63,656. This reclassification had no effect on the net assets of the Fund.
NOTE 11—Share Information
| | | | | | | | | | | | | | | | |
| | | Summary of Share Activity | |
| | | Years ended December 31, | |
| | | 2016(a) | | | 2015 | |
| | | Shares | | | Amount | | | Shares | | | Amount | |
Sold: | | | | | | | | | | | | | | | | |
Class A | | | 2,655,825 | | | $ | 43,017,409 | | | | 976,682 | | | $ | 16,753,031 | |
Class B | | | 1,115 | | | | 16,628 | | | | 2,140 | | | | 36,194 | |
Class C | | | 143,331 | | | | 2,172,496 | | | | 74,749 | | | | 1,233,324 | |
Class Y | | | 1,942,746 | | | | 31,767,442 | | | | 1,256,327 | | | | 22,365,003 | |
Class R5 | | | 190,566 | | | | 2,985,588 | | | | 470,384 | | | | 8,346,155 | |
Class R6 | | | 229,044 | | | | 3,499,721 | | | | 717,659 | | | | 12,621,968 | |
| | | | |
Issued as reinvestment of dividends: | | | | | | | | | | | | | | | | |
Class A | | | 618,026 | | | | 9,579,405 | | | | 565,549 | | | | 8,692,492 | |
Class B | | | 4,958 | | | | 73,322 | | | | 7,240 | | | | 106,566 | |
Class C | | | 78,847 | | | | 1,166,149 | | | | 85,569 | | | | 1,259,580 | |
Class Y | | | 270,606 | | | | 4,199,807 | | | | 323,219 | | | | 4,971,103 | |
Class R5 | | | 53,046 | | | | 815,850 | | | | 134,124 | | | | 2,045,387 | |
Class R6 | | | 81,688 | | | | 1,255,539 | | | | 242,878 | | | | 3,703,892 | |
| | | | |
Automatic conversion of Class B shares to Class A shares: | | | | | | | | | | | | | | | | |
Class A | | | 19,233 | | | | 301,069 | | | | 27,181 | | | | 486,056 | |
Class B | | | (20,165 | ) | | | (301,069 | ) | | | (28,389 | ) | | | (486,056 | ) |
| | | | |
Reacquired: | | | | | | | | | | | | | | | | |
Class A | | | (3,113,429 | ) | | | (49,611,883 | ) | | | (3,908,586 | ) | | | (69,339,612 | ) |
Class B | | | (24,008 | ) | | | (365,245 | ) | | | (38,471 | ) | | | (647,999 | ) |
Class C | | | (381,870 | ) | | | (5,870,446 | ) | | | (431,673 | ) | | | (7,242,599 | ) |
Class Y | | | (2,393,283 | ) | | | (37,267,918 | ) | | | (4,280,762 | ) | | | (73,982,526 | ) |
Class R5 | | | (1,230,141 | ) | | | (18,158,010 | ) | | | (2,432,669 | ) | | | (42,204,291 | ) |
Class R6 | | | (1,791,874 | ) | | | (26,745,127 | ) | | | (985,712 | ) | | | (15,987,666 | ) |
Net increase (decrease) in share activity | | | (2,665,739 | ) | | $ | (37,469,273 | ) | | | (7,222,561 | ) | | $ | (127,269,998 | ) |
| (a) | There are entities that are record owners of more than 5% of the outstanding shares of the Fund and in the aggregate own 32% of the outstanding shares of the Fund. IDI has an agreement with these entities to sell Fund shares. The Fund, Invesco and/or Invesco affiliates may make payments to these entities, which are considered to be related to the Fund, for providing services to the Fund, Invesco and/or Invesco affiliates including but not limited to services such as securities brokerage, distribution, third party record keeping and account servicing. The Fund has no knowledge as to whether all or any portion of the shares owned of record by these entities are also owned beneficially. |
20 Invesco International Small Company Fund
NOTE 12—Financial Highlights
The following schedule presents financial highlights for a share of the Fund outstanding throughout the periods indicated.
| | | | | | | | | | | | | | | | | | | | | | | | | | | | | | | | | | | | | | | | | | | | | | | | | | | | | | | | |
| | | Net asset
value,
beginning
of period | | | Net
investment
income(a) | | | Net gains
(losses)
on securities
(both
realized and
unrealized) | | | Total from
investment
operations | | | Dividends
from net
investment
income | | | Distributions
from net
realized
gains | | | Total
distributions | | | Net asset
value, end
of period | | | Total
return(b) | | | Net assets,
end of period
(000’s omitted) | | | Ratio of
expenses
to average
net assets
with fee waivers
and/or expenses
absorbed | | | Ratio of
expenses
to average net
assets without
fee waivers
and/or expenses
absorbed | | | Ratio of net
investment
income
to average
net assets | | | Portfolio
turnover(c) | |
Class A | |
Year ended 12/31/16 | | $ | 15.42 | | | $ | 0.34 | | | $ | 1.02 | | | $ | 1.36 | | | $ | (0.37 | ) | | $ | (0.97 | ) | | $ | (1.34 | ) | | $ | 15.44 | | | | 8.79 | % | | $ | 122,232 | | | | 1.57 | %(d) | | | 1.58 | %(d) | | | 2.13 | %(d) | | | 15 | % |
Year ended 12/31/15 | | | 18.40 | | | | 0.21 | | | | (1.92 | ) | | | (1.71 | ) | | | (0.19 | ) | | | (1.08 | ) | | | (1.27 | ) | | | 15.42 | | | | (9.30 | ) | | | 119,301 | | | | 1.52 | | | | 1.53 | | | | 1.18 | | | | 8 | |
Year ended 12/31/14 | | | 21.34 | | | | 0.28 | | | | (1.40 | ) | | | (1.12 | ) | | | (0.28 | ) | | | (1.54 | ) | | | (1.82 | ) | | | 18.40 | | | | (5.01 | ) | | | 185,380 | | | | 1.45 | | | | 1.46 | | | | 1.31 | | | | 20 | |
Year ended 12/31/13 | | | 20.81 | | | | 0.29 | | | | 1.64 | | | | 1.93 | | | | (0.31 | ) | | | (1.09 | ) | | | (1.40 | ) | | | 21.34 | | | | 9.50 | | | | 285,785 | | | | 1.45 | | | | 1.47 | | | | 1.37 | | | | 17 | |
Year ended 12/31/12 | | | 17.93 | | | | 0.18 | | | | 2.74 | | | | 2.92 | | | | (0.04 | ) | | | — | | | | (0.04 | ) | | | 20.81 | | | | 16.31 | | | | 295,767 | | | | 1.50 | | | | 1.51 | | | | 0.97 | | | | 15 | |
Class B | |
Year ended 12/31/16 | | | 14.75 | | | | 0.21 | | | | 0.98 | | | | 1.19 | | | | (0.24 | ) | | | (0.97 | ) | | | (1.21 | ) | | | 14.73 | | | | 8.03 | | | | 950 | | | | 2.32 | (d) | | | 2.33 | (d) | | | 1.38 | (d) | | | 15 | |
Year ended 12/31/15 | | | 17.66 | | | | 0.07 | | | | (1.84 | ) | | | (1.77 | ) | | | (0.06 | ) | | | (1.08 | ) | | | (1.14 | ) | | | 14.75 | | | | (9.99 | ) | | | 1,514 | | | | 2.27 | | | | 2.28 | | | | 0.43 | | | | 8 | |
Year ended 12/31/14 | | | 20.54 | | | | 0.12 | | | | (1.35 | ) | | | (1.23 | ) | | | (0.11 | ) | | | (1.54 | ) | | | (1.65 | ) | | | 17.66 | | | | (5.78 | ) | | | 2,828 | | | | 2.20 | | | | 2.21 | | | | 0.56 | | | | 20 | |
Year ended 12/31/13 | | | 20.03 | | | | 0.12 | | | | 1.58 | | | | 1.70 | | | | (0.10 | ) | | | (1.09 | ) | | | (1.19 | ) | | | 20.54 | | | | 8.71 | | | | 5,282 | | | | 2.20 | | | | 2.22 | | | | 0.62 | | | | 17 | |
Year ended 12/31/12 | | | 17.36 | | | | 0.04 | | | | 2.64 | | | | 2.68 | | | | (0.01 | ) | | | — | | | | (0.01 | ) | | | 20.03 | | | | 15.44 | | | | 10,352 | | | | 2.25 | | | | 2.26 | | | | 0.22 | | | | 15 | |
Class C | |
Year ended 12/31/16 | | | 14.76 | | | | 0.21 | | | | 0.97 | | | | 1.18 | | | | (0.24 | ) | | | (0.97 | ) | | | (1.21 | ) | | | 14.73 | | | | 7.96 | | | | 15,712 | | | | 2.32 | (d) | | | 2.33 | (d) | | | 1.38 | (d) | | | 15 | |
Year ended 12/31/15 | | | 17.67 | | | | 0.07 | | | | (1.84 | ) | | | (1.77 | ) | | | (0.06 | ) | | | (1.08 | ) | | | (1.14 | ) | | | 14.76 | | | | (9.98 | ) | | | 18,098 | | | | 2.27 | | | | 2.28 | | | | 0.43 | | | | 8 | |
Year ended 12/31/14 | | | 20.54 | | | | 0.12 | | | | (1.34 | ) | | | (1.22 | ) | | | (0.11 | ) | | | (1.54 | ) | | | (1.65 | ) | | | 17.67 | | | | (5.73 | ) | | | 26,458 | | | | 2.20 | | | | 2.21 | | | | 0.56 | | | | 20 | |
Year ended 12/31/13 | | | 20.03 | | | | 0.12 | | | | 1.58 | | | | 1.70 | | | | (0.10 | ) | | | (1.09 | ) | | | (1.19 | ) | | | 20.54 | | | | 8.71 | | | | 33,764 | | | | 2.20 | | | | 2.22 | | | | 0.62 | | | | 17 | |
Year ended 12/31/12 | | | 17.37 | | | | 0.04 | | | | 2.63 | | | | 2.67 | | | | (0.01 | ) | | | — | | | | (0.01 | ) | | | 20.03 | | | | 15.38 | | | | 36,136 | | | | 2.25 | | | | 2.26 | | | | 0.22 | | | | 15 | |
Class Y | |
Year ended 12/31/16 | | | 15.43 | | | | 0.38 | | | | 1.03 | | | | 1.41 | | | | (0.41 | ) | | | (0.97 | ) | | | (1.38 | ) | | | 15.46 | | | | 9.10 | | | | 57,810 | | | | 1.32 | (d) | | | 1.33 | (d) | | | 2.38 | (d) | | | 15 | |
Year ended 12/31/15 | | | 18.42 | | | | 0.26 | | | | (1.94 | ) | | | (1.68 | ) | | | (0.23 | ) | | | (1.08 | ) | | | (1.31 | ) | | | 15.43 | | | | (9.11 | ) | | | 60,497 | | | | 1.27 | | | | 1.28 | | | | 1.43 | | | | 8 | |
Year ended 12/31/14 | | | 21.38 | | | | 0.34 | | | | (1.42 | ) | | | (1.08 | ) | | | (0.34 | ) | | | (1.54 | ) | | | (1.88 | ) | | | 18.42 | | | | (4.79 | ) | | | 121,933 | | | | 1.20 | | | | 1.21 | | | | 1.56 | | | | 20 | |
Year ended 12/31/13 | | | 20.84 | | | | 0.35 | | | | 1.65 | | | | 2.00 | | | | (0.37 | ) | | | (1.09 | ) | | | (1.46 | ) | | | 21.38 | | | | 9.82 | | | | 122,163 | | | | 1.20 | | | | 1.22 | | | | 1.62 | | | | 17 | |
Year ended 12/31/12 | | | 17.97 | | | | 0.23 | | | | 2.73 | | | | 2.96 | | | | (0.09 | ) | | | — | | | | (0.09 | ) | | | 20.84 | | | | 16.51 | | | | 90,843 | | | | 1.25 | | | | 1.26 | | | | 1.22 | | | | 15 | |
Class R5 | |
Year ended 12/31/16 | | | 15.30 | | | | 0.39 | | | | 1.02 | | | | 1.41 | | | | (0.42 | ) | | | (0.97 | ) | | | (1.39 | ) | | | 15.32 | | | | 9.21 | | | | 9,740 | | | | 1.19 | (d) | | | 1.20 | (d) | | | 2.51 | (d) | | | 15 | |
Year ended 12/31/15 | | | 18.27 | | | | 0.27 | | | | (1.91 | ) | | | (1.64 | ) | | | (0.25 | ) | | | (1.08 | ) | | | (1.33 | ) | | | 15.30 | | | | (8.96 | ) | | | 24,821 | | | | 1.17 | | | | 1.18 | | | | 1.53 | | | | 8 | |
Year ended 12/31/14 | | | 21.23 | | | | 0.35 | | | | (1.41 | ) | | | (1.06 | ) | | | (0.36 | ) | | | (1.54 | ) | | | (1.90 | ) | | | 18.27 | | | | (4.74 | ) | | | 63,044 | | | | 1.13 | | | | 1.14 | | | | 1.63 | | | | 20 | |
Year ended 12/31/13 | | | 20.71 | | | | 0.36 | | | | 1.63 | | | | 1.99 | | | | (0.38 | ) | | | (1.09 | ) | | | (1.47 | ) | | | 21.23 | | | | 9.88 | | | | 91,240 | | | | 1.13 | | | | 1.15 | | | | 1.69 | | | | 17 | |
Year ended 12/31/12 | | | 17.85 | | | | 0.25 | | | | 2.72 | | | | 2.97 | | | | (0.11 | ) | | | — | | | | (0.11 | ) | | | 20.71 | | | | 16.66 | | | | 79,911 | | | | 1.13 | | | | 1.14 | | | | 1.34 | | | | 15 | |
Class R6 | |
Year ended 12/31/16 | | | 15.30 | | | | 0.40 | | | | 1.02 | | | | 1.42 | | | | (0.44 | ) | | | (0.97 | ) | | | (1.41 | ) | | | 15.31 | | | | 9.22 | | | | 15,436 | | | | 1.13 | (d) | | | 1.14 | (d) | | | 2.57 | (d) | | | 15 | |
Year ended 12/31/15 | | | 18.27 | | | | 0.28 | | | | (1.91 | ) | | | (1.63 | ) | | | (0.26 | ) | | | (1.08 | ) | | | (1.34 | ) | | | 15.30 | | | | (8.87 | ) | | | 38,080 | | | | 1.09 | | | | 1.10 | | | | 1.61 | | | | 8 | |
Year ended 12/31/14 | | | 21.24 | | | | 0.37 | | | | (1.42 | ) | | | (1.05 | ) | | | (0.38 | ) | | | (1.54 | ) | | | (1.92 | ) | | | 18.27 | | | | (4.68 | ) | | | 45,946 | | | | 1.04 | | | | 1.05 | | | | 1.72 | | | | 20 | |
Year ended 12/31/13 | | | 20.72 | | | | 0.38 | | | | 1.63 | | | | 2.01 | | | | (0.40 | ) | | | (1.09 | ) | | | (1.49 | ) | | | 21.24 | | | | 9.97 | | | | 36,554 | | | | 1.04 | | | | 1.06 | | | | 1.78 | | | | 17 | |
Year ended 12/31/12(e) | | | 19.66 | | | | 0.08 | | | | 1.09 | | | | 1.17 | | | | (0.11 | ) | | | — | | | | (0.11 | ) | | | 20.72 | | | | 5.99 | | | | 18,039 | | | | 1.04 | (f) | | | 1.06 | (f) | | | 1.42 | (f) | | | 15 | |
| (a) | Calculated using average shares outstanding. |
| (b) | Includes adjustments in accordance with accounting principles generally accepted in the United States of America and as such, the net asset value for financial reporting purposes and the returns based upon those net asset values may differ from the net asset value and returns for shareholder transactions. Not annualized for periods less than one year, if applicable. |
| (c) | Portfolio turnover is calculated at the fund level and is not annualized for periods less than one year, if applicable. |
| (d) | Ratios are based on average daily net assets (000’s omitted) of $118,548, $1,230, $17,516, $47,511, $12,298 and $18,992 for Class A, Class B, Class C, Class Y, Class R5 and Class R6 shares, respectively. |
| (e) | Commencement date of September 24, 2012. |
21 Invesco International Small Company Fund
Report of Independent Registered Public Accounting Firm
To the Board of Trustees of AIM Funds Group (Invesco Funds Group)
and Shareholders of the Invesco International Small Company Fund:
In our opinion, the accompanying statement of assets and liabilities, including the schedule of investments, and the related statements of operations and of changes in net assets and the financial highlights present fairly, in all material respects, the financial position of the Invesco International Small Company Fund (one of the portfolios constituting the AIM Funds Group (Invesco Funds Group), hereafter referred to as the “Fund”) as of December 31, 2016, the results of its operations for the year then ended, the changes in its net assets for each of the two years in the period then ended and the financial highlights for each of the five years in the period then ended, in conformity with accounting principles generally accepted in the United States of America. These financial statements and financial highlights (hereafter referred to as “financial statements”) are the responsibility of the Fund’s management. Our responsibility is to express an opinion on these financial statements based on our audits. We conducted our audits of these financial statements in accordance with the standards of the Public Company Accounting Oversight Board (United States). Those standards require that we plan and perform the audit to obtain reasonable assurance about whether the financial statements are free of material misstatement. An audit includes examining, on a test basis, evidence supporting the amounts and disclosures in the financial statements, assessing the accounting principles used and significant estimates made by management, and evaluating the overall financial statement presentation. We believe that our audits, which included confirmation of securities as of December 31, 2016 by correspondence with the custodian and brokers, provide a reasonable basis for our opinion.
PricewaterhouseCoopers LLP
Houston, Texas
February 23, 2017
22 Invesco International Small Company Fund
Calculating your ongoing Fund expenses
Example
As a shareholder of the Fund, you incur two types of costs: (1) transaction costs, which may include sales charges (loads) on purchase payments or contingent deferred sales charges on redemptions, if any; and (2) ongoing costs, including management fees, distribution and/or service (12b-1) fees, and other Fund expenses. This example is intended to help you understand your ongoing costs (in dollars) of investing in the Fund and to compare these costs with ongoing costs of investing in other mutual funds. The example is based on an investment of $1,000 invested at the beginning of the period and held for the entire period July 1, 2016 through December 31, 2016.
Actual expenses
The table below provides information about actual account values and actual expenses. You may use the information in this table, together with the amount you invested, to estimate the expenses that you paid over the period. Simply divide your account value by $1,000 (for example, an $8,600 account value divided by $1,000 = 8.6), then multiply the result by the number in the table under the heading entitled “Actual Expenses Paid During Period” to estimate the expenses you paid on your account during this period.
Hypothetical example for comparison purposes
The table below also provides information about hypothetical account values and hypothetical expenses based on the Fund’s actual expense ratio and an assumed rate of return of 5% per year before expenses, which is not the Fund’s actual return.
The hypothetical account values and expenses may not be used to estimate the actual ending account balance or expenses you paid for the period. You may use this information to compare the ongoing costs of investing in the Fund and other funds. To do so, compare this 5% hypothetical example with the 5% hypothetical examples that appear in the shareholder reports of the other funds.
Please note that the expenses shown in the table are meant to highlight your ongoing costs only and do not reflect any transaction costs, such as sales charges (loads) on purchase payments or contingent deferred sales charges on redemptions, if any. Therefore, the hypothetical information is useful in comparing ongoing costs only, and will not help you determine the relative total costs of owning different funds. In addition, if these transaction costs were included, your costs would have been higher.
| | | | | | | | | | | | | | | | | | | | | | | | |
| Class | | Beginning
Account Value
(07/01/16) | | | ACTUAL | | | HYPOTHETICAL
(5% annual return before
expenses) | | | Annualized
Expense
Ratio | |
| | | Ending
Account Value
(12/31/16)1 | | | Expenses
Paid During
Period2 | | | Ending
Account Value
(12/31/16) | | | Expenses
Paid During
Period2 | | |
A | | $ | 1,000.00 | | | $ | 1,064.40 | | | $ | 7.84 | | | $ | 1,017.55 | | | $ | 7.66 | | | | 1.51 | % |
B | | | 1,000.00 | | | | 1,060.20 | | | | 11.70 | | | | 1,013.77 | | | | 11.44 | | | | 2.26 | |
C | | | 1,000.00 | | | | 1,060.20 | | | | 11.70 | | | | 1,013.77 | | | | 11.44 | | | | 2.26 | |
Y | | | 1,000.00 | | | | 1,065.50 | | | | 6.54 | | | | 1,018.80 | | | | 6.39 | | | | 1.26 | |
R5 | | | 1,000.00 | | | | 1,066.30 | | | | 5.77 | | | | 1,019.56 | | | | 5.63 | | | | 1.11 | �� |
R6 | | | 1,000.00 | | | | 1,066.40 | | | | 5.51 | | | | 1,019.81 | | | | 5.38 | | | | 1.06 | |
| 1 | The actual ending account value is based on the actual total return of the Fund for the period July 1, 2016 through December 31, 2016, after actual expenses and will differ from the hypothetical ending account value which is based on the Fund’s expense ratio and a hypothetical annual return of 5% before expenses. |
| 2 | Expenses are equal to the Fund’s annualized expense ratio as indicated above multiplied by the average account value over the period, multiplied by 184/366 to reflect the most recent fiscal half year. |
23 Invesco International Small Company Fund
Tax Information
Form 1099-DIV, Form 1042-S and other year-end tax information provide shareholders with actual calendar year amounts that should be included in their tax returns. Shareholders should consult their tax advisors.
The following distribution information is being provided as required by the Internal Revenue Code or to meet a specific state’s requirement.
The Fund designates the following amounts or, if subsequently determined to be different, the maximum amount allowable for its fiscal year ended December 31, 2016:
| | | | |
Federal and State Income Tax | |
Long-Term Capital Gain Distributions | | | $12,951,817 | |
Qualified Dividend Income* | | | 100 | % |
Corporate Dividends Received Deduction* | | | 0.00 | % |
U.S. Treasury Obligations* | | | 0.00 | % |
Foreign Taxes per share | | | $0.0460 | per share |
Foreign Source Income per share | | | $0.6396 | per share |
| | * | The above percentages are based on ordinary income dividends paid to shareholders during the Fund’s fiscal year. |
Distribution Information
Correction notice
Shareholders were sent a notice from the Fund that set forth an estimate on a per share basis of the source or sources from which the distribution was paid in December of 2016. Subsequently, certain of these estimates have been corrected. Listed below is a written statement of the sources of this distribution, as corrected, on a generally accepted accounting principles (“GAAP”) basis.
| | | | | | | | | | | | | | | | | | |
| | | | | Net Income | | | Gain from
Sale of Securities | | | Return of Principal | | | Total Distribution | |
| 12/13/2016 | | Class A | | $ | 0.3475 | | | $ | 0.9078 | | | $ | 0.0846 | | | $ | 1.3399 | |
| 12/13/2016 | | Class B | | $ | 0.2171 | | | $ | 0.9078 | | | $ | 0.0846 | | | $ | 1.2095 | |
| 12/13/2016 | | Class C | | $ | 0.2171 | | | $ | 0.9078 | | | $ | 0.0846 | | | $ | 1.2095 | |
| 12/13/2016 | | Class Y | | $ | 0.3877 | | | $ | 0.9078 | | | $ | 0.0846 | | | $ | 1.3801 | |
| 12/13/2016 | | Class R5 | | $ | 0.4016 | | | $ | 0.9078 | | | $ | 0.0846 | | | $ | 1.3940 | |
| 12/13/2016 | | Class R6 | | $ | 0.4144 | | | $ | 0.9078 | | | $ | 0.0846 | | | $ | 1.4068 | |
Please note that the information in the preceding chart is for financial accounting purposes only. Shareholders should be aware that the tax treatment of distributions likely differs from GAAP treatment. Form 1099-DIV for the calendar year will report distributions for U.S. federal income tax purposes. This Notice is sent to comply with certain U.S. Securities and Exchange Commission requirements.
24 Invesco International Small Company Fund
Trustees and Officers
The address of each trustee and officer is AIM Funds Group (Invesco Funds Group) (the “Trust”), 11 Greenway Plaza, Suite 1000, Houston, Texas 77046-1173. The trustees serve for the life of the Trust, subject to their earlier death, incapacitation, resignation, retirement or removal as more specifically provided in the Trust’s organizational documents. Each officer serves for a one year term or until their successors are elected and qualified. Column two below includes length of time served with predecessor entities, if any.
| | | | | | | | |
Name, Year of Birth and
Position(s) Held with the Trust | | Trustee and/
or Officer Since | | Principal Occupation(s)
During Past 5 Years | | Number of
Funds in Fund
Complex
Overseen by
Trustee | | Other Directorship(s)
Held by Trustee During Past 5 Years |
| Interested Persons | | | | | | | | |
| Martin L. Flanagan1 — 1960 Trustee | | 2007 | | Executive Director, Chief Executive Officer and President, Invesco Ltd. (ultimate parent of Invesco and a global investment management firm); Advisor to the Board, Invesco Advisers, Inc. (formerly known as Invesco Institutional (N.A.), Inc.); Trustee, The Invesco Funds; Vice Chair, Investment Company Institute; and Member of Executive Board, SMU Cox School of Business Formerly: Chairman and Chief Executive Officer, Invesco Advisers, Inc. (registered investment adviser); Director, Chairman, Chief Executive Officer and President, Invesco Holding Company (US) Inc. (formerly IVZ Inc.) (holding company), Invesco Group Services, Inc. (service provider) and Invesco North American Holdings, Inc. (holding company); Director, Chief Executive Officer and President, Invesco Holding Company Limited (parent of Invesco and a global investment management firm); Director, Invesco Ltd.; Chairman, Investment Company Institute and President, Co-Chief Executive Officer, Co-President, Chief Operating Officer and Chief Financial Officer, Franklin Resources, Inc. (global investment management organization) | | 144 | | None |
Philip A. Taylor2 — 1954 Trustee and Senior Vice President | | 2006 | | Head of the Americas and Senior Managing Director, Invesco Ltd.; Director, Co-Chairman, Co-President and Co-Chief Executive Officer, Invesco Advisers, Inc. (formerly known as Invesco Institutional (N.A.), Inc.) (registered investment adviser); Director, Chairman, Chief Executive Officer and President, Invesco Management Group, Inc. (formerly known as Invesco AIM Management Group, Inc.) (financial services holding company); Director and Chairman, Invesco Investment Services, Inc. (formerly known as Invesco AIM Investment Services, Inc.) (registered transfer agent) Chief Executive Officer, Invesco Corporate Class Inc. (corporate mutual fund company) Director, Chairman and Chief Executive Officer, Invesco Canada Ltd. (formerly known as Invesco Trimark Ltd./Invesco Trimark Ltèe) (registered investment adviser and registered transfer agent); Trustee and Senior Vice President, The Invesco Funds; Director, Invesco Investment Advisers LLC (formerly known as Van Kampen Asset Management). Formerly: Director, Chief Executive Officer and President, Van Kampen Exchange Corp.; President and Principal Executive Officer, The Invesco Funds (other than AIM Treasurer’s Series Trust (Invesco Treasurer’s Series Trust), Short-Term Investments Trust and Invesco Management Trust); Executive Vice President, The Invesco Funds (AIM Treasurer’s Series Trust (Invesco Treasurer’s Series Trust), Short-Term Investments Trust and Invesco Management Trust only); Director and President, INVESCO Funds Group, Inc. (registered investment adviser and registered transfer agent); Director and Chairman, IVZ Distributors, Inc. (formerly known as INVESCO Distributors, Inc.) (registered broker dealer); Director, President and Chairman, Invesco Inc. (holding company), Invesco Canada Holdings Inc. (holding company), Trimark Investments Ltd./Placements Trimark Ltèe and Invesco Financial Services Ltd/Services Financiers Invesco Ltèe; Chief Executive Officer, Invesco Canada Fund Inc. (corporate mutual fund company); Director and Chairman, Van Kampen Investor Services Inc.; Director, Chief Executive Officer and President, 1371 Preferred Inc. (holding company) and Van Kampen Investments Inc.; Director and President, AIM GP Canada Inc. (general partner for limited partnerships) and Van Kampen Advisors, Inc.; Director and Chief Executive Officer, Invesco Trimark Dealer Inc. (registered broker dealer); Director, Invesco Distributors, Inc. (formerly known as Invesco AIM Distributors, Inc.) (registered broker dealer); Manager, Invesco PowerShares Capital Management LLC; Director, Chief Executive Officer and President, Invesco Advisers, Inc.; Director, Chairman, Chief Executive Officer and President, Invesco AIM Capital Management, Inc.; President, Invesco Trimark Dealer Inc. and Invesco Trimark Ltd./Invesco Trimark Ltèe; Director and President, AIM Trimark Corporate Class Inc. and AIM Trimark Canada Fund Inc.; Senior Managing Director, Invesco Holding Company Limited; Director and Chairman, Fund Management Company (former registered broker dealer); President and Principal Executive Officer, The Invesco Funds (AIM Treasurer’s Series Trust (Invesco Treasurer’s Series Trust), and Short-Term Investments Trust only); President, AIM Trimark Global Fund Inc. and AIM Trimark Canada Fund Inc. | | 144 | | None |
| 1 | Mr. Flanagan is considered an interested person (within the meaning of Section 2(a)(19) of the 1940 Act) of the Trust because he is an officer of the Adviser to the Trust, and an officer and a director of Invesco Ltd., ultimate parent of the Adviser. |
| 2 | Mr. Taylor is considered an interested person (within the meaning of Section 2(a)(19) of the 1940 Act) of the Trust because he is an officer and a director of the Adviser. |
T-1 Invesco International Small Company Fund
Trustees and Officers—(continued)
| | | | | | | | |
Name, Year of Birth and
Position(s) Held with the Trust | | Trustee and/
or Officer Since | | Principal Occupation(s)
During Past 5 Years | | Number of
Funds in Fund
Complex
Overseen by
Trustee | | Other Directorship(s)
Held by Trustee During
Past 5 Years |
| Independent Trustees | | | | | | | | |
Bruce L. Crockett — 1944 Trustee and Chair | | 1987 | | Chairman, Crockett Technologies Associates (technology consulting company) Formerly: Director, Captaris (unified messaging provider); Director, President and Chief Executive Officer, COMSAT Corporation; Chairman, Board of Governors of INTELSAT (international communications company); ACE Limited (insurance company); Independent Directors Council and Investment Company Institute | | 144 | | Chairman of the Audit committee, ALPS (Attorneys Liability Protection Society) (insurance company): Member of the Audit Committee, Ferroglobe PLC (metallurgical company) and Investment Company Institute; Member of the Executive Committee and Chair of the Governance Committee, Independent Directors Council |
David C. Arch — 1945 Trustee | | 2010 | | Chairman of Blistex Inc., a consumer health care products manufacturer | | 144 | | Board member of the Illinois Manufacturers’ Association |
James T. Bunch — 1942 Trustee | | 2003 | | Managing Member, Grumman Hill Group LLC (family office/private equity investments) Formerly: Chairman of the Board, Denver Film Society, Chairman of the Board of Trustees, Evans Scholarship Foundation; Chairman, Board of Governors, Western Golf Association | | 144 | | Trustee, Evans Scholarship Foundation; Chairman of the Board, Denver Film Society |
Jack M. Fields — 1952 Trustee | | 1997 | | Chief Executive Officer, Twenty First Century Group, Inc. (government affairs company); and Discovery Learning Alliance (non-profit) Formerly: Owner and Chief Executive Officer, Dos Angeles Ranch L.P. (cattle, hunting, corporate entertainment); Director, Insperity, Inc. (formerly known as Administaff); Chief Executive Officer, Texana Timber LP (sustainable forestry company); Director of Cross Timbers Quail Research Ranch (non-profit); and member of the U.S. House of Representatives | | 144 | | None |
Eli Jones — 1961 Trustee | | 2016 | | Professor and Dean, Mays Business School — Texas A&M University Formerly: Professor and Dean, Walton College of Business, University of Arkansas and E.J. Ourso College of Business, Louisiana State University and Director, Arvest Bank | | 144 | | Director of Insperity, Inc. (formerly known as Administaff) |
Prema Mathai-Davis — 1950 Trustee | | 1998 | | Retired. Formerly: Chief Executive Officer, YWCA of the U.S.A. | | 144 | | None |
Larry Soll — 1942 Trustee | | 2003 | | Retired. Formerly: Chairman, Chief Executive Officer and President, Synergen Corp. (a biotechnology company) | | 144 | | None |
Raymond Stickel, Jr. — 1944 Trustee | | 2005 | | Retired. Formerly: Director, Mainstay VP Series Funds, Inc. (25 portfolios) and Partner, Deloitte & Touche | | 144 | | None |
Robert C. Troccoli — 1949 Trustee | | 2016 | | Adjunct Professor, University of Denver — Daniels College of Business Formerly: Senior Partner, KPMG LLP | | 144 | | None |
| Other Officers | | | | | | | | |
Sheri Morris — 1964 President, Principal Executive Officer and Treasurer | | 1999 | | President, Principal Executive Officer and Treasurer, The Invesco Funds; Vice President, Invesco Advisers, Inc. (formerly known as Invesco Institutional (N.A.), Inc.) (registered investment adviser); and Vice President, PowerShares Exchange-Traded Fund Trust, PowerShares Exchange-Traded Fund Trust II, PowerShares India Exchange-Traded Fund Trust, PowerShares Actively Managed Exchange-Traded Fund Trust, and PowerShares Actively Managed Exchange-Traded Commodity Fund Trust Formerly: Vice President and Principal Financial Officer, The Invesco Funds; Vice President, Invesco AIM Advisers, Inc., Invesco AIM Capital Management, Inc. and Invesco AIM Private Asset Management, Inc.; Assistant Vice President and Assistant Treasurer, The Invesco Funds and Assistant Vice President, Invesco Advisers, Inc., Invesco AIM Capital Management, Inc. and Invesco AIM Private Asset Management, Inc.; and Treasurer, PowerShares Exchange-Traded Fund Trust, PowerShares Exchange-Traded Fund Trust II, PowerShares India Exchange-Traded Fund Trust and PowerShares Actively Managed Exchange-Traded Fund Trust | | N/A | | N/A |
Russell C. Burk — 1958 Senior Vice President and Senior Officer | | 2005 | | Senior Vice President and Senior Officer, The Invesco Funds | | N/A | | N/A |
T-2 Invesco International Small Company Fund
Trustees and Officers—(continued)
| | | | | | | | |
Name, Year of Birth and
Position(s) Held with the Trust | | Trustee and/
or Officer Since | | Principal Occupation(s)
During Past 5 Years | | Number of
Funds in Fund
Complex
Overseen by
Trustee | | Other Directorship(s)
Held by Trustee During
Past 5 Years |
| Other Officers—(continued) | | | | | | | | |
John M. Zerr — 1962 Senior Vice President, Chief Legal Officer and Secretary | | 2006 | | Director, Senior Vice President, Secretary and General Counsel, Invesco Management Group, Inc. (formerly known as Invesco AIM Management Group, Inc.; Senior Vice President, Invesco Advisers, Inc. (formerly known as Invesco Institutional (N.A.), Inc.) (registered investment adviser); Senior Vice President and Secretary, Invesco Distributors, Inc. (formerly known as Invesco AIM Distributors, Inc.); Director, Vice President and Secretary, Invesco Investment Services, Inc. (formerly known as Invesco AIM Investment Services, Inc.) Senior Vice President, Chief Legal Officer and Secretary, The Invesco Funds; Managing Director, Invesco PowerShares Capital Management LLC; Director, Secretary and General Counsel, Invesco Investment Advisers LLC (formerly known as Van Kampen Asset Management); Secretary and General Counsel, Invesco Capital Markets, Inc. (formerly known as Van Kampen Funds Inc.) and Chief Legal Officer, PowerShares Exchange-Traded Fund Trust, PowerShares Exchange-Traded Fund Trust II, PowerShares India Exchange-Traded Fund Trust, PowerShares Actively Managed Exchange-Traded Fund Trust, and PowerShares Actively Managed Exchange-Traded Commodity Fund Trust Formerly: Director, Secretary, General Counsel and Senior Vice President, Van Kampen Exchange Corp.; Director, Vice President and Secretary, IVZ Distributors, Inc. (formerly known as INVESCO Distributors, Inc.); Director and Vice President, INVESCO Funds Group, Inc.; Director and Vice President, Van Kampen Advisors Inc.; Director, Vice President, Secretary and General Counsel, Van Kampen Investor Services Inc.; Director, Invesco Distributors, Inc. (formerly known as Invesco AIM Distributors, Inc.); Director, Senior Vice President, General Counsel and Secretary, Invesco AIM Advisers, Inc. and Van Kampen Investments Inc.; Director, Vice President and Secretary, Fund Management Company; Director, Senior Vice President, Secretary, General Counsel and Vice President, Invesco AIM Capital Management, Inc.; Chief Operating Officer and General Counsel, Liberty Ridge Capital, Inc. (an investment adviser); Vice President and Secretary, PBHG Funds (an investment company) and PBHG Insurance Series Fund (an investment company); Chief Operating Officer, General Counsel and Secretary, Old Mutual Investment Partners (a broker-dealer); General Counsel and Secretary, Old Mutual Fund Services (an administrator) and Old Mutual Shareholder Services (a shareholder servicing center); Executive Vice President, General Counsel and Secretary, Old Mutual Capital, Inc. (an investment adviser); and Vice President and Secretary, Old Mutual Advisors Funds (an investment company) | | N/A | | N/A |
| Karen Dunn Kelley — 1960 Senior Vice President | | 1992 | | Senior Managing Director, Investments, Invesco Ltd.; Director, Co-President, Co-Chief Executive Officer, and Co-Chairman, Invesco Advisers, Inc. (formerly known as Invesco Institutional (N.A.), Inc.) (registered investment adviser); Chairman and Director, Invesco Senior Secured Management, Inc.; Senior Vice President, Invesco Management Group, Inc. (formerly known as Invesco AIM Management Group, Inc.); Executive Vice President, Invesco Distributors, Inc. (formerly known as Invesco AIM Distributors, Inc.); Director, Invesco Mortgage Capital Inc.; Senior Vice President, The Invesco Funds Formerly: Director, Invesco Management Company Limited; Vice President, The Invesco Funds (other than AIM Treasurer’s Series Trust (Invesco Treasurer’s Series Trust), Short-Term Investments Trust and Invesco Management Trust); and President and Principal Executive Officer, The Invesco Funds (AIM Treasurer’s Series Trust (Invesco Treasurer’s Series Trust), Short-Term Investments Trust and Invesco Management Trust only); Director and President, INVESCO Asset Management (Bermuda) Ltd., Director, INVESCO Global Asset Management DAC (formerly known as INVESCO Global Asset Management Limited) and INVESCO Management S.A.; Senior Vice President, Van Kampen Investments Inc. and Invesco Advisers, Inc. (formerly known as Invesco Institutional (N.A.), Inc.) (registered investment adviser); Director and President, Fund Management Company; Chief Cash Management Officer, Director of Cash Management, Senior Vice President, and Managing Director, Invesco AIM Capital Management, Inc.; Director of Cash Management, Senior Vice President, and Vice President, Invesco Advisers, Inc. and Vice President, The Invesco Funds (AIM Treasurer’s Series Trust (Invesco Treasurer’s Series Trust), and Short-Term Investments Trust only) | | N/A | | N/A |
Kelli Gallegos — 1970 Vice President, Principal Financial Officer and Assistant Treasurer | | 2008 | | Vice President, Principal Financial Officer and Assistant Treasurer, The Invesco Funds; Assistant Treasurer, Invesco PowerShares Capital Management LLC, PowerShares Exchange-Traded Fund Trust, PowerShares Exchange-Traded Fund Trust II, PowerShares India Exchange-Traded Fund Trust, PowerShares Actively Managed Exchange-Traded Fund Trust, and PowerShares Actively Managed Exchange-Traded Commodity Fund Trust Formerly: Assistant Vice President, The Invesco Funds | | N/A | | N/A |
Tracy Sullivan — 1962 Vice President, Chief Tax Officer and Assistant Treasurer | | 2008 | | Vice President, Chief Tax Officer and Assistant Treasurer, The Invesco Funds; Assistant Treasurer, Invesco PowerShares Capital Management LLC, PowerShares Exchange-Traded Fund Trust, PowerShares Exchange-Traded Fund Trust II, PowerShares India Exchange-Traded Fund Trust, PowerShares Actively Managed Exchange-Traded Fund Trust, and PowerShares Actively Managed Exchange-Traded Commodity Fund Trust Formerly: Assistant Vice President, The Invesco Funds | | N/A | | N/A |
T-3 Invesco International Small Company Fund
Trustees and Officers—(continued)
| | | | | | | | |
Name, Year of Birth and
Position(s) Held with the Trust | | Trustee and/
or Officer Since | | Principal Occupation(s)
During Past 5 Years | | Number of
Funds in Fund
Complex
Overseen by
Trustee | | Other Directorship(s)
Held by Trustee During
Past 5 Years |
| Other Officers—(continued) | | | | | | | | |
Crissie M. Wisdom — 1969 Anti-Money Laundering Compliance Officer | | 2013 | | Anti-Money Laundering Compliance Officer, Invesco Advisers, Inc. (formerly known as Invesco Institutional (N.A.), Inc.) (registered investment adviser), Invesco Capital Markets, Inc. (formerly known as Van Kampen Funds Inc.), Invesco Distributors, Inc., Invesco Investment Services, Inc., Invesco Management Group, Inc., The Invesco Funds, and PowerShares Exchange-Traded Fund Trust, PowerShares Exchange-Traded Fund Trust II, PowerShares India Exchange-Traded Fund Trust, PowerShares Actively Managed Exchange-Traded Fund Trust and PowerShares Actively Managed Exchange-Traded Commodity Fund Trust; Anti-Money Laundering Compliance Officer and Bank Secrecy Act Officer, INVESCO National Trust Company and Invesco Trust Company; and Fraud Prevention Manager and Controls and Risk Analysis Manager for Invesco Investment Services, Inc. Formerly: Anti-Money Laundering Compliance Officer, Van Kampen Exchange Corp. | | N/A | | N/A |
Robert R. Leveille — 1969 Chief Compliance Officer | | 2016 | | Chief Compliance Officer, Invesco Advisers, Inc. (registered investment adviser); and Chief Compliance Officer, The Invesco Funds Formerly: Chief Compliance Officer, Putnam Investments and the Putnam Funds | | N/A | | N/A |
The Statement of Additional Information of the Trust includes additional information about the Fund’s Trustees and is available upon request, without charge, by calling 1.800.959.4246. Please refer to the Fund’s Statement of Additional Information for information on the Fund’s sub-advisers.
| | | | | | |
Office of the Fund 11 Greenway Plaza, Suite 1000 Houston, TX 77046-1173 | | Investment Adviser Invesco Advisers, Inc. 1555 Peachtree Street, N.E. Atlanta, GA 30309 | | Distributor Invesco Distributors, Inc. 11 Greenway Plaza, Suite 1000 Houston, TX 77046-1173 | | Auditors PricewaterhouseCoopers LLP 1000 Louisiana Street, Suite 5800 Houston, TX 77002-5678 |
| | | |
| | | | | | |
Counsel to the Fund Stradley Ronon Stevens & Young, LLP 2005 Market Street, Suite 2600 Philadelphia, PA 19103-7018 | | Counsel to the Independent Trustees Goodwin Procter LLP 901 New York Avenue, N.W. Washington, D.C. 20001 | | Transfer Agent Invesco Investment Services, Inc. 11 Greenway Plaza, Suite 1000 Houston, TX 77046-1173 | | Custodian State Street Bank and Trust Company 225 Franklin Street Boston, MA 02110-2801 |
T-4 Invesco International Small Company Fund
Explore High-Conviction Investing with Invesco

Invesco mailing information
Send general correspondence to Invesco Investment Services, Inc., P.O. Box 219078, Kansas City, MO 64121-9078.
Important notice regarding delivery of security holder documents
To reduce Fund expenses, only one copy of most shareholder documents may be mailed to shareholders with multiple accounts at the same address (Householding). Mailing of your shareholder documents may be householded indefinitely unless you instruct us otherwise. If you do not want the mailing of these documents to be combined with those for other members of your household, please contact Invesco Investment Services, Inc. at 800 959 4246 or contact your financial institution. We will begin sending you individual copies for each account within 30 days after receiving your request.
| | |
Fund holdings and proxy voting information The Fund provides a complete list of its holdings four times in each fiscal year, at the quarter ends. For the second and fourth quarters, the lists appear in the Fund’s semiannual and annual reports to shareholders. For the first and third quarters, the Fund files the lists with the Securities and Exchange Commission (SEC) on Form N-Q. The most recent list of portfolio holdings is available at invesco.com/completeqtrholdings. Shareholders can also look up the Fund’s Forms N-Q on the SEC website at sec.gov. Copies of the Fund’s Forms N-Q may be reviewed and copied at the SEC Public Reference Room in Washington, D.C. You can obtain information on the operation of the Public Reference Room, including information about duplicating fee charges, by calling 202 551 8090 or 800 732 0330, or by electronic request at the following email address: publicinfo@sec.gov. The SEC file numbers for the Fund are shown below. A description of the policies and procedures that the Fund uses to determine how to vote proxies relating to portfolio securities is available without charge, upon request, from our Client Services department at 800 959 4246 or at invesco.com/proxyguidelines. The information is also available on the SEC website, sec.gov. |
Information regarding how the Fund voted proxies related to its portfolio securities during the most recent 12-month period ended June 30 is available at invesco.com/proxysearch. The information is also available on the SEC website, sec.gov. Invesco Advisers, Inc. is an investment adviser; it provides investment advisory services to individual and institutional clients and does not sell securities. Invesco Distributors, Inc. is the US distributor for Invesco Ltd.’s retail mutual funds, exchange-traded funds and institutional money market funds. Both are wholly owned, indirect subsidiaries of Invesco Ltd. | |  |
| | |
| SEC file numbers: 811-01540 and 002-27334 ISC-AR-1 Invesco Distributors, Inc. | | |
| | | | |
| | |
 | | Annual Report to Shareholders | | December 31, 2016 |
| | |
| | Invesco Small Cap Equity Fund |
| | Nasdaq: A: SMEAX ∎ B: SMEBX ∎ C: SMECX ∎ R: SMERX ∎ Y: SMEYX ∎ R5: SMEIX ∎ R6: SMEFX |

Letters to Shareholders
| | | | |

Philip Taylor | | | | Dear Shareholders: This annual report includes information about your Fund, including performance data and a complete list of its investments as of the close of the reporting period. Inside is a discussion of how your Fund was managed and the factors that affected its performance during the reporting period. The reporting period began with significant stock market volatility in the US and abroad; this volatility was the result of investor uncertainty about global economic growth and monetary policy. After recovering, markets declined sharply following UK voters’ decision in June to leave the European Union. Relatively quickly, however, markets recovered, reaching record highs later in the summer. Demand was strong for income-producing investments, particularly those perceived to be lower risk; this benefited bonds as well as dividend-paying stocks for much of the reporting period. While economic news in the US was generally positive during the reporting period, news |
overseas was less upbeat. The European Central Bank and central banks in China and Japan – as well as other countries – maintained extraordinarily accommodative monetary policies in response to economic weakness. After months of uncertainty, the surprise outcome of the US presidential election in November triggered a major stock market rally, with most market indexes reaching new record highs in December. As expected, the US Federal Reserve raised interest rates in December – its only rate increase during the reporting period and only its second increase since 2006. The Fed cited optimistic economic data for its decision, and Fed-watchers suggested that future rate increases might be announced more quickly than previously forecast.
Short-term market volatility can prompt some investors to abandon their investment plans – and can cause others to settle for whatever returns the market has to offer. The investment professionals at Invesco, in contrast, invest with high conviction. This means that, no matter the asset class or the strategy, each investment team has a passion to exceed. We want to help investors achieve better outcomes, such as seeking higher returns, helping mitigate risk and generating income. Of course, investing with high conviction can’t guarantee a profit or ensure success; no investment strategy can. To learn more about how we invest with high conviction, visit invesco.com/HighConviction.
You, too, can invest with high conviction by maintaining a long-term investment perspective and by working with your financial adviser on a regular basis. During periods of short-term market volatility or uncertainty, your financial adviser can keep you focused on your long-term investment goals – a new home, a child’s college education or a secure retirement. He or she also can share research about the economy, the markets and individual investment options.
Visit our website for more information on your investments
Our website, invesco.com/us, offers a wide range of market insights and investment perspectives. On the website, you’ll find detailed information about our funds, including performance, holdings and portfolio manager commentaries. You can access information about your account by completing a simple, secure online registration. Click on the “Need to register” link in the “Account Access” box on our homepage to get started.
In addition to the resources accessible on our website and through our mobile app, you can obtain timely updates to help you stay informed about the markets, the economy and investing by connecting with Invesco on Twitter, LinkedIn or Facebook. You can access our blog at blog.invesco.us.com. Our goal is to provide you the information you want, when and where you want it.
Finally, I’m pleased to share with you Invesco’s commitment to both the Principles for Responsible Investment and to considering environmental, social and governance issues in our robust investment process. I invite you to learn more at invesco.com/esg.
Have questions?
For questions about your account, contact an Invesco client services representative at 800 959 4246. For Invesco-related questions or comments, please email me directly at phil@invesco.com.
All of us at Invesco look forward to serving your investment management needs. Thank you for investing with us.
Sincerely,

Philip Taylor
Senior Managing Director, Invesco Ltd.
2 Invesco Small Cap Equity Fund
| | | | |

Bruce Crockett | | | | Dear Fellow Shareholders: Among the many important lessons I’ve learned in more than 40 years in a variety of business endeavors is the value of a trusted advocate. As independent chair of the Invesco Funds Board, I can assure you that the members of the Board are strong advocates for the interests of investors in Invesco’s mutual funds. We work hard to represent your interests through oversight of the quality of the investment management services your funds receive and other matters important to your investment, including but not limited to: ∎ Ensuring that Invesco offers a diverse lineup of mutual funds that your financial adviser can use to strive to meet your financial needs as your investment goals change over time. ∎ Monitoring how the portfolio management teams of the Invesco funds are performing in light of changing economic and market conditions. |
| ∎ | | Assessing each portfolio management team’s investment performance within the context of the investment strategy described in the fund’s prospectus. |
| ∎ | | Monitoring for potential conflicts of interests that may impact the nature of the services that your funds receive. |
We believe one of the most important services we provide our fund shareholders is the annual review of the funds’ advisory and sub-advisory contracts with Invesco Advisers and its affiliates. This review is required by the Investment Company Act of 1940 and focuses on the nature and quality of the services Invesco provides as the adviser to the Invesco funds and the reasonableness of the fees that it charges for those services. Each year, we spend months carefully reviewing information received from Invesco and a variety of independent sources, such as performance and fee data prepared by Lipper, Inc. (a subsidiary of Broadridge Financial Solutions, Inc.), an independent, third-party firm widely recognized as a leader in its field. We also meet with our independent legal counsel and other independent advisers to review and help us assess the information that we have received. Our goal is to assure that you receive quality investment management services for a reasonable fee.
I trust the measures outlined above provide assurance that you have a worthy advocate when it comes to choosing the Invesco Funds.
As always, please contact me at bruce@brucecrockett.com with any questions or concerns you may have. On behalf of the Board, we look forward to continuing to represent your interests and serving your needs.
Sincerely,

Bruce L. Crockett
Independent Chair
Invesco Funds Board of Trustees
3 Invesco Small Cap Equity Fund
Management’s Discussion of Fund Performance
Performance summary
For the year ended December 31, 2016, Class A shares of Invesco Small Cap
Equity Fund (the Fund), at net asset value (NAV), underperformed the Fund’s
style-specific index, the Russell 2000 Index.
Your Fund’s long-term performance appears later in this report.
Fund vs. Indexes
Total returns, 12/31/15 to 12/31/16, at net asset value (NAV). Performance shown does
not include applicable contingent deferred sales charges (CDSC) or front-end sales
charges, which would have reduced performance.
| | | | | |
Class A Shares | | | | 11.72 | % |
Class B Shares | | | | 10.89 | |
Class C Shares | | | | 10.90 | |
Class R Shares | | | | 11.46 | |
Class Y Shares | | | | 12.02 | |
Class R5 Shares | | | | 12.22 | |
Class R6 Shares | | | | 12.31 | |
S&P 500 Index▼ (Broad Market Index) | | | | 11.96 | |
Russell 2000 Index▼ (Style-Specific Index) | | | | 21.31 | |
Lipper Small-Cap Core Funds Index∎ (Peer Group Index) | | | | 22.54 | |
Source(s): ▼FactSet Research Systems Inc.; ∎Lipper Inc.
Market conditions and your Fund
During the year ended December 31, 2016, the US economy continued to expand. US gross domestic product (GDP) showed the US economy grew by 3.5% in the third quarter.1 However, annualized GDP is expected to be much lower. Employment data were mixed, with unemployment ending the year at 4.7%.2 Oil prices traded in a range from the high $20s to the low $50s during the reporting period.3 Major US stock market indexes posted gains for the reporting period, with most major market indexes hitting record highs; however, the markets were fairly volatile during the first half of the year.
Stocks began 2016 on a negative note, driven by investor concerns about economic weakness in China, falling oil prices and uncertainty over the US Federal Reserve’s (the Fed) monetary policy.
Markets recovered in February and posted gains until June, when UK voters opted to leave the European Union, sending markets sharply lower. Markets again recovered, and major US equity indexes hit record highs during the summer. Following the surprise outcome of the US presidential election, a stock market rally sent major US equity market indexes to new record highs. The rally was led by financials, gaining on the belief that they might benefit from reduced federal regulation. Also in November, OPEC agreed to cut production for the first time in eight years, which helped support higher oil prices. The Fed raised interest rates by a quarter point in December 2016 – its only increase during the reporting period.4
Within this environment, the Fund posted a solid positive return, yet underperformed the Russell 2000 Index. The Fund outperformed its style-specific
benchmark in the health care sector, but these contributions were offset by underperformance in other areas including the financials, real estate, consumer discretionary and information technology (IT) sectors.
The Fund’s outperformance in the health care sector was due to underweight allocation and favorable stock selection in the sector. Relative performance within the health care sector benefited from two of the Fund’s holdings that were acquired early in the year. Life sciences tools and services company Affymetrix and health care equipment and supplies company Alere both separately announced that they were being acquired for premiums of more than 50%. We sold our positions in both Affymetrix and Alere during the reporting period to lock in gains. The Fund also benefited from an underweight allocation in the weak-performing biotechnology stocks.
On an absolute basis, the Fund had positive returns in the utilities sector due to stock selection during the reporting period. UGI, a gas utilities company, contributed to Fund performance and was the Fund’s lone holding within the sector.
In contrast, the Fund trailed its style-specific index by the widest margin in the financials sector. Fund performance was impacted by stock selection in and overweight exposure to interest rate-sensitive stocks. Holdings sensitive to interest rates sold off aggressively at the start of the year due to concerns about a possible Chinese currency devaluation, followed by Brexit concerns in the middle of the year. Holdings that detracted due to Brexit included Jones Lang Lasalle and Evercore Partners, which were also negatively impacted by foreign exchange headwinds. East West Bancorp was also a detractor from the Fund’s relative performance as
| | | | | |
Portfolio Composition |
By sector | | | | % of total net assets | |
| | | | | |
| |
| Information Technology | | | | 21.2% | |
| Industrials | | | | 19.6 | |
| Financials | | | | 17.6 | |
| Consumer Discretionary | | | | 11.3 | |
| Health Care | | | | 11.0 | |
| Energy | | | | 6.5 | |
| Materials | | | | 6.0 | |
| Consumer Staples | | | | 2.2 | |
| Utilities | | | | 1.3 | |
| Telecommunication Services | | | | 1.1 | |
| Real Estate | | | | 1.1 | |
Money Market Funds Plus Other Assets Less Liabilities | | | | 1.1 | |
| | | | | |
Top 10 Equity Holdings* |
% of total net assets |
| | | | | |
| |
1. E*TRADE Financial Corp. | | | | 1.7% | |
2. Microsemi Corp. | | | | 1.6 | |
3. Old Dominion Freight Line, Inc. | | | | 1.5 | |
4. Pinnacle Foods Inc. | | | | 1.5 | |
5. Take-Two Interactive Software, Inc. | | | | 1.5 | |
6. Coherent, Inc. | | | | 1.4 | |
7. Graphic Packaging Holding Co. | | | | 1.4 | |
8. Webster Financial Corp. | | | | 1.4 | |
9. RSP Permian Inc. | | | | 1.4 | |
10. Great Western Bancorp, Inc. | | | | 1.4 | |
| | | | | |
Total Net Assets | | | | $1.3 billion | |
| |
| Total Number of Holdings* | | | | 98 | |
The Fund’s holdings are subject to change, and there is no assurance that the Fund will continue to hold any particular security.
*Excluding money market fund holdings.
Data presented here are as of December 31, 2016.
4 Invesco Small Cap Equity Fund
its expenses related to regulatory compliance exceeded management’s guidance. We sold our positions in Jones Lang Lasalle, Evercore Partners and East West Bancorp before the end of the reporting period.
In the real estate sector, stock selection and underweight allocation in real estate investment trusts (REITs) also detracted from relative performance. As the outlook for further interest rate hikes during 2016 dimmed in the first half of the reporting period, high-dividend-yielding stocks and REITs significantly outperformed the Fund’s style-specific benchmark. Fund holding Kennedy Wilson Holdings, a global real estate company, was a notable detractor from Fund performance during the reporting period. Kennedy Wilson Holdings has significant exposure to Kennedy Wilson Europe, which primarily invests in the UK commercial real estate, and the company’s shares declined significantly after the Brexit vote. By the end of the year, the stock had recouped most of its losses.
Additionally, within the consumer discretionary sector, stock selection detracted from performance relative to the Fund’s style-specific benchmark. GNC Holdings was one of the leading detractors from Fund performance during the year. The supplements retailer was hurt by lower sales and a change in management, and we sold the holding during the reporting period. Specialty clothing retailer American Eagle Outfitters was also a detractor from relative performance. The company’s stock price fell after fourth quarter guidance came in below consensus expectations. Consumer products company Helen of Troy also detracted from Fund performance due to decelerating organic sales in its beauty products segment and greater-than-expected foreign exchange headwinds. The company made a strategic decision during the reporting period to rationalize its lower-margin beauty products, which may be a headwind for organic sales growth, but could help expand profit margins.
Stock selection in the IT sector detracted from performance relative to the Fund’s style-specific benchmark. High-end software developer Luxoft Holdings detracted from Fund performance due to Brexit concerns and slowing growth in its European markets. Network security and storage solutions provider Barracuda Networks also detracted from Fund performance due to competition from cloud service providers. Television set-top box maker Arris
International detracted from Fund performance as well due to continued capital spending delays at cable and satellite providers. We sold our positions in both Barracuda Networks and Arris International during the reporting period.
All changes to positioning are based on our bottom-up stock selection process. Our portfolio construction process acts as a risk management tool and ensures the portfolio is aligned with small-cap market sector exposure within modest over- and underweight allocations relative to the Fund’s style-specific benchmark. Our long-term investment horizon is intended to lead to relatively low turnover. During the reporting period, our exposure to the industrials and energy sectors increased noticeably, while our exposure to the financials, real estate and health care sectors decreased. The financials, real estate and utilities sectors were the Fund’s largest underweight allocations relative to the Fund’s style-specific benchmark, while the industrials, IT and energy sectors were the Fund’s largest overweight allocations at the end of the reporting period.
Thank you for your commitment to Invesco Small Cap Equity Fund and for sharing our long-term investment horizon.
1 Source: Bureau of Economic Analysis
2 Source: Bureau of Labor Statistics
3 Source: Thompson-Reuters
4 Source: US Federal Reserve
The views and opinions expressed in management’s discussion of Fund performance are those of Invesco Advisers, Inc. These views and opinions are subject to change at any time based on factors such as market and economic conditions. These views and opinions may not be relied upon as investment advice or recommendations, or as an offer for a particular security. The information is not a complete analysis of every aspect of any market, country, industry, security or the Fund. Statements of fact are from sources considered reliable, but Invesco Advisers, Inc. makes no representation or warranty as to their completeness or accuracy. Although historical performance is no guarantee of future results, these insights may help you understand our investment management philosophy.
See important Fund and, if applicable, index disclosures later in this report.
| | |

| | Juliet Ellis |
| | Chartered Financial Analyst, Portfolio Manager and Chief Investment Officer of Invesco’s domestic growth investments |
| team, is lead manager of Invesco Small Cap Equity Fund. She joined Invesco in 2004. Ms. Ellis earned a BA in economics and political science from Indiana University. |
| | |

| | Juan Hartsfield |
| | Chartered Financial Analyst, Portfolio Manager, is manager of Invesco Small Cap Equity Fund. He joined Invesco in 2004. |
| Mr. Hartsfield earned a BS in petroleum engineering from The University of Texas at Austin and an MBA from the University of Michigan. |
| | |

| | Davis Paddock |
| | Chartered Financial Analyst, Portfolio Manager, is manager of Invesco Small Cap Equity Fund. He joined Invesco in 2001. Mr. |
| Paddock earned a BA and an MBA from The University of Texas at Austin. |
5 Invesco Small Cap Equity Fund
Your Fund’s Long-Term Performance
Results of a $10,000 Investment – Oldest Share Class(es)
Fund and index data from 12/31/06
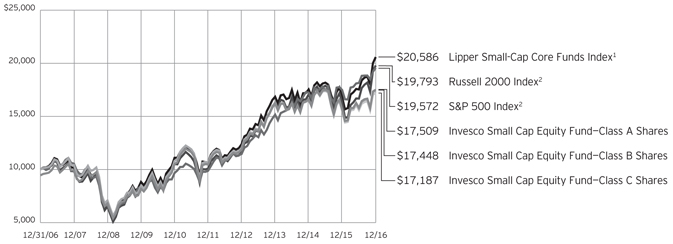
1 Source: Lipper Inc.
2 Source: FactSet Research Systems Inc.
Past performance cannot guarantee comparable future results.
The data shown in the chart include reinvested distributions, applicable sales charges and Fund expenses including management fees. Results for Class B shares are calculated as if a hypothetical
shareholder had liquidated his entire investment in the Fund at the close of the reporting period and paid the contingent deferred sales charges, if applicable. Index results include reinvested dividends, but they do not reflect sales charges. Performance of the peer group,
if applicable, reflects fund expenses and management fees; performance of a market index does not. Performance shown in the chart and table(s) does not reflect deduction of taxes a shareholder would pay on Fund distributions or sale of Fund shares.
6 Invesco Small Cap Equity Fund
| | | | | |
| Average Annual Total Returns |
| As of 12/31/16, including maximum applicable sales charges | |
| |
| Class A Shares | | | | | |
| Inception (8/31/00) | | | | 6.67 | % |
| 10 Years | | | | 5.76 | |
| 5 Years | | | | 9.57 | |
| 1 Year | | | | 5.59 | |
| |
| Class B Shares | | | | | |
| Inception (8/31/00) | | | | 6.67 | % |
| 10 Years | | | | 5.72 | |
| 5 Years | | | | 9.72 | |
| 1 Year | | | | 5.89 | |
| |
| Class C Shares | | | | | |
| Inception (8/31/00) | | | | 6.26 | % |
| 10 Years | | | | 5.56 | |
| 5 Years | | | | 9.98 | |
| 1 Year | | | | 9.90 | |
| |
| Class R Shares | | | | | |
| Inception (6/3/02) | | | | 7.24 | % |
| 10 Years | | | | 6.10 | |
| 5 Years | | | | 10.56 | |
| 1 Year | | | | 11.46 | |
| |
| Class Y Shares | | | | | |
| 10 Years | | | | 6.59 | % |
| 5 Years | | | | 11.10 | |
| 1 Year | | | | 12.02 | |
| |
| Class R5 Shares | | | | | |
| Inception (4/29/05) | | | | 8.81 | % |
| 10 Years | | | | 6.87 | |
| 5 Years | | | | 11.29 | |
| 1 Year | | | | 12.22 | |
| |
| Class R6 Shares | | | | | |
| 10 Years | | | | 6.58 | % |
| 5 Years | | | | 11.29 | |
| 1 Year | | | | 12.31 | |
Class Y shares incepted on October 3, 2008. Performance shown prior to that date is that of Class A shares and includes the 12b-1 fees applicable to Class A shares.
Class R6 shares incepted on September 24, 2012. Performance shown prior to that date is that of Class A shares and includes the 12b-1 fees applicable to Class A shares.
The performance data quoted represent past performance and cannot guarantee comparable future results; current performance may be lower or higher. Please visit invesco.com/performance for the most recent month-end performance. Performance figures reflect reinvested distributions, changes in net asset value and the effect of
the maximum sales charge unless otherwise stated. Investment return and principal value will fluctuate so that you may have a gain or loss when you sell shares.
The total annual Fund operating expense ratio set forth in the most recent Fund prospectus as of the date of this report for Class A, Class B, Class C, Class R, Class Y, Class R5 and Class R6 shares was 1.29%, 2.04%, 2.04%, 1.54%, 1.04%, 0.88% and 0.79%, respectively. The expense ratios presented above may vary from the expense ratios presented in other sections of this report that are based on expenses incurred during the period covered by this report.
Class A share performance reflects the maximum 5.50% sales charge, and Class B and Class C share performance reflects the applicable contingent deferred sales charge (CDSC) for the period involved. The CDSC on Class B shares declines from 5% beginning at the time of purchase to 0% at the beginning of the seventh year. The CDSC on Class C shares is 1% for the first year after purchase. Class R, Class Y, Class R5 and Class R6 shares do not have a front-end sales charge or a CDSC; therefore, performance is at net asset value.
The performance of the Fund’s share classes will differ primarily due to different sales charge structures and class expenses.
Fund performance reflects any applicable fee waivers and/or expense reimbursements. Had the adviser not waived fees and/or reimbursed expenses currently or in the past, returns would have been lower. See current prospectus for more information.
7 Invesco Small Cap Equity Fund
Invesco Small Cap Equity Fund’s investment objective is long-term growth of capital.
| ∎ | | Unless otherwise stated, information presented in this report is as of December 31, 2016, and is based on total net assets. |
| ∎ | | Unless otherwise noted, all data provided by Invesco. |
| ∎ | | To access your Fund’s reports/prospectus, visit invesco.com/fundreports. |
About share classes
| ∎ | | Class B shares may not be purchased for new or additional investments. Please see the prospectus for more information. |
| ∎ | | Class R shares are generally available only to employer sponsored retirement and benefit plans. Please see the prospectus for more information. |
| ∎ | | Class Y shares are available only to certain investors. Please see the prospectus for more information. |
| ∎ | | Class R5 shares and Class R6 shares are primarily intended for employer sponsored retirement and benefit plans that meet certain standards and for institutional investors. Please see the prospectus for more information. |
Principal risks of investing in the Fund
| ∎ | | Foreign securities risk. The Fund’s foreign investments may be adversely affected by political and social instability, changes in economic or taxation policies, difficulty in enforcing obligations, decreased liquidity or increased volatility. Foreign investments also involve the risk of the possible seizure, nationalization or expropriation of the issuer or foreign deposits (in which the Fund could lose its entire investments in a certain market) and the possible adoption of foreign governmental restrictions such as exchange controls. Unless the Fund has hedged its foreign securities risk, foreign securities risk also involves the risk of negative foreign currency rate fluctuations, which may cause the value of securities denominated in such foreign currency (or other instruments through which the Fund has exposure to foreign currencies) to decline in value. Currency exchange rates may fluctuate significantly over short periods of time. Currency hedging strategies, if used, are not always successful. |
| ∎ | | Management risk. The Fund is actively managed and depends heavily on the Adviser’s judgment about markets, interest rates or the attractiveness, relative |
| | | values, liquidity, or potential appreciation of particular investments made for the Fund’s portfolio. The Fund could experience losses if these judgments prove to be incorrect. Additionally, legislative, regulatory, or tax developments may adversely affect management of the Fund and, therefore, the ability of the Fund to achieve its investment objective. |
| ∎ | | Market risk. The market values of the Fund’s investments, and therefore the value of the Fund’s shares, will go up and down, sometimes rapidly or unpredictably. Market risk may affect a single issuer, industry or section of the economy, or it may affect the market as a whole. Individual stock prices tend to go up and down more dramatically than those of certain other types of investments, such as bonds. During a general downturn in the financial markets, multiple asset classes may decline in value. When markets perform well, there can be no assurance that specific investments held by the Fund will rise in value. |
| ∎ | | Small- and mid-capitalization companies risks. Small- and mid-capitalization companies tend to be more vulnerable to changing market conditions, may have little or no operating history or track record of success, and may have more limited product lines and markets, less experienced management and fewer financial resources than larger companies. These companies’ securities may be more volatile and less liquid than those of more established companies, and their returns may vary, sometimes significantly, from the overall securities market. |
About indexes used in this report
| ∎ | | The S&P 500® Index is an unmanaged index considered representative of the US stock market. |
| ∎ | | The Russell 2000® Index is an unmanaged index considered representative of small-cap stocks. The Russell 2000 Index is a trademark/service mark of the Frank Russell Co. Russell® is a trademark of the Frank Russell Co. |
| ∎ | | The Lipper Small-Cap Core Funds Index is an unmanaged index considered representative of small-cap core funds tracked by Lipper. |
| ∎ | | The Fund is not managed to track the performance of any particular index, including the index(es) described here, and consequently, the performance of the Fund may deviate significantly from the performance of the index(es). |
| ∎ | | A direct investment cannot be made in an index. Unless otherwise indicated, index results include reinvested dividends, and they do not reflect sales charges. Performance of the peer group, if applicable, reflects fund expenses; performance of a market index does not. |
Other information
| ∎ | | The returns shown in management’s discussion of Fund performance are based on net asset values (NAVs) calculated for shareholder transactions. Generally accepted accounting principles require adjustments to be made to the net assets of the Fund at period end for financial reporting purposes, and as such, the NAVs for shareholder transactions and the returns based on those NAVs may differ from the NAVs and returns reported in the Financial Highlights. |
| ∎ | | Industry classifications used in this report are generally according to the Global Industry Classification Standard, which was developed by and is the exclusive property and a service mark of MSCI Inc. and Standard & Poor’s. |
| | |
This report must be accompanied or preceded by a currently effective Fund prospectus, which contains more complete information, including sales charges and expenses. Investors should read it carefully before investing. | | |
| | | |
NOT FDIC INSURED | MAY LOSE VALUE | NO BANK GUARANTEE
8 Invesco Small Cap Equity Fund
Schedule of Investments(a)
December 31, 2016
| | | | | | | | |
| | | Shares | | | Value | |
Common Stocks & Other Equity Interests–98.89% | |
| Aerospace & Defense–1.91% | |
BWX Technologies, Inc. | | | 326,601 | | | $ | 12,966,060 | |
Orbital ATK, Inc. | | | 129,346 | | | | 11,347,524 | |
| | | | | 24,313,584 | |
|
| Air Freight & Logistics–0.94% | |
Forward Air Corp. | | | 252,690 | | | | 11,972,452 | |
|
| Alternative Carriers–1.09% | |
Iridium Communications Inc.(b)(c) | | | 1,453,268 | | | | 13,951,373 | |
|
| Apparel Retail–0.85% | |
American Eagle Outfitters, Inc.(b) | | | 711,437 | | | | 10,792,499 | |
|
| Apparel, Accessories & Luxury Goods–0.92% | |
Columbia Sportswear Co. | | | 200,168 | | | | 11,669,794 | |
|
| Application Software–3.58% | |
Blackbaud, Inc. | | | 214,373 | | | | 13,719,872 | |
MicroStrategy Inc.–Class A(c) | | | 68,588 | | | | 13,539,271 | |
SS&C Technologies Holdings, Inc. | | | 362,505 | | | | 10,367,643 | |
Verint Systems Inc.(c) | | | 228,500 | | | | 8,054,625 | |
| | | | | | | | 45,681,411 | |
|
| Auto Parts & Equipment–1.05% | |
Visteon Corp. | | | 166,899 | | | | 13,408,666 | |
|
| Biotechnology–1.38% | |
Neurocrine Biosciences, Inc.(c) | | | 260,649 | | | | 10,087,116 | |
Retrophin, Inc.(c) | | | 398,673 | | | | 7,546,880 | |
| | | | | | | | 17,633,996 | |
|
| Building Products–2.12% | |
Apogee Enterprises, Inc. | | | 269,787 | | | | 14,449,792 | |
Trex Co., Inc.(c) | | | 195,852 | | | | 12,612,869 | |
| | | | | | | | 27,062,661 | |
|
| Casinos & Gaming–1.10% | |
Boyd Gaming Corp.(c) | | | 696,142 | | | | 14,041,184 | |
|
| Construction & Engineering–1.63% | |
Dycom Industries, Inc.(c) | | | 132,085 | | | | 10,605,104 | |
Primoris Services Corp. | | | 448,901 | | | | 10,225,965 | |
| | | | | | | | 20,831,069 | |
|
| Construction Materials–1.21% | |
Eagle Materials Inc. | | | 156,643 | | | | 15,434,035 | |
|
| Data Processing & Outsourced Services–2.84% | |
Euronet Worldwide, Inc.(c) | | | 149,793 | | | | 10,849,507 | |
Genpact Ltd.(c) | | | 436,209 | | | | 10,617,327 | |
Jack Henry & Associates, Inc. | | | 166,135 | | | | 14,749,465 | |
| | | | | | | | 36,216,299 | |
|
| Diversified Support Services–0.80% | |
Mobile Mini, Inc. | | | 338,800 | | | | 10,248,700 | |
| | | | | | | | |
| | | Shares | | | Value | |
| Electrical Components & Equipment–2.15% | |
EnerSys | | | 180,649 | | | $ | 14,108,687 | |
Generac Holdings, Inc.(c) | | | 327,652 | | | | 13,348,542 | |
| | | | | | | | 27,457,229 | |
|
| Electronic Components–0.99% | |
Belden Inc. | | | 168,323 | | | | 12,585,511 | |
|
| Electronic Equipment & Instruments–3.78% | |
Coherent, Inc.(c) | | | 134,221 | | | | 18,439,952 | |
FLIR Systems, Inc. | | | 363,521 | | | | 13,155,825 | |
Zebra Technologies Corp.–Class A(c) | | | 194,207 | | | | 16,655,192 | |
| | | | | | | | 48,250,969 | |
|
| Environmental & Facilities Services–3.02% | |
ABM Industries Inc. | | | 330,859 | | | | 13,512,282 | |
Team, Inc.(c) | | | 276,050 | | | | 10,834,962 | |
Waste Connections, Inc. (Canada) | | | 179,671 | | | | 14,120,344 | |
| | | | | | | | 38,467,588 | |
|
| Gas Utilities–1.31% | |
UGI Corp. | | | 361,232 | | | | 16,645,571 | |
|
| Health Care Equipment–4.21% | |
Analogic Corp. | | | 160,910 | | | | 13,347,484 | |
Hill-Rom Holdings, Inc. | | | 289,149 | | | | 16,232,825 | |
Nevro Corp.(c) | | | 144,522 | | | | 10,500,969 | |
Wright Medical Group N.V.(c) | | | 589,775 | | | | 13,553,029 | |
| | | | | | | | 53,634,307 | |
|
| Health Care Facilities–0.58% | |
Acadia Healthcare Co., Inc.(c) | | | 222,587 | | | | 7,367,630 | |
|
| Health Care REIT’s–0.89% | |
Healthcare Trust of America, Inc.–Class A | | | 390,533 | | | | 11,368,416 | |
|
| Health Care Technology–0.85% | |
HMS Holdings Corp.(c) | | | 593,387 | | | | 10,775,908 | |
|
| Home Entertainment Software–1.45% | |
Take-Two Interactive Software, Inc.(c) | | | 375,194 | | | | 18,493,312 | |
|
| Home Furnishings–1.10% | |
La-Z-Boy Inc. | | | 451,248 | | | | 14,011,250 | |
|
| Homebuilding–0.61% | |
Beazer Homes USA, Inc.(c) | | | 588,728 | | | | 7,830,082 | |
|
| Household Appliances–0.90% | |
Helen of Troy Ltd.(c) | | | 135,901 | | | | 11,476,840 | |
|
| Industrial Machinery–3.62% | |
Albany International Corp.–Class A | | | 354,216 | | | | 16,400,201 | |
SPX Corp.(c) | | | 721,284 | | | | 17,108,856 | |
Watts Water Technologies, Inc.–Class A | | | 193,688 | | | | 12,628,458 | |
| | | | | | | | 46,137,515 | |
See accompanying Notes to Financial Statements which are an integral part of the financial statements.
9 Invesco Small Cap Equity Fund
| | | | | | | | |
| | | Shares | | | Value | |
| Investment Banking & Brokerage–1.74% | |
E*TRADE Financial Corp.(c) | | | 639,403 | | | $ | 22,155,314 | |
|
| IT Consulting & Other Services–0.70% | |
Luxoft Holding, Inc.(c) | | | 158,151 | | | | 8,888,086 | |
|
| Life & Health Insurance–1.07% | |
CNO Financial Group, Inc. | | | 713,603 | | | | 13,665,498 | |
|
| Life Sciences Tools & Services–1.90% | |
Bio-Techne Corp. | | | 117,753 | | | | 12,108,541 | |
Cambrex Corp.(c) | | | 224,415 | | | | 12,107,189 | |
| | | | | | | | 24,215,730 | |
|
| Managed Health Care–0.00% | |
HealthEquity, Inc.(c) | | | 46 | | | | 1,864 | |
|
| Multi-Line Insurance–1.88% | |
American Financial Group, Inc. | | | 177,234 | | | | 15,617,860 | |
Horace Mann Educators Corp. | | | 196,375 | | | | 8,404,850 | |
| | | | | | | | 24,022,710 | |
|
| Office Services & Supplies–0.64% | |
Pitney Bowes Inc. | | | 532,666 | | | | 8,091,197 | |
|
| Oil & Gas Equipment & Services–1.97% | |
Forum Energy Technologies Inc.(c) | | | 630,092 | | | | 13,862,024 | |
Superior Energy Services, Inc. | | | 667,809 | | | | 11,272,616 | |
| | | | | | | | 25,134,640 | |
|
| Oil & Gas Exploration & Production–4.59% | |
Energen Corp.(c) | | | 259,105 | | | | 14,942,585 | |
Newfield Exploration Co.(c) | | | 331,722 | | | | 13,434,741 | |
Parsley Energy, Inc.–Class A(c) | | | 355,044 | | | | 12,511,751 | |
RSP Permian Inc.(c) | | | 393,781 | | | | 17,570,508 | |
| | | | | | | | 58,459,585 | |
|
| Packaged Foods & Meats–2.18% | |
Pinnacle Foods Inc. | | | 354,585 | | | | 18,952,568 | |
TreeHouse Foods, Inc.(c) | | | 122,835 | | | | 8,867,459 | |
| | | | | | | | 27,820,027 | |
|
| Paper Packaging–1.40% | |
Graphic Packaging Holding Co. | | | 1,434,657 | | | | 17,904,519 | |
|
| Pharmaceuticals–2.14% | |
Impax Laboratories, Inc.(c) | | | 327,507 | | | | 4,339,468 | |
Phibro Animal Health Corp.–Class A | | | 347,642 | | | | 10,185,911 | |
Supernus Pharmaceuticals Inc.(c) | | | 506,781 | | | | 12,796,220 | |
| | | | | | | | 27,321,599 | |
|
| Property & Casualty Insurance–1.14% | |
Hanover Insurance Group Inc. (The) | | | 159,800 | | | | 14,543,398 | |
|
| Real Estate Operating Companies–0.81% | |
Kennedy-Wilson Holdings Inc. | | | 506,315 | | | | 10,379,458 | |
|
| Regional Banks–10.02% | |
Bank of the Ozarks, Inc. | | | 303,638 | | | | 15,968,322 | |
BankUnited, Inc. | | | 348,848 | | | | 13,148,081 | |
| | | | | | | | |
| | | Shares | | | Value | |
| Regional Banks–(continued) | |
Great Western Bancorp, Inc. | | | 399,983 | | | $ | 17,435,259 | |
IBERIABANK Corp. | | | 190,930 | | | | 15,990,387 | |
Pinnacle Financial Partners, Inc. | | | 221,140 | | | | 15,325,002 | |
Synovus Financial Corp. | | | 391,258 | | | | 16,072,879 | |
Webster Financial Corp. | | | 324,467 | | | | 17,612,069 | |
Western Alliance Bancorp(c) | | | 331,707 | | | | 16,157,448 | |
| | | | | | | | 127,709,447 | |
|
| Restaurants–2.03% | |
Panera Bread Co.–Class A(c) | | | 56,606 | | | | 11,609,324 | |
Papa John’s International, Inc. | | | 167,060 | | | | 14,296,995 | |
| | | | | 25,906,319 | |
|
| Semiconductor Equipment–2.35% | |
Entegris Inc.(c) | | | 886,885 | | | | 15,875,241 | |
Tessera Holding Corp. | | | 318,133 | | | | 14,061,479 | |
| | | | | | | | 29,936,720 | |
|
| Semiconductors–4.06% | |
Cirrus Logic, Inc.(c) | | | 160,282 | | | | 9,062,344 | |
MACOM Technology Solutions Holdings, Inc.(c) | | | 343,847 | | | | 15,913,239 | |
Microsemi Corp.(c) | | | 368,244 | | | | 19,874,129 | |
Power Integrations, Inc. | | | 100,848 | | | | 6,842,537 | |
| | | | | | | | 51,692,249 | |
|
| Specialized Consumer Services–1.02% | |
ServiceMaster Global Holdings, Inc.(c) | | | 344,821 | | | | 12,989,407 | |
|
| Specialized REIT’s–1.06% | |
CubeSmart | | | 505,926 | | | | 13,543,639 | |
|
| Specialty Chemicals–3.39% | |
Minerals Technologies Inc. | | | 191,497 | | | | 14,793,143 | |
PolyOne Corp. | | | 348,775 | | | | 11,174,751 | |
Sensient Technologies Corp. | | | 219,263 | | | | 17,229,687 | |
| | | | | | | | 43,197,581 | |
|
| Specialty Stores–1.69% | |
Michaels Cos., Inc. (The)(c) | | | 568,040 | | | | 11,616,418 | |
Sally Beauty Holdings, Inc.(c) | | | 377,324 | | | | 9,968,900 | |
| | | | | | | | 21,585,318 | |
|
| Technology Distributors–0.98% | |
Tech Data Corp.(c) | | | 147,084 | | | | 12,455,073 | |
|
| Technology Hardware, Storage & Peripherals–0.48% | |
Cray, Inc.(c) | | | 293,198 | | | | 6,069,199 | |
|
| Trucking–2.77% | |
Celadon Group, Inc. | | | 535,203 | | | | 3,826,701 | |
Old Dominion Freight Line, Inc.(c) | | | 224,435 | | | | 19,254,279 | |
Swift Transportation Co.(c) | | | 503,586 | | | | 12,267,355 | |
| | | | | 35,348,335 | |
Total Common Stocks & Other Equity Interests
(Cost $1,028,685,583) | | | | 1,260,796,763 | |
See accompanying Notes to Financial Statements which are an integral part of the financial statements.
10 Invesco Small Cap Equity Fund
| | | | | | | | |
| | | Shares | | | Value | |
Money Market Funds–1.49% | |
Government & Agency Portfolio–Institutional Class, 0.43%(d) | | | 11,415,047 | | | $ | 11,415,047 | |
Treasury Portfolio–Institutional Class, 0.37%(d) | | | 7,610,032 | | | | 7,610,032 | |
Total Money Market Funds
(Cost $19,025,079) | | | | 19,025,079 | |
TOTAL INVESTMENTS (excluding investments purchased with cash collateral from securities on loan)–100.38%
(Cost $1,047,710,662) | | | | 1,279,821,842 | |
| |
Investments Purchased with Cash Collateral from Securities on Loan | | | | | |
Money Market Fund–1.02% | |
Government & Agency Portfolio–Institutional Class, 0.43%
(Cost $13,011,195)(d)(e) | | | 13,011,195 | | | | 13,011,195 | |
TOTAL INVESTMENTS–101.40%
(Cost $1,060,721,857) | | | | 1,292,833,037 | |
OTHER ASSETS LESS LIABILITIES–(1.40)% | | | | (17,886,404 | ) |
NET ASSETS–100.00% | | | $ | 1,274,946,633 | |
Investment Abbreviations:
| | |
| REIT | | – Real Estate Investment Trust |
Notes to Schedule of Investments:
| (a) | Industry and/or sector classifications used in this report are generally according to the Global Industry Classification Standard, which was developed by and is the exclusive property and a service mark of MSCI Inc. and Standard & Poor’s. |
| (b) | All or a portion of this security was out on loan at December 31, 2016. |
| (c) | Non-income producing security. |
| (d) | The money market fund and the Fund are affiliated by having the same investment adviser. The rate shown is the 7-day SEC standardized yield as of December 31, 2016. |
| (e) | The security has been segregated to satisfy the commitment to return the cash collateral received in securities lending transactions upon the borrower’s return of the securities loaned. See Note 1I. |
See accompanying Notes to Financial Statements which are an integral part of the financial statements.
11 Invesco Small Cap Equity Fund
Statement of Assets and Liabilities
December 31, 2016
| | | | |
Assets: | |
Investments, at value (Cost $1,028,685,583)* | | $ | 1,260,796,763 | |
Investments in affiliated money market funds, at value and cost | | | 32,036,274 | |
Total investments, at value (Cost $1,060,721,857) | | | 1,292,833,037 | |
Receivable for: | | | | |
Fund shares sold | | | 3,000,698 | |
Dividends | | | 903,074 | |
Investment for trustee deferred compensation and retirement plans | | | 183,040 | |
Other assets | | | 71,783 | |
Total assets | | | 1,296,991,632 | |
|
Liabilities: | |
Payable for: | | | | |
Investments purchased | | | 2,054,585 | |
Fund shares reacquired | | | 5,982,365 | |
Collateral upon return of securities loaned | | | 13,011,195 | |
Accrued fees to affiliates | | | 758,307 | |
Accrued trustees’ and officers’ fees and benefits | | | 705 | |
Accrued other operating expenses | | | 31,894 | |
Trustee deferred compensation and retirement plans | | | 205,948 | |
Total liabilities | | | 22,044,999 | |
Net assets applicable to shares outstanding | | $ | 1,274,946,633 | |
|
Net assets consist of: | |
Shares of beneficial interest | | $ | 1,036,891,660 | |
Undistributed net investment income (loss) | | | (203,916 | ) |
Undistributed net realized gain | | | 6,147,709 | |
Net unrealized appreciation | | | 232,111,180 | |
| | | $ | 1,274,946,633 | |
| | | | |
Net Assets: | |
Class A | | $ | 557,205,384 | |
Class B | | $ | 2,985,857 | |
Class C | | $ | 56,845,175 | |
Class R | | $ | 74,226,835 | |
Class Y | | $ | 409,479,383 | |
Class R5 | | $ | 111,620,773 | |
Class R6 | | $ | 62,583,226 | |
|
Shares outstanding, no par value,
with an unlimited number of shares authorized: | |
Class A | | | 39,108,201 | |
Class B | | | 255,285 | |
Class C | | | 4,862,257 | |
Class R | | | 5,507,004 | |
Class Y | | | 27,932,170 | |
Class R5 | | | 7,184,617 | |
Class R6 | | | 4,008,751 | |
Class A: | | | | |
Net asset value per share | | $ | 14.25 | |
Maximum offering price per share | | | | |
(Net asset value of $14.25 ¸ 94.50%) | | $ | 15.08 | |
Class B: | | | | |
Net asset value and offering price per share | | $ | 11.70 | |
Class C: | | | | |
Net asset value and offering price per share | | $ | 11.69 | |
Class R: | | | | |
Net asset value and offering price per share | | $ | 13.48 | |
Class Y: | | | | |
Net asset value and offering price per share | | $ | 14.66 | |
Class R5: | | | | |
Net asset value and offering price per share | | $ | 15.54 | |
Class R6: | | | | |
Net asset value and offering price per share | | $ | 15.61 | |
| * | At December 31, 2016, securities with an aggregate value of $12,694,752 were on loan to brokers. |
See accompanying Notes to Financial Statements which are an integral part of the financial statements.
12 Invesco Small Cap Equity Fund
Statement of Operations
For the year ended December 31, 2016
| | | | |
Investment income: | |
Dividends (net of foreign withholding taxes of $9,175) | | $ | 14,144,241 | |
Dividends from affiliated money market funds (includes securities lending income of $311,189) | | | 413,083 | |
Total investment income | | | 14,557,324 | |
| |
Expenses: | | | | |
Advisory fees | | | 9,312,197 | |
Administrative services fees | | | 327,347 | |
Custodian fees | | | 31,716 | |
Distribution fees: | | | | |
Class A | | | 1,340,501 | |
Class B | | | 38,678 | |
Class C | | | 567,591 | |
Class R | | | 375,793 | |
Transfer agent fees — A, B, C, R and Y | | | 2,985,592 | |
Transfer agent fees — R5 | | | 123,227 | |
Transfer agent fees — R6 | | | 6,393 | |
Trustees’ and officers’ fees and benefits | | | 39,456 | |
Registration and filing fees | | | 141,612 | |
Reports to shareholders | | | 176,405 | |
Professional services fees | | | 53,399 | |
Other | | | 35,804 | |
Total expenses | | | 15,555,711 | |
Less: Fees waived and expense offset arrangement(s) | | | (47,284 | ) |
Net expenses | | | 15,508,427 | |
Net investment income (loss) | | | (951,103 | ) |
| |
Realized and unrealized gain from: | | | | |
Net realized gain from investment securities (includes net gains (losses) from securities sold to affiliates of $(22,607)) | | | 64,829,058 | |
Change in net unrealized appreciation of investment securities | | | 78,984,471 | |
Net realized and unrealized gain | | | 143,813,529 | |
Net increase in net assets resulting from operations | | $ | 142,862,426 | |
See accompanying Notes to Financial Statements which are an integral part of the financial statements.
13 Invesco Small Cap Equity Fund
Statement of Changes in Net Assets
For the years ended December 31, 2016 and 2015
| | | | | | | | |
| | | 2016 | | | 2015 | |
Operations: | | | | | |
Net investment income (loss) | | $ | (951,103 | ) | | $ | (1,806,652 | ) |
Net realized gain | | | 64,829,058 | | | | 59,467,702 | |
Change in net unrealized appreciation (depreciation) | | | 78,984,471 | | | | (134,751,952 | ) |
Net increase (decrease) in net assets resulting from operations | | | 142,862,426 | | | | (77,090,902 | ) |
| | |
Distributions to shareholders from net realized gains: | | | | | | | | |
Class A | | | (28,488,697 | ) | | | (33,001,895 | ) |
Class B | | | (196,666 | ) | | | (380,302 | ) |
Class C | | | (3,525,695 | ) | | | (4,273,991 | ) |
Class R | | | (4,038,957 | ) | | | (5,266,102 | ) |
Class Y | | | (20,836,295 | ) | | | (23,115,899 | ) |
Class R5 | | | (5,674,407 | ) | | | (8,802,315 | ) |
Class R6 | | | (2,748,507 | ) | | | (5,255,319 | ) |
Total distributions from net realized gains | | | (65,509,224 | ) | | | (80,095,823 | ) |
| | |
Share transactions–net: | | | | | | | | |
Class A | | | (17,490,273 | ) | | | 47,404,074 | |
Class B | | | (2,320,175 | ) | | | (2,729,034 | ) |
Class C | | | (4,949,775 | ) | | | 3,517,798 | |
Class R | | | (11,714,388 | ) | | | (7,055,210 | ) |
Class Y | | | (5,077,163 | ) | | | 77,407,083 | |
Class R5 | | | (49,455,127 | ) | | | 1,074,305 | |
Class R6 | | | (33,057,740 | ) | | | (12,209,238 | ) |
Net increase (decrease) in net assets resulting from share transactions | | | (124,064,641 | ) | | | 107,409,778 | |
Net increase (decrease) in net assets | | | (46,711,439 | ) | | | (49,776,947 | ) |
| | |
Net assets: | | | | | | | | |
Beginning of year | | | 1,321,658,072 | | | | 1,371,435,019 | |
End of year (includes undistributed net investment income (loss) of $(203,916) and $(210,744), respectively) | | $ | 1,274,946,633 | | | $ | 1,321,658,072 | |
Notes to Financial Statements
December 31, 2016
NOTE 1—Significant Accounting Policies
Invesco Small Cap Equity Fund (the “Fund”) is a series portfolio of AIM Funds Group (Invesco Funds Group) (the “Trust”). The Trust is a Delaware statutory trust registered under the Investment Company Act of 1940, as amended (the “1940 Act”), as an open-end series management investment company consisting of four separate portfolios, each authorized to issue an unlimited number of shares of beneficial interest. The assets, liabilities and operations of each portfolio are accounted for separately. Information presented in these financial statements pertains only to the Fund. Matters affecting each portfolio or class will be voted on exclusively by the shareholders of such portfolio or class.
The Fund’s primary investment objective is long-term growth of capital.
The Fund currently consists of seven different classes of shares: Class A, Class B, Class C, Class R, Class Y, Class R5 and Class R6. Class Y shares are available only to certain investors. Class A shares are sold with a front-end sales charge unless certain waiver criteria are met and under certain circumstances load waived shares may be subject to contingent deferred sales charges (“CDSC”). Class C shares are sold with a CDSC. Class R, Class Y, Class R5 and Class R6 shares are sold at net asset value. Effective November 30, 2010, new or additional investments in Class B shares are no longer permitted. Existing shareholders of Class B shares may continue to reinvest dividends and capital gains distributions in Class B shares until they convert to Class A shares. Also, shareholders in Class B shares will be able to exchange those shares for Class B shares of other Invesco Funds offering such shares until they convert to Class A shares. Generally, Class B shares will automatically convert to Class A shares on or about the month-end, which is at least eight years after the date of purchase. Redemption of Class B shares prior to the conversion date will be subject to a CDSC.
The Fund is an investment company and accordingly follows the investment company accounting and reporting guidance in accordance with Financial Accounting Standards Board Accounting Standards Codification Topic 946, Financial Services — Investment Companies.
The following is a summary of the significant accounting policies followed by the Fund in the preparation of its financial statements.
| A. | Security Valuations — Securities, including restricted securities, are valued according to the following policy. |
A security listed or traded on an exchange (except convertible securities) is valued at its last sales price or official closing price as of the close of the customary trading session on the exchange where the security is principally traded, or lacking any sales or official closing price on a
14 Invesco Small Cap Equity Fund
particular day, the security may be valued at the closing bid price on that day. Securities traded in the over-the-counter market are valued based on prices furnished by independent pricing services or market makers. When such securities are valued by an independent pricing service they may be considered fair valued. Futures contracts are valued at the final settlement price set by an exchange on which they are principally traded. Listed options are valued at the mean between the last bid and asked prices from the exchange on which they are principally traded. Options not listed on an exchange are valued by an independent source at the mean between the last bid and asked prices. For purposes of determining net asset value (“NAV”) per share, futures and option contracts generally are valued 15 minutes after the close of the customary trading session of the New York Stock Exchange (“NYSE”).
Investments in open-end and closed-end registered investment companies that do not trade on an exchange are valued at the end-of-day net asset value per share. Investments in open-end and closed-end registered investment companies that trade on an exchange are valued at the last sales price or official closing price as of the close of the customary trading session on the exchange where the security is principally traded.
Debt obligations (including convertible securities) and unlisted equities are fair valued using an evaluated quote provided by an independent pricing service. Evaluated quotes provided by the pricing service may be determined without exclusive reliance on quoted prices, and may reflect appropriate factors such as institution-size trading in similar groups of securities, developments related to specific securities, dividend rate (for unlisted equities), yield (for debt obligations), quality, type of issue, coupon rate (for debt obligations), maturity (for debt obligations), individual trading characteristics and other market data. Debt obligations are subject to interest rate and credit risks. In addition, all debt obligations involve some risk of default with respect to interest and/or principal payments.
Foreign securities’ (including foreign exchange contracts) prices are converted into U.S. dollar amounts using the applicable exchange rates as of the close of the NYSE. If market quotations are available and reliable for foreign exchange-traded equity securities, the securities will be valued at the market quotations. Because trading hours for certain foreign securities end before the close of the NYSE, closing market quotations may become unreliable. If between the time trading ends on a particular security and the close of the customary trading session on the NYSE, events occur that the Adviser determines are significant and make the closing price unreliable, the Fund may fair value the security. If the event is likely to have affected the closing price of the security, the security will be valued at fair value in good faith using procedures approved by the Board of Trustees. Adjustments to closing prices to reflect fair value may also be based on a screening process of an independent pricing service to indicate the degree of certainty, based on historical data, that the closing price in the principal market where a foreign security trades is not the current value as of the close of the NYSE. Foreign securities’ prices meeting the approved degree of certainty that the price is not reflective of current value will be priced at the indication of fair value from the independent pricing service. Multiple factors may be considered by the independent pricing service in determining adjustments to reflect fair value and may include information relating to sector indices, American Depositary Receipts and domestic and foreign index futures. Foreign securities may have additional risks including exchange rate changes, potential for sharply devalued currencies and high inflation, political and economic upheaval, the relative lack of issuer information, relatively low market liquidity and the potential lack of strict financial and accounting controls and standards.
Securities for which market prices are not provided by any of the above methods may be valued based upon quotes furnished by independent sources. The last bid price may be used to value equity securities. The mean between the last bid and asked prices is used to value debt obligations, including corporate loans.
Securities for which market quotations are not readily available or became unreliable are valued at fair value as determined in good faith by or under the supervision of the Trust’s officers following procedures approved by the Board of Trustees. Issuer specific events, market trends, bid/asked quotes of brokers and information providers and other market data may be reviewed in the course of making a good faith determination of a security’s fair value.
The Fund may invest in securities that are subject to interest rate risk, meaning the risk that the prices will generally fall as interest rates rise and, conversely, the prices will generally rise as interest rates fall. Specific securities differ in their sensitivity to changes in interest rates depending on their individual characteristics. Changes in interest rates may result in increased market volatility, which may affect the value and/or liquidity of certain Fund investments.
Valuations change in response to many factors including the historical and prospective earnings of the issuer, the value of the issuer’s assets, general economic conditions, interest rates, investor perceptions and market liquidity. Because of the inherent uncertainties of valuation, the values reflected in the financial statements may materially differ from the value received upon actual sale of those investments.
| B. | Securities Transactions and Investment Income — Securities transactions are accounted for on a trade date basis. Realized gains or losses on sales are computed on the basis of specific identification of the securities sold. Interest income (net of withholding tax, if any) is recorded on the accrual basis from settlement date. Dividend income (net of withholding tax, if any) is recorded on the ex-dividend date. |
The Fund may periodically participate in litigation related to Fund investments. As such, the Fund may receive proceeds from litigation settlements. Any proceeds received are included in the Statement of Operations as realized gain (loss) for investments no longer held and as unrealized gain (loss) for investments still held.
Brokerage commissions and mark ups are considered transaction costs and are recorded as an increase to the cost basis of securities purchased and/or a reduction of proceeds on a sale of securities. Such transaction costs are included in the determination of net realized and unrealized gain (loss) from investment securities reported in the Statement of Operations and the Statement of Changes in Net Assets and the net realized and unrealized gains (losses) on securities per share in the Financial Highlights. Transaction costs are included in the calculation of the Fund’s net asset value and, accordingly, they reduce the Fund’s total returns. These transaction costs are not considered operating expenses and are not reflected in net investment income reported in the Statement of Operations and the Statement of Changes in Net Assets, or the net investment income per share and the ratios of expenses and net investment income reported in the Financial Highlights, nor are they limited by any expense limitation arrangements between the Fund and the investment adviser.
The Fund allocates income and realized and unrealized capital gains and losses to a class based on the relative net assets of each class.
| C. | Country Determination — For the purposes of making investment selection decisions and presentation in the Schedule of Investments, the investment adviser may determine the country in which an issuer is located and/or credit risk exposure based on various factors. These factors include the laws of the country under which the issuer is organized, where the issuer maintains a principal office, the country in which the issuer derives 50% or more of its total revenues and the country that has the primary market for the issuer’s securities, as well as other criteria. Among the other criteria that may be evaluated for making this determination are the country in which the issuer maintains 50% or more of its assets, |
15 Invesco Small Cap Equity Fund
| | the type of security, financial guarantees and enhancements, the nature of the collateral and the sponsor organization. Country of issuer and/or credit risk exposure has been determined to be the United States of America, unless otherwise noted. |
| D. | Distributions — Distributions from net investment income and net realized capital gain, if any, are generally declared and paid annually and recorded on the ex-dividend date. The Fund may elect to treat a portion of the proceeds from redemptions as distributions for federal income tax purposes. |
| E. | Federal Income Taxes — The Fund intends to comply with the requirements of Subchapter M of the Internal Revenue Code of 1986, as amended (the “Internal Revenue Code”), necessary to qualify as a regulated investment company and to distribute substantially all of the Fund’s taxable earnings to shareholders. As such, the Fund will not be subject to federal income taxes on otherwise taxable income (including net realized capital gain) that is distributed to shareholders. Therefore, no provision for federal income taxes is recorded in the financial statements. |
The Fund recognizes the tax benefits of uncertain tax positions only when the position is more likely than not to be sustained. Management has analyzed the Fund’s uncertain tax positions and concluded that no liability for unrecognized tax benefits should be recorded related to uncertain tax positions. Management is not aware of any tax positions for which it is reasonably possible that the total amounts of unrecognized tax benefits will change materially in the next 12 months.
The Fund files tax returns in the U.S. Federal jurisdiction and certain other jurisdictions. Generally, the Fund is subject to examinations by such taxing authorities for up to three years after the filing of the return for the tax period.
| F. | Expenses — Fees provided for under the Rule 12b-1 plan of a particular class of the Fund are charged to the operations of such class. Transfer agency fees and expenses and other shareholder recordkeeping fees and expenses attributable to Class R5 and Class R6 are allocated to each share class based on relative net assets. Sub-accounting fees attributable to Class R5 are charged to the operations of the class. Transfer agency fees and expenses and other shareholder recordkeeping fees and expenses relating to all other classes are allocated among those classes based on relative net assets. All other expenses are allocated among the classes based on relative net assets. |
| G. | Accounting Estimates — The preparation of financial statements in conformity with accounting principles generally accepted in the United States of America (“GAAP”) requires management to make estimates and assumptions that affect the reported amounts of assets and liabilities at the date of the financial statements and the reported amounts of revenues and expenses during the reporting period including estimates and assumptions related to taxation. Actual results could differ from those estimates by a significant amount. In addition, the Fund monitors for material events or transactions that may occur or become known after the period-end date and before the date the financial statements are released to print. |
| H. | Indemnifications — Under the Trust’s organizational documents, each Trustee, officer, employee or other agent of the Trust is indemnified against certain liabilities that may arise out of the performance of their duties to the Fund. Additionally, in the normal course of business, the Fund enters into contracts, including the Fund’s servicing agreements, that contain a variety of indemnification clauses. The Fund’s maximum exposure under these arrangements is unknown as this would involve future claims that may be made against the Fund that have not yet occurred. The risk of material loss as a result of such indemnification claims is considered remote. |
| I. | Securities Lending — The Fund may lend portfolio securities having a market value up to one-third of the Fund’s total assets. Such loans are secured by collateral equal to no less than the market value of the loaned securities determined daily by the securities lending provider. Such collateral will be cash or debt securities issued or guaranteed by the U.S. Government or any of its sponsored agencies. Cash collateral received in connection with these loans is invested in short-term money market instruments or affiliated money market funds and is shown as such on the Schedule of Investments. The Fund bears the risk of loss with respect to the investment of collateral. It is the Fund’s policy to obtain additional collateral from or return excess collateral to the borrower by the end of the next business day, following the valuation date of the securities loaned. Therefore, the value of the collateral held may be temporarily less than the value of the securities on loan. When loaning securities, the Fund retains certain benefits of owning the securities, including the economic equivalent of dividends or interest generated by the security. Lending securities entails a risk of loss to the Fund if, and to the extent that, the market value of the securities loaned were to increase and the borrower did not increase the collateral accordingly, and the borrower failed to return the securities. The securities loaned are subject to termination at the option of the borrower or the Fund. Upon termination, the borrower will return to the Fund the securities loaned and the Fund will return the collateral. Upon the failure of the borrower to return the securities, collateral may be liquidated and the securities may be purchased on the open market to replace the loaned securities. The Fund could experience delays and costs in gaining access to the collateral and the securities may lose value during the delay which could result in potential losses to the Fund. Some of these losses may be indemnified by the lending agent. The Fund bears the risk of any deficiency in the amount of the collateral available for return to the borrower due to any loss on the collateral invested. Dividends received on cash collateral investments for securities lending transactions, which are net of compensation to counterparties, are included in Dividends from affiliated money market funds on the Statement of Operations. The aggregate value of securities out on loan, if any, is shown as a footnote on the Statement of Assets and Liabilities. |
NOTE 2—Advisory Fees and Other Fees Paid to Affiliates
The Trust has entered into a master investment advisory agreement with Invesco Advisers, Inc. (the “Adviser” or “Invesco”). Under the terms of the investment advisory agreement, the Fund pays an advisory fee to the Adviser based on the annual rate of the Fund’s average daily net assets as follows:
| | | | | | | | |
| Average Daily Net Assets | | Rate | |
First $250 million | | | 0 | .745% | | | | |
Next $250 million | | | 0 | .73% | | | | |
Next $500 million | | | 0 | .715% | | | | |
Next $1.5 billion | | | 0 | .70% | | | | |
Next $2.5 billion | | | 0 | .685% | | | | |
Next $2.5 billion | | | 0 | .67% | | | | |
Next $2.5 billion | | | 0 | .655% | | | | |
Over $10 billion | | | 0 | .64% | | | | |
16 Invesco Small Cap Equity Fund
For the year ended December 31, 2016, the effective advisory fees incurred by the Fund was 0.72%.
Under the terms of a master sub-advisory agreement between the Adviser and each of Invesco Asset Management Deutschland GmbH, Invesco Asset Management Limited, Invesco Asset Management (Japan) Limited, Invesco Hong Kong Limited, Invesco Senior Secured Management, Inc. and Invesco Canada Ltd. (collectively, the “Affiliated Sub-Advisers”) the Adviser, not the Fund, will pay 40% of the fees paid to the Adviser to any such Affiliated Sub-Adviser(s) that provide(s) discretionary investment management services to the Fund based on the percentage of assets allocated to such Affiliated Sub-Adviser(s).
The Adviser has contractually agreed, through at least June 30, 2017, to waive advisory fees and/or reimburse expenses of all shares to the extent necessary to limit total annual fund operating expenses after fee waiver and/or expense reimbursement (excluding certain items discussed below) of Class A, Class B, Class C, Class R, Class Y, Class R5 and Class R6 shares to 2.00%, 2.75%, 2.75%, 2.25%, 1.75%, 1.75% and 1.75%, respectively, of average daily net assets (the “expense limits”). In determining the Adviser’s obligation to waive advisory fees and/or reimburse expenses, the following expenses are not taken into account, and could cause the total annual fund operating expenses after fee waiver and/or expense reimbursement to exceed the numbers reflected above: (1) interest; (2) taxes; (3) dividend expense on short sales; (4) extraordinary or non-routine items, including litigation expenses; and (5) expenses that the Fund has incurred but did not actually pay because of an expense offset arrangement. Unless Invesco continues the fee waiver agreement, it will terminate on June 30, 2017. During its term, the fee waiver agreement cannot be terminated or amended to increase the expense limits without approval of the Board of Trustees. The Adviser did not waive fees and/or reimburse expenses during the period under these expense limits.
Further, the Adviser has contractually agreed, through at least June 30, 2018, to waive the advisory fee payable by the Fund in an amount equal to 100% of the net advisory fees the Adviser receives from the affiliated money market funds on investments by the Fund of uninvested cash (excluding investments of cash collateral from securities lending) in such affiliated money market funds.
For the year ended December 31, 2016, the Adviser waived advisory fees of $39,584.
The Trust has entered into a master administrative services agreement with Invesco pursuant to which the Fund has agreed to pay Invesco for certain administrative costs incurred in providing accounting services to the Fund. For the year ended December 31, 2016, expenses incurred under the agreement are shown in the Statement of Operations as Administrative services fees.
The Trust has entered into a transfer agency and service agreement with Invesco Investment Services, Inc. (“IIS”) pursuant to which the Fund has agreed to pay IIS a fee for providing transfer agency and shareholder services to the Fund and reimburse IIS for certain expenses incurred by IIS in the course of providing such services. IIS may make payments to intermediaries that provide omnibus account services, sub-accounting services and/or networking services. All fees payable by IIS to intermediaries that provide omnibus account services or sub-accounting are charged back to the Fund, subject to certain limitations approved by the Trust’s Board of Trustees. For the year ended December 31, 2016, expenses incurred under the agreement are shown in the Statement of Operations as Transfer agent fees.
The Trust has entered into master distribution agreements with Invesco Distributors, Inc. (“IDI”) to serve as the distributor for the Class A, Class B, Class C, Class R, Class Y, Class R5 and Class R6 shares of the Fund. The Trust has adopted plans pursuant to Rule 12b-1 under the 1940 Act with respect to the Fund’s Class A, Class B, Class C and Class R shares (collectively, the “Plans”). The Fund, pursuant to the Plans, pays IDI compensation at the annual rate of 0.25% of the Fund’s average daily net assets of Class A shares, 1.00% of the average daily net assets of Class B and Class C shares and 0.50% of the average daily net assets of Class R shares. Of the Plan payments, up to 0.25% of the average daily net assets of each class of shares may be paid to furnish continuing personal shareholder services to customers who purchase and own shares of such classes. Any amounts not paid as a service fee under the Plans would constitute an asset-based sales charge. Rules of the Financial Industry Regulatory Authority (“FINRA”) impose a cap on the total sales charges, including asset-based sales charges, that may be paid by any class of shares of the Fund. For the year ended December 31, 2016, expenses incurred under the Plans are shown in the Statement of Operations as Distribution fees.
Front-end sales commissions and CDSC (collectively, the “sales charges”) are not recorded as expenses of the Fund. Front-end sales commissions are deducted from proceeds from the sales of Fund shares prior to investment in Class A shares of the Fund. CDSC are deducted from redemption proceeds prior to remittance to the shareholder. During the year ended December 31, 2016, IDI advised the Fund that IDI retained $215,354 in front-end sales commissions from the sale of Class A shares and $8,862, $405 and $2,513 from Class A, Class B and Class C shares, respectively, for CDSC imposed on redemptions by shareholders.
For the year ended December 31, 2016, the Fund incurred $5,924 in brokerage commissions with Invesco Capital Markets, Inc., an affiliate of the Adviser and IDI, for portfolio transactions executed on behalf of the Fund.
Certain officers and trustees of the Trust are officers and directors of the Adviser, IIS and/or IDI.
NOTE 3—Additional Valuation Information
GAAP defines fair value as the price that would be received to sell an asset or paid to transfer a liability in an orderly transaction between market participants at the measurement date, under current market conditions. GAAP establishes a hierarchy that prioritizes the inputs to valuation methods, giving the highest priority to readily available unadjusted quoted prices in an active market for identical assets (Level 1) and the lowest priority to significant unobservable inputs (Level 3), generally when market prices are not readily available or are unreliable. Based on the valuation inputs, the securities or other investments are tiered into one of three levels. Changes in valuation methods may result in transfers in or out of an investment’s assigned level:
| | Level 1 — | Prices are determined using quoted prices in an active market for identical assets. |
| | Level 2 — | Prices are determined using other significant observable inputs. Observable inputs are inputs that other market participants may use in pricing a security. These may include quoted prices for similar securities, interest rates, prepayment speeds, credit risk, yield curves, loss severities, default rates, discount rates, volatilities and others. |
| | Level 3 — | Prices are determined using significant unobservable inputs. In situations where quoted prices or observable inputs are unavailable (for example, when there is little or no market activity for an investment at the end of the period), unobservable inputs may be used. Unobservable inputs reflect the Fund’s own assumptions about the factors market participants would use in determining fair value of the securities or instruments and would be based on the best available information. |
17 Invesco Small Cap Equity Fund
As of December 31, 2016, all of the securities in this Fund were valued based on Level 1 inputs (see the Schedule of Investments for security categories). The level assigned to the securities valuations may not be an indication of the risk or liquidity associated with investing in those securities. Because of the inherent uncertainties of valuation, the values reflected in the financial statements may materially differ from the value received upon actual sale of those investments.
NOTE 4—Security Transactions with Affiliated Funds
The Fund is permitted to purchase or sell securities from or to certain other Invesco Funds under specified conditions outlined in procedures adopted by the Board of Trustees of the Trust. The procedures have been designed to ensure that any purchase or sale of securities by the Fund from or to another fund or portfolio that is or could be considered an affiliate by virtue of having a common investment adviser (or affiliated investment advisers), common Trustees and/or common officers complies with Rule 17a-7 of the 1940 Act. Further, as defined under the procedures, each transaction is effected at the current market price. Pursuant to these procedures, for the year ended December 31, 2016, the Fund engaged in securities sales of $6,720,708, which resulted in net realized gains (losses) of $(22,607).
NOTE 5—Expense Offset Arrangement(s)
The expense offset arrangement is comprised of transfer agency credits which result from balances in demand deposit accounts used by the transfer agent for clearing shareholder transactions. For the year ended December 31, 2016, the Fund received credits from this arrangement, which resulted in the reduction of the Fund’s total expenses of $7,700.
NOTE 6—Trustees’ and Officers’ Fees and Benefits
Trustees’ and Officers’ Fees and Benefits include amounts accrued by the Fund to pay remuneration to certain Trustees and Officers of the Fund. Trustees have the option to defer compensation payable by the Fund, and Trustees’ and Officers’ Fees and Benefits also include amounts accrued by the Fund to fund such deferred compensation amounts. Those Trustees who defer compensation have the option to select various Invesco Funds in which their deferral accounts shall be deemed to be invested. Finally, certain current Trustees were eligible to participate in a retirement plan that provided for benefits to be paid upon retirement to Trustees over a period of time based on the number of years of service. The Fund may have certain former Trustees who also participate in a retirement plan and receive benefits under such plan. Trustees’ and Officers’ Fees and Benefits include amounts accrued by the Fund to fund such retirement benefits. Obligations under the deferred compensation and retirement plans represent unsecured claims against the general assets of the Fund.
NOTE 7—Cash Balances
The Fund is permitted to temporarily carry a negative or overdrawn balance in its account with State Street Bank and Trust Company, the custodian bank. Such balances, if any at period-end, are shown in the Statement of Assets and Liabilities under the payable caption Amount due custodian. To compensate the custodian bank for such overdrafts, the overdrawn Fund may either (1) leave funds as a compensating balance in the account so the custodian bank can be compensated by earning the additional interest; or (2) compensate by paying the custodian bank at a rate agreed upon by the custodian bank and Invesco, not to exceed the contractually agreed upon rate.
NOTE 8—Distributions to Shareholders and Tax Components of Net Assets
Tax Character of Distributions to Shareholders Paid During the Fiscal Years Ended December 31, 2016 and 2015:
| | | | | | | | |
| | | 2016 | | | 2015 | |
Long-term capital gain distributions | | $ | 65,509,224 | | | $ | 80,095,823 | |
Tax Components of Net Assets at Period-End:
| | | | |
| | | 2016 | |
Undistributed long-term gain | | $ | 6,327,395 | |
Net unrealized appreciation — investments | | | 231,931,494 | |
Temporary book/tax differences | | | (203,916 | ) |
Shares of beneficial interest | | | 1,036,891,660 | |
Total net assets | | $ | 1,274,946,633 | |
The difference between book-basis and tax-basis unrealized appreciation (depreciation) is due to differences in the timing of recognition of gains and losses on investments for tax and book purposes. The Fund’s net unrealized appreciation difference is attributable primarily to wash sales.
The temporary book/tax differences are a result of timing differences between book and tax recognition of income and/or expenses. The Fund’s temporary book/tax differences are the result of the trustee deferral of compensation and retirement plan benefits.
Capital loss carryforward is calculated and reported as of a specific date. Results of transactions and other activity after that date may affect the amount of capital loss carryforward actually available for the Fund to utilize. Capital losses generated in years beginning after December 22, 2010 can be carried forward for an unlimited period, whereas previous losses expire in eight tax years. Capital losses with an expiration period may not be used to offset capital gains until all net capital losses without an expiration date have been utilized. Capital loss carryforwards with no expiration date will retain their character as either short-term or long-term capital losses instead of as short-term capital losses as under prior law. The ability to utilize capital loss carryforwards in the future may be limited under the Internal Revenue Code and related regulations based on the results of future transactions.
The Fund does not have a capital loss carryforward as of December 31, 2016.
18 Invesco Small Cap Equity Fund
NOTE 9—Investment Securities
The aggregate amount of investment securities (other than short-term securities, U.S. Treasury obligations and money market funds, if any) purchased and sold by the Fund during the year ended December 31, 2016 was $444,784,306 and $626,983,308, respectively. Cost of investments on a tax basis includes the adjustments for financial reporting purposes as of the most recently completed federal income tax reporting period-end.
| | | | |
| Unrealized Appreciation (Depreciation) of Investment Securities on a Tax Basis | |
Aggregate unrealized appreciation of investment securities | | $ | 298,773,185 | |
Aggregate unrealized (depreciation) of investment securities | | | (66,841,691 | ) |
Net unrealized appreciation of investment securities | | $ | 231,931,494 | |
Cost of investments for tax purposes is $1,060,901,543.
NOTE 10—Reclassification of Permanent Differences
Primarily as a result of differing book/tax treatment of net operating losses, on December 31, 2016, undistributed net investment income (loss) was increased by $957,931 and shares of beneficial interest was decreased by $957,931. This reclassification had no effect on the net assets of the Fund.
NOTE 11—Share Information
| | | | | | | | | | | | | | | | |
| | | Summary of Share Activity | |
| | | Years ended December 31, | |
| | | 2016(a) | | | 2015 | |
| | | Shares | | | Amount | | | Shares | | | Amount | |
Sold: | | | | | | | | | | | | | | | | |
Class A | | | 7,981,739 | | | $ | 109,156,878 | | | | 8,820,013 | | | $ | 134,132,105 | |
Class B | | | 17,053 | | | | 196,559 | | | | 24,179 | | | | 308,260 | |
Class C | | | 774,627 | | | | 8,785,640 | | | | 1,062,124 | | | | 13,634,549 | |
Class R | | | 1,173,806 | | | | 15,175,380 | | | | 1,332,181 | | | | 19,252,749 | |
Class Y | | | 10,624,376 | | | | 147,481,614 | | | | 9,286,885 | | | | 143,406,211 | |
Class R5 | | | 2,096,196 | | | | 31,220,958 | | | | 2,437,027 | | | | 40,323,980 | |
Class R6 | | | 988,701 | | | | 14,391,165 | | | | 1,165,349 | | | | 18,987,531 | |
| | | | |
Issued as reinvestment of dividends: | | | | | | | | | | | | | | | | |
Class A | | | 1,874,016 | | | | 27,173,227 | | | | 2,361,575 | | | | 31,526,969 | |
Class B | | | 16,246 | | | | 193,498 | | | | 33,465 | | | | 373,800 | |
Class C | | | 282,483 | | | | 3,361,551 | | | | 367,005 | | | | 4,095,771 | |
Class R | | | 294,320 | | | | 4,038,063 | | | | 414,274 | | | | 5,261,272 | |
Class Y | | | 1,306,361 | | | | 19,490,897 | | | | 1,563,634 | | | | 21,390,517 | |
Class R5 | | | 348,891 | | | | 5,515,971 | | | | 590,393 | | | | 8,519,365 | |
Class R6 | | | 172,971 | | | | 2,748,507 | | | | 362,936 | | | | 5,255,319 | |
| | | | |
Automatic conversion of Class B shares to Class A shares: | | | | | | | | | | | | | | | | |
Class A | | | 136,542 | | | | 1,862,713 | | | | 138,552 | | | | 2,123,534 | |
Class B | | | (164,045 | ) | | | (1,862,713 | ) | | | (163,184 | ) | | | (2,123,534 | ) |
| | | | |
Reacquired: | | | | | | | | | | | | | | | | |
Class A | | | (11,335,325 | ) | | | (155,683,091 | ) | | | (7,899,564 | ) | | | (120,378,534 | ) |
Class B | | | (76,084 | ) | | | (847,519 | ) | | | (99,727 | ) | | | (1,287,560 | ) |
Class C | | | (1,500,306 | ) | | | (17,096,966 | ) | | | (1,105,330 | ) | | | (14,212,522 | ) |
Class R | | | (2,387,883 | ) | | | (30,927,831 | ) | | | (2,165,585 | ) | | | (31,569,231 | ) |
Class Y | | | (12,072,974 | ) | | | (172,049,674 | ) | | | (5,664,594 | ) | | | (87,389,645 | ) |
Class R5 | | | (5,763,825 | ) | | | (86,192,056 | ) | | | (2,920,822 | ) | | | (47,769,040 | ) |
Class R6 | | | (3,521,980 | ) | | | (50,197,412 | ) | | | (2,220,023 | ) | | | (36,452,088 | ) |
Net increase (decrease) in share activity | | | (8,734,094 | ) | | $ | (124,064,641 | ) | | | 7,720,763 | | | $ | 107,409,778 | |
| (a) | There are entities that is record owners of more than 5% of the outstanding shares of the Fund and in aggregate own 42% of the outstanding shares of the Fund. IDI has an agreement with this entity to sell Fund shares. The Fund, Invesco and/or Invesco affiliates may make payments to this entity, which is considered to be related to the Fund, for providing services to the Fund, Invesco and/or Invesco affiliates including but not limited to services such as, securities brokerage, distribution, third party record keeping and account servicing. The Fund has no knowledge as to whether all or any portion of the shares owned of record by this entity are also owned beneficially. |
19 Invesco Small Cap Equity Fund
NOTE 12—Financial Highlights
The following schedule presents financial highlights for a share of the Fund outstanding throughout the periods indicated.
| | | | | | | | | | | | | | | | | | | | | | | | | | | | | | | | | | | | | | | | | | | | | | | | |
| | | Net asset
value,
beginning
of period | | | Net
investment
income
(losses)(a) | | | Net gains
(losses)
on securities
(both
realized and
unrealized) | | | Total from
investment
operations | | | Distributions
from net
realized
gains | | | Net asset
value, end
of period | | | Total
return(b) | | | Net assets,
end of period
(000’s omitted) | | | Ratio of
expenses
to average
net assets
with fee waivers
and/or expenses
absorbed | | | Ratio of
expenses
to average net
assets without
fee waivers
and/or expenses
absorbed | | | Ratio of net
investment
income (loss)
to average
net assets | | | Portfolio
turnover(c) | |
Class A | |
Year ended 12/31/16 | | $ | 13.43 | | | $ | (0.02 | ) | | $ | 1.61 | | | $ | 1.59 | | | $ | (0.77 | ) | | $ | 14.25 | | | | 11.72 | % | | $ | 557,205 | | | | 1.31 | %(d) | | | 1.31 | %(d) | | | (0.18 | )%(d) | | | 35 | % |
Year ended 12/31/15 | | | 15.16 | | | | (0.04 | ) | | | (0.82 | ) | | | (0.86 | ) | | | (0.87 | ) | | | 13.43 | | | | (5.61 | ) | | | 543,187 | | | | 1.29 | | | | 1.29 | | | | (0.23 | ) | | | 29 | |
Year ended 12/31/14 | | | 17.00 | | | | (0.08 | ) | | | 0.37 | | | | 0.29 | | | | (2.13 | ) | | | 15.16 | | | | 2.17 | | | | 561,244 | | | | 1.29 | | | | 1.29 | | | | (0.49 | ) | | | 45 | |
Year ended 12/31/13 | | | 13.24 | | | | (0.06 | ) | | | 4.87 | | | | 4.81 | | | | (1.05 | ) | | | 17.00 | | | | 36.68 | | | | 586,779 | | | | 1.29 | | | | 1.29 | | | | (0.38 | ) | | | 28 | |
Year ended 12/31/12 | | | 12.19 | | | | (0.03 | )(e) | | | 1.66 | | | | 1.63 | | | | (0.58 | ) | | | 13.24 | | | | 13.50 | | | | 397,305 | | | | 1.34 | | | | 1.34 | | | | (0.21 | )(e) | | | 39 | |
Class B | |
Year ended 12/31/16 | | | 11.23 | | | | (0.10 | ) | | | 1.34 | | | | 1.24 | | | | (0.77 | ) | | | 11.70 | | | | 10.89 | | | | 2,986 | | | | 2.06 | (d) | | | 2.06 | (d) | | | (0.93 | )(d) | | | 35 | |
Year ended 12/31/15 | | | 12.92 | | | | (0.13 | ) | | | (0.69 | ) | | | (0.82 | ) | | | (0.87 | ) | | | 11.23 | | | | (6.28 | ) | | | 5,189 | | | | 2.04 | | | | 2.04 | | | | (0.98 | ) | | | 29 | |
Year ended 12/31/14 | | | 14.92 | | | | (0.18 | ) | | | 0.31 | | | | 0.13 | | | | (2.13 | ) | | | 12.92 | | | | 1.39 | | | | 8,624 | | | | 2.04 | | | | 2.04 | | | | (1.24 | ) | | | 45 | |
Year ended 12/31/13 | | | 11.81 | | | | (0.15 | ) | | | 4.31 | | | | 4.16 | | | | (1.05 | ) | | | 14.92 | | | | 35.61 | | | | 12,723 | | | | 2.04 | | | | 2.04 | | | | (1.13 | ) | | | 28 | |
Year ended 12/31/12 | | | 11.01 | | | | (0.11 | )(e) | | | 1.49 | | | | 1.38 | | | | (0.58 | ) | | | 11.81 | | | | 12.68 | | | | 12,620 | | | | 2.09 | | | | 2.09 | | | | (0.96 | )(e) | | | 39 | |
Class C | |
Year ended 12/31/16 | | | 11.22 | | | | (0.11 | ) | | | 1.35 | | | | 1.24 | | | | (0.77 | ) | | | 11.69 | | | | 10.90 | | | | 56,845 | | | | 2.06 | (d) | | | 2.06 | (d) | | | (0.93 | )(d) | | | 35 | |
Year ended 12/31/15 | | | 12.92 | | | | (0.13 | ) | | | (0.70 | ) | | | (0.83 | ) | | | (0.87 | ) | | | 11.22 | | | | (6.36 | ) | | | 59,546 | | | | 2.04 | | | | 2.04 | | | | (0.98 | ) | | | 29 | |
Year ended 12/31/14 | | | 14.92 | | | | (0.18 | ) | | | 0.31 | | | | 0.13 | | | | (2.13 | ) | | | 12.92 | | | | 1.40 | | | | 64,348 | | | | 2.04 | | | | 2.04 | | | | (1.24 | ) | | | 45 | |
Year ended 12/31/13 | | | 11.81 | | | | (0.15 | ) | | | 4.31 | | | | 4.16 | | | | (1.05 | ) | | | 14.92 | | | | 35.62 | | | | 72,662 | | | | 2.04 | | | | 2.04 | | | | (1.13 | ) | | | 28 | |
Year ended 12/31/12 | | | 11.00 | | | | (0.11 | )(e) | | | 1.50 | | | | 1.39 | | | | (0.58 | ) | | | 11.81 | | | | 12.78 | | | | 49,995 | | | | 2.09 | | | | 2.09 | | | | (0.96 | )(e) | | | 39 | |
Class R | |
Year ended 12/31/16 | | | 12.77 | | | | (0.06 | ) | | | 1.54 | | | | 1.48 | | | | (0.77 | ) | | | 13.48 | | | | 11.46 | | | | 74,227 | | | | 1.56 | (d) | | | 1.56 | (d) | | | (0.43 | )(d) | | | 35 | |
Year ended 12/31/15 | | | 14.50 | | | | (0.07 | ) | | | (0.79 | ) | | | (0.86 | ) | | | (0.87 | ) | | | 12.77 | | | | (5.87 | ) | | | 82,078 | | | | 1.54 | | | | 1.54 | | | | (0.48 | ) | | | 29 | |
Year ended 12/31/14 | | | 16.40 | | | | (0.12 | ) | | | 0.35 | | | | 0.23 | | | | (2.13 | ) | | | 14.50 | | | | 1.89 | | | | 99,241 | | | | 1.54 | | | | 1.54 | | | | (0.74 | ) | | | 45 | |
Year ended 12/31/13 | | | 12.83 | | | | (0.09 | ) | | | 4.71 | | | | 4.62 | | | | (1.05 | ) | | | 16.40 | | | | 36.38 | | | | 114,041 | | | | 1.54 | | | | 1.54 | | | | (0.63 | ) | | | 28 | |
Year ended 12/31/12 | | | 11.85 | | | | (0.06 | )(e) | | | 1.62 | | | | 1.56 | | | | (0.58 | ) | | | 12.83 | | | | 13.30 | | | | 80,486 | | | | 1.59 | | | | 1.59 | | | | (0.46 | )(e) | | | 39 | |
Class Y | |
Year ended 12/31/16 | | | 13.76 | | | | 0.01 | | | | 1.66 | | | | 1.67 | | | | (0.77 | ) | | | 14.66 | | | | 12.02 | | | | 409,479 | | | | 1.06 | (d) | | | 1.06 | (d) | | | 0.07 | (d) | | | 35 | |
Year ended 12/31/15 | | | 15.47 | | | | 0.00 | | | | (0.84 | ) | | | (0.84 | ) | | | (0.87 | ) | | | 13.76 | | | | (5.37 | ) | | | 386,369 | | | | 1.04 | | | | 1.04 | | | | 0.02 | | | | 29 | |
Year ended 12/31/14 | | | 17.27 | | | | (0.04 | ) | | | 0.37 | | | | 0.33 | | | | (2.13 | ) | | | 15.47 | | | | 2.36 | | | | 354,121 | | | | 1.04 | | | | 1.04 | | | | (0.24 | ) | | | 45 | |
Year ended 12/31/13 | | | 13.40 | | | | (0.02 | ) | | | 4.94 | | | | 4.92 | | | | (1.05 | ) | | | 17.27 | | | | 37.07 | | | | 269,044 | | | | 1.04 | | | | 1.04 | | | | (0.13 | ) | | | 28 | |
Year ended 12/31/12 | | | 12.30 | | | | 0.01 | (e) | | | 1.67 | | | | 1.68 | | | | (0.58 | ) | | | 13.40 | | | | 13.79 | | | | 107,440 | | | | 1.09 | | | | 1.09 | | | | 0.04 | (e) | | | 39 | |
Class R5 | |
Year ended 12/31/16 | | | 14.52 | | | | 0.04 | | | | 1.75 | | | | 1.79 | | | | (0.77 | ) | | | 15.54 | | | | 12.22 | | | | 111,621 | | | | 0.87 | (d) | | | 0.87 | (d) | | | 0.26 | (d) | | | 35 | |
Year ended 12/31/15 | | | 16.24 | | | | 0.03 | | | | (0.88 | ) | | | (0.85 | ) | | | (0.87 | ) | | | 14.52 | | | | (5.18 | ) | | | 152,486 | | | | 0.88 | | | | 0.88 | | | | 0.18 | | | | 29 | |
Year ended 12/31/14 | | | 17.99 | | | | (0.01 | ) | | | 0.39 | | | | 0.38 | | | | (2.13 | ) | | | 16.24 | | | | 2.55 | | | | 168,876 | | | | 0.87 | | | | 0.87 | | | | (0.07 | ) | | | 45 | |
Year ended 12/31/13 | | | 13.91 | | | | 0.01 | | | | 5.12 | | | | 5.13 | | | | (1.05 | ) | | | 17.99 | | | | 37.22 | | | | 200,674 | | | | 0.88 | | | | 0.88 | | | | 0.03 | | | | 28 | |
Year ended 12/31/12 | | | 12.72 | | | | 0.03 | (e) | | | 1.74 | | | | 1.77 | | | | (0.58 | ) | | | 13.91 | | | | 14.04 | | | | 140,110 | | | | 0.88 | | | | 0.88 | | | | 0.25 | (e) | | | 39 | |
Class R6 | |
Year ended 12/31/16 | | | 14.57 | | | | 0.05 | | | | 1.76 | | | | 1.81 | | | | (0.77 | ) | | | 15.61 | | | | 12.31 | | | | 62,583 | | | | 0.79 | (d) | | | 0.79 | (d) | | | 0.34 | (d) | | | 35 | |
Year ended 12/31/15 | | | 16.28 | | | | 0.05 | | | | (0.89 | ) | | | (0.84 | ) | | | (0.87 | ) | | | 14.57 | | | | (5.10 | ) | | | 92,803 | | | | 0.79 | | | | 0.79 | | | | 0.27 | | | | 29 | |
Year ended 12/31/14 | | | 18.02 | | | | 0.00 | | | | 0.39 | | | | 0.39 | | | | (2.13 | ) | | | 16.28 | | | | 2.60 | | | | 114,981 | | | | 0.78 | | | | 0.78 | | | | 0.02 | | | | 45 | |
Year ended 12/31/13 | | | 13.92 | | | | 0.02 | | | | 5.13 | | | | 5.15 | | | | (1.05 | ) | | | 18.02 | | | | 37.34 | | | | 119,633 | | | | 0.80 | | | | 0.80 | | | | 0.11 | | | | 28 | |
Year ended 12/31/12(f) | | | 14.30 | | | | 0.01 | (e) | | | 0.19 | | | | 0.20 | | | | (0.58 | ) | | | 13.92 | | | | 1.51 | | | | 70,677 | | | | 0.81 | (g) | | | 0.81 | (g) | | | 0.32 | (e)(g) | | | 39 | |
| (a) | Calculated using average shares outstanding. |
| (b) | Includes adjustments in accordance with accounting principles generally accepted in the United States of America and as such, the net asset value for financial reporting purposes and the returns based upon those net asset values may differ from the net asset value and returns for shareholder transactions. Does not include sales charges and is not annualized for periods less than one year, if applicable. |
| (c) | Portfolio turnover is calculated at the fund level and is not annualized for periods less than one year, if applicable. |
| (d) | Ratios are based on average daily net assets (000’s omitted) of $536,201, $3,868, $56,759, $75,159, $408,344, $140,603 and $71,882 for Class A, Class B, Class C, Class R, Class Y, Class R5 and Class R6 shares, respectively. |
| (e) | Net investment income (loss) per share and the ratio of net investment income (loss) to average net assets includes significant dividends received during the period. Net investment income (loss) per share and the ratio of net investment income (loss) to average net assets excluding the significant dividends are $(0.06) and (0.44)%, $(0.14) and (1.19)%, $(0.14) and (1.19)%, $(0.09) and (0.69)%, $(0.03) and (0.19)%, $0.00 and 0.02% and $0.00 and 0.09% for Class A, Class B, Class C, Class R, Class Y, Class R5 and Class R6 shares, respectively. |
| (f) | Commencement date of September 24, 2012. |
20 Invesco Small Cap Equity Fund
Report of Independent Registered Public Accounting Firm
To the Board of Trustees of AIM Funds Group (Invesco Funds Group) and Shareholders of the Invesco Small Cap Equity Fund:
In our opinion, the accompanying statement of assets and liabilities, including the schedule of investments, and the related statements of operations and of changes in net assets and the financial highlights present fairly, in all material respects, the financial position of the Invesco Small Cap Equity Fund (one of the portfolios constituting the AIM Funds Group (Invesco Funds Group), hereafter referred to as the “Fund”) as of December 31, 2016, the results of its operations for the year then ended, the changes in its net assets for each of the two years in the period then ended and the financial highlights for each of the five years in the period then ended, in conformity with accounting principles generally accepted in the United States of America. These financial statements and financial highlights (hereafter referred to as “financial statements”) are the responsibility of the Fund’s management. Our responsibility is to express an opinion on these financial statements based on our audits. We conducted our audits of these financial statements in accordance with the standards of the Public Company Accounting Oversight Board (United States). Those standards require that we plan and perform the audit to obtain reasonable assurance about whether the financial statements are free of material misstatement. An audit includes examining, on a test basis, evidence supporting the amounts and disclosures in the financial statements, assessing the accounting principles used and significant estimates made by management, and evaluating the overall financial statement presentation. We believe that our audits, which included confirmation of securities as of December 31, 2016 by correspondence with the custodian and brokers, provide a reasonable basis for our opinion.
PricewaterhouseCoopers LLP
Houston, Texas
February 23, 2017
21 Invesco Small Cap Equity Fund
Calculating your ongoing Fund expenses
Example
As a shareholder of the Fund, you incur two types of costs: (1) transaction costs, which may include sales charges (loads) on purchase payments or contingent deferred sales charges on redemptions, if any; and (2) ongoing costs, including management fees, distribution and/or service (12b-1) fees, and other Fund expenses. This example is intended to help you understand your ongoing costs (in dollars) of investing in the Fund and to compare these costs with ongoing costs of investing in other mutual funds. The example is based on an investment of $1,000 invested at the beginning of the period and held for the entire period July 1, 2016 through December 31, 2016.
Actual expenses
The table below provides information about actual account values and actual expenses. You may use the information in this table, together with the amount you invested, to estimate the expenses that you paid over the period. Simply divide your account value by $1,000 (for example, an $8,600 account value divided by $1,000 = 8.6), then multiply the result by the number in the table under the heading entitled “Actual Expenses Paid During Period” to estimate the expenses you paid on your account during this period.
Hypothetical example for comparison purposes
The table below also provides information about hypothetical account values and hypothetical expenses based on the Fund’s actual expense ratio and an assumed rate of return of 5% per year before expenses, which is not the Fund’s actual return.
The hypothetical account values and expenses may not be used to estimate the actual ending account balance or expenses you paid for the period. You may use this information to compare the ongoing costs of investing in the Fund and other funds. To do so, compare this 5% hypothetical example with the 5% hypothetical examples that appear in the shareholder reports of the other funds.
Please note that the expenses shown in the table are meant to highlight your ongoing costs only and do not reflect any transaction costs, such as sales charges (loads) on purchase payments or contingent deferred sales charges on redemptions, if any. Therefore, the hypothetical information is useful in comparing ongoing costs only, and will not help you determine the relative total costs of owning different funds. In addition, if these transaction costs were included, your costs would have been higher.
| | | | | | | | | | | | | | | | | | | | | | | | |
| Class | | Beginning
Account Value
(07/01/16) | | | ACTUAL | | | HYPOTHETICAL (5% annual return before
expenses) | | | Annualized
Expense
Ratio | |
| | | Ending
Account Value
(12/31/16)1 | | | Expenses
Paid During
Period2 | | | Ending
Account Value
(12/31/16) | | | Expenses
Paid During
Period2 | | |
| A | | $ | 1,000.00 | | | $ | 1,107.30 | | | $ | 6.83 | | | $ | 1,018.65 | | | $ | 6.55 | | | | 1.29 | % |
| B | | | 1,000.00 | | | | 1,103.00 | | | | 10.78 | | | | 1,014.88 | | | | 10.33 | | | | 2.04 | |
| C | | | 1,000.00 | | | | 1,103.10 | | | | 10.78 | | | | 1,014.88 | | | | 10.33 | | | | 2.04 | |
| R | | | 1,000.00 | | | | 1,105.90 | | | | 8.15 | | | | 1,017.39 | | | | 7.81 | | | | 1.54 | |
| Y | | | 1,000.00 | | | | 1,108.90 | | | | 5.51 | | | | 1,019.91 | | | | 5.28 | | | | 1.04 | |
| R5 | | | 1,000.00 | | | | 1,109.90 | | | | 4.61 | | | | 1,020.76 | | | | 4.42 | | | | 0.87 | |
| R6 | | | 1,000.00 | | | | 1,110.10 | | | | 4.14 | | | | 1,021.22 | | | | 3.96 | | | | 0.78 | |
| 1 | The actual ending account value is based on the actual total return of the Fund for the period July 1, 2016 through December 31, 2016, after actual expenses and will differ from the hypothetical ending account value which is based on the Fund’s expense ratio and a hypothetical annual return of 5% before expenses. |
| 2 | Expenses are equal to the Fund’s annualized expense ratio as indicated above multiplied by the average account value over the period, multiplied by 184/366 to reflect the most recent fiscal half year. |
22 Invesco Small Cap Equity Fund
Tax Information
Form 1099-DIV, Form 1042-S and other year-end tax information provide shareholders with actual calendar year amounts that should be included in their tax returns. Shareholders should consult their tax advisors.
The following distribution information is being provided as required by the Internal Revenue Code or to meet a specific state’s requirement.
The Fund designates the following amounts or, if subsequently determined to be different, the maximum amount allowable for its fiscal year ended December 31, 2016:
| | | | |
Federal and State Income Tax | |
Long-Term Capital Gain Distributions | | $ | 65,509,224 | |
Qualified Dividend Income* | | | 0.00 | % |
Corporate Dividends Received Deduction* | | | 0.00 | % |
U.S. Treasury Obligations* | | | 0.00 | % |
| | * | The above percentages are based on ordinary income dividends paid to shareholders during the Fund’s fiscal year. |
23 Invesco Small Cap Equity Fund
Trustees and Officers
The address of each trustee and officer is AIM Funds Group (Invesco Funds Group) (the “Trust”), 11 Greenway Plaza, Suite 1000, Houston, Texas 77046-1173. The trustees serve for the life of the Trust, subject to their earlier death, incapacitation, resignation, retirement or removal as more specifically provided in the Trust’s organizational documents. Each officer serves for a one year term or until their successors are elected and qualified. Column two below includes length of time served with predecessor entities, if any.
| | | | | | | | |
Name, Year of Birth and
Position(s) Held with the Trust | | Trustee and/
or Officer Since | | Principal Occupation(s)
During Past 5 Years | | Number of
Funds in Fund
Complex
Overseen by
Trustee | | Other Directorship(s)
Held by Trustee During Past 5 Years |
| Interested Persons | | | | | | | | |
| Martin L. Flanagan1 — 1960 Trustee | | 2007 | | Executive Director, Chief Executive Officer and President, Invesco Ltd. (ultimate parent of Invesco and a global investment management firm); Advisor to the Board, Invesco Advisers, Inc. (formerly known as Invesco Institutional (N.A.), Inc.); Trustee, The Invesco Funds; Vice Chair, Investment Company Institute; and Member of Executive Board, SMU Cox School of Business Formerly: Chairman and Chief Executive Officer, Invesco Advisers, Inc. (registered investment adviser); Director, Chairman, Chief Executive Officer and President, Invesco Holding Company (US) Inc. (formerly IVZ Inc.) (holding company), Invesco Group Services, Inc. (service provider) and Invesco North American Holdings, Inc. (holding company); Director, Chief Executive Officer and President, Invesco Holding Company Limited (parent of Invesco and a global investment management firm); Director, Invesco Ltd.; Chairman, Investment Company Institute and President, Co-Chief Executive Officer, Co-President, Chief Operating Officer and Chief Financial Officer, Franklin Resources, Inc. (global investment management organization) | | 144 | | None |
Philip A. Taylor2 — 1954 Trustee and Senior Vice President | | 2006 | | Head of the Americas and Senior Managing Director, Invesco Ltd.; Director, Co-Chairman, Co-President and Co-Chief Executive Officer, Invesco Advisers, Inc. (formerly known as Invesco Institutional (N.A.), Inc.) (registered investment adviser); Director, Chairman, Chief Executive Officer and President, Invesco Management Group, Inc. (formerly known as Invesco AIM Management Group, Inc.) (financial services holding company); Director and Chairman, Invesco Investment Services, Inc. (formerly known as Invesco AIM Investment Services, Inc.) (registered transfer agent) Chief Executive Officer, Invesco Corporate Class Inc. (corporate mutual fund company) Director, Chairman and Chief Executive Officer, Invesco Canada Ltd. (formerly known as Invesco Trimark Ltd./Invesco Trimark Ltèe) (registered investment adviser and registered transfer agent); Trustee and Senior Vice President, The Invesco Funds; Director, Invesco Investment Advisers LLC (formerly known as Van Kampen Asset Management). Formerly: Director, Chief Executive Officer and President, Van Kampen Exchange Corp.; President and Principal Executive Officer, The Invesco Funds (other than AIM Treasurer’s Series Trust (Invesco Treasurer’s Series Trust), Short-Term Investments Trust and Invesco Management Trust); Executive Vice President, The Invesco Funds (AIM Treasurer’s Series Trust (Invesco Treasurer’s Series Trust), Short-Term Investments Trust and Invesco Management Trust only); Director and President, INVESCO Funds Group, Inc. (registered investment adviser and registered transfer agent); Director and Chairman, IVZ Distributors, Inc. (formerly known as INVESCO Distributors, Inc.) (registered broker dealer); Director, President and Chairman, Invesco Inc. (holding company), Invesco Canada Holdings Inc. (holding company), Trimark Investments Ltd./Placements Trimark Ltèe and Invesco Financial Services Ltd/Services Financiers Invesco Ltèe; Chief Executive Officer, Invesco Canada Fund Inc. (corporate mutual fund company); Director and Chairman, Van Kampen Investor Services Inc.; Director, Chief Executive Officer and President, 1371 Preferred Inc. (holding company) and Van Kampen Investments Inc.; Director and President, AIM GP Canada Inc. (general partner for limited partnerships) and Van Kampen Advisors, Inc.; Director and Chief Executive Officer, Invesco Trimark Dealer Inc. (registered broker dealer); Director, Invesco Distributors, Inc. (formerly known as Invesco AIM Distributors, Inc.) (registered broker dealer); Manager, Invesco PowerShares Capital Management LLC; Director, Chief Executive Officer and President, Invesco Advisers, Inc.; Director, Chairman, Chief Executive Officer and President, Invesco AIM Capital Management, Inc.; President, Invesco Trimark Dealer Inc. and Invesco Trimark Ltd./Invesco Trimark Ltèe; Director and President, AIM Trimark Corporate Class Inc. and AIM Trimark Canada Fund Inc.; Senior Managing Director, Invesco Holding Company Limited; Director and Chairman, Fund Management Company (former registered broker dealer); President and Principal Executive Officer, The Invesco Funds (AIM Treasurer’s Series Trust (Invesco Treasurer’s Series Trust), and Short-Term Investments Trust only); President, AIM Trimark Global Fund Inc. and AIM Trimark Canada Fund Inc. | | 144 | | None |
| 1 | Mr. Flanagan is considered an interested person (within the meaning of Section 2(a)(19) of the 1940 Act) of the Trust because he is an officer of the Adviser to the Trust, and an officer and a director of Invesco Ltd., ultimate parent of the Adviser. |
| 2 | Mr. Taylor is considered an interested person (within the meaning of Section 2(a)(19) of the 1940 Act) of the Trust because he is an officer and a director of the Adviser. |
T-1 Invesco Small Cap Equity Fund
Trustees and Officers—(continued)
| | | | | | | | |
Name, Year of Birth and
Position(s) Held with the Trust | | Trustee and/
or Officer Since | | Principal Occupation(s)
During Past 5 Years | | Number of
Funds in Fund
Complex
Overseen by
Trustee | | Other Directorship(s)
Held by Trustee During
Past 5 Years |
| Independent Trustees | | | | | | | | |
Bruce L. Crockett — 1944 Trustee and Chair | | 1987 | | Chairman, Crockett Technologies Associates (technology consulting company) Formerly: Director, Captaris (unified messaging provider); Director, President and Chief Executive Officer, COMSAT Corporation; Chairman, Board of Governors of INTELSAT (international communications company); ACE Limited (insurance company); Independent Directors Council and Investment Company Institute | | 144 | | Chairman of the Audit committee, ALPS (Attorneys Liability Protection Society) (insurance company): Member of the Audit Committee, Ferroglobe PLC (metallurgical company) and Investment Company Institute; Member of the Executive Committee and Chair of the Governance Committee, Independent Directors Council |
David C. Arch — 1945 Trustee | | 2010 | | Chairman of Blistex Inc., a consumer health care products manufacturer | | 144 | | Board member of the Illinois Manufacturers’ Association |
James T. Bunch — 1942 Trustee | | 2003 | | Managing Member, Grumman Hill Group LLC (family office/private equity investments) Formerly: Chairman of the Board, Denver Film Society, Chairman of the Board of Trustees, Evans Scholarship Foundation; Chairman, Board of Governors, Western Golf Association | | 144 | | Trustee, Evans Scholarship Foundation; Chairman of the Board, Denver Film Society |
Jack M. Fields — 1952 Trustee | | 1997 | | Chief Executive Officer, Twenty First Century Group, Inc. (government affairs company); and Discovery Learning Alliance (non-profit) Formerly: Owner and Chief Executive Officer, Dos Angeles Ranch L.P. (cattle, hunting, corporate entertainment); Director, Insperity, Inc. (formerly known as Administaff); Chief Executive Officer, Texana Timber LP (sustainable forestry company); Director of Cross Timbers Quail Research Ranch (non-profit); and member of the U.S. House of Representatives | | 144 | | None |
Eli Jones — 1961 Trustee | | 2016 | | Professor and Dean, Mays Business School — Texas A&M University Formerly: Professor and Dean, Walton College of Business, University of Arkansas and E.J. Ourso College of Business, Louisiana State University and Director, Arvest Bank | | 144 | | Director of Insperity, Inc. (formerly known as Administaff) |
Prema Mathai-Davis — 1950 Trustee | | 1998 | | Retired. Formerly: Chief Executive Officer, YWCA of the U.S.A. | | 144 | | None |
Larry Soll — 1942 Trustee | | 2003 | | Retired. Formerly: Chairman, Chief Executive Officer and President, Synergen Corp. (a biotechnology company) | | 144 | | None |
Raymond Stickel, Jr. — 1944 Trustee | | 2005 | | Retired. Formerly: Director, Mainstay VP Series Funds, Inc. (25 portfolios) and Partner, Deloitte & Touche | | 144 | | None |
Robert C. Troccoli — 1949 Trustee | | 2016 | | Adjunct Professor, University of Denver — Daniels College of Business Formerly: Senior Partner, KPMG LLP | | 144 | | None |
| Other Officers | | | | | | | | |
Sheri Morris — 1964 President, Principal Executive Officer and Treasurer | | 1999 | | President, Principal Executive Officer and Treasurer, The Invesco Funds; Vice President, Invesco Advisers, Inc. (formerly known as Invesco Institutional (N.A.), Inc.) (registered investment adviser); and Vice President, PowerShares Exchange-Traded Fund Trust, PowerShares Exchange-Traded Fund Trust II, PowerShares India Exchange-Traded Fund Trust, PowerShares Actively Managed Exchange-Traded Fund Trust, and PowerShares Actively Managed Exchange-Traded Commodity Fund Trust Formerly: Vice President and Principal Financial Officer, The Invesco Funds; Vice President, Invesco AIM Advisers, Inc., Invesco AIM Capital Management, Inc. and Invesco AIM Private Asset Management, Inc.; Assistant Vice President and Assistant Treasurer, The Invesco Funds and Assistant Vice President, Invesco Advisers, Inc., Invesco AIM Capital Management, Inc. and Invesco AIM Private Asset Management, Inc.; and Treasurer, PowerShares Exchange-Traded Fund Trust, PowerShares Exchange-Traded Fund Trust II, PowerShares India Exchange-Traded Fund Trust and PowerShares Actively Managed Exchange-Traded Fund Trust | | N/A | | N/A |
Russell C. Burk — 1958 Senior Vice President and Senior Officer | | 2005 | | Senior Vice President and Senior Officer, The Invesco Funds | | N/A | | N/A |
T-2 Invesco Small Cap Equity Fund
Trustees and Officers—(continued)
| | | | | | | | |
Name, Year of Birth and
Position(s) Held with the Trust | | Trustee and/
or Officer Since | | Principal Occupation(s)
During Past 5 Years | | Number of
Funds in Fund
Complex
Overseen by
Trustee | | Other Directorship(s)
Held by Trustee During
Past 5 Years |
| Other Officers—(continued) | | | | | | | | |
John M. Zerr — 1962 Senior Vice President, Chief Legal Officer and Secretary | | 2006 | | Director, Senior Vice President, Secretary and General Counsel, Invesco Management Group, Inc. (formerly known as Invesco AIM Management Group, Inc.; Senior Vice President, Invesco Advisers, Inc. (formerly known as Invesco Institutional (N.A.), Inc.) (registered investment adviser); Senior Vice President and Secretary, Invesco Distributors, Inc. (formerly known as Invesco AIM Distributors, Inc.); Director, Vice President and Secretary, Invesco Investment Services, Inc. (formerly known as Invesco AIM Investment Services, Inc.) Senior Vice President, Chief Legal Officer and Secretary, The Invesco Funds; Managing Director, Invesco PowerShares Capital Management LLC; Director, Secretary and General Counsel, Invesco Investment Advisers LLC (formerly known as Van Kampen Asset Management); Secretary and General Counsel, Invesco Capital Markets, Inc. (formerly known as Van Kampen Funds Inc.) and Chief Legal Officer, PowerShares Exchange-Traded Fund Trust, PowerShares Exchange-Traded Fund Trust II, PowerShares India Exchange-Traded Fund Trust, PowerShares Actively Managed Exchange-Traded Fund Trust, and PowerShares Actively Managed Exchange-Traded Commodity Fund Trust Formerly: Director, Secretary, General Counsel and Senior Vice President, Van Kampen Exchange Corp.; Director, Vice President and Secretary, IVZ Distributors, Inc. (formerly known as INVESCO Distributors, Inc.); Director and Vice President, INVESCO Funds Group, Inc.; Director and Vice President, Van Kampen Advisors Inc.; Director, Vice President, Secretary and General Counsel, Van Kampen Investor Services Inc.; Director, Invesco Distributors, Inc. (formerly known as Invesco AIM Distributors, Inc.); Director, Senior Vice President, General Counsel and Secretary, Invesco AIM Advisers, Inc. and Van Kampen Investments Inc.; Director, Vice President and Secretary, Fund Management Company; Director, Senior Vice President, Secretary, General Counsel and Vice President, Invesco AIM Capital Management, Inc.; Chief Operating Officer and General Counsel, Liberty Ridge Capital, Inc. (an investment adviser); Vice President and Secretary, PBHG Funds (an investment company) and PBHG Insurance Series Fund (an investment company); Chief Operating Officer, General Counsel and Secretary, Old Mutual Investment Partners (a broker-dealer); General Counsel and Secretary, Old Mutual Fund Services (an administrator) and Old Mutual Shareholder Services (a shareholder servicing center); Executive Vice President, General Counsel and Secretary, Old Mutual Capital, Inc. (an investment adviser); and Vice President and Secretary, Old Mutual Advisors Funds (an investment company) | | N/A | | N/A |
| Karen Dunn Kelley — 1960 Senior Vice President | | 1992 | | Senior Managing Director, Investments, Invesco Ltd.; Director, Co-President, Co-Chief Executive Officer, and Co-Chairman, Invesco Advisers, Inc. (formerly known as Invesco Institutional (N.A.), Inc.) (registered investment adviser); Chairman and Director, Invesco Senior Secured Management, Inc.; Senior Vice President, Invesco Management Group, Inc. (formerly known as Invesco AIM Management Group, Inc.); Executive Vice President, Invesco Distributors, Inc. (formerly known as Invesco AIM Distributors, Inc.); Director, Invesco Mortgage Capital Inc.; Senior Vice President, The Invesco Funds Formerly: Director, Invesco Management Company Limited; Vice President, The Invesco Funds (other than AIM Treasurer’s Series Trust (Invesco Treasurer’s Series Trust), Short-Term Investments Trust and Invesco Management Trust); and President and Principal Executive Officer, The Invesco Funds (AIM Treasurer’s Series Trust (Invesco Treasurer’s Series Trust), Short-Term Investments Trust and Invesco Management Trust only); Director and President, INVESCO Asset Management (Bermuda) Ltd., Director, INVESCO Global Asset Management DAC (formerly known as INVESCO Global Asset Management Limited) and INVESCO Management S.A.; Senior Vice President, Van Kampen Investments Inc. and Invesco Advisers, Inc. (formerly known as Invesco Institutional (N.A.), Inc.) (registered investment adviser); Director and President, Fund Management Company; Chief Cash Management Officer, Director of Cash Management, Senior Vice President, and Managing Director, Invesco AIM Capital Management, Inc.; Director of Cash Management, Senior Vice President, and Vice President, Invesco Advisers, Inc. and Vice President, The Invesco Funds (AIM Treasurer’s Series Trust (Invesco Treasurer’s Series Trust), and Short-Term Investments Trust only) | | N/A | | N/A |
Kelli Gallegos — 1970 Vice President, Principal Financial Officer and Assistant Treasurer | | 2008 | | Vice President, Principal Financial Officer and Assistant Treasurer, The Invesco Funds; Assistant Treasurer, Invesco PowerShares Capital Management LLC, PowerShares Exchange-Traded Fund Trust, PowerShares Exchange-Traded Fund Trust II, PowerShares India Exchange-Traded Fund Trust, PowerShares Actively Managed Exchange-Traded Fund Trust, and PowerShares Actively Managed Exchange-Traded Commodity Fund Trust Formerly: Assistant Vice President, The Invesco Funds | | N/A | | N/A |
Tracy Sullivan — 1962 Vice President, Chief Tax Officer and Assistant Treasurer | | 2008 | | Vice President, Chief Tax Officer and Assistant Treasurer, The Invesco Funds; Assistant Treasurer, Invesco PowerShares Capital Management LLC, PowerShares Exchange-Traded Fund Trust, PowerShares Exchange-Traded Fund Trust II, PowerShares India Exchange-Traded Fund Trust, PowerShares Actively Managed Exchange-Traded Fund Trust, and PowerShares Actively Managed Exchange-Traded Commodity Fund Trust Formerly: Assistant Vice President, The Invesco Funds | | N/A | | N/A |
T-3 Invesco Small Cap Equity Fund
Trustees and Officers—(continued)
| | | | | | | | |
Name, Year of Birth and
Position(s) Held with the Trust | | Trustee and/
or Officer Since | | Principal Occupation(s)
During Past 5 Years | | Number of
Funds in Fund
Complex
Overseen by
Trustee | | Other Directorship(s)
Held by Trustee During
Past 5 Years |
| Other Officers—(continued) | | | | | | | | |
Crissie M. Wisdom — 1969 Anti-Money Laundering Compliance Officer | | 2013 | | Anti-Money Laundering Compliance Officer, Invesco Advisers, Inc. (formerly known as Invesco Institutional (N.A.), Inc.) (registered investment adviser), Invesco Capital Markets, Inc. (formerly known as Van Kampen Funds Inc.), Invesco Distributors, Inc., Invesco Investment Services, Inc., Invesco Management Group, Inc., The Invesco Funds, and PowerShares Exchange-Traded Fund Trust, PowerShares Exchange-Traded Fund Trust II, PowerShares India Exchange-Traded Fund Trust, PowerShares Actively Managed Exchange-Traded Fund Trust and PowerShares Actively Managed Exchange-Traded Commodity Fund Trust; Anti-Money Laundering Compliance Officer and Bank Secrecy Act Officer, INVESCO National Trust Company and Invesco Trust Company; and Fraud Prevention Manager and Controls and Risk Analysis Manager for Invesco Investment Services, Inc. Formerly: Anti-Money Laundering Compliance Officer, Van Kampen Exchange Corp. | | N/A | | N/A |
Robert R. Leveille — 1969 Chief Compliance Officer | | 2016 | | Chief Compliance Officer, Invesco Advisers, Inc. (registered investment adviser); and Chief Compliance Officer, The Invesco Funds Formerly: Chief Compliance Officer, Putnam Investments and the Putnam Funds | | N/A | | N/A |
The Statement of Additional Information of the Trust includes additional information about the Fund’s Trustees and is available upon request, without charge, by calling 1.800.959.4246. Please refer to the Fund’s Statement of Additional Information for information on the Fund’s sub-advisers.
| | | | | | |
Office of the Fund 11 Greenway Plaza, Suite 1000 Houston, TX 77046-1173 | | Investment Adviser Invesco Advisers, Inc. 1555 Peachtree Street, N.E. Atlanta, GA 30309 | | Distributor Invesco Distributors, Inc. 11 Greenway Plaza, Suite 1000 Houston, TX 77046-1173 | | Auditors PricewaterhouseCoopers LLP 1000 Louisiana Street, Suite 5800 Houston, TX 77002-5678 |
| | | |
| | | | | | |
Counsel to the Fund Stradley Ronon Stevens & Young, LLP 2005 Market Street, Suite 2600 Philadelphia, PA 19103-7018 | | Counsel to the Independent Trustees Goodwin Procter LLP 901 New York Avenue, N.W. Washington, D.C. 20001 | | Transfer Agent Invesco Investment Services, Inc. 11 Greenway Plaza, Suite 1000 Houston, TX 77046-1173 | | Custodian State Street Bank and Trust Company 225 Franklin Street Boston, MA 02110-2801 |
T-4 Invesco Small Cap Equity Fund
Explore High-Conviction Investing with Invesco

Invesco mailing information
Send general correspondence to Invesco Investment Services, Inc., P.O. Box 219078, Kansas City, MO 64121-9078.
Important notice regarding delivery of security holder documents
To reduce Fund expenses, only one copy of most shareholder documents may be mailed to shareholders with multiple accounts at the same address (Householding). Mailing of your shareholder documents may be householded indefinitely unless you instruct us otherwise. If you do not want the mailing of these documents to be combined with those for other members of your household, please contact Invesco Investment Services, Inc. at 800 959 4246 or contact your financial institution. We will begin sending you individual copies for each account within 30 days after receiving your request.
Fund holdings and proxy voting information
The Fund provides a complete list of its holdings four times in each fiscal year, at the quarter ends. For the second and fourth quarters, the lists appear in the Fund’s semiannual and annual reports to shareholders. For the first and third quarters, the Fund files the lists with the Securities and Exchange Commission (SEC) on Form N-Q. The most recent list of portfolio holdings is available at invesco.com/completeqtrholdings. Shareholders can also look up the Fund’s Forms N-Q on the SEC website at sec.gov. Copies of the Fund’s Forms N-Q may be reviewed and copied at the SEC Public Reference Room in Washington, D.C. You can obtain information on the operation of the Public Reference Room, including information about duplicating fee charges, by calling 202 551 8090 or 800 732 0330, or by electronic request at the following email address: publicinfo@sec.gov. The SEC file numbers for the Fund are shown below.
A description of the policies and procedures that the Fund uses to determine how to vote proxies relating to portfolio securities is available without charge, upon request, from our Client Services department at 800 959 4246 or at invesco.com/proxyguidelines. The information is also available on the SEC website, sec.gov.
| | |
Information regarding how the Fund voted proxies related to its portfolio securities during the most recent 12-month period ended June 30 is available at invesco.com/proxysearch. The information is also available on the SEC website, sec.gov. Invesco Advisers, Inc. is an investment adviser; it provides investment advisory services to individual and institutional clients and does not sell securities. Invesco Distributors, Inc. is the US distributor for Invesco Ltd.’s retail mutual funds, exchange-traded funds and institutional money market funds. Both are wholly owned, indirect subsidiaries of Invesco Ltd. | |  |
| | | | |
| SEC file numbers: 811-01540 and 002-27334 | | SCE-AR-1 | | Invesco Distributors, Inc. |
As of the end of the period covered by this report, the Registrant had adopted a code of ethics (the “Code”) that applies to the Registrant’s principal executive officer (“PEO”) and principal financial officer (“PFO”). There were no amendments to the Code during the period covered by the report. The Registrant did not grant any waivers, including implicit waivers, from any provisions of the Code to the PEO or PFO during the period covered by this report.
| ITEM 3. | AUDIT COMMITTEE FINANCIAL EXPERT. |
The Board of Trustees has determined that the Registrant has at least one audit committee financial expert serving on its Audit Committee. The Audit Committee financial expert is Raymond Stickel, Jr. Mr. Stickel is “independent” within the meaning of that term as used in Form N-CSR.
| ITEM 4. | PRINCIPAL ACCOUNTANT FEES AND SERVICES. |
PricewaterhouseCoopers LLP informed the Trust that it has identified an issue related to its independence under Rule 2-01(c)(1)(ii)(A) of Regulation S-X (referred to as the Loan Rule). The Loan Rule prohibits accounting firms, such as PricewaterhouseCoopers LLP, from being deemed independent if they have certain financial relationships with their audit clients or certain affiliates of those clients. The Trust is required under various securities laws to have its financial statements audited by an independent accounting firm.
The Loan Rule specifically provides that an accounting firm would not be independent if it or certain affiliates and covered persons receives a loan from a lender that is a record or beneficial owner of more than ten percent of an audit client’s equity securities (referred to as a “more than ten percent owner”). For purposes of the Loan Rule, audit clients include the Funds as well as all registered investment companies advised by the Adviser and its affiliates, including other subsidiaries of the Adviser’s parent company, Invesco Ltd. (collectively, the Invesco Fund Complex). PricewaterhouseCoopers LLP informed the Trust it and certain affiliates and covered persons have relationships with lenders who hold, as record owner, more than ten percent of the shares of certain funds within the Invesco Fund Complex, which may implicate the Loan Rule.
On June 20, 2016, the SEC Staff issued a “no-action” letter to another mutual fund complex (see Fidelity Management & Research Company et al., No-Action Letter) related to the audit independence issue described above. In that letter, the SEC confirmed that it would not recommend enforcement action against a fund that relied on audit services performed by an audit firm that was not in compliance with the Loan Rule in certain specified circumstances. In connection with prior independence determinations, PricewaterhouseCoopers LLP communicated, as contemplated by the no-action letter, that it believes that it remains objective and impartial and that a reasonable investor possessing all the facts would conclude that PricewaterhouseCoopers LLP is able to exhibit the requisite objectivity and impartiality to report on the Funds’ financial statements as the independent registered public accounting firm. PricewaterhouseCoopers LLP also represented that it has complied with PCAOB Rule 3526(b)(1) and (2), which are conditions to the Funds relying on the no action letter, and affirmed that it is an independent accountant within the meaning of PCAOB Rule 3520. Therefore, the Adviser, the Funds and PricewaterhouseCoopers LLP concluded that PricewaterhouseCoopers LLP could continue as the Funds’ independent registered public accounting firm. The Invesco Fund Complex relied upon the no-action letter in reaching this conclusion.
If in the future the independence of PricewaterhouseCoopers LLP is called into question under the Loan Rule by circumstances that are not addressed in the SEC’s no-action letter, the Funds will need to take other action in order for the Funds’ filings with the SEC containing financial statements to be deemed compliant with applicable securities laws. Such additional actions could result in additional costs, impair the ability of the Funds to issue new shares or have other material adverse effects on the Funds. In addition, the SEC has indicated that the no-action relief
will expire 18 months from its issuance after which the Invesco Funds will no longer be able to rely on the letter unless its term is extended or made permanent by the SEC Staff.
(a) to (d)
Fees Billed by PWC Related to the Registrant
PWC billed the Registrant aggregate fees for services rendered to the Registrant for the last two fiscal years as follows:
| | | | |
| | | Fees Billed for
Services Rendered
to the Registrant
for fiscal year end
2016 | | Fees Billed for
Services Rendered
to the Registrant for
fiscal year end 2015 |
| | |
Audit Fees | | $ 115,600 | | $ 115,600 |
Audit-Related Fees | | $ 0 | | $ 0 |
Tax Fees(1) | | $ 38,612 | | $ 67,764 |
All Other Fees | | $ 0 | �� | $ 0 |
Total Fees | | $ 154,212 | | $ 183,364 |
(g) PWC billed the Registrant aggregate non-audit fees of $38,612 for the fiscal year ended 2016, and $67,764 for the fiscal year ended 2015, for non-audit services rendered to the Registrant.
| | (1) | Tax fees for the fiscal year end December 31, 2016 includes fees billed for reviewing tax returns and/or services related to tax compliance. Tax fees for fiscal year end December 31, 2015 includes fees billed for reviewing tax returns and/or services related to tax compliance. |
Fees Billed by PWC Related to Invesco and Invesco Affiliates
PWC billed Invesco Advisers, Inc. (“Invesco”), the Registrant’s adviser, and any entity controlling, controlled by or under common control with Invesco that provides ongoing services to the Registrant (“Invesco Affiliates”) aggregate fees for pre-approved non-audit services rendered to Invesco and Invesco Affiliates for the last two fiscal years as follows:
| | | | |
| | | Fees Billed for Non-
Audit Services
Rendered to Invesco
and Invesco
Affiliates for fiscal
year end 2016 That
Were Required
to be Pre-Approved
by the Registrant’s
Audit Committee | | Fees Billed for Non-
Audit Services
Rendered to Invesco
and Invesco
Affiliates for fiscal
year end 2015 That
Were Required
to be Pre-Approved
by the Registrant’s
Audit Committee |
| | |
Audit-Related Fees | | $ 635,000 | | $ 574,000 |
Tax Fees | | $ 0 | | $ 0 |
All Other Fees | | $ 2,432,000 | | $ 3,750,000 |
Total Fees(1) | | $ 3,067,000 | | $ 4,324,000 |
| (1) | Audit-Related fees for the year end 2016 include fees billed related to reviewing controls at a service organization. Audit-Related fees for the year end 2015 include fees billed related to reviewing controls at a service organization. |
All other fees for the year end 2016 include fees billed related to the identification of structural and organizational alternatives, informed by industry practices, for certain of the company’s administrative activities and functions. All other fees for the year end 2015 include fees billed related to reviewing the operating effectiveness of strategic projects.
(e)(2) There were no amounts that were pre-approved by the Audit Committee pursuant to the de minimus exception under Rule 2-01 of Regulation S-X.
(g) Including the fees for services not required to be pre-approved by the registrant’s audit committee, PWC billed Invesco and Invesco Affiliates aggregate non-audit fees of $5,763,000 for the fiscal year ended December 31, 2016, and $9,099,000 for the fiscal year ended December 31, 2015, for non-audit services rendered to Invesco and Invesco Affiliates.
PWC provided audit services to the Investment Company complex of approximately $22 million.
(h) The Audit Committee also has considered whether the provision of non-audit services that were rendered to Invesco and Invesco Affiliates that were not required to be pre-approved pursuant to SEC regulations, if any, is compatible with maintaining PWC’s independence.
(f) Not applicable.
(e)(1)
PRE-APPROVAL OF AUDIT AND NON-AUDIT SERVICES
POLICIES AND PROCEDURES
As adopted by the Audit Committees
of the Invesco Funds (the “Funds”)
Last Amended May 4, 2016
| | I. | Statement of Principles |
The Audit Committees (the “Audit Committee”) of the Boards of Trustees of the Funds (the “Board”) have adopted these policies and procedures (the “Procedures”) with respect to the pre-approval of audit and non-audit services to be provided by the Funds’ independent auditor (the “Auditor”) to the Funds, and to the Funds’ investment adviser(s) and any entity controlling, controlled by, or under common control with the investment adviser(s) that provides ongoing services to the Funds (collectively, “Service Affiliates”).
Under Section 202 of the Sarbanes-Oxley Act of 2002, all audit and non-audit services provided to the Funds by the Auditor must be preapproved by the Audit Committee. Rule 2-01 of Regulation S-X requires that the Audit Committee also pre-approve a Service Affiliate’s engagement of the Auditor for non-audit services if the engagement relates directly to the operations and financial reporting of the Funds (a “Service Affiliate’s Covered Engagement”).
These Procedures set forth the procedures and the conditions pursuant to which the Audit Committee may pre-approve audit and non-audit services for the Funds and a Service Affiliate’s Covered Engagement pursuant to rules and regulations of the Securities and Exchange Commission (“SEC”) and other organizations and regulatory bodies applicable to the Funds (“Applicable Rules”).1 They address both general pre-approvals without consideration of specific case-by-case services (“general pre-approvals”) and pre-approvals on a case-by-case basis (“specific pre-approvals”). Any services requiring pre-approval that are not within the scope of general pre-approvals hereunder are subject to specific pre-approval. These Procedures also address the delegation by the Audit Committee of pre-approval authority to the Audit Committee Chair or Vice Chair.
| | II. | Pre-Approval of Fund Audit Services |
The annual Fund audit services engagement, including terms and fees, is subject to specific pre-approval by the Audit Committee. Audit services include the annual financial statement audit and other procedures required to be performed by an independent auditor to be able to form an opinion on the Funds’ financial statements. The Audit Committee will receive, review and consider sufficient information concerning a proposed Fund audit engagement to make a reasonable evaluation of the Auditor’s qualifications and
| 1 | Applicable Rules include, for example, New York Stock Exchange (“NYSE”) rules applicable to closed-end funds managed by Invesco and listed on NYSE. |
independence. The Audit Committee will oversee the Fund audit services engagement as necessary, including approving any changes in terms, audit scope, conditions and fees.
In addition to approving the Fund audit services engagement at least annually and specifically approving any changes, the Audit Committee may generally or specifically pre-approve engagements for other audit services, which are those services that only an independent auditor reasonably can provide. Other audit services may include services associated with SEC registration statements, periodic reports and other documents filed with the SEC.
| | III. | General and Specific Pre-Approval of Non-Audit Fund Services |
The Audit Committee will consider, at least annually, the list of General Pre-Approved Non-Audit Services which list may be terminated or modified at any time by the Audit Committee. To inform the Audit Committee’s review and approval of General Pre-Approved Non-Audit Services, the Funds’ Treasurer (or his or her designee) and Auditor shall provide such information regarding independence or other matters as the Audit Committee may request.
Any services or fee ranges that are not within the scope of General Pre-Approved Non-Audit Services have not received general pre-approval and require specific pre-approval. Each request for specific pre-approval by the Audit Committee for services to be provided by the Auditor to the Funds must be submitted to the Audit Committee by the Funds’ Treasurer (or his or her designee) and must include detailed information about the services to be provided, the fees or fee ranges to be charged, and other relevant information sufficient to allow the Audit Committee to consider whether to pre-approve such engagement, including evaluating whether the provision of such services will impair the independence of the Auditor and is otherwise consistent with Applicable Rules.
| | IV. | Non-Audit Service Types |
The Audit Committee may provide either general or specific pre-approval of audit-related, tax or other services, each as described in more detail below.
“Audit-related services” are assurance and related services that are reasonably related to the performance of the audit or review of the Fund’s financial statements or that are traditionally performed by an independent auditor. Audit-related services include, among others, accounting consultations related to accounting, financial reporting or disclosure matters not classified as “Audit services”; assistance with understanding and implementing new accounting and financial reporting guidance from rulemaking authorities; services related to mergers, acquisitions or dispositions; compliance with ratings agency requirements and interfund lending activities; and assistance with internal control reporting requirements.
“Tax services” include, but are not limited to, the review and signing of the Funds’ federal tax returns, the review of required distributions by the Funds and consultations regarding tax matters such as the tax treatment of new investments or the impact of new regulations. The Audit Committee will not approve proposed services of the Auditor which the Audit Committee believes are to be provided in connection with a service or transaction initially recommended by the Auditor, the sole business purpose of which may be tax avoidance and the tax treatment of which may not be supported in the Internal Revenue Code and related regulations. The Audit Committee will consult with the Funds’ Treasurer (or his or her designee) and may consult with outside counsel or advisers as necessary to ensure the consistency of tax services rendered by the Auditor with the foregoing policy. The Auditor shall not represent any Fund or any Service Affiliate before a tax court, district court or federal court of claims.
Each request to provide tax services under either the general or specific pre-approval of the Audit Committee will include a description from the Auditor in writing of (i) the scope of the service, the fee structure for the engagement, and any side letter or other amendment to the engagement letter, or any other agreement (whether oral, written, or otherwise) between the Auditor and the Funds, relating to the service;
and (ii) any compensation arrangement or other agreement, such as a referral agreement, a referral fee or fee-sharing arrangement, between the Auditor (or an affiliate of the Auditor) and any person (other than the Funds or Service Affiliates receiving the services) with respect to the promoting, marketing, or recommending of a transaction covered by the service. The Auditor will also discuss with the Audit Committee the potential effects of the services on the independence of the Auditor, and document the substance of its discussion with the Audit Committee.
The Audit Committee may pre-approve other non-audit services so long as the Audit Committee believes that the service will not impair the independence of the Auditor. Appendix I includes a list of services that the Auditor is prohibited from performing by the SEC rules. Appendix I also includes a list of services that would impair the Auditor’s independence unless the Audit Committee reasonably concludes that the results of the services will not be subject to audit procedures during an audit of the Funds’ financial statements.
| | V. | Pre-Approval of Service Affiliate’s Covered Engagements |
Rule 2-01 of Regulation S-X requires that the Audit Committee pre-approve a Service Affiliate’s engagement of the Auditor for non-audit services if the engagement relates directly to the operations and financial reporting of the Funds, defined above as a “Service Affiliate’s Covered Engagement”.
The Audit Committee may provide either general or specific pre-approval of any Service Affiliate’s Covered Engagement, including for audit-related, tax or other services, as described above, if the Audit Committee believes that the provision of the services to a Service Affiliate will not impair the independence of the Auditor with respect to the Funds. Any Service Affiliate’s Covered Engagements that are not within the scope of General Pre-Approved Non-Audit Services have not received general pre-approval and require specific pre-approval.
Each request for specific pre-approval by the Audit Committee of a Service Affiliate’s Covered Engagement must be submitted to the Audit Committee by the Funds’ Treasurer (or his or her designee) and must include detailed information about the services to be provided, the fees or fee ranges to be charged, a description of the current status of the pre-approval process involving other audit committees in the Invesco investment company complex (as defined in Rule 2-201 of Regulation S-X) with respect to the proposed engagement, and other relevant information sufficient to allow the Audit Committee to consider whether the provision of such services will impair the independence of the Auditor from the Funds. Additionally, the Funds’ Treasurer (or his or her designee) and the Auditor will provide the Audit Committee with a statement that the proposed engagement requires pre-approval by the Audit Committee, the proposed engagement, in their view, will not impair the independence of the Auditor and is consistent with Applicable Rules, and the description of the proposed engagement provided to the Audit Committee is consistent with that presented to or approved by the Invesco audit committee.
Information about all Service Affiliate engagements of the Auditor for non-audit services, whether or not subject to pre-approval by the Audit Committee, shall be provided to the Audit Committee at least quarterly, to allow the Audit Committee to consider whether the provision of such services is compatible with maintaining the Auditor’s independence from the Funds. The Funds’ Treasurer and Auditor shall provide the Audit Committee with sufficiently detailed information about the scope of services provided and the fees for such services, to ensure that the Audit Committee can adequately consider whether the provision of such services is compatible with maintaining the Auditor’s independence from the Funds.
| | VI. | Pre-Approved Fee Levels or Established Amounts |
Pre-approved fee levels or ranges for audit and non-audit services to be provided by the Auditor to the Funds, and for a Service Affiliate’s Covered Engagement, under general pre-approval or specific pre-approval will be set periodically by the Audit Committee. Any proposed fees exceeding 110% of the maximum pre-approved fee levels or ranges for such services or engagements will be promptly presented to the Audit Committee and will require specific pre-approval by the Audit Committee before payment of any additional fees is made.
The Audit Committee may from time to time delegate specific pre-approval authority to its Chair and/or Vice Chair, so that the Chair or, in his or her absence, Vice Chair may grant specific pre-approval for audit and non-audit services by the Auditor to the Funds and/or a Service Affiliate’s Covered Engagement between Audit Committee meetings. Any such delegation shall be reflected in resolutions adopted by the Audit Committee and may include such limitations as to dollar amount(s) and/or scope of service(s) as the Audit Committee may choose to impose. Any such delegation shall not preclude the Chair or Vice Chair from declining, on a case by case basis, to exercise his or her delegated authority and instead convening the Audit Committee to consider and pre-approve any proposed services or engagements.
Notwithstanding the foregoing, any non-audit services to be provided to the Funds for which the fees are estimated to exceed $500,000 and any Service Affiliate’s Covered Engagement for which the fees are estimated to exceed $500,000 must be pre-approved by the Audit Committee and may not be delegated to the Chair or Vice Chair.
| | VIII. | Compliance with Procedures |
Notwithstanding anything herein to the contrary, failure to pre-approve any services or engagements that are not required to be pre-approved pursuant to the de minimis exception provided for in Rule 2-01(c)(7)(i)(C) of Regulation S-X shall not constitute a violation of these Procedures. The Audit Committee has designated the Funds’ Treasurer to ensure services and engagements are pre-approved in compliance with these Procedures. The Funds’ Treasurer will immediately report to the Chair of the Audit Committee, or the Vice Chair in his or her absence, any breach of these Procedures that comes to the attention of the Funds’ Treasurer or any services or engagements that are not required to be pre-approved pursuant to the de minimis exception provided for in Rule 2-01(c)(7)(i)(C) of Regulation S-X.
On at least an annual basis, the Auditor will provide the Audit Committee with a summary of all non-audit services provided to any entity in the investment company complex (as defined in section 2-01(f)(14) of Regulation S-X, including the Funds and Service Affiliates) that were not pre-approved, including the nature of services provided and the associated fees.
| | IX. | Amendments to Procedures |
All material amendments to these Procedures must be approved in advance by the Audit Committee. Non-material amendments to these Procedures may be made by the Legal and Compliance Departments and will be reported to the Audit Committee at the next regularly scheduled meeting of the Audit Committee.
Appendix I
Non-Audit Services That May Impair the Auditor’s Independence
The Auditor is not independent if, at any point during the audit and professional engagement, the Auditor provides the following non-audit services:
| | • | | Broker-dealer, investment adviser, or investment banking services ; |
| | • | | Expert services unrelated to the audit; |
| | • | | Any service or product provided for a contingent fee or a commission; |
| | • | | Services related to marketing, planning, or opining in favor of the tax treatment of confidential transactions or aggressive tax position transactions, a significant purpose of which is tax avoidance; |
| | • | | Tax services for persons in financial reporting oversight roles at the Fund; and |
| | • | | Any other service that the Public Company Oversight Board determines by regulation is impermissible. |
An Auditor is not independent if, at any point during the audit and professional engagement, the Auditor provides the following non-audit services unless it is reasonable to conclude that the results of the services will not be subject to audit procedures during an audit of the Funds’ financial statements:
| | • | | Bookkeeping or other services related to the accounting records or financial statements of the audit client; |
| | • | | Financial information systems design and implementation; |
| | • | | Appraisal or valuation services, fairness opinions, or contribution-in-kind reports; |
| | • | | Actuarial services; and |
| | • | | Internal audit outsourcing services. |
| ITEM 5. | AUDIT COMMITTEE OF LISTED REGISTRANTS. |
Not applicable.
| ITEM 6. | SCHEDULE OF INVESTMENTS. |
Investments in securities of unaffiliated issuers is included as part of the reports to stockholders filed under Item 1 of this Form.
| ITEM 7. | DISCLOSURE OF PROXY VOTING POLICIES AND PROCEDURES FOR CLOSED-END MANAGEMENT INVESTMENT COMPANIES. |
Not applicable.
| ITEM 8. | PORTFOLIO MANAGERS OF CLOSED-END MANAGEMENT COMPANIES. |
Not applicable.
| ITEM 9. | PURCHASES OF EQUITY SECURITIES BY CLOSED-END MANAGEMENT INVESTMENT COMPANY AND AFFILIATED PURCHASERS. |
Not applicable.
| ITEM 10. | SUBMISSION OF MATTERS TO A VOTE OF SECURITY HOLDERS. |
None
| ITEM 11. | CONTROLS AND PROCEDURES. |
| (a) | As of February 13, 2017, an evaluation was performed under the supervision and with the participation of the officers of the Registrant, including the PEO and PFO, to assess the effectiveness of the Registrant’s disclosure controls and procedures, as that term is defined in Rule 30a-3(c) under the Investment Company Act of 1940 (the “Act”), as amended. Based on that evaluation, the Registrant’s officers, including the PEO and PFO, concluded that, as of February 13, 2017 the Registrant’s disclosure controls and procedures were reasonably designed to ensure: (1) that information required to be disclosed by the Registrant on Form N-CSR is recorded, processed, summarized and reported within the time periods specified by the rules and forms of the Securities and Exchange Commission; and (2) that material information relating to the Registrant is made known to the PEO and PFO as appropriate to allow timely decisions regarding required disclosure. |
| (b) | There have been no changes in the Registrant’s internal control over financial reporting (as defined in Rule 30a-3(d) under the Act) that occurred during the second fiscal quarter of the period covered by this report that have materially affected, or are reasonably likely to materially affect, the Registrant’s internal control over financial reporting. |
ITEM 12. EXHIBITS.
| | |
| |
| 12(a) (1) | | Code of Ethics. |
| |
| 12(a) (2) | | Certifications of principal executive officer and principal financial officer as required by Rule 30a-2(a) under the Investment Company Act of 1940. |
| |
| 12(a) (3) | | Not applicable. |
| |
| 12(b) | | Certifications of principal executive officer and principal financial officer as required by Rule 30a-2(b) under the Investment Company Act of 1940. |
SIGNATURES
Pursuant to the requirements of the Securities Exchange Act of 1934 and the Investment Company Act of 1940, the Registrant has duly caused this report to be signed on its behalf by the undersigned, thereunto duly authorized.
Registrant: AIM Funds Group (Invesco Funds Group)
| | |
| By: | | /s/ Sheri Morris |
| | Sheri Morris |
| | Principal Executive Officer |
| |
| Date: | | March 9, 2017 |
Pursuant to the requirements of the Securities and Exchange Act of 1934 and the Investment Company Act of 1940, this report has been signed below by the following persons on behalf of the Registrant and in the capacities and on the dates indicated.
| | |
| By: | | /s/ Sheri Morris |
| | Sheri Morris |
| | Principal Executive Officer |
| |
| Date: | | March 9, 2017 |
| | |
| By: | | /s/ Kelli Gallegos |
| | Kelli Gallegos |
| | Principal Financial Officer |
| |
| Date: | | March 9, 2017 |
EXHIBIT INDEX
| | |
| 12(a) (1) | | Code of Ethics. |
| |
| 12(a) (2) | | Certifications of principal executive officer and principal financial officer as required by Rule 30a-2(a) under the Investment Company Act of 1940. |
| |
| 12(a) (3) | | Not applicable. |
| |
| 12(b) | | Certifications of principal executive officer and principal financial officer as required by Rule 30a-2(b) under the Investment Company Act of 1940. |