UNITED STATES
SECURITIES AND EXCHANGE COMMISSION
Washington, D.C. 20549
FORMN-CSR
CERTIFIED SHAREHOLDER REPORT OF REGISTERED
MANAGEMENT INVESTMENT COMPANIES
Investment Company Act file number 811-01540
AIM Funds Group (Invesco Funds Group)
(Exact name of registrant as specified in charter)
11 Greenway Plaza, Suite 1000 Houston, Texas 77046
(Address of principal executive offices) (Zip code)
Sheri Morris 11 Greenway Plaza, Suite 1000 Houston, Texas 77046
(Name and address of agent for service)
Registrant’s telephone number, including area code: (713)626-1919
Date of fiscal year end: 12/31
Date of reporting period: 12/31/18
Item 1. Report to Stockholders.
| | | | |
 | | Annual Report to Shareholders | | December 31, 2018 |
| | Invesco European Small Company Fund Nasdaq: A: ESMAX ∎ C: ESMCX ∎ Y: ESMYX ∎ R6: ESMSX |

Letters to Shareholders
| | | | |

Philip Taylor | | | | Dear Shareholders: This annual report includes information about your Fund, including performance data and a complete list of its investments as of the close of the reporting period. Inside is a discussion of how your Fund was managed and the factors that affected its performance during the reporting period. From record market highs to an explosive late-year downturn, 2018 was a memorable and volatile year for investors. US equity markets entered 2018 enthused by corporate tax cuts and improving global growth. Despite asell-off in February, several US equity indexes continued to redefine highs for the first three quarters of the year. The ebullience, however, ended in October as global equities, in particular US stocks, sold off sharply and continued this volatile downward spiral for the rest of the year. The catalyst for thesell-off was a combination of ongoing trade conflicts between the US and China, fears of a global economic slowdown and rising US interest rates. Gains posted earlier in the year were erased as |
most US and international equity indexes ended 2018 in negative territory. During the late-year equitysell-off, Treasury bonds, along with government and municipal bonds, rallied. In general, fixed income markets outperformed equity markets for the year as yields declined from earlier highs and, conversely, bond prices rose. Given the strong economy, the US Federal Reserve (the Fed) raised the federal funds rate four times in 2018. In December, however, the Fed delivered a more “dovish hike” by simultaneously raising rates while reducing guidance for 2019 rate increases from three to two. As 2019 unfolds, we’ll see how the interplay of interest rates, economic data, geopolitics and a host of other factors affect US and over- seas equity and fixed income markets.
Short-term market volatility can prompt some investors to abandon their investment plans – and can cause others to settle for whatever returns the market has to offer. The investment professionals at Invesco, in contrast, invest with high conviction. This means that, no matter the asset class or the strategy, each investment team has a passion to exceed. We want to help investors achieve better outcomes, such as seeking higher returns, helping mitigate risk and generating income. Of course, investing with high conviction can’t guarantee a profit or ensure success; no investment strategy can. To learn more about how we invest with high conviction, visitinvesco.com/HighConviction.
You, too, can invest with high conviction by maintaining a long-term investment perspective and by working with your financial adviser on a regular basis. During periods of short-term market volatility or uncertainty, your financial adviser can keep you focused on your long-term investment goals – a new home, a child’s college education or a secure retirement. He or she also can share research about the economy, the markets and individual investment options.
Visit our website for more information on your investments
Our website,invesco.com/us, offers a wide range of market insights and investment perspectives. On the website, you’ll find detailed information about our funds, including performance, holdings and portfolio manager commentaries. You can access information about your account by completing a simple, secure online registration. To do so, select “Log In” on the right side of the homepage, and then select “Register for Individual Account Access.”
In addition to the resources accessible on our website and through our mobile app, you can obtain timely updates to help you stay informed about the markets and the economy by connecting with Invesco on Twitter, LinkedIn or Facebook. You can access our blog atblog.invesco.us.com. Our goal is to provide you the information you want, when and where you want it.
Finally, I’m pleased to share with you Invesco’s commitment to both the Principles for Responsible Investment and to considering environmental, social and governance issues in our robust investment process. I invite you to learn more atinvesco.com/esg.
Have questions?
For questions about your account, contact an Invesco client services representative at 800 959 4246.
All of us at Invesco look forward to serving your investment management needs. Thank you for investing with us.
Sincerely,

Philip Taylor
Senior Managing Director, Invesco Ltd.
2 Invesco European Small Company Fund
| | | | |

Bruce Crockett | | | | Dear Fellow Shareholders: Among the many important lessons I’ve learned in more than 40 years in a variety of business endeavors is the value of a trusted advocate. As independent chair of the Invesco Funds Board, I can assure you that the members of the Board are strong advocates for the interests of investors in Invesco’s mutual funds. We work hard to represent your interests through oversight of the quality of the investment management services your funds receive and other matters important to your investment, including but not limited to: ∎ Ensuring that Invesco offers a diverse lineup of mutual funds that your financial adviser can use to strive to meet your financial needs as your investment goals change over time. ∎ Monitoring how the portfolio management teams of the Invesco funds are performing in light of changing economic and market conditions. |
| ∎ | | Assessing each portfolio management team’s investment performance within the context of the investment strategy described in the fund’s prospectus. |
| ∎ | | Monitoring for potential conflicts of interests that may impact the nature of the services that your funds receive. |
We believe one of the most important services we provide our fund shareholders is the annual review of the funds’ advisory andsub-advisory contracts with Invesco Advisers and its affiliates. This review is required by the Investment Company Act of 1940 and focuses on the nature and quality of the services Invesco provides as the adviser to the Invesco funds and the reasonableness of the fees that it charges for those services. Each year, we spend months carefully reviewing information received from Invesco and a variety of independent sources, such as performance and fee data prepared by Lipper, Inc. (a subsidiary of Broadridge Financial Solutions, Inc.), an independent, third-party firm widely recognized as a leader in its field. We also meet with our independent legal counsel and other independent advisers to review and help us assess the information that we have received. Our goal is to assure that you receive quality investment management services for a reasonable fee.
I trust the measures outlined above provide assurance that you have a worthy advocate when it comes to choosing the Invesco Funds. On behalf of the Board, we look forward to continuing to represent your interests and serving your needs.
Sincerely,

Bruce L. Crockett
Independent Chair
Invesco Funds Board of Trustees
3 Invesco European Small Company Fund
Management’s Discussion of Fund Performance
Performance summary
For the year ended December 31, 2018, Class A shares of Invesco European Small Company Fund (the Fund), at net asset value (NAV), outperformed the MSCI Europe Small Cap Index, the Fund’s style-specific benchmark.
Your Fund’s long-term performance appears later in this report.
Fund vs. Indexes
Total returns, 12/31/17 to 12/31/18, at net asset value (NAV). Performance shown does not include applicable contingent deferred sales charges (CDSC) orfront-end sales charges, which would have reduced performance.
| | | | | |
| Class A Shares | | | | -15.21 | % |
| Class C Shares | | | | -15.89 | |
| Class Y Shares | | | | -15.01 | |
| Class R6 Shares | | | | -14.93 | |
| MSCI Europe Index▼(Broad Market Index) | | | | -14.86 | |
| MSCI Europe Small Cap Index▼(Style-Specific Index) | | | | -19.90 | |
| Lipper European Funds Index⬛(Peer Group Index) | | | | -16.24 | |
Source(s):▼RIMES Technologies Corp.;⬛Lipper Inc. | | | | | |
Market conditions and your Fund
Calendar year 2018 proved to be an increasingly volatile time for global equities. After strong positive returns in January, global equities sold off sharply in February as rising inflation spurred concern that central banks would raise interest rates at a faster pace than previously expected. Through the rest of the first quarter, equity markets struggled to regain momentum, hampered by global trade tensions and weakness in technology stocks. Somewhat counterintuitively, emerging markets generally held up better than developed markets in this volatile environment.
Significant market and currency volatility continued during the second quarter of 2018. While most domestic equity indexes delivered positive performance for the second quarter, major international indexes generally had negative results. Many international stocks struggled as investors worried that heightened global trade tensions would derail economic growth. Other concerns such as geopolitical uncertainty and the potential
impact of higher interest rates also weakened investor sentiment. In this environment, developed markets held up better than emerging markets. After a relatively quiet summer, market volatility markedly rose again in October. Global equity markets (particularly the US) declined sharply in the fourth quarter amid rising interest rates and concerns that higher inflation could result in a more restrictive monetary policy. Investors also had concerns over the Brexit negotiations, ongoingUS-China trade tensions, declining oil prices and fears of slowing economic growth, particularly in the eurozone.
Given signs of a strong economy, the US Federal Reserve (the Fed) raised interest rates four times during the year. Following December’s meeting, the Fed raised interest rates by 25 basis points and lowered guidance from three to two rate hikes in 2019, signaling a slightly more dovish stance than expected.1 In contrast, the European Central Bank held rates steady, indicating it would do so at least through the summer of 2019; however, it announced that its bond buying
program would be discontinued at year end. Central banks in several other countries maintained extraordinarily accommodative monetary policies, as well.
During the year, stock selection in the industrials and financials sectors was among the largest contributors to the Fund’s performance relative to its style-specific benchmark. Particular strength was seen in the commercial and professional services industry within the industrials sector, and in the banking industry within the financials sector. Conversely, the Fund’s holdings in the communication services and real estate sectors under-performed those of the style-specific benchmark and detracted from the Fund’s relative performance for the year. Underweight allocations to both sectors also dragged on the Fund’s performance relative to the style-specific benchmark during the year.
On a geographic basis, the Fund’s exposure to Romania and Israel, countries not represented in the style-specific benchmark, contributed to relative performance, as both regions posted positive absolute results. In contrast, stock selection in the UK and lack of exposure to Sweden detracted from relative returns during the year.
The Fund’s double-digit cash position in a declining market environment was a meaningful contributor to performance versus the style-specific benchmark. It is important to note that similar to the Fund’s sector and regional allocations, cash is a residual of ourbottom-up investment process and not the result of anytop-down tactical asset allocation or risk-management allocation decision.
From an individual securities perspective,UK-based recruitment companyStaffline Group was the most significant contributor to Fund performance during the year. The company reported better-than-expected results, with both its
| | | | | |
| By sector | | % of total net assets |
| |
| Industrials | | | | 28.8 | % |
| Financials | | | | 19.7 | |
| Information Technology | | | | 12.4 | |
| Consumer Discretionary | | | | 9.5 | |
| Consumer Staples | | | | 7.1 | |
| Energy | | | | 4.4 | |
| Health Care | | | | 3.7 | |
| Communication Services | | | | 2.5 | |
| Real Estate | | | | 1.8 | |
Money Market Funds Plus Other Assets Less Liabilities | | | | 10.1 | |
| | | | | | | |
| | |
| 1. | | Origin Enterprises PLC | | | | 4.0 | % |
| 2. | | Fondul Proprietatea S.A. | | | | 3.5 | |
| 3. | | Linedata Services | | | | 3.2 | |
| 4. | | Kardex AG | | | | 2.9 | |
| 5. | | Societatea Nationala de Gaze Naturale ROMGAZ S.A. | | | | 2.8 | |
| 6. | | Israel Discount Bank Ltd. | | | | 2.6 | |
| 7. | | Staffline Group PLC | | | | 2.4 | |
| 8. | | Danieli & C Officine Meccaniche S.p.A. | | | | 2.4 | |
| 9. | | MorphoSys AG | | | | 2.2 | |
| 10. | | Hilan Ltd. | | | | 2.1 | |
| | | | | |
Total Net Assets | | | $ | 578.9 million | |
| |
| Total Number of Holdings* | | | | 68 | |
The Fund’s holdings are subject to change, and there is no assurance that the Fund will continue to hold any particular security.
*Excluding money market fund holdings.
Data presented here are as of December 31, 2018.
4 Invesco European Small Company Fund
recruitment division and PeoplePlus, its training, skills and well-being services division, making good progress during the year.
In contrast, French business process outsourcerTessi was among the largest detractors from the Fund’s absolute performance for the year. The company faced difficulty during the first half of the year as a result of a prior acquisition that would require a greater integration effort than anticipated. In addition, there were some adverse tax developments in France. We believe that Tessi has a strong record of value creation and that most of the current challenges are transitory. Recently, the majority owner bid for the remaining shares in the company. We continued to hold our shares in Tessi at the end of the year.
Over the year, we continued to look for opportunities to improve the growth potential and quality of the Fund’s portfolio by adding companies based on our earnings, quality and valuation (EQV) outlook for each company. We added several new holdings during the year, includingUK-based gaming companyJPJ Group, Italy-based consumer finance companyGruppo MutuiOnline, Italy-based production and distribution animation companyMondo TV, Poland-based,Warsaw Stock Exchange, Hungary-based pharmaceutical and biotechnology companyRichter Gedeon, and Georgia-basedTBC Bank Group. We also trimmed or sold Fund holdings with EQV characteristics that were no longer as compelling as when we first initiated positions in them, including France-basedTrigano, Norway-basedNextGenTel Holding,UK-basedTP ICAP and Germany-basedSMT Scharf.
As always, regardless of the macroeconomic environment, we remain focused on abottom-up investment approach of identifying attractive companies that fit ourEQV-focused investment process. We continue to look for high-quality growth companies that exhibit the following characteristics: strong organic revenue growth, high returns on capital, pricing power, strong balance sheets, cash generation, effective capital allocation and reasonable valuations. In addition, we continue to favor companies that are resilient in weak economic environments. Our balancedEQV-focused approach aligns with the Fund’s investment objective of long-term growth of capital.
We thank you for your continued investment in Invesco European Small Company Fund.
1 Source: US Federal Reserve
The views and opinions expressed in management’s discussion of Fund performance are those of Invesco Advisers, Inc. These views and opinions are subject to change at any time based on factors such as market and economic conditions. These views and opinions may not be relied upon as investment advice or recommendations, or as an offer for a particular security. The information is not a complete analysis of every aspect of any market, country, industry, security or the Fund. Statements of fact are from sources considered reliable, but Invesco Advisers, Inc. makes no representation or warranty as to their completeness or accuracy. Although historical performance is no guarantee of future results, these insights may help you understand our investment management philosophy.
See important Fund and, if applicable, index disclosures later in this report.
| | |
 | | Jason Holzer Chartered Financial Analyst, Portfolio Manager, is lead manager of Invesco European Small |
| Company Fund. He joined Invesco in 1996. Mr. Holzer earned a BA in quantitative economics and an MS in engineering economic systems from Stanford University. |
| |
 | | Borge Endresen Chartered Financial Analyst, Portfolio Manager, is manager of Invesco European Small Company Fund. He |
| joined Invesco in 1999. Mr. Endresen earned a BS in finance from the University of Oregon and an MBA from The University of Texas at Austin. |
5 Invesco European Small Company Fund
Your Fund’s Long-Term Performance
Results of a $10,000 Investment – Oldest Share Class(es)
Fund and index data from 12/31/08
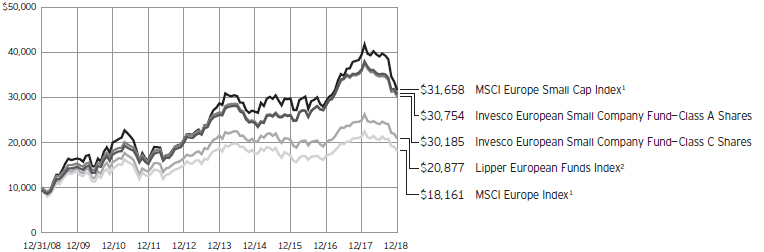
| 1 Source: | RIMES Technologies Corp. |
Past performance cannot guarantee comparable future results.
The data shown in the chart include reinvested distributions, applicable sales charges and Fund expenses including
management fees. Index results include reinvested dividends, but they do not reflect sales charges. Performance of the peer group, if applicable, reflects fund expenses and management fees; performance
of a market index does not. Performance shown in the chart and table(s) does not reflect deduction of taxes a shareholder would pay on Fund distributions or sale of Fund shares.
6 Invesco European Small Company Fund
| | | | | |
Average Annual Total Returns | |
| As of 12/31/18, including maximum applicable sales charges | |
| |
| Class A Shares | | | | | |
| Inception (08/31/00) | | | | 9.77 | % |
| 10 Years | | | | 11.89 | |
| 5 Years | | | | 2.13 | |
| 1 Year | | | | -19.85 | |
| |
| Class C Shares | | | | | |
| Inception (08/31/00) | | | | 9.31 | % |
| 10 Years | | | | 11.68 | |
| 5 Years | | | | 2.50 | |
| 1 Year | | | | -16.68 | |
| |
| Class Y Shares | | | | | |
| Inception (10/3/08) | | | | 9.27 | % |
| 10 Years | | | | 12.80 | % |
| 5 Years | | | | 3.54 | |
| 1 Year | | | | -15.01 | |
| |
| Class R6 Shares | | | | | |
| 10 Years | | | | 12.59 | % |
| 5 Years | | | | 3.40 | |
| 1 Year | | | | -14.93 | |
Class R6 shares incepted on April 4, 2017. Performance shown prior to that date is that of Class A shares and includes the12b-1 fees applicable to Class A shares.
The performance data quoted represent past performance and cannot guarantee comparable future results; current performance may be lower or higher. Please visit invesco.com/performance for the most recentmonth-end performance. Performance figures reflect reinvested distributions, changes in net asset value and the effect of the maximum sales charge unless otherwise stated. Investment return and principal value will fluctuate so that you may have a gain or loss when you sell shares.
The net annual Fund operating expense ratio set forth in the most recent Fund prospectus as of the date of this report for Class A, Class C, Class Y and Class R6 shares was 1.44%, 2.19%, 1.19% and 1.15%, respectively.1 The total annual Fund operating expense ratio set forth in the most recent Fund prospectus as of the date of this report for Class A, Class C, Class Y and Class R6 shares was 1.46% 2.21%, 1.21% and 1.17%, respectively. The expense
ratios presented above may vary from the expense ratios presented in other sections of this report that are based on expenses incurred during the period covered by this report.
Class A share performance reflects the maximum 5.50% sales charge, and Class C share performance reflects the applicable contingent deferred sales charge (CDSC) for the period involved. The CDSC on Class C shares is 1% for the first year after purchase. Class Y and Class R6 shares do not have afront-end sales charge or a CDSC; therefore, performance is at net asset value.
The performance of the Fund’s share classes will differ primarily due to different sales charge structures and class expenses.
Fund performance reflects any applicable fee waivers and/or expense reimbursements. Had the adviser not waived fees and/or reimbursed expenses currently or in the past, returns would have been lower. See current prospectus for more information.
| 1 | Total annual Fund operating expenses after any contractual fee waivers and/or expense reimbursements by the adviser in effect through at least June 30, 2020. See current prospectus for more information. |
7 Invesco European Small Company Fund
Invesco European Small Company Fund’s investment objective is long-term growth of capital.
| ∎ | | Unless otherwise stated, information presented in this report is as of December 31, 2018, and is based on total net assets. |
| ∎ | | Unless otherwise noted, all data provided by Invesco. |
| ∎ | | To access your Fund’s reports/prospectus, visit invesco.com/fundreports. |
About share classes
| ∎ | | Class Y shares are available only to certain investors. Please see the prospectus for more information. |
| ∎ | | Class R6 shares are available for use by retirement plans that meet certain standards and for institutional investors. Class R6 shares are also available through intermediaries that have established an agreement with Invesco Distributors, Inc. to make such shares available for use in retail omnibus accounts. Please see the prospectus for more information. |
Principal risks of investing in the Fund
| ∎ | | Cash/cash equivalents risk.In rising markets, holding cash or cash equivalents will negatively affect the Fund’s performance relative to its benchmark. |
| ∎ | | Depositary receipts risk.Investing in depositary receipts involves the same risks as direct investments in foreign securities. In addition, the underlying issuers of certain depositary receipts are under no obligation to distribute shareholder communications or pass through any voting rights with respect to the deposited securities to the holders of such receipts. The Fund may therefore receive less timely information or have less control than if it invested directly in the foreign issuer. |
| ∎ | | Derivatives risk.The value of a derivative instrument depends largely on (and is derived from) the value of an underlying security, currency, commodity, interest rate, index or other asset (each referred to as an underlying asset). In addition to risks relating to the underlying assets, the use of derivatives may include other, possibly greater, risks, including counterparty, leverage and liquidity risks. Counterparty risk is the risk that the counterparty to the derivative contract will default on its obligation to pay the Fund the amount owed or otherwise perform under the derivative contract. Derivatives create leverage risk because they do not require payment up front equal |
| | to the economic exposure created by holding a position in the derivative. As a result, an adverse change in the value of the underlying asset could result in the Fund sustaining a loss that is substantially greater than the amount invested in the derivative or the anticipated value of the underlying asset, which may make the Fund’s returns more volatile and increase the risk of loss. Derivative instruments may also be less liquid than more traditional investments and the Fund may be unable to sell or close out its derivative positions at a desirable time or price. This risk may be more acute under adverse market conditions, during which the Fund may be most in need of liquidating its derivative positions. Derivatives may also be harder to value, less tax efficient and subject to changing government regulation that could impact the Fund’s ability to use certain derivatives or their cost. Derivatives strategies may not always be successful. For example, derivatives used for hedging or to gain or limit exposure to a particular market segment may not provide the expected benefits, particularly during adverse market conditions. |
| ∎ | | Emerging markets securities risk.Emerging markets (also referred to as developing markets) are generally subject to greater market volatility, political, social and economic instability, uncertain trading markets and more governmental limitations on foreign investment than more developed markets. In addition, companies operating in emerging markets may be subject to lower trading volume and greater price fluctuations than companies in more developed markets. Securities law and the enforcement of systems of taxation in many emerging market countries may change quickly and unpredictably. In addition, investments in emerging markets securities may also be subject to additional transaction costs, delays in settlement procedures, and lack of timely information. |
This report must be accompanied or preceded by a currently effective Fund prospectus, which contains more complete information, including sales charges and expenses. Investors should read it carefully before investing.
NOT FDIC INSURED | MAY LOSE VALUE | NO BANK GUARANTEE
| ∎ | | Foreign securities risk.The Fund’s foreign investments may be adversely affected by political and social instability, changes in economic or taxation policies, difficulty in enforcing obligations, decreased liquidity or increased volatility. Foreign investments also involve the risk of the possible seizure, nationalization or expropriation of the issuer or foreign deposits (in which the Fund could lose its entire investments in a certain market) and the possible adoption of foreign governmental restrictions such as exchange controls. Unless the Fund has hedged its foreign securities risk, foreign securities risk also involves the risk of negative foreign currency rate fluctuations, which may cause the value of securities denominated in such foreign currency (or other instruments through which the Fund has exposure to foreign currencies) to decline in value. Currency exchange rates may fluctuate significantly over short periods of time. Currency hedging strategies, if used, are not always successful. |
| ∎ | | Geographic focus risk.The Fund may from time to time invest a substantial amount of its assets in securities of issuers located in a single country or a limited number of countries. Adverse economic, political or social conditions in those countries may therefore have a significant negative impact on the Fund’s investment performance. |
| ∎ | | Growth investing risk.Growth stocks tend to be more expensive relative to the issuing company’s earnings or assets compared with other types of stock. As a result, they tend to be more sensitive to changes in, or investors’ expectations of, the issuing company’s earnings and can be more volatile. |
| ∎ | | Investing in the European Union risk.Investments in certain countries in the European Union are susceptible to high economic risks associated with high levels of debt, such as investments in sovereign debt of Greece, Italy and Spain. Efforts of the member states to further unify their economic and monetary policies may increase the potential for the downward movement of one member state’s market to cause a similar effect on other member states’ markets. Separately, the European Union faces issues involving its membership, structure, procedures and policies. The exit of one or more member states |
8 Invesco European Small Company Fund
| | from the European Union, such as the United Kingdom (UK) which has announced its intention to exit, would place its currency and banking system in jeopardy. The exit by the UK or other member states will likely result in increased volatility, illiquidity and potentially lower economic growth in the affected markets, which will adversely affect the Fund’s investments. |
| ∎ | | Management risk.The Fund is actively managed and depends heavily on the Adviser’s judgment about markets, interest rates or the attractiveness, relative values, liquidity, or potential appreciation of particular investments made for the Fund’s portfolio. The Fund could experience losses if these judgments prove to be incorrect. Additionally, legislative, regulatory, or tax developments may adversely affect management of the Fund and, therefore, the ability of the Fund to achieve its investment objective. |
| ∎ | | Market risk.The market values of the Fund’s investments, and therefore the value of the Fund’s shares, will go up and down, sometimes rapidly or unpredictably. Market risk may affect a single issuer, industry or section of the economy, or it may affect the market as a whole. Individual stock prices tend to go up and down more dramatically than those of certain other types of investments, such as bonds. During a general downturn in the financial markets, multiple asset classes may decline in value. When markets perform well, there can be no assurance that specific investments held by the Fund will rise in value. |
| ∎ | | Preferred securities risk.Preferred securities are subject to issuer-specific and market risks applicable generally to equity securities. Preferred securities also may be subordinated to bonds or other debt instruments, subjecting them to a greater risk ofnon-payment, may be less liquid than many other securities, such as common stocks, and generally offer no voting rights with respect to the issuer. |
| ∎ | | Sector focus risk.The Fund may from time to time invest a significant amount of its assets (i.e. over 25%) in one market sector or group of related industries. In this event, the Fund’s performance will depend to a greater extent on the overall condition of the sector or |
| | group of industries and there is increased risk that the Fund will lose significant value if conditions adversely affect that sector or group of industries. |
| ∎ | | Small- andmid-capitalization companies risks.Small- andmid-capitalization companies tend to be more vulnerable to changing market conditions, may have little or no operating history or track record of success, and may have more limited product lines and markets, less experienced management and fewer financial resources than larger companies. These companies’ securities may be more volatile and less liquid than those of more established companies, and their returns may vary, sometimes significantly, from the overall securities market. |
About indexes used in this report
| ∎ | | TheMSCI Europe Index is an unman- aged index considered representative of stocks of developed European countries. The index is computed using the net return, which withholds applicable taxes fornon-resident investors. |
| ∎ | | TheMSCI Europe Small Cap Index is an unmanaged index considered representative ofsmall-cap European stocks. The index is computed using the net return, which withholds applicable taxes fornon-resident investors. |
| ∎ | | TheLipper European Funds Index is an unmanaged index considered representative of European funds tracked by Lipper. |
| ∎ | | The Fund is not managed to track the performance of any particular index, including the index(es) described here, and consequently, the performance of the Fund may deviate significantly from the performance of the index(es). |
| ∎ | | A direct investment cannot be made in an index. Unless otherwise indicated, index results include reinvested dividends, and they do not reflect sales charges. Performance of the peer group, if applicable, reflects fund expenses; performance of a market index does not. |
Other information
| ∎ | | The returns shown in management’s discussion of Fund performance are based on net asset values (NAVs) calculated for shareholder transactions. Generally accepted accounting principles require adjustments to be made to the net assets of the Fund at period end for financial reporting purposes, and as such, the NAVs for shareholder transactions and the returns based on those NAVs may differ from the NAVs and returns reported in the Financial Highlights. |
| ∎ | | Industry classifications used in this report are generally according to the Global Industry Classification Standard, which was developed by and is the exclusive property and a service mark of MSCI Inc. and Standard & Poor’s. |
9 Invesco European Small Company Fund
Schedule of Investments
December 31, 2018
| | | | | | | | |
| | | Shares | | | Value | |
Common Stocks & Other Equity Interests–89.88% | |
| Belgium–1.35% | |
Sioen Industries N.V. | | | 251,000 | | | $ | 6,513,759 | |
Van De Velde N.V. | | | 45,106 | | | | 1,323,013 | |
| | | | | | | | 7,836,772 | |
|
| France–21.41% | |
Caisse Regionale de Credit Agricole Mutuel Brie Picardie–CCI | | | 94,000 | | | | 2,745,285 | |
Caisse Regionale de Credit Agricole Mutuel d’Ile-de-France | | | 55,078 | | | | 5,524,895 | |
Caisse Regionale de Credit Agricole Mutuel de Normandie-Seine–CCI | | | 46,988 | | | | 6,998,743 | |
Caisse Regionale de Credit Agricole Mutuel Nord de France–CCI | | | 365,844 | | | | 9,305,477 | |
Caisse Regionale de Credit Agricole Mutuel Sud Rhone Alpes-CCI | | | 19,700 | | | | 4,502,517 | |
Constructions Industrielles de la Mediterranee S.A. | | | 80,972 | | | | 7,607,439 | |
GEA | | | 55,000 | | | | 5,406,793 | |
Gerard Perrier Industrie S.A. | | | 169,171 | | | | 8,780,391 | |
Infotel S.A. | | | 165,142 | | | | 7,265,717 | |
Kaufman & Broad S.A. | | | 304,000 | | | | 11,607,797 | |
Linedata Services(a) | | | 506,159 | | | | 18,267,842 | |
Maisons France Confort S.A. | | | 132,990 | | | | 4,883,563 | |
Manutan International | | | 93,000 | | | | 6,712,947 | |
Metropole Television S.A. | | | 192,790 | | | | 3,094,832 | |
Neurones | | | 280,000 | | | | 6,063,307 | |
Tessi S.A.(b) | | | 88,294 | | | | 11,713,307 | |
Total Gabon | | | 24,424 | | | | 3,497,974 | |
| | | | | | | | 123,978,826 | |
|
| Georgia–1.37% | |
TBC Bank Group PLC | | | 410,263 | | | | 7,923,180 | |
|
| Germany–3.21% | |
CENIT AG | | | 213,758 | | | | 3,257,345 | |
MorphoSys AG(b) | | | 125,562 | | | | 12,796,580 | |
Takkt AG | | | 164,690 | | | | 2,564,220 | |
| | | | | | | | 18,618,145 | |
|
| Greece–3.57% | |
Autohellas S.A. | | | 207,551 | | | | 5,231,633 | |
Hellenic Exchanges — Athens Stock Exchange S.A. | | | 399,791 | | | | 1,694,824 | |
Karelia Tobacco Co. Inc. S.A. | | | 9,265 | | | | 2,547,689 | |
Mytilineos Holdings S.A. | | | 1,341,192 | | | | 11,169,715 | |
| | | | | | | | 20,643,861 | |
|
| Hungary–1.43% | |
Richter Gedeon Nyrt | | | 426,580 | | | | 8,266,677 | |
|
| Ireland–6.55% | |
CPL Resources PLC | | | 1,141,792 | | | | 7,587,605 | |
| | | | | | | | |
| | | Shares | | | Value | |
| Ireland–(continued) | |
Origin Enterprises PLC | | | 3,497,056 | | | $ | 22,958,682 | |
Total Produce PLC | | | 4,536,323 | | | | 7,354,449 | |
| | | | | | | | 37,900,736 | |
|
| Israel–5.22% | |
Hilan Ltd. | | | 517,409 | | | | 12,158,945 | |
Israel Discount Bank Ltd.–Class A | | | 4,971,000 | | | | 15,319,694 | |
MIND C.T.I. Ltd.(a) | | | 1,200,000 | | | | 2,736,000 | |
| | | | | | | | 30,214,639 | |
|
| Italy–4.11% | |
Danieli & C Officine Meccaniche S.p.A.–Savings Shares | | | 920,532 | | | | 13,605,620 | |
Gruppo MutuiOnline S.p.A. | | | 415,000 | | | | 7,541,210 | |
Mondo TV S.p.A.(a)(b) | | | 1,925,000 | | | | 2,633,448 | |
| | | | | | | | 23,780,278 | |
|
| Norway–3.89% | |
Bonheur ASA | | | 531,206 | | | | 5,750,406 | |
Kongsberg Gruppen ASA | | | 581,581 | | | | 7,910,013 | |
Wilh Wilhelmsen Holding ASA–Class A | | | 474,539 | | | | 8,847,012 | |
| | | | | | | | 22,507,431 | |
|
| Poland–1.57% | |
Warsaw Stock Exchange | | | 925,630 | | | | 9,064,983 | |
|
| Portugal–0.38% | |
Conduril — Engenharia S.A. | | | 46,308 | | | | 2,217,798 | |
|
| Romania–8.20% | |
Banca Transilvania S.A. | | | 21,875,448 | | | | 10,797,704 | |
Fondul Proprietatea S.A. | | | 93,345,624 | | | | 20,291,528 | |
Societatea Nationala de Gaze Naturale ROMGAZ S.A. | | | 2,391,512 | | | | 16,367,315 | |
| | | | | | | | 47,456,547 | |
|
| Spain–2.35% | |
Baron de Ley, S.A.(b) | | | 68,000 | | | | 8,492,297 | |
Construcciones y Auxiliar de Ferrocarriles S.A. | | | 124,000 | | | | 5,124,254 | |
| | | | | | | | 13,616,551 | |
|
| Switzerland–4.74% | |
Carlo Gavazzi Holding AG | | | 18,625 | | | | 4,642,512 | |
Kardex AG | | | 147,048 | | | | 16,922,751 | |
OC Oerlikon Corp. AG | | | 521,945 | | | | 5,878,866 | |
| | | | | | | | 27,444,129 | |
|
| Turkey–0.69% | |
AG Anadolu Grubu Holding A.S. | | | 2,076,313 | | | | 4,017,278 | |
|
| United Kingdom–19.84% | |
City of London Investment Group PLC | | | 900,000 | | | | 4,349,785 | |
Clarkson PLC | | | 188,808 | | | | 4,572,438 | |
See accompanying Notes to Financial Statements which are an integral part of the financial statements.
10 Invesco European Small Company Fund
| | | | | | | | |
| | | Shares | | | Value | |
| United Kingdom–(continued) | |
DCC PLC | | | 58,026 | | | $ | 4,411,000 | |
Diploma PLC | | | 458,327 | | | | 7,040,197 | |
Eurocell PLC | | | 1,809,000 | | | | 4,934,307 | |
IG Group Holdings PLC | | | 642,684 | | | | 4,659,919 | |
JPJ Group PLC(b) | | | 1,339,000 | | | | 10,888,676 | |
Jupiter Fund Management PLC | | | 867,000 | | | | 3,262,190 | |
Lookers PLC | | | 8,915,000 | | | | 10,499,465 | |
Micro Focus International PLC | | | 288,178 | | | | 5,036,770 | |
NAHL Group PLC(a) | | | 2,324,183 | | | | 3,169,771 | |
Renew Holdings PLC | | | 1,981,000 | | | | 8,541,830 | |
SafeStyle UK PLC(a)(b) | | | 5,375,000 | | | | 5,819,279 | |
Savills PLC | | | 1,123,513 | | | | 10,095,441 | |
Staffline Group PLC | | | 861,000 | | | | 13,608,137 | |
Ultra Electronics Holdings PLC | | | 499,583 | | | | 8,249,836 | |
XLMedia PLC | | | 6,025,000 | | | | 5,721,200 | |
| | | | | | | | 114,860,241 | |
Total Common Stocks & Other Equity Interests
(Cost $509,480,899) | | | | 520,348,072 | |
| | | | | | | | |
| | | Shares | | | Value | |
Money Market Funds–11.42% | |
Invesco Government & Agency Portfolio–Institutional Class, 2.30%(c) | | | 23,141,013 | | | $ | 23,141,013 | |
Invesco Liquid Assets Portfolio–Institutional Class, 2.48%(c) | | | 16,526,649 | | | | 16,528,301 | |
Invesco Treasury Portfolio–Institutional Class, 2.30%(c) | | | 26,446,872 | | | | 26,446,872 | |
Total Money Market Funds
(Cost $66,117,471) | | | | 66,116,186 | |
TOTAL INVESTMENTS IN SECURITIES–101.30%
(Cost $575,598,370) | | | | 586,464,258 | |
OTHER ASSETS LESS LIABILITIES–(1.30)% | | | | (7,525,153 | ) |
NET ASSETS–100.00% | | | $ | 578,939,105 | |
Notes to Schedule of Investments:
| (a) | Affiliated company during the period. The Investment Company Act of 1940 defines an “affiliated person” as an issuance in which a fund holds 5% or more of the outstanding voting securities. The Fund has not owned enough of the outstanding voting securities of the issuer to have control (as defined in the Investment Company Act of 1940) of that issuer. The aggregate value of these securities as of December 31, 2018 was $32,626,340, which represented 5.64% of the Fund’s Net Assets. See Note 4. |
| (b) | Non-income producing security. |
| (c) | The money market fund and the Fund are affiliated by having the same investment adviser. The rate shown is the 7-day SEC standardized yield as of December 31, 2018. |
See accompanying Notes to Financial Statements which are an integral part of the financial statements.
11 Invesco European Small Company Fund
Statement of Assets and Liabilities
December 31, 2018
| | | | |
Assets: | | | | |
Investments in securities, at value (Cost $462,689,856) | | $ | 487,721,732 | |
Investments in affiliates, at value (Cost $112,908,514) | | | 98,742,526 | |
Foreign currencies, at value (Cost $1,072,192) | | | 1,074,886 | |
Receivable for: | | | | |
Fund shares sold | | | 1,933,714 | |
Dividends | | | 489,541 | |
Investment for trustee deferred compensation and retirement plans | | | 78,958 | |
Other assets | | | 26,171 | |
Total assets | | | 590,067,528 | |
| |
Liabilities: | | | | |
Payable for: | | | | |
Amount due to custodian | | | 4,119,013 | |
Fund shares reacquired | | | 6,476,472 | |
Accrued fees to affiliates | | | 195,766 | |
Accrued trustees’ and officers’ fees and benefits | | | 5,817 | |
Accrued other operating expenses | | | 242,355 | |
Trustee deferred compensation and retirement plans | | | 89,000 | |
Total liabilities | | | 11,128,423 | |
Net assets applicable to shares outstanding | | $ | 578,939,105 | |
| |
Net assets consist of: | | | | |
Shares of beneficial interest | | $ | 565,946,981 | |
Distributable earnings | | | 12,992,124 | |
| | | $ | 578,939,105 | |
| | | | |
|
Net Assets: | |
Class A | | $ | 127,904,369 | |
Class C | | $ | 22,684,468 | |
Class Y | | $ | 410,107,323 | |
Class R6 | | $ | 18,242,945 | |
|
Shares outstanding, no par value,
with an unlimited number of shares authorized: | |
Class A | | | 9,670,874 | |
Class C | | | 1,835,070 | |
Class Y | | | 30,903,887 | |
Class R6 | | | 1,374,919 | |
Class A: | | | | |
Net asset value per share | | $ | 13.23 | |
Maximum offering price per share | | | | |
(Net asset value of $13.23¸ 94.50% | | $ | 14.00 | |
Class C: | | | | |
Net asset value and offering price per share | | $ | 12.36 | |
Class Y: | | | | |
Net asset value and offering price per share | | $ | 13.27 | |
Class R6: | | | | |
Net asset value and offering price per share | | $ | 13.27 | |
See accompanying Notes to Financial Statements which are an integral part of the financial statements.
12 Invesco European Small Company Fund
Statement of Operations
For the year ended December 31, 2018
| | | | |
Investment income: | |
Dividends (net of foreign withholding taxes of $1,882,290) | | $ | 19,962,261 | |
Dividends from affiliates | | | 4,862,934 | |
Total investment income | | | 24,825,195 | |
| |
Expenses: | | | | |
Advisory fees | | | 7,322,212 | |
Administrative services fees | | | 200,778 | |
Custodian fees | | | 357,556 | |
Distribution fees: | | | | |
Class A | | | 421,961 | |
Class B | | | 327 | |
Class C | | | 308,264 | |
Transfer agent fees — A, B, C and Y | | | 891,217 | |
Transfer agent fees — R6 | | | 9,419 | |
Trustees’ and officers’ fees and benefits | | | 31,553 | |
Registration and filing fees | | | 105,200 | |
Reports to shareholders | | | 81,345 | |
Professional services fees | | | 75,261 | |
Other | | | 49,134 | |
Total expenses | | | 9,854,227 | |
Less: Fees waived and expense offset arrangement(s) | | | (240,042 | ) |
Net expenses | | | 9,614,185 | |
Net investment income | | | 15,211,010 | |
| |
Realized and unrealized gain (loss) from: | | | | |
Net realized gain (loss) from: | | | | |
Investment securities | | | 24,064,957 | |
Foreign currencies | | | (307,025 | ) |
| | | | 23,757,932 | |
Change in net unrealized appreciation (depreciation) of: | | | | |
Investment securities | | | (162,379,442 | ) |
Foreign currencies | | | (4,538 | ) |
| | | | (162,383,980 | ) |
Net realized and unrealized gain (loss) | | | (138,626,048 | ) |
Net increase (decrease) in net assets resulting from operations | | $ | (123,415,038 | ) |
See accompanying Notes to Financial Statements which are an integral part of the financial statements.
13 Invesco European Small Company Fund
Statement of Changes in Net Assets
For the years ended December 31, 2018 and 2017
| | | | | | | | |
| | | 2018 | | | 2017 | |
Operations: | | | | | | | | |
Net investment income | | $ | 15,211,010 | | | $ | 13,165,872 | |
Net realized gain | | | 23,757,932 | | | | 17,713,215 | |
Change in net unrealized appreciation (depreciation) | | | (162,383,980 | ) | | | 118,895,483 | |
Net increase (decrease) in net assets resulting from operations | | | (123,415,038 | ) | | | 149,774,570 | |
| | |
Distributions to shareholders from distributable earnings(1): | | | | | | | | |
Class A | | | (7,742,166 | ) | | | (5,825,573 | ) |
Class B | | | — | | | | (12,343 | ) |
Class C | | | (1,241,508 | ) | | | (897,473 | ) |
Class Y | | | (27,373,839 | ) | | | (20,221,344 | ) |
Class R6 | | | (1,161,131 | ) | | | (396 | ) |
Total distributions from distributable earnings | | | (37,518,644 | ) | | | (26,957,129 | ) |
| | |
Share transactions–net: | | | | | | | | |
Class A | | | (25,256,609 | ) | | | (36,384,645 | ) |
Class B | | | (472,760 | ) | | | (866,679 | ) |
Class C | | | (5,632,828 | ) | | | (3,322,288 | ) |
Class Y | | | (81,969,083 | ) | | | 266,053,459 | |
Class R6 | | | 23,811,202 | | | | 10,022 | |
Net increase (decrease) in net assets resulting from share transactions | | | (89,520,078 | ) | | | 225,489,869 | |
Net increase (decrease) in net assets | | | (250,453,760 | ) | | | 348,307,310 | |
| | |
Net assets: | | | | | | | | |
Beginning of year | | | 829,392,865 | | | | 481,085,555 | |
End of year | | $ | 578,939,105 | | | $ | 829,392,865 | |
| (1) | For the year ended December 31, 2017, distributions to shareholders from distributable earnings consisted of distributions from net investment income and distributions from net realized gains. The Securities and Exchange Commission eliminated the requirement to disclose the distribution components separately, except for tax return of capital. For the year ended December 31, 2017, distributions from net investment income were $2,987,109, $4,641, $337,475, $11,075,606 and $219 and distributions from net realized gains were $2,838,464, $7,702, $559,998, $9,145,738 and $177 for Class A, Class B, Class C, Class Y and Class R6 shares, respectively. |
Notes to Financial Statements
December 31, 2018
NOTE 1—Significant Accounting Policies
Invesco European Small Company Fund (the “Fund”) is a series portfolio of AIM Funds Group (Invesco Funds Group) (the “Trust”). The Trust is a Delaware statutory trust registered under the Investment Company Act of 1940, as amended (the “1940 Act”), as an open-end series management investment company authorized to issue an unlimited number of shares of beneficial interest. Information presented in these financial statements pertains only to the Fund. Matters affecting the Fund or each class will be voted on exclusively by the shareholders of the Fund or each class.
The Fund’s investment objective islong-term growth of capital.
The Fund currently consists of four different classes of shares: Class A, Class C, Class Y and Class R6. Class Y shares are available only to certain investors. Class A shares are sold with a front-end sales charge unless certain waiver criteria are met. Under certain circumstances, load waived shares may be subject to contingent deferred sales charges (“CDSC”). Class C shares are sold with a CDSC. Class Y and Class R6 shares are sold at net asset value. Effective November 30, 2010, new or additional investments in Class B shares are no longer permitted. Existing shareholders of Class B shares were permitted to continue to reinvest dividends and capital gains distributions in Class B shares until their conversion to Class A shares. Also, shareholders in Class B shares were able to exchange those shares for Class B shares of other Invesco Funds offering such shares until they converted to Class A shares. Generally, Class B shares automatically converted to Class A shares on or about the month-end, which was at least eight years after the date of purchase. Redemptions of Class B shares prior to the conversion date were subject to a CDSC. Effective January 26, 2018, all of the Fund’s outstanding Class B shares were converted to Class A shares, in advance of their normally scheduled conversion. No CDSC was paid in connection with this early conversion.
As of the open of business on November 30, 2015, the Fund has closed public sales of its shares to new investors.
The Fund is an investment company and accordingly follows the investment company accounting and reporting guidance in accordance with Financial Accounting Standards Board Accounting Standards Codification Topic 946,Financial Services — Investment Companies.
14 Invesco European Small Company Fund
The following is a summary of the significant accounting policies followed by the Fund in the preparation of its financial statements.
| A. | Security Valuations— Securities, including restricted securities, are valued according to the following policy. |
A security listed or traded on an exchange (except convertible securities) is valued at its last sales price or official closing price as of the close of the customary trading session on the exchange where the security is principally traded, or lacking any sales or official closing price on a particular day, the security may be valued at the closing bid price on that day. Securities traded in theover-the-counter market are valued based on prices furnished by independent pricing services or market makers. When such securities are valued by an independent pricing service they may be considered fair valued. Futures contracts are valued at the final settlement price set by an exchange on which they are principally traded. Listed options are valued at the mean between the last bid and asked prices from the exchange on which they are principally traded. Options not listed on an exchange are valued by an independent source at the mean between the last bid and asked prices. For purposes of determining net asset value (“NAV”) per share, futures and option contracts generally are valued 15 minutes after the close of the customary trading session of the New York Stock Exchange (“NYSE”).
Investments in open-end and closed-end registered investment companies that do not trade on an exchange are valued at theend-of-day net asset value per share. Investments in open-end and closed-end registered investment companies that trade on an exchange are valued at the last sales price or official closing price as of the close of the customary trading session on the exchange where the security is principally traded.
Debt obligations (including convertible securities) and unlisted equities are fair valued using an evaluated quote provided by an independent pricing service. Evaluated quotes provided by the pricing service may be determined without exclusive reliance on quoted prices, and may reflect appropriate factors such as institution-size trading in similar groups of securities, developments related to specific securities, dividend rate (for unlisted equities), yield (for debt obligations), quality, type of issue, coupon rate (for debt obligations), maturity (for debt obligations), individual trading characteristics and other market data. Pricing services generally value debt obligations assuming orderly transactions of institutional round lot size, but a fund may hold or transact in the same securities in smaller, odd lot sizes. Odd lots often trade at lower prices than institutional round lots. Debt obligations are subject to interest rate and credit risks. In addition, all debt obligations involve some risk of default with respect to interest and/or principal payments.
Foreign securities’ (including foreign exchange contracts) prices are converted into U.S. dollar amounts using the applicable exchange rates as of the close of the NYSE. If market quotations are available and reliable for foreign exchange-traded equity securities, the securities will be valued at the market quotations. Because trading hours for certain foreign securities end before the close of the NYSE, closing market quotations may become unreliable. If between the time trading ends on a particular security and the close of the customary trading session on the NYSE, events occur that the investment adviser determines are significant and make the closing price unreliable, the Fund may fair value the security. If the event is likely to have affected the closing price of the security, the security will be valued at fair value in good faith using procedures approved by the Board of Trustees. Adjustments to closing prices to reflect fair value may also be based on a screening process of an independent pricing service to indicate the degree of certainty, based on historical data, that the closing price in the principal market where a foreign security trades is not the current value as of the close of the NYSE. Foreign securities’ prices meeting the approved degree of certainty that the price is not reflective of current value will be priced at the indication of fair value from the independent pricing service. Multiple factors may be considered by the independent pricing service in determining adjustments to reflect fair value and may include information relating to sector indices, American Depositary Receipts and domestic and foreign index futures. Foreign securities may have additional risks including exchange rate changes, potential for sharply devalued currencies and high inflation, political and economic upheaval, the relative lack of issuer information, relatively low market liquidity and the potential lack of strict financial and accounting controls and standards.
Securities for which market prices are not provided by any of the above methods may be valued based upon quotes furnished by independent sources. The last bid price may be used to value equity securities. The mean between the last bid and asked prices is used to value debt obligations, including corporate loans.
Securities for which market quotations are not readily available or became unreliable are valued at fair value as determined in good faith by or under the supervision of the Trust’s officers following procedures approved by the Board of Trustees. Issuer specific events, market trends, bid/asked quotes of brokers and information providers and other market data may be reviewed in the course of making a good faith determination of a security’s fair value.
The Fund may invest in securities that are subject to interest rate risk, meaning the risk that the prices will generally fall as interest rates rise and, conversely, the prices will generally rise as interest rates fall. Specific securities differ in their sensitivity to changes in interest rates depending on their individual characteristics. Changes in interest rates may result in increased market volatility, which may affect the value and/or liquidity of certain Fund investments.
Valuations change in response to many factors including the historical and prospective earnings of the issuer, the value of the issuer’s assets, general economic conditions, interest rates, investor perceptions and market liquidity. Because of the inherent uncertainties of valuation, the values reflected in the financial statements may materially differ from the value received upon actual sale of those investments.
| B. | Securities Transactions and Investment Income— Securities transactions are accounted for on a trade date basis. Realized gains or losses on sales are computed on the basis of specific identification of the securities sold. Interest income (net of withholding tax, if any) is recorded on the accrual basis from settlement date. Dividend income (net of withholding tax, if any) is recorded on the ex-dividend date. |
The Fund may periodically participate in litigation related to Fund investments. As such, the Fund may receive proceeds from litigation settlements. Any proceeds received are included in the Statement of Operations as realized gain (loss) for investments no longer held and as unrealized gain (loss) for investments still held.
Brokerage commissions and mark ups are considered transaction costs and are recorded as an increase to the cost basis of securities purchased and/or a reduction of proceeds on a sale of securities. Such transaction costs are included in the determination of net realized and unrealized gain (loss) from investment securities reported in the Statement of Operations and the Statement of Changes in Net Assets and the net realized and unrealized gains (losses) on securities per share in the Financial Highlights. Transaction costs are included in the calculation of the Fund’s net asset value and, accordingly, they reduce the Fund’s total returns. These transaction costs are not considered operating expenses and are not reflected in net investment income reported in the Statement of Operations and the Statement of Changes in Net Assets, or the net investment income per share and the ratios of expenses and net investment income reported in the Financial Highlights, nor are they limited by any expense limitation arrangements between the Fund and the investment adviser.
The Fund allocates income and realized and unrealized capital gains and losses to a class based on the relative net assets of each class.
15 Invesco European Small Company Fund
| C. | Country Determination— For the purposes of making investment selection decisions and presentation in the Schedule of Investments, the investment adviser may determine the country in which an issuer is located and/or credit risk exposure based on various factors. These factors include the laws of the country under which the issuer is organized, where the issuer maintains a principal office, the country in which the issuer derives 50% or more of its total revenues and the country that has the primary market for the issuer’s securities, as well as other criteria. Amongthe other criteria that may be evaluated for making this determination are the country in which the issuer maintains 50% or more of its assets, the type of security, financial guarantees and enhancements, the nature of the collateral and the sponsor organization. Country of issuer and/or credit risk exposure has been determined to be the United States of America, unless otherwise noted. |
| D. | Distributions— Distributions from net investment income and net realized capital gain, if any, are generally declared and paid annually and recorded on the ex-dividend date. The Fund may elect to treat a portion of the proceeds from redemptions as distributions for federal income tax purposes. |
| E. | Federal Income Taxes— The Fund intends to comply with the requirements of Subchapter M of the Internal Revenue Code of 1986, as amended (the “Internal Revenue Code”), necessary to qualify as a regulated investment company and to distribute substantially all of the Fund’s taxable earnings to shareholders. As such, the Fund will not be subject to federal income taxes on otherwise taxable income (including net realized capital gain) that is distributed to shareholders. Therefore, no provision for federal income taxes is recorded in the financial statements. |
The Fund recognizes the tax benefits of uncertain tax positions only when the position is more likely than not to be sustained. Management has analyzed the Fund’s uncertain tax positions and concluded that no liability for unrecognized tax benefits should be recorded related to uncertain tax positions. Management is not aware of any tax positions for which it is reasonably possible that the total amounts of unrecognized tax benefits will change materially in the next 12 months.
The Fund files tax returns in the U.S. Federal jurisdiction and certain other jurisdictions. Generally, the Fund is subject to examinations by such taxing authorities for up to three years after the filing of the return for the tax period.
| F. | Expenses— Fees provided for under the Rule 12b-1 plan of a particular class of the Fund are charged to the operations of such class. Transfer agency fees and expenses and other shareholder recordkeeping fees and expenses attributable to Class R6 are charged to such class. Transfer agency fees and expenses and other shareholder recordkeeping fees and expenses relating to all other classes are allocated among those classes based on relative net assets. All other expenses are allocated among the classes based on relative net assets. |
| G. | Accounting Estimates— The preparation of financial statements in conformity with accounting principles generally accepted in the United States of America (“GAAP”) requires management to make estimates and assumptions that affect the reported amounts of assets and liabilities at the date of the financial statements and the reported amounts of revenues and expenses during the reporting period including estimates and assumptions related to taxation. Actual results could differ from those estimates by a significant amount. In addition, the Fund monitors for material events or transactions that may occur or become known after the period-end date and before the date the financial statements are released to print. |
| H. | Indemnifications— Under the Trust’s organizational documents, each Trustee, officer, employee or other agent of the Trust is indemnified against certain liabilities that may arise out of the performance of their duties to the Fund. Additionally, in the normal course of business, the Fund enters into contracts, including the Fund’s servicing agreements, that contain a variety of indemnification clauses. The Fund’s maximum exposure under these arrangements is unknown as this would involve future claims that may be made against the Fund that have not yet occurred. The risk of material loss as a result of such indemnification claims is considered remote. |
| I. | Foreign Currency Translations— Foreign currency is valued at the close of the NYSE based on quotations posted by banks and major currency dealers. Portfolio securities and other assets and liabilities denominated in foreign currencies are translated into U.S. dollar amounts at the date of valuation. Purchases and sales of portfolio securities (net of foreign taxes withheld on disposition) and income items denominated in foreign currencies are translated into U.S. dollar amounts on the respective dates of such transactions. The Fund does not separately account for the portion of the results of operations resulting from changes in foreign exchange rates on investments and the fluctuations arising from changes in market prices of securities held. The combined results of changes in foreign exchange rates and the fluctuation of market prices on investments (net of estimated foreign tax withholding) are included with the net realized and unrealized gain or loss from investments in the Statement of Operations. Reported net realized foreign currency gains or losses arise from (1) sales of foreign currencies, (2) currency gains or losses realized between the trade and settlement dates on securities transactions, and (3) the difference between the amounts of dividends, interest, and foreign withholding taxes recorded on the Fund’s books and the U.S. dollar equivalent of the amounts actually received or paid. Net unrealized foreign currency gains and losses arise from changes in the fair values of assets and liabilities, other than investments in securities at fiscal period end, resulting from changes in exchange rates. |
The Fund may invest in foreign securities, which may be subject to foreign taxes on income, gains on investments or currency repatriation, a portion of which may be recoverable. Foreign taxes, if any, are recorded based on the tax regulations and rates that exist in the foreign markets in which the Fund invests and are shown in the Statement of Operations.
| J. | Forward Foreign Currency Contracts— The Fund may engage in foreign currency transactions either on a spot (i.e. for prompt delivery and settlement) basis, or through forward foreign currency contracts, to manage or minimize currency or exchange rate risk. |
The Fund may also enter into forward foreign currency contracts for the purchase or sale of a security denominated in a foreign currency in order to “lock in” the U.S. dollar price of that security, or the Fund may also enter into forward foreign currency contracts that do not provide for physical settlement of the two currencies, but instead are settled by a single cash payment calculated as the difference between the agreed upon exchange rate and the spot rate at settlement based upon an agreed upon notional amount (non-deliverable forwards). The Fund will set aside liquid assets in an amount equal to the dailymark-to-market obligation for forward foreign currency contracts.
A forward foreign currency contract is an obligation between two parties (“Counterparties”) to purchase or sell a specific currency for anagreed-upon price at a future date. The use of forward foreign currency contracts does not eliminate fluctuations in the price of the underlying securities the Fund owns or intends to acquire but establishes a rate of exchange in advance. Fluctuations in the value of these contracts are measured by the difference in the contract date and reporting date exchange rates and are recorded as unrealized appreciation (depreciation) until the contracts are closed. When the contracts are closed, realized gains (losses) are recorded. Realized and unrealized gains (losses) on the contracts are included in the Statement of Operations. The primary risks associated with forward foreign currency contracts include failure of the Counterparty to meet the terms of the contract and the value of the foreign currency changing unfavorably. These risks may be in excess of the amounts reflected in the Statement of Assets and Liabilities.
16 Invesco European Small Company Fund
NOTE 2—Advisory Fees and Other Fees Paid to Affiliates
The Trust has entered into a master investment advisory agreement with Invesco Advisers, Inc. (the “Adviser” or “Invesco”). Under the terms of the investment advisory agreement, the Fund accrues daily and pays monthly an advisory fee to the Adviser based on the annual rate of the Fund’s average daily net assets as follows:
| | | | | | | | |
| Average Daily Net Assets | | Rate | |
First $250 million | | | 0 | .935% | | | | |
Next $250 million | | | 0 | .91% | | | | |
Next $500 million | | | 0 | .885% | | | | |
Next $1.5 billion | | | 0 | .86% | | | | |
Next $2.5 billion | | | 0 | .835% | | | | |
Next $2.5 billion | | | 0 | .81% | | | | |
Next $2.5 billion | | | 0 | .785% | | | | |
Over $10 billion | | | 0 | .76% | | | | |
For the year ended December 31, 2018, the effective advisory fees incurred by the Fund was 0.91%.
Under the terms of a mastersub-advisory agreement between the Adviser and each of Invesco Asset Management Deutschland GmbH, Invesco Asset Management Limited, Invesco Asset Management (Japan) Limited, Invesco Hong Kong Limited, Invesco Senior Secured Management, Inc. and Invesco Canada Ltd. and separatesub-advisory agreements with Invesco Capital Management LLC, formerly Invesco PowerShares Capital Management LLC, and Invesco Asset Management (India) Private Limited (collectively, the “AffiliatedSub-Advisers”) the Adviser, not the Fund, will pay 40% of the fees paid to the Adviser to any such AffiliatedSub-Adviser(s) that provide(s) discretionary investment management services to the Fund based on the percentage of assets allocated to such AffiliatedSub-Adviser(s).
The Adviser has contractually agreed, through at least June 30, 2019, to waive advisory fees and/or reimburse expenses of all shares to the extent necessary to limit total annual fund operating expenses after fee waiver and/or expense reimbursement (excluding certain items discussed below) of Class A, Class C, Class Y and Class R6 shares to 2.25%, 3.00%, 2.00% and 2.00%, respectively, of average daily net assets (the “expense limits”). Prior to their conversion to Class A shares, the expense limit for Class B shares was 3.00% of average daily net assets. In determining the Adviser’s obligation to waive advisory fees and/or reimburse expenses, the following expenses are not taken into account, and could cause the total annual fund operating expenses after fee waiver and/or expense reimbursement to exceed the numbers reflected above: (1) interest; (2) taxes; (3) dividend expense on short sales; (4) extraordinary or non-routine items, including litigation expenses; and (5) expenses that the Fund has incurred but did not actually pay because of an expense offset arrangement. Unless Invesco continues the fee waiver agreement, it will terminate on June 30, 2019. During its term, the fee waiver agreement cannot be terminated or amended to increase the expense limits or reduce the advisory fee waiver without approval of the Board of Trustees. The Adviser did not waive fees and/or reimburse expenses during the period under these expense limits.
Further, the Adviser has contractually agreed, through at least June 30, 2020, to waive the advisory fee payable by the Fund in an amount equal to 100% of the net advisory fees the Adviser receives from the affiliated money market funds on investments by the Fund of uninvested cash in such affiliated money market funds.
For the year ended December 31, 2018, the Adviser waived advisory fees of $236,360.
The Trust has entered into a master administrative services agreement with Invesco pursuant to which the Fund has agreed to pay Invesco for certain administrative costs incurred in providing accounting services to the Fund. For the year ended December 31, 2018, expenses incurred under the agreement are shown in the Statement of Operations asAdministrative services fees.
The Trust has entered into a transfer agency and service agreement with Invesco Investment Services, Inc. (“IIS”) pursuant to which the Fund has agreed to pay IIS a fee for providing transfer agency and shareholder services to the Fund and reimburse IIS for certain expenses incurred by IIS in the course of providing such services. IIS may make payments to intermediaries that provide omnibus account services,sub-accounting services and/or networking services. All fees payable by IIS to intermediaries that provide omnibus account services orsub-accounting services are charged back to the Fund, subject to certain limitations approved by the Trust’s Board of Trustees. For the year ended December 31, 2018, the expenses incurred under the agreement are shown in the Statement of Operations asTransfer agent fees.
The Trust has entered into master distribution agreements with Invesco Distributors, Inc. (“IDI”) to serve as the distributor for the Class A, Class C, Class Y and Class R6 shares of the Fund. The Trust has adopted plans pursuant to Rule 12b-1 under the 1940 Act with respect to the Fund’s Class A and Class C shares (collectively, the “Plans”). The Fund, pursuant to the Plans, pays IDI compensation at the annual rate of 0.25% of the Fund’s average daily net assets of Class A shares and 1.00% of the average daily net assets of Class C shares. Prior to their conversion to Class A shares, the Fund paid an annual rate of 1.00% of the average daily net assets of Class B shares. The fees are accrued daily and paid monthly. Of the Plan payments, up to 0.25% of the average daily net assets of each class of shares may be paid to furnish continuing personal shareholder services to customers who purchase and own shares of such classes. Any amounts not paid as a service fee under the Plans would constitute an asset-based sales charge. Rules of the Financial Industry Regulatory Authority (“FINRA”) impose a cap on the total sales charges, including asset-based sales charges, that may be paid by any class of shares of the Fund. For the year ended December 31, 2018, expenses incurred under the Plans are shown in the Statement of Operations asDistribution fees.
Front-end sales commissions and CDSC (collectively, the “sales charges”) are not recorded as expenses of the Fund. Front-end sales commissions are deducted from proceeds from the sales of Fund shares prior to investment in Class A shares of the Fund. CDSC are deducted from redemption proceeds prior to remittance to the shareholder. During the year ended December 31, 2018, IDI advised the Fund that IDI retained $7,574 infront-end sales commissions from the sale of Class A shares and $1,569 from Class C shares for CDSC imposed on redemptions by shareholders.
Certain officers and trustees of the Trust are officers and directors of the Adviser, IIS and/or IDI.
17 Invesco European Small Company Fund
NOTE 3—Additional Valuation Information
GAAP defines fair value as the price that would be received to sell an asset or paid to transfer a liability in an orderly transaction between market participants at the measurement date, under current market conditions. GAAP establishes a hierarchy that prioritizes the inputs to valuation methods, giving the highest priority to readily available unadjusted quoted prices in an active market for identical assets (Level 1) and the lowest priority to significant unobservable inputs (Level 3), generally when market prices are not readily available or are unreliable. Based on the valuation inputs, the securities or other investments are tiered into one of three levels. Changes in valuation methods may result in transfers in or out of an investment’s assigned level:
| | Level 1 — | Prices are determined using quoted prices in an active market for identical assets. |
| | Level 2 — | Prices are determined using other significant observable inputs. Observable inputs are inputs that other market participants may use in pricing a security. These may include quoted prices for similar securities, interest rates, prepayment speeds, credit risk, yield curves, loss severities, default rates, discount rates, volatilities and others. |
| | Level 3 — | Prices are determined using significant unobservable inputs. In situations where quoted prices or observable inputs are unavailable (for example, when there is little or no market activity for an investment at the end of the period), unobservable inputs may be used. Unobservable inputs reflect the Fund’s own assumptions about the factors market participants would use in determining fair value of the securities or instruments and would be based on the best available information. |
The following is a summary of the tiered valuation input levels, as of December 31, 2018. The level assigned to the securities valuations may not be an indication of the risk or liquidity associated with investing in those securities. Because of the inherent uncertainties of valuation, the values reflected in the financial statements may materially differ from the value received upon actual sale of those investments.
| | | | | | | | | | | | | | | | |
| | | Level 1 | | | Level 2 | | | Level 3 | | | Total | |
Investments in Securities | | | | | | | | | | | | | | | | |
Belgium | | $ | 7,836,772 | | | $ | — | | | $ | — | | | $ | 7,836,772 | |
France | | | 97,562,890 | | | | 26,415,936 | | | | — | | | | 123,978,826 | |
Georgia | | | — | | | | 7,923,180 | | | | | | | | 7,923,180 | |
Germany | | | 16,053,925 | | | | 2,564,220 | | | | — | | | | 18,618,145 | |
Greece | | | 9,474,146 | | | | 11,169,715 | | | | — | | | | 20,643,861 | |
Hungary | | | 8,266,677 | | | | — | | | | | | | | 8,266,677 | |
Ireland | | | 37,900,736 | | | | — | | | | — | | | | 37,900,736 | |
Israel | | | 14,894,945 | | | | 15,319,694 | | | | — | | | | 30,214,639 | |
Italy | | | 23,780,278 | | | | — | | | | — | | | | 23,780,278 | |
Norway | | | 22,507,431 | | | | — | | | | — | | | | 22,507,431 | |
Poland | | | 9,064,983 | | | | — | | | | — | | | | 9,064,983 | |
Portugal | | | 2,217,798 | | | | — | | | | — | | | | 2,217,798 | |
Romania | | | 47,456,547 | | | | — | | | | — | | | | 47,456,547 | |
Spain | | | 8,492,297 | | | | 5,124,254 | | | | — | | | | 13,616,551 | |
Switzerland | | | 4,642,512 | | | | 22,801,617 | | | | — | | | | 27,444,129 | |
Turkey | | | 4,017,278 | | | | — | | | | — | | | | 4,017,278 | |
United Kingdom | | | 56,656,184 | | | | 58,204,057 | | | | — | | | | 114,860,241 | |
Money Market Funds | | | 66,116,186 | | | | — | | | | — | | | | 66,116,186 | |
Total Investments | | $ | 436,941,585 | | | $ | 149,522,673 | | | $ | — | | | $ | 586,464,258 | |
NOTE 4—Investments in Other Affiliates
The 1940 Act defines an “affiliated person” as an issuance in which a fund holds 5% or more of the outstanding voting securities. The Fund has not owned enough of the outstanding voting securities of the issuer to have control (as defined in the 1940 Act) of that issuer. The following is a summary of the investments in other affiliates (excluding affiliated money market funds) for the year ended December 31, 2018.
| | | | | | | | | | | | | | | | | | | | | | | | | | | | |
| | | Value
12/31/17 | | | Purchases
at Cost | | | Proceeds
from Sales | | | Change in
Unrealized
Appreciation
(Depreciation) | | | Realized
Gain (Loss) | | | Value
12/31/18 | | | Dividend
Income | |
SafeStyle UK PLC(a) | | $ | 7,737,761 | | | $ | 2,611,650 | | | $ | — | | | $ | (4,530,132 | ) | | $ | — | | | $ | 5,819,279 | | | $ | — | |
Linedata Services | | | 23,872,553 | | | | — | | | | — | | | | (5,604,711 | ) | | | — | | | | 18,267,842 | | | | 679,411 | |
MIND C.T.I. Ltd. | | | 3,324,000 | | | | — | | | | — | | | | (588,000 | ) | | | — | | | | 2,736,000 | | | | 288,000 | |
NAHL Group PLC | | | 5,189,268 | | | | — | | | | — | | | | (2,019,497 | ) | | | — | | | | 3,169,771 | | | | 440,646 | |
Mondo TV S.p.A.(a) | | | — | | | | 8,777,764 | | | | — | | | | (6,144,316 | ) | | | — | | | | 2,633,448 | | | | — | |
Total | | $ | 40,123,582 | | | $ | 11,389,414 | | | $ | — | | | $ | (18,886,656 | ) | | $ | — | | | $ | 32,626,340 | | | $ | 1,408,057 | |
| (a) | As of December 31, 2017, this security was not considered as an affiliate of the Fund. |
18 Invesco European Small Company Fund
NOTE 5—Expense Offset Arrangement(s)
The expense offset arrangement is comprised of transfer agency credits which result from balances in demand deposit accounts used by the transfer agent for clearing shareholder transactions. For the year ended December 31, 2018, the Fund received credits from this arrangement, which resulted in the reduction of the Fund’s total expenses of $3,682.
NOTE 6—Trustees’ and Officers’ Fees and Benefits
Trustees’ and Officers’ Fees and Benefits include amounts accrued by the Fund to pay remuneration to certain Trustees and Officers of the Fund. Trustees have the option to defer compensation payable by the Fund, andTrustees’ and Officers’ Fees and Benefitsalso include amounts accrued by the Fund to fund such deferred compensation amounts. Those Trustees who defer compensation have the option to select various Invesco Funds in which their deferral accounts shall be deemed to be invested. Finally, certain current Trustees were eligible to participate in a retirement plan that provided for benefits to be paid upon retirement to Trustees over a period of time based on the number of years of service. The Fund may have certain former Trustees who also participate in a retirement plan and receive benefits under such plan.Trustees’ and Officers’ Fees and Benefits include amounts accrued by the Fund to fund such retirement benefits. Obligations under the deferred compensation and retirement plans represent unsecured claims against the general assets of the Fund.
NOTE 7—Cash Balances
The Fund is permitted to temporarily carry a negative or overdrawn balance in its account with State Street Bank and Trust Company, the custodian bank. Such balances, if any at period-end, are shown in the Statement of Assets and Liabilities under the payable captionAmount due custodian. To compensate the custodian bank for such overdrafts, the overdrawn Fund may either (1) leave funds as a compensating balance in the account so the custodian bank can be compensated by earning the additional interest; or (2) compensate by paying the custodian bank at a rate agreed upon by the custodian bank and Invesco, not to exceed the contractually agreed upon rate.
NOTE 8—Distributions to Shareholders and Tax Components of Net Assets
Tax Character of Distributions to Shareholders Paid During the Fiscal Years Ended December 31, 2018 and 2017:
| | | | | | | | |
| | | 2018 | | | 2017 | |
Ordinary income | | $ | 15,512,597 | | | $ | 14,405,050 | |
Long-term capital gain | | | 22,006,047 | | | | 12,552,079 | |
Total distributions | | $ | 37,518,644 | | | $ | 26,957,129 | |
Tax Components of Net Assets at Period-End:
| | | | |
| | | 2018 | |
Undistributed ordinary income | | $ | 514,426 | |
Undistributedlong-term gain | | | 2,669,433 | |
Net unrealized appreciation — investments | | | 9,889,832 | |
Net unrealized appreciation — foreign currencies | | | 1,438 | |
Temporary book/tax differences | | | (83,005 | ) |
Shares of beneficial interest | | | 565,946,981 | |
Total net assets | | $ | 578,939,105 | |
The difference between book-basis and tax-basis unrealized appreciation (depreciation) is due to differences in the timing of recognition of gains and losses on investments for tax and book purposes. The Fund’s net unrealized appreciation difference is attributable primarily to passive foreign investment companies.
The temporary book/tax differences are a result of timing differences between book and tax recognition of income and/or expenses. The Fund’s temporary book/tax differences are the result of the trustee deferral of compensation and retirement plan benefits.
Capital loss carryforward is calculated and reported as of a specific date. Results of transactions and other activity after that date may affect the amount of capital loss carryforward actually available for the Fund to utilize. Capital losses generated in years beginning after December 22, 2010 can be carried forward for an unlimited period, whereas previous losses expire in eight tax years. Capital losses with an expiration period may not be used to offset capital gains until all net capital losses without an expiration date have been utilized. Capital loss carryforwards with no expiration date will retain their character as eithershort-term orlong-term capital losses instead of asshort-term capital losses as under prior law. The ability to utilize capital loss carryforwards in the future may be limited under the Internal Revenue Code and related regulations based on the results of future transactions.
The Fund does not have a capital loss carryforward as of December 31, 2018.
19 Invesco European Small Company Fund
NOTE 9—Investment Transactions
The aggregate amount of investment securities (other thanshort-term securities, U.S. Treasury obligations and money market funds, if any) purchased and sold by the Fund during the year ended December 31, 2018 was $119,167,475 and $67,717,368, respectively. Cost of investments, including any derivatives, on a tax basis includes the adjustments for financial reporting purposes as of the most recently completed federal income tax reporting period-end.
| | | | |
| Unrealized Appreciation (Depreciation) of Investments on a Tax Basis | |
Aggregate unrealized appreciation of investments | | $ | 81,270,404 | |
Aggregate unrealized (depreciation) of investments | | | (71,380,572 | ) |
Net unrealized appreciation of investments | | $ | 9,889,832 | |
Cost of investments for tax purposes is $576,574,426.
NOTE 10—Reclassification of Permanent Differences
Primarily as a result of differing book/tax treatment of foreign currency transactions and distributions, on December 31, 2018, undistributed net investment income was decreased by $327,988 and undistributed net realized gain was increased by $327,988. This reclassification had no effect on the net assets or the distributable earnings of the Fund.
NOTE 11—Share Information
| | | | | | | | | | | | | | | | |
| | | Summary of Share Activity | |
| | | 2018(a) | | | 2017 | |
| | | Shares | | | Amount | | | Shares | | | Amount | |
Sold: | |
Class A | | | 1,022,588 | | | $ | 16,740,315 | | | | 2,177,203 | | | $ | 33,761,219 | |
Class B(b) | | | 150 | | | | 2,338 | | | | 1,276 | | | | 18,113 | |
Class C | | | 94,841 | | | | 1,459,222 | | | | 159,092 | | | | 2,315,394 | |
Class Y | | | 11,761,713 | | | | 192,661,568 | | | | 21,729,878 | | | | 341,938,593 | |
Class R6(d) | | | 1,722,614 | | | | 29,538,742 | | | | 683 | | | | 10,022 | |
| | | | |
Issued as reinvestment of dividends: | | | | | | | | | | | | | | | | |
Class A | | | 541,803 | | | | 7,184,313 | | | | 333,085 | | | | 5,385,982 | |
Class B(b) | | | — | | | | — | | | | 761 | | | | 11,508 | |
Class C | | | 94,802 | | | | 1,175,541 | | | | 56,560 | | | | 856,327 | |
Class Y | | | 1,676,439 | | | | 22,296,635 | | | | 1,035,701 | | | | 16,809,426 | |
Class R6 | | | 85,239 | | | | 1,133,683 | | | | — | | | | — | |
| | | | |
Conversion of Class B shares to Class A shares:(c) | | | | | | | | | | | | | | | | |
Class A | | | 26,182 | | | | 458,973 | | | | 46,770 | | | | 736,365 | |
Class B | | | (28,037 | ) | | | (458,973 | ) | | | (50,113 | ) | | | (736,365 | ) |
| | | | |
Reacquired: | | | | | | | | | | | | | | | | |
Class A | | | (3,155,360 | ) | | | (49,640,210 | ) | | | (5,102,092 | ) | | | (76,268,211 | ) |
Class B(b) | | | (1,000 | ) | | | (16,125 | ) | | | (11,144 | ) | | | (159,935 | ) |
Class C | | | (569,478 | ) | | | (8,267,591 | ) | | | (451,974 | ) | | | (6,494,009 | ) |
Class Y | | | (19,091,795 | ) | | | (296,927,286 | ) | | | (5,995,212 | ) | | | (92,694,560 | ) |
Class R6 | | | (433,617 | ) | | | (6,861,223 | ) | | | — | | | | — | |
Net increase (decrease) in share activity | | | (6,252,916 | ) | | $ | (89,520,078 | ) | | | 13,930,474 | | | $ | 225,489,869 | |
| (a) | There are entities that are record owners of more than 5% of the outstanding shares of the Fund and in the aggregate own 62% of the outstanding shares of the Fund. IDI has an agreement with these entities to sell Fund shares. The Fund, Invesco and/or Invesco affiliates may make payments to these entities, which are considered to be related to the Fund, for providing services to the Fund, Invesco and/or Invesco affiliates including but not limited to services such as securities brokerage, distribution, third party record keeping and account servicing. The Fund has no knowledge as to whether all or any portion of the shares owned of record by these entities are also owned beneficially. |
| (b) | Class B shares activity for the period January 1, 2018 through January 26, 2018 (date of conversion). |
| (c) | Effective as of the close of business January 26, 2018, all outstanding Class B shares were converted to Class A shares. |
| (d) | Commencement date of April 4, 2017. |
20 Invesco European Small Company Fund
NOTE 12—Financial Highlights
The following schedule presents financial highlights for a share of the Fund outstanding throughout the periods indicated.
| | | | | | | | | | | | | | | | | | | | | | | | | | | | | | | | | | | | | | | | | | | | | | | | | | | | | | | | |
| | | Net asset
value,
beginning
of period | | | Net
investment
income(a) | | | Net gains
(losses)
on securities
(both
realized and
unrealized) | | | Total from
investment
operations | | | Dividends
from net
investment
income | | | Distributions
from net
realized
gains | | | Total
distributions | | | Net asset
value, end
of period | | | Total
return(b) | | | Net assets,
end of period
(000’s omitted) | | | Ratio of
expenses
to average
net assets
with fee waivers
and/or expenses
absorbed | | | Ratio of
expenses
to average net
assets without
fee waivers
and/or expenses
absorbed | | | Ratio of net
investment
income
to average
net assets | | | Portfolio
turnover(c) | |
Class A | | | | | | | | | | | | | | | | | | | | | | | | | | | | | | | | | | | | | | | | | | | | | | | | | | | | | | | | |
Year ended 12/31/18 | | $ | 16.58 | | | $ | 0.28 | | | $ | (2.80 | ) | | $ | (2.52 | ) | | $ | (0.29 | ) | | $ | (0.54 | ) | | $ | (0.83 | ) | | $ | 13.23 | | | | (15.21 | )% | | $ | 127,904 | | | | 1.35 | %(d) | | | 1.38 | %(d) | | | 1.73 | %(d) | | | 11 | % |
Year ended 12/31/17 | | | 13.35 | | | | 0.29 | (e) | | | 3.47 | | | | 3.76 | | | | (0.27 | ) | | | (0.26 | ) | | | (0.53 | ) | | | 16.58 | | | | 28.29 | | | | 186,233 | | | | 1.40 | | | | 1.42 | | | | 1.85 | (e) | | | 10 | |
Year ended 12/31/16 | | | 12.55 | | | | 0.23 | | | | 0.85 | | | | 1.08 | | | | (0.28 | ) | | | — | | | | (0.28 | ) | | | 13.35 | | | | 8.61 | | | | 184,024 | | | | 1.40 | | | | 1.42 | | | | 1.80 | | | | 11 | |
Year ended 12/31/15 | | | 12.36 | | | | 0.14 | | | | 0.73 | | | | 0.87 | | | | (0.19 | ) | | | (0.49 | ) | | | (0.68 | ) | | | 12.55 | | | | 7.01 | | | | 205,621 | | | | 1.44 | | | | 1.46 | | | | 1.12 | | | | 19 | |
Year ended 12/31/14 | | | 14.85 | | | | 0.26 | (e) | | | (1.31 | ) | | | (1.05 | ) | | | (0.28 | ) | | | (1.16 | ) | | | (1.44 | ) | | | 12.36 | | | | (7.02 | ) | | | 173,809 | | | | 1.39 | | | | 1.41 | | | | 1.72 | (e) | | | 14 | |
Class B | | | | | | | | | | | | | | | | | | | | | | | | | | | | | | | | | | | | | | | | | | | | | | | | | | | | | | | | |
Year ended 12/31/18(f) | | | 15.49 | | | | 0.01 | | | | 0.87 | | | | 0.88 | | | | — | | | | — | | | | — | | | | 16.37 | | | | 5.68 | | | | — | | | | 2.10 | (d)(h) | | | 2.13 | (d)(h) | | | 0.98 | (d)(h) | | | 11 | |
Year ended 12/31/17 | | | 12.51 | | | | 0.16 | (e) | | | 3.24 | | | | 3.40 | | | | (0.16 | ) | | | (0.26 | ) | | | (0.42 | ) | | | 15.49 | | | | 27.23 | | | | 447 | | | | 2.15 | | | | 2.17 | | | | 1.10 | (e) | | | 10 | |
Year ended 12/31/16 | | | 11.76 | | | | 0.13 | | | | 0.79 | | | | 0.92 | | | | (0.17 | ) | | | — | | | | (0.17 | ) | | | 12.51 | | | | 7.88 | | | | 1,102 | | | | 2.15 | | | | 2.17 | | | | 1.05 | | | | 11 | |
Year ended 12/31/15 | | | 11.65 | | | | 0.04 | | | | 0.68 | | | | 0.72 | | | | (0.12 | ) | | | (0.49 | ) | | | (0.61 | ) | | | 11.76 | | | | 6.16 | | | | 2,262 | | | | 2.19 | | | | 2.21 | | | | 0.37 | | | | 19 | |
Year ended 12/31/14 | | | 14.05 | | | | 0.14 | (e) | | | (1.23 | ) | | | (1.09 | ) | | | (0.15 | ) | | | (1.16 | ) | | | (1.31 | ) | | | 11.65 | | | | (7.71 | ) | | | 2,938 | | | | 2.14 | | | | 2.16 | | | | 0.97 | (e) | | | 14 | |
Class C | | | | | | | | | | | | | | | | | | | | | | | | | | | | | | | | | | | | | | | | | | | | | | | | | | | | | | | | |
Year ended 12/31/18 | | | 15.52 | | | | 0.15 | | | | (2.61 | ) | | | (2.46 | ) | | | (0.16 | ) | | | (0.54 | ) | | | (0.70 | ) | | | 12.36 | | | | (15.89 | ) | | | 22,684 | | | | 2.10 | (d) | | | 2.13 | (d) | | | 0.98 | (d) | | | 11 | |
Year ended 12/31/17 | | | 12.53 | | | | 0.16 | (e) | | | 3.25 | | | | 3.41 | | | | (0.16 | ) | | | (0.26 | ) | | | (0.42 | ) | | | 15.52 | | | | 27.27 | | | | 34,366 | | | | 2.15 | | | | 2.17 | | | | 1.10 | (e) | | | 10 | |
Year ended 12/31/16 | | | 11.78 | | | | 0.13 | | | | 0.79 | | | | 0.92 | | | | (0.17 | ) | | | — | | | | (0.17 | ) | | | 12.53 | | | | 7.87 | | | | 30,709 | | | | 2.15 | | | | 2.17 | | | | 1.05 | | | | 11 | |
Year ended 12/31/15 | | | 11.66 | | | | 0.04 | | | | 0.69 | | | | 0.73 | | | | (0.12 | ) | | | (0.49 | ) | | | (0.61 | ) | | | 11.78 | | | | 6.24 | | | | 36,613 | | | | 2.19 | | | | 2.21 | | | | 0.37 | | | | 19 | |
Year ended 12/31/14 | | | 14.07 | | | | 0.14 | (e) | | | (1.24 | ) | | | (1.10 | ) | | | (0.15 | ) | | | (1.16 | ) | | | (1.31 | ) | | | 11.66 | | | | (7.78 | ) | | | 34,195 | | | | 2.14 | | | | 2.16 | | | | 0.97 | (e) | | | 14 | |
Class Y | | | | | | | | | | | | | | | | | | | | | | | | | | | | | | | | | | | | | | | | | | | | | | | | | | | | | | | | |
Year ended 12/31/18 | | | 16.64 | | | | 0.32 | | | | (2.81 | ) | | | (2.49 | ) | | | (0.34 | ) | | | (0.54 | ) | | | (0.88 | ) | | | 13.27 | | | | (15.01 | ) | | | 410,107 | | | | 1.10 | (d) | | | 1.13 | (d) | | | 1.98 | (d) | | | 11 | |
Year ended 12/31/17 | | | 13.41 | | | | 0.34 | (e) | | | 3.46 | | | | 3.80 | | | | (0.31 | ) | | | (0.26 | ) | | | (0.57 | ) | | | 16.64 | | | | 28.48 | | | | 608,335 | | | | 1.15 | | | | 1.17 | | | | 2.10 | (e) | | | 10 | |
Year ended 12/31/16 | | | 12.60 | | | | 0.27 | | | | 0.85 | | | | 1.12 | | | | (0.31 | ) | | | — | | | | (0.31 | ) | | | 13.41 | | | | 8.95 | | | | 265,250 | | | | 1.15 | | | | 1.17 | | | | 2.05 | | | | 11 | |
Year ended 12/31/15 | | | 12.39 | | | | 0.18 | | | | 0.73 | | | | 0.91 | | | | (0.21 | ) | | | (0.49 | ) | | | (0.70 | ) | | | 12.60 | | | | 7.33 | | | | 257,177 | | | | 1.19 | | | | 1.21 | | | | 1.37 | | | | 19 | |
Year ended 12/31/14 | | | 14.90 | | | | 0.30 | (e) | | | (1.32 | ) | | | (1.02 | ) | | | (0.33 | ) | | | (1.16 | ) | | | (1.49 | ) | | | 12.39 | | | | (6.81 | ) | | | 140,910 | | | | 1.14 | | | | 1.16 | | | | 1.97 | (e) | | | 14 | |
Class R6 | | | | | | | | | | | | | | | | | | | | | | | | | | | | | | | | | | | | | | | | | | | | | | | | | | | | | | | | |
Year ended 12/31/18 | | | 16.64 | | | | 0.33 | | | | (2.81 | ) | | | (2.48 | ) | | | (0.35 | ) | | | (0.54 | ) | | | (0.89 | ) | | | 13.27 | | | | (14.93 | ) | | | 18,243 | | | | 1.04 | (d) | | | 1.07 | (d) | | | 2.04 | (d) | | | 11 | |
Year ended 12/31/17(g) | | | 14.67 | | | | 0.27 | (e) | | | 2.28 | | | | 2.55 | | | | (0.32 | ) | | | (0.26 | ) | | | (0.58 | ) | | | 16.64 | | | | 17.49 | | | | 11 | | | | 1.08 | (h) | | | 1.10 | (h) | | | 2.17 | (e)(h) | | | 10 | |
| (a) | Calculated using average shares outstanding. |
| (b) | Includes adjustments in accordance with accounting principles generally accepted in the United States of America and as such, the net asset value for financial reporting purposes and the returns based upon those net asset values may differ from the net asset value and returns for shareholder transactions. Does not include sales charges and is not annualized for periods less than one year, if applicable. |
| (c) | Portfolio turnover is calculated at the fund level and is not annualized for periods less than one year, if applicable. |
| (d) | Ratios are based on average daily net assets (000’s omitted) of $168,785, $459, $30,826, $586,135 and $20,404 for Class A, Class B, Class C, Class Y and Class R6 shares, respectively. |
| (e) | Net investment income per share and the ratio of net investment income to average net assets include significant dividends received during the year ended December 31, 2017. Net investment income per share and the ratio of net investment income to average net assets excluding the significant dividends are $0.24 and 1.51%, $0.11 and 0.76%, $0.11 and 0.76%, $0.29 and 1.76% and $0.22 and 1.83% for Class A, Class B, Class C, Class Y and Class R6 shares, respectively. |
| | Net investment income per share and the ratio of net investment income to average net assets include significant dividends received during the year ended December 31, 2014. Net investment income per share and the ratio of net investment income to average net assets excluding the significant dividends are $0.18 and 1.23%, $0.07 and 0.48%, $0.07 and 0.48% and $0.22 and 1.48% for Class A, Class B, Class C and Class Y shares, respectively. |
| (f) | Reflects activity for the period January 1, 2018 through January 26, 2018 (date of conversion). |
| (g) | Commencement date of April 4, 2017. |
21 Invesco European Small Company Fund
Report of Independent Registered Public Accounting Firm
To the Board of Trustees of AIM Funds Group (Invesco Funds Group)
and Shareholders of Invesco European Small Company Fund:
Opinion on the Financial Statements
We have audited the accompanying statement of assets and liabilities, including the schedule of investments, of Invesco European Small Company Fund (one of the funds constituting AIM Funds Group (Invesco Funds Group), hereafter referred to as the “Fund”) as of December 31, 2018, the related statement of operations for the year ended December 31, 2018, the statement of changes in net assets for each of the two years in the period ended December 31, 2018, including the related notes, and the financial highlights for each of the periods indicated therein (collectively referred to as the “financial statements”). In our opinion, the financial statements present fairly, in all material respects, the financial position of the Fund as of December 31, 2018, the results of its operations for the year then ended, the changes in its net assets for each of the two years in the period ended December 31, 2018 and the financial highlights for each of the periods indicated therein in conformity with accounting principles generally accepted in the United States of America.
Basis for Opinion
These financial statements are the responsibility of the Fund’s management. Our responsibility is to express an opinion on the Fund’s financial statements based on our audits. We are a public accounting firm registered with the Public Company Accounting Oversight Board (United States) (PCAOB) and are required to be independent with respect to the Fund in accordance with the U.S. federal securities laws and the applicable rules and regulations of the Securities and Exchange Commission and the PCAOB.
We conducted our audits of these financial statements in accordance with the standards of the PCAOB. Those standards require that we plan and perform the audit to obtain reasonable assurance about whether the financial statements are free of material misstatement, whether due to error or fraud.
Our audits included performing procedures to assess the risks of material misstatement of the financial statements, whether due to error or fraud, and performing procedures that respond to those risks. Such procedures included examining, on a test basis, evidence regarding the amounts and disclosures in the financial statements. Our audits also included evaluating the accounting principles used and significant estimates made by management, as well as evaluating the overall presentation of the financial statements. Our procedures included confirmation of securities owned as of December 31, 2018 by correspondence with the custodian and transfer agent. We believe that our audits provide a reasonable basis for our opinion.
PricewaterhouseCoopers LLP
Houston, TX
February 28, 2019
We have served as the auditor of one or more of the investment companies in the Invesco group of investment companies since at least 1995. We have not been able to determine the specific year we began serving as auditor.
22 Invesco European Small Company Fund
Calculating your ongoing Fund expenses
Example
As a shareholder of the Fund, you incur two types of costs: (1) transaction costs, which may include sales charges (loads) on purchase payments or contingent deferred sales charges on redemptions, if any; and (2) ongoing costs, including management fees, distribution and/or service (12b-1) fees, and other Fund expenses. This example is intended to help you understand your ongoing costs (in dollars) of investing in the Fund and to compare these costs with ongoing costs of investing in other mutual funds. The example is based on an investment of $1,000 invested at the beginning of the period and held for the entire period July 1, 2018 through December 31, 2018.
Actual expenses
The table below provides information about actual account values and actual expenses. You may use the information in this table, together with the amount you invested, to estimate the expenses that you paid over the period. Simply divide your account value by $1,000 (for example, an $8,600 account value divided by $1,000 = 8.6), then multiply the result by the number in the table under the heading entitled “Actual Expenses Paid During Period” to estimate the expenses you paid on your account during this period.
Hypothetical example for comparison purposes
The table below also provides information about hypothetical account values and hypothetical expenses based on the Fund’s actual expense ratio and an assumed rate of return of 5% per year before expenses, which is not the Fund’s actual return.
The hypothetical account values and expenses may not be used to estimate the actual ending account balance or expenses you paid for the period. You may use this information to compare the ongoing costs of investing in the Fund and other funds. To do so, compare this 5% hypothetical example with the 5% hypothetical examples that appear in the shareholder reports of the other funds.
Please note that the expenses shown in the table are meant to highlight your ongoing costs only and do not reflect any transaction costs, such as sales charges (loads) on purchase payments or contingent deferred sales charges on redemptions, if any. Therefore, the hypothetical information is useful in comparing ongoing costs only, and will not help you determine the relative total costs of owning different funds. In addition, if these transaction costs were included, your costs would have been higher.
| | | | | | | | | | | | | | | | | | | | | | | | |
Class | | Beginning
Account Value (07/01/18) | | | ACTUAL | | | HYPOTHETICAL
(5% annual return before
expenses) | | | Annualized
Expense Ratio | |
| | Ending
Account Value
(12/31/18)1 | | | Expenses
Paid During
Period2 | | | Ending
Account Value
(12/31/18) | | | Expenses
Paid During
Period2 | |
| A | | $ | 1,000.00 | | | $ | 874.20 | | | $ | 6.47 | | | $ | 1,018.30 | | | $ | 6.97 | | | | 1.37 | % |
| C | | | 1,000.00 | | | | 870.90 | | | | 10.00 | | | | 1,014.52 | | | | 10.76 | | | | 2.12 | |
| Y | | | 1,000.00 | | | | 875.20 | | | | 5.29 | | | | 1,019.56 | | | | 5.70 | | | | 1.12 | |
| R6 | | | 1,000.00 | | | | 875.40 | | | | 5.06 | | | | 1,019.81 | | | | 5.45 | | | | 1.07 | |
| 1 | The actual ending account value is based on the actual total return of the Fund for the period July 1, 2018 through December 31, 2018, after actual expenses and will differ from the hypothetical ending account value which is based on the Fund’s expense ratio and a hypothetical annual return of 5% before expenses. |
| 2 | Expenses are equal to the Fund’s annualized expense ratio as indicated above multiplied by the average account value over the period, multiplied by 184/365 to reflect the most recent fiscal half year. |
23 Invesco European Small Company Fund
Tax Information
Form1099-DIV, Form 1042-S and other year-end tax information provide shareholders with actual calendar year amounts that should be included in their tax returns. Shareholders should consult their tax advisors.
The following distribution information is being provided as required by the Internal Revenue Code or to meet a specific state’s requirement.
The Fund designates the following amounts or, if subsequently determined to be different, the maximum amount allowable for its fiscal year ended December 31, 2018:
| | | | |
Federal and State Income Tax | |
Long-Term Capital Gain Distributions | | $ | 22,006,047 | |
Qualified Dividend Income* | | | 100.00 | % |
Corporate Dividends Received Deduction* | | | 1.51 | % |
U.S. Treasury Obligations* | | | 0.00 | % |
Foreign Taxes | | $ | 0.0409 | per share |
Foreign Source Income | | $ | 0.5326 | per share |
| | * | The above percentages are based on ordinary income dividends paid to shareholders during the Fund’s fiscal year. |
| | | | |
Non-Resident Alien Shareholders | |
QualifiedShort-Term Gains | | $ | 1,503,497 | |
24 Invesco European Small Company Fund
Trustees and Officers
The address of each trustee and officer is AIM Funds Group (Invesco Funds Group) (the “Trust”), 11 Greenway Plaza, Suite 1000, Houston, Texas 77046-1173. The trustees serve for the life of the Trust, subject to their earlier death, incapacitation, resignation, retirement or removal as more specifically provided in the Trust’s organizational documents. Each officer serves for a one year term or until their successors are elected and qualified. Column two below includes length of time served with predecessor entities, if any.
| | | | | | | | |
Name, Year of Birth and
Position(s) Held with the Trust | | Trustee and/
or Officer Since | | Principal Occupation(s)
During Past 5 Years | | Number of
Funds in Fund
Complex
Overseen by
Trustee | | Other Directorship(s)
Held by Trustee During
Past 5 Years |
| Interested Persons | | | | | | | | |
| Martin L. Flanagan1 — 1960 Trustee | | 2007 | | Executive Director, Chief Executive Officer and President, Invesco Ltd. (ultimate parent of Invesco and a global investment management firm); Trustee, The Invesco Funds; Vice Chair, Investment Company Institute; and Member of Executive Board, SMU Cox School of Business Formerly: Advisor to the Board, Invesco Advisers, Inc. (formerly known as Invesco Institutional (N.A.), Inc.); Chairman and Chief Executive Officer, Invesco Advisers, Inc. (registered investment adviser); Director, Chairman, Chief Executive Officer and President, Invesco Holding Company (US), Inc. (formerly IVZ Inc.) (holding company), Invesco Group Services, Inc. (service provider) and Invesco North American Holdings, Inc. (holding company); Director, Chief Executive Officer and President, Invesco Holding Company Limited (parent of Invesco and a global investment management firm); Director, Invesco Ltd.; Chairman, Investment Company Institute and President, Co-Chief Executive Officer, Co-President, Chief Operating Officer and Chief Financial Officer, Franklin Resources, Inc. (global investment management organization) | | 158 | | None |
| Philip A. Taylor2 — 1954 Trustee and Senior Vice President | | 2006 | | Head of the Americas and Senior Managing Director, Invesco Ltd.; Director, Invesco Advisers, Inc. (formerly known as Invesco Institutional (N.A.), Inc.) (registered investment adviser); Director and Chairman, Invesco Investment Services, Inc. (formerly known as Invesco AIM Investment Services, Inc.) (registered transfer agent); Chief Executive Officer, Invesco Corporate Class Inc. (corporate mutual fund company); Director, Chairman and Chief Executive Officer, Invesco Canada Ltd. (formerly known as Invesco Trimark Ltd./Invesco Trimark Ltèe) (registered investment adviser and registered transfer agent); Trustee and Senior Vice President, The Invesco Funds; Director, Invesco Investment Advisers LLC (formerly known as Van Kampen Asset Management) Formerly: Director, Chairman, Chief Executive Officer and President, Invesco Management Group, Inc. (formerly known as Invesco AIM Management Group, Inc.) (financial services holding company); Co-Chairman, Co-President and Co-Chief Executive Officer, Invesco Advisers, Inc. (formerly known as Invesco Institutional (N.A.), Inc.) (registered investment adviser); Director, Chief Executive Officer and President, Van Kampen Exchange Corp; President and Principal Executive Officer, The Invesco Funds (other than AIM Treasurer’s Series Trust (Invesco Treasurer’s Series Trust), Short-Term Investments Trust and Invesco Management Trust); Executive Vice President, The Invesco Funds (AIM Treasurer’s Series Trust (Invesco Treasurer’s Series Trust), Short-Term Investments Trust and Invesco Management Trust only); Director and President, INVESCO Funds Group, Inc. (registered investment adviser and registered transfer agent); Director and Chairman, IVZ Distributors, Inc. (formerly known as INVESCO Distributors, Inc.) (registered broker dealer); Director, President and Chairman, Invesco Inc. (holding company), Invesco Canada Holdings Inc. (holding company), Trimark Investments Ltd./Placements Trimark Ltèe and Invesco Financial Services Ltd/Services Financiers Invesco Ltèe; Chief Executive Officer, Invesco Canada Fund Inc. (corporate mutual fund company); Director and Chairman, Van Kampen Investor Services Inc.; Director, Chief Executive Officer and President, 1371 Preferred Inc. (holding company) and Van Kampen Investments Inc.; Director and President, AIM GP Canada Inc. (general partner for limited partnerships) and Van Kampen Advisors, Inc.; Director and Chief Executive Officer, Invesco Trimark Dealer Inc. (registered broker dealer); Director, Invesco Distributors, Inc. (formerly known as Invesco AIM Distributors, Inc.) (registered broker dealer); Manager, Invesco Capital Management LLC; Director, Chief Executive Officer and President, Invesco Advisers, Inc.; Director, Chairman, Chief Executive Officer and President, Invesco AIM Capital Management, Inc.; President, Invesco Trimark Dealer Inc. and Invesco Trimark Ltd./Invesco Trimark Ltèe; Director and President, AIM Trimark Corporate Class Inc. and AIM Trimark Canada Fund Inc.; Senior Managing Director, Invesco Holding Company Limited; Director and Chairman, Fund Management Company (former registered broker dealer); President and Principal Executive Officer, The Invesco Funds (AIM Treasurer’s Series Trust (Invesco Treasurer’s Series Trust), and Short-Term Investments Trust only); President, AIM Trimark Global Fund Inc. and AIM Trimark Canada Fund Inc. | | 158 | | None |
| 1 | Mr. Flanagan is considered an interested person (within the meaning of Section 2(a)(19) of the 1940 Act) of the Trust because he is an officer of the Adviser to the Trust, and an officer and a director of Invesco Ltd., ultimate parent of the Adviser. |
| 2 | Mr. Taylor is considered an interested person (within the meaning of Section 2(a)(19) of the 1940 Act) of the Trust because he is an officer and a director of the Adviser. |
T-1 Invesco European Small Company Fund
Trustees and Officers—(continued)
| | | | | | | | |
Name, Year of Birth and
Position(s) Held with the Trust | | Trustee and/
or Officer Since | | Principal Occupation(s)
During Past 5 Years | | Number of
Funds in Fund
Complex
Overseen by
Trustee | | Other Directorship(s)
Held by Trustee During
Past 5 Years |
| Independent Trustees | | | | | | | | |
Bruce L. Crockett — 1944 Trustee and Chair | | 1987 | | Chairman, Crockett Technologies Associates (technology consulting company) Formerly: Director, Captaris (unified messaging provider); Director, President and Chief Executive Officer, COMSAT Corporation; Chairman, Board of Governors of INTELSAT (international communications company); ACE Limited (insurance company); Independent Directors Council and Investment Company Institute: Member of the Audit Committee, Investment Company Institute; Member of the Executive Committee and Chair of the Governance Committee, Independent Directors Council | | 158 | | Director and Chairman of the Audit Committee, ALPS (Attorneys Liability Protection Society) (insurance company); Director and Member of the Audit Committee and Compensation Committee, Ferroglobe PLC (metallurgical company) |
David C. Arch — 1945 Trustee | | 2010 | | Chairman of Blistex Inc. (consumer health care products manufacturer); Member, World Presidents’ Organization | | 158 | | Board member of the Illinois Manufacturers’ Association |
Jack M. Fields — 1952 Trustee | | 1997 | | Chief Executive Officer, Twenty First Century Group, Inc. (government affairs company); and Chairman, Discovery Learning Alliance (non-profit) Formerly: Owner and Chief Executive Officer, Dos Angeles Ranch L.P. (cattle, hunting, corporate entertainment); Director, Insperity, Inc. (formerly known as Administaff) (human resources provider); Chief Executive Officer, Texana Timber LP (sustainable forestry company); Director of Cross Timbers Quail Research Ranch (non-profit); and member of the U.S. House of Representatives | | 158 | | None |
Cynthia Hostetler — 1962 Trustee | | 2017 | | Non-Executive Director and Trustee of a number of public and private business corporations Formerly: Director, Aberdeen Investment Funds (4 portfolios); Head of Investment Funds and Private Equity, Overseas Private Investment Corporation; President, First Manhattan Bancorporation, Inc.; Attorney, Simpson Thacher & Bartlett LLP | | 158 | | Vulcan Materials Company (construction materials company); Trilinc Global Impact Fund; Genesse Wyoming, Inc. (railroads); Artio Global Investment LLC (mutual fund complex); Edgen Group, Inc. (specialized energy and infrastructure products distributor); Investment Company Institute (professional organization); Independent Directors Council (professional organization) |
Eli Jones — 1961 Trustee | | 2016 | | Professor and Dean, Mays Business School — Texas A&M University Formerly: Professor and Dean, Walton College of Business, University of Arkansas and E.J. Ourso College of Business, Louisiana State University; Director, Arvest Bank | | 158 | | Insperity, Inc. (formerly known as Administaff) (human resources provider) |
Prema Mathai-Davis — 1950 Trustee | | 1998 | | Retired Co-Owner & Partner of Quantalytics Research, LLC, (a FinTech Investment Research Platform for the Self-Directed Investor) | | 158 | | None |
Teresa M. Ressel — 1962 Trustee | | 2017 | | Non-executive director and trustee of a number of public and private business corporations Formerly: Chief Financial Officer, Olayan America, The Olayan Group (international investor/commercial/industrial); Chief Executive Officer, UBS Securities LLC; Group Chief Operating Officer, Americas, UBS AG; Assistant Secretary for Management & Budget and CFO, US Department of the Treasury | | 158 | | Atlantic Power Corporation (power generation company); ON Semiconductor Corp. (semiconductor supplier) |
Ann Barnett Stern — 1957 Trustee | | 2017 | | President and Chief Executive Officer, Houston Endowment Inc. (private philanthropic institution) Formerly: Executive Vice President and General Counsel, Texas Children’s Hospital; Attorney, Beck, Redden and Secrest, LLP; Business Law Instructor, University of St. Thomas; Attorney, Andrews & Kurth LLP | | 158 | | Federal Reserve Bank of Dallas |
Raymond Stickel, Jr. — 1944 Trustee | | 2005 | | Retired Formerly: Director, Mainstay VP Series Funds, Inc. (25 portfolios); Partner, Deloitte & Touche | | 158 | | None |
Robert C. Troccoli — 1949 Trustee | | 2016 | | Adjunct Professor, University of Denver — Daniels College of Business Formerly: Senior Partner, KPMG LLP | | 158 | | None |
Christopher L. Wilson — 1957 Trustee | | 2017 | | Non-executive director and trustee of a number of public and private business corporations Formerly: Director, TD Asset Management USA Inc. (mutual fund complex) (22 portfolios); Managing Partner, CT2, LLC (investing and consulting firm); President/Chief Executive Officer, Columbia Funds, Bank of America Corporation; President/Chief Executive Officer, CDC IXIS Asset Management Services, Inc.; Principal & Director of Operations, Scudder Funds, Scudder, Stevens & Clark, Inc.; Assistant Vice President, Fidelity Investments | | 158 | | ISO New England, Inc.(non-profit organization managing regional electricity market) |
T-2 Invesco European Small Company Fund
Trustees and Officers—(continued)
| | | | | | | | |
Name, Year of Birth and
Position(s) Held with the Trust | | Trustee and/
or Officer Since | | Principal Occupation(s)
During Past 5 Years | | Number of
Funds in Fund
Complex
Overseen by
Trustee | | Other Directorship(s)
Held by Trustee During
Past 5 Years |
| Other Officers | | | | | | | | �� |
Sheri Morris — 1964 President, Principal Executive Officer and Treasurer | | 1999 | | President, Principal Executive Officer and Treasurer, The Invesco Funds; Vice President, Invesco Advisers, Inc. (formerly known as Invesco Institutional (N.A.), Inc.) (registered investment adviser); and Vice President, Invesco Exchange-Traded Fund Trust, Invesco Exchange-Traded Fund Trust II, Invesco India Exchange-Traded Fund Trust, Invesco Actively Managed Exchange-Traded Fund Trust, Invesco Actively Managed Exchange-Traded Commodity Fund Trust and Invesco Exchange-Traded Self-Indexed Fund Trust Formerly: Vice President and Principal Financial Officer, The Invesco Funds; Vice President, Invesco AIM Advisers, Inc., Invesco AIM Capital Management, Inc. and Invesco AIM Private Asset Management, Inc.; Assistant Vice President and Assistant Treasurer, The Invesco Funds and Assistant Vice President, Invesco Advisers, Inc., Invesco AIM Capital Management, Inc. and Invesco AIM Private Asset Management, Inc.; and Treasurer, Invesco Exchange-Traded Fund Trust, Invesco Exchange-Traded Fund Trust II, Invesco India Exchange-Traded Fund Trust and Invesco Actively Managed Exchange-Traded Fund Trust | | N/A | | N/A |
| Russell C. Burk — 1958 Senior Vice President and Senior Officer | | 2005 | | Senior Vice President and Senior Officer, The Invesco Funds | | N/A | | N/A |
Jeffrey H. Kupor — 1968 Senior Vice President, Chief Legal Officer and Secretary | | 2018 | | Head of Legal of the Americas; Senior Vice President and Secretary, Invesco Advisers, Inc. (formerly known as Invesco Institutional (N.A.), Inc.) (registered investment adviser); Senior Vice President and Secretary, Invesco Distributors, Inc. (formerly known as Invesco AIM Distributors, Inc.); Vice President and Secretary, Invesco Investment Services, Inc. (formerly known as Invesco AIM Investment Services, Inc.) Senior Vice President, Chief Legal Officer and Secretary, The Invesco Funds; Secretary and General Counsel, Invesco Investment Advisers LLC (formerly known as Van Kampen Asset Management); Secretary and General Counsel, Invesco Capital Markets, Inc. (formerly known as Van Kampen Funds Inc.) and Chief Legal Officer, Invesco Exchange-Traded Fund Trust, Invesco Exchange-Traded Fund Trust II, Invesco India Exchange-Traded Fund Trust, Invesco Actively Managed Exchange-Traded Fund Trust, Invesco Actively Managed Exchange-Traded Commodity Fund Trust and Invesco Exchange-Traded Self-Indexed Fund Trust; Secretary, Invesco Indexing LLC; Secretary, W.L. Ross & Co., LLC; Secretary and Vice President, Jemstep, Inc. Formerly: Head of Legal, Worldwide Institutional; Secretary and General Counsel, INVESCO Private Capital Investments, Inc.; Senior Vice President, Secretary and General Counsel, Invesco Management Group, Inc. (formerly known as Invesco AIM Management Group, Inc.); Assistant Secretary, INVESCO Asset Management (Bermuda) Ltd.; Secretary and General Counsel, Invesco Private Capital, Inc.; Assistant Secretary and General Counsel, INVESCO Realty, Inc.; Secretary and General Counsel, Invesco Senior Secured Management, Inc.; and Secretary, Sovereign G./P. Holdings Inc. | | N/A | | N/A |
John M. Zerr — 1962 Senior Vice President | | 2006 | | Chief Operating Officer of the Americas; Senior Vice President, Invesco Advisers, Inc. (formerly known as Invesco Institutional (N.A.), Inc.) (registered investment adviser); Senior Vice President, Invesco Distributors, Inc. (formerly known as Invesco AIM Distributors, Inc.); Director and Vice President, Invesco Investment Services, Inc. (formerly known as Invesco AIM Investment Services, Inc.) Senior Vice President, The Invesco Funds; Managing Director, Invesco Capital Management LLC; Director, Invesco Investment Advisers LLC (formerly known as Van Kampen Asset Management); Senior Vice President, Invesco Capital Markets, Inc. (formerly known as Van Kampen Funds Inc.); Manager, Invesco Indexing LLC Formerly: Director and Senior Vice President, Invesco Management Group, Inc. (formerly known as Invesco AIM Management Group, Inc.); Secretary and General Counsel, Invesco Management Group, Inc. (formerly known as Invesco AIM Management Group, Inc.); Secretary, Invesco Investment Services, Inc. (formerly known as Invesco AIM Investment Services, Inc.); Chief Legal Officer and Secretary, The Invesco Funds; Secretary and General Counsel, Invesco Investment Advisers LLC (formerly known as Van Kampen Asset Management); Secretary and General Counsel, Invesco Capital Markets, Inc. (formerly known as Van Kampen Funds Inc.); Chief Legal Officer, Invesco Exchange-Traded Fund Trust, Invesco Exchange-Traded Fund Trust II, Invesco India Exchange-Traded Fund Trust, Invesco Actively Managed Exchange-Traded Fund Trust, Invesco Actively Managed Exchange-Traded Commodity Fund Trust and Invesco Exchange-Traded Self-Indexed Fund Trust; Secretary, Invesco Indexing LLC; Director, Secretary, General Counsel and Senior Vice President, Van Kampen Exchange Corp.; Director, Vice President and Secretary, IVZ Distributors, Inc. (formerly known as INVESCO Distributors, Inc.); Director and Vice President, INVESCO Funds Group, Inc.; Director and Vice President, Van Kampen Advisors Inc.; Director, Vice President, Secretary and General Counsel, Van Kampen Investor Services Inc.; Director and Secretary, Invesco Distributors, Inc. (formerly known as Invesco AIM Distributors, Inc.); Director, Senior Vice President, General Counsel and Secretary, Invesco AIM Advisers, Inc. and Van Kampen Investments Inc.; Director, Vice President and Secretary, Fund Management Company; Director, Senior Vice President, Secretary, General Counsel and Vice President, Invesco AIM Capital Management, Inc.; Chief Operating Officer and General Counsel, Liberty Ridge Capital, Inc. (an investment adviser) | | N/A | | N/A |
T-3 Invesco European Small Company Fund
Trustees and Officers—(continued)
| | | | | | | | |
Name, Year of Birth and
Position(s) Held with the Trust | | Trustee and/
or Officer Since | | Principal Occupation(s)
During Past 5 Years | | Number of
Funds in Fund
Complex
Overseen by
Trustee | | Other Directorship(s)
Held by Trustee During
Past 5 Years |
| Other Officers—(continued) | | | | | | | | |
Gregory G. McGreevey — 1962 Senior Vice President | | 2012 | | Senior Managing Director, Invesco Ltd.; Director, Chairman, President, and Chief Executive Officer, Invesco Advisers, Inc. (formerly known as Invesco Institutional (N.A.), Inc.) (registered investment adviser); Director, Invesco Mortgage Capital, Inc. and Invesco Senior Secured Management, Inc.; and Senior Vice President, The Invesco Funds Formerly: Senior Vice President, Invesco Management Group, Inc. and Invesco Advisers, Inc.; Assistant Vice President, The Invesco Funds | | N/A | | N/A |
Kelli Gallegos — 1970 Vice President, Principal Financial Officer and Assistant Treasurer | | 2008 | | Vice President and Treasurer, Invesco Exchange-Traded Fund Trust, Invesco Exchange-Traded Fund Trust II, Invesco India Exchange-Traded Fund Trust, Invesco Actively Managed Exchange-Traded Fund Trust, Invesco Actively Managed Exchange-Traded Commodity Fund Trust and Invesco Exchange-Traded Self-Indexed Fund Trust; Vice President, Principal Financial Officer and Assistant Treasurer, The Invesco Funds; Principal Financial and Accounting Officer — Pooled Investments, Invesco Capital Management LLC Formerly: Assistant Treasurer, Invesco Exchange-Traded Fund Trust, Invesco Exchange-Traded Fund Trust II, Invesco India Exchange-Traded Fund Trust, Invesco Actively Managed Exchange-Traded Fund Trust, Invesco Actively Managed Exchange-Traded Commodity Fund Trust and Invesco Exchange-Traded Self-Indexed Fund Trust; Assistant Treasurer, Invesco Capital Management LLC; Assistant Vice President, The Invesco Funds | | N/A | | N/A |
Tracy Sullivan — 1962 Vice President, Chief Tax Officer and Assistant Treasurer | | 2008 | | Vice President, Chief Tax Officer and Assistant Treasurer, The Invesco Funds; Assistant Treasurer, Invesco Capital Management LLC, Invesco Exchange-Traded Fund Trust, Invesco Exchange-Traded Fund Trust II, Invesco India Exchange-Traded Fund Trust, Invesco Actively Managed Exchange-Traded Fund Trust, Invesco Actively Managed Exchange-Traded Commodity Fund Trust and Invesco Exchange-Traded Self-Indexed Fund Trust Formerly: Assistant Vice President, The Invesco Funds | | N/A | | N/A |
Crissie M. Wisdom — 1969 Anti-Money Laundering Compliance Officer | | 2013 | | Anti-Money Laundering Compliance Officer, Invesco Advisers, Inc. (formerly known as Invesco Institutional (N.A.), Inc.) (registered investment adviser), Invesco Capital Markets, Inc. (formerly known as Van Kampen Funds Inc.), Invesco Distributors, Inc., Invesco Investment Services, Inc., The Invesco Funds, and Invesco Exchange-Traded Fund Trust, Invesco Exchange-Traded Fund Trust II, Invesco India Exchange-Traded Fund Trust, Invesco Actively Managed Exchange-Traded Fund Trust, Invesco Actively Managed Exchange-Traded Commodity Fund Trust and Invesco Exchange-Traded Self-Indexed Fund Trust; Anti-Money Laundering Compliance Officer and Bank Secrecy Act Officer, INVESCO National Trust Company and Invesco Trust Company; and Fraud Prevention Manager and Controls and Risk Analysis Manager for Invesco Investment Services, Inc. Formerly: Anti-Money Laundering Compliance Officer, Van Kampen Exchange Corp. and Invesco Management Group, Inc. | | N/A | | N/A |
Robert R. Leveille — 1969 Chief Compliance Officer | | 2016 | | Chief Compliance Officer, Invesco Advisers, Inc. (registered investment adviser); and Chief Compliance Officer, The Invesco Funds Formerly: Chief Compliance Officer, Putnam Investments and the Putnam Funds | | N/A | | N/A |
The Statement of Additional Information of the Trust includes additional information about the Fund’s Trustees and is available upon request, without charge, by calling 1.800.959.4246. Please refer to the Fund’s Statement of Additional Information for information on the Fund’s sub-advisers.
| | | | | | |
Office of the Fund 11 Greenway Plaza, Suite 1000 Houston, TX 77046-1173 | | Investment Adviser Invesco Advisers, Inc. 1555 Peachtree Street, N.E. Atlanta, GA 30309 | | Distributor Invesco Distributors, Inc. 11 Greenway Plaza, Suite 1000 Houston, TX 77046-1173 | | Auditors PricewaterhouseCoopers LLP 1000 Louisiana Street, Suite 5800 Houston, TX 77002-5021 |
| | | |
| | | | | | |
Counsel to the Fund Stradley Ronon Stevens & Young, LLP 2005 Market Street, Suite 2600 Philadelphia, PA 19103-7018 | | Counsel to the Independent Trustees Goodwin Procter LLP 901 New York Avenue, N.W. Washington, D.C. 20001 | | Transfer Agent Invesco Investment Services, Inc. 11 Greenway Plaza, Suite 1000 Houston, TX 77046-1173 | | Custodian State Street Bank and Trust Company 225 Franklin Street Boston, MA 02110-2801 |
T-4 Invesco European Small Company Fund
Explore High-Conviction Investing with Invesco

Go paperless with eDelivery
Visit invesco.com/edelivery to enjoy the convenience and security of anytime electronic access to your investment documents.
With eDelivery, you can elect to have any or all of the following materials delivered straight to your inbox to download, save and print from your own computer:
| ∎ | | Fund reports and prospectuses |
Invesco mailing information
Send general correspondence to Invesco Investment Services, Inc., P.O. Box 219078, Kansas City, MO 64121-9078.
Important notice regarding delivery of security holder documents
To reduce Fund expenses, only one copy of most shareholder documents may be mailed to shareholders with multiple accounts at the same address (Householding). Mailing of your shareholder documents may be householded indefinitely unless you instruct us otherwise. If you do not want the mailing of these documents to be combined with those for other members of your household, please contact Invesco Investment Services, Inc. at 800 959 4246 or contact your financial institution. We will begin sending you individual copies for each account within 30 days after receiving your request.
Fund holdings and proxy voting information
The Fund provides a complete list of its holdings four times in each fiscal year, at the quarter ends. For the second and fourth quarters, the lists appear in the Fund’s semiannual and annual reports to shareholders. For the first and third quarters, the Fund files the lists with the Securities and Exchange Commission (SEC) on FormN-Q (or any successor Form). The most recent list of portfolio holdings is available at invesco.com/completeqtrholdings. Shareholders can also look up the Fund’s FormsN-Q (or any successor Form) on the SEC website at sec.gov. The SEC file numbers for the Fund are shown below.
A description of the policies and procedures that the Fund uses to determine how to vote proxies relating to portfolio securities is available without charge, upon request, from our Client Services department at 800 959 4246 or at invesco.com/proxyguidelines. The information is also available on the SEC website, sec.gov.
| | |
Information regarding how the Fund voted proxies related to its portfolio securities during the most recent12-month period ended June 30 is available at invesco.com/proxysearch. The information is also available on the SEC website, sec.gov. Invesco Advisers, Inc. is an investment adviser; it provides investment advisory services to individual and institutional clients and does not sell securities. Invesco Distributors, Inc. is the US distributor for Invesco Ltd.’s retail mutual funds, exchange-traded funds and institutional money market funds. Both are wholly owned, indirect subsidiaries of Invesco Ltd. | |  |
| |
| SEC file numbers:811-01540 and002-27334 Invesco Distributors, Inc. ESC-AR-1 | | 02192019 1526 |
| | | | |
| | |
 | | Annual Report to Shareholders | | December 31, 2018 |
| | |
| | Invesco Global Core Equity Fund |
| | Nasdaq: |
| | A: AWSAX◾ C: AWSCX◾ R: AWSRX◾ Y: AWSYX◾ R5: AWSIX◾ R6: AWSSX |

Letters to Shareholders
| | | | |

Philip Taylor | | | | Dear Shareholders: This annual report includes information about your Fund, including performance data and a complete list of its investments as of the close of the reporting period. Inside is a discussion of how your Fund was managed and the factors that affected its performance during the reporting period. From record market highs to an explosive late-year downturn, 2018 was a memorable and volatile year for investors. US equity markets entered 2018 enthused by corporate tax cuts and improving global growth. Despite asell-off in February, several US equity indexes continued to redefine highs for the first three quarters of the year. The ebullience, however, ended in October as global equities, in particular US stocks, sold off sharply and continued this volatile |
downward spiral for the rest of the year. The catalyst for thesell-off was a combination of ongoing trade conflicts between the US and China, fears of a global economic slowdown and rising US interest rates. Gains posted earlier in the year were erased as most US and international equity indexes ended 2018 in negative territory. During the late-year equitysell-off, Treasury bonds, along with government and municipal bonds, rallied. In general, fixed income markets outperformed equity markets for the year as yields declined from earlier highs and, conversely, bond prices rose. Given the strong economy, the US Federal Reserve (the Fed) raised the federal funds rate four times in 2018. In December, however, the Fed delivered a more “dovish hike” by simultaneously raising rates while reducing guidance for 2019 rate increases from three to two. As 2019 unfolds, we’ll see how the interplay of interest rates, economic data, geopolitics and a host of other factors affect US and overseas equity and fixed income markets.
Short-term market volatility can prompt some investors to abandon their investment plans – and can cause others to settle for whatever returns the market has to offer. The investment professionals at Invesco, in contrast, invest with high conviction. This means that, no matter the asset class or the strategy, each investment team has a passion to exceed. We want to help investors achieve better outcomes, such as seeking higher returns, helping mitigate risk and generating income. Of course, investing with high conviction can’t guarantee a profit or ensure success; no investment strategy can. To learn more about how we invest with high conviction, visitinvesco.com/HighConviction.
You, too, can invest with high conviction by maintaining a long-term investment perspective and by working with your financial adviser on a regular basis. During periods of short-term market volatility or uncertainty, your financial adviser can keep you focused on your long-term investment goals – a new home, a child’s college education or a secure retirement. He or she also can share research about the economy, the markets and individual investment options.
Visit our website for more information on your investments
Our website,invesco.com/us, offers a wide range of market insights and investment perspectives. On the website, you’ll find detailed information about our funds, including performance, holdings and portfolio manager commentaries. You can access information about your account by completing a simple, secure online registration. To do so, select “Log In” on the right side of the homepage, and then select “Register for Individual Account Access.”
In addition to the resources accessible on our website and through our mobile app, you can obtain timely updates to help you stay informed about the markets and the economy by connecting with Invesco on Twitter, LinkedIn or Facebook. You can access our blog atblog.invesco.us.com. Our goal is to provide you the information you want, when and where you want it.
Finally, I’m pleased to share with you Invesco’s commitment to both the Principles for Responsible Investment and to considering environmental, social and governance issues in our robust investment process. I invite you to learn more atinvesco.com/esg.
Have questions?
For questions about your account, contact an Invesco client services representative at 800 959 4246.
All of us at Invesco look forward to serving your investment management needs. Thank you for investing with us.
Sincerely,

Philip Taylor
Senior Managing Director, Invesco Ltd.
| | |
| 2 | | Invesco Global Core Equity Fund |
| | | | |

Bruce Crockett | | Dear Fellow Shareholders: Among the many important lessons I’ve learned in more than 40 years in a variety of business endeavors is the value of a trusted advocate. As independent chair of the Invesco Funds Board, I can assure you that the members of the Board are strong advocates for the interests of investors in Invesco’s mutual funds. We work hard to represent your interests through oversight of the quality of the investment management services your funds receive and other matters important to your investment, including but not limited to: |
| | ∎ | | Ensuring that Invesco offers a diverse lineup of mutual funds that your financial adviser can use to strive to meet your financial needs as your investment goals change over time. |
| | ∎ | | Monitoring how the portfolio management teams of the Invesco funds are performing in light of changing economic and market conditions. |
| ∎ | | Assessing each portfolio management team’s investment performance within the context of the investment strategy described in the fund’s prospectus. |
| ∎ | | Monitoring for potential conflicts of interests that may impact the nature of the services that your funds receive. |
We believe one of the most important services we provide our fund shareholders is the annual review of the funds’ advisory andsub-advisory contracts with Invesco Advisers and its affiliates. This review is required by the Investment Company Act of 1940 and focuses on the nature and quality of the services Invesco provides as the adviser to the Invesco funds and the reasonableness of the fees that it charges for those services. Each year, we spend months carefully reviewing information received from Invesco and a variety of independent sources, such as performance and fee data prepared by Lipper, Inc. (a subsidiary of Broadridge Financial Solutions, Inc.), an independent, third-party firm widely recognized as a leader in its field. We also meet with our independent legal counsel and other independent advisers to review and help us assess the information that we have received. Our goal is to assure that you receive quality investment management services for a reasonable fee.
I trust the measures outlined above provide assurance that you have a worthy advocate when it comes to choosing the Invesco Funds. On behalf of the Board, we look forward to continuing to represent your interests and serving your needs.
Sincerely,

Bruce L. Crockett
Independent Chair
Invesco Funds Board of Trustees
| | |
| 3 | | Invesco Global Core Equity Fund |
Management’s Discussion of Fund Performance
| | | | | | | | | | |
Performance summary For the year ended December 31, 2018, Class A shares of Invesco Global Core Equity Fund (the Fund), at net asset value (NAV), underperformed the MSCI World Index, the Fund’s broad market/style-specific benchmark. Your Fund’s long-term performance appears later in this report. | | | | and fears of slowing economic growth, particularly in the eurozone. Given signs of a strong economy, the US Federal Reserve (the Fed) raised interest rates four times during the year. Following December’s meeting, the Fed raised interest rates by 25 basis points and lowered guidance from three to two rate hikes in 2019, signaling a slightly more dovish stance than expected.1 In contrast, the European Central Bank held rates steady, indicating it would do so at least through the summer of 2019; however, it announced that its bond buying program would be discontinued at year end. Central banks in several other countries maintained extraordinarily accommodative monetary policies, as well. During the year, stock selection in the energy sector benefited the Fund’s performance relative to the broad market/style-specific benchmark. The largest detractors from relative performance included stock selection in the health care, industrials, communication services and information technology (IT) sectors, as well as underweight exposure to IT and health care. From a geographic perspective, stock selection in Australia and Hong Kong was beneficial to the Fund’s performance versus the broad market/style-specific benchmark for the year. Conversely, stock selection in Japan, the Nether-lands, Switzerland, the UK and, most notably, the US, detracted from the Fund’s relative performance. The Fund’s top contributor relative to its broad market/style-specific benchmark wasHCA Healthcare, which reported good results and a favorable outlook for the year. The stock responded well as the market had been skeptical that it could |
| Fund vs. Indexes |
Total returns, 12/31/17 to 12/31/18, at net asset value (NAV). Performance shown does not include applicable contingent deferred sales charges (CDSC) orfront-end sales charges, which would have reduced performance. |
Class A Shares | | | | | | -14.90% |
Class C Shares | | | | | | -15.58 |
Class R Shares | | | | | | -15.16 |
Class Y Shares | | | | | | -14.72 |
Class R5 Shares | | | | | | -14.70 |
Class R6 Shares | | | | | | -14.64 |
MSCI World Indexq (Broad Market/Style-Specific Index) | | -8.71 |
Lipper GlobalLarge-Cap Core Funds Index∎ (Peer Group Index) | | -10.46 |
Source(s):qRIMES Technologies Corp.;∎Lipper Inc. |
Market conditions and your Fund Calendar year 2018 proved to be an increasingly volatile time for global equities. After strong positive returns in January, global equities sold off sharply in February as rising inflation spurred concern that central banks would raise interest rates at a faster pace than previously expected. Through the rest of the first quarter, equity markets struggled to regain momentum, hampered by global trade tensions and weakness in technology stocks. Somewhat counterintuitively, emerging markets generally held up better than developed markets in this volatile environment. Significant market and currency volatility continued during the second quarter of 2018. While most domestic equity indexes delivered positive performance | | | | for the second quarter, most major international indexes had negative results. Many international stocks struggled as investors worried that heightened global trade tensions would derail economic growth. Other concerns such as geopolitical uncertainty and the potential impact of higher interest rates also weakened investor sentiment. In this environment, developed markets held up better than emerging markets. After a relatively quiet summer, market volatility markedly rose again in October. Global equity markets (particularly the US) declined sharply in the fourth quarter amid rising interest rates and concerns that higher inflation could result in a more restrictive monetary policy. Investors also had concerns over the Brexit negotiations, ongoing US-China trade tensions, declining oil prices |
| | | | |
| Portfolio Composition |
| By sector | | | | % of total net assets |
| | | | | | |
| |
Financials | | | 20.9% | |
| Communication Services | | | 15.1 | |
| Industrials | | | 13.3 | |
| Information Technology | | | 9.0 | |
| Health Care | | | 8.7 | |
| Consumer Discretionary | | | 8.6 | |
| Consumer Staples | | | 8.5 | |
| Energy | | | 7.8 | |
| Materials | | | 4.3 | |
| Utilities | | | 2.9 | |
| Real Estate | | | 0.5 | |
Money Market Funds Plus Other Assets Less Liabilities | | | 0.4 | |
| | | | |
| Top 10 Equity Holdings* | |
% of total net assets | |
| |
1. Chevron Corp. | | | 3.2% | |
2. Alphabet Inc.-Class C | | | 3.0 | |
3. Siemens AG | | | 3.0 | |
4. Royal Dutch ShellPLC-Class A-ADR | | | 3.0 | |
5. Enel S.p.A. | | | 2.9 | |
6. Verizon Communications Inc. | | | 2.7 | |
7. SoftBank Group Corp. | | | 2.6 | |
8. American Express Co. | | | 2.6 | |
9. First Republic Bank | | | 2.2 | |
10. AIA Group Ltd. | | | 2.1 | |
| | | | |
Total Net Assets | | $ | 704.1 million | |
| |
Total Number of Holdings* | | | 74 | |
The Fund’s holdings are subject to change, and there is no assurance that the Fund will continue to hold any particular security.
*Excluding money market fund holdings.
Data presented here are as of December 31, 2018.
| | |
| 4 | | Invesco Global Core Equity Fund |
meet, much less beat, management’s initial guidance for the year. Investors also appeared to be more confident in the company’s outlook for 2019.
Another key contributor to the Fund’s performance relative to its broad market/style-specific benchmark for the year was Brazilian energy giantPetróleo Brasileiro, which saw solid earnings estimate revision activity during the year. We exited our position in the holding before the close of the year.
Nike was a leading contributor to the Fund’s relative performance for the year, as the company reported material upside in sales and gross profit margin. The company benefited from growing online sales and quality of earnings.
Verizon Communications also aided the Fund’s relative performance for the year, as competitive intensity in the wireless industry moderated throughout the year, improving investor sentiment. Verizon also benefited because investors see it as a defensive safe haven asset with a less economically sensitive business model.
Shares of industrial manufacturerColfax, the Fund’s largest individual detractor versus the broad market/style-specific benchmark during the year, declined mainly due to higher costs that affected profits. We exited our position in Colfax before the close of the year.
Concho Resources was another detractor from the Fund’s performance relative to the broad market/style-specific benchmark during the year. The company sold off along with the energy sector as a whole, as oil prices fell during the year. In our view, company-specific issues were not the catalyst for the stock’s downturn.
During the year, several Japanese holdings were key detractors from the Fund’s performance versus the broad market/style-specific benchmark.Komatsu, a manufacturer of construction, mining, forestry and military equipment, was hampered by negative business news. In addition,Suruga Bank, a consumer-focused Japanese regional bank, experienced a recent slowdown in growth and some specific credit issues, which we viewed as temporary.
At the close of the year, the Fund’s largest overweight positions relative to the MSCI World Index were in the energy, financials, communication services and industrials sectors. The Fund also had a slight overweight position in the materials sector. The largest underweight positions
were in the consumer staples, IT, consumer discretionary and health care sectors.
Please note that the Fund’s strategy is principally implemented through equity investments, but may also use derivative instruments, including forward foreign currency contracts and options. The Fund can use forward foreign currency contracts and options to hedge against adverse movements in the foreign currencies in which portfolio securities are denominated.
Derivatives can be a cost-effective way to gain exposure to asset classes. However, derivatives may amplify traditional investment risks through the creation of leverage and may be less liquid than traditional securities. During the year, the use of index put options was additive to the Fund’s performance on an absolute basis and the use of forward foreign currency contracts detracted from the Fund’s performance on an absolute basis.
As always, we believe the team’s focus on mitigating risk and providing a high conviction investment strategy focused onbottom-up company research has the potential to reward investors during these uncertain times. In short, we seek to take advantage of the market’s volatile behavior and short-term focus. We believe our conservative approach should position the Fund to navigate the evolving economic backdrop.
We thank you for your continued investment in Invesco Global Core Equity Fund.
1 Source: US Federal Reserve
The views and opinions expressed in management’s discussion of Fund performance are those of Invesco Advisers, Inc. These views and opinions are subject to change at any time based on factors such as market and economic conditions. These views and opinions may not be relied upon as investment advice or recommendations, or as an offer for a particular security. The information is not a complete analysis of every aspect of any market, country, industry, security or the Fund. Statements of fact are from sources considered reliable, but Invesco Advisers, Inc. makes no representation or warranty as to their completeness or accuracy. Although historical performance is no guarantee of future results, these insights may help you understand our investment management philosophy.
See important Fund and, if applicable, index disclosures later in this report.
| | |
 | | Erik Esselink Portfolio Manager, is manager of Invesco Global Core Equity Fund. He joined Invesco in 2007. Mr. Esselink |
earned a bachelor of science degree from the Rotterdam School of Economics, where he studied commercial economics. |
 | | Jeffrey Everett Chartered Financial Analyst, Portfolio Manager andCo-Chief Investment Officer of Invesco’s Global Core |
| Equity Team, is manager of Invesco Global Core Equity Fund. He joined Invesco in 2016. Mr. Everett earned a bachelor’s degree in finance from Pennsylvania State University. |
| | |
 | | Marty Steinik Chartered Financial Analyst, Portfolio Manager, is manager of Invesco Global Core Equity Fund. He joined Invesco in 2016. |
| Mr. Steinik earned a BS degree from the University of Miami and an MBA from London Business School. He serves as Executive in Residence at the Smith School of Business at the University of Maryland. |
Assisted by Invesco’s Global Core Equity Team
| | |
| 5 | | Invesco Global Core Equity Fund |
Your Fund’s Long-Term Performance
Results of a $10,000 Investment – Oldest Share Class(es)
Fund and index data from 12/31/08
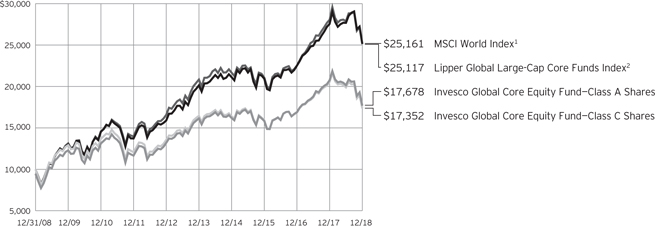
1 RIMES Technologies Corp.
2 Source: Lipper Inc.
Past performance cannot guarantee comparable future results.
The data shown in the chart include reinvested distributions, applicable sales charges and Fund expenses including management fees. Index results include reinvested dividends, but they do not reflect sales charges. Performance of the
peer group, if applicable, reflects fund expenses and management fees; performance of a market index does not. Performance shown in the chart and table(s) does not reflect deduction of taxes a shareholder would pay on Fund distributions or sale of Fund shares.
| | |
| 6 | | Invesco Global Core Equity Fund |
| | | | |
Average Annual Total Returns As of 12/31/18, including maximum applicable sales charges | |
| |
Class A Shares | | | | |
Inception (12/29/00) | | | 4.19 | % |
10 Years | | | 5.86 | |
5 Years | | | 0.70 | |
1 Year | | | -19.56 | |
| |
Class C Shares | | | | |
Inception (12/29/00) | | | 3.76 | % |
10 Years | | | 5.67 | |
5 Years | | | 1.07 | |
1 Year | | | -16.36 | |
| |
Class R Shares | | | | |
10 Years | | | 6.19 | % |
5 Years | | | 1.58 | |
1 Year | | | -15.16 | |
| |
Class Y Shares | | | | |
Inception (10/3/08) | | | 4.88 | % |
10 Years | | | 6.72 | |
5 Years | | | 2.09 | |
1 Year | | | -14.72 | |
| |
Class R5 Shares | | | | |
Inception (10/25/05) | | | 3.59 | % |
10 Years | | | 6.88 | |
5 Years | | | 2.16 | |
1 Year | | | -14.70 | |
| |
Class R6 Shares | | | | |
10 Years | | | 6.51 | % |
5 Years | | | 1.92 | |
1 Year | | | -14.64 | |
Class R shares incepted on May 23, 2011. Performance shown prior to that date is that of Class A shares and includes the12b-1 fees applicable to Class A shares.
Class R6 shares incepted on April 4, 2017. Performance shown prior to that date is that of Class A shares and includes the12b-1 fees applicable to Class A shares.
The performance data quoted represent past performance and cannot guarantee comparable future results; current performance may be lower or higher. Please visit invesco.com/performance for the most recentmonth-end performance. Performance figures reflect reinvested
distributions, changes in net asset value and the effect of the maximum sales charge unless otherwise stated. Investment return and principal value will fluctuate so that you may have a gain or loss when you sell shares.
The net annual Fund operating expense ratio set forth in the most recent Fund prospectus as of the date of this report for Class A, Class C, Class R, Class Y, Class R5 and Class R6 shares was 1.22%, 1.97%, 1.47%, 0.97%, 0.97% and 0.97%, respectively.1 The total annual Fund operating expense ratio set forth in the most recent Fund prospectus as of the date of this report for Class A, Class C, Class R, Class Y, Class R5 and Class R6 shares was 1.34%, 2.09%, 1.59%, 1.09%, 0.99% and 0.99%, respectively. The expense ratios presented above may vary from the expense ratios presented in other sections of this report that are based on expenses incurred during the period covered by this report.
Class A share performance reflects the maximum 5.50% sales charge, and Class C share performance reflects the applicable contingent deferred sales charge (CDSC) for the period involved. The CDSC on Class C shares is 1% for the first year after purchase. Class R, Class Y, Class R5 and Class R6 shares do not have afront-end sales charge or a CDSC; therefore, performance is at net asset value.
The performance of the Fund’s share classes will differ primarily due to different sales charge structures and class expenses.
Fund performance reflects any applicable fee waivers and/or expense reimbursements. Had the adviser not waived fees and/or reimbursed expenses currently or in the past, returns would have been lower. See current prospectus for more information.
| 1 | Total annual Fund operating expenses after any contractual fee waivers and/or expense reimbursements by the adviser in effect through at least April 30, 2020. See current prospectus for more information. |
| | |
| 7 | | Invesco Global Core Equity Fund |
Invesco Global Core Equity Fund’s investment objective is long-term growth of capital.
| ∎ | | Unless otherwise stated, information presented in this report is as of December 31, 2018, and is based on total net assets. |
| ∎ | | Unless otherwise noted, all data provided by Invesco. |
| ∎ | | To access your Fund’s reports/prospectus, visit invesco.com/fundreports. |
| | | | |
About share classes ∎ Class R shares are generally available only to employer sponsored retirement and benefit plans. Please see the prospectus for more information. ∎ Class Y shares are available only to certain investors. Please see the prospectus for more information. ∎ Class R5 sharesand Class R6 shares are available for use by retirement plans that meet certain standards and for institutional investors. Class R6 shares are also available through intermediaries that have established an agreement with Invesco Distributors, Inc. to make such shares available for use in retail omnibus accounts. Please see the prospectus for more information. Principal risks of investing in the Fund ∎ Depositary receipts risk.Investing in depositary receipts involves the same risks as direct investments in foreign securities. In addition, the underlying issuers of certain depositary receipts are under no obligation to distribute shareholder communications or pass through any voting rights with respect to the deposited securities to the holders of such receipts. The Fund may therefore receive less timely information or have less control than if it invested directly in the foreign issuer. ∎ Derivatives risk.The value of a derivative instrument depends largely on (and is derived from) the value of an underlying security, currency, commodity, interest rate, index or other asset (each referred to as an underlying asset). In addition to risks relating to the underlying assets, the use of derivatives may include other, possibly greater, risks, including counterparty, leverage and liquidity risks. Counterparty risk is the risk that the counterparty to the derivative contract will default on its obligation to pay the Fund the amount owed or otherwise perform under the derivative contract. Derivatives | | create leverage risk because they do not require payment up front equal to the economic exposure created by holding a position in the derivative. As a result, an adverse change in the value of the underlying asset could result in the Fund sustaining a loss that is substantially greater than the amount invested in the derivative or the anticipated value of the underlying asset, which may make the Fund’s returns more volatile and increase the risk of loss. Derivative instruments may also be less liquid than more traditional investments and the Fund may be unable to sell or close out its derivative positions at a desirable time or price. This risk may be more acute under adverse market conditions, during which the Fund may be most in need of liquidating its derivative positions. Derivatives may also be harder to value, less tax efficient and subject to changing government regulation that could impact the Fund’s ability to use certain derivatives or their cost. Derivatives strategies may not always be successful. For example, derivatives used for hedging or to gain or limit exposure to a particular market segment may not provide the expected benefits, particularly during adverse market conditions. ∎ Emerging markets securities risk. Emerging markets (also referred to as developing markets) are generally subject to greater market volatility, political, social and economic instability, uncertain trading markets and more governmental limitations on foreign investment than more developed markets. In addition, companies operating in emerging markets may be subject to lower trading volume and greater price fluctuations than companies in more developed markets. Securities law and the enforcement of systems of taxation in many emerging market countries may change quickly and unpredictably. The Fund’s investments in ChinaA-shares are subject to trading restrictions, quota limitations and clearing | | and settlement risks. In addition, investments in emerging markets securities may also be subject to additional transaction costs, delays in settlement procedures, and lack of timely information. ∎ Foreign securities risk.The Fund’s foreign investments may be adversely affected by political and social instability, changes in economic or taxation policies, difficulty in enforcing obligations, decreased liquidity or increased volatility. Foreign investments also involve the risk of the possible seizure, nationalization or expropriation of the issuer or foreign deposits (in which the Fund could lose its entire investments in a certain market) and the possible adoption of foreign governmental restrictions such as exchange controls. Unless the Fund has hedged its foreign securities risk, foreign securities risk also involves the risk of negative foreign currency rate fluctuations, which may cause the value of securities denominated in such foreign currency (or other instruments through which the Fund has exposure to foreign currencies) to decline in value. Currency exchange rates may fluctuate significantly over short periods of time. Currency hedging strategies, if used, are not always successful. ∎ Geographic focus risk.The Fund may from time to time invest a substantial amount of its assets in securities of issuers located in a single country or a limited number of countries. Adverse economic, political or social conditions in those countries may therefore have a significant negative impact on the Fund’s investment performance. ∎ Investing in the European Union risk.Investments in certain countries in the European Union are susceptible to high economic risks associated with high levels of debt, such as investments in sovereign debt of Greece, Italy and Spain. Efforts of the member states to further unify their economic and monetary policies may increase the potential for the downward movement of one member state’s market to cause a similar effect on other member states’ markets. Separately, the European Union faces issues involving its membership, |
|
|
| | |
This report must be accompanied or preceded by a currently effective Fund prospectus, which contains more complete information, including sales charges and expenses. Investors should read it carefully before investing. | | |
| | |
| NOT FDIC INSURED | MAY LOSE VALUE | NO BANK GUARANTEE | | |
| | |
| 8 | | Invesco Global Core Equity Fund |
| | structure, procedures and policies. The exit of one or more member states from the European Union, such as the United Kingdom (UK) which has announced its intention to exit, would place its currency and banking system in jeopardy. The exit by the UK or other member states will likely result in increased volatility, illiquidity and potentially lower economic growth in the affected markets, which will adversely affect the Fund’s investments. |
| ∎ | | Management risk.The Fund is actively managed and depends heavily on the Adviser’s judgment about markets, interest rates or the attractiveness, relative values, liquidity, or potential appreciation of particular investments made for the Fund’s portfolio. The Fund could experience losses if these judgments prove to be incorrect. Additionally, legislative, regulatory, or tax developments may adversely affect management of the Fund and, therefore, the ability of the Fund to achieve its investment objective. |
| ∎ | | Market risk.The market values of the Fund’s investments, and therefore the value of the Fund’s shares, will go up and down, sometimes rapidly or unpredictably. Market risk may affect a single issuer, industry or section of the economy, or it may affect the market as a whole. Individual stock prices tend to go up and down more dramatically than those of certain other types of investments, such as bonds. During a general downturn in the financial markets, multiple asset classes may decline in value. When markets perform well, there can be no assurance that specific investments held by the Fund will rise in value. |
| ∎ | | Preferred securities risk.Preferred securities are subject to issuer-specific and market risks applicable generally to equity securities. Preferred securities also may be subordinated to bonds or other debt instruments, subjecting them to a greater risk ofnon-payment, may be less liquid than many other securities, such as common stocks, and generally offer no voting rights with respect to the issuer. |
| ∎ | | Small- andmid-capitalization companies risks.Small- andmid-capitalization companies tend to be more vulnerable to changing market conditions, may |
| | have little or no operating history or track record of success, and may have more limited product lines and markets, less experienced management and fewer financial resources than larger companies. These companies’ securities may be more volatile and less liquid than those of more established companies, and their returns may vary, sometimes significantly, from the overall securities market. |
About indexes used in this report
| ∎ | | TheMSCI World IndexSM is an unmanaged index considered representative of stocks of developed countries. The index is computed using the net return, which withholds applicable taxes fornon-resident investors. |
| ∎ | | TheLipper GlobalLarge-Cap Core Funds Index is an unmanaged index considered representative of globallarge-cap core funds tracked by Lipper. |
| ∎ | | The Fund is not managed to track the performance of any particular index, including the index(es) described here, and consequently, the performance of the Fund may deviate significantly from the performance of the index(es). |
| ∎ | | A direct investment cannot be made in an index. Unless otherwise indicated, index results include reinvested dividends, and they do not reflect sales charges. Performance of the peer group, if applicable, reflects fund expenses; performance of a market index does not. |
Other information
| ∎ | | The returns shown in management’s discussion of Fund performance are based on net asset values (NAVs) calculated for shareholder transactions. Generally accepted accounting principles require adjustments to be made to the net assets of the Fund at period end for financial reporting purposes, and as such, the NAVs for shareholder transactions and the returns based on those NAVs may differ from the NAVs and returns reported in the Financial Highlights. |
| ∎ | | Industry classifications used in this report are generally according to the Global Industry Classification Standard, which was developed by and is the exclusive property and a service mark of MSCI Inc. and Standard & Poor’s. |
| | |
| 9 | | Invesco Global Core Equity Fund |
Schedule of Investments
December 31, 2018
| | | | | | | | |
| | | Shares | | | Value | |
Common Stocks & Other Equity Interests–99.65% | |
| Australia–1.08% | |
Rio Tinto PLC | | | 159,201 | | | $ | 7,590,843 | |
|
| Brazil–0.81% | |
PagSeguro Digital Ltd.–Class A(a)(b) | | | 304,981 | | | | 5,712,294 | |
|
| China–1.24% | |
Baidu, Inc.–ADR(b) | | | 54,938 | | | | 8,713,167 | |
|
| Denmark–1.55% | |
A.P. Møller — Maersk A/S–Class B | | | 5,786 | | | | 7,302,071 | |
Novo Nordisk A/S–Class B | | | 77,665 | | | | 3,570,082 | |
| | | | | | | | 10,872,153 | |
|
| Germany–4.83% | |
Infineon Technologies AG | | | 203,191 | | | | 4,042,677 | |
KION Group AG | | | 175,350 | | | | 8,906,216 | |
Siemens AG | | | 188,438 | | | | 21,024,612 | |
| | | | | | | | 33,973,505 | |
|
| Hong Kong–2.10% | |
AIA Group Ltd. | | | 1,792,400 | | | | 14,744,745 | |
|
| India–2.24% | |
Housing Development Finance Corp. Ltd. | | | 404,859 | | | | 11,414,513 | |
InterGlobe Aviation Ltd.–REGS(c) | | | 262,860 | | | | 4,386,522 | |
| | | | | | | | 15,801,035 | |
|
| Ireland–0.81% | |
James Hardie Industries PLC | | | 538,059 | | | | 5,730,204 | |
|
| Italy–4.72% | |
Banca Mediolanum S.p.A. | | | 1,113,063 | | | | 6,491,234 | |
Enel S.p.A. | | | 3,563,619 | | | | 20,558,770 | |
Prysmian S.p.A. | | | 319,238 | | | | 6,189,985 | |
| | | | | | | | 33,239,989 | |
|
| Japan–13.61% | |
Asahi Group Holdings, Ltd. | | | 369,600 | | | | 14,436,373 | |
Daito Trust Construction Co., Ltd. | | | 24,100 | | | | 3,291,687 | |
Hitachi, Ltd. | | | 440,600 | | | | 11,711,942 | |
KDDI Corp. | | | 462,800 | | | | 11,028,559 | |
Komatsu Ltd. | | | 508,601 | | | | 10,834,063 | |
Nissan Chemical Corp. | | | 100,700 | | | | 5,242,033 | |
Seven & i Holdings Co., Ltd. | | | 250,000 | | | | 10,885,596 | |
Shimano Inc. | | | 69,900 | | | | 9,937,269 | |
SoftBank Group Corp. | | | 277,300 | | | | 18,278,161 | |
Suruga Bank Ltd.(a) | | | 55,900 | | | | 205,075 | |
| | | | | | | | 95,850,758 | |
|
| Luxembourg–0.58% | |
ArcelorMittal | | | 199,434 | | | | 4,114,944 | |
| | | | | | | | |
| | | Shares | | | Value | |
| Netherlands–2.40% | |
Heineken N.V. | | | 95,873 | | | $ | 8,449,991 | |
ING Groep N.V. | | | 788,434 | | | | 8,449,510 | |
| | | | | | | | 16,899,501 | |
|
| Singapore–1.14% | |
DBS Group Holdings Ltd. | | | 465,800 | | | | 8,047,856 | |
|
| South Korea–0.54% | |
Samsung Electronics Co., Ltd. | | | 109,385 | | | | 3,784,795 | |
|
| Sweden–1.61% | |
Svenska Handelsbanken AB–Class A | | | 1,024,368 | | | | 11,347,636 | |
|
| Switzerland–2.82% | |
Glencore PLC | | | 1,986,248 | | | | 7,325,998 | |
Novartis AG | | | 36,167 | | | | 3,097,645 | |
UBS Group AG | | | 757,598 | | | | 9,457,066 | |
| | | | | | | | 19,880,709 | |
|
| Taiwan–0.90% | |
Taiwan Semiconductor Manufacturing Co., Ltd. | | | 870,000 | | | | 6,315,572 | |
|
| United Kingdom–8.54% | |
Imperial Brands PLC | | | 357,910 | | | | 10,823,189 | |
Just Eat PLC(b) | | | 1,081,862 | | | | 8,091,626 | |
Nomad Foods Ltd.(b) | | | 165,361 | | | | 2,764,836 | |
Royal Dutch Shell PLC–Class A–ADR | | | 357,292 | | | | 20,819,405 | |
St. James’s Place PLC | | | 1,042,465 | | | | 12,490,250 | |
Vodafone Group PLC–ADR | | | 266,952 | | | | 5,146,834 | |
| | | | | | | | 60,136,140 | |
|
| United States–48.13% | |
Activision Blizzard, Inc. | | | 77,877 | | | | 3,626,732 | |
Allergan PLC | | | 43,629 | | | | 5,831,452 | |
Alphabet Inc.–Class C(b) | | | 20,694 | | | | 21,430,913 | |
American Express Co. | | | 188,277 | | | | 17,946,564 | |
Aptiv PLC | | | 91,494 | | | | 5,633,286 | |
Biogen Inc.(b) | | | 41,804 | | | | 12,579,660 | |
BioMarin Pharmaceutical Inc.(b) | | | 87,907 | | | | 7,485,281 | |
Booking Holdings Inc.(b) | | | 6,356 | | | | 10,947,701 | |
Carnival Corp. | | | 197,002 | | | | 9,712,199 | |
Celgene Corp.(b) | | | 140,457 | | | | 9,001,889 | |
Chevron Corp. | | | 207,317 | | | | 22,554,016 | |
Cognizant Technology Solutions Corp.–Class A | | | 175,137 | | | | 11,117,697 | |
Comcast Corp.–Class A | | | 355,145 | | | | 12,092,687 | |
Concho Resources Inc.(b) | | | 114,619 | | | | 11,781,687 | |
Delta Air Lines, Inc. | | | 266,912 | | | | 13,318,909 | |
Elanco Animal Health Inc.(b) | | | 120,214 | | | | 3,790,347 | |
EPAM Systems, Inc.(b) | | | 68,248 | | | | 7,917,450 | |
Facebook, Inc.–Class A(b) | | | 53,375 | | | | 6,996,929 | |
FedEx Corp. | | | 56,322 | | | | 9,086,428 | |
See accompanying Notes to Financial Statements which are an integral part of the financial statements.
10 Invesco Global Core Equity Fund
| | | | | | | | |
| | | Shares | | | Value | |
| United States–(continued) | |
First Republic Bank | | | 180,054 | | | $ | 15,646,693 | |
HCA Healthcare, Inc. | | | 77,389 | | | | 9,631,061 | |
Marsh & McLennan Cos., Inc. | | | 99,172 | | | | 7,908,967 | |
Mastercard Inc.–Class A | | | 30,650 | | | | 5,782,122 | |
Moody’s Corp. | | | 49,796 | | | | 6,973,432 | |
NIKE, Inc.–Class B | | | 138,541 | | | | 10,271,430 | |
Oracle Corp. | | | 157,528 | | | | 7,112,389 | |
PepsiCo, Inc. | | | 116,299 | | | | 12,848,713 | |
Progressive Corp. (The) | | | 86,978 | | | | 5,247,383 | |
U.S. Bancorp | | | 241,147 | | | | 11,020,418 | |
United Technologies Corp. | | | 116,189 | | | | 12,371,805 | |
Verizon Communications Inc. | | | 332,923 | | | | 18,716,931 | |
Wynn Resorts Ltd. | | | 64,020 | | | | 6,332,218 | |
Zimmer Biomet Holdings, Inc. | | | 58,991 | | | | 6,118,547 | |
| | | | | | | | 338,833,936 | |
Total Common Stocks & Other Equity Interests
(Cost $707,435,744) | | | | 701,589,782 | |
| | |
Money Market Funds–0.58% | | | | | | | | |
Invesco Government & Agency Portfolio–Institutional Class, 2.30%(d) | | | 2,426,017 | | | | 2,426,017 | |
| | | | | | | | |
| | | Shares | | | Value | |
Invesco Treasury Portfolio–Institutional Class, 2.30%(d) | | | 1,648,879 | | | $ | 1,648,879 | |
Total Money Market Funds
(Cost $4,074,896) | | | | 4,074,896 | |
| | |
Options Purchased-0.11% | | | | | | | | |
(Cost $793,423)(f) | | | | 820,805 | |
TOTAL INVESTMENTS IN SECURITIES (excluding investments purchased with cash collateral from securities on loan)–100.34%
(Cost $712,304,063) | | | | 706,485,483 | |
| |
Investments Purchased with Cash Collateral from Securities on Loan | | | | | |
Money Market Funds–0.59% | | | | | |
Invesco Government & Agency Portfolio–Institutional Class, 2.30% (Cost $4,140,948)(d)(e) | | | 4,140,948 | | | | 4,140,948 | |
TOTAL INVESTMENTS IN SECURITIES–100.93%
(Cost $716,445,011) | | | | 710,626,431 | |
OTHER ASSETS LESS LIABILITIES–(0.93)% | | | | (6,559,846 | ) |
NET ASSETS–100.00% | | | $ | 704,066,585 | |
Investment Abbreviations:
| | |
| ADR | | – American Depositary Receipt |
| REGS | | – Regulation S |
Notes to Schedule of Investments:
| (a) | All or a portion of this security was out on loan at December 31, 2018. |
| (b) | Non-income producing security. |
| (c) | Security purchased or received in transaction exempt from registration under the Securities Act of 1933, as amended (the “1933 Act”). The security may be resold pursuant to an exemption from registration under the 1933 Act, typically to qualified institutional buyers. The value of this security at December 31, 2018 represented less than 1% of the Fund’s Net Assets. |
| (d) | The money market fund and the Fund are affiliated by having the same investment adviser. The rate shown is the 7-day SEC standardized yield as of December 31, 2018. |
| (e) | The security has been segregated to satisfy the commitment to return the cash collateral received in securities lending transactions upon the borrower’s return of the securities loaned. See Note 1I. |
| (f) | The table below details options purchased: See Note 1L. |
| | | | | | | | | | | | | | | | | | | | | | | | | | | | | | |
| Open Exchange-Traded Index Options Purchased — Equity Risk | |
| Description | | Type of
Contract | | | Expiration Date | | | Number of
Contracts | | Exercise Price | | | Notional
Value(a) | | | Value | |
S&P 500 Index | | | Put | | | | 01/18/2019 | | | 167 | | | USD | | | | 2,500 | | | | USD | | | | 41,750,000 | | | $ | 820,805 | |
| (a) | Notional Value is calculated by multiplying the Number of Contracts by the Exercise Price by the multiplier. |
| | | | | | | | | | | | | | | | | | | | | | |
| Open Forward Foreign Currency Contracts — Currency Risk | |
Settlement Date | | Counterparty | | Contract to | | | Unrealized
Appreciation
(Depreciation) | |
| | Deliver | | | Receive | |
02/20/2019 | | JPMorgan Chase Bank N.A. | | | JPY | | | | 2,400,000,000 | | | | USD | | | | 21,408,596 | | | $ | (564,476 | ) |
Currency Abbreviations:
| | |
| USD | | – U.S. Dollar |
| JPY | | – Japanese Yen |
See accompanying Notes to Financial Statements which are an integral part of the financial statements.
11 Invesco Global Core Equity Fund
Statement of Assets and Liabilities
December 31, 2018
| | | | |
Assets: | | | | |
Investments in securities, at value (Cost $708,229,167)* | | $ | 702,410,587 | |
Investments in affiliated money market funds, at value and cost | | | 8,215,844 | |
Foreign currencies, at value (Cost $453,855) | | | 456,863 | |
Receivable for: | | | | |
Fund shares sold | | | 624,883 | |
Dividends | | | 1,158,105 | |
Fund expenses absorbed | | | 85,796 | |
Investment for trustee deferred compensation and retirement plans | | | 194,259 | |
Other assets | | | 32,316 | |
Total assets | | | 713,178,653 | |
| |
Liabilities: | | | | |
Other investments: | | | | |
Unrealized depreciation on forward foreign currency contracts outstanding | | | 564,476 | |
Payable for: | | | | |
Amount due to custodian | | | 1,210,652 | |
Fund shares reacquired | | | 2,272,064 | |
Accrued foreign taxes | | | 56,891 | |
Collateral upon return of securities loaned | | | 4,140,948 | |
Accrued fees to affiliates | | | 448,010 | |
Accrued trustees’ and officers’ fees and benefits | | | 6,309 | |
Accrued other operating expenses | | | 153,596 | |
Trustee deferred compensation and retirement plans | | | 259,122 | |
Total liabilities | | | 9,112,068 | |
Net assets applicable to shares outstanding | | $ | 704,066,585 | |
| |
Net assets consist of: | | | | |
Shares of beneficial interest | | $ | 714,831,895 | |
Distributable earnings | | | (10,765,310 | ) |
| | | $ | 704,066,585 | |
| | | | |
Net Assets: | | | | |
Class A | | $ | 605,748,128 | |
Class C | | $ | 57,162,918 | |
Class R | | $ | 1,464,094 | |
Class Y | | $ | 32,382,300 | |
Class R5 | | $ | 533,091 | |
Class R6 | | $ | 6,776,054 | |
|
Shares outstanding, no par value,
with an unlimited number of shares authorized: | |
Class A | | | 47,601,036 | |
Class C | | | 4,723,667 | |
Class R | | | 115,066 | |
Class Y | | | 2,546,907 | |
Class R5 | | | 41,323 | |
Class R6 | | | 525,310 | |
Class A: | | | | |
Net asset value per share | | $ | 12.73 | |
Maximum offering price per share | | | | |
(Net asset value of $12.73¸ 94.50%) | | $ | 13.47 | |
Class C: | | | | |
Net asset value and offering price per share | | $ | 12.10 | |
Class R: | | | | |
Net asset value and offering price per share | | $ | 12.72 | |
Class Y: | | | | |
Net asset value and offering price per share | | $ | 12.71 | |
Class R5: | | | | |
Net asset value and offering price per share | | $ | 12.90 | |
Class R6: | | | | |
Net asset value and offering price per share | | $ | 12.90 | |
| * | At December 31, 2018, securities with an aggregate value of $4,053,917 were on loan to brokers. |
See accompanying Notes to Financial Statements which are an integral part of the financial statements.
12 Invesco Global Core Equity Fund
Statement of Operations
For the year ended December 31, 2018
| | | | |
Investment income: | | | | |
Dividends (net of foreign withholding taxes of $1,302,771) | | $ | 18,849,718 | |
Dividends from affiliated money market funds (includes securities lending income of $46,890) | | | 284,952 | |
Total investment income | | | 19,134,670 | |
| |
Expenses: | | | | |
Advisory fees | | | 6,782,713 | |
Administrative services fees | | | 226,083 | |
Custodian fees | | | 150,863 | |
Distribution fees: | | | | |
Class A | | | 1,870,955 | |
Class B | | | 6,953 | |
Class C | | | 733,579 | |
Class R | | | 8,392 | |
Transfer agent fees — A, B, C, R and Y | | | 1,427,601 | |
Transfer agent fees — R5 | | | 440 | |
Transfer agent fees — R6 | | | 3,136 | |
Trustees’ and officers’ fees and benefits | | | 32,226 | |
Registration and filing fees | | | 106,597 | |
Reports to shareholders | | | 133,332 | |
Professional services fees | | | 121,027 | |
Other | | | 56,064 | |
Total expenses | | | 11,659,961 | |
Less: Fees waived, expenses reimbursed and expense offset arrangement(s) | | | (587,367 | ) |
Net expenses | | | 11,072,594 | |
Net investment income | | | 8,062,076 | |
| |
Realized and unrealized gain (loss) from: | | | | |
Net realized gain (loss) from: | | | | |
Investment securities (Net of foreign taxes of $66,434) | | | 27,069,487 | |
Foreign currencies | | | (284,329 | ) |
Forward foreign currency contracts | | | 839,829 | |
| | | | 27,624,987 | |
Change in net unrealized appreciation (depreciation) of: | | | | |
Investment securities (Net of foreign taxes of $56,891) | | | (162,523,093 | ) |
Foreign currencies | | | (25,931 | ) |
Forward foreign currency contracts | | | (1,216,176 | ) |
| | | | (163,765,200 | ) |
Net realized and unrealized gain (loss) | | | (136,140,213 | ) |
Net increase (decrease) in net assets resulting from operations | | $ | (128,078,137 | ) |
See accompanying Notes to Financial Statements which are an integral part of the financial statements.
13 Invesco Global Core Equity Fund
Statement of Changes in Net Assets
For the years ended December 31, 2018 and 2017
| | | | | | | | |
| | | 2018 | | | 2017 | |
Operations: | | | | | | | | |
Net investment income | | $ | 8,062,076 | | | $ | 6,676,498 | |
Net realized gain | | | 27,624,987 | | | | 63,412,215 | |
Change in net unrealized appreciation (depreciation) | | | (163,765,200 | ) | | | 116,616,880 | |
Net increase (decrease) in net assets resulting from operations | | | (128,078,137 | ) | | | 186,705,593 | |
| | |
Distributions to shareholders from distributable earnings(1): | | | | | | | | |
Class A | | | (48,813,857 | ) | | | (40,053,962 | ) |
Class B | | | — | | | | (481,170 | ) |
Class C | | | (4,312,991 | ) | | | (3,678,608 | ) |
Class R | | | (110,921 | ) | | | (79,192 | ) |
Class Y | | | (2,795,087 | ) | | | (2,594,239 | ) |
Class R5 | | | (30,557 | ) | | | (21,182 | ) |
Class R6 | | | (558,441 | ) | | | (598 | ) |
Total distributions from distributable earnings | | | (56,621,854 | ) | | | (46,908,951 | ) |
| | |
Share transactions–net: | | | | | | | | |
Class A | | | (33,354,620 | ) | | | (70,593,636 | ) |
Class B | | | (10,193,666 | ) | | | (8,102,869 | ) |
Class C | | | (9,227,704 | ) | | | (14,864,201 | ) |
Class R | | | 146,143 | | | | 432,928 | |
Class Y | | | (8,629,000 | ) | | | 17,631,362 | |
Class R5 | | | 217,265 | | | | (48,845 | ) |
Class R6 | | | 9,031,211 | | | | 10,015 | |
Net increase (decrease) in net assets resulting from share transactions | | | (52,010,371 | ) | | | (75,535,246 | ) |
Net increase (decrease) in net assets | | | (236,710,362 | ) | | | 64,261,396 | |
| | |
Net assets: | | | | | | | | |
Beginning of year | | | 940,776,947 | | | | 876,515,551 | |
End of year | | $ | 704,066,585 | | | $ | 940,776,947 | |
| (1) | For the year ended December 31, 2017, distributions to shareholders from distributable earnings consisted of distributions from net investment income and net realized gains. The Securities and Exchange Commission eliminated the requirement to disclose the distribution components separately, except for tax return of capital. For the year ended December 31, 2017, distributions from net investment income were $7,230,525, $18,237, $ 139,297, $10,907, $583,991, $4,616 and $130 for Class A, Class B, Class C, Class R, Class Y, Class R5 and Class R6 shares, respectively, and distributions from net realized gains were $32,823,437, $462,933, $3,539,311, $68,285, $2,010,248, $16,566 and $468 for Class A, Class B, Class C, Class R, Class Y, Class R5 and Class R6 shares, respectively. |
Notes to Financial Statements
December 31, 2018
NOTE 1—Significant Accounting Policies
Invesco Global Core Equity Fund (the “Fund”) is a series portfolio of AIM Funds Group (Invesco Funds Group) (the “Trust”). The Trust is a Delaware statutory trust registered under the Investment Company Act of 1940, as amended (the “1940 Act”), as an open-end series management investment company authorized to issue an unlimited number of shares of beneficial interest. Information presented in these financial statements pertains only to the Fund. Matters affecting the Fund or each class will be voted on exclusively by the shareholders of the Fund or each class.
The Fund’s investment objective islong-term growth of capital.
The Fund currently consists of six different classes of shares: Class A, Class C, Class R, Class Y, Class R5 and Class R6. Class Y shares are available only to certain investors. Class A shares are sold with a front-end sales charge unless certain waiver criteria are met. Under certain circumstances, load waived shares may be subject to contingent deferred sales charges (“CDSC”). Class C shares are sold with a CDSC. Class R, Class Y, Class R5 and Class R6 shares are sold at net asset value. Effective November 30, 2010, new or additional investments in Class B shares are no longer permitted. Existing shareholders of Class B shares were permitted to continue to reinvest dividends and capital gains distributions in Class B shares until their conversion to Class A shares. Also, shareholders in Class B shares were able to exchange those shares for Class B shares of other Invesco Funds offering such shares until they converted to Class A shares. Generally, Class B shares automatically converted to Class A shares on or about the month-end, which was at least eight years after the date of purchase. Redemptions of Class B shares prior to the conversion date were subject to a CDSC. Effective January 26, 2018, all of the Fund’s outstanding Class B shares were converted to Class A shares, in advance of their normally scheduled conversion. No CDSC was paid in connection with this early conversion.
14 Invesco Global Core Equity Fund
The Fund is an investment company and accordingly follows the investment company accounting and reporting guidance in accordance with Financial Accounting Standards Board Accounting Standards Codification Topic 946,Financial Services — Investment Companies.
The following is a summary of the significant accounting policies followed by the Fund in the preparation of its financial statements.
| A. | Security Valuations— Securities, including restricted securities, are valued according to the following policy. |
A security listed or traded on an exchange (except convertible securities) is valued at its last sales price or official closing price as of the close of the customary trading session on the exchange where the security is principally traded, or lacking any sales or official closing price on a particular day, the security may be valued at the closing bid price on that day. Securities traded in theover-the-counter market are valued based on prices furnished by independent pricing services or market makers. When such securities are valued by an independent pricing service they may be considered fair valued. Futures contracts are valued at the final settlement price set by an exchange on which they are principally traded. Listed options are valued at the mean between the last bid and asked prices from the exchange on which they are principally traded. Options not listed on an exchange are valued by an independent source at the mean between the last bid and asked prices. For purposes of determining net asset value (“NAV”) per share, futures and option contracts generally are valued 15 minutes after the close of the customary trading session of the New York Stock Exchange (“NYSE”).
Investments in open-end and closed-end registered investment companies that do not trade on an exchange are valued at theend-of-day net asset value per share. Investments in open-end and closed-end registered investment companies that trade on an exchange are valued at the last sales price or official closing price as of the close of the customary trading session on the exchange where the security is principally traded.
Debt obligations (including convertible securities) and unlisted equities are fair valued using an evaluated quote provided by an independent pricing service. Evaluated quotes provided by the pricing service may be determined without exclusive reliance on quoted prices, and may reflect appropriate factors such as institution-size trading in similar groups of securities, developments related to specific securities, dividend rate (for unlisted equities), yield (for debt obligations), quality, type of issue, coupon rate (for debt obligations), maturity (for debt obligations), individual trading characteristics and other market data. Pricing services generally value debt obligations assuming orderly transactions of institutional round lot size, but a fund may hold or transact in the same securities in smaller, odd lot sizes. Odd lots often trade at lower prices than institutional round lots. Debt obligations are subject to interest rate and credit risks. In addition, all debt obligations involve some risk of default with respect to interest and/or principal payments.
Foreign securities’ (including foreign exchange contracts) prices are converted into U.S. dollar amounts using the applicable exchange rates as of the close of the NYSE. If market quotations are available and reliable for foreign exchange-traded equity securities, the securities will be valued at the market quotations. Because trading hours for certain foreign securities end before the close of the NYSE, closing market quotations may become unreliable. If between the time trading ends on a particular security and the close of the customary trading session on the NYSE, events occur that the investment adviser determines are significant and make the closing price unreliable, the Fund may fair value the security. If the event is likely to have affected the closing price of the security, the security will be valued at fair value in good faith using procedures approved by the Board of Trustees. Adjustments to closing prices to reflect fair value may also be based on a screening process of an independent pricing service to indicate the degree of certainty, based on historical data, that the closing price in the principal market where a foreign security trades is not the current value as of the close of the NYSE. Foreign securities’ prices meeting the approved degree of certainty that the price is not reflective of current value will be priced at the indication of fair value from the independent pricing service. Multiple factors may be considered by the independent pricing service in determining adjustments to reflect fair value and may include information relating to sector indices, American Depositary Receipts and domestic and foreign index futures. Foreign securities may have additional risks including exchange rate changes, potential for sharply devalued currencies and high inflation, political and economic upheaval, the relative lack of issuer information, relatively low market liquidity and the potential lack of strict financial and accounting controls and standards.
Securities for which market prices are not provided by any of the above methods may be valued based upon quotes furnished by independent sources. The last bid price may be used to value equity securities. The mean between the last bid and asked prices is used to value debt obligations, including corporate loans.
Securities for which market quotations are not readily available or became unreliable are valued at fair value as determined in good faith by or under the supervision of the Trust’s officers following procedures approved by the Board of Trustees. Issuer specific events, market trends, bid/asked quotes of brokers and information providers and other market data may be reviewed in the course of making a good faith determination of a security’s fair value.
The Fund may invest in securities that are subject to interest rate risk, meaning the risk that the prices will generally fall as interest rates rise and, conversely, the prices will generally rise as interest rates fall. Specific securities differ in their sensitivity to changes in interest rates depending on their individual characteristics. Changes in interest rates may result in increased market volatility, which may affect the value and/or liquidity of certain Fund investments.
Valuations change in response to many factors including the historical and prospective earnings of the issuer, the value of the issuer’s assets, general economic conditions, interest rates, investor perceptions and market liquidity. Because of the inherent uncertainties of valuation, the values reflected in the financial statements may materially differ from the value received upon actual sale of those investments.
| B. | Securities Transactions and Investment Income— Securities transactions are accounted for on a trade date basis. Realized gains or losses on sales are computed on the basis of specific identification of the securities sold. Interest income (net of withholding tax, if any) is recorded on the accrual basis from settlement date. Dividend income (net of withholding tax, if any) is recorded on the ex-dividend date. |
The Fund may periodically participate in litigation related to Fund investments. As such, the Fund may receive proceeds from litigation settlements. Any proceeds received are included in the Statement of Operations as realized gain (loss) for investments no longer held and as unrealized gain (loss) for investments still held.
Brokerage commissions and mark ups are considered transaction costs and are recorded as an increase to the cost basis of securities purchased and/or a reduction of proceeds on a sale of securities. Such transaction costs are included in the determination of net realized and unrealized gain (loss) from investment securities reported in the Statement of Operations and the Statement of Changes in Net Assets and the net realized and unrealized gains (losses) on securities per share in the Financial Highlights. Transaction costs are included in the calculation of the Fund’s net asset value and, accordingly, they reduce the Fund’s total returns. These transaction costs are not considered operating expenses and are not reflected in net investment income reported in the Statement of Operations and the Statement of Changes in Net Assets, or the net
15 Invesco Global Core Equity Fund
investment income per share and the ratios of expenses and net investment income reported in the Financial Highlights, nor are they limited by any expense limitation arrangements between the Fund and the investment adviser.
The Fund allocates income and realized and unrealized capital gains and losses to a class based on the relative net assets of each class.
| C. | Country Determination— For the purposes of making investment selection decisions and presentation in the Schedule of Investments, the investment adviser may determine the country in which an issuer is located and/or credit risk exposure based on various factors. These factors include the laws of the country under which the issuer is organized, where the issuer maintains a principal office, the country in which the issuer derives 50% or more of its total revenues and the country that has the primary market for the issuer’s securities, as well as other criteria. Among the other criteria that may be evaluated for making this determination are the country in which the issuer maintains 50% or more of its assets, the type of security, financial guarantees and enhancements, the nature of the collateral and the sponsor organization. Country of issuer and/or credit risk exposure has been determined to be the United States of America, unless otherwise noted. |
| D. | Distributions— Distributions from net investment income and net realized capital gain, if any, are generally declared and paid annually and recorded on the ex-dividend date. The Fund may elect to treat a portion of the proceeds from redemptions as distributions for federal income tax purposes. |
| E. | Federal Income Taxes— The Fund intends to comply with the requirements of Subchapter M of the Internal Revenue Code of 1986, as amended (the “Internal Revenue Code”), necessary to qualify as a regulated investment company and to distribute substantially all of the Fund’s taxable earnings to shareholders. As such, the Fund will not be subject to federal income taxes on otherwise taxable income (including net realized capital gain) that is distributed to shareholders. Therefore, no provision for federal income taxes is recorded in the financial statements. |
The Fund recognizes the tax benefits of uncertain tax positions only when the position is more likely than not to be sustained. Management has analyzed the Fund’s uncertain tax positions and concluded that no liability for unrecognized tax benefits should be recorded related to uncertain tax positions. Management is not aware of any tax positions for which it is reasonably possible that the total amounts of unrecognized tax benefits will change materially in the next 12 months.
The Fund files tax returns in the U.S. Federal jurisdiction and certain other jurisdictions. Generally, the Fund is subject to examinations by such taxing authorities for up to three years after the filing of the return for the tax period.
| F. | Expenses— Fees provided for under the Rule 12b-1 plan of a particular class of the Fund are charged to the operations of such class. Transfer agency fees and expenses and other shareholder recordkeeping fees and expenses attributable to Class R5 and Class R6 are allocated to each share class based on relative net assets.Sub-accounting fees attributable to Class R5 are charged to the operations of the class. Transfer agency fees and expenses and other shareholder recordkeeping fees and expenses relating to all other classes are allocated among those classes based on relative net assets. All other expenses are allocated among the classes based on relative net assets. |
| G. | Accounting Estimates— The preparation of financial statements in conformity with accounting principles generally accepted in the United States of America (“GAAP”) requires management to make estimates and assumptions that affect the reported amounts of assets and liabilities at the date of the financial statements and the reported amounts of revenues and expenses during the reporting period including estimates and assumptions related to taxation. Actual results could differ from those estimates by a significant amount. In addition, the Fund monitors for material events or transactions that may occur or become known after the period-end date and before the date the financial statements are released to print. |
| H. | Indemnifications— Under the Trust’s organizational documents, each Trustee, officer, employee or other agent of the Trust is indemnified against certain liabilities that may arise out of the performance of their duties to the Fund. Additionally, in the normal course of business, the Fund enters into contracts, including the Fund’s servicing agreements, that contain a variety of indemnification clauses. The Fund’s maximum exposure under these arrangements is unknown as this would involve future claims that may be made against the Fund that have not yet occurred. The risk of material loss as a result of such indemnification claims is considered remote. |
| I. | Securities Lending— The Fund may lend portfolio securities having a market value up to one-third of the Fund’s total assets. Such loans are secured by collateral equal to no less than the market value of the loaned securities determined daily by the securities lending provider. Such collateral will be cash or debt securities issued or guaranteed by the U.S. Government or any of its sponsored agencies. Cash collateral received in connection with these loans is invested inshort-term money market instruments or affiliated money market funds and is shown as such on the Schedule of Investments. The Fund bears the risk of loss with respect to the investment of collateral. It is the Fund’s policy to obtain additional collateral from or return excess collateral to the borrower by the end of the next business day, following the valuation date of the securities loaned. Therefore, the value of the collateral held may be temporarily less than the value of the securities on loan. When loaning securities, the Fund retains certain benefits of owning the securities, including the economic equivalent of dividends or interest generated by the security. Lending securities entails a risk of loss to the Fund if, and to the extent that, the market value of the securities loaned were to increase and the borrower did not increase the collateral accordingly, and the borrower failed to return the securities. The securities loaned are subject to termination at the option of the borrower or the Fund. Upon termination, the borrower will return to the Fund the securities loaned and the Fund will return the collateral. Upon the failure of the borrower to return the securities, collateral may be liquidated and the securities may be purchased on the open market to replace the loaned securities. The Fund could experience delays and costs in gaining access to the collateral and the securities may lose value during the delay which could result in potential losses to the Fund. Some of these losses may be indemnified by the lending agent. The Fund bears the risk of any deficiency in the amount of the collateral available for return to the borrower due to any loss on the collateral invested. Dividends received on cash collateral investments for securities lending transactions, which are net of compensation to counterparties, are included inDividends from affiliated money market fundson the Statement of Operations. The aggregate value of securities out on loan, if any, is shown as a footnote on the Statement of Assets and Liabilities. |
| J. | Foreign Currency Translations— Foreign currency is valued at the close of the NYSE based on quotations posted by banks and major currency dealers. Portfolio securities and other assets and liabilities denominated in foreign currencies are translated into U.S. dollar amounts at the date of valuation. Purchases and sales of portfolio securities (net of foreign taxes withheld on disposition) and income items denominated in foreign currencies are translated into U.S. dollar amounts on the respective dates of such transactions. The Fund does not separately account forthe portion of the results of operations resulting from changes in foreign exchange rates on investments and the fluctuations arising from changes in market prices of securities held. The combined results of changes in foreign exchange rates and the fluctuation of market prices on investments (net of estimated foreign tax withholding) are included with the net realized and unrealized gain or loss from investments in the |
16 Invesco Global Core Equity Fund
| | Statement of Operations. Reported net realized foreign currency gains or losses arise from (1) sales of foreign currencies, (2) currency gains or losses realized between the trade and settlement dates on securities transactions, and (3) the difference between the amounts of dividends, interest, and foreign withholding taxes recorded on the Fund’s books and the U.S. dollar equivalent of the amounts actually received or paid. Net unrealized foreign currency gains and losses arise from changes in the fair values of assets and liabilities, other than investments in securities at fiscal period end, resulting from changes in exchange rates. |
The Fund may invest in foreign securities, which may be subject to foreign taxes on income, gains on investments or currency repatriation, a portion of which may be recoverable. Foreign taxes, if any, are recorded based on the tax regulations and rates that exist in the foreign markets in which the Fund invests and are shown in the Statement of Operations.
| K. | Forward Foreign Currency Contracts— The Fund may engage in foreign currency transactions either on a spot (i.e. for prompt delivery and settlement) basis, or through forward foreign currency contracts, to manage or minimize currency or exchange rate risk. |
The Fund may also enter into forward foreign currency contracts for the purchase or sale of a security denominated in a foreign currency in order to “lock in” the U.S. dollar price of that security, or the Fund may also enter into forward foreign currency contracts that do not provide for physical settlement of the two currencies, but instead are settled by a single cash payment calculated as the difference between the agreed upon exchange rate and the spot rate at settlement based upon an agreed upon notional amount (non-deliverable forwards). The Fund will set aside liquid assets in an amount equal to the dailymark-to-market obligation for forward foreign currency contracts.
A forward foreign currency contract is an obligation between two parties (“Counterparties”) to purchase or sell a specific currency for anagreed-upon price at a future date. The use of forward foreign currency contracts does not eliminate fluctuations in the price of the underlying securities the Fund owns or intends to acquire but establishes a rate of exchange in advance. Fluctuations in the value of these contracts are measured by the difference in the contract date and reporting date exchange rates and are recorded as unrealized appreciation (depreciation) until the contracts are closed. When the contracts are closed, realized gains (losses) are recorded. Realized and unrealized gains (losses) on the contracts are included in the Statement of Operations. The primary risks associated with forward foreign currency contracts include failure of the Counterparty to meet the terms of the contract and the value of the foreign currency changing unfavorably. These risks may be in excess of the amounts reflected in the Statement of Assets and Liabilities.
| L. | Put Options Purchased— The Fund may purchase put options including options on securities indexes, or foreign currency and/or futures contracts. By purchasing a put option, the Fund obtains the right (but not the obligation) to sell the option’s underlying instrument at a fixed strike price. In return for this right, the Fund pays an option premium. The option’s underlying instrument may be a security, securities index, or a futures contract. Put options may be used by the Fund to hedge securities it owns by locking in a minimum price at which the Fund can sell. If security prices fall, the put option could be exercised to offset all or a portion of the Fund’s resulting losses. At the same time, because the maximum the Fund has at risk is the cost of the option, purchasing put options does not eliminate the potential for the Fund to profit from an increase in the value of the securities hedged. Realized and unrealized gains and losses on put options purchased are included in the Statement of Operations as Net realized gain (loss) from and Change in net unrealized appreciation (depreciation) of Investment securities. A risk in buying an option is that the Fund pays a premium whether or not the option is exercised. In addition, there can be no assurance that a liquid secondary market will exist for any option purchased. |
NOTE 2—Advisory Fees and Other Fees Paid to Affiliates
The Trust has entered into a master investment advisory agreement with Invesco Advisers, Inc. (the “Adviser” or “Invesco”). Under the terms of the investment advisory agreement, the Fund accrues daily and pays monthly an advisory fee to the Adviser based on the annual rate of the Fund’s average daily net assets as follows:
| | | | |
| Average Daily Net Assets | | Rate | |
First $250 million | | | 0.80% | |
Next $250 million | | | 0.78% | |
Next $500 million | | | 0.76% | |
Next $1.5 billion | | | 0.74% | |
Next $2.5 billion | | | 0.72% | |
Next $2.5 billion | | | 0.70% | |
Next $2.5 billion | | | 0.68% | |
Over $10 billion | | | 0.66% | |
For the year ended December 31, 2018, the effective advisory fees incurred by the Fund was 0.78%.
Under the terms of a mastersub-advisory agreement between the Adviser and each of Invesco Asset Management Deutschland GmbH, Invesco Asset Management Limited, Invesco Asset Management (Japan) Limited, Invesco Hong Kong Limited, Invesco Senior Secured Management, Inc. and Invesco Canada Ltd. (collectively, the “AffiliatedSub-Advisers”) the Adviser, not the Fund, will pay 40% of the fees paid to the Adviser to any such AffiliatedSub-Adviser(s) that provide(s) discretionary investment management services to the Fund based on the percentage of assets allocated to such AffiliatedSub-Adviser(s).
The Adviser has contractually agreed, through at least April 30, 2020, to waive advisory fees and/or reimburse expenses of all shares to the extent necessary to limit total annual fund operating expenses after fee waiver and/or expense reimbursement (excluding certain items discussed below) of Class A, Class C, Class R, Class Y, Class R5 and Class R6 shares to 1.22%, 1.97%, 1.47%, 0.97%, 0.97% and 0.97%, respectively, of average daily net assets (the “expense limits”). Prior to their conversion to Class A shares, the expense limit for Class B shares was 1.97% of average daily net assets. In determining the Adviser’s obligation to waive advisory fees and/or reimburse expenses, the following expenses are not taken into account, and could cause the total annual fund operating expenses after fee waiver and/or expense reimbursement to exceed the numbers reflected above: (1) interest; (2) taxes; (3) dividend expense on short sales; (4) extraordinary or non-routine items, including litigation expenses; and (5) expenses that the Fund has incurred but did not actually pay because of an expense offset arrangement. Unless Invesco continues the fee waiver
17 Invesco Global Core Equity Fund
agreement, it will terminate on April 30, 2020. During its term, the fee waiver agreement cannot be terminated or amended to increase the expense limits or reduce the advisory fee waiver without approval of the Board of Trustees.
Further, the Adviser has contractually agreed, through at least June 30, 2020, to waive the advisory fee payable by the Fund in an amount equal to 100% of the net advisory fees the Adviser receives from the affiliated money market funds on investments by the Fund of uninvested cash (excluding investments of cash collateral from securities lending) in such affiliated money market funds.
For the year ended December 31, 2018, the Adviser waived advisory fees of $13,997 and reimbursed class level expenses of $486,050, $453, $47,644, $1,090 and $26,230 of Class A, Class B, Class C, Class R and Class Y shares, respectively.
The Trust has entered into a master administrative services agreement with Invesco pursuant to which the Fund has agreed to pay Invesco for certain administrative costs incurred in providing accounting services to the Fund. For the year ended December 31, 2018, expenses incurred under the agreement are shown in the Statement of Operations asAdministrative services fees.
The Trust has entered into a transfer agency and service agreement with Invesco Investment Services, Inc. (“IIS”) pursuant to which the Fund has agreed to pay IIS a fee for providing transfer agency and shareholder services to the Fund and reimburse IIS for certain expenses incurred by IIS in the course of providing such services. IIS may make payments to intermediaries that provide omnibus account services,sub-accounting services and/or networking services. All fees payable by IIS to intermediaries that provide omnibus account services orsub-accounting services are charged back to the Fund, subject to certain limitations approved by the Trust’s Board of Trustees. For the year ended December 31, 2018, expenses incurred under the agreement are shown in the Statement of Operations asTransfer agent fees.
The Trust has entered into master distribution agreements with Invesco Distributors, Inc. (“IDI”) to serve as the distributor for the Class A, Class C, Class R, Class Y, Class R5 and Class R6 shares of the Fund. The Trust has adopted plans pursuant to Rule 12b-1 under the 1940 Act with respect to the Fund’s Class A, Class C and Class R shares (collectively, the “Plans”). The Fund, pursuant to the Plans, pays IDI compensation at the annual rate of 0.25% of the Fund’s average daily net assets of Class A shares, 1.00% of the average daily net assets of Class C shares and 0.50% of the average daily net assets of Class R shares. Prior to their conversion to Class A shares, the Fund paid an annual rate of 1.00% of the average daily net assets of Class B shares. The fees are accrued daily and paid monthly. Of the Plan payments, up to 0.25% of the average daily net assets of each class of shares may be paid to furnish continuing personal shareholder services to customers who purchase and own shares of such classes. Any amounts not paid as a service fee under the Plans would constitute an asset-based sales charge. Rules of the Financial Industry Regulatory Authority (“FINRA”) impose a cap on the total sales charges, including asset-based sales charges, that may be paid by any class of shares of the Fund. For the year ended December 31, 2018, expenses incurred under the Plans are shown in the Statement of Operations asDistribution fees.
Front-end sales commissions and CDSC (collectively, the “sales charges”) are not recorded as expenses of the Fund. Front-end sales commissions are deducted from proceeds from the sales of Fund shares prior to investment in Class A shares of the Fund. CDSC are deducted from redemption proceeds prior to remittance to the shareholder. During the year ended December 31, 2018, IDI advised the Fund that IDI retained $27,738 in front-end sales commissions from the sale of Class A shares and $2,523 and $1,835 from Class A and Class C shares, respectively, for CDSC imposed on redemptions by shareholders.
Certain officers and trustees of the Trust are officers and directors of the Adviser, IIS and/or IDI.
NOTE 3—Additional Valuation Information
GAAP defines fair value as the price that would be received to sell an asset or paid to transfer a liability in an orderly transaction between market participants at the measurement date, under current market conditions. GAAP establishes a hierarchy that prioritizes the inputs to valuation methods, giving the highest priority to readily available unadjusted quoted prices in an active market for identical assets (Level 1) and the lowest priority to significant unobservable inputs (Level 3), generally when market prices are not readily available or are unreliable. Based on the valuation inputs, the securities or other investments are tiered into one of three levels. Changes in valuation methods may result in transfers in or out of an investment’s assigned level:
| | Level 1 — | Prices are determined using quoted prices in an active market for identical assets. |
| | Level 2 — | Prices are determined using other significant observable inputs. Observable inputs are inputs that other market participants may use in pricing a security. These may include quoted prices for similar securities, interest rates, prepayment speeds, credit risk, yield curves, loss severities, default rates, discount rates, volatilities and others. |
| | Level 3 — | Prices are determined using significant unobservable inputs. In situations where quoted prices or observable inputs are unavailable (for example, when there is little or no market activity for an investment at the end of the period), unobservable inputs may be used. Unobservable inputs reflect the Fund’s own assumptions about the factors market participants would use in determining fair value of the securities or instruments and would be based on the best available information. |
18 Invesco Global Core Equity Fund
The following is a summary of the tiered valuation input levels, as of December 31, 2018. The level assigned to the securities valuations may not be an indication of the risk or liquidity associated with investing in those securities. Because of the inherent uncertainties of valuation, the values reflected in the financial statements may materially differ from the value received upon actual sale of those investments.
| | | | | | | | | | | | | | | | |
| | | Level 1 | | | Level 2 | | | Level 3 | | | Total | |
Investments in Securities | | | | | | | | | | | | | | | | |
Australia | | $ | — | | | $ | 7,590,843 | | | $ | — | | | $ | 7,590,843 | |
Brazil | | | 5,712,294 | | | | — | | | | — | | | | 5,712,294 | |
China | | | 8,713,167 | | | | — | | | | — | | | | 8,713,167 | |
Denmark | | | — | | | | 10,872,153 | | | | — | | | | 10,872,153 | |
Germany | | | 33,973,505 | | | | — | | | | — | | | | 33,973,505 | |
Hong Kong | | | — | | | | 14,744,745 | | | | — | | | | 14,744,745 | |
India | | | 15,801,035 | | | | — | | | | — | | | | 15,801,035 | |
Ireland | | | 5,730,204 | | | | — | | | | — | | | | 5,730,204 | |
Italy | | | 6,491,234 | | | | 26,748,755 | | | | — | | | | 33,239,989 | |
Japan | | | — | | | | 95,850,758 | | | | — | | | | 95,850,758 | |
Luxembourg | | | — | | | | 4,114,944 | | | | — | | | | 4,114,944 | |
Netherlands | | | — | | | | 16,899,501 | | | | — | | | | 16,899,501 | |
Singapore | | | — | | | | 8,047,856 | | | | — | | | | 8,047,856 | |
South Korea | | | — | | | | 3,784,795 | | | | — | | | | 3,784,795 | |
Sweden | | | — | | | | 11,347,636 | | | | — | | | | 11,347,636 | |
Switzerland | | | — | | | | 19,880,709 | | | | — | | | | 19,880,709 | |
Taiwan | | | — | | | | 6,315,572 | | | | — | | | | 6,315,572 | |
United Kingdom | | | 36,822,701 | | | | 23,313,439 | | | | — | | | | 60,136,140 | |
United States | | | 338,833,936 | | | | — | | | | — | | | | 338,833,936 | |
Money Market Funds | | | 8,215,844 | | | | — | | | | — | | | | 8,215,844 | |
Options Purchased | | | 820,805 | | | | — | | | | — | | | | 820,805 | |
Total Investments in Securities | | | 461,114,725 | | | | 249,511,706 | | | | — | | | | 710,626,431 | |
| | | | |
Other Investments — Liabilities* | | | | | | | | | | | | | | | | |
Forward Foreign Currency Contracts | | | — | | | | (564,476 | ) | | | — | | | | (564,476 | ) |
Total Investments | | $ | 461,114,725 | | | $ | 248,947,230 | | | $ | — | | | $ | 710,061,955 | |
| * | Unrealized appreciation (depreciation). |
NOTE 4—Derivative Investments
The Fund may enter into an International Swaps and Derivatives Association Master Agreement (“ISDA Master Agreement”) under which a fund may trade OTC derivatives. An OTC transaction entered into under an ISDA Master Agreement typically involves a collateral posting arrangement, payment netting provisions and close-out netting provisions. These netting provisions allow for reduction of credit risk through netting of contractual obligations. The enforceability of the netting provisions of the ISDA Master Agreement depends on the governing law of the ISDA Master Agreement, among other factors.
For financial reporting purposes, the Fund does not offset OTC derivative assets or liabilities that are subject to ISDA Master Agreements in the Statement of Assets and Liabilities.
Value of Derivative Investments at Period-End
The table below summarizes the value of the Fund’s derivative investments, detailed by primary risk exposure, held as of December 31, 2018:
| | | | | | | | | | | | |
| | | Value | |
| Derivative Assets | | Currency
Risk | | | Equity
Risk | | | Total | |
Options purchased, at value — Exchange-Traded(a) | | $ | — | | | $ | 820,805 | | | $ | 820,805 | |
Derivatives not subject to master netting agreements | | | — | | | | (820,805 | ) | | | (820,805 | ) |
Total Derivative Assets subject to master netting agreements | | $ | — | | | $ | — | | | $ | — | |
| |
| | | Value | |
| Derivative Liabilities | | Currency Risk | | | Equity
Risk | | | Total | |
Unrealized depreciation on forward foreign currency contracts outstanding | | $ | 564,476 | | | $ | — | | | $ | 564,476 | |
Derivatives not subject to master netting agreements | | | — | | | | — | | | | — | |
Total Derivative Liabilities subject to master netting agreements | | $ | 564,476 | | | $ | — | | | $ | 564,476 | |
| (a) | Options purchased, at value as reported in the Schedule of Investments. |
19 Invesco Global Core Equity Fund
Offsetting Assets and Liabilities
The table below reflects the Fund’s exposure to Counterparties subject to either an ISDA Master Agreement or other agreement for OTC derivative transactions as of December 31, 2018.
| | | | | | | | | | | | | | | | | | | | | | | | |
| | | Financial
Derivative
Assets | | | Financial
Derivative
Liabilities | | | Net Value of
Derivatives | | | Collateral
(Received)/Pledged | | | Net
Amount | |
| Counterparty | | Forward
Foreign Currency
Contracts | | | Forward
Foreign Currency
Contracts | |
| | Non-Cash | | | Cash | |
JPMorgan Chase Bank N.A. | | $ | — | | | $ | (564,476 | ) | | $ | (564,476 | ) | | $ | — | | | $ | — | | | $ | (564,476 | ) |
Effect of Derivative Investments for the year ended December 31, 2018
The table below summarizes the gains (losses) on derivative investments, detailed by primary risk exposure, recognized in earnings during the period:
| | | | | | | | | | | | |
| | | Location of Gain (Loss) on
Statement of Operations | |
| | | Currency
Risk | | | Equity
Risk | | | Total | |
Realized Gain: | | | | | | | | | | | | |
Forward foreign currency contracts | | $ | 839,829 | | | $ | — | | | $ | 839,829 | |
Options purchased(a) | | | — | | | | 80,640 | | | | 80,640 | |
Change in Net Unrealized Appreciation (Depreciation): | | | | | | | | | | | | |
Forward foreign currency contracts | | | (1,216,176 | ) | | | — | | | | (1,216,176 | ) |
Options purchased(a) | | | — | | | | 1,025,103 | | | | 1,025,103 | |
Total | | $ | (376,347 | ) | | $ | 1,105,743 | | | $ | 729,396 | |
| (a) | Options purchased are included in the net realized gain from investment securities and the change in net unrealized appreciation (depreciation) of investment securities. |
The table below summarizes the average notional value of forward foreign currency contracts and options purchased outstanding during the period.
| | | | | | | | |
| | | Forward
Foreign Currency
Contracts | | | Index Options
Purchased | |
Average notional value | | $ | 37,077,453 | | | $ | 49,349,583 | |
Average contracts | | | — | | | | 192 | |
NOTE 5—Security Transactions with Affiliated Funds
The Fund is permitted to purchase or sell securities from or to certain other Invesco Funds under specified conditions outlined in procedures adopted by the Board of Trustees of the Trust. The procedures have been designed to ensure that any purchase or sale of securities by the Fund from or to another fund or portfolio that is or could be considered an affiliate by virtue of having a common investment adviser (or affiliated investment advisers), common Trustees and/or common officers complies with Rule 17a-7 of the 1940 Act. Further, as defined under the procedures, each transaction is effected at the current market price. Pursuant to these procedures, for the year ended December 31, 2018, the Fund engaged in securities purchases of $2,716,372.
NOTE 6—Expense Offset Arrangement(s)
The expense offset arrangement is comprised of transfer agency credits which result from balances in demand deposit accounts used by the transfer agent for clearing shareholder transactions. For the year ended December 31, 2018, the Fund received credits from this arrangement, which resulted in the reduction of the Fund’s total expenses of $11,903.
NOTE 7—Trustees’ and Officers’ Fees and Benefits
Trustees’ and Officers’ Fees and Benefits include amounts accrued by the Fund to pay remuneration to certain Trustees and Officers of the Fund. Trustees have the option to defer compensation payable by the Fund, andTrustees’ and Officers’ Fees and Benefitsalso include amounts accrued by the Fund to fund such deferred compensation amounts. Those Trustees who defer compensation have the option to select various Invesco Funds in which their deferral accounts shall be deemed to be invested. Finally, certain current Trustees were eligible to participate in a retirement plan that provided for benefits to be paid upon retirement to Trustees over a period of time based on the number of years of service. The Fund may have certain former Trustees who also participate in a retirement plan and receive benefits under such plan.Trustees’ and Officers’ Fees and Benefits include amounts accrued by the Fund to fund such retirement benefits. Obligations under the deferred compensation and retirement plans represent unsecured claims against the general assets of the Fund.
20 Invesco Global Core Equity Fund
NOTE 8—Cash Balances
The Fund is permitted to temporarily carry a negative or overdrawn balance in its account with State Street Bank and Trust Company, the custodian bank. Such balances, if any at period-end, are shown in the Statement of Assets and Liabilities under the payable captionAmount due custodian. To compensate the custodian bank for such overdrafts, the overdrawn Fund may either (1) leave funds as a compensating balance in the account so the custodian bank can be compensated by earning the additional interest; or (2) compensate by paying the custodian bank at a rate agreed upon by the custodian bank and Invesco, not to exceed the contractually agreed upon rate.
NOTE 9—Distributions to Shareholders and Tax Components of Net Assets
Tax Character of Distributions to Shareholders Paid During the Fiscal Years Ended December 31, 2018 and 2017:
| | | | | | | | |
| | | 2018 | | | 2017 | |
Ordinary income | | $ | 14,564,528 | | | $ | 12,139,593 | |
Long-term capital gain | | | 42,057,326 | | | | 34,769,358 | |
Total distributions | | $ | 56,621,854 | | | $ | 46,908,951 | |
Tax Components of Net Assets at Period-End:
| | | | |
| | | 2018 | |
Undistributed ordinary income | | $ | 328,507 | |
Net unrealized appreciation (depreciation) — investments | | | (6,294,514 | ) |
Net unrealized appreciation — foreign currencies | | | 5,141 | |
Temporary book/tax differences | | | (246,468 | ) |
Post-October capital loss | | | (4,557,976 | ) |
Shares of beneficial interest | | | 714,831,895 | |
Total net assets | | $ | 704,066,585 | |
The difference between book-basis and tax-basis unrealized appreciation (depreciation) is due to differences in the timing of recognition of gains and losses on investments for tax and book purposes. The Fund’s net unrealized appreciation (depreciation) difference is attributable primarily to wash sales and forward foreign currency contracts.
The temporary book/tax differences are a result of timing differences between book and tax recognition of income and/or expenses. The Fund’s temporary book/tax differences are the result of the trustee deferral of compensation and retirement plan benefits.
Capital loss carryforward is calculated and reported as of a specific date. Results of transactions and other activity after that date may affect the amount of capital loss carryforward actually available for the Fund to utilize. Capital losses generated in years beginning after December 22, 2010 can be carried forward for an unlimited period, whereas previous losses expire in eight tax years. Capital losses with an expiration period may not be used to offset capital gains until all net capital losses without an expiration date have been utilized. Capital loss carryforwards with no expiration date will retain their character as eithershort-term orlong-term capital losses instead of asshort-term capital losses as under prior law. The ability to utilize capital loss carryforwards in the future may be limited under the Internal Revenue Code and related regulations based on the results of future transactions.
The Fund does not have a capital loss carryforward as of December 31, 2018.
NOTE 10—Investment Transactions
The aggregate amount of investment securities (other thanshort-term securities, U.S. Treasury obligations and money market funds, if any) purchased and sold by the Fund during the year ended December 31, 2018 was $256,017,614 and $355,026,402, respectively. Cost of investments, including any derivatives, on a tax basis includes the adjustments for financial reporting purposes as of the most recently completed federal income tax reporting period-end.
| | | | |
| Unrealized Appreciation (Depreciation) of Investments on a Tax Basis | |
Aggregate unrealized appreciation of investments | | $ | 67,041,816 | |
Aggregate unrealized (depreciation) of investments | | | (73,336,330 | ) |
Net unrealized appreciation (depreciation) of investments | | $ | (6,294,514 | ) |
Cost of investments for tax purposes is $716,356,469.
NOTE 11—Reclassification of Permanent Differences
Primarily as a result of differing book/tax treatment of foreign currency transactions and passive foreign investment companies, on December 31, 2018, undistributed net investment income was increased by $775,804 and undistributed net realized gain (loss) was decreased by $775,804. This reclassification had no effect on the net assets or the distributable earnings of the Fund.
21 Invesco Global Core Equity Fund
NOTE 12—Share Information
| | | | | | | | | | | | | | | | |
| | | Summary of Share Activity | |
| | | Years ended December 31, | |
| | | 2018(a) | | | 2017 | |
| | | Shares | | | Amount | | | Shares | | | Amount | |
Sold: | | | | | | | | | | | | | | | | |
Class A | | | 1,149,223 | | | $ | 17,999,481 | | | | 1,756,224 | | | $ | 26,888,847 | |
Class B(b) | | | 73 | | | | 1,209 | | | | 7,932 | | | | 114,601 | |
Class C | | | 203,827 | | | | 2,966,793 | | | | 193,338 | | | | 2,837,331 | |
Class R | | | 21,177 | | | | 333,253 | | | | 48,057 | | | | 746,020 | |
Class Y | | | 659,538 | | | | 10,541,494 | | | | 2,075,804 | | | | 31,424,151 | |
Class R5 | | | 27,865 | | | | 389,843 | | | | 2,285 | | | | 35,981 | |
Class R6(c) | | | 667,786 | | | | 11,416,522 | | | | 673 | | | | 10,015 | |
| | | | |
Issued as reinvestment of dividends: | | | | | | | | | | | | | | | | |
Class A | | | 3,391,401 | | | | 44,563,015 | | | | 2,310,480 | | | | 36,898,356 | |
Class B(b) | | | — | | | | — | | | | 30,635 | | | | 465,338 | |
Class C | | | 311,394 | | | | 3,892,426 | | | | 223,525 | | | | 3,404,353 | |
Class R | | | 8,410 | | | | 110,504 | | | | 4,959 | | | | 79,192 | |
Class Y | | | 172,557 | | | | 2,265,681 | | | | 136,691 | | | | 2,182,952 | |
Class R5 | | | 2,003 | | | | 26,678 | | | | 1,229 | | | | 19,890 | |
Class R6 | | | 39,572 | | | | 527,095 | | | | — | | | | — | |
| | | | |
Conversion of Class B shares to Class A shares:(d) | | | | | | | | | | | | | | | | |
Class A | | | 530,251 | | | | 9,194,555 | | | | 379,498 | | | | 6,032,363 | |
Class B | | | (557,930 | ) | | | (9,194,555 | ) | | | (399,976 | ) | | | (6,032,363 | ) |
| | | | |
Reacquired: | | | | | | | | | | | | | | | | |
Class A | | | (6,745,174 | ) | | | (105,111,671 | ) | | | (9,165,869 | ) | | | (140,413,202 | ) |
Class B(b) | | | (61,362 | ) | | | (1,000,320 | ) | | | (182,498 | ) | | | (2,650,445 | ) |
Class C | | | (1,081,471 | ) | | | (16,086,923 | ) | | | (1,450,310 | ) | | | (21,105,885 | ) |
Class R | | | (18,810 | ) | | | (297,614 | ) | | | (24,695 | ) | | | (392,284 | ) |
Class Y | | | (1,325,723 | ) | | | (21,436,175 | ) | | | (1,044,606 | ) | | | (15,975,741 | ) |
Class R5 | | | (13,882 | ) | | | (199,256 | ) | | | (6,688 | ) | | | (104,716 | ) |
Class R6 | | | (182,721 | ) | | | (2,912,406 | ) | | | — | | | | — | |
Net increase (decrease) in share activity | | | (2,801,996 | ) | | $ | (52,010,371 | ) | | | (5,103,312 | ) | | $ | (75,535,246 | ) |
| (a) | There are entities that are record owners of more than 5% of the outstanding shares of the Fund and in the aggregate own 53% of the outstanding shares of the Fund. IDI has an agreement with these entities to sell Fund shares. The Fund, Invesco and/or Invesco affiliates may make payments to these entities, which are considered to be related to the Fund, for providing services to the Fund, Invesco and/or Invesco affiliates including but not limited to services such as securities brokerage, distribution, third party record keeping and account servicing. The Fund has no knowledge as to whether all or any portion of the shares owned of record by these entities are also owned beneficially. |
| (b) | Class B shares activity for the period January 1, 2018 through January 26, 2018 (date of conversion). |
| (c) | Commencement date of April 4, 2017. |
| (d) | Effective as of the close of business January 26, 2018, all outstanding Class B shares were converted to Class A shares. |
22 Invesco Global Core Equity Fund
NOTE 13—Financial Highlights
The following schedule presents financial highlights for a share of the Fund outstanding throughout the periods indicated.
| | | | | | | | | | | | | | | | | | | | | | | | | | | | | | | | | | | | | | | | | | | | | | | | | | | | | | | | |
| | | Net asset
value,
beginning
of period | | | Net
investment
income
(loss)(a) | | | Net gains
(losses)
on securities
(both
realized and
unrealized) | | | Total from
investment
operations | | | Dividends
from net
investment
income | | | Distributions
from net
realized
gains | | | Total
distributions | | | Net asset
value, end
of period | | | Total
return(b) | | | Net assets,
end of period
(000’s omitted) | | | Ratio of
expenses
to average
net assets
with fee waivers
and/or expenses
absorbed | | | Ratio of
expenses
to average net
assets without
fee waivers
and/or expenses
absorbed | | | Ratio of net
investment
income (loss)
to average
net assets | | | Portfolio
turnover(c) | |
Class A | |
Year ended 12/31/18 | | $ | 16.20 | | | $ | 0.15 | | | $ | (2.53 | ) | | $ | (2.38 | ) | | $ | (0.17 | ) | | $ | (0.92 | ) | | $ | (1.09 | ) | | $ | 12.73 | | | | (14.90 | )% | | $ | 605,748 | | | | 1.22 | %(d) | | | 1.29 | %(d) | | | 0.97 | %(d) | | | 30 | % |
Year ended 12/31/17 | | | 13.89 | | | | 0.12 | | | | 3.04 | | | | 3.16 | | | | (0.15 | ) | | | (0.70 | ) | | | (0.85 | ) | | | 16.20 | | | | 22.83 | | | | 798,219 | | | | 1.22 | | | | 1.34 | | | | 0.80 | | | | 64 | |
Year ended 12/31/16 | | | 13.19 | | | | 0.13 | | | | 0.76 | | | | 0.89 | | | | (0.14 | ) | | | (0.05 | ) | | | (0.19 | ) | | | 13.89 | | | | 6.70 | | | | 749,810 | | | | 1.30 | | | | 1.30 | | | | 0.95 | (e) | | | 39 | |
Year ended 12/31/15 | | | 13.65 | | | | 0.10 | | | | (0.40 | ) | | | (0.30 | ) | | | (0.09 | ) | | | (0.07 | ) | | | (0.16 | ) | | | 13.19 | | | | (2.16 | ) | | | 818,600 | | | | 1.32 | | | | 1.32 | | | | 0.70 | | | | 66 | |
Year ended 12/31/14 | | | 15.36 | | | | 0.16 | | | | (0.14 | ) | | | 0.02 | | | | (0.17 | ) | | | (1.56 | ) | | | (1.73 | ) | | | 13.65 | | | | 0.38 | | | | 934,893 | | | | 1.29 | | | | 1.29 | | | | 1.03 | | | | 122 | |
Class B | | | | | | | | | | | | | | | | | | | | | | | | | | | | | | | | | | | | | | | | | | | | | | | | | | | | | | | | |
Year ended 12/31/18(f) | | | 15.40 | | | | 0.00 | | | | 1.08 | | | | 1.08 | | | | — | | | | — | | | | — | | | | 16.48 | | | | 7.01 | | | | — | | | | 1.96 | (d)(h) | | | 2.03 | (d)(h) | | | 0.23 | (d)(h) | | | 30 | |
Year ended 12/31/17 | | | 13.23 | | | | 0.01 | | | | 2.89 | | | | 2.90 | | | | (0.03 | ) | | | (0.70 | ) | | | (0.73 | ) | | | 15.40 | | | | 21.95 | | | | 9,536 | | | | 1.97 | | | | 2.09 | | | | 0.05 | | | | 64 | |
Year ended 12/31/16 | | | 12.57 | | | | 0.03 | | | | 0.71 | | | | 0.74 | | | | (0.03 | ) | | | (0.05 | ) | | | (0.08 | ) | | | 13.23 | | | | 5.88 | | | | 15,390 | | | | 2.05 | | | | 2.05 | | | | 0.20 | (e) | | | 39 | |
Year ended 12/31/15 | | | 13.03 | | | | (0.01 | ) | | | (0.37 | ) | | | (0.38 | ) | | | (0.01 | ) | | | (0.07 | ) | | | (0.08 | ) | | | 12.57 | | | | (2.88 | ) | | | 21,718 | | | | 2.07 | | | | 2.07 | | | | (0.05 | ) | | | 66 | |
Year ended 12/31/14 | | | 14.73 | | | | 0.04 | | | | (0.14 | ) | | | (0.10 | ) | | | (0.04 | ) | | | (1.56 | ) | | | (1.60 | ) | | | 13.03 | | | | (0.40 | ) | | | 31,846 | | | | 2.04 | | | | 2.04 | | | | 0.28 | | | | 122 | |
Class C | | | | | | | | | | | | | | | | | | | | | | | | | | | | | | | | | | | | | | | | | | | | | | | | | | | | | | | | |
Year ended 12/31/18 | | | 15.44 | | | | 0.03 | | | | (2.40 | ) | | | (2.37 | ) | | | (0.05 | ) | | | (0.92 | ) | | | (0.97 | ) | | | 12.10 | | | | (15.58 | ) | | | 57,163 | | | | 1.97 | (d) | | | 2.04 | (d) | | | 0.22 | (d) | | | 30 | |
Year ended 12/31/17 | | | 13.26 | | | | 0.01 | | | | 2.90 | | | | 2.91 | | | | (0.03 | ) | | | (0.70 | ) | | | (0.73 | ) | | | 15.44 | | | | 21.97 | | | | 81,668 | | | | 1.97 | | | | 2.09 | | | | 0.05 | | | | 64 | |
Year ended 12/31/16 | | | 12.60 | | | | 0.03 | | | | 0.71 | | | | 0.74 | | | | (0.03 | ) | | | (0.05 | ) | | | (0.08 | ) | | | 13.26 | | | | 5.87 | | | | 83,864 | | | | 2.05 | | | | 2.05 | | | | 0.20 | (e) | | | 39 | |
Year ended 12/31/15 | | | 13.07 | | | | (0.01 | ) | | | (0.38 | ) | | | (0.39 | ) | | | (0.01 | ) | | | (0.07 | ) | | | (0.08 | ) | | | 12.60 | | | | (2.95 | ) | | | 94,854 | | | | 2.07 | | | | 2.07 | | | | (0.05 | ) | | | 66 | |
Year ended 12/31/14 | | | 14.76 | | | | 0.04 | | | | (0.13 | ) | | | (0.09 | ) | | | (0.04 | ) | | | (1.56 | ) | | | (1.60 | ) | | | 13.07 | | | | (0.33 | ) | | | 111,552 | | | | 2.04 | | | | 2.04 | | | | 0.28 | | | | 122 | |
Class R | | | | | | | | | | | | | | | | | | | | | | | | | | | | | | | | | | | | | | | | | | | | | | | | | | | | | | | | |
Year ended 12/31/18 | | | 16.19 | | | | 0.11 | | | | (2.53 | ) | | | (2.42 | ) | | | (0.13 | ) | | | (0.92 | ) | | | (1.05 | ) | | | 12.72 | | | | (15.16 | ) | | | 1,464 | | | | 1.47 | (d) | | | 1.54 | (d) | | | 0.72 | (d) | | | 30 | |
Year ended 12/31/17 | | | 13.88 | | | | 0.09 | | | | 3.03 | | | | 3.12 | | | | (0.11 | ) | | | (0.70 | ) | | | (0.81 | ) | | | 16.19 | | | | 22.54 | | | | 1,689 | | | | 1.47 | | | | 1.59 | | | | 0.55 | | | | 64 | |
Year ended 12/31/16 | | | 13.18 | | | | 0.09 | | | | 0.76 | | | | 0.85 | | | | (0.10 | ) | | | (0.05 | ) | | | (0.15 | ) | | | 13.88 | | | | 6.45 | | | | 1,054 | | | | 1.55 | | | | 1.55 | | | | 0.70 | (e) | | | 39 | |
Year ended 12/31/15 | | | 13.65 | | | | 0.06 | | | | (0.39 | ) | | | (0.33 | ) | | | (0.07 | ) | | | (0.07 | ) | | | (0.14 | ) | | | 13.18 | | | | (2.43 | ) | | | 1,035 | | | | 1.57 | | | | 1.57 | | | | 0.45 | | | | 66 | |
Year ended 12/31/14 | | | 15.35 | | | | 0.12 | | | | (0.13 | ) | | | (0.01 | ) | | | (0.13 | ) | | | (1.56 | ) | | | (1.69 | ) | | | 13.65 | | | | 0.17 | | | | 807 | | | | 1.54 | | | | 1.54 | | | | 0.78 | | | | 122 | |
Class Y | | | | | | | | | | | | | | | | | | | | | | | | | | | | | | | | | | | | | | | | | | | | | | | | | | | | | | | | |
Year ended 12/31/18 | | | 16.19 | | | | 0.19 | | | | (2.54 | ) | | | (2.35 | ) | | | (0.21 | ) | | | (0.92 | ) | | | (1.13 | ) | | | 12.71 | | | | (14.72 | ) | | | 32,382 | | | | 0.97 | (d) | | | 1.04 | (d) | | | 1.22 | (d) | | | 30 | |
Year ended 12/31/17 | | | 13.88 | | | | 0.16 | | | | 3.04 | | | | 3.20 | | | | (0.19 | ) | | | (0.70 | ) | | | (0.89 | ) | | | 16.19 | | | | 23.14 | | | | 49,238 | | | | 0.97 | | | | 1.09 | | | | 1.05 | | | | 64 | |
Year ended 12/31/16 | | | 13.18 | | | | 0.16 | | | | 0.76 | | | | 0.92 | | | | (0.17 | ) | | | (0.05 | ) | | | (0.22 | ) | | | 13.88 | | | | 6.98 | | | | 25,996 | | | | 1.05 | | | | 1.05 | | | | 1.20 | (e) | | | 39 | |
Year ended 12/31/15 | | | 13.64 | | | | 0.13 | | | | (0.40 | ) | | | (0.27 | ) | | | (0.12 | ) | | | (0.07 | ) | | | (0.19 | ) | | | 13.18 | | | | (1.94 | ) | | | 18,405 | | | | 1.07 | | | | 1.07 | | | | 0.95 | | | | 66 | |
Year ended 12/31/14 | | | 15.35 | | | | 0.20 | | | | (0.14 | ) | | | 0.06 | | | | (0.21 | ) | | | (1.56 | ) | | | (1.77 | ) | | | 13.64 | | | | 0.65 | | | | 21,136 | | | | 1.04 | | | | 1.04 | | | | 1.28 | | | | 122 | |
Class R5 | | | | | | | | | | | | | | | | | | | | | | | | | | | | | | | | | | | | | | | | | | | | | | | | | | | | | | | | |
Year ended 12/31/18 | | | 16.41 | | | | 0.20 | | | | (2.58 | ) | | | (2.38 | ) | | | (0.21 | ) | | | (0.92 | ) | | | (1.13 | ) | | | 12.90 | | | | (14.70 | ) | | | 533 | | | | 0.97 | (d) | | | 0.97 | (d) | | | 1.22 | (d) | | | 30 | |
Year ended 12/31/17 | | | 14.06 | | | | 0.16 | | | | 3.08 | | | | 3.24 | | | | (0.19 | ) | | | (0.70 | ) | | | (0.89 | ) | | | 16.41 | | | | 23.14 | | | | 416 | | | | 0.97 | | | | 0.99 | | | | 1.05 | | | | 64 | |
Year ended 12/31/16 | | | 13.35 | | | | 0.18 | | | | 0.77 | | | | 0.95 | | | | (0.19 | ) | | | (0.05 | ) | | | (0.24 | ) | | | 14.06 | | | | 7.07 | | | | 401 | | | | 0.94 | | | | 0.94 | | | | 1.31 | (e) | | | 39 | |
Year ended 12/31/15 | | | 13.81 | | | | 0.15 | | | | (0.40 | ) | | | (0.25 | ) | | | (0.14 | ) | | | (0.07 | ) | | | (0.21 | ) | | | 13.35 | | | | (1.80 | ) | | | 191 | | | | 0.95 | | | | 0.95 | | | | 1.07 | | | | 66 | |
Year ended 12/31/14 | | | 15.52 | | | | 0.22 | | | | (0.14 | ) | | | 0.08 | | | | (0.23 | ) | | | (1.56 | ) | | | (1.79 | ) | | | 13.81 | | | | 0.76 | | | | 362 | | | | 0.94 | | | | 0.94 | | | | 1.38 | | | | 122 | |
Class R6 | | | | | | | | | | | | | | | | | | | | | | | | | | | | | | | | | | | | | | | | | | | | | | | | | | | | | | | | |
Year ended 12/31/18 | | | 16.41 | | | | 0.20 | | | | (2.57 | ) | | | (2.37 | ) | | | (0.22 | ) | | | (0.92 | ) | | | (1.14 | ) | | | 12.90 | | | | (14.64 | ) | | | 6,776 | | | | 0.91 | (d) | | | 0.91 | (d) | | | 1.28 | (d) | | | 30 | |
Year ended 12/31/17(g) | | | 14.89 | | | | 0.12 | | | | 2.29 | | | | 2.41 | | | | (0.19 | ) | | | (0.70 | ) | | | (0.89 | ) | | | 16.41 | | | | 16.27 | | | | 11 | | | | 0.97 | (h) | | | 1.01 | (h) | | | 1.05 | (h) | | | 64 | |
| (a) | Calculated using average shares outstanding. |
| (b) | Includes adjustments in accordance with accounting principles generally accepted in the United States of America and as such, the net asset value for financial reporting purposes and the returns based upon those net asset values may differ from the net asset value and returns for shareholder transactions. Does not include sales charges and is not annualized for periods less than one year, if applicable. |
| (c) | Portfolio turnover is calculated at the fund level and is not annualized for periods less than one year, if applicable. |
| (d) | Ratios are based on average daily net assets (000’s omitted) of $748,372, $9,797, $73,358, $1,678, $40,385, $441 and $7,794 for Class A, Class B, Class C, Class R, Class Y, Class R5 and Class R6 shares, respectively. |
| (e) | Amount includes the effect of a one-time reimbursement of custody expenses. The ratio of net investment income excluding these payments would have been 0.84%, 0.09%, 0.09%, 0.59%, 1.09% and 1.20% for Class A, Class B, Class C, Class R, Class Y and Class R5 shares, respectively. |
| (f) | Reflects activity for the period January 1, 2018 through January 26, 2018 (date of conversion). |
| (g) | Commencement date of April 4, 2017. |
23 Invesco Global Core Equity Fund
Report of Independent Registered Public Accounting Firm
To the Board of Trustees of AIM Funds Group (Invesco Funds Group)
and Shareholders of Invesco Global Core Equity Fund:
Opinion on the Financial Statements
We have audited the accompanying statement of assets and liabilities, including the schedule of investments, of Invesco Global Core Equity Fund (one of the funds constituting AIM Funds Group (Invesco Funds Group), hereafter referred to as the “Fund”) as of December 31, 2018, the related statement of operations for the year ended December 31, 2018, the statement of changes in net assets for each of the two years in the period ended December 31, 2018, including the related notes, and the financial highlights for each of the periods indicated therein (collectively referred to as the “financial statements”). In our opinion, the financial statements present fairly, in all material respects, the financial position of the Fund as of December 31, 2018, the results of its operations for the year then ended, the changes in its net assets for each of the two years in the period ended December 31, 2018 and the financial highlights for each of the periods indicated therein in conformity with accounting principles generally accepted in the United States of America.
Basis for Opinion
These financial statements are the responsibility of the Fund’s management. Our responsibility is to express an opinion on the Fund’s financial statements based on our audits. We are a public accounting firm registered with the Public Company Accounting Oversight Board (United States) (PCAOB) and are required to be independent with respect to the Fund in accordance with the U.S. federal securities laws and the applicable rules and regulations of the Securities and Exchange Commission and the PCAOB.
We conducted our audits of these financial statements in accordance with the standards of the PCAOB. Those standards require that we plan and perform the audit to obtain reasonable assurance about whether the financial statements are free of material misstatement, whether due to error or fraud.
Our audits included performing procedures to assess the risks of material misstatement of the financial statements, whether due to error or fraud, and performing procedures that respond to those risks. Such procedures included examining, on a test basis, evidence regarding the amounts and disclosures in the financial statements. Our audits also included evaluating the accounting principles used and significant estimates made by management, as well as evaluating the overall presentation of the financial statements. Our procedures included confirmation of securities owned as of December 31, 2018 by correspondence with the custodian, transfer agent and brokers; when replies were not received from brokers, we performed other auditing procedures. We believe that our audits provide a reasonable basis for our opinion.
PricewaterhouseCoopers LLP
Houston, TX
February 28, 2019
We have served as the auditor of one or more of the investment companies in the Invesco group of investment companies since at least 1995. We have not been able to determine the specific year we began serving as auditor.
24 Invesco Global Core Equity Fund
Calculating your ongoing Fund expenses
Example
As a shareholder of the Fund, you incur two types of costs: (1) transaction costs, which may include sales charges (loads) on purchase payments or contingent deferred sales charges on redemptions, if any; and (2) ongoing costs, including management fees, distribution and/or service (12b-1) fees, and other Fund expenses. This example is intended to help you understand your ongoing costs (in dollars) of investing in the Fund and to compare these costs with ongoing costs of investing in other mutual funds. The example is based on an investment of $1,000 invested at the beginning of the period and held for the entire period July 1, 2018 through December 31, 2018.
Actual expenses
The table below provides information about actual account values and actual expenses. You may use the information in this table, together with the amount you invested, to estimate the expenses that you paid over the period. Simply divide your account value by $1,000 (for example, an $8,600 account value divided by $1,000 = 8.6), then multiply the result by the number in the table under the heading entitled “Actual Expenses Paid During Period” to estimate the expenses you paid on your account during this period.
Hypothetical example for comparison purposes
The table below also provides information about hypothetical account values and hypothetical expenses based on the Fund’s actual expense ratio and an assumed rate of return of 5% per year before expenses, which is not the Fund’s actual return.
The hypothetical account values and expenses may not be used to estimate the actual ending account balance or expenses you paid for the period. You may use this information to compare the ongoing costs of investing in the Fund and other funds. To do so, compare this 5% hypothetical example with the 5% hypothetical examples that appear in the shareholder reports of the other funds.
Please note that the expenses shown in the table are meant to highlight your ongoing costs only and do not reflect any transaction costs, such as sales charges (loads) on purchase payments or contingent deferred sales charges on redemptions, if any. Therefore, the hypothetical information is useful in comparing ongoing costs only, and will not help you determine the relative total costs of owning different funds. In addition, if these transaction costs were included, your costs would have been higher.
| | | | | | | | | | | | | | | | | | | | | | | | |
| | | | | | ACTUAL | | | HYPOTHETICAL
(5% annual return before
expenses) | | | | |
| Class | | Beginning
Account Value
(07/01/18) | | | Ending
Account Value
(12/31/18)1 | | | Expenses
Paid During
Period2 | | | Ending
Account Value
(12/31/18) | | | Expenses
Paid During
Period2 | | | Annualized
Expense
Ratio | |
| A | | $ | 1,000.00 | | | $ | 876.50 | | | $ | 5.77 | | | $ | 1,019.06 | | | $ | 6.21 | | | | 1.22 | % |
| C | | | 1,000.00 | | | | 872.50 | | | | 9.30 | | | | 1,015.27 | | | | 10.01 | | | | 1.97 | |
| R | | | 1,000.00 | | | | 874.90 | | | | 6.95 | | | | 1,017.80 | | | | 7.48 | | | | 1.47 | |
| Y | | | 1,000.00 | | | | 876.60 | | | | 4.59 | | | | 1,020.32 | | | | 4.94 | | | | 0.97 | |
| R5 | | | 1,000.00 | | | | 877.10 | | | | 4.59 | | | | 1,020.32 | | | | 4.94 | | | | 0.97 | |
| R6 | | | 1,000.00 | | | | 877.60 | | | | 4.31 | | | | 1,020.62 | | | | 4.63 | | | | 0.91 | |
| 1 | The actual ending account value is based on the actual total return of the Fund for the period July 1, 2018 through December 31, 2018, after actual expenses and will differ from the hypothetical ending account value which is based on the Fund’s expense ratio and a hypothetical annual return of 5% before expenses. |
| 2 | Expenses are equal to the Fund’s annualized expense ratio as indicated above multiplied by the average account value over the period, multiplied by 184/365 to reflect the most recent fiscal half year. |
25 Invesco Global Core Equity Fund
Tax Information
Form1099-DIV, Form 1042-S and other year-end tax information provide shareholders with actual calendar year amounts that should be included in their tax returns. Shareholders should consult their tax advisors.
The following distribution information is being provided as required by the Internal Revenue Code or to meet a specific state’s requirement.
The Fund designates the following amounts or, if subsequently determined to be different, the maximum amount allowable for its fiscal year ended December 31, 2018:
| | | | |
Federal and State Income Tax | |
Long-Term Capital Gain Distributions | | $ | 42,103,636 | |
Qualified Dividend Income* | | | 89.12 | % |
Corporate Dividends Received Deduction* | | | 37.60 | % |
U.S. Treasury Obligations* | | | 0.00 | % |
Tax-Exempt Interest Dividends* | | | 0.00 | % |
| | * | The above percentages are based on ordinary income dividends paid to shareholders during the Fund’s fiscal year. |
| | | | |
Non-Resident Alien Shareholders | |
QualifiedShort-Term Gains | | $ | 6,004,917 | |
26 Invesco Global Core Equity Fund
Trustees and Officers
The address of each trustee and officer is AIM Funds Group (Invesco Funds Group) (the “Trust”), 11 Greenway Plaza, Suite 1000, Houston, Texas 77046-1173. The trustees serve for the life of the Trust, subject to their earlier death, incapacitation, resignation, retirement or removal as more specifically provided in the Trust’s organizational documents. Each officer serves for a one year term or until their successors are elected and qualified. Column two below includes length of time served with predecessor entities, if any.
| | | | | | | | |
Name, Year of Birth and
Position(s) Held with the Trust | | Trustee and/
or Officer Since | | Principal Occupation(s)
During Past 5 Years | | Number of
Funds in Fund
Complex
Overseen by
Trustee | | Other Directorship(s)
Held by Trustee During
Past 5 Years |
| Interested Persons | | | | | | | | |
| Martin L. Flanagan1 — 1960 Trustee | | 2007 | | Executive Director, Chief Executive Officer and President, Invesco Ltd. (ultimate parent of Invesco and a global investment management firm); Trustee, The Invesco Funds; Vice Chair, Investment Company Institute; and Member of Executive Board, SMU Cox School of Business Formerly: Advisor to the Board, Invesco Advisers, Inc. (formerly known as Invesco Institutional (N.A.), Inc.); Chairman and Chief Executive Officer, Invesco Advisers, Inc. (registered investment adviser); Director, Chairman, Chief Executive Officer and President, Invesco Holding Company (US), Inc. (formerly IVZ Inc.) (holding company), Invesco Group Services, Inc. (service provider) and Invesco North American Holdings, Inc. (holding company); Director, Chief Executive Officer and President, Invesco Holding Company Limited (parent of Invesco and a global investment management firm); Director, Invesco Ltd.; Chairman, Investment Company Institute and President, Co-Chief Executive Officer, Co-President, Chief Operating Officer and Chief Financial Officer, Franklin Resources, Inc. (global investment management organization) | | 158 | | None |
| Philip A. Taylor2 — 1954 Trustee and Senior Vice President | | 2006 | | Head of the Americas and Senior Managing Director, Invesco Ltd.; Director, Invesco Advisers, Inc. (formerly known as Invesco Institutional (N.A.), Inc.) (registered investment adviser); Director and Chairman, Invesco Investment Services, Inc. (formerly known as Invesco AIM Investment Services, Inc.) (registered transfer agent); Chief Executive Officer, Invesco Corporate Class Inc. (corporate mutual fund company); Director, Chairman and Chief Executive Officer, Invesco Canada Ltd. (formerly known as Invesco Trimark Ltd./Invesco Trimark Ltèe) (registered investment adviser and registered transfer agent); Trustee and Senior Vice President, The Invesco Funds; Director, Invesco Investment Advisers LLC (formerly known as Van Kampen Asset Management) Formerly: Director, Chairman, Chief Executive Officer and President, Invesco Management Group, Inc. (formerly known as Invesco AIM Management Group, Inc.) (financial services holding company); Co-Chairman, Co-President and Co-Chief Executive Officer, Invesco Advisers, Inc. (formerly known as Invesco Institutional (N.A.), Inc.) (registered investment adviser); Director, Chief Executive Officer and President, Van Kampen Exchange Corp; President and Principal Executive Officer, The Invesco Funds (other than AIM Treasurer’s Series Trust (Invesco Treasurer’s Series Trust), Short-Term Investments Trust and Invesco Management Trust); Executive Vice President, The Invesco Funds (AIM Treasurer’s Series Trust (Invesco Treasurer’s Series Trust), Short-Term Investments Trust and Invesco Management Trust only); Director and President, INVESCO Funds Group, Inc. (registered investment adviser and registered transfer agent); Director and Chairman, IVZ Distributors, Inc. (formerly known as INVESCO Distributors, Inc.) (registered broker dealer); Director, President and Chairman, Invesco Inc. (holding company), Invesco Canada Holdings Inc. (holding company), Trimark Investments Ltd./Placements Trimark Ltèe and Invesco Financial Services Ltd/Services Financiers Invesco Ltèe; Chief Executive Officer, Invesco Canada Fund Inc. (corporate mutual fund company); Director and Chairman, Van Kampen Investor Services Inc.; Director, Chief Executive Officer and President, 1371 Preferred Inc. (holding company) and Van Kampen Investments Inc.; Director and President, AIM GP Canada Inc. (general partner for limited partnerships) and Van Kampen Advisors, Inc.; Director and Chief Executive Officer, Invesco Trimark Dealer Inc. (registered broker dealer); Director, Invesco Distributors, Inc. (formerly known as Invesco AIM Distributors, Inc.) (registered broker dealer); Manager, Invesco Capital Management LLC; Director, Chief Executive Officer and President, Invesco Advisers, Inc.; Director, Chairman, Chief Executive Officer and President, Invesco AIM Capital Management, Inc.; President, Invesco Trimark Dealer Inc. and Invesco Trimark Ltd./Invesco Trimark Ltèe; Director and President, AIM Trimark Corporate Class Inc. and AIM Trimark Canada Fund Inc.; Senior Managing Director, Invesco Holding Company Limited; Director and Chairman, Fund Management Company (former registered broker dealer); President and Principal Executive Officer, The Invesco Funds (AIM Treasurer’s Series Trust (Invesco Treasurer’s Series Trust), and Short-Term Investments Trust only); President, AIM Trimark Global Fund Inc. and AIM Trimark Canada Fund Inc. | | 158 | | None |
| 1 | Mr. Flanagan is considered an interested person (within the meaning of Section 2(a)(19) of the 1940 Act) of the Trust because he is an officer of the Adviser to the Trust, and an officer and a director of Invesco Ltd., ultimate parent of the Adviser. |
| 2 | Mr. Taylor is considered an interested person (within the meaning of Section 2(a)(19) of the 1940 Act) of the Trust because he is an officer and a director of the Adviser. |
T-1 Invesco Global Core Equity Fund
Trustees and Officers—(continued)
| | | | | | | | |
Name, Year of Birth and
Position(s) Held with the Trust | | Trustee and/
or Officer Since | | Principal Occupation(s)
During Past 5 Years | | Number of
Funds in Fund
Complex
Overseen by
Trustee | | Other Directorship(s)
Held by Trustee During
Past 5 Years |
| Independent Trustees | | | | | | | | |
Bruce L. Crockett — 1944 Trustee and Chair | | 1987 | | Chairman, Crockett Technologies Associates (technology consulting company) Formerly: Director, Captaris (unified messaging provider); Director, President and Chief Executive Officer, COMSAT Corporation; Chairman, Board of Governors of INTELSAT (international communications company); ACE Limited (insurance company); Independent Directors Council and Investment Company Institute: Member of the Audit Committee, Investment Company Institute; Member of the Executive Committee and Chair of the Governance Committee, Independent Directors Council | | 158 | | Director and Chairman of the Audit Committee, ALPS (Attorneys Liability Protection Society) (insurance company); Director and Member of the Audit Committee and Compensation Committee, Ferroglobe PLC (metallurgical company) |
David C. Arch — 1945 Trustee | | 2010 | | Chairman of Blistex Inc. (consumer health care products manufacturer); Member, World Presidents’ Organization | | 158 | | Board member of the Illinois Manufacturers’ Association |
Jack M. Fields — 1952 Trustee | | 1997 | | Chief Executive Officer, Twenty First Century Group, Inc. (government affairs company); and Chairman, Discovery Learning Alliance (non-profit) Formerly: Owner and Chief Executive Officer, Dos Angeles Ranch L.P. (cattle, hunting, corporate entertainment); Director, Insperity, Inc. (formerly known as Administaff) (human resources provider); Chief Executive Officer, Texana Timber LP (sustainable forestry company); Director of Cross Timbers Quail Research Ranch (non-profit); and member of the U.S. House of Representatives | | 158 | | None |
Cynthia Hostetler — 1962 Trustee | | 2017 | | Non-Executive Director and Trustee of a number of public and private business corporations Formerly: Director, Aberdeen Investment Funds (4 portfolios); Head of Investment Funds and Private Equity, Overseas Private Investment Corporation; President, First Manhattan Bancorporation, Inc.; Attorney, Simpson Thacher & Bartlett LLP | | 158 | | Vulcan Materials Company (construction materials company); Trilinc Global Impact Fund; Genesse Wyoming, Inc. (railroads); Artio Global Investment LLC (mutual fund complex); Edgen Group, Inc. (specialized energy and infrastructure products distributor); Investment Company Institute (professional organization); Independent Directors Council (professional organization) |
Eli Jones — 1961 Trustee | | 2016 | | Professor and Dean, Mays Business School — Texas A&M University Formerly: Professor and Dean, Walton College of Business, University of Arkansas and E.J. Ourso College of Business, Louisiana State University; Director, Arvest Bank | | 158 | | Insperity, Inc. (formerly known as Administaff) (human resources provider) |
Prema Mathai-Davis — 1950 Trustee | | 1998 | | Retired Co-Owner & Partner of Quantalytics Research, LLC, (a FinTech Investment Research Platform for the Self-Directed Investor) | | 158 | | None |
Teresa M. Ressel — 1962 Trustee | | 2017 | | Non-executive director and trustee of a number of public and private business corporations Formerly: Chief Financial Officer, Olayan America, The Olayan Group (international investor/commercial/industrial); Chief Executive Officer, UBS Securities LLC; Group Chief Operating Officer, Americas, UBS AG; Assistant Secretary for Management & Budget and CFO, US Department of the Treasury | | 158 | | Atlantic Power Corporation (power generation company); ON Semiconductor Corp. (semiconductor supplier) |
Ann Barnett Stern — 1957 Trustee | | 2017 | | President and Chief Executive Officer, Houston Endowment Inc. (private philanthropic institution) Formerly: Executive Vice President and General Counsel, Texas Children’s Hospital; Attorney, Beck, Redden and Secrest, LLP; Business Law Instructor, University of St. Thomas; Attorney, Andrews & Kurth LLP | | 158 | | Federal Reserve Bank of Dallas |
Raymond Stickel, Jr. — 1944 Trustee | | 2005 | | Retired Formerly: Director, Mainstay VP Series Funds, Inc. (25 portfolios); Partner, Deloitte & Touche | | 158 | | None |
Robert C. Troccoli — 1949 Trustee | | 2016 | | Adjunct Professor, University of Denver — Daniels College of Business Formerly: Senior Partner, KPMG LLP | | 158 | | None |
Christopher L. Wilson — 1957 Trustee | | 2017 | | Non-executive director and trustee of a number of public and private business corporations Formerly: Director, TD Asset Management USA Inc. (mutual fund complex) (22 portfolios); Managing Partner, CT2, LLC (investing and consulting firm); President/Chief Executive Officer, Columbia Funds, Bank of America Corporation; President/Chief Executive Officer, CDC IXIS Asset Management Services, Inc.; Principal & Director of Operations, Scudder Funds, Scudder, Stevens & Clark, Inc.; Assistant Vice President, Fidelity Investments | | 158 | | ISO New England, Inc.(non-profit organization managing regional electricity market) |
T-2 Invesco Global Core Equity Fund
Trustees and Officers—(continued)
| | | | | | | | |
Name, Year of Birth and
Position(s) Held with the Trust | | Trustee and/
or Officer Since | | Principal Occupation(s)
During Past 5 Years | | Number of
Funds in Fund
Complex
Overseen by
Trustee | | Other Directorship(s)
Held by Trustee During
Past 5 Years |
| Other Officers | | | | | | | | |
Sheri Morris — 1964 President, Principal Executive Officer and Treasurer | | 1999 | | President, Principal Executive Officer and Treasurer, The Invesco Funds; Vice President, Invesco Advisers, Inc. (formerly known as Invesco Institutional (N.A.), Inc.) (registered investment adviser); and Vice President, Invesco Exchange-Traded Fund Trust, Invesco Exchange-Traded Fund Trust II, Invesco India Exchange-Traded Fund Trust, Invesco Actively Managed Exchange-Traded Fund Trust, Invesco Actively Managed Exchange-Traded Commodity Fund Trust and Invesco Exchange-Traded Self-Indexed Fund Trust Formerly: Vice President and Principal Financial Officer, The Invesco Funds; Vice President, Invesco AIM Advisers, Inc., Invesco AIM Capital Management, Inc. and Invesco AIM Private Asset Management, Inc.; Assistant Vice President and Assistant Treasurer, The Invesco Funds and Assistant Vice President, Invesco Advisers, Inc., Invesco AIM Capital Management, Inc. and Invesco AIM Private Asset Management, Inc.; and Treasurer, Invesco Exchange-Traded Fund Trust, Invesco Exchange-Traded Fund Trust II, Invesco India Exchange-Traded Fund Trust and Invesco Actively Managed Exchange-Traded Fund Trust | | N/A | | N/A |
| Russell C. Burk — 1958 Senior Vice President and Senior Officer | | 2005 | | Senior Vice President and Senior Officer, The Invesco Funds | | N/A | | N/A |
Jeffrey H. Kupor — 1968 Senior Vice President, Chief Legal Officer and Secretary | | 2018 | | Head of Legal of the Americas; Senior Vice President and Secretary, Invesco Advisers, Inc. (formerly known as Invesco Institutional (N.A.), Inc.) (registered investment adviser); Senior Vice President and Secretary, Invesco Distributors, Inc. (formerly known as Invesco AIM Distributors, Inc.); Vice President and Secretary, Invesco Investment Services, Inc. (formerly known as Invesco AIM Investment Services, Inc.) Senior Vice President, Chief Legal Officer and Secretary, The Invesco Funds; Secretary and General Counsel, Invesco Investment Advisers LLC (formerly known as Van Kampen Asset Management); Secretary and General Counsel, Invesco Capital Markets, Inc. (formerly known as Van Kampen Funds Inc.) and Chief Legal Officer, Invesco Exchange-Traded Fund Trust, Invesco Exchange-Traded Fund Trust II, Invesco India Exchange-Traded Fund Trust, Invesco Actively Managed Exchange-Traded Fund Trust, Invesco Actively Managed Exchange-Traded Commodity Fund Trust and Invesco Exchange-Traded Self-Indexed Fund Trust; Secretary, Invesco Indexing LLC; Secretary, W.L. Ross & Co., LLC; Secretary and Vice President, Jemstep, Inc. Formerly: Head of Legal, Worldwide Institutional; Secretary and General Counsel, INVESCO Private Capital Investments, Inc.; Senior Vice President, Secretary and General Counsel, Invesco Management Group, Inc. (formerly known as Invesco AIM Management Group, Inc.); Assistant Secretary, INVESCO Asset Management (Bermuda) Ltd.; Secretary and General Counsel, Invesco Private Capital, Inc.; Assistant Secretary and General Counsel, INVESCO Realty, Inc.; Secretary and General Counsel, Invesco Senior Secured Management, Inc.; and Secretary, Sovereign G./P. Holdings Inc. | | N/A | | N/A |
John M. Zerr — 1962 Senior Vice President | | 2006 | | Chief Operating Officer of the Americas; Senior Vice President, Invesco Advisers, Inc. (formerly known as Invesco Institutional (N.A.), Inc.) (registered investment adviser); Senior Vice President, Invesco Distributors, Inc. (formerly known as Invesco AIM Distributors, Inc.); Director and Vice President, Invesco Investment Services, Inc. (formerly known as Invesco AIM Investment Services, Inc.) Senior Vice President, The Invesco Funds; Managing Director, Invesco Capital Management LLC; Director, Invesco Investment Advisers LLC (formerly known as Van Kampen Asset Management); Senior Vice President, Invesco Capital Markets, Inc. (formerly known as Van Kampen Funds Inc.); Manager, Invesco Indexing LLC Formerly: Director and Senior Vice President, Invesco Management Group, Inc. (formerly known as Invesco AIM Management Group, Inc.); Secretary and General Counsel, Invesco Management Group, Inc. (formerly known as Invesco AIM Management Group, Inc.); Secretary, Invesco Investment Services, Inc. (formerly known as Invesco AIM Investment Services, Inc.); Chief Legal Officer and Secretary, The Invesco Funds; Secretary and General Counsel, Invesco Investment Advisers LLC (formerly known as Van Kampen Asset Management); Secretary and General Counsel, Invesco Capital Markets, Inc. (formerly known as Van Kampen Funds Inc.); Chief Legal Officer, Invesco Exchange-Traded Fund Trust, Invesco Exchange-Traded Fund Trust II, Invesco India Exchange-Traded Fund Trust, Invesco Actively Managed Exchange-Traded Fund Trust, Invesco Actively Managed Exchange-Traded Commodity Fund Trust and Invesco Exchange-Traded Self-Indexed Fund Trust; Secretary, Invesco Indexing LLC; Director, Secretary, General Counsel and Senior Vice President, Van Kampen Exchange Corp.; Director, Vice President and Secretary, IVZ Distributors, Inc. (formerly known as INVESCO Distributors, Inc.); Director and Vice President, INVESCO Funds Group, Inc.; Director and Vice President, Van Kampen Advisors Inc.; Director, Vice President, Secretary and General Counsel, Van Kampen Investor Services Inc.; Director and Secretary, Invesco Distributors, Inc. (formerly known as Invesco AIM Distributors, Inc.); Director, Senior Vice President, General Counsel and Secretary, Invesco AIM Advisers, Inc. and Van Kampen Investments Inc.; Director, Vice President and Secretary, Fund Management Company; Director, Senior Vice President, Secretary, General Counsel and Vice President, Invesco AIM Capital Management, Inc.; Chief Operating Officer and General Counsel, Liberty Ridge Capital, Inc. (an investment adviser) | | N/A | | N/A |
T-3 Invesco Global Core Equity Fund
Trustees and Officers—(continued)
| | | | | | | | |
Name, Year of Birth and
Position(s) Held with the Trust | | Trustee and/
or Officer Since | | Principal Occupation(s)
During Past 5 Years | | Number of
Funds in Fund
Complex
Overseen by
Trustee | | Other Directorship(s)
Held by Trustee During
Past 5 Years |
| Other Officers—(continued) | | | | | | | | |
Gregory G. McGreevey — 1962 Senior Vice President | | 2012 | | Senior Managing Director, Invesco Ltd.; Director, Chairman, President, and Chief Executive Officer, Invesco Advisers, Inc. (formerly known as Invesco Institutional (N.A.), Inc.) (registered investment adviser); Director, Invesco Mortgage Capital, Inc. and Invesco Senior Secured Management, Inc.; and Senior Vice President, The Invesco Funds Formerly: Senior Vice President, Invesco Management Group, Inc. and Invesco Advisers, Inc.; Assistant Vice President, The Invesco Funds | | N/A | | N/A |
Kelli Gallegos — 1970 Vice President, Principal Financial Officer and Assistant Treasurer | | 2008 | | Vice President and Treasurer, Invesco Exchange-Traded Fund Trust, Invesco Exchange-Traded Fund Trust II, Invesco India Exchange-Traded Fund Trust, Invesco Actively Managed Exchange-Traded Fund Trust, Invesco Actively Managed Exchange-Traded Commodity Fund Trust and Invesco Exchange-Traded Self-Indexed Fund Trust; Vice President, Principal Financial Officer and Assistant Treasurer, The Invesco Funds; Principal Financial and Accounting Officer — Pooled Investments, Invesco Capital Management LLC Formerly: Assistant Treasurer, Invesco Exchange-Traded Fund Trust, Invesco Exchange-Traded Fund Trust II, Invesco India Exchange-Traded Fund Trust, Invesco Actively Managed Exchange-Traded Fund Trust, Invesco Actively Managed Exchange-Traded Commodity Fund Trust and Invesco Exchange-Traded Self-Indexed Fund Trust; Assistant Treasurer, Invesco Capital Management LLC; Assistant Vice President, The Invesco Funds | | N/A | | N/A |
Tracy Sullivan — 1962 Vice President, Chief Tax Officer and Assistant Treasurer | | 2008 | | Vice President, Chief Tax Officer and Assistant Treasurer, The Invesco Funds; Assistant Treasurer, Invesco Capital Management LLC, Invesco Exchange-Traded Fund Trust, Invesco Exchange-Traded Fund Trust II, Invesco India Exchange-Traded Fund Trust, Invesco Actively Managed Exchange-Traded Fund Trust, Invesco Actively Managed Exchange-Traded Commodity Fund Trust and Invesco Exchange-Traded Self-Indexed Fund Trust Formerly: Assistant Vice President, The Invesco Funds | | N/A | | N/A |
Crissie M. Wisdom — 1969 Anti-Money Laundering Compliance Officer | | 2013 | | Anti-Money Laundering Compliance Officer, Invesco Advisers, Inc. (formerly known as Invesco Institutional (N.A.), Inc.) (registered investment adviser), Invesco Capital Markets, Inc. (formerly known as Van Kampen Funds Inc.), Invesco Distributors, Inc., Invesco Investment Services, Inc., The Invesco Funds, and Invesco Exchange-Traded Fund Trust, Invesco Exchange-Traded Fund Trust II, Invesco India Exchange-Traded Fund Trust, Invesco Actively Managed Exchange-Traded Fund Trust, Invesco Actively Managed Exchange-Traded Commodity Fund Trust and Invesco Exchange-Traded Self-Indexed Fund Trust; Anti-Money Laundering Compliance Officer and Bank Secrecy Act Officer, INVESCO National Trust Company and Invesco Trust Company; and Fraud Prevention Manager and Controls and Risk Analysis Manager for Invesco Investment Services, Inc. Formerly: Anti-Money Laundering Compliance Officer, Van Kampen Exchange Corp. and Invesco Management Group, Inc. | | N/A | | N/A |
Robert R. Leveille — 1969 Chief Compliance Officer | | 2016 | | Chief Compliance Officer, Invesco Advisers, Inc. (registered investment adviser); and Chief Compliance Officer, The Invesco Funds Formerly: Chief Compliance Officer, Putnam Investments and the Putnam Funds | | N/A | | N/A |
The Statement of Additional Information of the Trust includes additional information about the Fund’s Trustees and is available upon request, without charge, by calling 1.800.959.4246. Please refer to the Fund’s Statement of Additional Information for information on the Fund’s sub-advisers.
| | | | | | |
Office of the Fund 11 Greenway Plaza, Suite 1000 Houston, TX 77046-1173 | | Investment Adviser Invesco Advisers, Inc. 1555 Peachtree Street, N.E. Atlanta, GA 30309 | | Distributor Invesco Distributors, Inc. 11 Greenway Plaza, Suite 1000 Houston, TX 77046-1173 | | Auditors PricewaterhouseCoopers LLP 1000 Louisiana Street, Suite 5800 Houston, TX 77002-5021 |
| | | |
| | | | | | |
Counsel to the Fund Stradley Ronon Stevens & Young, LLP 2005 Market Street, Suite 2600 Philadelphia, PA 19103-7018 | | Counsel to the Independent Trustees Goodwin Procter LLP 901 New York Avenue, N.W. Washington, D.C. 20001 | | Transfer Agent Invesco Investment Services, Inc. 11 Greenway Plaza, Suite 1000 Houston, TX 77046-1173 | | Custodian State Street Bank and Trust Company 225 Franklin Street Boston, MA 02110-2801 |
T-4 Invesco Global Core Equity Fund
Explore High-Conviction Investing with Invesco

Go paperless with eDelivery
Visit invesco.com/edelivery to enjoy the convenience and security of anytime electronic access to your investment documents.
With eDelivery, you can elect to have any or all of the following materials delivered straight to your inbox to download, save and print from your own computer:
| ∎ | | Fund reports and prospectuses |
Invesco mailing information
Send general correspondence to Invesco Investment Services, Inc., P.O. Box 219078, Kansas City, MO 64121-9078.
Important notice regarding delivery of security holder documents
To reduce Fund expenses, only one copy of most shareholder documents may be mailed to shareholders with multiple accounts at the same address (Householding). Mailing of your shareholder documents may be householded indefinitely unless you instruct us otherwise. If you do not want the mailing of these documents to be combined with those for other members of your household, please contact Invesco Investment Services, Inc. at 800 959 4246 or contact your financial institution. We will begin sending you individual copies for each account within 30 days after receiving your request.
Fund holdings and proxy voting information
The Fund provides a complete list of its holdings four times in each fiscal year, at the quarter ends. For the second and fourth quarters, the lists appear in the Fund’s semiannual and annual reports to shareholders. For the first and third quarters, the Fund files the lists with the Securities and Exchange Commission (SEC) on FormN-Q (or any successor Form). The most recent list of portfolio holdings is available at invesco.com/completeqtrholdings. Shareholders can also look up the Fund’s FormsN-Q (or any successor Form) on the SEC website at sec.gov. The SEC file numbers for the Fund are shown below.
A description of the policies and procedures that the Fund uses to determine how to vote proxies relating to portfolio securities is available without charge, upon request, from our Client Services department at 800 959 4246 or at invesco.com/proxyguidelines. The information is also available on the SEC website, sec.gov.
| | |
Information regarding how the Fund voted proxies related to its portfolio securities during the most recent12-month period ended June 30 is available at invesco.com/proxysearch. The information is also available on the SEC website, sec.gov. Invesco Advisers, Inc. is an investment adviser; it provides investment advisory services to individual and institutional clients and does not sell securities. Invesco Distributors, Inc. is the US distributor for Invesco Ltd.’s retail mutual funds, exchange-traded funds and institutional money market funds. Both are wholly owned, indirect subsidiaries of Invesco Ltd. | |  |
| | | | | | | | | | | | |
SEC file numbers: 811-01540 and 002-27334 | | Invesco Distributors, Inc. | | GCE-AR-1 | | | 02202019 | | | | 1001 | |
| | | | |
 | | Annual Report to Shareholders | | December 31, 2018 |
| | Invesco International Small Company Fund Nasdaq: A: IEGAX ∎ C: IEGCX ∎ Y: IEGYX ∎ R5: IEGIX ∎ R6: IEGFX |

Letters to Shareholders
| | | | |

Philip Taylor | | | | Dear Shareholders: This annual report includes information about your Fund, including performance data and a complete list of its investments as of the close of the reporting period. Inside is a discussion of how your Fund was managed and the factors that affected its performance during the reporting period. From record market highs to an explosive late-year downturn, 2018 was a memorable and volatile year for investors. US equity markets entered 2018 enthused by corporate tax cuts and improving global growth. Despite asell-off in February, several US equity indexes continued to redefine highs for the first three quarters of the year. The ebullience, however, ended in October as global equities, in particular US stocks, sold off sharply and continued this volatile downward spiral for the rest of the year. The catalyst for thesell-off was a combination of ongoing trade conflicts between the US and China, fears of a global economic slowdown and |
rising US interest rates. Gains posted earlier in the year were erased as most US and international equity indexes ended 2018 in negative territory. During the late-year equitysell-off, Treasury bonds, along with government and municipal bonds, rallied. In general, fixed income markets outperformed equity markets for the year as yields declined from earlier highs and, conversely, bond prices rose. Given the strong economy, the US Federal Reserve (the Fed) raised the federal funds rate four times in 2018. In December, however, the Fed delivered a more “dovish hike” by simultaneously raising rates while reducing guidance for 2019 rate increases from three to two. As 2019 unfolds, we’ll see how the interplay of interest rates, economic data, geopolitics and a host of other factors affect US and overseas equity and fixed income markets.
Short-term market volatility can prompt some investors to abandon their investment plans - and can cause others to settle for whatever returns the market has to offer. The investment professionals at Invesco, in contrast, invest with high conviction. This means that, no matter the asset class or the strategy, each investment team has a passion to exceed. We want to help investors achieve better outcomes, such as seeking higher returns, helping mitigate risk and generating income. Of course, investing with high conviction can’t guarantee a profit or ensure success; no investment strategy can. To learn more about how we invest with high conviction, visitinvesco.com/HighConviction.
You, too, can invest with high conviction by maintaining a long-term investment perspective and by working with your financial adviser on a regular basis. During periods of short-term market volatility or uncertainty, your financial adviser can keep you focused on your long-term investment goals - a new home, a child’s college education or a secure retirement. He or she also can share research about the economy, the markets and individual investment options.
Visit our website for more information on your investments
Our website,invesco.com/us, offers a wide range of market insights and investment perspectives. On the website, you’ll find detailed information about our funds, including performance, holdings and portfolio manager commentaries. You can access information about your account by completing a simple, secure online registration. To do so, select “Log In” on the right side of the homepage, and then select “Register for Individual Account Access.”
In addition to the resources accessible on our website and through our mobile app, you can obtain timely updates to help you stay informed about the markets and the economy by connecting with Invesco on Twitter, LinkedIn or Facebook. You can access our blog atblog.invesco.us.com. Our goal is to provide you the information you want, when and where you want it.
Finally, I’m pleased to share with you Invesco’s commitment to both the Principles for Responsible Investment and to considering environmental, social and governance issues in our robust investment process. I invite you to learn more atinvesco.com/esg.
Have questions?
For questions about your account, contact an Invesco client services representative at 800 959 4246.
All of us at Invesco look forward to serving your investment management needs. Thank you for investing with us.
Sincerely,

Philip Taylor
Senior Managing Director, Invesco Ltd.
2 Invesco International Small Company Fund
| | | | |

Bruce Crockett | | | | Dear Fellow Shareholders: Among the many important lessons I’ve learned in more than 40 years in a variety of business endeavors is the value of a trusted advocate. As independent chair of the Invesco Funds Board, I can assure you that the members of the Board are strong advocates for the interests of investors in Invesco’s mutual funds. We work hard to represent your interests through oversight of the quality of the investment management services your funds receive and other matters important to your investment, including but not limited to: ∎ Ensuring that Invesco offers a diverse lineup of mutual funds that your financial adviser can use to strive to meet your financial needs as your investment goals change over time. ∎ Monitoring how the portfolio management teams of the Invesco funds are performing in light of changing economic and market conditions. |
| ∎ | | Assessing each portfolio management team’s investment performance within the context of the investment strategy described in the fund’s prospectus. |
| ∎ | | Monitoring for potential conflicts of interests that may impact the nature of the services that your funds receive. |
We believe one of the most important services we provide our fund shareholders is the annual review of the funds’ advisory andsub-advisory contracts with Invesco Advisers and its affiliates. This review is required by the Investment Company Act of 1940 and focuses on the nature and quality of the services Invesco provides as the adviser to the Invesco funds and the reasonableness of the fees that it charges for those services. Each year, we spend months carefully reviewing information received from Invesco and a variety of independent sources, such as performance and fee data prepared by Lipper, Inc. (a subsidiary of Broadridge Financial Solutions, Inc.), an independent, third-party firm widely recognized as a leader in its field. We also meet with our independent legal counsel and other independent advisers to review and help us assess the information that we have received. Our goal is to assure that you receive quality investment management services for a reasonable fee.
I trust the measures outlined above provide assurance that you have a worthy advocate when it comes to choosing the Invesco Funds. On behalf of the Board, we look forward to continuing to represent your interests and serving your needs.
Sincerely,

Bruce L. Crockett
Independent Chair
Invesco Funds Board of Trustees
3 Invesco International Small Company Fund
Management’s Discussion of Fund Performance
Performance summary
For the year ended December 31, 2018, Class A shares of Invesco International Small Company Fund (the Fund), at net asset value (NAV), underperformed the MSCI All Country Worldex-U.S.A. Small Cap Index, the Fund’s broad market/style- specific benchmark.
Your Fund’s long-term performance appears later in this report.
Fund vs. Indexes
Total returns, 12/31/17 to 12/31/18, at net asset value (NAV). Performance shown does not include applicable contingent deferred sales charges (CDSC) orfront-end sales charges, which would have reduced performance.
| | | | | |
| Class A Shares | | | | -18.67 | % |
| Class C Shares | | | | -19.24 | |
| Class Y Shares | | | | -18.44 | |
| Class R5 Shares | | | | -18.41 | |
| Class R6 Shares | | | | -18.31 | |
| MSCI All Country Worldex-U.S.A. Small Cap Index▼ | | | | | |
| (Broad Market/Style-Specific Index) | | | | -18.20 | |
| Lipper InternationalSmall/Mid-Cap Core Funds Index⬛(Peer Group Index) | | | | -19.24 | |
Source(s):▼RIMES Technologies Corp.;⬛Lipper Inc.
Market conditions and your Fund
Calendar year 2018 proved to be an increasingly volatile time for global equities. After strong positive returns in January, global equities sold off sharply in February as rising inflation spurred concern that central banks would raise interest rates at a faster pace than previously expected. Through the rest of the first quarter, equity markets struggled to regain momentum, hampered by global trade tensions and weakness in technology stocks. Somewhat counterintuitively, emerging markets generally held up better than developed markets in this volatile environment.
Significant market and currency volatility continued during the second quarter of 2018. While most domestic equity indexes delivered positive performance for the second quarter, most major international indexes had negative results. Many international stocks struggled as investors worried that heightened global
trade tensions would derail economic growth. Other concerns such as geopolitical uncertainty and the potential impact of higher interest rates also weakened investor sentiment. In this environment, developed markets held up better than emerging markets. After a relatively quiet summer, market volatility markedly rose again in October. Global equity markets (particularly the US) declined sharply in the fourth quarter amid rising interest rates and concerns that higher inflation could result in a more restrictive monetary policy. Investors also had concerns over the Brexit negotiations, ongoingUS-China trade tensions, declining oil prices and fears of slowing economic growth, particularly in the eurozone.
Given signs of a strong economy, the US Federal Reserve (the Fed) raised interest rates four times during the year. Following December’s meeting, the Fed raised interest rates by 25 basis points and lowered guidance from three to two
rate hikes in 2019, signaling a slightly more dovish stance than expected.1 In contrast, the European Central Bank held rates steady, indicating it would do so at least through the summer of 2019; however, it announced that its bond buying program would be discontinued at year end. Central banks in several other countries maintained extraordinarily accommodative monetary policies, as well.
During the year, Fund holdings in the financials, industrials and consumer discretionary sectors outperformed those of the broad market/style-specific benchmark and were among the largest contributors to the Fund’s relative performance. Conversely, Fund holdings in the real estate, communication services and information technology sectors underperformed those of the broad market/style-specific benchmark and were the most significant detractors from the Fund’s relative performance. An underweight allocation to the real estate sector also hampered relative performance.
On a geographic basis, the Fund’s exposure to Romania (not represented in the MSCI All Country Worldex-U.S.A. Small Cap Index) and the Fund’s holdings in Mexico and Norway were among the most significant contributors to the Fund’s performance versus the broad market/style-specific benchmark for the year. The Fund’s overweight exposure to Mexico and Norway was supportive on a relative basis, as well. In contrast, the Fund’s holdings in the UK underperformed those of the broad market/style-specific benchmark and were the most significant detractors from relative performance. The Fund’s overweight exposure to the UK and South Africa was also a drag on relative performance.
The Fund’s cash position in a declining market environment was a meaningful contributor to performance versus the
| | | | | |
Portfolio Composition | |
| By sector | | % of total net assets |
| |
| Industrials | | | | 29.5 | % |
| Financials | | | | 18.7 | |
| Energy | | | | 8.1 | |
| Health Care | | | | 7.3 | |
| Information Technology | | | | 6.8 | |
| Consumer Discretionary | | | | 6.6 | |
| Consumer Staples | | | | 6.0 | |
| Real Estate | | | | 3.8 | |
| Communication Services | | | | 2.3 | |
Money Market Funds Plus Other Assets Less Liabilities | | | | 10.9 | |
| | | | | |
| Top 10 EquityHoldings* | | |
| | | % of total net assets |
| | | | | | | |
| | |
| 1. | | MorphoSys AG | | | | 3.6 | % |
| 2. | | Wilson Sons Ltd | | | | 3.6 | |
| 3. | | Calian Group Ltd | | | | 2.9 | |
| 4. | | Bolsa Mexicana de Valores SAB de CV | | | | 2.8 | |
| 5. | | Precia S.A. | | | | 2.6 | |
| 6. | | Danieli & C Officine Meccaniche SpA | | | | 2.5 | |
| 7. | | Eastern Tobacco | | | | 2.3 | |
| 8. | | DCC PLC | | | | 2.1 | |
| 9. | | Fondul Proprietatea S.A. | | | | 2.1 | |
| 10. | | Societatea Nationala de Gaze Naturale ROMGAZ S.A. | | | | 2.0 | |
| | | | | |
Total Net Assets | | | $ | 268.0 million | |
| |
| Total Number of Holdings* | | | | 69 | |
The Fund’s holdings are subject to change, and there is no assurance that the Fund will continue to hold any particular security.
*Excluding money market fund holdings.
Data presented here are as of December 31, 2018.
4 Invesco International Small Company Fund
broad market/style-specific benchmark for the year. It is important to note that similar to the Fund’s sector and regional allocations, cash is a residual of ourbottom-up investment process and is not the result of anytop-down tactical asset allocation or a risk-management allocation decision.
Oslo Bors VPS, owner and operator of the Norway-based Oslo Stock Exchange, was the Fund’s largest contributor during the year. The company was bolstered by the planned tender offer by the European stock exchange operator Euronext.
In contrast, Israel-basedTaptica International, a mobile advertising technology company, was among the most significant detractors from the Fund’s performance for the year. In early December, the company’s chief executive officer resigned and the company warned that its revenues would be below expectations due to lower-margin sales. Nonetheless, the stock is still attractively valued and has impressive returns and a net cash balance sheet.
During 2018, we continued to look for opportunities to improve the growth potential and quality of the Fund’s portfolio by adding companies based on our earnings, quality and valuation (EQV) outlook for each company. We added several new stocks to the portfolio, including Poland-based health care companyPolski Bank Komorek Macierzystych,UK-based gaming companyJPJ Group, Mexico-based airport services companyGrupo Aeroportuario del Centro Norte, Japan-based industrials companyNabtesco and three Poland-based asset managers,Skarbiec Holding, Quercus TFIand ALTUS Towarzystwo Funduszy Inwestycyjnych. Deteriorating fundamentals and/or valuations led to the sale of several securities, includingMajor Cineplex Group,Link Administration Holdings,China Biologic Products,Stalexport Autostrady andTrangaz.
As always, regardless of the macroeconomic environment, we remain focused on abottom-up investment approach of identifying attractive companies that fit ourEQV-focused investment process. We continue to look for high-quality companies that exhibit the following characteristics: strong organic growth, high returns on capital, pricing power, strong balance sheets, cash generation and reasonable valuations. In addition, we continue to favor companies that are able to consistently generate cash during weak economic environments. Our balancedEQV-focused approach aligns with our goal of delivering attractive returns over the long term.
We thank you for your continued investment in Invesco International Small Company Fund.
| 1 | Source: US Federal Reserve |
The views and opinions expressed in management’s discussion of Fund performance are those of Invesco Advisers, Inc. These views and opinions are subject to change at any time based on factors such as market and economic conditions. These views and opinions may not be relied upon as investment advice or recommendations, or as an offer for a particular security. The information is not a complete analysis of every aspect of any market, country, industry, security or the Fund. Statements of fact are from sources considered reliable, but Invesco Advisers, Inc. makes no representation or warranty as to their completeness or accuracy. Although historical performance is no guarantee of future results, these insights may help you understand our investment management philosophy.
See important Fund and, if applicable, index disclosures later in this report.
| | |
 | | Shuxin (Steve) Cao Chartered Financial Analyst, Portfolio Manager, is lead manager of Invesco International Small Company |
| Fund. He joined Invesco in 1997. Mr. Cao earned a BA in English from the Tianjin Foreign Language Institute and an MBA from Texas A&M University. He is also a Certified Public Accountant. |
| |
 | | Jason Holzer Chartered Financial Analyst, Portfolio Manager, is lead manager of Invesco International Small Company Fund. He joined Invesco in |
| 1996. Mr. Holzer earned a BA in quantitative economics and an MS in engineering economic systems from Stanford University. |
| |
 | | Borge Endresen Chartered Financial Analyst, Portfolio Manager, is manager of Invesco International Small Company Fund. He joined Invesco in |
| 1999. Mr. Endresen earned a BS in finance from the University of Oregon and an MBA from The University of Texas at Austin. |
5 Invesco International Small Company Fund
Your Fund’s Long-Term Performance
Results of a $10,000 Investment - Oldest Share Class(es)
Fund and index data from 12/31/08
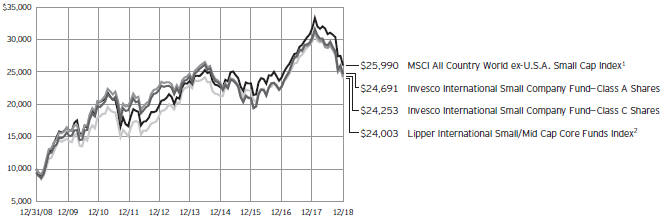
| 1 | Source: RIMES Technologies Corp. |
Past performance cannot guarantee comparable future results.
The data shown in the chart include reinvested distributions, applicable sales charges and Fund expenses including management fees. Index results include reinvested dividends, but they do not reflect sales charges. Performance of the
peer group, if applicable, reflects fund expenses and management fees; performance of a market index does not. Performance shown in the chart and table(s) does not reflect deduction of taxes a shareholder would pay on Fund distributions or sale of Fund shares.
6 Invesco International Small Company Fund
| | | | | |
Average Annual Total Returns | | | | | |
| As of 12/31/18, including maximum applicable sales charges | | | | | |
| | | | | |
| |
| Class A Shares | | | | | |
| Inception (8/31/00) | | | | 7.86 | % |
| 10 Years | | | | 9.46 | |
| 5 Years | | | | -0.79 | |
| 1 Year | | | | -23.16 | |
| |
| Class C Shares | | | | | |
| Inception (8/31/00) | | | | 7.41 | % |
| 10 Years | | | | 9.26 | |
| 5 Years | | | | -0.40 | |
| 1 Year | | | | -20.02 | |
| |
| Class Y Shares | | | | | |
| Inception (10/3/08) | | | | 7.31 | % |
| 10 Years | | | | 10.35 | |
| 5 Years | | | | 0.59 | |
| 1 Year | | | | -18.44 | |
| |
| Class R5 Shares | | | | | |
| Inception (10/25/05) | | | | 6.63 | % |
| 10 Years | | | | 10.50 | |
| 5 Years | | | | 0.69 | |
| 1 Year | | | | -18.41 | |
| |
| Class R6 Shares | | | | | |
| 10 Years | | | | 10.37 | % |
| 5 Years | | | | 0.77 | |
| 1 Year | | | | -18.31 | |
Class R6 shares incepted on September 24, 2012. Performance shown prior to that date is that of Class A shares and includes the12b-1 fees applicable to Class A shares.
The performance data quoted represent past performance and cannot guarantee comparable future results; current performance may be lower or higher. Please visit invesco.com/performance for the most recentmonth-end performance. Performance figures reflect reinvested distributions, changes in net asset value and the effect of the maximum sales charge unless otherwise stated. Investment return and principal value will fluctuate so that you may have a gain or loss when you sell shares.
The net annual Fund operating expense ratio set forth in the most recent Fund prospectus as of the date of this report for Class A, Class C, Class Y, Class R5 and Class R6 shares was 1.60%, 2.35%, 1.35%, 1.26% and 1.17%, respectively.1 The total annual Fund operating expense ratio set forth in the most recent Fund prospectus as of the date of this report for Class A,
Class C, Class Y, Class R5 and Class R6 shares was 1.61%, 2.36%, 1.36%, 1.27% and 1.18%, respectively. The expense ratios presented above may vary from the expense ratios presented in other sections of this report that are based on expenses incurred during the period covered by this report.
Class A share performance reflects the maximum 5.50% sales charge, and Class C share performance reflects the applicable contingent deferred sales charge (CDSC) for the period involved. The CDSC on Class C shares is 1% for the first year after purchase. Class Y, Class R5 and Class R6 shares do not have afront-end sales charge or a CDSC; therefore, performance is at net asset value.
The performance of the Fund’s share classes will differ primarily due to different sales charge structures and class expenses.
Fund performance reflects any applicable fee waivers and/or expense reimbursements. Had the adviser not waived fees and/or reimbursed expenses currently or in the past, returns would have been lower. See current prospectus for more information.
| 1 | Total annual Fund operating expenses after any contractual fee waivers and/or expense reimbursements by the adviser in effect through at least June 30, 2020. See current prospectus for more information. |
7 Invesco International Small Company Fund
Invesco International Small Company Fund’s investment objective is long-term growth of capital.
| ∎ | | Unless otherwise stated, information presented in this report is as of December 31, 2018, and is based on total net assets. |
| ∎ | | Unless otherwise noted, all data provided by Invesco. |
| ∎ | | To access your Fund’s reports/prospectus, visit invesco.com/fundreports. |
About share classes
| ∎ | | Class Y shares are available to only certain investors. Please see the prospectus for more information. |
| ∎ | | Class R5 shares andClass R6 shares are available for use by retirement plans that meet certain standards and for institutional investors. Class R6 shares are also available through intermediaries that have established an agreement with Invesco Distributors, Inc. to make such shares available for use in retail omnibus accounts. Please see the prospectus for more information. |
Principal risks of investing in the Fund
| ∎ | | Cash/cash equivalents risk.In rising markets, holding cash or cash equivalents will negatively affect the Fund’s performance relative to its benchmark. |
| ∎ | | Depositary receipts risk.Investing in depositary receipts involves the same risks as direct investments in foreign securities. In addition, the underlying issuers of certain depositary receipts are under no obligation to distribute shareholder communications or pass through any voting rights with respect to the deposited securities to the holders of such receipts. The Fund may therefore receive less timely information or have less control than if it invested directly in the foreign issuer. |
| ∎ | | Derivatives risk.The value of a derivative instrument depends largely on (and is derived from) the value of an underlying security, currency, commodity, interest rate, index or other asset (each referred to as an underlying asset). In addition to risks relating to the underlying assets, the use of derivatives may include other, possibly greater, risks, including counterparty, leverage and liquidity risks. Counterparty risk is the risk that the counterparty to the derivative contract will default on its obligation to pay the Fund the amount owed or otherwise perform under the derivative contract. Derivatives create leverage risk because |
| | | they do not require payment up front equal to the economic exposure created by holding a position in the derivative. As a result, an adverse change in the value of the underlying asset could result in the Fund sustaining a loss that is substantially greater than the amount invested in the derivative or the anticipated value of the underlying asset, which may make the Fund’s returns more volatile and increase the risk of loss. Derivative instruments may also be less liquid than more traditional investments and the Fund may be unable to sell or close out its derivative positions at a desirable time or price. This risk may be more acute under adverse market conditions, during which the Fund may be most in need of liquidating its derivative positions. Derivatives may also be harder to value, less tax efficient and subject to changing government regulation that could impact the Fund’s ability to use certain derivatives or their cost. Derivatives strategies may not always be successful. For example, derivatives used for hedging or to gain or limit exposure to a particular market segment may not provide the expected benefits, particularly during adverse market conditions. |
| ∎ | | Emerging markets securities risk. Emerging markets (also referred to as developing markets) are generally subject to greater market volatility, political, social and economic instability, uncertain trading markets and more governmental limitations on foreign investment than more developed markets. In addition, companies operating in emerging markets may be subject to lower trading volume and greater price fluctuations than companies in more developed markets. Securities law and the enforcement of systems of taxation in many emerging market countries may change quickly and unpredictably. The Fund’s investments in ChinaA- shares are subject to trading restrictions, quota limitations and clearing and settlement risks. In addition, investments in emerging markets securities |
This report must be accompanied or preceded by a currently effective Fund prospectus, which contains more complete information, including sales charges and expenses. Investors should read it carefully before investing.
NOT FDIC INSURED | MAY LOSE VALUE | NO BANK GUARANTEE
| | | may also be subject to additional transaction costs, delays in settlement procedures, and lack of timely information. |
| ∎ | | Foreign securities risk.The Fund’s foreign investments may be adversely affected by political and social instability, changes in economic or taxation policies, difficulty in enforcing obligations, decreased liquidity or increased volatility. Foreign investments also involve the risk of the possible seizure, nationalization or expropriation of the issuer or foreign deposits (in which the Fund could lose its entire investments in a certain market) and the possible adoption of foreign governmental restrictions such as exchange controls. Unless the Fund has hedged its foreign securities risk, foreign securities risk also involves the risk of negative foreign currency rate fluctuations, which may cause the value of securities denominated in such foreign currency (or other instruments through which the Fund has exposure to foreign currencies) to decline in value. Currency exchange rates may fluctuate significantly over short periods of time. Currency hedging strategies, if used, are not always successful. |
| ∎ | | Geographic focus risk.The Fund may from time to time invest a substantial amount of its assets in securities of issuers located in a single country or a limited number of countries. Adverse economic, political or social conditions in those countries may therefore have a significant negative impact on the Fund’s investment performance. |
| ∎ | | Growth investing risk.Growth stocks tend to be more expensive relative to the issuing company’s earnings or assets compared with other types of stock. As a result, they tend to be more sensitive to changes in, or investors’ expectations of, the issuing company’s earnings and can be more volatile. |
| ∎ | | Investing in the European Union risk.Investments in certain countries in the European Union are susceptible to high economic risks associated with high levels of debt, such as investments in sovereign debt of Greece, Italy and Spain. Efforts of the member states to further unify their economic and monetary policies may increase the potential for the downward movement of one member state’s market to cause a similar |
8 Invesco International Small Company Fund
| | effect on other member states’ markets. Separately, the European Union faces issues involving its membership, structure, procedures and policies. The exit of one or more member states from the European Union, such as the United Kingdom (UK) which has announced its intention to exit, would place its currency and banking system in jeopardy. The exit by the UK or other member states will likely result in increased volatility, illiquidity and potentially lower economic growth in the affected markets, which will adversely affect the Fund’s investments. |
| ∎ | | Management risk.The Fund is actively managed and depends heavily on the Adviser’s judgment about markets, interest rates or the attractiveness, relative values, liquidity, or potential appreciation of particular investments made for the Fund’s portfolio. The Fund could experience losses if these judgments prove to be incorrect. Additionally, legislative, regulatory, or tax developments may adversely affect management of the Fund and, therefore, the ability of the Fund to achieve its investment objective. |
| ∎ | | Market risk.The market values of the Fund’s investments, and therefore the value of the Fund’s shares, will go up and down, sometimes rapidly or unpredictably. Market risk may affect a single issuer, industry or section of the economy, or it may affect the market as a whole. Individual stock prices tend to go up and down more dramatically than those of certain other types of investments, such as bonds. During a general downturn in the financial markets, multiple asset classes may decline in value. When markets perform well, there can be no assurance that specific investments held by the Fund will rise in value. |
| ∎ | | Preferred securities risk.Preferred securities are subject to issuer-specific and market risks applicable generally to equity securities. Preferred securities also may be subordinated to bonds or other debt instruments, subjecting them to a greater risk ofnon-payment, may be less liquid than many other securities, such as common stocks, and generally offer no voting rights with respect to the issuer. |
| ∎ | | Sector focus risk.The Fund may from time to time invest a significant amount of its assets (i.e. over 25%) in one market sector or group of related industries. In this event, the Fund’s performance will depend to a greater extent on the overall condition of the sector or group of industries and there is increased risk that the Fund will lose significant value if conditions adversely affect that sector or group of industries. |
| ∎ | | Small- andmid-capitalization companies risks.Small- andmid-capitalization companies tend to be more vulnerable to changing market conditions, may have little or no operating history or track record of success, and may have more limited product lines and markets, less experienced management and fewer financial resources than larger companies. These companies’ securities may be more volatile and less liquid than those of more established companies, and their returns may vary, sometimes significantly, from the overall securities market. |
About indexes used in this report
| ∎ | | TheMSCI All Country Worldex-U.S.A. Small Cap Index represents the performance ofsmall-cap stocks in developed and emerging markets, excluding the US. The index is computed using the net return, which withholds applicable taxes fornon-resident investors. |
| ∎ | | TheLipper InternationalSmall/Mid-Cap Core Funds Index is an unmanaged index considered representative of internationalsmall/mid-cap core funds tracked by Lipper. |
| ∎ | | The Fund is not managed to track the performance of any particular index, including the index(es) described here, and consequently, the performance of the Fund may deviate significantly from the performance of the index(es). |
| ∎ | | A direct investment cannot be made in an index. Unless otherwise indicated, index results include reinvested dividends, and they do not reflect sales charges. Performance of the peer group, if applicable, reflects fund expenses; performance of a market index does not. |
Other information
| ∎ | | CPA® and Certified Public Accountant® are trademarks owned by the American Institute of Certified Public Accountants. |
| ∎ | | The returns shown in management’s discussion of Fund performance are based on net asset values (NAVs) calculated for shareholder transactions. Generally accepted accounting principles require adjustments to be made to the net assets of the Fund at period end for financial reporting purposes, and as such, the NAVs for shareholder transactions and the returns based on those NAVs may differ from the NAVs and returns reported in the Financial Highlights. |
| ∎ | | Industry classifications used in this report are generally according to the Global Industry Classification Standard, which was developed by and is the exclusive property and a service mark of MSCI Inc. and Standard & Poor’s. |
9 Invesco International Small Company Fund
Schedule of Investments
December 31, 2018
| | | | | | | | |
| | | Shares | | | Value | |
Common Stocks & Other Equity Interests–89.14% | |
| Australia–0.97% | | | | | | | | |
Tassal Group Ltd. | | | 832,143 | | | $ | 2,590,650 | |
|
| Brazil–6.15% | |
Fleury S.A. | | | 967,700 | | | | 4,964,499 | |
TOTVS S.A. | | | 284,800 | | | | 1,995,051 | |
Wilson Sons Ltd.–BDR | | | 922,700 | | | | 9,522,802 | |
| | | | | | | | 16,482,352 | |
|
| Canada–10.96% | |
Calian Group Ltd. | | | 367,000 | | | | 7,903,457 | |
E-L Financial Corp. Ltd. | | | 9,400 | | | | 5,067,683 | |
Epsilon Energy Ltd.(a) | | | 947,280 | | | | 4,156,319 | |
Total Energy Services Inc. | | | 722,190 | | | | 5,168,324 | |
TransGlobe Energy Corp. | | | 2,841,269 | | | | 5,286,276 | |
Trican Well Service Ltd.(a) | | | 2,041,808 | | | | 1,779,777 | |
| | | | | | | | 29,361,836 | |
|
| Egypt–2.31% | |
Eastern Tobacco | | | 6,809,400 | | | | 6,182,068 | |
|
| Estonia–0.93% | |
Silvano Fashion Group AS–Class A | | | 937,000 | | | | 2,485,168 | |
|
| France–9.48% | |
Aures Technologies S.A. | | | 67,164 | | | | 2,260,342 | |
Caisse Regionale de Credit Agricole Mutuel Nord de France–CCI | | | 206,000 | | | | 5,239,743 | |
Constructions Industrielles de la Mediterranee S.A. | | | 25,804 | | | | 2,424,324 | |
Kaufman & Broad S.A. | | | 45,500 | | | | 1,737,351 | |
Linedata Services | | | 58,928 | | | | 2,126,777 | |
Metropole Television S.A. | | | 203,770 | | | | 3,271,092 | |
Precia S.A.(b) | | | 35,321 | | | | 6,839,265 | |
Tessi S.A.(a) | | | 11,400 | | | | 1,512,353 | |
| | | | | | | | 25,411,247 | |
|
| Germany–4.10% | |
MorphoSys AG(a) | | | 93,659 | | | | 9,545,204 | |
Takkt AG | | | 93,000 | | | | 1,448,008 | |
| | | | | | | | 10,993,212 | |
|
| Greece–2.12% | |
European Reliance General Insurance Co. S.A. | | | 605,000 | | | | 2,363,739 | |
Mytilineos Holdings S.A. | | | 397,000 | | | | 3,306,295 | |
| | | | | | | | 5,670,034 | |
|
| Indonesia–1.83% | |
PT Pakuwon Jati Tbk | | | 113,792,500 | | | | 4,906,213 | |
|
| Ireland–1.94% | |
Origin Enterprises PLC | | | 405,000 | | | | 2,658,884 | |
Total Produce PLC | | | 1,570,000 | | | | 2,545,340 | |
| | | | | | | | 5,204,224 | |
| | | | | | | | |
| | | Shares | | | Value | |
| Israel–2.42% | |
Israel Discount Bank Ltd.–Class A | | | 1,490,000 | | | $ | 4,591,902 | |
Taptica international Ltd. | | | 925,000 | | | | 1,886,408 | |
| | | | | | | | 6,478,310 | |
|
| Italy–3.61% | |
Danieli & C Officine Meccaniche S.p.A.–Savings Shares | | | 458,910 | | | | 6,782,768 | |
Openjobmetis Spa agenzia per il lavoro(a) | | | 314,146 | | | | 2,879,461 | |
| | | | | | | | 9,662,229 | |
|
| Japan–1.88% | |
Nabtesco Corp. | | | 155,800 | | | | 3,352,185 | |
Nippon Ceramic Co. Ltd. | | | 79,200 | | | | 1,679,287 | |
| | | | | | | | 5,031,472 | |
|
| Malaysia–0.83% | |
Heineken Malaysia Bhd | | | 451,200 | | | | 2,233,890 | |
|
| Mexico–4.38% | |
Bolsa Mexicana de Valores, S.A.B. de C.V. | | | 4,325,494 | | | | 7,373,595 | |
Grupo Aeroportuario del Centro Norte, S.A.B. de C.V. | | | 915,166 | | | | 4,367,724 | |
| | | | | | | | 11,741,319 | |
|
| Netherlands–0.72% | |
Aalberts Industries N.V. | | | 58,546 | | | | 1,938,371 | |
|
| New Zealand–2.29% | |
Freightways Ltd. | | | 535,199 | | | | 2,640,308 | |
Trade Me Group Ltd. | | | 833,126 | | | | 3,503,269 | |
| | | | | | | | 6,143,577 | |
|
| Norway–2.42% | |
Kongsberg Gruppen ASA | | | 232,378 | | | | 3,160,545 | |
Oslo Bors VPS Holding ASA | | | 207,300 | | | | 3,332,528 | |
| | | | | | | | 6,493,073 | |
|
| Poland–2.21% | |
Altus Towarzystwo Funduszy Inwestycyjnych S.A. | | | 700,000 | | | | 400,283 | |
Polski Bank Komorek Macierzystych S.A.(b) | | | 247,000 | | | | 3,828,076 | |
Quercus TFI S.A.(a) | | | 1,250,000 | | | | 751,533 | |
Skarbiec Holding S.A. | | | 166,000 | | | | 935,936 | |
| | | | | | | | 5,915,828 | |
|
| Romania–5.90% | |
Banca Transilvania S.A. | | | 9,537,656 | | | | 4,707,779 | |
Fondul Proprietatea S.A. | | | 26,265,596 | | | | 5,709,631 | |
Societatea Nationala de Gaze Naturale ROMGAZ S.A. | | | 786,000 | | | | 5,379,321 | |
| | | | | | | | 15,796,731 | |
|
| South Africa–2.23% | |
Cartrack Holdings Ltd. | | | 1,500,000 | | | | 1,490,878 | |
Combined Motor Holdings Ltd. | | | 1,638,000 | | | | 2,537,690 | |
See accompanying Notes to Financial Statements which are an integral part of the financial statements.
10 Invesco International Small Company Fund
| | | | | | | | |
| | | Shares | | | Value | |
| South Africa–(continued) | |
Net 1 UEPS Technologies, Inc.(a) | | | 415,000 | | | $ | 1,946,350 | |
| | | | | | | | 5,974,918 | |
|
| Sweden–1.18% | |
Vitec Software Group AB | | | 360,000 | | | | 3,151,998 | |
|
| Switzerland–0.91% | |
Kardex AG | | | 21,300 | | | | 2,451,272 | |
|
| Turkey–0.41% | |
AG Anadolu Grubu Holding A.S. | | | 573,400 | | | | 1,109,422 | |
|
| United Kingdom–16.96% | |
Bioventix PLC | | | 32,000 | | | | 1,250,128 | |
Character Group PLC (The) | | | 440,000 | | | | 3,028,449 | |
Clarkson PLC | | | 142,000 | | | | 3,438,870 | |
DCC PLC | | | 75,551 | | | | 5,743,209 | |
Eurocell PLC | | | 1,131,000 | | | | 3,084,965 | |
Goodwin PLC | | | 46,301 | | | | 1,487,184 | |
HomeServe PLC | | | 327,805 | | | | 3,601,190 | |
IG Group Holdings PLC | | | 300,791 | | | | 2,180,950 | |
JPJ Group PLC(a) | | | 369,000 | | | | 3,000,688 | |
Jupiter Fund Management PLC | | | 873,948 | | | | 3,288,333 | |
| | | | | | | | |
| | | Shares | | | Value | |
| United Kingdom–(continued) | |
Micro Focus International PLC | | | 115,339 | | | $ | 2,015,893 | |
Mortgage Advice Bureau Holdings Ltd. | | | 615,000 | | | | 4,036,976 | |
Savills PLC | | | 591,866 | | | | 5,318,273 | |
Staffline Group PLC | | | 183,000 | | | | 2,892,322 | |
System1 Group PLC | | | 400,000 | | | | 1,091,271 | |
| | | | | | | | 45,458,701 | |
Total Common Stocks & Other Equity Interests
(Cost $234,043,165) | | | | 238,868,115 | |
| | |
Money Market Funds–9.88% | | | | | | | | |
Invesco Government & Agency Portfolio–Institutional Class, 2.30%(c) | | | 9,268,467 | | | | 9,268,467 | |
Invesco Liquid Assets Portfolio–Institutional Class, 2.48%(c) | | | 6,619,036 | | | | 6,619,698 | |
Invesco Treasury Portfolio–Institutional Class, 2.30%(c) | | | 10,592,534 | | | | 10,592,534 | |
Total Money Market Funds (Cost $26,480,995) | | | | | | | 26,480,699 | |
TOTAL INVESTMENTS IN SECURITIES–99.02%
(Cost $260,524,160) | | | | 265,348,814 | |
OTHER ASSETS LESS LIABILITIES–0.98% | | | | | | | 2,632,309 | |
NET ASSETS–100.00% | | | | | | $ | 267,981,123 | |
Investment Abbreviations:
| | |
| BDR | | – British Deposit Receipt |
Notes to Schedule of Investments:
| (a) | Non-income producing security. |
| (b) | Affiliated company during the period. The Investment Company Act of 1940 defines an “affiliated person” as an issuance in which a fund holds 5% or more of the outstanding voting securities. The Fund has not owned enough of the outstanding voting securities of the issuer to have control (as defined in the Investment Company Act of 1940) of that issuer. The aggregate value of these securities as of December 31, 2018 was $10,667,341, which represents 3.98% of the Fund’s Net Assets. See Note 4. |
| (c) | The money market fund and the Fund are affiliated by having the same investment adviser. The rate shown is the7-day SEC standardized yield as of December 31, 2018. |
See accompanying Notes to Financial Statements which are an integral part of the financial statements.
11 Invesco International Small Company Fund
Statement of Assets and Liabilities
December 31, 2018
| | | | |
Assets: | | | | |
Investments in securities, at value (Cost $224,829,367) | | $ | 228,200,774 | |
Investments in affiliates, at value (Cost $35,694,793) | | | 37,148,040 | |
Cash | | | 55,801 | |
Foreign currencies, at value (Cost $725,574) | | | 701,251 | |
Receivable for: | | | | |
Investments sold | | | 1,886,176 | |
Fund shares sold | | | 627,598 | |
Dividends | | | 605,168 | |
Investment for trustee deferred compensation and retirement plans | | | 116,194 | |
Other assets | | | 32,892 | |
Total assets | | | 269,373,894 | |
| |
Liabilities: | | | | |
Payable for: | | | | |
Fund shares reacquired | | | 971,728 | |
Accrued foreign taxes | | | 30,073 | |
Accrued fees to affiliates | | | 110,216 | |
Accrued trustees’ and officers’ fees and benefits | | | 4,691 | |
Accrued other operating expenses | | | 148,389 | |
Trustee deferred compensation and retirement plans | | | 127,674 | |
Total liabilities | | | 1,392,771 | |
Net assets applicable to shares outstanding | | $ | 267,981,123 | |
| |
Net assets consist of: | | | | |
Shares of beneficial interest | | $ | 262,113,109 | |
Distributable earnings | | | 5,868,014 | |
| | | $ | 267,981,123 | |
| | | | |
Net Assets: | | | | |
Class A | | $ | 131,610,143 | |
Class C | | $ | 12,844,566 | |
Class Y | | $ | 42,877,938 | |
Class R5 | | $ | 5,058,642 | |
Class R6 | | $ | 75,589,834 | |
|
Shares outstanding, no par value,
with an unlimited number of shares authorized: | |
Class A | | | 8,690,780 | |
Class C | | | 891,661 | |
Class Y | | | 2,828,909 | |
Class R5 | | | 336,945 | |
Class R6 | | | 5,039,222 | |
Class A: | | | | |
Net asset value per share | | $ | 15.14 | |
Maximum offering price per share | | | | |
(Net asset value of $15.14¸ 94.50% | | $ | 16.02 | |
Class C: | | | | |
Net asset value and offering price per share | | $ | 14.41 | |
Class Y: | | | | |
Net asset value and offering price per share | | $ | 15.16 | |
Class R5: | | | | |
Net asset value and offering price per share | | $ | 15.01 | |
Class R6: | | | | |
Net asset value and offering price per share | | $ | 15.00 | |
See accompanying Notes to Financial Statements which are an integral part of the financial statements.
12 Invesco International Small Company Fund
Statement of Operations
For the year ended December 31, 2018
| | | | |
Investment income: | | | | |
Dividends (net of foreign withholding taxes of $975,230) | | $ | 10,927,693 | |
Dividends from affiliates | | | 643,872 | |
Total investment income | | | 11,571,565 | |
| |
Expenses: | | | | |
Advisory fees | | | 2,968,827 | |
Administrative services fees | | | 93,813 | |
Custodian fees | | | 213,449 | |
Distribution fees: | | | | |
Class A | | | 397,113 | |
Class B | | | 297 | |
Class C | | | 176,208 | |
Transfer agent fees — A, B, C and Y | | | 444,436 | |
Transfer agent fees — R5 | | | 5,933 | |
Transfer agent fees — R6 | | | 26,610 | |
Trustees’ and officers’ fees and benefits | | | 24,686 | |
Registration and filing fees | | | 101,609 | |
Reports to shareholders | | | 66,994 | |
Professional services fees | | | 78,045 | |
Other | | | 29,659 | |
Total expenses | | | 4,627,679 | |
Less: Fees waived, expenses reimbursed and expense offset arrangement(s) | | | (38,087 | ) |
Net expenses | | | 4,589,592 | |
Net investment income | | | 6,981,973 | |
| |
Realized and unrealized gain (loss): | | | | |
Net realized gain (loss) from: | | | | |
Investment securities (net of foreign taxes of $177,871) | | | 6,440,000 | |
Foreign currencies | | | (248,823 | ) |
| | | | 6,191,177 | |
Change in net unrealized appreciation (depreciation) of: | | | | |
Investment securities (net of foreign taxes of $175,392) | | | (74,757,518 | ) |
Foreign currencies | | | (4,063 | ) |
| | | | (74,761,581 | ) |
Net realized and unrealized gain (loss) | | | (68,570,404 | ) |
Net increase (decrease) in net assets resulting from operations | | $ | (61,588,431 | ) |
See accompanying Notes to Financial Statements which are an integral part of the financial statements.
13 Invesco International Small Company Fund
Statement of Changes in Net Assets
For the years ended December 31, 2018 and 2017
| | | | | | | | |
| | | 2018 | | | 2017 | |
Operations: | | | | | | | | |
Net investment income | | $ | 6,981,973 | | | $ | 4,441,966 | |
Net realized gain | | | 6,191,177 | | | | 17,890,275 | |
Change in net unrealized appreciation (depreciation) | | | (74,761,581 | ) | | | 56,098,999 | |
Net increase (decrease) in net assets resulting from operations | | | (61,588,431 | ) | | | 78,431,240 | |
| | |
Distributions to shareholders from distributable earnings(1): | | | | | | | | |
Class A | | | (4,934,523 | ) | | | (9,582,476 | ) |
Class B | | | — | | | | (25,076 | ) |
Class C | | | (394,275 | ) | | | (1,096,369 | ) |
Class Y | | | (1,766,872 | ) | | | (3,728,144 | ) |
Class R5 | | | (211,877 | ) | | | (392,547 | ), |
Class R6 | | | (3,199,904 | ) | | | (5,183,213 | ) |
Total distributions from distributable earnings | | | (10,507,451 | ) | | | (20,007,825 | ) |
| | |
Share transactions–net: | | | | | | | | |
Class A | | | 4,844,762 | | | | 10,540,419 | |
Class B | | | (433,608 | ) | | | (734,869 | ) |
Class C | | | (3,150,858 | ) | | | 331,036 | |
Class Y | | | (8,298,732 | ) | | | (13,819,859 | ) |
Class R5 | | | (38,732 | ) | | | (5,760,686 | ) |
Class R6 | | | 13,530,491 | | | | 62,763,225 | |
Net increase in net assets resulting from share transactions | | | 6,453,323 | | | | 53,319,266 | |
Net increase (decrease) in net assets | | | (65,642,559 | ) | | | 111,742,681 | |
| | |
Net assets: | | | | | | | | |
Beginning of year | | | 333,623,682 | | | | 221,881,001 | |
End of year | | $ | 267,981,123 | | | $ | 333,623,682 | |
| (1) | For the year ended December 31, 2017, distributions to shareholders from distributable earnings consisted of distributions from net investment income and distributions from net realized gains. The Securities and Exchange Commission eliminated the requirement to disclose distribution components separately, except for tax return of capital. For the year ended December 31, 2017, distributions from net investment income were $4,079,768, $8,912, $389,742, $1,662,515, $177,866 and $2,387,347 and distributions from net realized gains were $5,502,708, $16,164, $706,627, $2,065,629, $214,681 and $2,795,866 for Class A, Class B, Class C, Class Y, Class R5 and Class R6 shares, respectively. |
Notes to Financial Statements
December 31, 2018
NOTE 1—Significant Accounting Policies
Invesco International Small Company Fund (the “Fund”) is a series portfolio of AIM Funds Group (Invesco Funds Group) (the “Trust”). The Trust is a Delaware statutory trust registered under the Investment Company Act of 1940, as amended (the “1940 Act”), as an open-end series management investment company authorized to issue an unlimited number of shares of beneficial interest. Information presented in these financial statements pertains only to the Fund. Matters affecting the Fund or each class will be voted on exclusively by the shareholders of the Fund or each class.
The Fund’s investment objective islong-term growth of capital.
The Fund currently consists of five different classes of shares: Class A, Class C, Class Y, Class R5 and Class R6. Class Y shares are available only to certain investors. Class A shares are sold with a front-end sales charge unless certain waiver criteria are met. Under certain circumstances, load waived shares may be subject to contingent deferred sales charges (“CDSC”). Class C shares are sold with a CDSC. Class Y, Class R5 and Class R6 shares are sold at net asset value. Effective November 30, 2010, new or additional investments in Class B shares are no longer permitted. Existing shareholders of Class B shares were permitted to continue to reinvest dividends and capital gains distributions in Class B shares until their conversion to Class A shares. Also, shareholders in Class B shares were able to exchange those shares for Class B shares of other Invesco Funds offering such shares until they converted to Class A shares. Generally, Class B shares automatically converted to Class A shares on or about the month-end, which was at least eight years after the date of purchase. Redemptions of Class B shares prior to the conversion date were subject to a CDSC. Effective January 26, 2018, all of the Fund’s outstanding Class B shares were converted to Class A shares, in advance of their normally scheduled conversion. No CDSC was paid in connection with this early conversion.
As of the open of business on September 11, 2015, the Fund has opened public sales of its shares to all investors.
The Fund is an investment company and accordingly follows the investment company accounting and reporting guidance in accordance with Financial Accounting Standards Board Accounting Standards Codification Topic 946,Financial Services — Investment Companies.
14 Invesco International Small Company Fund
The following is a summary of the significant accounting policies followed by the Fund in the preparation of its financial statements.
| A. | Security Valuations— Securities, including restricted securities, are valued according to the following policy. |
A security listed or traded on an exchange (except convertible securities) is valued at its last sales price or official closing price as of the close of the customary trading session on the exchange where the security is principally traded, or lacking any sales or official closing price on a particular day, the security may be valued at the closing bid price on that day. Securities traded in theover-the-counter market are valued based on prices furnished by independent pricing services or market makers. When such securities are valued by an independent pricing service they may be considered fair valued. Futures contracts are valued at the final settlement price set by an exchange on which they are principally traded. Listed options are valued at the mean between the last bid and asked prices from the exchange on which they are principally traded. Options not listed on an exchange are valued by an independent source at the mean between the last bid and asked prices. For purposes of determining net asset value (“NAV”) per share, futures and option contracts generally are valued 15 minutes after the close of the customary trading session of the New York Stock Exchange (“NYSE”).
Investments in open-end and closed-end registered investment companies that do not trade on an exchange are valued at theend-of-day net asset value per share. Investments in open-end and closed-end registered investment companies that trade on an exchange are valued at the last sales price or official closing price as of the close of the customary trading session on the exchange where the security is principally traded.
Debt obligations (including convertible securities) and unlisted equities are fair valued using an evaluated quote provided by an independent pricing service. Evaluated quotes provided by the pricing service may be determined without exclusive reliance on quoted prices, and may reflect appropriate factors such as institution-size trading in similar groups of securities, developments related to specific securities, dividend rate (for unlisted equities), yield (for debt obligations), quality, type of issue, coupon rate (for debt obligations), maturity (for debt obligations), individual trading characteristics and other market data. Pricing services generally value debt obligations assuming orderly transactions of institutional round lot size, but a fund may hold or transact in the same securities in smaller, odd lot sizes. Odd lots often trade at lower prices than institutional round lots. Debt obligations are subject to interest rate and credit risks. In addition, all debt obligations involve some risk of default with respect to interest and/or principal payments.
Foreign securities’ (including foreign exchange contracts) prices are converted into U.S. dollar amounts using the applicable exchange rates as of the close of the NYSE. If market quotations are available and reliable for foreign exchange-traded equity securities, the securities will be valued at the market quotations. Because trading hours for certain foreign securities end before the close of the NYSE, closing market quotations may become unreliable. If between the time trading ends on a particular security and the close of the customary trading session on the NYSE, events occur that the investment adviser determines are significant and make the closing price unreliable, the Fund may fair value the security. If the event is likely to have affected the closing price of the security, the security will be valued at fair value in good faith using procedures approved by the Board of Trustees. Adjustments to closing prices to reflect fair value may also be based on a screening process of an independent pricing service to indicate the degree of certainty, based on historical data, that the closing price in the principal market where a foreign security trades is not the current value as of the close of the NYSE. Foreign securities’ prices meeting the approved degree of certainty that the price is not reflective of current value will be priced at the indication of fair value from the independent pricing service. Multiple factors may be considered by the independent pricing service in determining adjustments to reflect fair value and may include information relating to sector indices, American Depositary Receipts and domestic and foreign index futures. Foreign securities may have additional risks including exchange rate changes, potential for sharply devalued currencies and high inflation, political and economic upheaval, the relative lack of issuer information, relatively low market liquidity and the potential lack of strict financial and accounting controls and standards.
Securities for which market prices are not provided by any of the above methods may be valued based upon quotes furnished by independent sources. The last bid price may be used to value equity securities. The mean between the last bid and asked prices is used to value debt obligations, including corporate loans.
Securities for which market quotations are not readily available or became unreliable are valued at fair value as determined in good faith by or under the supervision of the Trust’s officers following procedures approved by the Board of Trustees. Issuer specific events, market trends, bid/asked quotes of brokers and information providers and other market data may be reviewed in the course of making a good faith determination of a security’s fair value.
The Fund may invest in securities that are subject to interest rate risk, meaning the risk that the prices will generally fall as interest rates rise and, conversely, the prices will generally rise as interest rates fall. Specific securities differ in their sensitivity to changes in interest rates depending on their individual characteristics. Changes in interest rates may result in increased market volatility, which may affect the value and/or liquidity of certain Fund investments.
Valuations change in response to many factors including the historical and prospective earnings of the issuer, the value of the issuer’s assets, general economic conditions, interest rates, investor perceptions and market liquidity. Because of the inherent uncertainties of valuation, the values reflected in the financial statements may materially differ from the value received upon actual sale of those investments.
| B. | Securities Transactions and Investment Income— Securities transactions are accounted for on a trade date basis. Realized gains or losses on sales are computed on the basis of specific identification of the securities sold. Interest income (net of withholding tax, if any) is recorded on the accrual basis from settlement date. Dividend income (net of withholding tax, if any) is recorded on the ex-dividend date. |
The Fund may periodically participate in litigation related to Fund investments. As such, the Fund may receive proceeds from litigation settlements. Any proceeds received are included in the Statement of Operations as realized gain (loss) for investments no longer held and as unrealized gain (loss) for investments still held.
Brokerage commissions and mark ups are considered transaction costs and are recorded as an increase to the cost basis of securities purchased and/or a reduction of proceeds on a sale of securities. Such transaction costs are included in the determination of net realized and unrealized gain (loss) from investment securities reported in the Statement of Operations and the Statement of Changes in Net Assets and the net realized and unrealized gains (losses) on securities per share in the Financial Highlights. Transaction costs are included in the calculation of the Fund’s net asset value and, accordingly, they reduce the Fund’s total returns. These transaction costs are not considered operating expenses and are not reflected in net investment income reported in the Statement of Operations and the Statement of Changes in Net Assets, or the net investment income per share and the ratios of expenses and net investment income reported in the Financial Highlights, nor are they limited by any expense limitation arrangements between the Fund and the investment adviser.
The Fund allocates income and realized and unrealized capital gains and losses to a class based on the relative net assets of each class.
15 Invesco International Small Company Fund
| C. | Country Determination— For the purposes of making investment selection decisions and presentation in the Schedule of Investments, the investment adviser may determine the country in which an issuer is located and/or credit risk exposure based on various factors. These factors include the laws of the country under which the issuer is organized, where the issuer maintains a principal office, the country in which the issuer derives 50% or more of its total revenues and the country that has the primary market for the issuer’s securities, as well as other criteria. Among the other criteria that may be evaluated for making this determination are the country in which the issuer maintains 50% or more of its assets, the type of security, financial guarantees and enhancements, the nature of the collateral and the sponsor organization. Country of issuer and/or credit risk exposure has been determined to be the United States of America, unless otherwise noted. |
| D. | Distributions— Distributions from net investment income and net realized capital gain, if any, are generally declared and paid annually and recorded on the ex-dividend date. The Fund may elect to treat a portion of the proceeds from redemptions as distributions for federal income tax purposes. |
| E. | Federal Income Taxes— The Fund intends to comply with the requirements of Subchapter M of the Internal Revenue Code of 1986, as amended (the “Internal Revenue Code”), necessary to qualify as a regulated investment company and to distribute substantially all of the Fund’s taxable earnings to shareholders. As such, the Fund will not be subject to federal income taxes on otherwise taxable income (including net realized capital gain) that is distributed to shareholders. Therefore, no provision for federal income taxes is recorded in the financial statements. |
The Fund recognizes the tax benefits of uncertain tax positions only when the position is more likely than not to be sustained. Management has analyzed the Fund’s uncertain tax positions and concluded that no liability for unrecognized tax benefits should be recorded related to uncertain tax positions. Management is not aware of any tax positions for which it is reasonably possible that the total amounts of unrecognized tax benefits will change materially in the next 12 months.
The Fund files tax returns in the U.S. Federal jurisdiction and certain other jurisdictions. Generally, the Fund is subject to examinations by such taxing authorities for up to three years after the filing of the return for the tax period.
| F. | Expenses— Fees provided for under the Rule 12b-1 plan of a particular class of the Fund are charged to the operations of such class. Transfer agency fees and expenses and other shareholder recordkeeping fees and expenses attributable to Class R5 and Class R6 are allocated to each share class based on relative net assets.Sub-accounting fees attributable to Class R5 are charged to the operations of the class. Transfer agency fees and expenses and other shareholder recordkeeping fees and expenses relating to all other classes are allocated among those classes based on relative net assets. All other expenses are allocated among the classes based on relative net assets. |
| G. | Accounting Estimates— The preparation of financial statements in conformity with accounting principles generally accepted in the United States of America (“GAAP”) requires management to make estimates and assumptions that affect the reported amounts of assets and liabilities at the date of the financial statements and the reported amounts of revenues and expenses during the reporting period including estimates and assumptions related to taxation. Actual results could differ from those estimates by a significant amount. In addition, the Fund monitors for material events or transactions that may occur or become known after the period-end date and before the date the financial statements are released to print. |
| H. | Indemnifications— Under the Trust’s organizational documents, each Trustee, officer, employee or other agent of the Trust is indemnified against certain liabilities that may arise out of the performance of their duties to the Fund. Additionally, in the normal course of business, the Fund enters into contracts, including the Fund’s servicing agreements, that contain a variety of indemnification clauses. The Fund’s maximum exposure under these arrangements is unknown as this would involve future claims that may be made against the Fund that have not yet occurred. The risk of material loss as a result of such indemnification claims is considered remote. |
| I. | Foreign Currency Translations— Foreign currency is valued at the close of the NYSE based on quotations posted by banks and major currency dealers. Portfolio securities and other assets and liabilities denominated in foreign currencies are translated into U.S. dollar amounts at the date of valuation. Purchases and sales of portfolio securities (net of foreign taxes withheld on disposition) and income items denominated in foreign currencies are translated into U.S. dollar amounts on the respective dates of such transactions. The Fund does not separately account for the portion of the results of operations resulting from changes in foreign exchange rates on investments and the fluctuations arising from changes in market prices of securities held. The combined results of changes in foreign exchange rates and the fluctuation of market prices on investments (net of estimated foreign tax withholding) are included with the net realized and unrealized gain or loss from investments in the Statement of Operations. Reported net realized foreign currency gains or losses arise from (1) sales of foreign currencies, (2) currency gains or losses realized between the trade and settlement dates on securities transactions, and (3) the difference between the amounts of dividends, interest, and foreign withholding taxes recorded on the Fund’s books and the U.S. dollar equivalent of the amounts actually received or paid. Net unrealized foreign currency gains and losses arise from changes in the fair values of assets and liabilities, other than investments in securities at fiscal period end, resulting from changes in exchange rates. |
The Fund may invest in foreign securities, which may be subject to foreign taxes on income, gains on investments or currency repatriation, a portion of which may be recoverable. Foreign taxes, if any, are recorded based on the tax regulations and rates that exist in the foreign markets in which the Fund invests and are shown in the Statement of Operations.
| J. | Forward Foreign Currency Contracts— The Fund may engage in foreign currency transactions either on a spot (i.e. for prompt delivery and settlement) basis, or through forward foreign currency contracts, to manage or minimize currency or exchange rate risk. |
The Fund may also enter into forward foreign currency contracts for the purchase or sale of a security denominated in a foreign currency in order to “lock in” the U.S. dollar price of that security, or the Fund may also enter into forward foreign currency contracts that do not provide for physical settlement of the two currencies, but instead are settled by a single cash payment calculated as the difference between the agreed upon exchange rate and the spot rate at settlement based upon an agreed upon notional amount (non-deliverable forwards). The Fund will set aside liquid assets in an amount equal to the dailymark-to-market obligation for forward foreign currency contracts.
A forward foreign currency contract is an obligation between two parties (“Counterparties”) to purchase or sell a specific currency for anagreed-upon price at a future date. The use of forward foreign currency contracts does not eliminate fluctuations in the price of the underlying securities the Fund owns or intends to acquire but establishes a rate of exchange in advance. Fluctuations in the value of these contracts are measured by the difference in the contract date and reporting date exchange rates and are recorded as unrealized appreciation (depreciation) until the contracts are closed. When the contracts are closed, realized gains (losses) are recorded. Realized and unrealized gains (losses) on the contracts are included in the Statement of Operations. The primary risks associated with forward foreign currency contracts include failure of the Counterparty to meet the terms of the contract and the value of the foreign currency changing unfavorably. These risks may be in excess of the amounts reflected in the Statement of Assets and Liabilities.
16 Invesco International Small Company Fund
NOTE 2—Advisory Fees and Other Fees Paid to Affiliates
The Trust has entered into a master investment advisory agreement with Invesco Advisers, Inc. (the “Adviser” or “Invesco”). Under the terms of the investment advisory agreement, the Fund accrues daily and pays monthly an advisory fee to the Adviser based on the annual rate of the Fund’s average daily net assets as follows:
| | | | | | | | |
| Average Daily Net Assets | | Rate | |
First $250 million | | | 0 | .935% | | | | |
Next $250 million | | | 0 | .91% | | | | |
Next $500 million | | | 0 | .885% | | | | |
Next $1.5 billion | | | 0 | .86% | | | | |
Next $2.5 billion | | | 0 | .835% | | | | |
Next $2.5 billion | | | 0 | .81% | | | | |
Next $2.5 billion | | | 0 | .785% | | | | |
Over $10 billion | | | 0 | .76% | | | | |
For the year ended December 31, 2018, the effective advisory fees incurred by the Fund was 0.93%.
Under the terms of a mastersub-advisory agreement between the Adviser and each of Invesco Asset Management Deutschland GmbH, Invesco Asset Management Limited, Invesco Asset Management (Japan) Limited, Invesco Hong Kong Limited, Invesco Senior Secured Management, Inc. and Invesco Canada Ltd. (collectively, the “AffiliatedSub-Advisers”) the Adviser, not the Fund, will pay 40% of the fees paid to the Adviser to any such AffiliatedSub-Adviser(s) that provide(s) discretionary investment management services to the Fund based on the percentage of assets allocated to such AffiliatedSub-Adviser(s).
The Adviser has contractually agreed, through at least June 30, 2019, to waive advisory fees and/or reimburse expenses of all shares to the extent necessary to limit total annual fund operating expenses after fee waiver and/or expense reimbursement (excluding certain items discussed below) of Class A, Class C, Class Y, Class R5 and Class R6 shares to 2.25%, 3.00%, 2.00%, 2.00% and 2.00% of average daily net assets, respectively (the “expense limits”). Prior to their conversion to Class A shares, the expense limit for Class B shares was 3.00% of average daily net assets. In determining the Adviser’s obligation to waive advisory fees and/or reimburse expenses, the following expenses are not taken into account, and could cause the total annual fund operating expenses after fee waiver and/or expense reimbursement to exceed the numbers reflected above: (1) interest; (2) taxes; (3) dividend expense on short sales; (4) extraordinary or non-routine items, including litigation expenses; and (5) expenses that the Fund has incurred but did not actually pay because of an expense offset arrangement. Unless Invesco continues the fee waiver agreement, it will terminate on June 30, 2019. During its term, the fee waiver agreement cannot be terminated or amended to increase the expense limits or reduce the advisory fee waiver without approval of the Board of Trustees. The Adviser did not waive fees and/or reimburse expenses during the period under these expense limits.
Further, the Adviser has contractually agreed, through at least June 30, 2020, to waive the advisory fee payable by the Fund in an amount equal to 100% of the net advisory fees the Adviser receives from the affiliated money market funds on investments by the Fund of uninvested cash in such affiliated money market funds.
For the year ended December 31, 2018, the Adviser waived advisory fees of $35,412.
The Trust has entered into a master administrative services agreement with Invesco pursuant to which the Fund has agreed to pay Invesco for certain administrative costs incurred in providing accounting services to the Fund. For the year ended December 31, 2018, expenses incurred under the agreement are shown in the Statement of Operations asAdministrative services fees.
The Trust has entered into a transfer agency and service agreement with Invesco Investment Services, Inc. (“IIS”) pursuant to which the Fund has agreed to pay IIS a fee for providing transfer agency and shareholder services to the Fund and reimburse IIS for certain expenses incurred by IIS in the course of providing such services. IIS may make payments to intermediaries that provide omnibus account services,sub-accounting services and/or networking services. All fees payable by IIS to intermediaries that provide omnibus account services orsub-accounting services are charged back to the Fund, subject to certain limitations approved by the Trust’s Board of Trustees. For the year ended December 31, 2018, expenses incurred under the agreement are shown in the Statement of Operations asTransfer agent fees.
The Trust has entered into master distribution agreements with Invesco Distributors, Inc. (“IDI”) to serve as the distributor for the Class A, Class C, Class Y, Class R5 and Class R6 shares of the Fund. The Trust has adopted plans pursuant to Rule 12b-1 under the 1940 Act with respect to the Fund’s Class A and Class C shares (collectively, the “Plans”). The Fund, pursuant to the Plans, pays IDI compensation at the annual rate of 0.25% of the Fund’s average daily net assets of Class A shares and 1.00% of the average daily net assets of Class C shares. Prior to their conversion to Class A shares, the Fund paid an annual rate of 1.00% of the average daily net assets of Class B shares. The fees are accrued daily and paid monthly. Of the Plan payments, up to 0.25% of the average daily net assets of each class of shares may be paid to furnish continuing personal shareholder services to customers who purchase and own shares of such classes. Any amounts not paid as a service fee under the Plans would constitute an asset-based sales charge. Rules of the Financial Industry Regulatory Authority (“FINRA”) impose a cap on the total sales charges, including asset-based sales charges, that may be paid by any class of shares of the Fund. For the year ended December 31, 2018, expenses incurred under the Plans are shown in the Statement of Operations asDistribution fees.
Front-end sales commissions and CDSC (collectively, the “sales charges”) are not recorded as expenses of the Fund. Front-end sales commissions are deducted from proceeds from the sales of Fund shares prior to investment in Class A shares of the Fund. CDSC are deducted from redemption proceeds prior to remittance to the shareholder. During the year ended December 31, 2018, IDI advised the Fund that IDI retained $57,982 in front-end sales commissions from the sale of Class A shares and $5,714 and $730 from Class A and Class C shares, respectively, for CDSC imposed on redemptions by shareholders.
Certain officers and trustees of the Trust are officers and directors of the Adviser, IIS and/or IDI.
17 Invesco International Small Company Fund
NOTE 3—Additional Valuation Information
GAAP defines fair value as the price that would be received to sell an asset or paid to transfer a liability in an orderly transaction between market participants at the measurement date, under current market conditions. GAAP establishes a hierarchy that prioritizes the inputs to valuation methods, giving the highest priority to readily available unadjusted quoted prices in an active market for identical assets (Level 1) and the lowest priority to significant unobservable inputs (Level 3), generally when market prices are not readily available or are unreliable. Based on the valuation inputs, the securities or other investments are tiered into one of three levels. Changes in valuation methods may result in transfers in or out of an investment’s assigned level:
| | Level 1 — | Prices are determined using quoted prices in an active market for identical assets. |
| | Level 2 — | Prices are determined using other significant observable inputs. Observable inputs are inputs that other market participants may use in pricing a security. These may include quoted prices for similar securities, interest rates, prepayment speeds, credit risk, yield curves, loss severities, default rates, discount rates, volatilities and others. |
| | Level 3 — | Prices are determined using significant unobservable inputs. In situations where quoted prices or observable inputs are unavailable (for example, when there is little or no market activity for an investment at the end of the period), unobservable inputs may be used. Unobservable inputs reflect the Fund’s own assumptions about the factors market participants would use in determining fair value of the securities or instruments and would be based on the best available information. |
The following is a summary of the tiered valuation input levels, as of December 31, 2018. The level assigned to the securities valuations may not be an indication of the risk or liquidity associated with investing in those securities. Because of the inherent uncertainties of valuation, the values reflected in the financial statements may materially differ from the value received upon actual sale of those investments.
| | | | | | | | | | | | | | | | |
| | | Level 1 | | | Level 2 | | | Level 3 | | | Total | |
Investments in Securities | | | | | | | | | | | | | | | | |
Australia | | $ | 2,590,650 | | | $ | — | | | $ | — | | | $ | 2,590,650 | |
Brazil | | | 11,517,853 | | | | 4,964,499 | | | | — | | | | 16,482,352 | |
Canada | | | 29,361,836 | | | | — | | | | — | | | | 29,361,836 | |
Egypt | | | 6,182,068 | | | | — | | | | — | | | | 6,182,068 | |
Estonia | | | — | | | | 2,485,168 | | | | — | | | | 2,485,168 | |
France | | | 16,630,108 | | | | 8,781,139 | | | | — | | | | 25,411,247 | |
Germany | | | 9,545,204 | | | | 1,448,008 | | | | — | | | | 10,993,212 | |
Greece | | | 2,363,739 | | | | 3,306,295 | | | | — | | | | 5,670,034 | |
Indonesia | | | 4,906,213 | | | | — | | | | — | | | | 4,906,213 | |
Ireland | | | 5,204,224 | | | | — | | | | — | | | | 5,204,224 | |
Israel | | | 1,886,408 | | | | 4,591,902 | | | | — | | | | 6,478,310 | |
Italy | | | 9,662,229 | | | | — | | | | — | | | | 9,662,229 | |
Japan | | | — | | | | 5,031,472 | | | | — | | | | 5,031,472 | |
Malaysia | | | 2,233,890 | | | | — | | | | — | | | | 2,233,890 | |
Mexico | | | 11,741,319 | | | | — | | | | — | | | | 11,741,319 | |
Netherlands | | | — | | | | 1,938,371 | | | | — | | | | 1,938,371 | |
New Zealand | | | 6,143,577 | | | | — | | | | — | | | | 6,143,577 | |
Norway | | | 6,493,073 | | | | — | | | | — | | | | 6,493,073 | |
Poland | | | 5,915,828 | | | | — | | | | — | | | | 5,915,828 | |
Romania | | | 15,796,731 | | | | — | | | | — | | | | 15,796,731 | |
South Africa | | | 5,974,918 | | | | — | | | | — | | | | 5,974,918 | |
Sweden | | | 3,151,998 | | | | — | | | | — | | | | 3,151,998 | |
Switzerland | | | — | | | | 2,451,272 | | | | — | | | | 2,451,272 | |
Turkey | | | 1,109,422 | | | | — | | | | — | | | | 1,109,422 | |
United Kingdom | | | 25,507,915 | | | | 19,950,786 | | | | — | | | | 45,458,701 | |
Money Market Funds | | | 26,480,699 | | | | — | | | | — | | | | 26,480,699 | |
Total Investments | | $ | 210,399,902 | | | $ | 54,948,912 | | | $ | — | | | $ | 265,348,814 | |
18 Invesco International Small Company Fund
NOTE 4—Investments in Affiliates
The 1940 Act defines an “affiliated person” as an issuance in which a fund holds 5% or more of the outstanding voting securities. The Fund has not owned enough of the outstanding voting securities of the issuer to have control (as defined in the 1940 Act) of that issuer. The following is a summary of the investments in other affiliates (excluding affiliated money market funds) for the year ended December 31, 2018.
| | | | | | | | | | | | | | | | | | | | | | | | | | | | |
| | | Value
12/31/17 | | | Purchases
at Cost | | | Proceeds
from Sales | | | Change in
Unrealized
Appreciation
(Depreciation) | | | Realized
Gain (Loss) | | | Value
12/31/18 | | | Dividend
Income | |
Precia S.A. | | $ | 9,280,812 | | | $ | — | | | $ | 8,672,436 | | | $ | 1,931,087 | | | $ | 4,299,802 | | | $ | 6,839,265 | | | $ | 83,948 | |
Polski Bank | | | — | | | | 4,841,572 | | | | 4,019,555 | | | | 3,204,626 | | | | (198,567 | ) | | | 3,828,076 | | | | 42,747 | |
Total | | $ | 9,280,812 | | | $ | 4,841,572 | | | $ | 12,691,991 | | | $ | 5,135,713 | | | $ | 4,101,235 | | | $ | 10,667,341 | | | $ | 126,695 | |
NOTE 5—Expense Offset Arrangement(s)
The expense offset arrangement is comprised of transfer agency credits which result from balances in demand deposit accounts used by the transfer agent for clearing shareholder transactions. For the year ended December 31, 2018, the Fund received credits from this arrangement, which resulted in the reduction of the Fund’s total expenses of $2,675.
NOTE 6—Trustees’ and Officers’ Fees and Benefits
Trustees’ and Officers’ Fees and Benefits include amounts accrued by the Fund to pay remuneration to certain Trustees and Officers of the Fund. Trustees have the option to defer compensation payable by the Fund, andTrustees’ and Officers’ Fees and Benefitsalso include amounts accrued by the Fund to fund such deferred compensation amounts. Those Trustees who defer compensation have the option to select various Invesco Funds in which their deferral accounts shall be deemed to be invested. Finally, certain current Trustees were eligible to participate in a retirement plan that provided for benefits to be paid upon retirement to Trustees over a period of time based on the number of years of service. The Fund may have certain former Trustees who also participate in a retirement plan and receive benefits under such plan.Trustees’ and Officers’ Fees and Benefits include amounts accrued by the Fund to fund such retirement benefits. Obligations under the deferred compensation and retirement plans represent unsecured claims against the general assets of the Fund.
NOTE 7—Cash Balances
The Fund is permitted to temporarily carry a negative or overdrawn balance in its account with State Street Bank and Trust Company, the custodian bank. Such balances, if any at period-end, are shown in the Statement of Assets and Liabilities under the payable captionAmount due custodian. To compensate the custodian bank for such overdrafts, the overdrawn Fund may either (1) leave funds as a compensating balance in the account so the custodian bank can be compensated by earning the additional interest; or (2) compensate by paying the custodian bank at a rate agreed upon by the custodian bank and Invesco, not to exceed the contractually agreed upon rate.
NOTE 8—Distributions to Shareholders and Tax Components of Net Assets
Tax Character of Distributions to Shareholders Paid During the Fiscal Years Ended December 31, 2018 and 2017:
| | | | | | | | |
| | | 2018 | | | 2017 | |
Ordinary income | | $ | 6,686,624 | | | $ | 8,706,150 | |
Long-term capital gain | | | 3,820,827 | | | | 11,301,675 | |
Total distributions | | $ | 10,507,451 | | | $ | 20,007,825 | |
Tax Components of Net Assets at Period-End:
| | | | |
| | | 2018 | |
Undistributedlong-term gain | | $ | 2,720,299 | |
Net unrealized appreciation — investments | | | 3,601,901 | |
Net unrealized appreciation (depreciation) — foreign currencies | | | (16,851 | ) |
Temporary book/tax differences | | | (120,055 | ) |
Late-Year Ordinary Loss Deferral | | | (317,280 | ) |
Shares of beneficial interest | | | 262,113,109 | |
Total net assets | | $ | 267,981,123 | |
The difference between book-basis and tax-basis unrealized appreciation (depreciation) is due to differences in the timing of recognition of gains and losses on investments for tax and book purposes. The Fund’s net unrealized appreciation (depreciation) difference is attributable primarily to passive foreign investment companies.
The temporary book/tax differences are a result of timing differences between book and tax recognition of income and/or expenses. The Fund’s temporary book/tax differences are the result of the trustee deferral of compensation and retirement plan benefits.
19 Invesco International Small Company Fund
Capital loss carryforward is calculated and reported as of a specific date. Results of transactions and other activity after that date may affect the amount of capital loss carryforward actually available for the Fund to utilize. Capital losses generated in years beginning after December 22, 2010 can be carried forward for an unlimited period, whereas previous losses expire in eight tax years. Capital losses with an expiration period may not be used to offset capital gains until all net capital losses without an expiration date have been utilized. Capital loss carryforwards with no expiration date will retain their character as eithershort-term orlong-term capital losses instead of asshort-term capital losses as under prior law. The ability to utilize capital loss carryforwards in the future may be limited under the Internal Revenue Code and related regulations based on the results of future transactions.
The Fund does not have a capital loss carryforward as of December 31, 2018.
NOTE 9—Investment Transactions
The aggregate amount of investment securities (other thanshort-term securities, U.S. Treasury obligations and money market funds, if any) purchased and sold by the Fund during the year ended December 31, 2018 was $56,193,228 and $42,862,161, respectively. Cost of investments, including any derivatives, on a tax basis includes the adjustments for financial reporting purposes as of the most recently completed federal income tax reporting period-end.
| | | | |
| Unrealized Appreciation (Depreciation) of Investments on a Tax Basis | |
Aggregate unrealized appreciation of investments | | $ | 42,061,147 | |
Aggregate unrealized (depreciation) of investments | | | (38,459,246 | ) |
Net unrealized appreciation of investments | | $ | 3,601,901 | |
Cost of investments for tax purposes is $261,746,913.
NOTE 10—Reclassification of Permanent Differences
Primarily as a result of differing book/tax treatment of passive foreign investment companies on December 31, 2018, undistributed net investment income was increased by $156,512 and undistributed net realized gain was decreased by $156,512. This reclassification had no effect on the net assets or the distributable earnings of the Fund.
20 Invesco International Small Company Fund
NOTE 11—Share Information
| | | | | | | | | | | | | | | | |
| | | Summary of Share Activity | |
| | | Years ended December 31, | |
| | | 2018(a) | | | 2017 | |
| | | Shares | | | Amount | | | Shares | | | Amount | |
Sold: | | | | | | | | | | | | | | | | |
Class A | | | 2,474,940 | | | $ | 45,569,362 | | | | 3,223,594 | | | $ | 59,237,437 | |
Class B(b) | | | 71 | | | | 1,356 | | | | 1,378 | | | | 24,446 | |
Class C | | | 170,287 | | | | 3,017,331 | | | | 248,579 | | | | 4,367,303 | |
Class Y | | | 1,024,050 | | | | 18,249,762 | | | | 2,884,187 | | | | 50,811,800 | |
Class R5 | | | 87,154 | | | | 1,540,904 | | | | 148,126 | | | | 2,645,110 | |
Class R6 | | | 1,718,958 | | | | 31,579,715 | | | | 3,629,908 | | | | 69,334,857 | |
| | | | |
Issued as reinvestment of dividends: | | | | | | | | | | | | | | | | |
Class A | | | 299,850 | | | | 4,569,709 | | | | 490,038 | | | | 9,114,701 | |
Class B(b) | | | — | | | | — | | | | 1,362 | | | | 24,103 | |
Class C | | | 24,932 | | | | 361,519 | | | | 58,829 | | | | 1,040,712 | |
Class Y | | | 97,806 | | | | 1,491,547 | | | | 174,142 | | | | 3,244,291 | |
Class R5 | | | 14,022 | | | | 211,877 | | | | 21,266 | | | | 392,547 | |
Class R6 | | | 207,678 | | | | 3,133,857 | | | | 276,002 | | | | 5,089,494 | |
| | | | |
Conversion of Class B shares to Class A shares:(c) | | | | | | | | | | | | | | | | |
Class A | | | 19,336 | | | | 393,290 | | | | 32,478 | | | | 603,644 | |
Class B | | | (20,347 | ) | | | (393,290 | ) | | | (34,172 | ) | | | (603,644 | ) |
| | | | |
Reacquired: | | | | | | | | | | | | | | | | |
Class A | | | (2,509,370 | ) | | | (45,687,599 | ) | | | (3,257,973 | ) | | | (58,415,363 | ) |
Class B(b) | | | (2,167 | ) | | | (41,674 | ) | | | (10,642 | ) | | | (179,774 | ) |
Class C | | | (381,957 | ) | | | (6,529,708 | ) | | | (295,687 | ) | | | (5,076,979 | ) |
Class Y | | | (1,507,045 | ) | | | (28,040,041 | ) | | | (3,584,420 | ) | | | (67,875,950 | ) |
Class R5 | | | (99,532 | ) | | | (1,791,513 | ) | | | (469,800 | ) | | | (8,798,343 | ) |
Class R6 | | | (1,177,372 | ) | | | (21,183,081 | ) | | | (624,111 | ) | | | (11,661,126 | ) |
Net increase in share activity | | | 441,294 | | | $ | 6,453,323 | | | | 2,913,084 | | | $ | 53,319,266 | |
| (a) | There is an entity that is a record owner of more than 5% of the outstanding shares of the Fund and owns 49% of the outstanding shares of the Fund. IDI has an agreement with this entity to sell Fund shares. The Fund, Invesco and/or Invesco affiliates may make payments to this entity, which is considered to be related to the Fund, for providing services to the Fund, Invesco and/or Invesco affiliates including but not limited to services such as securities brokerage, distribution, third party record keeping and account servicing. The Fund has no knowledge as to whether all or any portion of the shares owned of record by this entity are also owned beneficially. |
| (b) | Class B shares activity for the period January 1, 2018 through January 26, 2018 (date of conversion). |
| (c) | Effective as of the close of business January 26, 2018, all outstanding Class B shares were converted to Class A shares. |
21 Invesco International Small Company Fund
NOTE 12—Financial Highlights
The following schedule presents financial highlights for a share of the Fund outstanding throughout the periods indicated.
| | | | | | | | | | | | | | | | | | | | | | | | | | | | | | | | | | | | | | | | | | | | | | | | | | | | | | | | |
| | | Net asset
value,
beginning
of period | | | Net
investment
income(a) | | | Net gains
(losses)
on securities
(both
realized and
unrealized) | | | Total from
investment
operations | | | Dividends
from net
investment
income | | | Distributions
from net
realized
gains | | | Total
distributions | | | Net asset
value, end
of period | | | Total
return(b) | | | Net assets,
end of period
(000’s omitted) | | | Ratio of
expenses
to average
net assets
with fee waivers
and/or expenses
absorbed | | | Ratio of
expenses
to average net
assets without
fee waivers
and/or expenses
absorbed | | | Ratio of net
investment
income
to average
net assets | | | Portfolio
turnover(c) | |
Class A | | | | | | | | | | | | | | | | | | | | | | | | | | | | | | | | | | | | | | | | | | | | | | | | | | | | | | | | |
Year ended 12/31/18 | | $ | 19.33 | | | $ | 0.38 | (d) | | $ | (3.98 | ) | | $ | (3.60 | ) | | $ | (0.34 | ) | | $ | (0.25 | ) | | $ | (0.59 | ) | | $ | 15.14 | | | | (18.67 | )% | | $ | 131,610 | | | | 1.55 | %(e) | | | 1.56 | %(e) | | | 2.07 | %(d)(e) | | | 15 | % |
Year ended 12/31/17 | | | 15.44 | | | | 0.27 | | | | 4.84 | | | | 5.11 | | | | (0.52 | ) | | | (0.70 | ) | | | (1.22 | ) | | | 19.33 | | | | 33.42 | | | | 162,497 | | | | 1.58 | | | | 1.59 | | | | 1.48 | | | | 16 | |
Year ended 12/31/16 | | | 15.42 | | | | 0.34 | | | | 1.02 | | | | 1.36 | | | | (0.37 | ) | | | (0.97 | ) | | | (1.34 | ) | | | 15.44 | | | | 8.79 | | | | 122,232 | | | | 1.57 | | | | 1.58 | | | | 2.13 | | | | 15 | |
Year ended 12/31/15 | | | 18.40 | | | | 0.21 | | | | (1.92 | ) | | | (1.71 | ) | | | (0.19 | ) | | | (1.08 | ) | | | (1.27 | ) | | | 15.42 | | | | (9.30 | ) | | | 119,301 | | | | 1.52 | | | | 1.53 | | | | 1.18 | | | | 8 | |
Year ended 12/31/14 | | | 21.34 | | | | 0.28 | | | | (1.40 | ) | | | (1.12 | ) | | | (0.28 | ) | | | (1.54 | ) | | | (1.82 | ) | | | 18.40 | | | | (5.01 | ) | | | 185,380 | | | | 1.45 | | | | 1.46 | | | | 1.31 | | | | 20 | |
Class B | | | | | | | | | | | | | | | | | | | | | | | | | | | | | | | | | | | | | | | | | | | | | | | | | | | | | | | | |
Year ended 12/31/18(f) | | | 18.38 | | | | 0.02 | | | | 0.93 | | | | 0.95 | | | | — | | | | — | | | | — | | | | 19.33 | | | | 5.17 | | | | — | | | | 2.30 | (e)(g) | | | 2.31 | (e)(g) | | | 1.32 | (e)(g) | | | 15 | |
Year ended 12/31/17 | | | 14.73 | | | | 0.13 | | | | 4.61 | | | | 4.74 | | | | (0.39 | ) | | | (0.70 | ) | | | (1.09 | ) | | | 18.38 | | | | 32.46 | | | | 413 | | | | 2.33 | | | | 2.34 | | | | 0.73 | | | | 16 | |
Year ended 12/31/16 | | | 14.75 | | | | 0.21 | | | | 0.98 | | | | 1.19 | | | | (0.24 | ) | | | (0.97 | ) | | | (1.21 | ) | | | 14.73 | | | | 8.03 | | | | 950 | | | | 2.32 | | | | 2.33 | | | | 1.38 | | | | 15 | |
Year ended 12/31/15 | | | 17.66 | | | | 0.07 | | | | (1.84 | ) | | | (1.77 | ) | | | (0.06 | ) | | | (1.08 | ) | | | (1.14 | ) | | | 14.75 | | | | (9.99 | ) | | | 1,514 | | | | 2.27 | | | | 2.28 | | | | 0.43 | | | | 8 | |
Year ended 12/31/14 | | | 20.54 | | | | 0.12 | | | | (1.35 | ) | | | (1.23 | ) | | | (0.11 | ) | | | (1.54 | ) | | | (1.65 | ) | | | 17.66 | | | | (5.78 | ) | | | 2,828 | | | | 2.20 | | | | 2.21 | | | | 0.56 | | | | 20 | |
Class C | | | | | | | | | | | | | | | | | | | | | | | | | | | | | | | | | | | | | | | | | | | | | | | | | | | | | | | | |
Year ended 12/31/18 | | | 18.38 | | | | 0.23 | (d) | | | (3.76 | ) | | | (3.53 | ) | | | (0.19 | ) | | | (0.25 | ) | | | (0.44 | ) | | | 14.41 | | | | (19.24 | ) | | | 12,845 | | | | 2.30 | (e) | | | 2.31 | (e) | | | 1.32 | (d)(e) | | | 15 | |
Year ended 12/31/17 | | | 14.73 | | | | 0.13 | | | | 4.61 | | | | 4.74 | | | | (0.39 | ) | | | (0.70 | ) | | | (1.09 | ) | | | 18.38 | | | | 32.46 | | | | 19,819 | | | | 2.33 | | | | 2.34 | | | | 0.73 | | | | 16 | |
Year ended 12/31/16 | | | 14.76 | | | | 0.21 | | | | 0.97 | | | | 1.18 | | | | (0.24 | ) | | | (0.97 | ) | | | (1.21 | ) | | | 14.73 | | | | 7.96 | | | | 15,712 | | | | 2.32 | | | | 2.33 | | | | 1.38 | | | | 15 | |
Year ended 12/31/15 | | | 17.67 | | | | 0.07 | | | | (1.84 | ) | | | (1.77 | ) | | | (0.06 | ) | | | (1.08 | ) | | | (1.14 | ) | | | 14.76 | | | | (9.98 | ) | | | 18,098 | | | | 2.27 | | | | 2.28 | | | | 0.43 | | | | 8 | |
Year ended 12/31/14 | | | 20.54 | | | | 0.12 | | | | (1.34 | ) | | | (1.22 | ) | | | (0.11 | ) | | | (1.54 | ) | | | (1.65 | ) | | | 17.67 | | | | (5.73 | ) | | | 26,458 | | | | 2.20 | | | | 2.21 | | | | 0.56 | | | | 20 | |
Class Y | | | | | | | | | | | | | | | | | | | | | | | | | | | | | | | | | | | | | | | | | | | | | | | | | | | | | | | | |
Year ended 12/31/18 | | | 19.36 | | | | 0.43 | (d) | | | (3.99 | ) | | | (3.56 | ) | | | (0.39 | ) | | | (0.25 | ) | | | (0.64 | ) | | | 15.16 | | | | (18.44 | ) | | | 42,878 | | | | 1.30 | (e) | | | 1.31 | (e) | | | 2.32 | (d)(e) | | | 15 | |
Year ended 12/31/17 | | | 15.46 | | | | 0.32 | | | | 4.84 | | | | 5.16 | | | | (0.56 | ) | | | (0.70 | ) | | | (1.26 | ) | | | 19.36 | | | | 33.74 | | | | 62,218 | | | | 1.33 | | | | 1.34 | | | | 1.73 | | | | 16 | |
Year ended 12/31/16 | | | 15.43 | | | | 0.38 | | | | 1.03 | | | | 1.41 | | | | (0.41 | ) | | | (0.97 | ) | | | (1.38 | ) | | | 15.46 | | | | 9.10 | | | | 57,810 | | | | 1.32 | | | | 1.33 | | | | 2.38 | | | | 15 | |
Year ended 12/31/15 | | | 18.42 | | | | 0.26 | | | | (1.94 | ) | | | (1.68 | ) | | | (0.23 | ) | | | (1.08 | ) | | | (1.31 | ) | | | 15.43 | | | | (9.11 | ) | | | 60,497 | | | | 1.27 | | | | 1.28 | | | | 1.43 | | | | 8 | |
Year ended 12/31/14 | | | 21.38 | | | | 0.34 | | | | (1.42 | ) | | | (1.08 | ) | | | (0.34 | ) | | | (1.54 | ) | | | (1.88 | ) | | | 18.42 | | | | (4.79 | ) | | | 121,933 | | | | 1.20 | | | | 1.21 | | | | 1.56 | | | | 20 | |
Class R5 | | | | | | | | | | | | | | | | | | | | | | | | | | | | | | | | | | | | | | | | | | | | | | | | | | | | | | | | |
Year ended 12/31/18 | | | 19.18 | | | | 0.44 | (d) | | | (3.96 | ) | | | (3.52 | ) | | | (0.40 | ) | | | (0.25 | ) | | | (0.65 | ) | | | 15.01 | | | | (18.37 | ) | | | 5,059 | | | | 1.21 | (e) | | | 1.22 | (e) | | | 2.41 | (d)(e) | | | 15 | |
Year ended 12/31/17 | | | 15.32 | | | | 0.33 | | | | 4.81 | | | | 5.14 | | | | (0.58 | ) | | | (0.70 | ) | | | (1.28 | ) | | | 19.18 | | | | 33.90 | | | | 6,433 | | | | 1.24 | | | | 1.25 | | | | 1.82 | | | | 16 | |
Year ended 12/31/16 | | | 15.30 | | | | 0.39 | | | | 1.02 | | | | 1.41 | | | | (0.42 | ) | | | (0.97 | ) | | | (1.39 | ) | | | 15.32 | | | | 9.21 | | | | 9,740 | | | | 1.19 | | | | 1.20 | | | | 2.51 | | | | 15 | |
Year ended 12/31/15 | | | 18.27 | | | | 0.27 | | | | (1.91 | ) | | | (1.64 | ) | | | (0.25 | ) | | | (1.08 | ) | | | (1.33 | ) | | | 15.30 | | | | (8.96 | ) | | | 24,821 | | | | 1.17 | | | | 1.18 | | | | 1.53 | | | | 8 | |
Year ended 12/31/14 | | | 21.23 | | | | 0.35 | | | | (1.41 | ) | | | (1.06 | ) | | | (0.36 | ) | | | (1.54 | ) | | | (1.90 | ) | | | 18.27 | | | | (4.74 | ) | | | 63,044 | | | | 1.13 | | | | 1.14 | | | | 1.63 | | | | 20 | |
Class R6 | | | | | | | | | | | | | | | | | | | | | | | | | | | | | | | | | | | | | | | | | | | | | | | | | | | | | | | | |
Year ended 12/31/18 | | | 19.17 | | | | 0.45 | (d) | | | (3.95 | ) | | | (3.50 | ) | | | (0.42 | ) | | | (0.25 | ) | | | (0.67 | ) | | | 15.00 | | | | (18.31 | ) | | | 75,590 | | | | 1.14 | (e) | | | 1.15 | (e) | | | 2.48 | (d)(e) | | | 15 | |
Year ended 12/31/17 | | | 15.31 | | | | 0.36 | | | | 4.80 | | | | 5.16 | | | | (0.60 | ) | | | (0.70 | ) | | | (1.30 | ) | | | 19.17 | | | | 34.04 | | | | 82,244 | | | | 1.15 | | | | 1.16 | | | | 1.91 | | | | 16 | |
Year ended 12/31/16 | | | 15.30 | | | | 0.40 | | | | 1.02 | | | | 1.42 | | | | (0.44 | ) | | | (0.97 | ) | | | (1.41 | ) | | | 15.31 | | | | 9.22 | | | | 15,436 | | | | 1.13 | | | | 1.14 | | | | 2.57 | | | | 15 | |
Year ended 12/31/15 | | | 18.27 | | | | 0.28 | | | | (1.91 | ) | | | (1.63 | ) | | | (0.26 | ) | | | (1.08 | ) | | | (1.34 | ) | | | 15.30 | | | | (8.87 | ) | | | 38,080 | | | | 1.09 | | | | 1.10 | | | | 1.61 | | | | 8 | |
Year ended 12/31/14 | | | 21.24 | | | | 0.37 | | | | (1.42 | ) | | | (1.05 | ) | | | (0.38 | ) | | | (1.54 | ) | | | (1.92 | ) | | | 18.27 | | | | (4.68 | ) | | | 45,946 | | | | 1.04 | | | | 1.05 | | | | 1.72 | | | | 20 | |
| (a) | Calculated using average shares outstanding. |
| (b) | Includes adjustments in accordance with accounting principles generally accepted in the United States of America and as such, the net asset value for financial reporting purposes and the returns based upon those net asset values may differ from the net asset value and returns for shareholder transactions. Does not include sales charges and is not annualized for periods less than one year, if applicable. |
| (c) | Portfolio turnover is calculated at the fund level and is not annualized for periods less than one year, if applicable. |
| (d) | Net investment income per share and the ratio of net investment income to average net assets includes significant dividends received during the year ended December 31, 2018. Net investment income per share and the ratio of net investment income to average net assets excluding the significant dividends are $0.33 and 1.82%, $0.18 and 1.07%, $0.38 and 2.07%, $0.39 and 2.16% and $0.40 and 2.23% for Class A, Class C, Class Y, Class R5 and Class R6, respectively. |
| (e) | Ratios are based on average daily net assets (000’s omitted) of $158,845, $418, $17,621, $50,995, $5,972 and $85,914 for Class A, Class B, Class C, Class Y, Class R5 and Class R6 shares, respectively. |
| (f) | Reflects activity for the period January 1, 2018 through January 26, 2018 (date of conversion). |
22 Invesco International Small Company Fund
Report of Independent Registered Public Accounting Firm
To the Board of Trustees of AIM Funds Group (Invesco Funds Group)
and Shareholders of Invesco International Small Company Fund:
Opinion on the Financial Statements
We have audited the accompanying statement of assets and liabilities, including the schedule of investments, of Invesco International Small Company Fund (one of the funds constituting AIM Funds Group (Invesco Funds Group), hereafter referred to as the “Fund”) as of December 31, 2018, the related statement of operations for the year ended December 31, 2018, the statement of changes in net assets for each of the two years in the period ended December 31, 2018, including the related notes, and the financial highlights for each of the periods indicated therein (collectively referred to as the “financial statements”). In our opinion, the financial statements present fairly, in all material respects, the financial position of the Fund as of December 31, 2018, the results of its operations for the year then ended, the changes in its net assets for each of the two years in the period ended December 31, 2018 and the financial highlights for each of the periods indicated therein in conformity with accounting principles generally accepted in the United States of America.
Basis for Opinion
These financial statements are the responsibility of the Fund’s management. Our responsibility is to express an opinion on the Fund’s financial statements based on our audits. We are a public accounting firm registered with the Public Company Accounting Oversight Board (United States) (PCAOB) and are required to be independent with respect to the Fund in accordance with the U.S. federal securities laws and the applicable rules and regulations of the Securities and Exchange Commission and the PCAOB.
We conducted our audits of these financial statements in accordance with the standards of the PCAOB. Those standards require that we plan and perform the audit to obtain reasonable assurance about whether the financial statements are free of material misstatement, whether due to error or fraud.
Our audits included performing procedures to assess the risks of material misstatement of the financial statements, whether due to error or fraud, and performing procedures that respond to those risks. Such procedures included examining, on a test basis, evidence regarding the amounts and disclosures in the financial statements. Our audits also included evaluating the accounting principles used and significant estimates made by management, as well as evaluating the overall presentation of the financial statements. Our procedures included confirmation of securities owned as of December 31, 2018 by correspondence with the custodian and transfer agent. We believe that our audits provide a reasonable basis for our opinion.
PricewaterhouseCoopers LLP
Houston, TX
February 28, 2019
We have served as the auditor of one or more of the investment companies in the Invesco group of investment companies since at least 1995. We have not been able to determine the specific year we began serving as auditor.
23 Invesco International Small Company Fund
Calculating your ongoing Fund expenses
Example
As a shareholder of the Fund, you incur two types of costs: (1) transaction costs, which may include sales charges (loads) on purchase payments or contingent deferred sales charges on redemptions, if any; and (2) ongoing costs, including management fees, distribution and/or service (12b-1) fees, and other Fund expenses. This example is intended to help you understand your ongoing costs (in dollars) of investing in the Fund and to compare these costs with ongoing costs of investing in other mutual funds. The example is based on an investment of $1,000 invested at the beginning of the period and held for the entire period July 1, 2018 through December 31, 2018.
Actual expenses
The table below provides information about actual account values and actual expenses. You may use the information in this table, together with the amount you invested, to estimate the expenses that you paid over the period. Simply divide your account value by $1,000 (for example, an $8,600 account value divided by $1,000 = 8.6), then multiply the result by the number in the table under the heading entitled “Actual Expenses Paid During Period” to estimate the expenses you paid on your account during this period.
Hypothetical example for comparison purposes
The table below also provides information about hypothetical account values and hypothetical expenses based on the Fund’s actual expense ratio and an assumed rate of return of 5% per year before expenses, which is not the Fund’s actual return.
The hypothetical account values and expenses may not be used to estimate the actual ending account balance or expenses you paid for the period. You may use this information to compare the ongoing costs of investing in the Fund and other funds. To do so, compare this 5% hypothetical example with the 5% hypothetical examples that appear in the shareholder reports of the other funds.
Please note that the expenses shown in the table are meant to highlight your ongoing costs only and do not reflect any transaction costs, such as sales charges (loads) on purchase payments or contingent deferred sales charges on redemptions, if any. Therefore, the hypothetical information is useful in comparing ongoing costs only, and will not help you determine the relative total costs of owning different funds. In addition, if these transaction costs were included, your costs would have been higher.
| | | | | | | | | | | | | | | | | | | | | | | | |
| Class | | Beginning
Account Value
(07/01/18) | | | ACTUAL | | | HYPOTHETICAL (5% annual return before
expenses) | | | Annualized
Expense
Ratio | |
| | Ending
Account Value
(12/31/18)1 | | | Expenses
Paid During
Period2 | | | Ending
Account Value
(12/31/18) | | | Expenses
Paid During
Period2 | |
| A | | $ | 1,000.00 | | | $ | 847.10 | | | $ | 7.22 | | | $ | 1,017.39 | | | $ | 7.88 | | | | 1.55 | % |
| C | | | 1,000.00 | | | | 844.30 | | | | 10.69 | | | | 1,013.61 | | | | 11.67 | | | | 2.30 | |
| Y | | | 1,000.00 | | | | 848.50 | | | | 6.06 | | | | 1,018.65 | | | | 6.61 | | | | 1.30 | |
| R5 | | | 1,000.00 | | | | 848.60 | | | | 5.59 | | | | 1,019.16 | | | | 6.11 | | | | 1.20 | |
| R6 | | | 1,000.00 | | | | 849.30 | | | | 5.22 | | | | 1,019.56 | | | | 5.70 | | | | 1.12 | |
| 1 | The actual ending account value is based on the actual total return of the Fund for the period July 1, 2018 through December 31, 2018, after actual expenses and will differ from the hypothetical ending account value which is based on the Fund’s expense ratio and a hypothetical annual return of 5% before expenses. |
| 2 | Expenses are equal to the Fund’s annualized expense ratio as indicated above multiplied by the average account value over the period, multiplied by 184/365 to reflect the most recent fiscal half year. |
24 Invesco International Small Company Fund
Tax Information
Form1099-DIV, Form 1042-S and other year-end tax information provide shareholders with actual calendar year amounts that should be included in their tax returns. Shareholders should consult their tax advisors.
The following distribution information is being provided as required by the Internal Revenue Code or to meet a specific state’s requirement.
The Fund designates the following amounts or, if subsequently determined to be different, the maximum amount allowable for its fiscal year ended December 31, 2018:
| | | | |
Federal and State Income Tax | |
Long-Term Capital Gain Distributions | | $ | 3,820,827 | |
Qualified Dividend Income* | | | 96.81 | % |
Corporate Dividends Received Deduction* | | | 0.00 | % |
U.S. Treasury Obligations* | | | 0.00 | % |
Foreign Taxes | | $ | 0.0552 | per share |
Foreign Source Income | | $ | 0.6964 | per share |
| | * | The above percentages are based on ordinary income dividends paid to shareholders during the Fund’s fiscal year. |
25 Invesco International Small Company Fund
Trustees and Officers
The address of each trustee and officer is AIM Funds Group (Invesco Funds Group) (the “Trust”), 11 Greenway Plaza, Suite 1000, Houston, Texas 77046-1173. The trustees serve for the life of the Trust, subject to their earlier death, incapacitation, resignation, retirement or removal as more specifically provided in the Trust’s organizational documents. Each officer serves for a one year term or until their successors are elected and qualified. Column two below includes length of time served with predecessor entities, if any.
| | | | | | | | |
Name, Year of Birth and
Position(s) Held with the Trust | | Trustee and/
or Officer Since | | Principal Occupation(s)
During Past 5 Years | | Number of
Funds in Fund
Complex
Overseen by
Trustee | | Other Directorship(s)
Held by Trustee During
Past 5 Years |
| Interested Persons | | | | | | | | |
| Martin L. Flanagan1 — 1960 Trustee | | 2007 | | Executive Director, Chief Executive Officer and President, Invesco Ltd. (ultimate parent of Invesco and a global investment management firm); Trustee, The Invesco Funds; Vice Chair, Investment Company Institute; and Member of Executive Board, SMU Cox School of Business Formerly: Advisor to the Board, Invesco Advisers, Inc. (formerly known as Invesco Institutional (N.A.), Inc.); Chairman and Chief Executive Officer, Invesco Advisers, Inc. (registered investment adviser); Director, Chairman, Chief Executive Officer and President, Invesco Holding Company (US), Inc. (formerly IVZ Inc.) (holding company), Invesco Group Services, Inc. (service provider) and Invesco North American Holdings, Inc. (holding company); Director, Chief Executive Officer and President, Invesco Holding Company Limited (parent of Invesco and a global investment management firm); Director, Invesco Ltd.; Chairman, Investment Company Institute and President, Co-Chief Executive Officer, Co-President, Chief Operating Officer and Chief Financial Officer, Franklin Resources, Inc. (global investment management organization) | | 158 | | None |
| Philip A. Taylor2 — 1954 Trustee and Senior Vice President | | 2006 | | Head of the Americas and Senior Managing Director, Invesco Ltd.; Director, Invesco Advisers, Inc. (formerly known as Invesco Institutional (N.A.), Inc.) (registered investment adviser); Director and Chairman, Invesco Investment Services, Inc. (formerly known as Invesco AIM Investment Services, Inc.) (registered transfer agent); Chief Executive Officer, Invesco Corporate Class Inc. (corporate mutual fund company); Director, Chairman and Chief Executive Officer, Invesco Canada Ltd. (formerly known as Invesco Trimark Ltd./Invesco Trimark Ltèe) (registered investment adviser and registered transfer agent); Trustee and Senior Vice President, The Invesco Funds; Director, Invesco Investment Advisers LLC (formerly known as Van Kampen Asset Management) Formerly: Director, Chairman, Chief Executive Officer and President, Invesco Management Group, Inc. (formerly known as Invesco AIM Management Group, Inc.) (financial services holding company); Co-Chairman, Co-President and Co-Chief Executive Officer, Invesco Advisers, Inc. (formerly known as Invesco Institutional (N.A.), Inc.) (registered investment adviser); Director, Chief Executive Officer and President, Van Kampen Exchange Corp; President and Principal Executive Officer, The Invesco Funds (other than AIM Treasurer’s Series Trust (Invesco Treasurer’s Series Trust), Short-Term Investments Trust and Invesco Management Trust); Executive Vice President, The Invesco Funds (AIM Treasurer’s Series Trust (Invesco Treasurer’s Series Trust), Short-Term Investments Trust and Invesco Management Trust only); Director and President, INVESCO Funds Group, Inc. (registered investment adviser and registered transfer agent); Director and Chairman, IVZ Distributors, Inc. (formerly known as INVESCO Distributors, Inc.) (registered broker dealer); Director, President and Chairman, Invesco Inc. (holding company), Invesco Canada Holdings Inc. (holding company), Trimark Investments Ltd./Placements Trimark Ltèe and Invesco Financial Services Ltd/Services Financiers Invesco Ltèe; Chief Executive Officer, Invesco Canada Fund Inc. (corporate mutual fund company); Director and Chairman, Van Kampen Investor Services Inc.; Director, Chief Executive Officer and President, 1371 Preferred Inc. (holding company) and Van Kampen Investments Inc.; Director and President, AIM GP Canada Inc. (general partner for limited partnerships) and Van Kampen Advisors, Inc.; Director and Chief Executive Officer, Invesco Trimark Dealer Inc. (registered broker dealer); Director, Invesco Distributors, Inc. (formerly known as Invesco AIM Distributors, Inc.) (registered broker dealer); Manager, Invesco Capital Management LLC; Director, Chief Executive Officer and President, Invesco Advisers, Inc.; Director, Chairman, Chief Executive Officer and President, Invesco AIM Capital Management, Inc.; President, Invesco Trimark Dealer Inc. and Invesco Trimark Ltd./Invesco Trimark Ltèe; Director and President, AIM Trimark Corporate Class Inc. and AIM Trimark Canada Fund Inc.; Senior Managing Director, Invesco Holding Company Limited; Director and Chairman, Fund Management Company (former registered broker dealer); President and Principal Executive Officer, The Invesco Funds (AIM Treasurer’s Series Trust (Invesco Treasurer’s Series Trust), and Short-Term Investments Trust only); President, AIM Trimark Global Fund Inc. and AIM Trimark Canada Fund Inc. | | 158 | | None |
| 1 | Mr. Flanagan is considered an interested person (within the meaning of Section 2(a)(19) of the 1940 Act) of the Trust because he is an officer of the Adviser to the Trust, and an officer and a director of Invesco Ltd., ultimate parent of the Adviser. |
| 2 | Mr. Taylor is considered an interested person (within the meaning of Section 2(a)(19) of the 1940 Act) of the Trust because he is an officer and a director of the Adviser. |
T-1 Invesco International Small Company Fund
Trustees and Officers—(continued)
| | | | | | | | |
Name, Year of Birth and
Position(s) Held with the Trust | | Trustee and/
or Officer Since | | Principal Occupation(s)
During Past 5 Years | | Number of
Funds in Fund
Complex
Overseen by
Trustee | | Other Directorship(s)
Held by Trustee During
Past 5 Years |
| Independent Trustees | | | | | | | | |
Bruce L. Crockett — 1944 Trustee and Chair | | 1987 | | Chairman, Crockett Technologies Associates (technology consulting company) Formerly: Director, Captaris (unified messaging provider); Director, President and Chief Executive Officer, COMSAT Corporation; Chairman, Board of Governors of INTELSAT (international communications company); ACE Limited (insurance company); Independent Directors Council and Investment Company Institute: Member of the Audit Committee, Investment Company Institute; Member of the Executive Committee and Chair of the Governance Committee, Independent Directors Council | | 158 | | Director and Chairman of the Audit Committee, ALPS (Attorneys Liability Protection Society) (insurance company); Director and Member of the Audit Committee and Compensation Committee, Ferroglobe PLC (metallurgical company) |
David C. Arch — 1945 Trustee | | 2010 | | Chairman of Blistex Inc. (consumer health care products manufacturer); Member, World Presidents’ Organization | | 158 | | Board member of the Illinois Manufacturers’ Association |
Jack M. Fields — 1952 Trustee | | 1997 | | Chief Executive Officer, Twenty First Century Group, Inc. (government affairs company); and Chairman, Discovery Learning Alliance (non-profit) Formerly: Owner and Chief Executive Officer, Dos Angeles Ranch L.P. (cattle, hunting, corporate entertainment); Director, Insperity, Inc. (formerly known as Administaff) (human resources provider); Chief Executive Officer, Texana Timber LP (sustainable forestry company); Director of Cross Timbers Quail Research Ranch (non-profit); and member of the U.S. House of Representatives | | 158 | | None |
Cynthia Hostetler — 1962 Trustee | | 2017 | | Non-Executive Director and Trustee of a number of public and private business corporations Formerly: Director, Aberdeen Investment Funds (4 portfolios); Head of Investment Funds and Private Equity, Overseas Private Investment Corporation; President, First Manhattan Bancorporation, Inc.; Attorney, Simpson Thacher & Bartlett LLP | | 158 | | Vulcan Materials Company (construction materials company); Trilinc Global Impact Fund; Genesse Wyoming, Inc. (railroads); Artio Global Investment LLC (mutual fund complex); Edgen Group, Inc. (specialized energy and infrastructure products distributor); Investment Company Institute (professional organization); Independent Directors Council (professional organization) |
Eli Jones — 1961 Trustee | | 2016 | | Professor and Dean, Mays Business School — Texas A&M University Formerly: Professor and Dean, Walton College of Business, University of Arkansas and E.J. Ourso College of Business, Louisiana State University; Director, Arvest Bank | | 158 | | Insperity, Inc. (formerly known as Administaff) (human resources provider) |
Prema Mathai-Davis — 1950 Trustee | | 1998 | | Retired Co-Owner & Partner of Quantalytics Research, LLC, (a FinTech Investment Research Platform for the Self-Directed Investor) | | 158 | | None |
Teresa M. Ressel — 1962 Trustee | | 2017 | | Non-executive director and trustee of a number of public and private business corporations Formerly: Chief Financial Officer, Olayan America, The Olayan Group (international investor/commercial/industrial); Chief Executive Officer, UBS Securities LLC; Group Chief Operating Officer, Americas, UBS AG; Assistant Secretary for Management & Budget and CFO, US Department of the Treasury | | 158 | | Atlantic Power Corporation (power generation company); ON Semiconductor Corp. (semiconductor supplier) |
Ann Barnett Stern — 1957 Trustee | | 2017 | | President and Chief Executive Officer, Houston Endowment Inc. (private philanthropic institution) Formerly: Executive Vice President and General Counsel, Texas Children’s Hospital; Attorney, Beck, Redden and Secrest, LLP; Business Law Instructor, University of St. Thomas; Attorney, Andrews & Kurth LLP | | 158 | | Federal Reserve Bank of Dallas |
Raymond Stickel, Jr. — 1944 Trustee | | 2005 | | Retired Formerly: Director, Mainstay VP Series Funds, Inc. (25 portfolios); Partner, Deloitte & Touche | | 158 | | None |
Robert C. Troccoli — 1949 Trustee | | 2016 | | Adjunct Professor, University of Denver — Daniels College of Business Formerly: Senior Partner, KPMG LLP | | 158 | | None |
Christopher L. Wilson — 1957 Trustee | | 2017 | | Non-executive director and trustee of a number of public and private business corporations Formerly: Director, TD Asset Management USA Inc. (mutual fund complex) (22 portfolios); Managing Partner, CT2, LLC (investing and consulting firm); President/Chief Executive Officer, Columbia Funds, Bank of America Corporation; President/Chief Executive Officer, CDC IXIS Asset Management Services, Inc.; Principal & Director of Operations, Scudder Funds, Scudder, Stevens & Clark, Inc.; Assistant Vice President, Fidelity Investments | | 158 | | ISO New England, Inc.(non-profit organization managing regional electricity market) |
T-2 Invesco International Small Company Fund
Trustees and Officers—(continued)
| | | | | | | | |
Name, Year of Birth and
Position(s) Held with the Trust | | Trustee and/
or Officer Since | | Principal Occupation(s)
During Past 5 Years | | Number of
Funds in Fund
Complex
Overseen by
Trustee | | Other Directorship(s)
Held by Trustee During
Past 5 Years |
| Other Officers | | | | | | | | |
Sheri Morris — 1964 President, Principal Executive Officer and Treasurer | | 1999 | | President, Principal Executive Officer and Treasurer, The Invesco Funds; Vice President, Invesco Advisers, Inc. (formerly known as Invesco Institutional (N.A.), Inc.) (registered investment adviser); and Vice President, Invesco Exchange-Traded Fund Trust, Invesco Exchange-Traded Fund Trust II, Invesco India Exchange-Traded Fund Trust, Invesco Actively Managed Exchange-Traded Fund Trust, Invesco Actively Managed Exchange-Traded Commodity Fund Trust and Invesco Exchange-Traded Self-Indexed Fund Trust Formerly: Vice President and Principal Financial Officer, The Invesco Funds; Vice President, Invesco AIM Advisers, Inc., Invesco AIM Capital Management, Inc. and Invesco AIM Private Asset Management, Inc.; Assistant Vice President and Assistant Treasurer, The Invesco Funds and Assistant Vice President, Invesco Advisers, Inc., Invesco AIM Capital Management, Inc. and Invesco AIM Private Asset Management, Inc.; and Treasurer, Invesco Exchange-Traded Fund Trust, Invesco Exchange-Traded Fund Trust II, Invesco India Exchange-Traded Fund Trust and Invesco Actively Managed Exchange-Traded Fund Trust | | N/A | | N/A |
| Russell C. Burk — 1958 Senior Vice President and Senior Officer | | 2005 | | Senior Vice President and Senior Officer, The Invesco Funds | | N/A | | N/A |
Jeffrey H. Kupor — 1968 Senior Vice President, Chief Legal Officer and Secretary | | 2018 | | Head of Legal of the Americas; Senior Vice President and Secretary, Invesco Advisers, Inc. (formerly known as Invesco Institutional (N.A.), Inc.) (registered investment adviser); Senior Vice President and Secretary, Invesco Distributors, Inc. (formerly known as Invesco AIM Distributors, Inc.); Vice President and Secretary, Invesco Investment Services, Inc. (formerly known as Invesco AIM Investment Services, Inc.) Senior Vice President, Chief Legal Officer and Secretary, The Invesco Funds; Secretary and General Counsel, Invesco Investment Advisers LLC (formerly known as Van Kampen Asset Management); Secretary and General Counsel, Invesco Capital Markets, Inc. (formerly known as Van Kampen Funds Inc.) and Chief Legal Officer, Invesco Exchange-Traded Fund Trust, Invesco Exchange-Traded Fund Trust II, Invesco India Exchange-Traded Fund Trust, Invesco Actively Managed Exchange-Traded Fund Trust, Invesco Actively Managed Exchange-Traded Commodity Fund Trust and Invesco Exchange-Traded Self-Indexed Fund Trust; Secretary, Invesco Indexing LLC; Secretary, W.L. Ross & Co., LLC; Secretary and Vice President, Jemstep, Inc. Formerly: Head of Legal, Worldwide Institutional; Secretary and General Counsel, INVESCO Private Capital Investments, Inc.; Senior Vice President, Secretary and General Counsel, Invesco Management Group, Inc. (formerly known as Invesco AIM Management Group, Inc.); Assistant Secretary, INVESCO Asset Management (Bermuda) Ltd.; Secretary and General Counsel, Invesco Private Capital, Inc.; Assistant Secretary and General Counsel, INVESCO Realty, Inc.; Secretary and General Counsel, Invesco Senior Secured Management, Inc.; and Secretary, Sovereign G./P. Holdings Inc. | | N/A | | N/A |
John M. Zerr — 1962 Senior Vice President | | 2006 | | Chief Operating Officer of the Americas; Senior Vice President, Invesco Advisers, Inc. (formerly known as Invesco Institutional (N.A.), Inc.) (registered investment adviser); Senior Vice President, Invesco Distributors, Inc. (formerly known as Invesco AIM Distributors, Inc.); Director and Vice President, Invesco Investment Services, Inc. (formerly known as Invesco AIM Investment Services, Inc.) Senior Vice President, The Invesco Funds; Managing Director, Invesco Capital Management LLC; Director, Invesco Investment Advisers LLC (formerly known as Van Kampen Asset Management); Senior Vice President, Invesco Capital Markets, Inc. (formerly known as Van Kampen Funds Inc.); Manager, Invesco Indexing LLC Formerly: Director and Senior Vice President, Invesco Management Group, Inc. (formerly known as Invesco AIM Management Group, Inc.); Secretary and General Counsel, Invesco Management Group, Inc. (formerly known as Invesco AIM Management Group, Inc.); Secretary, Invesco Investment Services, Inc. (formerly known as Invesco AIM Investment Services, Inc.); Chief Legal Officer and Secretary, The Invesco Funds; Secretary and General Counsel, Invesco Investment Advisers LLC (formerly known as Van Kampen Asset Management); Secretary and General Counsel, Invesco Capital Markets, Inc. (formerly known as Van Kampen Funds Inc.); Chief Legal Officer, Invesco Exchange-Traded Fund Trust, Invesco Exchange-Traded Fund Trust II, Invesco India Exchange-Traded Fund Trust, Invesco Actively Managed Exchange-Traded Fund Trust, Invesco Actively Managed Exchange-Traded Commodity Fund Trust and Invesco Exchange-Traded Self-Indexed Fund Trust; Secretary, Invesco Indexing LLC; Director, Secretary, General Counsel and Senior Vice President, Van Kampen Exchange Corp.; Director, Vice President and Secretary, IVZ Distributors, Inc. (formerly known as INVESCO Distributors, Inc.); Director and Vice President, INVESCO Funds Group, Inc.; Director and Vice President, Van Kampen Advisors Inc.; Director, Vice President, Secretary and General Counsel, Van Kampen Investor Services Inc.; Director and Secretary, Invesco Distributors, Inc. (formerly known as Invesco AIM Distributors, Inc.); Director, Senior Vice President, General Counsel and Secretary, Invesco AIM Advisers, Inc. and Van Kampen Investments Inc.; Director, Vice President and Secretary, Fund Management Company; Director, Senior Vice President, Secretary, General Counsel and Vice President, Invesco AIM Capital Management, Inc.; Chief Operating Officer and General Counsel, Liberty Ridge Capital, Inc. (an investment adviser) | | N/A | | N/A |
T-3 Invesco International Small Company Fund
Trustees and Officers—(continued)
| | | | | | | | |
Name, Year of Birth and
Position(s) Held with the Trust | | Trustee and/
or Officer Since | | Principal Occupation(s)
During Past 5 Years | | Number of
Funds in Fund
Complex
Overseen by
Trustee | | Other Directorship(s)
Held by Trustee During
Past 5 Years |
| Other Officers—(continued) | | | | | | | | |
Gregory G. McGreevey — 1962 Senior Vice President | | 2012 | | Senior Managing Director, Invesco Ltd.; Director, Chairman, President, and Chief Executive Officer, Invesco Advisers, Inc. (formerly known as Invesco Institutional (N.A.), Inc.) (registered investment adviser); Director, Invesco Mortgage Capital, Inc. and Invesco Senior Secured Management, Inc.; and Senior Vice President, The Invesco Funds Formerly: Senior Vice President, Invesco Management Group, Inc. and Invesco Advisers, Inc.; Assistant Vice President, The Invesco Funds | | N/A | | N/A |
Kelli Gallegos — 1970 Vice President, Principal Financial Officer and Assistant Treasurer | | 2008 | | Vice President and Treasurer, Invesco Exchange-Traded Fund Trust, Invesco Exchange-Traded Fund Trust II, Invesco India Exchange-Traded Fund Trust, Invesco Actively Managed Exchange-Traded Fund Trust, Invesco Actively Managed Exchange-Traded Commodity Fund Trust and Invesco Exchange-Traded Self-Indexed Fund Trust; Vice President, Principal Financial Officer and Assistant Treasurer, The Invesco Funds; Principal Financial and Accounting Officer — Pooled Investments, Invesco Capital Management LLC Formerly: Assistant Treasurer, Invesco Exchange-Traded Fund Trust, Invesco Exchange-Traded Fund Trust II, Invesco India Exchange-Traded Fund Trust, Invesco Actively Managed Exchange-Traded Fund Trust, Invesco Actively Managed Exchange-Traded Commodity Fund Trust and Invesco Exchange-Traded Self-Indexed Fund Trust; Assistant Treasurer, Invesco Capital Management LLC; Assistant Vice President, The Invesco Funds | | N/A | | N/A |
Tracy Sullivan — 1962 Vice President, Chief Tax Officer and Assistant Treasurer | | 2008 | | Vice President, Chief Tax Officer and Assistant Treasurer, The Invesco Funds; Assistant Treasurer, Invesco Capital Management LLC, Invesco Exchange-Traded Fund Trust, Invesco Exchange-Traded Fund Trust II, Invesco India Exchange-Traded Fund Trust, Invesco Actively Managed Exchange-Traded Fund Trust, Invesco Actively Managed Exchange-Traded Commodity Fund Trust and Invesco Exchange-Traded Self-Indexed Fund Trust Formerly: Assistant Vice President, The Invesco Funds | | N/A | | N/A |
Crissie M. Wisdom — 1969 Anti-Money Laundering Compliance Officer | | 2013 | | Anti-Money Laundering Compliance Officer, Invesco Advisers, Inc. (formerly known as Invesco Institutional (N.A.), Inc.) (registered investment adviser), Invesco Capital Markets, Inc. (formerly known as Van Kampen Funds Inc.), Invesco Distributors, Inc., Invesco Investment Services, Inc., The Invesco Funds, and Invesco Exchange-Traded Fund Trust, Invesco Exchange-Traded Fund Trust II, Invesco India Exchange-Traded Fund Trust, Invesco Actively Managed Exchange-Traded Fund Trust, Invesco Actively Managed Exchange-Traded Commodity Fund Trust and Invesco Exchange-Traded Self-Indexed Fund Trust; Anti-Money Laundering Compliance Officer and Bank Secrecy Act Officer, INVESCO National Trust Company and Invesco Trust Company; and Fraud Prevention Manager and Controls and Risk Analysis Manager for Invesco Investment Services, Inc. Formerly: Anti-Money Laundering Compliance Officer, Van Kampen Exchange Corp. and Invesco Management Group, Inc. | | N/A | | N/A |
Robert R. Leveille — 1969 Chief Compliance Officer | | 2016 | | Chief Compliance Officer, Invesco Advisers, Inc. (registered investment adviser); and Chief Compliance Officer, The Invesco Funds Formerly: Chief Compliance Officer, Putnam Investments and the Putnam Funds | | N/A | | N/A |
The Statement of Additional Information of the Trust includes additional information about the Fund’s Trustees and is available upon request, without charge, by calling 1.800.959.4246. Please refer to the Fund’s Statement of Additional Information for information on the Fund’s sub-advisers.
| | | | | | |
Office of the Fund 11 Greenway Plaza, Suite 1000 Houston, TX 77046-1173 | | Investment Adviser Invesco Advisers, Inc. 1555 Peachtree Street, N.E. Atlanta, GA 30309 | | Distributor Invesco Distributors, Inc. 11 Greenway Plaza, Suite 1000 Houston, TX 77046-1173 | | Auditors PricewaterhouseCoopers LLP 1000 Louisiana Street, Suite 5800 Houston, TX 77002-5021 |
| | | |
| | | | | | |
Counsel to the Fund Stradley Ronon Stevens & Young, LLP 2005 Market Street, Suite 2600 Philadelphia, PA 19103-7018 | | Counsel to the Independent Trustees Goodwin Procter LLP 901 New York Avenue, N.W. Washington, D.C. 20001 | | Transfer Agent Invesco Investment Services, Inc. 11 Greenway Plaza, Suite 1000 Houston, TX 77046-1173 | | Custodian State Street Bank and Trust Company 225 Franklin Street Boston, MA 02110-2801 |
T-4 Invesco International Small Company Fund
Explore High-Conviction Investing with Invesco

Go paperless with eDelivery
Visit invesco.com/edelivery to enjoy the convenience and security of anytime electronic access to your investment documents.
With eDelivery, you can elect to have any or all of the following materials delivered straight to your inbox to download, save and print from your own computer:
⬛ Fund reports and prospectuses
⬛ Quarterly statements
⬛ Daily confirmations
⬛ Tax forms
Invesco mailing information
Send general correspondence to Invesco Investment Services, Inc., P.O. Box 219078, Kansas City, MO 64121-9078.
Important notice regarding delivery of security holder documents
To reduce Fund expenses, only one copy of most shareholder documents may be mailed to shareholders with multiple accounts at the same address (Householding). Mailing of your shareholder documents may be householded indefinitely unless you instruct us otherwise. If you do not want the mailing of these documents to be combined with those for other members of your household, please contact Invesco Investment Services, Inc. at 800 959 4246 or contact your financial institution. We will begin sending you individual copies for each account within 30 days after receiving your request.
Fund holdings and proxy voting information
The Fund provides a complete list of its holdings four times in each fiscal year, at the quarter ends. For the second and fourth quarters, the lists appear in the Fund’s semiannual and annual reports to shareholders. For the first and third quarters, the Fund files the lists with the Securities and Exchange Commission (SEC) on FormN-Q (or any successor Form). The most recent list of portfolio holdings is available at invesco.com/completeqtrholdings. Shareholders can also look up the Fund’s FormsN-Q (or any successor Form) on the SEC website at sec.gov. The SEC file numbers for the Fund are shown below.
A description of the policies and procedures that the Fund uses to determine how to vote proxies relating to portfolio securities is available without charge, upon request, from our Client Services department at 800 959 4246 or at invesco.com/proxyguidelines. The information is also available on the SEC website, sec.gov.
| | |
Information regarding how the Fund voted proxies related to its portfolio securities during the most recent12-month period ended June 30 is available at invesco.com/proxysearch. The information is also available on the SEC website, sec.gov. Invesco Advisers, Inc. is an investment adviser; it provides investment advisory services to individual and institutional clients and does not sell securities. Invesco Distributors, Inc. is the US distributor for Invesco Ltd.’s retail mutual funds, exchange-traded funds and institutional money market funds. Both are wholly owned, indirect subsidiaries of Invesco Ltd. | | |
| |
| SEC file numbers:811-01540 and002-27334 Invesco Distributors, Inc. ISC-AR-1 | | 02222019 1444 |
| | |
 | | Annual Report to Shareholders December 31, 2018 |
| | Invesco Small Cap Equity Fund |
| | Nasdaq: A: SMEAX ∎ C: SMECX ∎ R: SMERX ∎ Y: SMEYX ∎ R5: SMEIX ∎ R6: SMEFX |

Letters to Shareholders
| | |

Philip Taylor | | Dear Shareholders: |
| | This annual report includes information about your Fund, including performance data and a complete list of its investments as of the close of the reporting period. Inside is a discussion of how your Fund was managed and the factors that affected its performance during the reporting period. From record market highs to an explosive late-year downturn, 2018 was a memorable and volatile year for investors. US equity markets entered 2018 enthused by corporate tax cuts and improving global growth. Despite asell-off in February, several US equity indexes continued to redefine highs for the first three quarters of the year. The ebullience, however, ended in October as global equities, in particular US stocks, sold off sharply and continued this volatile downward spiral for the rest of the year. The catalyst for thesell-off was a combination of ongoing trade |
| conflicts between the US and China, fears of a global economic slowdown and rising US interest rates. Gains posted earlier in the year were erased as most US and international equity indexes ended 2018 in negative territory. During the late-year equitysell-off, Treasury bonds, along with government and municipal bonds, rallied. In general, fixed income markets outperformed equity markets for the year as yields declined from earlier highs and, conversely, bond prices rose. Given the strong economy, the US Federal Reserve (the Fed) raised the federal funds rate four times in 2018. In December, however, the Fed delivered a more “dovish hike” by simultaneously raising rates while reducing guidance for 2019 rate increases from three to two. As 2019 unfolds, we’ll see how the interplay of interest rates, economic data, geopolitics and a host of other factors affect US and overseas equity and fixed income markets. |
Short-term market volatility can prompt some investors to abandon their investment plans – and can cause others to settle for whatever returns the market has to offer. The investment professionals at Invesco, in contrast, invest with high conviction. This means that, no matter the asset class or the strategy, each investment team has a passion to exceed. We want to help investors achieve better outcomes, such as seeking higher returns, helping mitigate risk and generating income. Of course, investing with high conviction can’t guarantee a profit or ensure success; no investment strategy can. To learn more about how we invest with high conviction, visitinvesco.com/HighConviction.
You, too, can invest with high conviction by maintaining a long-term investment perspective and by working with your financial adviser on a regular basis. During periods of short-term market volatility or uncertainty, your financial adviser can keep you focused on your long-term investment goals – a new home, a child’s college education or a secure retirement. He or she also can share research about the economy, the markets and individual investment options.
Visit our website for more information on your investments
Our website,invesco.com/us, offers a wide range of market insights and investment perspectives. On the website, you’ll find detailed information about our funds, including performance, holdings and portfolio manager commentaries. You can access information about your account by completing a simple, secure online registration. To do so, select “Log In” on the right side of the homepage, and then select “Register for Individual Account Access.”
In addition to the resources accessible on our website and through our mobile app, you can obtain timely updates to help you stay informed about the markets and the economy by connecting with Invesco on Twitter, LinkedIn or Facebook. You can access our blog atblog.invesco.us.com. Our goal is to provide you the information you want, when and where you want it.
Finally, I’m pleased to share with you Invesco’s commitment to both the Principles for Responsible Investment and to considering environmental, social and governance issues in our robust investment process. I invite you to learn more atinvesco.com/esg.
Have questions?
For questions about your account, contact an Invesco client services representative at 800 959 4246.
All of us at Invesco look forward to serving your investment management needs. Thank you for investing with us.
Sincerely,

Philip Taylor
Senior Managing Director, Invesco Ltd.
2 Invesco Small Cap Equity Fund
| | |

Bruce Crockett | | Dear Fellow Shareholders: Among the many important lessons I’ve learned in more than 40 years in a variety of business endeavors is the value of a trusted advocate. As independent chair of the Invesco Funds Board, I can assure you that the members of the Board are strong advocates for the interests of investors in Invesco’s mutual funds. We work hard to represent your interests through oversight of the quality of the investment management services your funds receive and other matters important to your investment, including but not limited to: ∎ Ensuring that Invesco offers a diverse lineup of mutual funds that your financial adviser can use to strive to meet your financial needs as your investment goals change over time. ∎ Monitoring how the portfolio management teams of the Invesco funds are performing in light of changing economic and market conditions. |
| ∎ | | Assessing each portfolio management team’s investment performance within the context of the investment strategy described in the fund’s prospectus. |
| ∎ | | Monitoring for potential conflicts of interests that may impact the nature of the services that your funds receive. |
We believe one of the most important services we provide our fund shareholders is the annual review of the funds’ advisory andsub-advisory contracts with Invesco Advisers and its affiliates. This review is required by the Investment Company Act of 1940 and focuses on the nature and quality of the services Invesco provides as the adviser to the Invesco funds and the reasonableness of the fees that it charges for those services. Each year, we spend months carefully reviewing information received from Invesco and a variety of independent sources, such as performance and fee data prepared by Lipper, Inc. (a subsidiary of Broadridge Financial Solutions, Inc.), an independent, third-party firm widely recognized as a leader in its field. We also meet with our independent legal counsel and other independent advisers to review and help us assess the information that we have received. Our goal is to assure that you receive quality investment management services for a reasonable fee.
I trust the measures outlined above provide assurance that you have a worthy advocate when it comes to choosing the Invesco Funds. On behalf of the Board, we look forward to continuing to represent your interests and serving your needs.
Sincerely,

Bruce L. Crockett
Independent Chair
Invesco Funds Board of Trustees
3 Invesco Small Cap Equity Fund
Management’s Discussion of Fund Performance
| | | | | | |
Performance summary For the year ended December 31, 2018, Class A shares of Invesco Small Cap Equity Fund (the Fund), at net asset value (NAV), underperformed the Russell 2000 Index, the Fund’s style-specific benchmark. Your Fund’s long-term performance appears later in this report. | |
Fund vs. Indexes Total returns, 12/31/17 to 12/31/18, at net asset value (NAV). Performance shown does not include applicable contingent deferred sales charges (CDSC) orfront-end sales charges, which would have reduced performance. | |
| Class A Shares | | | | | –15.16% | |
| Class C Shares | | | | | –15.76 | |
| Class R Shares | | | | | –15.35 | |
| Class Y Shares | | | | | –14.92 | |
| Class R5 Shares | | | | | –14.79 | |
| Class R6 Shares | | | | | –14.75 | |
| S&P 500 Indexq (Broad Market Index) | | | –4.38 | |
| Russell 2000 Index∎(Style-Specific Index) | | | –11.01 | |
| LipperSmall-Cap Core Funds Indext(Peer Group Index) | | | –11.19 | |
Source(s)qFactSet Research Systems Inc.;∎RIMES Technologies Corp.;tLipper Inc. | |
Market conditions and your Fund
Calendar year 2018 proved to be an increasingly volatile time for US equities. In January 2018, US equity markets steadily moved higher, as investors remained enthused about the passage of the Tax Cuts and Jobs Act signed into law in late December 2017. However, in February 2018, volatility returned to the US stock and bond markets. Worries about how rising interest rates might affect economic growth, concerns about a potential trade war and heightened geopolitical tensions, caused the US stock markets to pull back and volatility to increase.
US equity markets generally recovered in the second quarter of 2018 as strong US retail sales and low unemployment buoyed markets. Throughout the summer, US equities moved higher as corporate profits surged. Several US equity indexes reached new highs despite potential headwinds including trade tensions, tariff announcements and contagion
| | | | |
Portfolio Composition | |
| By sector % of total net assets | |
Financials | | | 19.4% | |
Information Technology | | | 17.7 | |
Industrials | | | 17.6 | |
Health Care | | | 13.8 | |
Consumer Discretionary | | | 12.5 | |
Real Estate | | | 4.2 | |
Materials | | | 3.6 | |
Energy | | | 3.6 | |
Communication Services | | | 3.4 | |
Utilities | | | 1.1 | |
Consumer Staples | | | 1.0 | |
Money Market Funds | | | | |
Plus Other Assets Less Liabilities | | | 2.1 | |
concerns over a Turkish currency crisis. After a relatively quiet summer, market volatility noticeably rose in October, as US equity markets suffered a sharp sell-off through year-end, amid rising interest rates and concerns that higher inflation could mean a more restrictive monetary policy. In this environment, there was a flight to safety, as investors fled to defensive areas of the equities markets, like health care and utilities, and US Treasuries.
Given signs of a strong economy, the US Federal Reserve raised interest rates four times during the year: in March, June, September and December 2018. Following December’s Federal Reserve meeting, Chairman Jerome Powell raised interest rates for the fourth time in 2018 to a targeted range of 2.25% to 2.50%, and lowered guidance from three to two rate hikes in 2019, signaling a slightly more dovish stance than expected.1 In contrast, the European Central Bank and
| | |
Top 10 Equity Holdings* |
| % of total net assets |
1. SPX Corp. | | 1.9% |
2. Iridium Communications Inc. | | 1.9 |
3. Hanover Insurance Group Inc. (The) | | 1.7 |
4. STERIS PLC | | 1.6 |
5. Webster Financial Corp. | | 1.5 |
6. Jack Henry & Associates, Inc. | | 1.5 |
7. Argo Group International Holdings, Ltd. | | 1.5 |
8. Array BioPharma, Inc. | | 1.5 |
9. Take-Two Interactive Software, Inc. | | 1.5 |
10.Wolverine World Wide, Inc. | | 1.5 |
central banks in several other countries maintained extraordinarily accommodative monetary policies.
Within this environment, stock selection helped the Fund outperform its style-specific index in the communication services, health care, real estate and industrials sectors. The Fund’s ancillary cash position also helped to mitigate losses in a down year. In contrast, these contributions were offset by the relative underperformance of holdings in the consumer discretionary, financials, information technology (IT) and energy sectors. Relatively small exposure in the defensive utilities sector also detracted from relative performance for the year given the choppy market.
California-based IT companyCoherentwas the leading detractor from the Fund’s performance on both a relative and absolute basis for the year. The laser system manufacturer experienced weakness during the year as a result of Apple’s (not a Fund holding) organic light-emitting diode (OLED) adoption concerns, which drove a brief stagnant period in the OLED market. These concerns impacted growth prospect for Coherent’s laser business as the company cuts the OLED panels. In addition, US-China trade tensions have also put pressure on Coherent’s stock price as China has been adopting laser technology in many industrial applications, including automobile manufacturing.
Visteon, a global automotive supplier, was another detractor from both absolute and relative Fund performance for the year. Headwinds included decelerating auto sales in China due to a softer economy, European production delays related to the implementation of the Worldwide Harmonize Light Vehicle Test Procedure (testing for CO2 emissions and fuel efficiency) and potential pressures
|
Total Net Assets $868.5 million |
Total Number of Holdings* 94 |
| The Fund’s holdings are subject to change, and there is no assurance that the Fund will continue to hold any particular security. |
| *Excluding money market fund holdings. |
| Data presented here are as of December 31, 2018. |
4 Invesco Small Cap Equity Fund
from higher raw material costs, emerging markets weakness and tariff risks.
Energy sector holdingsForum Energy Technologies,Core Laboratories andMatador Resources, were among the leading detractors from Fund results during the year. Lower oil prices led to reduced activity levels for exploration and production companies. This depressed spending environment weighed on the oilfield services group during the year.
Iridium Communications, one of the Fund’s top 10 holdings, was a leading contributor to the Fund’s annual results from the communication services sector. The satellite communications company provides 100% global coverage, even in the middle of the desert or to phones on remote oil rigs. Iridium planned to launch its ninth and final satellite for the Iridium Next platform, which is a recurring20-year capital expenditure cycle, in late 2018. The final launch was pushed back until the first quarter of 2019. With the final satellite’s launch, the company’s network will speed up and open up new markets and is expected to generate substantial free cash flow.
IT sector constituentZebra Technologies reported strong quarterly results across the board in 2018, which continued a string of better-than-expected performance. The company’s forward guidance also exceeded expectations for the year. Its strong results were powered by robust organic growth, which accelerated since we originally bought the stock. New products and strength in mobile computing drove the company’s impressive execution. We exited our Zebra position in the fourth quarter primarily due to valuations.
STERIS, a strong contributor to the Fund’s absolute performance in the health care sector, is primarily a consumables/recurring revenue business with meaningful exposure to hospital capital expenditure trends. One such trend is orders for capital equipment, which were very strong in the third quarter and drove an increase in organic growth guidance and supports our view of broad-based hospital capital expenditure strength in 2018. At the close of the year, STERIS was in the process of introducing a new centralized outsourced sterilization model to health care systems in the US and invested a decent amount in this new market, which has modestly constrained margin expansion.
Kansas-basedEuronet Worldwide was an overall contributor to the Fund’s performance during the year. Euronet offers a currency conversion service on its ATMs
and earns a currency spread on the transaction. In late 2017, a European Union Commission issued a proposal recommending a cap on these currency conversion charges. Euronet’s stock underperformed during the first half of 2018 on concerns that the company would be forced to lower the spread it earns on these transactions. In August of 2018, the European Parliament issued a draft proposal that recommended no caps on currency conversion charges on European ATMs and further recommended that the EU Commission change its recommendation. The company’s stock recovered during the year on the news as it seems increasingly likely that currency conversion charges will be permitted in their existing form.
All changes to the Fund’s positioning are based on ourbottom-up stock selection process. Our portfolio construction process acts as a risk control and ensures the portfolio is aligned withsmall-cap market sector exposure within modest over- and underweights. Our long-term investment horizon leads to relatively low turnover.
At the close of the year, it was our view that we are in a slowing, but not declining, growth environment as the benefits of US tax stimulus and deregulations are being offset by higher interest rates, rising labor costs and trade pressures. In such an environment, we believe true growth will likely remain scarce and the market will favor companies that can produce growth and compound earnings in spite of the economic cycle. We believe that change is the fuel for growth, thus we are seeking to identify “share-takers”, companies that can gain market share from technology-enabled advantages in their business models and from disruptive shifts in consumer behavior. Though we anticipate a possible economic slowing, we continue to prudently balance the portfolio between dynamic growth opportunities and more durable growth opportunities.
Thank you for your commitment to Invesco Small Cap Equity Fund and for sharing our long-term investment horizon.
1 Source: US Federal Reserve
The views and opinions expressed in management’s discussion of Fund performance are those of Invesco Advisers, Inc. These views and opinions are subject to change at any time based on factors such as market and economic conditions. These views and opinions may not be relied upon as investment advice or recommendations, or as an offer for a particular security. The information is not a complete analysis of every aspect of any market, country, industry, security or the Fund. Statements of fact are from sources considered reliable, but Invesco Advisers, Inc. makes no representation or warranty as to their completeness or accuracy. Although historical performance is no guarantee of future results, these insights may help you understand our investment management philosophy.
See important Fund and, if applicable, index disclosures later in this report.
| | |
 | | Juan Hartsfield Chartered Financial Analyst, Portfolio Manager, is lead manager of Invesco Small Cap Equity |
Fund. He joined Invesco in 2004. Mr. Hartsfield earned a BS in petroleum engineering from The University of Texas at Austin and an MBA from the University of Michigan. |
 | | Davis Paddock Chartered Financial Analyst, Portfolio Manager, is manager of Invesco Small Cap Equity Fund. He joined |
| Invesco in 2001. Mr. Paddock earned a BA and an MBA from The University of Texas at Austin. |
5 Invesco Small Cap Equity Fund
Your Fund’s Long-Term Performance
Results of a $10,000 Investment – Oldest Share Class(es)
Fund and index data from 12/31/08
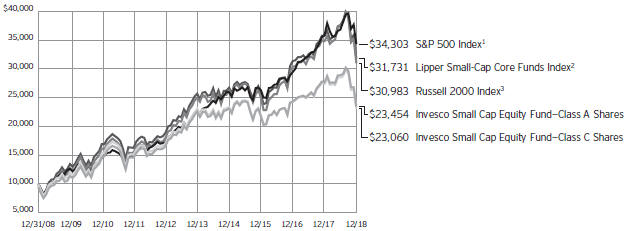
1 Source: FactSet Research Systems Inc.
2 Source: Lipper Inc.
3 Source: RIMES Technologies Corp.
Past performance cannot guarantee comparable future results.
The data shown in the chart include reinvested distributions, applicable sales charges and Fund expenses including management fees. Index results include reinvested dividends, but they do not reflect sales charges. Performance of the
peer group, if applicable, reflects fund expenses and management fees; performance of a market index does not. Performance shown in the chart and table(s) does not reflect deduction of taxes a shareholder would pay on Fund distributions or sale of Fund shares.
6 Invesco Small Cap Equity Fund
| | | | |
Average Annual Total Returns | |
As of 12/31/18, including maximum applicablesales charges | |
| |
Class A Shares | | | | |
Inception (8/31/00) | | | 5.71 | % |
10 Years | | | 8.90 | |
5 Years | | | –0.38 | |
1 Year | | | –19.81 | |
| |
Class C Shares | | | | |
Inception (8/31/00) | | | 5.27 | % |
10 Years | | | 8.71 | |
5 Years | | | 0.01 | |
1 Year | | | –16.44 | |
| |
Class R Shares | | | | |
Inception (6/3/02) | | | 6.07 | % |
10 Years | | | 9.25 | |
5 Years | | | 0.50 | |
1 Year | | | –15.35 | |
| |
Class Y Shares | | | | |
Inception (10/3/08) | | | 7.66 | % |
10 Years | | | 9.81 | |
5 Years | | | 1.01 | |
1 Year | | | –14.92 | |
| |
Class R5 Shares | | | | |
Inception (4/29/05) | | | 7.25 | % |
10 Years | | | 10.02 | |
5 Years | | | 1.17 | |
1 Year | | | –14.79 | |
| |
Class R6 Shares | | | | |
10 Years | | | 9.86 | % |
5 Years | | | 1.26 | |
1 Year | | | –14.75 | |
Class R6 shares incepted on September 24, 2012. Performance shown prior to that date is that of Class A shares and includes the12b-1 fees applicable to Class A shares.
The performance data quoted represent past performance and cannot guarantee comparable future results; current performance may be lower or higher. Please visit invesco.com/performance for the most recentmonth-end performance. Performance figures reflect reinvested distributions, changes in net asset value and the effect of the maximum sales charge unless otherwise stated. Investment return and principal value will fluctuate so that you may have a gain or loss when you sell shares.
The total annual Fund operating expense ratio set forth in the most recent Fund prospectus as of the date of this report for Class A, Class C, Class R, Class Y, Class R5 and Class R6 shares was 1.30%, 2.05%, 1.55%, 1.05%,
0.91% and 0.85%, respectively. The expense ratios presented above may vary from the expense ratios presented in other sections of this report that are based on expenses incurred during the period covered by this report.
Class A share performance reflects the maximum 5.50% sales charge, and Class C share performance reflects the applicable contingent deferred sales charge (CDSC) for the period involved. The CDSC on Class C shares is 1% for the first year after purchase. Class R, Class Y, Class R5 and Class R6 shares do not have afront-end sales charge or a CDSC; therefore, performance is at net asset value.
The performance of the Fund’s share classes will differ primarily due to different sales charge structures and class expenses.
Fund performance reflects any applicable fee waivers and/or expense reimbursements. Had the adviser not waived fees and/or reimbursed expenses currently or in the past, returns would have been lower. See current prospectus for more information.
7 Invesco Small Cap Equity Fund
Invesco Small Cap Equity Fund’s investment objective is long-term growth of capital.
| ∎ | | Unless otherwise stated, information presented in this report is as of December 31, 2018, and is based on total net assets. |
| ∎ | | Unless otherwise noted, all data provided by Invesco. |
| ∎ | | To access your Fund’s reports/prospectus, visit invesco.com/fundreports. |
About share classes
| ∎ | | Class R sharesare generally available only to employer sponsored retirement and benefit plans. Please see the prospectus for more information. |
| ∎ | | Class Y sharesare available only to certain investors. Please see the prospectus for more information. |
| ∎ | | Class R5 sharesandClass R6 sharesare available for use by retirement plans that meet certain standards and for institutional investors. Class R6 shares are also available through intermediaries that have established an agreement with Invesco Distributors, Inc. to make such shares available for use in retail omnibus accounts. Please see the prospectus for more information. |
Principal risks of investing in the Fund
| ∎ | | Foreign securities risk.The Fund’s foreign investments may be adversely affected by political and social instability, changes in economic or taxation policies, difficulty in enforcing obligations, decreased liquidity or increased volatility. Foreign investments also involve the risk of the possible seizure, nationalization or expropriation of the issuer or foreign deposits (in which the Fund could lose its entire investments in a certain market) and the possible adoption of foreign governmental restrictions such as exchange controls. Unless the Fund has hedged its foreign securities risk, foreign securities risk also involves the risk of negative foreign currency rate fluctuations, which may cause the value of securities denominated in such foreign currency (or other instruments through which the Fund has exposure to foreign currencies) to decline in value. Currency exchange rates may fluctuate significantly over short periods of time. Currency hedging strategies, if used, are not always successful. |
| ∎ | | Management risk.The Fund is actively managed and depends heavily on the Adviser’s judgment about markets, interest rates or the attractiveness, relative |
| | | values, liquidity, or potential appreciation of particular investments made for the Fund’s portfolio. The Fund could experience losses if these judgments prove to be incorrect. Additionally, legislative, regulatory, or tax developments may adversely affect management of the Fund and, therefore, the ability of the Fund to achieve its investment objective. |
| ∎ | | Market risk.The market values of the Fund’s investments, and therefore the value of the Fund’s shares, will go up and down, sometimes rapidly or unpredictably. Market risk may affect a single issuer, industry or section of the economy, or it may affect the market as a whole. Individual stock prices tend to go up and down more dramatically than those of certain other types of investments, such as bonds. During a general downturn in the financial markets, multiple asset classes may decline in value. When markets perform well, there can be no assurance that specific investments held by the Fund will rise in value. |
| ∎ | | Small- andmid-capitalization companies risks.Small- andmid-capitalization companies tend to be more vulnerable to changing market conditions, may have little or no operating history or track record of success, and may have more limited product lines and markets, less experienced management and fewer financial resources than larger companies. These companies’ securities may be more volatile and less liquid than those of more established companies, and their returns may vary, sometimes significantly, from the overall securities market. |
About indexes used in this report
| ∎ | | TheS&P 500®Indexis an unmanaged index considered representative of the US stock market. |
| ∎ | | TheRussell 2000®Indexis an unmanaged index considered representative ofsmall-cap stocks. The Russell 2000 Index is a trademark/service mark of the Frank Russell Co. Russell®is a trademark of the Frank Russell Co. |
| ∎ | | TheLipperSmall-Cap Core Funds Indexis an unmanaged index considered representative ofsmall-cap core funds tracked by Lipper. |
| ∎ | | The Fund is not managed to track the performance of any particular index, including the index(es) described here, and consequently, the performance of the Fund may deviate significantly from the performance of the index(es). |
| ∎ | | A direct investment cannot be made in an index. Unless otherwise indicated, index results include reinvested dividends, and they do not reflect sales charges. Performance of the peer group, if applicable, reflects fund expenses; performance of a market index does not. |
Other information
| ∎ | | The returns shown in management’s discussion of Fund performance are based on net asset values (NAVs) calculated for shareholder transactions. Generally accepted accounting principles require adjustments to be made to the net assets of the Fund at period end for financial reporting purposes, and as such, the NAVs for shareholder transactions and the returns based on those NAVs may differ from the NAVs and returns reported in the Financial Highlights. |
| ∎ | | Industry classifications used in this report are generally according to the Global Industry Classification Standard, which was developed by and is the exclusive property and a service mark of MSCI Inc. and Standard & Poor’s. |
| | | | |
This report must be accompanied or preceded by a currently effective Fund prospectus, which contains more complete information, including sales charges and expenses. Investors should read it carefully before investing. | | |
NOT FDIC INSURED | MAY LOSE VALUE | NO BANK GUARANTEE | | |
8 Invesco Small Cap Equity Fund
Schedule of Investments(a)
December 31, 2018
| | | | | | | | |
| | | Shares | | | Value | |
Common Stocks & Other Equity Interests–97.85% | |
| Aerospace & Defense–2.87% | |
BWX Technologies, Inc. | | | 166,726 | | | $ | 6,373,935 | |
Cubic Corp. | | | 176,087 | | | | 9,462,915 | |
Curtiss-Wright Corp. | | | 89,391 | | | | 9,128,609 | |
| | | | | | | | 24,965,459 | |
|
| Air Freight & Logistics–1.11% | |
Forward Air Corp. | | | 175,806 | | | | 9,642,959 | |
|
| Alternative Carriers–1.87% | |
Iridium Communications Inc.(b) | | | 879,657 | | | | 16,229,672 | |
|
| Apparel Retail–1.92% | |
American Eagle Outfitters, Inc. | | | 482,237 | | | | 9,321,641 | |
Children’s Place Inc. (The) | | | 82,099 | | | | 7,396,299 | |
| | | | | | | | 16,717,940 | |
|
| Application Software–3.90% | |
Avalara, Inc.(b)(c) | | | 274,573 | | | | 8,552,949 | |
Blackbaud, Inc. | | | 149,004 | | | | 9,372,352 | |
Cornerstone OnDemand, Inc.(b) | | | 209,592 | | | | 10,569,725 | |
Instructure Inc.(b) | | | 49,867 | | | | 1,870,511 | |
SVMK Inc.(b)(c) | | | 285,979 | | | | 3,508,962 | |
| | | | | | | | 33,874,499 | |
|
| Auto Parts & Equipment–0.80% | |
Visteon Corp.(b) | | | 114,768 | | | | 6,918,215 | |
|
| Biotechnology–3.85% | |
Array BioPharma Inc.(b) | | | 920,558 | | | | 13,117,952 | |
Neurocrine Biosciences, Inc.(b) | | | 179,436 | | | | 12,813,525 | |
Retrophin, Inc.(b) | | | 333,591 | | | | 7,549,164 | |
| | | | | | | | 33,480,641 | |
|
| Building Products–1.25% | |
Trex Co., Inc.(b) | | | 183,045 | | | | 10,865,551 | |
|
| Casinos & Gaming–1.66% | |
Boyd Gaming Corp. | | | 336,166 | | | | 6,985,530 | |
Penn National Gaming, Inc.(b) | | | 394,753 | | | | 7,433,199 | |
| | | | | | | | 14,418,729 | |
|
| Communications Equipment–2.00% | |
Ciena Corp.(b) | | | 269,578 | | | | 9,141,390 | |
Lumentum Holdings Inc.(b) | | | 195,131 | | | | 8,197,453 | |
| | | | | | | | 17,338,843 | |
|
| Construction & Engineering–1.51% | |
Dycom Industries, Inc.(b) | | | 110,522 | | | | 5,972,609 | |
Primoris Services Corp. | | | 375,615 | | | | 7,185,515 | |
| | | | | | | | 13,158,124 | |
|
| Consumer Finance–0.91% | |
SLM Corp.(b) | | | 950,023 | | | | 7,894,691 | |
| | | | | | | | |
| | | Shares | | | Value | |
| Data Processing & Outsourced Services–2.88% | |
Euronet Worldwide, Inc.(b) | | | 114,608 | | | $ | 11,733,567 | |
Jack Henry & Associates, Inc. | | | 104,919 | | | | 13,274,352 | |
| | | | | | | | 25,007,919 | |
|
| Diversified Support Services–1.04% | |
Mobile Mini, Inc. | | | 283,487 | | | | 9,000,712 | |
|
| Education Services–1.33% | |
Strategic Education, Inc. | | | 101,909 | | | | 11,558,519 | |
|
| Electrical Components & Equipment–1.35% | |
EnerSys | | | 151,159 | | | | 11,731,450 | |
|
| Electronic Components–0.68% | |
Belden Inc. | | | 140,846 | | | | 5,883,137 | |
|
| Electronic Equipment & Instruments–3.18% | |
Coherent, Inc.(b) | | | 52,002 | | | | 5,497,131 | |
FLIR Systems, Inc. | | | 220,023 | | | | 9,579,802 | |
National Instruments Corp. | | | 276,653 | | | | 12,554,513 | |
| | | | | | | | 27,631,446 | |
|
| Environmental & Facilities Services–2.32% | |
ABM Industries Inc. | | | 276,840 | | | | 8,889,332 | |
Waste Connections, Inc. | | | 151,915 | | | | 11,279,689 | |
| | | | | | | | 20,169,021 | |
|
| Food Retail–0.99% | |
Sprouts Farmers Market, Inc.(b) | | | 366,809 | | | | 8,623,680 | |
|
| Footwear–1.49% | |
Wolverine World Wide, Inc. | | | 404,764 | | | | 12,907,924 | |
|
| General Merchandise Stores–0.66% | |
Big Lots, Inc. | | | 197,410 | | | | 5,709,097 | |
|
| Health Care Equipment–4.15% | |
Hill-Rom Holdings, Inc. | | | 137,255 | | | | 12,153,930 | |
STERIS PLC | | | 129,937 | | | | 13,883,769 | |
Wright Medical Group N.V.(b) | | | 366,249 | | | | 9,969,298 | |
| | | | | | | | 36,006,997 | |
|
| Health Care Facilities–0.55% | |
Acadia Healthcare Co., Inc.(b) | | | 186,246 | | | | 4,788,385 | |
|
| Health Care REITs–0.95% | |
Healthcare Trust of America, Inc.–Class A | | | 326,777 | | | | 8,270,726 | |
|
| Health Care Supplies–2.05% | |
ICU Medical, Inc.(b) | | | 40,997 | | | | 9,414,141 | |
Lantheus Holdings, Inc.(b) | | | 534,216 | | | | 8,360,481 | |
| | | | | | | | 17,774,622 | |
|
| Industrial Machinery–3.28% | |
Albany International Corp.–Class A | | | 185,642 | | | | 11,589,630 | |
SPX Corp.(b) | | | 603,528 | | | | 16,904,819 | |
| | | | | | | | 28,494,449 | |
See accompanying Notes to Financial Statements which are an integral part of the financial statements.
9 Invesco Small Cap Equity Fund
| | | | | | | | |
| | | Shares | | | Value | |
| Interactive Home Entertainment–1.51% | |
Take-Two Interactive Software, Inc.(b) | | | 127,026 | | | $ | 13,076,057 | |
|
| Investment Banking & Brokerage–3.52% | |
E*TRADE Financial Corp. | | | 269,246 | | | | 11,814,515 | |
Lazard Ltd.–Class A | | | 252,717 | | | | 9,327,784 | |
Piper Jaffray Cos. | | | 142,822 | | | | 9,403,400 | |
| | | | | | | | 30,545,699 | |
|
| Life & Health Insurance–0.76% | |
CNO Financial Group, Inc. | | | 446,034 | | | | 6,636,986 | |
|
| Life Sciences Tools & Services–0.82% | |
Cambrex Corp.(b) | | | 187,778 | | | | 7,090,497 | |
|
| Managed Health Care–1.27% | |
HealthEquity, Inc.(b) | | | 184,977 | | | | 11,033,878 | |
|
| Multi-Line Insurance–2.28% | |
American Financial Group, Inc. | | | 107,532 | | | | 9,734,872 | |
Horace Mann Educators Corp. | | | 268,319 | | | | 10,048,547 | |
| | | | | | | | 19,783,419 | |
|
| Office REITs–0.93% | |
Highwoods Properties, Inc. | | | 208,712 | | | | 8,075,067 | |
|
| Oil & Gas Equipment & Services–1.77% | |
Apergy Corp.(b) | | | 269,710 | | | | 7,303,747 | |
Core Laboratories N.V. | | | 99,458 | | | | 5,933,664 | |
Forum Energy Technologies, Inc.(b) | | | 527,224 | | | | 2,177,435 | |
| | | | | | | | 15,414,846 | |
|
| Oil & Gas Exploration & Production–1.80% | |
Matador Resources Co.(b) | | | 364,522 | | | | 5,661,027 | |
Newfield Exploration Co.(b) | | | 277,568 | | | | 4,069,147 | |
Parsley Energy, Inc.–Class A(b) | | | 369,718 | | | | 5,908,093 | |
| | | | | | | | 15,638,267 | |
|
| Paper Packaging–0.88% | |
Graphic Packaging Holding Co. | | | 720,399 | | | | 7,665,045 | |
|
| Pharmaceuticals–1.08% | |
Phibro Animal Health Corp.–Class A | | | 290,888 | | | | 9,354,958 | |
|
| Property & Casualty Insurance–4.21% | |
Argo Group International Holdings, Ltd. | | | 196,961 | | | | 13,245,627 | |
Hanover Insurance Group Inc. (The) | | | 123,918 | | | | 14,469,905 | |
Selective Insurance Group, Inc. | | | 145,668 | | | | 8,877,008 | |
| | | | | | | | 36,592,540 | |
|
| Real Estate Operating Companies–0.89% | |
Kennedy-Wilson Holdings, Inc. | | | 423,655 | | | | 7,697,811 | |
|
| Regional Banks–7.77% | |
Columbia Banking System, Inc. | | | 278,753 | | | | 10,115,946 | |
Great Western Bancorp, Inc. | | | 267,039 | | | | 8,344,969 | |
IBERIABANK Corp. | | | 159,761 | | | | 10,269,437 | |
Synovus Financial Corp. | | | 215,350 | | | | 6,889,047 | |
UMB Financial Corp. | | | 149,145 | | | | 9,093,371 | |
| | | | | | | | |
| | | Shares | | | Value | |
| Regional Banks–(continued) | |
Webster Financial Corp. | | | 271,494 | | | $ | 13,381,939 | |
Western Alliance Bancorp(b) | | | 237,150 | | | | 9,365,053 | |
| | | | | | | | 67,459,762 | |
|
| Restaurants–1.83% | |
Papa John’s International, Inc. | | | 139,788 | | | | 5,564,960 | |
Wendy’s Co. (The) | | | 663,328 | | | | 10,354,550 | |
| | | | | | | | 15,919,510 | |
|
| Semiconductor Equipment–2.21% | |
Brooks Automation, Inc. | | | 368,836 | | | | 9,656,127 | |
Teradyne, Inc. | | | 304,629 | | | | 9,559,258 | |
| | | | | | | | 19,215,385 | |
|
| Semiconductors–0.59% | |
Power Integrations, Inc. | | | 84,387 | | | | 5,145,919 | |
|
| Specialized Consumer Services–1.09% | |
ServiceMaster Global Holdings, Inc.(b) | | | 258,080 | | | | 9,481,859 | |
|
| Specialized REITs–1.40% | |
CubeSmart | | | 423,329 | | | | 12,145,309 | |
|
| Specialty Chemicals–2.76% | |
Minerals Technologies Inc. | | | 160,237 | | | | 8,226,568 | |
PolyOne Corp. | | | 291,834 | | | | 8,346,452 | |
Sensient Technologies Corp. | | | 132,817 | | | | 7,417,829 | |
| | | | | | | | 23,990,849 | |
|
| Specialty Stores–0.74% | |
Michaels Cos., Inc. (The)(b) | | | 475,302 | | | | 6,435,589 | |
|
| Systems Software–1.27% | |
CommVault Systems, Inc.(b) | | | 186,629 | | | | 11,027,908 | |
|
| Technology Distributors–1.00% | |
Tech Data Corp.(b) | | | 105,706 | | | | 8,647,808 | |
|
| Tires & Rubber–1.01% | |
Cooper Tire & Rubber Co. | | | 270,088 | | | | 8,731,945 | |
|
| Trading Companies & Distributors–0.80% | |
Univar Inc.(b) | | | 391,871 | | | | 6,951,792 | |
|
| Trucking–2.03% | |
Knight-Swift Transportation Holdings Inc. | | | 289,279 | | | | 7,252,224 | |
Old Dominion Freight Line, Inc. | | | 83,983 | | | | 10,371,061 | |
| | | | | | | | 17,623,285 | |
|
| Water Utilities–1.08% | |
California Water Service Group | | | 196,942 | | | | 9,386,256 | |
Total Common Stocks & Other Equity Interests
(Cost $821,349,015) | | | | 849,831,653 | |
See accompanying Notes to Financial Statements which are an integral part of the financial statements.
10 Invesco Small Cap Equity Fund
| | | | | | | | |
| | | Shares | | | Value | |
Money Market Funds–2.05% | |
Invesco Government & Agency Portfolio–
Institutional Class, 2.30%(d) | | | 5,992,974 | | | $ | 5,992,974 | |
Invesco Liquid Assets Portfolio–Institutional Class, 2.48%(d) | | | 4,963,595 | | | | 4,964,092 | |
Invesco Treasury Portfolio–Institutional Class, 2.30%(d) | | | 6,849,113 | | | | 6,849,113 | |
Total Money Market Funds
(Cost $17,806,156) | | | | 17,806,179 | |
TOTAL INVESTMENTS IN SECURITIES (excluding investments purchased with cash collateral from securities on loan)–99.90%
(Cost $839,155,171) | | | | 867,637,832 | |
| | | | | | | | |
| | | Shares | | | Value | |
Investments Purchased with Cash
Collateral from Securities on Loan | |
Money Market Funds–0.55% | |
Invesco Government & Agency Portfolio–
Institutional Class, 2.30%
(Cost $4,783,170)(d)(e) | | | 4,783,170 | | | $ | 4,783,170 | |
TOTAL INVESTMENTS IN SECURITIES–100.45%
(Cost $843,938,341) | | | | 872,421,002 | |
OTHER ASSETS LESS LIABILITIES–(0.45)% | | | | (3,906,325 | ) |
NET ASSETS–100.00% | | | $ | 868,514,677 | |
Investment Abbreviations:
| | |
| REIT | | – Real Estate Investment Trust |
Notes to Schedule of Investments:
| (a) | Industry and/or sector classifications used in this report are generally according to the Global Industry Classification Standard, which was developed by and is the exclusive property and a service mark of MSCI Inc. and Standard & Poor’s. |
| (b) | Non-income producing security. |
| (c) | All or a portion of this security was out on loan at December 31, 2018. |
| (d) | The money market fund and the Fund are affiliated by having the same investment adviser. The rate shown is the 7-day SEC standardized yield as of December 31, 2018. |
| (e) | The security has been segregated to satisfy the commitment to return the cash collateral received in securities lending transactions upon the borrower’s return of the securities loaned. See Note 1I. |
See accompanying Notes to Financial Statements which are an integral part of the financial statements.
11 Invesco Small Cap Equity Fund
Statement of Assets and Liabilities
December 31, 2018
| | | | |
Assets: | |
Investments in securities, at value (Cost $821,349,015)* | | $ | 849,831,653 | |
Investments in affiliated money market funds, at value (Cost $22,589,326) | | | 22,589,349 | |
Receivable for: | | | | |
Investments sold | | | 1,272,375 | |
Fund shares sold | | | 4,068,672 | |
Dividends | | | 764,217 | |
Investment for trustee deferred compensation and retirement plans | | | 172,195 | |
Total assets | | | 878,698,461 | |
|
Liabilities: | |
Payable for: | | | | |
Amount due to custodian | | | 1,423,277 | |
Fund shares reacquired | | | 3,179,788 | |
Collateral upon return of securities loaned | | | 4,783,170 | |
Accrued fees to affiliates | | | 529,839 | |
Accrued trustees’ and officers’ fees and benefits | | | 6,695 | |
Accrued other operating expenses | | | 69,897 | |
Trustee deferred compensation and retirement plans | | | 191,118 | |
Total liabilities | | | 10,183,784 | |
Net assets applicable to shares outstanding | | $ | 868,514,677 | |
|
Net assets consist of: | |
Shares of beneficial interest | | $ | 816,743,520 | |
Distributable earnings | | | 51,771,157 | |
| | | $ | 868,514,677 | |
| | | | |
Net Assets: | |
Class A | | $ | 427,637,430 | |
Class C | | $ | 37,757,001 | |
Class R | | $ | 50,345,081 | |
Class Y | | $ | 71,037,457 | |
Class R5 | | $ | 26,542,564 | |
Class R6 | | $ | 255,195,144 | |
|
Shares outstanding, no par value,
with an unlimited number of shares authorized: | |
Class A | | | 38,725,168 | |
Class C | | | 4,486,400 | |
Class R | | | 4,917,046 | |
Class Y | | | 6,172,484 | |
Class R5 | | | 2,140,449 | |
Class R6 | | | 20,417,963 | |
Class A: | | | | |
Net asset value per share | | $ | 11.04 | |
Maximum offering price per share | | | | |
(Net asset value of $11.04¸ 94.50% | | $ | 11.68 | |
Class C: | | | | |
Net asset value and offering price per share | | $ | 8.42 | |
Class R: | | | | |
Net asset value and offering price per share | | $ | 10.24 | |
Class Y: | | | | |
Net asset value and offering price per share | | $ | 11.51 | |
Class R5: | | | | |
Net asset value and offering price per share | | $ | 12.40 | |
Class R6: | | | | |
Net asset value and offering price per share | | $ | 12.50 | |
| * | At December 31, 2018, securities with an aggregate value of $4,885,398 were on loan to brokers. |
See accompanying Notes to Financial Statements which are an integral part of the financial statements.
12 Invesco Small Cap Equity Fund
Statement of Operations
For the year ended December 31, 2018
| | | | |
Investment income: | |
Dividends (net of foreign withholding taxes of $37,711) | | $ | 11,427,765 | |
Dividends from affiliated money market funds (includes securities lending income of $30,611) | | | 553,285 | |
Total investment income | | | 11,981,050 | |
| |
Expenses: | | | | |
Advisory fees | | | 8,121,375 | |
Administrative services fees | | | 283,576 | |
Custodian fees | | | 20,160 | |
Distribution fees: | | | | |
Class A | | | 1,360,356 | |
Class B | | | 914 | |
Class C | | | 495,297 | |
Class R | | | 329,282 | |
Transfer agent fees — A, B, C, R and Y | | | 1,909,020 | |
Transfer agent fees — R5 | | | 30,469 | |
Transfer agent fees — R6 | | | 32,422 | |
Trustees’ and officers’ fees and benefits | | | 35,913 | |
Registration and filing fees | | | 140,499 | |
Reports to shareholders | | | 159,618 | |
Professional services fees | | | 50,729 | |
Other | | | 58,433 | |
Total expenses | | | 13,028,063 | |
Less: Fees waived and expense offset arrangements | | | (41,089 | ) |
Net expenses | | | 12,986,974 | |
Net investment income (loss) | | | (1,005,924 | ) |
| |
Realized and unrealized gain (loss) from: | | | | |
Net realized gain (loss) from: | | | | |
Investment securities | | | 140,005,618 | |
Foreign currencies | | | (91 | ) |
| | | | 140,005,527 | |
Change in net unrealized appreciation (depreciation) of investment securities | | | (287,832,527 | ) |
Net realized and unrealized gain (loss) | | | (147,827,000 | ) |
Net increase (decrease) in net assets resulting from operations | | $ | (148,832,924 | ) |
See accompanying Notes to Financial Statements which are an integral part of the financial statements.
13 Invesco Small Cap Equity Fund
Statement of Changes in Net Assets
For the years ended December 31, 2018 and 2017
| | | | | | | | |
| | | 2018 | | | 2017 | |
Operations: | | | | | | | | |
Net investment income (loss) | | $ | (1,005,924 | ) | | $ | (3,181,224 | ) |
Net realized gain | | | 140,005,527 | | | | 81,173,288 | |
Change in net unrealized appreciation (depreciation) | | | (287,832,527 | ) | | | 84,204,008 | |
Net increase (decrease) in net assets resulting from operations | | | (148,832,924 | ) | | | 162,196,072 | |
| | |
Distributions to shareholders from distributable earnings(1): | | | | | | | | |
Class A | | | (68,714,030 | ) | | | (28,064,769 | ) |
Class B | | | — | | | | (85,003 | ) |
Class C | | | (7,620,979 | ) | | | (3,250,570 | ) |
Class R | | | (8,489,306 | ) | | | (3,870,949 | ) |
Class Y | | | (11,713,570 | ) | | | (11,357,077 | ) |
Class R5 | | | (3,787,589 | ) | | | (2,659,854 | ) |
Class R6 | | | (35,888,595 | ) | | | (14,144,673 | ) |
Total distributions from distributable earnings | | | (136,214,069 | ) | | | (63,432,895 | ) |
| | |
Share transactions–net: | | | | | | | | |
Class A | | | 25,490,674 | | | | (49,629,810 | ) |
Class B | | | (1,326,391 | ) | | | (1,885,008 | ) |
Class C | | | 1,256,125 | | | | (8,651,902 | ) |
Class R | | | (3,114,099 | ) | | | (8,339,176 | ) |
Class Y | | | (139,268,604 | ) | | | (210,366,194 | ) |
Class R5 | | | (15,556,235 | ) | | | (69,798,640 | ) |
Class R6 | | | 29,719,070 | | | | 231,322,050 | |
Net increase (decrease) in net assets resulting from share transactions | | | (102,799,460 | ) | | | (117,348,680 | ) |
Net increase (decrease) in net assets | | | (387,846,453 | ) | | | (18,585,503 | ) |
| | |
Net assets: | | | | | | | | |
Beginning of year | | | 1,256,361,130 | | | | 1,274,946,633 | |
End of year | | $ | 868,514,677 | | | $ | 1,256,361,130 | |
| (1) | The Securities and Exchange Commission eliminated the requirement to disclose distribution components separately, except for tax return of capital. For the year ended December 31, 2017, distributions to shareholders from distributable earnings consisted of distributions from net realized gains. |
Notes to Financial Statements
December 31, 2018
NOTE 1—Significant Accounting Policies
Invesco Small Cap Equity Fund (the “Fund”) is a series portfolio of AIM Funds Group (Invesco Funds Group) (the “Trust”). The Trust is a Delaware statutory trust registered under the Investment Company Act of 1940, as amended (the “1940 Act”), as an open-end series management investment company authorized to issue an unlimited number of shares of beneficial interest. Information presented in these financial statements pertains only to the Fund. Matters affecting the Fund or each class will be voted on exclusively by the shareholders of the Fund or each class.
The Fund’s primary investment objective islong-term growth of capital.
The Fund currently consists of six different classes of shares: Class A, Class C, Class R, Class Y, Class R5 and Class R6. Class Y shares are available only to certain investors. Class A shares are sold with a front-end sales charge unless certain waiver criteria are met. Under certain circumstances, load waived shares may be subject to contingent deferred sales charges (“CDSC”). Class C shares are sold with a CDSC. Class R, Class Y, Class R5 and Class R6 shares are sold at net asset value. Effective November 30, 2010, new or additional investments in Class B shares are no longer permitted. Existing shareholders of Class B shares were permitted to continue to reinvest dividends and capital gains distributions in Class B shares until their conversion to Class A shares. Also, shareholders in Class B shares were able to exchange those shares for Class B shares of other Invesco Funds offering such shares until they converted to Class A shares. Generally, Class B shares automatically converted to Class A shares on or about the month-end, which was at least eight years after the date of purchase. Redemptions of Class B shares prior to the conversion date were subject to a CDSC. Effective January 26, 2018, all of the Fund’s outstanding Class B shares were converted to Class A shares, in advance of their normally scheduled conversion. No CDSC was paid in connection with this early conversion.
The Fund is an investment company and accordingly follows the investment company accounting and reporting guidance in accordance with Financial Accounting Standards Board Accounting Standards Codification Topic 946,Financial Services — Investment Companies.
14 Invesco Small Cap Equity Fund
The following is a summary of the significant accounting policies followed by the Fund in the preparation of its financial statements.
| A. | Security Valuations— Securities, including restricted securities, are valued according to the following policy. |
A security listed or traded on an exchange (except convertible securities) is valued at its last sales price or official closing price as of the close of the customary trading session on the exchange where the security is principally traded, or lacking any sales or official closing price on a particular day, the security may be valued at the closing bid price on that day. Securities traded in theover-the-counter market are valued based on prices furnished by independent pricing services or market makers. When such securities are valued by an independent pricing service they may be considered fair valued. Futures contracts are valued at the final settlement price set by an exchange on which they are principally traded. Listed options are valued at the mean between the last bid and asked prices from the exchange on which they are principally traded. Options not listed on an exchange are valued by an independent source at the mean between the last bid and asked prices. For purposes of determining net asset value (“NAV”) per share, futures and option contracts generally are valued 15 minutes after the close of the customary trading session of the New York Stock Exchange (“NYSE”).
Investments in open-end and closed-end registered investment companies that do not trade on an exchange are valued at theend-of-day net asset value per share. Investments in open-end and closed-end registered investment companies that trade on an exchange are valued at the last sales price or official closing price as of the close of the customary trading session on the exchange where the security is principally traded.
Debt obligations (including convertible securities) and unlisted equities are fair valued using an evaluated quote provided by an independent pricing service. Evaluated quotes provided by the pricing service may be determined without exclusive reliance on quoted prices, and may reflect appropriate factors such as institution-size trading in similar groups of securities, developments related to specific securities, dividend rate (for unlisted equities), yield (for debt obligations), quality, type of issue, coupon rate (for debt obligations), maturity (for debt obligations), individual trading characteristics and other market data. Pricing services generally value debt obligations assuming orderly transactions of institutional round lot size, but a fund may hold or transact in the same securities in smaller, odd lot sizes. Odd lots often trade at lower prices than institutional round lots. Debt obligations are subject to interest rate and credit risks. In addition, all debt obligations involve some risk of default with respect to interest and/or principal payments.
Foreign securities’ (including foreign exchange contracts) prices are converted into U.S. dollar amounts using the applicable exchange rates as of the close of the NYSE. If market quotations are available and reliable for foreign exchange-traded equity securities, the securities will be valued at the market quotations. Because trading hours for certain foreign securities end before the close of the NYSE, closing market quotations may become unreliable. If between the time trading ends on a particular security and the close of the customary trading session on the NYSE, events occur that the investment adviser determines are significant and make the closing price unreliable, the Fund may fair value the security. If the event is likely to have affected the closing price of the security, the security will be valued at fair value in good faith using procedures approved by the Board of Trustees. Adjustments to closing prices to reflect fair value may also be based on a screening process of an independent pricing service to indicate the degree of certainty, based on historical data, that the closing price in the principal market where a foreign security trades is not the current value as of the close of the NYSE. Foreign securities’ prices meeting the approved degree of certainty that the price is not reflective of current value will be priced at the indication of fair value from the independent pricing service. Multiple factors may be considered by the independent pricing service in determining adjustments to reflect fair value and may include information relating to sector indices, American Depositary Receipts and domestic and foreign index futures. Foreign securities may have additional risks including exchange rate changes, potential for sharply devalued currencies and high inflation, political and economic upheaval, the relative lack of issuer information, relatively low market liquidity and the potential lack of strict financial and accounting controls and standards.
Securities for which market prices are not provided by any of the above methods may be valued based upon quotes furnished by independent sources. The last bid price may be used to value equity securities. The mean between the last bid and asked prices is used to value debt obligations, including corporate loans.
Securities for which market quotations are not readily available or became unreliable are valued at fair value as determined in good faith by or under the supervision of the Trust’s officers following procedures approved by the Board of Trustees. Issuer specific events, market trends, bid/asked quotes of brokers and information providers and other market data may be reviewed in the course of making a good faith determination of a security’s fair value.
The Fund may invest in securities that are subject to interest rate risk, meaning the risk that the prices will generally fall as interest rates rise and, conversely, the prices will generally rise as interest rates fall. Specific securities differ in their sensitivity to changes in interest rates depending on their individual characteristics. Changes in interest rates may result in increased market volatility, which may affect the value and/or liquidity of certain Fund investments.
Valuations change in response to many factors including the historical and prospective earnings of the issuer, the value of the issuer’s assets, general economic conditions, interest rates, investor perceptions and market liquidity. Because of the inherent uncertainties of valuation, the values reflected in the financial statements may materially differ from the value received upon actual sale of those investments.
| B. | Securities Transactions and Investment Income— Securities transactions are accounted for on a trade date basis. Realized gains or losses on sales are computed on the basis of specific identification of the securities sold. Interest income (net of withholding tax, if any) is recorded on the accrual basis from settlement date. Dividend income (net of withholding tax, if any) is recorded on the ex-dividend date. |
The Fund may periodically participate in litigation related to Fund investments. As such, the Fund may receive proceeds from litigation settlements. Any proceeds received are included in the Statement of Operations as realized gain (loss) for investments no longer held and as unrealized gain (loss) for investments still held.
Brokerage commissions and mark ups are considered transaction costs and are recorded as an increase to the cost basis of securities purchased and/or a reduction of proceeds on a sale of securities. Such transaction costs are included in the determination of net realized and unrealized gain (loss) from investment securities reported in the Statement of Operations and the Statement of Changes in Net Assets and the net realized and unrealized gains (losses) on securities per share in the Financial Highlights. Transaction costs are included in the calculation of the Fund’s net asset value and, accordingly, they reduce the Fund’s total returns. These transaction costs are not considered operating expenses and are not reflected in net investment income reported in the Statement of Operations and the Statement of Changes in Net Assets, or the net investment income per share and the ratios of expenses and net investment income reported in the Financial Highlights, nor are they limited by any expense limitation arrangements between the Fund and the investment adviser.
15 Invesco Small Cap Equity Fund
The Fund allocates income and realized and unrealized capital gains and losses to a class based on the relative net assets of each class.
| C. | Country Determination— For the purposes of making investment selection decisions and presentation in the Schedule of Investments, the investment adviser may determine the country in which an issuer is located and/or credit risk exposure based on various factors. These factors include the laws of the country under which the issuer is organized, where the issuer maintains a principal office, the country in which the issuer derives 50% or more of its total revenues and the country that has the primary market for the issuer’s securities, as well as other criteria. Among the other criteria that may be evaluated for making this determination are the country in which the issuer maintains 50% or more of its assets, the type of security, financial guarantees and enhancements, the nature of the collateral and the sponsor organization. Country of issuer and/or credit risk exposure has been determined to be the United States of America, unless otherwise noted. |
| D. | Distributions— Distributions from net investment income and net realized capital gain, if any, are generally declared and paid annually and recorded on the ex-dividend date. The Fund may elect to treat a portion of the proceeds from redemptions as distributions for federal income tax purposes. |
| E. | Federal Income Taxes— The Fund intends to comply with the requirements of Subchapter M of the Internal Revenue Code of 1986, as amended (the “Internal Revenue Code”), necessary to qualify as a regulated investment company and to distribute substantially all of the Fund’s taxable earnings to shareholders. As such, the Fund will not be subject to federal income taxes on otherwise taxable income (including net realized capital gain) that is distributed to shareholders. Therefore, no provision for federal income taxes is recorded in the financial statements. |
The Fund recognizes the tax benefits of uncertain tax positions only when the position is more likely than not to be sustained. Management has analyzed the Fund’s uncertain tax positions and concluded that no liability for unrecognized tax benefits should be recorded related to uncertain tax positions. Management is not aware of any tax positions for which it is reasonably possible that the total amounts of unrecognized tax benefits will change materially in the next 12 months.
The Fund files tax returns in the U.S. Federal jurisdiction and certain other jurisdictions. Generally, the Fund is subject to examinations by such taxing authorities for up to three years after the filing of the return for the tax period.
| F. | Expenses— Fees provided for under the Rule 12b-1 plan of a particular class of the Fund are charged to the operations of such class. Transfer agency fees and expenses and other shareholder recordkeeping fees and expenses attributable to Class R5 and Class R6 are allocated to each share class based on relative net assets.Sub-accounting fees attributable to Class R5 are charged to the operations of the class. Transfer agency fees and expenses and other shareholder recordkeeping fees and expenses relating to all other classes are allocated among those classes based on relative net assets. All other expenses are allocated among the classes based on relative net assets. |
| G. | Accounting Estimates— The preparation of financial statements in conformity with accounting principles generally accepted in the United States of America (“GAAP”) requires management to make estimates and assumptions that affect the reported amounts of assets and liabilities at the date of the financial statements and the reported amounts of revenues and expenses during the reporting period including estimates and assumptions related to taxation. Actual results could differ from those estimates by a significant amount. In addition, the Fund monitors for material events or transactions that may occur or become known after the period-end date and before the date the financial statements are released to print. |
| H. | Indemnifications— Under the Trust’s organizational documents, each Trustee, officer, employee or other agent of the Trust is indemnified against certain liabilities that may arise out of the performance of their duties to the Fund. Additionally, in the normal course of business, the Fund enters into contracts, including the Fund’s servicing agreements, that contain a variety of indemnification clauses. The Fund’s maximum exposure under these arrangements is unknown as this would involve future claims that may be made against the Fund that have not yet occurred. The risk of material loss as a result of such indemnification claims is considered remote. |
| I. | Securities Lending— The Fund may lend portfolio securities having a market value up to one-third of the Fund’s total assets. Such loans are secured by collateral equal to no less than the market value of the loaned securities determined daily by the securities lending provider. Such collateral will be cash or debt securities issued or guaranteed by the U.S. Government or any of its sponsored agencies. Cash collateral received in connection with these loans is invested inshort-term money market instruments or affiliated money market funds and is shown as such on the Schedule of Investments. The Fund bears the risk of loss with respect to the investment of collateral. It is the Fund’s policy to obtain additional collateral from or return excess collateral to the borrower by the end of the next business day, following the valuation date of the securities loaned. Therefore, the value of the collateral held may be temporarily less than the value of the securities on loan. When loaning securities, the Fund retains certain benefits of owning the securities, including the economic equivalent of dividends or interest generated by the security. Lending securities entails a risk of loss to the Fund if, and to the extent that, the market value of the securities loaned were to increase and the borrower did not increase the collateral accordingly, and the borrower failed to return the securities. The securities loaned are subject to termination at the option of the borrower or the Fund. Upon termination, the borrower will return to the Fund the securities loaned and the Fund will return the collateral. Upon the failure of the borrower to return the securities, collateral may be liquidated and the securities may be purchased on the open market to replace the loaned securities. The Fund could experience delays and costs in gaining access to the collateral and the securities may lose value during the delay which could result in potential losses to the Fund. Some of these losses may be indemnified by the lending agent. The Fund bears the risk of any deficiency in the amount of the collateral available for return to the borrower due to any loss on the collateral invested. Dividends received on cash collateral investments for securities lending transactions, which are net of compensation to counterparties, are included inDividends from affiliated money market fundson the Statement of Operations. The aggregate value of securities out on loan, if any, is shown as a footnote on the Statement of Assets and Liabilities. |
16 Invesco Small Cap Equity Fund
NOTE 2—Advisory Fees and Other Fees Paid to Affiliates
The Trust has entered into a master investment advisory agreement with Invesco Advisers, Inc. (the “Adviser” or “Invesco”). Under the terms of the investment advisory agreement, the Fund accrues daily and pays monthly an advisory fee to the Adviser based on the annual rate of the Fund’s average daily net assets as follows:
| | | | | | | | |
| Average Daily Net Assets | | Rate | |
First $250 million | | | 0 | .745% | | | | |
Next $250 million | | | 0 | .73% | | | | |
Next $500 million | | | 0 | .715% | | | | |
Next $1.5 billion | | | 0 | .70% | | | | |
Next $2.5 billion | | | 0 | .685% | | | | |
Next $2.5 billion | | | 0 | .67% | | | | |
Next $2.5 billion | | | 0 | .655% | | | | |
Over $10 billion | | | 0 | .64% | | | | |
For the year ended December 31, 2018, the effective advisory fees incurred by the Fund was 0.72%.
Under the terms of a mastersub-advisory agreement between the Adviser and each of Invesco Asset Management Deutschland GmbH, Invesco Asset Management Limited, Invesco Asset Management (Japan) Limited, Invesco Hong Kong Limited, Invesco Senior Secured Management, Inc. and Invesco Canada Ltd. and separatesub-advisory agreements with Invesco Capital Management LLC, formerly Invesco PowerShares Capital Management LLC, and Invesco Asset Management (India) Private Limited (collectively, the “AffiliatedSub-Advisers”) the Adviser, not the Fund, will pay 40% of the fees paid to the Adviser to any such AffiliatedSub-Adviser(s) that provide(s) discretionary investment management services to the Fund based on the percentage of assets allocated to such AffiliatedSub-Adviser(s).
The Adviser has contractually agreed, through at least June 30, 2019, to waive advisory fees and/or reimburse expenses of all shares to the extent necessary to limit total annual fund operating expenses after fee waiver and/or expense reimbursement (excluding certain items discussed below) of Class A, Class C, Class R, Class Y, Class R5 and Class R6 shares to 2.00%, 2.75%, 2.25%, 1.75%, 1.75% and 1.75%, respectively, of average daily net assets (the “expense limits”). Prior to their conversion to Class A shares, the expense limit for Class B shares was 2.75% of average daily net assets. In determining the Adviser’s obligation to waive advisory fees and/or reimburse expenses, the following expenses are not taken into account, and could cause the total annual fund operating expenses after fee waiver and/or expense reimbursement to exceed the numbers reflected above: (1) interest; (2) taxes; (3) dividend expense on short sales; (4) extraordinary or non-routine items, including litigation expenses; and (5) expenses that the Fund has incurred but did not actually pay because of an expense offset arrangement. Unless Invesco continues the fee waiver agreement, it will terminate on June 30, 2019. During its term, the fee waiver agreement cannot be terminated or amended to increase the expense limits or reduce the advisory fee waiver without approval of the Board of Trustees. The Adviser did not waive fees and/or reimburse expenses during the period under these expense limits.
Further, the Adviser has contractually agreed, through at least June 30, 2020, to waive the advisory fee payable by the Fund in an amount equal to 100% of the net advisory fees the Adviser receives from the affiliated money market funds on investments by the Fund of uninvested cash (excluding investments of cash collateral from securities lending) in such affiliated money market funds.
For the year ended December 31, 2018, the Adviser waived advisory fees of $29,827.
The Trust has entered into a master administrative services agreement with Invesco pursuant to which the Fund has agreed to pay Invesco for certain administrative costs incurred in providing accounting services to the Fund. For the year ended December 31, 2018, expenses incurred under the agreement are shown in the Statement of Operations asAdministrative services fees.
The Trust has entered into a transfer agency and service agreement with Invesco Investment Services, Inc. (“IIS”) pursuant to which the Fund has agreed to pay IIS a fee for providing transfer agency and shareholder services to the Fund and reimburse IIS for certain expenses incurred by IIS in the course of providing such services. IIS may make payments to intermediaries that provide omnibus account services,sub-accounting services and/or networking services. All fees payable by IIS to intermediaries that provide omnibus account services orsub-accounting services are charged back to the Fund, subject to certain limitations approved by the Trust’s Board of Trustees. For the year ended December 31, 2018, expenses incurred under the agreement are shown in the Statement of Operations asTransfer agent fees.
The Trust has entered into master distribution agreements with Invesco Distributors, Inc. (“IDI”) to serve as the distributor for the Class A, Class C, Class R, Class Y, Class R5 and Class R6 shares of the Fund. The Trust has adopted plans pursuant to Rule 12b-1 under the 1940 Act with respect to the Fund’s Class A, Class C and Class R shares (collectively, the “Plans”). The Fund, pursuant to the Plans, pays IDI compensation at the annual rate of 0.25% of the Fund’s average daily net assets of Class A shares, 1.00% of the average daily net assets of Class C shares and 0.50% of the average daily net assets of Class R shares. Prior to their conversion to Class A shares, the Fund paid an annual rate of 1.00% of the average daily net assets of Class B shares. The fees are accrued daily and paid monthly. Of the Plan payments, up to 0.25% of the average daily net assets of each class of shares may be paid to furnish continuing personal shareholder services to customers who purchase and own shares of such classes. Any amounts not paid as a service fee under the Plans would constitute an asset-based sales charge. Rules of the Financial Industry Regulatory Authority (“FINRA”) impose a cap on the total sales charges, including asset-based sales charges, that may be paid by any class of shares of the Fund. For the year ended December 31, 2018, expenses incurred under the Plans are shown in the Statement of Operations asDistribution fees.
Front-end sales commissions and CDSC (collectively, the “sales charges”) are not recorded as expenses of the Fund. Front-end sales commissions are deducted from proceeds from the sales of Fund shares prior to investment in Class A shares of the Fund. CDSC are deducted from redemption proceeds prior to remittance to the shareholder. During the year ended December 31, 2018, IDI advised the Fund that IDI retained $139,775 in front-end sales commissions from the sale of Class A shares and $13,490 and $1,145 from Class A and Class C shares, respectively, for CDSC imposed on redemptions by shareholders.
17 Invesco Small Cap Equity Fund
For the year ended December 31, 2018, the Fund incurred $15,067 in brokerage commissions with Invesco Capital Markets, Inc., an affiliate of the Adviser and IDI, for portfolio transactions executed on behalf of the Fund.
Certain officers and trustees of the Trust are officers and directors of the Adviser, IIS and/or IDI.
NOTE 3—Additional Valuation Information
GAAP defines fair value as the price that would be received to sell an asset or paid to transfer a liability in an orderly transaction between market participants at the measurement date, under current market conditions. GAAP establishes a hierarchy that prioritizes the inputs to valuation methods, giving the highest priority to readily available unadjusted quoted prices in an active market for identical assets (Level 1) and the lowest priority to significant unobservable inputs (Level 3), generally when market prices are not readily available or are unreliable. Based on the valuation inputs, the securities or other investments are tiered into one of three levels. Changes in valuation methods may result in transfers in or out of an investment’s assigned level:
| | Level 1 — | Prices are determined using quoted prices in an active market for identical assets. |
| | Level 2 — | Prices are determined using other significant observable inputs. Observable inputs are inputs that other market participants may use in pricing a security. These may include quoted prices for similar securities, interest rates, prepayment speeds, credit risk, yield curves, loss severities, default rates, discount rates, volatilities and others. |
| | Level 3 — | Prices are determined using significant unobservable inputs. In situations where quoted prices or observable inputs are unavailable (for example, when there is little or no market activity for an investment at the end of the period), unobservable inputs may be used. Unobservable inputs reflect the Fund’s own assumptions about the factors market participants would use in determining fair value of the securities or instruments and would be based on the best available information. |
As of December 31, 2018, all of the securities in this Fund were valued based on Level 1 inputs (see the Schedule of Investments for security categories). The level assigned to the securities valuations may not be an indication of the risk or liquidity associated with investing in those securities. Because of the inherent uncertainties of valuation, the values reflected in the financial statements may materially differ from the value received upon actual sale of those investments.
NOTE 4—Security Transactions with Affiliated Funds
The Fund is permitted to purchase or sell securities from or to certain other Invesco Funds under specified conditions outlined in procedures adopted by the Board of Trustees of the Trust. The procedures have been designed to ensure that any purchase or sale of securities by the Fund from or to another fund or portfolio that is or could be considered an affiliate by virtue of having a common investment adviser (or affiliated investment advisers), common Trustees and/or common officers complies with Rule 17a-7 of the 1940 Act. Further, as defined under the procedures, each transaction is effected at the current market price. Pursuant to these procedures, for the year ended December 31, 2018, the Fund engaged in securities purchases of $3,432,590.
NOTE 5—Expense Offset Arrangement(s)
The expense offset arrangement is comprised of transfer agency credits which result from balances in demand deposit accounts used by the transfer agent for clearing shareholder transactions. For the year ended December 31, 2018, the Fund received credits from this arrangement, which resulted in the reduction of the Fund’s total expenses of $11,262.
NOTE 6—Trustees’ and Officers’ Fees and Benefits
Trustees’ and Officers’ Fees and Benefits include amounts accrued by the Fund to pay remuneration to certain Trustees and Officers of the Fund. Trustees have the option to defer compensation payable by the Fund, andTrustees’ and Officers’ Fees and Benefitsalso include amounts accrued by the Fund to fund such deferred compensation amounts. Those Trustees who defer compensation have the option to select various Invesco Funds in which their deferral accounts shall be deemed to be invested. Finally, certain current Trustees were eligible to participate in a retirement plan that provided for benefits to be paid upon retirement to Trustees over a period of time based on the number of years of service. The Fund may have certain former Trustees who also participate in a retirement plan and receive benefits under such plan.Trustees’ and Officers’ Fees and Benefits include amounts accrued by the Fund to fund such retirement benefits. Obligations under the deferred compensation and retirement plans represent unsecured claims against the general assets of the Fund.
NOTE 7—Cash Balances
The Fund is permitted to temporarily carry a negative or overdrawn balance in its account with State Street Bank and Trust Company, the custodian bank. Such balances, if any at period-end, are shown in the Statement of Assets and Liabilities under the payable captionAmount due custodian. To compensate the custodian bank for such overdrafts, the overdrawn Fund may either (1) leave funds as a compensating balance in the account so the custodian bank can be compensated by earning the additional interest; or (2) compensate by paying the custodian bank at a rate agreed upon by the custodian bank and Invesco, not to exceed the contractually agreed upon rate.
18 Invesco Small Cap Equity Fund
NOTE 8—Distributions to Shareholders and Tax Components of Net Assets
Tax Character of Distributions to Shareholders Paid During the Fiscal Years Ended December 31, 2018 and 2017:
| | | | | | | | |
| | | 2018 | | | 2017 | |
Ordinary income | | $ | 5,107,836 | | | $ | 5,807,205 | |
Long-term capital gain | | | 131,106,233 | | | | 57,625,690 | |
Total distributions | | $ | 136,214,069 | | | $ | 63,432,895 | |
Tax Components of Net Assets at Period-End:
| | | | |
| | | 2018 | |
Undistributed ordinary income | | $ | 503,723 | |
Undistributedlong-term gain | | | 23,617,664 | |
Net unrealized appreciation — investments | | | 27,829,584 | |
Temporary book/tax differences | | | (179,814 | ) |
Shares of beneficial interest | | | 816,743,520 | |
Total net assets | | $ | 868,514,677 | |
The difference between book-basis and tax-basis unrealized appreciation (depreciation) is due to differences in the timing of recognition of gains and losses on investments for tax and book purposes. The Fund’s net unrealized appreciation difference is attributable primarily to wash sales and partnerships.
The temporary book/tax differences are a result of timing differences between book and tax recognition of income and/or expenses. The Fund’s temporary book/tax differences are the result of the trustee deferral of compensation and retirement plan benefits.
Capital loss carryforward is calculated and reported as of a specific date. Results of transactions and other activity after that date may affect the amount of capital loss carryforward actually available for the Fund to utilize. Capital losses generated in years beginning after December 22, 2010 can be carried forward for an unlimited period, whereas previous losses expire in eight tax years. Capital losses with an expiration period may not be used to offset capital gains until all net capital losses without an expiration date have been utilized. Capital loss carryforwards with no expiration date will retain their character as eithershort-term orlong-term capital losses instead of asshort-term capital losses as under prior law. The ability to utilize capital loss carryforwards in the future may be limited under the Internal Revenue Code and related regulations based on the results of future transactions.
The Fund does not have a capital loss carryforward as of December 31, 2018.
NOTE 9—Investment Transactions
The aggregate amount of investment securities (other thanshort-term securities, U.S. Treasury obligations and money market funds, if any) purchased and sold by the Fund during the year ended December 31, 2018 was $225,592,985 and $473,286,527, respectively. Cost of investments, including any derivatives, on a tax basis includes the adjustments for financial reporting purposes as of the most recently completed federal income tax reporting period-end.
| | | | |
| Unrealized Appreciation (Depreciation) of Investments on a Tax Basis | |
Aggregate unrealized appreciation of investments | | $ | 148,450,346 | |
Aggregate unrealized (depreciation) of investments | | | (120,620,762 | ) |
Net unrealized appreciation of investments | | $ | 27,829,584 | |
Cost of investments for tax purposes is $844,591,418.
NOTE 10—Reclassification of Permanent Differences
Primarily as a result of differing book/tax treatment of net operating losses, on December 31, 2018, undistributed net investment income was increased by $1,105,931, undistributed net realized gain (loss) was decreased by $1,105,931. This reclassification had no effect on the net assets or the distributable earnings of the Fund.
19 Invesco Small Cap Equity Fund
NOTE 11—Share Information
| | | | | | | | | | | | | | | | |
| | | Summary of Share Activity | |
| | | Years ended December 31, | |
| | | 2018(a) | | | 2017 | |
| | | Shares | | | Amount | | | Shares | | | Amount | |
Sold: | | | | | | | | | | | | | | | | |
Class A | | | 5,557,572 | | | $ | 85,340,829 | | | | 6,985,727 | | | $ | 104,085,068 | |
Class B(b) | | | — | | | | — | | | | 12,223 | | | | 147,623 | |
Class C | | | 611,219 | | | | 7,362,784 | | | | 612,827 | | | | 7,469,083 | |
Class R | | | 756,120 | | | | 10,849,653 | | | | 1,028,834 | | | | 14,495,473 | |
Class Y | | | 1,191,057 | | | | 19,070,606 | | | | 9,361,531 | | | | 142,310,390 | |
Class R5 | | | 401,337 | | | | 6,935,534 | | | | 903,595 | | | | 14,684,328 | |
Class R6 | | | 3,685,368 | | | | 61,425,012 | | | | 15,825,629 | | | | 262,055,142 | |
| | | | |
Issued as reinvestment of dividends: | | | | | | | | | | | | | | | | |
Class A | | | 5,781,473 | | | | 65,850,960 | | | | 1,777,225 | | | | 26,978,269 | |
Class B(b) | | | — | | | | — | | | | 6,857 | | | | 83,801 | |
Class C | | | 838,976 | | | | 7,282,312 | | | | 258,499 | | | | 3,158,870 | |
Class R | | | 802,968 | | | | 8,479,342 | | | | 271,008 | | | | 3,869,987 | |
Class Y | | | 775,235 | | | | 9,202,041 | | | | 621,268 | | | | 9,741,484 | |
Class R5 | | | 294,240 | | | | 3,763,328 | | | | 158,284 | | | | 2,641,763 | |
Class R6 | | | 2,763,719 | | | | 35,624,345 | | | | 838,122 | | | | 14,072,070 | |
| | | | |
Conversion of Class B shares to Class A shares:(c) | | | | | �� | | | | | | | | | | | |
Class A | | | 69,676 | | | | 1,134,325 | | | | 108,203 | | | | 1,623,419 | |
Class B | | | (86,590 | ) | | | (1,134,325 | ) | | | (132,372 | ) | | | (1,623,419 | ) |
| | | | |
Reacquired: | | | | | | | | | | | | | | | | |
Class A | | | (8,441,736 | ) | | | (126,835,440 | ) | | | (12,221,173 | ) | | | (182,316,566 | ) |
Class B(b) | | | (14,688 | ) | | | (192,066 | ) | | | (40,715 | ) | | | (493,013 | ) |
Class C | | | (1,122,133 | ) | | | (13,388,971 | ) | | | (1,575,245 | ) | | | (19,279,855 | ) |
Class R | | | (1,558,792 | ) | | | (22,443,094 | ) | | | (1,890,096 | ) | | | (26,704,636 | ) |
Class Y | | | (10,179,194 | ) | | | (167,541,251 | ) | | | (23,529,583 | ) | | | (362,418,068 | ) |
Class R5 | | | (1,529,455 | ) | | | (26,255,097 | ) | | | (5,272,169 | ) | | | (87,124,731 | ) |
Class R6 | | | (4,006,568 | ) | | | (67,330,287 | ) | | | (2,697,058 | ) | | | (44,805,162 | ) |
Net increase (decrease) in share activity | | | (3,410,196 | ) | | $ | (102,799,460 | ) | | | (8,588,579 | ) | | $ | (117,348,680 | ) |
| (a) | There are entities that are record owners of more than 5% of the outstanding shares of the Fund and in the aggregate own 49% of the outstanding shares of the Fund. IDI has an agreement with these entities to sell Fund shares. The Fund, Invesco and/or Invesco affiliates may make payments to these entities, which are considered to be related to the Fund, for providing services to the Fund, Invesco and/or Invesco affiliates including but not limited to services such as securities brokerage, distribution, third party record keeping and account servicing. The Fund has no knowledge as to whether all or any portion of the shares owned of record by these entities are also owned beneficially. |
| (b) | Class B shares activity for the period January 1, 2018 through January 26, 2018 (date of conversion). |
| (c) | Effective as of the close of business January 26, 2018, all outstanding Class B shares were converted to Class A shares. |
20 Invesco Small Cap Equity Fund
NOTE 12—Financial Highlights
The following schedule presents financial highlights for a share of the Fund outstanding throughout the periods indicated.
| | | | | | | | | | | | | | | | | | | | | | | | | | | | | | | | | | | | | | | | | | | | | | | | |
| | | Net asset
value,
beginning
of period | | | Net
investment
income
(loss)(a) | | | Net gains
(losses)
on securities
(both
realized and
unrealized) | | | Total from
investment
operations | | | Distributions
from net
realized
gains | | | Net asset
value, end
of period | | | Total
return(b) | | | Net assets,
end of period
(000’s omitted) | | | Ratio of
expenses
to average
net assets
with fee waivers
and/or expenses
absorbed | | | Ratio of
expenses
to average net
assets without
fee waivers
and/or expenses
absorbed | | | Ratio of net
investment
income (loss)
to average
net assets | | | Portfolio
turnover(c) | |
Class A | | | | | | | | | | | | | | | | | | | | | | | | | | | | | | | | | | | | | | | | | | | | | | | | |
Year ended 12/31/18 | | $ | 15.35 | | | $ | (0.03 | ) | | $ | (2.23 | ) | | $ | (2.26 | ) | | $ | (2.05 | ) | | $ | 11.04 | | | | (15.16 | )% | | $ | 427,637 | | | | 1.28 | %(d) | | | 1.28 | %(d) | | | (0.21 | )%(d) | | | 22 | % |
Year ended 12/31/17 | | | 14.25 | | | | (0.05 | ) | | | 1.98 | | | | 1.93 | | | | (0.83 | ) | | | 15.35 | | | | 13.58 | | | | 549,010 | | | | 1.30 | | | | 1.30 | | | | (0.36 | ) | | | 21 | |
Year ended 12/31/16 | | | 13.43 | | | | (0.02 | ) | | | 1.61 | | | | 1.59 | | | | (0.77 | ) | | | 14.25 | | | | 11.72 | | | | 557,205 | | | | 1.31 | | | | 1.31 | | | | (0.18 | ) | | | 35 | |
Year ended 12/31/15 | | | 15.16 | | | | (0.04 | ) | | | (0.82 | ) | | | (0.86 | ) | | | (0.87 | ) | | | 13.43 | | | | (5.61 | ) | | | 543,187 | | | | 1.29 | | | | 1.29 | | | | (0.23 | ) | | | 29 | |
Year ended 12/31/14 | | | 17.00 | | | | (0.08 | ) | | | 0.37 | | | | 0.29 | | | | (2.13 | ) | | | 15.16 | | | | 2.17 | | | | 561,244 | | | | 1.29 | | | | 1.29 | | | | (0.49 | ) | | | 45 | |
Class B | | | | | | | | | | | | | | | | | | | | | | | | | | | | | | | | | | | | | | | | | | | | | | | | |
Year ended 12/31/18(e) | | | 12.36 | | | | (0.01 | ) | | | 0.75 | | | | 0.74 | | | | — | | | | 13.10 | | | | 5.99 | | | | — | | | | 2.04 | (d)(f) | | | 2.04 | (d)(f) | | | (0.97 | )(d)(f) | | | 22 | |
Year ended 12/31/17 | | | 11.70 | | | | (0.13 | ) | | | 1.62 | | | | 1.49 | | | | (0.83 | ) | | | 12.36 | | | | 12.78 | | | | 1,251 | | | | 2.05 | | | | 2.05 | | | | (1.11 | ) | | | 21 | |
Year ended 12/31/16 | | | 11.23 | | | | (0.10 | ) | | | 1.34 | | | | 1.24 | | | | (0.77 | ) | | | 11.70 | | | | 10.89 | | | | 2,986 | | | | 2.06 | | | | 2.06 | | | | (0.93 | ) | | | 35 | |
Year ended 12/31/15 | | | 12.92 | | | | (0.13 | ) | | | (0.69 | ) | | | (0.82 | ) | | | (0.87 | ) | | | 11.23 | | | | (6.28 | ) | | | 5,189 | | | | 2.04 | | | | 2.04 | | | | (0.98 | ) | | | 29 | |
Year ended 12/31/14 | | | 14.92 | | | | (0.18 | ) | | | 0.31 | | | | 0.13 | | | | (2.13 | ) | | | 12.92 | | | | 1.39 | | | | 8,624 | | | | 2.04 | | | | 2.04 | | | | (1.24 | ) | | | 45 | |
Class C | | | | | | | | | | | | | | | | | | | | | | | | | | | | | | | | | | | | | | | | | | | | | | | | |
Year ended 12/31/18 | | | 12.35 | | | | (0.12 | ) | | | (1.76 | ) | | | (1.88 | ) | | | (2.05 | ) | | | 8.42 | | | | (15.76 | ) | | | 37,757 | | | | 2.03 | (d) | | | 2.03 | (d) | | | (0.96 | )(d) | | | 22 | |
Year ended 12/31/17 | | | 11.69 | | | | (0.13 | ) | | | 1.62 | | | | 1.49 | | | | (0.83 | ) | | | 12.35 | | | | 12.79 | | | | 51,355 | | | | 2.05 | | | | 2.05 | | | | (1.11 | ) | | | 21 | |
Year ended 12/31/16 | | | 11.22 | | | | (0.11 | ) | | | 1.35 | | | | 1.24 | | | | (0.77 | ) | | | 11.69 | | | | 10.90 | | | | 56,845 | | | | 2.06 | | | | 2.06 | | | | (0.93 | ) | | | 35 | |
Year ended 12/31/15 | | | 12.92 | | | | (0.13 | ) | | | (0.70 | ) | | | (0.83 | ) | | | (0.87 | ) | | | 11.22 | | | | (6.36 | ) | | | 59,546 | | | | 2.04 | | | | 2.04 | | | | (0.98 | ) | | | 29 | |
Year ended 12/31/14 | | | 14.92 | | | | (0.18 | ) | | | 0.31 | | | | 0.13 | | | | (2.13 | ) | | | 12.92 | | | | 1.40 | | | | 64,348 | | | | 2.04 | | | | 2.04 | | | | (1.24 | ) | | | 45 | |
Class R | | | | | | | | | | | | | | | | | | | | | | | | | | | | | | | | | | | | | | | | | | | | | | | | |
Year ended 12/31/18 | | | 14.44 | | | | (0.07 | ) | | | (2.08 | ) | | | (2.15 | ) | | | (2.05 | ) | | | 10.24 | | | | (15.35 | ) | | | 50,345 | | | | 1.53 | (d) | | | 1.53 | (d) | | | (0.46 | )(d) | | | 22 | |
Year ended 12/31/17 | | | 13.48 | | | | (0.09 | ) | | | 1.88 | | | | 1.79 | | | | (0.83 | ) | | | 14.44 | | | | 13.32 | | | | 71,008 | | | | 1.55 | | | | 1.55 | | | | (0.61 | ) | | | 21 | |
Year ended 12/31/16 | | | 12.77 | | | | (0.06 | ) | | | 1.54 | | | | 1.48 | | | | (0.77 | ) | | | 13.48 | | | | 11.46 | | | | 74,227 | | | | 1.56 | | | | 1.56 | | | | (0.43 | ) | | | 35 | |
Year ended 12/31/15 | | | 14.50 | | | | (0.07 | ) | | | (0.79 | ) | | | (0.86 | ) | | | (0.87 | ) | | | 12.77 | | | | (5.87 | ) | | | 82,078 | | | | 1.54 | | | | 1.54 | | | | (0.48 | ) | | | 29 | |
Year ended 12/31/14 | | | 16.40 | | | | (0.12 | ) | | | 0.35 | | | | 0.23 | | | | (2.13 | ) | | | 14.50 | | | | 1.89 | | | | 99,241 | | | | 1.54 | | | | 1.54 | | | | (0.74 | ) | | | 45 | |
Class Y | | | | | | | | | | | | | | | | | | | | | | | | | | | | | | | | | | | | | | | | | | | | | | | | |
Year ended 12/31/18 | | | 15.86 | | | | 0.00 | | | | (2.30 | ) | | | (2.30 | ) | | | (2.05 | ) | | | 11.51 | | | | (14.92 | ) | | | 71,037 | | | | 1.03 | (d) | | | 1.03 | (d) | | | 0.04 | (d) | | | 22 | |
Year ended 12/31/17 | | | 14.66 | | | | (0.02 | ) | | | 2.05 | | | | 2.03 | | | | (0.83 | ) | | | 15.86 | | | | 13.88 | | | | 228,176 | | | | 1.05 | | | | 1.05 | | | | (0.11 | ) | | | 21 | |
Year ended 12/31/16 | | | 13.76 | | | | 0.01 | | | | 1.66 | | | | 1.67 | | | | (0.77 | ) | | | 14.66 | | | | 12.02 | | | | 409,479 | | | | 1.06 | | | | 1.06 | | | | 0.07 | | | | 35 | |
Year ended 12/31/15 | | | 15.47 | | | | 0.00 | | | | (0.84 | ) | | | (0.84 | ) | | | (0.87 | ) | | | 13.76 | | | | (5.37 | ) | | | 386,369 | | | | 1.04 | | | | 1.04 | | | | 0.02 | | | | 29 | |
Year ended 12/31/14 | | | 17.27 | | | | (0.04 | ) | | | 0.37 | | | | 0.33 | | | | (2.13 | ) | | | 15.47 | | | | 2.36 | | | | 354,121 | | | | 1.04 | | | | 1.04 | | | | (0.24 | ) | | | 45 | |
Class R5 | | | | | | | | | | | | | | | | | | | | | | | | | | | | | | | | | | | | | | | | | | | | | | | | |
Year ended 12/31/18 | | | 16.88 | | | | 0.03 | | | | (2.46 | ) | | | (2.43 | ) | | | (2.05 | ) | | | 12.40 | | | | (14.79 | ) | | | 26,543 | | | | 0.87 | (d) | | | 0.87 | (d) | | | 0.20 | (d) | | | 22 | |
Year ended 12/31/17 | | | 15.54 | | | | 0.00 | | | | 2.17 | | | | 2.17 | | | | (0.83 | ) | | | 16.88 | | | | 14.00 | | | | 50,217 | | | | 0.91 | | | | 0.91 | | | | 0.03 | | | | 21 | |
Year ended 12/31/16 | | | 14.52 | | | | 0.04 | | | | 1.75 | | | | 1.79 | | | | (0.77 | ) | | | 15.54 | | | | 12.22 | | | | 111,621 | | | | 0.87 | | | | 0.87 | | | | 0.26 | | | | 35 | |
Year ended 12/31/15 | | | 16.24 | | | | 0.03 | | | | (0.88 | ) | | | (0.85 | ) | | | (0.87 | ) | | | 14.52 | | | | (5.18 | ) | | | 152,486 | | | | 0.88 | | | | 0.88 | | | | 0.18 | | | | 29 | |
Year ended 12/31/14 | | | 17.99 | | | | (0.01 | ) | | | 0.39 | | | | 0.38 | | | | (2.13 | ) | | | 16.24 | | | | 2.55 | | | | 168,876 | | | | 0.87 | | | | 0.87 | | | | (0.07 | ) | | | 45 | |
Class R6 | | | | | | | | | | | | | | | | | | | | | | | | | | | | | | | | | | | | | | | | | | | | | | | | |
Year ended 12/31/18 | | | 16.99 | | | | 0.05 | | | | (2.49 | ) | | | (2.44 | ) | | | (2.05 | ) | | | 12.50 | | | | (14.75 | ) | | | 255,195 | | | | 0.80 | (d) | | | 0.80 | (d) | | | 0.27 | (d) | | | 22 | |
Year ended 12/31/17 | | | 15.61 | | | | 0.02 | | | | 2.19 | | | | 2.21 | | | | (0.83 | ) | | | 16.99 | | | | 14.19 | | | | 305,344 | | | | 0.85 | | | | 0.85 | | | | 0.09 | | | | 21 | |
Year ended 12/31/16 | | | 14.57 | | | | 0.05 | | | | 1.76 | | | | 1.81 | | | | (0.77 | ) | | | 15.61 | | | | 12.31 | | | | 62,583 | | | | 0.79 | | | | 0.79 | | | | 0.34 | | | | 35 | |
Year ended 12/31/15 | | | 16.28 | | | | 0.05 | | | | (0.89 | ) | | | (0.84 | ) | | | (0.87 | ) | | | 14.57 | | | | (5.10 | ) | | | 92,803 | | | | 0.79 | | | | 0.79 | | | | 0.27 | | | | 29 | |
Year ended 12/31/14 | | | 18.02 | | | | 0.00 | | | | 0.39 | | | | 0.39 | | | | (2.13 | ) | | | 16.28 | | | | 2.60 | | | | 114,981 | | | | 0.78 | | | | 0.78 | | | | 0.02 | | | | 45 | |
| (a) | Calculated using average shares outstanding. |
| (b) | Includes adjustments in accordance with accounting principles generally accepted in the United States of America and as such, the net asset value for financial reporting purposes and the returns based upon those net asset values may differ from the net asset value and returns for shareholder transactions. Does not include sales charges and is not annualized for periods less than one year, if applicable. |
| (c) | Portfolio turnover is calculated at the fund level and is not annualized for periods less than one year, if applicable. |
| (d) | Ratios are based on average daily net assets (000’s omitted) of $544,141, $1,287, $49,530, $65,856, $117,379, $37,137 and $308,562 for Class A, Class B, Class C, Class R, Class Y, Class R5 and Class R6 shares, respectively. |
| (e) | Reflects activity for the period January 1, 2018 through January 26, 2018 (date of conversion). |
21 Invesco Small Cap Equity Fund
Report of Independent Registered Public Accounting Firm
To the Board of Trustees of AIM Funds Group (Invesco Funds Group)
and Shareholders of Invesco Small Cap Equity Fund:
Opinion on the Financial Statements
We have audited the accompanying statement of assets and liabilities, including the schedule of investments, of Invesco Small Cap Equity Fund (one of the funds constituting AIM Funds Group (Invesco Funds Group), hereafter referred to as the “Fund”) as of December 31, 2018, the related statement of operations for the year ended December 31, 2018, the statement of changes in net assets for each of the two years in the period ended December 31,2018, including the related notes, and the financial highlights for each of the periods indicated therein (collectively referred to as the “financial statements”). In our opinion, the financial statements present fairly, in all material respects, the financial position of the Fund as of December 31, 2018, the results of its operations for the year then ended, the changes in its net assets for each of the two years in the period ended December 31, 2018 and the financial highlights for each of the periods indicated therein in conformity with accounting principles generally accepted in the United States of America.
Basis for Opinion
These financial statements are the responsibility of the Fund’s management. Our responsibility is to express an opinion on the Fund’s financial statements based on our audits. We are a public accounting firm registered with the Public Company Accounting Oversight Board (United States) (PCAOB) and are required to be independent with respect to the Fund in accordance with the U.S. federal securities laws and the applicable rules and regulations of the Securities and Exchange Commission and the PCAOB.
We conducted our audits of these financial statements in accordance with the standards of the PCAOB. Those standards require that we plan and perform the audit to obtain reasonable assurance about whether the financial statements are free of material misstatement, whether due to error or fraud.
Our audits included performing procedures to assess the risks of material misstatement of the financial statements, whether due to error or fraud, and performing procedures that respond to those risks. Such procedures included examining, on a test basis, evidence regarding the amounts and disclosures in the financial statements. Our audits also included evaluating the accounting principles used and significant estimates made by management, as well as evaluating the overall presentation of the financial statements. Our procedures included confirmation of securities owned as of December 31, 2018 by correspondence with the custodian, transfer agent and brokers; when replies were not received from brokers, we performed other auditing procedures. We believe that our audits provide a reasonable basis for our opinion.
PricewaterhouseCoopers LLP
Houston, TX
February 28, 2019
We have served as the auditor of one or more of the investment companies in the Invesco group of investment companies since at least 1995. We have not been able to determine the specific year we began serving as auditor.
22 Invesco Small Cap Equity Fund
Calculating your ongoing Fund expenses
Example
As a shareholder of the Fund, you incur two types of costs: (1) transaction costs, which may include sales charges (loads) on purchase payments or contingent deferred sales charges on redemptions, if any; and (2) ongoing costs, including management fees, distribution and/or service (12b-1) fees, and other Fund expenses. This example is intended to help you understand your ongoing costs (in dollars) of investing in the Fund and to compare these costs with ongoing costs of investing in other mutual funds. The example is based on an investment of $1,000 invested at the beginning of the period and held for the entire period July 1, 2018 through December 31, 2018.
Actual expenses
The table below provides information about actual account values and actual expenses. You may use the information in this table, together with the amount you invested, to estimate the expenses that you paid over the period. Simply divide your account value by $1,000 (for example, an $8,600 account value divided by $1,000 = 8.6), then multiply the result by the number in the table under the heading entitled “Actual Expenses Paid During Period” to estimate the expenses you paid on your account during this period.
Hypothetical example for comparison purposes
The table below also provides information about hypothetical account values and hypothetical expenses based on the Fund’s actual expense ratio and an assumed rate of return of 5% per year before expenses, which is not the Fund’s actual return.
The hypothetical account values and expenses may not be used to estimate the actual ending account balance or expenses you paid for the period. You may use this information to compare the ongoing costs of investing in the Fund and other funds. To do so, compare this 5% hypothetical example with the 5% hypothetical examples that appear in the shareholder reports of the other funds.
Please note that the expenses shown in the table are meant to highlight your ongoing costs only and do not reflect any transaction costs, such as sales charges (loads) on purchase payments or contingent deferred sales charges on redemptions, if any. Therefore, the hypothetical information is useful in comparing ongoing costs only, and will not help you determine the relative total costs of owning different funds. In addition, if these transaction costs were included, your costs would have been higher.
| | | | | | | | | | | | | | | | | | | | | | | | |
Class | | Beginning
Account Value (07/01/18) | | | ACTUAL | | | HYPOTHETICAL
(5% annual return before
expenses) | | | Annualized
Expense Ratio | |
| | Ending
Account Value
(12/31/18)1 | | | Expenses
Paid During
Period2 | | | Ending
Account Value
(12/31/18) | | | Expenses
Paid During
Period2 | |
| A | | $ | 1,000.00 | | | $ | 811.40 | | | $ | 5.84 | | | $ | 1,018.75 | | | $ | 6.51 | | | | 1.28 | % |
| C | | | 1,000.00 | | | | 809.00 | | | | 9.26 | | | | 1,014.97 | | | | 10.31 | | | | 2.03 | |
| R | | | 1,000.00 | | | | 810.60 | | | | 6.98 | | | | 1,017.49 | | | | 7.78 | | | | 1.53 | |
| Y | | | 1,000.00 | | | | 812.90 | | | | 4.71 | | | | 1,020.01 | | | | 5.24 | | | | 1.03 | |
| R5 | | | 1,000.00 | | | | 813.50 | | | | 3.93 | | | | 1,020.87 | | | | 4.38 | | | | 0.86 | |
| R6 | | | 1,000.00 | | | | 813.70 | | | | 3.70 | | | | 1,021.12 | | | | 4.13 | | | | 0.81 | |
| 1 | The actual ending account value is based on the actual total return of the Fund for the period July 1, 2018 through December 31, 2018, after actual expenses and will differ from the hypothetical ending account value which is based on the Fund’s expense ratio and a hypothetical annual return of 5% before expenses. |
| 2 | Expenses are equal to the Fund’s annualized expense ratio as indicated above multiplied by the average account value over the period, multiplied by 184/365 to reflect the most recent fiscal half year. |
23 Invesco Small Cap Equity Fund
Tax Information
Form1099-DIV, Form 1042-S and other year–end tax information provide shareholders with actual calendar year amounts that should be included in their tax returns. Shareholders should consult their tax advisors.
The following distribution information is being provided as required by the Internal Revenue Code or to meet a specific state’s requirement.
The Fund designates the following amounts or, if subsequently determined to be different, the maximum amount allowable for its fiscal year ended December 31, 2018:
| | | | |
Federal and State Income Tax | |
Long-Term Capital Gain Distributions | | $ | 131,106,233 | |
Qualified Dividend Income* | | | 89.18 | % |
Corporate Dividends Received Deduction* | | | 88.05 | % |
U.S. Treasury Obligations* | | | 0.00 | % |
| | * | The above percentages are based on ordinary income dividends paid to shareholders during the Fund’s fiscal year. |
24 Invesco Small Cap Equity Fund
Trustees and Officers
The address of each trustee and officer is AIM Funds Group (Invesco Funds Group) (the “Trust”), 11 Greenway Plaza, Suite 1000, Houston, Texas 77046-1173. The trustees serve for the life of the Trust, subject to their earlier death, incapacitation, resignation, retirement or removal as more specifically provided in the Trust’s organizational documents. Each officer serves for a one year term or until their successors are elected and qualified. Column two below includes length of time served with predecessor entities, if any.
| | | | | | | | |
Name, Year of Birth and
Position(s) Held with the Trust | | Trustee and/
or Officer Since | | Principal Occupation(s)
During Past 5 Years | | Number of
Funds in Fund
Complex
Overseen by
Trustee | | Other Directorship(s)
Held by Trustee During
Past 5 Years |
| Interested Persons | | | | | | | | |
| Martin L. Flanagan1 — 1960 Trustee | | 2007 | | Executive Director, Chief Executive Officer and President, Invesco Ltd. (ultimate parent of Invesco and a global investment management firm); Trustee, The Invesco Funds; Vice Chair, Investment Company Institute; and Member of Executive Board, SMU Cox School of Business Formerly: Advisor to the Board, Invesco Advisers, Inc. (formerly known as Invesco Institutional (N.A.), Inc.); Chairman and Chief Executive Officer, Invesco Advisers, Inc. (registered investment adviser); Director, Chairman, Chief Executive Officer and President, Invesco Holding Company (US), Inc. (formerly IVZ Inc.) (holding company), Invesco Group Services, Inc. (service provider) and Invesco North American Holdings, Inc. (holding company); Director, Chief Executive Officer and President, Invesco Holding Company Limited (parent of Invesco and a global investment management firm); Director, Invesco Ltd.; Chairman, Investment Company Institute and President, Co-Chief Executive Officer, Co-President, Chief Operating Officer and Chief Financial Officer, Franklin Resources, Inc. (global investment management organization) | | 158 | | None |
| Philip A. Taylor2 — 1954 Trustee and Senior Vice President | | 2006 | | Head of the Americas and Senior Managing Director, Invesco Ltd.; Director, Invesco Advisers, Inc. (formerly known as Invesco Institutional (N.A.), Inc.) (registered investment adviser); Director and Chairman, Invesco Investment Services, Inc. (formerly known as Invesco AIM Investment Services, Inc.) (registered transfer agent); Chief Executive Officer, Invesco Corporate Class Inc. (corporate mutual fund company); Director, Chairman and Chief Executive Officer, Invesco Canada Ltd. (formerly known as Invesco Trimark Ltd./Invesco Trimark Ltèe) (registered investment adviser and registered transfer agent); Trustee and Senior Vice President, The Invesco Funds; Director, Invesco Investment Advisers LLC (formerly known as Van Kampen Asset Management) Formerly: Director, Chairman, Chief Executive Officer and President, Invesco Management Group, Inc. (formerly known as Invesco AIM Management Group, Inc.) (financial services holding company); Co-Chairman, Co-President and Co-Chief Executive Officer, Invesco Advisers, Inc. (formerly known as Invesco Institutional (N.A.), Inc.) (registered investment adviser); Director, Chief Executive Officer and President, Van Kampen Exchange Corp; President and Principal Executive Officer, The Invesco Funds (other than AIM Treasurer’s Series Trust (Invesco Treasurer’s Series Trust), Short-Term Investments Trust and Invesco Management Trust); Executive Vice President, The Invesco Funds (AIM Treasurer’s Series Trust (Invesco Treasurer’s Series Trust), Short-Term Investments Trust and Invesco Management Trust only); Director and President, INVESCO Funds Group, Inc. (registered investment adviser and registered transfer agent); Director and Chairman, IVZ Distributors, Inc. (formerly known as INVESCO Distributors, Inc.) (registered broker dealer); Director, President and Chairman, Invesco Inc. (holding company), Invesco Canada Holdings Inc. (holding company), Trimark Investments Ltd./Placements Trimark Ltèe and Invesco Financial Services Ltd/Services Financiers Invesco Ltèe; Chief Executive Officer, Invesco Canada Fund Inc. (corporate mutual fund company); Director and Chairman, Van Kampen Investor Services Inc.; Director, Chief Executive Officer and President, 1371 Preferred Inc. (holding company) and Van Kampen Investments Inc.; Director and President, AIM GP Canada Inc. (general partner for limited partnerships) and Van Kampen Advisors, Inc.; Director and Chief Executive Officer, Invesco Trimark Dealer Inc. (registered broker dealer); Director, Invesco Distributors, Inc. (formerly known as Invesco AIM Distributors, Inc.) (registered broker dealer); Manager, Invesco Capital Management LLC; Director, Chief Executive Officer and President, Invesco Advisers, Inc.; Director, Chairman, Chief Executive Officer and President, Invesco AIM Capital Management, Inc.; President, Invesco Trimark Dealer Inc. and Invesco Trimark Ltd./Invesco Trimark Ltèe; Director and President, AIM Trimark Corporate Class Inc. and AIM Trimark Canada Fund Inc.; Senior Managing Director, Invesco Holding Company Limited; Director and Chairman, Fund Management Company (former registered broker dealer); President and Principal Executive Officer, The Invesco Funds (AIM Treasurer’s Series Trust (Invesco Treasurer’s Series Trust), and Short-Term Investments Trust only); President, AIM Trimark Global Fund Inc. and AIM Trimark Canada Fund Inc. | | 158 | | None |
| 1 | Mr. Flanagan is considered an interested person (within the meaning of Section 2(a)(19) of the 1940 Act) of the Trust because he is an officer of the Adviser to the Trust, and an officer and a director of Invesco Ltd., ultimate parent of the Adviser. |
| 2 | Mr. Taylor is considered an interested person (within the meaning of Section 2(a)(19) of the 1940 Act) of the Trust because he is an officer and a director of the Adviser. |
T-1 Invesco Small Cap Equity Fund
Trustees and Officers—(continued)
| | | | | | | | |
Name, Year of Birth and
Position(s) Held with the Trust | | Trustee and/
or Officer Since | | Principal Occupation(s)
During Past 5 Years | | Number of
Funds in Fund
Complex
Overseen by
Trustee | | Other Directorship(s)
Held by Trustee During
Past 5 Years |
| Independent Trustees | | | | | | | | |
Bruce L. Crockett — 1944 Trustee and Chair | | 1987 | | Chairman, Crockett Technologies Associates (technology consulting company) Formerly: Director, Captaris (unified messaging provider); Director, President and Chief Executive Officer, COMSAT Corporation; Chairman, Board of Governors of INTELSAT (international communications company); ACE Limited (insurance company); Independent Directors Council and Investment Company Institute: Member of the Audit Committee, Investment Company Institute; Member of the Executive Committee and Chair of the Governance Committee, Independent Directors Council | | 158 | | Director and Chairman of the Audit Committee, ALPS (Attorneys Liability Protection Society) (insurance company); Director and Member of the Audit Committee and Compensation Committee, Ferroglobe PLC (metallurgical company) |
David C. Arch — 1945 Trustee | | 2010 | | Chairman of Blistex Inc. (consumer health care products manufacturer); Member, World Presidents’ Organization | | 158 | | Board member of the Illinois Manufacturers’ Association |
Jack M. Fields — 1952 Trustee | | 1997 | | Chief Executive Officer, Twenty First Century Group, Inc. (government affairs company); and Chairman, Discovery Learning Alliance (non-profit) Formerly: Owner and Chief Executive Officer, Dos Angeles Ranch L.P. (cattle, hunting, corporate entertainment); Director, Insperity, Inc. (formerly known as Administaff) (human resources provider); Chief Executive Officer, Texana Timber LP (sustainable forestry company); Director of Cross Timbers Quail Research Ranch (non-profit); and member of the U.S. House of Representatives | | 158 | | None |
Cynthia Hostetler — 1962 Trustee | | 2017 | | Non-Executive Director and Trustee of a number of public and private business corporations Formerly: Director, Aberdeen Investment Funds (4 portfolios); Head of Investment Funds and Private Equity, Overseas Private Investment Corporation; President, First Manhattan Bancorporation, Inc.; Attorney, Simpson Thacher & Bartlett LLP | | 158 | | Vulcan Materials Company (construction materials company); Trilinc Global Impact Fund; Genesse Wyoming, Inc. (railroads); Artio Global Investment LLC (mutual fund complex); Edgen Group, Inc. (specialized energy and infrastructure products distributor); Investment Company Institute (professional organization); Independent Directors Council (professional organization) |
Eli Jones — 1961 Trustee | | 2016 | | Professor and Dean, Mays Business School — Texas A&M University Formerly: Professor and Dean, Walton College of Business, University of Arkansas and E.J. Ourso College of Business, Louisiana State University; Director, Arvest Bank | | 158 | | Insperity, Inc. (formerly known as Administaff) (human resources provider) |
Prema Mathai-Davis — 1950 Trustee | | 1998 | | Retired Co-Owner & Partner of Quantalytics Research, LLC, (a FinTech Investment Research Platform for the Self-Directed Investor) | | 158 | | None |
Teresa M. Ressel — 1962 Trustee | | 2017 | | Non-executive director and trustee of a number of public and private business corporations Formerly: Chief Financial Officer, Olayan America, The Olayan Group (international investor/commercial/industrial); Chief Executive Officer, UBS Securities LLC; Group Chief Operating Officer, Americas, UBS AG; Assistant Secretary for Management & Budget and CFO, US Department of the Treasury | | 158 | | Atlantic Power Corporation (power generation company); ON Semiconductor Corp. (semiconductor supplier) |
Ann Barnett Stern — 1957 Trustee | | 2017 | | President and Chief Executive Officer, Houston Endowment Inc. (private philanthropic institution) Formerly: Executive Vice President and General Counsel, Texas Children’s Hospital; Attorney, Beck, Redden and Secrest, LLP; Business Law Instructor, University of St. Thomas; Attorney, Andrews & Kurth LLP | | 158 | | Federal Reserve Bank of Dallas |
Raymond Stickel, Jr. — 1944 Trustee | | 2005 | | Retired Formerly: Director, Mainstay VP Series Funds, Inc. (25 portfolios); Partner, Deloitte & Touche | | 158 | | None |
Robert C. Troccoli — 1949 Trustee | | 2016 | | Adjunct Professor, University of Denver — Daniels College of Business Formerly: Senior Partner, KPMG LLP | | 158 | | None |
Christopher L. Wilson — 1957 Trustee | | 2017 | | Non-executive director and trustee of a number of public and private business corporations Formerly: Director, TD Asset Management USA Inc. (mutual fund complex) (22 portfolios); Managing Partner, CT2, LLC (investing and consulting firm); President/Chief Executive Officer, Columbia Funds, Bank of America Corporation; President/Chief Executive Officer, CDC IXIS Asset Management Services, Inc.; Principal & Director of Operations, Scudder Funds, Scudder, Stevens & Clark, Inc.; Assistant Vice President, Fidelity Investments | | 158 | | ISO New England, Inc.(non-profit organization managing regional electricity market) |
T-2 Invesco Small Cap Equity Fund
Trustees and Officers—(continued)
| | | | | | | | |
Name, Year of Birth and
Position(s) Held with the Trust | | Trustee and/
or Officer Since | | Principal Occupation(s)
During Past 5 Years | | Number of
Funds in Fund
Complex
Overseen by
Trustee | | Other Directorship(s)
Held by Trustee During
Past 5 Years |
| Other Officers | | | | | | | | |
Sheri Morris — 1964 President, Principal Executive Officer and Treasurer | | 1999 | | President, Principal Executive Officer and Treasurer, The Invesco Funds; Vice President, Invesco Advisers, Inc. (formerly known as Invesco Institutional (N.A.), Inc.) (registered investment adviser); and Vice President, Invesco Exchange-Traded Fund Trust, Invesco Exchange-Traded Fund Trust II, Invesco India Exchange-Traded Fund Trust, Invesco Actively Managed Exchange-Traded Fund Trust, Invesco Actively Managed Exchange-Traded Commodity Fund Trust and Invesco Exchange-Traded Self-Indexed Fund Trust Formerly: Vice President and Principal Financial Officer, The Invesco Funds; Vice President, Invesco AIM Advisers, Inc., Invesco AIM Capital Management, Inc. and Invesco AIM Private Asset Management, Inc.; Assistant Vice President and Assistant Treasurer, The Invesco Funds and Assistant Vice President, Invesco Advisers, Inc., Invesco AIM Capital Management, Inc. and Invesco AIM Private Asset Management, Inc.; and Treasurer, Invesco Exchange-Traded Fund Trust, Invesco Exchange-Traded Fund Trust II, Invesco India Exchange-Traded Fund Trust and Invesco Actively Managed Exchange-Traded Fund Trust | | N/A | | N/A |
| Russell C. Burk — 1958 Senior Vice President and Senior Officer | | 2005 | | Senior Vice President and Senior Officer, The Invesco Funds | | N/A | | N/A |
Jeffrey H. Kupor — 1968 Senior Vice President, Chief Legal Officer and Secretary | | 2018 | | Head of Legal of the Americas; Senior Vice President and Secretary, Invesco Advisers, Inc. (formerly known as Invesco Institutional (N.A.), Inc.) (registered investment adviser); Senior Vice President and Secretary, Invesco Distributors, Inc. (formerly known as Invesco AIM Distributors, Inc.); Vice President and Secretary, Invesco Investment Services, Inc. (formerly known as Invesco AIM Investment Services, Inc.) Senior Vice President, Chief Legal Officer and Secretary, The Invesco Funds; Secretary and General Counsel, Invesco Investment Advisers LLC (formerly known as Van Kampen Asset Management); Secretary and General Counsel, Invesco Capital Markets, Inc. (formerly known as Van Kampen Funds Inc.) and Chief Legal Officer, Invesco Exchange-Traded Fund Trust, Invesco Exchange-Traded Fund Trust II, Invesco India Exchange-Traded Fund Trust, Invesco Actively Managed Exchange-Traded Fund Trust, Invesco Actively Managed Exchange-Traded Commodity Fund Trust and Invesco Exchange-Traded Self-Indexed Fund Trust; Secretary, Invesco Indexing LLC; Secretary, W.L. Ross & Co., LLC; Secretary and Vice President, Jemstep, Inc. Formerly: Head of Legal, Worldwide Institutional; Secretary and General Counsel, INVESCO Private Capital Investments, Inc.; Senior Vice President, Secretary and General Counsel, Invesco Management Group, Inc. (formerly known as Invesco AIM Management Group, Inc.); Assistant Secretary, INVESCO Asset Management (Bermuda) Ltd.; Secretary and General Counsel, Invesco Private Capital, Inc.; Assistant Secretary and General Counsel, INVESCO Realty, Inc.; Secretary and General Counsel, Invesco Senior Secured Management, Inc.; and Secretary, Sovereign G./P. Holdings Inc. | | N/A | | N/A |
John M. Zerr — 1962 Senior Vice President | | 2006 | | Chief Operating Officer of the Americas; Senior Vice President, Invesco Advisers, Inc. (formerly known as Invesco Institutional (N.A.), Inc.) (registered investment adviser); Senior Vice President, Invesco Distributors, Inc. (formerly known as Invesco AIM Distributors, Inc.); Director and Vice President, Invesco Investment Services, Inc. (formerly known as Invesco AIM Investment Services, Inc.) Senior Vice President, The Invesco Funds; Managing Director, Invesco Capital Management LLC; Director, Invesco Investment Advisers LLC (formerly known as Van Kampen Asset Management); Senior Vice President, Invesco Capital Markets, Inc. (formerly known as Van Kampen Funds Inc.); Manager, Invesco Indexing LLC Formerly: Director and Senior Vice President, Invesco Management Group, Inc. (formerly known as Invesco AIM Management Group, Inc.); Secretary and General Counsel, Invesco Management Group, Inc. (formerly known as Invesco AIM Management Group, Inc.); Secretary, Invesco Investment Services, Inc. (formerly known as Invesco AIM Investment Services, Inc.); Chief Legal Officer and Secretary, The Invesco Funds; Secretary and General Counsel, Invesco Investment Advisers LLC (formerly known as Van Kampen Asset Management); Secretary and General Counsel, Invesco Capital Markets, Inc. (formerly known as Van Kampen Funds Inc.); Chief Legal Officer, Invesco Exchange-Traded Fund Trust, Invesco Exchange-Traded Fund Trust II, Invesco India Exchange-Traded Fund Trust, Invesco Actively Managed Exchange-Traded Fund Trust, Invesco Actively Managed Exchange-Traded Commodity Fund Trust and Invesco Exchange-Traded Self-Indexed Fund Trust; Secretary, Invesco Indexing LLC; Director, Secretary, General Counsel and Senior Vice President, Van Kampen Exchange Corp.; Director, Vice President and Secretary, IVZ Distributors, Inc. (formerly known as INVESCO Distributors, Inc.); Director and Vice President, INVESCO Funds Group, Inc.; Director and Vice President, Van Kampen Advisors Inc.; Director, Vice President, Secretary and General Counsel, Van Kampen Investor Services Inc.; Director and Secretary, Invesco Distributors, Inc. (formerly known as Invesco AIM Distributors, Inc.); Director, Senior Vice President, General Counsel and Secretary, Invesco AIM Advisers, Inc. and Van Kampen Investments Inc.; Director, Vice President and Secretary, Fund Management Company; Director, Senior Vice President, Secretary, General Counsel and Vice President, Invesco AIM Capital Management, Inc.; Chief Operating Officer and General Counsel, Liberty Ridge Capital, Inc. (an investment adviser) | | N/A | | N/A |
T-3 Invesco Small Cap Equity Fund
Trustees and Officers—(continued)
| | | | | | | | |
Name, Year of Birth and
Position(s) Held with the Trust | | Trustee and/
or Officer Since | | Principal Occupation(s)
During Past 5 Years | | Number of
Funds in Fund
Complex
Overseen by
Trustee | | Other Directorship(s)
Held by Trustee During
Past 5 Years |
| Other Officers—(continued) | | | | | | | | |
Gregory G. McGreevey — 1962 Senior Vice President | | 2012 | | Senior Managing Director, Invesco Ltd.; Director, Chairman, President, and Chief Executive Officer, Invesco Advisers, Inc. (formerly known as Invesco Institutional (N.A.), Inc.) (registered investment adviser); Director, Invesco Mortgage Capital, Inc. and Invesco Senior Secured Management, Inc.; and Senior Vice President, The Invesco Funds Formerly: Senior Vice President, Invesco Management Group, Inc. and Invesco Advisers, Inc.; Assistant Vice President, The Invesco Funds | | N/A | | N/A |
Kelli Gallegos — 1970 Vice President, Principal Financial Officer and Assistant Treasurer | | 2008 | | Vice President and Treasurer, Invesco Exchange-Traded Fund Trust, Invesco Exchange-Traded Fund Trust II, Invesco India Exchange-Traded Fund Trust, Invesco Actively Managed Exchange-Traded Fund Trust, Invesco Actively Managed Exchange-Traded Commodity Fund Trust and Invesco Exchange-Traded Self-Indexed Fund Trust; Vice President, Principal Financial Officer and Assistant Treasurer, The Invesco Funds; Principal Financial and Accounting Officer — Pooled Investments, Invesco Capital Management LLC Formerly: Assistant Treasurer, Invesco Exchange-Traded Fund Trust, Invesco Exchange-Traded Fund Trust II, Invesco India Exchange-Traded Fund Trust, Invesco Actively Managed Exchange-Traded Fund Trust, Invesco Actively Managed Exchange-Traded Commodity Fund Trust and Invesco Exchange-Traded Self-Indexed Fund Trust; Assistant Treasurer, Invesco Capital Management LLC; Assistant Vice President, The Invesco Funds | | N/A | | N/A |
Tracy Sullivan — 1962 Vice President, Chief Tax Officer and Assistant Treasurer | | 2008 | | Vice President, Chief Tax Officer and Assistant Treasurer, The Invesco Funds; Assistant Treasurer, Invesco Capital Management LLC, Invesco Exchange-Traded Fund Trust, Invesco Exchange-Traded Fund Trust II, Invesco India Exchange-Traded Fund Trust, Invesco Actively Managed Exchange-Traded Fund Trust, Invesco Actively Managed Exchange-Traded Commodity Fund Trust and Invesco Exchange-Traded Self-Indexed Fund Trust Formerly: Assistant Vice President, The Invesco Funds | | N/A | | N/A |
Crissie M. Wisdom — 1969 Anti-Money Laundering Compliance Officer | | 2013 | | Anti-Money Laundering Compliance Officer, Invesco Advisers, Inc. (formerly known as Invesco Institutional (N.A.), Inc.) (registered investment adviser), Invesco Capital Markets, Inc. (formerly known as Van Kampen Funds Inc.), Invesco Distributors, Inc., Invesco Investment Services, Inc., The Invesco Funds, and Invesco Exchange-Traded Fund Trust, Invesco Exchange-Traded Fund Trust II, Invesco India Exchange-Traded Fund Trust, Invesco Actively Managed Exchange-Traded Fund Trust, Invesco Actively Managed Exchange-Traded Commodity Fund Trust and Invesco Exchange-Traded Self-Indexed Fund Trust; Anti-Money Laundering Compliance Officer and Bank Secrecy Act Officer, INVESCO National Trust Company and Invesco Trust Company; and Fraud Prevention Manager and Controls and Risk Analysis Manager for Invesco Investment Services, Inc. Formerly: Anti-Money Laundering Compliance Officer, Van Kampen Exchange Corp. and Invesco Management Group, Inc. | | N/A | | N/A |
Robert R. Leveille — 1969 Chief Compliance Officer | | 2016 | | Chief Compliance Officer, Invesco Advisers, Inc. (registered investment adviser); and Chief Compliance Officer, The Invesco Funds Formerly: Chief Compliance Officer, Putnam Investments and the Putnam Funds | | N/A | | N/A |
The Statement of Additional Information of the Trust includes additional information about the Fund’s Trustees and is available upon request, without charge, by calling 1.800.959.4246. Please refer to the Fund’s Statement of Additional Information for information on the Fund’s sub-advisers.
| | | | | | |
Office of the Fund 11 Greenway Plaza, Suite 1000 Houston, TX 77046-1173 | | Investment Adviser Invesco Advisers, Inc. 1555 Peachtree Street, N.E. Atlanta, GA 30309 | | Distributor Invesco Distributors, Inc. 11 Greenway Plaza, Suite 1000 Houston, TX 77046-1173 | | Auditors PricewaterhouseCoopers LLP 1000 Louisiana Street, Suite 5800 Houston, TX 77002-5021 |
| | | |
| | | | | | |
Counsel to the Fund Stradley Ronon Stevens & Young, LLP 2005 Market Street, Suite 2600 Philadelphia, PA 19103-7018 | | Counsel to the Independent Trustees Goodwin Procter LLP 901 New York Avenue, N.W. Washington, D.C. 20001 | | Transfer Agent Invesco Investment Services, Inc. 11 Greenway Plaza, Suite 1000 Houston, TX 77046-1173 | | Custodian State Street Bank and Trust Company 225 Franklin Street Boston, MA 02110-2801 |
T-4 Invesco Small Cap Equity Fund
Explore High-Conviction Investing with Invesco

Go paperless with eDelivery
Visit invesco.com/edelivery to enjoy the convenience and security of anytime electronic access to your investment documents.
With eDelivery, you can elect to have any or all of the following materials delivered straight to your inbox to download, save and print from your own computer:
| ∎ | | Fund reports and prospectuses |
Invesco mailing information
Send general correspondence to Invesco Investment Services, Inc., P.O. Box 219078, Kansas City, MO 64121-9078.
Important notice regarding delivery of security holder documents
To reduce Fund expenses, only one copy of most shareholder documents may be mailed to shareholders with multiple accounts at the same address (Householding). Mailing of your shareholder documents may be householded indefinitely unless you instruct us otherwise. If you do not want the mailing of these documents to be combined with those for other members of your household, please contact Invesco Investment Services, Inc. at 800 959 4246 or contact your financial institution. We will begin sending you individual copies for each account within 30 days after receiving your request.
Fund holdings and proxy voting information
The Fund provides a complete list of its holdings four times in each fiscal year, at the quarter ends. For the second and fourth quarters, the lists appear in the Fund’s semiannual and annual reports to shareholders. For the first and third quarters, the Fund files the lists with the Securities and Exchange Commission (SEC) on FormN-Q (or any successor Form). The most recent list of portfolio holdings is available at invesco.com/completeqtrholdings. Shareholders can also look up the Fund’s FormsN-Q (or any successor Form) on the SEC website at sec.gov. The SEC file numbers for the Fund are shown below.
A description of the policies and procedures that the Fund uses to determine how to vote proxies relating to portfolio securities is available without charge, upon request, from our Client Services department at 800 959 4246 or at invesco.com/proxyguidelines. The information is also available on the SEC website, sec.gov.
| | |
Information regarding how the Fund voted proxies related to its portfolio securities during the most recent12-month period ended June 30 is available at invesco.com/proxysearch. The information is also available on the SEC website, sec.gov. Invesco Advisers, Inc. is an investment adviser; it provides investment advisory services to individual and institutional clients and does not sell securities. Invesco Distributors, Inc. is the US distributor for Invesco Ltd.’s retail mutual funds, exchange-traded funds and institutional money market funds. Both are wholly owned, indirect subsidiaries of Invesco Ltd. | |  |
| | | | |
| SEC file numbers:811-01540 and002-27334 | | Invesco Distributors, Inc. | | SCE-AR-1 02272019 0804 |
| | |
| |
ITEM 2. | | CODE OF ETHICS. |
| |
| | On May 2, 2018, the Board of Trustees of the Invesco Funds amended the Code of Ethics (the “Code”) that applies to the Registrant’s Principal Executive Officer (“PEO”) and Principal Financial Officer (“PFO”) during the period covered by the report. The Registrant did not grant any waivers, including implicit waivers, from any provisions of the Code to the PEO or PFO during the period covered by this report. |
| |
ITEM 3. | | AUDIT COMMITTEE FINANCIAL EXPERT. |
| |
| | The Board of Trustees has determined that the Registrant has at least one audit committee financial expert serving on its Audit Committee. The Audit Committee financial experts are David C. Arch, Bruce L. Crockett, Cynthia Hostetler, Teresa M. Ressel, Raymond Stickel, Jr. and Robert C. Troccoli. David C. Arch, Bruce L. Crockett, Cynthia Hostetler, Teresa M. Ressel, Raymond Stickel, Jr. and Robert Troccoli are “independent” within the meaning of that term as used in FormN-CSR. |
| |
ITEM 4. | | PRINCIPAL ACCOUNTANT FEES AND SERVICES. |
| |
| | PricewaterhouseCoopers LLP (“PwC”) informed the Trust that it has identified an issue related to its independence under Rule2-01(c)(1)(ii)(A) of RegulationS-X (referred to as the Loan Rule). The Loan Rule prohibits accounting firms, such as PricewaterhouseCoopers LLP, from being deemed independent if they have certain financial relationships with their audit clients or certain affiliates of those clients. The Trust is required under various securities laws to have its financial statements audited by an independent accounting firm. |
| |
| | The Loan Rule specifically provides that an accounting firm would not be independent if it or certain affiliates and covered persons receives a loan from a lender that is a record or beneficial owner of more than ten percent of an audit client’s equity securities (referred to as a “more than ten percent owner”). For purposes of the Loan Rule, audit clients include the Funds as well as all registered investment companies advised by the Adviser and its affiliates, including other subsidiaries of the Adviser’s parent company, Invesco Ltd. (collectively, the Invesco Fund Complex). PricewaterhouseCoopers LLP informed the Trust it and certain affiliates and covered persons have relationships with lenders who hold, as record owner, more than ten percent of the shares of certain funds within the Invesco Fund Complex. |
| |
| | On June 20, 2016, the SEC Staff issued a“no-action” letter to another mutual fund complex (see Fidelity Management & Research Company et al.,No-Action Letter) related to the audit independence issue described above. In that letter, the SEC confirmed that it would not recommend enforcement action against a fund that relied on audit services performed by an audit firm that was not in compliance with the Loan Rule in certain specified circumstances. On May 2, 2018, the SEC proposed amendments to the Loan Rule that, if adopted as proposed, would address many of the issues that led to issuance of theno-action letter. In connection with prior independence determinations, PricewaterhouseCoopers LLP communicated, as contemplated by theno-action letter, that it believes that it remains objective and impartial and that a reasonable investor possessing all the facts would conclude that PricewaterhouseCoopers LLP is able to exhibit the requisite objectivity and impartiality to report on the Funds’ financial statements as the independent registered public accounting firm. PricewaterhouseCoopers LLP also represented that it has complied with PCAOB Rule 3526(b)(1) and (2), which |
| | |
| | are conditions to the Funds relying on the no action letter, and affirmed that it is an independent accountant within the meaning of PCAOB Rule 3520. Therefore, the Adviser, the Funds and PricewaterhouseCoopers LLP concluded that PricewaterhouseCoopers LLP could continue as the Funds’ independent registered public accounting firm. The Invesco Fund Complex relied upon theno-action letter in reaching this conclusion. |
| |
| | If in the future the independence of PricewaterhouseCoopers LLP is called into question under the Loan Rule by circumstances that are not addressed in the SEC’sno-action letter, the Funds will need to take other action in order for the Funds’ filings with the SEC containing financial statements to be deemed compliant with applicable securities laws. Such additional actions could result in additional costs, impair the ability of the Funds to issue new shares or have other material adverse effects on the Funds. The SECno-action relief was initially set to expire 18 months from issuance but has been extended by the SEC without an expiration date, except that theno-action letter will be withdrawn upon the effectiveness of any amendments to the Loan Rule designed to address the concerns expressed in the letter. |
| |
| | PwC advised the Registrant’s Audit Committee that PwC had identified two matters for consideration under the SEC’s auditor independence rules. PwC stated that a PwC manager and a PwC Senior Manager each held financial interests in investment companies within the Invesco Fund complex that were inconsistent with the requirements of Rule2-01(c)(1) of RegulationS-X. |
| |
| | PwC advised the Audit Committee that it believes its objectivity and impartiality had not been adversely affected by these matters as they related to the audit of the Registrant. In reaching this conclusion, PwC noted, among other things, that during the time of its audit, the engagement team was not aware of the investments, neither individual was in the chain of command of the audit or the audit partners of Invesco or the affiliate of the Registrant, the services each individual provided were not relied upon by the audit engagement team with respect to the audit of the affiliate of the Registrant and the investments were not material to the net worth of either individual or their immediate family members. |
(a) to (d)
Fees Billed by PwC Related to the Registrant
PwC billed the Registrant aggregate fees for services rendered to the Registrant for the last two fiscal years as follows:
| | | | | | | | |
| | | Fees Billed for Services Rendered to
the Registrant forfiscal year end
2018 | | | Fees Billed for Services Rendered to
the Registrant for fiscal year end 2017 | |
| | |
Audit Fees | | | $ 143,200 | | | | $ 120,200 | |
Audit-Related Fees(1) | | | $ 0 | | | | $ 3,000 | |
Tax Fees(2) | | | $ 32,800 | | | | $ 65,972 | |
All Other Fees | | | $ 0 | | | | $ 0 | |
Total Fees | | | $ 176,000 | | | | $ 189,172 | |
(g) PwC billed the Registrant aggregatenon-audit fees of $32,800 for the fiscal year ended 2018, and $68,972 for the fiscal year ended 2017, fornon-audit services rendered to the Registrant.
| (1) | Audit-Related Fees for the fiscal year end December 31, 2017 included fees billed for reviewing regulatory filings. |
| (2) | Tax Fees for the fiscal year end December 31, 2018 includes fees billed for reviewing tax returns and/or services related to tax compliance. Tax Fees for fiscal year end December 31, 2017 included fees billed for reviewing tax returns and/or services related to tax compliance. |
Fees Billed by PwC Related to Invesco and Invesco Affiliates
PwC billed Invesco Advisers, Inc. (“Invesco”), the Registrant’s adviser, and any entity controlling, controlled by or under common control with Invesco that provides ongoing services to the Registrant (“Invesco Affiliates”) aggregate fees forpre-approvednon-audit services rendered to Invesco and Invesco Affiliates for the last two fiscal years as follows:
| | | | | | | | |
| | | Fees Billed for Non-Audit Services
Rendered to Invesco and Invesco
Affiliates for fiscal year end 2018
That Were Required to bePre-Approved by the Registrant’s Audit Committee | | | Fees Billed for Non-Audit Services
Rendered to Invesco and Invesco
Affiliates for fiscal year end 2017 That
Were Required to bePre-Approved by the Registrant’s Audit Committee | |
| | |
| Audit-Related Fees(1) | | | $ 690,000 | | | | $ 662,000 | |
| Tax Fees | | | $ 0 | | | | $ 0 | |
| All Other Fees(2) | | | $ 0 | | | | $ 1,006,000 | |
| Total Fees | | | $ 690,000 | | | | $ 1,668,000 | |
| | (1) | Audit-Related Fees for the year end 2018 includes fees billed related to reviewing controls at a service organization. Audit-Related Fees for the year end 2017 included fees billed related to reviewing controls at a service organization. |
| (2) | All Other Fees for the year end 2017 included fees billed related to the assessments for certain of the company’s risk management tools, current state analysis against regulatory requirements and identification of structural and organizational alternatives, informed by industry practices, for certain of the company’s administrative activities and functions. |
(e)(2) There were no amounts that werepre-approved by the Audit Committee pursuant to the de minimus exception under Rule2-01 of RegulationS-X.
(f) Not applicable.
(g) Including the fees for services not required to bepre-approved by the registrant’s audit committee, PwC billed Invesco and Invesco Affiliates aggregatenon-audit fees of $4,240,000 for the fiscal year ended December 31, 2018, and $4,496,000 for the fiscal year ended December 31, 2017, fornon-audit services rendered to Invesco and Invesco Affiliates.
PwC provided audit services to the Investment Company complex of approximately $25 million.
(h) The Audit Committee also has considered whether the provision ofnon-audit services that were rendered to Invesco and Invesco Affiliates that were not required to bepre-approved pursuant to SEC regulations, if any, is compatible with maintaining PwC’s independence.
(e)(1)
PRE-APPROVAL OF AUDIT ANDNON-AUDIT SERVICES
POLICIES AND PROCEDURES
As adopted by the Audit Committees
of the Invesco Funds (the “Funds”)
Last Amended March 29, 2017
| | I. | Statement of Principles |
The Audit Committees (the “Audit Committee”) of the Boards of Trustees of the Funds (the “Board”) have adopted these policies and procedures (the “Procedures”) with respect to thepre-approval of audit andnon-audit services to be provided by the Funds’ independent auditor (the “Auditor”) to the Funds, and to the Funds’ investment adviser(s) and any entity controlling, controlled by, or under common control with the investment adviser(s) that provides ongoing services to the Funds (collectively, “Service Affiliates”).
Under Section 202 of the Sarbanes-Oxley Act of 2002, all audit andnon-audit services provided to the Funds by the Auditor must be preapproved by the Audit Committee. Rule2-01 of RegulationS-X requires that the Audit Committee alsopre-approve a Service Affiliate’s engagement of the Auditor fornon-audit services if the engagement relates directly to the operations and financial reporting of the Funds (a “Service Affiliate’s Covered Engagement”).
These Procedures set forth the procedures and the conditions pursuant to which the Audit Committee maypre-approve audit andnon-audit services for the Funds and a Service Affiliate’s Covered Engagement pursuant to rules and regulations of the Securities and Exchange Commission (“SEC”) and other organizations and regulatory bodies applicable to the Funds (“Applicable Rules”).1 They address both generalpre-approvals without consideration of specificcase-by-case services (“general pre-approvals”) and pre-approvals on acase-by-case basis (“specific pre-approvals”). Any services requiringpre-approval that are not within the scope of generalpre-approvals hereunder are subject to specificpre-approval. These Procedures also address the delegation by the Audit Committee ofpre-approval authority to the Audit Committee Chair or Vice Chair.
| | II. | Pre-Approval of Fund Audit Services |
The annual Fund audit services engagement, including terms and fees, is subject to specificpre-approval by the Audit Committee. Audit services include the annual financial statement audit and other procedures required to be performed by an independent auditor to be able to form an opinion on the Funds’ financial statements. The Audit Committee will receive, review and consider sufficient information concerning a proposed Fund audit engagement to make a reasonable evaluation of the Auditor’s qualifications and independence. The Audit Committee will oversee the Fund audit services engagement as necessary, including approving any changes in terms, audit scope, conditions and fees.
1 Applicable Rules include, for example, New York Stock Exchange (“NYSE”) rules applicable to closed-end funds managed by Invesco and listed on NYSE.
In addition to approving the Fund audit services engagement at least annually and specifically approving any changes, the Audit Committee may generally or specificallypre-approve engagements for other audit services, which are those services that only an independent auditor reasonably can provide. Other audit services may include services associated with SEC registration statements, periodic reports and other documents filed with the SEC.
| | III. | General and SpecificPre-Approval ofNon-Audit Fund Services |
The Audit Committee will consider, at least annually, the list of GeneralPre-ApprovedNon-Audit Services which list may be terminated or modified at any time by the Audit Committee. To inform the Audit Committee’s review and approval of GeneralPre-ApprovedNon-Audit Services, the Funds’ Treasurer (or his or her designee) and Auditor shall provide such information regarding independence or other matters as the Audit Committee may request.
Any services or fee ranges that are not within the scope of GeneralPre-ApprovedNon-Audit Services have not received generalpre-approval and require specificpre-approval. Each request for specificpre-approval by the Audit Committee for services to be provided by the Auditor to the Funds must be submitted to the Audit Committee by the Funds’ Treasurer (or his or her designee)and must include detailed information about the services to be provided, the fees or fee ranges to be charged, and other relevant information sufficient to allow the Audit Committee to consider whether topre-approve such engagement, including evaluating whether the provision of such services will impair the independence of the Auditor and is otherwise consistent with Applicable Rules.
| | IV. | Non-Audit Service Types |
The Audit Committee may provide either general or specificpre-approval of audit-related, tax or other services, each as described in more detail below.
“Audit-related services” are assurance and related services that are reasonably related to the performance of the audit or review of the Fund’s financial statements or that are traditionally performed by an independent auditor. Audit-related services include, among others, accounting consultations related to accounting, financial reporting or disclosure matters not classified as “Audit services”; assistance with understanding and implementing new accounting and financial reporting guidance from rulemaking authorities; services related to mergers, acquisitions or dispositions; compliance with ratings agency requirements and interfund lending activities; and assistance with internal control reporting requirements.
“Tax services” include, but are not limited to, the review and signing of the Funds’ federal tax returns, the review of required distributions by the Funds and consultations regarding tax matters such as the tax treatment of new investments or the impact of new regulations. The Audit Committee will not approve proposed services of the Auditor which the Audit Committee believes are to be provided in connection with a service or transaction initially recommended by the Auditor, the sole business purpose of which may be tax avoidance and the tax treatment of which may not be supported in the Internal Revenue Code and related regulations. The Audit Committee will consult with the Funds’ Treasurer (or his or her designee) and may consult with outside counsel or advisers as necessary to ensure the consistency of tax services rendered by the Auditor with the foregoing policy. The Auditor shall not represent any Fund or any Service Affiliate before a tax court, district court or federal court of claims.
Each request to provide tax services under either the general or specificpre-approval of the Audit Committee will include a description from the Auditor in writing of (i) the scope of the service, the fee structure for the engagement, and any side letter or other amendment to the engagement letter, or any other agreement (whether oral, written, or otherwise) between the Auditor and the Funds, relating to the service; and (ii) any compensation arrangement or other agreement, such as a referral agreement, a referral fee orfee-sharing arrangement, between the Auditor (or an affiliate of the Auditor) and any person (other than the Funds or Service Affiliates receiving the services) with respect to the promoting, marketing, or recommending of a transaction covered by the service. The Auditor will also discuss with the Audit Committee the potential effects of the services on the independence of the Auditor, and document the substance of its discussion with the Audit Committee.
The Audit Committee maypre-approve other non-audit services so long as the Audit Committee believes that the service will not impair the independence of the Auditor.Appendix I includes a list of services that the Auditor is prohibited from performing by the SEC rules.Appendix I also includes a list of services that would impair the Auditor’s independence unless the Audit Committee reasonably concludes that the results of the services will not be subject to audit procedures during an audit of the Funds’ financial statements.
| | V. | Pre-Approval of Service Affiliate’s Covered Engagements |
Rule2-01 of RegulationS-X requires that the Audit Committeepre-approve a Service Affiliate’s engagement of the Auditor fornon-audit services if the engagement relates directly to the operations and financial reporting of the Funds, defined above as a “Service Affiliate’s Covered Engagement”.
The Audit Committee may provide either general or specificpre-approval of any Service Affiliate’s Covered Engagement, including for audit-related, tax or other services, as described above, if the Audit Committee believes that the provision of the services to a Service Affiliate will not impair the independence of the Auditor with respect to the Funds. Any Service Affiliate’s Covered Engagements that are not within the scope of GeneralPre-ApprovedNon-Audit Services have not received generalpre-approval and require specificpre-approval.
Each request for specificpre-approval by the Audit Committee of a Service Affiliate’s Covered Engagement must be submitted to the Audit Committee by the Funds’ Treasurer (or his or her designee)and must include detailed information about the services to be provided, the fees or fee ranges to be charged, a description of the current status of thepre-approval process involving other audit committees in the Invesco investment company complex (as defined in Rule2-201 of RegulationS-X) with respect to the proposed engagement, and other relevant information sufficient to allow the Audit Committee to consider whether the provision of such services will impair the independence of the Auditor from the Funds. Additionally, the Funds’ Treasurer (or his or her designee) and the Auditor will provide the Audit Committee with a statement that the proposed engagement requirespre-approval by the Audit Committee, the proposed engagement, in their view, will not impair the independence of the Auditor and is consistent with Applicable Rules, and the description of the proposed engagement provided to the Audit Committee is consistent with that presented to or approved by the Invesco audit committee.
Information about all Service Affiliate engagements of the Auditor fornon-audit services, whether or not subject topre-approval by the Audit Committee, shall be provided to the Audit Committee at least quarterly, to allow the Audit Committee to consider whether the provision of such services is compatible with maintaining the Auditor’s independence from the Funds. The Funds’ Treasurer and Auditor shall provide the Audit Committee with sufficiently detailed information about the scope of services provided and the fees for such services, to ensure that the Audit Committee can adequately consider whether the provision of such services is compatible with maintaining the Auditor’s independence from the Funds.
| | VI. | Pre-Approved Fee Levels or Established Amounts |
Pre-approved fee levels or ranges for audit andnon-audit services to be provided by the Auditor to the Funds, and for a Service Affiliate’s Covered Engagement, under generalpre-approval or specificpre-approval will be set periodically by the Audit Committee. Any proposed fees exceeding 110% of the maximumpre-approved fee levels or ranges for such services or engagements will be promptly presented to the Audit Committee and will require specificpre-approval by the Audit Committee before payment of any additional fees is made.
The Audit Committee hereby delegates, subject to the dollar limitations set forth below, specific authority to its Chair, or in his or her absence, Vice Chair, topre-approve audit andnon-audit services proposed to be provided by the Auditor to the Funds and/or a Service Affiliate’s Covered Engagement, between Audit Committee meetings. Such delegation does not preclude the Chair or Vice Chair from declining, on a case by case basis, to exercise his or her delegated authority and instead convening the Audit Committee to consider andpre-approve any proposed services or engagements.
Notwithstanding the foregoing, the Audit Committee mustpre-approve: (a) anynon-audit services to be provided to the Funds for which the fees are estimated to exceed $500,000; (b) any Service Affiliate’s Covered Engagement for which the fees are estimated to exceed $500,000; or (c) any cost increase to any previously approved service or engagement that exceeds the greater of $250,000 or 50% of the previously approved fees up to a maximum increase of $500,000.
| | VIII. | Compliance with Procedures |
Notwithstanding anything herein to the contrary, failure topre-approve any services or engagements that are not required to bepre-approved pursuant to the de minimis exception provided for in Rule2-01(c)(7)(i)(C) of RegulationS-X shall not constitute a violation of these Procedures. The Audit Committee has designated the Funds’ Treasurer to ensure services and engagements arepre-approved in compliance with these Procedures. The Funds’ Treasurer will immediately report to the Chair of the Audit Committee, or the Vice Chair in his or her absence, any breach of these Procedures that comes to the attention of the Funds’ Treasurer or any services or engagements that are not required to bepre-approved pursuant to the de minimis exception provided for in Rule2-01(c)(7)(i)(C) of RegulationS-X.
On at least an annual basis, the Auditor will provide the Audit Committee with a summary of allnon-audit services provided to any entity in the investment company complex (as defined in
section2-01(f)(14) of RegulationS-X, including the Funds and Service Affiliates) that were notpre-approved, including the nature of services provided and the associated fees.
| | IX. | Amendments to Procedures |
All material amendments to these Procedures must be approved in advance by the Audit Committee.Non-material amendments to these Procedures may be made by the Legal and Compliance Departments and will be reported to the Audit Committee at the next regularly scheduled meeting of the Audit Committee.
Appendix I
Non-Audit Services That May Impair the Auditor’s Independence
The Auditor is not independent if, at any point during the audit and professional engagement, the Auditor provides the followingnon-audit services:
| | · | | Broker-dealer, investment adviser, or investment banking services ; |
| | · | | Expert services unrelated to the audit; |
| | · | | Any service or product provided for a contingent fee or a commission; |
| | · | | Services related to marketing, planning, or opining in favor of the tax treatment of confidential transactions or aggressive tax position transactions, a significant purpose of which is tax avoidance; |
| | · | | Tax services for persons in financial reporting oversight roles at the Fund; and |
| | · | | Any other service that the Public Company Oversight Board determines by regulation is impermissible. |
An Auditor is not independent if, at any point during the audit and professional engagement, the Auditor provides the followingnon-audit services unless it is reasonable to conclude that the results of the services will not be subject to audit procedures during an audit of the Funds’ financial statements:
| | · | | Bookkeeping or other services related to the accounting records or financial statements of the audit client; |
| | · | | Financial information systems design and implementation; |
| | · | | Appraisal or valuation services, fairness opinions, orcontribution-in-kind reports; |
| | · | | Actuarial services; and |
| | · | | Internal audit outsourcing services. |
|
| ITEM 5. AUDIT COMMITTEE OF LISTED REGISTRANTS. |
|
Not applicable. |
| | |
| ITEM 6. | | SCHEDULE OF INVESTMENTS. |
| |
| | Investments in securities of unaffiliated issuers is included as part of the reports to stockholders filed under Item 1 of this Form. |
| |
| ITEM 7. | | DISCLOSURE OF PROXY VOTING POLICIES AND PROCEDURES FORCLOSED-END MANAGEMENT INVESTMENT COMPANIES. |
| |
| | Not applicable. |
| |
| ITEM 8. | | PORTFOLIO MANAGERS OFCLOSED-END MANAGEMENT INVESTMENT COMPANIES. |
| |
| | Not applicable. |
| |
| ITEM 9. | | PURCHASES OF EQUITY SECURITIES BYCLOSED-END MANAGEMENT INVESTMENT COMPANY AND AFFILIATED PURCHASERS. |
| |
| | Not applicable. |
| |
| ITEM 10. | | SUBMISSION OF MATTERS TO A VOTE OF SECURITY HOLDERS. |
| |
| | None. |
| |
| ITEM 11. | | CONTROLS AND PROCEDURES. |
| |
| (a) | | As of February 13, 2019, an evaluation was performed under the supervision and with the participation of the officers of the Registrant, including the Principal Executive Officer (“PEO”) and Principal Financial Officer (“PFO”), to assess the effectiveness of the Registrant’s disclosure controls and procedures, as that term is defined in Rule30a-3(c) under the Investment Company Act of 1940 (the “Act”), as amended. Based on that evaluation, the Registrant’s officers, including the PEO and PFO, concluded that, as of February 13, 2019, the Registrant’s disclosure controls and procedures were reasonably designed to ensure: (1) that information required to be disclosed by the Registrant on FormN-CSR is recorded, processed, summarized and reported within the time periods specified by the rules and forms of the Securities and Exchange Commission; and (2) that material information relating to the Registrant is made known to the PEO and PFO as appropriate to allow timely decisions regarding required disclosure. |
| |
| (b) | | There have been no changes in the Registrant’s internal control over financial reporting (as defined in Rule30a-3(d) under the Act) that occurred during the second fiscal quarter of the period covered by the report that has materially affected, or is reasonably likely to materially affect, the Registrant’s internal control over financial reporting. |
| |
| ITEM 12. | | DISCLOSURE OF SECURITIES LENDING ACTIVITIES FORCLOSED-END MANAGEMENT INVESTMENT COMPANIES |
| |
| | Not applicable. |
| | |
| ITEM 13. | | EXHIBITS. |
| |
| 13(a) (1) | | Code of Ethics. |
| |
| 13(a) (2) | | Certifications of principal executive officer and principal financial officer as required by Rule30a-2(a) under the Investment Company Act of 1940. |
| |
| 13(a) (3) | | Not applicable. |
| |
| 13(a) (4) | | Not applicable |
| |
| 13(b) | | Certifications of principal executive officer and principal financial officer as required by Rule30a-2(b) under the Investment Company Act of 1940. |
SIGNATURES
Pursuant to the requirements of the Securities Exchange Act of 1934 and the Investment Company Act of 1940, the Registrant has duly caused this report to be signed on its behalf by the undersigned, thereunto duly authorized.
Registrant: AIM Funds Group (Invesco Funds Group)
| | |
| By: | | /s/ Sheri Morris |
| | Sheri Morris |
| | Principal Executive Officer |
| |
| Date: | | March 8, 2019 |
Pursuant to the requirements of the Securities and Exchange Act of 1934 and the Investment Company Act of 1940, this report has been signed below by the following persons on behalf of the Registrant and in the capacities and on the dates indicated.
| | |
| By: | | /s/ Sheri Morris |
| | Sheri Morris |
| | Principal Executive Officer |
| |
| Date: | | March 8, 2019 |
| |
| By: | | /s/ Kelli Gallegos |
| | Kelli Gallegos |
| | Principal Financial Officer |
| |
| Date: | | March 8, 2019 |
EXHIBIT INDEX
| | |
| 13(a) (1) | | Code of Ethics. |
| |
| 13(a) (2) | | Certifications of principal executive officer and principal financial officer as required by Rule30a-2(a) under the Investment Company Act of 1940. |
| |
| 13(a) (3) | | Not applicable. |
| |
| 13(a) (4) | | Not applicable. |