UNITED STATES
SECURITIES AND EXCHANGE COMMISSION
Washington, D.C. 20549
FORM N-CSR
CERTIFIED SHAREHOLDER REPORT OF REGISTERED
MANAGEMENT INVESTMENT COMPANIES
| | |
| Investment Company Act file number | | 811-01540 |
AIM Funds Group (Invesco Funds Group)
(Exact name of registrant as specified in charter)
11 Greenway Plaza, Suite 1000 Houston, Texas 77046
(Address of principal executive offices) (Zip code)
Sheri Morris 11 Greenway Plaza, Suite 1000 Houston, Texas 77046
(Name and address of agent for service)
Registrant’s telephone number, including area code: (713) 626-1919
Date of fiscal year end: 12/31
Date of reporting period: 12/31/22
ITEM 1. REPORTS TO STOCKHOLDERS.
(a) The Registrant’s annual report transmitted to shareholders pursuant to Rule 30e-1 under the Investment Company Act of 1940 is as follows:
(b) Not applicable.

| | |
| Annual Report to Shareholders | | December 31, 2022 |
Invesco EQV European Small Company Fund
Nasdaq:
A: ESMAX ∎ C: ESMCX ∎ Y: ESMYX ∎ R6: ESMSX
Management’s Discussion of Fund Performance
| | | | |
| |
Performance summary | |
For the year ended December 31, 2022, Class A shares of Invesco EQV European Small Company Fund (the Fund) outperformed the MSCI Europe Small Cap Index, the Fund’s broad market/style-specific benchmark. | |
Your Fund’s long-term performance appears later in this report. | |
| |
Fund vs. Indexes | |
Total returns, 12/31/21 to 12/31/22, at net asset value (NAV). Performance shown does not include applicable contingent deferred sales charges (CDSC) or front-end sales charges, which would have reduced performance. | |
Class A Shares | | | -16.25 | % |
Class C Shares | | | -16.94 | |
Class Y Shares | | | -16.06 | |
Class R6 Shares | | | -15.95 | |
MSCI Europe Indexq (Broad Market Index)* | | | -15.06 | |
MSCI Europe Small Cap Indexq (Broad Market/Style-Specific Index)* | | | -27.27 | |
| |
Source(s): qRIMES Technologies Corp. | | | | |
* Effective April 29, 2022, the Fund changed its benchmark index from the MSCI Europe Index to the MSCI Europe Small Cap Index. The Fund’s investment adviser believes the MSCI Europe Small Cap Index provides a more appropriate comparison for evaluating the Fund’s performance. | |
Market conditions and your Fund
Global equity markets declined in the first half of 2022 amid volatility sparked by Russia’s invasion of Ukraine, rising commodity prices, rampant global inflation and central banks shifting toward tighter monetary policy. Russia’s invasion exacerbated inflationary pressures, disrupting already strained supply chains, and increasing shortages of oil, gas and raw materials, with the price of oil rising sharply.
Inflation headwinds continued into the third quarter of 2022. The US Federal Reserve (the Fed), the European Central Bank and the Bank of England all raised interest rates. In contrast, the People’s Bank of China lowered its policy rate and the Bank of Japan kept rates the same. Emerging market equities, hampered by the strong US dollar, underperformed developed market equities.
Global equity markets posted gains for the fourth quarter of 2022, after better inflation data sparked a rally in October and November. However, investor sentiment worsened in December after central banks signaled continued interest rate hikes into 2023 as inflation remained above target levels. International stocks outperformed US stocks in the fourth quarter, led by results in Europe and the UK. Emerging market equities also posted gains for the fourth quarter of 2022, boosted by China, which eased its zero-COVID-19 policy and started to reopen even as COVID-19 infections surged.
Despite the rebound in the fourth quarter of 2022, at the end of the fiscal year ended December 31, 2022, trailing one-year returns for developed market equities and emerging market equities were both in negative territory.
We remain focused on our bottom-up investment approach of identifying attractive companies that fit our earnings, quality and
valuation (EQV) process regardless of the macroeconomic environment.
During the fiscal year ended December 31, 2022, strong stock selection in the information technology (IT) and consumer discretionary sectors were among the largest contributors to the Fund’s relative outperformance versus the broad market/style-specific benchmark, MSCI Europe Small Cap Index. Within the IT sector, France-based financial software and services company Linedata Services was a notable contributor to absolute and relative results. In addition, we saw particular strength in France-based industrial and office equipment company Manutan International in the consumer discretionary sector. Strong stock selection in consumer staples also added to the Fund’s relative performance. Conversely, stock selection in the financials and industrials sectors detracted from the Fund’s relative performance during the fiscal year. Within the financials sector, UK-based Mortgage Advice Bureau detracted from both absolute and relative Fund performance. An underweight in financials and lack of exposure to materials and utilities sectors hampered relative results.
On a geographic basis, strong security selection in France was a key contributor to the Fund’s relative return during the fiscal year. In addition, an underweight in Sweden and the Fund’s exposure to Romania, a country not represented in the broad market/style-specific benchmark, added to relative performance after posting positive absolute results. In contrast, stock selection in Denmark and Switzerland detracted from the Fund’s relative performance. Exposure to Russia, underweights in Denmark and Switzerland and having no exposure to Spain also hampered relative results.
The Fund’s cash position in a declining market environment was additive to performance versus the broad market/style-specific benchmark. It is important to note that similar to
the Fund’s sector and regional allocations, cash is a residual of our bottom-up investment process and not the result of any top-down tactical asset allocation or risk-management allocation decision.
From an individual securities perspective, France-based energy company TotalEnergies EP Gabon was among the most significant contributors to the Fund’s performance during the fiscal year. The energy producer offers among the most attractive cash returns to investors in the industry.
In contrast, UK-based real estate company Savills was a key detractor from the Fund’s relative performance during the fiscal year. Savills is one of the world’s leading commercial real estate brokers. The stock sold off due to fears of a real estate market slowdown driven by macro weakness and higher interest rates. We believe the secular trends of outsourcing property management and demand for yield generating assets will persist.
Over the fiscal year, we continued to look for opportunities to improve the growth potential and quality of the Fund’s portfolio by adding companies based on our EQV outlook for each company. We initiated a few new positions, including multinational industrials company Signify and France-based IT company Claranova. We exited the Fund’s position in Globaltrans Investment during the fiscal year. We also had a couple of Fund positions that were acquired by other companies during the fiscal year; Vivo Energy was acquired by Vitol and Ultra Electronics was acquired by Cobham (not Fund holdings).
As always, we remain focused on a bottom-up investment approach of identifying attractive companies that fit our EQV-focused investment process. We continue to look for high-quality companies that exhibit the following characteristics: strong organic growth; high returns on capital; pricing power; strong balance sheets; cash generation; and reasonable valuations. In addition, we continue to favor companies that are able to consistently generate cash during weak economic environments. Our balanced EQV-focused approach aligns with our goal of delivering attractive risk-adjusted returns over the long term.
We thank you for your continued investment in Invesco EQV European Small Company Fund.
| | |
| 2 | | Invesco EQV European Small Company Fund |
Portfolio manager(s):
Borge Endresen - Lead
Minkun Zhang
The views and opinions expressed in management’s discussion of Fund performance are those of Invesco Advisers, Inc. and its affiliates. These views and opinions are subject to change at any time based on factors such as market and economic conditions. These views and opinions may not be relied upon as investment advice or recommendations, or as an offer for a particular security. The information is not a complete analysis of every aspect of any market, country, industry, security or the Fund. Statements of fact are from sources considered reliable, but Invesco Advisers, Inc. makes no representation or warranty as to their completeness or accuracy. Although historical performance is no guarantee of future results, these insights may help you understand our investment management philosophy.
See important Fund and, if applicable, index disclosures later in this report.
| | |
| 3 | | Invesco EQV European Small Company Fund |
Your Fund’s Long-Term Performance
Results of a $10,000 Investment – Oldest Share Class(es)
Fund and index data from 12/31/12
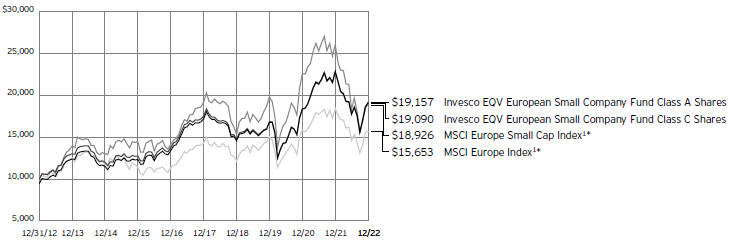
1 Source: RIMES Technologies Corp.
| | * | Effective April 29, 2022, the Fund changed its benchmark index from the MSCI Europe Index to the MSCI Europe Small Cap Index. The Fund’s investment adviser believes the MSCI Europe Small Cap Index provides a more appropriate comparison for evaluating the Fund’s performance. |
Past performance cannot guarantee future results.
The data shown in the chart include reinvested distributions, applicable sales charges and Fund expenses including management
fees. Index results include reinvested dividends, but they do not reflect sales charges. Performance of the peer group, if applicable, reflects fund expenses and management fees;
performance of a market index does not. Performance shown in the chart does not reflect deduction of taxes a shareholder would pay on Fund distributions or sale of Fund shares.
| | |
| 4 | | Invesco EQV European Small Company Fund |
| | | | |
| |
Average Annual Total Returns | |
As of 12/31/22, including maximum applicable sales charges | |
| |
Class A Shares | | | | |
Inception (8/31/00) | | | 9.28 | % |
10 Years | | | 6.72 | |
5 Years | | | 1.05 | |
1 Year | | | -20.84 | |
| |
Class C Shares | | | | |
Inception (8/31/00) | | | 9.28 | % |
10 Years | | | 6.68 | |
5 Years | | | 1.42 | |
1 Year | | | -17.68 | |
| |
Class Y Shares | | | | |
Inception (10/3/08) | | | 8.72 | % |
10 Years | | | 7.58 | |
5 Years | | | 2.45 | |
1 Year | | | -16.06 | |
| |
Class R6 Shares | | | | |
10 Years | | | 7.53 | % |
5 Years | | | 2.54 | |
1 Year | | | -15.95 | |
Class R6 shares incepted on April 4, 2017. Performance shown prior to that date is that of Class A shares at net asset value and includes the 12b-1 fees applicable to Class A shares.
The performance data quoted represent past performance and cannot guarantee future results; current performance may be lower or higher. Please visit invesco.com/ performance for the most recent month-end performance. Performance figures reflect reinvested distributions, changes in net asset value and the effect of the maximum sales charge unless otherwise stated. Performance figures do not reflect deduction of taxes a shareholder would pay on Fund distributions or sale of Fund shares. Investment return and principal value will fluctuate so that you may have a gain or loss when you sell shares.
Class A share performance reflects the maximum 5.50% sales charge, and Class C share performance reflects the applicable contingent deferred sales charge (CDSC) for the period involved. The CDSC on Class C shares is 1% for the first year after purchase. Class Y and Class R6 shares do not have a front-end sales charge or a CDSC; therefore, performance is at net asset value.
The performance of the Fund’s share classes will differ primarily due to different sales charge structures and class expenses.
Fund performance reflects any applicable fee waivers and/or expense reimbursements. Had the adviser not waived fees and/or reimbursed expenses currently or in the past, returns would have been lower. See current prospectus for more information.
| | |
| 5 | | Invesco EQV European Small Company Fund |
Supplemental Information
Invesco EQV European Small Company Fund’s investment objective is long-term growth of capital.
| ∎ | Unless otherwise stated, information presented in this report is as of December 31, 2022, and is based on total net assets. |
| ∎ | Unless otherwise noted, all data is provided by Invesco. |
| ∎ | To access your Fund’s reports/prospectus, visit invesco.com/fundreports. |
About indexes used in this report
| ∎ | The MSCI Europe Index is an unmanaged index considered representative of stocks of developed European countries. The index is computed using the net return, which withholds applicable taxes for non-resident investors. |
| ∎ | The MSCI Europe Small Cap Index is an unmanaged index considered representative of small-cap European stocks. The index is computed using the net return, which withholds applicable taxes for non-resident investors. |
| ∎ | The Fund is not managed to track the performance of any particular index, including the index(es) described here, and consequently, the performance of the Fund may deviate significantly from the performance of the index(es). |
| ∎ | A direct investment cannot be made in an index. Unless otherwise indicated, index results include reinvested dividends, and they do not reflect sales charges. Performance of the peer group, if applicable, reflects fund expenses; performance of a market index does not. |
|
|
This report must be accompanied or preceded by a currently effective Fund prospectus, which contains more complete information, including sales charges and expenses. Investors should read it carefully before investing. |
|
| NOT FDIC INSURED | MAY LOSE VALUE | NO BANK GUARANTEE |
| | |
| 6 | | Invesco EQV European Small Company Fund |
Fund Information
Portfolio Composition
| | | | | |
| By sector | | % of total net assets |
| |
Industrials | | | | 30.24 | % |
| |
Information Technology | | | | 20.90 | |
| |
Consumer Discretionary | | | | 15.29 | |
| |
Financials | | | | 12.63 | |
| |
Consumer Staples | | | | 4.82 | |
| |
Energy | | | | 4.10 | |
| |
Real Estate | | | | 2.60 | |
| |
Health Care | | | | 0.25 | |
| |
Money Market Funds Plus Other Assets Less Liabilities | | | | 9.17 | |
Top 10 Equity Holdings*
| | | | | | | |
| | | | | % of total net assets |
| | |
| 1. | | Neurones | | | | 5.37 | % |
| | |
| 2. | | Infotel S.A. | | | | 5.11 | |
| | |
| 3. | | Diploma PLC | | | | 4.90 | |
| | |
| 4. | | Fondul Proprietatea S.A. | | | | 4.58 | |
| | |
| 5. | | Gerard Perrier Industrie S.A. | | | | 4.36 | |
| | |
| 6. | | Renew Holdings PLC | | | | 4.20 | |
| | |
| 7. | | Clarkson PLC | | | | 4.05 | |
| | |
| 8. | | Kaufman & Broad S.A. | | | | 3.92 | |
| | |
| 9. | | Hilan Ltd. | | | | 3.90 | |
| | |
| 10. | | TBC Bank Group PLC | | | | 3.46 | |
The Fund’s holdings are subject to change, and there is no assurance that the Fund will continue to hold any particular security.
| * | Excluding money market fund holdings, if any. |
Data presented here are as of December 31, 2022.
| | |
| 7 | | Invesco EQV European Small Company Fund |
Schedule of Investments
December 31, 2022
| | | | | | | | |
| | | Shares | | | Value | |
|
| |
Common Stocks & Other Equity Interests–90.83% | |
Denmark–0.87% | | | | | | | | |
TCM Group A/S(a) | | | 151,388 | | | $ | 1,588,307 | |
|
| |
| | |
France–28.71% | | | | | | | | |
Claranova SE | | | 465,372 | | | | 1,373,933 | |
|
| |
Exail Technologies S.A.(b) | | | 114,696 | | | | 2,451,117 | |
|
| |
Gerard Perrier Industrie S.A. | | | 81,971 | | | | 7,933,443 | |
|
| |
HEXAOM | | | 132,990 | | | | 2,646,648 | |
|
| |
Infotel S.A. | | | 157,203 | | | | 9,287,592 | |
|
| |
Kaufman & Broad S.A. | | | 242,700 | | | | 7,126,786 | |
|
| |
Linedata Services | | | 40,177 | | | | 1,982,392 | |
|
| |
Manutan International | | | 46,230 | | | | 5,098,591 | |
|
| |
Neurones | | | 232,283 | | | | 9,758,818 | |
|
| |
Totalenergies EP Gabon | | | 26,924 | | | | 4,553,483 | |
|
| |
| | | | | | | 52,212,803 | |
|
| |
| | |
Georgia–3.46% | | | | | | | | |
TBC Bank Group PLC | | | 229,577 | | | | 6,294,247 | |
|
| |
| | |
Germany–0.25% | | | | | | | | |
MorphoSys AG(b) | | | 31,430 | | | | 444,119 | |
|
| |
| | |
Greece–1.75% | | | | | | | | |
Karelia Tobacco Co., Inc. S.A. | | | 10,265 | | | | 3,187,278 | |
|
| |
| | |
Ireland–3.07% | | | | | | | | |
Origin Enterprises PLC | | | 1,210,635 | | | | 5,589,558 | |
|
| |
| | |
Israel–4.60% | | | | | | | | |
Hilan Ltd. | | | 142,809 | | | | 7,092,776 | |
|
| |
MIND C.T.I. Ltd. | | | 609,450 | | | | 1,279,845 | |
|
| |
| | | | | | | 8,372,621 | |
|
| |
| | |
Italy–2.85% | | | | | | | | |
Gruppo MutuiOnline S.p.A. | | | 75,783 | | | | 2,138,275 | |
|
| |
Technogym S.p.A.(a) | | | 397,739 | | | | 3,038,183 | |
|
| |
| | | | | | | 5,176,458 | |
|
| |
| | |
Netherlands–1.60% | | | | | | | | |
SBM Offshore N.V. | | | 185,296 | | | | 2,911,612 | |
|
| |
| | |
Norway–0.95% | | | | | | | | |
Bouvet ASA | | | 284,184 | | | | 1,728,513 | |
|
| |
| | |
Poland–4.87% | | | | | | | | |
LiveChat Software S.A. | | | 131,000 | | | | 3,201,987 | |
|
| |
Mo-BRUK S.A. | | | 38,176 | | | | 2,590,795 | |
|
| |
Warsaw Stock Exchange | | | 378,420 | | | | 3,055,795 | |
|
| |
| | | | | | | 8,848,577 | |
|
| |
Investment Abbreviations:
BR – Bearer Shares
| | | | | | | | |
| | | Shares | | | Value | |
|
| |
Portugal–0.65% | | | | | | | | |
Conduril - Engenharia S.A. | | | 46,308 | | | $ | 1,189,689 | |
|
| |
| | |
Romania–4.58% | | | | | | | | |
Fondul Proprietatea S.A. | | | 18,836,533 | | | | 8,323,305 | |
|
| |
| | |
Singapore–0.98% | | | | | | | | |
XP Power Ltd. | | | 72,347 | | | | 1,778,524 | |
|
| |
| | |
Sweden–1.26% | | | | | | | | |
Proact IT Group AB | | | 287,095 | | | | 2,281,059 | |
|
| |
| | |
Switzerland–3.43% | | | | | | | | |
Carlo Gavazzi Holding AG, BR | | | 9,525 | | | | 3,098,195 | |
|
| |
Kardex Holding AG | | | 19,018 | | | | 3,138,614 | |
|
| |
| | | | | | | 6,236,809 | |
|
| |
| | |
United Kingdom–25.59% | | | | | | | | |
City of London Investment Group PLC | | | 900,000 | | | | 4,552,763 | |
|
| |
Clarkson PLC | | | 188,808 | | | | 7,359,759 | |
|
| |
DCC PLC | | | 74,233 | | | | 3,664,612 | |
|
| |
Diploma PLC | | | 265,427 | | | | 8,919,574 | |
|
| |
Eurocell PLC | | | 721,500 | | | | 1,286,735 | |
|
| |
IG Group Holdings PLC | | | 555,264 | | | | 5,252,583 | |
|
| |
Mortgage Advice Bureau Holdings Ltd. | | | 260,274 | | | | 1,678,120 | |
|
| |
Renew Holdings PLC | | | 860,626 | | | | 7,635,124 | |
|
| |
SafeStyle UK PLC | | | 4,465,000 | | | | 1,456,791 | |
|
| |
Savills PLC | | | 473,369 | | | | 4,728,547 | |
|
| |
| | | | | | | 46,534,608 | |
|
| |
| | |
United States–1.36% | | | | | | | | |
Signify N.V. | | | 73,555 | | | | 2,476,395 | |
|
| |
Total Common Stocks & Other Equity Interests
(Cost $138,086,209) | | | | 165,174,482 | |
|
| |
| | |
Money Market Funds–4.50% | | | | | | | | |
Invesco Government & Agency Portfolio, Institutional Class,
4.22%(c)(d) | | | 2,641,820 | | | | 2,641,820 | |
|
| |
Invesco Liquid Assets Portfolio, Institutional Class,
4.42%(c)(d) | | | 2,523,995 | | | | 2,524,753 | |
|
| |
Invesco Treasury Portfolio, Institutional Class, 4.20%(c)(d) | | | 3,019,224 | | | | 3,019,224 | |
|
| |
Total Money Market Funds (Cost $8,184,259) | | | | 8,185,797 | |
|
| |
TOTAL INVESTMENTS IN SECURITIES–95.33%
(Cost $146,270,468) | | | | 173,360,279 | |
|
| |
OTHER ASSETS LESS LIABILITIES–4.67% | | | | 8,498,711 | |
|
| |
NET ASSETS–100.00% | | | | | | $ | 181,858,990 | |
|
| |
See accompanying Notes to Financial Statements which are an integral part of the financial statements.
| | |
| 8 | | Invesco EQV European Small Company Fund |
Notes to Schedule of Investments:
| (a) | Security purchased or received in a transaction exempt from registration under the Securities Act of 1933, as amended (the “1933 Act”). The security may be resold pursuant to an exemption from registration under the 1933 Act, typically to qualified institutional buyers. The aggregate value of these securities at December 31, 2022 was $4,626,490, which represented 2.54% of the Fund’s Net Assets. |
| (b) | Non-income producing security. |
| (c) | Affiliated issuer. The issuer and/or the Fund is a wholly-owned subsidiary of Invesco Ltd., or is affiliated by having an investment adviser that is under common control of Invesco Ltd. The table below shows the Fund’s transactions in, and earnings from, its investments in affiliates for the fiscal year ended December 31, 2022. |
| | | | | | | | | | | | | | | | | | | | | | | | | | | | | | | | | | | | | | | | |
| | | Value
December 31, 2021 | | | Purchases
at Cost | | | Proceeds
from Sales | | | Change in Unrealized Appreciation (Depreciation) | | Realized Gain (Loss) | | | Value December 31, 2022 | | | Dividend Income | |
| Investments in Affiliated Money Market Funds: | | | | | | | | | | | | | | | | | | | | | | | | | | | | | | | | | | | | | | | | |
Invesco Government & Agency Portfolio, Institutional Class | | $ | 3,916,384 | | | | | | | $ | 18,394,583 | | | $ | (19,669,147 | ) | | $ | - | | | | | | | $ | - | | | $ | 2,641,820 | | | | | | | $ | 61,556 | |
Invesco Liquid Assets Portfolio, Institutional Class | | | 3,434,147 | | | | | | | | 13,138,988 | | | | (14,049,389 | ) | | | 1,167 | | | | | | | | (160) | | | | 2,524,753 | | | | | | | | 65,555 | |
Invesco Treasury Portfolio, Institutional Class | | | 4,475,867 | | | | | | | | 21,022,381 | | | | (22,479,024 | ) | | | - | | | | | | | | - | | | | 3,019,224 | | | | | | | | 83,296 | |
| Investments Purchased with Cash Collateral from Securities on Loan: | | | | | | | | | | | | | | | | | | | | | | | | | | | | | | | | | | | | | | | | |
Invesco Private Government Fund | | | 34,852 | | | | | | | | 5,254,208 | | | | (5,289,060 | ) | | | - | | | | | | | | - | | | | - | | | | | | | | 4,102* | |
Invesco Private Prime Fund | | | 81,321 | | | | | | | | 12,568,286 | | | | (12,649,925 | ) | | | - | | | | | | | | 318 | | | | - | | | | | | | | 10,921* | |
| Investments in Other Affiliates: | | | | | | | | | | | | | | | | | | | | | | | | | | | | | | | | | | | | | | | | |
MIND C.T.I. Ltd.** | | | 3,770,995 | | | | | | | | - | | | | (1,638,241 | ) | | | (846,726 | ) | | | | | | | (6,183) | | | | 1,279,845 | | | | | | | | 182,814 | |
Total | | $ | 15,713,566 | | | | | | | $ | 70,378,446 | | | $ | (75,774,786 | ) | | $ | (845,559 | ) | | | | | | $ | (6,025) | | | $ | 9,465,642 | | | | | | | $ | 408,244 | |
| * | Represents the income earned on the investment of cash collateral, which is included in securities lending income on the Statement of Operations. Does not include rebates and fees paid to lending agent or premiums received from borrowers, if any. |
| ** | As of December 31, 2022, this security was not considered as an affiliate of the Fund. |
| (d) | The rate shown is the 7-day SEC standardized yield as of December 31, 2022. |
See accompanying Notes to Financial Statements which are an integral part of the financial statements.
| | |
| 9 | | Invesco EQV European Small Company Fund |
Statement of Assets and Liabilities
December 31, 2022
| | | | |
Assets: | | | | |
Investments in unaffiliated securities, at value
(Cost $138,086,209) | | $ | 165,174,482 | |
|
| |
Investments in affiliated money market funds, at value (Cost $8,184,259) | | | 8,185,797 | |
|
| |
Foreign currencies, at value (Cost $8,296,380) | | | 8,367,688 | |
|
| |
Receivable for: | | | | |
Fund shares sold | | | 17,152 | |
|
| |
Dividends | | | 560,756 | |
|
| |
Investment for trustee deferred compensation and retirement plans | | | 51,848 | |
|
| |
Other assets | | | 35,826 | |
|
| |
Total assets | | | 182,393,549 | |
|
| |
| |
Liabilities: | | | | |
Payable for: | | | | |
Fund shares reacquired | | | 299,509 | |
|
| |
Accrued fees to affiliates | | | 94,138 | |
|
| |
Accrued trustees’ and officers’ fees and benefits | | | 3,013 | |
|
| |
Accrued other operating expenses | | | 79,181 | |
|
| |
Trustee deferred compensation and retirement plans | | | 58,718 | |
|
| |
Total liabilities | | | 534,559 | |
|
| |
Net assets applicable to shares outstanding | | $ | 181,858,990 | |
|
| |
| |
Net assets consist of: | | | | |
Shares of beneficial interest | | $ | 156,926,029 | |
|
| |
Distributable earnings | | | 24,932,961 | |
|
| |
| | $ | 181,858,990 | |
|
| |
| | | | |
Net Assets: | | | | |
| |
Class A | | $ | 94,975,498 | |
|
| |
Class C | | $ | 2,567,815 | |
|
| |
Class Y | | $ | 75,528,898 | |
|
| |
Class R6 | | $ | 8,786,779 | |
|
| |
|
Shares outstanding, no par value, with an unlimited number of shares authorized: | |
| |
Class A | | | 6,939,673 | |
|
| |
Class C | | | 202,788 | |
|
| |
Class Y | | | 5,493,882 | |
|
| |
Class R6 | | | 639,160 | |
|
| |
Class A: | | | | |
Net asset value per share | | $ | 13.69 | |
|
| |
Maximum offering price per share
(Net asset value of $13.69 ÷ 94.50%) | | $ | 14.49 | |
|
| |
Class C: | | | | |
Net asset value and offering price per share | | $ | 12.66 | |
|
| |
Class Y: | | | | |
Net asset value and offering price per share | | $ | 13.75 | |
|
| |
Class R6: | | | | |
Net asset value and offering price per share | | $ | 13.75 | |
|
| |
See accompanying Notes to Financial Statements which are an integral part of the financial statements.
| | |
| 10 | | Invesco EQV European Small Company Fund |
Statement of Operations
For the year ended December 31, 2022
| | | | |
Investment income: | | | | |
| |
Dividends (net of foreign withholding taxes of $589,658) | | $ | 8,639,514 | |
|
| |
Dividends from affiliates (includes net securities lending income of $189,685) | | | 582,906 | |
|
| |
Total investment income | | | 9,222,420 | |
|
| |
| |
Expenses: | | | | |
Advisory fees | | | 1,897,479 | |
|
| |
Administrative services fees | | | 29,816 | |
|
| |
Custodian fees | | | 51,775 | |
|
| |
Distribution fees: | | | | |
Class A | | | 246,939 | |
|
| |
Class C | | | 31,671 | |
|
| |
Transfer agent fees – A, C and Y | | | 297,077 | |
|
| |
Transfer agent fees – R6 | | | 2,491 | |
|
| |
Trustees’ and officers’ fees and benefits | | | 18,932 | |
|
| |
Registration and filing fees | | | 57,997 | |
|
| |
Reports to shareholders | | | 44,047 | |
|
| |
Professional services fees | | | 83,304 | |
|
| |
Other | | | 13,748 | |
|
| |
Total expenses | | | 2,775,276 | |
|
| |
Less: Fees waived and/or expense offset arrangement(s) | | | (13,906 | ) |
|
| |
Net expenses | | | 2,761,370 | |
|
| |
Net investment income | | | 6,461,050 | |
|
| |
| |
Realized and unrealized gain (loss) from: | | | | |
Net realized gain (loss) from: | | | | |
Unaffiliated investment securities | | | 17,780,504 | |
|
| |
Affiliated investment securities | | | (6,025 | ) |
|
| |
Foreign currencies | | | (198,839 | ) |
|
| |
| | | 17,575,640 | |
|
| |
Change in net unrealized appreciation (depreciation) of: | | | | |
Unaffiliated investment securities | | | (68,135,398 | ) |
|
| |
Affiliated investment securities | | | (845,559 | ) |
|
| |
Foreign currencies | | | 47,122 | |
|
| |
| | | (68,933,835 | ) |
|
| |
Net realized and unrealized gain (loss) | | | (51,358,195 | ) |
|
| |
Net increase (decrease) in net assets resulting from operations | | $ | (44,897,145 | ) |
|
| |
See accompanying Notes to Financial Statements which are an integral part of the financial statements.
| | |
| 11 | | Invesco EQV European Small Company Fund |
Statement of Changes in Net Assets
For the years ended December 31, 2022 and 2021
| | | | | | | | |
| | | 2022 | | | 2021 | |
|
| |
Operations: | | | | | | | | |
Net investment income | | $ | 6,461,050 | | | $ | 3,529,286 | |
|
| |
Net realized gain | | | 17,575,640 | | | | 21,908,904 | |
|
| |
Change in net unrealized appreciation (depreciation) | | | (68,933,835 | ) | | | 29,211,631 | |
|
| |
Net increase (decrease) in net assets resulting from operations | | | (44,897,145 | ) | | | 54,649,821 | |
|
| |
| | |
Distributions to shareholders from distributable earnings: | | | | | | | | |
Class A | | | (9,757,917 | ) | | | (3,871,714 | ) |
|
| |
Class C | | | (269,202 | ) | | | (56,942 | ) |
|
| |
Class Y | | | (8,046,073 | ) | | | (4,828,280 | ) |
|
| |
Class R6 | | | (933,877 | ) | | | (454,663 | ) |
|
| |
Total distributions from distributable earnings | | | (19,007,069 | ) | | | (9,211,599 | ) |
|
| |
| | |
Share transactions–net: | | | | | | | | |
Class A | | | 1,995,292 | | | | 4,080,917 | |
|
| |
Class C | | | (619,774 | ) | | | (3,325,561 | ) |
|
| |
Class Y | | | (27,224,590 | ) | | | (11,561,580 | ) |
|
| |
Class R6 | | | (622,420 | ) | | | (714,094 | ) |
|
| |
Net increase (decrease) in net assets resulting from share transactions | | | (26,471,492 | ) | | | (11,520,318 | ) |
|
| |
Net increase (decrease) in net assets | | | (90,375,706 | ) | | | 33,917,904 | |
|
| |
| | |
Net assets: | | | | | | | | |
Beginning of year | | | 272,234,696 | | | | 238,316,792 | |
|
| |
End of year | | $ | 181,858,990 | | | $ | 272,234,696 | |
|
| |
See accompanying Notes to Financial Statements which are an integral part of the financial statements.
| | |
| 12 | | Invesco EQV European Small Company Fund |
Financial Highlights
The following schedule presents financial highlights for a share of the Fund outstanding throughout the periods indicated.
| | | | | | | | | | | | | | | | | | | | | | | | | | | | | | | | | | | | | | | | | | | | | | | | | | | | | | | | |
| | | Net asset value, beginning of period | | Net investment income(a) | | Net gains (losses) on securities (both realized and unrealized) | | Total from investment operations | | Dividends from net investment income | | Distributions from net realized gains | | Total distributions | | Net asset value, end of period | | Total return (b) | | Net assets, end of period (000’s omitted) | | Ratio of expenses to average net assets with fee waivers and/or expenses absorbed | | Ratio of expenses to average net
assets without fee waivers and/or expenses absorbed | | Ratio of net investment income to average net assets | | Portfolio turnover (c) |
| Class A | | | | | | | | | | | | | | | | | | | | | | | | | | | | | | | | | | | | | | | | | | | | | | | | | | | | | | | | |
Year ended 12/31/22 | | | $18.25 | | | | $0.46 | (d) | | | $(3.48 | ) | | | $(3.02 | ) | | | $(0.36 | ) | | | $(1.18 | ) | | | $(1.54 | ) | | | $13.69 | | | | (16.25 | )% | | | $ 94,975 | | | | 1.48 | % | | | 1.49 | % | | | 3.06 | %(d) | | | 5 | % |
Year ended 12/31/21 | | | 15.18 | | | | 0.21 | | | | 3.46 | | | | 3.67 | | | | (0.53 | ) | | | (0.07 | ) | | | (0.60 | ) | | | 18.25 | | | | 24.27 | | | | 123,121 | | | | 1.33 | | | | 1.33 | | | | 1.22 | | | | 10 | |
Year ended 12/31/20 | | | 14.24 | | | | 0.14 | (d) | | | 1.21 | | | | 1.35 | | | | (0.17 | ) | | | (0.24 | ) | | | (0.41 | ) | | | 15.18 | | | | 9.60 | | | | 99,172 | | | | 1.53 | | | | 1.54 | | | | 1.09 | (d) | | | 6 | |
Year ended 12/31/19 | | | 13.23 | | | | 0.34 | (d) | | | 1.67 | | | | 2.01 | | | | (0.63 | ) | | | (0.37 | ) | | | (1.00 | ) | | | 14.24 | | | | 15.23 | | | | 121,763 | | | | 1.42 | | | | 1.43 | | | | 2.40 | (d) | | | 1 | |
Year ended 12/31/18 | | | 16.58 | | | | 0.28 | | | | (2.80 | ) | | | (2.52 | ) | | | (0.29 | ) | | | (0.54 | ) | | | (0.83 | ) | | | 13.23 | | | | (15.21 | ) | | | 127,904 | | | | 1.35 | | | | 1.38 | | | | 1.73 | | | | 11 | |
| Class C | | | | | | | | | | | | | | | | | | | | | | | | | | | | | | | | | | | | | | | | | | | | | | | | | | | | | | | | |
Year ended 12/31/22 | | | 17.04 | | | | 0.33 | (d) | | | (3.27 | ) | | | (2.94 | ) | | | (0.26 | ) | | | (1.18 | ) | | | (1.44 | ) | | | 12.66 | | | | (16.94 | ) | | | 2,568 | | | | 2.23 | | | | 2.24 | | | | 2.31 | (d) | | | 5 | |
Year ended 12/31/21 | | | 14.01 | | | | 0.08 | | | | 3.19 | | | | 3.27 | | | | (0.17 | ) | | | (0.07 | ) | | | (0.24 | ) | | | 17.04 | | | | 23.35 | | | | 4,215 | | | | 2.08 | | | | 2.08 | | | | 0.47 | | | | 10 | |
Year ended 12/31/20 | | | 13.27 | | | | 0.04 | (d) | | | 1.11 | | | | 1.15 | | | | (0.17 | ) | | | (0.24 | ) | | | (0.41 | ) | | | 14.01 | | | | 8.80 | | | | 6,370 | | | | 2.28 | | | | 2.29 | | | | 0.34 | (d) | | | 6 | |
Year ended 12/31/19 | | | 12.36 | | | | 0.22 | (d) | | | 1.56 | | | | 1.78 | | | | (0.50 | ) | | | (0.37 | ) | | | (0.87 | ) | | | 13.27 | | | | 14.44 | | | | 12,200 | | | | 2.17 | | | | 2.18 | | | | 1.65 | (d) | | | 1 | |
Year ended 12/31/18 | | | 15.52 | | | | 0.15 | | | | (2.61 | ) | | | (2.46 | ) | | | (0.16 | ) | | | (0.54 | ) | | | (0.70 | ) | | | 12.36 | | | | (15.89 | ) | | | 22,684 | | | | 2.10 | | | | 2.13 | | | | 0.98 | | | | 11 | |
| Class Y | | | | | | | | | | | | | | | | | | | | | | | | | | | | | | | | | | | | | | | | | | | | | | | | | | | | | | | | |
Year ended 12/31/22 | | | 18.33 | | | | 0.51 | (d) | | | (3.51 | ) | | | (3.00 | ) | | | (0.40 | ) | | | (1.18 | ) | | | (1.58 | ) | | | 13.75 | | | | (16.06 | ) | | | 75,529 | | | | 1.23 | | | | 1.24 | | | | 3.31 | (d) | | | 5 | |
Year ended 12/31/21 | | | 15.27 | | | | 0.26 | | | | 3.48 | | | | 3.74 | | | | (0.61 | ) | | | (0.07 | ) | | | (0.68 | ) | | | 18.33 | | | | 24.62 | | | | 132,546 | | | | 1.08 | | | | 1.08 | | | | 1.47 | | | | 10 | |
Year ended 12/31/20 | | | 14.29 | | | | 0.18 | (d) | | | 1.21 | | | | 1.39 | | | | (0.17 | ) | | | (0.24 | ) | | | (0.41 | ) | | | 15.27 | | | | 9.85 | | | | 121,746 | | | | 1.28 | | | | 1.29 | | | | 1.34 | (d) | | | 6 | |
Year ended 12/31/19 | | | 13.27 | | | | 0.38 | (d) | | | 1.68 | | | | 2.06 | | | | (0.67 | ) | | | (0.37 | ) | | | (1.04 | ) | | | 14.29 | | | | 15.56 | | | | 230,577 | | | | 1.17 | | | | 1.18 | | | | 2.65 | (d) | | | 1 | |
Year ended 12/31/18 | | | 16.64 | | | | 0.32 | | | | (2.81 | ) | | | (2.49 | ) | | | (0.34 | ) | | | (0.54 | ) | | | (0.88 | ) | | | 13.27 | | | | (15.01 | ) | | | 410,107 | | | | 1.10 | | | | 1.13 | | | | 1.98 | | | | 11 | |
| Class R6 | | | | | | | | | | | | | | | | | | | | | | | | | | | | | | | | | | | | | | | | | | | | | | | | | | | | | | | | |
Year ended 12/31/22 | | | 18.33 | | | | 0.52 | (d) | | | (3.50 | ) | | | (2.98 | ) | | | (0.42 | ) | | | (1.18 | ) | | | (1.60 | ) | | | 13.75 | | | | (15.95 | ) | | | 8,787 | | | | 1.11 | | | | 1.12 | | | | 3.43 | (d) | | | 5 | |
Year ended 12/31/21 | | | 15.28 | | | | 0.27 | | | | 3.48 | | | | 3.75 | | | | (0.63 | ) | | | (0.07 | ) | | | (0.70 | ) | | | 18.33 | | | | 24.72 | | | | 12,353 | | | | 1.00 | | | | 1.00 | | | | 1.55 | | | | 10 | |
Year ended 12/31/20 | | | 14.28 | | | | 0.19 | (d) | | | 1.22 | | | | 1.41 | | | | (0.17 | ) | | | (0.24 | ) | | | (0.41 | ) | | | 15.28 | | | | 9.99 | | | | 11,029 | | | | 1.19 | | | | 1.20 | | | | 1.43 | (d) | | | 6 | |
Year ended 12/31/19 | | | 13.27 | | | | 0.39 | (d) | | | 1.67 | | | | 2.06 | | | | (0.68 | ) | | | (0.37 | ) | | | (1.05 | ) | | | 14.28 | | | | 15.59 | | | | 14,875 | | | | 1.09 | | | | 1.10 | | | | 2.73 | (d) | | | 1 | |
Year ended 12/31/18 | | | 16.64 | | | | 0.33 | | | | (2.81 | ) | | | (2.48 | ) | | | (0.35 | ) | | | (0.54 | ) | | | (0.89 | ) | | | 13.27 | | | | (14.93 | ) | | | 18,243 | | | | 1.04 | | | | 1.07 | | | | 2.04 | | | | 11 | |
| (a) | Calculated using average shares outstanding. |
| (b) | Includes adjustments in accordance with accounting principles generally accepted in the United States of America and as such, the net asset value for financial reporting purposes and the returns based upon those net asset values may differ from the net asset value and returns for shareholder transactions. Does not include sales charges and is not annualized for periods less than one year, if applicable. |
| (c) | Portfolio turnover is calculated at the fund level and is not annualized for periods less than one year, if applicable. |
| (d) | Net investment income per share and the ratio of net investment income to average net assets include significant dividends received during the year ended December 31, 2022. Net investment income per share and the ratio of net investment income to average net assets excluding the significant dividends are $0.35 and 2.33%, $0.22 and 1.58%, $0.40 and 2.58% and $0.41 and 2.70% for Class A, Class C, Class Y and Class R6 shares, respectively. Net investment income per share and the ratio of net investment income to average net assets include significant dividends received during the year ended December 31, 2020. Net investment income per share and the ratio of net investment income to average net assets excluding the significant dividends are $0.08 and 0.62%, $(0.02) and (0.13)%, $0.12 and 0.87% and $0.13 and 0.96% for Class A, Class C, Class Y and Class R6 shares, respectively. Net investment income per share and the ratio of net investment income to average net assets include significant dividends received during the year ended December 31, 2019. Net investment income per share and the ratio of net investment income to average net assets excluding the significant dividends are $0.24 and 1.66%, $0.12 and 0.91%, $0.28 and 1.91% and $0.29 and 1.99% for Class A, Class C, Class Y and Class R6 shares, respectively. |
See accompanying Notes to Financial Statements which are an integral part of the financial statements.
| | |
| 13 | | Invesco EQV European Small Company Fund |
Notes to Financial Statements
December 31, 2022
NOTE 1–Significant Accounting Policies
Invesco EQV European Small Company Fund, formerly Invesco European Small Company Fund, (the “Fund”) is a series portfolio of AIM Funds Group (Invesco Funds Group) (the “Trust”). The Trust is a Delaware statutory trust registered under the Investment Company Act of 1940, as amended (the “1940 Act”), as an open-end series management investment company authorized to issue an unlimited number of shares of beneficial interest. Information presented in these financial statements pertains only to the Fund. Matters affecting the Fund or each class will be voted on exclusively by the shareholders of the Fund or each class.
The Fund’s investment objective is long-term growth of capital.
The Fund currently consists of four different classes of shares: Class A, Class C, Class Y and Class R6. Class Y shares are available only to certain investors. Class A shares are sold with a front-end sales charge unless certain waiver criteria are met. Under certain circumstances, load waived shares may be subject to contingent deferred sales charges (“CDSC”). Class C shares are sold with a CDSC. Class Y and Class R6 shares are sold at net asset value. Class C shares held for eight years after purchase are eligible for automatic conversion into Class A shares of the same Fund (the “Conversion Feature”). The automatic conversion pursuant to the Conversion Feature will generally occur at the end of the month following the eighth anniversary after a purchase of Class C shares.
The Fund is an investment company and accordingly follows the investment company accounting and reporting guidance in accordance with Financial Accounting Standards Board Accounting Standards Codification Topic 946, Financial Services – Investment Companies.
The following is a summary of the significant accounting policies followed by the Fund in the preparation of its financial statements.
| A. | Security Valuations - Securities, including restricted securities, are valued according to the following policy. |
A security listed or traded on an exchange is generally valued at its trade price or official closing price that day as of the close of the exchange where the security is principally traded, or lacking any trades or official closing price on a particular day, the security may be valued at the closing bid price on that day. Securities traded in the over-the-counter market are valued based on prices furnished by independent pricing services or market makers. When such securities are valued using prices provided by an independent pricing service they may be considered fair valued. Futures contracts are valued at the daily settlement price set by an exchange on which they are principally traded. U.S. exchange-traded options are valued at the mean between the last bid and asked prices from the exchange on which they are principally traded. Non-U.S. exchange-traded options are valued at the final settlement price set by the exchange on which they trade. Options not listed on an exchange and swaps generally are valued using pricing provided from independent pricing services.
Securities of investment companies that are not exchange-traded (e.g., open-end mutual funds) are valued using such company’s end-of-business-day net asset value per share.
Deposits, other obligations of U.S. and non-U.S. banks and financial institutions are valued at their daily account value.
Fixed income securities (including convertible debt securities) generally are valued on the basis of prices provided by independent pricing services. Prices provided by the pricing service may be determined without exclusive reliance on quoted prices, and may reflect appropriate factors such as institution-size trading in similar groups of securities, developments related to specific securities, dividend rate (for unlisted equities), yield (for debt obligations), quality, type of issue, coupon rate (for debt obligations), maturity (for debt obligations), individual trading characteristics and other market data. Pricing services generally value debt obligations assuming orderly transactions of institutional round lot size, but a fund may hold or transact in the same securities in smaller, odd lot sizes. Odd lots often trade at lower prices than institutional round lots, and their value may be adjusted accordingly. Debt obligations are subject to interest rate and credit risks. In addition, all debt obligations involve some risk of default with respect to interest and/or principal payments.
Foreign securities’ (including foreign exchange contracts) prices are converted into U.S. dollar amounts using the applicable exchange rates as of the close of the New York Stock Exchange (“NYSE”). If market quotations are available and reliable for foreign exchange-traded equity securities, the securities will be valued at the market quotations. Invesco Advisers, Inc. (the “Adviser” or “Invesco”) may use various pricing services to obtain market quotations as well as fair value prices. Because trading hours for certain foreign securities end before the close of the NYSE, closing market quotations may become not representative of market value in the Adviser’s judgment (“unreliable”). If, between the time trading ends on a particular security and the close of the customary trading session on the NYSE, a significant event occurs that makes the closing price of the security unreliable, the Adviser may fair value the security. If the event is likely to have affected the closing price of the security, the security will be valued at fair value in good faith in accordance with Board- approved policies and related Adviser procedures (“Valuation Procedures”). Adjustments to closing prices to reflect fair value may also be based on a screening process of an independent pricing service to indicate the degree of certainty, based on historical data, that the closing price in the principal market where a foreign security trades is not the current value as of the close of the NYSE. Foreign securities’ prices meeting the degree of certainty that the price is not reflective of current value will be priced at the indication of fair value from the independent pricing service. Multiple factors may be considered by the independent pricing service in determining adjustments to reflect fair value and may include information relating to sector indices, American Depositary Receipts and domestic and foreign index futures. Foreign securities may have additional risks including exchange rate changes, potential for sharply devalued currencies and high inflation, political and economic upheaval, the relative lack of issuer information, relatively low market liquidity and the potential lack of strict financial and accounting controls and standards.
Unlisted securities will be valued using prices provided by independent pricing services or by another method that the Adviser, in its judgment, believes better reflects the security’s fair value in accordance with the Valuation Procedures.
Securities for which market prices are not provided by any of the above methods may be valued based upon quotes furnished by independent sources. The last bid price may be used to value equity securities. The mean between the last bid and asked prices may be used to value debt obligations, including corporate loans.
Securities for which market quotations are not readily available are fair valued by the Adviser in accordance with the Valuation Procedures. If a fair value price provided by a pricing service is unreliable, the Adviser will fair value the security using the Valuation Procedures. Issuer specific events, market trends, bid/asked quotes of brokers and information providers and other market data may be reviewed in the course of making a good faith determination of a security’s fair value.
The Fund may invest in securities that are subject to interest rate risk, meaning the risk that the prices will generally fall as interest rates rise and, conversely, the prices will generally rise as interest rates fall. Specific securities differ in their sensitivity to changes in interest rates depending on their individual characteristics. Changes in interest rates may result in increased market volatility, which may affect the value and/or liquidity of certain Fund investments.
Valuations change in response to many factors including the historical and prospective earnings of the issuer, the value of the issuer’s assets, general market conditions which are not specifically related to the particular issuer, such as real or perceived adverse economic conditions, changes in the general outlook for revenues or corporate earnings, changes in interest or currency rates, regional or global instability, natural or environmental disasters, widespread disease or other public health issues, war, acts of terrorism, significant governmental actions or adverse investor sentiment generally and market liquidity. Because of the inherent uncertainties of valuation, the values reflected in the financial statements may materially differ from the value received upon actual sale of those investments.
The price the Fund could receive upon the sale of any investment may differ from the Adviser’s valuation of the investment, particularly for securities that are valued using a fair valuation technique. When fair valuation techniques are applied, the Adviser uses available information, including both observable and unobservable inputs and assumptions, to determine a methodology that will result in a valuation that the Adviser believes approximates market value. Fund securities that are fair valued may be subject to greater fluctuation in their value from one day to the next than would be the case if market quotations were used. Because of the inherent uncertainties of valuation, and the degree of subjectivity in such decisions, the Fund could realize a greater or lesser than expected gain or loss upon the sale of the investment.
| | |
| 14 | | Invesco EQV European Small Company Fund |
| B. | Securities Transactions and Investment Income - Securities transactions are accounted for on a trade date basis. Realized gains or losses on sales are computed on the basis of specific identification of the securities sold. Interest income (net of withholding tax, if any) is recorded on an accrual basis from settlement date and includes coupon interest and amortization of premium and accretion of discount on debt securities as applicable. Dividend income (net of withholding tax, if any) is recorded on the ex-dividend date. |
The Fund may periodically participate in litigation related to Fund investments. As such, the Fund may receive proceeds from litigation settlements. Any proceeds received are included in the Statement of Operations as realized gain (loss) for investments no longer held and as unrealized gain (loss) for investments still held.
Brokerage commissions and mark ups are considered transaction costs and are recorded as an increase to the cost basis of securities purchased and/or a reduction of proceeds on a sale of securities. Such transaction costs are included in the determination of net realized and unrealized gain (loss) from investment securities reported in the Statement of Operations and the Statement of Changes in Net Assets and the net realized and unrealized gains (losses) on securities per share in the Financial Highlights. Transaction costs are included in the calculation of the Fund’s net asset value and, accordingly, they reduce the Fund’s total returns. These transaction costs are not considered operating expenses and are not reflected in net investment income reported in the Statement of Operations and the Statement of Changes in Net Assets, or the net investment income per share and the ratios of expenses and net investment income reported in the Financial Highlights, nor are they limited by any expense limitation arrangements between the Fund and the investment adviser.
The Fund allocates income and realized and unrealized capital gains and losses to a class based on the relative net assets of each class.
| C. | Country Determination - For the purposes of making investment selection decisions and presentation in the Schedule of Investments, the investment adviser may determine the country in which an issuer is located and/or credit risk exposure based on various factors. These factors include the laws of the country under which the issuer is organized, where the issuer maintains a principal office, the country in which the issuer derives 50% or more of its total revenues, the country that has the primary market for the issuer’s securities and its “country of risk” as determined by a third party service provider, as well as other criteria. Among the other criteria that may be evaluated for making this determination are the country in which the issuer maintains 50% or more of its assets, the type of security, financial guarantees and enhancements, the nature of the collateral and the sponsor organization. Country of issuer and/or credit risk exposure has been determined to be the United States of America, unless otherwise noted. |
| D. | Distributions - Distributions from net investment income and net realized capital gain, if any, are generally declared and paid annually and recorded on the ex-dividend date. The Fund may elect to treat a portion of the proceeds from redemptions as distributions for federal income tax purposes. |
| E. | Federal Income Taxes - The Fund intends to comply with the requirements of Subchapter M of the Internal Revenue Code of 1986, as amended (the “Internal Revenue Code”), necessary to qualify as a regulated investment company and to distribute substantially all of the Fund’s taxable earnings to shareholders. As such, the Fund will not be subject to federal income taxes on otherwise taxable income (including net realized capital gain) that is distributed to shareholders. Therefore, no provision for federal income taxes is recorded in the financial statements. |
The Fund recognizes the tax benefits of uncertain tax positions only when the position is more likely than not to be sustained. Management has analyzed the Fund’s uncertain tax positions and concluded that no liability for unrecognized tax benefits should be recorded related to uncertain tax positions. Management is not aware of any tax positions for which it is reasonably possible that the total amounts of unrecognized tax benefits will change materially in the next 12 months.
The Fund files tax returns in the U.S. Federal jurisdiction and certain other jurisdictions. Generally, the Fund is subject to examinations by such taxing authorities for up to three years after the filing of the return for the tax period.
| F. | Expenses - Fees provided for under the Rule 12b-1 plan of a particular class of the Fund are charged to the operations of such class. Transfer agency fees and expenses and other shareholder recordkeeping fees and expenses attributable to Class R6 are charged to such class. Transfer agency fees and expenses and other shareholder recordkeeping fees and expenses relating to all other classes are allocated among those classes based on relative net assets. All other expenses are allocated among the classes based on relative net assets. |
| G. | Accounting Estimates - The preparation of financial statements in conformity with accounting principles generally accepted in the United States of America (“GAAP”) requires management to make estimates and assumptions that affect the reported amounts of assets and liabilities at the date of the financial statements and the reported amounts of revenues and expenses during the reporting period including estimates and assumptions related to taxation. Actual results could differ from those estimates by a significant amount. In addition, the Fund monitors for material events or transactions that may occur or become known after the period-end date and before the date the financial statements are released to print. |
| H. | Indemnifications - Under the Trust’s organizational documents, each Trustee, officer, employee or other agent of the Trust is indemnified against certain liabilities that may arise out of the performance of their duties to the Fund. Additionally, in the normal course of business, the Fund enters into contracts, including the Fund’s servicing agreements, that contain a variety of indemnification clauses. The Fund’s maximum exposure under these arrangements is unknown as this would involve future claims that may be made against the Fund that have not yet occurred. The risk of material loss as a result of such indemnification claims is considered remote. |
| I. | Securities Lending - The Fund may lend portfolio securities having a market value up to one-third of the Fund’s total assets. Such loans are secured by collateral equal to no less than the market value of the loaned securities determined daily by the securities lending provider. Such collateral will be cash or debt securities issued or guaranteed by the U.S. Government or any of its sponsored agencies. Cash collateral received in connection with these loans is invested in short-term money market instruments or affiliated, unregistered investment companies that comply with Rule 2a-7 under the 1940 Act and money market funds (collectively, “affiliated money market funds”) and is shown as such on the Schedule of Investments. The Fund bears the risk of loss with respect to the investment of collateral. It is the Fund’s policy to obtain additional collateral from or return excess collateral to the borrower by the end of the next business day, following the valuation date of the securities loaned. Therefore, the value of the collateral held may be temporarily less than the value of the securities on loan. When loaning securities, the Fund retains certain benefits of owning the securities, including the economic equivalent of dividends or interest generated by the security. Lending securities entails a risk of loss to the Fund if, and to the extent that, the market value of the securities loaned were to increase and the borrower did not increase the collateral accordingly, and the borrower failed to return the securities. The securities loaned are subject to termination at the option of the borrower or the Fund. Upon termination, the borrower will return to the Fund the securities loaned and the Fund will return the collateral. Upon the failure of the borrower to return the securities, collateral may be liquidated and the securities may be purchased on the open market to replace the loaned securities. The Fund could experience delays and costs in gaining access to the collateral and the securities may lose value during the delay which could result in potential losses to the Fund. Some of these losses may be indemnified by the lending agent. The Fund bears the risk of any deficiency in the amount of the collateral available for return to the borrower due to any loss on the collateral invested. Dividends received on cash collateral investments for securities lending transactions, which are net of compensation to counterparties, are included in Dividends from affiliates on the Statement of Operations. The aggregate value of securities out on loan, if any, is shown as a footnote on the Statement of Assets and Liabilities. |
The Adviser serves as an affiliated securities lending agent for the Fund. The Bank of New York Mellon also serves as a lending agent. To the extent the Fund utilizes the Adviser as an affiliated securities lending agent, the Fund conducts its securities lending in accordance with, and in reliance upon, no-action letters issued by the SEC staff that provide guidance on how an affiliate may act as a direct agent lender and receive compensation for those services in a manner consistent with the federal securities laws. For the year ended December 31, 2022, there were no securities lending transactions with the Adviser. Fees paid to the Adviser for securities lending agent services, if any, are included in Dividends from affiliates on the Statement of Operations.
| J. | Foreign Currency Translations - Foreign currency is valued at the close of the NYSE based on quotations posted by banks and major currency dealers. Portfolio securities and other assets and liabilities denominated in foreign currencies are translated into U.S. dollar amounts at the date of valuation. Purchases and sales of portfolio securities (net of foreign taxes withheld on disposition) and income items denominated in foreign currencies are translated into U.S. dollar |
| | |
| 15 | | Invesco EQV European Small Company Fund |
| | amounts on the respective dates of such transactions. The Fund does not separately account for the portion of the results of operations resulting from changes in foreign exchange rates on investments and the fluctuations arising from changes in market prices of securities held. The combined results of changes in foreign exchange rates and the fluctuation of market prices on investments (net of estimated foreign tax withholding) are included with the net realized and unrealized gain or loss from investments in the Statement of Operations. Reported net realized foreign currency gains or losses arise from (1) sales of foreign currencies, (2) currency gains or losses realized between the trade and settlement dates on securities transactions, and (3) the difference between the amounts of dividends, interest, and foreign withholding taxes recorded on the Fund’s books and the U.S. dollar equivalent of the amounts actually received or paid. Net unrealized foreign currency gains and losses arise from changes in the fair values of assets and liabilities, other than investments in securities at fiscal period end, resulting from changes in exchange rates. |
The Fund may invest in foreign securities, which may be subject to foreign taxes on income, gains on investments or currency repatriation, a portion of which may be recoverable. Foreign taxes, if any, are recorded based on the tax regulations and rates that exist in the foreign markets in which the Fund invests and are shown in the Statement of Operations.
| K. | Forward Foreign Currency Contracts – The Fund may engage in foreign currency transactions either on a spot (i.e. for prompt delivery and settlement) basis, or through forward foreign currency contracts, to manage or minimize currency or exchange rate risk. |
The Fund may also enter into forward foreign currency contracts for the purchase or sale of a security denominated in a foreign currency in order to “lock in” the U.S. dollar price of that security, or the Fund may also enter into forward foreign currency contracts that do not provide for physical exchange of the two currencies on the settlement date, but instead are settled by a single cash payment calculated as the difference between the agreed upon exchange rate and the spot rate at settlement based upon an agreed upon notional amount (non-deliverable forwards).
A forward foreign currency contract is an obligation between two parties (“Counterparties”) to purchase or sell a specific currency for an agreed-upon price at a future date. The use of forward foreign currency contracts for hedging does not eliminate fluctuations in the price of the underlying securities the Fund owns or intends to acquire but establishes a rate of exchange in advance. Fluctuations in the value of these contracts are measured by the difference in the contract date and reporting date exchange rates and are recorded as unrealized appreciation (depreciation) until the contracts are closed. When the contracts are closed, realized gains (losses) are recorded. Realized and unrealized gains (losses) on the contracts are included in the Statement of Operations. The primary risks associated with forward foreign currency contracts include failure of the Counterparty to meet the terms of the contract and the value of the foreign currency changing unfavorably. These risks may be in excess of the amounts reflected in the Statement of Assets and Liabilities.
| L. | Other Risks - Emerging markets (also referred to as developing markets) are generally subject to greater market volatility, political, social and economic instability, uncertainty regarding the existence of trading markets and more governmental limitations on foreign investment than more developed markets. In addition, companies operating in emerging markets may be subject to lower trading volume and greater price fluctuations than companies in more developed markets. Securities law in many emerging market countries is relatively new and unsettled. Therefore, laws regarding foreign investment in emerging market securities, securities regulation, title to securities, and shareholder rights may change quickly and unpredictably. In addition, the enforcement of systems of taxation at federal, regional and local levels in emerging market countries may be inconsistent, and subject to sudden change. Other risks of investing in emerging markets securities may include additional transaction costs, delays in settlement procedures, and lack of timely information. |
| M. | COVID-19 Risk - The COVID-19 strain of coronavirus has resulted in instances of market closures and dislocations, extreme volatility, liquidity constraints and increased trading costs. Efforts to contain its spread have resulted in travel restrictions, disruptions of healthcare systems, business operations (including business closures) and supply chains, layoffs, lower consumer demand and employee availability, and defaults and credit downgrades, among other significant economic impacts that have disrupted global economic activity across many industries. Such economic impacts may exacerbate other pre-existing political, social and economic risks locally or globally and cause general concern and uncertainty. The full economic impact and ongoing effects of COVID-19 (or other future epidemics or pandemics) at the macro-level and on individual businesses are unpredictable and may result in significant and prolonged effects on the Fund’s performance. |
NOTE 2–Advisory Fees and Other Fees Paid to Affiliates
The Trust has entered into a master investment advisory agreement with the Adviser. Under the terms of the investment advisory agreement, the Fund accrues daily and pays monthly an advisory fee to the Adviser based on the annual rate of the Fund’s average daily net assets as follows:
| | | | | | |
| Average Daily Net Assets | | Rate | |
|
| |
First $ 250 million | | | 0.935% | |
|
| |
Next $250 million | | | 0.910% | |
|
| |
Next $500 million | | | 0.885% | |
|
| |
Next $1.5 billion | | | 0.860% | |
|
| |
Next $2.5 billion | | | 0.835% | |
|
| |
Next $2.5 billion | | | 0.810% | |
|
| |
Next $2.5 billion | | | 0.785% | |
|
| |
Over $10 billion | | | 0.760% | |
|
| |
For the year ended December 31, 2022, the effective advisory fee rate incurred by the Fund was 0.93%.
Under the terms of a master sub-advisory agreement between the Adviser and each of Invesco Asset Management Deutschland GmbH, Invesco Asset Management Limited, Invesco Asset Management (Japan) Limited, Invesco Hong Kong Limited, Invesco Senior Secured Management, Inc. and Invesco Canada Ltd. and separate sub-advisory agreements with Invesco Capital Management LLC and Invesco Asset Management (India) Private Limited (collectively, the “Affiliated Sub-Advisers”) the Adviser, not the Fund, will pay 40% of the fees paid to the Adviser to any such Affiliated Sub-Adviser(s) that provide(s) discretionary investment management services to the Fund based on the percentage of assets allocated to such Affiliated Sub-Adviser(s).
The Adviser has contractually agreed, through at least June 30, 2023, to waive advisory fees and/or reimburse expenses of all shares to the extent necessary to limit total annual fund operating expenses after fee waiver and/or expense reimbursement (excluding certain items discussed below) of Class A, Class C, Class Y and Class R6 shares to 2.25%, 3.00%, 2.00% and 2.00%, respectively, of the Fund’s average daily net assets (the “expense limits”). In determining the Adviser’s obligation to waive advisory fees and/or reimburse expenses, the following expenses are not taken into account, and could cause the total annual fund operating expenses after fee waiver and/or expense reimbursement to exceed the numbers reflected above: (1) interest; (2) taxes; (3) dividend expense on short sales; (4) extraordinary or non-routine items, including litigation expenses; and (5) expenses that the Fund has incurred but did not actually pay because of an expense offset arrangement. Unless Invesco continues the fee waiver agreement, it will terminate on June 30, 2023. During its term, the fee waiver agreement cannot be terminated or amended to increase the expense limits or reduce the advisory fee waiver without approval of the Board of Trustees. The Adviser did not waive fees and/or reimburse expenses during the period under these expense limits.
Further, the Adviser has contractually agreed, through at least June 30, 2024, to waive the advisory fee payable by the Fund in an amount equal to 100% of the net advisory fees the Adviser receives from the affiliated money market funds on investments by the Fund of uninvested cash (excluding investments of cash collateral from securities lending) in such affiliated money market funds.
| | |
| 16 | | Invesco EQV European Small Company Fund |
For the year ended December 31, 2022, the Adviser waived advisory fees of $12,726.
The Trust has entered into a master administrative services agreement with Invesco pursuant to which the Fund has agreed to pay Invesco for certain administrative costs incurred in providing accounting services to the Fund. For the year ended December 31, 2022, expenses incurred under the agreement are shown in the Statement of Operations as Administrative services fees. Invesco has entered into a sub-administration agreement whereby State Street Bank and Trust Company (“SSB”) serves as fund accountant and provides certain administrative services to the Fund. Pursuant to a custody agreement with the Trust on behalf of the Fund, SSB also serves as the Fund’s custodian.
The Trust has entered into a transfer agency and service agreement with Invesco Investment Services, Inc. (“IIS”) pursuant to which the Fund has agreed to pay IIS a fee for providing transfer agency and shareholder services to the Fund and reimburse IIS for certain expenses incurred by IIS in the course of providing such services. IIS may make payments to intermediaries that provide omnibus account services, sub-accounting services and/or networking services. All fees payable by IIS to intermediaries that provide omnibus account services or sub-accounting services are charged back to the Fund, subject to certain limitations approved by the Trust’s Board of Trustees. For the year ended December 31, 2022, expenses incurred under the agreement are shown in the Statement of Operations as Transfer agent fees.
The Trust has entered into master distribution agreements with Invesco Distributors, Inc. (“IDI”) to serve as the distributor for the Class A, Class C, Class Y and Class R6 shares of the Fund. The Trust has adopted plans pursuant to Rule 12b-1 under the 1940 Act with respect to the Fund’s Class A and Class C shares (collectively, the “Plans”). The Fund, pursuant to the Plans, pays IDI compensation at the annual rate of 0.25% of the Fund’s average daily net assets of Class A shares and 1.00% of the average daily net assets of Class C shares. The fees are accrued daily and paid monthly. Of the Plan payments, up to 0.25% of the average daily net assets of each class of shares may be paid to furnish continuing personal shareholder services to customers who purchase and own shares of such classes. Any amounts not paid as a service fee under the Plans would constitute an asset-based sales charge. Rules of the Financial Industry Regulatory Authority (“FINRA”) impose a cap on the total sales charges, including asset-based sales charges, that may be paid by any class of shares of the Fund. For the year ended December 31, 2022, expenses incurred under the Plans are shown in the Statement of Operations as Distribution fees.
Front-end sales commissions and CDSC (collectively, the “sales charges”) are not recorded as expenses of the Fund. Front-end sales commissions are deducted from proceeds from the sales of Fund shares prior to investment in Class A shares of the Fund. CDSC are deducted from redemption proceeds prior to remittance to the shareholder. During the year ended December 31, 2022, IDI advised the Fund that IDI retained $6,711 in front-end sales commissions from the sale of Class A shares and $1,109 and $1,020 from Class A and Class C shares, respectively, for CDSC imposed upon redemptions by shareholders.
For the year ended December 31, 2022, the Fund incurred $646 in brokerage commissions with Invesco Capital Markets, Inc., an affiliate of the Adviser and IDI, for portfolio transactions executed on behalf of the Fund.
Certain officers and trustees of the Trust are officers and directors of the Adviser, IIS and/or IDI.
NOTE 3–Additional Valuation Information
GAAP defines fair value as the price that would be received to sell an asset or paid to transfer a liability in an orderly transaction between market participants at the measurement date, under current market conditions. GAAP establishes a hierarchy that prioritizes the inputs to valuation methods, giving the highest priority to readily available unadjusted quoted prices in an active market for identical assets (Level 1) and the lowest priority to significant unobservable inputs (Level 3), generally when market prices are not readily available. Based on the valuation inputs, the securities or other investments are tiered into one of three levels. Changes in valuation methods may result in transfers in or out of an investment’s assigned level:
| | |
| Level 1 - | | Prices are determined using quoted prices in an active market for identical assets. |
| Level 2 - | | Prices are determined using other significant observable inputs. Observable inputs are inputs that other market participants may use in pricing a security. These may include quoted prices for similar securities, interest rates, prepayment speeds, credit risk, yield curves, loss severities, default rates, discount rates, volatilities and others. |
| Level 3 - | | Prices are determined using significant unobservable inputs. In situations where quoted prices or observable inputs are unavailable (for example, when there is little or no market activity for an investment at the end of the period), unobservable inputs may be used. Unobservable inputs reflect the Adviser’s assumptions about the factors market participants would use in determining fair value of the securities or instruments and would be based on the best available information. |
The following is a summary of the tiered valuation input levels, as of December 31, 2022. The level assigned to the securities valuations may not be an indication of the risk or liquidity associated with investing in those securities. Because of the inherent uncertainties of valuation, the values reflected in the financial statements may materially differ from the value received upon actual sale of those investments.
| | | | | | | | | | | | | | |
| | | Level 1 | | | Level 2 | | | Level 3 | | Total | |
|
| |
Investments in Securities | | | | | | | | | | | | | | |
|
| |
Denmark | | $ | – | | | $ | 1,588,307 | | | $– | | $ | 1,588,307 | |
|
| |
France | | | – | | | | 52,212,803 | | | – | | | 52,212,803 | |
|
| |
Georgia | | | – | | | | 6,294,247 | | | – | | | 6,294,247 | |
|
| |
Germany | | | – | | | | 444,119 | | | – | | | 444,119 | |
|
| |
Greece | | | – | | | | 3,187,278 | | | – | | | 3,187,278 | |
|
| |
Ireland | | | – | | | | 5,589,558 | | | – | | | 5,589,558 | |
|
| |
Israel | | | 1,279,845 | | | | 7,092,776 | | | – | | | 8,372,621 | |
|
| |
Italy | | | – | | | | 5,176,458 | | | – | | | 5,176,458 | |
|
| |
Netherlands | | | – | | | | 2,911,612 | | | – | | | 2,911,612 | |
|
| |
Norway | | | – | | | | 1,728,513 | | | – | | | 1,728,513 | |
|
| |
Poland | | | – | | | | 8,848,577 | | | – | | | 8,848,577 | |
|
| |
Portugal | | | 1,189,689 | | | | – | | | – | | | 1,189,689 | |
|
| |
Romania | | | – | | | | 8,323,305 | | | – | | | 8,323,305 | |
|
| |
Singapore | | | – | | | | 1,778,524 | | | – | | | 1,778,524 | |
|
| |
Sweden | | | – | | | | 2,281,059 | | | – | | | 2,281,059 | |
|
| |
Switzerland | | | – | | | | 6,236,809 | | | – | | | 6,236,809 | |
|
| |
United Kingdom | | | – | | | | 46,534,608 | | | – | | | 46,534,608 | |
|
| |
United States | | | – | | | | 2,476,395 | | | – | | | 2,476,395 | |
|
| |
Money Market Funds | | | 8,185,797 | | | | – | | | – | | | 8,185,797 | |
|
| |
Total Investments | | $ | 10,655,331 | | | $ | 162,704,948 | | | $– | | $ | 173,360,279 | |
|
| |
| | |
| 17 | | Invesco EQV European Small Company Fund |
NOTE 4–Expense Offset Arrangement(s)
The expense offset arrangement is comprised of transfer agency credits which result from balances in demand deposit accounts used by the transfer agent for clearing shareholder transactions. For the year ended December 31, 2022, the Fund received credits from this arrangement, which resulted in the reduction of the Fund’s total expenses of $1,180.
NOTE 5–Trustees’ and Officers’ Fees and Benefits
Trustees’ and Officers’ Fees and Benefits include amounts accrued by the Fund to pay remuneration to certain Trustees and Officers of the Fund. Trustees have the option to defer compensation payable by the Fund, and Trustees’ and Officers’ Fees and Benefits also include amounts accrued by the Fund to fund such deferred compensation amounts. Those Trustees who defer compensation have the option to select various Invesco Funds in which their deferral accounts shall be deemed to be invested. Finally, certain current Trustees were eligible to participate in a retirement plan that provided for benefits to be paid upon retirement to Trustees over a period of time based on the number of years of service. The Fund may have certain former Trustees who also participate in a retirement plan and receive benefits under such plan. Trustees’ and Officers’ Fees and Benefits include amounts accrued by the Fund to fund such retirement benefits. Obligations under the deferred compensation and retirement plans represent unsecured claims against the general assets of the Fund.
NOTE 6–Cash Balances
The Fund is permitted to temporarily carry a negative or overdrawn balance in its account with SSB, the custodian bank. Such balances, if any at period-end, are shown in the Statement of Assets and Liabilities under the payable caption Amount due custodian. To compensate the custodian bank for such overdrafts, the overdrawn Fund may either (1) leave funds as a compensating balance in the account so the custodian bank can be compensated by earning the additional interest; or (2) compensate by paying the custodian bank at a rate agreed upon by the custodian bank and Invesco, not to exceed the contractually agreed upon rate. The Fund may not purchase additional securities when any borrowings from banks or broker-dealers exceed 5% of the Fund’s total assets, or when any borrowings from an Invesco Fund are outstanding.
NOTE 7–Distributions to Shareholders and Tax Components of Net Assets
Tax Character of Distributions to Shareholders Paid During the Fiscal Years Ended December 31, 2022 and 2021:
| | | | | | | | | | | | |
| | | 2022 | | | | | | 2021 | |
|
| |
Ordinary income* | | $ | 4,710,246 | | | | | | | $ | 8,341,811 | |
|
| |
Long-term capital gain | | | 14,296,823 | | | | | | | | 869,788 | |
|
| |
Total distributions | | $ | 19,007,069 | | | | | | | $ | 9,211,599 | |
|
| |
| * | Includes short-term capital gain distributions, if any. |
Tax Components of Net Assets at Period-End:
| | | | |
| | | 2022 | |
|
| |
Undistributed ordinary income | | $ | 3,869,757 | |
|
| |
Undistributed long-term capital gain | | | 1,035,809 | |
|
| |
Net unrealized appreciation – investments | | | 20,037,099 | |
|
| |
Net unrealized appreciation – foreign currencies | | | 35,834 | |
|
| |
Temporary book/tax differences | | | (45,538 | ) |
|
| |
Shares of beneficial interest | | | 156,926,029 | |
|
| |
Total net assets | | $ | 181,858,990 | |
|
| |
The difference between book-basis and tax-basis unrealized appreciation (depreciation) is due to differences in the timing of recognition of gains and losses on investments for tax and book purposes. The Fund’s net unrealized appreciation (depreciation) difference is attributable primarily to passive foreign investment companies.
The temporary book/tax differences are a result of timing differences between book and tax recognition of income and/or expenses. The Fund’s temporary book/tax differences are the result of the trustee deferral of compensation and retirement plan benefits.
Capital loss carryforward is calculated and reported as of a specific date. Results of transactions and other activity after that date may affect the amount of capital loss carryforward actually available for the Fund to utilize. The ability to utilize capital loss carryforward in the future may be limited under the Internal Revenue Code and related regulations based on the results of future transactions.
The Fund does not have a capital loss carryforward as of December 31, 2022.
NOTE 8–Investment Transactions
The aggregate amount of investment securities (other than short-term securities, U.S. Government obligations and money market funds, if any) purchased and sold by the Fund during the year ended December 31, 2022 was $10,437,981 and $42,652,483, respectively. Cost of investments, including any derivatives, on a tax basis includes the adjustments for financial reporting purposes as of the most recently completed federal income tax reporting period-end.
| | | | |
| Unrealized Appreciation (Depreciation) of Investments on a Tax Basis | |
|
| |
Aggregate unrealized appreciation of investments | | $ | 50,898,926 | |
|
| |
Aggregate unrealized (depreciation) of investments | | | (30,861,827 | ) |
|
| |
Net unrealized appreciation of investments | | $ | 20,037,099 | |
|
| |
Cost of investments for tax purposes is $153,323,180.
| | |
| 18 | | Invesco EQV European Small Company Fund |
NOTE 9–Reclassification of Permanent Differences
Primarily as a result of differing book/tax treatment of passive foreign investment companies, foreign currency transactions and equalization, on December 31, 2022, undistributed net investment income was increased by $301,644, undistributed net realized gain was decreased by $2,145,642 and shares of beneficial interest was increased by $1,843,998. This reclassification had no effect on the net assets of the Fund.
NOTE 10–Share Information
| | | | | | | | | | | | | | | | |
| | | Summary of Share Activity | |
|
| |
| | | Year ended | | | Year ended | |
| | | December 31, 2022(a) | | | December 31, 2021 | |
| | | Shares | | | Amount | | | Shares | | | Amount | |
|
| |
Sold: | | | | | | | | | | | | | | | | |
Class A | | | 1,022,926 | | | $ | 15,388,545 | | | | 721,657 | | | $ | 12,789,363 | |
|
| |
Class C | | | 24,297 | | | | 377,876 | | | | 62,423 | | | | 1,012,232 | |
|
| |
Class Y | | | 677,184 | | | | 10,266,872 | | | | 1,839,539 | | | | 32,978,261 | |
|
| |
Class R6 | | | 85,412 | | | | 1,307,791 | | | | 157,301 | | | | 2,848,615 | |
|
| |
| | | | |
Issued as reinvestment of dividends: | | | | | | | | | | | | | | | | |
Class A | | | 651,241 | | | | 8,628,939 | | | | 204,585 | | | | 3,590,468 | |
|
| |
Class C | | | 20,805 | | | | 255,064 | | | | 3,313 | | | | 54,302 | |
|
| |
Class Y | | | 495,044 | | | | 6,584,080 | | | | 216,421 | | | | 3,813,343 | |
|
| |
Class R6 | | | 59,397 | | | | 789,986 | | | | 21,153 | | | | 372,705 | |
|
| |
| | | | |
Automatic conversion of Class C shares to Class A shares: | | | | | | | | | | | | | | | | |
Class A | | | 25,520 | | | | 372,699 | | | | 181,220 | | | | 3,198,060 | |
|
| |
Class C | | | (27,475 | ) | | | (372,699 | ) | | | (197,190 | ) | | | (3,198,060 | ) |
|
| |
| | | | |
Reacquired: | | | | | | | | | | | | | | | | |
Class A | | | (1,506,103 | ) | | | (22,394,891 | ) | | | (894,236 | ) | | | (15,496,974 | ) |
|
| |
Class C | | | (62,239 | ) | | | (880,015 | ) | | | (75,954 | ) | | | (1,194,035 | ) |
|
| |
Class Y | | | (2,910,203 | ) | | | (44,075,542 | ) | | | (2,795,752 | ) | | | (48,353,184 | ) |
|
| |
Class R6 | | | (179,628 | ) | | | (2,720,197 | ) | | | (226,085 | ) | | | (3,935,414 | ) |
|
| |
Net increase (decrease) in share activity | | | (1,623,822 | ) | | $ | (26,471,492 | ) | | | (781,605 | ) | | $ | (11,520,318 | ) |
|
| |
| (a) | There are entities that are record owners of more than 5% of the outstanding shares of the Fund and in the aggregate own 51% of the outstanding shares of the Fund. IDI has an agreement with these entities to sell Fund shares. The Fund, Invesco and/or Invesco affiliates may make payments to these entities, which are considered to be related to the Fund, for providing services to the Fund, Invesco and/or Invesco affiliates including but not limited to services such as securities brokerage, distribution, third party record keeping and account servicing. The Fund has no knowledge as to whether all or any portion of the shares owned of record by these entities are also owned beneficially. |
| | |
| 19 | | Invesco EQV European Small Company Fund |
Report of Independent Registered Public Accounting Firm
To the Board of Trustees of AIM Funds Group (Invesco Funds Group) and Shareholders of Invesco EQV European Small Company Fund
Opinion on the Financial Statements
We have audited the accompanying statement of assets and liabilities, including the schedule of investments, of Invesco EQV European Small Company Fund (one of the funds constituting AIM Funds Group (Invesco Funds Group), referred to hereafter as the “Fund”) as of December 31, 2022, the related statement of operations for the year ended December 31, 2022, the statement of changes in net assets for each of the two years in the period ended December 31, 2022, including the related notes, and the financial highlights for each of the five years in the period ended December 31, 2022 (collectively referred to as the “financial statements”). In our opinion, the financial statements present fairly, in all material respects, the financial position of the Fund as of December 31, 2022, the results of its operations for the year then ended, the changes in its net assets for each of the two years in the period ended December 31, 2022 and the financial highlights for each of the five years in the period ended December 31, 2022 in conformity with accounting principles generally accepted in the United States of America.
Basis for Opinion
These financial statements are the responsibility of the Fund’s management. Our responsibility is to express an opinion on the Fund’s financial statements based on our audits. We are a public accounting firm registered with the Public Company Accounting Oversight Board (United States) (PCAOB) and are required to be independent with respect to the Fund in accordance with the U.S. federal securities laws and the applicable rules and regulations of the Securities and Exchange Commission and the PCAOB.
We conducted our audits of these financial statements in accordance with the standards of the PCAOB. Those standards require that we plan and perform the audit to obtain reasonable assurance about whether the financial statements are free of material misstatement, whether due to error or fraud.
Our audits included performing procedures to assess the risks of material misstatement of the financial statements, whether due to error or fraud, and performing procedures that respond to those risks. Such procedures included examining, on a test basis, evidence regarding the amounts and disclosures in the financial statements. Our audits also included evaluating the accounting principles used and significant estimates made by management, as well as evaluating the overall presentation of the financial statements. Our procedures included confirmation of securities owned as of December 31, 2022 by correspondence with the custodian and transfer agent. We believe that our audits provide a reasonable basis for our opinion.
/s/PricewaterhouseCoopers LLP
Houston, Texas
February 22, 2023
We have served as the auditor of one or more of the investment companies in the Invesco group of investment companies since at least 1995. We have not been able to determine the specific year we began serving as auditor.
| | |
| 20 | | Invesco EQV European Small Company Fund |
Calculating your ongoing Fund expenses
Example
As a shareholder of the Fund, you incur two types of costs: (1) transaction costs, which may include sales charges (loads) on purchase payments or contingent deferred sales charges on redemptions, if any; and (2) ongoing costs, including management fees, distribution and/or service (12b-1) fees, and other Fund expenses. This example is intended to help you understand your ongoing costs (in dollars) of investing in the Fund and to compare these costs with ongoing costs of investing in other mutual funds. The example is based on an investment of $1,000 invested at the beginning of the period and held for the entire period July 1, 2022 through December 31, 2022.
Actual expenses
The table below provides information about actual account values and actual expenses. You may use the information in this table, together with the amount you invested, to estimate the expenses that you paid over the period. Simply divide your account value by $1,000 (for example, an $8,600 account value divided by $1,000 = 8.6), then multiply the result by the number in the table under the heading entitled “Actual Expenses Paid During Period” to estimate the expenses you paid on your account during this period.
Hypothetical example for comparison purposes
The table below also provides information about hypothetical account values and hypothetical expenses based on the Fund’s actual expense ratio and an assumed rate of return of 5% per year before expenses, which is not the Fund’s actual return.
The hypothetical account values and expenses may not be used to estimate the actual ending account balance or expenses you paid for the period. You may use this information to compare the ongoing costs of investing in the Fund and other funds. To do so, compare this 5% hypothetical example with the 5% hypothetical examples that appear in the shareholder reports of the other funds.
Please note that the expenses shown in the table are meant to highlight your ongoing costs only and do not reflect any transaction costs, such as sales charges (loads) on purchase payments or contingent deferred sales charges on redemptions, if any. Therefore, the hypothetical information is useful in comparing ongoing costs only, and will not help you determine the relative total costs of owning different funds. In addition, if these transaction costs were included, your costs would have been higher.
| | | | | | | | | | | | |
| | | | | ACTUAL | | HYPOTHETICAL
(5% annual return before expenses) | | |
| | | Beginning
Account Value
(07/01/22) | | Ending
Account Value
(12/31/22)1 | | Expenses
Paid During
Period2 | | Ending
Account Value
(12/31/22) | | Expenses
Paid During
Period2 | | Annualized
Expense Ratio |
Class A | | $1,000.00 | | $1,076.40 | | $7.85 | | $1,017.64 | | $7.63 | | 1.50% |
Class C | | 1,000.00 | | 1,071.40 | | 11.75 | | 1,013.86 | | 11.42 | | 2.25 |
Class Y | | 1,000.00 | | 1,077.50 | | 6.55 | | 1,018.90 | | 6.36 | | 1.25 |
Class R6 | | 1,000.00 | | 1,078.20 | | 5.87 | | 1,019.56 | | 5.70 | | 1.12 |
| 1 | The actual ending account value is based on the actual total return of the Fund for the period July 1, 2022 through December 31, 2022, after actual expenses and will differ from the hypothetical ending account value which is based on the Fund’s expense ratio and a hypothetical annual return of 5% before expenses. |
| 2 | Expenses are equal to the Fund’s annualized expense ratio as indicated above multiplied by the average account value over the period, multiplied by 184/365 to reflect the most recent fiscal half year. |
| | |
| 21 | | Invesco EQV European Small Company Fund |
Tax Information
Form 1099-DIV, Form 1042-S and other year–end tax information provide shareholders with actual calendar year amounts that should be included in their tax returns. Shareholders should consult their tax advisers.
The following distribution information is being provided as required by the Internal Revenue Code or to meet a specific state’s requirement.
The Fund designates the following amounts or, if subsequently determined to be different, the maximum amount allowable for its fiscal year ended December 31, 2022:
| | | | | | | | |
Federal and State Income Tax | | | | | | | |
Long-Term Capital Gain Distributions | | | $16,140,823 | | | |
Qualified Dividend Income* | | | 100.00 | % | | |
Corporate Dividends Received Deduction* | | | 3.82 | % | | |
U.S. Treasury Obligations* | | | 0.00 | % | | |
Qualified Business Income* | | | 0.00 | % | | |
Business Interest Income* | | | 0.00 | % | | |
Foreign Taxes | | | $0.0412 | | | per share |
Foreign Source Income | | $ | 0.7073 | | | per share |
|
* The above percentages are based on ordinary income dividends paid to shareholders during the Fund’s fiscal year. |
| | |
| 22 | | Invesco EQV European Small Company Fund |
Trustees and Officers
The address of each trustee and officer is AIM Funds Group (Invesco Funds Group) (the “Trust”), 11 Greenway Plaza, Suite 1000, Houston, Texas 77046-1173. The trustees serve for the life of the Trust, subject to their earlier death, incapacitation, resignation, retirement or removal as more specifically provided in the Trust’s organizational documents. Each officer serves for a one year term or until their successors are elected and qualified. Column two below includes length of time served with predecessor entities, if any.
| | | | | | | | |
Name, Year of Birth and Position(s) Held with the Trust | | Trustee and/or Officer Since | | Principal Occupation(s) During Past 5 Years | | Number of Funds in Fund Complex
Overseen by
Trustee | | Other Directorship(s) Held by Trustee
During Past 5 Years |
| Interested Trustee | | | | | | | | |
Martin L. Flanagan1 - 1960 Trustee and Vice Chair | | 2007 | | Executive Director, Chief Executive Officer and President, Invesco Ltd. (ultimate parent of Invesco and a global investment management firm); Trustee and Vice Chair, The Invesco Funds; Vice Chair, Investment Company Institute; and Member of Executive Board, SMU Cox School of Business Formerly: Advisor to the Board, Invesco Advisers, Inc. (formerly known as Invesco Institutional (N.A.), Inc.); Chairman and Chief Executive Officer, Invesco Advisers, Inc. (registered investment adviser); Director, Chairman, Chief Executive Officer and President, Invesco Holding Company (US), Inc. (formerly IVZ Inc.) (holding company), Invesco Group Services, Inc. (service provider) and Invesco North American Holdings, Inc. (holding company); Director, Chief Executive Officer and President, Invesco Holding Company Limited (parent of Invesco and a global investment management firm); Director, Invesco Ltd.; Chairman, Investment Company Institute and President, Co-Chief Executive Officer, Co-President, Chief Operating Officer and Chief Financial Officer, Franklin Resources, Inc. (global investment management organization) | | 189 | | None |
| 1 | Mr. Flanagan is considered an interested person (within the meaning of Section 2(a)(19) of the 1940 Act) of the Trust because he is an officer of the Adviser to the Trust, and an officer and a director of Invesco Ltd., ultimate parent of the Adviser. |
| | | | | | | | |
Name, Year of Birth and Position(s) Held with the Trust | | Trustee and/or Officer Since | | Principal Occupation(s) During Past 5 Years | | Number of Funds in
Fund Complex
Overseen by
Trustee | | Other Directorship(s) Held by Trustee During Past 5 Years |
| Independent Trustees | | | | | | | | |
| Beth Ann Brown - 1968 Trustee (2019) and Chair (August 2022) | | 2019 | | Independent Consultant Formerly: Head of Intermediary Distribution, Managing Director, Strategic Relations, Managing Director, Head of National Accounts, Senior Vice President, National Account Manager and Senior Vice President, Key Account Manager, Columbia Management Investment Advisers LLC; Vice President, Key Account Manager, Liberty Funds Distributor, Inc.; and Trustee of certain Oppenheimer Funds | | 189 | | Director, Board of Directors of Caron Engineering Inc.; Advisor, Board of Advisors of Caron Engineering Inc.; President and Director, Acton Shapleigh Youth Conservation Corps (non-profit) Formerly: President and Director Director of Grahamtastic Connection (non-profit) |
Cynthia Hostetler -1962 Trustee | | 2017 | | Non-Executive Director and Trustee of a number of public and private business corporations Formerly: Director, Aberdeen Investment Funds (4 portfolios); Director, Artio Global Investment LLC (mutual fund complex); Director, Edgen Group, Inc. (specialized energy and infrastructure products distributor); Director, Genesee & Wyoming, Inc. (railroads); Head of Investment Funds and Private Equity, Overseas Private Investment Corporation; President, First Manhattan Bancorporation, Inc.; and Attorney, Simpson Thacher & Bartlett LLP | | 189 | | Resideo Technologies, Inc. (smart home technology); Vulcan Materials Company (construction materials company); Trilinc Global Impact Fund; Textainer Group Holdings, (shipping container leasing company); Investment Company Institute (professional organization); and Independent Directors Council (professional organization) |
Eli Jones - 1961 Trustee | | 2016 | | Professor and Dean Emeritus, Mays Business School - Texas A&M University Formerly: Dean of Mays Business School-Texas A&M University; Professor and Dean, Walton College of Business, University of Arkansas and E.J. Ourso College of Business, Louisiana State University; and Director, Arvest Bank | | 189 | | Insperity, Inc. (formerly known as Administaff) (human resources provider); and Member of Regional Board of Directors and Board of Directors, First Financial Bancorp (regional bank) |
| | |
| T-1 | | Invesco EQV European Small Company Fund |
Trustees and Officers–(continued)
| | | | | | | | |
Name, Year of Birth and Position(s) Held with the Trust | | Trustee and/or Officer Since | | Principal Occupation(s) During Past 5 Years | | Number of Funds in
Fund Complex
Overseen by
Trustee | | Other Directorship(s) Held by Trustee During Past 5 Years |
| Independent Trustees–(continued) | | | | | | |
Elizabeth Krentzman - 1959 Trustee | | 2019 | | Formerly: Principal and Chief Regulatory Advisor for Asset Management Services and U.S. Mutual Fund Leader of Deloitte & Touche LLP; General Counsel of the Investment Company Institute (trade association); National Director of the Investment Management Regulatory Consulting Practice, Principal, Director and Senior Manager of Deloitte & Touche LLP; Assistant Director of the Division of Investment Management - Office of Disclosure and Investment Adviser Regulation of the U.S. Securities and Exchange Commission and various positions with the Division of Investment Management – Office of Regulatory Policy of the U.S. Securities and Exchange Commission; Associate at Ropes & Gray LLP; and Trustee of certain Oppenheimer Funds | | 189 | | Formerly: Member of the Cartica Funds Board of Directors (private investment fund); Trustee of the University of Florida National Board Foundation; and Member of the University of Florida Law Center Association, Inc. Board of Trustees, Audit Committee and Membership Committee |
Anthony J. LaCava, Jr. - 1956 Trustee | | 2019 | | Formerly: Director and Member of the Audit Committee, Blue Hills Bank (publicly traded financial institution) and Managing Partner, KPMG LLP | | 189 | | Blue Hills Bank; Chairman, Bentley University; Member, Business School Advisory Council; and Nominating Committee, KPMG LLP |
Prema Mathai-Davis - 1950 Trustee | | 1998 | | Retired Formerly: Co-Founder & Partner of Quantalytics Research, LLC, (a FinTech Investment Research Platform for the Self-Directed Investor); Trustee of YWCA Retirement Fund; CEO of YWCA of the USA; Board member of the NY Metropolitan Transportation Authority; Commissioner of the NYC Department of Aging; and Board member of Johns Hopkins Bioethics Institute | | 189 | | Member of Board of Positive Planet US (non-profit) and HealthCare Chaplaincy Network (non-profit) |
Joel W. Motley - 1952 Trustee | | 2019 | | Director of Office of Finance, Federal Home Loan Bank System; Managing Director of Carmona Motley Inc. (privately held financial advisor); Member of the Council on Foreign Relations and its Finance and Budget Committee; Chairman Emeritus of Board of Human Rights Watch and Member of its Investment Committee; and Member of Investment Committee Board of Historic Hudson Valley (non-profit cultural organization); Member of the Board, Blue Ocean Acquisition Corp.; and Member of the Vestry and the Investment Committee of Trinity Church Wall Street. Formerly: Managing Director of Public Capital Advisors, LLC (privately held financial advisor); Managing Director of Carmona Motley Hoffman, Inc. (privately held financial advisor); Trustee of certain Oppenheimer Funds; and Director of Columbia Equity Financial Corp. (privately held financial advisor) | | 189 | | Member of Board of Trust for Mutual Understanding (non-profit promoting the arts and environment); Member of Board of Greenwall Foundation (bioethics research foundation) and its Investment Committee; Member of Board of Friends of the LRC (non-profit legal advocacy); and Board Member and Investment Committee Member of Pulitzer Center for Crisis Reporting (non-profit journalism) |
Teresa M. Ressel - 1962 Trustee | | 2017 | | Non-executive director and trustee of a number of public and private business corporations Formerly: Chief Executive Officer, UBS Securities LLC (investment banking); Chief Operating Officer, UBS AG Americas (investment banking); Sr. Management Team Olayan America, The Olayan Group (international investor/commercial/industrial); Assistant Secretary for Management & Budget and Designated Chief Financial Officer, U.S. Department of Treasury and Director, ON Semiconductor Corporation (semiconductor manufacturing) | | 189 | | None |
Robert C. Troccoli - 1949 Trustee | | 2016 | | Retired Formerly: Adjunct Professor, University of Denver – Daniels College of Business; and Managing Partner, KPMG LLP | | 189 | | None |
Daniel S. Vandivort - 1954 Trustee | | 2019 | | President, Flyway Advisory Services LLC (consulting and property management) Formerly: President and Chief Investment Officer, previously Head of Fixed Income, Weiss Peck and Greer/Robeco Investment Management; Trustee and Chair, Weiss Peck and Greer Funds Board; and various capacities at CS First Boston including Head of Fixed Income at First Boston Asset Management. | | 189 | | Formerly: Trustee and Governance Chair, Oppenheimer Funds; Treasurer, Chairman of the Audit and Finance Committee, Huntington Disease Foundation of America |
| | |
| T-2 | | Invesco EQV European Small Company Fund |
Trustees and Officers–(continued)
| | | | | | | | |
Name, Year of Birth and Position(s) Held with the Trust | | Trustee and/or Officer Since | | Principal Occupation(s) During Past 5 Years | | Number of Funds in
Fund Complex
Overseen by
Trustee | | Other Directorship(s) Held by Trustee During Past 5 Years |
| Officers | | | | | | | | |
Sheri Morris - 1964 President and Principal Executive Officer | | 1999 | | Director, Invesco Trust Company; Head of Global Fund Services, Invesco Ltd.; President and Principal Executive Officer, The Invesco Funds; Vice President, Invesco Exchange-Traded Fund Trust, Invesco Exchange-Traded Fund Trust II, Invesco India Exchange-Traded Fund Trust, Invesco Actively Managed Exchange-Traded Fund Trust, Invesco Actively Managed Exchange-Traded Commodity Fund Trust and Invesco Exchange-Traded Self-Indexed Fund Trust; and Vice President, OppenheimerFunds, Inc. Formerly: Vice President, Treasurer and Principal Financial Officer, The Invesco Funds; Vice President, Invesco AIM Advisers, Inc., Invesco AIM Capital Management, Inc. and Invesco AIM Private Asset Management, Inc.; Assistant Vice President and Assistant Treasurer, The Invesco Funds; Vice President and Assistant Vice President, Invesco Advisers, Inc.; Assistant Vice President, Invesco AIM Capital Management, Inc. and Invesco AIM Private Asset Management, Inc.; Treasurer, Invesco Exchange-Traded Fund Trust, Invesco Exchange-Traded Fund Trust II, Invesco India Exchange-Traded Fund Trust and Invesco Actively Managed Exchange-Traded Fund Trust; and Senior Vice President, Invesco Advisers, Inc. (formerly known as Invesco Institutional (N.A.), Inc.) (registered investment adviser) | | N/A | | N/A |
Jeffrey H. Kupor - 1968 Senior Vice President, Chief Legal Officer and Secretary | | 2018 | | Head of Legal of the Americas, Invesco Ltd.; Senior Vice President and Secretary, Invesco Advisers, Inc. (formerly known as Invesco Institutional (N.A.), Inc.) (registered investment adviser); Secretary, Invesco Distributors, Inc. (formerly known as Invesco AIM Distributors, Inc.); Vice President and Secretary, Invesco Investment Services, Inc. (formerly known as Invesco AIM Investment Services, Inc.); Senior Vice President, Chief Legal Officer and Secretary, The Invesco Funds; Secretary and General Counsel, Invesco Investment Advisers LLC (formerly known as Van Kampen Asset Management); Secretary and General Counsel, Invesco Capital Markets, Inc. (formerly known as Van Kampen Funds Inc.); Chief Legal Officer, Invesco Exchange-Traded Fund Trust, Invesco Exchange-Traded Fund Trust II, Invesco India Exchange-Traded Fund Trust, Invesco Actively Managed Exchange-Traded Fund Trust, Invesco Actively Managed Exchange-Traded Commodity Fund Trust and Invesco Exchange-Traded Self-Indexed Fund Trust;; Secretary and Vice President, Harbourview Asset Management Corporation; Secretary and Vice President, OppenheimerFunds, Inc. and Invesco Managed Accounts, LLC; Secretary and Senior Vice President, OFI Global Institutional, Inc.; Secretary and Vice President, OFI SteelPath, Inc.; Secretary and Vice President, Oppenheimer Acquisition Corp.; Secretary and Vice President, Shareholder Services, Inc.; and Secretary and Vice President, Trinity Investment Management Corporation Formerly: Senior Vice President, Invesco Distributors, Inc.; Secretary and Vice President, Jemstep, Inc.; Head of Legal, Worldwide Institutional, Invesco Ltd.; Secretary and General Counsel, INVESCO Private Capital Investments, Inc.; Senior Vice President, Secretary and General Counsel, Invesco Management Group, Inc. (formerly known as Invesco AIM Management Group, Inc.); Assistant Secretary, INVESCO Asset Management (Bermuda) Ltd.; Secretary and General Counsel, Invesco Private Capital, Inc.; Assistant Secretary and General Counsel, INVESCO Realty, Inc.; Secretary and General Counsel, Invesco Senior Secured Management, Inc.; Secretary, Sovereign G./P. Holdings Inc.; Secretary, Invesco Indexing LLC; and Secretary, W.L. Ross & Co., LLC | | N/A | | N/A |
Andrew R. Schlossberg - 1974 Senior Vice President | | 2019 | | Senior Vice President, Invesco Group Services, Inc.; Head of the Americas and Senior Managing Director, Invesco Ltd.; Director and Senior Vice President, Invesco Advisers, Inc. (formerly known as Invesco Institutional (N.A.), Inc.) (registered investment adviser); Director and Chairman, Invesco Investment Services, Inc. (formerly known as Invesco AIM Investment Services, Inc.) (registered transfer agent); Senior Vice President, The Invesco Funds; and Director, Invesco Investment Advisers LLC (formerly known as Van Kampen Asset Management) Formerly: Director, President and Chairman, Invesco Insurance Agency, Inc.; Director, Invesco UK Limited; Director and Chief Executive, Invesco Asset Management Limited and Invesco Fund Managers Limited; Assistant Vice President, The Invesco Funds; Senior Vice President, Invesco Advisers, Inc. (formerly known as Invesco Institutional (N.A.), Inc.) (registered investment adviser); Director and Chief Executive, Invesco Administration Services Limited and Invesco Global Investment Funds Limited; Director, Invesco Distributors, Inc.; Head of EMEA, Invesco Ltd.; President, Invesco Actively Managed Exchange-Traded Commodity Fund Trust, Invesco Actively Managed Exchange-Traded Fund Trust, Invesco Exchange-Traded Fund Trust, Invesco Exchange-Traded Fund Trust II and Invesco India Exchange-Traded Fund Trust; and Managing Director and Principal Executive Officer, Invesco Capital Management LLC | | N/A | | N/A |
| | |
| T-3 | | Invesco EQV European Small Company Fund |
Trustees and Officers–(continued)
| | | | | | | | |
Name, Year of Birth and Position(s) Held with the Trust | | Trustee and/or Officer Since | | Principal Occupation(s) During Past 5 Years | | Number of Funds in
Fund Complex
Overseen by
Trustee | | Other Directorship(s) Held by Trustee During Past 5 Years |
| Officers–(continued) | | | | | | | | |
John M. Zerr - 1962 Senior Vice President | | 2006 | | Chief Operating Officer of the Americas; Senior Vice President, Invesco Advisers, Inc. (formerly known as Invesco Institutional (N.A.), Inc.) (registered investment adviser); Senior Vice President, Invesco Distributors, Inc. (formerly known as Invesco AIM Distributors, Inc.); Director and Vice President, Invesco Investment Services, Inc. (formerly known as Invesco AIM Investment Services, Inc.) Senior Vice President, The Invesco Funds; Managing Director, Invesco Capital Management LLC; Director, Invesco Investment Advisers LLC (formerly known as Van Kampen Asset Management); Senior Vice President, Invesco Capital Markets, Inc. (formerly known as Van Kampen Funds Inc.); Manager, Invesco Indexing LLC; Manager, Invesco Specialized Products, LLC; Member, Invesco Canada Funds Advisory Board; Director, President and Chief Executive Officer, Invesco Corporate Class Inc. (corporate mutual fund company); and Director, Chairman, President and Chief Executive Officer, Invesco Canada Ltd. (formerly known as Invesco Trimark Ltd./Invesco Trimark Ltèe) (registered investment adviser and registered transfer agent); President, Invesco, Inc.; President, Invesco Global Direct Real Estate Feeder GP Ltd.; President, Invesco IP Holdings (Canada) Ltd; President, Invesco Global Direct Real Estate GP Ltd.; President, Invesco Financial Services Ltd. / Services Financiers Invesco Ltée; and Director and Chairman, Invesco Trust Company Formerly: President, Trimark Investments Ltd/Services Financiers Invesco Ltee; Director and Senior Vice President, Invesco Insurance Agency, Inc.; Director and Senior Vice President, Invesco Management Group, Inc. (formerly known as Invesco AIM Management Group, Inc.); Secretary and General Counsel, Invesco Management Group, Inc. (formerly known as Invesco AIM Management Group, Inc.); Secretary, Invesco Investment Services, Inc. (formerly known as Invesco AIM Investment Services, Inc.); Chief Legal Officer and Secretary, The Invesco Funds; Secretary and General Counsel, Invesco Investment Advisers LLC (formerly known as Van Kampen Asset Management); Secretary and General Counsel, Invesco Capital Markets, Inc. (formerly known as Van Kampen Funds Inc.); Chief Legal Officer, Invesco Exchange-Traded Fund Trust, Invesco Exchange-Traded Fund Trust II, Invesco India Exchange-Traded Fund Trust, Invesco Actively Managed Exchange-Traded Fund Trust, Invesco Actively Managed Exchange-Traded Commodity Fund Trust and Invesco Exchange-Traded Self-Indexed Fund Trust; Secretary, Invesco Indexing LLC; Director, Secretary, General Counsel and Senior Vice President, Van Kampen Exchange Corp.; Director, Vice President and Secretary, IVZ Distributors, Inc. (formerly known as INVESCO Distributors, Inc.); Director and Vice President, INVESCO Funds Group, Inc.; Director and Vice President, Van Kampen Advisors Inc.; Director, Vice President, Secretary and General Counsel, Van Kampen Investor Services Inc.;Director and Secretary, Invesco Distributors, Inc. (formerly known as Invesco AIM Distributors, Inc.); Director, Senior Vice President, General Counsel and Secretary, Invesco AIM Advisers, Inc. and Van Kampen Investments Inc.; Director, Vice President and Secretary, Fund Management Company; Director, Senior Vice President, Secretary, General Counsel and Vice President, Invesco AIM Capital Management, Inc.; and Chief Operating Officer and General Counsel, Liberty Ridge Capital, Inc. (an investment adviser) | | N/A | | N/A |
Gregory G. McGreevey - 1962 Senior Vice President | | 2012 | | Senior Managing Director, Invesco Ltd.; Director, Chairman, President, and Chief Executive Officer, Invesco Advisers, Inc. (formerly known as Invesco Institutional (N.A.), Inc.) (registered investment adviser); Director, Invesco Mortgage Capital, Inc. and Invesco Senior Secured Management, Inc.; Senior Vice President, The Invesco Funds; President, SNW Asset Management Corporation and Invesco Managed Accounts, LLC; Chairman and Director, Invesco Private Capital, Inc.; Chairman and Director, INVESCO Private Capital Investments, Inc.; Chairman and Director, INVESCO Realty, Inc.; and Senior Vice President, Invesco Group Services, Inc. Formerly: Senior Vice President, Invesco Management Group, Inc. and Invesco Advisers, Inc.; Assistant Vice President, The Invesco Funds | | N/A | | N/A |
Adrien Deberghes - 1967 Principal Financial Officer, Treasurer and Vice President | | 2020 | | Head of the Fund Office of the CFO and Fund Administration; Vice President, Invesco Advisers, Inc.; Principal Financial Officer, Treasurer and Vice President, The Invesco Funds; Vice President, Invesco Exchange-Traded Fund Trust, Invesco Exchange-Traded Fund Trust II, Invesco India Exchange-Traded Fund Trust, Invesco Actively Managed Exchange-Traded Fund Trust, Invesco Actively Managed Exchange-Traded Commodity Fund Trust and Invesco Exchange-Traded Self-Indexed Fund Trust Formerly: Senior Vice President and Treasurer, Fidelity Investments | | N/A | | N/A |
Crissie M. Wisdom - 1969 Anti-Money Laundering Compliance Officer | | 2013 | | Anti-Money Laundering and OFAC Compliance Officer for Invesco U.S. entities including: Invesco Advisers, Inc. and its affiliates, Invesco Capital Markets, Inc., Invesco Distributors, Inc., Invesco Investment Services, Inc., The Invesco Funds, Invesco Capital Management, LLC, Invesco Trust Company; and Fraud Prevention Manager for Invesco Investment Services, Inc. | | N/A | | N/A |
| | |
| T-4 | | Invesco EQV European Small Company Fund |
Trustees and Officers–(continued)
| | | | | | | | |
Name, Year of Birth and Position(s) Held with the Trust | | Trustee and/or Officer Since | | Principal Occupation(s) During Past 5 Years | | Number of Funds in
Fund Complex
Overseen by
Trustee | | Other Directorship(s) Held by Trustee During Past 5 Years |
| Officers–(continued) | | | | | | | | |
Todd F. Kuehl – 1969
Chief Compliance Officer and Senior Vice President | | 2020 | | Chief Compliance Officer, Invesco Advisers, Inc. (registered investment adviser); and Chief Compliance Officer and Senior Vice President, The Invesco Funds Formerly: Managing Director and Chief Compliance Officer, Legg Mason (Mutual Funds); Chief Compliance Officer, Legg Mason Private Portfolio Group (registered investment adviser) | | N/A | | N/A |
| James Bordewick, Jr. – 1959 Senior Vice President and Senior Officer | | 2022 | | Senior Vice President and Senior Officer, The Invesco Funds Formerly: Chief Legal Officer, KingsCrowd, Inc. (research and analytical platform for investment in private capital markets); Chief Operating Officer and Head of Legal and Regulatory, Netcapital (private capital investment platform); Managing Director, General Counsel of asset management and Chief Compliance Officer for asset management and private banking, Bank of America Corporation; Chief Legal Officer, Columbia Funds and BofA Funds; Senior Vice President and Associate General Counsel, MFS Investment Management; Chief Legal Officer, MFS Funds; Associate, Ropes & Gray; and Associate, Gaston Snow & Ely Bartlett | | N/A | | N/A |
The Statement of Additional Information of the Trust includes additional information about the Fund’s Trustees and is available upon request, without charge, by calling 1.800.959.4246. Please refer to the Fund’s Statement of Additional Information for information on the Fund’s sub-advisers.
| | | | | | |
| Office of the Fund | | Investment Adviser | | Distributor | | Auditors |
| 11 Greenway Plaza, Suite 1000 | | Invesco Advisers, Inc. | | Invesco Distributors, Inc. | | PricewaterhouseCoopers LLP |
| Houston, TX 77046-1173 | | 1555 Peachtree Street, N.E. | | 11 Greenway Plaza, Suite 1000 | | 1000 Louisiana Street, Suite 5800 |
| | Atlanta, GA 30309 | | Houston, TX 77046-1173 | | Houston, TX 77002-5021 |
| | | |
| Counsel to the Fund | | Counsel to the Independent Trustees | | Transfer Agent | | Custodian |
| Stradley Ronon Stevens & Young, LLP | | Sidley Austin LLP | | Invesco Investment Services, Inc. | | State Street Bank and Trust Company |
| 2005 Market Street, Suite 2600 | | 787 Seventh Avenue | | 11 Greenway Plaza, Suite 1000 | | 225 Franklin Street |
| Philadelphia, PA 19103-7018 | | New York, NY 10019 | | Houston, TX 77046-1173 | | Boston, MA 02110-2801 |
| | |
| T-5 | | Invesco EQV European Small Company Fund |

Go paperless with eDelivery
Visit invesco.com/edelivery to enjoy the convenience and security of anytime electronic access to your investment documents.
With eDelivery, you can elect to have any or all of the following materials delivered straight to your inbox to download, save and print from your own computer:
∎ Fund reports and prospectuses
∎ Quarterly statements
∎ Daily confirmations
∎ Tax forms
Invesco mailing information
Send general correspondence to Invesco Investment Services, Inc., P.O. Box 219078, Kansas City, MO 64121-9078.
Important notice regarding delivery of security holder documents
To reduce Fund expenses, only one copy of most shareholder documents may be mailed to shareholders with multiple accounts at the same address (Householding). Mailing of your shareholder documents may be householded indefinitely unless you instruct us otherwise. If you do not want the mailing of these documents to be combined with those for other members of your household, please contact Invesco Investment Services, Inc. at 800 959 4246 or contact your financial institution. We will begin sending you individual copies for each account within 30 days after receiving your request.
Fund holdings and proxy voting information
The Fund provides a complete list of its portfolio holdings four times each year, at the end of each fiscal quarter. For the second and fourth quarters, the list appears, respectively, in the Fund’s semiannual and annual reports to shareholders. For the first and third quarters, the Fund files the list with the Securities and Exchange Commission (SEC) as an exhibit to its reports on Form N-PORT. The most recent list of portfolio holdings is available at invesco.com/completeqtrholdings. Shareholders can also look up the Fund’s Form N-PORT filings on the SEC website, sec.gov. The SEC file numbers for the Fund are shown below.
A description of the policies and procedures that the Fund uses to determine how to vote proxies relating to portfolio securities is available without charge, upon request, from our Client Services department at 800 959 4246, or at invesco.com/corporate/about-us/esg. The information is also available on the SEC website, sec.gov.
Information regarding how the Fund voted proxies related to its portfolio securities during the most recent 12-month period ended June 30 is available at invesco.com/proxysearch. This information is also available on the SEC website, sec.gov.
Invesco Advisers, Inc. is an investment adviser; it provides investment advisory services to individual and institutional clients and does not sell securities. Invesco Distributors, Inc. is the US distributor for Invesco Ltd.’s retail mutual funds, exchange-traded funds and institutional money market funds. Both are wholly owned, indirect subsidiaries of Invesco Ltd.

| | | | |
| SEC file number(s): 811-01540 and 002-27334 | | Invesco Distributors, Inc. | | ESC-AR-1 |

| | |
| | |
| Annual Report to Shareholders | | December 31, 2022 |
Invesco Global Core Equity Fund
Nasdaq:
A: AWSAX ∎ C: AWSCX ∎ R: AWSRX ∎ Y: AWSYX ∎ R5: AWSIX ∎ R6: AWSSX
Management’s Discussion of Fund Performance
| | | | |
| |
Performance summary | |
For the fiscal year ended December 31, 2022, Class A shares of Invesco Global Core Equity Fund (the Fund), at net asset value (NAV), underperformed the MSCI World Index, the Fund’s broad market/style-specific benchmark. | |
Your Fund’s long-term performance appears later in this report. | |
| |
Fund vs. Indexes | |
Total returns, 12/31/21 to 12/31/22, at net asset value (NAV). Performance shown does not include applicable contingent deferred sales charges (CDSC) or front-end sales charges, which would have reduced performance. | |
Class A Shares | | | -22.20 | % |
Class C Shares | | | -22.81 | |
Class R Shares | | | -22.45 | |
Class Y Shares | | | -21.99 | |
Class R5 Shares | | | -22.02 | |
Class R6 Shares | | | -21.99 | |
MSCI World Index▼ (Broad Market/Style-Specific Index) | | | -18.14 | |
Lipper Global Large-Cap Core Funds Index∎ (Peer Group Index) | | | -16.48 | |
| |
Source(s): ▼RIMES Technologies Corp.; ∎Lipper Inc. | | | | |
Market conditions and your Fund
Global equity markets declined in the first half of 2022 amid volatility sparked by Russia’s invasion of Ukraine, rising commodity prices, rampant global inflation and central banks shifting toward tighter monetary policy. Russia’s invasion exacerbated inflationary pressures, disrupting already strained supply chains, and increasing shortages of oil, gas and raw materials, with the price of oil rising sharply.
Inflation headwinds continued into the third quarter of 2022. The US Federal Reserve (the Fed), the European Central Bank and the Bank of England all raised interest rates. In contrast, the People’s Bank of China lowered its policy rate and the Bank of Japan kept rates the same. Emerging market equities, hampered by the strong US dollar, underperformed developed market equities.
Global equity markets posted gains for the fourth quarter of 2022, after better inflation data sparked a rally in October and November. However, investor sentiment worsened in December after central banks signaled continued interest rate hikes into 2023 as inflation remained above target levels. International stocks outperformed US stocks in the fourth quarter, led by results in Europe and the
UK. Emerging market equities also posted gains for the fourth quarter of 2022, boosted by China, which eased its zero-COVID-19 policy and started to reopen even as COVID-19 infections surged.
Despite the rebound in the fourth quarter of 2022, at the end of the fiscal year ended December 31, 2022, trailing one-year returns for developed market equities and emerging market equities were both in negative territory.
The Fund’s relative underperformance compared to the MSCI World Index was primarily due to investments in the industrials and health care sectors which lagged those of
the index over the fiscal year. A lack of exposure to the energy sector also detracted from relative Fund performance. In contrast, the Fund’s investments in the consumer discretionary and consumer staples sectors outperformed the index over the fiscal year and benefited relative Fund performance.
The most significant individual contributors to absolute Fund performance during the fiscal year included AutoZone and Honeywell International.
AutoZone is a leading retailer of aftermarket automotive parts and accessories in the United States. Shares in AutoZone benefited from recession fears which may increase demand for replacement repair parts of used vehicles. Honeywell International is a US-based multinational industrial conglomerate operating in aerospace, building technologies, performance materials and safety and productivity solutions. Shares in Honeywell International rose over the fiscal year on evidence that supply-chain issues were being resolved and management’s expected improvements in margins in 2023 due to a combination of moderating inflation and pricing actions.
The most significant individual detractors from absolute Fund performance during the fiscal year included KION Group AG and Temenos AG.
KION Group AG is a global leader in the manufacturing of industrial trucks and forklifts and is a leading provider of warehouse automation solutions. Shares in KION Group AG declined over the fiscal year as supply-chain issues caused delays in their ability to deliver truck and forklift shipments. Temenos AG is a Switzerland-based company that specializes in enterprise software for banks and financial services institutions. Shares in Teme-nos AG declined over the fiscal year on disappointing operating results due to higher-than-expected project costs and lowered revenue guidance due to macro concerns.
Thank you for your investment in Invesco Global Core Equity Fund.
Portfolio manager(s):
Michael Hatcher
The views and opinions expressed in management’s discussion of Fund performance are those of Invesco Advisers, Inc. and its affiliates. These views and opinions are subject to change at any time based on factors such as market and economic conditions. These views and opinions may not be relied upon as investment advice or recommendations, or as an offer for a particular security. The information is not a complete analysis of every aspect of any market, country, industry, security or the Fund. Statements of fact are from sources considered reliable, but Invesco Advisers, Inc. makes no representation or warranty as to their completeness or accuracy. Although historical performance is no guarantee of future results, these insights may help you understand our investment management philosophy.
See important Fund and, if applicable, index disclosures later in this report.
| | |
| 2 | | Invesco Global Core Equity Fund |
Your Fund’s Long-Term Performance
Results of a $10,000 Investment – Oldest Share Class(es)
Fund and index data from 12/31/12
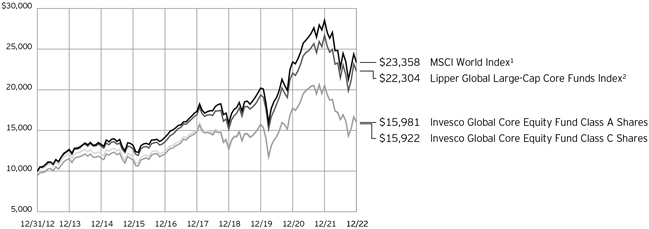
1 Source: RIMES Technologies Corp.
2 Source: Lipper Inc.
Past performance cannot guarantee future results.
The data shown in the chart include reinvested distributions, applicable sales charges and Fund expenses including management
fees. Index results include reinvested dividends, but they do not reflect sales charges. Performance of the peer group, if applicable, reflects fund expenses and management fees;
performance of a market index does not.
Performance shown in the chart does not reflect deduction of taxes a shareholder would pay on Fund distributions or sale of Fund shares.
| | |
| 3 | | Invesco Global Core Equity Fund |
| | | | |
| |
Average Annual Total Returns | |
As of 12/31/22, including maximum applicable sales charges | |
| |
Class A Shares | | | | |
Inception (12/29/00) | | | 4.51 | % |
10 Years | | | 4.80 | |
5 Years | | | 0.30 | |
1 Year | | | -26.47 | |
| |
Class C Shares | | | | |
Inception (12/29/00) | | | 4.52 | % |
10 Years | | | 4.76 | |
5 Years | | | 0.70 | |
1 Year | | | -23.55 | |
| |
Class R Shares | | | | |
Inception (5/23/11) | | | 4.12 | % |
10 Years | | | 5.13 | |
5 Years | | | 1.19 | |
1 Year | | | -22.45 | |
| |
Class Y Shares | | | | |
Inception (10/3/08) | | | 5.28 | % |
10 Years | | | 5.66 | |
5 Years | | | 1.71 | |
1 Year | | | -21.99 | |
| |
Class R5 Shares | | | | |
Inception (10/25/05) | | | 4.21 | % |
10 Years | | | 5.70 | |
5 Years | | | 1.71 | |
1 Year | | | -22.02 | |
| |
Class R6 Shares | | | | |
10 Years | | | 5.58 | % |
5 Years | | | 1.78 | |
1 Year | | | -21.99 | |
Class R6 shares incepted on April 4, 2017. Performance shown prior to that date is that of Class A shares at net asset value and includes the 12b-1 fees applicable to Class A shares.
The performance data quoted represent past performance and cannot guarantee future results; current performance may be lower or higher. Please visit invesco.com/ performance for the most recent month-end performance. Performance figures reflect reinvested distributions, changes in net asset value and the effect of the maximum sales charge unless otherwise stated. Performance figures do not reflect deduction of taxes a shareholder would pay on Fund distributions or sale of Fund shares. Investment return and principal value will fluctuate so that you may have a gain or loss when you sell shares.
Class A share performance reflects the maximum 5.50% sales charge, and Class C share performance reflects the applicable contingent deferred sales charge (CDSC) for the period involved. The CDSC on Class C shares is 1% for the first year after purchase. Class R, Class Y, Class R5 and Class R6 shares do not have a front-end sales charge or a CDSC; therefore, performance is at net asset value.
The performance of the Fund’s share classes will differ primarily due to different sales charge structures and class expenses.
Fund performance reflects any applicable fee waivers and/or expense reimbursements. Had the adviser not waived fees and/or reimbursed expenses currently or in the past, returns would have been lower. See current prospectus for more information.
| | |
| 4 | | Invesco Global Core Equity Fund |
Supplemental Information
Invesco Global Core Equity Fund’s investment objective is long-term growth of capital.
| ∎ | Unless otherwise stated, information presented in this report is as of December 31, 2022, and is based on total net assets. |
| ∎ | Unless otherwise noted, all data is provided by Invesco. |
| ∎ | To access your Fund’s reports/prospectus, visit invesco.com/fundreports. |
About indexes used in this report
| ∎ | The MSCI World IndexSM is an unmanaged index considered representative of stocks of developed countries. The index is computed using the net return, which withholds applicable taxes for non-resident investors. |
| ∎ | The Lipper Global Large-Cap Core Funds Index is an unmanaged index considered representative of global large-cap core funds tracked by Lipper. |
| ∎ | The Fund is not managed to track the performance of any particular index, including the index(es) described here, and consequently, the performance of the Fund may deviate significantly from the performance of the index(es). |
| ∎ | A direct investment cannot be made in an index. Unless otherwise indicated, index results include reinvested dividends, and they do not reflect sales charges. Performance of the peer group, if applicable, reflects fund expenses; performance of a market index does not. |
|
|
This report must be accompanied or preceded by a currently effective Fund prospectus, which contains more complete information, including sales charges and expenses. Investors should read it carefully before investing. |
|
| NOT FDIC INSURED | MAY LOSE VALUE | NO BANK GUARANTEE |
| | |
| 5 | | Invesco Global Core Equity Fund |
Fund Information
Portfolio Composition
| | | | | |
| By sector | | % of total net assets |
| |
Information Technology | | | | 32.48 | % |
| |
Financials | | | | 12.32 | |
| |
Consumer Staples | | | | 12.20 | |
| |
Industrials | | | | 11.21 | |
| |
Health Care | | | | 9.19 | |
| |
Communication Services | | | | 8.74 | |
| |
Consumer Discretionary | | | | 7.07 | |
| |
Real Estate | | | | 0.53 | |
| |
Money Market Funds Plus Other Assets Less Liabilities | | | | 6.26 | |
Top 10 Equity Holdings*
| | | | | | | |
| | | | | % of total net assets |
| | |
| 1. | | Visa, Inc., Class A | | | | 5.60 | % |
| | |
| 2. | | British American Tobacco PLC | | | | 5.39 | |
| | |
| 3. | | Microsoft Corp. | | | | 4.60 | |
| | |
| 4. | | SAP SE | | | | 4.36 | |
| | |
| 5. | | London Stock Exchange Group PLC | | | | 4.31 | |
| | |
| 6. | | Honeywell International, Inc. | | | | 4.19 | |
| | |
| 7. | | Analog Devices, Inc. | | | | 4.15 | |
| | |
| 8. | | AIA Group Ltd. | | | | 4.10 | |
| | |
| 9. | | Aon PLC, Class A | | | | 3.91 | |
| | |
| 10. | | Alphabet, Inc., Class A | | | | 3.91 | |
The Fund’s holdings are subject to change, and there is no assurance that the Fund will continue to hold any particular security.
| * | Excluding money market fund holdings, if any. |
Data presented here are as of December 31, 2022.
| | |
| 6 | | Invesco Global Core Equity Fund |
Schedule of Investments
December 31, 2022
| | | | | | | | |
| | | Shares | | | Value | |
|
| |
Common Stocks & Other Equity Interests–93.74% | |
Belgium–3.88% | |
Anheuser-Busch InBev S.A./N.V., ADR | | | 341,157 | | | $ | 20,483,066 | |
|
| |
|
China–1.18% | |
Kweichow Moutai Co. Ltd., A Shares | | | 25,206 | | | | 6,237,360 | |
|
| |
|
Finland–2.46% | |
Kone OYJ, Class B | | | 250,464 | | | | 12,973,132 | |
|
| |
|
France–3.04% | |
LVMH Moet Hennessy Louis Vuitton SE | | | 22,062 | | | | 16,026,827 | |
|
| |
|
Germany–7.84% | |
KION Group AG | | | 642,961 | | | | 18,398,429 | |
|
| |
SAP SE | | | 222,700 | | | | 22,982,507 | |
|
| |
| | | | | | | 41,380,936 | |
|
| |
|
Hong Kong–4.10% | |
AIA Group Ltd. | | | 1,963,800 | | | | 21,635,192 | |
|
| |
|
Japan–1.07% | |
FANUC Corp. | | | 17,700 | | | | 2,641,582 | |
|
| |
Nabtesco Corp. | | | 115,900 | | | | 2,970,035 | |
|
| |
| | | | | | | 5,611,617 | |
|
| |
|
Netherlands–2.66% | |
Topicus.com, Inc.(a) | | | 267,599 | | | | 14,049,936 | |
|
| |
|
Switzerland–3.75% | |
Cie Financiere Richemont S.A., Wts., expiring 11/22/2023(a) | | | 432,956 | | | | 360,543 | |
|
| |
Temenos AG | | | 351,193 | | | | 19,399,924 | |
|
| |
| | | | | | | 19,760,467 | |
|
| |
|
United Kingdom–11.45% | |
British American Tobacco PLC | | | 716,796 | | | | 28,438,675 | |
|
| |
Imperial Brands PLC | | | 370,767 | | | | 9,263,457 | |
|
| |
London Stock Exchange Group PLC | | | 263,402 | | | | 22,727,391 | |
|
| |
| | | | | | | 60,429,523 | |
|
| |
|
United States–52.31% | |
Accenture PLC, Class A | | | 56,402 | | | | 15,050,310 | |
|
| |
Adobe, Inc.(a) | | | 15,005 | | | | 5,049,633 | |
|
| |
Alphabet, Inc., Class A(a) | | | 233,593 | | | | 20,609,910 | |
|
| |
Analog Devices, Inc. | | | 133,543 | | | | 21,905,058 | |
|
| |
Investment Abbreviations:
ADR - American Depositary Receipt
Wts. - Warrants
| | | | | | | | |
| | | Shares | | | Value | |
|
| |
United States–(continued) | |
Aon PLC, Class A | | | 68,799 | | | $ | 20,649,332 | |
|
| |
Aptiv PLC(a) | | | 168,965 | | | | 15,735,711 | |
|
| |
AutoZone, Inc.(a) | | | 1,031 | | | | 2,542,632 | |
|
| |
Becton, Dickinson and Co. | | | 75,514 | | | | 19,203,210 | |
|
| |
CDW Corp. | | | 29,918 | | | | 5,342,756 | |
|
| |
Charter Communications, Inc., Class A(a) | | | 45,643 | | | | 15,477,541 | |
|
| |
Equinix, Inc. | | | 4,248 | | | | 2,782,567 | |
|
| |
Floor & Decor Holdings, Inc., Class A(a)(b) | | | 38,103 | | | | 2,653,112 | |
|
| |
Honeywell International, Inc. | | | 103,038 | | | | 22,081,043 | |
|
| |
Microsoft Corp. | | | 101,313 | | | | 24,296,884 | |
|
| |
Roche Holding AG | | | 51,565 | | | | 16,204,912 | |
|
| |
Sabre Corp.(a)(b) | | | 2,227,539 | | | | 13,766,191 | |
|
| |
Visa, Inc., Class A(b) | | | 142,094 | | | | 29,521,449 | |
|
| |
Walt Disney Co. (The)(a) | | | 115,576 | | | | 10,041,243 | |
|
| |
Zoetis, Inc. | | | 89,223 | | | | 13,075,631 | |
|
| |
| | | | | | | 275,989,125 | |
|
| |
Total Common Stocks & Other Equity Interests
(Cost $513,124,039) | | | | 494,577,181 | |
|
| |
|
Money Market Funds–4.87% | |
Invesco Government & Agency Portfolio, Institutional Class,
4.22%(c)(d) | | | 15,435,683 | | | | 15,435,683 | |
|
| |
Invesco Treasury Portfolio, Institutional Class, 4.20%(c)(d) | | | 10,290,456 | | | | 10,290,456 | |
|
| |
Total Money Market Funds
(Cost $25,726,139) | | | | 25,726,139 | |
|
| |
TOTAL INVESTMENTS IN SECURITIES (excluding Investments purchased with cash collateral from securities on loan)-98.61%
(Cost $538,850,178) | | | | 520,303,320 | |
|
| |
|
Investments Purchased with Cash Collateral from Securities on Loan | |
Money Market Funds–7.02% | |
Invesco Private Government Fund, 4.28%(c)(d)(e) | | | 10,368,461 | | | | 10,368,461 | |
|
| |
Invesco Private Prime Fund,
4.46%(c)(d)(e) | | | 26,653,762 | | | | 26,661,758 | |
|
| |
Total Investments Purchased with Cash Collateral from Securities on Loan
(Cost $37,027,658) | | | | 37,030,219 | |
|
| |
TOTAL INVESTMENTS IN SECURITIES–105.63%
(Cost $575,877,836) | | | | 557,333,539 | |
|
| |
OTHER ASSETS LESS LIABILITIES–(5.63)% | | | | (29,711,445 | ) |
|
| |
NET ASSETS–100.00% | | | $ | 527,622,094 | |
|
| |
See accompanying Notes to Financial Statements which are an integral part of the financial statements.
| | |
| 7 | | Invesco Global Core Equity Fund |
Notes to Schedule of Investments:
| (a) | Non-income producing security. |
| (b) | All or a portion of this security was out on loan at December 31, 2022. |
| (c) | Affiliated issuer. The issuer and/or the Fund is a wholly-owned subsidiary of Invesco Ltd., or is affiliated by having an investment adviser that is under common control of Invesco Ltd. The table below shows the Fund’s transactions in, and earnings from, its investments in affiliates for the fiscal year ended December 31, 2022. |
| | | | | | | | | | | | | | | | | | | | | | | | | | | | | | | | | | | |
| | | Value
December 31, 2021 | | Purchases at Cost | | Proceeds from Sales | | Change in
Unrealized
Appreciation | | Realized
Gain
(Loss) | | Value
December 31, 2022 | | Dividend
Income |
| Investments in Affiliated Money Market Funds: | | | | | | | | | | | | | | | | | | | | | | | | | | | | | | | | | | | |
Invesco Government & Agency Portfolio, Institutional Class | | | $ | 23,912,333 | | | | $ | 47,267,502 | | | | $ | (55,744,152 | ) | | | $ | - | | | | $ | - | | | | $ | 15,435,683 | | | | $ | 265,908 | |
Invesco Treasury Portfolio, Institutional Class | | | | 15,941,556 | | | | | 31,511,668 | | | | | (37,162,768 | ) | | | | - | | | | | - | | | | | 10,290,456 | | | | | 172,049 | |
| Investments Purchased with Cash Collateral from Securities on Loan: | | | | | | | | | | | | | | | | | | | | | | | | | | | | | | | | | | | |
Invesco Private Government Fund | | | | 20,115,822 | | | | | 177,031,169 | | | | | (186,778,530 | ) | | | | - | | | | | - | | | | | 10,368,461 | | | | | 204,086* | |
Invesco Private Prime Fund | | | | 46,936,917 | | | | | 403,885,081 | | | | | (424,159,610 | ) | | | | 5,340 | | | | | (5,970) | | | | | 26,661,758 | | | | | 557,717* | |
Total | | | $ | 106,906,628 | | | | $ | 659,695,420 | | | | $ | (703,845,060 | ) | | | $ | 5,340 | | | | $ | (5,970) | | | | $ | 62,756,358 | | | | $ | 1,199,760 | |
| | * | Represents the income earned on the investment of cash collateral, which is included in securities lending income on the Statement of Operations. Does not include rebates and fees paid to lending agent or premiums received from borrowers, if any. |
| (d) | The rate shown is the 7-day SEC standardized yield as of December 31, 2022. |
| (e) | The security has been segregated to satisfy the commitment to return the cash collateral received in securities lending transactions upon the borrower’s return of the securities loaned. See Note 1I. |
See accompanying Notes to Financial Statements which are an integral part of the financial statements.
| | |
| 8 | | Invesco Global Core Equity Fund |
Statement of Assets and Liabilities
December 31, 2022
| | | | |
Assets: | | | | |
| |
Investments in unaffiliated securities, at value (Cost $513,124,039)* | | $ | 494,577,181 | |
|
| |
Investments in affiliated money market funds, at value (Cost $62,753,797) | | | 62,756,358 | |
|
| |
Cash | | | 16,353 | |
|
| |
Foreign currencies, at value (Cost $230,876) | | | 230,498 | |
|
| |
Receivable for: | |
Investments sold | | | 7,104,287 | |
|
| |
Fund shares sold | | | 33,766 | |
|
| |
Dividends | | | 1,227,266 | |
|
| |
Investment for trustee deferred compensation and retirement plans | | | 131,921 | |
|
| |
Other assets | | | 54,744 | |
|
| |
Total assets | | | 566,132,374 | |
|
| |
| |
Liabilities: | | | | |
Payable for: | |
Fund shares reacquired | | | 824,659 | |
|
| |
Collateral upon return of securities loaned | | | 37,027,658 | |
|
| |
Accrued fees to affiliates | | | 353,671 | |
|
| |
Accrued trustees’ and officers’ fees and benefits | | | 3,502 | |
|
| |
Accrued other operating expenses | | | 117,716 | |
|
| |
Trustee deferred compensation and retirement plans | | | 183,074 | |
|
| |
Total liabilities | | | 38,510,280 | |
|
| |
Net assets applicable to shares outstanding | | $ | 527,622,094 | |
|
| |
| |
Net assets consist of: | | | | |
Shares of beneficial interest | | $ | 547,379,318 | |
|
| |
Distributable earnings (loss) | | | (19,757,224 | ) |
|
| |
| | $ | 527,622,094 | |
|
| |
| | | | |
Net Assets: | | | | |
| |
Class A | | $ | 495,054,014 | |
|
| |
| |
Class C | | $ | 3,462,447 | |
|
| |
| |
Class R | | $ | 1,403,195 | |
|
| |
| |
Class Y | | $ | 21,797,444 | |
|
| |
| |
Class R5 | | $ | 857,438 | |
|
| |
| |
Class R6 | | $ | 5,047,556 | |
|
| |
|
Shares outstanding, no par value, with an unlimited number of shares authorized: | |
| |
Class A | | | 41,015,322 | |
|
| |
| |
Class C | | | 310,212 | |
|
| |
| |
Class R | | | 116,701 | |
|
| |
| |
Class Y | | | 1,803,307 | |
|
| |
| |
Class R5 | | | 69,571 | |
|
| |
| |
Class R6 | | | 409,207 | |
|
| |
Class A: | | | | |
Net asset value per share | | $ | 12.07 | |
|
| |
Maximum offering price per share
(Net asset value of $12.07 ÷ 94.50%) | | $ | 12.77 | |
|
| |
Class C: | | | | |
Net asset value and offering price per share | | $ | 11.16 | |
|
| |
Class R: | | | | |
Net asset value and offering price per share | | $ | 12.02 | |
|
| |
Class Y: | | | | |
Net asset value and offering price per share | | $ | 12.09 | |
|
| |
Class R5: | | | | |
Net asset value and offering price per share | | $ | 12.32 | |
|
| |
Class R6: | | | | |
Net asset value and offering price per share | | $ | 12.33 | |
|
| |
| * | At December 31, 2022, securities with an aggregate value of $36,319,313 were on loan to brokers. |
See accompanying Notes to Financial Statements which are an integral part of the financial statements.
| | |
| 9 | | Invesco Global Core Equity Fund |
Statement of Operations
For the year ended December 31, 2022
| | | | |
Investment income: | | | | |
| |
Dividends (net of foreign withholding taxes of $471,630) | | $ | 8,638,049 | |
|
| |
| |
Dividends from affiliated money market funds (includes net securities lending income of $86,658) | | | 524,615 | |
|
| |
Total investment income | | | 9,162,664 | |
|
| |
| |
Expenses: | | | | |
| |
Advisory fees | | | 4,767,120 | |
|
| |
| |
Administrative services fees | | | 89,591 | |
|
| |
| |
Custodian fees | | | 38,998 | |
|
| |
Distribution fees: | | | | |
| |
Class A | | | 1,420,634 | |
|
| |
Class C | | | 42,485 | |
|
| |
Class R | | | 7,181 | |
|
| |
Transfer agent fees – A, C, R and Y | | | 998,948 | |
|
| |
Transfer agent fees – R5 | | | 911 | |
|
| |
Transfer agent fees – R6 | | | 1,556 | |
|
| |
Trustees’ and officers’ fees and benefits | | | 25,070 | |
|
| |
Registration and filing fees | | | 87,177 | |
|
| |
Reports to shareholders | | | 43,364 | |
|
| |
Professional services fees | | | 69,582 | |
|
| |
Other | | | 18,436 | |
|
| |
Total expenses | | | 7,611,053 | |
|
| |
Less: Fees waived, expenses reimbursed and/or expense offset arrangement(s) | | | (278,640 | ) |
|
| |
Net expenses | | | 7,332,413 | |
|
| |
Net investment income | | | 1,830,251 | |
|
| |
| |
Realized and unrealized gain (loss) from: | | | | |
| |
Net realized gain (loss) from: | | | | |
Unaffiliated investment securities | | | (2,574,406 | ) |
|
| |
Affiliated investment securities | | | (5,970 | ) |
|
| |
Foreign currencies | | | (19,626 | ) |
|
| |
| | | (2,600,002 | ) |
|
| |
Change in net unrealized appreciation (depreciation) of: | | | | |
Unaffiliated investment securities | | | (166,126,852 | ) |
|
| |
Affiliated investment securities | | | 5,340 | |
|
| |
Foreign currencies | | | (19,575 | ) |
|
| |
| | | (166,141,087 | ) |
|
| |
Net realized and unrealized gain (loss) | | | (168,741,089 | ) |
|
| |
Net increase (decrease) in net assets resulting from operations | | $ | (166,910,838 | ) |
|
| |
See accompanying Notes to Financial Statements which are an integral part of the financial statements.
| | |
| 10 | | Invesco Global Core Equity Fund |
Statement of Changes in Net Assets
For the years ended December 31, 2022 and 2021
| | | | | | | | |
| | | 2022 | | | 2021 | |
|
| |
Operations: | | | | | | | | |
| | |
Net investment income | | $ | 1,830,251 | | | $ | 508,012 | |
|
| |
Net realized gain (loss) | | | (2,600,002 | ) | | | 45,689,621 | |
|
| |
Change in net unrealized appreciation (depreciation) | | | (166,141,087 | ) | | | 65,370,886 | |
|
| |
Net increase (decrease) in net assets resulting from operations | | | (166,910,838 | ) | | | 111,568,519 | |
|
| |
| | |
Distributions to shareholders from distributable earnings: | | | | | | | | |
| | |
Class A | | | (15,816,476 | ) | | | (36,895,882 | ) |
|
| |
| | |
Class C | | | (117,254 | ) | | | (272,344 | ) |
|
| |
| | |
Class R | | | (42,683 | ) | | | (83,037 | ) |
|
| |
| | |
Class Y | | | (799,085 | ) | | | (1,850,484 | ) |
|
| |
| | |
Class R5 | | | (29,867 | ) | | | (58,467 | ) |
|
| |
| | |
Class R6 | | | (180,021 | ) | | | (367,890 | ) |
|
| |
Total distributions from distributable earnings | | | (16,985,386 | ) | | | (39,528,104 | ) |
|
| |
| | |
Share transactions–net: | | | | | | | | |
| | |
Class A | | | (51,359,333 | ) | | | (35,598,155 | ) |
|
| |
| | |
Class C | | | (954,633 | ) | | | (1,119,643 | ) |
|
| |
| | |
Class R | | | 97,846 | | | | (294,029 | ) |
|
| |
| | |
Class Y | | | (4,548,444 | ) | | | (1,092,219 | ) |
|
| |
| | |
Class R5 | | | 3,389 | | | | 21,083 | |
|
| |
| | |
Class R6 | | | (236,257 | ) | | | (267,609 | ) |
|
| |
Net increase (decrease) in net assets resulting from share transactions | | | (56,997,432 | ) | | | (38,350,572 | ) |
|
| |
Net increase (decrease) in net assets | | | (240,893,656 | ) | | | 33,689,843 | |
|
| |
| | |
Net assets: | | | | | | | | |
| | |
Beginning of year | | | 768,515,750 | | | | 734,825,907 | |
|
| |
End of year | | $ | 527,622,094 | | | $ | 768,515,750 | |
|
| |
See accompanying Notes to Financial Statements which are an integral part of the financial statements.
| | |
| 11 | | Invesco Global Core Equity Fund |
Financial Highlights
The following schedule presents financial highlights for a share of the Fund outstanding throughout the periods indicated.
| | | | | | | | | | | | | | | | | | | | | | | | | | | | | | | | | | | | | | | | | | | | | | | | | | | | | | | | |
| | | Net asset
value,
beginning
of period | | Net
investment
income
(loss)(a) | | Net gains
(losses) on securities
(both
realized and
unrealized) | | Total from
investment
operations | | Dividends
from net
investment
income | | Distributions
from net
realized
gains | | Total
distributions | | Net asset
value, end
of period | | Total
return (b) | | Net assets,
end of period
(000’s omitted) | | Ratio of
expenses
to average net assets
with fee waivers
and/or
expenses
absorbed | | Ratio of
expenses
to average net
assets without
fee waivers
and/or
expenses
absorbed | | Ratio of net
investment
income
(loss) to average
net assets | | Portfolio
turnover (c) |
Class A | | | | | | | | | | | | | | | | | | | | | | | | | | | | | | | | | | | | | | | | | | | | | | | | | | | | | | | | |
Year ended 12/31/22 | | | $16.02 | | | | $0.04 | | | | $(3.59 | ) | | | $(3.55 | ) | | | $(0.01 | ) | | | $(0.39 | ) | | | $(0.40 | ) | | | $12.07 | | | | (22.20 | )% | | | $495,054 | | | | 1.22 | % | | | 1.26 | % | | | 0.29 | % | | | 11 | % |
Year ended 12/31/21 | | | 14.61 | | | | 0.01 | | | | 2.26 | | | | 2.27 | | | | (0.13 | ) | | | (0.73 | ) | | | (0.86 | ) | | | 16.02 | | | | 15.68 | | | | 718,327 | | | | 1.22 | | | | 1.22 | | | | 0.06 | | | | 23 | |
Year ended 12/31/20 | | | 15.66 | | | | 0.14 | | | | 1.78 | | | | 1.92 | | | | (0.03 | ) | | | (2.94 | ) | | | (2.97 | ) | | | 14.61 | | | | 12.63 | | | | 686,612 | | | | 1.22 | | | | 1.28 | | | | 0.92 | | | | 126 | |
Year ended 12/31/19 | | | 12.73 | | | | 0.19 | | | | 2.93 | | | | 3.12 | | | | (0.19 | ) | | | – | | | | (0.19 | ) | | | 15.66 | | | | 24.53 | | | | 709,829 | | | | 1.22 | | | | 1.28 | | | | 1.33 | | | | 24 | |
Year ended 12/31/18 | | | 16.20 | | | | 0.15 | | | | (2.53 | ) | | | (2.38 | ) | | | (0.17 | ) | | | (0.92 | ) | | | (1.09 | ) | | | 12.73 | | | | (14.90 | ) | | | 605,748 | | | | 1.22 | | | | 1.29 | | | | 0.97 | | | | 30 | |
Class C | | | | | | | | | | | | | | | | | | | | | | | | | | | | | | | | | | | | | | | | | | | | | | | | | | | | | | | | |
Year ended 12/31/22 | | | 14.96 | | | | (0.06 | ) | | | (3.35 | ) | | | (3.41 | ) | | | – | | | | (0.39 | ) | | | (0.39 | ) | | | 11.16 | | | | (22.81 | ) | | | 3,462 | | | | 1.97 | | | | 2.01 | | | | (0.46 | ) | | | 11 | |
Year ended 12/31/21 | | | 13.67 | | | | (0.10 | ) | | | 2.12 | | | | 2.02 | | | | – | | | | (0.73 | ) | | | (0.73 | ) | | | 14.96 | | | | 14.90 | | | | 5,778 | | | | 1.97 | | | | 1.97 | | | | (0.69 | ) | | | 23 | |
Year ended 12/31/20 | | | 14.94 | | | | 0.02 | | | | 1.68 | | | | 1.70 | | | | (0.03 | ) | | | (2.94 | ) | | | (2.97 | ) | | | 13.67 | | | | 11.75 | | | | 6,307 | | | | 1.97 | | | | 2.03 | | | | 0.17 | | | | 126 | |
Year ended 12/31/19 | | | 12.10 | | | | 0.08 | | | | 2.79 | | | | 2.87 | | | | (0.03 | ) | | | – | | | | (0.03 | ) | | | 14.94 | | | | 23.74 | | | | 14,290 | | | | 1.97 | | | | 2.03 | | | | 0.58 | | | | 24 | |
Year ended 12/31/18 | | | 15.44 | | | | 0.03 | | | | (2.40 | ) | | | (2.37 | ) | | | (0.05 | ) | | | (0.92 | ) | | | (0.97 | ) | | | 12.10 | | | | (15.58 | ) | | | 57,163 | | | | 1.97 | | | | 2.04 | | | | 0.22 | | | | 30 | |
Class R | | | | | | | | | | | | | | | | | | | | | | | | | | | | | | | | | | | | | | | | | | | | | | | | | | | | | | | | |
Year ended 12/31/22 | | | 16.00 | | | | 0.01 | | | | (3.60 | ) | | | (3.59 | ) | | | – | | | | (0.39 | ) | | | (0.39 | ) | | | 12.02 | | | | (22.45 | ) | | | 1,403 | | | | 1.47 | | | | 1.51 | | | | 0.04 | | | | 11 | |
Year ended 12/31/21 | | | 14.58 | | | | (0.03 | ) | | | 2.27 | | | | 2.24 | | | | (0.09 | ) | | | (0.73 | ) | | | (0.82 | ) | | | 16.00 | | | | 15.49 | | | | 1,732 | | | | 1.47 | | | | 1.47 | | | | (0.19 | ) | | | 23 | |
Year ended 12/31/20 | | | 15.68 | | | | 0.10 | | | | 1.77 | | | | 1.87 | | | | (0.03 | ) | | | (2.94 | ) | | | (2.97 | ) | | | 14.58 | | | | 12.28 | | | | 1,845 | | | | 1.47 | | | | 1.53 | | | | 0.67 | | | | 126 | |
Year ended 12/31/19 | | | 12.72 | | | | 0.16 | | | | 2.94 | | | | 3.10 | | | | (0.14 | ) | | | – | | | | (0.14 | ) | | | 15.68 | | | | 24.38 | | | | 1,963 | | | | 1.47 | | | | 1.53 | | | | 1.08 | | | | 24 | |
Year ended 12/31/18 | | | 16.19 | | | | 0.11 | | | | (2.53 | ) | | | (2.42 | ) | | | (0.13 | ) | | | (0.92 | ) | | | (1.05 | ) | | | 12.72 | | | | (15.16 | ) | | | 1,464 | | | | 1.47 | | | | 1.54 | | | | 0.72 | | | | 30 | |
Class Y | | | | | | | | | | | | | | | | | | | | | | | | | | | | | | | | | | | | | | | | | | | | | | | | | | | | | | | | |
Year ended 12/31/22 | | | 16.06 | | | | 0.07 | | | | (3.60 | ) | | | (3.53 | ) | | | (0.05 | ) | | | (0.39 | ) | | | (0.44 | ) | | | 12.09 | | | | (21.99 | ) | | | 21,797 | | | | 0.97 | | | | 1.01 | | | | 0.54 | | | | 11 | |
Year ended 12/31/21 | | | 14.64 | | | | 0.05 | | | | 2.27 | | | | 2.32 | | | | (0.17 | ) | | | (0.73 | ) | | | (0.90 | ) | | | 16.06 | | | | 15.97 | | | | 34,582 | | | | 0.97 | | | | 0.97 | | | | 0.31 | | | | 23 | |
Year ended 12/31/20 | | | 15.64 | | | | 0.17 | | | | 1.80 | | | | 1.97 | | | | (0.03 | ) | | | (2.94 | ) | | | (2.97 | ) | | | 14.64 | | | | 12.96 | | | | 32,476 | | | | 0.97 | | | | 1.03 | | | | 1.17 | | | | 126 | |
Year ended 12/31/19 | | | 12.71 | | | | 0.23 | | | | 2.93 | | | | 3.16 | | | | (0.23 | ) | | | – | | | | (0.23 | ) | | | 15.64 | | | | 24.87 | | | | 34,547 | | | | 0.97 | | | | 1.03 | | | | 1.58 | | | | 24 | |
Year ended 12/31/18 | | | 16.19 | | | | 0.19 | | | | (2.54 | ) | | | (2.35 | ) | | | (0.21 | ) | | | (0.92 | ) | | | (1.13 | ) | | | 12.71 | | | | (14.72 | ) | | | 32,382 | | | | 0.97 | | | | 1.04 | | | | 1.22 | | | | 30 | |
Class R5 | | | | | | | | | | | | | | | | | | | | | | | | | | | | | | | | | | | | | | | | | | | | | | | | | | | | | | | | |
Year ended 12/31/22 | | | 16.37 | | | | 0.08 | | | | (3.68 | ) | | | (3.60 | ) | | | (0.06 | ) | | | (0.39 | ) | | | (0.45 | ) | | | 12.32 | | | | (22.02 | ) | | | 857 | | | | 0.95 | | | | 0.95 | | | | 0.56 | | | | 11 | |
Year ended 12/31/21 | | | 14.90 | | | | 0.06 | | | | 2.31 | | | | 2.37 | | | | (0.17 | ) | | | (0.73 | ) | | | (0.90 | ) | | | 16.37 | | | | 16.05 | | | | 1,125 | | | | 0.93 | | | | 0.93 | | | | 0.35 | | | | 23 | |
Year ended 12/31/20 | | | 15.88 | | | | 0.18 | | | | 1.81 | | | | 1.99 | | | | (0.03 | ) | | | (2.94 | ) | | | (2.97 | ) | | | 14.90 | | | | 12.89 | | | | 1,004 | | | | 0.95 | | | | 0.95 | | | | 1.19 | | | | 126 | |
Year ended 12/31/19 | | | 12.90 | | | | 0.24 | | | | 2.97 | | | | 3.21 | | | | (0.23 | ) | | | – | | | | (0.23 | ) | | | 15.88 | | | | 24.92 | | | | 755 | | | | 0.95 | | | | 0.95 | | | | 1.60 | | | | 24 | |
Year ended 12/31/18 | | | 16.41 | | | | 0.20 | | | | (2.58 | ) | | | (2.38 | ) | | | (0.21 | ) | | | (0.92 | ) | | | (1.13 | ) | | | 12.90 | | | | (14.70 | ) | | | 533 | | | | 0.97 | | | | 0.97 | | | | 1.22 | | | | 30 | |
Class R6 | | | | | | | | | | | | | | | | | | | | | | | | | | | | | | | | | | | | | | | | | | | | | | | | | | | | | | | | |
Year ended 12/31/22 | | | 16.39 | | | | 0.09 | | | | (3.69 | ) | | | (3.60 | ) | | | (0.07 | ) | | | (0.39 | ) | | | (0.46 | ) | | | 12.33 | | | | (21.99 | ) | | | 5,048 | | | | 0.88 | | | | 0.88 | | | | 0.63 | | | | 11 | |
Year ended 12/31/21 | | | 14.91 | | | | 0.07 | | | | 2.32 | | | | 2.39 | | | | (0.18 | ) | | | (0.73 | ) | | | (0.91 | ) | | | 16.39 | | | | 16.17 | | | | 6,971 | | | | 0.87 | | | | 0.87 | | | | 0.41 | | | | 23 | |
Year ended 12/31/20 | | | 15.88 | | | | 0.19 | | | | 1.81 | | | | 2.00 | | | | (0.03 | ) | | | (2.94 | ) | | | (2.97 | ) | | | 14.91 | | | | 12.95 | | | | 6,581 | | | | 0.89 | | | | 0.89 | | | | 1.25 | | | | 126 | |
Year ended 12/31/19 | | | 12.90 | | | | 0.24 | | | | 2.98 | | | | 3.22 | | | | (0.24 | ) | | | – | | | | (0.24 | ) | | | 15.88 | | | | 24.98 | | | | 7,085 | | | | 0.90 | | | | 0.90 | | | | 1.65 | | | | 24 | |
Year ended 12/31/18 | | | 16.41 | | | | 0.20 | | | | (2.57 | ) | | | (2.37 | ) | | | (0.22 | ) | | | (0.92 | ) | | | (1.14 | ) | | | 12.90 | | | | (14.64 | ) | | | 6,776 | | | | 0.91 | | | | 0.91 | | | | 1.28 | | | | 30 | |
| (a) | Calculated using average shares outstanding. |
| (b) | Includes adjustments in accordance with accounting principles generally accepted in the United States of America and as such, the net asset value for financial reporting purposes and the returns based upon those net asset values may differ from the net asset value and returns for shareholder transactions. Does not include sales charges and is not annualized for periods less than one year, if applicable. |
| (c) | Portfolio turnover is calculated at the fund level and is not annualized for periods less than one year, if applicable. |
See accompanying Notes to Financial Statements which are an integral part of the financial statements.
| | |
| 12 | | Invesco Global Core Equity Fund |
Notes to Financial Statements
December 31, 2022
NOTE 1–Significant Accounting Policies
Invesco Global Core Equity Fund (the “Fund”) is a series portfolio of AIM Funds Group (Invesco Funds Group) (the “Trust”). The Trust is a Delaware statutory trust registered under the Investment Company Act of 1940, as amended (the “1940 Act”), as an open-end series management investment company authorized to issue an unlimited number of shares of beneficial interest. Information presented in these financial statements pertains only to the Fund. Matters affecting the Fund or each class will be voted on exclusively by the shareholders of the Fund or each class.
The Fund’s investment objective is long-term growth of capital.
The Fund currently consists of six different classes of shares: Class A, Class C, Class R, Class Y, Class R5 and Class R6. Class Y shares are available only to certain investors. Class A shares are sold with a front-end sales charge unless certain waiver criteria are met. Under certain circumstances, load waived shares may be subject to contingent deferred sales charges (“CDSC”). Class C shares are sold with a CDSC. Class R, Class Y, Class R5 and Class R6 shares are sold at net asset value. Class C shares held for eight years after purchase are eligible for automatic conversion into Class A shares of the same Fund (the “Conversion Feature”). The automatic conversion pursuant to the Conversion Feature will generally occur at the end of the month following the eighth anniversary after a purchase of Class C shares.
The Fund is an investment company and accordingly follows the investment company accounting and reporting guidance in accordance with Financial Accounting Standards Board Accounting Standards Codification Topic 946, Financial Services – Investment Companies.
The following is a summary of the significant accounting policies followed by the Fund in the preparation of its financial statements.
| A. | Security Valuations – Securities, including restricted securities, are valued according to the following policy. |
A security listed or traded on an exchange is generally valued at its trade price or official closing price that day as of the close of the exchange where the security is principally traded, or lacking any trades or official closing price on a particular day, the security may be valued at the closing bid price on that day. Securities traded in the over-the-counter market are valued based on prices furnished by independent pricing services or market makers. When such securities are valued using prices provided by an independent pricing service they may be considered fair valued. Futures contracts are valued at the daily settlement price set by an exchange on which they are principally traded. U.S. exchange-traded options are valued at the mean between the last bid and asked prices from the exchange on which they are principally traded. Non-U.S. exchange-traded options are valued at the final settlement price set by the exchange on which they trade. Options not listed on an exchange and swaps generally are valued using pricing provided from independent pricing services.
Securities of investment companies that are not exchange-traded (e.g., open-end mutual funds) are valued using such company’s end-of-business-day net asset value per share.
Deposits, other obligations of U.S. and non-U.S. banks and financial institutions are valued at their daily account value.
Fixed income securities (including convertible debt securities) generally are valued on the basis of prices provided by independent pricing services. Prices provided by the pricing service may be determined without exclusive reliance on quoted prices, and may reflect appropriate factors such as institution-size trading in similar groups of securities, developments related to specific securities, dividend rate (for unlisted equities), yield (for debt obligations), quality, type of issue, coupon rate (for debt obligations), maturity (for debt obligations), individual trading characteristics and other market data. Pricing services generally value debt obligations assuming orderly transactions of institutional round lot size, but a fund may hold or transact in the same securities in smaller, odd lot sizes. Odd lots often trade at lower prices than institutional round lots, and their value may be adjusted accordingly. Debt obligations are subject to interest rate and credit risks. In addition, all debt obligations involve some risk of default with respect to interest and/or principal payments.
Foreign securities’ (including foreign exchange contracts) prices are converted into U.S. dollar amounts using the applicable exchange rates as of the close of the New York Stock Exchange (“NYSE”). If market quotations are available and reliable for foreign exchange-traded equity securities, the securities will be valued at the market quotations. Invesco Advisers, Inc. (the “Adviser” or “Invesco”) may use various pricing services to obtain market quotations as well as fair value prices. Because trading hours for certain foreign securities end before the close of the NYSE, closing market quotations may become not representative of market value in the Adviser’s judgment (“unreliable”). If, between the time trading ends on a particular security and the close of the customary trading session on the NYSE, a significant event occurs that makes the closing price of the security unreliable, the Adviser may fair value the security. If the event is likely to have affected the closing price of the security, the security will be valued at fair value in good faith in accordance with Board- approved policies and related Adviser procedures (“Valuation Procedures”). Adjustments to closing prices to reflect fair value may also be based on a screening process of an independent pricing service to indicate the degree of certainty, based on historical data, that the closing price in the principal market where a foreign security trades is not the current value as of the close of the NYSE. Foreign securities’ prices meeting the degree of certainty that the price is not reflective of current value will be priced at the indication of fair value from the independent pricing service. Multiple factors may be considered by the independent pricing service in determining adjustments to reflect fair value and may include information relating to sector indices, American Depositary Receipts and domestic and foreign index futures. Foreign securities may have additional risks including exchange rate changes, potential for sharply devalued currencies and high inflation, political and economic upheaval, the relative lack of issuer information, relatively low market liquidity and the potential lack of strict financial and accounting controls and standards.
Unlisted securities will be valued using prices provided by independent pricing services or by another method that the Adviser, in its judgment, believes better reflects the security’s fair value in accordance with the Valuation Procedures.
Securities for which market prices are not provided by any of the above methods may be valued based upon quotes furnished by independent sources. The last bid price may be used to value equity securities. The mean between the last bid and asked prices may be used to value debt obligations, including corporate loans.
Securities for which market quotations are not readily available are fair valued by the Adviser in accordance with the Valuation Procedures. If a fair value price provided by a pricing service is unreliable, the Adviser will fair value the security using the Valuation Procedures. Issuer specific events, market trends, bid/asked quotes of brokers and information providers and other market data may be reviewed in the course of making a good faith determination of a security’s fair value.
The Fund may invest in securities that are subject to interest rate risk, meaning the risk that the prices will generally fall as interest rates rise and, conversely, the prices will generally rise as interest rates fall. Specific securities differ in their sensitivity to changes in interest rates depending on their individual characteristics. Changes in interest rates may result in increased market volatility, which may affect the value and/or liquidity of certain Fund investments.
Valuations change in response to many factors including the historical and prospective earnings of the issuer, the value of the issuer’s assets, general market conditions which are not specifically related to the particular issuer, such as real or perceived adverse economic conditions, changes in the general outlook for revenues or corporate earnings, changes in interest or currency rates, regional or global instability, natural or environmental disasters, widespread disease or other public health issues, war, acts of terrorism, significant governmental actions or adverse investor sentiment generally and market liquidity. Because of the inherent uncertainties of valuation, the values reflected in the financial statements may materially differ from the value received upon actual sale of those investments.
The price the Fund could receive upon the sale of any investment may differ from the Adviser’s valuation of the investment, particularly for securities that are valued using a fair valuation technique. When fair valuation techniques are applied, the Adviser uses available information, including both observable and unobservable inputs and assumptions, to determine a methodology that will result in a valuation that the Adviser believes approximates market value. Fund securities that are fair valued may be subject to greater fluctuation in their value from one day to the next than would be the case if market quotations were used. Because of the inherent uncertainties of valuation, and the degree of subjectivity in such decisions, the Fund could realize a greater or lesser than expected gain or loss upon the sale of the investment.
| | |
| 13 | | Invesco Global Core Equity Fund |
| B. | Securities Transactions and Investment Income – Securities transactions are accounted for on a trade date basis. Realized gains or losses on sales are computed on the basis of specific identification of the securities sold. Interest income (net of withholding tax, if any) is recorded on an accrual basis from settlement date and includes coupon interest and amortization of premium and accretion of discount on debt securities as applicable. Dividend income (net of withholding tax, if any) is recorded on the ex-dividend date. |
The Fund may periodically participate in litigation related to Fund investments. As such, the Fund may receive proceeds from litigation settlements.Any proceeds received are included in the Statement of Operations as realized gain (loss) for investments no longer held and as unrealized gain (loss) for investments still held.
Brokerage commissions and mark ups are considered transaction costs and are recorded as an increase to the cost basis of securities purchased and/or a reduction of proceeds on a sale of securities. Such transaction costs are included in the determination of net realized and unrealized gain (loss) from investment securities reported in the Statement of Operations and the Statement of Changes in Net Assets and the net realized and unrealized gains (losses) on securities per share in the Financial Highlights. Transaction costs are included in the calculation of the Fund’s net asset value and, accordingly, they reduce the Fund’s total returns. These transaction costs are not considered operating expenses and are not reflected in net investment income reported in the Statement of Operations and the Statement of Changes in Net Assets, or the net investment income per share and the ratios of expenses and net investment income reported in the Financial Highlights, nor are they limited by any expense limitation arrangements between the Fund and the investment adviser.
The Fund allocates income and realized and unrealized capital gains and losses to a class based on the relative net assets of each class.
| C. | Country Determination – For the purposes of making investment selection decisions and presentation in the Schedule of Investments, the investment adviser may determine the country in which an issuer is located and/or credit risk exposure based on various factors. These factors include the laws of the country under which the issuer is organized, where the issuer maintains a principal office, the country in which the issuer derives 50% or more of its total revenues, the country that has the primary market for the issuer’s securities and its “country of risk” as determined by a third party service provider, as well as other criteria. Among the other criteria that may be evaluated for making this determination are the country in which the issuer maintains 50% or more of its assets, the type of security, financial guarantees and enhancements, the nature of the collateral and the sponsor organization. Country of issuer and/or credit risk exposure has been determined to be the United States of America, unless otherwise noted. |
| D. | Distributions – Distributions from net investment income and net realized capital gain, if any, are generally declared and paid annually and recorded on the ex-dividend date. The Fund may elect to treat a portion of the proceeds from redemptions as distributions for federal income tax purposes. |
| E. | Federal Income Taxes – The Fund intends to comply with the requirements of Subchapter M of the Internal Revenue Code of 1986, as amended (the “Internal Revenue Code”), necessary to qualify as a regulated investment company and to distribute substantially all of the Fund’s taxable earnings to shareholders. As such, the Fund will not be subject to federal income taxes on otherwise taxable income (including net realized capital gain) that is distributed to shareholders. Therefore, no provision for federal income taxes is recorded in the financial statements. |
The Fund recognizes the tax benefits of uncertain tax positions only when the position is more likely than not to be sustained. Management has analyzed the Fund’s uncertain tax positions and concluded that no liability for unrecognized tax benefits should be recorded related to uncertain tax positions. Management is not aware of any tax positions for which it is reasonably possible that the total amounts of unrecognized tax benefits will change materially in the next 12 months.
The Fund files tax returns in the U.S. Federal jurisdiction and certain other jurisdictions. Generally, the Fund is subject to examinations by such taxing authorities for up to three years after the filing of the return for the tax period.
| F. | Expenses – Fees provided for under the Rule 12b-1 plan of a particular class of the Fund are charged to the operations of such class. Transfer agency fees and expenses and other shareholder recordkeeping fees and expenses attributable to Class R5 and Class R6 are allocated based on relative net assets of Class R5 and Class R6. Sub-accounting fees attributable to Class R5 are charged to the operations of the class. Transfer agency fees and expenses and other shareholder recordkeeping fees and expenses relating to all other classes are allocated among those classes based on relative net assets. All other expenses are allocated among the classes based on relative net assets. |
| G. | Accounting Estimates – The preparation of financial statements in conformity with accounting principles generally accepted in the United States of America (“GAAP”) requires management to make estimates and assumptions that affect the reported amounts of assets and liabilities at the date of the financial statements and the reported amounts of revenues and expenses during the reporting period including estimates and assumptions related to taxation. Actual results could differ from those estimates by a significant amount. In addition, the Fund monitors for material events or transactions that may occur or become known after the period-end date and before the date the financial statements are released to print. |
| H. | Indemnifications – Under the Trust’s organizational documents, each Trustee, officer, employee or other agent of the Trust is indemnified against certain liabilities that may arise out of the performance of their duties to the Fund. Additionally, in the normal course of business, the Fund enters into contracts, including the Fund’s servicing agreements, that contain a variety of indemnification clauses. The Fund’s maximum exposure under these arrangements is unknown as this would involve future claims that may be made against the Fund that have not yet occurred. The risk of material loss as a result of such indemnification claims is considered remote. |
| I. | Securities Lending – The Fund may lend portfolio securities having a market value up to one-third of the Fund’s total assets. Such loans are secured by collateral equal to no less than the market value of the loaned securities determined daily by the securities lending provider. Such collateral will be cash or debt securities issued or guaranteed by the U.S. Government or any of its sponsored agencies. Cash collateral received in connection with these loans is invested in short-term money market instruments or affiliated, unregistered investment companies that comply with Rule 2a-7 under the 1940 Act and money market funds (collectively, “affiliated money market funds”) and is shown as such on the Schedule of Investments. The Fund bears the risk of loss with respect to the investment of collateral. It is the Fund’s policy to obtain additional collateral from or return excess collateral to the borrower by the end of the next business day, following the valuation date of the securities loaned. Therefore, the value of the collateral held may be temporarily less than the value of the securities on loan. When loaning securities, the Fund retains certain benefits of owning the securities, including the economic equivalent of dividends or interest generated by the security. Lending securities entails a risk of loss to the Fund if, and to the extent that, the market value of the securities loaned were to increase and the borrower did not increase the collateral accordingly, and the borrower failed to return the securities. The securities loaned are subject to termination at the option of the borrower or the Fund. Upon termination, the borrower will return to the Fund the securities loaned and the Fund will return the collateral. Upon the failure of the borrower to return the securities, collateral may be liquidated and the securities may be purchased on the open market to replace the loaned securities. The Fund could experience delays and costs in gaining access to the collateral and the securities may lose value during the delay which could result in potential losses to the Fund. Some of these losses may be indemnified by the lending agent. The Fund bears the risk of any deficiency in the amount of the collateral available for return to the borrower due to any loss on the collateral invested. Dividends received on cash collateral investments for securities lending transactions, which are net of compensation to counterparties, are included in Dividends from affiliated money market funds on the Statement of Operations. The aggregate value of securities out on loan, if any, is shown as a footnote on the Statement of Assets and Liabilities. |
The Adviser serves as an affiliated securities lending agent for the Fund. The Bank of New York Mellon also serves as a lending agent. To the extent the Fund utilizes the Adviser as an affiliated securities lending agent, the Fund conducts its securities lending in accordance with, and in reliance upon, no-action letters issued by the SEC staff that provide guidance on how an affiliate may act as a direct agent lender and receive compensation for those services in a manner consistent with the federal securities laws. For the year ended December 31, 2022, the Fund paid the Adviser $5,708 in fees for securities lending agent services. Fees paid to the Adviser for securities lending agent services, if any, are included in Dividends from affiliated money market funds on the Statement of Operations.
| J. | Foreign Currency Translations – Foreign currency is valued at the close of the NYSE based on quotations posted by banks and major currency dealers. |
| | |
| 14 | | Invesco Global Core Equity Fund |
Portfolio securities and other assets and liabilities denominated in foreign currencies are translated into U.S. dollar amounts at the date of valuation. Purchases and sales of portfolio securities (net of foreign taxes withheld on disposition) and income items denominated in foreign currencies are translated into U.S. dollar amounts on the respective dates of such transactions. The Fund does not separately account for the portion of the results of operations resulting from changes in foreign exchange rates on investments and the fluctuations arising from changes in market prices of securities held. The combined results of changes in foreign exchange rates and the fluctuation of market prices on investments (net of estimated foreign tax withholding) are included with the net realized and unrealized gain or loss from investments in the Statement of Operations. Reported net realized foreign currency gains or losses arise from (1) sales of foreign currencies, (2) currency gains or losses realized between the trade and settlement dates on securities transactions, and (3) the difference between the amounts of dividends, interest, and foreign withholding taxes recorded on the Fund’s books and the U.S. dollar equivalent of the amounts actually received or paid. Net unrealized foreign currency gains and losses arise from changes in the fair values of assets and liabilities, other than investments in securities at fiscal period end, resulting from changes in exchange rates.
The Fund may invest in foreign securities, which may be subject to foreign taxes on income, gains on investments or currency repatriation, a portion of which may be recoverable. Foreign taxes, if any, are recorded based on the tax regulations and rates that exist in the foreign markets in which the Fund invests and are shown in the Statement of Operations.
| K. | Forward Foreign Currency Contracts – The Fund may engage in foreign currency transactions either on a spot (i.e. for prompt delivery and settlement) basis, or through forward foreign currency contracts, to manage or minimize currency or exchange rate risk. |
The Fund may also enter into forward foreign currency contracts for the purchase or sale of a security denominated in a foreign currency in order to “lock in” the U.S. dollar price of that security, or the Fund may also enter into forward foreign currency contracts that do not provide for physical exchange of the two currencies on the settlement date, but instead are settled by a single cash payment calculated as the difference between the agreed upon exchange rate and the spot rate at settlement based upon an agreed upon notional amount (non-deliverable forwards).
A forward foreign currency contract is an obligation between two parties (“Counterparties”) to purchase or sell a specific currency for an agreed-upon price at a future date. The use of forward foreign currency contracts for hedging does not eliminate fluctuations in the price of the underlying securities the Fund owns or intends to acquire but establishes a rate of exchange in advance. Fluctuations in the value of these contracts are measured by the difference in the contract date and reporting date exchange rates and are recorded as unrealized appreciation (depreciation) until the contracts are closed. When the contracts are closed, realized gains (losses) are recorded. Realized and unrealized gains (losses) on the contracts are included in the Statement of Operations. The primary risks associated with forward foreign currency contracts include failure of the Counterparty to meet the terms of the contract and the value of the foreign currency changing unfavorably. These risks may be in excess of the amounts reflected in the Statement of Assets and Liabilities.
| L. | COVID-19 Risk – The COVID-19 strain of coronavirus has resulted in instances of market closures and dislocations, extreme volatility, liquidity constraints and increased trading costs. Efforts to contain its spread have resulted in travel restrictions, disruptions of healthcare systems, business operations (including business closures) and supply chains, layoffs, lower consumer demand and employee availability, and defaults and credit downgrades, among other significant economic impacts that have disrupted global economic activity across many industries. Such economic impacts may exacerbate other pre-existing political, social and economic risks locally or globally and cause general concern and uncertainty. The full economic impact and ongoing effects of COVID-19 (or other future epidemics or pandemics) at the macro-level and on individual businesses are unpredictable and may result in significant and prolonged effects on the Fund’s performance. |
NOTE 2–Advisory Fees and Other Fees Paid to Affiliates
The Trust has entered into a master investment advisory agreement with the Adviser. Under the terms of the investment advisory agreement, the Fund accrues daily and pays monthly an advisory fee to the Adviser based on the annual rate of the Fund’s average daily net assets as follows:
| | | | |
| Average Daily Net Assets | | Rate | |
|
| |
First $250 million | | | 0.800% | |
|
| |
Next $250 million | | | 0.780% | |
|
| |
Next $500 million | | | 0.760% | |
|
| |
Next $1.5 billion | | | 0.740% | |
|
| |
Next $2.5 billion | | | 0.720% | |
|
| |
Next $2.5 billion | | | 0.700% | |
|
| |
Next $2.5 billion | | | 0.680% | |
|
| |
Over $10 billion | | | 0.660% | |
|
| |
For the year ended December 31, 2022, the effective advisory fee rate incurred by the Fund was 0.78%.
Under the terms of a master sub-advisory agreement between the Adviser and each of Invesco Asset Management Deutschland GmbH, Invesco Asset Management Limited, Invesco Asset Management (Japan) Limited, Invesco Hong Kong Limited, Invesco Senior Secured Management, Inc. and Invesco Canada Ltd. (collectively, the “Affiliated Sub-Advisers”) the Adviser, not the Fund, will pay 40% of the fees paid to the Adviser to any such Affiliated Sub-Adviser(s) that provide(s) discretionary investment management services to the Fund based on the percentage of assets allocated to such Affiliated Sub-Adviser(s).
The Adviser has contractually agreed, through at least April 30, 2024, to waive advisory fees and/or reimburse expenses of all shares to the extent necessary to limit total annual fund operating expenses after fee waiver and/or expense reimbursement (excluding certain items discussed below) of Class A, Class C, Class R, Class Y, Class R5 and Class R6 shares to 1.22%, 1.97%, 1.47%, 0.97%, 0.97% and 0.97%, respectively, of the Fund’s average daily net assets (the “expense limits”). In determining the Adviser’s obligation to waive advisory fees and/or reimburse expenses, the following expenses are not taken into account, and could cause the total annual fund operating expenses after fee waiver and/or expense reimbursement to exceed the numbers reflected above: (1) interest; (2) taxes; (3) dividend expense on short sales; (4) extraordinary or non-routine items, including litigation expenses; and (5) expenses that the Fund has incurred but did not actually pay because of an expense offset arrangement. Unless Invesco continues the fee waiver agreement, it will terminate on April 30, 2024. During its term, the fee waiver agreement cannot be terminated or amended to increase the expense limits or reduce the advisory fee waiver without approval of the Board of Trustees.
Further, the Adviser has contractually agreed, through at least June 30, 2024, to waive the advisory fee payable by the Fund in an amount equal to 100% of the net advisory fees the Adviser receives from the affiliated money market funds on investments by the Fund of uninvested cash (excluding investments of cash collateral from securities lending) in such affiliated money market funds.
For the year ended December 31, 2022, the Adviser waived advisory fees of $25,217 and reimbursed class level expenses of $235,906, $1,698, $618, $11,109, $0 and $0 of Class A, Class C, Class R, Class Y, Class R5 and Class R6 shares, respectively.
The Trust has entered into a master administrative services agreement with Invesco pursuant to which the Fund has agreed to pay Invesco for certain administrative costs incurred in providing accounting services to the Fund. For the year ended December 31, 2022, expenses incurred under the agreement are shown in the Statement of Operations as Administrative services fees. Invesco has entered into a sub-administration agreement whereby State Street Bank and Trust Company (“SSB”) serves as fund accountant and provides certain administrative services to the Fund. Pursuant to a custody agreement with the Trust on behalf of the Fund, SSB also serves as the Fund’s custodian.
| | |
| 15 | | Invesco Global Core Equity Fund |
The Trust has entered into a transfer agency and service agreement with Invesco Investment Services, Inc. (“IIS”) pursuant to which the Fund has agreed to pay IIS a fee for providing transfer agency and shareholder services to the Fund and reimburse IIS for certain expenses incurred by IIS in the course of providing such services. IIS may make payments to intermediaries that provide omnibus account services, sub-accounting services and/or networking services. All fees payable by IIS to intermediaries that provide omnibus account services or sub-accounting services are charged back to the Fund, subject to certain limitations approved by the Trust’s Board of Trustees. For the year ended December 31, 2022, expenses incurred under the agreement are shown in the Statement of Operations as Transfer agent fees.
The Trust has entered into master distribution agreements with Invesco Distributors, Inc. (“IDI”) to serve as the distributor for the Class A, Class C, Class R, Class Y, Class R5 and Class R6 shares of the Fund. The Trust has adopted plans pursuant to Rule 12b-1 under the 1940 Act with respect to the Fund’s Class A, Class C and Class R shares (collectively, the “Plans”). The Fund, pursuant to the Plans, pays IDI compensation at the annual rate of 0.25% of the Fund’s average daily net assets of Class A shares, 1.00% of the average daily net assets of Class C shares and 0.50% of the average daily net assets of Class R shares. The fees are accrued daily and paid monthly. Of the Plan payments, up to 0.25% of the average daily net assets of each class of shares may be paid to furnish continuing personal shareholder services to customers who purchase and own shares of such classes. Any amounts not paid as a service fee under the Plans would constitute an asset-based sales charge. Rules of the Financial Industry Regulatory Authority (“FINRA”) impose a cap on the total sales charges, including asset-based sales charges, that may be paid by any class of shares of the Fund. For the year ended December 31, 2022, expenses incurred under the Plans are shown in the Statement of Operations as Distribution fees.
Front-end sales commissions and CDSC (collectively, the “sales charges”) are not recorded as expenses of the Fund. Front-end sales commissions are deducted from proceeds from the sales of Fund shares prior to investment in Class A shares of the Fund. CDSC are deducted from redemption proceeds prior to remittance to the shareholder. During the year ended December 31, 2022, IDI advised the Fund that IDI retained $12,635 in front-end sales commissions from the sale of Class A shares and $252 and $642 from Class A and Class C shares, respectively, for CDSC imposed upon redemptions by shareholders.
For the year ended December 31, 2022, the Fund incurred $4,968 in brokerage commissions with Invesco Capital Markets, Inc., an affiliate of the Adviser and IDI, for portfolio transactions executed on behalf of the Fund.
Certain officers and trustees of the Trust are officers and directors of the Adviser, IIS and/or IDI.
NOTE 3–Additional Valuation Information
GAAP defines fair value as the price that would be received to sell an asset or paid to transfer a liability in an orderly transaction between market participants at the measurement date, under current market conditions. GAAP establishes a hierarchy that prioritizes the inputs to valuation methods, giving the highest priority to readily available unadjusted quoted prices in an active market for identical assets (Level 1) and the lowest priority to significant unobservable inputs (Level 3), generally when market prices are not readily available. Based on the valuation inputs, the securities or other investments are tiered into one of three levels. Changes in valuation methods may result in transfers in or out of an investment’s assigned level:
| | | | |
| | Level 1 – | | Prices are determined using quoted prices in an active market for identical assets. |
| | Level 2 – | | Prices are determined using other significant observable inputs. Observable inputs are inputs that other market participants may use in pricing a security. These may include quoted prices for similar securities, interest rates, prepayment speeds, credit risk, yield curves, loss severities, default rates, discount rates, volatilities and others. |
| | Level 3 – | | Prices are determined using significant unobservable inputs. In situations where quoted prices or observable inputs are unavailable (for example, when there is little or no market activity for an investment at the end of the period), unobservable inputs may be used. Unobservable inputs reflect the Adviser’s assumptions about the factors market participants would use in determining fair value of the securities or instruments and would be based on the best available information. |
The following is a summary of the tiered valuation input levels, as of December 31, 2022. The level assigned to the securities valuations may not be an indication of the risk or liquidity associated with investing in those securities. Because of the inherent uncertainties of valuation, the values reflected in the financial statements may materially differ from the value received upon actual sale of those investments.
| | | | | | | | | | | | | | | | |
| | | Level 1 | | | Level 2 | | | Level 3 | | | Total | |
|
| |
Investments in Securities | | | | | | | | | | | | | | | | |
|
| |
Belgium | | $ | 20,483,066 | | | $ | – | | | | $– | | | $ | 20,483,066 | |
|
| |
China | | | – | | | | 6,237,360 | | | | – | | | | 6,237,360 | |
|
| |
Finland | | | – | | | | 12,973,132 | | | | – | | | | 12,973,132 | |
|
| |
France | | | – | | | | 16,026,827 | | | | – | | | | 16,026,827 | |
|
| |
Germany | | | – | | | | 41,380,936 | | | | – | | | | 41,380,936 | |
|
| |
Hong Kong | | | – | | | | 21,635,192 | | | | – | | | | 21,635,192 | |
|
| |
Japan | | | – | | | | 5,611,617 | | | | – | | | | 5,611,617 | |
|
| |
Netherlands | | | 14,049,936 | | | | – | | | | – | | | | 14,049,936 | |
|
| |
Switzerland | | | 360,543 | | | | 19,399,924 | | | | – | | | | 19,760,467 | |
|
| |
United Kingdom | | | – | | | | 60,429,523 | | | | – | | | | 60,429,523 | |
|
| |
United States | | | 259,784,213 | | | | 16,204,912 | | | | – | | | | 275,989,125 | |
|
| |
Money Market Funds | | | 25,726,139 | | | | 37,030,219 | | | | – | | | | 62,756,358 | |
|
| |
Total Investments | | $ | 320,403,897 | | | $ | 236,929,642 | | | | $– | | | $ | 557,333,539 | |
|
| |
NOTE 4–Expense Offset Arrangement(s)
The expense offset arrangement is comprised of transfer agency credits which result from balances in demand deposit accounts used by the transfer agent for clearing shareholder transactions. For the year ended December 31, 2022, the Fund received credits from this arrangement, which resulted in the reduction of the Fund’s total expenses of $4,092.
NOTE 5–Trustees’ and Officers’ Fees and Benefits
Trustees’ and Officers’ Fees and Benefits include amounts accrued by the Fund to pay remuneration to certain Trustees and Officers of the Fund. Trustees have the option to defer compensation payable by the Fund, and Trustees’ and Officers’ Fees and Benefits also include amounts accrued by the Fund to fund such deferred compensation amounts. Those Trustees who defer compensation have the option to select various Invesco Funds in which their deferral accounts shall be deemed to be invested. Finally, certain current Trustees were eligible to participate in a retirement plan that provided for benefits to be paid upon retirement to Trustees over a period of time based on the number of years of service. The Fund may have certain former Trustees who also participate in a retirement plan and receive benefits under
| | |
| 16 | | Invesco Global Core Equity Fund |
such plan. Trustees’ and Officers’ Fees and Benefits include amounts accrued by the Fund to fund such retirement benefits. Obligations under the deferred compensation and retirement plans represent unsecured claims against the general assets of the Fund.
NOTE 6–Cash Balances
The Fund is permitted to temporarily carry a negative or overdrawn balance in its account with SSB, the custodian bank. Such balances, if any at period-end, are shown in the Statement of Assets and Liabilities under the payable caption Amount due custodian. To compensate the custodian bank for such overdrafts, the overdrawn Fund may either (1) leave funds as a compensating balance in the account so the custodian bank can be compensated by earning the additional interest; or (2) compensate by paying the custodian bank at a rate agreed upon by the custodian bank and Invesco, not to exceed the contractually agreed upon rate. The Fund may not purchase additional securities when any borrowings from banks or broker-dealers exceed 5% of the Fund’s total assets, or when any borrowings from an Invesco Fund are outstanding.
NOTE 7–Distributions to Shareholders and Tax Components of Net Assets
Tax Character of Distributions to Shareholders Paid During the Fiscal Years Ended December 31, 2022 and 2021:
| | | | | | | | | | | | |
| | | 2022 | | | | | | 2021 | |
|
| |
Ordinary income* | | $ | 1,889,631 | | | | | | | $ | 32,061,147 | |
|
| |
Long-term capital gain | | | 15,095,755 | | | | | | | | 7,466,957 | |
|
| |
Total distributions | | $ | 16,985,386 | | | | | | | $ | 39,528,104 | |
|
| |
| * | Includes short-term capital gain distributions, if any. |
Tax Components of Net Assets at Period-End:
| | | | |
| | | 2022 | |
|
| |
Undistributed ordinary income | | $ | 1,680,312 | |
|
| |
Net unrealized appreciation (depreciation) – investments | | | (19,710,901 | ) |
|
| |
Net unrealized appreciation (depreciation) – foreign currencies | | | (21,261 | ) |
|
| |
Temporary book/tax differences | | | (141,541 | ) |
|
| |
Capital loss carryforward | | | (1,563,833 | ) |
|
| |
Shares of beneficial interest | | | 547,379,318 | |
|
| |
Total net assets | | $ | 527,622,094 | |
|
| |
The difference between book-basis and tax-basis unrealized appreciation (depreciation) is due to differences in the timing of recognition of gains and losses on investments for tax and book purposes. The Fund’s net unrealized appreciation (depreciation) difference is attributable primarily to wash sales.
The temporary book/tax differences are a result of timing differences between book and tax recognition of income and/or expenses. The Fund’s temporary book/tax differences are the result of the trustee deferral of compensation and retirement plan benefits.
Capital loss carryforward is calculated and reported as of a specific date. Results of transactions and other activity after that date may affect the amount of capital loss carryforward actually available for the Fund to utilize. The ability to utilize capital loss carryforward in the future may be limited under the Internal Revenue Code and related regulations based on the results of future transactions.
The Fund has a capital loss carryforward as of December 31, 2022, as follows:
| | | | | | | | | | | | |
Capital Loss Carryforward* | |
|
| |
Expiration | | | | | Short-Term | | | Long-Term | | | Total | |
|
| |
Not subject to expiration | | | | | $1,563,833 | | | $– | | $ | 1,563,833 | |
|
| |
| * | Capital loss carryforward is reduced for limitations, if any, to the extent required by the Internal Revenue Code and may be further limited depending upon a variety of factors, including the realization of net unrealized gains or losses as of the date of any reorganization. |
NOTE 8–Investment Transactions
The aggregate amount of investment securities (other than short-term securities, U.S. Government obligations and money market funds, if any) purchased and sold by the Fund during the year ended December 31, 2022 was $64,539,581 and $129,427,206, respectively. Cost of investments, including any derivatives, on a tax basis includes the adjustments for financial reporting purposes as of the most recently completed federal income tax reporting period-end.
| | | | |
Unrealized Appreciation (Depreciation) of Investments on a Tax Basis | |
Aggregate unrealized appreciation of investments | | $ | 46,234,563 | |
|
| |
| |
Aggregate unrealized (depreciation) of investments | | | (65,945,464 | ) |
|
| |
| |
Net unrealized appreciation (depreciation) of investments | | $ | (19,710,901 | ) |
|
| |
Cost of investments for tax purposes is $577,044,440.
NOTE 9–Reclassification of Permanent Differences
Primarily as a result of differing book/tax treatment of foreign currency transactions and distributions, on December 31, 2022, undistributed net investment income was decreased by $133,930 and undistributed net realized gain (loss) was increased by $133,930. This reclassification had no effect on the net assets or the distributable earnings (loss) of the Fund.
| | |
| 17 | | Invesco Global Core Equity Fund |
NOTE 10–Share Information
| | | | | | | | | | | | | | | | |
| | | Summary of Share Activity | |
|
| |
| | | Year ended | | | Year ended | |
| | | December 31, 2022(a) | | | December 31, 2021 | |
| | | Shares | | | Amount | | | Shares | | | Amount | |
|
| |
Sold: | | | | | | | | | | | | | | | | |
Class A | | | 445,928 | | | $ | 5,911,040 | | | | 575,956 | | | $ | 9,190,343 | |
|
| |
Class C | | | 51,160 | | | | 625,875 | | | | 52,990 | | | | 783,831 | |
|
| |
Class R | | | 24,492 | | | | 322,326 | | | | 24,226 | | | | 391,875 | |
|
| |
Class Y | | | 347,245 | | | | 4,615,673 | | | | 401,585 | | | | 6,398,176 | |
|
| |
Class R5 | | | 10,280 | | | | 138,545 | | | | 6,058 | | | | 99,533 | |
|
| |
Class R6 | | | 41,717 | | | | 571,050 | | | | 83,651 | | | | 1,383,845 | |
|
| |
| | | | |
Issued as reinvestment of dividends: | | | | | | | | | | | | | | | | |
Class A | | | 1,195,268 | | | | 14,414,935 | | | | 2,144,820 | | | | 33,609,210 | |
|
| |
Class C | | | 10,109 | | | | 112,815 | | | | 17,030 | | | | 249,146 | |
|
| |
Class R | | | 3,551 | | | | 42,683 | | | | 5,309 | | | | 83,037 | |
|
| |
Class Y | | | 52,332 | | | | 632,167 | | | | 94,893 | | | | 1,489,825 | |
|
| |
Class R5 | | | 2,399 | | | | 29,557 | | | | 3,613 | | | | 57,844 | |
|
| |
Class R6 | | | 14,062 | | | | 173,384 | | | | 22,130 | | | | 354,526 | |
|
| |
| | | | |
Automatic conversion of Class C shares to Class A shares: | | | | | | | | | | | | | | | | |
Class A | | | 37,843 | | | | 502,499 | | | | 67,125 | | | | 1,069,812 | |
|
| |
Class C | | | (40,678 | ) | | | (502,499 | ) | | | (71,970 | ) | | | (1,069,812 | ) |
|
| |
| | | | |
Reacquired: | | | | | | | | | | | | | | | | |
Class A | | | (5,491,960 | ) | | | (72,187,807 | ) | | | (4,966,058 | ) | | | (79,467,520 | ) |
|
| |
Class C | | | (96,648 | ) | | | (1,190,824 | ) | | | (73,084 | ) | | | (1,082,808 | ) |
|
| |
Class R | | | (19,628 | ) | | | (267,163 | ) | | | (47,798 | ) | | | (768,941 | ) |
|
| |
Class Y | | | (749,072 | ) | | | (9,796,284 | ) | | | (562,566 | ) | | | (8,980,220 | ) |
|
| |
Class R5 | | | (11,844 | ) | | | (164,713 | ) | | | (8,311 | ) | | | (136,294 | ) |
|
| |
Class R6 | | | (71,938 | ) | | | (980,691 | ) | | | (121,739 | ) | | | (2,005,980 | ) |
|
| |
Net increase (decrease) in share activity | | | (4,245,382 | ) | | | $(56,997,432 | ) | | | (2,352,140 | ) | | | $(38,350,572 | ) |
|
| |
| (a) | There are entities that are record owners of more than 5% of the outstanding shares of the Fund and in the aggregate own 54% of the outstanding shares of the Fund. IDI has an agreement with these entities to sell Fund shares. The Fund, Invesco and/or Invesco affiliates may make payments to these entities, which are considered to be related to the Fund, for providing services to the Fund, Invesco and/or Invesco affiliates including but not limited to services such as securities brokerage, distribution, third party record keeping and account servicing. The Fund has no knowledge as to whether all or any portion of the shares owned of record by these entities are also owned beneficially. |
| | |
| 18 | | Invesco Global Core Equity Fund |
Report of Independent Registered Public Accounting Firm
To the Board of Trustees of AIM Funds Group (Invesco Funds Group) and Shareholders of Invesco Global Core Equity Fund
Opinion on the Financial Statements
We have audited the accompanying statement of assets and liabilities, including the schedule of investments, of Invesco Global Core Equity Fund (one of the funds constituting AIM Funds Group (Invesco Funds Group), referred to hereafter as the “Fund”) as of December 31, 2022, the related statement of operations for the year ended December 31, 2022, the statement of changes in net assets for each of the two years in the period ended December 31, 2022, including the related notes, and the financial highlights for each of the five years in the period ended December 31, 2022 (collectively referred to as the “financial statements”). In our opinion, the financial statements present fairly, in all material respects, the financial position of the Fund as of December 31, 2022, the results of its operations for the year then ended, the changes in its net assets for each of the two years in the period ended December 31, 2022 and the financial highlights for each of the five years in the period ended December 31, 2022 in conformity with accounting principles generally accepted in the United States of America.
Basis for Opinion
These financial statements are the responsibility of the Fund’s management. Our responsibility is to express an opinion on the Fund’s financial statements based on our audits. We are a public accounting firm registered with the Public Company Accounting Oversight Board (United States) (PCAOB) and are required to be independent with respect to the Fund in accordance with the U.S. federal securities laws and the applicable rules and regulations of the Securities and Exchange Commission and the PCAOB.
We conducted our audits of these financial statements in accordance with the standards of the PCAOB. Those standards require that we plan and perform the audit to obtain reasonable assurance about whether the financial statements are free of material misstatement, whether due to error or fraud.
Our audits included performing procedures to assess the risks of material misstatement of the financial statements, whether due to error or fraud, and performing procedures that respond to those risks. Such procedures included examining, on a test basis, evidence regarding the amounts and disclosures in the financial statements. Our audits also included evaluating the accounting principles used and significant estimates made by management, as well as evaluating the overall presentation of the financial statements. Our procedures included confirmation of securities owned as of December 31, 2022 by correspondence with the custodian, transfer agent and broker; when replies were not received from the broker, we performed other auditing procedures. We believe that our audits provide a reasonable basis for our opinion.
/s/PricewaterhouseCoopers LLP
Houston, Texas
February 22, 2023
We have served as the auditor of one or more of the investment companies in the Invesco group of investment companies since at least 1995. We have not been able to determine the specific year we began serving as auditor.
| | |
| 19 | | Invesco Global Core Equity Fund |
Calculating your ongoing Fund expenses
Example
As a shareholder of the Fund, you incur two types of costs: (1) transaction costs, which may include sales charges (loads) on purchase payments or contingent deferred sales charges on redemptions, if any; and (2) ongoing costs, including management fees, distribution and/or service (12b-1) fees, and other Fund expenses. This example is intended to help you understand your ongoing costs (in dollars) of investing in the Fund and to compare these costs with ongoing costs of investing in other mutual funds. The example is based on an investment of $1,000 invested at the beginning of the period and held for the entire period July 1, 2022 through December 31, 2022.
Actual expenses
The table below provides information about actual account values and actual expenses. You may use the information in this table, together with the amount you invested, to estimate the expenses that you paid over the period. Simply divide your account value by $1,000 (for example, an $8,600 account value divided by $1,000 = 8.6), then multiply the result by the number in the table under the heading entitled “Actual Expenses Paid During Period” to estimate the expenses you paid on your account during this period.
Hypothetical example for comparison purposes
The table below also provides information about hypothetical account values and hypothetical expenses based on the Fund’s actual expense ratio and an assumed rate of return of 5% per year before expenses, which is not the Fund’s actual return.
The hypothetical account values and expenses may not be used to estimate the actual ending account balance or expenses you paid for the period. You may use this information to compare the ongoing costs of investing in the Fund and other funds. To do so, compare this 5% hypothetical example with the 5% hypothetical examples that appear in the shareholder reports of the other funds.
Please note that the expenses shown in the table are meant to highlight your ongoing costs only and do not reflect any transaction costs, such as sales charges (loads) on purchase payments or contingent deferred sales charges on redemptions, if any. Therefore, the hypothetical information is useful in comparing ongoing costs only, and will not help you determine the relative total costs of owning different funds. In addition, if these transaction costs were included, your costs would have been higher.
| | | | | | | | | | | | |
| | | | | ACTUAL | | HYPOTHETICAL
(5% annual return before expenses) | | |
| | | Beginning
Account Value
(07/01/22) | | Ending
Account Value
(12/31/22)1 | | Expenses
Paid During
Period2 | | Ending
Account Value
(12/31/22) | | Expenses
Paid During
Period2 | | Annualized
Expense Ratio |
Class A | | $1,000.00 | | $977.50 | | $6.08 | | $1,019.06 | | $6.21 | | 1.22% |
Class C | | 1,000.00 | | 973.70 | | 9.80 | | 1,015.27 | | 10.01 | | 1.97 |
Class R | | 1,000.00 | | 975.40 | | 7.32 | | 1,017.80 | | 7.48 | | 1.47 |
Class Y | | 1,000.00 | | 978.80 | | 4.84 | | 1,020.32 | | 4.94 | | 0.97 |
Class R5 | | 1,000.00 | | 978.20 | | 4.74 | | 1,020.42 | | 4.84 | | 0.95 |
Class R6 | | 1,000.00 | | 978.30 | | 4.39 | | 1,020.77 | | 4.48 | | 0.88 |
| 1 | The actual ending account value is based on the actual total return of the Fund for the period July 1, 2022 through December 31, 2022, after actual expenses and will differ from the hypothetical ending account value which is based on the Fund’s expense ratio and a hypothetical annual return of 5% before expenses. |
| 2 | Expenses are equal to the Fund’s annualized expense ratio as indicated above multiplied by the average account value over the period, multiplied by 184/365 to reflect the most recent fiscal half year. |
| | |
| 20 | | Invesco Global Core Equity Fund |
Tax Information
Form 1099-DIV, Form 1042-S and other year–end tax information provide shareholders with actual calendar year amounts that should be included in their tax returns. Shareholders should consult their tax advisers.
The following distribution information is being provided as required by the Internal Revenue Code or to meet a specific state’s requirement.
The Fund designates the following amounts or, if subsequently determined to be different, the maximum amount allowable for its fiscal year ended December 31, 2022:
| | | | | | | | |
Federal and State Income Tax | | | | | | |
Long-Term Capital Gain Distributions | | | $15,095,755 | | | | | |
Qualified Dividend Income* | | | 36.46 | % | | | | |
Corporate Dividends Received Deduction* | | | 15.53 | % | | | | |
U.S. Treasury Obligations* | | | 0.00 | % | | | | |
Qualified Business Income* | | | 0.00 | % | | | | |
Business Interest Income* | | | 0.00 | % | | | | |
|
| * The above percentages are based on ordinary income dividends paid to shareholders during the Fund’s fiscal year. | |
| | | | | | | | |
Non-Resident Alien Shareholders | | | | | | |
Short-Term Capital Gain Distributions | | | $1,426,925 | | | | | |
| | |
| 21 | | Invesco Global Core Equity Fund |
Trustees and Officers
The address of each trustee and officer is AIM Funds Group (Invesco Funds Group) (the “Trust”), 11 Greenway Plaza, Suite 1000, Houston, Texas 77046-1173. The trustees serve for the life of the Trust, subject to their earlier death, incapacitation, resignation, retirement or removal as more specifically provided in the Trust’s organizational documents. Each officer serves for a one year term or until their successors are elected and qualified. Column two below includes length of time served with predecessor entities, if any.
| | | | | | | | |
Name, Year of Birth and
Position(s)
Held with the Trust | | Trustee and/or Officer Since | | Principal Occupation(s) During Past 5 Years | | Number of
Funds in
Fund Complex
Overseen by
Trustee | | Other Directorship(s) Held by Trustee During Past 5 Years |
| Interested Trustee |
| Martin L. Flanagan1 – 1960 Trustee and Vice Chair | | 2007 | | Executive Director, Chief Executive Officer and President, Invesco Ltd. (ultimate parent of Invesco and a global investment management firm); Trustee and Vice Chair, The Invesco Funds; Vice Chair, Investment Company Institute; and Member of Executive Board, SMU Cox School of Business Formerly: Advisor to the Board, Invesco Advisers, Inc. (formerly known as Invesco Institutional (N.A.), Inc.); Chairman and Chief Executive Officer, Invesco Advisers, Inc. (registered investment adviser); Director, Chairman, Chief Executive Officer and President, Invesco Holding Company (US), Inc. (formerly IVZ Inc.) (holding company), Invesco Group Services, Inc. (service provider) and Invesco North American Holdings, Inc. (holding company); Director, Chief Executive Officer and President, Invesco Holding Company Limited (parent of Invesco and a global investment management firm); Director, Invesco Ltd.; Chairman, Investment Company Institute and President, Co-Chief Executive Officer, Co-President, Chief Operating Officer and Chief Financial Officer, Franklin Resources, Inc. (global investment management organization) | | 189 | | None |
| 1 | Mr. Flanagan is considered an interested person (within the meaning of Section 2(a)(19) of the 1940 Act) of the Trust because he is an officer of the Adviser to the Trust, and an officer and a director of Invesco Ltd., ultimate parent of the Adviser. |
|
| T-1 Invesco Global Core Equity Fund |
Trustees and Officers–(continued)
| | | | | | | | |
Name, Year of Birth and
Position(s)
Held with the Trust | | Trustee and/or Officer Since | | Principal Occupation(s) During Past 5 Years | | Number of
Funds in
Fund Complex
Overseen by
Trustee | | Other Directorship(s)
Held by Trustee
During Past 5 Years |
| Independent Trustees |
Beth Ann Brown – 1968 Trustee (2019) and Chair (August 2022) | | 2019 | | Independent Consultant Formerly: Head of Intermediary Distribution, Managing Director, Strategic Relations, Managing Director, Head of National Accounts, Senior Vice President, National Account Manager and Senior Vice President, Key Account Manager, Columbia Management Investment Advisers LLC; Vice President, Key Account Manager, Liberty Funds Distributor, Inc.; and Trustee of certain Oppenheimer Funds | | 189 | | Director, Board of Directors of Caron Engineering Inc.; Advisor, Board of Advisors of Caron Engineering Inc.; President and Director, Acton Shapleigh Youth Conservation Corps (non-profit) Formerly: President and Director Director of Grahamtastic Connection (non-profit) |
| Cynthia Hostetler – 1962 Trustee | | 2017 | | Non-Executive Director and Trustee of a number of public and private business corporations Formerly: Director, Aberdeen Investment Funds (4 portfolios); Director, Artio Global Investment LLC (mutual fund complex); Director, Edgen Group, Inc. (specialized energy and infrastructure products distributor); Director, Genesee & Wyoming, Inc. (railroads); Head of Investment Funds and Private Equity, Overseas Private Investment Corporation; President, First Manhattan Bancorporation, Inc.; and Attorney, Simpson Thacher & Bartlett LLP | | 189 | | Resideo Technologies, Inc. (smart home technology); Vulcan Materials Company (construction materials company); Trilinc Global Impact Fund; Textainer Group Holdings, (shipping container leasing company); Investment Company Institute (professional organization); and Independent Directors Council (professional organization) |
Eli Jones – 1961 Trustee | | 2016 | | Professor and Dean Emeritus, Mays Business School - Texas A&M University Formerly: Dean of Mays Business School-Texas A&M University; Professor and Dean, Walton College of Business, University of Arkansas and E.J. Ourso College of Business, Louisiana State University; and Director, Arvest Bank | | 189 | | Insperity, Inc. (formerly known as Administaff) (human resources provider); and Member of Regional Board of Directors and Board of Directors, First Financial Bancorp (regional bank) |
Elizabeth Krentzman – 1959 Trustee | | 2019 | | Formerly: Principal and Chief Regulatory Advisor for Asset Management Services and U.S. Mutual Fund Leader of Deloitte & Touche LLP; General Counsel of the Investment Company Institute (trade association); National Director of the Investment Management Regulatory Consulting Practice, Principal, Director and Senior Manager of Deloitte & Touche LLP; Assistant Director of the Division of Investment Management - Office of Disclosure and Investment Adviser Regulation of the U.S. Securities and Exchange Commission and various positions with the Division of Investment Management - Office of Regulatory Policy of the U.S. Securities and Exchange Commission; Associate at Ropes & Gray LLP; and Trustee of certain Oppenheimer Funds | | 189 | | Formerly: Member of the Cartica Funds Board of Directors (private investment fund); Trustee of the University of Florida National Board Foundation; and Member of the University of Florida Law Center Association, Inc. Board of Trustees, Audit Committee and Membership Committee |
Anthony J. LaCava, Jr. – 1956 Trustee | | 2019 | | Formerly: Director and Member of the Audit Committee, Blue Hills Bank (publicly traded financial institution) and Managing Partner, KPMG LLP | | 189 | | Blue Hills Bank; Chairman, Bentley University; Member, Business School Advisory Council; and Nominating Committee, KPMG LLP |
Prema Mathai-Davis – 1950 Trustee | | 1998 | | Retired Formerly: Co-Founder & Partner of Quantalytics Research, LLC, (a FinTech Investment Research Platform for the Self-Directed Investor); Trustee of YWCA Retirement Fund; CEO of YWCA of the USA; Board member of the NY Metropolitan Transportation Authority; Commissioner of the NYC Department of Aging; and Board member of Johns Hopkins Bioethics Institute | | 189 | | Member of Board of Positive Planet US (non-profit) and HealthCare Chaplaincy Network (non-profit) |
T-2 Invesco Global Core Equity Fund
Trustees and Officers–(continued)
| | | | | | | | |
Name, Year of Birth and
Position(s)
Held with the Trust | | Trustee and/or Officer Since | | Principal Occupation(s) During Past 5 Years | | Number of
Funds in
Fund Complex
Overseen by
Trustee | | Other Directorship(s)
Held by Trustee
During Past 5 Years |
| Independent Trustees–(continued) | | | | |
Joel W. Motley – 1952 Trustee | | 2019 | | Director of Office of Finance, Federal Home Loan Bank System; Managing Director of Carmona Motley Inc. (privately held financial advisor); Member of the Council on Foreign Relations and its Finance and Budget Committee; Chairman Emeritus of Board of Human Rights Watch and Member of its Investment Committee; and Member of Investment Committee Board of Historic Hudson Valley (non-profit cultural organization); Member of the Board, Blue Ocean Acquisition Corp.; and Member of the Vestry and the Investment Committee of Trinity Church Wall Street. Formerly: Managing Director of Public Capital Advisors, LLC (privately held financial advisor); Managing Director of Carmona Motley Hoffman, Inc. (privately held financial advisor); Trustee of certain Oppenheimer Funds; and Director of Columbia Equity Financial Corp. (privately held financial advisor) | | 189 | | Member of Board of Trust for Mutual Understanding (non-profit promoting the arts and environment); Member of Board of Greenwall Foundation (bioethics research foundation) and its Investment Committee; Member of Board of Friends of the LRC (non-profit legal advocacy); and Board Member and Investment Committee Member of Pulitzer Center for Crisis Reporting (non-profit journalism) |
Teresa M. Ressel – 1962 Trustee | | 2017 | | Non-executive director and trustee of a number of public and private business corporations Formerly: Chief Executive Officer, UBS Securities LLC (investment banking); Chief Operating Officer, UBS AG Americas (investment banking); Sr. Management Team Olayan America, The Olayan Group (international investor/commercial/industrial); Assistant Secretary for Management & Budget and Designated Chief Financial Officer, U.S. Department of Treasury and Director, ON Semiconductor Corporation (semiconductor manufacturing) | | 189 | | None |
Robert C. Troccoli – 1949 Trustee | | 2016 | | Retired Formerly: Adjunct Professor, University of Denver - Daniels College of Business; and Managing Partner, KPMG LLP | | 189 | | None |
Daniel S. Vandivort – 1954 Trustee | | 2019 | | President, Flyway Advisory Services LLC (consulting and property management) Formerly: President and Chief Investment Officer, previously Head of Fixed Income, Weiss Peck and Greer/Robeco Investment Management; Trustee and Chair, Weiss Peck and Greer Funds Board; and various capacities at CS First Boston including Head of Fixed Income at First Boston Asset Management. | | 189 | | Formerly: Trustee and Governance Chair, Oppenheimer Funds; Treasurer, Chairman of the Audit and Finance Committee, Huntington Disease Foundation of America |
T-3 Invesco Global Core Equity Fund
Trustees and Officers–(continued)
| | | | | | | | |
Name, Year of Birth and Position(s) Held with the Trust | | Trustee and/or Officer Since | | Principal Occupation(s) During Past 5 Years | | Number of Funds in Fund Complex Overseen by Trustee | | Other Directorship(s) Held by Trustee During Past 5 Years |
| Officers | | | | | | | | |
Sheri Morris – 1964 President and Principal Executive Officer | | 1999 | | Director, Invesco Trust Company; Head of Global Fund Services, Invesco Ltd.; President and Principal Executive Officer, The Invesco Funds; Vice President, Invesco Exchange-Traded Fund Trust, Invesco Exchange-Traded Fund Trust II, Invesco India Exchange-Traded Fund Trust, Invesco Actively Managed Exchange-Traded Fund Trust, Invesco Actively Managed Exchange-Traded Commodity Fund Trust and Invesco Exchange-Traded Self-Indexed Fund Trust; and Vice President, OppenheimerFunds, Inc. Formerly: Vice President, Treasurer and Principal Financial Officer, The Invesco Funds; Vice President, Invesco AIM Advisers, Inc., Invesco AIM Capital Management, Inc. and Invesco AIM Private Asset Management, Inc.; Assistant Vice President and Assistant Treasurer, The Invesco Funds; Vice President and Assistant Vice President, Invesco Advisers, Inc.; Assistant Vice President, Invesco AIM Capital Management, Inc. and Invesco AIM Private Asset Management, Inc.; Treasurer, Invesco Exchange-Traded Fund Trust, Invesco Exchange-Traded Fund Trust II, Invesco India Exchange-Traded Fund Trust and Invesco Actively Managed Exchange-Traded Fund Trust; and Senior Vice President, Invesco Advisers, Inc. (formerly known as Invesco Institutional (N.A.), Inc.) (registered investment adviser) | | N/A | | N/A |
Jeffrey H. Kupor – 1968 Senior Vice President, Chief Legal Officer and Secretary | | 2018 | | Head of Legal of the Americas, Invesco Ltd.; Senior Vice President and Secretary, Invesco Advisers, Inc. (formerly known as Invesco Institutional (N.A.), Inc.) (registered investment adviser); Secretary, Invesco Distributors, Inc. (formerly known as Invesco AIM Distributors, Inc.); Vice President and Secretary, Invesco Investment Services, Inc. (formerly known as Invesco AIM Investment Services, Inc.); Senior Vice President, Chief Legal Officer and Secretary, The Invesco Funds; Secretary and General Counsel, Invesco Investment Advisers LLC (formerly known as Van Kampen Asset Management); Secretary and General Counsel, Invesco Capital Markets, Inc. (formerly known as Van Kampen Funds Inc.); Chief Legal Officer, Invesco Exchange-Traded Fund Trust, Invesco Exchange-Traded Fund Trust II, Invesco India Exchange-Traded Fund Trust, Invesco Actively Managed Exchange-Traded Fund Trust, Invesco Actively Managed Exchange-Traded Commodity Fund Trust and Invesco Exchange-Traded Self-Indexed Fund Trust;; Secretary and Vice President, Harbourview Asset Management Corporation; Secretary and Vice President, OppenheimerFunds, Inc. and Invesco Managed Accounts, LLC; Secretary and Senior Vice President, OFI Global Institutional, Inc.; Secretary and Vice President, OFI SteelPath, Inc.; Secretary and Vice President, Oppenheimer Acquisition Corp.; Secretary and Vice President, Shareholder Services, Inc.; and Secretary and Vice President, Trinity Investment Management Corporation Formerly: Senior Vice President, Invesco Distributors, Inc.; Secretary and Vice President, Jemstep, Inc.; Head of Legal, Worldwide Institutional, Invesco Ltd.; Secretary and General Counsel, INVESCO Private Capital Investments, Inc.; Senior Vice President, Secretary and General Counsel, Invesco Management Group, Inc. (formerly known as Invesco AIM Management Group, Inc.); Assistant Secretary, INVESCO Asset Management (Bermuda) Ltd.; Secretary and General Counsel, Invesco Private Capital, Inc.;Assistant Secretary and General Counsel, INVESCO Realty, Inc.; Secretary and General Counsel, Invesco Senior Secured Management, Inc.; Secretary, Sovereign G./P. Holdings Inc.; Secretary, Invesco Indexing LLC; and Secretary, W.L. Ross & Co., LLC | | N/A | | N/A |
Andrew R. Schlossberg – 1974 Senior Vice President | | 2019 | | Senior Vice President, Invesco Group Services, Inc.; Head of the Americas and Senior Managing Director, Invesco Ltd.; Director and Senior Vice President, Invesco Advisers, Inc. (formerly known as Invesco Institutional (N.A.), Inc.) (registered investment adviser); Director and Chairman, Invesco Investment Services, Inc. (formerly known as Invesco AIM Investment Services, Inc.) (registered transfer agent); Senior Vice President, The Invesco Funds; and Director, Invesco Investment Advisers LLC (formerly known as Van Kampen Asset Management) Formerly: Director, President and Chairman, Invesco Insurance Agency, Inc.; Director, Invesco UK Limited; Director and Chief Executive, Invesco Asset Management Limited and Invesco Fund Managers Limited; Assistant Vice President, The Invesco Funds; Senior Vice President, Invesco Advisers, Inc. (formerly known as Invesco Institutional (N.A.), Inc.) (registered investment adviser); Director and Chief Executive, Invesco Administration Services Limited and Invesco Global Investment Funds Limited; Director, Invesco Distributors, Inc.; Head of EMEA, Invesco Ltd.; President, Invesco Actively Managed Exchange-Traded Commodity Fund Trust, Invesco Actively Managed Exchange-Traded Fund Trust, Invesco Exchange-Traded Fund Trust, Invesco Exchange-Traded Fund Trust II and Invesco India Exchange-Traded Fund Trust; and Managing Director and Principal Executive Officer, Invesco Capital Management LLC | | N/A | | N/A |
T-4 Invesco Global Core Equity Fund
Trustees and Officers–(continued)
| | | | | | | | |
Name, Year of Birth and Position(s) Held with the Trust | | Trustee and/or Officer Since | | Principal Occupation(s) During Past 5 Years | | Number of Funds in Fund Complex Overseen by Trustee | | Other Directorship(s) Held by Trustee During Past 5 Years |
| Officers–(continued) | | | | | | | | |
John M. Zerr – 1962 Senior Vice President | | 2006 | | Chief Operating Officer of the Americas; Senior Vice President, Invesco Advisers, Inc. (formerly known as Invesco Institutional (N.A.), Inc.) (registered investment adviser); Senior Vice President, Invesco Distributors, Inc. (formerly known as Invesco AIM Distributors, Inc.); Director and Vice President, Invesco Investment Services, Inc. (formerly known as Invesco AIM Investment Services, Inc.) Senior Vice President, The Invesco Funds; Managing Director, Invesco Capital Management LLC; Director, Invesco Investment Advisers LLC (formerly known as Van Kampen Asset Management); Senior Vice President, Invesco Capital Markets, Inc. (formerly known as Van Kampen Funds Inc.); Manager, Invesco Indexing LLC; Manager, Invesco Specialized Products, LLC; Member, Invesco Canada Funds Advisory Board; Director, President and Chief Executive Officer, Invesco Corporate Class Inc. (corporate mutual fund company); and Director, Chairman, President and Chief Executive Officer, Invesco Canada Ltd. (formerly known as Invesco Trimark Ltd./Invesco Trimark Ltèe) (registered investment adviser and registered transfer agent); President, Invesco, Inc.; President, Invesco Global Direct Real Estate Feeder GP Ltd.; President, Invesco IP Holdings (Canada) Ltd; President, Invesco Global Direct Real Estate GP Ltd.; President, Invesco Financial Services Ltd. / Services Financiers Invesco Ltée; and Director and Chairman, Invesco Trust Company Formerly: President, Trimark Investments Ltd/Services Financiers Invesco Ltee; Director and Senior Vice President, Invesco Insurance Agency, Inc.; Director and Senior Vice President, Invesco Management Group, Inc. (formerly known as Invesco AIM Management Group, Inc.); Secretary and General Counsel, Invesco Management Group, Inc. (formerly known as Invesco AIM Management Group, Inc.); Secretary, Invesco Investment Services, Inc. (formerly known as Invesco AIM Investment Services, Inc.); Chief Legal Officer and Secretary, The Invesco Funds; Secretary and General Counsel, Invesco Investment Advisers LLC (formerly known as Van Kampen Asset Management); Secretary and General Counsel, Invesco Capital Markets, Inc. (formerly known as Van Kampen Funds Inc.); Chief Legal Officer, Invesco Exchange-Traded Fund Trust, Invesco Exchange-Traded Fund Trust II, Invesco India Exchange-Traded Fund Trust, Invesco Actively Managed Exchange-Traded Fund Trust, Invesco Actively Managed Exchange-Traded Commodity Fund Trust and Invesco Exchange-Traded Self-Indexed Fund Trust; Secretary, Invesco Indexing LLC; Director, Secretary, General Counsel and Senior Vice President, Van Kampen Exchange Corp.; Director, Vice President and Secretary, IVZ Distributors, Inc. (formerly known as INVESCO Distributors, Inc.); Director and Vice President, INVESCO Funds Group, Inc.; Director and Vice President, Van Kampen Advisors Inc.; Director, Vice President, Secretary and General Counsel, Van Kampen Investor Services Inc.;Director and Secretary, Invesco Distributors, Inc. (formerly known as Invesco AIM Distributors, Inc.); Director, Senior Vice President, General Counsel and Secretary, Invesco AIM Advisers, Inc. and Van Kampen Investments Inc.; Director, Vice President and Secretary, Fund Management Company; Director, Senior Vice President, Secretary, General Counsel and Vice President, Invesco AIM Capital Management, Inc.; and Chief Operating Officer and General Counsel, Liberty Ridge Capital, Inc. (an investment adviser) | | N/A | | N/A |
Gregory G. McGreevey – 1962 Senior Vice President | | 2012 | | Senior Managing Director, Invesco Ltd.; Director, Chairman, President, and Chief Executive Officer, Invesco Advisers, Inc. (formerly known as Invesco Institutional (N.A.), Inc.) (registered investment adviser); Director, Invesco Mortgage Capital, Inc. and Invesco Senior Secured Management, Inc.; Senior Vice President, The Invesco Funds; President, SNW Asset Management Corporation and Invesco Managed Accounts, LLC; Chairman and Director, Invesco Private Capital, Inc.; Chairman and Director, INVESCO Private Capital Investments, Inc.; Chairman and Director, INVESCO Realty, Inc.; and Senior Vice President, Invesco Group Services, Inc. Formerly: Senior Vice President, Invesco Management Group, Inc. and Invesco Advisers, Inc.; Assistant Vice President, The Invesco Funds | | N/A | | N/A |
Adrien Deberghes – 1967 Principal Financial Officer, Treasurer and Vice President | | 2020 | | Head of the Fund Office of the CFO and Fund Administration; Vice President, Invesco Advisers, Inc.; Principal Financial Officer, Treasurer and Vice President, The Invesco Funds; Vice President, Invesco Exchange-Traded Fund Trust, Invesco Exchange-Traded Fund Trust II, Invesco India Exchange-Traded Fund Trust, Invesco Actively Managed Exchange-Traded Fund Trust, Invesco Actively Managed Exchange-Traded Commodity Fund Trust and Invesco Exchange-Traded Self-Indexed Fund Trust Formerly: Senior Vice President and Treasurer, Fidelity Investments | | N/A | | N/A |
Crissie M. Wisdom – 1969 Anti-Money Laundering Compliance Officer | | 2013 | | Anti-Money Laundering and OFAC Compliance Officer for Invesco U.S. entities including: Invesco Advisers, Inc. and its affiliates, Invesco Capital Markets, Inc., Invesco Distributors, Inc., Invesco Investment Services, Inc., The Invesco Funds, Invesco Capital Management, LLC, Invesco Trust Company; and Fraud Prevention Manager for Invesco Investment Services, Inc. | | N/A | | N/A |
T-5 Invesco Global Core Equity Fund
Trustees and Officers–(continued)
| | | | | | | | |
Name, Year of Birth and Position(s) Held with the Trust | | Trustee and/or Officer Since | | Principal Occupation(s) During Past 5 Years | | Number of Funds in Fund Complex Overseen by Trustee | | Other Directorship(s) Held by Trustee During Past 5 Years |
| Officers–(continued) | | | | | | | | |
Todd F. Kuehl – 1969 Chief Compliance Officer and Senior Vice President | | 2020 | | Chief Compliance Officer, Invesco Advisers, Inc. (registered investment adviser); and Chief Compliance Officer and Senior Vice President, The Invesco Funds Formerly: Managing Director and Chief Compliance Officer, Legg Mason (Mutual Funds); Chief Compliance Officer, Legg Mason Private Portfolio Group (registered investment adviser) | | N/A | | N/A |
James Bordewick, Jr. – 1959 Senior Vice President and
Senior Officer | | 2022 | | Senior Vice President and Senior Officer, The Invesco Funds Formerly: Chief Legal Officer, KingsCrowd, Inc. (research and analytical platform for investment in private capital markets); Chief Operating Officer and Head of Legal and Regulatory, Netcapital (private capital investment platform); Managing Director, General Counsel of asset management and Chief Compliance Officer for asset management and private banking, Bank of America Corporation; Chief Legal Officer, Columbia Funds and BofA Funds; Senior Vice President and Associate General Counsel, MFS Investment Management; Chief Legal Officer, MFS Funds; Associate, Ropes & Gray; and Associate, Gaston Snow & Ely Bartlett | | N/A | | N/A |
The Statement of Additional Information of the Trust includes additional information about the Fund’s Trustees and is available upon request, without charge, by calling 1.800.959.4246. Please refer to the Fund’s Statement of Additional Information for information on the Fund’s sub-advisers.
| | | | | | |
| Office of the Fund | | Investment Adviser | | Distributor | | Auditors |
| 11 Greenway Plaza, Suite 1000 | | Invesco Advisers, Inc. | | Invesco Distributors, Inc. | | PricewaterhouseCoopers LLP |
| Houston, TX 77046-1173 | | 1555 Peachtree Street, N.E. | | 11 Greenway Plaza, Suite 1000 | | 1000 Louisiana Street, Suite 5800 |
| | Atlanta, GA 30309 | | Houston, TX 77046-1173 | | Houston, TX 77002-5021 |
| | | |
| Counsel to the Fund | | Counsel to the Independent Trustees | | Transfer Agent | | Custodian |
| Stradley Ronon Stevens & Young, LLP | | Sidley Austin LLP | | Invesco Investment Services, Inc. | | State Street Bank and Trust Company |
| 2005 Market Street, Suite 2600 | | 787 Seventh Avenue | | 11 Greenway Plaza, Suite 1000 | | 225 Franklin Street |
| Philadelphia, PA 19103-7018 | | New York, NY 10019 | | Houston, TX 77046-1173 | | Boston, MA 02110-2801 |
T-6 Invesco Global Core Equity Fund

Go paperless with eDelivery
Visit invesco.com/edelivery to enjoy the convenience and security of anytime electronic access to your investment documents.
With eDelivery, you can elect to have any or all of the following materials delivered straight to your inbox to download, save and print from your own computer:
∎ Fund reports and prospectuses
∎ Quarterly statements
∎ Daily confirmations
∎ Tax forms
Invesco mailing information
Send general correspondence to Invesco Investment Services, Inc., P.O. Box 219078, Kansas City, MO 64121-9078.
Important notice regarding delivery of security holder documents
To reduce Fund expenses, only one copy of most shareholder documents may be mailed to shareholders with multiple accounts at the same address (Householding). Mailing of your shareholder documents may be householded indefinitely unless you instruct us otherwise. If you do not want the mailing of these documents to be combined with those for other members of your household, please contact Invesco Investment Services, Inc. at 800 959 4246 or contact your financial institution. We will begin sending you individual copies for each account within 30 days after receiving your request.
Fund holdings and proxy voting information
The Fund provides a complete list of its portfolio holdings four times each year, at the end of each fiscal quarter. For the second and fourth quarters, the list appears, respectively, in the Fund’s semiannual and annual reports to shareholders. For the first and third quarters, the Fund files the list with the Securities and Exchange Commission (SEC) as an exhibit to its reports on Form N-PORT. The most recent list of portfolio holdings is available at invesco.com/completeqtrholdings. Shareholders can also look up the Fund’s Form N-PORT filings on the SEC website, sec.gov. The SEC file numbers for the Fund are shown below.
A description of the policies and procedures that the Fund uses to determine how to vote proxies relating to portfolio securities is available without charge, upon request, from our Client Services department at 800 959 4246, or at invesco.com/ corporate/about-us/esg. The information is also available on the SEC website, sec.gov.
Information regarding how the Fund voted proxies related to its portfolio securities during the most recent 12-month period ended June 30 is available at invesco.com/proxysearch. This information is also available on the SEC website, sec.gov.
Invesco Advisers, Inc. is an investment adviser; it provides investment advisory services to individual and institutional clients and does not sell securities. Invesco Distributors, Inc. is the US distributor for Invesco Ltd.’s retail mutual funds, exchange-traded funds and institutional money market funds. Both are wholly owned, indirect subsidiaries of Invesco Ltd.

| | | | | | |
SEC file number(s): 811-01540 and 002-27334 | | Invesco Distributors, Inc. | | GCE-AR-1 | | |

| | |
| | |
| Annual Report to Shareholders | | December 31, 2022 |
Invesco EQV International Small Company Fund
Nasdaq:
A: IEGAX ∎ C: IEGCX ∎ Y: IEGYX ∎ R5: IEGIX ∎ R6: IEGFX
Management’s Discussion of Fund Performance
| | | | |
| |
Performance summary | |
For the fiscal year ended December 31, 2022, Class A shares of Invesco EQV International Small Company Fund (the Fund), at net asset value (NAV), outperformed the MSCI All Country World ex USA Small Cap Index, the Fund’s broad market/style-specific benchmark. | |
Your Fund’s long-term performance appears later in this report. | |
| |
Fund vs. Indexes | |
Total returns, 12/31/21 to 12/31/22, at net asset value (NAV). Performance shown does not include applicable contingent deferred sales charges (CDSC) or front-end sales charges, which would have reduced performance. | |
Class A Shares | | | -11.27 | % |
Class C Shares | | | -11.94 | |
Class Y Shares | | | -11.08 | |
Class R5 Shares | | | -11.00 | |
Class R6 Shares | | | -10.91 | |
MSCI All Country World ex USA Small Cap Index▼ (Broad Market/Style-Specific Index) | | | -19.97 | |
| |
Source(s): ▼RIMES Technologies Corp. | | | | |
Market conditions and your Fund
Global equity markets declined in the first half of 2022 amid volatility sparked by Russia’s invasion of Ukraine, rising commodity prices, rampant global inflation and central banks shifting toward tighter monetary policy. Russia’s invasion exacerbated inflationary pressures, disrupting already strained supply chains, and increasing shortages of oil, gas and raw materials, with the price of oil rising sharply.
Inflation headwinds continued into the third quarter of 2022. The US Federal Reserve (the Fed), the European Central Bank and the Bank of England all raised interest rates. In contrast, the People’s Bank of China lowered its policy rate and the Bank of Japan kept rates the same. Emerging market equities, hampered by the strong US dollar, underperformed developed market equities.
Global equity markets posted gains for the fourth quarter of 2022, after better inflation data sparked a rally in October and November. However, investor sentiment worsened in December after central banks signaled continued interest rate hikes into 2023 as inflation remained above target levels. International stocks outperformed US stocks in the fourth quarter, led by results in Europe and the UK. Emerging market equities also posted gains for the fourth quarter of 2022, boosted by China, which eased its zero-COVID-19 policy and started to reopen even as COVID-19 infections surged.
Despite the rebound in the fourth quarter of 2022, at the end of the fiscal year ended December 31, 2022, trailing one-year returns for developed market equities and emerging market equities were both in negative territory.
We remain focused on our bottom-up investment approach of identifying attractive companies that fit our earnings, quality and
valuation (EQV) process regardless of the macroeconomic environment.
During the fiscal year, strong stock selection in the consumer discretionary, health care, information technology and real estate sectors were among the largest contributors to the Fund’s relative outperformance versus the MSCI All Country World ex USA Small Cap Index. In addition, an overweight in the energy sector and an underweight in the real estate sector relative to the benchmark added to the Fund’s relative return. Conversely, an underweight in the materials sector and a lack of exposure to the utilities sector hampered relative results.
On a geographic basis, strong stock selection in Canada, Brazil and Indonesia were among the largest contributors to the Fund’s relative performance. In addition, an overweight in Canada, Mexico and Brazil positively contributed to relative results. In contrast, stock selection and an underweight in Japan, as well as stock selection in Singapore, Den-mark and Switzerland, were leading detractors from the Fund’s relative performance.
Given the declining equity market environment, the Fund’s cash position contributed to relative performance versus the broad market/style-specific benchmark for the fiscal year. It is important to note that similar to the Fund’s sector and regional allocations, cash is a residual of our bottom-up investment process and is not the result of any top-down tactical asset allocation or a risk-management allocation decision.
On a security level, Mexico-based airport operator Grupo Aeroportuario del Centro Norte was one of the Fund’s largest contributors during the fiscal year. The recovery in passenger traffic has continued to drive the company’s operating performance. We trimmed the Fund’s position on strong outperformance. In contrast, UK-based financials company Mortgage Advice Bureau was the
largest individual detractor from the Fund’s performance during the fiscal year.
During 2022, we continued to look for opportunities to improve the growth potential and quality of the Fund’s portfolio by adding companies based on our EQV outlook for each company. We added several new stocks to the portfolio, including South Korea-based LEENO Industrial, a developer and manufacturer of high-end testing pins and sockets, Taiwan-based semiconductor materials manufacturer Visual Photonics Epitaxy and China-based online travel company
Tongcheng Travel Holdings. Deteriorating fundamentals and/or valuations led to the sale of several securities, including Fleury, Masan Consumer and Dorel Industries.
As always, we remain focused on a bottom-up investment approach of identifying attractive companies that fit our EQV-focused investment process. We continue to look for high-quality companies that exhibit the following characteristics: strong organic growth; high returns on capital; pricing power; strong balance sheets; cash generation; and reasonable valuations. In addition, we continue to favor companies that are able to consistently generate cash during weak economic environments. Our balanced EQV-focused approach aligns with our goal of delivering attractive risk-adjusted returns over the long term.
We thank you for your continued investment in Invesco EQV International Small Company Fund.
Portfolio manager(s):
Shuxin Cao - Lead
Borge Endresen - Lead
The views and opinions expressed in management’s discussion of Fund performance are those of Invesco Advisers, Inc. and its affiliates. These views and opinions are subject to change at any time based on factors such as market and economic conditions. These views and opinions may not be relied upon as investment advice or recommendations, or as an offer for a particular security. The information is not a complete analysis of every aspect of any market, country, industry, security or the Fund. Statements of fact are from sources considered reliable, but Invesco Advisers, Inc. makes no representation or warranty as to their completeness or accuracy. Although historical performance is no guarantee of future results, these insights may help you understand our investment management philosophy.
See important Fund and, if applicable, index disclosures later in this report.
| | |
| 2 | | Invesco EQV International Small Company Fund |
Your Fund’s Long-Term Performance
Results of a $10,000 Investment – Oldest Share Class(es)
Fund and index data from 12/31/12
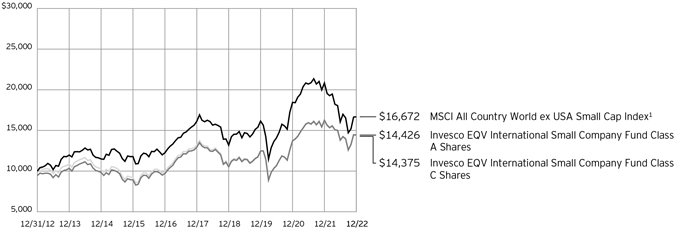
1 Source: RIMES Technologies Corp.
Past performance cannot guarantee future results.
The data shown in the chart include reinvested distributions, applicable sales charges and Fund expenses including management
fees. Index results include reinvested dividends, but they do not reflect sales charges. Performance of the peer group, if applicable, reflects fund expenses and management fees;
performance of a market index does not. Performance shown in the chart does not reflect deduction of taxes a shareholder would pay on Fund distributions or sale of Fund shares.
| | |
| 3 | | Invesco EQV International Small Company Fund |
| | | | |
| |
Average Annual Total Returns | |
As of 12/31/22, including maximum applicable sales charges | |
| |
Class A Shares | | | | |
Inception (8/31/00) | | | 7.92 | % |
10 Years | | | 3.73 | |
5 Years | | | 1.04 | |
1 Year | | | -16.14 | |
| |
Class C Shares | | | | |
Inception (8/31/00) | | | 7.92 | % |
10 Years | | | 3.70 | |
5 Years | | | 1.43 | |
1 Year | | | -12.80 | |
| |
Class Y Shares | | | | |
Inception (10/3/08) | | | 7.63 | % |
10 Years | | | 4.58 | |
5 Years | | | 2.45 | |
1 Year | | | -11.08 | |
| |
Class R5 Shares | | | | |
Inception (10/25/05) | | | 7.08 | % |
10 Years | | | 4.69 | |
5 Years | | | 2.55 | |
1 Year | | | -11.00 | |
| |
Class R6 Shares | | | | |
Inception (9/24/12) | | | 5.23 | % |
10 Years | | | 4.76 | |
5 Years | | | 2.64 | |
1 Year | | | -10.91 | |
The performance data quoted represent past performance and cannot guarantee future results; current performance may be lower or higher. Please visit invesco.com/ performance for the most recent month-end performance. Performance figures reflect reinvested distributions, changes in net asset value and the effect of the maximum sales charge unless otherwise stated. Performance figures do not reflect deduction of taxes a shareholder would pay on Fund distributions or sale of Fund shares. Investment return and principal value will fluctuate so that you may have a gain or loss when you sell shares.
Class A share performance reflects the maximum 5.50% sales charge, and Class C share performance reflects the applicable contingent deferred sales charge (CDSC) for the period involved. The CDSC on Class C shares is 1% for the first year after purchase. Class Y, Class R5 and Class R6 shares do not have a front-end sales charge or a CDSC; therefore, performance is at net asset value.
The performance of the Fund’s share classes will differ primarily due to different sales charge structures and class expenses.
Fund performance reflects any applicable fee waivers and/or expense reimbursements. Had the adviser not waived fees and/or reimbursed expenses currently or in the past, returns would have been lower. See current prospectus for more information.
| | |
| 4 | | Invesco EQV International Small Company Fund |
Supplemental Information
Invesco EQV International Small Company Fund’s investment objective is long-term growth of capital.
| ∎ | Unless otherwise stated, information presented in this report is as of December 31, 2022, and is based on total net assets. |
| ∎ | Unless otherwise noted, all data is provided by Invesco. |
| ∎ | To access your Fund’s reports/prospectus, visit invesco.com/fundreports. |
About indexes used in this report
| ∎ | The MSCI All Country World ex USA Small Cap Index represents the performance of small-cap stocks in developed and emerging markets, excluding the US. The index is computed using the net return, which withholds applicable taxes for non-resident investors. |
| ∎ | The Fund is not managed to track the performance of any particular index, including the index(es) described here, and consequently, the performance of the Fund may deviate significantly from the performance of the index(es). |
| ∎ | A direct investment cannot be made in an index. Unless otherwise indicated, index results include reinvested dividends, and they do not reflect sales charges. Performance of the peer group, if applicable, reflects fund expenses; performance of a market index does not. |
|
|
This report must be accompanied or preceded by a currently effective Fund prospectus, which contains more complete information, including sales charges and expenses. Investors should read it carefully before investing. |
|
| NOT FDIC INSURED | MAY LOSE VALUE | NO BANK GUARANTEE |
| | |
| 5 | | Invesco EQV International Small Company Fund |
Fund Information
Portfolio Composition
| | | | | |
| By sector | | % of total net assets |
| |
Industrials | | | | 26.44 | % |
| |
Information Technology | | | | 15.72 | |
| |
Financials | | | | 11.81 | |
| |
Consumer Discretionary | | | | 10.68 | |
| |
Health Care | | | | 7.14 | |
| |
Real Estate | | | | 6.37 | |
| |
Consumer Staples | | | | 5.22 | |
| |
Energy | | | | 4.27 | |
| |
Other Sectors, Each Less than 2% of Net Assets | | | | 2.35 | |
| |
Money Market Funds Plus Other Assets Less Liabilities | | | | 10.00 | |
Top 10 Equity Holdings*
| | | | | | | |
| | | | | % of total net assets |
| | |
| 1. | | Calian Group Ltd. | | | | 3.05 | % |
| | |
| 2. | | TBC Bank Group PLC | | | | 2.81 | |
| | |
| 3. | | Precia S.A. | | | | 2.56 | |
| | |
| 4. | | Tongcheng Travel Holdings Ltd. | | | | 2.36 | |
| | |
| 5. | | E-L Financial Corp. Ltd. | | | | 2.30 | |
| | |
| 6. | | Bolsa Mexicana de Valores S.A.B. de C.V. | | | | 2.25 | |
| | |
| 7. | | IG Group Holdings PLC | | | | 2.16 | |
| | |
| 8. | | LEENO Industrial, Inc. | | | | 2.08 | |
| | |
| 9. | | Multiplan Empreendimentos Imobiliarios S.A. | | | | 2.05 | |
| | |
| 10. | | Grupo Aeroportuario del Centro Norte S.A.B. de C.V. | | | | 2.03 | |
The Fund’s holdings are subject to change, and there is no assurance that the Fund will continue to hold any particular security.
| * | Excluding money market fund holdings, if any. |
Data presented here are as of December 31, 2022.
| | |
| 6 | | Invesco EQV International Small Company Fund |
Schedule of Investments
December 31, 2022
| | | | | | | | |
| | | Shares | | | Value | |
|
| |
Common Stocks & Other Equity Interests–90.00% | |
Brazil–5.77% | |
Arcos Dorados Holdings, Inc., Class A | | | 393,626 | | | $ | 3,290,713 | |
|
| |
Multiplan Empreendimentos Imobiliarios S.A. | | | 1,832,200 | | | | 7,608,034 | |
|
| |
TOTVS S.A. | | | 837,600 | | | | 4,359,489 | |
|
| |
Wilson Sons Holdings Brasil S.A. | | | 3,008,682 | | | | 6,155,886 | |
|
| |
| | | | | | | 21,414,122 | |
|
| |
|
Canada–8.90% | |
Calian Group Ltd. | | | 229,300 | | | | 11,310,891 | |
|
| |
E-L Financial Corp. Ltd. | | | 13,106 | | | | 8,537,291 | |
|
| |
Information Services Corp. | | | 404,100 | | | | 7,213,513 | |
|
| |
Total Energy Services, Inc. | | | 670,190 | | | | 4,261,696 | |
|
| |
Trican Well Service Ltd.(a) | | | 639,308 | | | | 1,728,115 | |
|
| |
| | | | | | | 33,051,506 | |
|
| |
|
China–3.65% | |
Chongqing Fuling Zhacai Group Co. Ltd., A Shares | | | 1,293,700 | | | | 4,794,441 | |
|
| |
Tongcheng Travel Holdings Ltd.(a)(b) | | | 3,632,000 | | | | 8,741,009 | |
|
| |
| | | | | | | 13,535,450 | |
|
| |
|
Denmark–0.52% | |
TCM Group A/S(b) | | | 183,645 | | | | 1,926,736 | |
|
| |
|
Egypt–2.05% | |
Eastern Co. S.A.E. | | | 5,694,856 | | | | 3,291,984 | |
|
| |
Integrated Diagnostics Holdings PLC(b) | | | 6,777,870 | | | | 4,301,229 | |
|
| |
| | | | | | | 7,593,213 | |
|
| |
|
France–9.73% | |
Exail Technologies S.A.(a) | | | 223,548 | | | | 4,777,345 | |
|
| |
Guillemot Corp. | | | 261,198 | | | | 3,582,935 | |
|
| |
Kaufman & Broad S.A. | | | 189,837 | | | | 5,574,486 | |
|
| |
Linedata Services | | | 58,928 | | | | 2,907,593 | |
|
| |
Metropole Television S.A. | | | 125,460 | | | | 2,059,356 | |
|
| |
Neurones | | | 87,859 | | | | 3,691,187 | |
|
| |
Precia S.A. | | | 306,210 | | | | 9,484,637 | |
|
| |
Societe Pour L’Informatique Industrielle SII | | | 82,859 | | | | 4,027,039 | |
|
| |
| | | | | | | 36,104,578 | |
|
| |
|
Georgia–2.81% | |
TBC Bank Group PLC | | | 380,586 | | | | 10,434,417 | |
|
| |
|
Germany–1.61% | |
Cherry SE(a) | | | 368,000 | | | | 2,981,577 | |
|
| |
MorphoSys AG(a) | | | 36,120 | | | | 510,391 | |
|
| |
VITA 34 AG(a) | | | 296,986 | | | | 2,487,068 | |
|
| |
| | | | | | | 5,979,036 | |
|
| |
|
India–1.01% | |
Emami Ltd. | | | 735,135 | | | | 3,769,172 | |
|
| |
|
Indonesia–4.94% | |
PT Kalbe Farma Tbk | | | 49,480,300 | | | | 6,643,376 | |
|
| |
PT Mitra Keluarga Karyasehat Tbk(b) | | | 33,954,300 | | | | 6,958,014 | |
|
| |
PT Pakuwon Jati Tbk | | | 161,499,300 | | | | 4,730,727 | |
|
| |
| | | | | | | 18,332,117 | |
|
| |
| | | | | | | | |
| | | Shares | | | Value | |
|
| |
Ireland–0.62% | |
Origin Enterprises PLC | | | 495,000 | | | $ | 2,285,438 | |
|
| |
|
Italy–2.90% | |
Danieli & C. Officine Meccaniche S.p.A., RSP | | | 266,310 | | | | 4,073,735 | |
|
| |
Openjobmetis Spa agenzia per il lavoro | | | 340,146 | | | | 3,016,678 | |
|
| |
Technogym S.p.A.(b) | | | 481,169 | | | | 3,675,475 | |
|
| |
| | | | | | | 10,765,888 | |
|
| |
|
Japan–4.02% | |
Nabtesco Corp. | | | 185,800 | | | | 4,761,282 | |
|
| |
Tokyo Ohka Kogyo Co. Ltd. | | | 68,300 | | | | 3,076,726 | |
|
| |
Zuken, Inc. | | | 308,900 | | | | 7,073,073 | |
|
| |
| | | | | | | 14,911,081 | |
|
| |
|
Malaysia–2.34% | |
Bursa Malaysia Bhd. | | | 2,283,700 | | | | 3,447,052 | |
|
| |
Heineken Malaysia Bhd. | | | 918,100 | | | | 5,252,944 | |
|
| |
| | | | | | | 8,699,996 | |
|
| |
|
Mexico–4.28% | |
Bolsa Mexicana de Valores S.A.B. de C.V. | | | 4,325,494 | | | | 8,350,657 | |
|
| |
Grupo Aeroportuario del Centro Norte S.A.B. de C.V. | | | 978,166 | | | | 7,533,081 | |
|
| |
| | | | | | | 15,883,738 | |
|
| |
|
Netherlands–0.95% | |
SBM Offshore N.V. | | | 223,727 | | | | 3,515,489 | |
|
| |
|
New Zealand–0.82% | |
Freightways Ltd. | | | 494,382 | | | | 3,031,644 | |
|
| |
|
Poland–2.95% | |
LiveChat Software S.A. | | | 268,000 | | | | 6,550,630 | |
|
| |
Mo-BRUK S.A. | | | 54,400 | | | | 3,691,829 | |
|
| |
Skarbiec Holding S.A.(a)(b) | | | 166,000 | | | | 720,130 | |
|
| |
| | | | | | | 10,962,589 | |
|
| |
|
Romania–1.77% | |
Fondul Proprietatea S.A. | | | 14,855,342 | | | | 6,564,135 | |
|
| |
|
Singapore–1.17% | |
XP Power Ltd. | | | 176,849 | | | | 4,347,521 | |
|
| |
|
South Africa–2.26% | |
Combined Motor Holdings Ltd. | | | 2,114,569 | | | | 3,313,084 | |
|
| |
Karooooo Ltd. | | | 214,000 | | | | 5,078,220 | |
|
| |
| | | | | | | 8,391,304 | |
|
| |
|
South Korea–2.49% | |
Douzone Bizon Co. Ltd. | | | 52,160 | | | | 1,528,581 | |
|
| |
LEENO Industrial, Inc. | | | 62,302 | | | | 7,731,514 | |
|
| |
| | | | | | | 9,260,095 | |
|
| |
|
Spain–0.90% | |
Construcciones y Auxiliar de Ferrocarriles S.A. | | | 117,396 | | | | 3,340,765 | |
|
| |
|
Sweden–1.68% | |
Kindred Group PLC, SDR | | | 406,793 | | | | 4,246,088 | |
|
| |
See accompanying Notes to Financial Statements which are an integral part of the financial statements.
| | |
| 7 | | Invesco EQV International Small Company Fund |
| | | | | | | | |
| | | Shares | | | Value | |
|
| |
Sweden–(continued) | |
Proact IT Group AB | | | 249,786 | | | $ | 1,984,627 | |
|
| |
| | | | | | | 6,230,715 | |
|
| |
|
Switzerland–0.96% | |
Kardex Holding AG | | | 21,500 | | | | 3,548,228 | |
|
| |
|
Taiwan–1.84% | |
ASPEED Technology, Inc. | | | 31,000 | | | | 1,696,924 | |
|
| |
Visual Photonics Epitaxy Co. Ltd. | | | 2,296,000 | | | | 5,149,900 | |
|
| |
| | | | | | | 6,846,824 | |
|
| |
|
United Kingdom–14.09% | |
4imprint Group PLC | | | 70,000 | | | | 3,595,324 | |
|
| |
Bioventix PLC | | | 32,000 | | | | 1,542,672 | |
|
| |
Character Group PLC (The) | | | 440,000 | | | | 2,298,913 | |
|
| |
Clarkson PLC | | | 142,000 | | | | 5,535,177 | |
|
| |
DCC PLC | | | 108,144 | | | | 5,338,675 | |
|
| |
EMIS Group PLC | | | 178,500 | | | | 4,039,973 | |
|
| |
Eurocell PLC | | | 1,106,000 | | | | 1,972,459 | |
|
| |
HomeServe PLC(a) | | | 422,495 | | | | 6,114,140 | |
|
| |
IG Group Holdings PLC | | | 847,045 | | | | 8,012,719 | |
|
| |
Mortgage Advice Bureau Holdings Ltd. | | | 673,446 | | | | 4,342,052 | |
|
| |
Renew Holdings PLC | | | 608,291 | | | | 5,396,511 | |
|
| |
Savills PLC | | | 413,099 | | | | 4,126,501 | |
|
| |
| | | | | | | 52,315,116 | |
|
| |
| | | | | | | | |
| | | Shares | | | Value | |
|
| |
United States–2.97% | |
Epsilon Energy Ltd. | | | 272,280 | | | $ | 1,805,217 | |
|
| |
Signify N.V. | | | 139,045 | | | | 4,681,264 | |
|
| |
VAALCO Energy, Inc. | | | 998,947 | | | | 4,555,198 | |
|
| |
| | | | | | | 11,041,679 | |
|
| |
Total Common Stocks & Other Equity Interests
(Cost $295,569,540) | | | | 334,082,592 | |
|
| |
|
Money Market Funds–9.69% | |
Invesco Government & Agency Portfolio, Institutional Class, 4.22%(c)(d) | | | 12,529,275 | | | | 12,529,276 | |
|
| |
Invesco Liquid Assets Portfolio,
Institutional Class, 4.42%(c)(d) | | | 9,116,007 | | | | 9,118,741 | |
|
| |
Invesco Treasury Portfolio, Institutional
Class, 4.20%(c)(d) | | | 14,319,172 | | | | 14,319,172 | |
|
| |
Total Money Market Funds (Cost $35,963,576) | | | | 35,967,189 | |
|
| |
TOTAL INVESTMENTS IN SECURITIES–99.69%
(Cost $331,533,116) | | | | 370,049,781 | |
|
| |
OTHER ASSETS LESS LIABILITIES–0.31% | | | | 1,138,693 | |
|
| |
NET ASSETS- 100.00% | | | $ | 371,188,474 | |
|
| |
Investment Abbreviations:
RSP – Registered Savings Plan Shares
SDR – Swedish Depository Receipt
Notes to Schedule of Investments:
| (a) | Non-income producing security. |
| (b) | Security purchased or received in a transaction exempt from registration under the Securities Act of 1933, as amended (the “1933 Act”). The security may be resold pursuant to an exemption from registration under the 1933 Act, typically to qualified institutional buyers. The aggregate value of these securities at December 31, 2022 was $26,322,593, which represented 7.09% of the Fund’s Net Assets. |
| (c) | Affiliated issuer. The issuer and/or the Fund is a wholly-owned subsidiary of Invesco Ltd., or is affiliated by having an investment adviser that is under common control of Invesco Ltd. The table below shows the Fund’s transactions in, and earnings from, its investments in affiliates for the fiscal year ended December 31, 2022. |
| | | | | | | | | | | | | | | | | | | | | | | | | | | | |
| | | Value
December 31, 2021 | | | Purchases
at Cost | | | Proceeds
from Sales | | | Change in
Unrealized
Appreciation | | | Realized
Gain
(Loss) | | | Value
December 31, 2022 | | | Dividend Income | |
Investments in Affiliated Money Market Funds: | | | | | | | | | | | | | | | | | | | | | | | | | |
Invesco Government & Agency Portfolio, Institutional Class | | | $ 9,144,542 | | | | $ 30,569,454 | | | | $ (27,184,720) | | | | $ - | | | | $ - | | | | $12,529,276 | | | | $181,507 | |
Invesco Liquid Assets Portfolio, Institutional Class | | | 6,699,851 | | | | 21,835,325 | | | | (19,417,658 | ) | | | 3,520 | | | | (2,297) | | | | 9,118,741 | | | | 137,971 | |
Invesco Treasury Portfolio, Institutional Class | | | 10,450,906 | | | | 34,936,519 | | | | (31,068,253 | ) | | | - | | | | - | | | | 14,319,172 | | | | 202,642 | |
Investments Purchased with Cash Collateral from Securities on Loan: | | | | | | | | | | | | | | | | | | | | | | | | | |
Invesco Private Government Fund | | | 68,922 | | | | 6,999,900 | | | | (7,068,822 | ) | | | - | | | | - | | | | - | | | | 4,308* | |
Invesco Private Prime Fund | | | 160,819 | | | | 16,409,910 | | | | (16,570,345 | ) | | | - | | | | (384) | | | | - | | | | 12,060* | |
Total | | | $26,525,040 | | | | $110,751,108 | | | | $(101,309,798) | | | | $3,520 | | | | $(2,681) | | | | $35,967,189 | | | | $538,488 | |
| | * | Represents the income earned on the investment of cash collateral, which is included in securities lending income on the Statement of Operations. Does not include rebates and fees paid to lending agent or premiums received from borrowers, if any. |
| (d) | The rate shown is the 7-day SEC standardized yield as of December 31, 2022. |
See accompanying Notes to Financial Statements which are an integral part of the financial statements.
| | |
| 8 | | Invesco EQV International Small Company Fund |
Statement of Assets and Liabilities
December 31, 2022
| | | | |
Assets: | | | | |
| |
Investments in unaffiliated securities, at value (Cost $295,569,540) | | $ | 334,082,592 | |
|
| |
Investments in affiliated money market funds, at value (Cost $35,963,576) | | | 35,967,189 | |
|
| |
Cash | | | 14,465 | |
|
| |
Foreign currencies, at value (Cost $306,539) | | | 311,778 | |
|
| |
Receivable for: | | | | |
Investments sold | | | 6,500 | |
|
| |
Fund shares sold | | | 811,258 | |
|
| |
Dividends | | | 996,304 | |
|
| |
Investment for trustee deferred compensation and retirement plans | | | 84,172 | |
|
| |
Other assets | | | 57,383 | |
|
| |
Total assets | | | 372,331,641 | |
|
| |
Liabilities: | | | | |
| |
Payable for: | | | | |
Investments purchased | | | 349,526 | |
|
| |
Fund shares reacquired | | | 457,042 | |
|
| |
Accrued fees to affiliates | | | 136,443 | |
|
| |
Accrued trustees’ and officers’ fees and benefits | | | 3,100 | |
|
| |
Accrued other operating expenses | | | 105,839 | |
|
| |
| |
Trustee deferred compensation and retirement plans | | | 91,217 | |
|
| |
Total liabilities | | | 1,143,167 | |
|
| |
| |
Net assets applicable to shares outstanding | | $ | 371,188,474 | |
|
| |
| |
Net assets consist of: | | | | |
Shares of beneficial interest | | $ | 335,316,721 | |
|
| |
Distributable earnings | | | 35,871,753 | |
|
| |
| | $ | 371,188,474 | |
|
| |
| | | | |
Net Assets: | | | | |
| |
Class A | | $ | 131,970,838 | |
|
| |
| |
Class C | | $ | 2,713,115 | |
|
| |
| |
Class Y | | $ | 65,633,820 | |
|
| |
| |
Class R5 | | $ | 19,913,096 | |
|
| |
| |
Class R6 | | $ | 150,957,605 | |
|
| |
|
Shares outstanding, no par value, with an unlimited number of shares authorized: | |
| |
Class A | | | 7,236,237 | |
|
| |
| |
Class C | | | 157,588 | |
|
| |
| |
Class Y | | | 3,594,323 | |
|
| |
| |
Class R5 | | | 1,102,355 | |
|
| |
| |
Class R6 | | | 8,364,583 | |
|
| |
| |
Class A: | | | | |
Net asset value per share | | $ | 18.24 | |
|
| |
Maximum offering price per share (Net asset value of $18.24 ÷ 94.50%) | | $ | 19.30 | |
|
| |
Class C: | | | | |
Net asset value and offering price per share | | $ | 17.22 | |
|
| |
Class Y: | | | | |
Net asset value and offering price per share | | $ | 18.26 | |
|
| |
Class R5: | | | | |
Net asset value and offering price per share | | $ | 18.06 | |
|
| |
Class R6: | | | | |
Net asset value and offering price per share | | $ | 18.05 | |
|
| |
See accompanying Notes to Financial Statements which are an integral part of the financial statements.
| | |
| 9 | | Invesco EQV International Small Company Fund |
Statement of Operations
For the year ended December 31, 2022
| | | | |
Investment income: | | | | |
| |
Dividends (net of foreign withholding taxes of $1,337,938) | | $ | 12,896,587 | |
|
| |
| |
Dividends from affiliates (includes net securities lending income of $115,573) | | | 637,693 | |
|
| |
Total investment income | | | 13,534,280 | |
|
| |
| |
Expenses: | | | | |
| |
Advisory fees | | | 3,111,318 | |
|
| |
| |
Administrative services fees | | | 48,858 | |
|
| |
Custodian fees | | | 55,989 | |
|
| |
Distribution fees: | | | | |
Class A | | | 334,478 | |
|
| |
Class C | | | 29,315 | |
|
| |
Transfer agent fees - A, C and Y | | | 397,269 | |
|
| |
Transfer agent fees - R5 | | | 14,940 | |
|
| |
Transfer agent fees - R6 | | | 42,042 | |
|
| |
Trustees’ and officers’ fees and benefits | | | 19,602 | |
|
| |
Registration and filing fees | | | 84,457 | |
|
| |
Reports to shareholders | | | 67,718 | |
|
| |
Professional services fees | | | 63,934 | |
|
| |
Other | | | 16,996 | |
|
| |
Total expenses | | | 4,286,916 | |
|
| |
Less: Fees waived and/or expense offset arrangement(s) | | | (28,297 | ) |
|
| |
Net expenses | | | 4,258,619 | |
|
| |
Net investment income | | | 9,275,661 | |
|
| |
| |
Realized and unrealized gain (loss) from: | | | | |
| |
Net realized gain (loss) from: | | | | |
Unaffiliated investment securities | | | 3,417,165 | |
|
| |
Affiliated investment securities | | | (2,681 | ) |
|
| |
Foreign currencies | | | (176,454 | ) |
|
| |
| | | 3,238,030 | |
|
| |
Change in net unrealized appreciation (depreciation) of: | | | | |
Unaffiliated investment securities | | | (50,776,524 | ) |
|
| |
Affiliated investment securities | | | 3,520 | |
|
| |
Foreign currencies | | | (18,309 | ) |
|
| |
| | | (50,791,313 | ) |
|
| |
Net realized and unrealized gain (loss) | | | (47,553,283 | ) |
|
| |
Net increase (decrease) in net assets resulting from operations | | $ | (38,277,622 | ) |
|
| |
See accompanying Notes to Financial Statements which are an integral part of the financial statements.
| | |
| 10 | | Invesco EQV International Small Company Fund |
Statement of Changes in Net Assets
For the years ended December 31, 2022 and 2021
| | | | | | | | |
| | | 2022 | | | 2021 | |
|
| |
Operations: | | | | | | | | |
| | |
Net investment income | | $ | 9,275,661 | | | $ | 4,167,159 | |
|
| |
Net realized gain | | | 3,238,030 | | | | 11,625,067 | |
|
| |
Change in net unrealized appreciation (depreciation) | | | (50,791,313 | ) | | | 31,722,209 | |
|
| |
Net increase (decrease) in net assets resulting from operations | | | (38,277,622 | ) | | | 47,514,435 | |
|
| |
| | |
Distributions to shareholders from distributable earnings: | | | | | | | | |
| | |
Class A | | | (3,833,669 | ) | | | (6,113,393 | ) |
|
| |
| | |
Class C | | | (63,024 | ) | | | (128,495 | ) |
|
| |
| | |
Class Y | | | (2,041,537 | ) | | | (1,668,013 | ) |
|
| |
| | |
Class R5 | | | (634,773 | ) | | | (479,671 | ) |
|
| |
| | |
Class R6 | | | (5,014,570 | ) | | | (5,856,055 | ) |
|
| |
Total distributions from distributable earnings | | | (11,587,573 | ) | | | (14,245,627 | ) |
|
| |
| | |
Share transactions-net: | | | | | | | | |
| | |
Class A | | | 1,811,612 | | | | 6,379,187 | |
|
| |
| | |
Class C | | | (279,008 | ) | | | (88,626 | ) |
|
| |
| | |
Class Y | | | 34,010,432 | | | | (912,243 | ) |
|
| |
| | |
Class R5 | | | 11,063,184 | | | | 3,924,448 | |
|
| |
| | |
Class R6 | | | 38,488,822 | | | | 42,324,774 | |
|
| |
Net increase in net assets resulting from share transactions | | | 85,095,042 | | | | 51,627,540 | |
|
| |
Net increase in net assets | | | 35,229,847 | | | | 84,896,348 | |
|
| |
| | |
Net assets: | | | | | | | | |
| | |
Beginning of year | | | 335,958,627 | | | | 251,062,279 | |
|
| |
End of year | | $ | 371,188,474 | | | $ | 335,958,627 | |
|
| |
See accompanying Notes to Financial Statements which are an integral part of the financial statements.
| | |
| 11 | | Invesco EQV International Small Company Fund |
Financial Highlights
The following schedule presents financial highlights for a share of the Fund outstanding throughout the periods indicated.
| | | | | | | | | | | | | | | | | | | | | | | | | | | | | | | | | | | | | | | | | | | | | | | | | | | | | | | | |
| | | Net asset
value,
beginning
of period | | Net
investment
income
(loss)(a) | | Net gains
(losses) on securities
(both
realized and
unrealized) | | Total from
investment
operations | | Dividends
from net
investment
income | | Distributions
from net
realized
gains | | Total
distributions | | Net asset
value, end
of period | | Total
return(b) | | Net assets,
end of period
(000’s omitted) | | Ratio of
expenses
to average net assets
with fee waivers
and/or
expenses
absorbed | | Ratio of
expenses
to average net
assets without
fee waivers
and/or
expenses
absorbed | | Ratio of net
investment
income
(loss) to average
net assets | | Portfolio
turnover (c) |
Class A | | | | | | | | | | | | | | | | | | | | | | | | | | | | | | | | | | | | | | | | | | | | | | | | | | | | | | | | |
Year ended 12/31/22 | | | $21.18 | | | | $0.48 | (d) | | | $(2.88 | ) | | | $(2.40 | ) | | | $(0.35 | ) | | | $(0.19 | ) | | | $(0.54 | ) | | | $18.24 | | | | (11.27 | )% | | | $131,971 | | | | 1.49 | % | | | 1.50 | % | | | 2.55 | %(d) | | | 10 | % |
Year ended 12/31/21 | | | 18.67 | | | | 0.26 | | | | 3.14 | | | | 3.40 | | | | (0.38 | ) | | | (0.51 | ) | | | (0.89 | ) | | | 21.18 | | | | 18.38 | | | | 150,947 | | | | 1.47 | | | | 1.47 | | | | 1.21 | | | | 6 | |
Year ended 12/31/20 | | | 17.13 | | | | 0.09 | | | | 1.66 | | | | 1.75 | | | | (0.10 | ) | | | (0.11 | ) | | | (0.21 | ) | | | 18.67 | | | | 10.23 | | | | 127,417 | | | | 1.60 | | | | 1.61 | | | | 0.57 | | | | 10 | |
Year ended 12/31/19 | | | 15.14 | | | | 0.28 | | | | 2.49 | | | | 2.77 | | | | (0.40 | ) | | | (0.38 | ) | | | (0.78 | ) | | | 17.13 | | | | 18.37 | | | | 139,919 | | | | 1.55 | | | | 1.56 | | | | 1.70 | | | | 10 | |
Year ended 12/31/18 | | | 19.33 | | | | 0.38 | (e) | | | (3.98 | ) | | | (3.60 | ) | | | (0.34 | ) | | | (0.25 | ) | | | (0.59 | ) | | | 15.14 | | | | (18.67 | ) | | | 131,610 | | | | 1.55 | | | | 1.56 | | | | 2.07 | (e) | | | 15 | |
Class C | | | | | | | | | | | | | | | | | | | | | | | | | | | | | | | | | | | | | | | | | | | | | | | | | | | | | | | | |
Year ended 12/31/22 | | | 20.02 | | | | 0.32 | (d) | | | (2.72 | ) | | | (2.40 | ) | | | (0.21 | ) | | | (0.19 | ) | | | (0.40 | ) | | | 17.22 | | | | (11.94 | ) | | | 2,713 | | | | 2.24 | | | | 2.25 | | | | 1.80 | (d) | | | 10 | |
Year ended 12/31/21 | | | 17.69 | | | | 0.09 | | | | 2.98 | | | | 3.07 | | | | (0.23 | ) | | | (0.51 | ) | | | (0.74 | ) | | | 20.02 | | | | 17.51 | | | | 3,472 | | | | 2.22 | | | | 2.22 | | | | 0.46 | | | | 6 | |
Year ended 12/31/20 | | | 16.30 | | | | (0.03 | ) | | | 1.55 | | | | 1.52 | | | | (0.02 | ) | | | (0.11 | ) | | | (0.13 | ) | | | 17.69 | | | | 9.36 | | | | 3,151 | | | | 2.35 | | | | 2.36 | | | | (0.18 | ) | | | 10 | |
Year ended 12/31/19 | | | 14.41 | | | | 0.15 | | | | 2.36 | | | | 2.51 | | | | (0.24 | ) | | | (0.38 | ) | | | (0.62 | ) | | | 16.30 | | | | 17.45 | | | | 4,213 | | | | 2.30 | | | | 2.31 | | | | 0.95 | | | | 10 | |
Year ended 12/31/18 | | | 18.38 | | | | 0.23 | (e) | | | (3.76 | ) | | | (3.53 | ) | | | (0.19 | ) | | | (0.25 | ) | | | (0.44 | ) | | | 14.41 | | | | (19.24 | ) | | | 12,845 | | | | 2.30 | | | | 2.31 | | | | 1.32 | (e) | | | 15 | |
Class Y | | | | | | | | | | | | | | | | | | | | | | | | | | | | | | | | | | | | | | | | | | | | | | | | | | | | | | | | |
Year ended 12/31/22 | | | 21.21 | | | | 0.52 | (d) | | | (2.88 | ) | | | (2.36 | ) | | | (0.40 | ) | | | (0.19 | ) | | | (0.59 | ) | | | 18.26 | | | | (11.08 | ) | | | 65,634 | | | | 1.24 | | | | 1.25 | | | | 2.80 | (d) | | | 10 | |
Year ended 12/31/21 | | | 18.69 | | | | 0.31 | | | | 3.16 | | | | 3.47 | | | | (0.44 | ) | | | (0.51 | ) | | | (0.95 | ) | | | 21.21 | | | | 18.70 | | | | 37,629 | | | | 1.22 | | | | 1.22 | | | | 1.46 | | | | 6 | |
Year ended 12/31/20 | | | 17.15 | | | | 0.13 | | | | 1.66 | | | | 1.79 | | | | (0.14 | ) | | | (0.11 | ) | | | (0.25 | ) | | | 18.69 | | | | 10.47 | | | | 34,240 | | | | 1.35 | | | | 1.36 | | | | 0.82 | | | | 10 | |
Year ended 12/31/19 | | | 15.16 | | | | 0.32 | | | | 2.50 | | | | 2.82 | | | | (0.45 | ) | | | (0.38 | ) | | | (0.83 | ) | | | 17.15 | | | | 18.66 | | | | 46,477 | | | | 1.30 | | | | 1.31 | | | | 1.95 | | | | 10 | |
Year ended 12/31/18 | | | 19.36 | | | | 0.43 | (e) | | | (3.99 | ) | | | (3.56 | ) | | | (0.39 | ) | | | (0.25 | ) | | | (0.64 | ) | | | 15.16 | | | | (18.44 | ) | | | 42,878 | | | | 1.30 | | | | 1.31 | | | | 2.32 | (e) | | | 15 | |
Class R5 | | | | | | | | | | | | | | | | | | | | | | | | | | | | | | | | | | | | | | | | | | | | | | | | | | | | | | | | |
Year ended 12/31/22 | | | 20.99 | | | | 0.54 | (d) | | | (2.86 | ) | | | (2.32 | ) | | | (0.42 | ) | | | (0.19 | ) | | | (0.61 | ) | | | 18.06 | | | | (11.00 | ) | | | 19,913 | | | | 1.12 | | | | 1.13 | | | | 2.92 | (d) | | | 10 | |
Year ended 12/31/21 | | | 18.51 | | | | 0.32 | | | | 3.13 | | | | 3.45 | | | | (0.46 | ) | | | (0.51 | ) | | | (0.97 | ) | | | 20.99 | | | | 18.78 | | | | 11,009 | | | | 1.13 | | | | 1.13 | | | | 1.55 | | | | 6 | |
Year ended 12/31/20 | | | 16.98 | | | | 0.15 | | | | 1.65 | | | | 1.80 | | | | (0.16 | ) | | | (0.11 | ) | | | (0.27 | ) | | | 18.51 | | | | 10.64 | | | | 6,297 | | | | 1.22 | | | | 1.23 | | | | 0.95 | | | | 10 | |
Year ended 12/31/19 | | | 15.01 | | | | 0.34 | | | | 2.48 | | | | 2.82 | | | | (0.47 | ) | | | (0.38 | ) | | | (0.85 | ) | | | 16.98 | | | | 18.84 | | | | 5,656 | | | | 1.18 | | | | 1.19 | | | | 2.07 | | | | 10 | |
Year ended 12/31/18 | | | 19.18 | | | | 0.44 | (e) | | | (3.96 | ) | | | (3.52 | ) | | | (0.40 | ) | | | (0.25 | ) | | | (0.65 | ) | | | 15.01 | | | | (18.37 | ) | | | 5,059 | | | | 1.21 | | | | 1.22 | | | | 2.41 | (e) | | | 15 | |
Class R6 | | | | | | | | | | | | | | | | | | | | | | | | | | | | | | | | | | | | | | | | | | | | | | | | | | | | | | | | |
Year ended 12/31/22 | | | 20.97 | | | | 0.56 | (d) | | | (2.86 | ) | | | (2.30 | ) | | | (0.43 | ) | | | (0.19 | ) | | | (0.62 | ) | | | 18.05 | | | | (10.91 | ) | | | 150,958 | | | | 1.05 | | | | 1.06 | | | | 2.99 | (d) | | | 10 | |
Year ended 12/31/21 | | | 18.49 | | | | 0.34 | | | | 3.12 | | | | 3.46 | | | | (0.47 | ) | | | (0.51 | ) | | | (0.98 | ) | | | 20.97 | | | | 18.88 | | | | 132,901 | | | | 1.06 | | | | 1.06 | | | | 1.62 | | | | 6 | |
Year ended 12/31/20 | | | 16.96 | | | | 0.16 | | | | 1.65 | | | | 1.81 | | | | (0.17 | ) | | | (0.11 | ) | | | (0.28 | ) | | | 18.49 | | | | 10.72 | | | | 79,958 | | | | 1.15 | | | | 1.16 | | | | 1.02 | | | | 10 | |
Year ended 12/31/19 | | | 15.00 | | | | 0.35 | | | | 2.47 | | | | 2.82 | | | | (0.48 | ) | | | (0.38 | ) | | | (0.86 | ) | | | 16.96 | | | | 18.88 | | | | 79,608 | | | | 1.11 | | | | 1.12 | | | | 2.14 | | | | 10 | |
Year ended 12/31/18 | | | 19.17 | | | | 0.45 | (e) | | | (3.95 | ) | | | (3.50 | ) | | | (0.42 | ) | | | (0.25 | ) | | | (0.67 | ) | | | 15.00 | | | | (18.31 | ) | | | 75,590 | | | | 1.14 | | | | 1.15 | | | | 2.48 | (e) | | | 15 | |
| (a) | Calculated using average shares outstanding. |
| (b) | Includes adjustments in accordance with accounting principles generally accepted in the United States of America and as such, the net asset value for financial reporting purposes and the returns based upon those net asset values may differ from the net asset value and returns for shareholder transactions. Does not include sales charges and is not annualized for periods less than one year, if applicable. |
| (c) | Portfolio turnover is calculated at the fund level and is not annualized for periods less than one year, if applicable. |
| (d) | Net investment income per share and the ratio of net investment income to average net assets include significant dividends received during the year ended December 31, 2022. Net investment income per share and the ratio of net investment income to average net assets excluding the significant dividends are $0.38 and 2.03%, $0.22 and 1.28%, $0.42 and 2.28%, $0.44 and 2.40% and $0.46 and 2.47% for Class A, Class C, Class Y, Class R5 and Class R6 shares, respectively. |
| (e) | Net investment income per share and the ratio of net investment income to average net assets includes significant dividends received during the year ended December 31, 2018. Net investment income per share and the ratio of net investment income to average net assets excluding the significant dividends are $0.33 and 1.82%, $0.18 and 1.07%, $0.38 and 2.07%, $0.39 and 2.16% and $0.40 and 2.23% for Class A, Class C, Class Y, Class R5 and Class R6 shares, respectively. |
See accompanying Notes to Financial Statements which are an integral part of the financial statements.
| | |
| 12 | | Invesco EQV International Small Company Fund |
Notes to Financial Statements
December 31, 2022
NOTE 1–Significant Accounting Policies
Invesco EQV International Small Company Fund, formerly Invesco International Small Company Fund, (the “Fund”) is a series portfolio of AIM Funds Group (Invesco Funds Group) (the “Trust”). The Trust is a Delaware statutory trust registered under the Investment Company Act of 1940, as amended (the “1940 Act”), as an open-end series management investment company authorized to issue an unlimited number of shares of beneficial interest. Information presented in these financial statements pertains only to the Fund. Matters affecting the Fund or each class will be voted on exclusively by the shareholders of the Fund or each class.
The Fund’s investment objective is long-term growth of capital.
The Fund currently consists of five different classes of shares: Class A, Class C, Class Y, Class R5 and Class R6. Class Y shares are available only to certain investors. Class A shares are sold with a front-end sales charge unless certain waiver criteria are met. Under certain circumstances, load waived shares may be subject to contingent deferred sales charges (“CDSC”). Class C shares are sold with a CDSC. Class Y, Class R5 and Class R6 shares are sold at net asset value. Class C shares held for eight years after purchase are eligible for automatic conversion into Class A shares of the same Fund (the “Conversion Feature”). The automatic conversion pursuant to the Conversion Feature will generally occur at the end of the month following the eighth anniversary after a purchase of Class C shares.
The Fund is an investment company and accordingly follows the investment company accounting and reporting guidance in accordance with Financial Accounting Standards Board Accounting Standards Codification Topic 946, Financial Services – Investment Companies.
The following is a summary of the significant accounting policies followed by the Fund in the preparation of its financial statements.
| A. | Security Valuations – Securities, including restricted securities, are valued according to the following policy. |
A security listed or traded on an exchange is generally valued at its trade price or official closing price that day as of the close of the exchange where the security is principally traded, or lacking any trades or official closing price on a particular day, the security may be valued at the closing bid price on that day. Securities traded in the over-the-counter market are valued based on prices furnished by independent pricing services or market makers. When such securities are valued using prices provided by an independent pricing service they may be considered fair valued. Futures contracts are valued at the daily settlement price set by an exchange on which they are principally traded. U.S. exchange-traded options are valued at the mean between the last bid and asked prices from the exchange on which they are principally traded. Non-U.S. exchange-traded options are valued at the final settlement price set by the exchange on which they trade. Options not listed on an exchange and swaps generally are valued using pricing provided from independent pricing services.
Securities of investment companies that are not exchange-traded (e.g., open-end mutual funds) are valued using such company’s end-of-business-day net asset value per share.
Deposits, other obligations of U.S. and non-U.S. banks and financial institutions are valued at their daily account value.
Fixed income securities (including convertible debt securities) generally are valued on the basis of prices provided by independent pricing services. Prices provided by the pricing service may be determined without exclusive reliance on quoted prices, and may reflect appropriate factors such as institution-size trading in similar groups of securities, developments related to specific securities, dividend rate (for unlisted equities), yield (for debt obligations), quality, type of issue, coupon rate (for debt obligations), maturity (for debt obligations), individual trading characteristics and other market data. Pricing services generally value debt obligations assuming orderly transactions of institutional round lot size, but a fund may hold or transact in the same securities in smaller, odd lot sizes. Odd lots often trade at lower prices than institutional round lots, and their value may be adjusted accordingly. Debt obligations are subject to interest rate and credit risks. In addition, all debt obligations involve some risk of default with respect to interest and/or principal payments.
Foreign securities’ (including foreign exchange contracts) prices are converted into U.S. dollar amounts using the applicable exchange rates as of the close of the New York Stock Exchange (“NYSE”). If market quotations are available and reliable for foreign exchange-traded equity securities, the securities will be valued at the market quotations. Invesco Advisers, Inc. (the “Adviser” or “Invesco”) may use various pricing services to obtain market quotations as well as fair value prices. Because trading hours for certain foreign securities end before the close of the NYSE, closing market quotations may become not representative of market value in the Adviser’s judgment (“unreliable”). If, between the time trading ends on a particular security and the close of the customary trading session on the NYSE, a significant event occurs that makes the closing price of the security unreliable, the Adviser may fair value the security. If the event is likely to have affected the closing price of the security, the security will be valued at fair value in good faith in accordance with Board- approved policies and related Adviser procedures (“Valuation Procedures”). Adjustments to closing prices to reflect fair value may also be based on a screening process of an independent pricing service to indicate the degree of certainty, based on historical data, that the closing price in the principal market where a foreign security trades is not the current value as of the close of the NYSE. Foreign securities’ prices meeting the degree of certainty that the price is not reflective of current value will be priced at the indication of fair value from the independent pricing service. Multiple factors may be considered by the independent pricing service in determining adjustments to reflect fair value and may include information relating to sector indices, American Depositary Receipts and domestic and foreign index futures. Foreign securities may have additional risks including exchange rate changes, potential for sharply devalued currencies and high inflation, political and economic upheaval, the relative lack of issuer information, relatively low market liquidity and the potential lack of strict financial and accounting controls and standards.
Unlisted securities will be valued using prices provided by independent pricing services or by another method that the Adviser, in its judgment, believes better reflects the security’s fair value in accordance with the Valuation Procedures.
Securities for which market prices are not provided by any of the above methods may be valued based upon quotes furnished by independent sources. The last bid price may be used to value equity securities. The mean between the last bid and asked prices may be used to value debt obligations, including corporate loans.
Securities for which market quotations are not readily available are fair valued by the Adviser in accordance with the Valuation Procedures. If a fair value price provided by a pricing service is unreliable, the Adviser will fair value the security using the Valuation Procedures. Issuer specific events, market trends, bid/asked quotes of brokers and information providers and other market data may be reviewed in the course of making a good faith determination of a security’s fair value.
The Fund may invest in securities that are subject to interest rate risk, meaning the risk that the prices will generally fall as interest rates rise and, conversely, the prices will generally rise as interest rates fall. Specific securities differ in their sensitivity to changes in interest rates depending on their individual characteristics. Changes in interest rates may result in increased market volatility, which may affect the value and/or liquidity of certain Fund investments.
Valuations change in response to many factors including the historical and prospective earnings of the issuer, the value of the issuer’s assets, general market conditions which are not specifically related to the particular issuer, such as real or perceived adverse economic conditions, changes in the general outlook for revenues or corporate earnings, changes in interest or currency rates, regional or global instability, natural or environmental disasters, widespread disease or other public health issues, war, acts of terrorism, significant governmental actions or adverse investor sentiment generally and market liquidity. Because of the inherent uncertainties of valuation, the values reflected in the financial statements may materially differ from the value received upon actual sale of those investments.
The price the Fund could receive upon the sale of any investment may differ from the Adviser’s valuation of the investment, particularly for securities that are valued using a fair valuation technique. When fair valuation techniques are applied, the Adviser uses available information, including both observable and unobservable inputs and assumptions, to determine a methodology that will result in a valuation that the Adviser believes approximates market value. Fund securities that are fair valued may be subject to greater fluctuation in their value from one day to the next than would be the case if market quotations were used. Because of the inherent uncertainties of valuation, and the degree of subjectivity in such decisions, the Fund could realize a greater or lesser than expected gain or loss upon the sale of the investment.
| | |
| 13 | | Invesco EQV International Small Company Fund |
| B. | Securities Transactions and Investment Income – Securities transactions are accounted for on a trade date basis. Realized gains or losses on sales are computed on the basis of specific identification of the securities sold. Interest income (net of withholding tax, if any) is recorded on an accrual basis from settlement date and includes coupon interest and amortization of premium and accretion of discount on debt securities as applicable. Dividend income (net of withholding tax, if any) is recorded on the ex-dividend date. |
The Fund may periodically participate in litigation related to Fund investments. As such, the Fund may receive proceeds from litigation settlements.Any proceeds received are included in the Statement of Operations as realized gain (loss) for investments no longer held and as unrealized gain (loss) for investments still held.
Brokerage commissions and mark ups are considered transaction costs and are recorded as an increase to the cost basis of securities purchased and/or a reduction of proceeds on a sale of securities. Such transaction costs are included in the determination of net realized and unrealized gain (loss) from investment securities reported in the Statement of Operations and the Statement of Changes in Net Assets and the net realized and unrealized gains (losses) on securities per share in the Financial Highlights. Transaction costs are included in the calculation of the Fund’s net asset value and, accordingly, they reduce the Fund’s total returns. These transaction costs are not considered operating expenses and are not reflected in net investment income reported in the Statement of Operations and the Statement of Changes in Net Assets, or the net investment income per share and the ratios of expenses and net investment income reported in the Financial Highlights, nor are they limited by any expense limitation arrangements between the Fund and the investment adviser.
The Fund allocates income and realized and unrealized capital gains and losses to a class based on the relative net assets of each class.
| C. | Country Determination – For the purposes of making investment selection decisions and presentation in the Schedule of Investments, the investment adviser may determine the country in which an issuer is located and/or credit risk exposure based on various factors. These factors include the laws of the country under which the issuer is organized, where the issuer maintains a principal office, the country in which the issuer derives 50% or more of its total revenues, the country that has the primary market for the issuer’s securities and its “country of risk” as determined by a third party service provider, as well as other criteria. Among the other criteria that may be evaluated for making this determination are the country in which the issuer maintains 50% or more of its assets, the type of security, financial guarantees and enhancements, the nature of the collateral and the sponsor organization. Country of issuer and/or credit risk exposure has been determined to be the United States of America, unless otherwise noted. |
| D. | Distributions – Distributions from net investment income and net realized capital gain, if any, are generally declared and paid annually and recorded on the ex-dividend date. The Fund may elect to treat a portion of the proceeds from redemptions as distributions for federal income tax purposes. |
| E. | Federal Income Taxes – The Fund intends to comply with the requirements of Subchapter M of the Internal Revenue Code of 1986, as amended (the “Internal Revenue Code”), necessary to qualify as a regulated investment company and to distribute substantially all of the Fund’s taxable earnings to shareholders. As such, the Fund will not be subject to federal income taxes on otherwise taxable income (including net realized capital gain) that is distributed to shareholders. Therefore, no provision for federal income taxes is recorded in the financial statements. |
The Fund recognizes the tax benefits of uncertain tax positions only when the position is more likely than not to be sustained. Management has analyzed the Fund’s uncertain tax positions and concluded that no liability for unrecognized tax benefits should be recorded related to uncertain tax positions. Management is not aware of any tax positions for which it is reasonably possible that the total amounts of unrecognized tax benefits will change materially in the next 12 months.
The Fund files tax returns in the U.S. Federal jurisdiction and certain other jurisdictions. Generally, the Fund is subject to examinations by such taxing authorities for up to three years after the filing of the return for the tax period.
| F. | Expenses – Fees provided for under the Rule 12b-1 plan of a particular class of the Fund are charged to the operations of such class. Transfer agency fees and expenses and other shareholder recordkeeping fees and expenses attributable to Class R5 and Class R6 are allocated based on relative net assets of Class R5 and Class R6. Sub-accounting fees attributable to Class R5 are charged to the operations of the class. Transfer agency fees and expenses and other shareholder recordkeeping fees and expenses relating to all other classes are allocated among those classes based on relative net assets. All other expenses are allocated among the classes based on relative net assets. |
| G. | Accounting Estimates – The preparation of financial statements in conformity with accounting principles generally accepted in the United States of America (“GAAP”) requires management to make estimates and assumptions that affect the reported amounts of assets and liabilities at the date of the financial statements and the reported amounts of revenues and expenses during the reporting period including estimates and assumptions related to taxation. Actual results could differ from those estimates by a significant amount. In addition, the Fund monitors for material events or transactions that may occur or become known after the period-end date and before the date the financial statements are released to print. |
| H. | Indemnifications – Under the Trust’s organizational documents, each Trustee, officer, employee or other agent of the Trust is indemnified against certain liabilities that may arise out of the performance of their duties to the Fund. Additionally, in the normal course of business, the Fund enters into contracts, including the Fund’s servicing agreements, that contain a variety of indemnification clauses. The Fund’s maximum exposure under these arrangements is unknown as this would involve future claims that may be made against the Fund that have not yet occurred. The risk of material loss as a result of such indemnification claims is considered remote. |
| I. | Securities Lending – The Fund may lend portfolio securities having a market value up to one-third of the Fund’s total assets. Such loans are secured by collateral equal to no less than the market value of the loaned securities determined daily by the securities lending provider. Such collateral will be cash or debt securities issued or guaranteed by the U.S. Government or any of its sponsored agencies. Cash collateral received in connection with these loans is invested in short-term money market instruments or affiliated, unregistered investment companies that comply with Rule 2a-7 under the 1940 Act and money market funds (collectively, “affiliated money market funds”) and is shown as such on the Schedule of Investments. The Fund bears the risk of loss with respect to the investment of collateral. It is the Fund’s policy to obtain additional collateral from or return excess collateral to the borrower by the end of the next business day, following the valuation date of the securities loaned. Therefore, the value of the collateral held may be temporarily less than the value of the securities on loan. When loaning securities, the Fund retains certain benefits of owning the securities, including the economic equivalent of dividends or interest generated by the security. Lending securities entails a risk of loss to the Fund if, and to the extent that, the market value of the securities loaned were to increase and the borrower did not increase the collateral accordingly, and the borrower failed to return the securities. The securities loaned are subject to termination at the option of the borrower or the Fund. Upon termination, the borrower will return to the Fund the securities loaned and the Fund will return the collateral. Upon the failure of the borrower to return the securities, collateral may be liquidated and the securities may be purchased on the open market to replace the loaned securities. The Fund could experience delays and costs in gaining access to the collateral and the securities may lose value during the delay which could result in potential losses to the Fund. Some of these losses may be indemnified by the lending agent. The Fund bears the risk of any deficiency in the amount of the collateral available for return to the borrower due to any loss on the collateral invested. Dividends received on cash collateral investments for securities lending transactions, which are net of compensation to counterparties, are included in Dividends from affiliated money market funds on the Statement of Operations. The aggregate value of securities out on loan, if any, is shown as a footnote on the Statement of Assets and Liabilities. |
The Adviser serves as an affiliated securities lending agent for the Fund. The Bank of New York Mellon also serves as a lending agent. To the extent the Fund utilizes the Adviser as an affiliated securities lending agent, the Fund conducts its securities lending in accordance with, and in reliance upon, no-action letters issued by the SEC staff that provide guidance on how an affiliate may act as a direct agent lender and receive compensation for those services in a manner consistent with the federal securities laws. For the year ended December 31, 2022, there were no securities lending transactions with the Adviser. Fees paid to the Adviser for securities lending agent services, if any, are included in Dividends from affiliated money market funds on the Statement of Operations.
| J. | Foreign Currency Translations – Foreign currency is valued at the close of the NYSE based on quotations posted by banks and major currency dealers. Portfolio securities and other assets and liabilities denominated in foreign currencies are translated into U.S. dollar amounts at the date of valuation. Purchases |
| | |
| 14 | | Invesco EQV International Small Company Fund |
| | and sales of portfolio securities (net of foreign taxes withheld on disposition) and income items denominated in foreign currencies are translated into U.S. dollar amounts on the respective dates of such transactions. The Fund does not separately account for the portion of the results of operations resulting from changes in foreign exchange rates on investments and the fluctuations arising from changes in market prices of securities held. The combined results of changes in foreign exchange rates and the fluctuation of market prices on investments (net of estimated foreign tax withholding) are included with the net realized and unrealized gain or loss from investments in the Statement of Operations. Reported net realized foreign currency gains or losses arise from (1) sales of foreign currencies, (2) currency gains or losses realized between the trade and settlement dates on securities transactions, and (3) the difference between the amounts of dividends, interest, and foreign withholding taxes recorded on the Fund’s books and the U.S. dollar equivalent of the amounts actually received or paid. Net unrealized foreign currency gains and losses arise from changes in the fair values of assets and liabilities, other than investments in securities at fiscal period end, resulting from changes in exchange rates. |
The Fund may invest in foreign securities, which may be subject to foreign taxes on income, gains on investments or currency repatriation, a portion of which may be recoverable. Foreign taxes, if any, are recorded based on the tax regulations and rates that exist in the foreign markets in which the Fund invests and are shown in the Statement of Operations.
| K. | Forward Foreign Currency Contracts - The Fund may engage in foreign currency transactions either on a spot (i.e. for prompt delivery and settlement) basis, or through forward foreign currency contracts, to manage or minimize currency or exchange rate risk. |
The Fund may also enter into forward foreign currency contracts for the purchase or sale of a security denominated in a foreign currency in order to “lock in” the U.S. dollar price of that security, or the Fund may also enter into forward foreign currency contracts that do not provide for physical exchange of the two currencies on the settlement date, but instead are settled by a single cash payment calculated as the difference between the agreed upon exchange rate and the spot rate at settlement based upon an agreed upon notional amount (non-deliverable forwards).
A forward foreign currency contract is an obligation between two parties (“Counterparties”) to purchase or sell a specific currency for an agreed-upon price at a future date. The use of forward foreign currency contracts for hedging does not eliminate fluctuations in the price of the underlying securities the Fund owns or intends to acquire but establishes a rate of exchange in advance. Fluctuations in the value of these contracts are measured by the difference in the contract date and reporting date exchange rates and are recorded as unrealized appreciation (depreciation) until the contracts are closed. When the contracts are closed, realized gains (losses) are recorded. Realized and unrealized gains (losses) on the contracts are included in the Statement of Operations. The primary risks associated with forward foreign currency contracts include failure of the Counterparty to meet the terms of the contract and the value of the foreign currency changing unfavorably. These risks may be in excess of the amounts reflected in the Statement of Assets and Liabilities.
| L. | COVID-19 Risk - The COVID-19 strain of coronavirus has resulted in instances of market closures and dislocations, extreme volatility, liquidity constraints and increased trading costs. Efforts to contain its spread have resulted in travel restrictions, disruptions of healthcare systems, business operations (including business closures) and supply chains, layoffs, lower consumer demand and employee availability, and defaults and credit downgrades, among other significant economic impacts that have disrupted global economic activity across many industries. Such economic impacts may exacerbate other pre-existing political, social and economic risks locally or globally and cause general concern and uncertainty. The full economic impact and ongoing effects of COVID-19 (or other future epidemics or pandemics) at the macro-level and on individual businesses are unpredictable and may result in significant and prolonged effects on the Fund’s performance. |
NOTE 2–Advisory Fees and Other Fees Paid to Affiliates
The Trust has entered into a master investment advisory agreement with the Adviser. Under the terms of the investment advisory agreement, the Fund accrues daily and pays monthly an advisory fee to the Adviser based on the annual rate of the Fund’s average daily net assets as follows:
| | | | |
| Average Daily Net Assets | | Rate | |
|
| |
First $ 250 million | | | 0.935% | |
|
| |
Next $250 million | | | 0.910% | |
|
| |
Next $500 million | | | 0.885% | |
|
| |
Next $1.5 billion | | | 0.860% | |
|
| |
Next $2.5 billion | | | 0.835% | |
|
| |
Next $2.5 billion | | | 0.810% | |
|
| |
Next $2.5 billion | | | 0.785% | |
|
| |
Over $10 billion | | | 0.760% | |
|
| |
For the year ended December 31, 2022, the effective advisory fee rate incurred by the Fund was 0.93%.
Under the terms of a master sub-advisory agreement between the Adviser and each of Invesco Asset Management Deutschland GmbH, Invesco Asset Management Limited, Invesco Asset Management (Japan) Limited, Invesco Hong Kong Limited, Invesco Senior Secured Management, Inc. and Invesco Canada Ltd. (collectively, the “Affiliated Sub-Advisers”) the Adviser, not the Fund, will pay 40% of the fees paid to the Adviser to any such Affiliated Sub-Adviser(s) that provide(s) discretionary investment management services to the Fund based on the percentage of assets allocated to such Affiliated Sub-Adviser(s).
The Adviser has contractually agreed, through at least June 30, 2023, to waive advisory fees and/or reimburse expenses of all shares to the extent necessary to limit total annual fund operating expenses after fee waiver and/or expense reimbursement (excluding certain items discussed below) of Class A, Class C, Class Y, Class R5 and Class R6 shares to 2.25%, 3.00%, 2.00%, 2.00% and 2.00% of the Fund’s average daily net assets, respectively (the “expense limits”). In determining the Adviser’s obligation to waive advisory fees and/or reimburse expenses, the following expenses are not taken into account, and could cause the total annual fund operating expenses after fee waiver and/or expense reimbursement to exceed the numbers reflected above: (1) interest; (2) taxes; (3) dividend expense on short sales; (4) extraordinary or non-routine items, including litigation expenses; and (5) expenses that the Fund has incurred but did not actually pay because of an expense offset arrangement. Unless Invesco continues the fee waiver agreement, it will terminate on June 30, 2023. During its term, the fee waiver agreement cannot be terminated or amended to increase the expense limits or reduce the advisory fee waiver without approval of the Board of Trustees. The Adviser did not waive fees and/or reimburse expenses during the period under these expense limits.
Further, the Adviser has contractually agreed, through at least June 30, 2024, to waive the advisory fee payable by the Fund in an amount equal to 100% of the net advisory fees the Adviser receives from the affiliated money market funds on investments by the Fund of uninvested cash (excluding investments of cash collateral from securities lending) in such affiliated money market funds.
For the year ended December 31, 2022, the Adviser waived advisory fees of $27,349.
The Trust has entered into a master administrative services agreement with Invesco pursuant to which the Fund has agreed to pay Invesco for certain administrative costs incurred in providing accounting services to the Fund. For the year ended December 31, 2022, expenses incurred under the agreement are shown in the Statement of Operations as Administrative services fees. Invesco has entered into a sub-administration agreement whereby State Street Bank and Trust Company (“SSB”) serves as fund accountant and provides certain administrative services to the Fund. Pursuant to a custody agreement with the Trust on behalf of the Fund, SSB also serves as the Fund’s custodian.
| | |
| 15 | | Invesco EQV International Small Company Fund |
The Trust has entered into a transfer agency and service agreement with Invesco Investment Services, Inc. (“IIS”) pursuant to which the Fund has agreed to pay IIS a fee for providing transfer agency and shareholder services to the Fund and reimburse IIS for certain expenses incurred by IIS in the course of providing such services. IIS may make payments to intermediaries that provide omnibus account services, sub-accounting services and/or networking services. All fees payable by IIS to intermediaries that provide omnibus account services or sub-accounting services are charged back to the Fund, subject to certain limitations approved by the Trust’s Board of Trustees. For the year ended December 31, 2022, expenses incurred under the agreement are shown in the Statement of Operations as Transfer agent fees.
The Trust has entered into master distribution agreements with Invesco Distributors, Inc. (“IDI”) to serve as the distributor for the Class A, Class C, Class Y, Class R5 and Class R6 shares of the Fund. The Trust has adopted plans pursuant to Rule 12b-1 under the 1940 Act with respect to the Fund’s Class A and Class C shares (collectively, the “Plans”). The Fund, pursuant to the Plans, pays IDI compensation at the annual rate of 0.25% of the Fund’s average daily net assets of Class A shares and 1.00% of the average daily net assets of Class C shares. The fees are accrued daily and paid monthly. Of the Plan payments, up to 0.25% of the average daily net assets of each class of shares may be paid to furnish continuing personal shareholder services to customers who purchase and own shares of such classes. Any amounts not paid as a service fee under the Plans would constitute an asset-based sales charge. Rules of the Financial Industry Regulatory Authority (“FINRA”) impose a cap on the total sales charges, including asset-based sales charges, that may be paid by any class of shares of the Fund. For the year ended December 31, 2022, expenses incurred under the Plans are shown in the Statement of Operations as Distribution fees.
Front-end sales commissions and CDSC (collectively, the “sales charges”) are not recorded as expenses of the Fund. Front-end sales commissions are deducted from proceeds from the sales of Fund shares prior to investment in Class A shares of the Fund. CDSC are deducted from redemption proceeds prior to remittance to the shareholder. During the year ended December 31, 2022, IDI advised the Fund that IDI retained $14,220 in front-end sales commissions from the sale of Class A shares and $2,505 and $94 from Class A and Class C shares, respectively, for CDSC imposed upon redemptions by shareholders.
For the year ended December 31, 2022, the Fund incurred $822 in brokerage commissions with Invesco Capital Markets, Inc., an affiliate of the Adviser and IDI, for portfolio transactions executed on behalf of the Fund.
Certain officers and trustees of the Trust are officers and directors of the Adviser, IIS and/or IDI.
NOTE 3–Additional Valuation Information
GAAP defines fair value as the price that would be received to sell an asset or paid to transfer a liability in an orderly transaction between market participants at the measurement date, under current market conditions. GAAP establishes a hierarchy that prioritizes the inputs to valuation methods, giving the highest priority to readily available unadjusted quoted prices in an active market for identical assets (Level 1) and the lowest priority to significant unobservable inputs (Level 3), generally when market prices are not readily available. Based on the valuation inputs, the securities or other investments are tiered into one of three levels. Changes in valuation methods may result in transfers in or out of an investment’s assigned level:
| | |
| Level 1 - | | Prices are determined using quoted prices in an active market for identical assets. |
| Level 2 - | | Prices are determined using other significant observable inputs. Observable inputs are inputs that other market participants may use in pricing a security. These may include quoted prices for similar securities, interest rates, prepayment speeds, credit risk, yield curves, loss severities, default rates, discount rates, volatilities and others. |
| Level 3 - | | Prices are determined using significant unobservable inputs. In situations where quoted prices or observable inputs are unavailable (for example, when there is little or no market activity for an investment at the end of the period), unobservable inputs may be used. Unobservable inputs reflect the Adviser’s assumptions about the factors market participants would use in determining fair value of the securities or instruments and would be based on the best available information. |
The following is a summary of the tiered valuation input levels, as of December 31, 2022. The level assigned to the securities valuations may not be an indication of the risk or liquidity associated with investing in those securities. Because of the inherent uncertainties of valuation, the values reflected in the financial statements may materially differ from the value received upon actual sale of those investments.
| | | | | | | | | | | | | | | | |
| | | Level 1 | | | Level 2 | | | Level 3 | | | Total | |
|
| |
Investments in Securities | | | | | | | | | | | | | | | | |
|
| |
Brazil | | $ | 3,290,713 | | | $ | 18,123,409 | | | | $– | | | $ | 21,414,122 | |
|
| |
Canada | | | 33,051,506 | | | | – | | | | – | | | | 33,051,506 | |
|
| |
China | | | – | | | | 13,535,450 | | | | – | | | | 13,535,450 | |
|
| |
Denmark | | | – | | | | 1,926,736 | | | | – | | | | 1,926,736 | |
|
| |
Egypt | | | – | | | | 7,593,213 | | | | – | | | | 7,593,213 | |
|
| |
France | | | – | | | | 36,104,578 | | | | – | | | | 36,104,578 | |
|
| |
Georgia | | | – | | | | 10,434,417 | | | | – | | | | 10,434,417 | |
|
| |
Germany | | | – | | | | 5,979,036 | | | | – | | | | 5,979,036 | |
|
| |
India | | | – | | | | 3,769,172 | | | | – | | | | 3,769,172 | |
|
| |
Indonesia | | | – | | | | 18,332,117 | | | | – | | | | 18,332,117 | |
|
| |
Ireland | | | – | | | | 2,285,438 | | | | – | | | | 2,285,438 | |
|
| |
Italy | | | – | | | | 10,765,888 | | | | – | | | | 10,765,888 | |
|
| |
Japan | | | – | | | | 14,911,081 | | | | – | | | | 14,911,081 | |
|
| |
Malaysia | | | – | | | | 8,699,996 | | | | – | | | | 8,699,996 | |
|
| |
Mexico | | | 15,883,738 | | | | – | | | | – | | | | 15,883,738 | |
|
| |
Netherlands | | | – | | | | 3,515,489 | | | | – | | | | 3,515,489 | |
|
| |
New Zealand | | | – | | | | 3,031,644 | | | | – | | | | 3,031,644 | |
|
| |
Poland | | | – | | | | 10,962,589 | | | | – | | | | 10,962,589 | |
|
| |
Romania | | | – | | | | 6,564,135 | | | | – | | | | 6,564,135 | |
|
| |
Singapore | | | – | | | | 4,347,521 | | | | – | | | | 4,347,521 | |
|
| |
South Africa | | | 5,078,220 | | | | 3,313,084 | | | | – | | | | 8,391,304 | |
|
| |
South Korea | | | – | | | | 9,260,095 | | | | – | | | | 9,260,095 | |
|
| |
Spain | | | – | | | | 3,340,765 | | | | – | | | | 3,340,765 | |
|
| |
Sweden | | | – | | | | 6,230,715 | | | | – | | | | 6,230,715 | |
|
| |
Switzerland | | | – | | | | 3,548,228 | | | | – | | | | 3,548,228 | |
|
| |
| | |
| 16 | | Invesco EQV International Small Company Fund |
| | | | | | | | | | | | | | |
| | | Level 1 | | | Level 2 | | | Level 3 | | Total | |
|
| |
Taiwan | | $ | – | | | $ | 6,846,824 | | | $– | | $ | 6,846,824 | |
|
| |
United Kingdom | | | – | | | | 52,315,116 | | | – | | | 52,315,116 | |
|
| |
United States | | | 6,360,415 | | | | 4,681,264 | | | – | | | 11,041,679 | |
|
| |
Money Market Funds | | | 35,967,189 | | | | – | | | – | | | 35,967,189 | |
|
| |
Total Investments | | $ | 99,631,781 | | | $ | 270,418,000 | | | $– | | $ | 370,049,781 | |
|
| |
NOTE 4–Expense Offset Arrangement(s)
The expense offset arrangement is comprised of transfer agency credits which result from balances in demand deposit accounts used by the transfer agent for clearing shareholder transactions. For the year ended December 31, 2022, the Fund received credits from this arrangement, which resulted in the reduction of the Fund’s total expenses of $948.
NOTE 5–Trustees’ and Officers’ Fees and Benefits
Trustees’ and Officers’ Fees and Benefits include amounts accrued by the Fund to pay remuneration to certain Trustees and Officers of the Fund. Trustees have the option to defer compensation payable by the Fund, and Trustees’ and Officers’ Fees and Benefits also include amounts accrued by the Fund to fund such deferred compensation amounts. Those Trustees who defer compensation have the option to select various Invesco Funds in which their deferral accounts shall be deemed to be invested. Finally, certain current Trustees were eligible to participate in a retirement plan that provided for benefits to be paid upon retirement to Trustees over a period of time based on the number of years of service. The Fund may have certain former Trustees who also participate in a retirement plan and receive benefits under such plan. Trustees’ and Officers’ Fees and Benefits include amounts accrued by the Fund to fund such retirement benefits. Obligations under the deferred compensation and retirement plans represent unsecured claims against the general assets of the Fund.
NOTE 6–Cash Balances
The Fund is permitted to temporarily carry a negative or overdrawn balance in its account with SSB, the custodian bank. Such balances, if any at period-end, are shown in the Statement of Assets and Liabilities under the payable caption Amount due custodian. To compensate the custodian bank for such overdrafts, the overdrawn Fund may either (1) leave funds as a compensating balance in the account so the custodian bank can be compensated by earning the additional interest; or (2) compensate by paying the custodian bank at a rate agreed upon by the custodian bank and Invesco, not to exceed the contractually agreed upon rate. The Fund may not purchase additional securities when any borrowings from banks or broker-dealers exceed 5% of the Fund’s total assets, or when any borrowings from an Invesco Fund are outstanding.
NOTE 7–Distributions to Shareholders and Tax Components of Net Assets
Tax Character of Distributions to Shareholders Paid During the Fiscal Years Ended December 31, 2022 and 2021:
| | | | | | | | | | | | |
| | | 2022 | | | | | | 2021 | |
|
| |
Ordinary income* | | $ | 7,790,347 | | | | | | | $ | 7,548,591 | |
|
| |
Long-term capital gain | | | 3,797,226 | | | | | | | | 6,697,036 | |
|
| |
Total distributions | | $ | 11,587,573 | | | | | | | $ | 14,245,627 | |
|
| |
| * | Includes short-term capital gain distributions, if any. |
Tax Components of Net Assets at Period-End:
| | | | |
| | | 2022 | |
|
| |
Undistributed ordinary income | | $ | 1,723,879 | |
|
| |
Undistributed long-term capital gain | | | 84,026 | |
|
| |
Net unrealized appreciation – investments | | | 34,138,299 | |
|
| |
Net unrealized appreciation (depreciation) – foreign currencies | | | (8,308 | ) |
|
| |
Temporary book/tax differences | | | (66,143 | ) |
|
| |
Shares of beneficial interest | | | 335,316,721 | |
|
| |
Total net assets | | $ | 371,188,474 | |
|
| |
The difference between book-basis and tax-basis unrealized appreciation (depreciation) is due to differences in the timing of recognition of gains and losses on investments for tax and book purposes. The Fund’s net unrealized appreciation (depreciation) difference is attributable primarily to passive foreign investment companies.
The temporary book/tax differences are a result of timing differences between book and tax recognition of income and/or expenses. The Fund’s temporary book/tax differences are the result of the trustee deferral of compensation and retirement plan benefits.
Capital loss carryforward is calculated and reported as of a specific date. Results of transactions and other activity after that date may affect the amount of capital loss carryforward actually available for the Fund to utilize. The ability to utilize capital loss carryforward in the future may be limited under the Internal Revenue Code and related regulations based on the results of future transactions.
The Fund does not have a capital loss carryforward as of December 31, 2022.
| | |
| 17 | | Invesco EQV International Small Company Fund |
NOTE 8–Investment Transactions
The aggregate amount of investment securities (other than short-term securities, U.S. Government obligations and money market funds, if any) purchased and sold by the Fund during the year ended December 31, 2022 was $111,027,802 and $31,218,182, respectively. Cost of investments, including any derivatives, on a tax basis includes the adjustments for financial reporting purposes as of the most recently completed federal income tax reporting period-end.
| | | | |
Unrealized Appreciation (Depreciation) of Investments on a Tax Basis | |
Aggregate unrealized appreciation of investments | | | $60,302,922 | |
|
| |
Aggregate unrealized (depreciation) of investments | | | (26,164,623 | ) |
|
| |
Net unrealized appreciation of investments | | | $34,138,299 | |
|
| |
Cost of investments for tax purposes is $335,911,482.
NOTE 9–Reclassification of Permanent Differences
Primarily as a result of differing book/tax treatment of foreign currency transactions, on December 31, 2022, undistributed net investment income was decreased by $174,078, undistributed net realized gain was increased by $177,180 and shares of beneficial interest was decreased by $3,102. This reclassification had no effect on the net assets of the Fund.
NOTE 10–Share Information
| | | | | | | | | | | | | | | | |
| | | Summary of Share Activity | |
|
| |
| | |
| | | Year ended | | | Year ended | |
| | | December 31, 2022(a) | | | December 31, 2021 | |
| | | Shares | | | Amount | | | Shares | | | Amount | |
|
| |
Sold: | | | | | | | | | | | | | | | | |
Class A | | | 1,111,536 | | | $ | 20,627,803 | | | | 1,058,014 | | | $ | 22,247,050 | |
|
| |
Class C | | | 35,093 | | | | 618,279 | | | | 41,704 | | | | 809,181 | |
|
| |
Class Y | | | 2,366,207 | | | | 44,197,209 | | | | 914,276 | | | | 19,335,568 | |
|
| |
Class R5 | | | 657,184 | | | | 12,578,887 | | | | 226,839 | | | | 4,812,197 | |
|
| |
Class R6 | | | 3,720,766 | | | | 70,279,827 | | | | 2,779,447 | | | | 58,352,819 | |
|
| |
| | | | |
Issued as reinvestment of dividends: | | | | | | | | | | | | | | | | |
Class A | | | 195,890 | | | | 3,510,417 | | | | 275,716 | | | | 5,657,712 | |
|
| |
Class C | | | 3,418 | | | | 57,826 | | | | 5,930 | | | | 115,034 | |
|
| |
Class Y | | | 99,094 | | | | 1,777,751 | | | | 67,234 | | | | 1,380,988 | |
|
| |
Class R5 | | | 35,782 | | | | 634,773 | | | | 23,594 | | | | 479,671 | |
|
| |
Class R6 | | | 269,144 | | | | 4,771,915 | | | | 276,696 | | | | 5,619,689 | |
|
| |
| | | | |
Automatic conversion of Class C shares to Class A shares: | | | | | | | | | | | | | | | | |
Class A | | | 9,836 | | | | 179,007 | | | | 6,582 | | | | 135,201 | |
|
| |
Class C | | | (10,445 | ) | | | (179,007 | ) | | | (6,969 | ) | | | (135,201 | ) |
|
| |
| | | | |
Reacquired: | | | | | | | | | | | | | | | | |
Class A | | | (1,206,371 | ) | | | (22,505,615 | ) | | | (1,039,335 | ) | | | (21,660,776 | ) |
|
| |
Class C | | | (43,908 | ) | | | (776,106 | ) | | | (45,318 | ) | | | (877,640 | ) |
|
| |
Class Y | | | (645,079 | ) | | | (11,964,528 | ) | | | (1,039,315 | ) | | | (21,628,799 | ) |
|
| |
Class R5 | | | (115,158 | ) | | | (2,150,476 | ) | | | (66,156 | ) | | | (1,367,420 | ) |
|
| |
Class R6 | | | (1,963,795 | ) | | | (36,562,920 | ) | | | (1,042,593 | ) | | | (21,647,734 | ) |
|
| |
Net increase in share activity | | | 4,519,194 | | | $ | 85,095,042 | | | | 2,436,346 | | | $ | 51,627,540 | |
|
| |
| (a) | There are entities that are record owners of more than 5% of the outstanding shares of the Fund and in the aggregate own 71% of the outstanding shares of the Fund. IDI has an agreement with these entities to sell Fund shares. The Fund, Invesco and/or Invesco affiliates may make payments to these entities, which are considered to be related to the Fund, for providing services to the Fund, Invesco and/or Invesco affiliates including but not limited to services such as securities brokerage, distribution, third party record keeping and account servicing. The Fund has no knowledge as to whether all or any portion of the shares owned of record by these entities are also owned beneficially. |
| | |
| 18 | | Invesco EQV International Small Company Fund |
Report of Independent Registered Public Accounting Firm
To the Board of Trustees of AIM Funds Group (Invesco Funds Group) and Shareholders of Invesco EQV International Small Company Fund
Opinion on the Financial Statements
We have audited the accompanying statement of assets and liabilities, including the schedule of investments, of Invesco EQV International Small Company Fund (one of the funds constituting AIM Funds Group (Invesco Funds Group), referred to hereafter as the “Fund”) as of December 31, 2022, the related statement of operations for the year ended December 31, 2022, the statement of changes in net assets for each of the two years in the period ended December 31, 2022, including the related notes, and the financial highlights for each of the five years in the period ended December 31, 2022 (collectively referred to as the “financial statements”). In our opinion, the financial statements present fairly, in all material respects, the financial position of the Fund as of December 31, 2022, the results of its operations for the year then ended, the changes in its net assets for each of the two years in the period ended December 31, 2022 and the financial highlights for each of the five years in the period ended December 31, 2022 in conformity with accounting principles generally accepted in the United States of America.
Basis for Opinion
These financial statements are the responsibility of the Fund’s management. Our responsibility is to express an opinion on the Fund’s financial statements based on our audits. We are a public accounting firm registered with the Public Company Accounting Oversight Board (United States) (PCAOB) and are required to be independent with respect to the Fund in accordance with the U.S. federal securities laws and the applicable rules and regulations of the Securities and Exchange Commission and the PCAOB.
We conducted our audits of these financial statements in accordance with the standards of the PCAOB. Those standards require that we plan and perform the audit to obtain reasonable assurance about whether the financial statements are free of material misstatement, whether due to error or fraud.
Our audits included performing procedures to assess the risks of material misstatement of the financial statements, whether due to error or fraud, and performing procedures that respond to those risks. Such procedures included examining, on a test basis, evidence regarding the amounts and disclosures in the financial statements. Our audits also included evaluating the accounting principles used and significant estimates made by management, as well as evaluating the overall presentation of the financial statements. Our procedures included confirmation of securities owned as of December 31, 2022 by correspondence with the custodian, transfer agent and brokers; when replies were not received from brokers, we performed other auditing procedures. We believe that our audits provide a reasonable basis for our opinion.
/s/PricewaterhouseCoopers LLP
Houston, Texas
February 22, 2023
We have served as the auditor of one or more of the investment companies in the Invesco group of investment companies since at least 1995. We have not been able to determine the specific year we began serving as auditor.
| | |
| 19 | | Invesco EQV International Small Company Fund |
Calculating your ongoing Fund expenses
Example
As a shareholder of the Fund, you incur two types of costs: (1) transaction costs, which may include sales charges (loads) on purchase payments or contingent deferred sales charges on redemptions, if any; and (2) ongoing costs, including management fees, distribution and/or service (12b-1) fees, and other Fund expenses. This example is intended to help you understand your ongoing costs (in dollars) of investing in the Fund and to compare these costs with ongoing costs of investing in other mutual funds. The example is based on an investment of $1,000 invested at the beginning of the period and held for the entire period July 1, 2022 through December 31, 2022.
Actual expenses
The table below provides information about actual account values and actual expenses. You may use the information in this table, together with the amount you invested, to estimate the expenses that you paid over the period. Simply divide your account value by $1,000 (for example, an $8,600 account value divided by $1,000 = 8.6), then multiply the result by the number in the table under the heading entitled “Actual Expenses Paid During Period” to estimate the expenses you paid on your account during this period.
Hypothetical example for comparison purposes
The table below also provides information about hypothetical account values and hypothetical expenses based on the Fund’s actual expense ratio and an assumed rate of return of 5% per year before expenses, which is not the Fund’s actual return.
The hypothetical account values and expenses may not be used to estimate the actual ending account balance or expenses you paid for the period. You may use this information to compare the ongoing costs of investing in the Fund and other funds. To do so, compare this 5% hypothetical example with the 5% hypothetical examples that appear in the shareholder reports of the other funds.
Please note that the expenses shown in the table are meant to highlight your ongoing costs only and do not reflect any transaction costs, such as sales charges (loads) on purchase payments or contingent deferred sales charges on redemptions, if any. Therefore, the hypothetical information is useful in comparing ongoing costs only, and will not help you determine the relative total costs of owning different funds. In addition, if these transaction costs were included, your costs would have been higher.
| | | | | | | | | | | | |
| | | | | ACTUAL | | HYPOTHETICAL (5% annual return before expenses) | | |
| | | Beginning
Account Value
(07/01/22) | | Ending
Account Value
(12/31/22)1 | | Expenses
Paid During
Period2 | | Ending
Account Value
(12/31/22) | | Expenses
Paid During
Period2 | | Annualized
Expense Ratio |
Class A | | $1,000.00 | | $1,044.00 | | $7.88 | | $1,017.49 | | $7.78 | | 1.53% |
Class C | | 1,000.00 | | 1,040.10 | | 11.72 | | 1,013.71 | | 11.57 | | 2.28 |
Class Y | | 1,000.00 | | 1,044.90 | | 6.49 | | 1,018.85 | | 6.41 | | 1.26 |
Class R5 | | 1,000.00 | | 1,045.40 | | 5.77 | | 1,019.56 | | 5.70 | | 1.12 |
Class R6 | | 1,000.00 | | 1,046.10 | | 5.47 | | 1,019.86 | | 5.40 | | 1.06 |
| 1 | The actual ending account value is based on the actual total return of the Fund for the period July 1, 2022 through December 31, 2022, after actual expenses and will differ from the hypothetical ending account value which is based on the Fund’s expense ratio and a hypothetical annual return of 5% before expenses. |
| 2 | Expenses are equal to the Fund’s annualized expense ratio as indicated above multiplied by the average account value over the period, multiplied by 184/365 to reflect the most recent fiscal half year. |
| | |
| 20 | | Invesco EQV International Small Company Fund |
Tax Information
Form 1099-DIV, Form 1042-S and other year–end tax information provide shareholders with actual calendar year amounts that should be included in their tax returns. Shareholders should consult their tax advisers.
The following distribution information is being provided as required by the Internal Revenue Code or to meet a specific state’s requirement.
The Fund designates the following amounts or, if subsequently determined to be different, the maximum amount allowable for its fiscal year ended December 31, 2022:
| | | | | | | | |
Federal and State Income Tax | | | | | | |
Long-Term Capital Gain Distributions | | $ | 3,797,226 | | | | | |
Qualified Dividend Income* | | | 95.21 | % | | | | |
Corporate Dividends Received Deduction* | | | 0.00 | % | | | | |
U.S. Treasury Obligations* | | | 0.00 | % | | | | |
Qualified Business Income* | | | 0.00 | % | | | | |
Business Interest Income* | | | 0.00 | % | | | | |
Foreign Taxes | | $ | 0.0488 | per share | | | | |
Foreign Source Income | | $ | 0.6927 | per share | | | | |
* The above percentages are based on ordinary income dividends paid to shareholders during the Fund’s fiscal year.
| | | | | | | | |
Non-Resident Alien Shareholders | | | | | | |
Short-Term Capital Gain Distributions | | | $2,774 | | | | | |
| | |
| 21 | | Invesco EQV International Small Company Fund |
Trustees and Officers
The address of each trustee and officer is AIM Funds Group (Invesco Funds Group) (the “Trust”), 11 Greenway Plaza, Suite 1000, Houston, Texas 77046-1173. The trustees serve for the life of the Trust, subject to their earlier death, incapacitation, resignation, retirement or removal as more specifically provided in the Trust’s organizational documents. Each officer serves for a one year term or until their successors are elected and qualified. Column two below includes length of time served with predecessor entities, if any.
| | | | | | | | |
Name, Year of Birth and
Position(s)
Held with the Trust | | Trustee and/or Officer Since | | Principal Occupation(s) During Past 5 Years | | Number of
Funds in
Fund Complex
Overseen by
Trustee | | Other Directorship(s) Held by Trustee During Past 5 Years |
| Interested Trustee |
| Martin L. Flanagan1 – 1960 Trustee and Vice Chair | | 2007 | | Executive Director, Chief Executive Officer and President, Invesco Ltd. (ultimate parent of Invesco and a global investment management firm); Trustee and Vice Chair, The Invesco Funds; Vice Chair, Investment Company Institute; and Member of Executive Board, SMU Cox School of Business Formerly: Advisor to the Board, Invesco Advisers, Inc. (formerly known as Invesco Institutional (N.A.), Inc.); Chairman and Chief Executive Officer, Invesco Advisers, Inc. (registered investment adviser); Director, Chairman, Chief Executive Officer and President, Invesco Holding Company (US), Inc. (formerly IVZ Inc.) (holding company), Invesco Group Services, Inc. (service provider) and Invesco North American Holdings, Inc. (holding company); Director, Chief Executive Officer and President, Invesco Holding Company Limited (parent of Invesco and a global investment management firm); Director, Invesco Ltd.; Chairman, Investment Company Institute and President, Co-Chief Executive Officer, Co-President, Chief Operating Officer and Chief Financial Officer, Franklin Resources, Inc. (global investment management organization) | | 189 | | None |
| 1 | Mr. Flanagan is considered an interested person (within the meaning of Section 2(a)(19) of the 1940 Act) of the Trust because he is an officer of the Adviser to the Trust, and an officer and a director of Invesco Ltd., ultimate parent of the Adviser. |
|
| T-1 Invesco EQV International Small Company Fund |
Trustees and Officers–(continued)
| | | | | | | | |
Name, Year of Birth and
Position(s)
Held with the Trust | | Trustee and/or Officer Since | | Principal Occupation(s) During Past 5 Years | | Number of
Funds in
Fund Complex
Overseen by
Trustee | | Other Directorship(s)
Held by Trustee
During Past 5 Years |
| Independent Trustees |
Beth Ann Brown – 1968 Trustee (2019) and Chair (August 2022) | | 2019 | | Independent Consultant Formerly: Head of Intermediary Distribution, Managing Director, Strategic Relations, Managing Director, Head of National Accounts, Senior Vice President, National Account Manager and Senior Vice President, Key Account Manager, Columbia Management Investment Advisers LLC; Vice President, Key Account Manager, Liberty Funds Distributor, Inc.; and Trustee of certain Oppenheimer Funds | | 189 | | Director, Board of Directors of Caron Engineering Inc.; Advisor, Board of Advisors of Caron Engineering Inc.; President and Director, Acton Shapleigh Youth Conservation Corps (non-profit) Formerly: President and Director Director of Grahamtastic Connection (non-profit) |
| Cynthia Hostetler –1962 Trustee | | 2017 | | Non-Executive Director and Trustee of a number of public and private business corporations Formerly: Director, Aberdeen Investment Funds (4 portfolios); Director, Artio Global Investment LLC (mutual fund complex); Director, Edgen Group, Inc. (specialized energy and infrastructure products distributor); Director, Genesee & Wyoming, Inc. (railroads); Head of Investment Funds and Private Equity, Overseas Private Investment Corporation; President, First Manhattan Bancorporation, Inc.; and Attorney, Simpson Thacher & Bartlett LLP | | 189 | | Resideo Technologies, Inc. (smart home technology); Vulcan Materials Company (construction materials company); Trilinc Global Impact Fund; Textainer Group Holdings, (shipping container leasing company); Investment Company Institute (professional organization); and Independent Directors Council (professional organization) |
Eli Jones – 1961 Trustee | | 2016 | | Professor and Dean Emeritus, Mays Business School - Texas A&M University Formerly: Dean of Mays Business School-Texas A&M University; Professor and Dean, Walton College of Business, University of Arkansas and E.J. Ourso College of Business, Louisiana State University; and Director, Arvest Bank | | 189 | | Insperity, Inc. (formerly known as Administaff) (human resources provider); and Member of Regional Board of Directors and Board of Directors, First Financial Bancorp (regional bank) |
Elizabeth Krentzman – 1959 Trustee | | 2019 | | Formerly: Principal and Chief Regulatory Advisor for Asset Management Services and U.S. Mutual Fund Leader of Deloitte & Touche LLP; General Counsel of the Investment Company Institute (trade association); National Director of the Investment Management Regulatory Consulting Practice, Principal, Director and Senior Manager of Deloitte & Touche LLP; Assistant Director of the Division of Investment Management - Office of Disclosure and Investment Adviser Regulation of the U.S. Securities and Exchange Commission and various positions with the Division of Investment Management - Office of Regulatory Policy of the U.S. Securities and Exchange Commission; Associate at Ropes & Gray LLP; and Trustee of certain Oppenheimer Funds | | 189 | | Formerly: Member of the Cartica Funds Board of Directors (private investment fund); Trustee of the University of Florida National Board Foundation; and Member of the University of Florida Law Center Association, Inc. Board of Trustees, Audit Committee and Membership Committee |
Anthony J. LaCava, Jr. – 1956 Trustee | | 2019 | | Formerly: Director and Member of the Audit Committee, Blue Hills Bank (publicly traded financial institution) and Managing Partner, KPMG LLP | | 189 | | Blue Hills Bank; Chairman, Bentley University; Member, Business School Advisory Council; and Nominating Committee, KPMG LLP |
Prema Mathai-Davis – 1950 Trustee | | 1998 | | Retired Formerly: Co-Founder & Partner of Quantalytics Research, LLC, (a FinTech Investment Research Platform for the Self-Directed Investor); Trustee of YWCA Retirement Fund; CEO of YWCA of the USA; Board member of the NY Metropolitan Transportation Authority; Commissioner of the NYC Department of Aging; and Board member of Johns Hopkins Bioethics Institute | | 189 | | Member of Board of Positive Planet US (non-profit) and HealthCare Chaplaincy Network (non-profit) |
T-2 Invesco EQV International Small Company Fund
Trustees and Officers–(continued)
| | | | | | | | |
Name, Year of Birth and
Position(s)
Held with the Trust | | Trustee and/or Officer Since | | Principal Occupation(s) During Past 5 Years | | Number of
Funds in
Fund Complex
Overseen by
Trustee | | Other Directorship(s)
Held by Trustee
During Past 5 Years |
| Independent Trustees–(continued) | | | | |
Joel W. Motley – 1952 Trustee | | 2019 | | Director of Office of Finance, Federal Home Loan Bank System; Managing Director of Carmona Motley Inc. (privately held financial advisor); Member of the Council on Foreign Relations and its Finance and Budget Committee; Chairman Emeritus of Board of Human Rights Watch and Member of its Investment Committee; and Member of Investment Committee Board of Historic Hudson Valley (non-profit cultural organization); Member of the Board, Blue Ocean Acquisition Corp.; and Member of the Vestry and the Investment Committee of Trinity Church Wall Street. Formerly: Managing Director of Public Capital Advisors, LLC (privately held financial advisor); Managing Director of Carmona Motley Hoffman, Inc. (privately held financial advisor); Trustee of certain Oppenheimer Funds; and Director of Columbia Equity Financial Corp. (privately held financial advisor) | | 189 | | Member of Board of Trust for Mutual Understanding (non-profit promoting the arts and environment); Member of Board of Greenwall Foundation (bioethics research foundation) and its Investment Committee; Member of Board of Friends of the LRC (non-profit legal advocacy); and Board Member and Investment Committee Member of Pulitzer Center for Crisis Reporting (non-profit journalism) |
Teresa M. Ressel – 1962 Trustee | | 2017 | | Non-executive director and trustee of a number of public and private business corporations Formerly: Chief Executive Officer, UBS Securities LLC (investment banking); Chief Operating Officer, UBS AG Americas (investment banking); Sr. Management Team Olayan America, The Olayan Group (international investor/commercial/industrial); Assistant Secretary for Management & Budget and Designated Chief Financial Officer, U.S. Department of Treasury and Director, ON Semiconductor Corporation (semiconductor manufacturing) | | 189 | | None |
Robert C. Troccoli – 1949 Trustee | | 2016 | | Retired Formerly: Adjunct Professor, University of Denver - Daniels College of Business; and Managing Partner, KPMG LLP | | 189 | | None |
Daniel S. Vandivort – 1954 Trustee | | 2019 | | President, Flyway Advisory Services LLC (consulting and property management) Formerly: President and Chief Investment Officer, previously Head of Fixed Income, Weiss Peck and Greer/Robeco Investment Management; Trustee and Chair, Weiss Peck and Greer Funds Board; and various capacities at CS First Boston including Head of Fixed Income at First Boston Asset Management. | | 189 | | Formerly: Trustee and Governance Chair, Oppenheimer Funds; Treasurer, Chairman of the Audit and Finance Committee, Huntington Disease Foundation of America |
T-3 Invesco EQV International Small Company Fund
Trustees and Officers–(continued)
| | | | | | | | |
Name, Year of Birth and Position(s) Held with the Trust | | Trustee and/or Officer Since | | Principal Occupation(s) During Past 5 Years | | Number of Funds in Fund Complex Overseen by Trustee | | Other Directorship(s) Held by Trustee During Past 5 Years |
| Officers | | | | | | | | |
Sheri Morris – 1964 President and Principal Executive Officer | | 1999 | | Director, Invesco Trust Company; Head of Global Fund Services, Invesco Ltd.; President and Principal Executive Officer, The Invesco Funds; Vice President, Invesco Exchange-Traded Fund Trust, Invesco Exchange-Traded Fund Trust II, Invesco India Exchange-Traded Fund Trust, Invesco Actively Managed Exchange-Traded Fund Trust, Invesco Actively Managed Exchange-Traded Commodity Fund Trust and Invesco Exchange-Traded Self-Indexed Fund Trust; and Vice President, OppenheimerFunds, Inc. Formerly: Vice President, Treasurer and Principal Financial Officer, The Invesco Funds; Vice President, Invesco AIM Advisers, Inc., Invesco AIM Capital Management, Inc. and Invesco AIM Private Asset Management, Inc.; Assistant Vice President and Assistant Treasurer, The Invesco Funds; Vice President and Assistant Vice President, Invesco Advisers, Inc.; Assistant Vice President, Invesco AIM Capital Management, Inc. and Invesco AIM Private Asset Management, Inc.; Treasurer, Invesco Exchange-Traded Fund Trust, Invesco Exchange-Traded Fund Trust II, Invesco India Exchange-Traded Fund Trust and Invesco Actively Managed Exchange-Traded Fund Trust; and Senior Vice President, Invesco Advisers, Inc. (formerly known as Invesco Institutional (N.A.), Inc.) (registered investment adviser) | | N/A | | N/A |
Jeffrey H. Kupor – 1968 Senior Vice President, Chief Legal Officer and Secretary | | 2018 | | Head of Legal of the Americas, Invesco Ltd.; Senior Vice President and Secretary, Invesco Advisers, Inc. (formerly known as Invesco Institutional (N.A.), Inc.) (registered investment adviser); Secretary, Invesco Distributors, Inc. (formerly known as Invesco AIM Distributors, Inc.); Vice President and Secretary, Invesco Investment Services, Inc. (formerly known as Invesco AIM Investment Services, Inc.); Senior Vice President, Chief Legal Officer and Secretary, The Invesco Funds; Secretary and General Counsel, Invesco Investment Advisers LLC (formerly known as Van Kampen Asset Management); Secretary and General Counsel, Invesco Capital Markets, Inc. (formerly known as Van Kampen Funds Inc.); Chief Legal Officer, Invesco Exchange-Traded Fund Trust, Invesco Exchange-Traded Fund Trust II, Invesco India Exchange-Traded Fund Trust, Invesco Actively Managed Exchange-Traded Fund Trust, Invesco Actively Managed Exchange-Traded Commodity Fund Trust and Invesco Exchange-Traded Self-Indexed Fund Trust;; Secretary and Vice President, Harbourview Asset Management Corporation; Secretary and Vice President, OppenheimerFunds, Inc. and Invesco Managed Accounts, LLC; Secretary and Senior Vice President, OFI Global Institutional, Inc.; Secretary and Vice President, OFI SteelPath, Inc.; Secretary and Vice President, Oppenheimer Acquisition Corp.; Secretary and Vice President, Shareholder Services, Inc.; and Secretary and Vice President, Trinity Investment Management Corporation Formerly: Senior Vice President, Invesco Distributors, Inc.; Secretary and Vice President, Jemstep, Inc.; Head of Legal, Worldwide Institutional, Invesco Ltd.; Secretary and General Counsel, INVESCO Private Capital Investments, Inc.; Senior Vice President, Secretary and General Counsel, Invesco Management Group, Inc. (formerly known as Invesco AIM Management Group, Inc.); Assistant Secretary, INVESCO Asset Management (Bermuda) Ltd.; Secretary and General Counsel, Invesco Private Capital, Inc.;Assistant Secretary and General Counsel, INVESCO Realty, Inc.; Secretary and General Counsel, Invesco Senior Secured Management, Inc.; Secretary, Sovereign G./P. Holdings Inc.; Secretary, Invesco Indexing LLC; and Secretary, W.L. Ross & Co., LLC | | N/A | | N/A |
Andrew R. Schlossberg – 1974 Senior Vice President | | 2019 | | Senior Vice President, Invesco Group Services, Inc.; Head of the Americas and Senior Managing Director, Invesco Ltd.; Director and Senior Vice President, Invesco Advisers, Inc. (formerly known as Invesco Institutional (N.A.), Inc.) (registered investment adviser); Director and Chairman, Invesco Investment Services, Inc. (formerly known as Invesco AIM Investment Services, Inc.) (registered transfer agent); Senior Vice President, The Invesco Funds; and Director, Invesco Investment Advisers LLC (formerly known as Van Kampen Asset Management) Formerly: Director, President and Chairman, Invesco Insurance Agency, Inc.; Director, Invesco UK Limited; Director and Chief Executive, Invesco Asset Management Limited and Invesco Fund Managers Limited; Assistant Vice President, The Invesco Funds; Senior Vice President, Invesco Advisers, Inc. (formerly known as Invesco Institutional (N.A.), Inc.) (registered investment adviser); Director and Chief Executive, Invesco Administration Services Limited and Invesco Global Investment Funds Limited; Director, Invesco Distributors, Inc.; Head of EMEA, Invesco Ltd.; President, Invesco Actively Managed Exchange-Traded Commodity Fund Trust, Invesco Actively Managed Exchange-Traded Fund Trust, Invesco Exchange-Traded Fund Trust, Invesco Exchange-Traded Fund Trust II and Invesco India Exchange-Traded Fund Trust; and Managing Director and Principal Executive Officer, Invesco Capital Management LLC | | N/A | | N/A |
T-4 Invesco EQV International Small Company Fund
Trustees and Officers–(continued)
| | | | | | | | |
Name, Year of Birth and Position(s) Held with the Trust | | Trustee and/or Officer Since | | Principal Occupation(s) During Past 5 Years | | Number of Funds in Fund Complex Overseen by Trustee | | Other Directorship(s) Held by Trustee During Past 5 Years |
| Officers–(continued) | | | | | | | | |
John M. Zerr – 1962 Senior Vice President | | 2006 | | Chief Operating Officer of the Americas; Senior Vice President, Invesco Advisers, Inc. (formerly known as Invesco Institutional (N.A.), Inc.) (registered investment adviser); Senior Vice President, Invesco Distributors, Inc. (formerly known as Invesco AIM Distributors, Inc.); Director and Vice President, Invesco Investment Services, Inc. (formerly known as Invesco AIM Investment Services, Inc.) Senior Vice President, The Invesco Funds; Managing Director, Invesco Capital Management LLC; Director, Invesco Investment Advisers LLC (formerly known as Van Kampen Asset Management); Senior Vice President, Invesco Capital Markets, Inc. (formerly known as Van Kampen Funds Inc.); Manager, Invesco Indexing LLC; Manager, Invesco Specialized Products, LLC; Member, Invesco Canada Funds Advisory Board; Director, President and Chief Executive Officer, Invesco Corporate Class Inc. (corporate mutual fund company); and Director, Chairman, President and Chief Executive Officer, Invesco Canada Ltd. (formerly known as Invesco Trimark Ltd./Invesco Trimark Ltèe) (registered investment adviser and registered transfer agent); President, Invesco, Inc.; President, Invesco Global Direct Real Estate Feeder GP Ltd.; President, Invesco IP Holdings (Canada) Ltd; President, Invesco Global Direct Real Estate GP Ltd.; President, Invesco Financial Services Ltd. / Services Financiers Invesco Ltée; and Director and Chairman, Invesco Trust Company Formerly: President, Trimark Investments Ltd/Services Financiers Invesco Ltee; Director and Senior Vice President, Invesco Insurance Agency, Inc.; Director and Senior Vice President, Invesco Management Group, Inc. (formerly known as Invesco AIM Management Group, Inc.); Secretary and General Counsel, Invesco Management Group, Inc. (formerly known as Invesco AIM Management Group, Inc.); Secretary, Invesco Investment Services, Inc. (formerly known as Invesco AIM Investment Services, Inc.); Chief Legal Officer and Secretary, The Invesco Funds; Secretary and General Counsel, Invesco Investment Advisers LLC (formerly known as Van Kampen Asset Management); Secretary and General Counsel, Invesco Capital Markets, Inc. (formerly known as Van Kampen Funds Inc.); Chief Legal Officer, Invesco Exchange-Traded Fund Trust, Invesco Exchange-Traded Fund Trust II, Invesco India Exchange-Traded Fund Trust, Invesco Actively Managed Exchange-Traded Fund Trust, Invesco Actively Managed Exchange-Traded Commodity Fund Trust and Invesco Exchange-Traded Self-Indexed Fund Trust; Secretary, Invesco Indexing LLC; Director, Secretary, General Counsel and Senior Vice President, Van Kampen Exchange Corp.; Director, Vice President and Secretary, IVZ Distributors, Inc. (formerly known as INVESCO Distributors, Inc.); Director and Vice President, INVESCO Funds Group, Inc.; Director and Vice President, Van Kampen Advisors Inc.; Director, Vice President, Secretary and General Counsel, Van Kampen Investor Services Inc.;Director and Secretary, Invesco Distributors, Inc. (formerly known as Invesco AIM Distributors, Inc.); Director, Senior Vice President, General Counsel and Secretary, Invesco AIM Advisers, Inc. and Van Kampen Investments Inc.; Director, Vice President and Secretary, Fund Management Company; Director, Senior Vice President, Secretary, General Counsel and Vice President, Invesco AIM Capital Management, Inc.; and Chief Operating Officer and General Counsel, Liberty Ridge Capital, Inc. (an investment adviser) | | N/A | | N/A |
Gregory G. McGreevey - 1962 Senior Vice President | | 2012 | | Senior Managing Director, Invesco Ltd.; Director, Chairman, President, and Chief Executive Officer, Invesco Advisers, Inc. (formerly known as Invesco Institutional (N.A.), Inc.) (registered investment adviser); Director, Invesco Mortgage Capital, Inc. and Invesco Senior Secured Management, Inc.; Senior Vice President, The Invesco Funds; President, SNW Asset Management Corporation and Invesco Managed Accounts, LLC; Chairman and Director, Invesco Private Capital, Inc.; Chairman and Director, INVESCO Private Capital Investments, Inc.; Chairman and Director, INVESCO Realty, Inc.; and Senior Vice President, Invesco Group Services, Inc. Formerly: Senior Vice President, Invesco Management Group, Inc. and Invesco Advisers, Inc.; Assistant Vice President, The Invesco Funds | | N/A | | N/A |
Adrien Deberghes- 1967 Principal Financial Officer, Treasurer and Vice President | | 2020 | | Head of the Fund Office of the CFO and Fund Administration; Vice President, Invesco Advisers, Inc.; Principal Financial Officer, Treasurer and Vice President, The Invesco Funds; Vice President, Invesco Exchange-Traded Fund Trust, Invesco Exchange-Traded Fund Trust II, Invesco India Exchange-Traded Fund Trust, Invesco Actively Managed Exchange-Traded Fund Trust, Invesco Actively Managed Exchange-Traded Commodity Fund Trust and Invesco Exchange-Traded Self-Indexed Fund Trust Formerly: Senior Vice President and Treasurer, Fidelity Investments | | N/A | | N/A |
Crissie M. Wisdom – 1969 Anti-Money Laundering Compliance Officer | | 2013 | | Anti-Money Laundering and OFAC Compliance Officer for Invesco U.S. entities including: Invesco Advisers, Inc. and its affiliates, Invesco Capital Markets, Inc., Invesco Distributors, Inc., Invesco Investment Services, Inc., The Invesco Funds, Invesco Capital Management, LLC, Invesco Trust Company; and Fraud Prevention Manager for Invesco Investment Services, Inc. | | N/A | | N/A |
T-5 Invesco EQV International Small Company Fund
Trustees and Officers–(continued)
| | | | | | | | |
Name, Year of Birth and Position(s) Held with the Trust | | Trustee and/or Officer Since | | Principal Occupation(s) During Past 5 Years | | Number of Funds in Fund Complex Overseen by Trustee | | Other Directorship(s) Held by Trustee During Past 5 Years |
| Officers–(continued) | | | | | | | | |
Todd F. Kuehl – 1969 Chief Compliance Officer and Senior Vice President | | 2020 | | Chief Compliance Officer, Invesco Advisers, Inc. (registered investment adviser); and Chief Compliance Officer and Senior Vice President, The Invesco Funds Formerly: Managing Director and Chief Compliance Officer, Legg Mason (Mutual Funds); Chief Compliance Officer, Legg Mason Private Portfolio Group (registered investment adviser) | | N/A | | N/A |
James Bordewick, Jr. – 1959 Senior Vice President and Senior Officer | | 2022 | | Senior Vice President and Senior Officer, The Invesco Funds Formerly: Chief Legal Officer, KingsCrowd, Inc. (research and analytical platform for investment in private capital markets); Chief Operating Officer and Head of Legal and Regulatory, Netcapital (private capital investment platform); Managing Director, General Counsel of asset management and Chief Compliance Officer for asset management and private banking, Bank of America Corporation; Chief Legal Officer, Columbia Funds and BofA Funds; Senior Vice President and Associate General Counsel, MFS Investment Management; Chief Legal Officer, MFS Funds; Associate, Ropes & Gray; and Associate, Gaston Snow & Ely Bartlett | | N/A | | N/A |
| | | | | | |
| Office of the Fund | | Investment Adviser | | Distributor | | Auditors |
| 11 Greenway Plaza, Suite 1000 | | Invesco Advisers, Inc. | | Invesco Distributors, Inc. | | PricewaterhouseCoopers LLP |
| Houston, TX 77046-1173 | | 1555 Peachtree Street, N.E. | | 11 Greenway Plaza, Suite 1000 | | 1000 Louisiana Street, Suite 5800 |
| | Atlanta, GA 30309 | | Houston, TX 77046-1173 | | Houston, TX 77002-5021 |
| | | |
| Counsel to the Fund | | Counsel to the Independent Trustees | | Transfer Agent | | Custodian |
| Stradley Ronon Stevens & Young, LLP | | Sidley Austin LLP | | Invesco Investment Services, Inc. | | State Street Bank and Trust Company |
| 2005 Market Street, Suite 2600 | | 787 Seventh Avenue | | 11 Greenway Plaza, Suite 1000 | | 225 Franklin Street |
| Philadelphia, PA 19103-7018 | | New York, NY 10019 | | Houston, TX 77046-1173 | | Boston, MA 02110-2801 |
T-6 Invesco EQV International Small Company Fund

Go paperless with eDelivery
Visit invesco.com/edelivery to enjoy the convenience and security of anytime electronic access to your investment documents.
With eDelivery, you can elect to have any or all of the following materials delivered straight to your inbox to download, save and print from your own computer:
∎ Fund reports and prospectuses
∎ Quarterly statements
∎ Daily confirmations
∎ Tax forms
Invesco mailing information
Send general correspondence to Invesco Investment Services, Inc., P.O. Box 219078, Kansas City, MO 64121-9078.
Important notice regarding delivery of security holder documents
To reduce Fund expenses, only one copy of most shareholder documents may be mailed to shareholders with multiple accounts at the same address (Householding). Mailing of your shareholder documents may be householded indefinitely unless you instruct us otherwise. If you do not want the mailing of these documents to be combined with those for other members of your household, please contact Invesco Investment Services, Inc. at 800 959 4246 or contact your financial institution. We will begin sending you individual copies for each account within 30 days after receiving your request.
Fund holdings and proxy voting information
The Fund provides a complete list of its portfolio holdings four times each year, at the end of each fiscal quarter. For the second and fourth quarters, the list appears, respectively, in the Fund’s semiannual and annual reports to shareholders. For the first and third quarters, the Fund files the list with the Securities and Exchange Commission (SEC) as an exhibit to its reports on Form N-PORT. The most recent list of portfolio holdings is available at invesco.com/completeqtrholdings. Shareholders can also look up the Fund’s Form N-PORT filings on the SEC website, sec.gov. The SEC file numbers for the Fund are shown below.
A description of the policies and procedures that the Fund uses to determine how to vote proxies relating to portfolio securities is available without charge, upon request, from our Client Services department at 800 959 4246, or at invesco.com/ corporate/about-us/esg. The information is also available on the SEC website, sec.gov.
Information regarding how the Fund voted proxies related to its portfolio securities during the most recent 12-month period ended June 30 is available at invesco.com/proxysearch. This information is also available on the SEC website, sec.gov.
Invesco Advisers, Inc. is an investment adviser; it provides investment advisory services to individual and institutional clients and does not sell securities. Invesco Distributors, Inc. is the US distributor for Invesco Ltd.’s retail mutual funds, exchange-traded funds and institutional money market funds. Both are wholly owned, indirect subsidiaries of Invesco Ltd.

| | | | | | |
SEC file number(s): 811-01540 and 002-27334 | | Invesco Distributors, Inc. | | ISC-AR-1 | | |

| | |
Annual Report to Shareholders | | December 31, 2022 |
Invesco Small Cap Equity Fund
Nasdaq:
A: SMEAX ∎ C: SMECX ∎ R: SMERX ∎ Y: SMEYX ∎ R5: SMEIX ∎ R6: SMEFX
Management’s Discussion of Fund Performance
|
Performance summary For the fiscal year ended December 31, 2022, Class A shares of Invesco Small Cap Equity Fund (the Fund), at net asset value (NAV), underperformed the Russell 2000 Index, the Fund’s style-specific benchmark. Your Fund’s long-term performance appears later in this report. |
Fund vs. Indexes |
| Total returns, 12/31/21 to 12/31/22, at net asset value (NAV). Performance shown does not include applicable contingent deferred sales charges (CDSC) or front-end sales charges, which would have reduced performance. |
| | | | |
Class A Shares | | | -20.60 | % |
Class C Shares | | | -21.20 | |
Class R Shares | | | -20.79 | |
Class Y Shares | | | -20.40 | |
Class R5 Shares | | | -20.32 | |
Class R6 Shares | | | -20.25 | |
S&P 500 Indexq (Broad Market Index) | | | -18.11 | |
Russell 2000 Indexq (Style-Specific Index) | | | -20.44 | |
Lipper Small-Cap Core Funds Index ∎ (Peer Group Index) | | | -15.22 | |
Source(s): q RIMES Technologies Corp.; ∎ Lipper Inc. | | | | |
Market conditions and your Fund
Equity markets declined in the first quarter of 2022 amid volatility sparked by Russia’s invasion of Ukraine, rising commodity prices, rampant global inflation and the US Federal Reserve’s (the Fed) shift toward tighter monetary policy. Russia’s invasion exacerbated inflation pressures, disrupting already strained supply chains and increasing shortages of oil, gas and raw materials. The price of oil rose sharply, with crude prices reaching their highest price per barrel since 2008.1 Inflation continued to be a top concern for consumers, investors and the Fed. To combat inflation, the Fed raised the federal funds rate by one-quarter percentage point in March and indicated it would “taper” its asset purchase program quickly.2
As the war in Ukraine continued and corporate earnings in high-profile names like Netflix reported slowing growth and profits, the equity markets sold off for much of April 2022. The downward direction of the equity markets continued into the second quarter of 2022 amid substantial inflation, rising interest rates and an increasing likelihood of a US recession. Driven by higher food and energy prices, the consumer price index rose by yet another 40-year high to 8.6% for the twelve months ended May 2022.3 Oil prices peaked near $122 per barrel in early June, resulting in skyrocketing gasoline prices; the national average price reached a record high, above $5 per gallon in early June.1 In an effort to tame inflation, the Fed raised the
benchmark federal funds rate three more times, by 0.50% in May, by 0.75% in June and another 0.75% in July, which were the largest increases in nearly 30 years.2 US equity markets rose in July and August until Fed chairman Jerome Powell’s hawkish comments at an economic policy symposium held in Jackson Hole, which sparked a sharp selloff at month-end. The Fed reiterated that it would continue taking aggressive action to curb inflation, even though such measures could “bring pain to households and businesses,” and the Fed raised the benchmark federal funds rate by another 0.75% in September.2
After experiencing a sharp drop in September 2022, US equity markets rebounded in October and November,4 despite mixed data on the economy and corporate earnings. However, the Fed’s message of continued rate hikes until data shows inflation meaningfully declining, sent markets lower in December.4 As energy prices declined,1 therateof inflation slowed modestly in the fourth quarter.3 Corporate earnings generally met expectations, though companies provided cautious future guidance. With inflation still at multi-decade highs and little evidence of a slowing economy, the Fed raised its target rate by 0.75% in November and by 0.50% in December, marking its highest level in over a decade.2
In this environment, US stocks had negative double-digit returns for the fiscal year of -18.11%, as measured by the S&P 500 Index.4
Given this environment, the Fund produced a negative return and underperformed its style-specific benchmark during the fiscal year.
Amid a challenging macro-environment for small-cap and growth-oriented stocks, the Fund benefited from steps taken by the portfolio management team to reposition the portfolio into more defensive and high-quality names offering stable growth and stable margins, while moving away from cyclical and interest rate sensitive areas of the market. At a sector level, positive relative performance was driven by stock selection across a broad set of sectors including financials, information technology, communication services, real estate and industrials. Active underweights in the communication services and real estate sectors as well as the portfolio’s ancillary cash position helped relative performance during the fiscal year. Alternatively, stock selection in the health care, materials and consumer discretionary sectors detracted from relative Fund performance. An underweight allocation in the energy, consumer staples and utilities sectors were head-winds as was an overweight allocation to the consumer discretionary sector.
Top individual contributors to the Fund’s absolute performance during the fiscal year included Weatherford International, LPL Financial and ChemoCentryx.
Oil service company, Weatherford International was a contributor to absolute Fund performance during the fiscal year despite facing a sell-off earlier in the year when oil prices declined. Demand remains strong, however, and Weatherford International continues to deliver positive fundamental results. With its current attractive valuations and the continued margin expansion opportunities from improved technological infrastructure and consolidating its footprint, it remains a name we continue to have a positive outlook on.
Another leading contributor to absolute Fund performance was LPL Financial, which did relatively well in the fiscal year versus other interest rate sensitive stocks due to its ability to provide good interest rate exposure with less credit risk than a bank, while also delivering strong growth in assets under management as more registered investment advisors join the LPL platform. This is a continuation of trends that have been ongoing for several quarters.
|
| 2 Invesco Small Cap Equity Fund |
ChemoCentryx is a biopharmaceutical
company focused on discovering, developing and commercializing orally administered therapeutics to treat autoimmune diseases, inflammatory disorders and cancer, primarily focused on orphan and rare diseases. ChemoCentryx’s share price rallied during the fiscal year following an announced buyout offer made by Amgen (not a fund holding) for a whopping 116% premium relative to the most recent closing share price at the time of the announcement. The deal closed in the fourth quarter of 2022 for $52 per share in cash and brought with it recent FDA approved Anti-Neutrophil Cytoplasmic Autoantibody associated vasculitis drug, Tavneos, as well as a few additional drug candidates that are still in the development stage. We exited our position during the fiscal year.
Top individual detractors from the Fund’s absolute performance included MP Materials, Quanterix and NeoGenomics.
Las Vegas based rare earth materials company MP Materials was the leading detractor from absolute Fund performance in 2022. MP Materials owns and operates the Mountain Pass mine, the only operating rare earth mine and processing facility in the United States. The stock came under pressure during the fiscal year due to price volatility for rare earth oxides related to demand head-winds in Europe resulting from the war in Ukraine and COVID-19 lockdowns in China. Despite the price volatility, demand for rare earth materials is expected to remain strong as demand for electric vehicles grows.
Another leading detractor from absolute Fund performance was the health care company, Quanterix. Early in 2022 the life sciences and tools company had gross margin issues reported in its first quarter earnings report resulting from lower production late in the quarter that yielded less fixed-cost absorption, which was disappointing. As an earlier stage, higher-growth company, Quanterix came under pressure due to rising interest rates and management announced a realignment of business activities to navigate the challenging macro backdrop. We sold our position in Quanterix during the fiscal year as a result of the business realignment.
NeoGenomics detracted from absolute Fund performance during the fiscal year due to a couple of recent developments. Late in the first quarter of 2022, the company announced its CEO of only 11 months, would be stepping down.
Additionally, the company withdrew its revenue guidance for 2022, which suggests that their core lab business is continuing to face COVID-19-related head-winds such as limited staffing, patient access and scheduling. We expect these disruptions will abate over time. We exited our position during the fiscal year.
We wish to remind you that all positioning changes are based on a bottom-up stock selection process. Our portfolio construction is designed to manage risk and ensure alignment with small-cap market sector exposure within modest over- and underweights. At the close of the fiscal year, the Fund’s largest underweight exposures relative to the Russell 2000 Index were in the health care, real estate, utilities and consumer staples sectors. Conversely, the Fund’s largest overweight exposures were in the industrials, financials and materials sectors.
The war in Ukraine has continued to drive market uncertainty and persistent inflationary pressure. The Fed continued to aggressively raise interest rates to combat inflation, causing meaningful slowing in housing and significantly tighter financial conditions. In our view, the US economy could enter into a recession in 2023, as we expect already the Fed will continue raising rates to combat inflation despite the weakening economy given the labor market remains healthy. We anticipate earnings expectations to further decline as we enter the new year and our overall outlook remains guarded. In this environment, we have repositioned the portfolio into high-quality, stable revenue and energy stocks and away from long-duration growth and cyclical revenue stocks.
Thank you for your commitment to the Invesco Small Cap Equity Fund and for sharing our long-term investment horizon.
| 2 | Source: US Federal Reserve |
| 3 | Source: US Bureau of Labor Statistics |
Portfolio manager(s):
Juan Hartsfield - Lead
Davis Paddock
The views and opinions expressed in management’s discussion of Fund performance are those of Invesco Advisers, Inc. and its affiliates. These views and opinions are subject to change at any time based on factors such as market and economic conditions. These views and opinions may not be relied upon as investment advice or recommendations, or as an offer for a particular security. The
information is not a complete analysis of every aspect of any market, country, industry, security or the Fund. Statements of fact are from sources considered reliable, but Invesco Advisers, Inc. makes no representation or warranty as to their completeness or accuracy. Although historical performance is no guarantee of future results, these insights may help you understand our investment management philosophy.
See important Fund and, if applicable, index disclosures later in this report.
|
| 3 Invesco Small Cap Equity Fund |
Your Fund’s Long-Term Performance
Results of a $10,000 Investment – Oldest Share Class(es)
Fund and index data from 12/31/12
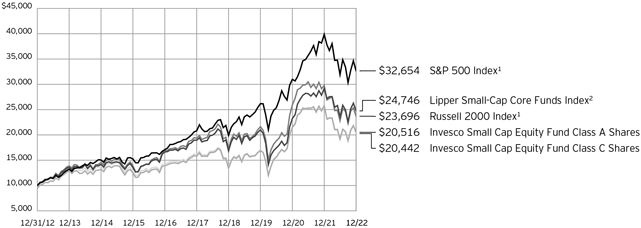
| 1 | Source: RIMES Technologies Corp. |
Past performance cannot guarantee future results.
The data shown in the chart include reinvested distributions, applicable sales charges and Fund expenses including
management fees. Index results include reinvested dividends, but they do not reflect sales charges. Performance of the peer group, if applicable, reflects fund expenses and management fees; perfor-
mance of a market index does not. Performance shown in the chart does not reflect deduction of taxes a shareholder would pay on Fund distributions or sale of Fund shares.
|
| 4 Invesco Small Cap Equity Fund |
| | | | |
Average Annual Total Returns | |
| As of 12/31/22, including maximum applicable sales charges | |
| |
Class A Shares | | | | |
Inception (8/31/00) | | | 6.68 | % |
10 Years | | | 7.45 | |
5 Years | | | 4.17 | |
1 Year | | | -24.95 | |
| |
Class C Shares | | | | |
Inception (8/31/00) | | | 6.67 | % |
10 Years | | | 7.41 | |
5 Years | | | 4.55 | |
1 Year | | | -21.96 | |
| |
Class R Shares | | | | |
Inception (6/3/02) | | | 7.00 | % |
10 Years | | | 7.79 | |
5 Years | | | 5.09 | |
1 Year | | | -20.79 | |
| |
Class Y Shares | | | | |
Inception (10/3/08) | | | 8.72 | % |
10 Years | | | 8.33 | |
5 Years | | | 5.62 | |
1 Year | | | -20.40 | |
| |
Class R5 Shares | | | | |
Inception (4/29/05) | | | 8.23 | % |
10 Years | | | 8.50 | |
5 Years | | | 5.78 | |
1 Year | | | -20.32 | |
| |
Class R6 Shares | | | | |
Inception (9/24/12) | | | 8.50 | % |
10 Years | | | 8.58 | |
5 Years | | | 5.84 | |
1 Year | | | -20.25 | |
The performance data quoted represent past performance and cannot guarantee future results; current performance may be lower or higher. Please visit invesco.com/performance for the most recent month-end performance. Performance figures reflect reinvested distributions, changes in net asset value and the effect of the maximum sales charge unless otherwise stated. Performance figures do not reflect deduction of taxes a shareholder would pay on Fund distributions or sale of Fund shares. Investment return and principal value will fluctuate so that you may have a gain or loss when you sell shares.
Class A share performance reflects the maximum 5.50% sales charge, and Class C share performance reflects the applicable contingent deferred sales charge (CDSC) for the period involved. The CDSC on Class C shares is 1% for the first year after purchase. Class R, Class Y, Class R5 and Class R6 shares
do not have a front-end sales charge or a CDSC; therefore, performance is at net asset value.
The performance of the Fund’s share classes will differ primarily due to different sales charge structures and class expenses.
Fund performance reflects any applicable fee waivers and/or expense reimbursements. Had the adviser not waived fees and/or reimbursed expenses currently or in the past, returns would have been lower. See current prospectus for more information.
|
| 5 Invesco Small Cap Equity Fund |
Supplemental Information
Invesco Small Cap Equity Fund’s investment objective is long-term growth of capital.
∎ Unless otherwise stated, information presented in this report is as of December 31, 2022, and is based on total net assets.
∎ Unless otherwise noted, all data is provided by Invesco.
∎ To access your Fund’s reports/prospectus, visit invesco.com/fundreports.
About indexes used in this report
| ∎ | The S&P 500® Index is an unmanaged index considered representative of the US stock market. |
| ∎ | The Russell 2000® Index is an unmanaged index considered representative of small-cap stocks. The Russell 2000 Index is a trademark/service mark of the Frank Russell Co. Russell® is a trademark of the Frank Russell Co. |
| ∎ | The Lipper Small-Cap Core Funds Index is an unmanaged index considered representative of small-cap core funds tracked by Lipper. |
| ∎ | The Fund is not managed to track the performance of any particular index, including the index(es) described here, and consequently, the performance of the Fund may deviate significantly from the performance of the index(es). |
| ∎ | A direct investment cannot be made in an index. Unless otherwise indicated, index results include reinvested dividends, and they do not reflect sales charges. Performance of the peer group, if applicable, reflects fund expenses; performance of a market index does not. |
| | | | |
This report must be accompanied or preceded by a currently effective Fund prospectus, which contains more complete information, including sales charges and expenses. Investors should read it carefully before investing.
| | |
| | | | |
| NOT FDIC INSURED | MAY LOSE VALUE | NO BANK GUARANTEE | | |
|
| 6 Invesco Small Cap Equity Fund |
Fund Information
Portfolio Composition
| | |
| By sector | | % of total net assets |
| |
Financials | | 20.59% |
| |
Industrials | | 19.80 |
| |
Health Care | | 12.02 |
| |
Information Technology | | 11.86 |
| |
Consumer Discretionary | | 10.80 |
| |
Energy | | 6.89 |
| |
Materials | | 5.10 |
| |
Real Estate | | 4.18 |
| |
Consumer Staples | | 2.56 |
| |
Utilities | | 2.19 |
| |
Communication Services | | 1.80 |
| |
Money Market Funds Plus Other Assets Less Liabilities | | 2.21 |
Top 10 Equity Holdings*
| | |
| | | % of total net assets |
| |
1. Weatherford International PLC | | 2.44% |
| |
2. WillScot Mobile Mini Holdings Corp. | | 1.80 |
| |
3. Blucora, Inc. | | 1.60 |
| |
4. Reinsurance Group of America, Inc. | | 1.56 |
| |
5. Summit Materials, Inc., Class A | | 1.55 |
| |
6. Visteon Corp. | | 1.54 |
| |
7. Huron Consulting Group, Inc. | | 1.53 |
| |
8. Gaming and Leisure Properties, Inc. | | 1.52 |
| |
9. Matador Resources Co. | | 1.50 |
| |
10. Flex Ltd. | | 1.48 |
The Fund’s holdings are subject to change, and there is no assurance that the Fund will continue to hold any particular security.
| * | Excluding money market fund holdings, if any. |
Data presented here are as of December 31, 2022.
7 Invesco Small Cap Equity Fund
Schedule of Investments(a)
December 31, 2022
| | | | | | | | |
| | | Shares | | | Value | |
Common Stocks & Other Equity Interests–97.79% | |
Aerospace & Defense–1.26% | |
Curtiss-Wright Corp. | | | 64,841 | | | $ | 10,827,799 | |
|
| |
|
Air Freight & Logistics–0.88% | |
Air Transport Services Group,
Inc.(b)(c) | | | 288,698 | | | | 7,500,374 | |
|
| |
|
Alternative Carriers–1.41% | |
Iridium Communications, Inc.(b) | | | 234,930 | | | | 12,075,402 | |
|
| |
|
Apparel, Accessories & Luxury Goods–1.33% | |
Oxford Industries, Inc.(c) | | | 122,331 | | | | 11,398,803 | |
|
| |
|
Application Software–3.13% | |
Descartes Systems Group, Inc.
(The) (Canada)(b) | | | 146,863 | | | | 10,229,008 | |
|
| |
Manhattan Associates, Inc.(b) | | | 81,977 | | | | 9,952,008 | |
|
| |
Workiva, Inc.(b)(c) | | | 78,328 | | | | 6,577,202 | |
|
| |
| | | | | | | 26,758,218 | |
|
| |
|
Asset Management & Custody Banks–2.62% | |
Blucora, Inc.(b) | | | 537,312 | | | | 13,717,575 | |
|
| |
Federated Hermes, Inc., Class B | | | 240,928 | | | | 8,748,096 | |
|
| |
| | | | | | | 22,465,671 | |
|
| |
|
Auto Parts & Equipment–1.54% | |
Visteon Corp.(b) | | | 100,817 | | | | 13,189,888 | |
|
| |
|
Automotive Retail–0.86% | |
Lithia Motors, Inc., Class A(c) | | | 35,816 | | | | 7,332,968 | |
|
| |
|
Biotechnology–2.08% | |
Ascendis Pharma A/S, ADR (Denmark)(b)(c) | | | 49,491 | | | | 6,044,336 | |
|
| |
CRISPR Therapeutics AG (Switzerland)(b)(c) | | | 41,570 | | | | 1,689,821 | |
|
| |
Karuna Therapeutics, Inc.(b)(c) | | | 18,117 | | | | 3,559,990 | |
|
| |
Mirati Therapeutics, Inc.(b) | | | 46,965 | | | | 2,127,984 | |
|
| |
Natera, Inc.(b)(c) | | | 109,609 | | | | 4,402,994 | |
|
| |
| | | | | | | 17,825,125 | |
|
| |
|
Casinos & Gaming–0.50% | |
Penn Entertainment, Inc.(b)(c) | | | 142,809 | | | | 4,241,427 | |
|
| |
|
Construction & Engineering–1.80% | |
WillScot Mobile Mini Holdings Corp.(b) | | | 340,872 | | | | 15,397,188 | |
|
| |
|
Construction Materials–1.55% | |
Summit Materials, Inc.,
Class A(b)(c) | | | 466,312 | | | | 13,238,592 | |
|
| |
|
Data Processing & Outsourced Services–0.94% | |
Concentrix Corp. | | | 60,531 | | | | 8,060,308 | |
|
| |
|
Diversified Metals & Mining–0.93% | |
MP Materials Corp.(b)(c) | | | 326,277 | | | | 7,922,006 | |
|
| |
| | | | | | | | |
| | | Shares | | | Value | |
Electrical Components & Equipment–2.01% | |
EnerSys | | | 109,344 | | | $ | 8,073,961 | |
|
| |
Vertiv Holdings Co. | | | 668,067 | | | | 9,125,795 | |
|
| |
| | | | | | | 17,199,756 | |
|
| |
|
Electronic Equipment & Instruments–1.27% | |
Badger Meter, Inc. | | | 99,690 | | | | 10,869,201 | |
|
| |
|
Electronic Manufacturing Services–2.56% | |
Flex Ltd.(b) | | | 588,117 | | | | 12,620,991 | |
|
| |
Jabil, Inc. | | | 135,919 | | | | 9,269,676 | |
|
| |
| | | | | | | 21,890,667 | |
|
| |
|
Environmental & Facilities Services–2.07% | |
Casella Waste Systems, Inc., Class A(b)(c) | | | 138,875 | | | | 11,014,176 | |
|
| |
Montrose Environmental Group,
Inc.(b)(c) | | | 151,611 | | | | 6,730,013 | |
|
| |
| | | | | | | 17,744,189 | |
|
| |
|
Financial Exchanges & Data–1.25% | |
TMX Group Ltd. (Canada) | | | 106,687 | | | | 10,678,155 | |
|
| |
|
Food Retail–1.22% | |
Sprouts Farmers Market, Inc.(b)(c) | | | 321,394 | | | | 10,403,524 | |
|
| |
|
Gas Utilities–0.92% | |
ONE Gas, Inc. | | | 104,377 | | | | 7,903,426 | |
|
| |
|
General Merchandise Stores–0.84% | |
Ollie’s Bargain Outlet Holdings,
Inc.(b)(c) | | | 153,179 | | | | 7,174,904 | |
|
| |
|
Health Care Distributors–0.58% | |
Owens & Minor, Inc. | | | 252,562 | | | | 4,932,536 | |
|
| |
|
Health Care Equipment–4.28% | |
AtriCure, Inc.(b)(c) | | | 204,425 | | | | 9,072,381 | |
|
| |
CONMED Corp.(c) | | | 98,248 | | | | 8,708,703 | |
|
| |
Heska Corp.(b)(c) | | | 87,311 | | | | 5,427,252 | |
|
| |
iRhythm Technologies, Inc.(b)(c) | | | 62,065 | | | | 5,813,628 | |
|
| |
QuidelOrtho Corp.(b) | | | 88,949 | | | | 7,620,261 | |
|
| |
| | | | | | | 36,642,225 | |
|
| |
|
Health Care Facilities–1.70% | |
Encompass Health Corp. | | | 131,186 | | | | 7,846,235 | |
|
| |
Tenet Healthcare Corp. | | | 137,716 | | | | 6,719,163 | |
|
| |
| | | | | | | 14,565,398 | |
|
| |
|
Health Care Services–0.60% | |
R1 RCM, Inc.(b)(c) | | | 466,718 | | | | 5,110,562 | |
|
| |
|
Health Care Supplies–1.62% | |
ICU Medical, Inc.(b)(c) | | | 36,012 | | | | 5,671,170 | |
|
| |
OrthoPediatrics Corp.(b)(c) | | | 207,079 | | | | 8,227,248 | |
|
| |
| | | | | | | 13,898,418 | |
|
| |
See accompanying Notes to Financial Statements which are an integral part of the financial statements.
|
| 8 Invesco Small Cap Equity Fund |
| | | | | | | | |
| | | Shares | | | Value | |
Health Care Technology–0.81% | | | | | | | | |
Simulations Plus, Inc. | | | 189,057 | | | $ | 6,913,815 | |
|
| |
| | |
Homebuilding–1.27% | | | | | | | | |
Taylor Morrison Home Corp., Class A(b) | | | 358,488 | | | | 10,880,111 | |
|
| |
|
Hotels, Resorts & Cruise Lines–1.09% | |
Travel + Leisure Co. | | | 255,911 | | | | 9,315,160 | |
|
| |
|
Human Resource & Employment Services–0.96% | |
Alight, Inc., Class A(b)(c) | | | 987,728 | | | | 8,257,406 | |
|
| |
| | |
Industrial Machinery–2.11% | | | | | | | | |
Chart Industries, Inc.(b)(c) | | | 67,139 | | | | 7,736,427 | |
|
| |
ITT, Inc. | | | 126,947 | | | | 10,295,402 | |
|
| |
| | | | | | | 18,031,829 | |
|
| |
| | |
Industrial REITs–2.16% | | | | | | | | |
EastGroup Properties, Inc. | | | 65,253 | | | | 9,661,359 | |
|
| |
STAG Industrial, Inc. | | | 272,060 | | | | 8,790,259 | |
|
| |
| | | | | | | 18,451,618 | |
|
| |
| |
Interactive Media & Services–0.39% | | | | | |
Eventbrite, Inc., Class A(b)(c) | | | 566,861 | | | | 3,321,805 | |
|
| |
| |
Internet & Direct Marketing Retail–0.41% | | | | | |
Overstock.com, Inc.(b)(c) | | | 183,420 | | | | 3,551,011 | |
|
| |
| |
Investment Banking & Brokerage–2.15% | | | | | |
LPL Financial Holdings, Inc. | | | 41,385 | | | | 8,946,196 | |
|
| |
Piper Sandler Cos.(c) | | | 72,344 | | | | 9,418,465 | |
|
| |
| | | | | | | 18,364,661 | |
|
| |
| | |
Leisure Products–1.04% | | | | | | | | |
Acushnet Holdings Corp. | | | 210,080 | | | | 8,919,997 | |
|
| |
| | |
Life & Health Insurance–1.13% | | | | | | | | |
Primerica, Inc. | | | 67,950 | | | | 9,636,669 | |
|
| |
| |
Oil & Gas Equipment & Services–3.67% | | | | | |
Cactus, Inc., Class A | | | 209,049 | | | | 10,506,803 | |
|
| |
Weatherford International PLC(b) | | | 410,745 | | | | 20,915,135 | |
|
| |
| | | | | | | 31,421,938 | |
|
| |
| |
Oil & Gas Exploration & Production–3.22% | | | | | |
Matador Resources Co. | | | 224,240 | | | | 12,835,498 | |
|
| |
Ranger Oil Corp.(c) | | | 211,801 | | | | 8,563,114 | |
|
| |
Southwestern Energy Co.(b) | | | 1,058,557 | | | | 6,192,558 | |
|
| |
| | | | | | | 27,591,170 | |
|
| |
| | |
Packaged Foods & Meats–1.34% | | | | | | | | |
Calavo Growers, Inc. | | | 91,659 | | | | 2,694,775 | |
|
| |
Hostess Brands, Inc.(b)(c) | | | 392,308 | | | | 8,803,391 | |
|
| |
| | | | | | | 11,498,166 | |
|
| |
| | |
Paper Packaging–1.17% | | | | | | | | |
Graphic Packaging Holding Co. | | | 451,463 | | | | 10,045,052 | |
|
| |
| | | | | | | | |
| | | Shares | | | Value | |
Pharmaceuticals–0.35% | | | | | | | | |
Arvinas, Inc.(b)(c) | | | 87,989 | | | $ | 3,010,104 | |
|
| |
| |
Property & Casualty Insurance–3.16% | | | | | |
Hanover Insurance Group, Inc. (The) | | | 56,102 | | | | 7,581,063 | |
|
| |
RLI Corp. | | | 80,168 | | | | 10,523,654 | |
|
| |
Selective Insurance Group, Inc. | | | 100,846 | | | | 8,935,964 | |
|
| |
| | | | | | | 27,040,681 | |
|
| |
| | |
Real Estate Services–0.51% | | | | | | | | |
FirstService Corp. (Canada) | | | 36,009 | | | | 4,409,640 | |
|
| |
| | |
Regional Banks–6.04% | | | | | | | | |
Community Bank System, Inc. | | | 123,390 | | | | 7,767,401 | |
|
| |
Glacier Bancorp, Inc.(c) | | | 189,772 | | | | 9,378,532 | |
|
| |
Pacific Premier Bancorp, Inc.(c) | | | 253,204 | | | | 7,991,118 | |
|
| |
Pinnacle Financial Partners, Inc. | | | 135,203 | | | | 9,923,900 | |
|
| |
South State Corp. | | | 97,555 | | | | 7,449,300 | |
|
| |
Webster Financial Corp. | | | 194,198 | | | | 9,193,333 | |
|
| |
| | | | | | | 51,703,584 | |
|
| |
| | |
Reinsurance–2.77% | | | | | | | | |
Reinsurance Group of America, Inc. | | | 94,124 | | | | 13,374,079 | |
|
| |
RenaissanceRe Holdings Ltd. (Bermuda)(c) | | | 56,057 | | | | 10,327,381 | |
|
| |
| | | | | | | 23,701,460 | |
|
| |
| |
Research & Consulting Services–5.02% | | | | | |
CACI International, Inc., Class A(b) | | | 33,793 | | | | 10,157,838 | |
|
| |
Huron Consulting Group, Inc.(b) | | | 180,385 | | | | 13,095,951 | |
|
| |
NV5 Global, Inc.(b) | | | 68,200 | | | | 9,024,224 | |
|
| |
Science Applications International Corp. | | | 96,578 | | | | 10,713,397 | |
|
| |
| | | | | | | 42,991,410 | |
|
| |
| | |
Restaurants–1.92% | | | | | | | | |
Bloomin’ Brands, Inc. | | | 389,425 | | | | 7,835,231 | |
|
| |
Papa John’s International, Inc.(c) | | | 104,733 | | | | 8,620,573 | |
|
| |
| | | | | | | 16,455,804 | |
|
| |
| | |
Semiconductors–2.85% | | | | | | | | |
Diodes, Inc.(b) | | | 96,667 | | | | 7,360,225 | |
|
| |
Lattice Semiconductor Corp.(b) | | | 158,771 | | | | 10,301,063 | |
|
| |
Power Integrations, Inc.(c) | | | 93,403 | | | | 6,698,863 | |
|
| |
| | | | | | | 24,360,151 | |
|
| |
| | |
Specialized REITs–1.51% | | | | | | | | |
Gaming and Leisure Properties, Inc. | | | 248,914 | | | | 12,965,930 | |
|
| |
| | |
Specialty Chemicals–1.45% | | | | | | | | |
Ashland, Inc. | | | 115,340 | | | | 12,402,510 | |
|
| |
| | |
Systems Software–1.11% | | | | | | | | |
CommVault Systems, Inc.(b) | | | 150,916 | | | | 9,483,561 | |
|
| |
| |
Thrifts & Mortgage Finance–1.47% | | | | | |
Essent Group Ltd. | | | 170,910 | | | | 6,644,981 | |
|
| |
Radian Group, Inc. | | | 313,310 | | | | 5,974,822 | |
|
| |
| | | | | | | 12,619,803 | |
|
| |
See accompanying Notes to Financial Statements which are an integral part of the financial statements.
|
| 9 Invesco Small Cap Equity Fund |
| | | | | | | | |
| | | Shares | | | Value | |
Trading Companies & Distributors–2.61% | |
Applied Industrial Technologies, Inc. | | | 83,213 | | | $ | 10,487,334 | |
|
| |
Univar Solutions, Inc.(b) | | | 372,848 | | | | 11,856,567 | |
|
| |
| | | | | | | 22,343,901 | |
|
| |
|
Trucking–1.08% | |
Knight-Swift Transportation
Holdings, Inc. | | | 176,288 | | | | 9,239,254 | |
|
| |
|
Water Utilities–1.27% | |
SJW Group(c) | | | 133,521 | | | | 10,840,570 | |
|
| |
Total Common Stocks & Other
Equity Interests
(Cost $743,319,806) | | | | 837,015,501 | |
|
| |
| | |
Money Market Funds–2.19% | | | | | | | | |
Invesco Government & Agency Portfolio, Institutional Class, 4.22%(d)(e) | | | 6,573,636 | | | | 6,573,636 | |
|
| |
Invesco Liquid Assets Portfolio, Institutional Class, 4.42%(d)(e) | | | 4,689,495 | | | | 4,690,902 | |
|
| |
Invesco Treasury Portfolio, Institutional Class, 4.20%(d)(e) | | | 7,512,727 | | | | 7,512,727 | |
|
| |
Total Money Market Funds
(Cost $18,775,469) | | | | 18,777,265 | |
|
| |
TOTAL INVESTMENTS IN SECURITIES
(excluding investments purchased
with cash collateral from
securities on loan)-99.98%
(Cost $762,095,275) | | | | 855,792,766 | |
|
| |
| | | | | | | | |
| | | Shares | | | Value | |
Investments Purchased with Cash Collateral from Securities on Loan | |
Money Market Funds–17.39% | |
Invesco Private Government Fund, 4.28%(d)(e)(f) | | | 41,664,730 | | | $ | 41,664,730 | |
|
| |
Invesco Private Prime Fund, 4.46%(d)(e)(f) | | | 107,105,744 | | | | 107,137,875 | |
|
| |
Total Investments Purchased with Cash Collateral from Securities on Loan
(Cost $148,781,880) | | | | 148,802,605 | |
|
| |
TOTAL INVESTMENTS IN
SECURITIES–117.37%
(Cost $910,877,155) | | | | 1,004,595,371 | |
|
| |
OTHER ASSETS LESS LIABILITIES–(17.37)% | | | | (148,683,457 | ) |
|
| |
NET ASSETS–100.00% | | | | | | $ | 855,911,914 | |
|
| |
Investment Abbreviations:
ADR – American Depositary Receipt
REIT – Real Estate Investment Trust
Notes to Schedule of Investments:
| (a) | Industry and/or sector classifications used in this report are generally according to the Global Industry Classification Standard, which was developed by and is the exclusive property and a service mark of MSCI Inc. and Standard & Poor’s. |
| (b) | Non-income producing security. |
| (c) | All or a portion of this security was out on loan at December 31, 2022. |
| (d) | Affiliated issuer. The issuer and/or the Fund is a wholly-owned subsidiary of Invesco Ltd., or is affiliated by having an investment adviser that is under common control of Invesco Ltd. The table below shows the Fund’s transactions in, and earnings from, its investments in affiliates for the fiscal year ended December 31, 2022. |
| | | | | | | | | | | | | | | | | | | | | | | | | | | | |
| | | Value
December 31,
2021 | | | Purchases
at Cost | | | Proceeds
from Sales | | | Change in
Unrealized
Appreciation | | | Realized
Gain
(Loss) | | | Value
December 31, 2022 | | | Dividend
Income | |
Investments in Affiliated Money Market Funds: | | | | | | | | | | | | | | | | | | | | | | | | | | | | |
Invesco Government & Agency Portfolio, Institutional Class | | | $ 13,052,440 | | | | $ 63,337,136 | | | | $ (69,815,940) | | | | $ - | | | | $ - | | | | $ 6,573,636 | | | | $ 139,721 | |
Invesco Liquid Assets Portfolio, Institutional Class | | | 9,317,379 | | | | 45,240,812 | | | | (49,868,528) | | | | 1,689 | | | | (450) | | | | 4,690,902 | | | | 102,964 | |
Invesco Treasury Portfolio, Institutional Class | | | 14,917,075 | | | | 72,385,298 | | | | (79,789,646) | | | | - | | | | - | | | | 7,512,727 | | | | 153,300 | |
| Investments Purchased with Cash Collateral from Securities on Loan: | | | | | | | | | | | | | | | | | | | | | | | | | | | | |
Invesco Private Government Fund | | | 43,467,653 | | | | 284,655,224 | | | | (286,458,147) | | | | - | | | | - | | | | 41,664,730 | | | | 762,077* | |
Invesco Private Prime Fund | | | 101,424,521 | | | | 648,380,086 | | | | (642,700,116) | | | | 27,348 | | | | 6,036 | | | | 107,137,875 | | | | 2,084,620* | |
Total | | | $182,179,068 | | | | $1,113,998,556 | | | | $(1,128,632,377) | | | | $29,037 | | | | $5,586 | | | | $167,579,870 | | | | $3,242,682 | |
| | * | Represents the income earned on the investment of cash collateral, which is included in securities lending income on the Statement of Operations. Does not include rebates and fees paid to lending agent or premiums received from borrowers, if any. |
See accompanying Notes to Financial Statements which are an integral part of the financial statements.
|
| 10 Invesco Small Cap Equity Fund |
| (e) | The rate shown is the 7-day SEC standardized yield as of December 31, 2022. |
| (f) | The security has been segregated to satisfy the commitment to return the cash collateral received in securities lending transactions upon the borrower’s return of the securities loaned. See Note 1I. |
See accompanying Notes to Financial Statements which are an integral part of the financial statements.
|
| 11 Invesco Small Cap Equity Fund |
Statement of Assets and Liabilities
December 31, 2022
| | | | |
Assets: | |
| |
Investments in unaffiliated securities, at value
(Cost $743,319,806)* | | | $ 837,015,501 | |
|
| |
Investments in affiliated money market funds, at value
(Cost $167,557,349) | | | 167,579,870 | |
|
| |
Cash | | | 15,890 | |
|
| |
Foreign currencies, at value (Cost $151) | | | 149 | |
|
| |
Receivable for: | | | | |
Fund shares sold | | | 1,477,551 | |
|
| |
Dividends | | | 347,503 | |
|
| |
Investment for trustee deferred compensation and retirement plans | | | 123,746 | |
|
| |
Other assets | | | 64,282 | |
|
| |
Total assets | | | 1,006,624,492 | |
|
| |
|
Liabilities: | |
Payable for: | | | | |
Fund shares reacquired | | | 1,035,362 | |
|
| |
Collateral upon return of securities loaned | | | 148,781,880 | |
|
| |
Accrued fees to affiliates | | | 611,396 | |
|
| |
Accrued trustees’ and officers’ fees and benefits | | | 3,864 | |
|
| |
Accrued other operating expenses | | | 144,589 | |
|
| |
Trustee deferred compensation and retirement plans | | | 135,487 | |
|
| |
Total liabilities | | | 150,712,578 | |
|
| |
Net assets applicable to shares outstanding | | | $ 855,911,914 | |
|
| |
|
Net assets consist of: | |
Shares of beneficial interest | | | $ 762,678,862 | |
|
| |
Distributable earnings | | | 93,233,052 | |
|
| |
| | | $ 855,911,914 | |
|
| |
| | | | |
Net Assets: | |
| |
Class A | | $ | 506,505,597 | |
|
| |
Class C | | $ | 12,069,442 | |
|
| |
Class R | | $ | 46,851,393 | |
|
| |
Class Y | | $ | 59,795,984 | |
|
| |
Class R5 | | $ | 21,181,146 | |
|
| |
Class R6 | | $ | 209,508,352 | |
|
| |
|
Shares outstanding, no par value, with an unlimited number of shares authorized: | |
| |
Class A | | | 43,828,363 | |
|
| |
Class C | | | 1,668,576 | |
|
| |
Class R | | | 4,593,661 | |
|
| |
Class Y | | | 4,819,684 | |
|
| |
Class R5 | | | 1,529,913 | |
|
| |
Class R6 | | | 14,937,782 | |
|
| |
Class A: | | | | |
Net asset value per share | | $ | 11.56 | |
|
| |
Maximum offering price per share
(Net asset value of $11.56 ÷ 94.50%) | | $ | 12.23 | |
|
| |
Class C: | | | | |
Net asset value and offering price per share | | $ | 7.23 | |
|
| |
Class R: | | | | |
Net asset value and offering price per share | | $ | 10.20 | |
|
| |
Class Y: | | | | |
Net asset value and offering price per share | | $ | 12.41 | |
|
| |
Class R5: | | | | |
Net asset value and offering price per share | | $ | 13.84 | |
|
| |
Class R6: | | | | |
Net asset value and offering price per share | | $ | 14.03 | |
|
| |
| * | At December 31, 2022, securities with an aggregate value of $139,224,468 were on loan to brokers. |
See accompanying Notes to Financial Statements which are an integral part of the financial statements.
|
| 12 Invesco Small Cap Equity Fund |
Statement of Operations
For the year ended December 31, 2022
| | | | |
Investment income: | | | | |
Dividends (net of foreign withholding taxes of $45,710) | | $ | 9,596,549 | |
|
| |
Dividends from affiliated money market funds (includes net securities lending income of $192,574) | | | 588,559 | |
|
| |
Total investment income | | | 10,185,108 | |
|
| |
| |
Expenses: | | | | |
Advisory fees | | | 6,794,103 | |
|
| |
Administrative services fees | | | 138,164 | |
|
| |
Custodian fees | | | 7,284 | |
|
| |
Distribution fees: | | | | |
Class A | | | 1,356,582 | |
|
| |
Class C | | | 136,876 | |
|
| |
Class R | | | 239,423 | |
|
| |
Transfer agent fees – A, C, R and Y | | | 1,652,135 | |
|
| |
Transfer agent fees – R5 | | | 22,458 | |
|
| |
Transfer agent fees – R6 | | | 78,194 | |
|
| |
Trustees’ and officers’ fees and benefits | | | 24,154 | |
|
| |
Registration and filing fees | | | 123,279 | |
|
| |
Reports to shareholders | | | 60,665 | |
|
| |
Professional services fees | | | 49,969 | |
|
| |
Other | | | 19,197 | |
|
| |
Total expenses | | | 10,702,483 | |
|
| |
Less: Fees waived and/or expense offset arrangement(s) | | | (35,349 | ) |
|
| |
Net expenses | | | 10,667,134 | |
|
| |
Net investment income (loss) | | | (482,026 | ) |
|
| |
| |
Realized and unrealized gain (loss) from: | | | | |
Net realized gain from: | | | | |
Unaffiliated investment securities | | | 9,298,302 | |
|
| |
Affiliated investment securities | | | 5,586 | |
|
| |
Foreign currencies | | | 1,505 | |
|
| |
| | | 9,305,393 | |
|
| |
Change in net unrealized appreciation (depreciation) of: | | | | |
Unaffiliated investment securities | | | (244,426,658 | ) |
|
| |
Affiliated investment securities | | | 29,037 | |
|
| |
Foreign currencies | | | (783 | ) |
|
| |
| | | (244,398,404 | ) |
|
| |
Net realized and unrealized gain (loss) | | | (235,093,011 | ) |
|
| |
Net increase (decrease) in net assets resulting from operations | | $ | (235,575,037 | ) |
|
| |
|
See accompanying Notes to Financial Statements which are an integral part of the financial statements. |
| 13 Invesco Small Cap Equity Fund |
Statement of Changes in Net Assets
For the years ended December 31, 2022 and 2021
| | | | | | | | |
| | | 2022 | | | 2021 | |
| |
Operations: | | | | | | | | |
| | |
Net investment income (loss) | | $ | (482,026 | ) | | $ | (1,166,682 | ) |
|
| |
Net realized gain | | | 9,305,393 | | | | 155,511,519 | |
|
| |
Change in net unrealized appreciation (depreciation) | | | (244,398,404 | ) | | | 43,613,697 | |
| |
Net increase (decrease) in net assets resulting from operations | | | (235,575,037 | ) | | | 197,958,534 | |
| |
| | |
Distributions to shareholders from distributable earnings: | | | | | | | | |
| | |
Class A | | | (14,530,646 | ) | | | (105,869,258 | ) |
|
| |
Class C | | | (547,028 | ) | | | (4,117,457 | ) |
|
| |
Class R | | | (1,502,723 | ) | | | (9,052,200 | ) |
|
| |
Class Y | | | (1,612,784 | ) | | | (14,030,433 | ) |
|
| |
Class R5 | | | (509,553 | ) | | | (3,782,814 | ) |
|
| |
Class R6 | | | (4,971,097 | ) | | | (43,447,856 | ) |
|
| |
Total distributions from distributable earnings | | | (23,673,831 | ) | | | (180,300,018 | ) |
|
| |
| | |
Share transactions–net: | | | | | | | | |
| | |
Class A | | | (2,551,680 | ) | | | 91,186,548 | |
|
| |
Class C | | | (1,464,914 | ) | | | 2,723,311 | |
|
| |
Class R | | | 8,362,223 | | | | 2,438,958 | |
|
| |
Class Y | | | (10,519,236 | ) | | | 24,790,175 | |
|
| |
Class R5 | | | (167,742 | ) | | | 5,456,734 | |
|
| |
Class R6 | | | (43,575,940 | ) | | | 30,152,495 | |
|
| |
Net increase (decrease) in net assets resulting from share transactions | | | (49,917,289 | ) | | | 156,748,221 | |
|
| |
Net increase (decrease) in net assets | | | (309,166,157 | ) | | | 174,406,737 | |
|
| |
| | |
Net assets: | | | | | | | | |
| | |
Beginning of year | | | 1,165,078,071 | | | | 990,671,334 | |
|
| |
End of year | | $ | 855,911,914 | | | $ | 1,165,078,071 | |
|
| |
|
| See accompanying Notes to Financial Statements which are an integral part of the financial statements. |
|
| 14 Invesco Small Cap Equity Fund |
Financial Highlights
The following schedule presents financial highlights for a share of the Fund outstanding throughout the periods indicated.
| | | | | | | | | | | | | | | | | | | | | | | | | | | | | | | | | | | | | | | | | | | | | | | | | | | | | | | | | | | | | | | | | | | | | | |
| | | Net asset
value,
beginning
of period | | Net
investment
income (loss)(a) | | Net gains
(losses)
on securities
(both
realized and
unrealized) | | Total from
investment
operations | | Dividends
from net
investment
income | | Distributions
from net
realized
gains | | Total
distributions | | Net asset value, end
of period | | Total
return (b) | | Net assets,
end of period
(000’s omitted) | | Ratio of
expenses to average net assets
with fee waivers
and/or
expenses
absorbed | | Ratio of
expenses
to average net
assets without
fee waivers
and/or
expenses
absorbed | | Ratio of net
investment
income (loss) to average
net assets | | Portfolio
turnover (c) |
Class A | | | | | | | | | | | |
Year ended 12/31/22 | | | $ | 14.99 | | | | $ | (0.02 | ) | | | $ | (3.07 | ) | | | $ | (3.09 | ) | | | $ | - | | | | $ | (0.34 | ) | | | $ | (0.34 | ) | | | $ | 11.56 | | | | | (20.60 | )% | | | $ | 506,506 | | | | | 1.26 | % | | | | 1.26 | % | | | | (0.17 | )% | | | | 33 | % |
Year ended 12/31/21 | | | | 14.97 | | | | | (0.04 | ) | | | | 2.91 | | | | | 2.87 | | | | | - | | | | | (2.85 | ) | | | | (2.85 | ) | | | | 14.99 | | | | | 20.02 | | | | | 660,296 | | | | | 1.22 | | | | | 1.22 | | | | | (0.22 | ) | | | | 22 | |
Year ended 12/31/20 | | | | 12.50 | | | | | (0.02 | ) | | | | 3.39 | | | | | 3.37 | | | | | - | | | | | (0.90 | ) | | | | (0.90 | ) | | | | 14.97 | | | | | 27.29 | | | | | 562,995 | | | | | 1.31 | | | | | 1.31 | | | | | (0.13 | ) | | | | 43 | |
Year ended 12/31/19 | | | | 11.04 | | | | | (0.00 | ) | | | | 2.86 | | | | | 2.86 | | | | | - | | | | | (1.40 | ) | | | | (1.40 | ) | | | | 12.50 | | | | | 26.13 | | | | | 495,573 | | | | | 1.31 | | | | | 1.31 | | | | | (0.00 | ) | | | | 35 | |
Year ended 12/31/18 | | | | 15.35 | | | | | (0.03 | ) | | | | (2.23 | ) | | | | (2.26 | ) | | | | - | | | | | (2.05 | ) | | | | (2.05 | ) | | | | 11.04 | | | | | (15.16 | ) | | | | 427,637 | | | | | 1.28 | | | | | 1.28 | | | | | (0.21 | ) | | | | 22 | |
Class C | | | | | | | | | | | | | | | | | | | | | | | | | | | | | | | | | | | | | | | | | | | | | | | | | | | | | | | | | | | | | | | | | | | | | | |
Year ended 12/31/22 | | | | 9.61 | | | | | (0.07 | ) | | | | (1.97 | ) | | | | (2.04 | ) | | | | - | | | | | (0.34 | ) | | | | (0.34 | ) | | | | 7.23 | | | | | (21.20 | ) | | | | 12,069 | | | | | 2.01 | | | | | 2.01 | | | | | (0.92 | ) | | | | 33 | |
Year ended 12/31/21 | | | | 10.57 | | | | | (0.12 | ) | | | | 2.01 | | | | | 1.89 | | | | | - | | | | | (2.85 | ) | | | | (2.85 | ) | | | | 9.61 | | | | | 19.06 | | | | | 17,784 | | | | | 1.97 | | | | | 1.97 | | | | | (0.97 | ) | | | | 22 | |
Year ended 12/31/20 | | | | 9.11 | | | | | (0.08 | ) | | | | 2.44 | | | | | 2.36 | | | | | - | | | | | (0.90 | ) | | | | (0.90 | ) | | | | 10.57 | | | | | 26.36 | | | | | 16,129 | | | | | 2.06 | | | | | 2.06 | | | | | (0.88 | ) | | | | 43 | |
Year ended 12/31/19 | | | | 8.42 | | | | | (0.07 | ) | | | | 2.16 | | | | | 2.09 | | | | | - | | | | | (1.40 | ) | | | | (1.40 | ) | | | | 9.11 | | | | | 25.10 | | | | | 18,873 | | | | | 2.06 | | | | | 2.06 | | | | | (0.75 | ) | | | | 35 | |
Year ended 12/31/18 | | | | 12.35 | | | | | (0.12 | ) | | | | (1.76 | ) | | | | (1.88 | ) | | | | - | | | | | (2.05 | ) | | | | (2.05 | ) | | | | 8.42 | | | | | (15.76 | ) | | | | 37,757 | | | | | 2.03 | | | | | 2.03 | | | | | (0.96 | ) | | | | 22 | |
Class R | | | | | | | | | | | | | | | | | | | | | | | | | | | | | | | | | | | | | | | | | | | | | | | | | | | | | | | | | | | | | | | | | | | | | | |
Year ended 12/31/22 | | | | 13.31 | | | | | (0.05 | ) | | | | (2.72 | ) | | | | (2.77 | ) | | | | - | | | | | (0.34 | ) | | | | (0.34 | ) | | | | 10.20 | | | | | (20.79 | ) | | | | 46,851 | | | | | 1.51 | | | | | 1.51 | | | | | (0.42 | ) | | | | 33 | |
Year ended 12/31/21 | | | | 13.61 | | | | | (0.07 | ) | | | | 2.62 | | | | | 2.55 | | | | | - | | | | | (2.85 | ) | | | | (2.85 | ) | | | | 13.31 | | | | | 19.66 | | | | | 51,571 | | | | | 1.47 | | | | | 1.47 | | | | | (0.47 | ) | | | | 22 | |
Year ended 12/31/20 | | | | 11.45 | | | | | (0.04 | ) | | | | 3.10 | | | | | 3.06 | | | | | - | | | | | (0.90 | ) | | | | (0.90 | ) | | | | 13.61 | | | | | 27.09 | | | | | 48,792 | | | | | 1.56 | | | | | 1.56 | | | | | (0.38 | ) | | | | 43 | |
Year ended 12/31/19 | | | | 10.24 | | | | | (0.03 | ) | | | | 2.64 | | | | | 2.61 | | | | | - | | | | | (1.40 | ) | | | | (1.40 | ) | | | | 11.45 | | | | | 25.71 | | | | | 47,521 | | | | | 1.56 | | | | | 1.56 | | | | | (0.25 | ) | | | | 35 | |
Year ended 12/31/18 | | | | 14.44 | | | | | (0.07 | ) | | | | (2.08 | ) | | | | (2.15 | ) | | | | - | | | | | (2.05 | ) | | | | (2.05 | ) | | | | 10.24 | | | | | (15.35 | ) | | | | 50,345 | | | | | 1.53 | | | | | 1.53 | | | | | (0.46 | ) | | | | 22 | |
Class Y | | | | | | | | | | | | | | | | | | | | | | | | | | | | | | | | | | | | | | | | | | | | | | | | | | | | | | | | | | | | | | | | | | | | | | |
Year ended 12/31/22 | | | | 16.02 | | | | | 0.01 | | | | | (3.28 | ) | | | | (3.27 | ) | | | | - | | | | | (0.34 | ) | | | | (0.34 | ) | | | | 12.41 | | | | | (20.40 | ) | | | | 59,796 | | | | | 1.01 | | | | | 1.01 | | | | | 0.08 | | | | | 33 | |
Year ended 12/31/21 | | | | 15.80 | | | | | 0.01 | | | | | 3.07 | | | | | 3.08 | | | | | (0.01 | ) | | | | (2.85 | ) | | | | (2.86 | ) | | | | 16.02 | | | | | 20.27 | | | | | 91,380 | | | | | 0.97 | | | | | 0.97 | | | | | 0.03 | | | | | 22 | |
Year ended 12/31/20 | | | | 13.12 | | | | | 0.02 | | | | | 3.57 | | | | | 3.59 | | | | | (0.01 | ) | | | | (0.90 | ) | | | | (0.91 | ) | | | | 15.80 | | | | | 27.70 | | | | | 66,783 | | | | | 1.06 | | | | | 1.06 | | | | | 0.12 | | | | | 43 | |
Year ended 12/31/19 | | | | 11.51 | | | | | 0.03 | | | | | 2.98 | | | | | 3.01 | | | | | - | | | | | (1.40 | ) | | | | (1.40 | ) | | | | 13.12 | | | | | 26.36 | | | | | 62,023 | | | | | 1.06 | | | | | 1.06 | | | | | 0.25 | | | | | 35 | |
Year ended 12/31/18 | | | | 15.86 | | | | | 0.00 | | | | | (2.30 | ) | | | | (2.30 | ) | | | | - | | | | | (2.05 | ) | | | | (2.05 | ) | | | | 11.51 | | | | | (14.92 | ) | | | | 71,037 | | | | | 1.03 | | | | | 1.03 | | | | | 0.04 | | | | | 22 | |
Class R5 | | | | | | | | | | | | | | | | | | | | | | | | | | | | | | | | | | | | | | | | | | | | | | | | | | | | | | | | | | | | | | | | | | | | | | |
Year ended 12/31/22 | | | | 17.80 | | | | | 0.03 | | | | | (3.65 | ) | | | | (3.62 | ) | | | | - | | | | | (0.34 | ) | | | | (0.34 | ) | | | | 13.84 | | | | | (20.32 | ) | | | | 21,181 | | | | | 0.87 | | | | | 0.87 | | | | | 0.22 | | | | | 33 | |
Year ended 12/31/21 | | | | 17.28 | | | | | 0.03 | | | | | 3.36 | | | | | 3.39 | | | | | (0.02 | ) | | | | (2.85 | ) | | | | (2.87 | ) | | | | 17.80 | | | | | 20.39 | | | | | 27,506 | | | | | 0.85 | | | | | 0.85 | | | | | 0.15 | | | | | 22 | |
Year ended 12/31/20 | | | | 14.28 | | | | | 0.04 | | | | | 3.91 | | | | | 3.95 | | | | | (0.05 | ) | | | | (0.90 | ) | | | | (0.95 | ) | | | | 17.28 | | | | | 27.95 | | | | | 21,396 | | | | | 0.88 | | | | | 0.88 | | | | | 0.30 | | | | | 43 | |
Year ended 12/31/19 | | | | 12.40 | | | | | 0.07 | | | | | 3.21 | | | | | 3.28 | | | | | - | | | | | (1.40 | ) | | | | (1.40 | ) | | | | 14.28 | | | | | 26.65 | | | | | 20,674 | | | | | 0.85 | | | | | 0.85 | | | | | 0.46 | | | | | 35 | |
Year ended 12/31/18 | | | | 16.88 | | | | | 0.03 | | | | | (2.46 | ) | | | | (2.43 | ) | | | | - | | | | | (2.05 | ) | | | | (2.05 | ) | | | | 12.40 | | | | | (14.79 | ) | | | | 26,543 | | | | | 0.87 | | | | | 0.87 | | | | | 0.20 | | | | | 22 | |
Class R6 | | | | | | | | | | | | | | | | | | | | | | | | | | | | | | | | | | | | | | | | | | | | | | | | | | | | | | | | | | | | | | | | | | | | | | |
Year ended 12/31/22 | | | | 18.01 | | | | | 0.04 | | | | | (3.68 | ) | | | | (3.64 | ) | | | | - | | | | | (0.34 | ) | | | | (0.34 | ) | | | | 14.03 | | | | | (20.20 | ) | | | | 209,508 | | | | | 0.80 | | | | | 0.80 | | | | | 0.29 | | | | | 33 | |
Year ended 12/31/21 | | | | 17.45 | | | | | 0.04 | | | | | 3.40 | | | | | 3.44 | | | | | (0.03 | ) | | | | (2.85 | ) | | | | (2.88 | ) | | | | 18.01 | | | | | 20.46 | | | | | 316,542 | | | | | 0.79 | | | | | 0.79 | | | | | 0.21 | | | | | 22 | |
Year ended 12/31/20 | | | | 14.41 | | | | | 0.05 | | | | | 3.94 | | | | | 3.99 | | | | | (0.05 | ) | | | | (0.90 | ) | | | | (0.95 | ) | | | | 17.45 | | | | | 28.03 | | | | | 274,576 | | | | | 0.81 | | | | | 0.81 | | | | | 0.37 | | | | | 43 | |
Year ended 12/31/19 | | | | 12.50 | | | | | 0.07 | | | | | 3.24 | | | | | 3.31 | | | | | - | | | | | (1.40 | ) | | | | (1.40 | ) | | | | 14.41 | | | | | 26.67 | | | | | 293,300 | | | | | 0.81 | | | | | 0.81 | | | | | 0.50 | | | | | 35 | |
Year ended 12/31/18 | | | | 16.99 | | | | | 0.05 | | | | | (2.49 | ) | | | | (2.44 | ) | | | | - | | | | | (2.05 | ) | | | | (2.05 | ) | | | | 12.50 | | | | | (14.75 | ) | | | | 255,195 | | | | | 0.80 | | | | | 0.80 | | | | | 0.27 | | | | | 22 | |
| (a) | Calculated using average shares outstanding. |
| (b) | Includes adjustments in accordance with accounting principles generally accepted in the United States of America and as such, the net asset value for financial reporting purposes and the returns based upon those net asset values may differ from the net asset value and returns for shareholder transactions. Does not include sales charges and is not annualized for periods less than one year, if applicable. |
| (c) | Portfolio turnover is calculated at the fund level and is not annualized for periods less than one year, if applicable. |
|
| See accompanying Notes to Financial Statements which are an integral part of the financial statements. |
|
| 15 Invesco Small Cap Equity Fund |
Notes to Financial Statements
December 31, 2022
NOTE 1–Significant Accounting Policies
Invesco Small Cap Equity Fund (the “Fund”) is a series portfolio of AIM Funds Group (Invesco Funds Group) (the “Trust”). The Trust is a Delaware statutory trust registered under the Investment Company Act of 1940, as amended (the “1940 Act”), as an open-end series management investment company authorized to issue an unlimited number of shares of beneficial interest. Information presented in these financial statements pertains only to the Fund. Matters affecting the Fund or each class will be voted on exclusively by the shareholders of the Fund or each class.
The Fund’s primary investment objective is long-term growth of capital.
The Fund currently consists of six different classes of shares: Class A, Class C, Class R, Class Y, Class R5 and Class R6. Class Y shares are available only to certain investors. Class A shares are sold with a front-end sales charge unless certain waiver criteria are met. Under certain circumstances, load waived shares may be subject to contingent deferred sales charges (“CDSC”). Class C shares are sold with a CDSC. Class R, Class Y, Class R5 and Class R6 shares are sold at net asset value. Class C shares held for eight years after purchase are eligible for automatic conversion into Class A shares of the same Fund (the “Conversion Feature”). The automatic conversion pursuant to the Conversion Feature will generally occur at the end of the month following the eighth anniversary after a purchase of Class C shares.
The Fund is an investment company and accordingly follows the investment company accounting and reporting guidance in accordance with Financial Accounting Standards Board Accounting Standards Codification Topic 946, Financial Services – Investment Companies.
The following is a summary of the significant accounting policies followed by the Fund in the preparation of its financial statements.
| A. | Security Valuations – Securities, including restricted securities, are valued according to the following policy. |
A security listed or traded on an exchange is generally valued at its trade price or official closing price that day as of the close of the exchange where the security is principally traded, or lacking any trades or official closing price on a particular day, the security may be valued at the closing bid price on that day. Securities traded in the over-the-counter market are valued based on prices furnished by independent pricing services or market makers. When such securities are valued using prices provided by an independent pricing service they may be considered fair valued. Futures contracts are valued at the daily settlement price set by an exchange on which they are principally traded. U.S. exchange-traded options are valued at the mean between the last bid and asked prices from the exchange on which they are principally traded. Non-U.S. exchange-traded options are valued at the final settlement price set by the exchange on which they trade. Options not listed on an exchange and swaps generally are valued using pricing provided from independent pricing services.
Securities of investment companies that are not exchange-traded (e.g., open-end mutual funds) are valued using such company’s end-of-business-day net asset value per share.
Deposits, other obligations of U.S. and non-U.S. banks and financial institutions are valued at their daily account value.
Fixed income securities (including convertible debt securities) generally are valued on the basis of prices provided by independent pricing services. Prices provided by the pricing service may be determined without exclusive reliance on quoted prices, and may reflect appropriate factors such as institution-size trading in similar groups of securities, developments related to specific securities, dividend rate (for unlisted equities), yield (for debt obligations), quality, type of issue, coupon rate (for debt obligations), maturity (for debt obligations), individual trading characteristics and other market data. Pricing services generally value debt obligations assuming orderly transactions of institutional round lot size, but a fund may hold or transact in the same securities in smaller, odd lot sizes. Odd lots often trade at lower prices than institutional round lots, and their value may be adjusted accordingly. Debt obligations are subject to interest rate and credit risks. In addition, all debt obligations involve some risk of default with respect to interest and/or principal payments.
Foreign securities’ (including foreign exchange contracts) prices are converted into U.S. dollar amounts using the applicable exchange rates as of the close of the New York Stock Exchange (“NYSE”). If market quotations are available and reliable for foreign exchange-traded equity securities, the securities will be valued at the market quotations. Invesco Advisers, Inc. (the “Adviser” or “Invesco”) may use various pricing services to obtain market quotations as well as fair value prices. Because trading hours for certain foreign securities end before the close of the NYSE, closing market quotations may become not representative of market value in the Adviser’s judgment (“unreliable”). If, between the time trading ends on a particular security and the close of the customary trading session on the NYSE, a significant event occurs that makes the closing price of the security unreliable, the Adviser may fair value the security. If the event is likely to have affected the closing price of the security, the security will be valued at fair value in good faith in accordance with Board- approved policies and related Adviser procedures (“Valuation Procedures”). Adjustments to closing prices to reflect fair value may also be based on a screening process of an independent pricing service to indicate the degree of certainty, based on historical data, that the closing price in the principal market where a foreign security trades is not the current value as of the close of the NYSE. Foreign securities’ prices meeting the degree of certainty that the price is not reflective of current value will be priced at the indication of fair value from the independent pricing service. Multiple factors may be considered by the independent pricing service in determining adjustments to reflect fair value and may include information relating to sector indices, American Depositary Receipts and domestic and foreign index futures. Foreign securities may have additional risks including exchange rate changes, potential for sharply devalued currencies and high inflation, political and economic upheaval, the relative lack of issuer information, relatively low market liquidity and the potential lack of strict financial and accounting controls and standards.
Unlisted securities will be valued using prices provided by independent pricing services or by another method that the Adviser, in its judgment, believes better reflects the security’s fair value in accordance with the Valuation Procedures.
Securities for which market prices are not provided by any of the above methods may be valued based upon quotes furnished by independent sources. The last bid price may be used to value equity securities. The mean between the last bid and asked prices may be used to value debt obligations, including corporate loans.
Securities for which market quotations are not readily available are fair valued by the Adviser in accordance with the Valuation Procedures. If a fair value price provided by a pricing service is unreliable, the Adviser will fair value the security using the Valuation Procedures. Issuer specific events, market trends, bid/asked quotes of brokers and information providers and other market data may be reviewed in the course of making a good faith determination of a security’s fair value.
|
| 16 Invesco Small Cap Equity Fund |
The Fund may invest in securities that are subject to interest rate risk, meaning the risk that the prices will generally fall as interest rates rise and, conversely, the prices will generally rise as interest rates fall. Specific securities differ in their sensitivity to changes in interest rates depending on their individual characteristics. Changes in interest rates may result in increased market volatility, which may affect the value and/or liquidity of certain Fund investments.
Valuations change in response to many factors including the historical and prospective earnings of the issuer, the value of the issuer’s assets, general market conditions which are not specifically related to the particular issuer, such as real or perceived adverse economic conditions, changes in the general outlook for revenues or corporate earnings, changes in interest or currency rates, regional or global instability, natural or environmental disasters, widespread disease or other public health issues, war, acts of terrorism, significant governmental actions or adverse investor sentiment generally and market liquidity. Because of the inherent uncertainties of valuation, the values reflected in the financial statements may materially differ from the value received upon actual sale of those investments.
The price the Fund could receive upon the sale of any investment may differ from the Adviser’s valuation of the investment, particularly for securities that are valued using a fair valuation technique. When fair valuation techniques are applied, the Adviser uses available information, including both observable and unobservable inputs and assumptions, to determine a methodology that will result in a valuation that the Adviser believes approximates market value. Fund securities that are fair valued may be subject to greater fluctuation in their value from one day to the next than would be the case if market quotations were used. Because of the inherent uncertainties of valuation, and the degree of subjectivity in such decisions, the Fund could realize a greater or lesser than expected gain or loss upon the sale of the investment.
| B. | Securities Transactions and Investment Income – Securities transactions are accounted for on a trade date basis. Realized gains or losses on sales are computed on the basis of specific identification of the securities sold. Interest income (net of withholding tax, if any) is recorded on an accrual basis from settlement date and includes coupon interest and amortization of premium and accretion of discount on debt securities as applicable. Dividend income (net of withholding tax, if any) is recorded on the ex-dividend date. |
The Fund may periodically participate in litigation related to Fund investments. As such, the Fund may receive proceeds from litigation settlements. Any proceeds received are included in the Statement of Operations as realized gain (loss) for investments no longer held and as unrealized gain (loss) for investments still held.
Brokerage commissions and mark ups are considered transaction costs and are recorded as an increase to the cost basis of securities purchased and/or a reduction of proceeds on a sale of securities. Such transaction costs are included in the determination of net realized and unrealized gain (loss) from investment securities reported in the Statement of Operations and the Statement of Changes in Net Assets and the net realized and unrealized gains (losses) on securities per share in the Financial Highlights. Transaction costs are included in the calculation of the Fund’s net asset value and, accordingly, they reduce the Fund’s total returns. These transaction costs are not considered operating expenses and are not reflected in net investment income reported in the Statement of Operations and the Statement of Changes in Net Assets, or the net investment income per share and the ratios of expenses and net investment income reported in the Financial Highlights, nor are they limited by any expense limitation arrangements between the Fund and the investment adviser.
The Fund allocates income and realized and unrealized capital gains and losses to a class based on the relative net assets of each class.
The Fund recharacterizes distributions received from REIT investments based on information provided by the REIT into the following categories: ordinary income, long-term and short-term capital gains, and return of capital. If information is not available on a timely basis from the REIT, the recharacterization will be based on available information which may include the previous year’s allocation. If new or additional information becomes available from the REIT at a later date, a recharacterization will be made in the following year. The Fund records as dividend income the amount recharacterized as ordinary income and as realized gain the amount recharacterized as capital gain in the Statement of Operations, and the amount recharacterized as return of capital as a reduction of the cost of the related investment. These recharacterizations are reflected in the accompanying financial statements.
| C. | Country Determination – For the purposes of making investment selection decisions and presentation in the Schedule of Investments, the investment adviser may determine the country in which an issuer is located and/or credit risk exposure based on various factors. These factors include the laws of the country under which the issuer is organized, where the issuer maintains a principal office, the country in which the issuer derives 50% or more of its total revenues, the country that has the primary market for the issuer’s securities and its “country of risk” as determined by a third party service provider, as well as other criteria. Among the other criteria that may be evaluated for making this determination are the country in which the issuer maintains 50% or more of its assets, the type of security, financial guarantees and enhancements, the nature of the collateral and the sponsor organization. Country of issuer and/or credit risk exposure has been determined to be the United States of America, unless otherwise noted. |
| D. | Distributions – Distributions from net investment income and net realized capital gain, if any, are generally declared and paid annually and recorded on the ex-dividend date. The Fund may elect to treat a portion of the proceeds from redemptions as distributions for federal income tax purposes. |
| E. | Federal Income Taxes – The Fund intends to comply with the requirements of Subchapter M of the Internal Revenue Code of 1986, as amended (the “Internal Revenue Code”), necessary to qualify as a regulated investment company and to distribute substantially all of the Fund’s taxable earnings to shareholders. As such, the Fund will not be subject to federal income taxes on otherwise taxable income (including net realized capital gain) that is distributed to shareholders. Therefore, no provision for federal income taxes is recorded in the financial statements. |
The Fund recognizes the tax benefits of uncertain tax positions only when the position is more likely than not to be sustained. Management has analyzed the Fund’s uncertain tax positions and concluded that no liability for unrecognized tax benefits should be recorded related to uncertain tax positions. Management is not aware of any tax positions for which it is reasonably possible that the total amounts of unrecognized tax benefits will change materially in the next 12 months.
The Fund files tax returns in the U.S. Federal jurisdiction and certain other jurisdictions. Generally, the Fund is subject to examinations by such taxing authorities for up to three years after the filing of the return for the tax period.
| F. | Expenses – Fees provided for under the Rule 12b-1 plan of a particular class of the Fund are charged to the operations of such class. Transfer agency fees and expenses and other shareholder recordkeeping fees and expenses attributable to Class R5 and Class R6 are allocated based on relative net assets of Class R5 and Class R6. Sub-accounting fees attributable to Class R5 are charged to the operations of the class. Transfer agency fees and expenses and other shareholder recordkeeping fees and expenses relating to all other classes are allocated among those classes based on relative net assets. All other expenses are allocated among the classes based on relative net assets. |
|
| 17 Invesco Small Cap Equity Fund |
| G. | Accounting Estimates – The preparation of financial statements in conformity with accounting principles generally accepted in the United States of America (“GAAP”) requires management to make estimates and assumptions that affect the reported amounts of assets and liabilities at the date of the financial statements and the reported amounts of revenues and expenses during the reporting period including estimates and assumptions related to taxation. Actual results could differ from those estimates by a significant amount. In addition, the Fund monitors for material events or transactions that may occur or become known after the period-end date and before the date the financial statements are released to print. |
| H. | Indemnifications – Under the Trust’s organizational documents, each Trustee, officer, employee or other agent of the Trust is indemnified against certain liabilities that may arise out of the performance of their duties to the Fund. Additionally, in the normal course of business, the Fund enters into contracts, including the Fund’s servicing agreements, that contain a variety of indemnification clauses. The Fund’s maximum exposure under these arrangements is unknown as this would involve future claims that may be made against the Fund that have not yet occurred. The risk of material loss as a result of such indemnification claims is considered remote. |
| I. | Securities Lending – The Fund may lend portfolio securities having a market value up to one-third of the Fund’s total assets. Such loans are secured by collateral equal to no less than the market value of the loaned securities determined daily by the securities lending provider. Such collateral will be cash or debt securities issued or guaranteed by the U.S. Government or any of its sponsored agencies. Cash collateral received in connection with these loans is invested in short-term money market instruments or affiliated, unregistered investment companies that comply with Rule 2a-7 under the 1940 Act and money market funds (collectively, “affiliated money market funds”) and is shown as such on the Schedule of Investments. The Fund bears the risk of loss with respect to the investment of collateral. It is the Fund’s policy to obtain additional collateral from or return excess collateral to the borrower by the end of the next business day, following the valuation date of the securities loaned. Therefore, the value of the collateral held may be temporarily less than the value of the securities on loan. When loaning securities, the Fund retains certain benefits of owning the securities, including the economic equivalent of dividends or interest generated by the security. Lending securities entails a risk of loss to the Fund if, and to the extent that, the market value of the securities loaned were to increase and the borrower did not increase the collateral accordingly, and the borrower failed to return the securities. The securities loaned are subject to termination at the option of the borrower or the Fund. Upon termination, the borrower will return to the Fund the securities loaned and the Fund will return the collateral. Upon the failure of the borrower to return the securities, collateral may be liquidated and the securities may be purchased on the open market to replace the loaned securities. The Fund could experience delays and costs in gaining access to the collateral and the securities may lose value during the delay which could result in potential losses to the Fund. Some of these losses may be indemnified by the lending agent. The Fund bears the risk of any deficiency in the amount of the collateral available for return to the borrower due to any loss on the collateral invested. Dividends received on cash collateral investments for securities lending transactions, which are net of compensation to counterparties, are included in Dividends from affiliated money market funds on the Statement of Operations. The aggregate value of securities out on loan, if any, is shown as a footnote on the Statement of Assets and Liabilities. |
The Adviser serves as an affiliated securities lending agent for the Fund. The Bank of New York Mellon also serves as a lending agent. To the extent the Fund utilizes the Adviser as an affiliated securities lending agent, the Fund conducts its securities lending in accordance with, and in reliance upon, no-action letters issued by the SEC staff that provide guidance on how an affiliate may act as a direct agent lender and receive compensation for those services in a manner consistent with the federal securities laws. For the year ended December 31, 2022, the Fund paid the Adviser $9,212 in fees for securities lending agent services. Fees paid to the Adviser for securities lending agent services, if any, are included in Dividends from affiliated money market funds on the Statement of Operations.
| J. | Foreign Currency Translations – Foreign currency is valued at the close of the NYSE based on quotations posted by banks and major currency dealers. Portfolio securities and other assets and liabilities denominated in foreign currencies are translated into U.S. dollar amounts at the date of valuation. Purchases and sales of portfolio securities (net of foreign taxes withheld on disposition) and income items denominated in foreign currencies are translated into U.S. dollar amounts on the respective dates of such transactions. The Fund does not separately account for the portion of the results of operations resulting from changes in foreign exchange rates on investments and the fluctuations arising from changes in market prices of securities held. The combined results of changes in foreign exchange rates and the fluctuation of market prices on investments (net of estimated foreign tax withholding) are included with the net realized and unrealized gain or loss from investments in the Statement of Operations. Reported net realized foreign currency gains or losses arise from (1) sales of foreign currencies, (2) currency gains or losses realized between the trade and settlement dates on securities transactions, and (3) the difference between the amounts of dividends, interest, and foreign withholding taxes recorded on the Fund’s books and the U.S. dollar equivalent of the amounts actually received or paid. Net unrealized foreign currency gains and losses arise from changes in the fair values of assets and liabilities, other than investments in securities at fiscal period end, resulting from changes in exchange rates. |
The Fund may invest in foreign securities, which may be subject to foreign taxes on income, gains on investments or currency repatriation, a portion of which may be recoverable. Foreign taxes, if any, are recorded based on the tax regulations and rates that exist in the foreign markets in which the Fund invests and are shown in the Statement of Operations.
| K. | Forward Foreign Currency Contracts – The Fund may engage in foreign currency transactions either on a spot (i.e. for prompt delivery and settlement) basis, or through forward foreign currency contracts, to manage or minimize currency or exchange rate risk. |
The Fund may also enter into forward foreign currency contracts for the purchase or sale of a security denominated in a foreign currency in order to “lock in” the U.S. dollar price of that security, or the Fund may also enter into forward foreign currency contracts that do not provide for physical exchange of the two currencies on the settlement date, but instead are settled by a single cash payment calculated as the difference between the agreed upon exchange rate and the spot rate at settlement based upon an agreed upon notional amount (non-deliverable forwards).
A forward foreign currency contract is an obligation between two parties (“Counterparties”) to purchase or sell a specific currency for an agreed-upon price at a future date. The use of forward foreign currency contracts for hedging does not eliminate fluctuations in the price of the underlying securities the Fund owns or intends to acquire but establishes a rate of exchange in advance. Fluctuations in the value of these contracts are measured by the difference in the contract date and reporting date exchange rates and are recorded as unrealized appreciation (depreciation) until the contracts are closed. When the contracts are closed, realized gains (losses) are recorded. Realized and unrealized gains (losses) on the contracts are included in the Statement of Operations. The primary risks associated with forward foreign currency contracts include failure of the Counterparty to meet the terms of the contract and the value of the foreign currency changing unfavorably. These risks may be in excess of the amounts reflected in the Statement of Assets and Liabilities.
|
| 18 Invesco Small Cap Equity Fund |
| L. | COVID-19 Risk - The COVID-19 strain of coronavirus has resulted in instances of market closures and dislocations, extreme volatility, liquidity constraints and increased trading costs. Efforts to contain its spread have resulted in travel restrictions, disruptions of healthcare systems, business operations (including business closures) and supply chains, layoffs, lower consumer demand and employee availability, and defaults and credit downgrades, among other significant economic impacts that have disrupted global economic activity across many industries. Such economic impacts may exacerbate other pre-existing political, social and economic risks locally or globally and cause general concern and uncertainty. The full economic impact and ongoing effects of COVID-19 (or other future epidemics or pandemics) at the macro-level and on individual businesses are unpredictable and may result in significant and prolonged effects on the Fund’s performance. |
NOTE 2–Advisory Fees and Other Fees Paid to Affiliates
The Trust has entered into a master investment advisory agreement with the Adviser. Under the terms of the investment advisory agreement, the Fund accrues daily and pays monthly an advisory fee to the Adviser based on the annual rate of the Fund’s average daily net assets as follows:
| | | | | | | | |
Average Daily Net Assets | | | | Rate | |
First $250 million | | | | 0.745 | % |
Next $250 million | | | | | | | 0.730 | % |
Next $500 million | | | | 0.715 | % |
Next $1.5 billion | | | | 0.700 | % |
Next $2.5 billion | | | | 0.685 | % |
Next $2.5 billion | | | | 0.670 | % |
Next $2.5 billion | | | | 0.655 | % |
Over $10 billion | | | | 0.640 | % |
For the year ended December 31, 2022, the effective advisory fee rate incurred by the Fund was 0.73%.
Under the terms of a master sub-advisory agreement between the Adviser and each of Invesco Asset Management Deutschland GmbH, Invesco Asset Management Limited, Invesco Asset Management (Japan) Limited, Invesco Hong Kong Limited, Invesco Senior Secured Management, Inc. and Invesco Canada Ltd. and separate sub-advisory agreements with Invesco Capital Management LLC and Invesco Asset Management (India) Private Limited (collectively, the “Affiliated Sub-Advisers”) the Adviser, not the Fund, will pay 40% of the fees paid to the Adviser to any such Affiliated Sub-Adviser(s) that provide(s) discretionary investment management services to the Fund based on the percentage of assets allocated to such Affiliated Sub-Adviser(s).
The Adviser has contractually agreed, through at least June 30, 2023, to waive advisory fees and/or reimburse expenses of all shares to the extent necessary to limit total annual fund operating expenses after fee waiver and/or expense reimbursement (excluding certain items discussed below) of Class A, Class C, Class R, Class Y, Class R5 and Class R6 shares to 2.00%, 2.75%, 2.25%, 1.75%, 1.75% and 1.75%, respectively, of the Fund’s average daily net assets (the “expense limits”). In determining the Adviser’s obligation to waive advisory fees and/or reimburse expenses, the following expenses are not taken into account, and could cause the total annual fund operating expenses after fee waiver and/or expense reimbursement to exceed the numbers reflected above: (1) interest; (2) taxes; (3) dividend expense on short sales; (4) extraordinary or non-routine items, including litigation expenses; and (5) expenses that the Fund has incurred but did not actually pay because of an expense offset arrangement. Unless Invesco continues the fee waiver agreement, it will terminate on June 30, 2023. During its term, the fee waiver agreement cannot be terminated or amended to increase the expense limits or reduce the advisory fee waiver without approval of the Board of Trustees. The Adviser did not waive fees and/or reimburse expenses during the period under these expense limits.
Further, the Adviser has contractually agreed, through at least June 30, 2024, to waive the advisory fee payable by the Fund in an amount equal to 100% of the net advisory fees the Adviser receives from the affiliated money market funds on investments by the Fund of uninvested cash (excluding investments of cash collateral from securities lending) in such affiliated money market funds.
For the year ended December 31, 2022, the Adviser waived advisory fees of $29,936.
The Trust has entered into a master administrative services agreement with Invesco pursuant to which the Fund has agreed to pay Invesco for certain administrative costs incurred in providing accounting services to the Fund. For the year ended December 31, 2022, expenses incurred under the agreement are shown in the Statement of Operations as Administrative services fees. Invesco has entered into a sub-administration agreement whereby State Street Bank and Trust Company (“SSB”) serves as fund accountant and provides certain administrative services to the Fund. Pursuant to a custody agreement with the Trust on behalf of the Fund, SSB also serves as the Fund’s custodian.
The Trust has entered into a transfer agency and service agreement with Invesco Investment Services, Inc. (“IIS”) pursuant to which the Fund has agreed to pay IIS a fee for providing transfer agency and shareholder services to the Fund and reimburse IIS for certain expenses incurred by IIS in the course of providing such services. IIS may make payments to intermediaries that provide omnibus account services, sub-accounting services and/or networking services. All fees payable by IIS to intermediaries that provide omnibus account services or sub-accounting services are charged back to the Fund, subject to certain limitations approved by the Trust’s Board of Trustees. For the year ended December 31, 2022, expenses incurred under the agreement are shown in the Statement of Operations as Transfer agent fees.
The Trust has entered into master distribution agreements with Invesco Distributors, Inc. (“IDI”) to serve as the distributor for the Class A, Class C, Class R, Class Y, Class R5 and Class R6 shares of the Fund. The Trust has adopted plans pursuant to Rule 12b-1 under the 1940 Act with respect to the Fund’s Class A, Class C and Class R shares (collectively, the “Plans”). The Fund, pursuant to the Plans, pays IDI compensation at the annual rate of 0.25% of the Fund’s average daily net assets of Class A shares, 1.00% of the average daily net assets of Class C shares and 0.50% of the average daily net assets of Class R shares. The fees are accrued daily and paid monthly. Of the Plan payments, up to 0.25% of the average daily net assets of each class of shares may be paid to furnish continuing personal shareholder services to customers who purchase and own shares of such classes. Any amounts not paid as a service fee under the Plans would constitute an asset-based sales charge. Rules of the Financial Industry Regulatory Authority (“FINRA”) impose a cap on the total sales charges, including asset-based sales charges, that may be paid by any class of shares of the Fund. For the year ended December 31, 2022, expenses incurred under the Plans are shown in the Statement of Operations as Distribution fees.
|
| 19 Invesco Small Cap Equity Fund |
Front-end sales commissions and CDSC (collectively, the “sales charges”) are not recorded as expenses of the Fund. Front-end sales commissions are deducted from proceeds from the sales of Fund shares prior to investment in Class A shares of the Fund. CDSC are deducted from redemption proceeds prior to remittance to the shareholder. During the year ended December 31, 2022, IDI advised the Fund that IDI retained $92,028 in front-end sales commissions from the sale of Class A shares and $3,513 and $719 from Class A and Class C shares, respectively, for CDSC imposed upon redemptions by shareholders.
For the year ended December 31, 2022, the Fund incurred $3,047 in brokerage commissions with Invesco Capital Markets, Inc., an affiliate of the Adviser and IDI, for portfolio transactions executed on behalf of the Fund.
Certain officers and trustees of the Trust are officers and directors of the Adviser, IIS and/or IDI.
NOTE 3–Additional Valuation Information
GAAP defines fair value as the price that would be received to sell an asset or paid to transfer a liability in an orderly transaction between market participants at the measurement date, under current market conditions. GAAP establishes a hierarchy that prioritizes the inputs to valuation methods, giving the highest priority to readily available unadjusted quoted prices in an active market for identical assets (Level 1) and the lowest priority to significant unobservable inputs (Level 3), generally when market prices are not readily available. Based on the valuation inputs, the securities or other investments are tiered into one of three levels. Changes in valuation methods may result in transfers in or out of an investment’s assigned level:
| | |
Level 1 – | | Prices are determined using quoted prices in an active market for identical assets. |
Level 2 – | | Prices are determined using other significant observable inputs. Observable inputs are inputs that other market participants may use in pricing a security. These may include quoted prices for similar securities, interest rates, prepayment speeds, credit risk, yield curves, loss severities, default rates, discount rates, volatilities and others. |
Level 3 – | | Prices are determined using significant unobservable inputs. In situations where quoted prices or observable inputs are unavailable (for example, when there is little or no market activity for an investment at the end of the period), unobservable inputs may be used. Unobservable inputs reflect the Adviser’s assumptions about the factors market participants would use in determining fair value of the securities or instruments and would be based on the best available information. |
The following is a summary of the tiered valuation input levels, as of December 31, 2022. The level assigned to the securities valuations may not be an indication of the risk or liquidity associated with investing in those securities. Because of the inherent uncertainties of valuation, the values reflected in the financial statements may materially differ from the value received upon actual sale of those investments.
| | | | | | | | | | | | | | | | |
| | | Level 1 | | | Level 2 | | | Level 3 | | | Total | |
Investments in Securities | | | | | | | | | | | | | | | | |
Common Stocks & Other Equity Interests | | $ | 837,015,501 | | | $ | - | | | | $- | | | $ | 837,015,501 | |
Money Market Funds | | | 18,777,265 | | | | 148,802,605 | | | | - | | | | 167,579,870 | |
Total Investments | | $ | 855,792,766 | | | $ | 148,802,605 | | | | $- | | | $ | 1,004,595,371 | |
NOTE 4–Expense Offset Arrangement(s)
The expense offset arrangement is comprised of transfer agency credits which result from balances in demand deposit accounts used by the transfer agent for clearing shareholder transactions. For the year ended December 31, 2022, the Fund received credits from this arrangement, which resulted in the reduction of the Fund’s total expenses of $5,413.
NOTE 5–Trustees’ and Officers’ Fees and Benefits
Trustees’ and Officers’ Fees and Benefits include amounts accrued by the Fund to pay remuneration to certain Trustees and Officers of the Fund. Trustees have the option to defer compensation payable by the Fund, and Trustees’ and Officers’ Fees and Benefits also include amounts accrued by the Fund to fund such deferred compensation amounts. Those Trustees who defer compensation have the option to select various Invesco Funds in which their deferral accounts shall be deemed to be invested. Finally, certain current Trustees were eligible to participate in a retirement plan that provided for benefits to be paid upon retirement to Trustees over a period of time based on the number of years of service. The Fund may have certain former Trustees who also participate in a retirement plan and receive benefits under such plan. Trustees’ and Officers’ Fees and Benefits include amounts accrued by the Fund to fund such retirement benefits. Obligations under the deferred compensation and retirement plans represent unsecured claims against the general assets of the Fund.
NOTE 6–Cash Balances
The Fund is permitted to temporarily carry a negative or overdrawn balance in its account with SSB, the custodian bank. Such balances, if any at period-end, are shown in the Statement of Assets and Liabilities under the payable caption Amount due custodian. To compensate the custodian bank for such overdrafts, the overdrawn Fund may either (1) leave funds as a compensating balance in the account so the custodian bank can be compensated by earning the additional interest; or (2) compensate by paying the custodian bank at a rate agreed upon by the custodian bank and Invesco, not to exceed the contractually agreed upon rate. The Fund may not purchase additional securities when any borrowings from banks or broker-dealers exceed 5% of the Fund’s total assets, or when any borrowings from an Invesco Fund are outstanding.
|
| 20 Invesco Small Cap Equity Fund |
NOTE 7–Distributions to Shareholders and Tax Components of Net Assets
Tax Character of Distributions to Shareholders Paid During the Fiscal Years Ended December 31, 2022 and 2021:
| | | | | | | | |
| | |
| | | 2022 | | | 2021 | |
|
| |
Ordinary income* | | $ | 3,782,111 | | | $ | 40,153,182 | |
Long-term capital gain | | | 19,891,720 | | | | 140,146,836 | |
Total distributions | | $ | 23,673,831 | | | $ | 180,300,018 | |
| * | Includes short-term capital gain distributions, if any. |
Tax Components of Net Assets at Period-End:
| | | | |
| | | 2022 | |
|
| |
Net unrealized appreciation – investments | | $ | 93,331,513 | |
|
| |
Net unrealized appreciation (depreciation) – foreign currencies | | | (2 | ) |
|
| |
Temporary book/tax differences | | | (98,459 | ) |
|
| |
Shares of beneficial interest | | | 762,678,862 | |
|
| |
Total net assets | | $ | 855,911,914 | |
|
| |
The difference between book-basis and tax-basis unrealized appreciation (depreciation) is due to differences in the timing of recognition of gains and losses on investments for tax and book purposes. The Fund’s net unrealized appreciation (depreciation) difference is attributable primarily to wash sales and return of capital.
The temporary book/tax differences are a result of timing differences between book and tax recognition of income and/or expenses. The Fund’s temporary book/tax differences are the result of the trustee deferral of compensation and retirement plan benefits.
Capital loss carryforward is calculated and reported as of a specific date. Results of transactions and other activity after that date may affect the amount of capital loss carryforward actually available for the Fund to utilize. The ability to utilize capital loss carryforward in the future may be limited under the Internal Revenue Code and related regulations based on the results of future transactions.
The Fund does not have a capital loss carryforward as of December 31, 2022.
NOTE 8–Investment Transactions
The aggregate amount of investment securities (other than short-term securities, U.S. Government obligations and money market funds, if any) purchased and sold by the Fund during the year ended December 31, 2022 was $298,214,787 and $355,087,020, respectively. Cost of investments, including any derivatives, on a tax basis includes the adjustments for financial reporting purposes as of the most recently completed federal income tax reporting period-end.
| | | | |
| Unrealized Appreciation (Depreciation) of Investments on a Tax Basis | |
|
| |
Aggregate unrealized appreciation of investments | | $ | 184,529,313 | |
|
| |
Aggregate unrealized (depreciation) of investments | | | (91,197,800 | ) |
|
| |
Net unrealized appreciation of investments | | $ | 93,331,513 | |
|
| |
Cost of investments for tax purposes is $911,263,858.
NOTE 9–Reclassification of Permanent Differences
Primarily as a result of differing book/tax treatment of REITs and net operating losses , on December 31, 2022, undistributed net investment income (loss) was increased by $547,535, undistributed net realized gain (loss) was decreased by $32,897 and shares of beneficial interest was decreased by $514,638. This reclassification had no effect on the net assets of the Fund.
NOTE 10–Share Information
| | | | | | | | | | | | | | | | |
| | | Summary of Share Activity | |
|
| |
| | | Year ended | | | Year ended | |
| | | December 31, 2022(a) | | | December 31, 2021 | |
| | | Shares | | | Amount | | | Shares | | | Amount | |
|
| |
Sold: | | | | | | | | | | | | | | | | |
Class A | | | 5,136,443 | | | $ | 64,986,774 | | | | 5,015,384 | | | $ | 85,528,828 | |
|
| |
Class C | | | 270,323 | | | | 2,149,348 | | | | 416,624 | | | | 5,004,241 | |
|
| |
Class R | | | 1,529,353 | | | | 17,514,223 | | | | 890,653 | | | | 13,863,107 | |
|
| |
Class Y | | | 1,776,454 | | | | 24,391,302 | | | | 2,455,563 | | | | 44,474,055 | |
|
| |
Class R5 | | | 245,308 | | | | 3,690,075 | | | | 315,843 | | | | 6,213,714 | |
|
| |
Class R6 | | | 3,216,448 | | | | 48,312,105 | | | | 3,260,718 | | | | 65,428,913 | |
|
| |
|
| 21 Invesco Small Cap Equity Fund |
| | | | | | | | | | | | | | | | |
| | | Summary of Share Activity | |
|
| |
| | | Year ended | | | Year ended | |
| | | December 31, 2022(a) | | | December 31, 2021 | |
| | | Shares | | | Amount | | | Shares | | | Amount | |
|
| |
| | | | |
Issued as reinvestment of dividends: | | | | | | | | | | | | | | | | |
Class A | | | 1,210,906 | | | | $13,937,483 | | | | 7,067,826 | | | $ | 101,423,307 | |
|
| |
Class C | | | 73,440 | | | | 528,767 | | | | 424,577 | | | | 3,910,360 | |
|
| |
Class R | | | 147,885 | | | | 1,502,512 | | | | 709,372 | | | | 9,044,489 | |
|
| |
Class Y | | | 112,947 | | | | 1,394,901 | | | | 765,104 | | | | 11,736,691 | |
|
| |
Class R5 | | | 36,974 | | | | 509,497 | | | | 221,969 | | | | 3,782,349 | |
|
| |
Class R6 | | | 347,555 | | | | 4,851,865 | | | | 2,461,555 | | | | 42,461,825 | |
|
| |
| | | | |
Automatic conversion of Class C shares to Class A shares: | | | | | | | | | | | | | | | | |
Class A | | | 117,533 | | | | 1,451,109 | | | | 87,219 | | | | 1,491,762 | |
|
| |
Class C | | | (184,020 | ) | | | (1,451,109 | ) | | | (124,860 | ) | | | (1,491,762 | ) |
|
| |
| | | | |
Reacquired: | | | | | | | | | | | | | | | | |
Class A | | | (6,699,487 | ) | | | (82,927,046 | ) | | | (5,705,779 | ) | | | (97,257,349 | ) |
|
| |
Class C | | | (341,092 | ) | | | (2,691,920 | ) | | | (391,796 | ) | | | (4,699,528 | ) |
|
| |
Class R | | | (958,686 | ) | | | (10,654,512 | ) | | | (1,310,120 | ) | | | (20,468,638 | ) |
|
| |
Class Y | | | (2,774,961 | ) | | | (36,305,439 | ) | | | (1,742,443 | ) | | | (31,420,571 | ) |
|
| |
Class R5 | | | (297,895 | ) | | | (4,367,314 | ) | | | (230,795 | ) | | | (4,539,329 | ) |
|
| |
Class R6 | | | (6,201,361 | ) | | | (96,739,910 | ) | | | (3,883,067 | ) | | | (77,738,243 | ) |
|
| |
Net increase (decrease) in share activity | | | (3,235,933 | ) | | | $(49,917,289 | ) | | | 10,703,547 | | | $ | 156,748,221 | |
|
| |
| (a) | There are entities that are record owners of more than 5% of the outstanding shares of the Fund and in the aggregate own 51% of the outstanding shares of the Fund. IDI has an agreement with these entities to sell Fund shares. The Fund, Invesco and/or Invesco affiliates may make payments to these entities, which are considered to be related to the Fund, for providing services to the Fund, Invesco and/or Invesco affiliates including but not limited to services such as securities brokerage, distribution, third party record keeping and account servicing. The Fund has no knowledge as to whether all or any portion of the shares owned of record by these entities are also owned beneficially. |
|
| 22 Invesco Small Cap Equity Fund |
Report of Independent Registered Public Accounting Firm
To the Board of Trustees of AIM Funds Group (Invesco Funds Group) and Shareholders of Invesco Small Cap Equity Fund
Opinion on the Financial Statements
We have audited the accompanying statement of assets and liabilities, including the schedule of investments, of Invesco Small Cap Equity Fund (one of the funds constituting AIM Funds Group (Invesco Funds Group), referred to hereafter as the “Fund”) as of December 31, 2022, the related statement of operations for the year ended December 31, 2022, the statement of changes in net assets for each of the two years in the period ended December 31, 2022, including the related notes, and the financial highlights for each of the five years in the period ended December 31, 2022 (collectively referred to as the “financial statements”). In our opinion, the financial statements present fairly, in all material respects, the financial position of the Fund as of December 31, 2022, the results of its operations for the year then ended, the changes in its net assets for each of the two years in the period ended December 31, 2022 and the financial highlights for each of the five years in the period ended December 31, 2022 in conformity with accounting principles generally accepted in the United States of America.
Basis for Opinion
These financial statements are the responsibility of the Fund’s management. Our responsibility is to express an opinion on the Fund’s financial statements based on our audits. We are a public accounting firm registered with the Public Company Accounting Oversight Board (United States) (PCAOB) and are required to be independent with respect to the Fund in accordance with the U.S. federal securities laws and the applicable rules and regulations of the Securities and Exchange Commission and the PCAOB.
We conducted our audits of these financial statements in accordance with the standards of the PCAOB. Those standards require that we plan and perform the audit to obtain reasonable assurance about whether the financial statements are free of material misstatement, whether due to error or fraud.
Our audits included performing procedures to assess the risks of material misstatement of the financial statements, whether due to error or fraud, and performing procedures that respond to those risks. Such procedures included examining, on a test basis, evidence regarding the amounts and disclosures in the financial statements. Our audits also included evaluating the accounting principles used and significant estimates made by management, as well as evaluating the overall presentation of the financial statements. Our procedures included confirmation of securities owned as of December 31, 2022 by correspondence with the custodian, transfer agent and broker. We believe that our audits provide a reasonable basis for our opinion.
/s/PricewaterhouseCoopers LLP
Houston, Texas
February 22, 2023
We have served as the auditor of one or more of the investment companies in the Invesco group of investment companies since at least 1995. We have not been able to determine the specific year we began serving as auditor.
|
| 23 Invesco Small Cap Equity Fund |
Calculating your ongoing Fund expenses
Example
As a shareholder of the Fund, you incur two types of costs: (1) transaction costs, which may include sales charges (loads) on purchase payments or contingent deferred sales charges on redemptions, if any; and (2) ongoing costs, including management fees, distribution and/or service (12b-1) fees, and other Fund expenses. This example is intended to help you understand your ongoing costs (in dollars) of investing in the Fund and to compare these costs with ongoing costs of investing in other mutual funds. The example is based on an investment of $1,000 invested at the beginning of the period and held for the entire period July 1, 2022 through December 31, 2022.
Actual expenses
The table below provides information about actual account values and actual expenses. You may use the information in this table, together with the amount you invested, to estimate the expenses that you paid over the period. Simply divide your account value by $1,000 (for example, an $8,600 account value divided by $1,000 = 8.6), then multiply the result by the number in the table under the heading entitled “Actual Expenses Paid During Period” to estimate the expenses you paid on your account during this period.
Hypothetical example for comparison purposes
The table below also provides information about hypothetical account values and hypothetical expenses based on the Fund’s actual expense ratio and an assumed rate of return of 5% per year before expenses, which is not the Fund’s actual return.
The hypothetical account values and expenses may not be used to estimate the actual ending account balance or expenses you paid for the period. You may use this information to compare the ongoing costs of investing in the Fund and other funds. To do so, compare this 5% hypothetical example with the 5% hypothetical examples that appear in the shareholder reports of the other funds.
Please note that the expenses shown in the table are meant to highlight your ongoing costs only and do not reflect any transaction costs, such as sales charges (loads) on purchase payments or contingent deferred sales charges on redemptions, if any. Therefore, the hypothetical information is useful in comparing ongoing costs only, and will not help you determine the relative total costs of owning different funds. In addition, if these transaction costs were included, your costs would have been higher.
| | | | | | | | | | | | | | | | | | | | | | | | | | | | | | |
| | | | | ACTUAL | | HYPOTHETICAL (5% annual return before expenses) | | Annualized
Expense Ratio |
| | | Beginning
Account Value
(07/01/22) | | Ending
Account Value
(12/31/22)1 | | Expenses
Paid During
Period2 | | Ending
Account Value
(12/31/22) | | Expenses
Paid During
Period2 |
Class A | | | $ | 1,000.00 | | | | $ | 1,067.50 | | | | $ | 6.72 | | | | $ | 1,018.70 | | | | $ | 6.56 | | | | | 1.29 | % |
Class C | | | | 1,000.00 | | | | | 1,063.50 | | | | | 10.61 | | | | | 1,014.92 | | | | | 10.36 | | | | | 2.04 | |
Class R | | | | 1,000.00 | | | | | 1,066.00 | | | | | 8.02 | | | | | 1,017.44 | | | | | 7.83 | | | | | 1.54 | |
Class Y | | | | 1,000.00 | | | | | 1,068.90 | | | | | 5.42 | | | | | 1,019.96 | | | | | 5.30 | | | | | 1.04 | |
Class R5 | | | | 1,000.00 | | | | | 1,069.60 | | | | | 4.54 | | | | | 1,020.82 | | | | | 4.43 | | | | | 0.87 | |
Class R6 | | | | 1,000.00 | | | | | 1,069.40 | | | | | 4.17 | | | | | 1,021.17 | | | | | 4.08 | | | | | 0.80 | |
| 1 | The actual ending account value is based on the actual total return of the Fund for the period July 1, 2022 through December 31, 2022, after actual expenses and will differ from the hypothetical ending account value which is based on the Fund’s expense ratio and a hypothetical annual return of 5% before expenses. |
| 2 | Expenses are equal to the Fund’s annualized expense ratio as indicated above multiplied by the average account value over the period, multiplied by 184/365 to reflect the most recent fiscal half year. |
|
| 24 Invesco Small Cap Equity Fund |
Tax Information
Form 1099-DIV, Form 1042-S and other year–end tax information provide shareholders with actual calendar year amounts that should be included in their tax returns. Shareholders should consult their tax advisers.
The following distribution information is being provided as required by the Internal Revenue Code or to meet a specific state’s requirement.
The Fund designates the following amounts or, if subsequently determined to be different, the maximum amount allowable for its fiscal year ended December 31, 2022:
| | | | | | | | | | |
| | | | | | | | | |
Federal and State Income Tax | | | | | | | | |
Long-Term Capital Gain Distributions | | $ | 19,891,720 | | | | | |
Qualified Dividend Income* | | | 38.62 | % | | | | |
Corporate Dividends Received Deduction* | | | 37.56 | % | | | | |
U.S. Treasury Obligations* | | | 0.00 | % | | | | |
Qualified Business Income* | | | 3.99 | % | | | | |
Business Interest Income* | | | 0.00 | % | | | | |
| | * | The above percentages are based on ordinary income dividends paid to shareholders during the Fund’s fiscal year. |
| | | | | | |
| | | | | | |
Non-Resident Alien Shareholders | | | | |
Short-Term Capital Gain Distributions | | $ | 3,782,111 | |
|
| 25 Invesco Small Cap Equity Fund |
Trustees and Officers
The address of each trustee and officer is AIM Funds Group (Invesco Funds Group) (the “Trust”), 11 Greenway Plaza, Suite 1000, Houston, Texas 77046-1173. The trustees serve for the life of the Trust, subject to their earlier death, incapacitation, resignation, retirement or removal as more specifically provided in the Trust’s organizational documents. Each officer serves for a one year term or until their successors are elected and qualified. Column two below includes length of time served with predecessor entities, if any.
| | | | | | | | |
Name, Year of Birth and
Position(s)
Held with the Trust | | Trustee and/or Officer Since | | Principal Occupation(s) During Past 5 Years | | Number of
Funds in
Fund Complex
Overseen by
Trustee | | Other Directorship(s) Held by Trustee During Past 5 Years |
| Interested Trustee |
| Martin L. Flanagan1 – 1960 Trustee and Vice Chair | | 2007 | | Executive Director, Chief Executive Officer and President, Invesco Ltd. (ultimate parent of Invesco and a global investment management firm); Trustee and Vice Chair, The Invesco Funds; Vice Chair, Investment Company Institute; and Member of Executive Board, SMU Cox School of Business Formerly: Advisor to the Board, Invesco Advisers, Inc. (formerly known as Invesco Institutional (N.A.), Inc.); Chairman and Chief Executive Officer, Invesco Advisers, Inc. (registered investment adviser); Director, Chairman, Chief Executive Officer and President, Invesco Holding Company (US), Inc. (formerly IVZ Inc.) (holding company), Invesco Group Services, Inc. (service provider) and Invesco North American Holdings, Inc. (holding company); Director, Chief Executive Officer and President, Invesco Holding Company Limited (parent of Invesco and a global investment management firm); Director, Invesco Ltd.; Chairman, Investment Company Institute and President, Co-Chief Executive Officer, Co-President, Chief Operating Officer and Chief Financial Officer, Franklin Resources, Inc. (global investment management organization) | | 189 | | None |
| 1 | Mr. Flanagan is considered an interested person (within the meaning of Section 2(a)(19) of the 1940 Act) of the Trust because he is an officer of the Adviser to the Trust, and an officer and a director of Invesco Ltd., ultimate parent of the Adviser. |
|
| T-1 Invesco Small Cap Equity Fund |
Trustees and Officers–(continued)
| | | | | | | | |
Name, Year of Birth and
Position(s)
Held with the Trust | | Trustee and/or Officer Since | | Principal Occupation(s) During Past 5 Years | | Number of
Funds in
Fund Complex
Overseen by
Trustee | | Other Directorship(s)
Held by Trustee
During Past 5 Years |
| Independent Trustees |
Beth Ann Brown – 1968 Trustee (2019) and Chair (August 2022) | | 2019 | | Independent Consultant Formerly: Head of Intermediary Distribution, Managing Director, Strategic Relations, Managing Director, Head of National Accounts, Senior Vice President, National Account Manager and Senior Vice President, Key Account Manager, Columbia Management Investment Advisers LLC; Vice President, Key Account Manager, Liberty Funds Distributor, Inc.; and Trustee of certain Oppenheimer Funds | | 189 | | Director, Board of Directors of Caron Engineering Inc.; Advisor, Board of Advisors of Caron Engineering Inc.; President and Director, Acton Shapleigh Youth Conservation Corps (non-profit) Formerly: President and Director Director of Grahamtastic Connection (non-profit) |
| Cynthia Hostetler – 1962 Trustee | | 2017 | | Non-Executive Director and Trustee of a number of public and private business corporations Formerly: Director, Aberdeen Investment Funds (4 portfolios); Director, Artio Global Investment LLC (mutual fund complex); Director, Edgen Group, Inc. (specialized energy and infrastructure products distributor); Director, Genesee & Wyoming, Inc. (railroads); Head of Investment Funds and Private Equity, Overseas Private Investment Corporation; President, First Manhattan Bancorporation, Inc.; and Attorney, Simpson Thacher & Bartlett LLP | | 189 | | Resideo Technologies, Inc. (smart home technology); Vulcan Materials Company (construction materials company); Trilinc Global Impact Fund; Textainer Group Holdings, (shipping container leasing company); Investment Company Institute (professional organization); and Independent Directors Council (professional organization) |
Eli Jones – 1961 Trustee | | 2016 | | Professor and Dean Emeritus, Mays Business School - Texas A&M University Formerly: Dean of Mays Business School-Texas A&M University; Professor and Dean, Walton College of Business, University of Arkansas and E.J. Ourso College of Business, Louisiana State University; and Director, Arvest Bank | | 189 | | Insperity, Inc. (formerly known as Administaff) (human resources provider); and Member of Regional Board of Directors and Board of Directors, First Financial Bancorp (regional bank) |
Elizabeth Krentzman – 1959 Trustee | | 2019 | | Formerly: Principal and Chief Regulatory Advisor for Asset Management Services and U.S. Mutual Fund Leader of Deloitte & Touche LLP; General Counsel of the Investment Company Institute (trade association); National Director of the Investment Management Regulatory Consulting Practice, Principal, Director and Senior Manager of Deloitte & Touche LLP; Assistant Director of the Division of Investment Management - Office of Disclosure and Investment Adviser Regulation of the U.S. Securities and Exchange Commission and various positions with the Division of Investment Management - Office of Regulatory Policy of the U.S. Securities and Exchange Commission; Associate at Ropes & Gray LLP; and Trustee of certain Oppenheimer Funds | | 189 | | Formerly: Member of the Cartica Funds Board of Directors (private investment fund); Trustee of the University of Florida National Board Foundation; and Member of the University of Florida Law Center Association, Inc. Board of Trustees, Audit Committee and Membership Committee |
Anthony J. LaCava, Jr. – 1956 Trustee | | 2019 | | Formerly: Director and Member of the Audit Committee, Blue Hills Bank (publicly traded financial institution) and Managing Partner, KPMG LLP | | 189 | | Blue Hills Bank; Chairman, Bentley University; Member, Business School Advisory Council; and Nominating Committee, KPMG LLP |
Prema Mathai-Davis – 1950 Trustee | | 1998 | | Retired Formerly: Co-Founder & Partner of Quantalytics Research, LLC, (a FinTech Investment Research Platform for the Self-Directed Investor); Trustee of YWCA Retirement Fund; CEO of YWCA of the USA; Board member of the NY Metropolitan Transportation Authority; Commissioner of the NYC Department of Aging; and Board member of Johns Hopkins Bioethics Institute | | 189 | | Member of Board of Positive Planet US (non-profit) and HealthCare Chaplaincy Network (non-profit) |
T-2 Invesco Small Cap Equity Fund
Trustees and Officers–(continued)
| | | | | | | | |
Name, Year of Birth and
Position(s)
Held with the Trust | | Trustee and/or Officer Since | | Principal Occupation(s) During Past 5 Years | | Number of
Funds in
Fund Complex
Overseen by
Trustee | | Other Directorship(s)
Held by Trustee
During Past 5 Years |
| Independent Trustees–(continued) | | | | |
Joel W. Motley – 1952 Trustee | | 2019 | | Director of Office of Finance, Federal Home Loan Bank System; Managing Director of Carmona Motley Inc. (privately held financial advisor); Member of the Council on Foreign Relations and its Finance and Budget Committee; Chairman Emeritus of Board of Human Rights Watch and Member of its Investment Committee; and Member of Investment Committee Board of Historic Hudson Valley (non-profit cultural organization); Member of the Board, Blue Ocean Acquisition Corp.; and Member of the Vestry and the Investment Committee of Trinity Church Wall Street. Formerly: Managing Director of Public Capital Advisors, LLC (privately held financial advisor); Managing Director of Carmona Motley Hoffman, Inc. (privately held financial advisor); Trustee of certain Oppenheimer Funds; and Director of Columbia Equity Financial Corp. (privately held financial advisor) | | 189 | | Member of Board of Trust for Mutual Understanding (non-profit promoting the arts and environment); Member of Board of Greenwall Foundation (bioethics research foundation) and its Investment Committee; Member of Board of Friends of the LRC (non-profit legal advocacy); and Board Member and Investment Committee Member of Pulitzer Center for Crisis Reporting (non-profit journalism) |
Teresa M. Ressel – 1962 Trustee | | 2017 | | Non-executive director and trustee of a number of public and private business corporations Formerly: Chief Executive Officer, UBS Securities LLC (investment banking); Chief Operating Officer, UBS AG Americas (investment banking); Sr. Management Team Olayan America, The Olayan Group (international investor/commercial/industrial); Assistant Secretary for Management & Budget and Designated Chief Financial Officer, U.S. Department of Treasury and Director, ON Semiconductor Corporation (semiconductor manufacturing) | | 189 | | None |
Robert C. Troccoli – 1949 Trustee | | 2016 | | Retired Formerly: Adjunct Professor, University of Denver - Daniels College of Business; and Managing Partner, KPMG LLP | | 189 | | None |
Daniel S. Vandivort – 1954 Trustee | | 2019 | | President, Flyway Advisory Services LLC (consulting and property management) Formerly: President and Chief Investment Officer, previously Head of Fixed Income, Weiss Peck and Greer/Robeco Investment Management; Trustee and Chair, Weiss Peck and Greer Funds Board; and various capacities at CS First Boston including Head of Fixed Income at First Boston Asset Management. | | 189 | | Formerly: Trustee and Governance Chair, Oppenheimer Funds; Treasurer, Chairman of the Audit and Finance Committee, Huntington Disease Foundation of America |
T-3 Invesco Small Cap Equity Fund
Trustees and Officers–(continued)
| | | | | | | | |
Name, Year of Birth and Position(s) Held with the Trust | | Trustee and/or Officer Since | | Principal Occupation(s) During Past 5 Years | | Number of Funds in Fund Complex Overseen by Trustee | | Other Directorship(s) Held by Trustee During Past 5 Years |
| Officers | | | | | | | | |
Sheri Morris – 1964 President and Principal Executive Officer | | 1999 | | Director, Invesco Trust Company; Head of Global Fund Services, Invesco Ltd.; President and Principal Executive Officer, The Invesco Funds; Vice President, Invesco Exchange-Traded Fund Trust, Invesco Exchange-Traded Fund Trust II, Invesco India Exchange-Traded Fund Trust, Invesco Actively Managed Exchange-Traded Fund Trust, Invesco Actively Managed Exchange-Traded Commodity Fund Trust and Invesco Exchange-Traded Self-Indexed Fund Trust; and Vice President, OppenheimerFunds, Inc. Formerly: Vice President, Treasurer and Principal Financial Officer, The Invesco Funds; Vice President, Invesco AIM Advisers, Inc., Invesco AIM Capital Management, Inc. and Invesco AIM Private Asset Management, Inc.; Assistant Vice President and Assistant Treasurer, The Invesco Funds; Vice President and Assistant Vice President, Invesco Advisers, Inc.; Assistant Vice President, Invesco AIM Capital Management, Inc. and Invesco AIM Private Asset Management, Inc.; Treasurer, Invesco Exchange-Traded Fund Trust, Invesco Exchange-Traded Fund Trust II, Invesco India Exchange-Traded Fund Trust and Invesco Actively Managed Exchange-Traded Fund Trust; and Senior Vice President, Invesco Advisers, Inc. (formerly known as Invesco Institutional (N.A.), Inc.) (registered investment adviser) | | N/A | | N/A |
Jeffrey H. Kupor – 1968 Senior Vice President, Chief Legal Officer and Secretary | | 2018 | | Head of Legal of the Americas, Invesco Ltd.; Senior Vice President and Secretary, Invesco Advisers, Inc. (formerly known as Invesco Institutional (N.A.), Inc.) (registered investment adviser); Secretary, Invesco Distributors, Inc. (formerly known as Invesco AIM Distributors, Inc.); Vice President and Secretary, Invesco Investment Services, Inc. (formerly known as Invesco AIM Investment Services, Inc.); Senior Vice President, Chief Legal Officer and Secretary, The Invesco Funds; Secretary and General Counsel, Invesco Investment Advisers LLC (formerly known as Van Kampen Asset Management); Secretary and General Counsel, Invesco Capital Markets, Inc. (formerly known as Van Kampen Funds Inc.); Chief Legal Officer, Invesco Exchange-Traded Fund Trust, Invesco Exchange-Traded Fund Trust II, Invesco India Exchange-Traded Fund Trust, Invesco Actively Managed Exchange-Traded Fund Trust, Invesco Actively Managed Exchange-Traded Commodity Fund Trust and Invesco Exchange-Traded Self-Indexed Fund Trust;; Secretary and Vice President, Harbourview Asset Management Corporation; Secretary and Vice President, OppenheimerFunds, Inc. and Invesco Managed Accounts, LLC; Secretary and Senior Vice President, OFI Global Institutional, Inc.; Secretary and Vice President, OFI SteelPath, Inc.; Secretary and Vice President, Oppenheimer Acquisition Corp.; Secretary and Vice President, Shareholder Services, Inc.; and Secretary and Vice President, Trinity Investment Management Corporation Formerly: Senior Vice President, Invesco Distributors, Inc.; Secretary and Vice President, Jemstep, Inc.; Head of Legal, Worldwide Institutional, Invesco Ltd.; Secretary and General Counsel, INVESCO Private Capital Investments, Inc.; Senior Vice President, Secretary and General Counsel, Invesco Management Group, Inc. (formerly known as Invesco AIM Management Group, Inc.); Assistant Secretary, INVESCO Asset Management (Bermuda) Ltd.; Secretary and General Counsel, Invesco Private Capital, Inc.;Assistant Secretary and General Counsel, INVESCO Realty, Inc.; Secretary and General Counsel, Invesco Senior Secured Management, Inc.; Secretary, Sovereign G./P. Holdings Inc.; Secretary, Invesco Indexing LLC; and Secretary, W.L. Ross & Co., LLC | | N/A | | N/A |
Andrew R. Schlossberg – 1974 Senior Vice President | | 2019 | | Senior Vice President, Invesco Group Services, Inc.; Head of the Americas and Senior Managing Director, Invesco Ltd.; Director and Senior Vice President, Invesco Advisers, Inc. (formerly known as Invesco Institutional (N.A.), Inc.) (registered investment adviser); Director and Chairman, Invesco Investment Services, Inc. (formerly known as Invesco AIM Investment Services, Inc.) (registered transfer agent); Senior Vice President, The Invesco Funds; and Director, Invesco Investment Advisers LLC (formerly known as Van Kampen Asset Management) Formerly: Director, President and Chairman, Invesco Insurance Agency, Inc.; Director, Invesco UK Limited; Director and Chief Executive, Invesco Asset Management Limited and Invesco Fund Managers Limited; Assistant Vice President, The Invesco Funds; Senior Vice President, Invesco Advisers, Inc. (formerly known as Invesco Institutional (N.A.), Inc.) (registered investment adviser); Director and Chief Executive, Invesco Administration Services Limited and Invesco Global Investment Funds Limited; Director, Invesco Distributors, Inc.; Head of EMEA, Invesco Ltd.; President, Invesco Actively Managed Exchange-Traded Commodity Fund Trust, Invesco Actively Managed Exchange-Traded Fund Trust, Invesco Exchange-Traded Fund Trust, Invesco Exchange-Traded Fund Trust II and Invesco India Exchange-Traded Fund Trust; and Managing Director and Principal Executive Officer, Invesco Capital Management LLC | | N/A | | N/A |
T-4 Invesco Small Cap Equity Fund
Trustees and Officers–(continued)
| | | | | | | | |
Name, Year of Birth and Position(s) Held with the Trust | | Trustee and/or Officer Since | | Principal Occupation(s) During Past 5 Years | | Number of Funds in Fund Complex Overseen by Trustee | | Other Directorship(s) Held by Trustee During Past 5 Years |
| Officers–(continued) | | | | | | | | |
John M. Zerr – 1962 Senior Vice President | | 2006 | | Chief Operating Officer of the Americas; Senior Vice President, Invesco Advisers, Inc. (formerly known as Invesco Institutional (N.A.), Inc.) (registered investment adviser); Senior Vice President, Invesco Distributors, Inc. (formerly known as Invesco AIM Distributors, Inc.); Director and Vice President, Invesco Investment Services, Inc. (formerly known as Invesco AIM Investment Services, Inc.) Senior Vice President, The Invesco Funds; Managing Director, Invesco Capital Management LLC; Director, Invesco Investment Advisers LLC (formerly known as Van Kampen Asset Management); Senior Vice President, Invesco Capital Markets, Inc. (formerly known as Van Kampen Funds Inc.); Manager, Invesco Indexing LLC; Manager, Invesco Specialized Products, LLC; Member, Invesco Canada Funds Advisory Board; Director, President and Chief Executive Officer, Invesco Corporate Class Inc. (corporate mutual fund company); and Director, Chairman, President and Chief Executive Officer, Invesco Canada Ltd. (formerly known as Invesco Trimark Ltd./Invesco Trimark Ltèe) (registered investment adviser and registered transfer agent); President, Invesco, Inc.; President, Invesco Global Direct Real Estate Feeder GP Ltd.; President, Invesco IP Holdings (Canada) Ltd; President, Invesco Global Direct Real Estate GP Ltd.; President, Invesco Financial Services Ltd. / Services Financiers Invesco Ltée; and Director and Chairman, Invesco Trust Company Formerly: President, Trimark Investments Ltd/Services Financiers Invesco Ltee; Director and Senior Vice President, Invesco Insurance Agency, Inc.; Director and Senior Vice President, Invesco Management Group, Inc. (formerly known as Invesco AIM Management Group, Inc.); Secretary and General Counsel, Invesco Management Group, Inc. (formerly known as Invesco AIM Management Group, Inc.); Secretary, Invesco Investment Services, Inc. (formerly known as Invesco AIM Investment Services, Inc.); Chief Legal Officer and Secretary, The Invesco Funds; Secretary and General Counsel, Invesco Investment Advisers LLC (formerly known as Van Kampen Asset Management); Secretary and General Counsel, Invesco Capital Markets, Inc. (formerly known as Van Kampen Funds Inc.); Chief Legal Officer, Invesco Exchange-Traded Fund Trust, Invesco Exchange-Traded Fund Trust II, Invesco India Exchange-Traded Fund Trust, Invesco Actively Managed Exchange-Traded Fund Trust, Invesco Actively Managed Exchange-Traded Commodity Fund Trust and Invesco Exchange-Traded Self-Indexed Fund Trust; Secretary, Invesco Indexing LLC; Director, Secretary, General Counsel and Senior Vice President, Van Kampen Exchange Corp.; Director, Vice President and Secretary, IVZ Distributors, Inc. (formerly known as INVESCO Distributors, Inc.); Director and Vice President, INVESCO Funds Group, Inc.; Director and Vice President, Van Kampen Advisors Inc.; Director, Vice President, Secretary and General Counsel, Van Kampen Investor Services Inc.;Director and Secretary, Invesco Distributors, Inc. (formerly known as Invesco AIM Distributors, Inc.); Director, Senior Vice President, General Counsel and Secretary, Invesco AIM Advisers, Inc. and Van Kampen Investments Inc.; Director, Vice President and Secretary, Fund Management Company; Director, Senior Vice President, Secretary, General Counsel and Vice President, Invesco AIM Capital Management, Inc.; and Chief Operating Officer and General Counsel, Liberty Ridge Capital, Inc. (an investment adviser) | | N/A | | N/A |
Gregory G. McGreevey - 1962 Senior Vice President | | 2012 | | Senior Managing Director, Invesco Ltd.; Director, Chairman, President, and Chief Executive Officer, Invesco Advisers, Inc. (formerly known as Invesco Institutional (N.A.), Inc.) (registered investment adviser); Director, Invesco Mortgage Capital, Inc. and Invesco Senior Secured Management, Inc.; Senior Vice President, The Invesco Funds; President, SNW Asset Management Corporation and Invesco Managed Accounts, LLC; Chairman and Director, Invesco Private Capital, Inc.; Chairman and Director, INVESCO Private Capital Investments, Inc.; Chairman and Director, INVESCO Realty, Inc.; and Senior Vice President, Invesco Group Services, Inc. Formerly: Senior Vice President, Invesco Management Group, Inc. and Invesco Advisers, Inc.; Assistant Vice President, The Invesco Funds | | N/A | | N/A |
Adrien Deberghes- 1967 Principal Financial Officer, Treasurer and Vice President | | 2020 | | Head of the Fund Office of the CFO and Fund Administration; Vice President, Invesco Advisers, Inc.; Principal Financial Officer, Treasurer and Vice President, The Invesco Funds; Vice President, Invesco Exchange-Traded Fund Trust, Invesco Exchange-Traded Fund Trust II, Invesco India Exchange-Traded Fund Trust, Invesco Actively Managed Exchange-Traded Fund Trust, Invesco Actively Managed Exchange-Traded Commodity Fund Trust and Invesco Exchange-Traded Self-Indexed Fund Trust Formerly: Senior Vice President and Treasurer, Fidelity Investments | | N/A | | N/A |
Crissie M. Wisdom – 1969 Anti-Money Laundering Compliance Officer | | 2013 | | Anti-Money Laundering and OFAC Compliance Officer for Invesco U.S. entities including: Invesco Advisers, Inc. and its affiliates, Invesco Capital Markets, Inc., Invesco Distributors, Inc., Invesco Investment Services, Inc., The Invesco Funds, Invesco Capital Management, LLC, Invesco Trust Company; and Fraud Prevention Manager for Invesco Investment Services, Inc. | | N/A | | N/A |
T-5 Invesco Small Cap Equity Fund
Trustees and Officers–(continued)
| | | | | | | | |
Name, Year of Birth and Position(s) Held with the Trust | | Trustee and/or Officer Since | | Principal Occupation(s) During Past 5 Years | | Number of Funds in Fund Complex Overseen by Trustee | | Other Directorship(s) Held by Trustee During Past 5 Years |
| Officers–(continued) | | | | | | | | |
Todd F. Kuehl – 1969 Chief Compliance Officer and Senior Vice President | | 2020 | | Chief Compliance Officer, Invesco Advisers, Inc. (registered investment adviser); and Chief Compliance Officer and Senior Vice President, The Invesco Funds Formerly: Managing Director and Chief Compliance Officer, Legg Mason (Mutual Funds); Chief Compliance Officer, Legg Mason Private Portfolio Group (registered investment adviser) | | N/A | | N/A |
James Bordewick, Jr. – 1959 Senior Vice President and Senior Officer | | 2022 | | Senior Vice President and Senior Officer, The Invesco Funds Formerly: Chief Legal Officer, KingsCrowd, Inc. (research and analytical platform for investment in private capital markets); Chief Operating Officer and Head of Legal and Regulatory, Netcapital (private capital investment platform); Managing Director, General Counsel of asset management and Chief Compliance Officer for asset management and private banking, Bank of America Corporation; Chief Legal Officer, Columbia Funds and BofA Funds; Senior Vice President and Associate General Counsel, MFS Investment Management; Chief Legal Officer, MFS Funds; Associate, Ropes & Gray; and Associate, Gaston Snow & Ely Bartlett | | N/A | | N/A |
| | | | | | |
| Office of the Fund | | Investment Adviser | | Distributor | | Auditors |
| 11 Greenway Plaza, Suite 1000 | | Invesco Advisers, Inc. | | Invesco Distributors, Inc. | | PricewaterhouseCoopers LLP |
| Houston, TX 77046-1173 | | 1555 Peachtree Street, N.E. | | 11 Greenway Plaza, Suite 1000 | | 1000 Louisiana Street, Suite 5800 |
| | Atlanta, GA 30309 | | Houston, TX 77046-1173 | | Houston, TX 77002-5021 |
| | | |
| Counsel to the Fund | | Counsel to the Independent Trustees | | Transfer Agent | | Custodian |
| Stradley Ronon Stevens & Young, LLP | | Sidley Austin LLP | | Invesco Investment Services, Inc. | | State Street Bank and Trust Company |
| 2005 Market Street, Suite 2600 | | 787 Seventh Avenue | | 11 Greenway Plaza, Suite 1000 | | 225 Franklin Street |
| Philadelphia, PA 19103-7018 | | New York, NY 10019 | | Houston, TX 77046-1173 | | Boston, MA 02110-2801 |
T-6 Invesco Small Cap Equity Fund

Go paperless with eDelivery
Visit invesco.com/edelivery to enjoy the convenience and security of anytime electronic access to your investment documents.
With eDelivery, you can elect to have any or all of the following materials delivered straight to your inbox to download, save and print from your own computer:
∎ Fund reports and prospectuses
∎ Quarterly statements
∎ Daily confirmations
∎ Tax forms
Invesco mailing information
Send general correspondence to Invesco Investment Services, Inc., P.O. Box 219078, Kansas City, MO 64121-9078.
Important notice regarding delivery of security holder documents
To reduce Fund expenses, only one copy of most shareholder documents may be mailed to shareholders with multiple accounts at the same address (Householding). Mailing of your shareholder documents may be householded indefinitely unless you instruct us otherwise. If you do not want the mailing of these documents to be combined with those for other members of your household, please contact Invesco Investment Services, Inc. at 800 959 4246 or contact your financial institution. We will begin sending you individual copies for each account within 30 days after receiving your request.
Fund holdings and proxy voting information
The Fund provides a complete list of its portfolio holdings four times each year, at the end of each fiscal quarter. For the second and fourth quarters, the list appears, respectively, in the Fund’s semiannual and annual reports to shareholders. For the first and third quarters, the Fund files the list with the Securities and Exchange Commission (SEC) as an exhibit to its reports on Form N-PORT. The most recent list of portfolio holdings is available at invesco.com/completeqtrholdings. Shareholders can also look up the Fund’s Form N-PORT filings on the SEC website, sec.gov. The SEC file numbers for the Fund are shown below.
A description of the policies and procedures that the Fund uses to determine how to vote proxies relating to portfolio securities is available without charge, upon request, from our Client Services department at 800 959 4246, or at invesco.com/ corporate/about-us/esg. The information is also available on the SEC website, sec.gov.
Information regarding how the Fund voted proxies related to its portfolio securities during the most recent 12-month period ended June 30 is available at invesco.com/proxysearch. This information is also available on the SEC website, sec.gov.
Invesco Advisers, Inc. is an investment adviser; it provides investment advisory services to individual and institutional clients and does not sell securities. Invesco Distributors, Inc. is the US distributor for Invesco Ltd.’s retail mutual funds, exchange-traded funds and institutional money market funds. Both are wholly owned, indirect subsidiaries of Invesco Ltd.

| | | | | | |
SEC file number(s): 811-01540 and 002-27334 | | Invesco Distributors, Inc. | | SCE-AR-1 | | |
ITEM 2. CODE OF ETHICS.
There were no amendments to the Code of Ethics (the “Code”) that applies to the Registrant’s Principal Executive Officer (“PEO”) and Principal Financial Officer (“PFO”) during the period covered by the report. The Registrant did not grant any waivers, including implicit waivers, from any provisions of the Code to the PEO or PFO during the period covered by this report.
ITEM 3. AUDIT COMMITTEE FINANCIAL EXPERT.
The Board of Trustees has determined that the Registrant has at least one audit committee financial expert serving on its Audit Committee. The Audit Committee financial experts are Cynthia Hostetler, Anthony J. LaCava, Jr., and Robert C. Troccoli. Cynthia Hostetler, Anthony J. LaCava, Jr., and Robert C. Troccoli are “independent” within the meaning of that term as used in Form N-CSR.
ITEM 4. PRINCIPAL ACCOUNTANT FEES AND SERVICES.
Pursuant to PCAOB Rule 3526, Communication with Audit Committees Concerning Independence, PricewaterhouseCoopers LLC (“PwC”) advised the Registrant’s Audit Committee of the following two matters identified since the previous annual Form N-CSR filing that may be reasonably thought to bear on PwC’s independence. PwC advised the Audit Committee that one PwC Senior Associate and one PwC Partner each held financial interests directly in an investment company within the complex that includes the Funds as well as all registered investment companies advised by the Adviser and its affiliates, including other subsidiaries of the Adviser’s parent company, Invesco Ltd. (collectively the “Invesco Funds Investment Company Complex”) that were inconsistent with the requirements of Rule 2-01(c)(1) of SEC Regulation S-X. In reporting each matter to the Audit Committee, PwC noted, among other things, that the impermissible holdings were disposed of by the individuals, the individuals were not in the chain of command of the audit or the audit partners of the Funds, the financial interests were not material to the net worth of each individual or his or her respective immediate family members and the Funds’ audit engagement team was unaware of the impermissible holdings until after the matters were confirmed to be independence exceptions . In addition, PwC considered that the audit services performed by the PwC Senior Associate were reviewed by team members at least two levels higher than the individual and the individual did not have any decision making responsibility for matters that materially affected the audit and that the PwC Partner provided non-audit services that were not relied upon by the audit engagement team in the audits of the financial statements of the Funds. Based on the mitigating factors noted above, PwC advised the Audit Committee that it concluded, individually for each matter and in the aggregate, that its objectivity and impartiality with respect to all issues encompassed within the audit engagement has not been impaired and it believes that a reasonable investor with knowledge of all relevant facts and circumstances for the violations would conclude PwC is capable of exercising objective and impartial judgment on all issues encompassed within the audits of the financial statements of the Funds in the Registrant for the impacted periods.
(a) to (d)
Fees Billed by PwC Related to the Registrant
PwC billed the Registrant aggregate fees for services rendered to the Registrant for the last two fiscal years as shown in the following table. The Audit Committee pre-approved all audit and non-audit services provided to the Registrant.
| | | | | | | | | | |
| | | Fees Billed for
Services Rendered
to the Registrant for
fiscal year end 2022 | | Fees Billed for
Services Rendered
to the Registrant for
fiscal year end 2021 |
Audit Fees | | | $ | 126,684 | | | | $ | 122,400 | |
Audit-Related Fees(1) | | | $ | 0 | | | | $ | 21,000 | |
Tax Fees(2) | | | $ | 58,160 | | | | $ | 106,105 | |
All Other Fees | | | $ | 0 | | | | $ | 0 | |
Total Fees | | | $ | 184,844 | | | | $ | 249,505 | |
| | (1) | Audit-Related Fees for the fiscal year ended December 31, 2021, includes fees billed for reviewing regulatory filings. |
| | (2) | Tax Fees for the fiscal years ended December 31, 2022 and December 31, 2021 includes fees billed for preparation of U.S. Tax Returns and Taxable Income calculations, including excise tax and year-to-date estimates for various book-to-tax differences. |
Fees Billed by PwC Related to Invesco and Invesco Affiliates
PwC billed Invesco Advisers, Inc. (“Invesco”), the Registrant’s adviser, and any entity controlling, controlled by or under common control with Invesco that provides ongoing services to the Registrant (“Invesco Affiliates”) aggregate fees for pre-approved non-audit services rendered to Invesco and Invesco Affiliates for the last two fiscal years as shown in the following table. The Audit Committee pre-approved all non-audit services provided to Invesco and Invesco Affiliates that were required to be pre-approved.
| | | | | | | | | | |
| | | Fees Billed for Non- Audit Services
Rendered to Invesco and
Invesco Affiliates for
fiscal year end 2022 That Were Required to be Pre-Approved by the Registrant’s Audit Committee | | Fees Billed for Non-Audit
Services Rendered to Invesco and Invesco
Affiliates for fiscal year end 2021 That Were Required to be Pre-Approved by the Registrant’s Audit Committee |
Audit-Related Fees(1) | | | $ | 874,000 | | | | $ | 801,000 | |
Tax Fees | | | $ | 0 | | | | $ | 0 | |
All Other Fees | | | $ | 0 | | | | $ | 0 | |
Total Fees | | | $ | 874,000 | | | | $ | 801,000 | |
(1) Audit-Related Fees for the fiscal years ended 2022 and 2021 include fees billed related to reviewing controls at a service organization.
(e)(1)
PRE-APPROVAL OF AUDIT AND NON-AUDIT SERVICES
POLICIES AND PROCEDURES
As adopted by the Audit Committees
of the Invesco Funds (the “Funds”)
Last Amended March 29, 2017
| | I. | Statement of Principles |
The Audit Committees (the “Audit Committee”) of the Boards of Trustees of the Funds (the “Board”) have adopted these policies and procedures (the “Procedures”) with respect to the pre-approval of audit and non-audit services to be provided by the Funds’ independent auditor (the “Auditor”) to the Funds, and to the Funds’ investment adviser(s) and any entity controlling, controlled by, or under common control with the investment adviser(s) that provides ongoing services to the Funds (collectively, “Service Affiliates”).
Under Section 202 of the Sarbanes-Oxley Act of 2002, all audit and non-audit services provided to the Funds by the Auditor must be preapproved by the Audit Committee. Rule 2-01 of Regulation S-X requires that the Audit Committee also pre-approve a Service Affiliate’s engagement of the Auditor for non-audit services if the engagement relates directly to the operations and financial reporting of the Funds (a “Service Affiliate’s Covered Engagement”).
These Procedures set forth the procedures and the conditions pursuant to which the Audit Committee may pre-approve audit and non-audit services for the Funds and a Service Affiliate’s Covered Engagement pursuant to rules and regulations of the Securities and Exchange Commission (“SEC”) and other organizations and regulatory bodies applicable to the Funds (“Applicable Rules”).1 They address both general pre-approvals without consideration of specific case-by-case services (“general pre-approvals”) and pre-approvals on a case-by-case basis (“specific pre-approvals”). Any services requiring pre-approval that are not within the scope of general pre-approvals hereunder are subject to specific pre-approval. These Procedures also address the delegation by the Audit Committee of pre-approval authority to the Audit Committee Chair or Vice Chair.
| | II. | Pre-Approval of Fund Audit Services |
The annual Fund audit services engagement, including terms and fees, is subject to specific pre-approval by the Audit Committee. Audit services include the annual financial statement audit and other procedures required to be performed by an independent auditor to be able to form an opinion on the Funds’ financial statements. The Audit Committee will receive, review and consider sufficient information concerning a proposed Fund audit engagement to make a reasonable evaluation of the Auditor’s qualifications and independence. The Audit Committee will oversee the Fund audit services engagement as necessary, including approving any changes in terms, audit scope, conditions and fees.
In addition to approving the Fund audit services engagement at least annually and specifically approving any changes, the Audit Committee may generally or specifically pre-approve engagements for other audit services, which are those services that only an independent auditor reasonably can provide. Other audit
1 Applicable Rules include, for example, New York Stock Exchange (“NYSE”) rules applicable to closed-end funds managed by Invesco and listed on NYSE.
| | III. | General and Specific Pre-Approval of Non-Audit Fund Services |
The Audit Committee will consider, at least annually, the list of General Pre-Approved Non-Audit Services which list may be terminated or modified at any time by the Audit Committee. To inform the Audit Committee’s review and approval of General Pre-Approved Non-Audit Services, the Funds’ Treasurer (or his or her designee) and Auditor shall provide such information regarding independence or other matters as the Audit Committee may request.
Any services or fee ranges that are not within the scope of General Pre-Approved Non-Audit Services have not received general pre-approval and require specific pre-approval. Each request for specific pre-approval by the Audit Committee for services to be provided by the Auditor to the Funds must be submitted to the Audit Committee by the Funds’ Treasurer (or his or her designee) and must include detailed information about the services to be provided, the fees or fee ranges to be charged, and other relevant information sufficient to allow the Audit Committee to consider whether to pre-approve such engagement, including evaluating whether the provision of such services will impair the independence of the Auditor and is otherwise consistent with Applicable Rules.
| | IV. | Non-Audit Service Types |
The Audit Committee may provide either general or specific pre-approval of audit-related, tax or other services, each as described in more detail below.
“Audit-related services” are assurance and related services that are reasonably related to the performance of the audit or review of the Fund’s financial statements or that are traditionally performed by an independent auditor. Audit-related services include, among others, accounting consultations related to accounting, financial reporting or disclosure matters not classified as “Audit services”; assistance with understanding and implementing new accounting and financial reporting guidance from rulemaking authorities; services related to mergers, acquisitions or dispositions; compliance with ratings agency requirements and interfund lending activities; and assistance with internal control reporting requirements.
“Tax services” include, but are not limited to, the review and signing of the Funds’ federal tax returns, the review of required distributions by the Funds and consultations regarding tax matters such as the tax treatment of new investments or the impact of new regulations. The Audit Committee will not approve proposed services of the Auditor which the Audit Committee believes are to be provided in connection with a service or transaction initially recommended by the Auditor, the sole business purpose of which may be tax avoidance and the tax treatment of which may not be supported in the Internal Revenue Code and related regulations. The Audit Committee will consult with the Funds’ Treasurer (or his or her designee) and may consult with outside counsel or advisers as necessary to ensure the consistency of tax services rendered by the Auditor with the foregoing policy. The Auditor shall not represent any Fund or any Service Affiliate before a tax court, district court or federal court of claims.
Each request to provide tax services under either the general or specific pre-approval of the Audit Committee will include a description from the Auditor in writing of (i) the scope of the service, the fee structure for the engagement, and any side letter or other amendment to the engagement letter, or any other agreement (whether oral, written, or otherwise) between the Auditor and the Funds, relating to the service; and (ii) any compensation arrangement or other agreement, such as a referral agreement, a referral fee or fee-sharing arrangement, between the Auditor (or an affiliate of the Auditor) and any
person (other than the Funds or Service Affiliates receiving the services) with respect to the promoting, marketing, or recommending of a transaction covered by the service. The Auditor will also discuss with the Audit Committee the potential effects of the services on the independence of the Auditor, and document the substance of its discussion with the Audit Committee.
The Audit Committee may pre-approve other non-audit services so long as the Audit Committee believes that the service will not impair the independence of the Auditor. Appendix I includes a list of services that the Auditor is prohibited from performing by the SEC rules. Appendix I also includes a list of services that would impair the Auditor’s independence unless the Audit Committee reasonably concludes that the results of the services will not be subject to audit procedures during an audit of the Funds’ financial statements.
| | V. | Pre-Approval of Service Affiliate’s Covered Engagements |
Rule 2-01 of Regulation S-X requires that the Audit Committee pre-approve a Service Affiliate’s engagement of the Auditor for non-audit services if the engagement relates directly to the operations and financial reporting of the Funds, defined above as a “Service Affiliate’s Covered Engagement”.
The Audit Committee may provide either general or specific pre-approval of any Service Affiliate’s Covered Engagement, including for audit-related, tax or other services, as described above, if the Audit Committee believes that the provision of the services to a Service Affiliate will not impair the independence of the Auditor with respect to the Funds. Any Service Affiliate’s Covered Engagements that are not within the scope of General Pre-Approved Non-Audit Services have not received general pre-approval and require specific pre-approval.
Each request for specific pre-approval by the Audit Committee of a Service Affiliate’s Covered Engagement must be submitted to the Audit Committee by the Funds’ Treasurer (or his or her designee) and must include detailed information about the services to be provided, the fees or fee ranges to be charged, a description of the current status of the pre-approval process involving other audit committees in the Invesco investment company complex (as defined in Rule 2-201 of Regulation S-X) with respect to the proposed engagement, and other relevant information sufficient to allow the Audit Committee to consider whether the provision of such services will impair the independence of the Auditor from the Funds. Additionally, the Funds’ Treasurer (or his or her designee) and the Auditor will provide the Audit Committee with a statement that the proposed engagement requires pre-approval by the Audit Committee, the proposed engagement, in their view, will not impair the independence of the Auditor and is consistent with Applicable Rules, and the description of the proposed engagement provided to the Audit Committee is consistent with that presented to or approved by the Invesco audit committee.
Information about all Service Affiliate engagements of the Auditor for non-audit services, whether or not subject to pre-approval by the Audit Committee, shall be provided to the Audit Committee at least quarterly, to allow the Audit Committee to consider whether the provision of such services is compatible with maintaining the Auditor’s independence from the Funds. The Funds’ Treasurer and Auditor shall provide the Audit Committee with sufficiently detailed information about the scope of services provided and the fees for such services, to ensure that the Audit Committee can adequately consider whether the provision of such services is compatible with maintaining the Auditor’s independence from the Fund
| | VI. | Pre-Approved Fee Levels or Established Amounts |
Pre-approved fee levels or ranges for audit and non-audit services to be provided by the Auditor to the Funds, and for a Service Affiliate’s Covered Engagement, under general pre-approval or specific pre-approval will be set periodically by the Audit Committee. Any proposed fees exceeding 110% of the maximum pre-approved fee levels or ranges for such services or engagements will be promptly presented to the Audit Committee and will require specific pre-approval by the Audit Committee before payment of any additional fees is made.
The Audit Committee hereby delegates, subject to the dollar limitations set forth below, specific authority to its Chair, or in his or her absence, Vice Chair, to pre-approve audit and non-audit services proposed to be provided by the Auditor to the Funds and/or a Service Affiliate’s Covered Engagement, between Audit Committee meetings. Such delegation does not preclude the Chair or Vice Chair from declining, on a case by case basis, to exercise his or her delegated authority and instead convening the Audit Committee to consider and pre-approve any proposed services or engagements.
Notwithstanding the foregoing, the Audit Committee must pre-approve: (a) any non-audit services to be provided to the Funds for which the fees are estimated to exceed $500,000; (b) any Service Affiliate’s Covered Engagement for which the fees are estimated to exceed $500,000; or (c) any cost increase to any previously approved service or engagement that exceeds the greater of $250,000 or 50% of the previously approved fees up to a maximum increase of $500,000.
| | VIII. | Compliance with Procedures |
Notwithstanding anything herein to the contrary, failure to pre-approve any services or engagements that are not required to be pre-approved pursuant to the de minimis exception provided for in Rule 2-01(c)(7)(i)(C) of Regulation S-X shall not constitute a violation of these Procedures. The Audit Committee has designated the Funds’ Treasurer to ensure services and engagements are pre-approved in compliance with these Procedures. The Funds’ Treasurer will immediately report to the Chair of the Audit Committee, or the Vice Chair in his or her absence, any breach of these Procedures that comes to the attention of the Funds’ Treasurer or any services or engagements that are not required to be pre-approved pursuant to the de minimis exception provided for in Rule 2-01(c)(7)(i)(C) of Regulation S-X.
On at least an annual basis, the Auditor will provide the Audit Committee with a summary of all non-audit services provided to any entity in the investment company complex (as defined in section 2-01(f)(14) of Regulation S-X, including the Funds and Service Affiliates) that were not pre-approved, including the nature of services provided and the associated fees.
| | IX. | Amendments to Procedures |
All material amendments to these Procedures must be approved in advance by the Audit Committee. Non-material amendments to these Procedures may be made by the Legal and Compliance Departments and will be reported to the Audit Committee at the next regularly scheduled meeting of the Audit Committee.
Appendix I
Non-Audit Services That May Impair the Auditor’s Independence
The Auditor is not independent if, at any point during the audit and professional engagement, the Auditor provides the following non-audit services:
| | ● | | Broker-dealer, investment adviser, or investment banking services ; |
| | ● | | Expert services unrelated to the audit; |
| | ● | | Any service or product provided for a contingent fee or a commission; |
| | ● | | Services related to marketing, planning, or opining in favor of the tax treatment of confidential transactions or aggressive tax position transactions, a significant purpose of which is tax avoidance; |
| | ● | | Tax services for persons in financial reporting oversight roles at the Fund; and |
| | ● | | Any other service that the Public Company Oversight Board determines by regulation is impermissible. |
An Auditor is not independent if, at any point during the audit and professional engagement, the Auditor provides the following non-audit services unless it is reasonable to conclude that the results of the services will not be subject to audit procedures during an audit of the Funds’ financial statements:
| | ● | | Bookkeeping or other services related to the accounting records or financial statements of the audit client; |
| | ● | | Financial information systems design and implementation; |
| | ● | | Appraisal or valuation services, fairness opinions, or contribution-in-kind reports; |
| | ● | | Actuarial services; and |
| | ● | | Internal audit outsourcing services. |
(e)(2) There were no amounts that were pre-approved by the Audit Committee pursuant to the de minimus exception under Rule 2-01 of Regulation S-X.
(f) Not applicable.
(g) In addition to the amounts shown in the tables above, PwC billed Invesco and Invesco Affiliates aggregate fees of $ 8,440,000 for the fiscal year ended December 31, 2022 and $5,931,000 for the fiscal year ended December 31, 2021. In total, PwC billed the Registrant, Invesco and Invesco Affiliates aggregate non-audit fees of $9,372,160 for the fiscal year ended December 31, 2022 and $6,838,105 for the fiscal year ended December 31, 2021.
PwC provided audit services to the Investment Company complex of approximately $32 million.
(h) The Audit Committee also has considered whether the provision of non-audit services that were rendered to Invesco and Invesco Affiliates that were not required to be pre-approved pursuant to SEC regulations, if any, is compatible with maintaining PwC’s independence.
| ITEM 5. | AUDIT COMMITTEE OF LISTED REGISTRANTS. |
Not applicable.
| ITEM 6. | SCHEDULE OF INVESTMENTS. |
Investments in securities of unaffiliated issuers is included as part of the reports to stockholders filed under Item 1 of this Form.
| ITEM 7. | DISCLOSURE OF PROXY VOTING POLICIES AND PROCEDURES FOR CLOSED-END MANAGEMENT INVESTMENT COMPANIES. |
Not applicable.
| ITEM 8. | PORTFOLIO MANAGERS OF CLOSED-END MANAGEMENT COMPANIES. |
Not applicable.
| ITEM 9. | PURCHASES OF EQUITY SECURITIES BY CLOSED-END MANAGEMENT INVESTMENT COMPANY AND AFFILIATED PURCHASERS. |
Not applicable.
| ITEM 10. | SUBMISSION OF MATTERS TO A VOTE OF SECURITY HOLDERS. |
None.
| ITEM 11. | CONTROLS AND PROCEDURES. |
| | (a) | As of February 10, 2023, an evaluation was performed under the supervision and with the participation of the officers of the Registrant, including the PEO and PFO, to assess the effectiveness of the Registrant’s disclosure controls and procedures, as that term is defined in Rule 30a-3(c) under the Investment Company Act of 1940 (the “Act”), as amended. Based on that evaluation, the Registrant’s officers, including the PEO and PFO, concluded that, as of February 10, 2023, the Registrant’s disclosure controls and procedures were reasonably designed to ensure: (1) that information required to be disclosed by the Registrant on Form N-CSR is recorded, processed, summarized and reported within the time periods specified by the rules and forms of the Securities and Exchange Commission; and (2) that material |
| | information relating to the Registrant is made known to the PEO and PFO as appropriate to allow timely decisions regarding required disclosure. |
| | (b) | There have been no changes in the Registrant’s internal control over financial reporting (as defined in Rule 30a-3(d) under the Act) that occurred during the period covered by this report that have materially affected, or are reasonably likely to materially affect, the Registrant’s internal control over financial reporting. |
| ITEM 12. | DISCLOSURE OF SECURITIES LENDING ACTIVITIES FOR CLOSED-END MANAGEMENT INVESTMENT COMPANIES. |
Not applicable.
SIGNATURES
Pursuant to the requirements of the Securities Exchange Act of 1934 and the Investment Company Act of 1940, the Registrant has duly caused this report to be signed on its behalf by the undersigned, thereunto duly authorized.
Registrant: AIM Funds Group (Invesco Funds Group)
| | |
| By: | | /s/ Sheri Morris |
| | Sheri Morris |
| | Principal Executive Officer |
| |
| Date: | | March 1, 2023 |
Pursuant to the requirements of the Securities and Exchange Act of 1934 and the Investment Company Act of 1940, this report has been signed below by the following persons on behalf of the Registrant and in the capacities and on the dates indicated.
| | |
| By: | | /s/ Sheri Morris |
| | Sheri Morris |
| | Principal Executive Officer |
| |
| Date: | | March 1, 2023 |
| | |
| By: | | /s/ Adrien Deberghes |
| | Adrien Deberghes |
| | Principal Financial Officer |
| |
| Date: | | March 1, 2023 |