0001934850fg:LongDurationContractsAssumptionsActualExperienceMemberfg:ImmediateAnnuityMember2024-12-31
UNITED STATES
SECURITIES AND EXCHANGE COMMISSION
Washington, D.C. 20549
FORM 10-K
(Mark One)
| | | | | |
| ☒ | ANNUAL REPORT PURSUANT TO SECTION 13 OR 15(d) OF THE SECURITIES EXCHANGE ACT OF 1934 |
For the fiscal year ended December 31, 2024
OR
| | | | | |
| ☐ | TRANSITION REPORT PURSUANT TO SECTION 13 OR 15(d) OF THE SECURITIES EXCHANGE ACT OF 1934 |
Commission file number 001-41490
F&G Annuities & Life, Inc.
(Exact name of registrant as specified in its charter)
| | | | | | | | | | | | | | |
| Delaware | | | 85-2487422 |
| (State or other jurisdiction of incorporation or organization) | | | (I.R.S. Employer Identification No.) |
| |
801 Grand Avenue, Suite 2600 Des Moines, Iowa 50309 |
| (Address of principal executive offices, including zip code) |
(866) 846-4660
(Registrant's telephone number, including area code)
Securities registered pursuant to Section 12(b) of the Act:
| | | | | | | | |
| Title of each class | Trading Symbol(s) | Name of each exchange on which registered |
| Common stock, par value $0.001 per share | FG | New York Stock Exchange |
| 7.950% Senior Notes due 2053 | FGN | New York Stock Exchange |
| 7.300% Junior Subordinated Notes due 2065 | FGSN | New York Stock Exchange |
Securities registered pursuant to section 12(g) of the Act: None
Indicate by check mark if the registrant is a well-known seasoned issuer, as defined in Rule 405 of the Securities Act. Yes ☒ No
Indicate by check mark if the registrant is not required to file reports pursuant to Section 13 or Section 15(d) of the Act. Yes No ☒
Indicate by check mark whether the registrant: (1) has filed all reports required to be filed by Section 13 or 15(d) of the Securities Exchange Act of 1934 during the preceding 12 months (or for such shorter period that the registrant was required to file such reports); and (2) has been subject to such filing requirements for the past 90 days. Yes ☒ No
Indicate by check mark whether the registrant has submitted electronically and posted on its corporate web site, if any, every Interactive Data File required to be submitted and posted pursuant to Rule 405 of Regulation S-T (§232.405 of this chapter) during the preceding 12 months (or for such shorter period that the registrant was required to submit and post such files). Yes ☒ No ☐
Indicate by check mark whether the registrant is a large accelerated filer, an accelerated filer, a non-accelerated filer, or a smaller reporting company. See the definitions of “large accelerated filer,” “accelerated filer” and “smaller reporting company” in Rule 12b-2 of the Exchange Act. (Check one):
| | | | | | | | | | | |
| Large accelerated filer | ☐ | Accelerated filer | ☒ |
| Non-accelerated filer | ☐ | Smaller reporting company | ☐ |
| | Emerging growth company | ☐ |
If an emerging growth company, indicate by check mark if the registrant has elected not to use the extended transition period for complying with any new or revised financial accounting standards provided pursuant to Section 13(a) of the Exchange Act.
Indicate by check mark whether the registrant has filed a report on and attestation to its management’s assessment of the effectiveness of its internal control over financial reporting under Section 404(b) of the Sarbanes-Oxley Act (15 U.S.C. 7262(b)) by the registered public accounting firm that prepared or issued its audit report Yes ☒ No
If the company’s securities are registered under Section 12(b), indicate by check mark whether the company’s financial statements included in the Form 10-K reflect the correction of an error to previously issued financial statements. Yes ☐ No ☒
Indicate by check mark whether any of those error corrections are restatements that required a recovery analysis of incentive-based compensation received by any of the company’s executive officers during the relevant recovery period pursuant to Rule 10D-1(b) under the Exchange Act. Yes No ☒
Indicate by check mark whether the registrant is a shell company (as defined in Rule 12b-2 of the Act). Yes ☐ No ☒
The aggregate market value of the shares of F&G common stock held by non-affiliates of the registrant as of June 30, 2024 was $622,990,760 based on the closing price of $24.78 as reported by The New York Stock Exchange.
The registrant had outstanding 126,773,653 shares of common stock as of January 31, 2025.
DOCUMENTS INCORPORATED BY REFERENCE
Portions of the registrant’s definitive proxy statement to be filed in connection with the Annual Meeting of Shareholders, which will be filed no later than 120 days after December 31, 2024, are incorporated by reference into Part III of this Annual Report on Form 10-K.
F&G ANNUITIES & LIFE, INC.
FORM 10-K
TABLE OF CONTENTS
Introductory Note
The following describes the business of F&G Annuities & Life, Inc. and its subsidiaries. Except where otherwise noted in this Annual Report on Form 10-K, all references to “we,” “us,” “our,” the “Company,” or “F&G” are to F&G Annuities & Life, Inc. and its subsidiaries, taken together.
Statement Regarding Forward-Looking Information
Certain statements included in this Annual Report on Form 10-K and the documents incorporated into this document by reference are “forward-looking statements” within the meaning of Section 27A of the Securities Act of 1933, as amended (the “Securities Act”), and Section 21E of the Securities Exchange Act of 1934, as amended (the “Exchange Act”). Such forward-looking statements include statements about our plans and objectives, including our future financial condition, anticipated capital expenditures, anticipated distributions, and our belief that we have the liquidity and capital resources necessary to meet our known obligations.
This Annual Report on Form 10-K and other materials that F&G has filed or will file with the Securities and Exchange Commission (the “SEC”) contains information that includes or is based upon forward-looking statements that are intended to enhance the reader’s ability to assess our future financial and business performance.
Some of the forward-looking statements can be identified by the use of terms such as “believes,” “expects,” “may,” “will,” “should,” “could,” “seeks,” “intends,” “plans,” “estimates,” “anticipates” or other comparable terms. However, not all forward-looking statements contain these identifying words. These forward-looking statements include all matters that are not related to present facts or current conditions or that are not historical facts. They appear in a number of places throughout this report and include statements regarding our intentions, beliefs or current expectations concerning, among other things, our consolidated results of operations, financial condition, liquidity, prospects and growth strategies and the industries in which we operate and including, without limitation, statements relating to our future performance.
Forward-looking statements are subject to known and unknown risks and uncertainties, many of which are beyond our control. We caution you that forward-looking statements are not guarantees of future performance and that our actual consolidated results of operations, financial condition and liquidity, and industry development may differ materially from those made in or suggested by the forward-looking statements contained in this report. In addition, even if our consolidated results of operations, financial condition and liquidity, and industry development are consistent with the forward-looking statements contained in this report, those results or developments may not be indicative of results or developments in subsequent periods. A number of important factors could cause actual results to differ materially from those contained in or implied by the forward-looking statements, including the risks and uncertainties discussed in “Risk Factors” and the Risk Factor Summary provided below. Factors that could cause actual results to differ from those reflected in forward-looking statements relating to our operations and business include the following (among others):
•general economic conditions and other factors, including prevailing interest and unemployment rate levels and stock and credit market performance;
•natural disasters, public health crises, international tensions and conflicts, geopolitical events, terrorist acts, labor strikes, political crises, accidents and other events;
•concentration in certain states for distribution of our products;
•the impact of interest rate fluctuations;
•equity market volatility;
•credit market volatility or disruption;
•the impact of credit risk of our counterparties;
•volatility or decline in the market price of our common stock could impair our ability to raise necessary capital;
•changes in our methodologies, estimates and assumptions regarding our valuation of investments and the determinations of the amounts of allowances and impairments;
•changes in our valuation allowance against our deferred tax assets, and restrictions on our ability to fully utilize such assets;
•the accuracy of management’s reserving assumptions;
•regulatory changes or actions, including those relating to regulation of financial services affecting (among other things) underwriting of insurance products and regulation of the sale, underwriting and pricing of products, and minimum capitalization and statutory reserve requirements for insurance companies, or the ability of our insurance subsidiaries to make cash distributions to us (including dividends or payments on surplus notes those insurance subsidiaries issue to us);
•the impact of fiduciary standards on us and on our products, distribution and business model;
•changes in the federal income tax laws and regulations which may affect the relative income tax advantages of our products;
•changes in tax laws which affect us and/or our shareholders;
•the impact on our business of new accounting rules or changes to existing accounting rules;
•our potential need and our insurance subsidiaries’ potential need for additional capital to maintain our and their financial strength and credit ratings and meet other requirements and obligations;
•our ability to successfully acquire new companies or businesses and integrate such acquisitions into our existing framework;
•the impact of potential litigation, including class action litigation;
•our ability to protect our intellectual property;
•our ability to maintain effective internal controls over financial reporting;
•the impact of restrictions in our debt instruments on its ability to operate its business, finance its capital needs or pursue or expand its business strategies;
•our ability and our insurance subsidiaries’ ability to maintain or improve financial strength ratings;
•the performance of third parties including third-party administrators, investment managers, independent distributors, underwriters, actuarial consultants and other outsourcing relationships;
•the loss of key personnel;
•interruption or other operational failures in telecommunication, information technology and other operational systems, or a failure to maintain the security, integrity, confidentiality or privacy of sensitive data residing on such systems;
•security breaches or other disruptions in our information technology infrastructure;
•our exposure to unidentified or unanticipated risk not adequately addressed by our risk management policies and procedures;
•the impact on our business of natural and man-made catastrophes, pandemics, and malicious and terrorist acts;
•our ability to compete in a highly competitive industry;
•our ability to attract and retain national marketing organizations and independent agents;
•our subsidiaries’ ability to pay dividends to us; and
•the other factors discussed in “Risk Factors” of this Annual Report on Form 10-K
Consequently, any forward-looking statements should be regarded solely as F&G’s current plans, estimates and beliefs and are based on management’s beliefs and assumptions about the businesses in which F&G competes, global and domestic economic conditions and other factors. F&G does not intend, and will not undertake any obligation, to update any forward-looking statements to reflect future events or circumstances or changed assumptions after the date of such statements.
You should review carefully the section captioned “Risk Factors” in this Annual Report on Form 10-K to better understand the risks and uncertainties inherent in our business and underlying any forward-looking statements.
Risk Factor Summary
Risks Related to Our Business
•Our debt instruments may restrict our current and future operations, particularly our ability to respond to changes or to take certain actions.
•Our ability to grow depends in large part upon the continued availability of capital.
•A financial strength ratings downgrade, potential downgrade, or any other negative action by a rating agency could increase our cost of capital, making it challenging to grow our business, and could hinder our ability to participate in certain market segments, thereby adversely affecting our results of operations and our financial condition.
•We may face losses if our actual experience differs significantly from our reserving assumptions.
•Our valuation of investments and the determinations of the amounts of allowances and impairments taken on our investments may include methodologies, estimates and assumptions which are subject to differing interpretations and, if changed, could materially adversely affect our results of operations and financial condition.
•Change in our evaluation of the recoverability of our deferred tax assets could materially adversely affect our results of operations and financial condition.
•We have recorded goodwill as a result of past acquisitions, and adverse events affecting the value of our reporting unit could cause the balance to become impaired, requiring write-downs that would reduce our operating income.
•If we are unable to attract and retain national marketing organizations and independent agents, sales of our products may be reduced.
•We operate in a highly competitive industry, which could limit our ability to gain or maintain our position in the industry and could materially adversely affect our business, financial condition and results of operations.
•Concentration in certain states for the distribution of our products may subject us to losses attributable to economic downturns or catastrophes in those states.
•Concentration in one or more of our products may subject us to greater volatility of sales if such products experienced a significant decrease in sales.
•We are subject to the credit risk of our counterparties, including companies with whom we have reinsurance agreements or from whom we have purchased options.
•Our business could be interrupted or compromised if we experience difficulties arising from outsourcing relationships.
•The loss of key personnel could negatively affect our financial results and impair our ability to implement our business strategy.
•Our risk management policies and procedures may not capture unidentified or unanticipated risk, which could negatively affect our business or result in losses.
•F&G has a subsidiary focused on acquiring minority and/or majority ownership in indexed universal life and annuity Independent Marketing Organizations (“IMO”). While these acquisitions are intended to diversify our earnings, they present several risks that could adversely affect our business, financial condition and operating results.
•Interruption or other operational failures in telecommunication, information technology and other operational systems, or a failure to maintain the security, integrity, confidentiality or privacy of sensitive data residing on such systems, including as a result of human error, could result in a loss or disclosure of confidential information, damage to our reputation, monetary losses, additional costs and impairment of our ability to conduct business effectively.
•Security breaches like the June 2023 MOVEit incident and other disruptions to our information technology infrastructure could compromise Company, consumer and customer information, interfere with our operations, cause us to incur significant costs for remediation and enhancement of our IT systems and
expose us to legal liability, all of which could have a substantial negative impact on our business and reputation.
•Advancements in Artificial Intelligence, Machine Learning, and Large Language Models (“AI/ML/LLM”) pose risks and challenges.
•The new and emerging types of AI and their uses are very early stage in the industry and may be subject to many uncertain future developments and regulations.
•We rely on our investment management advisory agreements (“IMA”) with Blackstone ISG-I Advisors LLC (“BIS”) and other investment managers and sub-managers for the management of portions of certain of our life insurance companies’ investment portfolios.
•We have a long-term contractual relationship with BIS that limits our ability to terminate this relationship or retain another investment manager without BIS’s consent.
•The historical performance of BIS, or any other asset manager we engage, should not be considered as indicative of the future results of our investment portfolio, our future results or any returns expected on our common stock.
•Increased regulation or scrutiny of alternative investment advisers, arrangements with such investment advisers and investment activities may affect BIS’s or, if engaged, any other asset manager’s ability to manage our investment portfolio or impact the reputation of our business.
Risks Related to Economic Conditions and Market Conditions
•Conditions in the economy generally could adversely affect our business, results of operations and financial condition.
•Our investments are subject to geopolitical risk. The on-going conflicts in Russia, Ukraine and the Middle East may adversely affect our business, financial condition, results of operations and cash flows.
•Our investments are subject to market risks that could be heightened during periods of extreme volatility or disruption in financial and credit markets.
•Our investments are subject to credit risks of the underlying issuer, borrower, or physical collateral which can change over time with the credit cycle.
•Interest rate fluctuations could adversely affect our business, financial condition, liquidity and results of operations.
•Equity market volatility could negatively impact our business.
•We are exposed to liquidity risk as a result of our other risks.
•Our business could be materially and adversely affected by the occurrence of a catastrophe, including natural or man-made disasters.
•Our business is subject to risk due to our owned distribution strategy and investments in distribution consolidators.
Legal, Regulatory and Tax Risks
•Our business is highly regulated and subject to numerous legal restrictions and regulations.
•Our business is subject to government regulation in each of the jurisdictions in which we conduct business and regulators have broad administrative and discretionary authority over our business and business practices.
•Our business in the United States is regulated by the National Association of Insurance Commissioners (“NAIC”), which continues to consider reforms including relating to cybersecurity regulations, best interest standards, risk-based capital (“RBC”) and life insurance reserves.
•Current and emerging developments relating to market conduct standards for the financial industry emerging from the United States Department of Labor’s (“DOL”) implementation of the “fiduciary rule” may over time materially affect our business.
•Our regulation in Bermuda and the Cayman Islands may limit or curtail our activities, and changes to existing regulations may affect our ability to continue to offer our existing products and services, or new products and services.
•The SECURE 2.0 Act of 2022 may impact our business and the markets in which we compete.
•The amount of statutory capital that our insurance subsidiaries have and the amount of statutory capital that they must hold to maintain their financial strength ratings and meet other requirements can vary significantly from time to time due to a number of factors outside of our control.
•New accounting rules or changes to existing accounting standards could adversely impact our reported results of operations.
•Changes in federal or state tax laws may affect sales of our products and profitability.
•Changes in tax law may increase our future tax liabilities and related compliance costs.
•The redemption of our preferred stock may require a significant amount of cash and may result in adverse tax consequences.
•We may be the target of future litigation, law enforcement investigations or increased scrutiny which may negatively affect our operations or financial strength or reduce profitability.
•We may not be able to protect our intellectual property and may be subject to infringement claims.
•Changing rules, public disclosure regulations and stakeholder expectations on environmental, social and corporate governance (“ESG”) related matters create a variety of risks for our business.
Risks Relating to Our Indebtedness and Financing
•We are a holding company and depend on distributions from our subsidiaries for cash.
Risks Related to the Separation and Distribution and our Status as a Subsidiary of Fidelity National Financial, Inc. (“FNF”)
•Although we have past history of operating as a public company, our historical financial information and summary historical financial information are not necessarily representative of the results that we would have achieved as a separate, publicly traded company and may not be a reliable indicator of our future results.
•FNF is our principal shareholder and retains significant rights with respect to our governance and certain corporate actions. In certain cases, FNF may have interests which differ from our other shareholders.
•Certain of our directors may have actual or potential conflicts of interest because of their FNF equity ownership or their current or former FNF positions.
•Provisions in our amended and restated certificate of incorporation and bylaws, and of Delaware law, may prevent or delay an acquisition of us, which could decrease the trading price of our common stock.
•We are a “controlled company” within the meaning of the New York Stock Exchange (“NYSE”) rules and, as a result, we qualify for, and rely on, exemptions from certain corporate governance requirements.
•FNF or F&G may fail to perform under various transaction agreements that were executed as part of the separation and distribution, or we may fail to have necessary systems and services in place when certain of the transaction agreements expire.
•In connection with the separation and distribution, FNF has agreed to indemnify us for certain liabilities and we have agreed to indemnify FNF for certain liabilities. If we are required to pay under these indemnities to FNF, our financial results could be negatively impacted. FNF’s indemnification of us may not be sufficient to hold us harmless from the full amount of all liabilities that will be allocated to us, and FNF may not be able to satisfy its indemnification obligations in the future.
•We may have received better terms from unaffiliated third parties than the terms we received in our agreements with FNF.
•Insurance holding company laws generally provide that no person, corporation or other entity may acquire control of an insurance company, which is presumed to exist if a person owns, directly or indirectly, 10% or more of the voting securities of an insurance company, without the prior approval of such insurance
company’s domiciliary state insurance regulator. Persons considering an investment in our common stock should take into consideration their ownership of FNF voting securities and consult their own legal advisors regarding such laws in light of their particular circumstances.
•Our amended and restated bylaws contain an exclusive forum provision that could limit our shareholders’ ability to choose a judicial forum that they find favorable for certain disputes with us or our directors, officers, shareholders, employees or agents, and may discourage lawsuits with respect to such claims.
•We and certain of our subsidiaries file consolidated federal income tax returns with FNF.
Risks Related to Our Common Stock and Preferred Stock
•Our stock price may fluctuate significantly.
•If we are unable to implement and maintain the effectiveness of our internal control over financial reporting, our investors may lose confidence in the accuracy and completeness of our financial reports, which could adversely affect our stock price.
•Our common stock is subordinated to our preferred stock.
•Substantial sales of our common stock may occur which could cause our stock price to be volatile and to decline.
•We cannot guarantee the timing, amount or payment of dividends on our common stock or preferred stock in the future.
•Your percentage of ownership in F&G may be diluted in the future.
Part I
Item 1. Business
Overview
Founded in 1959, F&G is a leading provider of insurance solutions serving retail annuity and life customers as well as institutional clients. Our mission is to help people turn their aspirations into reality. As of December 31, 2024, F&G has approximately 731,000 policyholders who count on the safety and protection of our fixed annuity and life insurance products. We also serve approximately 115,000 plan participants who will receive their pension payments from F&G through our pension risk transfer solutions.
Through our insurance subsidiaries, including Fidelity & Guaranty Life Insurance Company (“FGL Insurance”) and Fidelity & Guaranty Life Insurance Company of New York (“FGL NY Insurance”), we market a broad portfolio of annuities, including fixed indexed annuities (“FIAs”), registered index-linked annuities (“RILAs”), (together referred to as “indexed annuities”), multi-year guarantee annuities (“MYGAs”) as well as pension risk transfer (“PRT”) solutions, indexed universal life (“IUL”) insurance and institutional funding agreements.
On June 1, 2020, F&G was acquired by Fidelity National Financial, Inc. (“FNF”). We have benefited from financial strength ratings upgrades since the acquisition; S&P and Fitch upgraded to A- in June 2020, Moody’s upgraded to A3 in July 2023, and A.M. Best upgraded to A in January 2024. These upgrades are valued by our distribution partners and positioned us to quickly expand our business in our existing channels and gain access to new markets. Gross sales profitability increased from $4.5 billion for the full year 2020 to $15.3 billion in 2024. With our success in expanding distribution under FNF’s ownership, we have grown assets under management (“AUM”) from $26.5 billion at the time of acquisition to $53.8 billion as of December 31, 2024. We now operate in and source significant premiums from three distinct retail channels and two institutional markets versus a single channel prior to the acquisition by FNF in June 2020. For a discussion of the five distinct channels, see “We Play in Large and Growing Markets” and “Our Retail Distribution Channels” within this section of the Annual Report on Form 10-K.
We believe the strength of our balance sheet provides confidence to our policyholders and business partners and positions us for continued growth. Our investment portfolio is diversified, well positioned and high quality. As of December 31, 2024, 96% of our fixed maturity securities were rated under criteria of the NAIC as NAIC 1 or NAIC 2, the two highest credit rating designations of the NAIC. These assets are managed against what we believe to be prudently underwritten liabilities. We have in-force liabilities of $52.3 billion at December 31, 2024, with a liability duration of approximately 6 years, well matched to our assets. For the year ended December 31, 2024, net earnings attributable to F&G totaled $639 million, we produced adjusted net earnings attributable to F&G common shareholders of $546 million, and we had an adjusted return on assets attributable to F&G common shareholders (“ROA”) of 106 basis points. Adjusted net earnings attributable to F&G common shareholders the year ended December 31, 2024 included $514 million of investment income from alternative investments and $46 million of collateralized loan obligations (“CLOs”) redemptions and bond prepay income, and $14 million tax valuation allowance, partially offset by $26 million of net expense from actuarial assumption and model updates and other items. Alternative investments investment income based on management’s long-term expected return of approximately 10% was $659 million.
We are focused on growing our inforce liabilities and AUM, driven by sales of attractively priced liabilities across our multi-channel new business platform. We have great momentum and remain focused on continuing to deliver long-term growth by driving sustainable asset growth from our retail and pension risk transfer growth strategies, generating ROA expansion from enhanced investment margin opportunities, scale benefits and fee-based earnings from accretive flow reinsurance, as well as diversifying earnings through strong growth in our middle market life insurance business and owned distribution strategies.
As of December 31, 2024, we had $4.0 billion of total F&G equity and $5.6 billion of total F&G common shareholders’ equity excluding accumulated other comprehensive income (loss) (“AOCI”). FGL Insurance’s estimated U.S. RBC ratio was over 410% as of December 31, 2024, as compared to 451% and 442% as of
December 31, 2023 and December 31, 2022, respectively. FGL Insurance expects to maintain its U.S. risk-based capital (“RBC”) ratio at or above our target of 400%.
F&G Dividend Distribution (the “separation and distribution”)
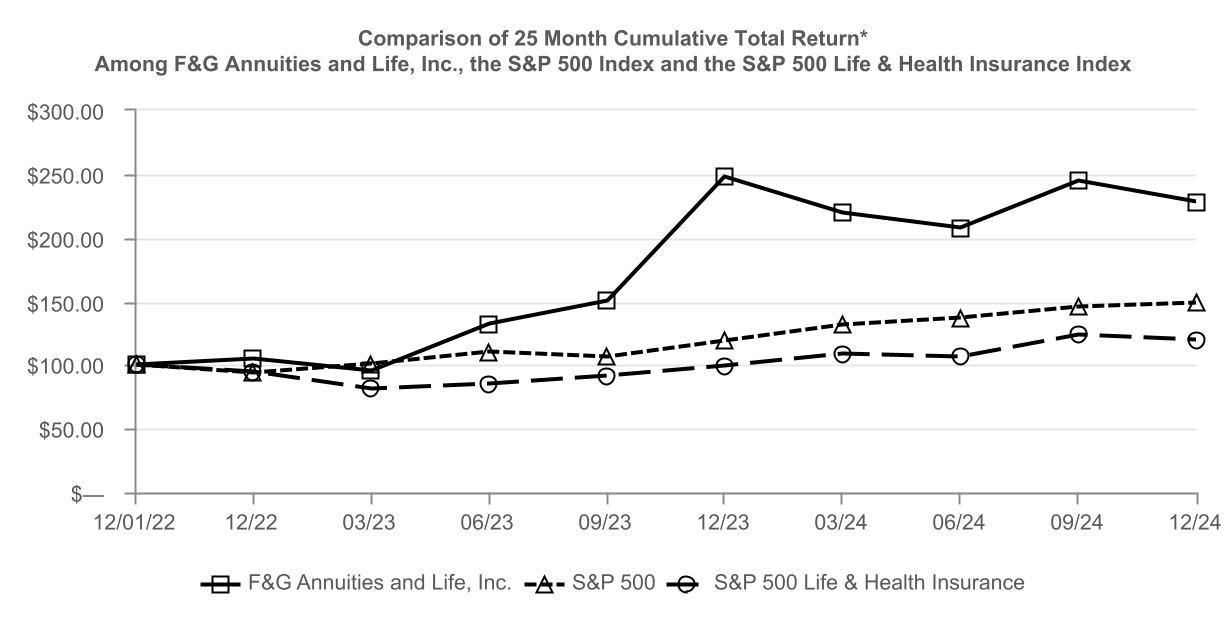
On December 1, 2022, FNF distributed, on a pro rata basis, approximately 15% of the common stock of F&G. The purpose of the separation and distribution was to enhance and more fully recognize the overall market value of each company. FNF retained control of F&G through ownership of approximately 85% of F&G common stock.
For additional information about risks to F&G related to our status as a subsidiary of FNF, please see “Risk Factors - Risks Related to the Separation and Distribution and our Status as a subsidiary of FNF.”
Our Strategy
Through a diversified growth strategy, F&G has demonstrated profitable, compound annual growth rates in gross sales of 31% and AUM of 15% for the five-year period 2019 to 2024 and, more recently, annual increases in gross sales of 16% and AUM of 10% as of December 31, 2024 compared to the year ended December 31, 2023. We have expanded our business in our traditional channel and entered new markets. We are focused on delivering on our medium term financial targets laid out at our October 2023 Investor Day to grow assets, expand ROA and ROE, and increase our multiple as we grow our retail distribution, win our share of the healthy PRT pipeline, maintain spreads in any rate environment, benefit from demographic tailwinds, and diversify through our accretive flow reinsurance and owned distribution strategies, which set F&G apart. We are positioned to accomplish our goals through the following areas of strategic focus:
•Targeting large and growing markets. The opportunity for our core annuity products remains significant, as policyholders seek to add safety and certainty to their retirement plans. Our investments in life insurance products allows us to penetrate the underserved middle market, which addresses the needs of many of our cultural communities. And as corporations continue to de-risk their pension funds, our buyout solutions can guarantee pension-holders the lifetime benefits they need and want. Finally, we continue to attract strong institutional annuity buyers with funding agreements. F&G is a national leader in the markets we play in, and demographic trends provide tailwinds and significant room to continue growing.
•Superior ecosystem. Our business model gives us a sustainable competitive advantage. We have strong and long-standing relationships with a diverse network of distributors, a durable investment edge through our Blackstone partnership, a scalable administrative platform, and a track record of attracting and retaining top talent.
•Consistent track record of success. F&G’s deep and experienced management team has successfully diversified products and channels in recent years and demonstrated our ability to deliver consistent top line growth, increase assets under management and generate steady spreads and expand ROA, excluding short-term mark-to-market effects, across varying market cycles.
•Driving margin expansion and improved returns. We are pursuing strategies to continue to grow earnings, while generating significant positive net cash flow and diversifying into “capital light” flow reinsurance and accretive owned distribution to generate higher return on equity.
Our Competitive Advantages
Our business model is strong and positions us to capitalize on the growth prospects in our addressable markets.
•Trusted by distributors. We have long-standing relationships with a broad range of distributors representing nearly 138,000 independent agents and financial advisors, and built on our reputation for transparency and a consistently competitive product portfolio. We offer fixed annuities and life insurance products through a network of approximately 22 leading banks and broker-dealers and approximately 300 Independent Marketing Organizations (“IMO”) that provide back-office support for thousands of independent insurance agents.
•Winning in high-growth markets. The U.S. retirement and middle markets are growing, and we are both well-established and well-positioned for continued growth. Our strategic alignment with our distribution partners allows us to reach a diverse, growing and underserved middle market demographic in both our retail and institutional channels.
•Durable investment management edge. Our strategic partnership with Blackstone provides a sustained competitive advantage for our business. Our liability profile and risk appetite drives our investment strategy. F&G’s investment and risk offices set strategic asset allocation and risk limits. Blackstone is responsible for idea generation and security selection. Blackstone’s capabilities expand our investment universe to new asset classes and their origination capabilities provide incremental spread. Our high quality, diversified investment portfolio is well positioned to withstand macroeconomic headwinds and continues to perform well. We have enhanced the return while improving the credit quality of our portfolio, and credit related impairments remain low, averaging 7 basis points over the past 3 years, below our pricing assumption.
•Clean and profitable in-force book. As a life insurer, we generate spread earnings based on our assets under management and over the lifetime of the liabilities in place. Our disciplined new business underwriting process provides us with stable liabilities, primarily in products that reset annually, which has allowed us to achieve consistently attractive lifetime returns. Approximately 93% of our $35.6 billion fixed indexed and fixed rate annuities account value are surrender-charge protected and our asset and liability cash flows are well matched. Additionally, our funding agreements, pension risk transfer and immediate annuities are non-surrenderable.
•Track record of attracting top talent. F&G’s management team and over 1,300 employees have a record of long-term success and have delivered impressive results in the last few years. Our commitment to our cultural values is the cornerstone of our success, whereby F&G is a company of individuals who believe in the power of partnerships, encourage innovation and creativity, and are transparent about decisions while delivering on their commitments. This is borne out by consistently being recognized as an employer of choice as well as an involuntary turnover rate that is well below that of other financial services companies. We believe our flexible, employee-centric work approach positions us as an employer of choice.
•Clear governance structure. We have a disciplined approach for considering new lines of business to enter, the appropriate product/channel mix for achieving our targeted new business profitability, and the management of our capital and in-force liabilities. Further, we target and pursue opportunities that leverage our strengths.
We Play in Large and Growing Markets
We serve a market with very attractive demographic tailwinds as more than 10,000 Baby Boomers are retiring every day. Demand for our fixed annuity products continues to grow as people plan for a retirement that could last approximately 30 years and are seeking solutions that can withstand market volatility. Both retirees and advisors are turning to fixed annuities for simplicity, relatively higher interest rates, guaranteed tax deferred growth and principal protection, as an alternative to the traditional 60/40 investment portfolio.
The U.S. retirement market opportunity is vast and includes the $1.1 trillion U.S. consumer savings market and the $223 billion retail life and annuities market. While insured products are designed to effectively serve the needs of retirees, annuities and life insurance solutions continue to be underutilized. We believe middle market consumers, in particular, lack the guidance they need and want and can benefit greatly from insurance solutions.
Retail. Until recently, F&G distributed our flagship annuity and life insurance products solely through our longstanding IMO relationships. In mid-2020, we expanded into the bank and broker-dealer channels to broaden our reach and capture share of the personal savings and CDs markets. Our entry into these channels was successful, resulting in $15.3 billion of cumulative new business since the launch in 2020 to year-end 2024. In early 2024, we entered into the fast-growing RILA market and have successfully onboarded with seven banker dealer distribution partners. We are focused on adding additional distribution partners and see the potential for RILA sales to ramp up over the medium term. Annuity sales through the bank and broker-dealer channels were $5.0 billion and $4.9 billion for the years ended December 31, 2024 and 2023, respectively. The approximate 22 banks and broker-dealers we
work with account for 42% of all annuity sales. In these retail markets F&G ranks: (i) 5th and 11th in FIA sales in the IMO and bank channels and 7th in FIA industry sales; (ii) 7th and 4th in MYGA sales in the broker-dealer and bank channels and 6th in MYGA industry sales; and (iii) 5th in IUL sales in the IMO channel, 4th in the number of IUL policies sold and 6th in IUL industry sales, in each case, for the year to date as of September 30, 2024, as sourced from Wink’s Sales and Market Report.
We successfully expanded into new retail channels and diversified our annuity distribution, yet not at the expense of our traditional IMO channel. We grew our IMO channel sales by 41% and 6% during the years ended December 31, 2024 and December 31, 2023, respectively.
We continue to invest in our life insurance business, focusing our approach to meet the needs of the underserved middle market which we reach largely through Network Marketing Groups (“NMGs”). The middle market segment was the largest in 2023, at 45% of households. NMGs are unique and growing, recruiting members of diverse communities for careers in insurance and penetrating cultural segments. NMGs have proven to be one of our most cost-efficient distribution channels, in large part because they tend to work with a smaller number of strategic product providers. This has allowed us to build deep and lasting relationships with both the NMGs and the agents. Since 2019, largely due to our NMG strategy, F&G’s IUL sales growth has far outpaced the industry, with a three-year combined annual growth rate of 46% compared to the industry’s 10%. F&G’s growth rate in IUL has consistently placed us in the top 10 IUL sales ranking since 2021. Untapped opportunities remain in this channel, particularly among younger and more diverse demographics. In the United States, 42% of adults reported a need for life insurance or more coverage, which equates to approximately 102 million adults with a life insurance gap. Hispanics, the second largest ethnic group behind Caucasians, have the largest uninsured population among adults at 40% representing significant opportunity for us to serve this market.
Owned Distribution. Our owned distribution strategy provides a diversified source of earnings while generating a meaningfully higher risk adjusted return on capital than retained business. Owned distribution further strengthens our relationships with key partners and with industry consolidation underway, we believe we are uniquely positioned to partner as a distribution consolidator. We have invested $680 million in owned distribution partners through the following transactions:
•In October 2021, we purchased a 30% minority ownership stake in Freedom Equity Group (“FEG”). FEG is a nearly 4,000 agent strong NMG that focuses on cultural markets including Mexican-American, Hmong, Laotian, Filipino, Burmese, Congolese-American, Samoan, African-American, Thai and Vietnamese.
•In January 2023, we purchased a 49% minority ownership stake in Syncis Holdings, LLC, an NMG. Syncis is an approximately 1,200 agent NMG that focuses on cultural markets including Korean, African-American, and Persian.
•In June 2023, we purchased a 40% minority ownership stake in DCMT Worldwide, LLC (“DCMT”), who distributes life insurance and annuity products through a network of over 1,000 agents.
•In January 2024, we purchased a 70% majority ownership stake in Roar Joint Venture, LLC (“Roar”), a wholesaler of annuities and life insurance products to financial institutions and the broker-dealer community.
•In July 2024, we acquired a 100% ownership stake in PALH, LLC (“PALH”), who owns a 100% ownership stake in an operating company. PALH markets and sells life insurance and annuity products of various insurance carriers to individuals through a network of agents.
Institutional. In 2021, F&G entered two institutional business lines to further diversify our sources of revenue. Our competitive asset management advantage through Blackstone allows us to have very competitive offerings in our spread lending products as well as in the PRT market, while still meeting our internal pricing targets.
•In addition to our funding agreement business with the Federal Home Loan Bank of Atlanta, (“FHLB”), we now offer the proven ability to originate Funding Agreement Backed Notes (“FABN”), a $210 billion market. Our FABN Program (the “FABN Program”) offers funding agreements to institutional clients by means of capital markets transactions through investment banks. This business line has generated $2.3 billion in sales for F&G in 2021, its year of inception of FABN, $1.4 billion in sales for the year ended
December 31, 2022, $1.3 billion in sales for the year ended December 31, 2023, and $1.0 billion in sales for the year ended December 31, 2024.
•We also offer PRT solutions to a $45 billion (of $3 trillion total private defined benefit plan assets) market. Our PRT business is supported by an experienced team with access to brokers and institutional consultants for distribution. We have generated over $7 billion of cumulative sales since launch in 2021 to year-end 2024 and now serve approximately 115,000 total participants, including beneficiaries, who will receive their pension payments from F&G. Our targeted deal size is approximately $100 million to $1 billion, and we selectively pursue plan termination and larger retiree buyouts. We expect our opportunity to continue to grow as employers shift away from traditional defined benefit pension plans and seek to de-risk frozen pension plans. This line of business generated $1.1 billion in sales for F&G in 2021, its year of inception, $1.4 billion in sales for the year ended December 31, 2022, $2.0 billion in sales for the year ended December 31, 2023, and $2.2 billion in sales for the year ended December 31, 2024. In the pension risk transfer market, F&G ranks as 8th in the PRT industry sales for the year to date as of September 30, 2024, as sourced from the Life Insurance Marketing and Research Association.
We Have Meaningfully Diversified Our Business
With the addition of the retail bank and broker-dealer channels and our success in entering the PRT and funding agreement institutional markets, F&G has diversified our product and distribution capabilities from one primary channel to now five, and from one primary product to now six with our entrance into the RILA market in early 2024. We completed this expansion over a five-year period and, combined with organic growth in our core IMO channel, increased gross sales by 292%, from $3.9 billion in 2019 to $15.3 billion in 2024.
We have reinforced our earnings engine in addition to driving top-line growth. We have acquired and retained customers through the years, growing AUM from $26.5 billion at the time of FNF’s acquisition to $53.8 billion as of December 31, 2024. Profitable growth in AUM is the most important driver of F&G’s earnings and our ability to return capital to shareholders.
Our Financial Goals
Our competitive advantages – product and channel diversification, as well as our strategic partnership with Blackstone – enable us to address a greater share of the markets in which we play. Further, the strength of our distribution partner relationships and pension risk transfer growth strategy has enabled the Company to achieve profitable double digit sales growth. The launch of our RILA product in early 2024 will further boost our sales growth as we enter a large and fast-growing market. We have made good progress toward the medium term financial targets we laid out at our 2023 Investor Day as we focus on driving sustainable asset growth from our retail and pension risk transfer growth strategies, generating ROA expansion from enhanced investment margin, scale benefits and fee-based earnings from accretive flow reinsurance, and diversifying earnings through strong growth in our middle market life insurance business and owned distribution strategies.
The Products We Offer
F&G’s expertise in annuities, life insurance, pension risk transfer solutions and funding agreements will allow us to continue to introduce innovative products and solutions designed to meet customers’ changing needs. We work hand-in-hand with our distributors and institutional advisors to devise the most suitable solutions for the ever-changing market. Our retail annuities serve as a retirement and savings tool on which our customers rely for principal protection and predictable income streams. In addition, our life insurance products provide our customers with a complementary product that allows them to build on their savings and provide a payment to their designated beneficiaries upon the policyholder’s death. Our most popular products are FIAs that tie contractual returns to specific market indices, such as the S&P 500 Index. Our customers value our FIAs, which provide a portion of the gains of an underlying market index, while also providing principal protection. We believe this principal protection fills the need for middle-income Americans who must save for retirement but who want to limit the risk of decline in their savings. As noted above, in 2021, we launched into two institutional markets to originate FABN and PRT
transactions. These markets leverage our existing team's spread-based capabilities as well as our strategic partnership with Blackstone.
For the year ended December 31, 2024, FIAs generated approximately 44% of our gross sales. The remaining 56% of sales were primarily generated from fixed rate annuities (33%), PRT sales (15%), funding agreements (7%) and IUL (1%). We invest the proceeds primarily in fixed income securities. We also use options and futures that hedge the index credit of our FIA and IUL liabilities by replicating the market index returns to our policyholders. We invest in options on indices such as the S&P 500 Index. The majority of our products allow for active management to achieve targeted lifetime returns. In addition, our annuity contracts generally either cannot be surrendered or include surrender charges that discourage early redemptions.
Annuities. Through F&G’s insurance subsidiaries, we issue a broad portfolio of deferred annuities (indexed annuities and fixed rate annuities), immediate annuities, and PRT solutions. A deferred annuity is a type of contract that accumulates value on a tax deferred basis and typically begins making specified periodic or lump sum payments a certain number of years after the contract has been issued. An immediate annuity is a type of contract that begins making specified payments within one annuity period (e.g., one month or one year) and typically pays principal and earnings in equal payments over some period of time.
Deferred Annuities – FIAs. Our FIAs allow contract owners the possibility of earning returns linked to the performance of a specified market index, such as the S&P 500 Index, while providing principal protection. The contract owners typically make a single deposit into our deferred annuities. The contracts include a provision for a minimum guaranteed surrender value calculated in accordance with applicable law. A market index tracks the performance of a specific group of stocks representing a particular segment of the market, or in some cases an entire market. For example, the S&P 500 Composite Stock Price Index is an index of 500 stocks intended to be representative of a broad segment of the market. All FIA products allow policyholders to allocate funds once a year among several different crediting strategies, including one or more index-based strategies and a traditional fixed rate strategy. Surrender charges apply for early withdrawal, typically for seven to fourteen years after purchase.
We purchase derivatives consisting predominantly of over-the-counter options and, to a lesser degree, futures contracts (specifically for FIA contracts) on the equity indices underlying the applicable policy such as the S&P 500 Index. These derivatives are used to fund the index credits due to policyholders under the FIA and IUL contracts based upon policyholders’ contract elections. The down-side risk to F&G is limited to the cost of the options because if the value of the options decreases there is no index credit. The cost of the hedge is included in the pricing of the product and can be reset on an annual basis for each policy based on market conditions. The majority of all such equity options are one-year options purchased to match the funding requirements underlying the FIA/IUL contracts. On the anniversary dates of the FIA/IUL contracts, the market index used to compute the annual index credit under the contracts is reset. At such time, we purchase new equity options to fund the next index credit. We manage the cost of these purchases through the terms of our FIA/IUL contracts, which permit us to change caps or participation rates, subject to certain guaranteed minimums on each contract’s anniversary date. The change in the fair value of the options and futures contracts is generally designed to offset the equity market related change in the fair value of the FIA/IUL contract’s related reserve liability. The options and futures contracts are marked to fair value with the change in fair value included as a component of “Recognized gains and (losses), net” in our Consolidated Statements of Operations. The change in fair value of the options and futures contracts includes the gains and losses recognized at the expiration of the instrument’s term or upon early termination and the changes in fair value of open positions. Generally accepted accounting principles (“GAAP”) accounting of the reserve liability for products with embedded derivatives such as FIA creates additional volatility beyond the accounting for the options and the futures.
The contractholder account value of a FIA contract is equal to the sum of deposits paid, premium bonuses, if any, (described below), and index credits based on the change in the relevant market index (subject to a cap, spread and/or a participation rate) less any fees for riders and any withdrawals taken to-date. Caps (a maximum rate that may be credited) generally range from 1% to 10% when measured annually and 1% to 3% when measured monthly, spreads (a credited rate determined by deducting a specific rate from the index return) generally range from 1% to 3% when measured annually, and participation rates (a credited rate equal to a percentage of index return) generally
range from 50% to 250% of the performance of the applicable market index. The cap, spread and participation rate can typically be reset annually and in some instances every two to five years. Certain riders provide a variety of benefits, such as the ability to increase their cap, lifetime income or additional liquidity for a set fee. As this fee is fixed, the contract holder may lose principal if the index credits received do not exceed the amount of such fee.
Approximately 39% of the FIA sales for the year ended December 31, 2024, involved premium bonuses or vesting bonuses. Premium bonuses increase the initial annuity deposit by a specified rate of 2%. The vesting bonuses, which range from 1% to 15%, increase the initial annuity deposit liability but are subject to adjustment for unvested amounts in the event of surrender by the policyholder prior to the end of the vesting period. We made compensating adjustments in the commission paid to the agent or the surrender charges on the policy to offset the premium bonus.
Approximately 48% of our FIA contracts were issued with a guaranteed minimum withdrawal benefit (“GMWB”) rider for the year ended December 31, 2024. With this rider, a contract owner can elect to receive guaranteed payments for life from the FIA contract without requiring the owner to annuitize the FIA contract value. The amount of the income benefit available is determined by the growth in the policy’s benefit base value as defined in the FIA contract rider. Typically, this accumulates for 10 years based on a guaranteed rate of 3% to 8%. Guaranteed withdrawal payments may be stopped and restarted at the election of the contract owner. Some of the FIA contract riders that we offer include an additional death benefit or an increase in benefit amounts under chronic health conditions. Rider fees range from 0% to 1%. Unlike a variable annuity, policyholder values do not decline with market movements.
Deferred Annuities – Fixed Rate Annuities. Fixed rate annuities are typically single deposit contracts and include annual reset and multi-year rate guaranteed policies. Fixed rate annual reset annuities issued by us have an annual interest rate (the “crediting rate”) that is guaranteed for the first policy year. After the first policy year, we have the discretionary ability to change the crediting rate once annually to any rate at or above a guaranteed minimum rate. MYGAs are similar to fixed rate annual reset annuities except that the initial crediting rate is guaranteed for a specified number of years before it may be changed at our discretion. As of December 31, 2024, crediting rates on outstanding (i) single-year guaranteed annuities generally ranged from 2% to 6% and (ii) MYGA ranged from 1% to 6%. The average crediting rate on all outstanding fixed rate annuities at December 31, 2024 was 5%.
Deferred Annuities - RILA – In early 2024, we entered into the RILA markets. RILAs are similar to FIAs in offering the policyholder the opportunity for tax-deferred growth based in part on the performance of a market index. Compared to a FIA, RILAs have the potential for higher returns but also have the potential for risk of loss to principal and related earnings. RILAs provide the ability for the policyholder to participate in the positive performance of certain market indices during a term, limited by a cap or adjusted for a participation rate. Negative performance of the market indices during a term can result in negative policyholder returns, with downside protection typically provided in the form of either a “buffer” or a “floor” to limit the policyholder’s exposure to market loss. A “buffer” is protection from negative exposure up to a certain percentage, typically 10 or 20 percent. A “floor” is protection from negative exposure less than a stated percentage (i.e., the policyholder risks exposure of loss up to the “floor,” but is protected against any loss in excess of this amount).
Withdrawal Options for Deferred Annuities. After the first year following the issuance of a deferred annuity, policy holders of deferred annuities are typically permitted penalty-free withdrawals up to a contractually specified amount. The penalty-free withdrawal amount is typically 10% of the prior year account value for FIAs and is typically up to accumulated interest for fixed rate annuities, subject to certain restrictions. Withdrawals in excess of allowable penalty-free amounts are assessed a surrender charge if such withdrawals are made during the penalty period of the deferred annuity policy. The penalty period typically ranges from seven to fourteen years for FIAs and three to ten years for fixed rate annuities. This surrender charge initially ranges from 8% to 14% of the contract value for FIAs and is 8% of the contract value for fixed rate annuities and generally decreases by approximately one to two percentage points per year during the penalty period. The average surrender charge was 8% for our FIAs and 7% for our fixed rate annuities as of December 31, 2024. A market value adjustment (“MVA”) will also apply in most states to any withdrawal that incurs a surrender charge, subject to certain exceptions. The MVA is based on a
formula that accounts for changes in interest rates since contract issuance. Generally, if interest rates have risen, the MVA will decrease surrender value, whereas if rates have fallen, it will increase surrender value. MVAs are included on all policies, if allowed (for FIAs since 2015 and for a longer time for fixed rate annuities). At December 31, 2024, approximately 81% of our business included an MVA feature.
The following table summarizes our deferred annuity account values and surrender charge protection as of December 31, 2024 (dollars in millions):
| | | | | | | | | | | | | | | | | |
| SURRENDER CHARGE EXPIRATION BY YEAR | Fixed Rate and Indexed Annuities Account Value | | Percent of Total | | Weighted Average Surrender Charge |
| Out of surrender charge | $ | 2,427 | | | 7 | % | | — | % |
| 2025 | 2,225 | | | 6 | | | 4 | % |
| 2026-2028 | 8,332 | | | 23 | | | 6 | % |
| 2029-2030 | 6,347 | | | 18 | | | 7 | % |
| 2031-2032 | 6,213 | | | 17 | | | 8 | % |
| Thereafter | 10,009 | | | 29 | | | 11 | % |
| Total | $ | 35,553 | | | 100 | % | | 7 | % |
Subsequent to the penalty period, the policyholder may elect to take the proceeds of the surrender either in a single payment or in a series of payments over the life of the policyholder or for a fixed number of years (or a combination of these payment options). In addition to the foregoing withdrawal rights, policyholders may also elect to have additional withdrawal benefits by purchasing a GMWB.
Single Premium Immediate Annuities. We have previously sold single premium immediate annuities (“SPIA”), which provide a series of periodic payments for a fixed period of time or for the life of the policyholder, according to the policyholder’s choice at the time of issue. The amounts, frequency and length of time of the payments are fixed at the outset of the annuity contract. SPIAs are often purchased by persons at or near retirement age who desire a steady stream of payments over a future period of years. Existing policyholders may elect to surrender their contract and use the proceeds to purchase a supplementary contract which functions as a SPIA.
Life Insurance. We currently offer IUL insurance policies and have previously sold universal life, term and whole life insurance products. Holders of universal life insurance policies may make periodic payments over the life of the contract and earn returns on their policies, which are credited to the policyholder’s cash value account. The insurer periodically deducts its expenses and the cost of life insurance protection from the cash value account. The balance of the cash value account is credited interest at a fixed rate or returns based on the performance of a market index, or both, at the option of the policyholder, using a method similar to that described above for FIAs. In addition to the annual renewal premium, we are diversifying earnings through strong growth in our middle market life insurance business.
Funding Agreements. As defined by the Iowa Insurance Division (“IID”), a funding agreement is an agreement for an insurer to accept and accumulate funds and to make one or more payments at future dates in amounts that are not based on mortality or morbidity contingencies of the person to whom the funding agreement is issued. In essence, funding agreement providers are agreeing to a defined stream of future payments in exchange for a single upfront premium. This type of business is sometimes referred to as spread lending, as funding agreement providers invest upfront premiums with the intent to earn an investment spread on the funds prior to making agreed upon maturity and interest payments. The structure of the payments can take several forms but are commonly a fixed or variable interest payment with a single maturity principal re-payment.
F&G currently utilizes two forms of funding agreement offerings. The first is through the issuance of collateralized funding agreements with the FHLB. This enables spread-based income without longevity or mortality exposure given the certainty in liability profile. Funding agreements through the FHLB are flexible in their format and the ability to issue during broad windows, as long as sufficient eligible collateral has been deposited with the bank. F&G and its predecessors have been entering into funding agreements with the FHLB since at least 2004.
In June 2021, we established a FABN Program, which is a medium term note program under which funding agreements are issued to a special-purpose trust that issues marketable notes. The notes are underwritten and marketed by major investment banks’ broker-dealer operations and are sold to institutional investors. These FABN offerings are more limited regarding timing of issuance, but do not require collateralization as with the FHLB. The maximum aggregate principal amount permitted to be outstanding at any one time under the FABN Program is currently $5.0 billion. As of December 31, 2024, we had approximately $2.5 billion outstanding under the FABN Program.
Pension Risk Transfer. In July 2021, we entered the PRT market. A PRT occurs when a defined-benefit pension provider seeks to remove some or all of its obligation to pay guaranteed retirement income or post-retirement benefits to plan participants. There are four major types of PRT strategies: longevity reinsurance, buy-in, buy-out, and paying in lump sums. We are currently active in plan buy-outs, where we have a direct, irrevocable commitment to each covered participant to make the specified annuity payments based upon the terms of the pension plan. Plan buy-out transactions fully and permanently transfer all investment, mortality, and administrative risk, associated with covered benefits, from the pension plan sponsor to the insurance provider.
Our PRT products are comparable to income annuities, as we generally receive a single, upfront premium in exchange for paying a guaranteed stream of future income payments which are typically fixed in nature but may vary in duration based on participant mortality experience. These products primarily create earnings through spread income. In each transaction FGL Insurance and/or FGL NY Insurance issues a group annuity contract to discharge pension plan liabilities from a pension plan sponsor, either through a separate account or through a general account guarantee. Certificate holders covered under a group annuity contract have a guaranteed benefit from the insurance company.
Our PRT solutions business is supported by a team of experienced professionals, and we partner with brokers and institutional consultants for distribution. As of December 31, 2024, we had completed cumulative PRT transactions that represented pension obligations of $7.0 billion.
Reinsurance philosophy/arrangements. Our insurance subsidiaries cede insurance to other insurance companies. We use reinsurance to diversify risks and earnings, to manage loss exposures, to enhance our capital position, and to manage new business volume. The effects of certain reinsurance agreements are not accounted for as reinsurance as they do not reinsure insurance contracts, or they do not transfer the risks of the reinsured policies.
In instances where we are the ceding company, we pay a premium to a reinsurer in exchange for the reinsurer assuming a portion of our liabilities under the policies we issued and collect expense allowances in return for our administration of the ceded policies. Use of reinsurance does not discharge our liability as the ceding company because we remain directly liable to our policyholders and are required to pay the full amount of our policy obligations in the event that our reinsurers fail to satisfy their obligations. We collect reimbursement from our reinsurers when we pay claims on policies that are reinsured.
We monitor the credit risk related to the ability of our reinsurers to honor their obligations under various agreements. To minimize the risk of credit loss on such contracts, we generally diversify our exposures among many reinsurers and limit the amount of exposure to each based on financial strength ratings, which are reviewed annually. We are able to further manage risk with various forms of collateral or collateral arrangements, including secured trusts, funds withheld arrangements and irrevocable letters of credit.
Please refer to Note E - Reinsurance to our Consolidated Financial Statements included in Part II - Item 8 of this Annual Report on Form 10-K for further discussion on reinsurance, reinsurance recoverables for our largest reinsurers and credit risk and counterparty risk.
Please refer to “Risk Factors” for additional details regarding credit risk related to reinsurance agreements. A description of significant ceded reinsurance transactions appears below.
Wilton Reinsurance Transaction. Almost all of the life insurance policies in force issued before March 1, 2010, except for the return of premium benefits on term life insurance products, are subject to a reinsurance arrangement with Wilton Reassurance Company (“Wilton Re”). Pursuant to the agreed upon terms, Wilton Re purchased through a 100% quota share reinsurance agreement certain FGL Insurance life insurance policies that are subject to redundant reserves, reported on a statutory basis, under Regulation XXX and Guideline AXXX, as well as another block of FGL Insurance’s in-force traditional, universal life and IUL insurance policies. The effects of this agreement are accounted for as reinsurance as the ceded policies qualify as insurance products and because the agreement satisfies the risk transfer requirements for GAAP.
Hannover Reinsurance Transaction. Originally effective January 1, 2017, FGL Insurance has a reinsurance agreement with Hannover Life Reassurance Company of America, an unaffiliated reinsurer, to reinsure an in-force block of FGL Insurance’s FIA and fixed rate deferred annuity contracts with GMWB and Guaranteed Minimum Death Benefit (“GMDB”) guarantees. In accordance with the terms of this agreement, FGL Insurance cedes 70% net retention of secondary guarantee payments in excess of account value for GMWB and death benefits in excess of account value for GMDB guarantees. The effects of this agreement are not accounted for as reinsurance as it does not satisfy the risk transfer requirements for GAAP; therefore, deposit accounting is applied and FGL insurance applies the right of offset in the reinsurance agreement.
Kubera Reinsurance Transaction. FGL Insurance has a reinsurance agreement with Kubera Insurance (SAC) Ltd. (“Kubera”), an unaffiliated reinsurer, to cede certain FIA statutory reserves on a coinsurance funds withheld quota share basis, net of applicable existing reinsurance. This agreement has been amended several times to include additional FIA policies, with the latest amendment effective December 1, 2024. The effects of this agreement are not accounted for as reinsurance as it does not satisfy the risk transfer requirements for GAAP; therefore, deposit accounting is applied and FGL Insurance applies the right of offset in the reinsurance agreement.
To enhance Kubera's ability to pay its obligations under the amended reinsurance agreement, F&G entered into a Variable Note Purchase Agreement (the “NPA”), whereby F&G agreed to fund a note to Kubera to be used to ultimately settle with F&G, with principal increases up to a maximum amount of $300 million, to the extent a potential funding shortfall (treaty assets are less than the total funding requirement) is projected relative to the business ceded to Kubera from F&G as part of the amended reinsurance agreement. The potential funding shortfall will be determined quarterly and, among other items, is impacted by the market value of the assets in the funds withheld account related to the reinsurance agreement and Kubera's capital as calculated on a Bermuda regulatory basis. The NPA matures on November 30, 2071. Based on the current level of the treaty assets and projections that these policies will be profitable over the lifetime of the agreement, we do not expect significant fundings to occur under the NPA. As of December 31, 2024 and December 31, 2023, the amount funded under the NPA was insignificant.
Kubera & Somerset Reinsurance Transactions. FGL Insurance entered into a reinsurance agreement with Kubera, effective December 31, 2018, to cede certain fixed rate annuity (including MYGA) GAAP and statutory reserves on a coinsurance funds withheld basis, net of applicable existing reinsurance. Effective October 31, 2021, this agreement was novated from Kubera to Somerset Reinsurance Ltd. (“Somerset”), a certified third-party reinsurer. Effective December 1, 2023, FGL Insurance executed an additional coinsurance funds withheld agreement with Somerset to cede certain flow MYGA business written effective on or after December 1, 2023. As the policies ceded to Somerset are investment contracts, there is no significant insurance risk present and the reinsurance agreements are accounted for as separate investment contracts.
Effective July 1, 2024, FGL Insurance amended the existing flow reinsurance agreement with Somerset to additionally cede the base contract benefits and GMWB riders attached under certain FIA policies on a coinsurance funds withheld quota share basis written on or after July 1, 2024. As the base contract benefits and GWMB riders are ceded to Somerset, there is sufficient insurance risk present that results in this portion of the reinsurance agreement being accounted for as reinsurance.
Everlake Reinsurance Transaction. Effective September 1, 2023, FGL Insurance executed a coinsurance agreement with Everlake Life Insurance Company (“Everlake”), an unaffiliated reinsurer to cede, on a quota share basis, certain flow MYGA business written effective on or after September 1, 2023. As the policies ceded to Everlake are investment contracts, there is no significant insurance risk present and therefore the reinsurance agreement is accounted for as a separate investment contract.
Effective January 1, 2025, F&G amended the existing flow reinsurance agreement with Everlake Life Insurance Company (“Everlake”) to cede future additional MYGA business for agreed upon periods to Everlake pursuant to an offer and acceptance process, rather than on a flow basis. The amendment included a cession of an inforce block of certain MYGA policies on a coinsurance quota share basis.
Aspida Reinsurance Transaction. FGL Insurance has a reinsurance agreement with Aspida Life Re Ltd. (“Aspida Re”), an unaffiliated reinsurer, to cede certain flow MYGA business, on a funds withheld coinsurance basis, net of applicable existing reinsurance, written effective on or after January 15, 2021. As the policies ceded to Aspida Re are investment contracts, there is no significant insurance risk present and therefore the reinsurance agreement is accounted for as a separate investment contract.
New Re Reinsurance Transaction. Effective December 31, 2022, FGL Insurance entered into an indemnity reinsurance agreement with New Reinsurance Company Ltd., an unaffiliated reinsurer and wholly owned subsidiary of Münchener Rückversicherungs-Gesellschaft Aktiengesellschaft in München (d/b/a Munich Re), to cede certain FIA policies. Effective July 1, 2023, this agreement was amended to reinsure additional FIA products. The coinsurance quota share is only applicable to the base contract benefits under the FIA policies. The yearly renewable term is applicable to the waiver of surrender charges and return of premium. The effects of this agreement are not accounted for as reinsurance as it does not satisfy the risk transfer requirements for GAAP; therefore, deposit accounting is applied and FGL Insurance applies the right of offset in the reinsurance agreement.
The CARVM Facility. Life insurance companies operating in the United States must calculate required reserves for life and annuity policies based on statutory principles. The insurance divisions have adopted the methodology contained in the NAIC Valuation Manual as the prescribed methodology for the insurance industry. The industry has reduced or eliminated redundancies thereby increasing capital using a variety of techniques including reserve facilities.
FGL Insurance has a reinsurance treaty with Raven Reinsurance Company (“Raven Re”), its wholly owned captive reinsurance company, to cede the Commissioners Annuity Reserve Valuation Method (“CARVM”) liability for annuity benefits where surrender charges are waived related to certain FIA, deferred annuity and MYGA policies. In connection with the CARVM reinsurance agreement, FGL Insurance and Raven Re entered into an agreement with Nomura Bank International plc (“NBI”) to establish a reserve financing facility in the form of a letter of credit issued by NBI. The financing facility has $175 million available to draw on as of December 31, 2024. The amended facility may terminate earlier than the current termination date of October 1, 2027, in accordance with the terms of the reimbursement agreement. Under the terms of the reimbursement agreement, in the event the letter of credit is drawn upon, Raven Re is required to repay the amounts utilized, and F&G Annuities & Life, Inc. (“FGAL”) is obligated to repay the amounts utilized if Raven Re fails to make the required reimbursement. Under the terms of the agreement, FGAL is also required to make a capital contribution to Raven Re in certain circumstances, including in the event that Raven Re’s statutory capital and surplus falls below defined levels. As of December 31, 2024 and December 31, 2023, no capital contributions were required to be made due to these conditions. As this letter of credit is provided by an unaffiliated financial institution, Raven Re is permitted to carry the letter of credit as an admitted asset on the Raven Re statutory balance sheet.
GMWB/GWP Reinsurance Transaction. Effective December 31, 2023, FGL Insurance recaptured its reinsurance arrangement with Canada Life Assurance Company (“Canada Life”) United States Branch covering FIA policies with GMWB and guaranteed withdrawal payment (“GWP”) features and entered into a reinsurance treaty with Corbeau Re, Inc. (“Corbeau Re”), its wholly owned captive reinsurance company, to cede certain FIA policies with GMWB and GWP. In accordance with the terms of this agreement, FGL Insurance cedes a quota share of GMWB and GWP paid in excess of account value. In connection with the reinsurance agreement between FGL
Insurance and Corbeau Re, Corbeau Re entered into an excess of loss reinsurance agreement (“XOL”) with Canada Life Barbados Branch to finance the portion of statutory reserves considered to be non-economic. The XOL matures on December 31, 2043, and provides for coverage on losses up to $1,500 million as of December 31, 2024. With Corbeau Re, non-economic reserves were financed through the maturity date of the XOL and statutory reserves are recorded for all risks expected to be incurred after the maturity date of the XOL. The XOL is not accounted for as reinsurance as it does not satisfy the risk transfer requirements for GAAP; therefore, deposit accounting is applied. Under the terms of the agreement, FGAL is required to make a capital contribution to Corbeau Re in certain circumstances, including in the event that Corbeau Re’s statutory capital and surplus falls below defined levels. As of December 31, 2024, no capital contributions were required to be made due to these conditions. Corbeau Re is permitted to account for the excess of loss reinsurance agreement from Canada Life as an admitted asset on the Corbeau Re statutory balance sheet.
PRT Reinsurance Transaction. Effective October 1, 2023, FGL Insurance recaptured a reinsurance agreement with its affiliate F&G Life Re Ltd. (“F&G Life Re”), a Bermuda reinsurer, covering a quota share of certain pension risk transfer group annuity contracts and entered into an agreement with its affiliate F&G Cayman Re Ltd. (“F&G Cayman Re”), a Cayman Islands reinsurer, to reinsure a quota share of certain pension risk transfer group annuity contracts (previously ceded to F&G Life Re) in addition to flow pension risk transfer group annuity contracts. Some of the contracts reinsured are held by FGL Insurance’s general account and others are held by a FGL Insurance separate account (which does not meet the GAAP definition of a separate account). Reinsurance of the general account contracts are maintained on a coinsurance funds withheld basis for the general account statutory reserves. Reinsurance of the separate account contracts are maintained on a modified coinsurance basis for the separate account statutory reserves and coinsurance basis for the general account statutory reserves supporting the separate account. In connection with the agreement, F&G Cayman Re entered into a financing agreement with Deutsche Bank AG (“DB”), operating out of its New York branch, whereby DB issued a letter of credit used to support the coinsured general account statutory reserves (generally considered to be the non-economic reserves).
Our Retail Distribution Channels
We distribute our annuity and life insurance products through three main retail channels of distribution: independent agents, banks, and broker-dealers.
In our independent agent channel, the sale of our products typically occurs as part of a four party, three stage sales process between FGL Insurance, an IMO, the agent and the customer. FGL Insurance designs, manufactures, issues, and services the product. The IMOs will typically sign contracts with multiple insurance carriers to provide their agents with a broad and competitive product portfolio. The IMO provides training and discusses product options with agents in preparation for meetings with clients. The IMO staff also provide assistance to the agent during the selling and application process. The agent may get customer leads from the IMOs. The agent conducts a fact finding and presents suitable product choices to the customers. We monitor the business issued by each distribution partner for pricing metrics, mortality, persistency, as well as market conduct and suitability.
We offer our products through a network of approximately 300 IMOs, representing approximately 126,000 agents. We believe that our relationships with these IMOs are strong. We identify Power Partners as those who have demonstrated the ability to generate significant production for our business. We currently have 41 Power Partners, comprised of 19 annuity IMOs and 22 life insurance IMOs. The average tenure of the Power Partners is approximately 21 years.
We took a similar approach in launching products as a new entrant into the bank and broker-dealer channels by partnering with one of the largest broker-dealers in the industry. In 2020, F&G launched a set of fixed rate annuity and FIA products to banks and broker-dealers and gained selling agreements with some of the largest banks and broker-dealers in the United States. We offer our products through a network of approximately 22 banks and broker-dealers, representing approximately 12,000 financial advisers. The financial advisers at our bank and broker-dealer partners are able to offer their clients guaranteed rates of return, protected growth, and income for life through our Secure series of annuity products. We employ a hybrid distribution model in this channel, whereby some financial institutions partner directly with F&G and our sales team, and others work with an intermediary. As such, we partner
with a select number of financial institution intermediaries who have expertise in the channel and maintain the appropriate field wholesaling forces to be successful in this channel. In 2024, the top 5 firms represented 77% of channel sales. Bank and broker-dealers represented 42% of annuity sales for the year ended December 31, 2024.
The top five states for the distribution of F&G’s retail products in the year ended December 31, 2024 were Florida, California, Pennsylvania, Texas and Ohio, which together accounted for 38.7% of F&G’s retail sales.
Our Investment Management Governance and Approach
We embrace a long-term conservative investment philosophy, investing nearly all the insurance premiums we receive in a wide range of high-quality debt securities. Our investment strategy is designed to (i) preserve capital, (ii) provide consistent yield and investment income, and (iii) achieve attractive absolute returns. We base all of our decisions on fundamental, bottom-up research, coupled with a top-down view that respects the cyclicality of certain asset classes. The types of assets in which we may invest are influenced by various state laws, which prescribe qualified investment assets applicable to insurance companies.
FGL Insurance and certain other subsidiaries of F&G are party to investment management agreements (“IMAs”) with Blackstone ISG-I Advisors LLC (“BIS”) pursuant to which BIS is appointed as investment manager of substantially all assets in the general and separate accounts of those entities (the “F&G Accounts”). Effective October 1, 2024, FGL Insurance amended and restated its IMA with BIS to increase a fee cap from 26 basis points to 30 basis points. This increase did not change the overall economics of the IMA as it was not material in nature. MVB Management, LLC, (“MVB Management”), an entity that is 50% owned by BilCar, LLC (an affiliate of William Foley, the Executive Chairman and a director of the Company) (“BilCar”), receives a participation fee from BIS in connection with assets of F&G and its subsidiaries that are managed by BIS. BIS also receives services from MVB Management. Pursuant to the investment management agreements with BIS, BIS pays MVB Management a fee of approximately 7.5% of certain fees paid to BIS and its affiliates for AUM relating to new business generated after March 31, 2023 (“New AUM”) (15% prior to that date). In March 2023, BilCar waived its right to receive any portion of payments made by BIS to MVB in respect of such New AUM. Additionally, in March 2023 the Company entered into an agreement with BilCar to pay BilCar the fees that it would have received through MVB Management from BIS over the 10-year period ending March 31, 2033. BIS, in accordance with our IMAs, has delegated certain investment services to its affiliates, including Blackstone’s Credit, Real Estate Debt and Asset-Based Finance businesses, in each case, pursuant to separate sub-management agreements executed between BIS and each such affiliate. There are no specified minimum amounts of assets that we have agreed that BIS will manage; however, BIS has the right to manage (and receive fees based on) all assets in the F&G Accounts with limited exceptions. For certain asset classes, we continue to utilize specialized third-party investment managers. As of December 31, 2024, approximately 81% of our $60 billion investment portfolio was managed by BIS, with 18% managed by other third parties, and the remaining 1% internally managed. BIS, in accordance with our IMAs, has delegated certain investment services to its affiliates, including Blackstone’s Credit, Real Estate Debt and Asset-Based Finance businesses, in each case, pursuant to separate sub-management agreements executed between BIS and each such affiliate.
On March 10, 2023, the IMAs were amended such that, for assets under management as of March 31, 2023, BIS’s per annum management fees are as follows:
•for aggregate assets under management in the F&G Accounts up to $25 billion, 0.26% of such aggregate assets under management;
•for aggregate assets under management in the F&G Accounts above $25 billion and up to $34 billion, 0.24% of such aggregate assets under management; and
•for aggregate assets under management in the F&G Accounts above $34 billion, .12% of such aggregate assets under management.
In addition, the Sub-Manager Fee Agreement has been amended to provide for certain updates thereto, including, among other things, to reflect certain additional asset classes, certain revisions to the applicable sub-manager fee rates in respect of certain existing asset classes and certain revisions to the applicable sub-manager fee
rates in respect of assets under management relating to new business of the Company and its subsidiaries generated after March 31, 2023. For the avoidance of doubt, there will be no management fee payable under the IMAs with respect to New AUM.
Aggregate fees paid to BIS were $203 million, $194 million and $155 million for the years ended December 31, 2024, 2023 and 2022, respectively.
Effective January 1, 2025, FGL NY Insurance and BIS entered into an IMA pursuant to which BIS is appointed as investment manager of substantially all assets in the general account of FGL NY Insurance. FGL NY Insurance terminated its current IMA with its current investment manager effective December 31, 2024. There are no separate agreements or arrangements between BIS or its affiliates, on the one hand, and FGL NY Insurance or its affiliates, on the other hand, concerning the IMA between BIS and FGL NY Insurance.
F&G has a robust governance process and framework to manage the investment portfolio. While BIS is primarily responsible for security selection, F&G makes all investment strategy decisions and sets risk parameters. All major decisions need to be reviewed and approved by the F&G Investment Committee, and new investment asset classes go through an internal risk assessment process at F&G to ensure the investments are suitable for an insurance company balance sheet. We define risk tolerance across a wide range of factors, including credit risk, liquidity risk, concentration (issuer and sector) risk, and caps on specific asset classes, which in turn establish conservative risk thresholds. Also, F&G has flexibility to use other asset management partners through our flow reinsurance platform over time.
F&G, along with BIS, continually monitors portfolio allocations and holdings to optimize the portfolio profile. F&G has undertaken several programs to take advantage of the credit cycle and market conditions or to undertake prudent risk management in anticipation of an unfavorable economic environment. We have also added several new asset classes to the investment portfolio to further enhance diversification.
Each of our subsidiaries that is party to an investment management agreement with BIS may terminate such agreement upon 30 days’ notice. BIS may also terminate any investment management agreement upon 30 days’ notice. However, F&G and FNF are party to an omnibus termination side letter under which they are required to cause our insurance subsidiaries to engage BIS as an investment manager and to generally not engage any other person as an investment manager. See also “Risk Factors—Risks Relating to Our Business—We rely on our investment management advisory agreements with BIS and other investment managers and sub-managers for the management of portions of certain of our life insurance companies’ investment portfolios.”
The initial term of the side letter expires in 2029 and will automatically renew for successive two-year terms unless F&G terminates the side letter. Prior to June 1, 2029, we and FNF may only terminate the side letter for cause. Cause is generally limited to circumstances where BIS is legally unable to manage our assets, if BIS fails to offer us “most favored nations” rights with respect to certain products it may issue to third parties, or where BIS has acted with gross negligence, willful misconduct or reckless disregard of its obligations under the investment management agreements. In addition, at the expiration of the initial term of the side letter in 2029, or at the end of any renewal term, we may with prior notice terminate the side letter for unsatisfactory long-term performance by BIS based on underperformance. If we provide any such notice, the termination would not become effective for one year from the date of termination given in the notice, during which time BIS may seek to cure the events giving arise to the termination notice.
Because our subsidiaries can terminate an investment management agreement at any time upon 30 days' notice, it is possible that such a termination by one of our subsidiaries could cause us to be in breach of our obligations under the side letter. BIS’s contractual remedies under the side letter include specific performance and the right to seek damages including, in the event of a non-permitted termination of an investment management agreement by one of our subsidiaries, as compensation for the costs incurred in performing services under, and the failure to receive the benefits reasonably anticipated by, an IMA, the full amount of damages available at law in the same manner and to the same extent as if such IMA had been terminated by us our at our direction in violation of the terms of the side letter.
Our investment portfolio consists of fixed-rate high-quality fixed maturities, including publicly and privately issued corporate bonds, municipal and other government bonds, asset-backed securities (“ABS”), residential mortgage-backed securities (“RMBS”), commercial mortgage-backed securities, commercial mortgage loans (“CMLs”), residential mortgage loans (“RMLs”), limited partnership investments, and other investments. We also maintain holdings in floating rate, and less rate-sensitive investments, including CLOs, non-agency RMBS, and various types of ABS. It is our expectation that our investment portfolio will broaden in scope and diversity to include other asset classes held by life and annuity insurance writers. We also have a small amount of equity holdings required as part of our funding arrangements with the FHLB.
Over the year, we have hedged a portion of the existing floating rate asset exposure in the portfolio. In addition to hedging the existing floating-rate assets, subject to the broader macro and interest rate environment, we will also look to hedge a significant share of new purchases of floating-rate assets.
The portfolio also has exposure to U.S. dollar denominated emerging market bonds, highly rated preferred stocks and hybrids. We currently maintain a well-matched asset/liability profile (asset duration of 4.9 years vs. liability duration of 5.8 years).
Please refer to Note C - Investments in the Consolidated Financial Statements and the “Management’s Discussion and Analysis of Financial Condition and Results of Operations — Investment Portfolio” in this Annual Report on Form 10-K for additional information about our investment portfolio.
Mature Risk Management Framework and Governance
Risk management is a critical part of our business to manage our financial strength and meet or exceed regulatory requirements. We seek to assess risk to our business through a comprehensive, formal process involving:
a.identifying short-term and long-term strategic and operational objectives;
b.development of risk appetite statements that establish what the Company is willing to accept in terms of risks to achieving its goals and objectives;
c.identifying the levers that control the risk appetite of the Company;
d.establishing the overall limits of risk acceptable for a given risk driver;
e.establishing operational risk limits that are aligned with the tolerances;
f.assigning risk limit quantification and mitigation responsibilities to individual team members within functional groups;
g.analyzing the potential qualitative and quantitative impact of individual risks, including but not limited to stress and scenario testing covering over eight economic and insurance related risks;
h.mitigating risks by appropriate actions; and
i.identifying, documenting and communicating key business risks in a timely fashion.
Our most significant risks are governed through holding company governance committees and overall by the Enterprise Risk Management Committee (“ERMC”). Our most significant risks such as credit risk, liquidity risk, and policyholder behavior associated with interest rate risk have established risk limits associated with our risk appetite statements. These include investment limits by asset class, ratings and issuer. Liquidity risk is managed through frequent forecasting of sources and uses of cash and managed to our Liquidity Policy. Asset liability management procedures and limits protect the Company, within limits, against significant changes in interest rates. In addition, the risks are stressed as part of our scenario testing process to identify areas requiring mitigation plans based on the macroeconomic environment. Risk limits, risk appetite and scenario testing results of the stresses are discussed with stakeholders such as the F&G ERMC, the Board of Directors (“Board”) and Audit Committee (“AC”) of F&G, regulators and rating agencies.
The responsibility for monitoring, evaluating and responding to risk embedded across the organization: first assigned to our management and employees, second to those occupying specialist functions, such as legal compliance and risk teams, and third to those occupying supervisory functions, such as internal audit and the Board.
Operations/Outsourcing
We believe we have designed an efficient corporate platform which enables us to be highly scalable with volume over time and allows us to onboard incremental business with low incremental fixed operating cost. As a result, we believe we should be able to convert a significant portion of incremental net investment income from additional invested assets and liabilities into operating income.
We outsource the following functions to third-party service providers:
•new business administration (data entry and policy issue only);
•service of existing policies;
•underwriting administration of life insurance applications;
•call centers;
•information technology development and maintenance;
•certain investment accounting and custody; and
•co-located data centers and hosting of financial systems.
We closely manage our outsourcing partners and integrate their services into our operations. We believe that outsourcing such functions allows us to focus capital and our employees on our core business operations and perform differentiating functions, such as finance, actuarial, product development and risk management functions. In addition, we believe an outsourcing model provides predictable pricing, service levels and volume capabilities and allows us to benefit from technological developments that enhance our customer self-service and sales processes. We believe that we have a good relationship with our principal outsource service providers.
Our Financial Strength/Ratings
Our access to funding and our related cost of borrowing, the attractiveness of certain of our products to customers and requirements for derivatives collateral posting are affected by our credit ratings and insurance financial strength ratings, which are periodically reviewed by the rating agencies. Financial strength ratings and credit ratings are important factors affecting public confidence in an insurer and its competitive position in marketing products.
As of the date of this Annual Report on Form 10-K, A.M. Best, Fitch, Moody’s, and S&P had issued credit ratings, financial strength ratings and/or outlook statements regarding us, as listed below. Credit ratings represent the opinions of rating agencies regarding an entity’s ability to repay its indebtedness. Financial strength ratings represent the opinions of rating agencies regarding the ability of an insurance company to meet its financial obligations under an insurance policy and generally involve quantitative and qualitative evaluations by rating agencies of a company’s financial condition and operating performance. Generally, rating agencies base their financial strength ratings upon information furnished to them by the insurer and upon their own investigations, studies and assumptions. Financial strength ratings are based upon factors of concern to policyholders, agents and intermediaries and are not directed toward the protection of investors. Credit and financial strength ratings are not recommendations to buy, sell or hold securities and they may be revised or revoked at any time at the sole discretion of the rating organization.
In addition to the financial strength ratings, rating agencies use an “outlook statement” to indicate a medium- or long-term trend that, if continued, may lead to a rating change. A positive outlook indicates a rating may be raised and a negative outlook indicates a rating may be lowered. A stable outlook is assigned when ratings are not likely to be changed. A developing outlook is assigned when a rating may be raised, lowered, or affirmed. Outlooks should not be confused with expected stability of the issuer’s financial or economic performance. A rating may have a
“stable” outlook to indicate that the rating is not expected to change, but a “stable” outlook does not preclude a rating agency from changing a rating at any time without notice.
The rating organizations may take various actions, positive or negative. Such actions are beyond our control, and we cannot predict what these actions may be and the timing thereof.
| | | | | | | | | | | | | | | | | | | | | | | |
| A.M. Best | | S&P | | Fitch | | Moody’s |
| Holding Company & Security Ratings | | | | | | | |
| F&G Annuities & Life, Inc. | | | | | | | |
| Issuer Credit / Default Rating | Not Rated | | BBB- | | BBB | | Baa3 |
| Outlook | | | Stable | | Stable | | Stable |
| Senior Unsecured Notes | Not Rated | | BBB- | | BBB- | | Baa3 |
Junior Subordinated Notes (a) | Not Rated | | BB | | BB | | Ba1 |
| CF Bermuda Holdings Limited | | | | | | | |
| Issuer Credit / Default Rating | Not Rated | | BBB- | | BBB | | Baa3 |
| Outlook | | | Stable | | Stable | | Stable |
Fidelity & Guaranty Life Holdings, Inc. (b) | | | | | | | |
| Issuer Credit / Default Rating | BBB | | BBB- | | BBB | | Not Rated |
| Outlook | Stable | | Stable | | Stable | | |
| | | | | | | |
| Operating Subsidiary Ratings | | | | | | | |
| Fidelity & Guaranty Life Insurance Company | | | | | | | |
| Financial Strength Rating | A | | A- | | A- | | A3 |
| Outlook | Stable | | Stable | | Stable | | Stable |
| Fidelity & Guaranty Life Insurance Company of New York | | | | | | | |
| Financial Strength Rating | A | | A- | | A- | | Not Rated |
| Outlook | Stable | | Stable | | Stable | | |
| F&G Life Re Ltd | | | | | | | |
| Financial Strength Rating | Not Rated | | A- | | A- | | A3 |
| Outlook | | | Stable | | Stable | | Stable |
| F&G Cayman Re Ltd | | | | | | | |
| Financial Strength Rating | Not Rated | | Not Rated | | A- | | Not Rated |
| Outlook | | | | | Stable | | |
| | | | | | | |
| (a) Reflects rating of $375 million Junior Subordinated Notes due 2065 issued in January 2025 |
| (b) Ratings removed for Fidelity & Guaranty Life Holdings, Inc. Senior Unsecured Notes due 2025 following full redemption in February 2025 |
A.M. Best, S&P, Fitch and Moody’s review their ratings of insurance companies from time to time. There can be no assurance that any particular rating will continue for any given period of time or that it will not be changed or withdrawn entirely if, in their judgment, circumstances so warrant. While the degree to which ratings adjustments will affect sales and persistency is unknown, we believe if our ratings were to be negatively adjusted for any reason, we could experience a material decline in the sales of our products and the persistency of our existing business. See “Risk Factors” in this Annual Report on Form 10-K.
Potential Impact of a Ratings Downgrade. We are required to maintain minimum ratings as a matter of routine practice as part of our over-the-counter derivatives agreements on International Swap and Derivative Association (“ISDA”) forms. Under some ISDA agreements, we have agreed to maintain certain financial strength ratings. Please refer to Note D - Derivative Financial Instruments to the Consolidated Financial Statements in this Annual Report on Form 10-K for disclosure around our requirement to maintain minimum ratings.
If the insurance subsidiaries held net short positions against a counterparty, and the subsidiaries’ financial strength ratings were below the levels required in the ISDA agreement with the counterparty, the counterparty would demand immediate further collateralization, which could negatively impact overall liquidity. Based on the fair value
of our derivatives as of December 31, 2024, we hold no net short positions against a counterparty; therefore, we were not required to post collateral at December 31, 2024.
A downgrade of the financial strength rating of one of our principal insurance subsidiaries could affect our competitive position in the insurance industry and make it more difficult for us to market our products, as potential customers may select companies with higher financial strength ratings. A downgrade of the financial strength rating could also impact our borrowing costs.
Regulation of F&G
U.S. Regulatory Overview
FGL Insurance, FGL NY Insurance, Raven Re and Corbeau Re are subject to comprehensive regulation and supervision in their domiciles, Iowa, New York, Vermont and Vermont, respectively, and in each state in which they do business. FGL Insurance does business throughout the United States and Puerto Rico, except for New York. FGL NY Insurance only does business in New York. Raven Re is a special purpose captive reinsurance company that only provides reinsurance to FGL Insurance under the CARVM Treaty. Corbeau Re, a wholly owned captive reinsurance company, reinsures certain of FGL Insurance’s FIA policies with GMWB and GWP. FGL Insurance’s principal insurance regulatory authority is the IID; however, state insurance departments throughout the United States also monitor FGL Insurance’s insurance operations as a licensed insurer. The New York State Department of Financial Services (“NYDFS”) regulates the operations of FGL NY Insurance. The purpose of these regulations is primarily to protect insurers’ policyholders and beneficiaries and not their general creditors and shareholders of those insurers or of their holding companies. Many of the laws and regulations to which FGL Insurance and FGL NY Insurance are subject are regularly re-examined and existing or future laws and regulations may become more restrictive or otherwise adversely affect their operations.
Generally, insurance products underwritten by, and rates used by, FGL Insurance and FGL NY Insurance must be approved by the insurance regulators in each state or territory in which they are sold. In addition, insurance products may also be subject to the Employee Retirement Income Security Act of 1974 (“ERISA”).
State insurance authorities have broad administrative powers over FGL Insurance and FGL NY Insurance with respect to all aspects of the insurance business, including:
•licensing to transact business;
•licensing agents;
•prescribing which assets and liabilities are to be considered in determining statutory surplus;
•regulating premium rates for certain insurance products;
•approving policy forms and certain related materials;
•requiring insurers and agents to act in the best interests of consumers when making recommendations to purchase annuities, or to determine whether a reasonable basis exists as to the suitability of such investments for consumers;
•regulating unfair trade and claims practices;
•establishing reserve requirements and solvency standards;
•regulating the amount of dividends that may be paid in any year by insurance companies;
•regulating the availability of reinsurance or other substitute financing solutions, the terms thereof and the ability of an insurer to take credit on its financial statements for insurance ceded to reinsurers or other substitute financing solutions;
•fixing maximum interest rates on life insurance policy loans and minimum accumulation or surrender values; and
•regulating the type, amounts, and valuations of investments permitted, transactions with affiliates and other matters.
Financial Regulation
State insurance laws and regulations require FGL Insurance, FGL NY Insurance, Raven Re and Corbeau Re to file reports, including financial statements, with state insurance departments in each state in which they do business, and their operations and accounts are subject to examination by those departments at any time. FGL Insurance, FGL NY Insurance, Raven Re and Corbeau Re prepare statutory financial statements in accordance with accounting practices and procedures prescribed or permitted by these departments.
The NAIC has approved a series of statutory accounting principles and various model regulations that have been adopted, in some cases with certain modifications, by all state insurance departments. These statutory principles are subject to ongoing change and modification. Moreover, compliance with any particular regulator’s interpretation of a legal or accounting issue may not result in compliance with another regulator’s interpretation of the same issue, particularly when compliance is judged in hindsight. Any particular regulator’s interpretation of a legal or accounting issue may change over time to FGL Insurance’s, FGL NY Insurance’s, Raven Re’s or Corbeau Re’s detriment, or changes to the overall legal or market environment, even absent any change of interpretation by a particular regulator, may cause FGL Insurance, FGL NY Insurance, Raven Re and Corbeau Re to change their views regarding the actions they need to take from a legal risk management perspective, which could necessitate changes to FGL Insurance’s, FGL NY Insurance’s, Raven Re’s or Corbeau Re’s practices that may, in some cases, limit their ability to grow and improve profitability.
State insurance departments conduct periodic examinations of the books and records, financial reporting, policy and rate filings, market conduct and business practices of insurance companies domiciled in their states, generally once every three to five years. Examinations are generally carried out in cooperation with the insurance departments of other states under guidelines promulgated by the NAIC. State insurance departments also have the authority to conduct examinations of non-domiciliary insurers that are licensed in their states.
The IID last completed a routine financial examination of FGL Insurance for the five year period ending 2022 and found no material deficiencies and proposed no adjustments to the financial statements as filed. The IID is currently in the process of executing a market conduct exam for the five year period ending 2022. Results of the most recent market conduct exam have not been finalized.
The NYDFS last completed a routine financial examination of FGL NY Insurance for the five year period ended December 31, 2017, and found no material deficiencies and proposed no adjustments to the financial statements as filed. The NYDFS is currently in the process of executing an exam for the five year period ending 2022. Results of the most recent examination have not been finalized.
The Vermont Department of Financial Regulation completed a routine financial examination of Raven Re for the five year period ending December 31, 2022, and found no material deficiencies and proposed no adjustments to the financial statements as filed.
Dividend and Other Distribution Payment Limitations
The insurance laws of Iowa and New York regulate the amount of dividends that may be paid in any year by FGL Insurance and FGL NY Insurance, respectively.
FGL Insurance dividends are paid as declared by its Board of Directors. Pursuant to Iowa insurance law, any proposed payment of a dividend is classified as an “extraordinary dividend” if it, together with the aggregate fair market value of other dividends or distributions made during the preceding twelve months, exceeds the greater of (i) 10% of capital and surplus as of the preceding December 31 or (ii) net gain from operations before realized capital gains or losses for twelve month period ending December 31 of the preceding year. No extraordinary dividends may be paid without prior approval of the IID. In addition, no ordinary dividends may be paid except from the earned profits arising from FGL Insurance’s business, which does not include contributed capital or contributed surplus.
In 2024, FGL Insurance did not pay dividends to Fidelity & Guaranty Life Holdings, Inc. (“FGLH”). Pursuant to the limitations described above, it is estimated that FGL Insurance’s maximum ordinary dividend capacity for 2025 is $0.
Any payment of dividends by FGL Insurance is subject to the regulatory restrictions described above and the approval of such payment by the board of directors of FGL Insurance, which must consider various factors, including general economic and business conditions, tax considerations, FGL Insurance’s strategic plans, financial results and condition, FGL Insurance’s expansion plans, any contractual, legal or regulatory restrictions on the payment of dividends and its effect on RBC and such other factors the board of directors of FGL Insurance considers relevant. For example, payments of dividends could reduce FGL Insurance’s RBC and financial condition and lead to a reduction in FGL Insurance’s financial strength rating. See “Risk Factors—Risks Relating to Our Business—A financial strength ratings downgrade, potential downgrade, or any other negative action by a rating agency could increase our cost of capital, making it challenging to grow our business, and could hinder our ability to participate in certain market segments, thereby adversely affecting our results of operations and our financial condition” in this Annual Report on Form 10-K.
Each year, FGL NY Insurance may pay a certain limited amount of ordinary dividends or other distributions as calculated under New York insurance laws without being required to obtain the prior consent of the NYDFS. However, to pay any dividends or distributions (including the payment of any dividends or distributions for which prior consent is not required), FGL NY Insurance must provide advance written notice to the NYDFS.
FGL NY Insurance has historically not paid dividends.
Surplus and Capital
FGL Insurance and FGL NY Insurance are subject to the supervision of the regulators in states where they are licensed to transact business. Regulators have discretionary authority in connection with the continued licensing of these entities to limit or prohibit sales to policyholders if, in their judgment, the regulators determine that such entities have not maintained the minimum surplus or capital or that the further transaction of business would be hazardous to policyholders.
Risk-Based Capital
In order to enhance the regulation of insurers’ solvency, the NAIC adopted a model law to implement RBC requirements for life, health and property and casualty insurance companies. All states have adopted the NAIC’s model law or a substantially similar law. RBC is used to evaluate the adequacy of capital and surplus maintained by an insurance company in relation to risks associated with: (i) asset risk, (ii) insurance risk, (iii) interest rate risk, and (iv) business risk. In general, RBC is calculated by applying factors to various asset, premium and reserve items, taking into account the risk characteristics of the insurer. Within a given risk category, these factors are higher for those items with greater underlying risk and lower for items with lower underlying risk. The RBC formula is used as an early warning regulatory tool to identify possible inadequately capitalized insurers for purposes of initiating regulatory action, and not as a means to rank insurers generally. Insurers that have less statutory capital than the RBC calculation requires are considered to have inadequate capital and are subject to varying degrees of regulatory action depending upon the level of capital inadequacy. As of the most recent annual statutory financial statements filed with insurance regulators, the RBC ratios for FGL Insurance and FGL NY Insurance each exceeded the minimum RBC requirements.
It is desirable to maintain an RBC ratio in excess of the minimum requirements in order to maintain or improve financial strength ratings. FGL Insurance’s estimated U.S. RBC ratio was over 410% as of December 31, 2024, above our 400% target. See “Risk Factors — Risks Related to Our Business — A financial strength ratings downgrade, potential downgrade, or any other negative action by a rating agency could increase our cost of capital, making it challenging to grow our business, and could hinder our ability to participate in certain market segments, thereby adversely affecting our results of operations and our financial condition” in this Annual Report on Form 10-K.
See “Bermuda Regulatory Overview — ECR and Bermuda Solvency Capital Requirements” for a discussion of Bermuda regulatory requirements that impact F&G Life Re.
Insurance Regulatory Information System Tests
The NAIC has developed a set of financial relationships or tests known as the Insurance Regulatory Information System (“IRIS”) to assist state regulators in monitoring the financial condition of U.S. insurance companies and identifying companies that require special attention or action by insurance regulatory authorities. A ratio falling outside the prescribed “usual range” is not considered a failing result. Rather, unusual values are viewed as part of the regulatory early monitoring system. In many cases, it is not unusual for financially sound companies to have one or more ratios that fall outside the usual range. Insurance companies generally submit data annually to the NAIC, which in turn analyzes the data using prescribed financial data ratios, each with defined “usual ranges.” Generally, regulators will begin to investigate or monitor an insurance company if its ratios fall outside the usual ranges for four or more of the ratios. IRIS consists of a statistical phase and an analytical phase whereby financial examiners review insurers’ annual statements and financial ratios. The statistical phase consists of 12 key financial ratios based on year-end data that are generated from the NAIC database annually; each ratio has a “usual range” of results.
As of December 31, 2024, FGL Insurance, FGL NY Insurance, Raven Re and Corbeau Re had five, one, two and four ratios outside the usual range, respectively. The IRIS ratios for net and gross change to capital and surplus, total affiliated investments to capital and surplus, surplus relief - over $5 million capital and surplus and change in premium for FGL Insurance were outside the usual range. The IRIS ratio for change in premium ratio for FGL NY Insurance was outside the usual range. The IRIS ratios for adequacy of investment income and change in premium for Raven Re were outside the usual range. The IRIS ratios for net income to total income (including realized capital gains and losses), adequacy of investment income, change in premium and change in asset mix for Corbeau Re were outside the usual range.
In all instances in prior years, regulators have been satisfied upon follow-up that no regulatory action was required. FGL Insurance, FGL NY Insurance, Raven Re and Corbeau Re are not currently subject to regulatory restrictions based on these ratios.
Group Capital Calculation
The NAIC developed a group capital calculation tool using an RBC methodology for all entities within the insurance holding company system, including non-U.S. entities. In December 2020, the NAIC adopted the Group Capital Calculation Template and Instructions, as well as amendments to the Model Holding Company Act and Regulation. The amendments implement the annual filing requirement for the group capital calculation but will not become effective until adopted by state legislatures or regulatory agencies. Legislation was introduced in New York in May 2022 that would require a group capital calculation. FNF’s lead regulator, which is also the Company’s lead regulator for this purpose, has not yet adopted a requirement for group capital.
Insurance Reserves
State insurance laws require insurers to analyze the adequacy of reserves. Following the implementation of principle-based reserving for life insurance products, the NAIC is now developing a principle-based reserving framework for fixed annuity products. The respective appointed actuaries for FGL Insurance, FGL NY Insurance, Raven Re and Corbeau Re must each submit an opinion on an annual basis that their respective reserves, when considered in light of the respective assets FGL Insurance, FGL NY Insurance, Raven Re and Corbeau Re hold with respect to those reserves, make adequate provision for the contractual obligations and related expenses of FGL Insurance, FGL NY Insurance, Raven Re and Corbeau Re. FGL Insurance, FGL NY Insurance, Raven Re and Corbeau Re have filed all of the required opinions with the insurance departments in the states in which they do business.
Credit for Reinsurance Regulation
States regulate the extent to which insurers are permitted to take credit on their financial statements for the financial obligations that the insurers cede to reinsurers. Where an insurer cedes obligations to a reinsurer that is neither licensed nor accredited by the state insurance department, the ceding insurer is not permitted to take such financial statement credit unless the unlicensed or unaccredited reinsurer secures the liabilities it will owe under the reinsurance contract.
Under the laws regulating credit for reinsurance issued by such unlicensed or unaccredited reinsurers, the permissible means of securing such liabilities are (i) the establishment of a trust account by the reinsurer to hold certain qualifying assets in a qualified U.S. financial institution, such as a member of the Federal Reserve, with the ceding insurer as the exclusive beneficiary of such trust account with the unconditional right to demand, without notice to the reinsurer, that the trustee pay over to it the assets in the trust account equal to the liabilities owed by the reinsurer; (ii) the posting of an unconditional and irrevocable letter of credit by a qualified U.S. financial institution in favor of the ceding company allowing the ceding company to draw upon the letter of credit up to the amount of the unpaid liabilities of the reinsurer and (iii) a “funds withheld” arrangement by which the ceding company withholds transfer to the reinsurer of the assets, which support the liabilities to be owed by the reinsurer, with the ceding insurer retaining title to and exclusive control over such assets.
In addition, all U.S. states, including Iowa and New York, permit an insurer to take credit for reinsurance ceded to a non-U.S. reinsurer that posts collateral in amounts less than 100% of the reinsurer’s obligations if the reinsurer has been designated as a “certified reinsurer” and is domiciled in a country recognized by the state and the NAIC as a “Qualified Jurisdiction.” The reduced percentage of full collateral applied to a certified reinsurer is based upon an assessment of the reinsurer and its financial ratings. Iowa and New York both also recognize certain qualified non-U.S. insurers as reciprocal jurisdiction reinsurers such that ceding domestic insurers may receive credit for reinsurance ceded to such unauthorized reinsurers without the requirement for the reinsurer to provide collateral.
FGL Insurance and FGL NY Insurance are subject to the credit for reinsurance rules described above in Iowa and New York, respectively, insofar as they enter into any reinsurance contracts with reinsurers that are neither licensed, accredited nor certified in Iowa and New York, respectively, or recognized as a reciprocal reinsurer in such jurisdictions.
Insurance Holding Company Regulation
F&G, as the indirect parent company of FGL Insurance and FGL NY Insurance, is subject to the insurance holding company laws in Iowa and New York. These laws generally require each insurance company directly or indirectly owned by the holding company to register with the insurance department in the insurance company’s state of domicile and to furnish annually financial and other information about the operations of companies within the holding company system. Generally, all transactions between insurers and affiliates within the holding company system are subject to regulation and must be fair and reasonable, and may require prior notice and approval or non-disapproval by its domiciliary insurance regulator.
Most states, including Iowa and New York, have insurance laws that require regulatory approval of a direct or indirect change of control of an insurer or an insurer’s holding company. Such laws prevent any person from acquiring control, directly or indirectly, of F&G, FGL US Holdings Inc. (“FGL US Holdings”), CF Bermuda Holdings Limited (“CF Bermuda”), FGLH, FGL Insurance or FGL NY Insurance or certain of their affiliates unless that person has filed a statement with specified information with the insurance regulators and has obtained their prior approval. In addition, investors deemed to have a direct or indirect controlling interest are required to make regulatory filings and respond to regulatory inquiries. Under most states’ statutes, including those of Iowa and New York, acquiring 10% or more of the voting stock of an insurance company or its parent company is presumptively considered a change of control, although such presumption may be rebutted. In addition, the insurance laws of Iowa and New York permit a determination of control in circumstances where the thresholds for the presumption of control have not been crossed. Similar laws apply to a direct or indirect change of ownership of Raven Re and
Corbeau Re. Any person who is deemed to acquire control over F&G, FNF, FGL US Holdings, CF Bermuda, FGLH, FGL Insurance, FGL NY Insurance, Raven Re, Corbeau Re or certain of their affiliates including any person who acquires 10% or more of our or FNF’s voting securities of FGL Insurance, FGL NY Insurance or certain of their affiliates, without the prior approval of the insurance regulators of Iowa and New York, will be in violation of those states’ laws and may be subject to injunctive action requiring the disposition or seizure of those securities by the relevant insurance regulator or prohibiting the voting of those securities and to other actions determined by the relevant insurance regulator.
Insurance Guaranty Association Assessments
Each state has insurance guaranty association laws under which insurers doing business in the state may be assessed by state insurance guaranty associations for certain obligations of insolvent insurance companies to policyholders and claimants. Typically, states assess each member insurer in an amount related to the member insurer’s proportionate share of the business written by all member insurers in the state. Although no prediction can be made as to the amount and timing of any future assessments under these laws, FGL Insurance and FGL NY Insurance have established reserves that they believe are adequate for assessments relating to insurance companies that are currently subject to insolvency proceedings.
Market Conduct Regulation
State insurance laws and regulations include numerous provisions governing the marketplace activities of insurers, including provisions governing the form and content of disclosure to consumers, illustrations, advertising, sales and complaint process practices. State regulatory authorities generally enforce these provisions through periodic market conduct examinations. In addition, FGL Insurance and FGL NY Insurance must file, and in many jurisdictions and for some lines of business obtain regulatory approval for, rates and forms relating to the insurance written in the jurisdictions in which they operate. FGL Insurance is currently the subject of two ongoing market conduct examinations in various states. Market conduct examinations can result in monetary fines or remediation and generally require FGL Insurance to devote significant resources to the management of such examinations. FGL Insurance does not believe that any of the current market conduct examinations it is subject to will result in any fines or remediation orders that will be material to its business.
Regulation of Investments
FGL Insurance, FGL NY Insurance, Raven Re and Corbeau Re are subject to state laws and regulations that require diversification of their investment portfolios and limit the amount of investments in certain asset categories, such as below investment grade fixed income securities, equity, real estate, other equity investments and derivatives. Failure to comply with these laws and regulations would cause investments exceeding regulatory limitations to be treated as either non-admitted assets for purposes of measuring surplus or as not qualified as an asset held for reserve purposes and, in some instances, would require divestiture or replacement of such non-qualifying investments. We believe that the investment portfolios of FGL Insurance, FGL NY Insurance, Raven Re and Corbeau Re as of December 31, 2024, complied in all material respects with such regulations.
In 2023, the NAIC released new regulations the define a residual interest. All the Company’s impacted insurance subsidiaries have complied with the new regulations. Beginning January 1, 2025, these investments will be subject to a new accounting model, which the Company is currently in the process of implementing. Also in 2023, the NAIC released new regulations that define the criteria for investments that can be classified as a bond, which the Company is currently in the process of implementing for all of its impacted insurance subsidiaries. See “Risk Factors — Risks Related to Our Business — Increased regulation or scrutiny of alternative investment advisers, arrangements with such investment advisers and investment activities may affect BIS’s or, if engaged, any other asset manager’s ability to manage our investment portfolio or impact of the reputation of our business” in this Annual Report on Form 10-K.
On December 7, 2021, the NAIC assigned to its Macroprudential Working Group, the evaluation of a list of “Regulatory Considerations Applicable (But Not Exclusive) to Private Equity (PE) Owned Insurers.” Included
within this list is the consideration of material increases in privately structured securities (both by affiliated and non-affiliated asset managers), which the NAIC says introduces other sources of risk or increases traditional credit risk, such as complexity risk and illiquidity risk. As a result, the NAIC has issued several clarifying revisions to the guidance and disclosure requirements for related party and affiliated securities and continues to consider additional proposals and disclosure requirements.
In addition, the NAIC continues to refine its application of RBC factors for certain investments.
Privacy Regulation
Our operations are subject to certain federal and state laws and regulations that require financial institutions and other businesses to protect the security and confidentiality of personal information, including health-related and customer information, and to notify customers and other individuals about their policies and practices relating to their collection and disclosure of health-related and customer information and their practices relating to protecting the security and confidentiality of such information. These laws and regulations require notice to affected individuals, law enforcement agencies, regulators and others if there is a breach of the security of certain personal information, including social security numbers, and require holders of certain personal information to protect the security of the data. Our operations are also subject to certain federal regulations that require financial institutions and creditors to implement effective programs to detect, prevent and mitigate identity theft. In addition, our ability to make telemarketing calls and to send unsolicited email or fax messages to consumers and customers and our uses of certain personal information, including consumer report information, are regulated. Federal and state governments and regulatory bodies may be expected to consider additional or more detailed regulation regarding these subjects and the privacy and security of personal information.
The Dodd-Frank Act
The Dodd-Frank Wall Street Reform and Consumer Protection Act (“The Dodd-Frank Act”) established the Federal Insurance Office within the U.S. Department of the Treasury to monitor the insurance industry. The Dodd-Frank Act made sweeping changes to the regulation of financial services entities, products and markets. Certain provisions of the Dodd-Frank Act are applicable to us, our competitors or those entities with which we do business. These provisions may impact us in many ways, including, but not limited to, having an effect on the overall business climate, requiring the allocation of certain resources to government affairs, and increasing our legal and compliance related activities and the costs associated therewith.
Under the Dodd-Frank Act, annuities that meet specific requirements, including requirements relating to certain state suitability rules, are specifically exempted from being treated as securities by the SEC. We believe that the types of FIAs that FGL Insurance and FGL NY Insurance sell will meet these requirements and, therefore, are exempt from being treated as securities by the SEC and state securities regulators. However, there can be no assurance that federal or state securities laws or state insurance laws and regulations will not be amended or interpreted to impose further requirements on FIAs. If FIAs were to be treated as securities, federal and state securities laws would require additional registration and licensing of these products and the agents selling them, and FGL Insurance and FGL NY Insurance would be required to seek additional marketing relationships for these products, any of which could impose significant restrictions on its ability to conduct operations as currently operated. However, our RILA product is not exempted from being treated as a security by the SEC.
Additionally, the Dodd-Frank Act established the Financial Stability Oversight Council (“FSOC”), which plays a role in shaping the regulatory environment affecting RILAs. The FSOC monitors systemic risks and may designate insurers offering RILAs as systemically important financial institutions if their activities pose significant risks to the broader economy, subjecting them to enhanced prudential standards and supervision by the Board of Governors of the United States Federal Reserve. The prudential standards for non-bank Systemically Important Financial Institutions (“SIFIs”) include enhanced RBC requirements, leverage limits, liquidity requirements, single counterparty exposure limits, governance requirements for risk management, stress test requirements, special debt-to-equity limits for certain companies, early remediation procedures, and recovery and resolution planning.
ERISA and Fiduciary Standards
We may offer certain insurance and annuity products to employee benefit plans governed by ERISA and/or the Internal Revenue Code of 1986, as amended (the “Code”), including group annuity contracts designated to fund tax-qualified retirement plans. ERISA and the Code provide (among other requirements) standards of conduct for employee benefit plan fiduciaries, including investment managers and investment advisers with respect to the assets of such plans, and holds fiduciaries liable if they fail to satisfy fiduciary standards of conduct.
State and federal regulators have been adopting stronger consumer protection regulations that may materially impact our company, business, distribution, and products. The NAIC adopted an amended Suitability in Annuity Transactions Model Regulation in February 2020 incorporating a requirement that agents act in the best interest of consumers without putting their own financial interests or insurer’s interests ahead of consumer interests. The best interest requirement is satisfied by complying with four regulatory obligations relating to care, disclosure, conflict of interest, and documentation. The amended model regulation also requires agents to provide certain disclosures to consumers, obligates insurers to supervise agent compliance with the new requirements, and prohibits sales contests or other incentives based on sales of specific annuities within a limited period of time.
Several states have adopted the revised NAIC model regulation, including FGL Insurance’s domiciliary state of Iowa. Management has instituted business procedures to comply with these revised requirements where required. FGL NY Insurance separately instituted new business procedures in response to the NYDFS best interest rule adopted in August 2019 which survived a legal challenge and deviates from the NAIC model regulation and is considered more onerous in certain respects including its broader application to life insurance sales.
In December 2020, the DOL issued its final version of an investment advice rule replacing the previous “Fiduciary Rule” that had been challenged by industry participants and vacated in March 2018 by the United States Fifth Circuit Court of Appeals. The new investment advice rule reinstates the five-part test for determining whether a person is considered a fiduciary for purposes of the Employee Retirement Income Security Act of 1974 (“ERISA”) and the Internal Revenue Code of 1986, as amended (the “Code”), and sets forth a new exemption, referred to as prohibited transaction class exemption (“PTE”) 2020-02. The rule’s preamble also contains the DOL’s reinterpretation of elements of the five-part test that appears to encompass more insurance agents selling IRA products and withdraws the DOL’s longstanding position that rollover recommendations out of employer plans are not subject to ERISA. The new rule took effect on February 16, 2021. The DOL left in place PTE 84-24, which is a longstanding class exemption providing prohibited transaction relief for insurance agents selling annuity products, provided that certain disclosures are made to the plan fiduciary, which is the policyholder in the case of an IRA, and certain other conditions are met. Among other things, these disclosures include the agent’s relationship to the insurer and commissions received in connection with the annuity sale. We, along with FGL Insurance and FGL NY Insurance, designed and launched a compliance program in January 2022 requiring all agents selling IRA products to submit an acknowledgment with each IRA application indicating the agent has satisfied PTE 84-24 requirements on a precautionary basis in case the agent acted or is found to have acted as a fiduciary. Meanwhile, the DOL has publicly announced its intention to consider future rulemaking that may revoke or modify PTE 84-24.
On April 23, 2024, following previous attempts to expand fiduciary regulation for advisers, the DOL released a new rule, the New Fiduciary Rule, which significantly broadens the definition of “fiduciary” under ERISA and Section 4975 when advisers provide investment recommendations to plans subject to ERISA and Section 4975 of the Code. Among other requirements, the New Fiduciary Rule provides that any person will be an investment advice fiduciary if such person provides investment advice or makes an investment recommendation to a retirement investor (i.e., a plan, a discretionary plan fiduciary, a plan participant or beneficiary, an IRA, an IRA owner or beneficiary, or an IRA fiduciary) for a fee or other compensation, the person makes professional investment recommendations to investors on a regular basis as part of their business, and the recommendation is provided under circumstances that would indicate to a reasonable investor in like circumstances that the recommendation is based on a review of the particular needs or individual investor circumstances of the retirement investor, reflects the application of professional or expert judgment to the retirement investor’s particular needs or individual circumstances, and may be relied upon by the retirement investor as intended to advance the retirement investor’s
best interest. Unlike the current ERISA standard, the New Fiduciary Rule subjects non-discretionary investment advice to retirement plans and accounts under the care and loyalty standards that also apply to investment advisors with discretionary authority or control over such plans and accounts. In addition, on the same date, the DOL issued amended versions of PTE 2020-02 and PTE 84-24, either or both of which provide prohibited transaction exemptive relief to insurance companies and insurance producers who make insurance product recommendations to retirement investors, subject to certain conditions. The New Fiduciary Rule likely means that certain of the Company’s agents will be considered fiduciaries for purposes of ERISA and the Code, subjecting the Company, and the insurance industry on the whole, to greater regulatory risk.
The DOL’s new Fiduciary Rule, which was scheduled to become effective on September 23, 2024, has been challenged. On July 25, 2024, in the case of Federation of Americans for Consumer Choice, Inc., et al. v. United States Department of Labor, et al., (“Federation of Americans”) the United States District Court for the Eastern District of Texas issued an order staying the effective date of the DOL’s final fiduciary rule (and related amendments to PTE 84-24) that was issued in March 2024. The District Court, in part relying on the Supreme Court’s recent ruling in Loper Bright Enterprises v. Raimondo, found that the plaintiffs (primarily insurance agents) were likely to succeed on their arguments that the Final Rule improperly expanded the definition of an “investment advice fiduciary” under ERISA. As a result, the Final Rule’s original effective date of September 23, 2024 has been delayed until further notice.
In addition, on July 26, 2024, a companion case to Federation of Americans filed in the United States District Court for the Northern District of Texas, American Council of Life Insurers, et al. v. United States Dep’t of Labor, et al., held the remaining PTE amendments included in the Final Rule (PTEs 2020-02, 75-1, 77-4, 80-83, 83-1 and 86-128) that were not challenged in Federation of Americans were also stayed, noting that the Northern District fully agreed with the Eastern District’s analysis and decision to stay the effective date of the Final Rule.
On September 20, 2024, the DOL appealed both rulings to the Fifth Circuit Court of Appeals. On February 11, 2025, the DOL filed an unopposed motion to hold the appeals in abeyance to allow new agency officials time to become familiar with the issues in these cases and determine how they wish to proceed. The motion was granted so the appeals are in abeyance. A Fifth Circuit reversal of the Texas district court rulings could have harmful effects on the insurance industry, creating additional hurdles to operate our business.
Management believes these current and emerging developments relating to market conduct standards for the financial services industry may, over time, materially affect the way in which our agents do business, the role of IMOs, sale of IRA products including IRA-to-IRA and employer plan rollovers, how we supervise our distribution force, compensation practices and liability exposure and costs. In addition to implementing the compliance procedures described above, management is monitoring further developments closely and will be working with IMOs and distributors to adapt to these evolving regulatory requirements and risks. See “Risk Factors—Legal, Regulatory and Tax Risks—Current and emerging developments relating to market conduct standards for the financial industry emerging from the United States Department of Labor’s (“DOL”) implementation of the “fiduciary rule” may over time materially affect our business.”
The SECURE 2.0 Act
New and recently passed legislation may also impact the industry in which F&G competes. For example, the SECURE 2.0 Act of 2022, which went into effect as early as January 1, 2023, in certain respects, creates an opportunity for F&G and its competitors to pursue sales to employer retirement plan sponsors as well as its traditional customers. In addition, F&G and its competitors may implement operational changes to adapt to the effect of the new legislation. See “Risk Factors—Legal, Regulatory and Tax Risks—The SECURE 2.0 Act of 2022 may impact our business and the markets in which we compete.”
Corporate Alternative Minimum Tax
The Inflation Reduction Act of 2022 (the “Inflation Reduction Act”) was signed into law on August 16, 2022. Among other changes, the Inflation Reduction Act introduced a 15% corporate alternative minimum tax (“CAMT”)
on adjusted financial statement income and a 1% excise tax on treasury stock repurchases. These provisions were effective January 1, 2023. For purposes of calculating the adjusted financial statement income, the Company is included in the controlled group of FNF, its parent company. Though the Company is subject to the minimum tax, the Company does not expect to be in a perpetual CAMT position. The life companies will join the consolidated tax return group with FNF and file a life/non-life consolidated return once the five-year waiting period has completed in 2026, which should strengthen that position as FNF is not anticipating owing CAMT on its future returns. For the years ended December 31, 2024 and 2023, the Company was subject to CAMT, but there was no impact to total tax. A CAMT credit carryforward was created and is expected to be able to be utilized in future years.
Climate Risk
On November 15, 2021, NYDFS issued final Guidance for New York Domestic Insurers on Managing the Financial Risks from Climate Change, detailing NYDFS’s expectations related to domestic insurers' management of the financial risks from climate change. These guidelines are applicable to FGL NY Insurance and became effective in 2022. Under the guidelines, climate change risk must be specifically included in an insurance group's enterprise risk management function.
Diversity and Corporate Governance
The NAIC and certain state insurance regulators are focused on the issue of diversity within the insurance industry, such as the diversity of an insurer’s board of directors and management. The NAIC is developing a framework for approaching issues related to race and insurance. The NAIC goals include improving access to different types of insurance products in minority communities, addressing issues related to affordability, and providing guidance to regulators on ways to improve insurance access and the understanding of insurance in underserved communities. In New York, NYDFS issued a circular letter that states that the NYDFS expects the insurers it regulates to make diversity of their leadership a business priority and key element of their corporate governance, and it includes diversity-related questions in its examination process. This guidance is applicable to FGL NY Insurance.
Bermuda Regulatory Overview
F&G Life Re is a Bermuda exempted company incorporated under the Companies Act, 1981, as amended (the “Bermuda Companies Act”) and registered as a Class E insurer under the Insurance Act 1978, as amended, and its related regulations (the “Bermuda Insurance Act”). F&G Life Re is regulated by the Bermuda Monetary Authority (“BMA”).
The Bermuda Insurance Act provides that no person may carry on an insurance business in or from within Bermuda unless registered as an insurer under the Bermuda Insurance Act by the BMA. In deciding whether to grant registration, the BMA has broad discretion to act as it thinks fit in the public interest. The BMA is required by the Bermuda Insurance Act to determine whether the applicant is a fit and proper body to be engaged in the insurance business and, in particular, whether it has, or has available to it, adequate knowledge and expertise. The registration of an applicant as an insurer is subject to the insurer complying with the terms of its registration and such other conditions as the BMA may impose at any time. In addition, the Bermuda Insurance Act requires BMA approval of increases in control or dispositions of control of an insurance company.
Effective January 1, 2015, Bermuda was placed on the NAIC’s List of Qualified Jurisdictions, which makes Bermuda-domiciled reinsurers that meet certain criteria to qualify as a certified reinsurer eligible for reduced reinsurance collateral requirements under the NAIC’s Credit for Reinsurance Model Law and Regulations as adopted by various states. F&G Life Re is a certified reinsurer in Iowa.
Bermuda has been awarded full equivalence for commercial insurers under Europe’s Solvency II regime applicable to insurance companies, which regime came into effect on January 1, 2016.
Effective January 1, 2020, Bermuda was granted NAIC Reciprocal Jurisdiction status, which makes Bermuda domiciled reinsurers that satisfy certain conditions eligible to be designated as a reciprocal jurisdiction reinsurer. Under the NAIC’s Credit for Reinsurance Model Law and Regulations which has been adopted by all states, a ceding insurer may take credit for reinsurance ceded to a reciprocal jurisdiction reinsurer without posting collateral. F&G Life Re has been designated a reciprocal jurisdiction reinsurer in Iowa.
All insurers are required to implement corporate governance policies and processes as the BMA considers appropriate given the nature, size, complexity and risk profile of the insurer and all insurers, on an annual basis, are required to deliver a declaration to the BMA confirming whether or not they meet the minimum criteria for registration under the Bermuda Insurance Act.
All insurers are required to comply with the Bermuda Insurance Code of Conduct, which is a codification of best practices for insurers provided by the BMA, and to submit annually to the BMA with its statutory financial return a declaration of compliance confirming it complies with the Bermuda Insurance Code of Conduct. All insurers are also required to comply with the Bermuda Insurance Sector Cyber Risk Management Code of Conduct issued by the BMA under the Bermuda Insurance Act, which establishes the duties, requirements, standards, procedures and principles to be complied with in relation to operational cyber risk management.
The BMA utilizes a risk-based approach when it comes to licensing and supervising insurance and reinsurance companies. As part of the BMA’s risk-based system, an assessment of the inherent risks within each particular class of insurer or reinsurer is used to determine the limitations and specific requirements that may be imposed. Thereafter the BMA keeps its analysis of relative risk within individual institutions under review on an ongoing basis, including through the scrutiny of audited financial statements, and, as appropriate, meeting with senior management during onsite visits.
The Bermuda Insurance Act imposes solvency and liquidity standards on Bermuda insurance companies, as well as auditing and reporting requirements. Certain significant aspects of the Bermuda insurance regulatory framework are set forth below.
Minimum Solvency Margin. The Bermuda Insurance Act provides that the value of the assets of an insurer must exceed the value of its liabilities by an amount greater than its prescribed minimum solvency margin.
The minimum solvency margin that must be maintained by a Class E insurer is the greater of: (i) $8,000,000; (ii) 2% of first $500,000,000 of assets plus 1.5% of assets above $500,000,000; and (iii) 25% of that insurer’s enhanced capital requirement (“ECR”). An insurer may file an application under the Bermuda Insurance Act to waive the aforementioned requirements.
ECR and Bermuda Solvency Capital Requirements (“BSCR”). Class E insurers are required to maintain available capital and surplus at a level equal to or in excess of the applicable ECR, which is established by reference to either the applicable BSCR model or an approved internal capital model. Furthermore, to enable the BMA to better assess the quality of the insurer’s capital resources, a Class E insurer is required to disclose the makeup of its capital in accordance with its 3-tiered capital system. An insurer may file an application under the Bermuda Insurance Act to have the aforementioned ECR requirements waived.
Restrictions on Dividends and Distributions. In addition to the requirements under the Bermuda Companies Act (as discussed below), the Bermuda Insurance Act limits the maximum amount of annual dividends and distributions that may be paid or distributed by F&G Life Re without prior regulatory approval.
F&G Life Re is prohibited from declaring or paying a dividend if it fails to meet its minimum solvency margin, or ECR, or if the declaration or payment of such dividend would cause such breach. If F&G Life Re were to fail to meet its minimum solvency margin on the last day of any financial year, it would be prohibited from declaring or paying any dividends during the next financial year without the approval of the BMA.
In addition, as a Class E insurer, F&G Life Re must not declare or pay a dividend to any person other than a policyholder unless the value of the assets of such insurer, as certified by the insurer’s approved actuary, exceeds its liabilities (as so certified) by the greater of its margin of solvency or ECR. In the event a dividend complies with the above, F&G Life Re must ensure the amount of any such dividend does not exceed that excess.
Furthermore, as a Class E insurer, F&G Life Re must not declare or pay a dividend in any financial year which would exceed 25% of its total statutory capital and surplus, as set out in its previous year’s Bermuda statutory financial statements, unless at least seven days before payment of such dividend F&G Life Re files with the BMA an affidavit signed by at least two directors of F&G Life Re and its principal representative under the Bermuda Insurance Act stating that, in the opinion of those signing, declaration of such dividend has not caused the insurer to fail to meet its relevant margins.
The Bermuda Companies Act also limits F&G Life Re’s ability to pay dividends and make distributions to its shareholders. F&G Life Re is not permitted to declare or pay a dividend, or make a distribution out of its contributed surplus, if it is, or would after the payment be, unable to pay its liabilities as they become due or if the realizable value of its assets would be less than its liabilities.
Reduction of Capital. F&G Life Re may not reduce its total statutory capital by 15% or more, as set out in its previous year’s financial statements, unless it has received the prior approval of the BMA. Total statutory capital consists of the insurer’s paid in share capital, its contributed surplus (sometimes called additional paid in capital) and any other fixed capital designated by the BMA as statutory capital.
Bermuda Corporate Income Tax
The Corporate Income Tax (“CIT”) Act of 2023 was passed in Bermuda on December 27, 2023. The CIT Act commenced on January 1, 2025 and applies a statutory rate of 15% to the taxable income or loss of Bermuda tax resident entities and permanent establishments. F&G Life Re, a 953(d) company with no or minimal US permanent tax differences, does not anticipate to owe any Bermuda CIT due to the foreign tax credit. The deferred tax asset recorded for the year ended December 31, 2024, of $10 million has a full valuation allowance. As a result, there is no material impact to the financial statements.
Block Transactions
Since January 2023, the BMA has required all long-term (life) commercial reinsurers such as F&G Life Re to obtain the prior approval of the BMA for all long-term block reinsurance transactions, which is defined as a block transaction that covers an existing long-term business policy that is written and in force and on the books of the cedant, as of the date of the reinsurance transaction (including pension risk transfer transactions).
Affiliate, Related Party or Connected Party Assets
As a Class E insurer, F&G Life Re is required to obtain the prior written approval of the BMA before investing in assets with counterparty credit exposure to an affiliate, related party or connected party (each as defined under the Bermuda Insurance Act) of F&G Life Re.
Cayman Islands Regulatory Overview
F&G Cayman Re is a Cayman Islands exempted company incorporated under the Companies Act, (2023 Revision) as amended, and licensed as a Class D insurer in the Cayman Islands under the Insurance Act, 2010 as amended and its related regulations (the “Cayman Islands Insurance Act”). F&G Cayman Re is regulated by the Cayman Islands Monetary Authority (“CIMA”).
The Cayman Islands Insurance Act provides that no person may carry on an insurance business in or from within the Cayman Islands unless licensed under the Cayman Islands Insurance Act. CIMA has broad discretion in its consideration of whether to grant a license and must act in the public interest. CIMA is required by the Cayman
Islands Insurance Act to determine whether an applicant is a fit and proper body to be engaged in insurance business. A licensed insurer must comply with the terms of its license and such other conditions as CIMA may impose at any time. In addition, the Cayman Islands Insurance Act requires CIMA approval of increases in control or dispositions of control of an insurance company.
All insurers are required to implement corporate governance policies as CIMA considers appropriate given the nature, size, complexity and risk profile of the insurer. All insurers are also required to comply with the CIMA's Rules and Statements of Guidance as applicable to insurers which is a codification of best practices provided by CIMA, and to submit annually to CIMA audited financial statements and a declaration of compliance confirming it complies with the Cayman Islands Insurance Act.
Capital Requirements. The Cayman Islands Insurance Act provides that an insurer must maintain a minimum capital requirement based on its license class. For a Class D insurer, the minimum capital requirement is $50,000,000. In addition, an insurer must maintain a minimum margin of solvency at a level equal to or in excess of the total prescribed capital requirement which is established by reference to either the applicable prescribed capital requirements based on license class or an internal capital model approved by CIMA. Notwithstanding the minimum capital requirements, CIMA may set an enhanced prescribed capital requirement in respect of any insurer. CIMA may also, for class B, C and D insurers, exclude from the calculations assets that it deems inappropriate.
CIMA utilizes a risk-based approach to licensing and supervising insurers and to determining limitations and/or specific requirements. CIMA reviews on an ongoing basis, an insurer’s audited financial statements, actuarial valuation report and, as appropriate, meeting with senior management during onsite visits.
The Cayman Islands Insurance Act and regulations promulgated thereunder impose solvency and liquidity standards on Cayman Islands insurance companies, as well as auditing and reporting requirements.
As a regulated insurance company, F&G Cayman Re is subject to the supervision of CIMA and CIMA may at any time direct F&G Cayman Re, in relation to a policy, a line of business or the entire business, to cease or refrain from committing an act or pursing a course of conduct and to perform such acts as in the opinion of CIMA are necessary to remedy or ameliorate the situation.
The laws and regulations of the Cayman Islands require that, among other things, F&G Cayman Re maintain minimum levels of statutory capital, surplus and liquidity, meet solvency standards, submit to periodic examinations of its financial condition and restrict payments of dividends and reductions of capital. Statutes, regulations and policies that F&G Cayman Re is subject to may also restrict the ability of F&G Cayman Re to write insurance and reinsurance policies, make certain investments and distribute funds. Any failure to meet the applicable requirements or minimum statutory capital requirements could subject it to further examination or corrective action by CIMA, including restrictions on dividend payments, limitations on our writing of additional business or engaging in finance activities, supervision or liquidation.
Human Capital Resources
As of December 31, 2024, we had 1,338 full-time equivalent employees. None of our employees are subject to collective bargaining agreements. We consider our relations with our employees to be good.
Talent Management
F&G’s core values - Collaborative, Authentic, Dynamic and Empowered, coupled with our competitive total rewards philosophy and flexible work environment provide an attractive employee value proposition. We recruit top talent to join our team and provide opportunities for personal and professional growth.
Our development programs are designed to provide opportunities for all employees to grow and develop. Development programs are aligned to the skills and behaviors defined in our F&G Competencies - Think Enterprise
Wide, Leverage Data, Center Equity, Communicate with Courage, Be Accountable- and ensure our employees are developing skills that are critical to achieve business goals now and in the future.
Leadership Academy is our leadership development program designed to develop the next level of leaders at F&G and enables cross-functional leaders to hone their leadership capability and network with colleagues from across the enterprise.
Employee engagement is measured annually through two surveys. Our strong engagement scores on the Energage Engagement Survey were rewarded with several “Top Places to Work” designations including Leadership, Innovation, Compensation & Benefits, Work-Life Flexibility and Financial Services Industry. We are honored to be a recipient of the “Top Workplaces USA” designation in 2024, 2023 and 2022 and a recipient of the “Top Workplaces Iowa” designation since 2018.
The Gallup Employee Engagement survey data is our key metric to support strategic decisions on engaging and retaining our talent. Initiatives such as our Employee Resource Groups and our Connection Week program are a few examples of programs that were identified based on our employee engagement data.
At F&G, we provide comprehensive benefits designed to meet the needs of our employees and demonstrate the value they bring to the organization. Employees are eligible to participate in our 401(k) savings plan, to which we make matching and annual nondiscretionary contributions. Employees are also eligible to participate in our Employee Stock Purchase Plan with a competitive match feature. We offer competitive health care benefit options for medical, dental and vision coverage, as well as a health savings account with an employer contribution. Other benefits offerings include health care and dependent care flexible spending accounts, employee assistance program, lifestyle reimbursements, charitable matching donations, and adoption assistance. To support a healthy work-life balance, all employees receive paid time off, holidays, flexible Fridays, volunteer time off and paid parental leave for new parents.
Employee retention is critical to the success of our business. Turnover is monitored and analyzed to ensure we are protecting our most valuable asset, our team members. Our turnover rates have been consistently below national and industry-specific benchmarks.
Workplace Flexibility
F&G is committed to providing employees with the opportunities and flexibility they need to succeed, as well as ensuring a culture of belonging and inclusion by:
•Providing well rounded benefits that support employees diverse needs such as, domestic partner medical coverage, gender dysphoria services, $50,000 lifetime maximum for infertility services ($35,000 is United Health Care standard), travel & lodging reimbursement for services rendered out-of-state due to state law, Employee Assistance Program including 6 free counseling sessions per person per incident per year, in addition to other emotional health solutions, $10,000 in adoption assistance benefit, parental leave benefits, flexible PTO and lifestyle reimbursements.
•Supporting employee training, developing and educating through LinkedIn learning with a wide array of topics (e.g., Using Gender inclusive language, fueling your Company Culture, Inclusive Leadership, Unconscious Bias, etc.), tuition reimbursement, and manager and leadership training.
•Hosting educational and developmental events such as, a Mental Awareness and Racial Equity Master Class, a Mental Health panel, and a panel on Neurodiversity.
•Recognized for several Cultural Excellence Awards in 2024, 2023 and 2022 through Energage, for excellence in 1) Compensation and Benefits, 2) Leadership, 3) Work-Life Flexibility, 4) Professional Development, 5) Appreciation, 6) Employee Wellbeing, 7) Professional Development and 8) Purpose and Values.
Community engagement
F&G focuses its community engagement and charitable giving to support essential needs such as food insecurity and housing. In recent years, F&G has won multiple awards for its corporate support and employee involvement with United Way, including Outstanding Corporate/Foundation Philanthropist for 2023 from the Association of Fundraising Professionals Central Iowa Chapter. Other community investments include:
•Serving as founding partner of the American Council of Life Insurer’s Impact Investments Initiative (“360 Community Capital”) to make housing affordable and sustainable in underserved communities.
•Fostering partnerships in the Des Moines community with the Iowa Food Bank and Polk County Housing Trust.
•Offering company-wide volunteer events for employees to make an impact locally with organizations such as Rebuilding Together.
•Providing employees with 16 hours of paid time off per year for volunteering.
•Supporting dozens of other community organizations identified by F&G employees in support of essential needs within the community where they live and work.
Operational Sustainability
F&G aims to reduce the company’s environmental footprint through a variety of sustainable and environmentally sound programs within its LEED-certified headquarters building in Des Moines, Iowa. F&G also promotes flexible work from home arrangements which reduce commute time, greenhouse gas emissions, and paper usage.
Governance
Our Company and our Board is committed to sustainable practices to serve our employees, business partners and the community
The F&G AC is responsible for overseeing the Company’s sustainability risks. Such risks may include climate risks as a subset of investment risks. The Company’s Chief Risk Officer (“CRO”) will continue to update the AC on F&G’s climate risk profile as risks and opportunities arise.
Management’s Role in Assessing and Managing Sustainability Risks and Opportunities
Additional governance committees
The AC and ERMC utilize and rely on other groups and committees within F&G to facilitate that all risks and opportunities related to our sustainability are addressed appropriately.
The ERMC is an enterprise committee, consisting of C-suite level executives including the Chief Executive Officer, Chief Financial Officer, Chief Investment Officer and CRO who are responsible for reviewing risks and associated strategy across the business. The risks are included in the overall F&G Risk Register that is the basis for quarterly risk assessments. The overall risk posture of the organization is updated in the quarterly ERM dashboard report. The development of and maturity of the enterprise ESG program, including climate-risks, is included in F&G’s 2023 Own Risk and Solvency Assessment (“ORSA”) summary report, and articulates the responsibility for actively monitoring and focusing resources on sustainability-related activities.
The Investment Committee provides oversight of investments held, approves new asset classes, and reviews investment managers and mandates. The Investment Committee also oversees the relationships with F&G’s Asset Management companies, which includes assessing their sustainability policies and practices for consistency with F&G’s missions and vision.
Strategy
F&G’s product solutions provide social good by supporting clients to achieve their retirement goals and to improve their financial lives, while protecting against unforeseen events through life insurance policies. This sentiment of service provides the foundation for F&G’s culture and guides business operations as well as interactions within our communities.
The investment portfolio supporting the current range of products offered by F&G considers climate-related risks and the transition to a low carbon economy. As long-term investors, F&G understands the energy transition will be gradual, and the focus should be on investment outcomes that will support our fiduciary duty to our clients and the investment goals of our clients.
F&G completed a qualitative assessment of climate risks and opportunities in 2023 with input from the ESG Executive Steering Committee and ESG working group. The assessment identified potential impacts of climate change on the F&G businesses and financial plans over short-, medium-, and long-term time horizons. Generally, short term is defined as present and 1 – 5 years in the future, medium-term is 5- 10 years in the future, and long-term is 10-30 years in the future.
The assessment also identified the risks applicable to F&G based on physical presence, products sold, and credit/counterparty risk. The identified risks were added to the enterprise risk register for inclusion in the quarterly self-assessment and annual risk assessment processes. The risks were also integrated into the ESG Program.
Impact of pending and passed legislation
Developments in national, state, and international regulations related to ESG and climate risk are ever-changing. F&G is diligently working to identify and gather the appropriate data for evolving reporting standards.
The California Air Resources Board ("CARB"), and similar regulators in other U.S. states and international jurisdictions in which we sell our products have phased in, or are phasing in, emission regulations setting maximum emission standards.
The state of California passed two bills that will require certain companies doing businesses in the state to disclose GHG emissions and climate-related financial risk information. Senate Bill 253 (SB 253) requires the annual disclosure of Scope 1, 2 and 3 GHG emissions, with certain GHG emissions data subject to third party assurance. The bill requires disclosure of Scope 1 and 2 GHG emissions beginning in 2026 for the 2025 reporting year and disclosure of Scope 3 GHG emissions beginning in 2027 for the 2026 reporting year. SB 253 would be effective for public and private companies with total annual revenues exceeding $1 billion and that do business in California. Senate Bill 261 (SB 261) requires biennial disclosures posted on a company’s website related to climate-related financial risks and the measures a company has adopted to reduce and adapt to such risks. The bill requires disclosure of the climate-related financial risk disclosures beginning in 2026 for the 2025 reporting year. SB 261 is effective for public and private companies with total annual revenues exceeding $500 million. Both SB 253 and 261 have been challenged in the U.S. District Court for the Central District of California. Further, on September 27, 2024, the California Governor amended both SB 253 and SB 261 by signing into law Senate Bill 219 (SB 219). SB 219 extends the time in which CARB has to promulgate implementing regulations for SB 253 until July 1, 2025, a delay of six months, but does not otherwise change the reporting deadlines in SB 253 or SB 261.
Capital expenditures related to climate change
Current expenditures related specifically to climate change have been minimal. F&G added a sustainability module to the Governance, Risk, and Compliance application to maintain risk information and metrics related to sustainability efforts. Future expenditures will likely increase as F&G moves forward with plans for ongoing scenario analysis and data stores to facilitate the calculation of Scope 3 emissions.
Investment Portfolio climate scenario analysis
F&G conducted a one-time pilot scenario analysis exercise with the advisory support of Baringa using BlackRock’s Aladdin Climate technology (incorporating Baringa’s industry-leading Climate Change Scenario Model). This analysis included an overall scenario analysis on the investment portfolio and assessed the transition risks by asset class and sector for the portfolio using different climate scenarios. The overall scenario analysis covered multiple industry-recognized scenarios, including a 2°C or lower scenario. For the pilot portfolio temperature alignment was calculated, aligning F&G’s pilot portfolio with a warming trajectory through 2050. The analysis also included an assessment of physical risk of three commercial properties held in the F&G portfolio. The evaluation included electricity and gas expenditures, outdoor labor costs, vulnerability to rising sea levels, and weather-related catastrophes.
The overall results of the pilot scenario analysis indicated larger impacts under the Orderly and Disorderly scenarios by 2050, as expected, highlighting energy-intensive industries. Utilities saw larger variability between the issuers, while energy and airlines saw more uniform impacts. Automobile manufacturers saw the largest impact and variability, while financials and structured products had smaller impacts.
We will continue to enhance our capabilities in the evaluation and assessment of risks due to climate change as a component of our overall enterprise risk process.
Risk Management
F&G’s ERM policy defines the approach to risk identification, risk assessment, and risk response. The ERMC owns the ERM Policy and is responsible for reviewing and approving the policy on an annual basis. Updates to the policy are determined by the ERM leadership team.
The ERM process includes a risk appetite statement which outlines the level of acceptable risk in the pursuit of overall financial and strategic objectives. Risk appetite statements and risk tolerances are linked to the strategic objectives set out in the corporate plan and are stressed using a variety of multifactor scenarios. Qualitative and quantitative approaches are used to manage risk appetite and are monitored as part of the strategy and planning process.
Risks are defined in the risk taxonomy, based on International Organization for Standardization 31000, and captured in a risk library. The taxonomy includes four parent categories: Operational, Governance/Strategy, Product/Distribution, and Investments. These four parent categories are broken down further into 31 sub-categories (IMO/Agent Servicing, Business Continuity/Disaster Recovery, Third-Party Administration/Outsourcing, Fraud, Human Resources/People, Policy Administration, IT Systems, Information Security, Accounting and Financial Reporting, Actuarial and Governance Operations, Project Management, Model Risk, Compliance, Capital Management, Risk Management, Business Strategy, Corporate Governance, Marketing/Communications, ESG, Legal/Litigation, Regulatory Environment, Reputation, Pricing and Product Design, Product Governance, In-force Performance Management, Distribution, Asset Liability Management (“ALM”), Investment Guidelines and Compliance, Credit, Foreign Exchange, and Liquidity Risk). The library identifies risk ownership, corresponding risk limits, and high-level controls for monitoring, reporting, and mitigating material risks.
Risks are identified via ongoing discussions between ERM and the business partners, as well as through monitoring of industry groups and publications. New and emerging risks are reviewed at the ERMC and added to the risk register. Each quarter, ERM works with the risk owners to assess the impact and likelihood of each risk in the register to determine the inherent risk rating, and then apply a control assurance rating to identify the residual risk rating. The rating scales are three by three (low, medium, high). The quarterly self-assessment results are reported in the ERM dashboard to the ERMC. The dashboard reflects the residual risk ratings at the sub-category level for the Enterprise, and the direction the risk is trending (increasing, decreasing, stable).
F&G monitors risks via an annual risk assessment, the quarterly risk self-assessments, quarterly ERMC meetings, monthly Investment Committee meetings, monthly Capital Committee meetings, and ad hoc analysis. The
overall risk posture of the organization is updated in the ERMC meeting report that includes a CRO assessment, emerging risks, ERM dashboard, market risk discussion, stress testing results, and risk appetite measures.
The development of an enterprise program, including climate risks, is included in F&G’s 2023 ORSA summary report, and articulates the Management Committee’s responsibility for actively monitoring and focusing resources on sustainability-related activities. Overall climate risk was deemed to be minimal by the ESG Steering Committee during a qualitative review of risks and opportunities based on the insurance-related products sold by F&G. As a life insurance and annuities company, physical climate risks that are material risks for property and casualty insurers are less impactful. Climate-related underwriting risk (mortality/morbidity) is monitored within the overall risk framework, although it is not considered material to F&G’s overall business.
F&G recognizes the rapidly evolving regulatory environment on climate-related risks and opportunities and has a regulatory monitoring process. The ongoing monitoring of ESG-related regulations is included in the overall regulatory monitoring process overseen by the Legal Department. Any new regulation passed related to ESG is entered into the Comply On Demand Enterprise system and assigned to subject matter experts for review. If policy or procedure changes are required, the implementation of those changes is monitored through this system.
Climate risks will be identified and assessed in accordance with the ERM Policy and managed through the ERM framework. The framework utilizes the three lines of defense model: Business/Operational Management, the ERM function (Risk Management), and Internal Audit.
The 1st line of defense develops and implements mitigation activities for risks in business activities and provides monitoring and reporting of such risks on an ongoing basis; the 2nd line of defense challenges and supports the 1st line of defense, while helping to identify activities to mitigate risks and advise on risk management activities. The 3rd line of defense provides management with independent, objective assurance of the overall effectiveness, and efficiency of the design and operation of internal controls.
The framework and process alignment includes utilization of committee structure to identify, assess, and prioritize risk to ensure both senior management and the Board understand and can manage the risk profile. Any changes in business trends as a result of climate change would be identified through Risk Management interaction with the 1st line of defense discussions and risk assessments. No material or significant changes due to climate change have been identified to date.
Investment risk is one of the largest sources of risk to the Company, and the Senior Vice President, Investment Risk and ALM Strategy, with the Deputy Chief Investment Officer are responsible for integrating sustainability practices, including understanding and managing climate-related risks, into F&G’s investment process. Our primary asset manager generally considers material sustainability factors a key part of evaluating new investments. By considering applicable sustainability factors in the investment process, they aim to identify and address material investment risks and opportunities. They also continuously monitor sustainability-related risks throughout the investment holding period and engage on certain focus areas such as Climate Risk, Inclusion and good Corporate Governance.
Metrics and Targets
F&G is evaluating how climate-related metrics can be leveraged to better understand the potential risks and opportunities to our business. F&G anticipates conducting an expanded quantitative analysis of the investment portfolio, as well as considering other metrics and proactive contributions to reduce uncertainty, filling data gaps, and working with investment managers and other stakeholders to collect additional data about climate risks.
F&G anticipates gathering Scope 1 and Scope 2 emissions in the coming year for additional office locations in New York, Bermuda and Cayman.
F&G’s existing risk management framework includes various metrics to manage risks across the investment portfolio. F&G is currently assessing the development of climate-related targets to improve the existing risk
management framework. Efforts will continue to develop and enhance key policies and statements to reflect our ongoing commitment to mitigating climate-related risk, including climate scenario analysis, and F&G will continue to monitor risks and opportunities related to our climate risk assessment.
Available Information
Our web address is www.fglife.com. Our electronic filings with the SEC (including all Annual Reports on Form 10-K, Quarterly Reports on Form 10-Q, Current Reports on Form 8-K, and if applicable, amendments to those reports) will be available free of charge on the website as soon as reasonably practicable after they are electronically filed with, or furnished to, the SEC. The information posted on our website is not incorporated into this document.
The SEC maintains a website that contains reports, proxy statements and other information about issuers, like us, that file electronically with the SEC. The address of that site is www.sec.gov.
Item 1A. Risk Factors
You should carefully consider the following risks and other information in this Annual Report on Form 10-K in evaluating F&G and our common stock. The occurrence of any of the following risks could materially and adversely affect our business, financial condition, prospects, results of operations and cash flows. In such case, the trading price of F&G’s common stock could decline, and you could lose all or part of your investment.
The risk factors generally have been separated into the following 6 groups: risks related to our business; risks related to economic conditions and market conditions; legal, regulatory and tax risks; risks relating to our indebtedness and financing; risks related to the separation and distribution and our status as a subsidiary of FNF, and risks related to our common stock and preferred stock. However, these risks are not the only ones we face. Additional risks and uncertainties not presently known to us or that we currently deem immaterial may also materially affect our business, financial condition, results of operations and prospects.
Risks Related to Our Business
Our debt instruments may restrict our current and future operations, particularly our ability to respond to changes or to take certain actions.
At December 31, 2024, we had outstanding (i) $500 million in aggregate principal balance of our 6.250% F&G Senior Notes due 2034 (the “6.250% F&G Notes”), (ii) $550 million in aggregate principal of our 6.50% Senior Notes due 2029 (the 6.50% F&G Notes”), (iii) $345 million in aggregate principal of our 7.95% Senior Notes due 2053 (the “7.95% F&G Notes”), (iv) $500 million in aggregate principal of our 7.40% Senior Notes due 2028 (the “7.40% F&G Notes”) and (v) $300 million in aggregate principal of our 5.50% Senior Notes due 2025 (the “5.50% F&G Notes”). We also had an unsecured revolving credit agreement with Bank of America, N.A., as administrative agent, the lenders ( the “Lenders”) and guarantors party there-to and the other parties there-to (the “Credit Agreement”), which had no balance outstanding and $750 million of borrowing availability at December 31, 2024.
The Credit Agreement imposes operating and financial restrictions, including financial covenants, and the Credit Agreement and the indentures governing the 6.250% F&G Notes, the 6.50% F&G Notes, the 7.95% F&G Notes, the 7.40% F&G Notes and the 5.50% F&G Notes impose limitations. As a result of these restrictions, covenants and limitations, we may be limited in how we conduct our business, and we may be unable to raise additional debt or equity financing to compete effectively or take advantage of new business opportunities. We do not believe these restrictions, covenants or limitations will have a material impact on the Company’s current or future operations. However, our failure to comply with the restrictive covenants in existing or future debt instruments could result in an event of default, which, if not cured or waived, could result in our being required to repay outstanding indebtedness before their due date. If we are forced to refinance indebtedness on less favorable terms or are unable to refinance at all, our results of operations and financial condition could be materially adversely affected.
Our ability to grow depends in large part upon the continued availability of capital.
Our long-term strategic capital requirements will depend on many factors, including our accumulated statutory earnings and the relationship between our statutory capital and surplus and various elements of required capital. To support long-term capital requirements, we may need to increase or maintain statutory capital and surplus of our insurance subsidiaries through financing which could include debt, equity, financing arrangements or other surplus relief transactions. On June 24, 2022, FNF capitalized $400 million of intercompany indebtedness into common stock of F&G. FNF is not obligated to, may choose not to, or may not be able to provide financing or make capital contributions to us now or in the future. Consequently, financings, if available at all, may be available only on terms that are not favorable to us. Under a NPA with Kubera, in which we are a noteholder, and capital keep-well agreements with our reinsurance subsidiary, F&G Cayman Re, there is an obligation to provide financing to the extent of a funding shortfall on a reserve note facility. Adverse market conditions have affected and continue to affect the availability and cost of capital from external sources. If we cannot maintain adequate capital for our
insurance subsidiaries, or if we are obligated to provide capital contributions in the event of funding shortfalls, we may be required to limit growth in sales of new policies which could materially adversely affect our business, operations and financial condition.
A financial strength ratings downgrade, potential downgrade, or any other negative action by a rating agency could increase our cost of capital, making it challenging to grow our business, and could hinder our ability to participate in certain market segments, thereby adversely affecting our results of operations and our financial condition.
Various nationally recognized rating agencies review the financial performance and condition of insurers, including our insurance subsidiaries, and publish their financial strength ratings as indicators of an insurer’s ability to meet policyholder and contract holder obligations. These ratings are important to maintaining public confidence in our products, our ability to market our products and our competitive position. Downgrades, unfavorable changes in rating methodology or other negative action by a rating agency could have a material adverse effect on us in many ways, including the following:
•adversely affecting relationships with distributors, IMOs and sales agents, which could result in reduction of sales;
•increasing the number or amount of policy lapses or surrenders and withdrawals of funds;
•requiring a reduction in prices for our subsidiaries’ insurance products and services in order to remain competitive;
•excluding us from participating in the PRT business or FABN issuances;
•adversely affecting our ability to obtain reinsurance at a reasonable price, on reasonable terms or at all;
•requiring us to collateralize reserves, balances or obligations under certain reinsurance agreements. In the event of a withdrawal or downgrade of our S&P issuer credit rating to BB or lower, we are required to fund a note issued by a reinsurance counterparty up to $300 million. As of December 31, 2024, the amount funded under the note agreement was insignificant; and
•limiting our ability to hedge index risk inherent in the products offered due to Additional Termination Event (“ATE”) provisions in our ISDA/Credit Support Annex (“CSA”), which could allow counterparties to opt not to trade with us should our rating fall below a certain threshold. As of December 31, 2024, our ratings exceeded the ATE threshold in our ISDA/CSAs.
We may face losses if our actual experience differs significantly from our reserving assumptions.
Our profitability depends significantly upon the extent to which our actual experience is consistent with the assumptions used in setting rates for our products and establishing liabilities for future life insurance, annuity and PRT policy benefits and claims. However, due to the nature of the underlying risks and the high degree of uncertainty associated with the determination of the liabilities for unpaid policy benefits and claims, we cannot precisely determine the amounts we will ultimately pay to settle these liabilities. As a result, we may experience volatility in our reserves and, therefore, our profitability from period to period. To the extent that actual experience is less favorable than our underlying assumptions, we could be required to increase our reserves which may reduce our profitability and impact our financial strength.
We have been issuing GMWB products since 2008. In our reserve calculations, we make assumptions for policyholder behavior as it relates to GMWB utilization. If emerging experience deviates from our assumptions on GMWB utilization, it could have a significant effect on our reserve levels and related results of operations. We will continue to monitor the GMWB utilization assumption and update our best estimate as applicable.
Our valuation of investments and the determinations of the amounts of allowances and impairments taken on our investments may include methodologies, estimates and assumptions which are subject to differing interpretations and, if changed, could materially adversely affect our results of operations and financial condition.
Fixed maturities, equity securities and derivatives represent the majority of total cash and invested assets reported at fair value on our balance sheet. Fair value is defined as the price that would be received to sell an asset or paid to transfer a liability in an orderly transaction between market participants at the measurement date (an exit price). Fair value estimates are made based on available market information and judgments about the financial instrument at a specific point in time. Expectations that our investments will continue to perform in accordance with their contractual terms are based on evidence gathered through our normal credit surveillance process and on assumptions a market participant would use in determining the current fair value.
The determination of current expected credit loss varies by investment type and is based upon our periodic evaluation and assessment of known and inherent risks associated with the respective asset class. Our management considers a wide range of factors about the instrument issuer (e.g., operations of the issuer and future earnings potential) and uses their best judgment in evaluating the cause of the decline in the estimated fair value of the instrument and in assessing the prospects for recovery. In addition, we conduct various quantitative credit screens on the investment portfolio to create a credit watchlist. The credit watchlist investments are then further analyzed by our portfolio managers for likelihood of loss of contractual principal and interest. Our portfolio managers also maintain a credit spotlight for investments that do not meet the quantitative screens. These investments have been identified as requiring a higher level of review and monitoring due to idiosyncratic risk. Such evaluations and assessments require significant judgment and are revised as conditions change and new information becomes available. Additional impairments may need to be taken in the future, and the ultimate loss may exceed management’s current estimate of impairment amounts.
The value and performance of certain of our assets are dependent upon the performance of collateral underlying these investments. It is possible the collateral will not meet performance expectations leading to adverse changes in the cash flows on our holdings of these types of securities.
See Note C - Investments to the Consolidated Financial Statements, including the notes thereto, in this Annual Report on Form 10-K for additional information about our investment portfolio.
Change in our evaluation of the recoverability of our deferred tax assets could materially adversely affect our results of operations and financial condition.
Deferred tax assets and liabilities are attributable to differences between the financial statement carrying amounts of existing assets and liabilities and their respective tax bases using enacted tax rates expected to be in effect during the years in which the basis differences reverse. Deferred tax assets, in essence, represent future savings of taxes that would otherwise be paid in cash. We are required to evaluate the recoverability of our deferred tax assets each quarter and establish a valuation allowance, if necessary, to reduce our deferred tax assets to an amount that is more-likely-than-not to be realizable. In determining the need for a valuation allowance, we consider many factors, including future reversals of existing taxable temporary differences, future taxable income exclusive of reversing temporary differences and carryforwards, taxable income in prior carryback years and implementation of any feasible and prudent tax planning strategies management would employ to realize the tax benefit.
Based on our current assessment of future taxable income, including available tax planning opportunities, we anticipate it is more-likely-than-not that we will generate sufficient taxable income to realize all of our deferred tax assets as to which we do not have a valuation allowance. If future events differ from our current assumptions, the valuation allowance may need to be increased, which could have a material adverse effect on our results of operations and financial condition.
We have recorded goodwill as a result of past acquisitions, and adverse events affecting the value of our reporting unit could cause the balance to become impaired, requiring write-downs that would reduce our operating income.
Current accounting rules require that goodwill be assessed for impairment annually or more frequently if changes in events or circumstances indicate that the fair value of our reporting unit may be less than its carrying value. Factors that may be considered a change in circumstance indicating the carrying value of goodwill may not be recoverable include, but are not limited to, significant underperformance relative to historical or projected future operating results, divestitures, and negative industry or economic trends. Evaluating this asset’s recoverability requires us to make estimates and assumptions to estimate the fair value of our reporting unit. For the years ended December 31, 2024 and 2023, no goodwill impairment charge was recorded. However, if there is an adverse event affecting the value of our reporting unit in the future, the carrying amount of our goodwill may no longer be recoverable, and we may be required to record an impairment charge, which would have a negative impact on our results of operations and financial condition. We will continue to monitor our operating results and the impact of the economy to determine if there is an impairment of goodwill in future periods.
If we are unable to attract and retain national marketing organizations and independent agents, sales of our products may be reduced.
We must attract and retain our network of IMOs and independent agents to sell our products. Insurance companies compete vigorously for productive agents. We compete with private equity investments as well as other life insurance companies for marketers and agents primarily on the basis of our financial position, support services, compensation and product features. If we are unable to attract and retain a sufficient number of marketers and agents to sell our products, our ability to compete and our revenues would suffer.
We operate in a highly competitive industry, which could limit our ability to gain or maintain our position in the industry and could materially adversely affect our business, financial condition and results of operations.
We operate in a highly competitive industry. We encounter significant competition in all of our product lines from other insurance companies, many of which have greater financial resources and higher financial strength ratings than us and which may have a greater market share, offer a broader range of products, services or features, assume a greater level of risk, have lower operating or financing costs, or have different profitability expectations than we do. Competition could result in, among other things, lower sales or higher lapses of existing products.
Our annuity products compete with indexed annuities and fixed rate annuities sold by other insurance companies and also with mutual fund products, traditional bank investments and other retirement funding alternatives offered by asset managers, banks and broker-dealers. The ability of banks and broker-dealers to increase their securities-related business or to affiliate with insurance companies may materially and adversely affect sales of all of our products by substantially increasing the number and financial strength of potential competitors. Our insurance products compete with those of other insurance companies, financial intermediaries and other institutions based on a number of factors, including premium rates, policy terms and conditions, service provided to distribution channels and policyholders, ratings by rating agencies, reputation and commission structures.
Our ability to compete is dependent upon, among other things, our ability to develop competitive and profitable products, our ability to maintain low unit costs, our maintenance of adequate financial strength ratings from rating agencies and our ability to attract and retain distribution channels to market our products, the competition for which is vigorous. We must anticipate and respond effectively to changes in customer preferences, new industry standards, evolving distribution models, disruptive technology developments and alternate business models. The evolving nature of consumer needs and preferences and improvements in technology could result in a reduction in consumer demand and in the prices of the products and services we offer. Our competitive position may be impacted if we are unable to deploy, in a cost effective and competitive manner, technology such as artificial intelligence and machine learning, or if our competitors collect and use data which we do not have the ability to access or use.
There is a risk that purchasers may be able to obtain more favorable terms and offerings from competitors, vendors or other third parties, including pricing and technology. Additionally, customers may turn to our competitors as a result of our or our client’s failure, or perceived failure, to deliver on customer expectations, product or service flaws, technology issues, gaps in operational support or other issues affecting customer
experience. As a result, competition may adversely affect the persistency of our policies, our ability to sell products and provide services, maintain client relationships, and our revenues and results of operations.
Concentration in certain states for the distribution of our products may subject us to losses attributable to economic downturns or catastrophes in those states.
For the year ended December 31, 2024, our top five states for the distribution of our products were Florida, California, Pennsylvania, Texas and Ohio, which together accounted for 38.7% of our premiums. Any adverse economic developments or catastrophes in these states could have an adverse impact on our business.
Concentration in one or more of our products may subject us to greater volatility of sales if such products experienced a significant decrease in sales.
We may experience greater volatility in our sales performance from period to period to the extent we have a high concentration of sales in one or more of our products and those products suffer a material decline (for whatever reason) in a particular period. We may not be able to increase the sales of other products at the same pace, or at all, to the extent there is a decrease in sales of our products that made up the majority of our sales in historical periods. As a result, decreased sales in high concentration products could adversely affect our financial condition, liquidity and results of operations.
With the addition of the retail bank and broker-dealer channels and our success in entering the PRT and funding agreement institutional markets, F&G has diversified our product and distribution capabilities from one primary channel to now five, and from one primary product to now six with our recent entrance into the RILA markets.
We are subject to the credit risk of our counterparties, including companies with whom we have reinsurance agreements or from whom we have purchased options.
We cede material amounts of insurance to other insurance companies through reinsurance. Accordingly, we bear credit risk with respect to our reinsurers. The failure, insolvency, inability or unwillingness of any reinsurer to pay under the terms of reinsurance agreements with us could materially adversely affect our business, financial condition, liquidity and results of operations. We regularly monitor the credit rating and performance of our reinsurance parties. Aspida Re, Wilton Re, Somerset and Everlake represent our largest third-party reinsurance counterparty exposures. As of December 31, 2024, the net amount recoverable from Aspida Re, Somerset, Everlake and Wilton Re were $7,844 million, $2,822 million, $1,168 million and $1,066 million, respectively. The risk of non-performance is mitigated with various forms of collateral or collateral arrangements, including secured trusts, funds withheld accounts and irrevocable letters of credit.
We are also exposed to credit loss in the event of non-performance by our counterparties on options. We seek to reduce the risk associated with such agreements by purchasing such options from large, well-established financial institutions, and by holding collateral. There can be no assurance we will not suffer losses in the event of counterparty non-performance. Several of our derivative counterparty ISDA agreements contain additional termination event triggers based on a downgrade of FGL Insurance. These triggers would give these counterparties the option to terminate our options, which could lead to losses if occurring at an inopportune time.
Please refer to “Management’s Discussion and Analysis of Financial Condition and Results of Operations” for additional details on credit risk and counterparty risk.
Our business could be interrupted or compromised if we experience difficulties arising from outsourcing relationships.
If we do not maintain an effective outsourcing strategy or third-party providers do not perform as contracted, we may experience operational difficulties, increased costs and a loss of business that could have a material adverse effect on our results of operations. If there is a delay in our third-party providers’ introduction of our new products or if our third-party providers are unable to service our customers appropriately, we may experience a loss of
business that could have a material adverse effect on our business, financial condition and results of operations. We have a formal vendor management program that follows a continuous lifecycle for all third-party providers. The lifecycle includes an initial risk assessment for new relationships to determine risk tier; vendor due diligence depending on the risk tier; contract management to effectively address all terms, conditions, duties and obligations, risks/issues identified; ongoing monitoring and management to ensure compliance with contract provisions and service level agreements; and termination/offboarding to ensure appropriate communication and any other requirements such as destruction of data.
If our key providers, distributors or other parties terminate important business arrangements with us, reduce their business with us or renew contracts on terms less favorable to us, which occurs from time to time, we may fail to meet our business objectives and targets, and our cash flows, results of operations and financial condition could be materially adversely affected.
In addition, our reliance on third-party service providers that we do not control does not relieve us of our responsibilities and contractual, legal and other requirements. Any failure or negligence by such third-party service providers in carrying out their contractual duties may result in us becoming subjected to liability to parties who are harmed and ensuing litigation. Any litigation relating to such matters could be costly, expensive and time-consuming, and the outcome of any such litigation may be uncertain. Moreover, any adverse publicity arising from such litigation, even if the litigation is not successful, could adversely affect our reputation and sales of our products.
The loss of key personnel could negatively affect our financial results and impair our ability to implement our business strategy.
Our success depends in large part on our ability to attract and retain qualified employees. Intense competition exists for key employees with demonstrated ability, and we may be unable to hire or retain such employees. Our key employees include senior management, sales and distribution professionals, actuarial, investment and finance professionals and information technology professionals. We do not believe the departure of any particular individual would cause a material adverse effect on our operations; however, the unexpected loss of several key employees could have a material adverse effect on our operations due to the loss of their skills, knowledge of our business, and their years of industry experience as well as the potential difficulty of promptly finding qualified replacement employees.
Our risk management policies and procedures may not capture unidentified or unanticipated risk, which could negatively affect our business or result in losses.
We believe we have developed risk management policies and procedures designed to manage material risks within established risk appetites and risk tolerances. Nonetheless, our policies and procedures may not effectively mitigate the internal and external risks identified or predict future exposures, which could be different or significantly greater than expected and which could result in unexpected monetary losses or cause damage to our reputation or additional costs, or which could impair our ability to conduct business effectively. Many of our methods of managing risk and exposures are based upon observed historical data, current market behavior, and certain assumptions made by management. This information may not always be accurate, complete, up-to-date, or properly evaluated. As a result, additional risks and uncertainties not currently known to us, or that we currently deem to be immaterial, may materially adversely affect our business, financial condition and results of operations.
F&G has a subsidiary focused on acquiring minority and/or majority ownership in indexed universal life and annuity Independent Marketing Organizations (“IMO”). While these acquisitions are intended to diversify our earnings, they present several risks that could adversely affect our business, financial condition and operating results.
Successfully integrating acquisitions into our existing operations involves significant challenges such as integrating IT systems, consolidating GAAP financials, aligning organizational cultures, and retaining key
personnel. Failure to effectively manage any of the integration processes could disrupt our operations and negatively impact our financial performance.
Our due diligence processes may not identify all potential liabilities and risks associated with acquisitions. This could result in unexpected financial and operational challenges post-acquisition, including regulatory non-compliance, undisclosed liabilities, or operational inefficiencies.
Changes in market conditions, regulatory landscapes, or operational environments could adversely impact performance. Additionally, any reputational issues or operational failures could affect our overall brand and market standing.
If acquisitions do not perform as expected, it could lead to financial losses, impairments of goodwill, and a negative impact on our earnings and capital position. Moreover, the use of our financial resources for acquisitions may limit our ability to invest in other strategic initiatives.
Our focus on acquisitions may divert management’s attention from our core operations and other priorities resulting in strategic misalignment.
Failure to comply with regulations during, or post-acquisition, can result in legal penalties, regulatory actions, or reputational damage, which could have a material, adverse effect on our business.
Interruption or other operational failures in telecommunication, information technology and other operational systems, or a failure to maintain the security, integrity, confidentiality or privacy of sensitive data residing on such systems, including as a result of human error, could result in a loss or disclosure of confidential information, damage to our reputation, monetary losses, additional costs and impairment of our ability to conduct business effectively.
We are highly dependent on automated and information technology systems to record and process our internal transactions and transactions involving our customers, as well as to calculate reserves, value invested assets and complete certain other components of our financial statements. The integrity of our computer systems and the protection of the information, including policy holder information, that resides on such systems are important to our successful operation. If we fail to maintain an adequate security infrastructure, adapt to emerging security threats or follow our internal business processes with respect to security, the information or assets we hold could be compromised. Further, even if we, or third parties to which we outsource certain information technology services, maintain a reasonable, industry-standard information security infrastructure to mitigate these risks, the inherent risk that unauthorized access to information or assets remains. This risk is increased by transmittal of information over the internet and the increased threat and sophistication of cyber criminals. While, to date, we believe that we have not experienced a material breach of our computer systems, the occurrence or scope of such events is not always apparent.
In addition, some laws and certain of our contracts require notification of various parties, including regulators, consumers or customers, in the event that confidential or personal information has or may have been taken or accessed by unauthorized parties. Such notifications can potentially result in, among other things, adverse publicity, diversion of management and other resources, the attention of regulatory authorities, the imposition of fines, and disruptions in business operations, the effects of which may be material. Any inability to prevent security or privacy breaches, or the perception that such breaches may occur, could inhibit our ability to retain or attract new clients and/or result in financial losses, litigation, increased costs, negative publicity, or other adverse consequences to our business.
Further, our financial institution clients have obligations to safeguard their information technology systems and the confidentiality of customer information. In certain of our businesses, we are bound contractually and/or by regulation to comply with the same requirements. If we fail to comply with these regulations and requirements, we could be exposed to suits for breach of contract, governmental proceedings or the imposition of fines. In addition, future adoption of more restrictive privacy laws, rules or industry security requirements by federal or state
regulatory bodies or by a specific industry in which we do business could have an adverse impact on us through increased costs or restrictions on business processes.
Security breaches like the June 2023 MOVEit incident and other disruptions to our information technology infrastructure could compromise Company, consumer and customer information, interfere with our operations, cause us to incur significant costs for remediation and enhancement of our IT systems and expose us to legal liability, all of which could have a substantial negative impact on our business and reputation.
In the ordinary course of business, we collect, process, transmit and store sensitive data, including intellectual property, proprietary business information and personally identifiable information. The secure operation of our information technology systems, and of the processing and maintenance of this information, is critical to our business operations and strategy. Despite our substantial investment in physical and technological security measures, our information technology infrastructure (or those of our third-party vendors and other service providers) are potentially vulnerable to unauthorized access to data or breaches of confidential information.
In June 2023, we were notified that PBI Research Services (“PBI”), a third-party vendor to F&G, was the victim of the security incident associated with the MOVEit file transfer system. PBI provides services to F&G and other companies in the insurance industry, including services to satisfy certain regulatory obligations related to identifying the deaths of insured persons that may trigger the payment of certain insurance benefits. It was widely reported that numerous organizations around the world, including Fortune 500 companies, governmental agencies, and non-governmental organizations, were affected by a zero-day vulnerability in the MOVEit file transfer system. This vulnerability resulted in access to PBI’s instance of the MOVEit system and acquisition of certain data within the MOVEit system by an unauthorized third party. The incident did not affect any F&G systems, including any of F&G’s financial systems. In addition, the incident did not affect F&G’s ability to serve its customers.
Because our products and services involve the storage and transmission of personal information of consumers, we will continue to routinely be the target of attempted cyber and other security threats by outside third parties. Our increased dependence on third parties to store our data systems may also subject us to further cyber threats. In addition, a significant number of our employees continue to work from home and we believe this will continue into 2025 and future years. The remote work environment puts greater demands on our technological systems, puts us at greater risk of cybersecurity incidents and adds complexity to our programs that are designed to protect private data.
While we currently maintain cybersecurity insurance, such insurance may not be sufficient in type or amount to cover us against claims related to cybersecurity breaches or attacks, failures or other data security-related incidents, and we cannot be certain that cyber insurance will continue to be available to us on economically reasonable terms, or at all, or that an insurer will not deny coverage as to any future claim. The successful assertion of one or more claims against us that exceed available insurance coverage, or the occurrence of changes in our insurance policies, including premium increases or the imposition of large deductibles, could materially and adversely affect our financial condition, results of operations and cash flows.
Advancements in Artificial Intelligence, Machine Learning, and Large Language Models (“AI/ML/LLM”) pose risks and challenges.
Issues in the development and use of AI/ML/LLM, combined with an uncertain regulatory environment, may result in reputational harm, liability, or other adverse consequences to our business operations. As with many technological innovations, AI/ML/LLM presents risks and challenges that could impact our business. We may adopt and integrate generative artificial intelligence tools into our systems for specific use cases reviewed by legal and information security. Our vendors may incorporate generative artificial intelligence tools into their offerings without disclosing this use to us, and the providers of these generative artificial intelligence tools may not meet existing or rapidly evolving regulatory or industry standards with respect to privacy and data protection and may inhibit our or our vendors’ ability to maintain an adequate level of service and experience. If we, our vendors, or our third-party partners experience an actual or perceived breach or privacy or security incident because of the use of AI/ML/LLM, we may lose valuable intellectual property and confidential information and our reputation and the public perception of the effectiveness of our security measures could be harmed.
The new and emerging types of AI and their uses are very early stage in the industry and may be subject to many uncertain future developments and regulations.
Regulatory agencies are evaluating existing regulatory frameworks for insurance industry wide use of AI. New AI algorithms and predictive models may be used by insurance companies in the development, administration and sales of insurance products to consumers. However, the use of new artificial intelligence models may make insurance companies more susceptible to potential bias, discrimination, and data security risks. These concerns could lead to development of new, or modifications to, laws and regulations pertaining to the use of Artificial Intelligence by insurance companies, or the broader financial services sector, that may prove to be onerous for companies to implement in a timely manner.
We rely on our investment management advisory agreements (“IMA”) with Blackstone ISG-I Advisors LLC (“BIS”) and other investment managers and sub-managers for the management of portions of certain of our life insurance companies’ investment portfolios.
Our insurance company subsidiaries are parties to IMAs with BIS and other investment managers and sub-managers. These entities depend in large part on their ability to attract and retain key people, including senior executives, finance professionals and information technology professionals. Intense competition exists for key employees with demonstrated ability, and our investment managers may be unable to hire or retain such employees. The unexpected loss by any of our investment managers, including BIS, of key employees could have a material adverse effect on their ability to manage our investment portfolio and have an adverse impact on our investment portfolio and results of operations.
We have a long-term contractual relationship with BIS that limits our ability to terminate this relationship or retain another investment manager without BIS’s consent.
Under an omnibus termination side letter among us, FNF and BIS, we have agreed with BIS not to allow other investment managers to be appointed or retained to provide investment management or advisory services to our annuity and life insurance subsidiaries without BIS’s consent. Although BIS has consented to the engagement of other investment managers in the past, BIS has no obligation to do so in the future.
Each of our subsidiaries that is party to an IMA with BIS may terminate such agreement upon 30 days’ notice. BIS may also terminate any IMA upon 30 days’ notice. However, we and FNF have agreed in the omnibus termination side letter to cause our insurance company subsidiaries to engage BIS as an investment manager. The initial term of this side letter expires on June 1, 2029, and contains an automatic renewal provision which provides for successive two-year terms thereafter. Prior to June 1, 2029, we and FNF may only terminate the side letter for cause. Cause is generally limited to circumstances where BIS is legally unable to manage our assets, if BIS fails to offer us “most favored nations” rights with respect to certain products it may issue to third parties, or where BIS has acted with gross negligence, willful misconduct or reckless disregard of its obligations. In addition, at the expiration of the initial term of the side letter in 2029, or at the end of any renewal term, we may, with prior notice, terminate the side letter for unsatisfactory long-term performance by BIS based on underperformance. If we provide any such notice, the termination will not become effective for one year, during which time BIS may seek to cure the events giving arise to our termination right. If one of our subsidiaries were to terminate an IMA or take other actions that we have agreed will not be taken under the omnibus termination side letter, we and FNF may be in breach of our respective obligations to BIS under such side letter.
The historical performance of BIS, or any other asset manager we engage, should not be considered as indicative of the future results of our investment portfolio, our future results or any returns expected on our common stock.
Our investment portfolio’s returns have benefited historically from investment opportunities and general market conditions that may not continue or currently exist, or may not be repeated, and there can be no assurance that BIS will be able to avail itself of profitable investment opportunities in the future. In addition, because BIS is
compensated based solely on our assets which it manages, rather than by investment return targets, BIS is not directly incentivized to maximize investment return targets. Accordingly, there can be no guarantee that BIS will be able to achieve, or seek to achieve, any particular returns for our investment portfolio in the future.
Increased regulation or scrutiny of alternative investment advisers, arrangements with such investment advisers and investment activities may affect BIS’s or, if engaged, any other asset manager’s ability to manage our investment portfolio or impact the reputation of our business.
The regulatory environment for investment managers is evolving, and changes in the regulation of investment managers may adversely affect the ability of BIS to effect transactions that utilize leverage or pursue their strategies in managing our investment portfolio. BIS, in conjunction with its investment managers, continuously monitors the ongoing regulatory conversations. In addition, the securities and futures markets are subject to comprehensive statutes, regulations and margin requirements. The SEC, other regulators and self-regulatory organizations and exchanges are authorized to take extraordinary actions in the event of market emergencies. Due to our reliance on these relationships in particular to manage a significant portion of our investment portfolio, any regulatory action or enforcement against BIS could have an adverse effect on our financial condition.
In addition, the NAIC continues to consider the nature of the relationships between insurance companies and their investment advisors and investment managers, and more broadly the impact of private equity within the insurance industry. We are continuing to monitor the development of any proposals that could have a material impact on the contractual relationships between us and BIS.
Risks Related to Economic Conditions and Market Conditions
Conditions in the economy generally could adversely affect our business, results of operations and financial condition.
Our results of operations are materially affected by conditions in the U.S. economy. Adverse economic conditions may result in a decline in revenues and/or erosion of our profit margins. In addition, in the event of extreme prolonged market events and economic downturns, we could incur significant losses. Even in the absence of a market downturn we are exposed to substantial risk of loss due to market volatility.
Factors such as consumer spending, business investment, government spending, the volatility and strength of the capital markets, investor and consumer confidence, foreign currency exchange rates, commodity prices, inflation levels, changes in trade policy, tariffs and trade sanctions on goods, trade wars, United States-China relations and supply chain disruptions all affect the business and economic environment and, ultimately, the amount and profitability of our business. In an economic downturn characterized by higher unemployment, lower family income, negative investor sentiment and lower consumer spending, the demand for our insurance products could be adversely affected. Under such conditions, we may also experience an elevated incidence of policy lapses, policy loans, withdrawals and surrenders. In addition, our investments could be adversely affected as a result of deteriorating financial and business conditions affecting the issuers of the securities in our investment portfolio.
As of December 31, 2024, current economic conditions, including high inflation rates, have not adversely affected our business, results of operations and financial condition. However, we cannot predict if it will impact our business, results of operations and financial condition in the future for the forgoing reasons.
Please refer to “Management’s Discussion and Analysis of Financial Condition and Results of Operations — Business Trends and Conditions” for additional details on economic conditions and market conditions that may impact our business.
Our investments are subject to geopolitical risk. The on-going conflicts in Russia, Ukraine and the Middle East may adversely affect our business, financial condition, results of operations and cash flows.
While we have no exposure to investments in Russia or Ukraine, we have de minimis exposure in the Middle East and the surrounding regions. If the conflicts and their inflationary impact leads to a wider recession or other restrictive actions by the United States and/or other countries, our investments could suffer losses, which could have a negative impact on our financial results.
The current invasion of Ukraine by Russia has escalated tensions among the United States, the North Atlantic Treaty Organization (“NATO”) and Russia. The United States and other NATO member states, as well as non-member states, have announced new sanctions against Russia and certain Russian banks, enterprises and individuals. These and any future additional sanctions and any resulting conflict between Russia, the United States and NATO countries could have an adverse impact on our current operations because they could cause declining conditions in worldwide credit and capital markets and the economy in general. Further, such invasion, ongoing military conflict, resulting sanctions and related countermeasures by NATO states, the United States and other countries are likely to lead to market disruptions, including significant volatility in the credit and capital markets, which could have an adverse impact on our operations and financial performance.
The ongoing armed conflicts in and around the Middle East may negatively impact the business environment, both within and outside of Israel, including due to reluctance of foreign investors to invest or transact business, as well as to increased currency fluctuations, downgrades in credit rating, increased interest rates, increased volatility in security markets, and other changes in macroeconomic conditions. To the extent that any of these negative developments do occur, they may have an adverse effect on our business, results of operations and financial condition.
Our investments are subject to market risks that could be heightened during periods of extreme volatility or disruption in financial and credit markets.
Our invested assets and derivative financial instruments are subject to risks of credit defaults and changes in market values. Periods of extreme volatility or disruption in the financial and credit markets could increase these risks. Changes in interest rates and credit spreads could cause market price and cash flow variability in the fixed income instruments in our investment portfolio. Significant volatility and lack of liquidity in the credit markets could cause the market value of the fixed-income securities we own to decline. Further, if our investment manager, BIS, fails to react appropriately to difficult market or economic conditions, our investment portfolio could incur material losses.
Our investments are subject to credit risks of the underlying issuer, borrower, or physical collateral which can change over time with the credit cycle.
A worsening business climate, recession, or changing trends could cause issuers of the fixed-income securities that we own to default on either principal or interest payments. Additionally, market price valuations may not accurately reflect the underlying expected cash flows of securities within our investment portfolio.
The value of our mortgage-backed securities and our commercial and residential mortgage loan investments depends in part on the financial condition of the borrowers and tenants for the properties underlying those investments, as well as general and specific economic trends affecting the overall default rate. We are also subject to the risk that cash flows resulting from the payments on pools of mortgages that serve as collateral underlying the mortgage-backed securities we own may differ from our expectations in timing or size. Historically, we have not experienced material credit losses; however, any event reducing the estimated fair value of these securities, other than on a temporary basis, could have an adverse effect on our business, results of operations, liquidity and financial condition.
We also maintain holdings in floating rate, and less rate-sensitive investments, including senior tranches of CLOs and directly originated senior secured loans. If realized collateral loss and recoveries differ materially from our assumptions, returns on these assets could be lower than our expectation.
We invest in ABS (traditional and specialty finance) and asset-backed and consumer whole loans. Consumer balance sheets are healthy and underwriting standards have become more conservative following the Global Financial Crisis. However, high inflation rates have been a headwind for consumers, and efforts by the Federal Reserve to stem inflation could induce a recession which would have an adverse impact on consumers and potentially increase delinquencies to a higher level than what is assumed in our underwriting.
Interest rate fluctuations could adversely affect our business, financial condition, liquidity and results of operations.
Interest rate risk is a significant market risk for us, as our business involves issuing interest rate sensitive obligations backed primarily by investments in fixed income assets. As of December 31, 2024, we also maintained approximately 21% of the assets in our investment portfolio in floating rate investments. We have executed some variable interest rate credit agreements, floating rate funding agreements and pay-float and receive-fixed interest rate swaps to reduce market risks from interest rate changes on our earnings associated with our floating rate investments. All of these assets are subject to an element of market risk from changes in interest rates.
Prior to 2022, interest rates had been at or near historical low levels over the preceding several years. A prolonged period of low rates exposes us to the risk of not achieving returns sufficient to meet our earnings targets and/or our contractual obligations. Furthermore, low or declining interest rates may reduce the rate of policyholder surrenders and withdrawals on our life insurance and annuity products, thus increasing the duration of the liabilities, creating asset and liability duration mismatches and increasing the risk of having to reinvest assets at yields below the amounts required to support our obligations. Lower interest rates may also result in decreased sales of certain insurance products, negatively impacting our profitability from new business.
Since March 2022, the Federal Reserve has increased the Federal Funds (“Fed Funds”) rate 11 times from approximately 0% to approximately 5.50% before pausing in the latter half of 2023. In September 2024, the Federal Reserve began reducing the Fed Funds rate ending 2024 at approximately 4.5%. Over the period since March 2022, market rates across the yield curve have risen. During periods of increasing interest rates, we may offer higher crediting rates on interest-sensitive products, such as universal life insurance and fixed annuities, and we may increase crediting rates on in-force products to keep these products competitive. We may be required to accept lower spread income (the difference between the returns we earn on our investments and the amounts we credit to contract holders), thus reducing our profitability, as returns on our portfolio of invested assets may not increase as quickly as current interest rates. Rapidly rising interest rates may also expose us to the risk of financial disintermediation, which is an increase in policy surrenders, withdrawals and requests for policy loans as customers seek to achieve higher returns elsewhere, requiring us to liquidate assets in an unrealized loss position. If we experience unexpected withdrawal activity, we could exhaust our liquid assets and be forced to liquidate other less liquid assets such as limited partnership investments. We may have difficulty selling these investments in a timely manner and/or be forced to sell them for less than we otherwise would have been able to realize, which could have a material adverse effect on our business, financial condition or operating results. We have developed and maintain ALM programs and procedures that are, we believe, designed to mitigate interest rate risk by matching asset cash flows to expected liability cash flows, and robust inflows provide additional opportunities to allocate in force assets in support of news business, further mitigating potential losses due to disintermediation risk. In addition, we assess surrender charges on withdrawals in excess of allowable penalty-free amounts that occur during the surrender charge period. The significant new business written in recent years strengthens the surrender charge protection since the surrender charges are highest in the early years of a policy. There can be no assurance that actual withdrawals, contract benefits, and maturities will match our estimates. Despite our efforts to reduce the impact of rising interest rates, we may be required to sell assets to raise the cash necessary to respond to an increase in surrenders, withdrawals and loans, thereby realizing capital losses on the assets sold.
Liabilities that are held on our balance sheet at fair value, including embedded derivatives on our Indexed Annuity and IUL business and market risk benefits (“MRB”) on our indexed annuity and fixed rate annuity business, are sensitive to fluctuations in interest rates. Decreases in interest rates generally would have the impact of increasing the value of these liabilities, which will result in a reduction in our net income. Liabilities for future policy benefits (“FPB”) are valued using locked-in discount rates, and any changes in interest rates since the inception of those contracts are reflected in AOCI. Decreases in interest rates would result in a reduction in our AOCI. In addition, certain statutory capital and reserve requirements are based on formulas or models that consider interest rates and a prolonged period of low interest rates may increase the statutory capital we are required to hold as well as the amount of assets we must maintain to support statutory reserves.
As of December 31, 2024, current economic conditions, including higher interest rates, have not adversely affected our business, results of operations and financial condition. However, we cannot predict if it will impact our business, results of operations and financial condition in the future for the forgoing reasons. Higher interest rates have decreased the fair value of our investment security portfolio, primarily our fixed maturity securities, as of December 31, 2024 and December 31, 2023, resulting in our AOCI being a loss of $1.9 billion and $2.0 billion, respectively. See “Quantitative and Qualitative Disclosure about Market Risk” in this Annual Report on Form 10-K for a more detailed discussion of interest rate risk.
Equity market volatility could negatively impact our business.
The estimated cost of providing guaranteed minimum withdrawal benefit riders associated with our annuity products incorporates various assumptions about the overall performance of equity markets over certain time periods. Periods of significant and sustained downturns in equity markets or increased equity volatility could result in an increase in the valuation of the MRBs or contractholder funds liabilities associated with such products, resulting in a reduction in our revenues and net income.
We are exposed to liquidity risk as a result of our other risks.
We are exposed to liquidity risk, which is the risk that we are unable to meet near-term obligations as they come due.
Liquidity risk is a manifestation of events that are driven by other risk types, including market, insurance, investment or operational risks. A liquidity shortfall may arise in the event of insufficient funding sources or an immediate and significant need for cash or collateral. In addition, it is possible that expected liquidity sources, such as our minimum cash buffers, funding agreements through the FHLB or other credit facilities, may be unavailable or inadequate to satisfy the liquidity demands described below.
We have the following sources of liquidity exposure and associated drivers that trigger material liquidity demand. Those sources are:
•Derivative collateral market exposure: abrupt changes to interest rate, equity, and/or currency markets may increase collateral requirements to counterparties and create liquidity risk for us.
•Asset liability mismatch: there are liquidity risks associated with liabilities coming due prior to the matching asset cash flows.
•Insurance cash flows: we face potential liquidity risks from unexpected cash demands due to severe mortality calamity, customer withdrawals, policy loans or lapse events. If such events were to occur, we may face unexpectedly high levels of claim payments to policyholders.
•FHLB collateral: we issue funding agreements to the FHLB for which eligible securities collateral is posted. If the value of the eligible securities declines significantly, and there is no available eligible security collateral in the portfolio, we may need to supplement the collateral account with cash.
•Kubera NPA: we issued a variable note purchase agreement to Kubera for which we may be liable to fund any shortfall in Kubera’s ability to pay its obligations under the amended reinsurance agreement with FGL Insurance, assuring such principal up to $300 million is timely paid.
•Holding Company Liquidity: as a holding company, we are required to make interest and expense payments to satisfy obligations. The holding company’s cash position is targeted at the minimum of two times fixed charge coverage ratio on an annual basis.
Our business could be materially and adversely affected by the occurrence of a catastrophe, including natural or man-made disasters.
Any catastrophic event, such as pandemic diseases, terrorist attacks, floods, severe storms or hurricanes or computer cyber-terrorism, could have a material and adverse effect on our business in several respects:
•any such event could have a material adverse effect on our liquidity, financial condition and the operating results of our insurance business due to its impact on the economy and financial markets;
•we could experience long-term interruptions in the services provided by our significant vendors due to the effects of catastrophic events;
•some of our operational systems are not fully redundant, and our disaster recovery and business continuity planning cannot account for all eventualities. Additionally, unanticipated problems with our disaster recovery systems could further impede our ability to conduct business, particularly if those problems affect our computer-based data processing, transmission, storage and retrieval systems and destroy valuable data;
•how we manage our financial exposure for losses with third-party reinsurance and catastrophic events could adversely affect the cost and availability of that reinsurance; and
•the value of our investment portfolio may decrease if the securities in which we invest are negatively impacted by climate change (both transition risk and physical risk), pandemic diseases, severe weather conditions and other catastrophic events.
Natural and man-made catastrophes, pandemics (including COVID-19) present risks that could materially adversely affect our results of operations or the mortality or morbidity experience of our business. In addition, our business operations may be adversely affected by the increased risk of malicious and terrorist acts, as evidenced by recent incidents such as the New Orleans attack and Las Vegas explosion, which could disrupt our operations or the safety of our employees or customers. Claims arising from such events could have a material adverse effect on our business, operations and financial condition, either directly or as a result of their effect on our reinsurers or other counterparties. Such events could also have an adverse effect on the rate and amount of lapses and surrenders of existing policies, as well as sales of new policies.
While we believe we have taken steps to identify and mitigate these types of risks, such risks cannot be reliably predicted, nor fully protected against even if anticipated. In addition, such events could result in overall macroeconomic volatility or specifically a decrease or halt in economic activity in large geographic areas, adversely affecting the marketing or administration of our business within such geographic areas or the general economic climate, which in turn could have an adverse effect on our business, results of operations and financial condition. The possible macroeconomic effects of such events could also adversely affect our asset portfolio.
Our business is subject to risk due to our owned distribution strategy and investments in distribution consolidators.
Our owned distribution strategy, including our investments in minority and majority stakes in various NMGs and other distribution consolidators, exposes us to operational, financial, and strategic risks. These investments, including stakes in Syncis Holdings, DCMT Worldwide, a majority interest in Roar, and a wholly-owned interest in PALH, represent a significant component of our distribution strategy. The success of this strategy depends on the continued growth and performance of these businesses, which is subject to challenges such as the retention and performance of agents, market demand in cultural communities, and our ability to integrate these entities effectively into our broader operations. Furthermore, as industry consolidation among independent agent distribution channels accelerates, competition to acquire and partner with high-performing platforms intensifies, limiting our ability to secure attractive investment opportunities. Our ownership stakes also expose us to financial risks, including the potential for impairment of goodwill or intangible assets if these entities underperform, as well as regulatory and
compliance risks related to licensing and fiduciary standards. These factors, combined with the operational challenges of managing both majority and minority investments, create risks that could materially and adversely affect our financial performance, competitive position, and long-term growth prospects.
Legal, Regulatory and Tax Risks
Our business is highly regulated and subject to numerous legal restrictions and regulations.
Insurance businesses are subject to extensive regulation by state insurance authorities in each state in which they operate. Most states also regulate insurance holding companies like us with respect to acquisitions, changes of control and the terms of transactions with our affiliates. In addition, we may incur significant costs in the course of complying with regulatory requirements.
State insurance regulators, the NAIC and federal regulators continually reexamine existing laws and regulations and may impose changes in the future. New interpretations of existing laws and the passage of new legislation may harm our ability to sell new policies, increase our claim exposure on policies we issued previously and adversely affect our profitability and financial strength. We are also subject to the risk that compliance with any particular regulator’s interpretation of a legal or accounting issue may not result in compliance with another regulator’s interpretation of the same issue, particularly when compliance is judged in hindsight. Regulators and other authorities have the power to bring administrative or judicial proceedings against us, which could result in, among other things, suspension or revocation of our licenses, cease and desist orders, fines, civil penalties, criminal penalties or other disciplinary action, which could materially harm our results of operations and financial condition.
We cannot predict what form any future changes in these or other areas of regulation affecting the insurance industry might take or what effect, if any, such proposals might have on us if enacted into law. In addition, because our activities are relatively concentrated in a small number of lines of business, any change in law or regulation affecting one of those lines of business could have a disproportionate impact on us as compared to other more diversified insurance companies.
Please refer to “Business-Regulation of F&G” included in this Annual Report on Form 10-K for additional details on the impact of regulations on our business.
Our business is subject to government regulation in each of the jurisdictions in which we conduct business and regulators have broad administrative and discretionary authority over our business and business practices.
Our business is subject to government regulation in each of the states in which we conduct business, along with the District of Columbia and Puerto Rico, and is concerned primarily with the protection of policyholders and other customers. Such regulation is vested in state agencies having broad administrative and discretionary authority, which may include, among other things, premium rates and increases thereto, underwriting practices, reserve requirements, marketing practices, advertising, privacy, policy forms, reinsurance reserve requirements, acquisitions, mergers and capital adequacy. At any given time, we and our insurance subsidiaries may be the subject of a number of ongoing financial or market conduct, audits or inquiries. From time to time, regulators raise issues during such examinations or audits that could have a material impact on our business.
Under insurance guaranty fund laws in most states, insurance companies doing business therein can be assessed up to prescribed limits for policyholder losses incurred by insolvent companies. We cannot predict the amount or timing of any such future assessments and therefore the liability we have established for these potential assessments may not be adequate. In addition, regulators may change their interpretation or application of existing laws and regulations, including, for example, broadening the scope of carriers that must contribute towards long-term care insolvencies.
Our business in the United States is regulated by the National Association of Insurance Commissioners (“NAIC”), which continues to consider reforms including relating to cybersecurity regulations, best interest standards, risk-based capital (“RBC”) and life insurance reserves.
Although our business is subject to regulation in each state in which we conduct business, along with the District of Columbia and Puerto Rico, in many instances the state regulatory models emanate from the NAIC. Some of the NAIC pronouncements, particularly as they affect accounting issues, take effect automatically in the various states without affirmative action by the states. Statutes, regulations and interpretations may be applied with retroactive impact, particularly in areas such as accounting and reserve requirements. The NAIC continues to work to reform state regulation in various areas, including comprehensive reforms relating to cybersecurity regulations, best interest standards, RBC and life insurance reserves.
We and our insurance subsidiaries are subject to minimum capitalization requirements based on RBC formulas for life insurance companies that establish capital requirements relating to insurance, business, asset, interest rate and certain other risks. Changes to statutory reserve or RBC requirements may increase the amount of reserves or capital we and our insurance subsidiaries are required to hold and may impact our ability to pay dividends. In addition, changes in statutory reserve or RBC requirements may adversely impact our financial strength ratings. Changes currently under consideration include adding an operational risk component, factors for asset credit risk, and group wide capital calculations. See “—Risks Related to our Business—A financial strength ratings downgrade, potential downgrade, or any other negative action by a rating agency could increase our cost of capital, making it challenging to grow the business, and could hinder our ability to participate in certain market segments, thereby adversely affect our financial condition and results of operations” for a discussion of risks relating to our financial strength ratings.
Current and emerging developments relating to market conduct standards for the financial industry emerging from the United States Department of Labor’s (“DOL”) implementation of the “fiduciary rule” may over time materially affect our business.
In December 2020, the DOL issued its final version of an investment advice rule replacing the previous “Fiduciary Rule” that had been challenged by industry participants and vacated in March 2018 by the United States Fifth Circuit Court of Appeals. The new investment advice rule reinstates the five-part test for determining whether a person is considered a fiduciary for purposes of the Employee Retirement Income Security Act of 1974 (“ERISA”) and the Internal Revenue Code of 1986, as amended (the “Code”), and sets forth a new exemption, referred to as prohibited transaction class exemption (“PTE”) 2020-02. The rule’s preamble also contains the DOL’s reinterpretation of elements of the five-part test that appears to encompass more insurance agents selling IRA products and withdraws the DOL’s longstanding position that rollover recommendations out of employer plans are not subject to ERISA. The new rule took effect on February 16, 2021. The DOL left in place PTE 84-24, which is a longstanding class exemption providing prohibited transaction relief for insurance agents selling annuity products, provided that certain disclosures are made to the plan fiduciary, which is the policyholder in the case of an IRA, and certain other conditions are met. Among other things, these disclosures include the agent’s relationship to the insurer and commissions received in connection with the annuity sale. We, along with FGL Insurance and FGL NY Insurance, designed and launched a compliance program in January 2022 requiring all agents selling IRA products to submit an acknowledgment with each IRA application indicating the agent has satisfied PTE 84-24 requirements on a precautionary basis in case the agent acted or is found to have acted as a fiduciary. Meanwhile, the DOL has publicly announced its intention to consider future rulemaking that may revoke or modify PTE 84-24.
On April 23, 2024, following previous attempts to expand fiduciary regulation for advisers, the DOL released a new rule, the New Fiduciary Rule, which significantly broadens the definition of “fiduciary” under ERISA and Section 4975 when advisers provide investment recommendations to plans subject to ERISA and Section 4975 of the Code. Among other requirements, the New Fiduciary Rule provides that any person will be an investment advice fiduciary if such person provides investment advice or makes an investment recommendation to a retirement investor (i.e., a plan, a discretionary plan fiduciary, a plan participant or beneficiary, an IRA, an IRA owner or
beneficiary, or an IRA fiduciary) for a fee or other compensation, the person makes professional investment recommendations to investors on a regular basis as part of their business, and the recommendation is provided under circumstances that would indicate to a reasonable investor in like circumstances that the recommendation is based on a review of the particular needs or individual investor circumstances of the retirement investor, reflects the application of professional or expert judgment to the retirement investor’s particular needs or individual circumstances, and may be relied upon by the retirement investor as intended to advance the retirement investor’s best interest. Unlike the current ERISA standard, the New Fiduciary Rule subjects non-discretionary investment advice to retirement plans and accounts under the care and loyalty standards that also apply to investment advisors with discretionary authority or control over such plans and accounts. In addition, on the same date, the DOL issued amended versions of PTE 2020-02 and PTE 84-24, either or both of which provide prohibited transaction exemptive relief to insurance companies and insurance producers who make insurance product recommendations to retirement investors, subject to certain conditions. The New Fiduciary Rule likely means that certain of the Company’s agents will be considered fiduciaries for purposes of ERISA and the Code, subjecting the Company, and the insurance industry on the whole, to greater regulatory risk.
The DOL’s new Fiduciary Rule, which was scheduled to become effective on September 23, 2024, has been challenged. On July 25, 2024, in the case of Federation of Americans for Consumer Choice, Inc., et al. v. United States Department of Labor, et al., (“Federation of Americans”) the United States District Court for the Eastern District of Texas issued an order staying the effective date of the DOL’s final fiduciary rule (and related amendments to PTE 84-24) that was issued in March 2024. The District Court, in part relying on the Supreme Court’s recent ruling in Loper Bright Enterprises v. Raimondo, found that the plaintiffs (primarily insurance agents) were likely to succeed on their arguments that the Final Rule improperly expanded the definition of an “investment advice fiduciary” under ERISA. As a result, the Final Rule’s original effective date of September 23, 2024 has been delayed until further notice.
In addition, on July 26, 2024, a companion case to Federation of Americans filed in the United States District Court for the Northern District of Texas, American Council of Life Insurers, et al. v. United States Dep’t of Labor, et al., held the remaining PTE amendments included in the Final Rule (PTEs 2020-02, 75-1, 77-4, 80-83, 83-1 and 86-128) that were not challenged in Federation of Americans were also stayed, noting that the Northern District fully agreed with the Eastern District’s analysis and decision to stay the effective date of the Final Rule.
On September 20, 2024, the DOL appealed both rulings to the Fifth Circuit Court of Appeals. On February 11, 2025, the DOL filed an unopposed motion to hold the appeals in abeyance to allow new agency officials time to become familiar with the issues in these cases and determine how they wish to proceed. The motion was granted so the appeals are in abeyance. A Fifth Circuit reversal of the Texas district court rulings could have harmful effects on the insurance industry, creating additional hurdles to operate our business.
Management believes these current and emerging developments relating to market conduct standards for the financial services industry may, over time, materially affect the way in which our agents do business, the role of IMOs, sale of IRA products including IRA-to-IRA and employer plan rollovers, how we supervise our distribution force, compensation practices and liability exposure and costs. In addition to implementing the compliance procedures described above, management is monitoring further developments closely and will be working with IMOs and distributors to adapt to these evolving regulatory requirements and risks.
Please refer to “Business-Regulation of F&G” for additional details on the DOL’s “Fiduciary Rule.”
Our regulation in Bermuda and the Cayman Islands may limit or curtail our activities, and changes to existing regulations may affect our ability to continue to offer our existing products and services, or new products and services.
Our business is subject to regulation in Bermuda and the Cayman Islands, including the BMA and the CIMA. These regulations may limit or curtail our activities, including activities that might be profitable, and changes to existing regulations may affect our ability to continue to offer our existing products and services, or new products and services we may wish to offer in the future.
Our reinsurance subsidiary, F&G Life Re, is registered in Bermuda under the Bermuda Insurance Act and is subject to the rules and regulations promulgated thereunder. The BMA has sought regulatory equivalency, which enables Bermuda’s commercial insurers to transact business with the European Union (“EU”) on a “level playing field.” In connection with its initial efforts to achieve equivalency under the EU’s Directive (2009/138/EC) (“Solvency II”), the BMA implemented and imposed additional requirements on the companies it regulates. Effective 1 January 2015, Bermuda was placed on the NAIC’s List of Qualified Jurisdictions, which makes Bermuda-domiciled reinsurers that meet certain criteria to qualify as a certified reinsurer eligible for reduced reinsurance collateral requirements under the NAIC’s Credit for Reinsurance Model Law and Regulations as adopted by various states. F&G Life Re has been designated as a certified reinsurer in Iowa. The European Commission in 2016 granted Bermuda’s commercial insurers full equivalency in all areas of Solvency II for an indefinite period of time. Effective 1 January 2020, Bermuda was granted NAIC Reciprocal Jurisdiction status, which makes Bermuda domiciled reinsurers that satisfy certain conditions eligible to be designated as a reciprocal jurisdiction reinsurer. Under the NAIC’s Credit for Reinsurance Model Law and Regulations, which has been adopted by all states, a ceding insurer may take credit for reinsurance ceded to a reciprocal jurisdiction reinsurer without posting any collateral. F&G Life Re has been approved as a reciprocal jurisdiction reinsurer in Iowa.
Our reinsurance subsidiary, F&G Cayman Re, is a licensed Class D insurer in the Cayman Islands and a wholly owned direct subsidiary of ours, is licensed by the CIMA and is subject to supervision by CIMA. CIMA may, at any time, direct F&G Cayman Re, in relation to a policy, a line of business or the entire business, to cease or refrain from committing an act or pursing a course of conduct and to perform such acts as in the opinion of CIMA are necessary to remedy or ameliorate the situation.
Please refer to “Business-Regulation of F&G” for additional details on the regulations in Bermuda and the Cayman Islands.
The SECURE 2.0 Act of 2022 may impact our business and the markets in which we compete.
The Secure 2.0 Act of 2022, Division T of the Consolidated Appropriations Act, 2023 (“SECURE Act 2.0”), was signed into law on December 29, 2022, and went into effect as early as January 1, 2023, in certain respects. The SECURE Act 2.0 contains provisions that may impact our F&G insurance subsidiaries, and these changes could affect the desirability of IRAs, necessitate changes to our administrative system to implement the Act, and affect, to some extent, the length of time that IRA assets remain in our annuity products. These provisions include, for example, raising the age for required minimum distributions from IRAs from 72 to 73 (age 74 after 2032); additional exceptions to the 10% penalty tax for distributions before age 59-1/2; reduction of the penalty for failures to take a required distribution amount; directions to the SEC for new registration forms for registered index linked annuities; and directions to the DOL to revisit fiduciary standards relating to choosing an annuity provider in pension risk transfer transactions. While we cannot predict whether, or to what extent, the SECURE Act 2.0 will ultimately impact us, whether positive or negative, it may have implications for our business operations and the markets in which we compete.
The amount of statutory capital that our insurance subsidiaries have and the amount of statutory capital that they must hold to maintain their financial strength ratings and meet other requirements can vary significantly from time to time due to a number of factors outside of our control.
The financial strength ratings of our insurance subsidiaries are significantly influenced by their statutory surplus amounts and capital adequacy ratios. In any particular year, statutory surplus amounts and U.S. RBC ratios may increase or decrease depending on a variety of factors, most of which are outside of the control of each of our insurance subsidiaries, including, but not limited to, the following:
•the amount of statutory income or losses generated by such insurance subsidiary (which itself is sensitive to equity market and credit market conditions);
•the amount of additional capital such insurance subsidiary must hold to support business growth and changes to the RBC calculation methodologies;
•changes in statutory accounting or reserve requirements applicable to such insurance subsidiary;
•such insurance subsidiary’s ability to access capital markets to provide reserve relief;
•changes in equity market levels, interest rates, and market volatility;
•the value of certain fixed-income and equity securities in such insurance subsidiary’s investment portfolio;
•changes in the credit ratings of investments held in such insurance subsidiary’s portfolio; and
•the value of certain derivative instruments.
Rating agencies may also implement changes to their internal models, which differ from the RBC capital model and could result in such insurance subsidiary increasing or decreasing the amount of statutory capital it must hold in order to maintain its current financial strength ratings. In addition, rating agencies may downgrade the investments held in such insurance subsidiary’s portfolio, which could result in a reduction of its capital and surplus and its RBC ratio. To the extent that such insurance subsidiary’s U.S. RBC ratios are deemed to be insufficient, such insurance subsidiary may take actions either to increase its capitalization or to reduce the capitalization requirements. If such insurance subsidiary is unable to take such actions, the rating agencies may view this as a reason for a ratings downgrade.
The failure of any of our insurance subsidiaries to meet their applicable RBC requirements or minimum capital and surplus requirements could subject them to further examination or corrective action imposed by insurance regulators, including limitations on their ability to write additional business, supervision by regulators or seizure or liquidation. Any corrective action imposed could have a material adverse effect on such insurance subsidiary’s business, results of operations and financial condition. A decline in U.S. RBC ratios could be a factor in causing rating agencies to downgrade such insurance subsidiary’s financial strength ratings, which could have a material adverse effect on its business, results of operations and financial condition.
New accounting rules or changes to existing accounting standards could adversely impact our reported results of operations.
As a U.S.-based SEC registrant, F&G prepares its financial statements in accordance with GAAP, subject to the accounting-related rules and interpretations of the SEC. New accounting rules or changes in accounting standards, particularly those that specifically apply to insurance company operations, may impact F&G’s reported financial results and could cause increased volatility in reported earnings, resulting in other adverse impacts on F&G’s ratings and cost of capital, and decrease the understandability of F&G’s financial results as well as the comparability of F&G’s reported results with other insurers.
Changes in federal or state tax laws may affect sales of our products and profitability.
The annuity and life insurance products that we market generally provide the policyholder with certain federal income or state tax advantages. For example, federal income taxation on any increases in non-qualified annuity contract values (i.e., the “inside build-up”) is deferred until it is received by the policyholder. Non-qualified annuities are annuities that are not sold to a qualified retirement plan or are in the form of a qualified contract such as an IRA. With other savings investments, such as certificates of deposit and taxable bonds, the increase in value is generally taxed each year as it is realized. Additionally, life insurance death benefits and the inside build-up under life insurance contracts are generally exempt from income tax or are tax deferred.
From time to time, various tax law changes have been proposed that could have an adverse effect on our business, including the elimination of all or a portion of the income tax advantages described above for annuities and life insurance policies. For example, changes in tax law could reduce or eliminate the tax-deferred accumulation of earnings on the deposits paid by the holders of annuities and life insurance products, which could make such products less attractive to potential purchasers. Additionally, insurance products, including the tax favorable features of these products, generally must be approved by the insurance regulators in each state in which they are sold. This review could delay the introduction of new products or impact the features that provide for tax advantages and make such products less attractive to potential purchasers. A shift away from life insurance and annuity products could
reduce FGL Insurance’s and FGL NY Insurance’s income from the sale of such products, as well as the assets upon which FGL Insurance and FGL NY Insurance earn investment income. If legislation were enacted to eliminate the tax deferral for annuities or life insurance policies, such a change would have a material adverse effect on our ability to sell non-qualified annuities or life insurance policies.
Changes in tax law may increase our future tax liabilities and related compliance costs.
From time to time, the United States, as well as foreign, state and local governments, consider changes to their tax laws that may affect our future results of operations and financial condition. Also, the Organization for Economic Co-operation and Development has published reports and launched a global dialogue among member and non-member countries on measures to limit harmful tax competition. These measures are largely directed at counteracting the effects of tax havens and preferential tax regimes in countries around the world. Changes to tax laws could increase their complexity and the burden and costs of compliance. Additionally, such changes could also result in significant modifications to the existing transfer pricing rules and could potentially have an impact on our taxable profits as such legislation is adopted by participating countries.
We and our subsidiaries and affiliates are subject to reviews and audits by the Internal Revenue Service (“IRS”) and other taxing authorities from time to time, and the IRS or other taxing authority may challenge tax positions taken by us and our subsidiaries and affiliates. Responding to or defending against challenges from taxing authorities could be expensive and time consuming, and could divert management’s time and focus away from operating our business. We cannot predict whether and when taxing authorities will conduct an audit, challenge our tax positions or the cost involved in responding to any such audit or challenge. If our subsidiaries and affiliates are unsuccessful in defending against such challenges, they may be required to pay taxes for prior periods, interest, fines or penalties, and may be obligated to pay increased taxes in the future, all of which could have an adverse effect on our business, financial condition, results of operations or growth prospects.
The Inflation Reduction Act establishes, among other things, a new corporate alternative minimum tax of 15% on corporations that have an average adjusted financial statement income in excess of $1 billion over a three-year period and an excise tax of 1% on certain stock buy-backs by publicly-traded corporations. While we are continuing to evaluate the impact of these new provisions, as well as any regulations and legal decisions interpreting and applying them, we currently anticipate that their impact, if any, will not be material to our operating results, cash flows or statutory capital position.
The redemption of our preferred stock may require a significant amount of cash and may result in adverse tax consequences.
We have 5,000,000 shares of preferred stock outstanding as of December 31, 2024. Pursuant to the Certificate of Designations, on January 15, 2027, unless converted earlier in accordance with the terms of the certificate of designations, each share of the 6.875% Series A Mandatory Convertible Preferred Stock, par value $.0.001 per share, liquidation preference of $50.00 per share (“the FNF Preferred Stock”) will automatically convert into between 0.9456 shares and 1.1111 shares of common stock, in each case, subject to customary anti-dilution adjustments described in the certificate of designations. The number of shares of common stock issuable upon conversion will be determined based on the average volume weighted average price per share of common stock over the 20 consecutive trading day period beginning on, and including, the 21st scheduled trading day immediately prior to January 15, 2027. The FNF Preferred Stock is not subject to redemption at our option. The redemption of the FNF Preferred Stock and the payment of any excise tax could adversely affect the Company’s business, financial position and results of operations. In the event our assets are not sufficient to meet our redemption obligations, this could have a significant adverse effect on our reputation, business, financial condition, growth and ability to accomplish our strategic objectives.
We may be the target of future litigation, law enforcement investigations or increased scrutiny which may negatively affect our operations or financial strength or reduce profitability.
We, like other financial services companies, are involved in litigation and arbitration in the ordinary course of business. For further discussion on litigation and regulatory investigation risk, see Note N - Commitments and Contingencies to the Consolidated Financial Statements included in this Annual Report on Form 10-K.
From time to time, we receive inquiries and requests for information from state insurance departments, attorneys general and other regulatory agencies about various matters relating to our business. Sometimes these take the form of civil investigative demands or subpoenas. We cooperate with all such inquiries, and we have responded to or are currently responding to inquiries from multiple governmental agencies. Various governmental entities are studying the insurance product, market, pricing, and business practices, and potential regulatory and legislative changes, which may materially affect our business and operations. From time to time, we are assessed fines for violations of regulations or other matters or enter into settlements with such authorities, which may require us to pay fines or claims or take other actions.
More generally, we operate in an industry in which various practices are subject to scrutiny and potential litigation, including class actions. In addition, we sell our products through IMOs, whose activities may be difficult to monitor. Civil jury verdicts have been returned against insurers and other financial services companies involving sales, underwriting practices, product design, product disclosure, administration, denial or delay of benefits, charging excessive or impermissible fees, recommending unsuitable products to customers, breaching fiduciary or other duties to customers, refund or claims practices, alleged agent misconduct, failure to properly supervise representatives, relationships with agents or other persons with whom the insurer does business, payment of sales or other contingent commissions and other matters. Such lawsuits can result in substantial judgments and damage to our reputation that is disproportionate to the actual damages, including material amounts of punitive non-economic compensatory damages. In some states, juries, judges and arbitrators have substantial discretion in awarding punitive and non-economic compensatory damages, which creates the potential for unpredictable material adverse judgments or awards in any given lawsuit or arbitration. Arbitration awards are subject to very limited appellate review. In addition, in some class action and other lawsuits, financial services companies have made material settlement payments.
We may not be able to protect our intellectual property and may be subject to infringement claims.
We rely on a combination of contractual rights and copyright, trademark and trade secret laws to establish and protect our intellectual property. Although we use a broad range of measures to protect our intellectual property rights, third parties may infringe or misappropriate our intellectual property. We may have to litigate to enforce and protect our copyrights, trademarks, trade secrets and know-how or to determine their scope, validity or enforceability, which represents a diversion of resources that may be significant in amount and may not prove successful. The loss of intellectual property protection or the inability to secure or enforce the protection of our intellectual property assets could adversely impact our business and our ability to compete effectively.
We may be subject to costly litigation in the event that another party alleges our operations or activities infringe upon that party’s intellectual property rights. Third parties may have, or may eventually be issued, patents or other protections that could be infringed by our products, methods, processes or services or could otherwise limit our ability to offer certain product features. We may also be subject to claims by third parties for breach of copyright, trademark, trade secret or license usage rights. Any such claims and any resulting litigation could result in significant expense and liability for damages or we could be enjoined from providing certain products or services to our customers or utilizing and benefiting from certain methods, processes, copyrights, trademarks, trade secrets or licenses, or alternatively, we could be required to enter into costly licensing arrangements with third parties, all of which could have a material adverse effect on our business, results of operations and financial condition.
Changing rules, public disclosure regulations and stakeholder expectations on environmental, social and corporate governance (“ESG”) related matters create a variety of risks for our business.
In addition to the changing rules and regulations related to ESG matters imposed by governmental and self-regulatory organizations such as the SEC and the NYSE, a variety of third-party organizations, institutional investors and customers evaluate the performance of companies on ESG topics, and the results of these assessments are widely publicized. These changing rules, regulations and stakeholder expectations have resulted in, and are likely to continue to result in, increased general and administrative expenses and increased management time and attention spent complying with or meeting such regulations and expectations. Reduced access to or increased cost of capital may occur as financial institutions and investors increase or change expectations related to ESG matters.
Developing and acting on initiatives within the scope of ESG, and collecting, measuring and reporting ESG-related information and metrics can be costly, difficult and time consuming and is subject to evolving reporting standards. We may also communicate certain initiatives and goals, regarding environmental matters, diversity, social investments and other ESG-related matters, in our SEC filings or in other public disclosures. These initiatives and goals within the scope of ESG could be difficult and expensive to implement, the technologies needed to implement them may not be cost effective and may not advance at a sufficient pace, and we could be criticized for the accuracy, adequacy or completeness of the disclosure. If our ESG-related data, processes and reporting are incomplete or inaccurate, or if we fail to achieve progress with respect to our goals, including our previously announced commitments to reduce greenhouse gas emissions, within the scope of ESG on a timely basis, or at all, our reputation, business, financial performance and growth could be adversely affected.
In addition, in recent years “anti-ESG” sentiment has gained momentum across the U.S., with several states and Congress having proposed or enacted “anti-ESG” policies, legislation, or initiatives or issued related legal opinions, and the President having recently issued an executive order opposing diversity equity and inclusion (“DEI”) initiatives in the private sector. Such anti-ESG and anti-DEI-related policies, legislation, initiatives, litigation, legal opinions, and scrutiny could result in additional compliance obligations, investigations and enforcement actions, or reputational harm.
Risks Relating to Our Indebtedness and Financing
We are a holding company and depend on distributions from our subsidiaries for cash.
We are a holding company whose operating subsidiaries write insurance products that generate a net spread between their assets and liabilities (net of operating costs). Our ability to pay interest on our outstanding debt and our other obligations and to pay dividends is dependent on the ability of our subsidiaries to pay dividends or make other distributions or payments to us. If our operating subsidiaries are not able to pay dividends to us, we may not be able to meet our obligations or pay dividends on our common stock or preferred stock.
Our insurance subsidiaries are also subject to state laws or other regulations with respect to the payment of dividends. For example, the Iowa insurance law and the New York insurance law regulate the amount of dividends that may be paid in any year by FGL Insurance and FGL NY Insurance, respectively. Compliance with these state regulations will limit the amounts that FGL Insurance and FGL NY Insurance may dividend to us. Any dividends in excess of a threshold amount are subject to advance state notice or approval.
The maximum dividend permitted by law is not necessarily indicative of an insurer’s actual ability to pay dividends, which may be constrained by business and regulatory considerations, such as the impact of dividends on surplus, which could affect an insurer’s ratings or competitive position, the amount of premiums that can be written and the ability to pay future dividends. To the extent that we need funds and our subsidiaries are restricted from making such distributions under applicable law or regulation, or are otherwise unable to provide such funds, it could materially and adversely affect our liquidity and financial condition. Further, depending on business and regulatory conditions, we may in the future need to retain cash in our subsidiaries or even contribute cash to one or more of them in order to maintain their ratings or their statutory capital position. Such a requirement could be the result of
investment losses, reserve charges, adverse operating conditions in the current economic environment or changes in interpretation of statutory accounting requirements by regulators.
Risks Related to the Separation and Distribution and our Status as a Subsidiary of Fidelity National Financial, Inc. (“FNF”)
Although we have past history of operating as a public company, our historical financial information and summary historical financial information are not necessarily representative of the results that we would have achieved as a separate, publicly traded company and may not be a reliable indicator of our future results.
The historical information about us in this Annual Report on Form 10-K includes periods where we operated as a wholly owned subsidiary of FNF or as a stand-alone public company. Our historical financial information and summary historical financial information included in this Annual Report on Form 10-K is derived from the Consolidated Financial Statements and the accounting records of F&G and FNF. Accordingly, the historical financial information for periods prior to the separation and distribution included in this Annual Report on Form 10-K does not necessarily reflect the financial condition, results of operations or cash flows that we would have achieved as a separate, publicly traded company during the periods presented, or those that we will achieve in the future, including:
•The ongoing cost of capital for our business may be higher than our access to FNF’s cost of capital prior to the separation and distribution.
•Our historical financial information for periods prior the separation and distribution does not reflect the debt or the associated interest expense that we have incurred in connection with the separation and distribution or expect to incur in the future.
Other changes may occur in our cost structure, management, financing and business operations as a result of operating as a company separate from FNF. For additional information about the past financial performance of our business and the basis of presentation of the Consolidated Financial Statements and summary historical financial information of our business, see “Management’s Discussion and Analysis of Financial Condition and Results of Operations” and the historical financial statements and accompanying notes included elsewhere in this Annual Report on Form 10-K.
FNF is our principal shareholder and retains significant rights with respect to our governance and certain corporate actions. In certain cases, FNF may have interests which differ from our other shareholders.
FNF owns approximately 85% of our outstanding common stock and 5,000,000 shares of our FNF Preferred Stock. As a result, FNF is able to control the election of our directors, determine our corporate and management policies and determine, without the consent of our other shareholders, the outcome of any corporate transaction or other matter submitted to our shareholders for approval, including potential mergers or acquisitions, asset sales and other significant corporate transactions. FNF also has sufficient voting power to approve amendments to our organizational documents.
FNF is under no obligation to sell its remaining interest in us and retains the sole discretion to determine the timing of any future sales of shares of our common stock.
Our amended and restated certificate of incorporation and our amended and restated bylaws include a number of provisions that may discourage, delay or prevent a change in our management or control. These provisions not only could have a negative impact on the trading price of our common stock but could also allow FNF to delay or prevent a corporate transaction of which the public shareholders approve.
In addition, conflicts of interest may arise between FNF, as our controlling shareholder, and us. Affiliates of FNF engage in transactions with us. Further, FNF may, from time to time, acquire and hold interests in businesses that compete directly or indirectly with us, and FNF may either directly, or through affiliates, also maintain business
relationships with companies that may directly compete with us. In general, FNF or its affiliates could pursue business interests or exercise their voting power as shareholders in ways that are detrimental to us but beneficial to themselves or to other companies in which they invest or with whom they have relationships. Conflicts of interest could also arise with respect to business opportunities that could be advantageous to FNF, and they may pursue acquisition opportunities in the future that may be complementary to our business. As a result, those acquisition opportunities may not be available to us.
As a result of these relationships, the interests of FNF may not coincide with our interests or the interests of the other holders of our common stock and preferred stock. So long as FNF continues to control a significant amount of the outstanding shares of our common stock, FNF will continue to be able to strongly influence or effectively control our decisions, including with respect to potential mergers or acquisitions, asset sales and other significant corporate transactions.
Certain of our directors may have actual or potential conflicts of interest because of their FNF equity ownership or their current or former FNF positions.
A number of persons who currently are our directors are also officers, directors or employees of FNF (or officers, directors or employees of affiliates of FNF) and, thus, have professional relationships with FNF’s officers, directors or employees. In addition, certain of our directors and executive officers own FNF common stock or other equity compensation awards. These relationships may create, or may create the appearance of, conflicts of interest when these directors and officers are faced with decisions that could have different implications for FNF and us. For example, potential conflicts of interest could arise in connection with the resolution of any dispute that may arise between FNF and us regarding the terms of the agreements governing our relationship with FNF.
Provisions in our amended and restated certificate of incorporation and bylaws, and of Delaware law, may prevent or delay an acquisition of us, which could decrease the trading price of our common stock.
Our amended and restated certificate of incorporation and bylaws contain, and Delaware law contains, provisions that may be considered to have an anti-takeover effect and may delay or prevent a tender offer or other corporate transaction that a shareholder might consider to be in its best interest, including those transactions that might result in payment of a premium over the market price for our stock.
These provisions include:
•rules regarding how shareholders may present proposals or nominate directors for election at shareholder meetings;
•permitting our Board to issue preferred stock without shareholder approval;
•granting to the Board, and not the shareholders, the sole power to set the number of directors;
•the initial division of our Board into three classes of directors, with each class serving a staggered term;
•a provision that directors serving on a classified Board may be removed by shareholders only for cause;
•authorizing vacancies on our Board to be filled only by a vote of the majority of the directors then in office and specifically denying our shareholders the right to fill vacancies in the Board; and
•limiting shareholder action by written consent.
These provisions apply even if an offer may be considered beneficial by some shareholders.
Certain other provisions of our amended and restated certificate of incorporation and bylaws may be considered to have an anti-takeover effect and may delay or prevent a tender offer or other corporate transaction that a shareholder might consider to be in its best interest, including those transactions that might result in payment of a premium over the market price for our shares. We believe these provisions protect our shareholders from coercive or otherwise unfair takeover tactics. These provisions are not intended to make us immune from takeovers. However, these provisions will apply even if the offer may be considered beneficial by some shareholders and the provisions
could delay or prevent an acquisition that our Board determines is not in the best interests of us and our shareholders. These provisions may also prevent or discourage attempts to remove and replace incumbent directors.
We are a “controlled company” within the meaning of the New York Stock Exchange (“NYSE”) rules and, as a result, we qualify for, and rely on, exemptions from certain corporate governance requirements.
FNF controls a majority of the voting power of our outstanding common stock. Accordingly, we will qualify as a “controlled company” within the meaning of the NYSE corporate governance standards. Under the NYSE rules, a company of which more than 50% of the voting power is held by an individual, group or another company is a “controlled company” and may elect not to comply with certain NYSE corporate governance standards, including:
•the requirement that a majority of the board consist of independent directors;
•the requirement to have a compensation committee that is composed entirely of independent directors with a written charter addressing the committee’s purpose and responsibilities;
•the requirement to have a nominating and governance committee that is composed entirely of independent directors with a written charter addressing the committee’s purpose and responsibilities, or otherwise have director nominees selected by vote of a majority of the independent directors; and
•the requirement for an annual performance evaluation of the nominating and governance and compensation committees.
We have availed ourselves of some or all of these exemptions. Consequently, you do not have the same protections afforded to shareholders of companies that are subject to all of the NYSE corporate governance rules and requirements. Our status as a controlled company could make our common stock less attractive to some investors or otherwise harm our stock price. If we cease to qualify as a “controlled company” we will be subject to certain phase-in rules to come into compliance with applicable listing standards.
FNF or F&G may fail to perform under various transaction agreements that were executed as part of the separation and distribution, or we may fail to have necessary systems and services in place when certain of the transaction agreements expire.
In connection with the separation and distribution, we and FNF entered into the separation and distribution agreement. In connection with the separation, F&G also entered into various ancillary agreements to effect the separation and provide a framework for its relationship with FNF after the separation and distribution, such as a corporate services agreement (the “Corporate Services Agreement”), a reverse corporate services agreement (the “Reverse Corporate Services Agreement”), a tax sharing agreement (the “Tax Sharing Agreement”) and other agreements entered into in connection therewith (collectively with a Separation and Distribution Agreement, the “Transaction Agreements”). The Transaction Agreements determine the allocation of assets, rights and liabilities between the companies following the separation and distribution and include indemnifications related to liabilities and obligations. The Corporate Services Agreement provides for the performance of certain services by FNF for the benefit of us for a limited period of time after the separation and distribution. The reverse services agreement provides for the performance of certain services by us for the benefit of FNF for a limited period of time after the separation and distribution. We rely on FNF to satisfy its obligations under the Transaction Agreements. If FNF is unable to satisfy its obligations under the Transaction Agreements, including its indemnification obligations, we could incur operational difficulties or losses. Upon expiration of the Corporate Services Agreement, the services that are covered thereunder will have to be provided internally or by third parties. If we do not have agreements with other providers for these services once certain Transaction Agreements expire or terminate, we may not be able to operate our business effectively, which may have a material adverse effect on our business, financial condition or operating results.
In connection with the separation and distribution, FNF has agreed to indemnify us for certain liabilities, and we have agreed to indemnify FNF for certain liabilities. If we are required to pay under these indemnities to FNF, our financial results could be negatively impacted. FNF’s indemnification of us may not be sufficient to hold us harmless from the full amount of all liabilities that will be allocated to us, and FNF may not be able to satisfy its indemnification obligations in the future.
Pursuant to the Transaction Agreements, FNF has agreed to indemnify us for certain liabilities, and we have agreed to indemnify FNF for certain liabilities, in certain cases for uncapped amounts. Indemnities that we may be required to provide FNF may not be subject to any cap, may be significant and could negatively impact our business, particularly with respect to indemnities provided in the Tax Sharing Agreement. Third parties could also seek to hold us responsible for any of the liabilities that FNF has agreed to retain under the Transaction Agreements. Any amounts that we are required to pay pursuant to these indemnification obligations and other liabilities could require us to divert cash that would otherwise have been used operating our business. Further, the indemnities from FNF may not be sufficient to protect us against the full amount of such liabilities, and FNF may not be able to fully satisfy its indemnification obligations. Moreover, even if we ultimately succeed in recovering from FNF any amounts for which we are held liable, we may be temporarily required to bear these losses ourselves. Each of these risks could have a material adverse effect on our business, financial condition or operating results.
We may have received better terms from unaffiliated third parties than the terms we received in our agreements with FNF.
The agreements we entered into with FNF in connection with the separation and distribution, including the Transaction Agreements, were prepared in the context of our separation from FNF while we were still a wholly owned subsidiary of FNF. Accordingly, during the period in which the terms of those agreements were prepared, we did not have an independent board of directors or a management team that was independent of FNF. As a result, the terms of those agreements may not reflect terms that would have resulted from arm’s length negotiations between unaffiliated third parties. We may have received better terms from third parties because, among other things, third parties may have competed with each other to win our business.
Insurance holding company laws generally provide that no person, corporation or other entity may acquire control of an insurance company, which is presumed to exist if a person owns, directly or indirectly, 10% or more of the voting securities of an insurance company, without the prior approval of such insurance company’s domiciliary state insurance regulator. Persons considering an investment in our common stock should take into consideration their ownership of FNF voting securities and consult their own legal advisors regarding such laws in light of their particular circumstances.
We are subject to regulation under the insurance holding company laws of various jurisdictions. See “Business -Regulation of F&G.” Insurance holding company laws generally provide that no person, corporation or other entity may acquire control of an insurance company, or a controlling interest in any direct or indirect parent company of an insurance company, without the prior approval of such insurance company’s domiciliary state insurance regulator. Under the laws of each of the domiciliary states of our U.S. insurance subsidiaries, Iowa and New York, any person acquiring, directly or indirectly, 10% or more of the voting securities of an insurance company is presumed to have acquired “control” of the company, which may consider voting securities held at both the parent company and subsidiary collectively for these purposes. This statutory presumption of control may be rebutted by a showing that control does not exist in fact. State insurance regulators, however, may find that “control” exists in circumstances in which a person owns or controls less than 10% of the voting securities. We are a subsidiary of FNF, the common stock (its voting securities) of which trades on the NYSE. Consequently, persons considering an investment in our common stock (our voting securities) should also take into consideration their ownership of FNF voting securities and consult their own legal advisors regarding such insurance holding company laws relating to the purchase and ownership of our common stock in light of their particular circumstances.
Our amended and restated bylaws contain an exclusive forum provision that could limit our shareholders’ ability to choose a judicial forum that they find favorable for certain disputes with us or our directors, officers, shareholders, employees or agents, and may discourage lawsuits with respect to such claims.
Our amended and restated bylaws provide that unless the Board otherwise determines, the Court of Chancery of the State of Delaware will be the sole and exclusive forum for (i) any derivative action or proceeding brought on behalf of us, (ii) any action asserting a claim of breach of a fiduciary duty owed by any director, officer, shareholder, employee or agent of ours to either of us or our shareholders, (iii) any action asserting a claim against us or any director, officer, shareholder, employee or agent of ours arising out of or relating to any provision of the Delaware General Corporation Law or our amended and restated certificate of incorporation or bylaws, or (iv) any action asserting a claim against us or any director, officer, shareholder, employee or agent of ours governed by the internal affairs doctrine, in all cases subject to the court having subject matter jurisdiction and personal jurisdiction over an indispensable party named as a defendant. The amended and restated bylaws further provide that the federal district courts of the United States of America shall, to the fullest extent permitted by law, be the sole and exclusive forum for the resolution of any complaint asserting a cause of action arising under the Securities Act. Section 22 of the Securities Act creates concurrent jurisdiction for federal and state courts over all suits brought to enforce any duty or liability created by the Securities Act or the rules and regulations thereunder. Therefore, there is uncertainty as to whether a court will enforce the exclusive forum provision with respect to claims arising under the Securities Act. Notwithstanding the foregoing, the exclusive forum provision does not apply to any actions arising under the Exchange Act and investors cannot waive compliance with the federal securities laws and the rules and regulations thereunder. These exclusive forum provisions may limit our shareholders’ ability, or make it more costly, to bring a claim in a judicial forum that they find favorable for such disputes and may discourage these types of lawsuits. Alternatively, if a court were to find the exclusive forum provisions inapplicable to, or unenforceable in respect of, one or more of the specified types of actions or proceedings, we may incur additional costs associated with resolving such matters in other jurisdictions.
We and certain of our subsidiaries file consolidated federal income tax returns with FNF.
We and our eligible subsidiaries are “affiliated” with FNF for U.S. federal income tax purposes and will join in filing with FNF a consolidated federal income tax return. Pursuant to the Tax Sharing Agreement, we are periodically obligated to make payments to FNF equal to the tax obligations of us and our subsidiaries for federal income taxes and certain state and local income taxes that are computed on a combined, consolidated or unitary method. In addition, are obligated to make payments to FNF for the use of certain tax attributes of FNF and its subsidiaries that are used to offset taxes by us and our subsidiaries. Certain tax attributes of us and our subsidiaries are also available for use by FNF, for which FNF will generally be obligated to make payments to us in compensation. To the extent such tax attributes are used by FNF and its subsidiaries, they will not be available to offset taxes of us and our subsidiaries.
Risks Related to Our Common Stock and Preferred Stock
Our stock price may fluctuate significantly.
Many factors could cause the market price of our common stock to rise and fall, including the following:
•our business profile and market capitalization may not fit the investment objectives of current shareholders, causing a shift in our investor base, and our common stock may not be included in some indices causing certain holders to sell their common stock;
•our announcements or our competitors’ announcements regarding new products or services, significant contracts, acquisitions or strategic investments;
•fluctuations in our quarterly or annual financial results or the quarterly or annual financial results of companies perceived to be similar to us;
•the failure of securities analysts to cover our common stock;
•actual or anticipated fluctuations in our operating results;
•changes in earnings estimates or recommendations by securities analysts or our ability to meet those estimates;
•the operating and stock price performance of other comparable companies;
•investors’ general perception of us and our industry;
•changes to the regulatory and legal environment under which we operate;
•changes in general economic and market conditions;
•changes in industry conditions;
•changes in regulatory and other dynamics; and
•the other factors described in this “Risk Factors” section and elsewhere in this Annual Report on Form 10-K.
In addition, if the market for stocks in our industry, or the stock market in general, experiences a loss of investor confidence, the trading price of our common stock could decline for reasons unrelated to our business, financial condition or results of operations. If any of the foregoing occurs, it could cause our stock price to fall and may expose us to lawsuits that, even if successfully defended, could be costly to defend and a distraction to management.
If we are unable to implement and maintain the effectiveness of our internal control over financial reporting, our investors may lose confidence in the accuracy and completeness of our financial reports, which could adversely affect our stock price.
Pursuant to Section 404 of the Sarbanes-Oxley Act of 2002 and the related rules adopted by the SEC and the Public Company Accounting Oversight Board, our management is required to report on the effectiveness of our internal control over financial reporting. We may encounter problems or delays in completing the implementation of any changes necessary to our internal control over financial reporting to conclude such controls are effective. If we are unable to comply with the requirements of Section 404 in a timely manner or assert that our internal control over financial reporting is effective, or if our independent registered public accounting firm is unable to express an opinion as to the effectiveness of our internal control over financial reporting, investor confidence and our stock price could decline.
Matters impacting our internal controls may cause us to be unable to report our financial information on a timely basis and thereby subject us to adverse regulatory consequences, including sanctions by the SEC or violations of NYSE rules, and result in a breach of the covenants under our financing arrangements. There also could be a negative reaction in the financial markets due to a loss of investor confidence in us and the reliability of our financial statements. Confidence in the reliability of our financial statements also could suffer if we were to report a material weakness in our internal controls over financial reporting. This could materially adversely affect the price of our common stock.
Our common stock is subordinated to our preferred stock.
The Company issued and sold in a private placement to FNF 5,000,000 shares of its FNF Preferred Stock. As described in the Certificate of Designations, subject to certain exceptions, so long as any share of FNF Preferred Stock remains outstanding, no dividend or distribution will be declared or paid on shares of the Company’s common stock, or any other class or series of stock ranking junior to the FNF Preferred Stock, and no common stock or any other class or series of stock ranking junior to or on parity with the FNF Preferred Stock will be purchased, redeemed, or otherwise acquired for consideration by the Company or any of its subsidiaries unless, in each case, all accumulated and unpaid dividends for all preceding dividend periods have been declared and paid in cash, shares of common stock or a combination thereof, or a sufficient sum of cash or number of shares of common stock has been set aside for the payment of such dividends, on all outstanding shares of FNF Preferred Stock. In addition, when dividends on shares of the FNF Preferred Stock (i) have not been declared and paid in full on any dividend payment date (or, in the case of any parity stock having dividend payment dates different from such dividend payment dates, on a dividend payment date falling within a regular dividend period related to such dividend payment date), or (ii)
have been declared but a sum of cash or number of shares of common stock sufficient for payment thereof has not been set aside for the benefit of the holders thereof on the applicable regular record date, no dividends may be declared or paid on any parity stock unless dividends are declared on the shares of FNF Preferred Stock such that the respective amounts of such dividends declared on the shares of FNF Preferred Stock and such shares of parity stock shall be allocated pro rata among the holders of the shares of FNF Preferred Stock and the holders of any shares of parity stock then outstanding.
Substantial sales of our common stock may occur which could cause our stock price to be volatile and to decline.
Any sales of substantial amounts of our common stock in the public market, or the perception that these sales may occur, in connection with the distribution or otherwise, could cause the market price of our common stock to decline. These sales also could impede our ability to raise future capital. We cannot predict the size of future sales of shares of our common stock in the open market following the distribution or the effect, if any, that such future sales, or the perception that such sales may occur, would have on the market price of our common stock. We are also unable to predict whether a sufficient number of buyers would be in the market at that time.
We cannot guarantee the timing, amount or payment of dividends on our common stock or preferred stock in the future.
We expect to pay regular quarterly dividends in the future. However, there can be no assurance we will be able to pay such dividends. The payment and amount of any future dividend will be subject to the sole discretion of our Board and will depend upon many factors, including our financial condition and prospects, our capital requirements and access to capital markets, covenants associated with certain of our debt obligations, legal requirements and other factors that our Board may deem relevant, and there can be no assurance that we will continue to pay a dividend in the future.
Your percentage of ownership in F&G may be diluted in the future.
In the future, your percentage ownership in us may be diluted because of equity issuances for acquisitions, capital market transactions or otherwise, including equity awards that we may be granting to our directors, officers and employees. Such awards may have a dilutive effect on our earnings per share, which could adversely affect the market price of our common stock. From time to time, we will issue additional options or other stock-based awards to our employees under our employee benefits plans.
In addition, our amended and restated certificate of incorporation authorizes us to issue, without the approval of our shareholders, one or more classes or series of preferred stock having such designation, powers, preferences and relative, participating, optional and other special rights, including preferences over our common stock respecting dividends and distributions, as our Board generally may determine. The terms of one or more classes or series of preferred stock could dilute the voting power or reduce the value of our common stock. For example, we could grant the holders of preferred stock the right to elect some number of our directors in all events or on the happening of specified events or the right to veto specified transactions. Similarly, the repurchase or redemption rights or liquidation preferences we could assign to holders of preferred stock could affect the residual value of the common stock.
Item 1B. Unresolved Staff Comments
None.
Item 1C. Cybersecurity
Risk Management and Strategy Disclosure
The Company’s Information Security team is responsible for executing the Company’s enterprise-wide cybersecurity strategy, which is based upon the Center for Internet Security’s best practice controls, including
providing subject matter expertise, accountability, and oversight in the areas of policy and standards development, security architecture, engineering, and development practices, third-party IT and Security risk, compliance with industry, state, and federal regulations, and security education, awareness, and training. The Information Security program is managed and overseen by a full-time Chief Information Security Officer (“CISO”) with over 25 years in information technology leadership, service management, operations, information security, risk management, and regulatory compliance.
The CISO reports to the Company’s Chief Information Officer (“CIO”), who is an executive of the Company and oversees all of the Company’s information technology efforts. The Company’s CIO has over 33 years of information technology leadership experience within the insurance and financial services industries. The CIO provides regular updates to senior leadership, including reports to the Board on a periodic basis.
In conjunction with CIO senior leadership updates and periodic reports to the Board, the Company’s ERM team also provides updates on the Company’s cyber risk and threats, status of key projects improving the Company’s security posture, and efforts reducing the Company’s attack surface.
In addition, a cybersecurity working group reviews the status of the Company’s cybersecurity environment monthly with the senior managers of various departments including Information Technology, Information Security, ERM, Internal Audit, and Compliance. Based on the information received, the working group generates monthly reports and updates key stakeholders across the enterprise.
To mitigate information and cybersecurity risks, the Company utilizes external firms to perform supplemental annual vulnerability and penetration testing to objectively assess and identify potential improvements to the Company’s security posture. Findings from such testing are tracked, prioritized, remediated, and reported accordingly. The Company also leverages a third-party to perform 24x7 Security Operations Center monitoring of its information assets. The Company has processes in-place to risk assess through initial due diligence, monitor throughout the third-party service provider lifecycle, and periodically re-evaluate the technology and security risks associated with the usage of third-party service providers. Additionally, the Company maintains cyber insurance coverage to reduce potential financial losses that may stem from security incidents.
See Item 1A - Risk Factors for discussion of material risks faced by the Company, including risks related to cybersecurity.
Governance Disclosure
As set forth in the Company’s charter, our Audit Committee, comprised of fully independent directors, is responsible for reviewing with management of the Company, the Company’s policies and practices with respect to risk assessment and risk management, including cybersecurity risk. The CRO reports information and cybersecurity risks to the Audit Committee.
F&G has adopted a “three lines of defense” governance model for information and cybersecurity risk management. The CISO is the first line of defense providing frontline business, operational, and technology controls and capabilities to protect against information and cybersecurity risks and responding to cyber incidents and data breaches. The information security team under the CISO is responsible for overseeing infrastructure defense and security controls, managing access controls, performing vulnerability assessments, facilitating independent external penetration testing, assessing third-party or vendor information security, implementing employee awareness and training programs, and handling security incident management.
F&G's ERM department serves as the Company’s second line of defense and considers Information Security risk alongside other company risks. ERM facilitates the quarterly risk self-assessment with the CISO and the CIO to identify and assess information and cybersecurity risks, evaluates the likelihood and impact of potential risk events to Information Assets, and assesses mitigation offered by the control environment to determine residual risk. The assessment results are presented at quarterly Operational Risk Sub-Committee (“ORSC”) and ERMC meetings. ERM, jointly with the Information Security professionals, annually conducts a Cybersecurity Risk Assessment based
on critical security controls set forth by the Center for Internet Security. The assessment is reported to the CRO, CISO and CIO.
The Company’s Internal Audit department serves as the third line of defense and independently assures the effectiveness of the Company’s management of information and cybersecurity risk.
As an added layer of defense, the Company has an incident response team in place to evaluate information and cybersecurity incidents on an on-going basis. Based on materiality, a security incident may be escalated to the Corporate Crisis Management Team (“CCMT”) for risk mitigation and recovery actions.
Cybersecurity Incidents
F&G did not experience a cybersecurity reporting incident during the year ended December 31, 2024. On June 30, 2023, F&G filed a Current Report on Form 8-K regarding a cybersecurity incident associated with the MOVEit file transfer system. As a result of this incident, F&G is a defendant in two putative class action lawsuits that allege certain of F&G’s customers’ personal information was disclosed due to a vulnerability in the MOVEit file transfer software. F&G’s vendor, Pension Benefit Information, LLC (“PBI”), used the MOVEit software in the course of providing audit and address research services to F&G and many other corporate customers. At this time, F&G does not believe the incident will have a material impact on its business, operations, or financial results. For more details on these lawsuits, refer to Note N - Commitment and Contingencies to the Consolidated Financial Statements included in Item 8 of Part II of this Annual Report on Form 10-K.
Item 2. Properties
Our headquarters are in leased facilities at 801 Grand Avenue, in Des Moines, Iowa. We also have leased space for our primary operations in Hamilton, Bermuda; George Town, Cayman Islands; and New York, New York. We believe our existing facilities are suitable and adequate for our present purposes and operations.
Item 3. Legal Proceedings
See discussion of legal proceedings in Note N - Commitments and Contingencies to the Consolidated Financial Statements included in Item 8 of Part II of this Annual Report on Form 10-K, which is incorporated by reference into this Item 3 of Part I.
Item 4. Mine Safety Disclosures
Not applicable.
Part II
Item 5. Market for Registrant’s Common Equity, Related Shareholder Matters and Issuer Purchases of Equity Securities
Market Information
On December 1, 2022, FNF announced completion of the distribution to FNF shareholders, on a pro rata basis, of approximately 15% of the common stock of its subsidiary, F&G. Effective December 1, 2022, F&G commenced “regular-way” trading of its common stock on the New York Stock Exchange (“NYSE”) under the symbol “FG”. FNF retains control of F&G through an approximate 85% equity ownership stake and continues to trade on the NYSE under the symbol “FNF”.
On January 31, 2025, the last reported sale price of our common stock on the NYSE was $45.91. We had approximately 6,570 shareholders of record of our Common Stock on January 31, 2025. This number does not include the stockholders for whom shares are held in a “nominee” or “street” name.
Refer to Note R - Employee Benefit Plans to our Consolidated Financial Statements included in this Annual Report on Form 10-K, which is incorporated by reference into this Item 5 of Part II, for further information on securities issued for employee stock compensation pursuant to our Omnibus Plan.
Information concerning securities authorized for issuance under our equity compensation plans will be included in the definitive proxy statement for our Annual Meeting of Shareholders, which will be filed with the SEC within 120 days after the close of the fiscal year pursuant to Regulation 14A.
Performance Graph
The graph and the table below compare the cumulative total shareholder return on our common stock against the cumulative total return on the S&P 500 Index and S&P 500 Life and Health Insurance Index. The graph assumes a $100 initial investment on December 1, 2022 (the date that our common stock commenced regular way trading on the New York Stock Exchange) with dividends reinvested over the periods indicated. The stock performance in this graph is not necessarily indicative of future stock performance.
*$100 invested on December 1, 2022 in stock or on November 30, 2022, in index, including reinvestment of dividends. Fiscal year ending December 31.
| | | | | | | | | | | | | | | | | | | | | | | | | | | | | | | | | | | | | | | | | | | | | | | | | | | | | | | | |
| 12/01/22 | | 12/31/22 | | 03/31/23 | | 06/30/23 | | 09/30/23 | 12/31/23 | | 03/31/24 | | 06/30/24 | | 09/30/24 | | 12/31/24 |
| F&G Annuities and Life, Inc. | $ | 100.00 | | | $ | 104.60 | | | $ | 95.63 | | | $ | 132.00 | | | $ | 150.54 | | $ | 247.92 | | | $ | 219.80 | | | $ | 207.43 | | | $ | 245.00 | | | $ | 228.18 | |
| S&P 500 | 100.00 | | | 94.24 | | | 101.30 | | | 110.16 | | | 106.55 | | 119.01 | | | 131.57 | | | 137.21 | | | 145.29 | | | 148.79 | |
| S&P 500 Life & Health Insurance | 100.00 | | | 94.94 | | | 81.17 | | | 84.91 | | | 91.45 | | 99.35 | | | 108.78 | | | 106.05 | | | 123.46 | | | 119.52 | |
Dividends on Ordinary Shares
On February 20, 2025, our Board of Directors declared a quarterly cash dividend of $0.22 per share, payable on March 31, 2025, to F&G common shareholders of record as of March 17, 2025. During the years ended December 31, 2024, 2023, and 2022, we declared dividends on our common stock of $0.85, $0.81, and $0.20, respectively (inaugural dividend declared December 2022). On February 20, 2025, our Board of Directors also declared a quarterly cash dividend of $0.8594 per share on the F&G 6.875% Series A Mandatory Convertible Preferred Stock, par value $.0.001 per share, liquidation preference of $50.00 per share (the “FNF Preferred Stock”) for the period from January 1, 2025 to and excluding April 15, 2025, to be paid on April 15, 2025, to FNF Preferred Stock record holders as of April 1, 2025. Preferred Stock dividends of approximately $17 million were declared during the year ended December 31, 2024.
We intend to announce the record date and payment date for each dividend, subject to quarterly review and approval by our Board of Directors and any required regulatory approvals, following completion of the relevant fiscal quarter and with payment in the third month of each subsequent quarter, based on our view of the prevailing and prospective macroeconomic conditions, regulatory landscape and business performance. Generally, no dividends will be declared or paid on F&G common stock and no common stock can be acquired by F&G unless all preferred dividends are declared and paid on the outstanding FNF Preferred Stock.
Purchases of Equity Securities by the Issuer
In 2023, F&G’s Board of Directors approved a three-year stock repurchase program, under which the Company may repurchase up to $50 million of F&G common stock. There were no shares of F&G common stock repurchased under the program during the year ended December 31, 2024. The total remaining authorization of F&G common stock that may yet be purchased under the program at December 31, 2024 totaled approximately $32 million. The Company believes the share repurchase program is an efficient means of returning cash to shareholders when we consider the shares to be undervalued. For further details of the repurchase program, refer to Note U - Equity to the Consolidated Financial Statements in Item 8 of Part II of this Annual Report on Form 10-K.
There were no unregistered sales of equity securities sold during the period covered by this Annual Report on Form 10-K that were not previously included in a Current Report on Form 8-K.
Item 6. Reserved
Item 7. Management's Discussion and Analysis of Financial Condition and Results of Operations
The following discussion and analysis of our financial condition and results of operations for the years ended December 31, 2024, December 31, 2023 and December 31, 2022 should be read together with, and is qualified in its entirety by reference to, our Consolidated Financial Statements and related notes included elsewhere in this Annual Report on Form 10-K which have been prepared in accordance with GAAP. The following discussion may contain forward-looking statements based on assumptions we believe to be reasonable. Our actual results could differ materially from those discussed in these forward-looking statements. Factors that could cause or contribute to these differences include, but are not limited to, those discussed below and elsewhere in this Annual Report on Form 10-K, particularly in “Risk Factors” and “Note Regarding Forward-Looking Statements.”
Our Results of Operations discussion and analysis presents a review for the years ended December 31, 2024, 2023 and 2022, and year-over-year comparisons between these years. For a discussion of our 2022 results of operations, including year-over-year comparison to the year ended December 31, 2021, refer to Part I, Item 7 of our Annual Report on Form 10-K, which was filed with the SEC on February 27, 2023.
Overview
The following describes the business of F&G Annuities & Life, Inc. and its subsidiaries. Except where otherwise noted in this Report, all references to “we,” “us,” “our,” the “Company,” or “F&G” are to F&G Annuities & Life, Inc. and its subsidiaries, taken together.
For a description of our business see the discussion under “Business” in Item 1 of Part I of this Annual Report on Form 10-K, and Note A - Business and Summary of Significant Accounting Policies in Part II - Item 8 of this Annual Report on Form 10-K, which are incorporated by reference into this Item 7 of Part II of this Annual Report on Form 10-K.
Business Trends and Conditions
The following factors represent some of the key trends and uncertainties that have influenced the development of the Company and its historical financial performance, and we believe these key trends and uncertainties will continue to influence the business and financial performance of the Company in the future.
Market Conditions
Market volatility has affected, and may continue to affect, our business and financial performance in varying ways. Volatility can pressure sales and reduce demand as consumers hesitate to make financial decisions. To enhance the attractiveness and profitability of our products and services, we continually monitor the behavior of our customers, as evidenced by annuitization rates and lapse rates, which vary in response to changes in market conditions. See “Part I. Item 1A. Risk Factors” in this Annual Report on Form 10-K for further discussion of risk factors that could affect market conditions.
Interest Rate Environment
Some of our products include guaranteed minimum crediting rates, most notably our fixed rate annuities. As of December 31, 2024 and December 31, 2023, our reserves, net of reinsurance, and average crediting rate on our fixed rate annuities were $6 billion and 5%, respectively, and $6 billion and 4%, respectively. We are required to pay the guaranteed minimum crediting rates even if earnings on our investment portfolio decline, which would negatively impact earnings. In addition, we expect more policyholders to hold policies with comparatively high guaranteed rates for a longer period in a low interest rate environment. Conversely, a rise in average yield on our investment portfolio would increase earnings if the average interest rate we pay on our products does not rise correspondingly. Similarly, we expect that policyholders would be less likely to hold policies with existing guarantees as interest rates
rise and the relative value of other new business offerings are increased, which would negatively impact our earnings and cash flows.
See “Quantitative and Qualitative Disclosure about Market Risk” and “Part I. Item 1A. Risk Factors” in this Annual Report on Form 10-K for a more detailed discussion of interest rate risk.
Aging of the U.S. Population
We believe that the aging of the U.S. population will increase the demand for our indexed annuity and indexed universal life (“IUL”) products. As the “baby boomer” generation prepares for retirement, we believe that demand for retirement savings, growth, and income products will grow. We serve a growing retirement population, with more than 10,000 Americans turning 65 every day and a projected 23% increase in people age 65 and older over the next 25 years. The impact of this growth may be offset to some extent by asset outflows as an increasing percentage of the population begins withdrawing assets to convert their savings into income.
Industry Factors and Trends Affecting Our Results of Operations
We operate in the sector of the insurance industry that focuses on the needs of middle-income Americans. The underserved middle-income market represents a major growth opportunity for us. As a tool for addressing the unmet need for retirement planning, we believe that many middle-income Americans have grown to appreciate the financial certainty that we believe annuities such as our FIA products afford. For example, the fixed index annuity market grew from nearly $12 billion of sales in 2002 to $97 billion of sales in 2023 and the registered index-linked annuities (“RILA”) market grew from $11 billion of sales in 2018 to $44 billion of sales in 2023. Additionally, this market demand has positively impacted the IUL market as it has expanded from $100 million of annual sales in 2002 to $3 billion of annual sales in 2023.
Critical Accounting Policies and Estimates
The accounting estimates described below are those we consider critical in preparing our Consolidated Financial Statements. Management is required to make estimates and assumptions that can affect the reported amounts of assets and liabilities and disclosures with respect to contingent assets and liabilities at the date of the Consolidated Financial Statements and the reported amounts of revenues and expenses during the reporting period. Actual amounts could differ from those estimates. See Note A - Business and Summary of Significant Accounting Policies to our Consolidated Financial Statements included in Part II - Item 8 of this Annual Report for additional description of the significant accounting policies that have been followed in preparing our Consolidated Financial Statements.
Reserves for Future Policy Benefits and Certain Information on Contractholder Funds
The determination of FPB reserves is dependent on actuarial assumptions. The principal assumptions used to establish liabilities for FPBs are established at issue of the contract and include discount rates, mortality and cash surrender or policy lapse for our traditional life insurance products. The assumptions used require considerable judgment. We review policyholder behavior experience at least annually and update these assumptions when deemed necessary based on additional information that becomes available. Discount rate assumptions are updated at each reporting period and also incorporate changes in risk free rates and option market values. Changes in, or deviations from, the assumptions previously used can significantly affect our reserve levels and related results of operations in a positive or negative direction.
Mortality refers to the incidence of death on covered lives, which triggers contractual death benefit provisions. On our deferred annuities and life insurance products, these provisions may allow for lump sum payments, payments over a period of time, or spousal continuation of the contract. On our life-contingent immediate annuities (which includes life-contingent pension risk transfer (“PRT”) annuities), the death of a named annuitant or certificate holder may trigger the cessation or reduction of future life-contingent payments due, depending on the presence of a joint annuitant/certificate holder and any remaining guaranteed non-life contingent payment periods. We utilize a combination of internal and industry experience when setting our mortality assumptions.
A surrender rate is the percentage of account value surrendered by the policyholder in exchange for receipt of a cash surrender value. A lapse rate is the percentage of account value canceled by us due to nonpayment of premiums required to maintain coverage on our life insurance products. We make estimates of expected full and partial surrenders of our deferred annuity products based on a combination of internal and industry experience. Management’s best estimate of surrender behavior generally represents a medium-to-long term perspective, as we expect to experience a range of policyholder behavior and market conditions period to period. If actual surrender rates are significantly different from those estimated, such differences could have a significant effect on our reserve levels and related results of operations.
Discount rates refer to the interest rates used to discount future cash flows to the current period to determine a present value. For liability for FPB reserves the discount rate used is based on the yield curve for A-rated corporate bonds as of the valuation date. Changes in the discount rates from the at-issue or at-purchase discount rates flow through other comprehensive income (loss) (“OCI”).
Our aggregate reserves for contractholder funds, FPBs and MRBs on a direct and net basis as of December 31, 2024 and December 31, 2023, are summarized as follows (in millions):
| | | | | | | | | | | | | | | | | |
| As of December 31, 2024 |
| Direct | | Deposit Asset/
Reinsurance Recoverable | | Net |
| Indexed annuities | $ | 31,002 | | | $ | (861) | | | $ | 30,141 | |
| Fixed rate annuities | 17,443 | | | (11,009) | | | 6,434 | |
| Single premium immediate annuities ("SPIA") and other | 1,673 | | | (109) | | | 1,564 | |
| IUL and other life | 4,203 | | | (1,390) | | | 2,813 | |
| | | | | |
| Funding agreements | 5,315 | | | — | | | 5,315 | |
| PRT | 6,066 | | | — | | | 6,066 | |
| Total | $ | 65,702 | | | $ | (13,369) | | | $ | 52,333 | |
| | | | | | | | | | | | | | | | | |
| As of December 31, 2023 |
| Direct | | Deposit Asset/
Reinsurance Recoverable | | Net |
| Indexed annuities | $ | 27,809 | | | $ | (17) | | | $ | 27,792 | |
| Fixed rate annuities | 13,445 | | | (7,521) | | | 5,924 | |
| SPIA and other | 1,814 | | | (115) | | | 1,699 | |
| IUL and other life | 3,828 | | | (1,307) | | | 2,521 | |
| | | | | |
| Funding agreements | 5,152 | | | — | | | 5,152 | |
| PRT | 4,203 | | | — | | | 4,203 | |
| Total | $ | 56,251 | | | $ | (8,960) | | | $ | 47,291 | |
Indexed annuities and IUL products contain an embedded derivative; a feature that permits the holder to elect an interest rate return or an equity-index linked component, where interest credited to the contract is linked to the performance of various equity indices. The indexed annuities/IUL embedded derivatives are valued at fair value and included in the liability for Contractholder funds in our Consolidated Balance Sheets with changes in fair value included as a component of Benefits and other changes in policy reserves in our Consolidated Statements of Operations.
For life-contingent immediate annuity policies, gross premiums received in excess of net premiums are deferred at initial recognition as a deferred profit liability (“DPL”). Gross premiums are measured using assumptions consistent with those used in the measurement of the related liability for FPBs.
Valuation of Fixed Maturity, Preferred and Equity Securities, and Derivatives
Our investments in fixed maturity securities have been designated as available-for-sale (“AFS”) and are carried at fair value, net of allowance for expected credit losses, with unrealized gains and losses included within accumulated other comprehensive income (loss) (“AOCI”), net of deferred income taxes. Our equity securities are carried at fair value with unrealized gains and losses included in net income (loss). Realized gains and losses on the sale of investments are determined on the basis of first-in first-out cost basis and are credited or charged to income on a trade date basis.
Management’s assessment of all available data when determining fair value of the AFS securities is necessary to appropriately apply fair value accounting. Management utilizes information from independent pricing services, who take into account perceived market movements and sector news, as well as a security’s terms and conditions, including any features specific to that issue that may influence risk and marketability. Depending on the security, the priority of the use of observable market inputs may change as some observable market inputs may not be relevant or additional inputs may be necessary. We generally obtain one value from our primary external pricing service. In situations where a price is not available from the independent pricing service, we may obtain broker quotes or prices from additional parties recognized to be market participants. We believe the broker quotes are prices at which trades could be executed based on historical trades executed at broker-quoted or slightly higher prices. When quoted prices in active markets are not available, the determination of estimated fair value is based on market standard valuation methodologies, including discounted cash flows, matrix pricing, or other similar techniques.
We validate external valuations at least quarterly through a combination of procedures that include the evaluation of methodologies used by the pricing services, comparisons to valuations from other independent pricing services, analytical reviews and performance analysis of the prices against trends, and maintenance of a securities watch list. See Note B - Fair Value of Financial Instruments and Note C - Investments to our Consolidated Financial Statements included in Part II - Item 8 of this Annual Report on Form 10-K.
The fair value of derivative assets and liabilities is based upon valuation pricing models or independent broker quotes and represents what we would expect to receive or pay at the balance sheet date if we canceled or exercised the derivative or entered into offsetting positions. Fair values for instruments utilizing valuation pricing models are determined internally using a conventional model and market observable inputs, including interest rates, yield curve volatilities and other factors. Credit risk related to the counterparty is considered when estimating the fair values of these derivatives. However, we are largely protected by collateral arrangements with counterparties when individual counterparty exposures exceed certain thresholds. The fair value of futures contracts (specifically for indexed annuities contracts) at the balance sheet date represents the cumulative unsettled variation margin (open trade equity net of cash settlements). The fair value of an interest rate swap represents the change in projected interest rates between the reporting date and the date the interest rate swap was executed. The fair values of the embedded derivatives in our indexed annuities and IUL contracts are derived using market value of options, use of current and budgeted option cost, swap rates, mortality rates, surrender rates, partial withdrawals, and non-performance spread. The discount rate used to determine the fair value of our indexed annuities/IUL embedded derivative liabilities includes an adjustment to reflect the risk that these obligations will not be fulfilled (“non-performance risk”). For the years ended December 31, 2024 and December 31, 2023, our non-performance risk adjustment was based on the expected loss due to default in debt obligations for similarly rated financial companies. See Note B - Fair Value of Financial Instruments and Note D - Derivative Financial Instruments to our Consolidated Financial Statements included in Part II - Item 8 of this Annual Report on Form 10-K.
F&G cedes certain business on a coinsurance funds withheld basis. Investment results for the assets that support the coinsurance that are segregated within the funds withheld account are passed directly to the reinsurer pursuant to the contractual terms of the reinsurance arrangement, which creates embedded derivatives considered to be total return swaps. These total return swaps are not clearly and closely related to the underlying insurance contract and thus require bifurcation. The fair value of the total return swaps is based on the change in fair value of the underlying assets held in the funds withheld account. For arrangements reinsuring indexed annuities products, the funds withheld account additionally contains an embedded derivative representing the index credit obligation due the reinsurer, resulting in a compound embedded derivative. These compound embedded derivatives are
reported in Funds withheld for reinsurance liabilities and for all other arrangements, embedded derivatives are reported in Prepaid expenses and other assets if in a net gain position, or Accounts payable and accrued liabilities, if in a net loss position on the Consolidated Balance Sheets. The related gains or losses are reported in Recognized gains and (losses), net on the Consolidated Statements of Operations. See Note E - Reinsurance to our Consolidated Financial Statements included in Part II - Item 8 of this Annual Report on Form 10-K.
We categorize our fixed maturity securities, preferred securities, equity securities and derivatives into a three-level hierarchy based on the priority of the inputs to the valuation technique. The fair value hierarchy gives the highest priority to quoted prices in active markets for identical assets (Level 1) and the lowest priority to unobservable inputs (Level 3). If the inputs used to measure fair value fall within different levels of the hierarchy, the category level is based on the lowest priority level input that is significant to the fair value measurement of the instrument. The following table presents the fair value of fixed maturity securities and equity securities by pricing source, hierarchy level and net asset value (“NAV”) as of December 31, 2024 and December 31, 2023, dollars in millions.
| | | | | | | | | | | | | | | | | | | | | | | | | | | | | |
| As of December 31, 2024 |
| Quoted Prices in Active Markets for Identical Assets (Level 1) | | Significant Observable Inputs (Level 2) | | Significant Unobservable Inputs (Level 3) | | NAV | | Total |
| Fixed maturity securities available-for-sale and equity securities: | | | | | | | | | |
| Prices via third party pricing services | $ | 441 | | | $ | 35,136 | | | $ | 852 | | | $ | — | | | $ | 36,429 | |
| Priced via independent broker quotations | — | | | — | | | 10,246 | | | — | | | 10,246 | |
| Priced via other methods | — | | | — | | | — | | | 57 | | | 57 | |
| Total | $ | 441 | | | $ | 35,136 | | | $ | 11,098 | | | $ | 57 | | | $ | 46,732 | |
| % of Total | 1 | % | | 75 | % | | 24 | % | | — | % | | 100 | % |
| | | | | | | | | | | | | | | | | | | | | | | | | | | | | |
| As of December 31, 2023 |
| Quoted Prices in Active Markets for Identical Assets (Level 1) | | Significant Observable Inputs (Level 2) | | Significant Unobservable Inputs (Level 3) | | NAV | | Total |
| Fixed maturity securities available-for-sale and equity securities: | | | | | | | | | |
| Prices via third party pricing services | $ | 586 | | | $ | 31,195 | | | $ | 895 | | | $ | — | | | $ | 32,676 | |
| Priced via independent broker quotations | — | | | — | | | 8,290 | | | — | | | 8,290 | |
| Priced via other methods | — | | | — | | | — | | | 59 | | | 59 | |
| Total | $ | 586 | | | $ | 31,195 | | | $ | 9,185 | | | $ | 59 | | | $ | 41,025 | |
| % of Total | 2 | % | | 76 | % | | 22 | % | | — | % | | 100 | % |
Market Risk Benefits
MRBs are contracts or contract features that both provide protection to the contract holder from other-than-nominal capital market risk (equity, interest and foreign exchange risk) and expose the Company to other-than-nominal capital market risk. MRBs include certain contract features primarily on FIA contracts that provide minimum guarantees to policyholders, such as Guaranteed Minimum Death Benefit (“GMDBs”) and Guaranteed Minimum Withdrawal Benefits (“GMWBs”) and Guaranteed Minimum Accumulation Benefits (“GMAB”) riders. In certain reinsurance transactions, the underlying risks ceded to a reinsurer contain MRBs. MRBs, inclusive of reinsured MRBs, are measured at fair value using a risk neutral valuation method, which is based on current net amounts at risk, market data, internal and industry experience, and other factors.
The principal policyholder behavior assumptions used to calculate MRBs are established at issue of the contract and include mortality, contract full and partial surrenders, and utilization of the GMWB rider benefits. The assumptions used reflect a combination of internal experience, industry experience, and judgment. We review overall policyholder behavior experience at least annually and update these assumptions when deemed necessary
based on additional information that becomes available. Changes in, or deviations from, the assumptions previously used can significantly affect our MRBs and related results of operations in a positive or negative direction.
See Note G - Market Risk Benefits to our Consolidated Financial Statements included in Part II - Item 8 of this Annual Report on Form 10-K for further information on the changes in MRB.
Mortality refers to the incidence of death amongst policyholders on covered lives, which triggers contractual death benefit provisions. These provisions may allow for lump sum payments, payments over a period of time, or spousal continuation of the contract. We utilize a combination of actual internal and industry experience when setting our mortality assumptions.
A surrender rate is the percentage of account value surrendered by the policyholder in exchange for receipt of a cash surrender value. We make estimates of expected full and partial surrenders of our deferred annuity products based on a combination of internal and industry experience. Management’s best estimate of surrender generally represents a medium-to-long term perspective, as we expect to experience a range of policyholder behavior and market conditions period to period. If actual surrender rates are significantly different from those estimated, such differences could have a significant effect on our MRBs and related results of operations.
We have been issuing GMWB products since 2008. We make assumptions for policyholder behavior as it relates to GMWB utilization using a higher degree of industry experience and judgment than our other behavioral assumptions because internal experience, which we review annually, is still emerging. If emerging experience deviates from our assumptions on GMWB utilization, it could have a significant effect on MRBs and related results of operations.
Goodwill
As of December 31, 2024 and December 31, 2023, goodwill was $2,179 million and $1,749 million. The goodwill was recorded in connection with the recent owned distribution acquisitions and the FNF Acquisition.
In evaluating the recoverability of goodwill, we perform a qualitative analysis at the reporting unit level to determine whether there are any events or circumstances that would indicate it is more likely than not that the fair value of our recorded goodwill exceeds its carrying value. Based on the results of this analysis, an annual goodwill impairment test may be completed based on an analysis of the discounted future cash flows generated by the underlying assets. The process of determining whether or not goodwill is impaired or recoverable relies on projections of future cash flows, operating results and market conditions. Future cash flow estimates are based partly on projections of market conditions such as the volume and mix of refinance and purchase transactions and interest rates, which are beyond our control and are likely to fluctuate. While we believe that our estimates of future cash flows are reasonable, these estimates are not guarantees of future performance and are subject to risks and uncertainties that may cause actual results to differ from what is assumed in our impairment tests. Such analyses are particularly sensitive to changes in estimates of future cash flows and discount rates. Changes to these estimates might result in material changes in fair value and determination of the recoverability of goodwill, which may result in charges against earnings and a reduction in the carrying value of our goodwill in the future. We completed annual goodwill impairment analyses in the fourth quarter of each period presented using a September 30 measurement date. For the years ended December 31, 2024 and December 31, 2023, we determined there were no events or circumstances that indicated that the carrying value exceeded the fair value.
Accounting for Income Taxes
As part of the process of preparing the Consolidated Financial Statements, we are required to determine income taxes in each of the jurisdictions in which we operate. This process involves estimating actual current tax expense together with assessing temporary differences resulting from differing recognition of items for income tax and accounting purposes. These differences result in deferred income tax assets and liabilities, which are included within the Consolidated Balance Sheets. We must then assess the likelihood that deferred income tax assets will be realized and, to the extent we believe that realizability is not likely, establish a valuation allowance. Determination of income
tax expense requires estimates and can involve complex issues that may require an extended period to resolve. Further, the estimated level of annual pre-tax income can cause the overall effective income tax rate to vary from period to period. We believe that our tax positions comply with applicable tax law and that we adequately provide for any known tax contingencies. We believe the estimates and assumptions used to support our evaluation of tax benefit realization are reasonable. Final determination of prior-year tax liabilities, either by settlement with tax authorities or expiration of statutes of limitations, could be materially different than estimates reflected in assets and liabilities and historical income tax provisions. The outcome of these final determinations could have a material effect on our income tax provision, net income or cash flows in the period that determination is made.
For the year ended December 31, 2024, changes in market conditions, including changing interest rates, resulted in deferred tax assets related to the net unrealized capital losses in the Company’s investment portfolio. GAAP requires the evaluation of the recoverability of deferred tax assets and the establishment of a valuation allowance, if necessary, to reduce the deferred tax asset to an amount that is more likely than not to be realized. When assessing the need for valuation allowance on the unrealized capital loss deferred tax assets, we assert a tax planning strategy to hold the vast majority of underlying securities to recovery or maturity. Our ability to assert such a tax planning strategy is dependent upon factors such as the Company’s asset/liability matching process, overall investment strategy, projected future annuity product sales, and expected liquidity needs. In the event these estimates differ from our prior estimates due to the receipt of new information, we may be required to significantly change the income tax expense recorded in the Consolidated Financial Statements. This includes a further significant decline in value of assets incorporated into our tax planning strategies which could lead to an increase of our valuation allowance on deferred tax assets having an adverse effect on current and future results.
Refer to Note H - Income Taxes to our Consolidated Financial Statements included in this Annual Report on Form 10-K for details.
Business Overview
We are in three distinct retail channels and two institutional markets. Our three retail channels include agent-based Independent Marketing Organizations (“IMOs”), banks and broker-dealers. We have deep, long-tenured relationships with our network of leading IMOs and their agents to serve the needs of the middle-income market and develop competitive annuity and life products to align with their evolving needs. Upon FNF’s acquisition of F&G on June 1, 2020 (the “FNF Acquisition”), and F&G’s subsequent rating upgrades in mid-2020, we launched into banks and broker-dealers. Further, in 2021, we launched into two institutional markets to originate Funding Agreement Backed Notes (“FABN”) and pension risk transfer (“PRT”) transactions. The FABN Program offers funding agreements to institutional clients by means of capital markets transactions through investment banks. The funding agreements issued under the FABN Program are in addition to those issued to the Federal Home Loan Bank of Atlanta (“FHLB”). The PRT solutions business is supported by an experienced team, and we partner with brokers and institutional consultants for distribution. These markets leverage our existing team's spread-based capabilities as well as our strategic partnership with Blackstone ISG-I Advisors LLC (“Blackstone”).
Additionally, we have expanded our owned distribution strategy with majority and minority ownership stakes in a number of IMOs, providing a diversified source of earnings while generating a meaningfully higher risk adjusted return on capital than retained business. Owned distribution further strengthens our relationships with key partners and with industry consolidation underway, we believe we are uniquely positioned to partner as a distribution consolidator. For our minority owned interests, our Consolidated Statements of Operations reflects dividend income in Interest and investment income. For our majority owned interests, unaffiliated commission revenue is recorded in Owned distribution revenue and unaffiliated expenses are recorded in Personnel costs and Other operating expenses in our Consolidated Statements of Operations.
In setting the features and pricing of our flagship indexed annuity products relative to our targeted net margin, we take into account our expectations regarding (1) the difference between the net investment income we earn and the sum of the interest credited to policyholders and the cost of hedging our risk on the policies; (2) fees, including surrender charges and rider fees, partly offset by vesting bonuses that we pay our policyholders; and (3) a number of
related expenses, including benefits and changes in reserves, acquisition costs, and general and administrative expenses.
On March 16, 2022, FNF announced its intention to partially spin off F&G through a dividend to FNF shareholders. On December 1, 2022, FNF distributed, on a pro rata basis, approximately 15% of the common stock of F&G. FNF retained control of F&G through ownership of approximately 85% of F&G common stock. Effective December 1, 2022, F&G commenced “regular-way” trading of its common stock on the New York Stock Exchange (“NYSE”) under the symbol “FG”.
Key Components of Our Historical Results of Operations
Through our insurance subsidiaries, we issue a broad portfolio of deferred annuities (indexed annuities and fixed rate annuities), IUL insurance, immediate annuities, funding agreements and PRT solutions. A deferred annuity is a type of contract that accumulates value on a tax deferred basis and typically begins making specified periodic or lump sum payments a certain number of years after the contract has been issued. IUL insurance is a complementary type of contract that accumulates value in a cash value account and provides a payment to designated beneficiaries upon the policyholder’s death. An immediate annuity is a type of contract that begins making specified payments within one annuity period (e.g., one month or one year) and typically makes payments of principal and interest earnings over a period of time. As defined by the IID, a funding agreement is an agreement for an insurer to accept and accumulate funds and to make one or more payments at future dates in amounts that are not based on mortality or morbidity contingencies of the person to whom the funding agreement is issued. In essence, funding agreement providers issue fixed maturity contracts with fixed or floating interest rates in exchange for a single upfront premium. Our PRT products are comparable to income annuities, as we generally receive a single, upfront premium in exchange for paying a guaranteed stream of future income payments which are typically fixed in nature but may vary in duration based on participant mortality experience.
Under GAAP, premium collections for deferred annuities (indexed annuities and fixed rate annuities), immediate annuities and PRT without life contingency, and deposits received for funding agreements are reported in the financial statements as deposit liabilities (i.e., contractholder funds) instead of as sales or revenues. Similarly, cash payments to customers are reported as decreases in the liability for contractholder funds and not as expenses. Sources of revenues for products accounted for as deposit liabilities are net investment income, surrender charges, cost of insurance and other charges deducted from contractholder funds (i.e., amortization of URL), and net realized gains (losses) on investments. Components of expenses for products accounted for as deposit liabilities are interest-sensitive and index product benefits (primarily interest credited to account balances or the hedging cost of providing index credits to the policyholder), amortization of VOBA, DAC and DSI, and other operating costs and expenses.
F&G hedges certain portions of its exposure to product related equity market risk by entering into derivative transactions. We purchase derivatives consisting predominantly of equity options and, to a lesser degree, futures contracts (specifically for indexed annuity contracts) on the equity indices underlying the applicable policy. These derivatives are used to offset the reserve impact of the index credits due to policyholders under the indexed annuity and IUL contracts. The majority of all such equity options are one-year options purchased to match the funding requirements underlying the indexed annuity/IUL contracts. We attempt to manage the cost of these purchases through the terms of our indexed annuity/IUL contracts, which permit us to change caps, spread, or participation rates on each policy's annual anniversary, subject to certain guaranteed minimums that must be maintained. The equity options and futures contracts are marked to fair value with the change in fair value included as a component of net investment gains (losses). The change in fair value of the equity options and futures contracts includes the gains and losses recognized at the expiration of the instruments’ terms or upon early termination and the changes in fair value of open positions. In addition, to reduce market risks from interest rate changes on our earnings associated with our floating rate investments, during 2023, we began to execute pay-float and receive-fixed interest rate swaps.
Market risk benefits (“MRBs”) are contracts or contract features that both provide protection to the contract holder from other-than-nominal capital market risk (equity, interest and foreign exchange risk) and expose the Company to other-than-nominal capital market risk. MRBs (inclusive of reinsured MRBs) are measured at fair value using a risk neutral valuation method, which is based on current net amounts at risk, market data, internal and
industry experience, and other factors. The change in fair value of MRBs generally reflects impacts from actual policyholder behavior (including surrenders of the benefit), changes in interest rates, and changes in equity market returns. Generally higher interest rates and equity returns result in gains whereas lower interest rates and equity returns result in losses. Reinsured MRBs are valued using a methodology consistent with direct MRBs, with the exception of the non-performance spread which reflects the credit of the reinsurer.
Earnings from products accounted for as deposit liabilities are primarily generated from the excess of net investment income earned over the sum of interest credited to policyholders and the cost of hedging our risk on indexed annuity/IUL policies, which includes the expenses incurred to fund the index credit with respect to indexed annuities/IULs. Proceeds received upon expiration or early termination of equity options purchased to fund annual index credits are recorded as part of the change in fair value of derivatives and are largely offset by an expense for index credits earned on annuity contractholder fund balances.
Our profitability depends in large part upon the amount of:
i.AUM (see “—Non-GAAP Financial Measures”),
ii.the excess of net investment income over the sum of interest credited to policyholders and the cost of hedging our risk on indexed product policies, earned on our average assets under management (“AAUM” — see “—Non-GAAP Financial Measures”),
iii.flow reinsurance fee income from allocating capital to the highest returning retained business while enhancing cash flow and generating fee-based earnings,
iv.owned distribution margin generated from a meaningfully higher risk adjusted return on capital than retained business and providing a diversifying source of earnings while further strengthening our relationships with key partners, and
v.through our disciplined expense management and the costs of acquiring new business (principally commissions to agents and bonuses credited to policyholders).
As we grow AUM, earnings generally increase. AUM increases when cash inflows, which include sales, exceed cash outflows. Managing the excess of net investment income earned over the sum of interest credited to policyholders and the cost of hedging our risk on indexed product policies, involves the ability to maximize returns on our AUM and minimize risks such as interest rate changes and defaults or impairment of investments. It also includes our ability to manage interest rates credited to policyholders and costs of the options and futures purchased to fund the annual index credits on the indexed annuities/IULs. We analyze returns on AAUM to measure our profitability.
F&G reinsures portions of its policy risks with other insurance companies. The use of indemnity reinsurance does not discharge an insurer from liability on the insurance ceded. The insurer is required to pay in full the amount of its insurance liability regardless of whether it is entitled to or able to receive payment from the reinsurer. The portion of risks exceeding F&G's retention limit is reinsured. F&G primarily seeks reinsurance coverage in order to manage loss exposures, to enhance our capital position, to diversify risks and earnings, and to manage new business volume. F&G follows reinsurance accounting when the treaty adequately transfers insurance risk and any acquisition cost reimbursements reduce policy acquisition costs deferred and maintenance expense reimbursements reduce direct expenses incurred. Otherwise, F&G follows deposit accounting if there is inadequate transfer of insurance risk or if the underlying policy for which risk is being transferred is an investment contract that does not contain insurance risk. See Note E - Reinsurance to the Consolidated Financial Statements included in Part II, Item 8 of this Annual Report on Form 10-K for additional information.
Non-GAAP Financial Measures
In addition to reporting financial results in accordance with GAAP, this document includes non-GAAP financial measures, which the Company believes are useful to help investors better understand its financial performance, competitive position and prospects for the future. Management believes these non-GAAP financial measures may be useful in certain instances to provide additional meaningful comparisons between current results and results in prior
operating periods. Our non-GAAP measures may not be comparable to similarly titled measures of other organizations because other organizations may not calculate such non-GAAP measures in the same manner as we do. The presentation of this financial information is not intended to be considered in isolation of or as a substitute for, or superior to, the financial information prepared and presented in accordance with GAAP. By disclosing these non-GAAP financial measures, the Company believes it offers investors a greater understanding of, and an enhanced level of transparency into, the means by which the Company’s management operates the Company. Any non-GAAP measures should be considered in context with the GAAP financial presentation and should not be considered in isolation or as a substitute for GAAP net earnings, net earnings attributable to common shareholders, or any other measures derived in accordance with GAAP as measures of operating performance or liquidity. Reconciliations of these non-GAAP financial measures to the most directly comparable GAAP measures are provided within.
Adjusted Net Earnings Attributable to Common Shareholders
Adjusted net earnings attributable to common shareholders is a non-GAAP economic measure we use to evaluate financial performance each period. Adjusted net earnings attributable to common shareholders is calculated by adjusting net earnings (loss) attributable to common shareholders to eliminate:
(i) Recognized (gains) and losses, net: the impact of net investment gains/losses, including changes in allowance for expected credit losses and other than temporary impairment (“OTTI”) losses, recognized in operations; and the effects of changes in fair value of the reinsurance related embedded derivative and other derivatives, including interest rate swaps and forwards;
(ii) Market related liability adjustments: the impacts related to changes in the fair value, including both realized and unrealized gains and losses, of index product related derivatives and embedded derivatives, net of hedging cost; the impact of initial pension risk transfer deferred profit liability losses, including amortization from previously deferred pension risk transfer deferred profit liability losses; and the changes in the fair value of market risk benefits by deferring current period changes and amortizing that amount over the life of the market risk benefit;
(iii) Purchase price amortization: the impacts related to the amortization of certain intangibles (internally developed software, trademarks and value of distribution asset and the change in fair value of liabilities recognized as a result of acquisition activities);
(iv) Transaction costs: the impacts related to acquisition, integration and merger related items;
(v) Other and “non-recurring,” “infrequent” or “unusual items”: Other adjustments include removing any charges associated with U.S. guaranty fund assessments as these charges neither relate to the ordinary course of the Company’s business nor reflect the Company’s underlying business performance, but result from external situations not controlled by the Company. Further, Management excludes certain items determined to be “non-recurring,” “infrequent” or “unusual” from adjusted net earnings when incurred if it is determined these expenses are not a reflection of the core business and when the nature of the item is such that it is not reasonably likely to recur within two years and/or there was not a similar item in the preceding two years;
(vi) Non-controlling interest on non-GAAP adjustments: the portion of the non-GAAP adjustments attributable to the equity interest of entities that F&G does not wholly own; and
(vii) Income taxes: the income tax impact related to the above-mentioned adjustments is measured using an effective tax rate, as appropriate by tax jurisdiction.
While these adjustments are an integral part of the overall performance of F&G, market conditions and/or the non-operating nature of these items can overshadow the underlying performance of the core business. Accordingly, management considers this to be a useful measure internally and to investors and analysts in analyzing the trends of our operations. Adjusted net earnings should not be used as a substitute for net earnings (loss). However, we believe the adjustments made to net earnings (loss) in order to derive adjusted net earnings provide an understanding of our overall results of operations.
For example, we could have strong operating results in a given period, yet report net income that is materially less, if during such period the fair value of our derivative assets hedging the indexed annuity and IUL index credit obligations decreased due to general equity market conditions but the embedded derivative liability related to the
index credit obligation did not decrease in the same proportion as the derivative assets because of non-equity market factors such as interest rate and non-performance credit spread movements. Similarly, we could also have poor operating results in a given period yet show net earnings (loss) that is materially greater, if during such period the fair value of the derivative assets increased but the embedded derivative liability did not increase in the same proportion as the derivative assets. We hedge our index credits with a combination of static and dynamic strategies, which can result in earnings volatility, the effects of which are generally likely to reverse over time. Our management and board of directors review adjusted net earnings and net earnings (loss) as part of their examination of our overall financial results. However, these examples illustrate the significant impact derivative and embedded derivative movements can have on our net earnings (loss). Accordingly, our management performs a review and analysis of these items, as part of their review of our hedging results each period.
Amounts attributable to the fair value accounting for derivatives hedging the indexed annuities and IUL index credits and the related embedded derivative liability fluctuate from period to period based upon changes in the derivative’s underlying index, changes in the interest rates and non-performance credit spreads used to discount the embedded derivative liability, and the fair value assumptions reflected in the embedded derivative liability. The accounting standards for fair value measurement require the discount rates used in the calculation of the embedded derivative liability to be based on risk-free interest rates adjusted for our non-performance as of the reporting date. The impact of the change in fair values of these derivatives and hedging costs has been removed from net earnings (loss) in calculating adjusted net earnings.
Adjusted Return on Assets attributable to Common Shareholders
Adjusted return on assets attributable to common shareholders is calculated by dividing year-to-date annualized adjusted net earnings attributable to common shareholders by year-to-date AAUM. Return on assets is comprised of net investment income, less cost of funds, flow reinsurance fee income, owned distribution margin and less expenses (including operating expenses, interest expense and income taxes) consistent with our adjusted net earnings definition and related adjustments. Cost of funds includes liability costs related to cost of crediting as well as other liability costs. Management considers this non-GAAP financial measure to be useful internally and to investors and analysts when assessing financial performance and profitability earned on AAUM.
Assets Under Management (“AUM”)
AUM is comprised of the following components and is reported net of reinsurance assets ceded in accordance with GAAP:
(i) total invested assets at amortized cost, excluding investments in unconsolidated affiliates, owned distribution and derivatives;
(ii) investments in unconsolidated affiliates at carrying value;
(iii) related party loans and investments;
(iv) accrued investment income;
(v) the net payable/receivable for the purchase/sale of investments; and
(vi) cash and cash equivalents excluding derivative collateral at the end of the period.
Management considers this non-GAAP financial measure to be useful internally and to investors and analysts when assessing the size of our investment portfolio that is retained.
Average Assets Under Management (“AAUM”)
AAUM is calculated as AUM at the beginning of the period and the end of each month in the period, divided by the total number of months in the period plus one.
Management considers this non-GAAP financial measure to be useful internally and to investors and analysts when assessing the rate of return on retained assets.
Sales
Annuity, IUL, funding agreement and non-life contingent PRT sales are not derived from any specific GAAP income statement accounts or line items and should not be viewed as a substitute for any financial measure determined in accordance with GAAP. Sales from these products are recorded as deposit liabilities (i.e., contractholder funds) within the Company's consolidated financial statements in accordance with GAAP. Life contingent PRT sales are recorded as premiums in revenues within the consolidated financial statements. Management believes that presentation of sales, as measured for management purposes, enhances the understanding of our business and helps depict longer term trends that may not be apparent in the results of operations due to the timing of sales and revenue recognition.
Total F&G Equity attributable to common shareholders, excluding AOCI
Total F&G equity attributable to common shareholder, excluding AOCI is based on total F&G Annuities & Life, Inc. shareholders' equity excluding the effect of AOCI and preferred stocks, including additional paid-in-capital. Since AOCI fluctuates from quarter to quarter due to unrealized changes in the fair value of available for sale investments, changes in instrument-specific credit risk for market risk benefits and discount rate assumption changes for the future policy benefits, management considers this non-GAAP financial measure to be useful internally and for investors and analysts to assess the level of return driven by the Company that is available to common shareholders.
Yield on AAUM
Yield on AAUM is calculated by dividing annualized net investment income by AAUM. Management considers this non-GAAP financial measure to be useful internally and to investors and analysts when assessing the level of return earned on AAUM.
Results of Operations
The results of operations for the years ended December 31, 2024, 2023 and 2022 were as follows (in millions):
| | | | | | | | | | | | | | | | | |
| Year ended December 31, |
| 2024 | | 2023 | | 2022 |
| Revenues | | | | | |
| Life insurance premiums and other fees | $ | 2,860 | | | $ | 2,413 | | | $ | 1,704 | |
| Interest and investment income | 2,719 | | | 2,211 | | | 1,655 | |
| Owned distribution revenues | 81 | | | — | | | — | |
| Recognized gains and (losses), net | 84 | | | (124) | | | (1,010) | |
| Total revenues | 5,744 | | | 4,500 | | | 2,349 | |
| Benefits and expenses | | | | | |
| Benefits and other changes in policy reserves | 3,791 | | | 3,553 | | | 1,126 | |
| Market risk benefit (gains) losses | (25) | | | 95 | | | (182) | |
| Depreciation and amortization | 569 | | | 412 | | | 324 | |
| Personnel costs | 296 | | | 232 | | | 157 | |
| Other operating expenses | 203 | | | 146 | | | 102 | |
| Interest expense | 132 | | | 97 | | | 29 | |
| Total benefits and expenses | 4,966 | | | 4,535 | | | 1,556 | |
| Earnings (loss) before income taxes | 778 | | | (35) | | | 793 | |
| Income tax expense | 136 | | | 23 | | | 158 | |
| Net earnings (loss) | 642 | | | (58) | | | 635 | |
| Less: Non-controlling interests | 3 | | | — | | | — | |
| Net earnings (loss) attributable to F&G | 639 | | | (58) | | | 635 | |
| Less: Preferred stock dividend | 17 | | | — | | | — | |
| Net earnings (loss) attributable to F&G common shareholders | $ | 622 | | | $ | (58) | | | $ | 635 | |
The following table summarizes sales by product type (in millions) (see “Non-GAAP Financial Measures”):
| | | | | | | | | | | | | | | | | |
| Year ended December 31, |
| 2024 | | 2023 | | 2022 |
| Indexed annuities ("FIA/RILA") | $ | 6,729 | | | $ | 4,699 | | | $ | 4,550 | |
| Fixed rate annuities ("MYGA") | 5,105 | | | 5,066 | | | 3,744 | |
| Total annuity | 11,834 | | | 9,765 | | | 8,294 | |
| IUL | 166 | | | 156 | | | 127 | |
| Funding agreements ("FABN/FHLB") | 1,020 | | | 1,256 | | | 1,443 | |
| PRT | 2,242 | | | 1,976 | | | 1,390 | |
| Gross sales | 15,262 | | | 13,153 | | | 11,254 | |
| Sales attributable to flow reinsurance to third parties | (4,691) | | | (3,915) | | | (2,248) | |
| Net sales | $ | 10,571 | | | $ | 9,238 | | | $ | 9,006 | |
•Total annuity sales were higher during the years ended December 31, 2024 and 2023, reflecting F&G's productive and expanding retail distribution through independent agents, banks and broker-dealers, enhanced product features and pricing actions taken to align to the macro environment.
•Funding agreements, reflecting new FABN and FHLB agreements, were lower for the years ended December 31, 2024 and 2023, and are subject to fluctuation period to period based on economic conditions and the timing of entering the new agreements.
•PRT sales increased during the years ended December 31, 2024 and 2023, reflecting the timing of PRT transactions that are also subject to fluctuation period to period. During the year ended December 31, 2024, we closed 12 pension risk transfer transactions. Since entering the pension risk transfer market in 2021
through December 31, 2024, we have closed 32 transactions involving approximately 115,000 plan participants and resulting in over $7 billion cumulative plan transaction value from inception.
•Sales attributable to flow reinsurance to third parties were higher during the years ended December 31, 2024 and 2023, primarily reflecting the addition of new reinsurance, the higher level of MYGA sales, and changes in the percentages ceded during the periods.
Revenues
Life Insurance Premiums and Other Fees
Life insurance premiums and other fees primarily reflect premiums on life-contingent PRTs and traditional life insurance products, which are recognized as revenue when due from the policyholder, as well as policy rider fees primarily on indexed annuity policies, the cost of insurance on IUL policies and surrender charges assessed against policy withdrawals in excess of the policyholder's allowable penalty-free amounts (up to 10% of the prior year's value, subject to certain limitations). The following table summarizes the Life insurance premiums and other fees, on the Consolidated Statements of Operations for the respective periods (in millions):
| | | | | | | | | | | | | | | | | |
| Year ended December 31, |
| 2024 | | 2023 | | 2022 |
| Life-contingent pension risk transfer premiums | $ | 2,217 | | | $ | 1,964 | | | $ | 1,362 | |
| Traditional life insurance and life-contingent immediate annuity premiums | 35 | | | 43 | | | 33 | |
| | | | | |
| Surrender charges | 268 | | | 103 | | | 58 | |
| Policyholder fees and other income | 340 | | | 303 | | | 251 | |
| Life insurance premiums and other fees | $ | 2,860 | | | $ | 2,413 | | | $ | 1,704 | |
•Life-contingent pension risk transfer premiums increased for the years ended December 31, 2024 and 2023, reflecting the timing of PRT transactions. As noted above, PRT premiums are subject to fluctuation period to period.
•Surrender charges increased for the years ended December 31, 2024 and 2023, primarily reflecting increases in withdrawals from policyholders with surrender charges and market value adjustments (“MVAs”), primarily on our indexed annuities policies. The increase in termination activity is primarily due to the higher interest rate environment. See “Item 1. Business – The Products We Offer – Withdrawal Option for Deferred Annuities,” in this Annual Report on Form 10-K for additional discussion on surrender charges and MVAs.
•Policyholder fees and other income increased for the years ended December 31, 2024 and 2023, primarily due to increased cost of insurance charges, net of changes in unearned revenue liabilities (“URL”) on IUL policies from growth in business and higher guaranteed minimum withdrawal benefit (“GMWB”) rider fees. GMWB rider fees are based on the policyholder's benefit base and are collected at the end of the policy year.
Interest and Investment Income
Below is a summary of interest and investment income (in millions):
| | | | | | | | | | | | | | | | | |
| Year ended December 31, |
| 2024 | | 2023 | | 2022 |
| | | | | |
| Fixed maturity securities, available-for-sale | $ | 2,181 | | | $ | 1,843 | | | $ | 1,431 | |
| Equity securities | 21 | | | 20 | | | 17 | |
| Preferred securities | 23 | | | 41 | | | 49 | |
| Mortgage loans | 273 | | | 229 | | | 186 | |
| Invested cash and short-term investments | 161 | | | 76 | | | 33 | |
| Limited partnerships | 323 | | | 229 | | | 110 | |
| | | | | |
| Other investments | 32 | | | 27 | | | 20 | |
| Gross investment income | 3,014 | | | 2,465 | | | 1,846 | |
| Investment expense | (295) | | | (254) | | | (191) | |
| Interest and investment income | $ | 2,719 | | | $ | 2,211 | | | $ | 1,655 | |
Interest and investment income is shown net of amounts attributable to certain funds withheld reinsurance agreements which is passed along to the reinsurer in accordance with the terms of these agreements. Interest and investment income attributable to these agreements, and thus excluded from the totals in the table above, was $636 million, $339 million and $109 million, for the years ended December 31, 2024, 2023 and 2022, respectively.
Our AAUM and yield on AAUM are summarized as follows (annualized) (dollars in millions) (see “Non-GAAP Financial Measures”):
| | | | | | | | | | | | | | | | | |
| Year ended December 31, |
| 2024 | | 2023 | | 2022 |
| AAUM | $ | 51,574 | | | $ | 46,044 | | | $ | 40,069 | |
| Yield on AAUM (at amortized cost) | 5.27 | % | | 4.80 | % | | 4.13 | % |
•AAUM was higher for the years ended December 31, 2024 and 2023, reflecting net new business asset flows, stable inforce retention and net debt proceeds.
•Interest and investment income was higher for the year ended December 31, 2024 compared to the year ended December 31, 2023, primarily due to $266 million from invested asset growth, $49 million from returns on alternative investments and $193 million of all other rate and mix impacts.
•Interest and investment income was higher for the year ended December 31, 2023 compared to the year ended December 31, 2022, primarily due to $258 million from invested asset growth, $192 million from returns on alternative investments and $106 million of all other rate and mix impacts.
Owned Distribution Revenues
Below is a summary of owned distribution revenues (in millions):
| | | | | | | | | | | | | | | | | | | |
| | Year ended December 31, | |
| | 2024 | | 2023 | | 2022 | |
| Owned distribution revenues | | $ | 81 | | | $ | — | | | $ | — | | |
| Owned distribution revenues | | $ | 81 | | | $ | — | | | $ | — | | |
•Owned distribution revenues represent commissions received by our majority owned distribution partners generated from third-party annuity and life insurance sales. Override and bonus commissions are recognized as revenue at the effective date of each policy sold under a contract. Owned distribution revenues for the year ended December 31, 2024 represent revenues associated with the 2024 acquisitions of Roar and PALH, and primarily reflect commission revenues.
Recognized Gains and (Losses), Net
Below is a summary of the major components included in recognized gains and losses, net (in millions):
| | | | | | | | | | | | | | | | | |
| Year ended December 31, |
| 2024 | | 2023 | | 2022 |
| | | | | |
| Net realized and unrealized gains (losses) on fixed maturity available-for-sale securities, equity securities and other invested assets | $ | 76 | | | $ | (111) | | | $ | (461) | |
| Change in allowance for expected credit losses | (34) | | | (37) | | | (34) | |
| Net realized and unrealized gains (losses) on certain derivatives instruments | 70 | | | 147 | | | (857) | |
| Change in fair value of reinsurance related embedded derivatives | (32) | | | (128) | | | 352 | |
| Change in fair value of other derivatives and embedded derivatives | 4 | | | 5 | | | (10) | |
| Recognized gains and (losses), net | $ | 84 | | | $ | (124) | | | $ | (1,010) | |
Recognized gains and (losses), net is shown net of amounts attributable to certain funds withheld reinsurance agreements which is passed along to the reinsurer in accordance with the terms of these agreements. Recognized gains and (losses) attributable to these agreements, and thus excluded from the totals in the table above, was $(30) million, $(123) million and $381 million for the years ended December 31, 2024, 2023 and 2022, respectively.
•For the year ended December 31, 2024, net realized and unrealized gains (losses) on fixed maturity available-for-sale securities, equity securities and other invested assets is primarily the result of unrealized fair value option gains on owned distribution investments and mark-to-market gains on our preferred and equity securities.
•For the year ended December 31, 2023, net realized and unrealized gains (losses) on fixed maturity available-for-sale securities, equity securities and other invested assets is primarily the result of realized losses on fixed maturity available-for-sale securities, partially offset by mark-to-market gains on our equity securities and realized gains on other invested assets.
•For the year ended December 31, 2022, net realized and unrealized gains (losses) on fixed maturity available-for-sale securities, equity securities and other invested assets is primarily the result of realized losses on fixed maturity available-for-sale securities and mark-to-market losses on our equity securities.
•For all periods, net realized and unrealized gains (losses) on certain derivative instruments primarily relate to the net realized and unrealized gains (losses) on equity options and futures used to hedge indexed annuity and IUL products, including gains on option and futures expiration and changes in the fair value of interest rate swaps. See the table below for primary drivers of gains (losses) on certain derivatives.
•The fair value of reinsurance related embedded derivative is based on the change in fair value of the underlying assets held in the funds withheld (“FWH”) portfolio.
We utilize a combination of static (equity options) and dynamic (long futures contracts) instruments in our product hedging strategy. Equity options and futures contracts are generally based upon the performance of various equity indices, such as the S&P 500 Index, as well as other bond and gold market indices.
We utilize interest rate swaps to reduce market risks from interest rate changes on our earnings associated with our floating rate investments.
The components of the realized and unrealized gains (losses) on certain derivative instruments hedging our indexed annuities, universal life products and floating rate investments are summarized in the table below (in millions):
| | | | | | | | | | | | | | | | | |
| Year ended December 31, |
| 2024 | | 2023 | | 2022 |
| | | | | |
| Equity options: | | | | | |
| Realized gains (losses) | $ | 220 | | | $ | (216) | | | $ | (170) | |
| Change in unrealized (losses) gains | (75) | | | 308 | | | (692) | |
| Futures contracts: | | | | | |
| Gains (losses) on futures contracts expiration | 24 | | | 7 | | | (6) | |
| Change in unrealized (losses) gains | (6) | | | 2 | | | (1) | |
| Interest rate swap (losses) gains | (103) | | | 48 | | | — | |
| Other derivative investments | | | | | |
| Gains (losses) on other derivative investments | 10 | | | (2) | | | 12 | |
| Total net change in fair value | $ | 70 | | | $ | 147 | | | $ | (857) | |
| | | | | |
| Annual Point-to-Point Change in S&P 500 Index during the periods | 23 | % | | 24 | % | | (19) | % |
| Secured Overnight Financing Rates | 4.49 | % | | 5.38 | % | | 4.30 | % |
•Realized gains and (losses) on certain derivative instruments are directly correlated to the performance of the indices upon which the equity options and futures contracts are based and the value of the derivatives at the time of expiration compared to the value at the time of purchase.
•The changes in unrealized gains (losses) due to the net changes in fair value of equity options and futures contracts are driven by the underlying performance of the indices, such as the S&P 500 Index, upon which the equity options and futures contracts are based during each respective period relative to the respective indices on the policyholder buy dates.
•The net change in fair value of the interest rate swaps was primarily driven by fluctuations in the interest rate index underlying the swap contracts.
The average index credits to policyholders are as follows:
| | | | | | | | | | | | | | | | | |
| Year ended December 31, |
| 2024 | | 2023 | | 2022 |
| | | | | |
| Average Crediting Rate | 4 | % | | 1 | % | | 1 | % |
| S&P 500 Index: | | | | | |
| Point-to-point strategy | 4 | % | | 2 | % | | 1 | % |
| Monthly average strategy | 3 | % | | 1 | % | | 2 | % |
| Monthly point-to-point strategy | 5 | % | | — | % | | — | % |
| 3 year high water mark | 3 | % | | 8 | % | | 13 | % |
•Actual amounts credited to contractholder fund balances may differ from the index appreciation due to contractual features in the indexed annuity contracts and certain IUL contracts (caps, spreads and participation rates), which allow us to manage the cost of the options purchased to fund the annual index credits.
•The credits for the periods presented were based on comparing the S&P 500 Index on each issue date in the period to the same issue date in the respective prior year periods.
Benefits and Expenses
Benefits and Other Changes in Policy Reserves
Below is a summary of the major components included in Benefits and other changes in policy reserves (in millions):
| | | | | | | | | | | | | | | | | |
| Year ended December 31, |
| 2024 | | 2023 | | 2022 |
| | | | | |
| PRT agreements | $ | 2,310 | | | $ | 2,016 | | | $ | 1,399 | |
| Indexed annuities/IUL market related liability movements | (221) | | | 588 | | | (1,010) | |
| Index credits, interest credited and bonuses | 1,696 | | | 831 | | | 593 | |
| Other changes in policy reserves | 6 | | | 118 | | | 144 | |
| Total benefits and other changes in policy reserves | $ | 3,791 | | | $ | 3,553 | | | $ | 1,126 | |
•PRT agreements increased for the years ended December 31, 2024 and 2023 reflecting the timing of PRT transactions. PRT transactions are subject to fluctuation period to period.
•The indexed annuities/IUL market related liability movements for all periods presented are mainly driven by changes in the equity markets, non-performance spreads, and risk-free rates during the respective periods. The change in risk free rates and non-performance spreads increased (decreased) the indexed annuities market related liability by approximately $(203) million, $106 million and $(656) million during the years ended December 31, 2024, 2023 and 2022, respectively. The remaining changes in market value of the market related liability movements for all periods were primarily driven by equity market impacts. See “Revenues — Recognized gains and (losses), net” above for summary and discussion of net unrealized gains (losses) on certain derivative instruments.
•Annually, typically in the third quarter, we review assumptions associated with reserves for policy benefits and product guarantees.
•During the third quarter of 2024 and for the year ended December 31, 2024, based on policyholder behavior, experience and interest rate movements, we reflected updates to surrender assumptions for recent and expected near term policyholder behavior, as well as updated certain FIA assumptions used to calculate the fair value of the embedded derivative component within contractholder funds. These changes resulted in decreases in total benefits and other changes in policy reserves of approximately $89 million for the year ended December 31, 2024.
•During the third quarter and for the year ended December 31, 2023, based on increases in interest rates and pricing changes, we updated certain indexed annuities assumptions used to calculate the fair value of the embedded derivative component within contractholder funds and also aligned reserves to actual policyholder behavior. These changes, taken together, resulted in an increase in total benefits and other changes in policy reserves of approximately $73 million.
•During the fourth quarter of 2022, based on increases in interest rates and pricing changes during 2022, we updated certain indexed annuities assumptions used to calculate the fair value of the embedded derivative component within contractholder funds and the fair value of market risk benefits. These changes, taken together, resulted in an increase in contractholder funds and market risk benefits of approximately $99 million.
•Index credits, interest credited and bonuses were higher for the years ended December 31, 2024 and 2023, primarily reflecting higher index credits and interest credited on indexed annuities and other policies as a result of market movement during the respective periods and higher interest credited associated with the growth in PRT agreements.
Market Risk Benefit (Gains) Losses
Below is a summary of market risk benefit (gains) losses (in millions):
| | | | | | | | | | | | | | | | | |
| Year ended December 31, |
| 2024 | | 2023 | | 2022 |
| | | | | |
| Market risk benefit (gains) losses | $ | (25) | | | $ | 95 | | | $ | (182) | |
•Market risk benefit (gains) losses is primarily driven by issuances, attributed fees collected, effects of market related movements (including changes in equity markets and risk-free rates), actual policyholder behavior as compared with expected, changes in assumptions during the periods. Market risk benefit (gains) losses are reported net of reinsurance, reflecting an amended reinsurance agreement effective during the year ended December 31, 2024.
•Changes in market risk benefit (gains) losses for the year ended December 31, 2024, compared to the year ended December 31, 2023, primarily reflect more favorable market related movements and favorable actual policyholder behavior as compared to expected.
•Changes in market risk benefit (gains) losses for the year ended December 31, 2023, compared to the year ended December 31, 2022, primarily reflect less favorable market related movements, a favorable GMWB utilization assumption change in 2022 (that did not recur in 2023) and higher attributed fees. These changes were partially offset by actual policyholder behavior for the year ended December 31, 2023 being more in line with expected, as compared to the year ended December 31, 2022, resulting in a favorable change to the market risk benefit (gains) losses.
Depreciation and Amortization
Below is a summary of the major components included in depreciation and amortization (in millions):
| | | | | | | | | | | | | | | | | |
| Year ended December 31, |
| 2024 | | 2023 | | 2022 |
| | | | | |
| Amortization of DAC, VOBA and DSI | $ | 495 | | | $ | 382 | | | $ | 300 | |
| | | | | |
| | | | | |
| Amortization of other intangible assets and fixed asset depreciation | 74 | | | 30 | | | 24 | |
| Total depreciation and amortization | $ | 569 | | | $ | 412 | | | $ | 324 | |
•DAC, VOBA and DSI are amortized on a constant level basis for the grouped contracts over the expected term of the related contracts to approximate straight-line amortization. Amortization of DAC, VOBA and DSI increased for the years ended December 31, 2024 and 2023, primarily reflecting increased DAC and DSI associated with the growth of the business. In addition, as a result of our annual actuarial assumption update process, amortization rates on some DAC and DSI balances increased primarily for indexed annuities. Amortization of VOBA also increased approximately $15 million for the year ended December 31, 2024, reflecting other actuarial model updates and refinements.
•Amortization of other intangible assets and fixed asset depreciation for the year ended December 31, 2024 included amortization of other intangible assets from our majority owned interests in Roar and PALH.
Personnel Costs and Other Operating Expenses
Below is a summary of personnel costs and other operating expenses (in millions):
| | | | | | | | | | | | | | | | | |
| Year ended December 31, |
| 2024 | | 2023 | | 2022 |
| Personnel costs | $ | 296 | | | $ | 232 | | | $ | 157 | |
| Other operating expenses | 203 | | | 146 | | | 102 | |
| Total personnel costs and other operating expenses | $ | 499 | | | $ | 378 | | | $ | 259 | |
•Personnel costs and other operating expenses increased for the years ended December 31, 2024 and 2023, reflecting costs in line with the growth in sales and assets along with continued investments in our operating platform. In addition, the year ended December 31, 2024 includes $39 million from our majority owned interests in Roar and PALH, $26 million related to the change in fair value of contingent consideration and $19 million of guaranty fund assessments.
Interest expense
Below is a summary of interest expense (in millions):
| | | | | | | | | | | | | | | | | |
| Year ended December 31, |
| 2024 | | 2023 | | 2022 |
| Interest expense | $ | 132 | | | $ | 97 | | | $ | 29 | |
| Total interest expense | $ | 132 | | | $ | 97 | | | $ | 29 | |
•Interest expense increased for the year ended December 31, 2024 compared to the year ended December 31, 2023, primarily reflecting interest on the debt issuances in December 2023, June 2024, and October 2024, partially offset by lower interest resulting from a partial repayment of the 5.5% F&G Notes in June 2024 and lower balances on the revolving credit facility.
Other Items Affecting Net Earnings
Income Tax Expense
Below is a summary of the major components included in income tax expense (benefit) (dollars in millions):
| | | | | | | | | | | | | | | | | |
| Year ended December 31, |
| 2024 | | 2023 | | 2022 |
| | | | | |
| Earnings (loss) before taxes | $ | 778 | | | $ | (35) | | | $ | 793 | |
| | | | | |
| Income tax (benefit) expense before valuation allowance | 150 | | | (12) | | | 131 | |
| Change in valuation allowance | (14) | | | 35 | | | 27 | |
| Income tax expense | $ | 136 | | | $ | 23 | | | $ | 158 | |
| Effective rate | 17 | % | | (66) | % | | 20 | % |
•The income tax expense for the year ended December 31, 2024 was $136 million compared to income tax expense of $23 million for the year ended December 31, 2023. The effective tax rate was 17% and (66)%, respectively, for the years ended December 31, 2024 and December 31, 2023. The effective tax rate for the year ended December 31, 2024 differs from the statutory rate of 21% primarily due to favorable permanent adjustments and valuation allowance release on unrealized losses and capital loss carryforwards. The effective tax rate for the year ended December 31, 2023 differs from the statutory rate of 21% primarily due to a tax valuation allowance expense recorded on unrealized losses and capital loss carryforwards. The effective tax rate for the year ended December 31, 2022 differs from the statutory rate of 21% primarily due to favorable permanent tax adjustments.
•See Note H - Income Taxes to the Consolidated Financial Statements in Item 8 of Part II of this Annual Report on Form 10-K for further information.
Adjusted Net Earnings (See “—Non-GAAP Financial Measures”)
The table below shows the adjustments made to reconcile Net earnings (loss) attributable to common shareholders to Adjusted net earnings attributable to common shareholders (in millions):
| | | | | | | | | | | | | | | | | |
| Year ended December 31, |
| 2024 | | 2023 | | 2022 |
| | | | | |
| Net earnings (loss) attributable to common shareholders | $ | 622 | | | $ | (58) | | | $ | 635 | |
| | | | | |
| | | | | |
| Non-GAAP adjustments: | | | | | |
| Recognized (gains) and losses, net | | | | | |
| Net realized and unrealized (gains) losses on fixed maturity available-for-sale securities, equity securities and other invested assets | (76) | | | 98 | | | 446 | |
| Change in allowance for expected credit losses | 32 | | | 48 | | | 24 | |
| Change in fair value of reinsurance related embedded derivatives | 33 | | | 128 | | | (352) | |
| Change in fair value of other derivatives and embedded derivatives | 38 | | | (60) | | | (1) | |
| Recognized (gains) losses, net | 27 | | | 214 | | | 117 | |
| Market related liability adjustments | (214) | | | 258 | | | (534) | |
| Purchase price amortization | 84 | | | 22 | | | 21 | |
| Transaction costs, other and non-recurring items | 16 | | | 3 | | | 10 | |
| Non-controlling interest | (10) | | | — | | | — | |
| Income taxes adjustment | 21 | | | (104) | | | 104 | |
| Adjusted net earnings attributable to common shareholders | $ | 546 | | | $ | 335 | | | $ | 353 | |
| | | | | |
| | | | | |
| | | | | |
The commentary below is intended to provide additional information on the significant income and expense items that help explain the trends in our adjusted net earnings for each time period, as we believe these items provide further clarity to the financial performance of the business.
•Adjusted net earnings of $546 million for the year ended December 31, 2024 included $514 million of investment income from alternative investments and $46 million of CLO redemptions and bond prepay income, and $14 million tax valuation allowance, partially offset by $26 million of net expense from actuarial assumption and model updates and other items. Alternative investments investment income based on management’s long-term expected return of approximately 10% was $659 million.
•Adjusted net earnings of $335 million for the year ended December 31, 2023 included $405 million of investment income from alternative investments and $5 million of bond prepay income, partially offset by $37 million tax valuation allowance, $10 million of one-time fixed asset impairment charge and $9 million actuarial industry assumption updates. Alternative investments investment income based on management’s long-term expected return of approximately 10% was $558 million.
•Adjusted net earnings of $353 million for the year ended December 31, 2022 included $202 million of
investment income from alternative investments, $66 million gain from actuarial assumption updates, $20
million net, tax benefits and $13 million net, CLO redemption gains and other income and expense items.
Alternative investments investment income based on management’s long-term expected return of
approximately 10% was $419 million.
•.
Investment Portfolio
The types of assets in which we may invest are influenced by various state laws, which prescribe qualified investment assets applicable to insurance companies. Within the parameters of these laws, we invest in assets giving consideration to four primary investment objectives: (i) maintain robust absolute returns; (ii) provide reliable yield and investment income; (iii) preserve capital; and (iv) provide liquidity to meet policyholder and other corporate obligations.
Our investment portfolio is designed to contribute stable earnings, excluding short-term mark-to-market effects, and balance risk across diverse asset classes and is primarily invested in high quality fixed income securities.
As of December 31, 2024 and December 31, 2023, the fair value of our investment portfolio was approximately $60 billion and $52 billion, respectively, and was divided among the following asset classes and sectors (dollars in millions):
| | | | | | | | | | | | | | | | | | | | | | | | | | | | | | |
| December 31, 2024 | | | December 31, 2023 | | |
| Fair Value | | Percent | | | Fair Value | | Percent | | | | |
| | | | | | | | | | | | |
| Fixed maturity securities, available for sale: | | | | | | | | | | | | |
| United States Government full faith and credit | $ | 158 | | | — | % | | | $ | 261 | | | 1 | % | | | | |
| United States Government sponsored entities | 95 | | | — | | | | 31 | | | — | | | | | |
| United States municipalities, states and territories | 1,346 | | | 2 | | | | 1,567 | | | 3 | | | | | |
| Foreign Governments | 186 | | | — | | | | 226 | | | — | | | | | |
| Corporate securities: | | | | | | | | | | | | |
| Finance, insurance and real estate | 8,611 | | | 14 | | | | 6,895 | | | 13 | | | | | |
| Manufacturing, construction and mining | 1,139 | | | 2 | | | | 947 | | | 2 | | | | | |
| Utilities, energy and related sectors | 2,971 | | | 5 | | | | 2,374 | | | 5 | | | | | |
| Wholesale/retail trade | 3,210 | | | 5 | | | | 2,433 | | | 5 | | | | | |
| Services, media and other | 4,547 | | | 8 | | | | 3,930 | | | 8 | | | | | |
| Hybrid securities | 581 | | | 1 | | | | 618 | | | 1 | | | | | |
| Non-agency residential mortgage-backed securities | 2,693 | | | 5 | | | | 2,393 | | | 5 | | | | | |
| Commercial mortgage-backed securities | 5,131 | | | 9 | | | | 4,410 | | | 9 | | | | | |
| Asset-backed securities | 10,270 | | | 17 | | | | 8,929 | | | 17 | | | | | |
| Collateral loan obligations | 5,379 | | | 9 | | | | 5,405 | | | 10 | | | | | |
| Total fixed maturity available for sale securities | 46,317 | | | 77 | | | | 40,419 | | | 79 | | | | | |
| Equity securities (a) | 415 | | | 1 | | | | 606 | | | 1 | | | | | |
| Limited partnerships: | | | | | | | | | | | | |
| Private equity | 1,830 | | | 3 | | | | 1,277 | | | 2 | | | | | |
| Real assets | 437 | | | 1 | | | | 463 | | | 1 | | | | | |
| Credit | 1,021 | | | 2 | | | | 1,039 | | | 2 | | | | | |
| Limited partnerships | 3,288 | | | 6 | | | | 2,779 | | | 5 | | | | | |
| Commercial mortgage loans | 2,404 | | | 4 | | | | 2,253 | | | 4 | | | | | |
| Residential mortgage loans | 2,916 | | | 5 | | | | 2,545 | | | 5 | | | | | |
| Other (primarily derivatives, company owned life insurance and unconsolidated owned distribution investments) | 1,753 | | | 3 | | | | 1,697 | | | 3 | | | | | |
| Short term investments | 2,410 | | | 4 | | | | 1,452 | | | 3 | | | | | |
| Total investments | $ | 59,503 | | | 100 | % | | | $ | 51,751 | | | 100 | % | | | | |
(a)Includes investment grade non-redeemable preferred stocks ($222 million and $428 million at December 31, 2024 and 2023, respectively).
Insurance statutes regulate the type of investments that our life insurance subsidiaries are permitted to make and limit the amount of funds that may be used for any one type of investment. In light of these statutes and regulations, and our business and investment strategy, we generally seek to invest in primarily high-grade fixed-income assets across a wide range of sectors, including Corporate securities, U.S. Government and government-sponsored agency securities, and Structured securities, among others.
The NAIC’s Securities Valuation Office (“SVO”) is responsible for the day-to-day credit quality assessment and valuation of securities owned by state regulated insurance companies. Insurance companies report ownership of securities to the SVO when such securities are eligible for regulatory filings. The SVO conducts credit analysis on these securities for the purpose of assigning an NAIC designation or unit price. Typically, if a security has been rated by a nationally recognized statistical rating organization (“NRSRO”), the SVO utilizes that rating and assigns an NAIC designation based upon the NAIC published comparison of NRSRO ratings to NAIC designations.
The NAIC determines ratings for non-agency Residential Mortgage-backed Securities (“RMBS”) and commercial mortgage-backed securities using modeling that estimates security level expected losses under a variety of economic scenarios. For such assets issued prior to January 1, 2013, an insurer’s amortized cost basis in applicable assets can impact the assigned rating. In the tables below, we present the rating of structured securities
based on ratings from the NAIC rating methodologies described above (which in some cases do not correspond to rating agency designations). All NAIC designations (e.g., NAIC 1-6) are based on the NAIC methodologies.
The following table summarizes the credit quality by NRSRO rating, or NAIC designation equivalent, of our fixed income portfolio (dollars in millions) at December 31, 2024 and 2023:
| | | | | | | | | | | | | | | | | | | | | | | | | | | | | | | | | | | | | | | | | | | | | | | | | |
| | December 31, 2024 | | | December 31, 2023 | | | | |
NRSRO
Rating | NAIC Designation | Amortized Cost | | Fair Value | | Fair Value Percent | | | Amortized Cost | | Fair Value | | Fair Value Percent | | | | | | | | |
| AAA/AA/A | 1 | $ | 31,258 | | | $ | 29,174 | | | 63 | % | | | $ | 28,052 | | | $ | 26,170 | | | 65 | % | | | | | | | | |
| BBB | 2 | 16,254 | | | 15,082 | | | 33 | | | | 13,421 | | | 12,302 | | | 30 | | | | | | | | | |
| BB | 3 | 1,591 | | | 1,538 | | | 3 | | | | 1,633 | | | 1,554 | | | 4 | | | | | | | | | |
| B | 4 | 375 | | | 353 | | | 1 | | | | 268 | | | 215 | | | 1 | | | | | | | | | |
| CCC | 5 | 100 | | | 68 | | | — | | | | 103 | | | 72 | | | — | | | | | | | | | |
| CC and lower | 6 | 151 | | | 102 | | | — | | | | 124 | | | 106 | | | — | | | | | | | | | |
Total | | $ | 49,729 | | | $ | 46,317 | | | 100 | % | | | $ | 43,601 | | | $ | 40,419 | | | 100 | % | | | | | | | | |
| | | | | | | | | | | | | | | | | | | | | |
| | | | | | | | | | | | | | | | | | | | | |
| | | | | | | | | | | | | | | | | | | | | |
| | | | | | | | | | | | | | | | | | | | | |
| | | | | | | | | | | | | | | | | | | | | |
| | | | | | | | | | | | | | | | | | | | | |
Investment Concentrations
The tables below present the top ten structured security and industry categories of our fixed maturity and equity securities including the fair value and percent of total fixed maturity and equity securities fair value as of December 31, 2024 and 2023 (dollars in millions):
| | | | | | | | | | | | | | |
| | December 31, 2024 |
| Top 10 Concentrations | | Fair Value | | Percent of Total Fair Value |
| ABS other | | $ | 10,270 | | | 22 | % |
| CLO securities | | 5,379 | | | 11 | |
| Commercial mortgage-backed securities | | 5,131 | | | 11 | |
| Diversified financial services | | 4,271 | | | 9 | |
| Whole loan collateralized mortgage obligation | | 2,635 | | | 6 | |
| Banking | | 1,988 | | | 4 | |
| Insurance | | 1,761 | | | 4 | |
| Municipal | | 1,363 | | | 3 | |
| Electric | | 1,229 | | | 3 | |
| Pharmaceuticals | | 738 | | | 1 | |
| Total | | $ | 34,765 | | | 74 | % |
| | | | | | | | | | | | | | |
| | December 31, 2023 |
| Top 10 Concentrations | | Fair Value | | Percent of Total Fair Value |
| ABS other | | $ | 8,929 | | | 22 | % |
| CLO securities | | 5,405 | | | 13 | |
| Commercial mortgage-backed securities | | 4,410 | | | 11 | |
| Diversified financial services | | 3,272 | | | 8 | |
| Banking | | 2,048 | | | 5 | |
| Whole loan collateralized mortgage obligation | | 2,043 | | | 5 | |
| Municipal | | 1,600 | | | 4 | |
| Insurance | | 1,567 | | | 4 | |
| Electric | | 1,086 | | | 3 | |
| Telecommunications | | 696 | | | 2 | |
| Total | | $ | 31,056 | | | 77 | % |
The amortized cost and fair value of fixed maturity AFS securities by contractual maturities as of December 31, 2024 (dollars in millions), are shown below. Actual maturities may differ from contractual maturities because issuers may have the right to call or prepay obligations.
| | | | | | | | | | | | | | | | | | | | | | | | |
| December 31, 2024 | | | | | | | |
| Amortized Cost | | Fair Value | | | | | | | | | | | | | |
| Corporate, Non-structured Hybrids, Municipal, Foreign and U.S. Government securities: | | | | | | | | | | | | | | | | |
| Due in one year or less | $ | 525 | | | $ | 524 | | | | | | | | | | | | | | |
| Due after one year through five years | 3,634 | | | 3,589 | | | | | | | | | | | | | | |
| Due after five years through ten years | 4,930 | | | 4,756 | | | | | | | | | | | | | | |
| Due after ten years | 16,675 | | | 13,880 | | | | | | | | | | | | | | |
| Subtotal | 25,764 | | | 22,749 | | | | | | | | | | | | | | |
| Other securities, which provide for periodic payments | | | | | | | | | | | | | | | | |
| Asset-backed securities | 15,777 | | | 15,649 | | | | | | | | | | | | | | |
| Commercial mortgage-backed securities | 5,327 | | | 5,131 | | | | | | | | | | | | | | |
| | | | | | | | | | | | | | | | |
| Residential mortgage-backed securities | 2,861 | | | 2,788 | | | | | | | | | | | | | | |
| Subtotal | 23,965 | | | 23,568 | | | | | | | | | | | | | | |
| Total fixed maturity available-for-sale securities | $ | 49,729 | | | $ | 46,317 | | | | | | | | | | | | | | |
Non-Agency RMBS Exposure
Our investment in non-agency RMBS securities is predicated on the conservative and adequate cushion between purchase price and NAIC 1 rating, general lack of sensitivity to interest rates, positive convexity to prepayment rates and correlation between the price of the securities and the unfolding recovery of the housing market.
The fair value of our investments in subprime securities and Alt-A RMBS securities were $29 million and $44 million as of December 31, 2024, respectively, and $33 million and $49 million as of December 31, 2023, respectively. As of December 31, 2024 and 2023, approximately 93% and 95%, respectively, of the subprime and Alt-A RMBS exposures were rated NAIC 2 or higher.
ABS and CLO Exposures
Our ABS exposures are largely diversified by underlying collateral and issuer type. Our CLO exposures are generally senior tranches of CLOs which have leveraged loans as their underlying collateral.
As of December 31, 2024, the CLO and ABS positions were trading at a net unrealized gain position of $92 million and a net unrealized loss of $207 million, respectively. As of December 31, 2023, the CLO and ABS positions were trading at a net unrealized gain position of $65 million and a net unrealized loss position of $344 million, respectively.
The following table summarizes the credit quality by NRSRO rating, or NAIC designation equivalent, of our AFS ABS portfolio at December 31, 2024 and 2023 (dollars in millions) .
| | | | | | | | | | | | | | | | | | | | | | | | | | | | | |
| | December 31, 2024 | | | December 31, 2023 |
| | Fair Value | | Percent | | | Fair Value | | Percent |
| NRSRO Rating | NAIC Designation | | | | | | | | |
| AAA/AA/A | 1 | $ | 7,963 | | | 78 | % | | | $ | 7,023 | | | 79 | % |
| BBB | 2 | 1,633 | | 16 | | | | 1,375 | | 15 | |
| BB | 3 | 445 | | 4 | | | | 418 | | 5 | |
| B | 4 | 183 | | 2 | | | | 59 | | 1 | |
| CCC | 5 | 8 | | — | | | | 13 | | — | |
| CC and lower | 6 | 38 | | — | | | | 41 | | — | |
| Total | | $ | 10,270 | | | 100 | % | | | $ | 8,929 | | | 100 | % |
The following table summarizes the credit quality by NRSRO rating, or NAIC designation equivalent, of our AFS CLO portfolio at December 31, 2024 and 2023 (dollars in millions).
| | | | | | | | | | | | | | | | | | | | | | | | | | | | | |
| | December 31, 2024 | | | December 31, 2023 |
| | Fair Value | | Percent | | | Fair Value | | Percent |
| NRSRO Rating | NAIC Designation | | | | | | | | |
| AAA/AA/A | 1 | $ | 3,411 | | | 63 | % | | | $ | 3,288 | | | 61 | % |
| BBB | 2 | 1,396 | | 26 | | | | 1,582 | | 29 | |
| BB | 3 | 524 | | 10 | | | | 480 | | 9 | |
| B | 4 | 10 | | — | | | | 17 | | — | |
| CCC | 5 | — | | — | | | | — | | — | |
| CC and lower | 6 | 38 | | 1 | | | | 38 | | 1 | |
| Total | | $ | 5,379 | | | 100 | % | | | $ | 5,405 | | | 100 | % |
Municipal Bond Exposure
The following table summarizes our municipal bond exposure as of December 31, 2024 and 2023 (dollars in millions).
| | | | | | | | | | | | | | | | | | | | | | | | | | |
| December 31, 2024 | | | December 31, 2023 |
| Amortized Cost | | Fair Value | | | Amortized Cost | | Fair Value |
| General obligation bonds | $ | 247 | | | $ | 205 | | | | $ | 269 | | | $ | 232 | |
| Special revenue bonds | 1,329 | | | 1,128 | | | | 1,507 | | | 1,335 | |
| Certificate participations | 16 | | | 13 | | | | — | | | — | |
| Total | $ | 1,592 | | | $ | 1,346 | | | | $ | 1,776 | | | $ | 1,567 | |
Across all municipal bonds, the largest issuer represented 5% of the category and less than 1% of the total portfolio for both December 31, 2024 and 2023, and is rated NAIC 1 as of December 31, 2024. Our focus within municipal bonds is on NAIC 1 rated instruments, with 97% and 98% of our municipal bond exposure rated NAIC 1 as of December 31, 2024 and 2023, respectively.
Mortgage Loans
Commercial Mortgage Loans
We diversify our commercial mortgage loans (“CMLs”) portfolio by geographic region and property type to attempt to reduce concentration risk. We continuously evaluate CMLs based on relevant current information to ensure properties are performing at a level to secure the related debt. Loan-to-value (“LTV”) and debt service coverage (“DSC”) ratios are utilized to assess the risk and quality of CMLs. As of December 31, 2024 and December 31, 2023, our mortgage loans on real estate portfolio had a weighted average DSC ratio of 2.3 times, and a weighted average LTV ratio of 57% and 55%, respectively.
We consider a CML delinquent when a loan payment is greater than 30 days past due. For mortgage loans that are determined to require foreclosure, the carrying value is reduced to the fair value of the underlying collateral, net of estimated costs to obtain and sell at the point of foreclosure. At December 31, 2024, we had one CML that was delinquent in principal or interest payments compared to none at December 31, 2023. At December 31, 2024 and 2023, we had no CMLs in the process of foreclosure. See Note C - Investments to the Consolidated Financial Statements included in this report for additional information on our CMLs, including our distribution by property type, geographic region, LTV and DSC ratios.
Residential Mortgage Loans (“RML”)
Our residential mortgage loans are closed end, amortizing loans and 100% of the properties are in the United States. We diversify our RML portfolio by state to attempt to reduce concentration risk. RMLs have a primary credit quality indicator of either a performing or non-performing loan. We define non-performing RMLs as those that are 90 or more days past due and/or in non-accrual status.
Loans are placed on non-accrual status when they are over 90 days delinquent. If a loan becomes over 90 days delinquent, it is our general policy to initiate foreclosure proceedings unless a workout arrangement to bring the loan current can be put in place. See Note C - Investments to the Consolidated Financial Statements included in this Annual Report on Form 10-K for additional information on our RMLs.
Unrealized Losses
The amortized cost and fair value of the fixed maturity securities and the equity securities that were in an unrealized loss position as of December 31, 2024 and 2023, were as follows (dollars in millions):
| | | | | | | | | | | | | | | | | | | | | | | | | | | | | |
| December 31, 2024 |
| Number of Securities | | Amortized Cost | | Allowance for Expected Credit Losses | | Unrealized Losses | | Fair Value |
| Fixed maturity securities, available for sale: | | | | | | | | | |
| United States Government full faith and credit | 29 | | | $ | 106 | | | $ | — | | | $ | (3) | | | $ | 103 | |
| United States Government sponsored agencies | 64 | | | 92 | | | — | | | (4) | | | 88 | |
| United States municipalities, states and territories | 176 | | | 1,476 | | | — | | | (249) | | | 1,227 | |
| Foreign Governments | 43 | | | 224 | | | — | | | (45) | | | 179 | |
| Corporate securities: | | | | | | | | | |
| Finance, insurance and real estate | 840 | | | 6,596 | | | — | | | (728) | | | 5,868 | |
| Manufacturing, construction and mining | 156 | | | 1,173 | | | — | | | (161) | | | 1,012 | |
| Utilities, energy and related sectors | 477 | | | 3,000 | | | — | | | (542) | | | 2,458 | |
| Wholesale/retail trade | 523 | | | 3,111 | | | — | | | (497) | | | 2,614 | |
| Services, media and other | 640 | | | 4,679 | | | — | | | (874) | | | 3,805 | |
| Hybrid securities | 31 | | | 515 | | | — | | | (29) | | | 486 | |
| Non-agency residential mortgage-backed securities | 314 | | | 1,370 | | | — | | | (101) | | | 1,269 | |
| Commercial mortgage-backed securities | 344 | | | 2,552 | | | (41) | | | (200) | | | 2,311 | |
| Asset-backed securities | 355 | | | 4,148 | | | (11) | | | (317) | | | 3,820 | |
| Total fixed maturity available for sale securities | 3,992 | | | 29,042 | | | (52) | | | (3,750) | | | 25,240 | |
| Equity securities | 31 | | | 363 | | | — | | | (87) | | | 276 | |
| Total investments | 4,023 | | | $ | 29,405 | | | $ | (52) | | | $ | (3,837) | | | $ | 25,516 | |
| | | | | | | | | | | | | | | | | | | | | | | | | | | | | |
| December 31, 2023 |
| Number of Securities | | Amortized Cost | | Allowance for Expected Credit Losses | | Unrealized Losses | | Fair Value |
| Fixed maturity securities, available for sale: | | | | | | | | | |
| United States Government full faith and credit | 8 | | | $ | 15 | | | $ | — | | | $ | (1) | | | $ | 14 | |
| United States Government sponsored agencies | 56 | | | 30 | | | — | | | (3) | | | 27 | |
| United States municipalities, states and territories | 180 | | | 1,498 | | | — | | | (222) | | | 1,276 | |
| Foreign Governments | 50 | | | 209 | | | — | | | (39) | | | 170 | |
| Corporate securities: | | | | | | | | | |
| Finance, insurance and real estate | 637 | | | 5,529 | | | — | | | (690) | | | 4,839 | |
| Manufacturing, construction and mining | 117 | | | 965 | | | — | | | (135) | | | 830 | |
| Utilities, energy and related sectors | 316 | | | 2,402 | | | — | | | (471) | | | 1,931 | |
| Wholesale/retail trade | 332 | | | 2,165 | | | — | | | (397) | | | 1,768 | |
| Services, media and other | 401 | | | 3,370 | | | — | | | (686) | | | 2,684 | |
| Hybrid securities | 36 | | | 597 | | | — | | | (53) | | | 544 | |
| Non-agency residential mortgage-backed securities | 244 | | | 1,118 | | | (2) | | | (101) | | | 1,015 | |
| Commercial mortgage-backed securities | 435 | | | 3,198 | | | (22) | | | (323) | | | 2,853 | |
| Asset-backed securities | 800 | | | 8,078 | | | (9) | | | (470) | | | 7,599 | |
| Total fixed maturity available for sale securities | 3,612 | | | 29,174 | | | (33) | | | (3,591) | | | 25,550 | |
| Equity securities | 41 | | | 567 | | | — | | | (100) | | | 467 | |
| Total investments | 3,653 | | | $ | 29,741 | | | $ | (33) | | | $ | (3,691) | | | $ | 26,017 | |
The gross unrealized loss position on the fixed maturity available-for-sale fixed and equity portfolio was $3,837 million and $3,691 million as of December 31, 2024 and 2023, respectively. Most components of the portfolio exhibited price depreciation caused by higher treasury rates as opposed to issuer specific credit concerns. The total amortized cost of all securities in an unrealized loss position was $29,405 million and $29,741 million as of December 31, 2024 and 2023, respectively. The average market value/book value of the investment category with the largest unrealized loss position was 81% for services, media and other as of December 31, 2024. In the aggregate, services, media and other represented 23% of the total unrealized loss position as of December 31, 2024. The average market value/book value of the investment category with the largest unrealized loss position was 88% for finance, insurance and real estate as of December 31, 2023. In the aggregate, finance, insurance and real estate represented 19% of the total unrealized loss position as of December 31, 2023.
The amortized cost and fair value of fixed maturity available for sale securities under watch list analysis and the number of months in a loss position with investment grade securities (NRSRO rating of BBB/Baa or higher) as of December 31, 2024 and 2023, were as follows (dollars in millions):
| | | | | | | | | | | | | | | | | | | | | | | | | | | | | |
| December 31, 2024 |
| Number of Securities | | Amortized Cost | | Fair Value | | Allowance for Credit Loss | | Gross Unrealized Losses |
| Investment grade: | | | | | | | | | |
| Less than six months | 8 | | | $ | 54 | | | $ | 52 | | | $ | — | | | $ | (2) | |
| Six months or more and less than twelve months | — | | | — | | | — | | | — | | | — | |
| Twelve months or greater | 107 | | | 1,443 | | | 959 | | | — | | | (484) | |
| Total investment grade | 115 | | | 1,497 | | | 1,011 | | | — | | | (486) | |
| | | | | | | | | |
| Below investment grade: | | | | | | | | | |
| Less than six months | — | | | — | | | — | | | — | | | — | |
| Six months or more and less than twelve months | — | | | — | | | — | | | — | | | — | |
| Twelve months or greater | 5 | | | 82 | | | 51 | | | — | | | (31) | |
| Total below investment grade | 5 | | | 82 | | | 51 | | | — | | | (31) | |
| Total | 120 | | | $ | 1,579 | | | $ | 1,062 | | | $ | — | | | $ | (517) | |
| | | | | | | | | | | | | | | | | | | | | | | | | | | | | |
| December 31, 2023 |
| Number of Securities | | Amortized Cost | | Fair Value | | Allowance for Credit Loss | | Gross Unrealized Losses |
| Investment grade: | | | | | | | | | |
| Less than six months | 1 | | | $ | 15 | | | $ | 14 | | | $ | — | | | $ | (1) | |
| Six months or more and less than twelve months | 1 | | | 54 | | | 44 | | | — | | | (10) | |
| Twelve months or greater | 47 | | | 634 | | | 444 | | | — | | | (190) | |
| Total investment grade | 49 | | | 703 | | | 502 | | | — | | | (201) | |
| | | | | | | | | |
| Below investment grade: | | | | | | | | | |
| Less than six months | — | | | — | | | — | | | — | | | — | |
| Six months or more and less than twelve months | — | | | — | | | — | | | — | | | — | |
| Twelve months or greater | 3 | | | 19 | | | 15 | | | — | | | (4) | |
| Total below investment grade | 3 | | | 19 | | | 15 | | | — | | | (4) | |
| Total | 52 | | | $ | 722 | | | $ | 517 | | | $ | — | | | $ | (205) | |
Expected Credit Losses and Watch List
We prepare a watch list to identify securities to evaluate for expected credit losses. Factors used in preparing the watch list include fair values relative to amortized cost, ratings and negative ratings actions and other factors. Detailed analysis is performed for each security on the watch list to further assess the presence of credit impairment loss indicators and, where present, calculate an allowance for expected credit loss or direct write-down of a security’s amortized cost.
At December 31, 2024, our watch list included 120 securities in an unrealized loss position with an amortized cost of $1,579 million, no allowance for expected credit losses, unrealized losses of $517 million and a fair value of $1,062 million.
At December 31, 2023, our watch list included 52 securities in an unrealized loss position with an amortized cost of $722 million, no allowance for expected credit losses, unrealized losses of $205 million and a fair value of $517 million.
The watch list excludes structured securities as we have separate processes to evaluate the credit quality on the structured securities.
There were 45 and 101 structured securities with a fair value of $146 million and $316 million, respectively to which we had potential credit exposure as of December 31, 2024 and 2023, respectively. Our analysis of these structured securities, which included cash flow testing, resulted in allowances for expected credit losses of $62 million and $35 million as of December 31, 2024 and 2023, respectively.
Exposure to Sovereign Debt and Certain Other Exposures
Our investment portfolio had an immaterial amount of direct exposure to European sovereign debt as of December 31, 2024 and 2023, respectively. We have no exposure to investments in Russia or Ukraine and de minimis investments in peripheral countries in the region.
Interest and Investment Income
For discussion regarding our net investment income and net investment gains (losses) refer to Note C - Investments to the Consolidated Financial Statements included in this Annual Report on Form 10-K.
AFS Securities
For additional information regarding our AFS securities, including the amortized cost, gross unrealized gains (losses), and fair value as well as the amortized cost and fair value of fixed maturity AFS securities by contractual maturities, as of December 31, 2024 and 2023, refer to Note C - Investments to the Consolidated Financial Statements included in this Annual Report on Form 10-K.
Concentrations of Financial Instruments
For certain information regarding our concentrations of financial instruments, refer to Note C - Investments to the Consolidated Financial Statements included in this Annual Report on Form 10-K.
Derivatives
We are exposed to credit loss in the event of non-performance by our counterparties on derivative instruments. We attempt to reduce this credit risk by purchasing such derivative instruments from large, well-established financial institutions.
We also hold cash and cash equivalents received from counterparties for derivative instrument collateral, as well as U.S. Government securities pledged as derivative instrument collateral, if our counterparty’s net exposures exceed pre-determined thresholds.
We are required to pay counterparties the effective federal funds rate each day for cash collateral posted to F&G for daily mark-to-market margin changes. We reduce the negative interest cost associated with cash collateral posted from counterparties under various ISDA agreements by reinvesting derivative cash collateral. This program permits collateral cash received to be invested in short term Treasury securities, bank deposits and commercial paper rated A1/P1, which are included in Cash and cash equivalents in the Consolidated Balance Sheets.
See Note D - Derivatives to the Consolidated Financial Statements included in Part II - Item 8 of this Annual Report on Form 10-K for additional information regarding our derivatives and our exposure to credit loss on derivatives.
Liquidity and Capital Resources
Liquidity refers to the ability of an enterprise to generate adequate amounts of cash from its normal operations to meet cash requirements with a prudent margin of safety. Our principal sources of cash flow from operating activities are annuity considerations, insurance premiums, and fees and investment income. We also generate cash inflows from investing activities resulting from maturities and sales of invested assets and from financing activities including inflows on our investment-type products, proceeds from borrowing activities and issuances of preferred stock. Our operating activities provided cash of $5,999 million and $5,834 million for the years ended December 31, 2024 and 2023, respectively. When considering our liquidity and cash flow, it is important to distinguish between the needs of our insurance subsidiaries and the needs of the holding company, F&G Annuities & Life, Inc. As a holding company with no operations of its own, F&G Annuities & Life, Inc. derives its cash primarily from its insurance subsidiaries and CF Bermuda Holdings Ltd. (“CF Bermuda”), a Bermuda exempted limited liability company and a wholly owned direct subsidiary of the Company, a downstream holding company that provides additional sources of liquidity. Dividends from our insurance subsidiaries flow through CF Bermuda to F&G Annuities & Life, Inc. F&G Cayman Re, a licensed class D insurer in the Cayman Islands and a wholly owned direct subsidiary of the Company, could also provide dividends directly to F&G Annuities & Life, Inc.
The sources of liquidity of the holding company are principally comprised of dividends from subsidiaries, lines of credit (at the F&G Annuities & Life, Inc. level), existing surplus notes, investment income on holding company assets and the ability to raise long-term public financing under an SEC-filed registration statement or private placement offering. These sources of liquidity and cash flow support the general corporate needs of the holding company, interest and debt service, funding acquisitions and investment in core businesses.
On January 2, 2024, F&G acquired a 70% majority ownership stake in the equity of Roar Joint Venture, LLC (“Roar”). Roar wholesales life insurance and annuity products to banks and broker-dealers through a network of agents. Total initial consideration is comprised of cash of approximately $269 million and contingent consideration. Under the terms of the purchase agreement, the Company has agreed to make cash payments of up to approximately $90 million over a 3 year period upon the achievement of certain earnings before interest, taxes, depreciation and amortization (“EBITDA”) milestones of Roar.
On January 12, 2024 we completed a $250 million preferred stock investment from FNF. Net proceeds from the investment have been used to support the growth of F&G’s assets under management. Under the terms of the agreement, FNF agreed to invest $250 million in exchange for 5,000,000 shares of FNF Preferred Stock. Unless earlier converted at the option of the holder, each outstanding share of the FNF Preferred Stock will automatically convert into shares of F&G common stock on January 15, 2027. Generally, no dividends will be declared or paid on F&G common stock and no common stock can be acquired by F&G unless all preferred dividends are declared and paid on the outstanding FNF Preferred Stock.
The offer and the sale of the FNF Preferred Stock were made in a private placement pursuant to an exemption from registration under Section 4(a)(2) of the Securities Act. The agreement was negotiated pursuant to market terms and pricing by a Special Committee of F&G’s Board of Directors comprised of independent members of the Board, in consultation with an independent financial advisor and independent legal counsel.
On February 16, 2024, F&G entered into an amendment and extension of its existing senior unsecured revolving credit agreement (the “Credit Agreement”). The maturity date of the Credit Agreement was extended by approximately two years from November 22, 2025 to November 22, 2027. Total borrowing availability increased from $665 million to $750 million. Pricing and advance rates remain unchanged. Financial covenants also remain essentially the same. As noted below, we used $365 million of net proceeds from our 6.250% F&G Notes to pay off the Credit Agreement. As of December 31, 2024, the balance of the Credit Agreement was $0 and the borrowing capacity was $750 million.
On June 4, 2024, F&G completed its public offering of $550 million aggregate principal amount of its 6.50% Senior Notes due 2029 (the “6.50% F&G Notes”). The 6.50% F&G Notes are guaranteed on an unsecured, unsubordinated basis by each of F&G’s subsidiaries that are guarantors of F&G’s obligations under its existing credit agreement. A portion of the net proceeds were used to finance a cash tender offer by its wholly owned subsidiary Fidelity & Guaranty Life Holdings, Inc. (“FGLH”) for an aggregate principal amount of $250 million of FGLH’s 5.50% Senior Notes due 2025 (the “5.50% F&G Notes”).
On July 18, 2024, F&G acquired a 100% ownership stake in the equity of PALH, LLC (“PALH”). PALH markets and sells life insurance and annuity products of various insurance carriers to individuals through a network of agents. Prior to the acquisition date, PALH owned a 70% ownership stake in an operating company of which F&G owned 30% equity. Total consideration of approximately $314 million is comprised of cash of $215 million, settlement of a prepaid asset of $8 million, acquisition date fair value of the previously held interests of $92 million, net of $1 million cash acquired.
On October 4, 2024, F&G completed its public offering of its 6.250% Senior Notes due 2034 with the aggregate principal amount of $500 million (the “6.250% F&G Notes”).The 6.250% F&G Notes are guaranteed on an unsecured, unsubordinated basis by each of F&G’s subsidiaries that are guarantors of F&G’s obligations under its existing credit agreement. A portion of the net proceeds were used to pay off the outstanding balance of $365 million on the Company’s revolving credit facility.
Cash Requirements. Our current cash requirements include personnel costs, operating expenses, benefit payments, funding agreement payments, taxes, payments of interest and principal on our debt, capital expenditures, business acquisitions, stock repurchases and dividends on our common stock. For the year ended December 31, 2024, we paid common and preferred dividends of approximately $121 million.
On November 6, 2024, our Board of Directors declared a quarterly cash dividend of $0.8594 per share on the FNF Preferred Stock for the period from October 15, 2024 to and excluding January 15, 2025, which was paid on January 15, 2025, to FNF Preferred Stock record holders on January 1, 2025. On February 20, 2025, our Board of Directors declared a quarterly cash dividend of $0.22 per common share, payable on March 31, 2025, to F&G common shareholders of record as of March 17, 2025. On February 20, 2025, our Board of Directors also declared a quarterly cash dividend of $0.8594 per share on the FNF Preferred Stock for the period from January 15, 2025 to and excluding April 15, 2025, to be paid on April 15, 2025, to FNF Preferred Stock record holders as of April 1, 2025.
There are no restrictions on our retained earnings regarding our ability to pay dividends to our shareholders, although there are limits on the ability of certain subsidiaries to pay dividends to us, as described below. As discussed above, there are certain conditions on the declaration and payment of dividends pursuant to our recent preferred stock issuance. The declaration of any future dividends is at the discretion of our Board of Directors.
In 2023, F&G’s Board of Directors approved a three-year stock repurchase program, under which the Company may repurchase up to $50 million of F&G common stock. Purchases may be made from time to time by the Company in the open market at prevailing market prices or through privately negotiated transactions or accelerated share repurchase transactions through November 6, 2026. All purchases are held as treasury stock. The timing and extent of share repurchases will depend on a variety of factors, including, market conditions, regulatory requirements, and considerations as determined by management. No shares were repurchased pursuant to the program during the year ended December 31, 2024, compared to approximately 869,000 shares for a total cost of approximately $18 million with an average cost per share of $21.07 for the year ended December 31, 2023. At December 31, 2024, the total remaining authorization of F&G common stock that may be repurchased was approximately $32 million.
As of December 31, 2024 and 2023, we had cash and cash equivalents of $2,264 million and $1,563 million, respectively, and short term investments of $2,410 million and $1,452 million, respectively. As of December 31, 2024 we had $200 million of capacity under our revolving credit facility with FNF (the “FNF Credit Facility”). No amounts were outstanding under the FNF Credit Facility as of December 31, 2024 or 2023. The FNF Credit Facility matures October 29, 2025, or when the Revolving Credit Facility described above is terminated, whichever occurs first. We continually assess our capital allocation strategy, including decisions relating to the amount of our dividend, if any, reducing debt, investing in growth of our subsidiaries, making acquisitions and/or conserving cash. We believe that all anticipated cash requirements for current operations will be met from internally generated funds, through cash dividends from subsidiaries, cash generated by investment securities, potential sales of non-strategic assets, potential issuances of additional debt or equity securities, and borrowings on the revolving credit facility or the FNF Credit Facility. Our short-term and long-term liquidity requirements are monitored regularly to ensure that we can meet our cash requirements. We forecast the needs of all our subsidiaries and periodically review their short-term and long-term projected sources and uses of funds, as well as the asset, liability, investment and cash flow assumptions underlying such forecasts. Refer to Financing Arrangements below and Note L - Notes Payable of the Consolidated Financial Statements in Part II - Item 8 of this Annual Report on Form 10-K for further information regarding our borrowings.
Our two significant sources of internally generated funds are dividends and other payments from our subsidiaries. As a holding company, we receive cash from our subsidiaries in the form of dividends and as reimbursement for operating and other administrative expenses we incur. The reimbursements are paid within the guidelines of management agreements among us and our subsidiaries. As discussed below, our insurance subsidiaries are restricted by state regulation and other laws in their ability to pay dividends and make distributions.
The maximum dividend permitted by law is not necessarily indicative of an insurer’s actual ability to pay dividends, which may be constrained by business and regulatory considerations, such as the impact of dividends on surplus, which could affect an insurer’s ratings or competitive position, the amount of premiums that can be written and the ability to pay future dividends.
Dividend and Other Distribution Payment Limitations
The insurance laws of Iowa and New York regulate the amount of dividends that may be paid in any year by FGL Insurance and FGL NY Insurance, respectively. In 2024, FGL Insurance did not pay dividends to its parent, Fidelity & Guaranty Life Holdings, Inc. (“FGLH”). FGL Insurance’s maximum ordinary dividend capacity for 2025 is $0. FGL NY Insurance has historically not paid dividends. Under the laws of the State of Vermont, Raven Re and Corbeau Re cannot pay dividends out of, or other distribution with respect to, capital or surplus, without prior approval. Likewise, the insurance laws of Bermuda limit the maximum amount of annual dividends and distributions that may be paid or distributed by F&G Life Re without prior regulatory approval and those of the Cayman Islands require that, among other things, F&G Cayman Re maintain minimum levels of statutory capital, surplus and liquidity, meet solvency standards, submit to periodic examinations of its financial condition and restrict payments of dividends and reductions of capital. Please refer to “Item 1. Business - Regulation of F&G” of Part I of this Annual Report on Form 10-K and Note O - Insurance Subsidiary Financial Information and Regulatory Matters to the Consolidated Financial Statements included in Part II - Item 8 of this Annual Report on Form 10-K, for additional details on risk-based capital, statutory capital and dividend and other distribution payment limitations.
Cash Flow from our Operations
Cash flow from our operations will be used for general corporate purposes including to reinvest in operations, repay debt, pay dividends, repurchase stock, pursue other strategic initiatives and/or conserve cash.
Operating Cash Flow. Our cash flows provided by operations for the years ended December 31, 2024, 2023, and 2022 were $5,999 million, $5,834 million and $3,171 million, respectively. The primary cash inflows from operating activities include net investment income and insurance premiums. The primary cash outflows from operating activities are comprised of benefit payments and operating expenses. Cash provided by operations for the years ended December 31, 2024 and 2023 included approximately $1,800 million and $1,300 million of net cash received for PRT transactions, respectively, included in the change in future policy benefits.
Investing Cash Flows. Our cash used in investing activities for the years ended December 31, 2024, 2023, and 2022 were $7,953 million, $8,918 million, $9,370 million, respectively. The primary cash inflows from investing activities are the proceeds from sales, calls, maturities and redemptions of investments, including those resulting from our portfolio repositioning. The primary cash outflows from investing activities are the purchases of fixed maturity securities and other investments. Cash used in investing activities for the years ended December 31, 2024 and 2023 included purchases of fixed maturity securities and other investments associated with investing the net cash received from our investment-type products, generated from financing cash flows and PRT transactions, generated from operating activities, as well as cash received from borrowings generated from financing activities in both periods. Cash used in investing activities for the year ended December 31, 2024 also included net cash outflows of $482 million for the Roar and PALH acquisitions.
Financing Cash Flows. Our cash flows provided by financing activities for the years ended December 31, 2024, 2023, and 2022 were $2,655 million, $3,687 million and $5,626 million, respectively and reflected lower net contractholder deposits for the years ended December 31, 2024 and 2023. Contractholder account deposits and withdrawals in 2024 included FABN issuances of approximately $600 million and withdrawals of $820 million as compared to no FABN issuances and withdrawals of $53 million for 2023. In addition, cash provided by financing activities for the year ended December 31, 2024 included borrowing proceeds of $1,050 million, portions of which were used to finance a $250 million cash tender offer on the 5.50% F&G Notes and for net revolving credit facility repayments of $365 million, and proceeds of $250 million from the issuance of the FNF Preferred Stock, all discussed above, partially offset by dividend payments of approximately $121 million. Cash provided by financing activities for the year ended December 31, 2023 included proceeds from debt issuances of $845 million, partially offset by net partial revolver pay downs of $185 million, dividend payments of approximately $101 million and common stock repurchases of $18 million.
Financing Arrangements. At December 31, 2024, we had outstanding:
•$300 million aggregate principal amount of 5.50% F&G Notes,
•$500 million aggregate principal amount of our 7.40% Senior Notes due 2028 (the “7.40% F&G Notes”),
•$345 million aggregate principal amount of our 7.95% Senior Notes due 2053 (“the 7.95% F&G Notes”),
•$550 million aggregate principal amount of its 6.50% F&G Notes, and
•$500 million aggregate principal amount of our 6.250% F&G Notes.
For further description of our financing arrangements see Note L - Notes Payable to the Consolidated Financial Statements in Part II - Item 8 of this Annual Report on Form 10-K.
The Credit Agreement imposes significant operating and financial restrictions, including financial covenants, and the Credit Agreement and the indentures governing the 6.250% F&G Notes, 6.50% F&G Notes, 7.95% F&G Notes, the 7.40% F&G Notes, and the 5.50% F&G Notes limit, among other things, our and our subsidiaries’ ability to:
•incur or assume additional indebtedness, including guarantees;
•incur or assume liens;
•engage in mergers or consolidations;
•convey, transfer, lease or dispose of assets;
•make certain investments;
•enter into transactions with affiliates;
•declare or make any dividend payments or distributions or repurchase capital stock or other equity interests;
•change the nature of our business materially;
•make changes in accounting treatment or reporting practices that affect the calculation of financial covenants, or change our fiscal year; and
•enter into certain agreements that would restrict the ability of subsidiaries to make payments to us.
As of December 31, 2024, we were in compliance with all covenants.
Subsequent Events. On January 13, 2025, F&G completed its public offering of its 7.300% Junior Subordinated Notes due 2065 with an aggregate principal amount of $375 million (the “7.300% F&G Notes”). F&G intends to use the net proceeds of this offering for general corporate purposes, including the repurchase, redemption or repayment at maturity of outstanding indebtedness.
On February 1, 2025, F&G redeemed the outstanding $300 million aggregate principal amount of its 5.50% senior notes due May 1, 2025.
Obligations - Contractual and Other. As of December 31, 2024, our required annual payments relating to contractual and other obligations were as follows:
| | | | | | | | | | | | | | | | | | | | | | | | | | | | | | | | | | | | | | | | | |
| 2025 | | 2026 | | 2027 | | 2028 | | 2029 | | Thereafter | | Total |
| |
| Notes payable principal repayment | $ | 300 | | | $ | — | | | $ | — | | | $ | 500 | | | $ | 550 | | | $ | 845 | | | $ | 2,195 | |
| Operating lease payments | 2 | | | 2 | | | 2 | | | 2 | | | 1 | | | 1 | | | 10 | |
| Annuity and universal life products | 6,801 | | | 6,340 | | | 7,338 | | | 7,284 | | | 6,881 | | | 45,376 | | | 80,020 | |
| Pension risk transfer annuity payments | 854 | | | 821 | | | 793 | | | 763 | | | 734 | | | 8,922 | | | 12,887 | |
| Funding agreements (FABN / FHLB) | 796 | | | 1,514 | | | 1,690 | | | 1,052 | | | 429 | | | — | | | 5,481 | |
| Interest on fixed rate notes payable | 133 | | | 131 | | | 131 | | | 96 | | | 77 | | | 809 | | | 1,377 | |
| Total | $ | 8,886 | | | $ | 8,808 | | | $ | 9,954 | | | $ | 9,697 | | | $ | 8,672 | | | $ | 55,953 | | | $ | 101,970 | |
Reinsurance. Please refer to Note E - Reinsurance to the Consolidated Financial Statements in Part II - Item 8 of this Annual Report on Form 10-K for additional information on our reinsurance.
Preferred and Equity Security Investments. Our preferred and equity security investments may be subject to significant volatility. Currently prevailing accounting standards require us to record the change in fair value of preferred and equity security investments held as of any given period end within earnings. Our results of operations in future periods are anticipated to be subject to such volatility.
Off-Balance Sheet Arrangements. Throughout our history, we have entered in indemnifications in the ordinary course of business with our customers, suppliers, service providers, business partners and in certain instances, when we sold businesses. Additionally, we have indemnified our directors and officers who are, or were, serving at our request in such capacities. Although the specific terms or number of such arrangements is not precisely known due to the extensive history of our past operations, costs incurred to settle claims related to these indemnifications have not been material to our financial statements. We have no reason to believe that future costs to settle claims related to our former operations will have a material impact on our financial position, results of operations or cash flows.
We have unfunded commitments as of December 31, 2024 based upon the timing of when investments and agreements are executed or signed compared to when the actual commitments are funded or closed. Some investments require that funding occur over a period of months or years. Please refer to Note C -Investments and Note N - Commitments and Contingencies to the Consolidated Financial Statements in Part II - Item 8 of this Annual Report on Form 10-K for additional details on unfunded commitments.
FHLB Collateral. We are currently a member of the FHLB and are required to maintain a collateral deposit that backs any funding agreements issued. We use these funding agreements as part of a spread enhancement strategy. We have the ability to obtain funding from the FHLB based on a percentage of the value of our assets, subject to the availability of eligible collateral. Collateral is pledged based on the outstanding balances of FHLB funding agreements. The amount of funding varies based on the type, rating and maturity of the collateral posted to the FHLB. Generally, U.S. government agency notes, mortgage-backed securities, municipal bonds, and commercial and residential whole loans are pledged to the FHLB as collateral. Market value fluctuations resulting from changes in interest rates, spreads and other risk factors for each type of asset are monitored and additional collateral is either pledged or released as needed.
Our borrowing capacity under these credit facilities does not have an expiration date as long as we maintain a satisfactory level of creditworthiness based on the FHLB’s credit assessment. As of December 31, 2024 and 2023, we had $2,852 million and $2,514 million, respectively, in FHLB non-putable funding agreements included under contractholder funds on our Consolidated Balance Sheets. As of December 31, 2024 and 2023, we had assets with a fair value of approximately $4,289 million and $4,345 million, respectively, which collateralized the FHLB funding agreements. Assets pledged to the FHLB are primarily included in fixed maturities, AFS, on our Consolidated Balance Sheets.
Collateral-Derivative Contracts. Under the terms of our ISDA agreements, we may receive from, or deliver to, counterparties collateral to assure that all terms of the ISDA agreements will be met with regard to the Credit Support Annex (“CSA”). The terms of the CSA call for us to pay interest on any cash received equal to the federal funds rate. As of December 31, 2024 and 2023, $771 million and $775 million, respectively, of collateral was posted by our counterparties as they did not meet the net exposure thresholds. Collateral requirements are monitored on a daily basis and incorporate changes in market values of both the derivatives contract as well as the collateral pledged. Market value fluctuations are due to changes in interest rates, spreads and other risk factors.
Our cash flows associated with collateral received from and posted with counterparties change as the market value of the underlying derivative contract changes. As the value of a derivative asset declines (or increases), the collateral required to be posted by our counterparties would also decline (or increase). Likewise, when the value of a derivative liability declines (or increases), the collateral we are required to post to our counterparties would also decline (or increase).
Guarantor Financial Information
Our 2024 issuances of the 6.250% F&G Notes and 6.50% F&G Notes and the 2023 issuances of the 7.40% F&G Notes and the 7.95% F&G Notes are fully and unconditionally guaranteed on a senior, unsecured, unsubordinated basis, jointly and severally, by each of our existing and future direct and indirect subsidiaries that are guarantors of our obligations under the credit agreement (collectively, the “obligor group”). Refer to Note L - Notes Payable of the Consolidated Financial Statements in Part II - Item 8 of this Annual Report on Form 10-K for further information regarding these borrowings.
Set forth below is summarized unaudited financial information of the obligor group, as presented on a combined basis (dollars in millions). Intercompany transactions and balances within the obligor group have been eliminated. In addition, financial information of any non-guarantor subsidiaries, which would normally be consolidated by either F&G or the guarantors under GAAP, has been excluded from such presentation.
| | | | | | | | | | | |
| Year ended December 31, |
| 2024 | | 2023 |
| Summarized Statement of Operations: | | | |
| Total revenues | $ | 77 | | | $ | (5) | |
| Total expenses | (124) | | | (94) | |
| Income tax (expense) benefit | 3 | | | (1) | |
| Net loss | $ | (44) | | | $ | (100) | |
| | | |
| December 31, |
| 2024 | | 2023 |
| Summarized Balance Sheet: | | | |
| Investments | $ | 334 | | | $ | 532 | |
| Cash and cash equivalents | 272 | | | 322 | |
| Goodwill | 1,725 | | | 1,725 | |
| Due from non-guarantor affiliates | 77 | | | 64 | |
| Other assets | 42 | | | 33 | |
| Total assets | $ | 2,450 | | | $ | 2,676 | |
| | | |
| Notes payable | $ | 2,171 | | | $ | 1,754 | |
| Other liabilities | 167 | | | 145 | |
| Total liabilities | $ | 2,338 | | | $ | 1,899 | |
Item 7A. Quantitative and Qualitative Disclosures About Market Risk
In the normal course of business, we are routinely subject to a variety of risks, as described in “Part I - Item 1A Risk Factors” included in this Annual Report on Form 10-K.
The risks related to our business also include certain market risks that may affect our financial instruments and certain liabilities.
At present, we face market risks associated with our marketable equity securities, liability for Contractholder Funds, balances for MRBs which are subject to equity price volatility, and interest rate movements on both our fixed income investments and liabilities for debt, FPBs, MRBs, and Contractholder Funds.
We regularly assess these market risks and have established policies and business practices designed to protect against the adverse effects of these exposures.
Additionally, financial instruments, which potentially subject us to concentrations of credit risk, consist primarily of cash equivalents, derivatives, long-term investments and short-term investments. We require placement of cash in financial institutions evaluated as highly creditworthy.
Enterprise Risk Management
We place a high priority on risk management and risk control. As part of our effort to ensure measured risk taking, management has integrated risk management in our daily business activities and strategic planning. We have comprehensive risk management, governance and control procedures in place and have established a dedicated risk management function with responsibility for the formulation of our risk appetite, risk mitigation strategies, policies and limits. The risk management function is also responsible for monitoring our overall market risk exposures and provides review, oversight and support functions on risk-related issues. Our risk appetite is aligned with how our businesses are managed and anticipated future regulatory developments.
Our risk governance and control systems enable us to identify, control, monitor and aggregate risks and provide assurance that risks are being measured, monitored and reported adequately and effectively in accordance with the following three principles:
i.Management of the business has primary responsibility for the day-to-day management of risk.
ii.The risk management function has the primary responsibility to align risk taking with strategic planning through risk tolerance and limit setting.
iii.The internal audit function provides an ongoing independent and objective assessment of the effectiveness of internal controls.
The Chief Risk Officer (“CRO”) heads our risk management process and reports directly to our Chief Executive Officer (“CEO”). Our Enterprise Risk Management Committee (“ERMC”) reviews all risk policies, risk appetites, and discusses market risks associated with our activities. Market risks include the risks of losses due to an ineffective ALM program and the risk of losses arising from fluctuations in market prices, including interest rates, exchange rates, asset prices. These risks are monitored and assessed for appropriate mitigating activities to reduce the likelihood of erosion of the value of investments or trading positions that could result in financial losses or capital inadequacies.
We have implemented several limit structures to manage risk. Examples include, but are not limited to, the following:
i.At-risk limits on sensitivities of regulatory capital to the capital markets provide the fundamental framework to manage capital markets risks including the risk of asset / liability mismatch;
ii.Duration mismatch limits;
iii.Credit risk concentration limits; and
iv.Investment and derivative guidelines.
We manage our risk appetite based on two key risk metrics:
i.Regulatory Capital Sensitivities: the potential reduction, under a range of moderate to extreme capital markets stress scenarios, of the excess of available statutory capital above the minimum required under the NAIC regulatory RBC methodology; and
ii.Earnings Sensitivities: the potential reduction in results of operations over a 30-year time horizon under the same moderate to extreme capital markets stress scenario. Maintaining a consistent level of earnings helps us to finance our operations, support our capital requirements and provide funds to pay dividends to shareholders.
Our risk metrics cover the most important aspects in terms of performance measures where risk can materialize and are representative of the regulatory constraints to which our business is subject. The sensitivities for earnings
and statutory capital are important metrics since they provide insight into the level of risk we take under stress scenarios. They also are the basis for internal risk management.
We are also subject to cash flow stress testing pursuant to regulatory requirements. This analysis measures the effect of changes in interest rate assumptions on asset and liability cash flows. The analysis includes the effects of:
i.The timing and amount of redemptions and prepayments in our asset portfolio;
ii.Our derivative portfolio;
iii.Death benefits and other claims payable under the terms of our insurance products;
iv.Lapses and surrenders in our insurance products;
v.Minimum interest guarantees in our insurance products,
vi.Book value guarantees in our insurance products; and
vii.Reinvestment and disinvestment
Asset Liability Management (“ALM”)
As part of our ALM program, we have made a significant effort to identify the assets appropriate to different product lines and ensure investing strategies match the profile of these liabilities. We monitor ALM metrics (such as duration, key-rate durations, net cash flows and liquidity) and manage the risk exposures at levels that are consistent with our risk appetite. The ALM strategy is designed to align the expected cash flows from the investment portfolio with the expected liability cash flows. As such, a major component of our effort to manage interest rate risk has been to structure the investment portfolio with cash flow characteristics that are consistent with the cash flow characteristics of the insurance liabilities. We use actuarial models to simulate the cash flows expected from the existing business under various interest rate scenarios. These simulations enable us to measure the potential gain or loss in the fair value of interest rate-sensitive financial instruments, to evaluate the adequacy of expected cash flows from assets to meet the expected cash requirements of the liabilities and to determine if it is necessary to lengthen or shorten the average life and duration of our investment portfolio. Duration measures the price sensitivity of a security to a small change in interest rates. When the durations of assets and liabilities are similar, exposure to interest rate risk is minimized because a change in the value of assets could be expected to be largely offset by a change in the value of liabilities.
The durations of the investment portfolio, net of investments subject to reinsurance agreements and excluding cash and cash equivalents, derivatives, policy loans, and common stocks as of December 31, 2024 and December 31, 2023, are summarized as follows (dollars in millions):
| | | | | | | | | | | | | | | | | | | | | | | | | | |
| | December 31, 2024 | | December 31, 2023 |
| Duration (years) | | Amortized Cost | | % of Total | | Amortized Cost | | % of Total |
| 0-4 | | $ | 29,363 | | | 54 | % | | $ | 26,146 | | | 54 | % |
| 5-9 | | 12,526 | | | 23 | | | 10,455 | | | 21 | |
| 10-14 | | 10,448 | | | 19 | | | 9,943 | | | 20 | |
| 15-19 | | 1,862 | | | 4 | | | 2,650 | | | 5 | |
| 20-30 | | 33 | | | — | | | 69 | | | — | |
| Total | | $ | 54,232 | | | 100 | % | | $ | 49,263 | | | 100 | % |
Interest Rate Risk
Interest rate risk is our primary market risk exposure. We define interest rate risk as the risk of an economic loss due to adverse changes in interest rates. This risk arises from investing life insurance premiums and fixed annuity deposits received in interest-sensitive assets and carrying these funds as interest-sensitive liabilities. Substantial and sustained increases or decreases in market interest rates can affect the profitability of the insurance products and the fair value of our investments, as the majority of our insurance liabilities are backed by fixed maturity securities.
Investments
Increases and decreases in prevailing interest rates generally translate into decreases and increases in fair values of investments. Additionally, fair values of interest rate sensitive instruments may be affected by the creditworthiness of the issuer, prepayment options, relative values of alternative investments, the liquidity of the instrument and other general market conditions. We monitor our interest rate risk and make investment decisions to manage the perceived risk. We manage interest rate risk through a variety of measures, including pay-float and receive-fixed interest rate swaps to reduce market risks from interest rate changes on our earnings associated with floating rate investments.
Product Liabilities
The profitability of most of our products depends on the spreads between interest yield on investments and rates credited on insurance liabilities. We have the ability to adjust the rates credited on the majority of the annuity liabilities at least annually, subject to minimum guaranteed values. In addition, the majority of the annuity products have surrender and withdrawal penalty provisions designed to encourage persistency and to help ensure targeted spreads are earned. However, competitive factors, including the impact of the level of surrenders and withdrawals, may limit our ability to adjust or maintain crediting rates at the levels necessary to avoid a narrowing of spreads under certain market conditions.
In order to meet our policy and contractual obligations, we must earn a sufficient return on invested assets. Significant changes in interest rates expose us to the risk of not earning the anticipated spreads between the interest rate earned on its investments and the credited interest rates paid on outstanding policies and contracts. Both rising and declining interest rates can negatively affect interest earnings, spread income and the attractiveness of certain products.
During periods of increasing interest rates, we may offer higher crediting rates on interest-sensitive products, such as IUL insurance and fixed annuities, and may increase crediting rates on in-force products to keep these products competitive. A rise in interest rates, in the absence of other countervailing changes, will result in a decline in the market value of our investment portfolio, partially offset by gains related to the fair value of MRBs. In addition, some of our deferred annuity policies contain a market value adjustment (“MVA”) during the surrender charge period, where if interest rates have risen, the MVA will decrease the surrender value, whereas if rates have fallen, it will increase the surrender value. The MVA reduces market risk and earnings volatility from interest rate changes, should a policy surrender, as it offsets the decline in the market value of the investment portfolio in a rising rate scenario, and vice versa in a declining rate scenario
Additionally, at December 31, 2024, we had floating rate funding agreements outstanding to match certain of our floating rate investments. Accordingly, fluctuations in market interest rates on the funding agreements will be significantly offset by corresponding changes in investment income associated with our floating rate investments.
Notes Payable
At December 31, 2024, we had a short-term revolving credit facility that bears interest at a floating rate. Accordingly, depending on the amounts outstanding, fluctuations in market interest rates will have an impact on our resulting interest expense. The impact to net earnings, however, will again be significantly offset by corresponding changes in investment income associated with our floating rate investments. There was no balance outstanding on the revolving credit facility at December 31, 2024.
Equity Price Risk
Equity price risk is the risk that we will incur economic losses due to adverse changes in equity prices. In the past, our exposure to changes in equity prices primarily resulted from our holdings of equity securities. Refer to
Note B - Fair Value of Financial Instruments to the Consolidated Financial Statements included in Part II - Item 8 of this Annual Report on Form 10-K for additional details on how the carrying values of these investments are determined as of the balance sheet date. Carrying values are subject to fluctuation and, consequently, the amount realized in the subsequent sale of an investment may significantly differ from the reported carrying value. Fluctuation in the carrying value of a security may result from perceived changes in the underlying economic characteristics of the investee, the relative price of alternative investments and general market conditions. Furthermore, amounts realized in the sale of a particular security may be affected by the relative quantity of the security being sold.
We are also exposed to equity price risk through certain insurance products. We offer a variety of indexed annuities and IUL contracts with crediting strategies linked to the performance of indices such as the S&P 500 Index, Dow Jones Industrials or the NASDAQ 100 Index, and target volatility indices. Additionally, the estimated cost of providing GMWB on FIA products incorporates various assumptions about the overall performance of equity markets over certain time periods. Periods of significant and sustained downturns in equity markets or increased equity volatility could result in an increase in the valuation of the MRB liabilities and decrease in the valuation of contractholder funds liabilities associated with such products.
To economically hedge the equity returns on these products, we purchase derivatives to hedge the indexed annuities and IUL equity exposures. The primary way we hedge indexed annuities and IUL equity exposure is to purchase over the counter equity index equity options from broker-dealer derivative counterparties approved by F&G. The second way to hedge indexed annuities and IUL equity exposure is by purchasing exchange traded equity index futures contracts. This hedging strategy enables us to reduce the overall hedging costs and achieve a high correlation of returns on the equity options purchased relative to the index credits earned by the indexed annuity/IUL contractholders. The majority of the equity options are one-year options purchased to match the funding requirements underlying the indexed annuity/IUL contracts. These hedge programs are limited to the current policy term of the indexed annuity/IUL contracts. Future returns, which may be reflected in indexed annuity/IUL contracts’ credited rates beyond the current policy term, are not hedged. We attempt to manage the costs of these purchases through the terms of the indexed annuity/IUL contracts, which permit us to change cap, spread or participation rates, subject to certain guaranteed minimums that must be maintained.
The derivatives are used to fund the indexed annuities and IUL contract index credits and the cost of the equity options purchased is treated as a component of spread earnings. While the indexed annuity/IUL hedging program does not explicitly hedge GAAP income volatility, the indexed annuities/ IUL hedging program tends to mitigate a significant portion of the GAAP reserve changes associated with movements in the equity market. This is due to the fact that a key component in the calculation of GAAP reserves is the market valuation of the current term embedded derivative. Due to the alignment of the embedded derivative reserve component with hedging of this same embedded derivative, there should be a reasonable match between changes in this component of the reserve and changes in the assets backing this component of the reserve. However, there may be an interim mismatch due to the fact that the hedges, which are put in place are only intended to cover exposures expected to remain until the end of an indexing term. To the extent index credits earned by the contractholder exceed the proceeds from option expirations and futures income, we incur a raw hedging loss.
See Note D - Derivative Financial Instruments to the Consolidated Financial Statements included in Part II - Item 8 of this Annual Report on Form 10-K for additional details on the derivatives portfolio.
Fair value changes associated with these investments are intended to, but do not always, substantially offset the increase or decrease in the amounts added to contractholder funds for indexed products. When index credits to policyholders exceed option proceeds received at expiration related to such credits, any shortfall is funded by our excess of net investment income earned over the sum of interest credited to policyholders and the cost of hedging our risk on indexed product policies and futures income. For the years ended December 31, 2024, December 31, 2023 and December 31, 2022, the annual index credits to policyholders on their anniversaries were $725 million, $203 million and $155 million, respectively. Proceeds received at expiration of options related to such credits were $849 million, $212 million and $158 million, respectively.
Other market exposures are hedged periodically depending on market conditions and our risk tolerance. The indexed annuity/ IUL hedging strategy economically hedges the equity returns and exposes us to the risk that unhedged market exposures result in divergence between changes in the fair value of the liabilities and the hedging assets. We use a variety of techniques, including direct estimation of market sensitivities, to monitor this risk daily. We intend to continue to adjust the hedging strategy as market conditions and risk tolerance change.
Sensitivity Analysis
For purposes of this Annual Report on Form 10-K, we perform a sensitivity analysis to determine the effects that market risk exposures may have on various financial instruments.
The financial instruments that are included in the sensitivity analysis with respect to interest rate risk include fixed maturity investments, certain preferred securities, interest rate swaps, embedded derivatives, MRBs and floating rate notes payable and funding agreements. The financial instruments that are included in the sensitivity analysis with respect to equity price risk include marketable equity securities. With the exception of our equity method investments, it is not anticipated that there would be a significant change in the fair value of other long-term investments or short-term investments if there were a change in market conditions, based on the nature and duration of the financial instruments involved.
To perform the sensitivity analysis, we assess the risk of loss in fair values from the effect of hypothetical changes in interest rates and equity prices on market-sensitive instruments. The changes in fair values for interest rate risks are determined by estimating the present value of future cash flows using various models, primarily duration modeling. The changes in fair values for equity price risk are determined by comparing the market price of investments against their reported values as of the balance sheet date.
Information provided by the sensitivity analysis does not necessarily represent the actual changes in fair value that we would incur under normal market conditions because, due to practical limitations, all variables other than the specific market risk factor are held constant.
Market Risk Factors
Market risk is the risk of the loss of fair value resulting from adverse changes in market rates and prices, such as interest rates, foreign currency exchange rates, commodity prices and equity prices. Market risk is directly influenced by the volatility and liquidity in the markets in which the related underlying financial instruments are traded. We have significant holdings in financial instruments, which are naturally exposed to a variety of market risks. They are primarily exposed to interest rate risk, credit risk and equity price risk and have some exposure to counterparty risk, which affect the fair value of financial instruments subject to market risk.
We have no market risk sensitive instruments entered into for trading purposes; therefore, all of our market risk sensitive instruments were entered into for purposes other than trading. The results of the sensitivity analysis at December 31, 2024 is as follows:
Interest Rate Risk
An increase in the levels of interest rates of 100 basis points, with all other variables held constant, would result in a decrease in the fair value of our fixed maturity securities and certain investments in preferred securities of approximately $2.6 billion, a net decrease in the fair value of interest rate swaps of approximately $0.1 billion and a net decrease in the combined fair value of embedded derivatives and MRBs of approximately $0.6 billion at December 31, 2024. For comparison, a similar increase in the levels of interest rates of 100 basis points, with all other variables held constant, would have resulted in a decrease in the fair value of our fixed maturity securities and certain investments in preferred securities of approximately $2.4 billion, a net decrease in the fair value of interest rate swaps of approximately $0.1 billion and a net decrease in the combined fair value of embedded derivatives and MRBs of approximately $0.5 billion at December 31, 2023.
A 100 basis point shift in interest rates for our floating rate debt and funding agreements will increase or decrease floating expense by approximately $17 million and $14 million per year as of December 31, 2024 and December 31, 2023, respectively. As noted above, the impact to net earnings related to the interest rate swaps and floating rate notes payable and funding agreements will be significantly offset by corresponding changes in investment income associated with our floating rate investments.
The actuarial models used to estimate the impact of a one percentage point change in market interest rates incorporate numerous assumptions, require significant estimates and assume an immediate and parallel change in interest rates without any management of the investment portfolio in reaction to such change. Consequently, potential changes in value of financial instruments indicated by these simulations will likely be different from the actual changes experienced under given interest rate scenarios, and the differences may be material. Because we actively manage our investments and liabilities, the net exposure to interest rates can vary over time. However, any such decreases in the fair value of fixed maturity securities, unless related to credit concerns of the issuer requiring allowances for credit losses, would generally be realized only if we were required to sell such securities at losses prior to their maturity to meet liquidity needs. Our liquidity needs are managed using the surrender and withdrawal provisions of the annuity contracts and through other means.
Equity Price Risk
At December 31, 2024, a 10% decrease in market prices, with all other variables held constant, would result in a net decrease in the fair value of our equity securities portfolio of $42 million, as compared with a decrease of $61 million at December 31, 2023.
Credit Risk and Counterparty Risk
We are exposed to the risk that a counterparty will default on its contractual obligation resulting in financial loss. Our major source of credit risk arises predominantly in our insurance operations’ portfolios of debt and similar securities. The fair value of our fixed maturity portfolio totaled $46 billion at December 31, 2024. Our credit risk materializes primarily as impairment losses. We are exposed to occasional cyclical economic downturns, during which impairment losses may be significantly higher than the long-term historical average. This is offset by years where it expects the actual impairment losses to be substantially lower than the long-term average. Credit risk in the portfolio can also materialize as increased capital requirements as assets migrate into lower credit qualities over time. The effect of rating migration on our capital requirements is also dependent on the economic cycle and increased asset impairment levels may go hand in hand with increased asset related capital requirements.
We attempt to manage the risk of default and rating migration by applying disciplined credit evaluation and underwriting standards and limiting allocations to lower quality, higher risk investments. In addition, we diversify exposure by issuer and country, using rating-based issuer and country limits. We also set investment constraints that limit our exposure by industry segment. To limit the impact that credit risk can have on earnings and capital adequacy levels, we have portfolio-level credit risk constraints in place. Limit compliance is monitored on a monthly basis.
In connection with the use of derivative instruments, we are exposed to counterparty credit risk-the risk that a counterparty fails to perform under the terms of the derivative contract. We have adopted a policy of only dealing with credit worthy counterparties and obtaining sufficient collateral where appropriate, as a means of attempting to mitigate the financial loss from defaults. The exposure and credit rating of the counterparties are continuously monitored and the aggregate value of transactions concluded is spread amongst different approved counterparties to limit the concentration in one counterparty. This policy allows for the purchase of derivative instruments from counterparties and/or clearinghouses that meet the required qualifications under the insurance laws of Iowa. We review the ratings of all the counterparties periodically. Collateral support documents are negotiated to further reduce the exposure when deemed necessary. See Note D - Derivative Financial Instruments in the Consolidated Financial Statements included in Part II - Item 8 of this Annual Report on Form 10-K for additional information regarding our exposure to credit loss.
We also have credit risk related to the ability of reinsurance counterparties to honor their obligations to pay the contract amounts under various agreements. To minimize the risk of credit loss on such contracts, we diversify exposures among many reinsurers and limit the amount of exposure to each based on credit rating. We also generally limit selection of counterparties with which to do new transactions to those with an “A-” credit rating or above from at least one of the major rating agencies and/or that are appropriately collateralized and provide credit for reinsurance.
In the normal course of business, certain reinsurance recoverables are subject to reviews by the reinsurers. We are not aware of any material disputes arising from these reviews or other communications with the counterparties as of December 31, 2024 and December 31, 2023, that would require an increase to the allowance for credit losses.
For information on concentrations of reinsurance risk, refer to Note E - Reinsurance in the Consolidated Financial Statements included in Part II - Item 8 of this Annual Report on Form 10-K.
For further information on certain risk associated with our business, refer to Note N - Commitments and Contingencies in the Consolidated Financial Statements included in Part II - Item 8 of this Annual Report on Form 10-K.
Use of Estimates and Assumptions
The preparation of our Consolidated Financial Statements included in this Annual Report on Form 10-K in conformity with GAAP requires management to make estimates and assumptions that affect the reported amounts of assets and liabilities and disclosures of contingent assets and liabilities at the date of the financial statements and the reported amounts of revenues and expenses during the reporting period. Actual results could differ from those estimates and assumptions used.
Concentrations of Financial Instruments
Refer to Management's Discussion and Analysis of Financial Condition and Results of Operations - Investment Portfolio - Investment Concentrations included in Part II - Item 7 of this Annual Report on Form 10-K regarding the top ten investment concentrations of our fixed maturity and equity securities including the fair value and percent of total fixed maturity and equity securities fair value as of December 31, 2024 and December 31, 2023.
Refer to Note C - Investments in the Consolidated Financial Statements included in Part II - Item 8 of this Annual Report on Form 10-K for our underlying investment concentrations that exceed 10% of shareholders equity as of December 31, 2024 and December 31, 2023.
Concentrations of Financial and Capital Markets Risk
We are exposed to financial and capital markets risk, including changes in interest rates and credit spreads, which can have an adverse effect on our results of operations, financial condition and liquidity. Exposure to such financial and capital markets risk relates primarily to the market price and cash flow variability associated with changes in interest rates. A rise in interest rates, in the absence of other countervailing changes, will increase the net unrealized loss position and, if long-term interest rates rise dramatically within a six- to twelve-month time period, certain of our products may be exposed to disintermediation risk. Disintermediation risk refers to the risk that policyholders surrender their contracts in a rising interest rate environment, requiring us to liquidate assets in an unrealized loss position. We attempt to mitigate the risk, including changes in interest rates by investing in less rate-sensitive investments, including senior tranches of collateralized loan obligations, non-agency residential mortgage-backed securities, and various types of asset-backed securities. Management believes this risk is also mitigated to some extent by surrender charge and MVA protection provided by our products. We expect to continue to face these challenges and uncertainties that could adversely affect our results of operations and financial condition.
.
Item 8. Financial Statements and Supplementary Data
INDEX TO FINANCIAL INFORMATION
F&G ANNUITIES AND LIFE, INC. AND SUBSIDIARIES
| | | | | |
| Page
Number |
| Audited Consolidated Financial Statements | |
| |
| |
| |
| |
| |
| |
| |
| |
| Consolidated Financial Statement Schedules | |
| |
| |
| |
| |
Report of Independent Registered Public Accounting Firm
To the Shareholders and the Board of Directors of F&G Annuities & Life, Inc.
Opinion on Internal Control Over Financial Reporting
We have audited F&G Annuities & Life, Inc. and subsidiaries’ internal control over financial reporting as of December 31, 2024, based on criteria established in Internal Control—Integrated Framework issued by the Committee of Sponsoring Organizations of the Treadway Commission (2013 framework) (the COSO criteria). In our opinion, F&G Annuities & Life, Inc. and subsidiaries (the Company) maintained, in all material respects, effective internal control over financial reporting as of December 31, 2024, based on the COSO criteria.
As indicated in the accompanying Management’s Report on Internal Control Over Financial Reporting, management’s assessment of and conclusion on the effectiveness of internal control over financial reporting did not include the internal controls of Roar Joint Venture, LLC, which is included in the 2024 consolidated financial statements of the Company and constituted 0.49% and 10.29% of total assets and total equity, respectively, as of December 31, 2024 and 1.36% and 6.89% of revenues and net earnings attributable to F&G common shareholders, respectively, for the year then ended. Our audit of internal control over financial reporting of the Company also did not include an evaluation of the internal control over financial reporting of Roar Joint Venture, LLC.
We also have audited, in accordance with the standards of the Public Company Accounting Oversight Board (United States) (PCAOB), the consolidated balance sheets of the Company as of December 31, 2024 and 2023, the related consolidated statements of operations, comprehensive income (loss), equity and cash flows for each of the three years in the period ended December 31, 2024, and the related notes and financial statement schedules listed in the Index at Item 15(2) and our report dated February 28, 2025 expressed an unqualified opinion thereon.
Basis for Opinion
The Company’s management is responsible for maintaining effective internal control over financial reporting and for its assessment of the effectiveness of internal control over financial reporting included in the accompanying Management’s Report on Internal Control Over Financial Reporting. Our responsibility is to express an opinion on the Company’s internal control over financial reporting based on our audit. We are a public accounting firm registered with the PCAOB and are required to be independent with respect to the Company in accordance with the U.S. federal securities laws and the applicable rules and regulations of the Securities and Exchange Commission and the PCAOB.
We conducted our audit in accordance with the standards of the PCAOB. Those standards require that we plan and perform the audit to obtain reasonable assurance about whether effective internal control over financial reporting was maintained in all material respects.
Our audit included obtaining an understanding of internal control over financial reporting, assessing the risk that a material weakness exists, testing and evaluating the design and operating effectiveness of internal control based on the assessed risk, and performing such other procedures as we considered necessary in the circumstances. We believe that our audit provides a reasonable basis for our opinion.
Definition and Limitations of Internal Control Over Financial Reporting
A company’s internal control over financial reporting is a process designed to provide reasonable assurance regarding the reliability of financial reporting and the preparation of financial statements for external purposes in accordance with generally accepted accounting principles. A company’s internal control over financial reporting includes those policies and procedures that (1) pertain to the maintenance of records that, in reasonable detail, accurately and fairly reflect the transactions and dispositions of the assets of the company; (2) provide reasonable assurance that transactions are recorded as necessary to permit preparation of financial statements in accordance with generally accepted accounting principles, and that receipts and expenditures of the company are being made only in accordance with authorizations of management and directors of the company; and (3) provide reasonable
assurance regarding prevention or timely detection of unauthorized acquisition, use, or disposition of the company’s assets that could have a material effect on the financial statements.
Because of its inherent limitations, internal control over financial reporting may not prevent or detect misstatements. Also, projections of any evaluation of effectiveness to future periods are subject to the risk that controls may become inadequate because of changes in conditions, or that the degree of compliance with the policies or procedures may deteriorate.
/s/ Ernst & Young LLP
Des Moines, Iowa
February 28, 2025
Report of Independent Registered Public Accounting Firm
To the Shareholders and the Board of Directors of F&G Annuities & Life, Inc.
Opinion on the Financial Statements
We have audited the accompanying consolidated balance sheets of F&G Annuities & Life, Inc. and subsidiaries (the Company) as of December 31, 2024 and 2023, the related consolidated statements of operations, comprehensive income (loss), equity and cash flows for each of the three years in the period ended December 31, 2024, and the related notes and financial statement schedules listed in the Index at Item 15(2) (collectively referred to as the “consolidated financial statements”). In our opinion, the consolidated financial statements present fairly, in all material respects, the financial position of the Company at December 31, 2024 and 2023, and the results of its operations and its cash flows for each of the three years in the period ended December 31, 2024, in conformity with U.S. generally accepted accounting principles.
We also have audited, in accordance with the standards of the Public Company Accounting Oversight Board (United States) (PCAOB), the Company's internal control over financial reporting as of December 31, 2024, based on criteria established in Internal Control—Integrated Framework issued by the Committee of Sponsoring Organizations of the Treadway Commission (2013 framework), and our report dated February 28, 2025, expressed an unqualified opinion thereon.
Basis for Opinion
These financial statements are the responsibility of the Company's management. Our responsibility is to express an opinion on the Company’s financial statements based on our audits. We are a public accounting firm registered with the PCAOB and are required to be independent with respect to the Company in accordance with the U.S. federal securities laws and the applicable rules and regulations of the Securities and Exchange Commission and the PCAOB.
We conducted our audits in accordance with the standards of the PCAOB. Those standards require that we plan and perform the audit to obtain reasonable assurance about whether the financial statements are free of material misstatement, whether due to error or fraud. Our audits included performing procedures to assess the risks of material misstatement of the financial statements, whether due to error or fraud, and performing procedures that respond to those risks. Such procedures included examining, on a test basis, evidence regarding the amounts and disclosures in the financial statements. Our audits also included evaluating the accounting principles used and significant estimates made by management, as well as evaluating the overall presentation of the financial statements. We believe that our audits provide a reasonable basis for our opinion.
Critical Audit Matter
The critical audit matter communicated below is a matter arising from the current period audit of the financial statements that was communicated or required to be communicated to the audit committee and that: (1) relates to accounts or disclosures that are material to the financial statements and (2) involved our especially challenging, subjective or complex judgments. The communication of the critical audit matter does not alter in any way our opinion on the consolidated financial statements, taken as a whole, and we are not, by communicating the critical audit matter below, providing a separate opinion on the critical audit matter or on the accounts or disclosures to which it relates.
| | | | | | | | |
| | Fixed Indexed Annuity Embedded Derivative Liability, Market Risk Benefits, and Future Policy Benefits Liability |
| | |
| Description of the Matter | | At December 31, 2024, the fair value of the Company’s fixed indexed annuity embedded derivative liability totaled $5.2 billion. Certain of the Company’s fixed indexed annuity (FIA) contracts allow the policyholder to elect an equity index linked feature, where amounts credited to the contract’s account value are linked to the performance of designated equity indices and crediting strategy selected by the policyholder. The equity index crediting feature is accounted for as an embedded derivative liability and reported at fair value as discussed in Notes A (see section on Contractholder Funds), B, and D to the consolidated financial statements. A subset of FIA contracts include certain contract features that provide minimum guarantees to policyholders, such as guaranteed minimum withdrawal benefits and guaranteed minimum death benefit features that are market risk benefits (MRB) measured at fair value as discussed in Notes A (see section on MRBs), B, and G to the consolidated financial statements. The Company’s MRB assets and MRB liabilities totaled $189 million and $549 million, respectively, as of December 31, 2024. At December 31, 2024, future policy benefits (FPB) liabilities related to traditional life and life-contingent immediate annuity policies (which includes life-contingent pension risk transfer annuities) totaled $8.7 billion. The future policy benefits liability related to these products is based on estimates of how much the Company will need to pay for future benefits and related claim expenses and the amount of net premiums to be collected from policyholders as discussed in Notes A (see section on Future Policy Benefits) and J to the consolidated financial statements.
Auditing the valuation of the Company’s fixed indexed annuity embedded derivative, MRBs, and FPB liabilities was complex because of the highly judgmental nature of the determination of the assumptions required to determine the fair value of the embedded derivative and MRBs and valuation of FPB liabilities. In particular, the fair value of fixed indexed annuity embedded derivative and MRBs was sensitive to the significant assumptions including surrender rates, GMWB utilization, option cost and non-performance spread. In addition, mortality, partial withdrawals, and capital market performance scenarios were significant assumptions used in the valuation of MRBs. Mortality is a significant assumption used in the valuation of FPB liabilities.
|
| | |
| How we Addressed the Matter in Our Audit | | We obtained an understanding, evaluated the design, and tested the operating effectiveness of the Company’s controls over management’s process for the development of the significant assumptions used in measuring the fair value of the embedded derivative for fixed indexed annuities and MRBs and the valuation of FPB liabilities. These controls included, among others, the review and approval process management has in place for the development of the significant assumptions.
To evaluate the judgment used by management in determining the assumptions used in measuring the fair value of the fixed indexed annuity embedded derivative and MRBs and the valuation of FPB liabilities, among other procedures, we involved actuarial specialists and evaluated the methodology applied by management in determining the valuation with those used in the prior period and in the industry. To evaluate the significant assumptions used by management in the methodology applied, we compared as applicable, the significant assumptions noted above to historical experience, observable market data, and management’s estimates of prospective changes in these assumptions. We also performed an independent recalculation of the embedded derivative, MRB, and FPB liabilities for a sample of policies or cohorts for comparison with the actuarial models used by management.
|
| | |
| | |
/s/ Ernst & Young LLP
We have served as the Company’s auditor since 2020.
Des Moines, Iowa
February 28, 2025
F&G ANNUITIES & LIFE, INC. AND SUBSIDIARIES
CONSOLIDATED BALANCE SHEETS
(Dollars in millions, except share data) | | | | | | | | | | | |
| December 31, |
| 2024 | | 2023 |
| ASSETS: | | | |
| Investments | | | |
| Fixed maturity securities available for sale, at fair value, at December 31, 2024 and 2023, at an amortized cost of $49,729 and $43,601, respectively, net of allowance for credit losses of $62 and $35, respectively | $ | 46,317 | | | $ | 40,419 | |
| Preferred securities, at fair value | 270 | | | 469 | |
| Equity securities, at fair value | 145 | | | 137 | |
| Derivative investments | 792 | | | 797 | |
| Mortgage loans, net of allowance for credit losses of $70 and $66 at December 31, 2024 and 2023, respectively | 5,926 | | | 5,336 | |
| Investments in unconsolidated affiliates (certain investments at fair value of $272 and $285 at December 31, 2024 and 2023, respectively) | 3,565 | | | 3,071 | |
| Other long-term investments | 580 | | | 537 | |
| Policy loans | 104 | | | 71 | |
| Short-term investments | 2,410 | | | 1,452 | |
| Total investments | 60,109 | | | 52,289 | |
| Cash and cash equivalents | 2,264 | | | 1,563 | |
| Reinsurance recoverable, net of allowance for credit losses of $20 and $21 at December 31, 2024 and 2023, respectively | 13,369 | | | 8,960 | |
| | | |
| Goodwill | 2,179 | | | 1,749 | |
| Prepaid expenses and other assets (certain assets held at fair value of $11 million and $0 at December 31, 2024 and 2023, respectively) | 1,059 | | | 931 | |
| Other intangible assets, net | 5,572 | | | 4,207 | |
| Market risk benefits asset | 189 | | | 88 | |
| Income taxes receivable | — | | | 27 | |
| Deferred tax asset, net | 299 | | | 388 | |
| Total assets | $ | 85,040 | | | $ | 70,202 | |
| LIABILITIES AND EQUITY |
| Liabilities: | | | |
| Contractholder funds | $ | 56,404 | | | $ | 48,798 | |
| Future policy benefits | 8,749 | | | 7,050 | |
| Market risk benefits liability | 549 | | | 403 | |
| Accounts payable and accrued liabilities | 2,219 | | | 2,011 | |
| Income taxes payable | 5 | | | — | |
| | | |
| Notes payable | 2,171 | | | 1,754 | |
| Funds withheld for reinsurance liabilities | 10,867 | | | 7,083 | |
| | | |
| Total liabilities | 80,964 | | | 67,099 | |
| Equity: | | | |
| Preferred stock $0.001 par value; authorized 25,000,000 shares as of December 31, 2024 and 2023; outstanding and issued 5,000,000 and 0 shares as of December 31, 2024 and 2023, respectively | — | | | — | |
| F&G common stock, $0.001 par value; authorized 500,000,000 shares as of December 31, 2024 and 2023; outstanding of 126,792,844 and 126,332,142 as of December 31, 2024 and 2023, respectively, and issued of 127,952,143 and 127,234,902 as of December 31, 2024 and 2023, respectively | — | | | — | |
| Additional paid-in-capital | 3,464 | | | 3,185 | |
| Retained earnings | 2,440 | | | 1,926 | |
| Accumulated other comprehensive income (loss) ("AOCI") | (1,923) | | | (1,990) | |
| Treasury stock, at cost (1,159,299 shares and 902,760 shares as of December 31, 2024 and 2023, respectively) | (30) | | | (18) | |
| Total F&G Annuities & Life, Inc. shareholders' equity | 3,951 | | | 3,103 | |
| Non-controlling interests | 125 | | | — | |
| Total equity | 4,076 | | | 3,103 | |
| Total liabilities and equity | $ | 85,040 | | | $ | 70,202 | |
See accompanying Notes to Consolidated Financial Statements
F&G ANNUITIES & LIFE, INC. AND SUBSIDIARIES
CONSOLIDATED STATEMENTS OF OPERATIONS
(Dollars and shares in millions, except per share data)
| | | | | | | | | | | | | | | | | |
| Year ended December 31, |
| 2024 | | 2023 | | 2022 |
| | |
| Revenues: | | | | | |
| Life insurance premiums and other fees | $ | 2,860 | | | $ | 2,413 | | | $ | 1,704 | |
| Interest and investment income | 2,719 | | | 2,211 | | | 1,655 | |
| Owned distribution revenues | 81 | | | — | | | — | |
| Recognized gains and (losses), net | 84 | | | (124) | | | (1,010) | |
| Total revenues | 5,744 | | | 4,500 | | | 2,349 | |
| Benefits and expenses: | | | | | |
| Benefits and other changes in policy reserves (remeasurement gains (losses) (a)) | 3,791 | | | 3,553 | | | 1,126 | |
| Market risk benefit (gains) losses | (25) | | | 95 | | | (182) | |
| Depreciation and amortization | 569 | | | 412 | | | 324 | |
| Personnel costs | 296 | | | 232 | | | 157 | |
| Other operating expenses | 203 | | | 146 | | | 102 | |
| Interest expense | 132 | | | 97 | | | 29 | |
| Total benefits and expenses | 4,966 | | | 4,535 | | | 1,556 | |
| Earnings (loss) before income taxes | 778 | | | (35) | | | 793 | |
| Income tax expense | 136 | | | 23 | | | 158 | |
| Net earnings (loss) | 642 | | | (58) | | | 635 | |
| Less: Non-controlling interests | 3 | | | — | | | — | |
| Net earnings (loss) attributable to F&G | 639 | | | (58) | | | 635 | |
| | | | | |
| | | | | |
| Less: Preferred stock dividend | 17 | | | — | | | — | |
| Net earnings (loss) attributable to F&G common shareholders | $ | 622 | | | $ | (58) | | | $ | 635 | |
| | | | | |
| Earnings per share | | | | | |
| Basic | | | | | |
| | | | | |
| | | | | |
| Net earnings (loss) per share attributable to F&G common shareholders, basic | $ | 4.98 | | | $ | (0.47) | | | $ | 5.52 | |
| Diluted | | | | | |
| | | | | |
| | | | | |
| Net earnings (loss) per share attributable to F&G common shareholders, diluted | $ | 4.88 | | | $ | (0.47) | | | $ | 5.52 | |
| | | | | |
| Weighted average shares outstanding F&G common stock, basic basis (b) | 125 | | | 124 | | | 115 | |
| Weighted average shares outstanding F&G common stock, diluted basis (b) | 131 | | | 124 | | | 115 | |
(a)The remeasurement gains for the years ended December 31, 2024, 2023 and 2022 were $20 million, $7 million and $1 million, respectively.
(b)Weighted average shares outstanding for the year ended December 31, 2022 includes the 105,000 for 1 stock split that became effective on June 24, 2022.
See accompanying Notes to Consolidated Financial Statements
F&G ANNUITIES & LIFE, INC. AND SUBSIDIARIES
CONSOLIDATED STATEMENTS OF COMPREHENSIVE INCOME (LOSS)
(In millions)
| | | | | | | | | | | | | | | | | |
| Year ended December 31, |
| 2024 | | 2023 | | 2022 |
| | | |
| Net earnings (loss) | $ | 642 | | | $ | (58) | | | $ | 635 | |
| Other comprehensive income (loss), net: | | | | | |
| Changes in current discount rate - future policy benefits | 224 | | | (189) | | | 764 | |
| Changes in instrument-specific credit risk - market risk benefits | 5 | | | (34) | | | 67 | |
| Unrealized (loss) gain on investments and other financial instruments | (164) | | | 919 | | | (4,689) | |
| Unrealized (loss) gain on foreign currency translation | (5) | | | 2 | | | (5) | |
| Reclassification adjustments for change in unrealized gains and losses included in net earnings | 7 | | | 130 | | | 212 | |
| | | | | |
| Other comprehensive income (loss) | 67 | | | 828 | | | (3,651) | |
| Comprehensive income (loss) | 709 | | | 770 | | | (3,016) | |
| Less: Comprehensive income attributable to non-controlling interests | 3 | | | — | | | — | |
| Comprehensive income (loss) attributable to F&G | $ | 706 | | | $ | 770 | | | $ | (3,016) | |
See accompanying Notes to Consolidated Financial Statements
F&G ANNUITIES & LIFE, INC. AND SUBSIDIARIES
CONSOLIDATED STATEMENTS OF EQUITY
(In millions)
| | | | | | | | | | | | | | | | | | | | | | | | | | | | | | | | | | | | | | | | | | | | | | | |
| | F&G Annuities & Life, Inc. shareholders' equity | | | | |
| | Preferred Stock | | Common Stock | | Additional Paid-in-Capital | | Retained Earnings | | Accumulated Other Comprehensive Income (Loss) | | Treasury Stock | | Non-controlling Interests | | Total Equity |
| | | | | | | | | | | | | | | |
| | | | | | | | | | | | | | | |
| | | | | | | | | | | | | | | |
| | | | | | | | | | | | | | | |
| | | | | | | | | | | | | | | |
| | | | | | | | | | | | | | | |
| | | | | | | | | | | | | | | |
| | | | | | | | | | | | | | | |
| | | | | | | | | | | | | | | |
| | | | | | | | | | | | | | | |
| | | | | | | | | | | | | | | |
| | | | | | | | | | | | | | | |
| | | | | | | | | | | | | | | |
| Balance, January 1, 2022 | $ | — | | | $ | — | | | $ | 2,750 | | | $ | 1,451 | | | $ | 833 | | | $ | — | | | $ | — | | | $ | 5,034 | |
| | | | | | | | | | | | | | | |
| Treasury stock purchased | — | | | — | | | — | | | — | | | — | | | — | | | — | | | — | |
| | | | | | | | | | | | | | | |
| | | | | | | | | | | | | | | |
| | | | | | | | | | | | | | | |
| Stock-based compensation | — | | | — | | | 12 | | | — | | | — | | | — | | | — | | | 12 | |
| | | | | | | | | | | | | | | |
| | | | | | | | | | | | | | | |
| | | | | | | | | | | | | | | |
| Common stock dividends declared | — | | | — | | | — | | | (25) | | | — | | | — | | | — | | | (25) | |
| Other comprehensive income (loss) | — | | | — | | | — | | | — | | | (3,651) | | | — | | | — | | | (3,651) | |
| Debt to equity conversion | — | | | — | | | 400 | | | — | | | — | | | — | | | — | | | 400 | |
| Net earnings (loss) | — | | | — | | | — | | | 635 | | | — | | | — | | | — | | | 635 | |
| Balance, December 31, 2022 | $ | — | | | $ | — | | | $ | 3,162 | | | $ | 2,061 | | | $ | (2,818) | | | $ | — | | | $ | — | | | $ | 2,405 | |
| | | | | | | | | | | | | | | | | | | | | | | | | | | | | | | | | | | | | | | | | | | | | | | |
| | F&G Annuities & Life, Inc. shareholders' equity | | | | |
| | Preferred Stock | | Common Stock | | Additional Paid-in-Capital | | Retained Earnings | | Accumulated Other Comprehensive Income (Loss) | | Treasury Stock | | Non-controlling Interests | | Total Equity |
| | | | | | | | | | | | | | | |
| | | | | | | | | | | | | | | |
| | | | | | | | | | | | | | | |
| | | | | | | | | | | | | | | |
| | | | | | | | | | | | | | | |
| | | | | | | | | | | | | | | |
| | | | | | | | | | | | | | | |
| | | | | | | | | | | | | | | |
| | | | | | | | | | | | | | | |
| | | | | | | | | | | | | | | |
| | | | | | | | | | | | | | | |
| | | | | | | | | | | | | | | |
| | | | | | | | | | | | | | | |
| Balance, January 1, 2023 | $ | — | | | $ | — | | | $ | 3,162 | | | $ | 2,061 | | | $ | (2,818) | | | $ | — | | | $ | — | | | $ | 2,405 | |
| | | | | | | | | | | | | | | |
| Treasury stock purchased | — | | | — | | | — | | | — | | | — | | | (18) | | | — | | | (18) | |
| | | | | | | | | | | | | | | |
| | | | | | | | | | | | | | | |
| | | | | | | | | | | | | | | |
| Stock-based compensation | — | | | — | | | 23 | | | — | | | — | | | — | | | — | | | 23 | |
| | | | | | | | | | | | | | | |
| | | | | | | | | | | | | | | |
| | | | | | | | | | | | | | | |
| Common stock dividends declared | — | | | — | | | — | | | (77) | | | — | | | — | | | — | | | (77) | |
| Other comprehensive income (loss) | — | | | — | | | — | | | — | | | 828 | | | — | | | — | | | 828 | |
| Net earnings (loss) | — | | | — | | | — | | | (58) | | | — | | | — | | | — | | | (58) | |
| Balance, December 31, 2023 | $ | — | | | $ | — | | | $ | 3,185 | | | $ | 1,926 | | | $ | (1,990) | | | $ | (18) | | | $ | — | | | $ | 3,103 | |
See accompanying Notes to Consolidated Financial Statements
F&G ANNUITIES & LIFE, INC. AND SUBSIDIARIES
CONSOLIDATED STATEMENTS OF EQUITY, CONTINUED
(In millions)
| | | | | | | | | | | | | | | | | | | | | | | | | | | | | | | | | | | | | | | | | | | | | | | |
| F&G Annuities & Life, Inc. shareholders' equity | | | | |
| Preferred Stock | | Common Stock | | Additional Paid-in Capital | | Retained Earnings | | Accumulated Other Comprehensive Income (Loss) | | Treasury Stock | | Non-controlling Interests | | Total Equity |
| Balance, January 1, 2024 | $ | — | | | $ | — | | | $ | 3,185 | | | $ | 1,926 | | | $ | (1,990) | | | $ | (18) | | | $ | — | | | $ | 3,103 | |
| Acquisition of non-controlling interest | — | | | — | | | — | | | — | | | — | | | — | | | 136 | | | 136 | |
| Issuance of Preferred Stock | — | | | — | | | 250 | | | — | | | — | | | — | | | — | | | 250 | |
| Treasury stock purchased | — | | | — | | | — | | | — | | | — | | | (12) | | | — | | | (12) | |
| | | | | | | | | | | | | | | |
| | | | | | | | | | | | | | | |
| | | | | | | | | | | | | | | |
| | | | | | | | | | | | | | | |
| | | | | | | | | | | | | | | |
| Stock-based compensation | — | | | — | | | 29 | | | — | | | — | | | — | | | — | | | 29 | |
| | | | | | | | | | | | | | | |
| Common stock dividends declared | — | | | — | | | — | | | (108) | | | — | | | — | | | — | | | (108) | |
| Preferred stock dividends declared | — | | | — | | | — | | | (17) | | | — | | | — | | | — | | | (17) | |
| Dividends declared and distributions to non-controlling interests | — | | | — | | | — | | | — | | | — | | | — | | | (14) | | | (14) | |
| Other comprehensive income (loss) | — | | | — | | | — | | | — | | | 67 | | | — | | | — | | | 67 | |
| Net earnings (loss) | — | | | — | | | — | | | 639 | | | — | | | — | | | 3 | | | 642 | |
| Balance, December 31, 2024 | $ | — | | | $ | — | | | $ | 3,464 | | | $ | 2,440 | | | $ | (1,923) | | | $ | (30) | | | $ | 125 | | | $ | 4,076 | |
See accompanying Notes to Consolidated Financial Statements
F&G ANNUITIES & LIFE, INC. AND SUBSIDIARIES
CONSOLIDATED STATEMENTS OF CASH FLOWS
(In millions)
| | | | | | | | | | | | | | | | | |
| Year ended December 31, |
| 2024 | | 2023 | | 2022 |
| Cash Flows from Operating Activities: | | | | | |
| Net earnings (loss) | $ | 642 | | | $ | (58) | | | $ | 635 | |
| Adjustments to reconcile net earnings (loss) to net cash provided by operating activities: | | | | | |
| Depreciation and amortization | 569 | | | 412 | | | 324 | |
| (Gain) loss on sales of investments and other assets and asset impairments, net | (210) | | | 461 | | | 436 | |
| | | | | |
| Interest credited/index credits to contractholder account balances | 1,327 | | | 1,409 | | | (560) | |
| Change in market risk benefits, net | (25) | | | 95 | | | (182) | |
| Deferred policy acquisition costs and deferred sales inducements | (1,419) | | | (1,082) | | | (814) | |
| Charges assessed to contractholders for mortality and administration | (291) | | | (255) | | | (221) | |
| Distributions from unconsolidated affiliates, return on investment | 108 | | | 104 | | | 119 | |
| Stock-based compensation cost | 29 | | | 23 | | | 12 | |
| Change in NAV of limited partnerships, net | (350) | | | (220) | | | (109) | |
| Change in valuation of derivatives, equity and preferred securities and other assets, net | 60 | | | (347) | | | 561 | |
| Changes in assets and liabilities, net of effects from acquisitions: | | | | | |
| Change in reinsurance recoverable | (19) | | | 94 | | | 148 | |
| Change in derivative collateral liabilities | 91 | | | 410 | | | (398) | |
| Change in future policy benefits | 1,853 | | | 1,325 | | | 1,071 | |
| Change in funds withheld from reinsurers | 3,795 | | | 3,386 | | | 2,056 | |
| Net change in income taxes | 103 | | | (4) | | | 211 | |
| Net change in other assets and other liabilities | (264) | | | 81 | | | (118) | |
| Net cash provided by operating activities | 5,999 | | | 5,834 | | | 3,171 | |
| Cash Flows from Investing Activities: | | | | | |
| Proceeds from sales, calls and maturities of investments | 11,260 | | | 5,279 | | | 5,429 | |
| Additions to property and equipment and capitalized software | (24) | | | (27) | | | (32) | |
| Purchases of investment securities | (16,922) | | | (13,326) | | | (12,426) | |
| Net proceeds from sales, maturities and purchases of short-term investment securities | (1,103) | | | (28) | | | (1,654) | |
| Other acquisitions/disposals, net of cash acquired | (482) | | | — | | | — | |
| Additional investments in unconsolidated affiliates | (1,114) | | | (1,137) | | | (987) | |
| Net increase in policy loans | (33) | | | (19) | | | (13) | |
| Distributions from unconsolidated affiliates, return of investment | 478 | | | 340 | | | 313 | |
| Net increase in notes receivable | (13) | | | — | | | — | |
| Net cash used in investing activities | (7,953) | | | (8,918) | | | (9,370) | |
| Cash Flows from Financing Activities: | | | | | |
| Borrowings | 1,050 | | | 845 | | | 550 | |
| Debt issuance costs | (20) | | | (16) | | | (4) | |
| Net revolving credit facility (repayments) borrowings | (365) | | | (185) | | | — | |
| Repayments of outstanding debt | (250) | | | — | | | — | |
| Dividends paid | (121) | | | (101) | | | — | |
| Dividends and distributions paid to non-controlling interest shareholders | (14) | | | — | | | — | |
| | | | | |
| Purchases of treasury stock | (12) | | | (18) | | | — | |
| Issuance of preferred stock | 250 | | | — | | | — | |
| Contractholder account deposits | 10,147 | | | 7,787 | | | 8,530 | |
| Contractholder account withdrawals | (8,010) | | | (4,625) | | | (3,450) | |
| Net cash provided by financing activities | 2,655 | | | 3,687 | | | 5,626 | |
| Net increase (decrease) in cash and cash equivalents | 701 | | | 603 | | | (573) | |
| Cash and cash equivalents at beginning of period | 1,563 | | | 960 | | | 1,533 | |
| Cash and cash equivalents at end of period | $ | 2,264 | | | $ | 1,563 | | | $ | 960 | |
See accompanying Notes to Consolidated Financial Statements
F&G ANNUITIES & LIFE, INC. AND SUBSIDIARIES
NOTES TO CONSOLIDATED FINANCIAL STATEMENTS
Note A - Business and Summary of Significant Accounting Policies
The following describes the business and significant accounting policies of F&G Annuities & Life, Inc. (“FGAL”) and its subsidiaries (collectively, “we,” “us,” “our,” the “Company” or “F&G”), which have been followed in preparing the Consolidated Financial Statements.
Description of the Business
F&G is a majority-owned subsidiary of Fidelity National Financial, Inc. (NYSE: FNF) (“FNF”). We provide insurance solutions and market a broad portfolio of annuity and life insurance products through retail channels and institutional markets and earn commissions on the sale of insurance products through our owned distribution channels. For certain disclosures within this Annual Report on Form 10-K, we have elected to aggregate business based on the applicable product type, the manner in which information is regularly reviewed by management and the nature of disclosures that exist outside the Company’s generally accepted accounting principles (“GAAP”) financial statements.
Retail distribution channels products include:
•Deferred annuities including fixed indexed annuities (“FIA”), registered index-linked annuities (“RILA”), (together referred to as “indexed annuities”) and fixed rate annuities including multi-year guarantee annuities (“MYGA”),
•Immediate annuities, and
•Indexed universal life (“IUL”) insurance.
Institutional markets products include:
•Pension risk transfer (“PRT”) solutions, and
•Funding agreements, including funding agreement backed notes (“FABN”) and Federal Home Loan Bank funding agreements (“FHLB”).
F&G has one reporting segment, which reflects the manner by which our chief operating decision maker (“CODM”), the Chief Executive Officer of F&G, views and manages the business. For information about our reporting segment refer to Note V - Segment Information.
Recent Developments
Redemption of 5.50% F&G Senior Notes
On February 1, 2025, F&G redeemed the outstanding $300 million aggregate principal amount of its 5.50% Senior Notes due May 1, 2025 (the “5.50% F&G Senior Notes”). The notes were redeemed for a redemption price equal to 100% of the principal amount of the notes plus accrued and unpaid interest to, but excluding, the redemption date. On and after the redemption date, interest will cease to accrue on the notes.
7.300% F&G Junior Notes
On January 13, 2025, F&G completed its public offering of its 7.300% Junior Subordinated Notes due 2065 with an aggregate principal amount of $375 million (the “7.300% F&G Notes”). F&G intends to use the net proceeds of this offering for general corporate purposes, including the repurchase, redemption or repayment at maturity of outstanding indebtedness. The 7.300% F&G Notes were registered under the Securities Act of 1933 (as amended) (the “Securities Act”).
6.250% F&G Senior Notes
On October 4, 2024, F&G completed its public offering of its 6.250% Senior Notes due 2034 with an aggregate principal amount of $500 million (the “6.250% F&G Notes”). The 6.250% F&G Notes are guaranteed on an unsecured, unsubordinated basis by each of F&G’s subsidiaries that are guarantors of F&G’s obligations under its existing credit agreements. A portion of the net proceeds were used to pay off the outstanding balance of $365 million on the Company’s revolving credit facility. The 6.250% F&G Notes were registered under the Securities Act.
6.50% F&G Senior Notes
On June 4, 2024, F&G completed its public offering of $550 million aggregate principal amount of its 6.50% Senior Notes due 2029 (the “6.50% F&G Notes”). The 6.50% F&G Notes are guaranteed on an unsecured, unsubordinated basis by each of F&G’s subsidiaries that are guarantors of F&G’s obligations under its existing credit agreement. A portion of the net proceeds were used to finance a cash tender offer by its wholly owned subsidiary Fidelity & Guaranty Life Holdings, Inc. (“FGLH”) for an aggregate principal amount of $250 million of FGLH’s 5.50% Senior Notes due 2025 (the “5.50% F&G Notes”). The 6.50% F&G Notes were registered under the Securities Act.
Revolving Credit Facility
On February 16, 2024, F&G entered into an amendment and extension of its existing senior unsecured revolving credit agreement (the “Credit Agreement”). The maturity date of the Credit Agreement has been extended by approximately two years from November 22, 2025 to November 22, 2027. Total commitments increased from $665 million to $750 million. Pricing and advance rates remain unchanged. Financial covenants also remain essentially the same. As noted above, we used $365 million of net proceeds from our 6.250% F&G Notes to pay off the Credit Agreement, and the balance was of the Credit Agreement was $0 as of December 31, 2024.
Refer to Note L- Notes Payable for further information related to these financing facilities.
FNF $250 million Preferred Stock Investment
On January 12, 2024, we completed a $250 million preferred stock investment from FNF. Net proceeds from the investment have been used to support the growth of F&G’s assets under management. Under the terms of the agreement, FNF agreed to invest $250 million in exchange for 5,000,000 shares of F&G’s 6.875% Series A Mandatory Convertible Preferred Stock, par value $.0.001 per share, liquidation preference of $50.00 per share (the “FNF Preferred Stock”). For further information related to this preferred stock issuance, refer to Note Q - Related Party Transactions and Note U - Equity.
Owned Distribution Investments
On July 18, 2024, F&G acquired a 100% ownership stake in the equity of PALH, LLC (“PALH”). PALH markets and sells life insurance and annuity products of various insurance carriers to individuals through a network of agents. Prior to the acquisition date, PALH owned a 70% ownership stake in an operating company of which F&G owned 30% equity. Total consideration of approximately $314 million is comprised of cash of $215 million, settlement of a prepaid asset of $8 million, acquisition date fair value of the previously held interests of $92 million, net of $1 million cash acquired.
On January 2, 2024, F&G acquired a 70% majority ownership stake in the equity of Roar Joint Venture, LLC (“Roar”) resulting in the consolidation of Roar in F&G’s financial statements. Roar wholesales life insurance and annuity products to banks and broker-dealers through a network of agents. Total initial consideration is comprised of cash of approximately $269 million and $48 million of contingent consideration. Under the terms of the purchase agreement, the Company has agreed to make cash payments of up to approximately $90 million over a three year
period upon the achievement by Roar of certain earnings before interest, taxes, depreciation and amortization (“EBITDA”) milestones.
For more information regarding the Roar and PALH acquisitions, refer to Note P - Acquisitions.
Principles of Consolidation and Basis of Presentation
The Consolidated Financial Statements are prepared in accordance with GAAP and include our accounts as well as our wholly owned subsidiaries and majority-owned subsidiaries. All intercompany profits, transactions and balances have been eliminated. Non-controlling interests recorded on the Consolidated Statements of Operations represent the portion of a majority-owned subsidiary's net earnings or loss that is owned by non-controlling shareholders of the subsidiary. Non-controlling interests recorded on the Consolidated Balance Sheets represent the portion of equity in a consolidated subsidiary owned by non-controlling shareholders.
Refer to Note T - Recent Accounting Pronouncements for information on recent accounting pronouncements that may have an impact on our Consolidated Financial Statements.
We are involved in certain entities that are considered variable interest entities (“VIEs”) as defined under GAAP. Our involvement with VIEs is primarily to invest in assets that allow us to gain exposure to a broadly diversified portfolio of asset classes. A VIE is an entity that does not have sufficient equity to finance its own activities without additional financial support, where investors lack certain characteristics of a controlling financial interest, or where the entity is structured with non-substantive voting rights. We assess our relationships with VIEs to evaluate if we are the primary beneficiary of the VIE. If we determine we are the primary beneficiary of a VIE, we consolidate the assets and liabilities of the VIE in our Consolidated Financial Statements. See Note C - Investments for additional information on our investments in VIEs.
Investments
Fixed Maturity Securities Available-for-Sale
Fixed maturity securities are purchased to support our investment strategies, which are developed based on factors including rate of return, maturity, credit risk, duration, tax considerations and regulatory requirements. Our investments in fixed maturity securities have been designated as available-for-sale (“AFS”) and are carried at fair value, net of allowance for expected credit losses, with unrealized gains and losses included within accumulated other comprehensive income (loss) (“AOCI”), net of deferred income taxes. We recognize investment income on fixed maturities based on the effective interest method, which results in the recognition of a constant rate of return on the investment equal to the prevailing rate at the time of purchase or at the time of subsequent adjustments of book value. Realized gains and losses on sales of our fixed maturity securities are determined on the first-in first-out cost basis. We generally record security transactions on a trade date basis except for private placements, which are recorded on a settlement date basis. Realized gains and losses on sales of fixed maturity securities are reported within Recognized gains and (losses), net in the Consolidated Statements of Operations. Fixed maturity securities AFS are subject to an allowance for credit loss and changes in the allowance are reported in net earnings as a component of Recognized gains and (losses), net. For details on our policy around allowance for expected credit losses on available-for-sale securities, refer to Note C - Investments.
Preferred and Equity Securities
Preferred and equity securities held are carried at fair value as of the balance sheet dates. Changes in fair value and realized gains and losses on sales of our preferred and equity securities are reported within Recognized gains and losses, net in the Consolidated Statements of Operations. Realized gains and losses on sales of our preferred and equity securities are determined on the first-in first-out cost basis and are credited or charged to earnings on a trade date basis unless the security is a private placement in which case settlement date basis is used. Interest and dividend income from these investments is reported in Interest and investment income in the Consolidated Statements of Operations.
Derivative Financial Instruments
We hedge certain portions of our exposure to product related equity market risk by entering into derivative transactions (primarily equity options). We utilize interest rate swaps to reduce market risks from interest rate changes on our earnings associated with our floating rate investments. All such derivative instruments are recognized as either assets or liabilities in the Consolidated Balance Sheets at fair value. The changes in fair value are reported within Recognized gains and losses, net in the Consolidated Statements of Operations. The change in the fair value of derivative instruments is included in (Gain) loss on sales of investments and other assets and asset impairments, net, in the Consolidated Statements of Cash Flow.
We purchase financial instruments that may contain embedded derivative instruments. If it is determined that the embedded derivative possesses economic characteristics that are not clearly and closely related to the economic characteristics of the host contract, and a separate instrument with the same terms would qualify as a derivative instrument, the embedded derivative is bifurcated from the host contract for measurement purposes.
Mortgage Loans
Our investment in mortgage loans consists of commercial and residential mortgage loans on real estate, which are reported at amortized cost, less allowance for expected credit losses. For details on our policy around allowance for expected credit losses on mortgage loans, refer to Note C - Investments.
Commercial mortgage loans are continuously monitored by reviewing appraisals, operating statements, rent revenues, annual inspection reports, loan specific credit quality, property characteristics, market trends and other factors.
Commercial mortgage loans are rated for the purpose of quantifying the level of risk. Loans are placed on a watch list when the debt service coverage (“DSC”) ratio falls below certain thresholds and the loan-to-value (“LTV”) ratios exceeds certain thresholds. Loans on the watchlist are closely monitored for collateral deficiency or other credit events that may lead to a potential loss of principal or interest. We define delinquent mortgage loans as 30 days past due, consistent with industry practice.
Residential mortgage loans have a primary credit quality indicator of either a performing or nonperforming loan. We define nonperforming residential mortgage loans as those that are 90 or more days past due and/or in nonaccrual status, which is assessed monthly. Generally, nonperforming residential mortgage loans have a higher risk of experiencing a credit loss. We consider residential mortgage loans that are 90 or more days past due and have an LTV greater than 90% to be foreclosure probable.
Interest on loans is recognized on an accrual basis at the applicable interest rate on the principal amount outstanding. Loan origination fees and direct costs, as well as premiums and discounts, are amortized as level yield adjustments over the respective loan terms. Unamortized net fees or costs are recognized upon early repayment of the loans. Interest income, amortization of premiums and discounts, prepayment fees, and loan commitment fees are reported in Interest and investment income in the Consolidated Statements of Operations.
Policy loans
Policy loans are reported at the unpaid principal balance and are fully collateralized by the cash surrender value of underlying insurance policies.
Short-term investments
Short-term investments consist of financial instruments with an original maturity of one year or less when purchased and include short-term fixed maturity securities and money market instruments, which are carried at fair value, and short-term loans, which are carried at amortized cost, which approximates fair value.
Investments in Unconsolidated Affiliates
We account for our investments in unconsolidated affiliates using the equity method or by electing the fair value option. Initial investments are recorded at cost.
For investments subsequently measured using the equity method (primarily limited partnerships), adjustments to the carrying amount reflect our pro rata ownership percentage of the operating results as indicated by net asset value (“NAV”) in the unconsolidated affiliates’ financial statements, which we may adjust if we determine NAV is not calculated consistent with investment company fair value principles. Our pro rata share of NAV adjustments are reported in Interest and investment income and realized gains and losses on sales are reported in Recognized gains and (losses), net in the Consolidated Statements of Operations. Distributions received from investments measured using the equity method are recorded as a decrease in the investment balance. Recognition of income and adjustments to the carrying amount can be delayed due to the availability of the related financial statements, which are obtained from the general partner or managing member generally on a one to three month delay. Management inquires quarterly with the general partner or managing member to determine whether any credit or other market events have occurred since prior quarter financial statements to ensure any material events are properly included in our current quarter NAV adjustments and investment income.
For investments subsequently measured using the fair value option, adjustments to the carrying amount reflecting the change in fair value of the investment and realized gains and losses on sales are reported in Recognized gains and (losses), net in the Consolidated Statements of Operations. Distributions received from investments measured using the fair value option are reported within Interest and investment income in the Consolidated Statements of Operations.
For descriptions of the fair value methodologies used for our investments, refer to Note B - Fair Value of Financial Instruments.
Interest and investment income
Dividends and interest income are recorded in Interest and investment income and recognized when earned. Income or losses upon call or prepayment of fixed maturity securities are recognized in Interest and investment income. Amortization of premiums and accretion of discounts on investments in fixed maturity securities are reflected in Interest and investment income over the contractual terms of the investments, and for callable investments at a premium, based on the earliest call date of the investments, in a manner that produces a constant effective yield.
For mortgage-backed and asset-backed securities, included in the fixed maturity securities portfolios, one of two models may be used to recognize interest income. For higher rated securities, interest income will be estimated based on an effective yield that considers cash flows received to date plus current expectations of future cash flows. For all other securities, interest income will be estimated based upon an effective yield that considers current expectations of future cash flows. For both interest income models, the estimated future cash flows include assumptions regarding the performance of the underlying collateral pool.
Interest and investment income is presented net of investment expenses and the effects of certain reinsurance contracts.
Cash and Cash Equivalents
Highly liquid instruments purchased as part of cash management with original maturities of three months or less are considered cash equivalents. The carrying amounts reported in the Consolidated Balance Sheets for these instruments approximate fair value.
Fair Value of Financial Instruments
The fair values of financial instruments presented in the Consolidated Financial Statements are estimates of the fair values at the balance sheet date using available market information and appropriate valuation methodologies. These estimates are subjective in nature and involve uncertainties and significant judgment in the interpretation of current market data. See a description of the fair value methodology used in Note B - Fair Value of Financial Instruments.
Fair Value of Assets Acquired and Liabilities Assumed in Business Combinations
The Financial Accounting Standards Board (“FASB”) Accounting Standards Codification (“ASC”) Topic 805, Business Combinations, requires an acquirer to recognize, separately from goodwill, the identifiable assets acquired, liabilities assumed, and any non-controlling interest in the acquiree, and to measure these items generally at their acquisition date fair values. If the initial accounting for a business combination is incomplete by the end of the reporting period in which the combination occurs, we are required to report provisional amounts in the financial statements for the items for which the accounting is incomplete. Adjustments to provisional amounts initially recorded that are identified during the measurement period are recognized in the reporting period in which the adjustment amounts are determined. This includes any effect on earnings of changes in depreciation, amortization, or other income effects as a result of the change to the provisional amounts, calculated as if the accounting had been completed at the acquisition date. During the measurement period, we are also required to recognize additional assets or liabilities if new information is obtained about facts and circumstances that existed as of the acquisition date that, if known, would have resulted in the recognition of those assets and liabilities as of that date. The measurement period ends the sooner of one year from the acquisition date, when we receive the information we were seeking about facts and circumstances that existed as of the acquisition date or learn that more information is not obtainable.
Goodwill
Goodwill represents the excess of cost over fair value of identifiable net assets acquired and assumed in a business combination. Goodwill and other intangible assets with indefinite useful lives are reviewed for impairment at the reporting unit level on an annual basis or more frequently if circumstances indicate potential impairment, through a comparison of fair value to the carrying amount. In evaluating the recoverability of goodwill, we perform a qualitative analysis at the reporting unit level to determine whether there are any events or circumstances that would indicate it is more likely than not that the fair value of our recorded goodwill exceeds its carrying value, prior to performing a full fair-value assessment.
We complete annual goodwill impairment analyses in the fourth quarter of each period presented using a September 30 measurement date. For the years ended December 31, 2024 and 2023, we determined there were no events or circumstances which indicated that the carrying value of a reporting unit exceeded the fair value.
Insurance and Reinsurance Related Intangible Assets
We have insurance and reinsurance related intangible assets, which include the value of insurance and reinsurance contracts acquired (hereafter referred to as “VOBA”), DAC, DSI, and cost of reinsurance (“COR”). VOBA, DAC, and DSI are reported in Other intangible assets, net, on the Consolidated Balance Sheets. COR may be reported in Prepaid expenses and other assets or in Accounts payable and accrued liabilities on the Consolidated Balance Sheets as described below under “Reinsurance - Cost of Reinsurance.”
VOBA is an intangible asset that reflects the amount recorded as insurance contract liabilities less the estimated fair value of in-force contracts (“VIF”) in a life insurance company acquisition. It represents the portion of the purchase price that is allocated to the value of the rights to receive future cash flows from the business in force at the acquisition date. VOBA is a function of the VIF, current GAAP reserves, GAAP assets, and deferred tax liability. The VIF is determined by the present value of statutory distributable earnings less opening required capital. DAC
consists principally of commissions and other acquisition costs that are related directly to the successful sale of new or renewal insurance contracts that are deferred as they are incurred. When insurance contracts are reinsured and reinsurance accounting is applied, acquisition cost reimbursements from reinsurers are recorded as a reduction to DAC. Indirect or unsuccessful acquisition costs, maintenance, product development and overhead expenses are charged to expense as incurred and are offset by maintenance expense reimbursements within a reinsurance arrangement, when reinsurance accounting is applied to the respective arrangement DSI represents up front bonus credits and persistency or vesting bonuses credited to contractholder fund balances. COR represents net cash flows on reinsurance coverage to ensure no gain or loss is recognized at inception.
VOBA, DAC, DSI, and COR are amortized on a constant level basis for the grouped contracts over the expected term of the related contracts to approximate straight-line amortization. Contracts are grouped by product type, feature and issue year into cohorts consistent with the grouping used in estimating the associated liability, where applicable. The constant level amortization bases of VOBA, DAC, DSI, and COR varies by product type. For universal life and IUL insurance products, the constant level basis used is face amount in force. For deferred annuities (indexed annuities and fixed rate annuities), the constant level basis used is initial premium deposit for DAC and DSI and vested account value as of the acquisition date for VOBA and ceded initial premium for COR. For immediate annuity contracts, the VOBA balance is amortized in alignment with the Company’s accounting policy of amortizing the deferred profit liability (“DPL”). All amortization bases are adjusted by full lapses, which includes deaths, full surrenders, annuitizations and maturities, where applicable.
The constant level basis used for amortization are projected using mortality and lapse assumptions that are based on Company’s experience, industry data, and other factors and are consistent with those used for the FPB, where applicable. If those projected assumptions change in future periods, they will be reflected in the cohort level amortization basis at that time. Unexpected contract terminations, due to higher mortality and/or lapse experience than expected, are recognized in the current period as a reduction of the capitalized balances. All balances are reduced for actual experience in excess of expected experience with changes in future estimates recognized prospectively over the remaining expected grouped contract term. The impact of changes in projected assumptions and the impact of actual experience that is different from expectations impact the amortization of these intangible assets, which is reported within Depreciation and amortization for VOBA, DAC DSI and for COR, if the net COR balance is in a deferred gain position is reported within Life insurance premiums and other fees, and if the net COR balance is in a deferred loss position is reported within Other operating expenses in the Consolidated Statements of Operations.
Some of our IUL policies require payment of fees or other policyholder assessments in advance for services that will be rendered over the estimated lives of the policies or contracts. These payments are established as URL upon receipt and included in Accounts payable and other accrued liabilities in the Consolidated Balance Sheets. URL is amortized like DAC over the estimated lives of these policies.
Other Intangible Assets
We have other intangible assets, not including goodwill, VOBA, DAC or DSI, which consist primarily of customer relationships and contracts, the value of distribution network acquired (“VODA”), trademarks and tradenames, state licenses and computer software, which are generally recorded in connection with business combinations at their fair value. Intangible assets with estimable lives are amortized over their respective estimated useful lives to their estimated residual values and reviewed for impairment whenever events or changes in circumstances indicate that the carrying amount may not be recoverable. In general, customer relationships are amortized over their estimated useful lives using an accelerated method, which takes into consideration expected customer attrition rates. VODA is an intangible asset that represents the value of an acquired distribution network and is amortized using the sum of years digits method. Contractual relationships are generally amortized over their contractual life. Trademarks and tradenames are generally amortized over ten years. Capitalized computer software includes the fair value of software acquired in business combinations, purchased software and capitalized software development costs. Purchased software is recorded at cost and amortized using the straight-line method over its estimated useful life. Software acquired in business combinations is recorded at its fair value and amortized using straight-line or accelerated methods over its estimated useful life. For internal-use computer software products,
internal and external costs incurred during the preliminary project stage are expensed as they are incurred. Internal and external costs incurred during the application development stage are capitalized and amortized on a product by product basis commencing on the date the software is ready for its intended use. We do not capitalize any costs once the software is ready for its intended use.
We review VOBA, DSI and other intangible assets for impairment annually or when events or circumstances occur that indicate a potential change in the underlying basis. Refer to Note F - Intangibles for details of impairment expense.
Contingent Consideration
Contingent consideration recognized in connection with a business combination represents an obligation to transfer additional assets or equity interests as part of the exchange for control of an acquiree if specified future events or conditions are met. Contingent consideration is recognized at fair value in the Consolidated Balance Sheets within Accounts payable and accrued liabilities. Changes in fair value are recognized in the Consolidated Statements of Operations as Other operating expenses.
Property and Equipment
Property and equipment are recorded at cost, less accumulated depreciation in Prepaid expenses and other assets on the Consolidated Balance Sheets. Depreciation is computed primarily using the straight-line method based on the estimated useful lives of the related assets: twenty to thirty years for buildings and three to twenty-five years for furniture, fixtures and equipment. Leasehold improvements are amortized on a straight-line basis over the lesser of the term of the applicable lease or the estimated useful lives of such assets. Property and equipment are reviewed for impairment whenever events or circumstances indicate that the carrying amounts may not be recoverable.
Contractholder Funds
Contractholder funds include deferred annuities (indexed annuities and fixed rate annuities), IULs, funding agreements and non-life contingent (“NLC”) immediate annuities (which includes NLC PRT annuities). The liabilities for contractholder funds for fixed rate annuities, funding agreements and NLC immediate annuities consist of contract account balances that accrue to the benefit of the contractholders. The liabilities for indexed annuities and IUL policies consist of the value of the host contract plus the fair value of the indexed crediting feature of the policy, which is accounted for as an embedded derivative. The embedded derivative liability is carried at fair value in Contractholder funds in the Consolidated Balance Sheets with changes in fair value reported in Benefits and other changes in policy reserves in the Consolidated Statements of Operations. See a description of the fair value methodology used in Note B - Fair Value of Financial Instruments.
Future Policy Benefits
The FPB are determined as the present value of future policy benefits and related claims expenses to be paid to or on behalf of the policyholder less the present value of future net premiums to be collected from policyholders. The FPB for traditional life policies and life-contingent immediate annuity policies (which includes life-contingent PRT annuities) are estimated using current assumptions that include discount rate, mortality and surrender/lapse terminations for traditional life insurance policies only, and expenses. The expense assumption is locked-in at contract issuance and not subsequently reviewed or updated. The initial assumptions are based on generally accepted actuarial methods and a combination of internal and industry experience. Policies are terminated through surrenders, lapses and maturities, where surrenders represent the voluntary terminations of policies by policyholders, lapses represent cancellations by us due to nonpayment of premiums, and maturities are determined by policy contract terms.
For traditional life policies and life-contingent immediate annuity policies, contracts are grouped into cohorts by product type, legal entity, and issue year, or acquisition year for cohorts established as of the FNF Acquisition Date. Life-contingent PRT annuities are grouped into cohorts by deal and legal entity. At contract inception, a net
premium ratio (“NPR”) is determined, which is calculated based on discounted future cash flows projected using best estimate assumptions and is capped at 100%, as net premiums cannot exceed gross premiums. Cohorts with NPRs less than 100% are not used to offset cohorts with NPRs greater than 100%.
The NPR is adjusted for changes in cash flow assumptions and for differences between actual and expected experience. We assess the appropriateness of all future cash flow assumptions, excluding the expense assumption, on a quarterly basis and perform an in-depth review of future cash flow assumptions in the third quarter of each year. Updates are made when evidence suggests a revision is necessary. Updates for actual experience, which includes actual cash flows and insurance in-force, are performed on a quarterly basis. These updated cash flows are used to calculate a revised NPR, which is used to derive an updated liability as of the beginning of the current reporting period, discounted at the original contract issuance date. The updated liability is compared with the carrying amount of the liability as of that same date before the revised NPR. The difference between these amounts is the remeasurement gain or loss, presented parenthetically within Benefits and other changes in policy reserves in the Consolidated Statements of Operations. In subsequent periods, the revised NPR is used to measure the FPB, subject to future revisions. If the NPR is greater than 100%, and therefore capped at 100%, the liability is increased and expensed immediately to reflect the amount necessary for net premiums to equal gross premiums. As the liability assumptions are reviewed and updated, if deemed necessary, at least annually, if conditions improve whereby the contracts are no longer expected to have net premiums in excess of gross premiums, the improvements would be captured in the remeasurement process and reflected in the Consolidated Statements of Operations in the period of improvement.
For traditional life policies and life-contingent immediate annuity policies (which includes life-contingent PRT annuities), the discount rate assumption is an equivalent single rate that is derived based on A-credit-rated fixed-income instruments with similar duration to the liability. We selected fixed-income instruments that have been A-rated by Bloomberg. In order to reflect the duration characteristics of the liability, we will use an implied forward yield curve and linear interpolation will be used for durations that have limited or no market observable points on the curve. The discount rate assumption is updated quarterly and used to remeasure the liability at the reporting date, with the resulting change reflected in the Consolidated Statements of Comprehensive Income (Loss).
Deferred Profit Liability
For life-contingent immediate annuity policies, gross premiums received in excess of net premiums are deferred at initial recognition as a DPL. Premiums are measured using assumptions consistent with those used in the measurement of the related liability for FPBs, including discount rate, mortality, and expenses.
The DPL is amortized and recognized as premium revenue with the amount of expected future benefit payments, discounted using the same discount rate determined and locked-in at contract issuance that is used in the measurement of the related FPB. Interest is accreted on the balance of the DPL using this same discount rate. We periodically review and update our estimates using the actual historical experience and updated cash flows for the DPL at the same time as the estimates of cash flows for the FPB. When cash flows are updated, the updated estimates are used to recalculate the initial DPL at contract issuance. The recalculated DPL as of the beginning of the current reporting period is compared to the carrying amount of the DPL as of the beginning of the current reporting period, with any differences recognized as a remeasurement gain or loss, presented parenthetically within Benefits and other changes in policy reserves in the Consolidated Statements of Operations. The DPL is recorded as a component of the Future policy benefits in the Consolidated Balance Sheets.
Market Risk Benefits
MRBs are contracts or contract features that both provide protection to the contract holder from other-than-nominal capital market risk (equity, interest rate and foreign exchange risk) and expose the Company to other-than-nominal capital market risk. MRBs include certain contract features primarily on indexed annuities products that provide minimum guarantees to policyholders, such as guaranteed minimum death benefit (“GMDB”), guaranteed minimum withdrawal benefit (“GMWB”) riders and guaranteed minimum accumulation benefit (“GMAB”) riders. In certain reinsurance transactions, the underlying risks ceded to a reinsurer contain MRBs.
MRBs (inclusive of reinsured MRBs) are measured at fair value using an attributed fee measurement approach where attributed fees are explicit rider charges collectible from the policyholder (or paid to the reinsurer) used to cover the excess benefits, which represent expected benefits in excess of the policyholder’s account value. At contract inception, an attributed fee ratio is calculated equal to rider charges over benefits paid in excess of the account value attributable to the MRBs. The attributed fee ratio remains static over the life of the MRBs and is capped at 100%. Each period subsequent to contract inception, the attributed fee ratio is used to calculate the fair value of the MRBs using a risk neutral valuation method and is based on current net amounts at risk, market data, internal and industry experience, and other factors. The balances are computed using assumptions including mortality, full and partial surrender, GMWB utilization, risk-free rates including non-performance spread and risk margin, market value of options and economic scenarios. Policyholder behavior assumptions are reviewed at least annually, typically in the third quarter, for any revisions. Reinsured MRBs are valued using a methodology consistent with direct MRBs, with the exception of the non-performance spread which reflects the credit of the reinsurer. MRBs can either be in an asset or liability position and are presented separately on the Consolidated Balance Sheets as the right of setoff criteria are not met. Changes in fair value, net, are recognized in Market risk benefit (gains) losses in the Consolidated Statements of Operations, except for the change in fair value due to a change in our instrument-specific credit risk, which is recognized in the Consolidated Statements of Comprehensive Income (Loss). See a description of the fair value methodology used in Note B - Fair Value of Financial Instruments and Note G - Market Risk Benefits.
Income Taxes
We recognize deferred tax assets and liabilities for temporary differences between the financial reporting basis and the tax basis of our assets and liabilities and expected benefits of utilizing net operating loss and credit carryforwards. Deferred tax assets and liabilities are measured using enacted tax rates expected to apply to taxable income in the years in which those temporary differences are expected to be recovered or settled. We evaluate the likelihood of realizing the benefit of our deferred tax assets and may record a valuation allowance if, based on all available evidence, we determine that it is more likely than not that some portion of the tax benefit will not be realized. We adjust the valuation allowance if, based on our evaluation, there is a change in the amount of deferred income tax assets that are deemed more-likely-than-not to be realized. The impact on deferred taxes of changes in tax rates and laws, if any, is applied to the years during which temporary differences are expected to be settled and reflected in the financial statements in the period enacted.
Reinsurance
Our insurance subsidiaries enter into reinsurance agreements with other companies in the normal course of business. In certain arrangements that are not accounted for as reinsurance, the right of offset may be applied resulting in all balances and activity associated with the agreement being presented on a net basis in the Consolidated Balance Sheets and Statements of Operations, respectively.
When the right of offset is not applied, the arrangement is reflected on a gross basis in the Consolidated Balance Sheets and Statements of Operations. This results in the recognition of a Reinsurance recoverable for amounts due from the reinsurer. For arrangements accounted for as reinsurance, the Reinsurance recoverable balance reflects the reserve balance of the policies ceded. For arrangements not accounted for as reinsurance, deposit accounting is applied. As a result, the deposit asset presented as a Reinsurance recoverable on the Consolidated Balance Sheets, is based on the actual and expected cash flows due from the reinsurer where the interest method is used to accrete the deposit asset using an effective yield based on changes in actual and expected cash flows. For coinsurance of FIA and IUL policies, the Reinsurance recoverable will incorporate the fair value of the indexed crediting feature, which is accounted for as an embedded derivative. Changes in the Reinsurance recoverable balance are reported as Benefits and other changes in policy reserves in the Consolidated Statements of Operations.
Cost of Reinsurance
Amounts received from or paid to reinsurers in excess of reimbursements or liabilities ceded, respectively, represents COR. If the net COR balance is in a deferred gain position, it is included within Accounts payable and accrued liabilities with the related amortization reflected within Life insurance premiums and other fees and, if in a deferred loss position, is included within the Prepaid expenses and other assets with the related amortization reflected within Other operating expenses, in the Consolidated Balance Sheets and Statements of Operations, respectively. Premiums and expenses are recorded net of reinsurance ceded.
Funds Withheld Arrangements
F&G cedes certain business on a coinsurance funds withheld basis. Investment results for the assets that support the coinsurance that are segregated within the funds withheld account are passed directly to the reinsurer pursuant to the contractual terms of the reinsurance agreement, which creates embedded derivatives considered to be total return swaps. These total return swaps are not clearly and closely related to the underlying reinsurance agreement and thus require bifurcation. The fair value of the total return swaps is based on the change in fair value of the underlying assets held in the funds withheld account. These embedded derivatives are reported in Prepaid expenses and other assets if in a net gain position, or Accounts payable and accrued liabilities, if in a net loss position on the Consolidated Balance Sheets and the related gains or losses are reported in Recognized gains and (losses), net, on the Consolidated Statements of Operations.
Revenue Recognition
F&G derives its revenue from external customers primarily located in the United States. Life insurance premiums and other fees primarily reflect premiums on life-contingent PRTs and traditional life insurance products, which are recognized as revenue when due from the policyholder, as well as policy rider fees primarily on indexed annuities policies, the cost of insurance on IUL policies and surrender charges assessed against policy withdrawals in excess of the policyholder's allowable penalty-free amounts. We have ceded the majority of our traditional life business to unaffiliated third-party reinsurers. While the base contract has been reinsured, we continue to retain the return of premium rider. Other income related to riders is earned when elected by the policyholder. Surrender charges are earned when a policyholder withdraws funds from the contract early or cancels the contract.
Premium and annuity deposit collections for indexed annuities, fixed rate annuities, immediate annuities and PRT without life contingencies, and amounts received for funding agreements are reported in the financial statements as deposit liabilities (i.e., Contractholder Funds) instead of as sales or revenues. Similarly, cash payments to customers are reported as decreases in the liability for contractholder funds and not as expenses. Sources of revenues for products accounted for as deposit liabilities include net investment income, surrender, cost of insurance and other charges deducted from Contractholder Funds, and net realized gains (losses) on investments. Components of expenses for products accounted for as deposit liabilities are interest-sensitive and index product benefits (primarily interest credited to account balances or the hedging cost of providing index credits to the policyholder), amortization of VOBA, DAC, DSI and COR, other operating costs and expenses, and income taxes.
Premiums, annuity deposits (net of reinsurance and reinsurance recoverable) and funding agreements, which are not included as revenues in the Consolidated Statements of Operations, collected by product type were as follows:
| | | | | | | | | | | | | | | | | |
| Year Ended December 31, |
| 2024 | | 2023 | | 2022 |
| | | | | |
| Indexed annuities | $ | 5,828 | | | $ | 4,738 | | | $ | 4,483 | |
| Fixed rate annuities | 1,277 | | | 1,147 | | | 1,522 | |
| Funding agreements (FABN/FHLB) | 2,404 | | | 1,256 | | | 1,891 | |
Life insurance and other (a) | 638 | | | 646 | | | 446 | |
| Total | $ | 10,147 | | | $ | 7,787 | | | $ | 8,342 | |
(a)Life insurance and other primarily includes indexed universal life insurance.
Interest and investment income consist primarily of interest payments received on fixed maturity security holdings and dividends received on preferred and equity security holdings along with the investment income of limited partnerships and is recognized when earned.
Owned distribution revenues generated from commissions earned on contracts with insurance carriers are considered variable consideration and consist of revenue primarily from annuity products. Revenue is recognized at the effective date of each policy sold at the net amount retained under a contract within Owned distribution revenues on the Consolidated Statements of Operations. Intercompany transactions are eliminated in consolidation.
Benefits and Other Changes in Policy Reserves
Benefit expenses for deferred annuities (indexed annuities and fixed rate annuities), IUL policies and funding agreements include interest credited to contractholder account balances. For indexed annuities and IUL, the benefits expense includes the change in fair value of the embedded derivatives associated with the equity crediting rates. Benefit claims in excess of contract account balances, net of reinsurance recoveries, are charged to expense in the period that they are earned by the policyholder based on their selected strategy or strategies.
All changes in the Reinsurance recoverable balance that need to be reflected in earnings are included within Benefits and other changes in policy reserves on the Consolidated Statements of Operations. For reinsurance arrangements that apply reinsurance accounting, this primarily relates to changes in the reserve balance ceded. For reinsurance arrangements that apply deposit accounting, this primarily relates to accretion of the deposit asset balance.
Other changes in policy reserves also include the change in reserves for life insurance products. For traditional life and life-contingent immediate annuities (which includes PRT annuities with life contingencies), policy benefit claims are charged to expense in the period that the claims are incurred, net of reinsurance recoveries. Remeasurement gains or losses on the related FPB and DPL balances are presented parenthetically within Benefits and other changes in policy reserves in the Consolidated Statements of Operations.
Stock-Based Compensation Plans
We account for stock-based compensation plans using the fair value method. Using the fair value method of accounting, compensation cost is measured based on the fair value of the award at the grant date using quoted market prices and recognized over the service period. Refer to Note R - Employee Benefit Plans for more details regarding our stock compensation plans.
Earnings Per Share
Basic earnings per share (“EPS”), as presented on the Consolidated Statements of Operations, is computed by dividing net earnings available to common shareholders in a given period by the weighted average number of common shares outstanding during such period. Net earnings available to common shareholders is net earnings adjusted for net earnings attributable to non-controlling interests, preferred stock dividends, including preferred stock dividends declared. In periods when earnings are positive, diluted EPS is calculated by dividing net earnings available to common shareholders by the weighted average number of common shares outstanding plus assumed conversions of potentially dilutive securities. For periods when we recognize a net loss, diluted loss per share is equal to basic loss per share as the impact of assumed conversions of potentially dilutive securities is considered to be antidilutive. Certain shares of restricted stock, using the treasury stock method and, as of January 12, 2024, the FNF Preferred Stock, using the if-converted method, are treated as common share equivalents for purposes of calculating diluted earnings per share for periods in which the effect is dilutive. The if-converted method assumes that the convertible preferred stock converts into common stock at the beginning of the period or date of issuance, if later.
Refer to Note S - Earnings Per Share for more details over our calculation of EPS.
Comprehensive Income (Loss)
We report Comprehensive Income (Loss) in accordance with GAAP on the Consolidated Statements of Comprehensive Income (Loss). Total comprehensive income is defined as all changes in shareholders' equity during a period, other than those resulting from investments by and distributions to shareholders. While total Comprehensive Income (Loss) is the activity in a period and is largely driven by net earnings in that period, Accumulated other comprehensive income or loss (“AOCI”) represents the cumulative balance of other comprehensive income, net of tax, as of the balance sheet date. Amounts reclassified to net earnings relate to the realized gains (losses) on our investments and other financial instruments, excluding investments in unconsolidated affiliates, and are included in Recognized gains and (losses), net on the Consolidated Statements of Operations. The income tax effects are released from AOCI when the related activity is reclassified to net earnings.
Management Estimates
The preparation of these Consolidated Financial Statements in conformity with GAAP requires us to make estimates and assumptions that affect the reported amounts of assets and liabilities and disclosure of contingent assets and liabilities at the date of the Consolidated Financial Statements and the reported amounts of revenues and expenses during the reporting period. Actual results could differ from those estimates.
Periodically, and at least annually, typically in the third quarter, we review the assumptions associated with reserves for policy benefits and product guarantees. During the third quarter and for the year ended December 31, 2024, based on policyholder behavior, experience and interest rate movements, we reflected updates to surrender assumptions for recent and expected near term policyholder behavior, as well as updated certain indexed annuities assumptions used to calculate the fair value of the embedded derivative component within contractholder funds. These changes resulted in a decrease in total benefits and other changes in policy reserves of approximately $89 million for the year ended December 31, 2024.
During the third quarter and for the year ended December 31, 2023, based on increases in interest rates and pricing changes, we updated certain indexed annuities assumptions to calculate the fair value of the embedded derivative component within the contractholder funds and also aligned reserves to actual policyholder behavior. These changes resulted in an increase in total benefits and other changes in policy reserves of approximately $73 million.
During the fourth quarter of 2022, based on increases in interest rates and pricing changes during 2022, we updated certain indexed annuities assumptions used to calculate the fair value of the embedded derivative component within contractholder funds and the fair value of market risk benefits. These changes, taken together, resulted in an increase in contractholder funds and market risk benefits of $99 million.
Reclassifications
Prior period amounts have been reclassified to conform with the current period presentation.
Note B - Fair Value of Financial Instruments
Our measurement of fair value is based on assumptions used by market participants in pricing the asset or liability, which may include inherent risk, restrictions on the sale or use of an asset, or non-performance risk, which may include our own credit risk. We estimate an exchange price is the price in an orderly transaction between market participants to sell the asset or transfer the liability (“exit price”) in the principal market, or the most advantageous market for that asset or liability in the absence of a principal market as opposed to the price that would be paid to acquire the asset or assume a liability (“entry price”). We categorize financial instruments carried at fair value into a three-level fair value hierarchy, based on the priority of inputs to the respective valuation technique, along with net asset value. The three-level hierarchy for fair value measurement is defined as follows:
Level 1 – Values are unadjusted quoted prices for identical assets and liabilities in active markets accessible at the measurement date.
Level 2 – Inputs include quoted prices for similar assets or liabilities in active markets, quoted prices from those willing to trade in markets that are not active, or other inputs that are observable or can be corroborated by market data for the term of the instrument. Such inputs include market interest rates and volatilities, spreads, and yield curves.
Level 3 – Certain inputs are unobservable (supported by little or no market activity) and significant to the fair value measurement. Unobservable inputs reflect the Company’s best estimate of what hypothetical market participants would use to determine a transaction price for the asset or liability at the reporting date based on the best information available in the circumstances.
Net Asset Value (“NAV”) – Certain equity investments are measured using NAV as a practical expedient in determining fair value. In addition, our unconsolidated affiliates (primarily limited partnerships) are primarily accounted for using the equity method of accounting with fair value determined using NAV as a practical expedient. Our carrying value reflects our pro rata ownership percentage as indicated by NAV in the unconsolidated affiliate’s financial statements, which we may adjust if we determine NAV is not calculated consistent with investment company fair value principles. The underlying investments of the unconsolidated affiliates may have significant unobservable inputs, which may include, but are not limited to, comparable multiples and weighted average cost of capital rates applied in valuation models or a discounted cash flow model. Additionally, management inquires quarterly with the general partner to determine whether any credit or other market events have occurred since prior period financial statements to ensure any material events are properly included in current period valuation and investment income.
In certain cases, the inputs used to measure fair value may fall into different levels of the fair value hierarchy. In such cases, an investment’s level within the fair value hierarchy is based on the lowest level of input that is significant to the fair value measurement. Our assessment of the significance of a particular input to the fair value measurement in its entirety requires judgment and considers factors specific to the investment.
When a determination is made to classify an asset or liability within Level 3 of the fair value hierarchy, the determination is based upon the significance of the unobservable inputs to the overall fair value measurement. Because certain securities trade in less liquid or illiquid markets with limited or no pricing information, the determination of fair value for these securities is inherently more difficult. In addition to the unobservable inputs, Level 3 fair value investments may include observable components, which are components that are actively quoted or can be validated to market-based sources.
Our assets and liabilities measured and carried at fair value on a recurring basis, summarized according to the hierarchy previously described, are as follows (in millions):
| | | | | | | | | | | | | | | | | | | | | | | | | | | | | | | |
| December 31, 2024 |
| Level 1 | | Level 2 | | Level 3 | | NAV | | Fair Value | | |
| Assets | | | | | | | | | | | |
| Cash and cash equivalents | $ | 2,264 | | | $ | — | | | $ | — | | | $ | — | | | $ | 2,264 | | | |
| Fixed maturity securities, available-for-sale: | | | | | | | | | | | |
| Asset-backed securities | — | | | 7,506 | | | 8,143 | | | — | | | 15,649 | | | |
| Commercial mortgage-backed securities | — | | | 5,131 | | | — | | | — | | | 5,131 | | | |
| Corporates | 41 | | | 17,496 | | | 2,941 | | | — | | | 20,478 | | | |
| Hybrids | 35 | | | 546 | | | — | | | — | | | 581 | | | |
| Municipals | — | | | 1,346 | | | — | | | — | | | 1,346 | | | |
| Residential mortgage-backed securities | — | | | 2,785 | | | 3 | | | — | | | 2,788 | | | |
| U.S. Government | 158 | | | — | | | — | | | — | | | 158 | | | |
| Foreign Governments | — | | | 182 | | | 4 | | | — | | | 186 | | | |
| Preferred securities | 119 | | | 144 | | | 7 | | | — | | | 270 | | | |
| Equity securities | 88 | | | — | | | — | | | 57 | | | 145 | | | |
| Derivative investments | — | | | 789 | | | 3 | | | — | | | 792 | | | |
| Investment in unconsolidated affiliates | — | | | — | | | 272 | | | — | | | 272 | | | |
| Other long-term investments | — | | | — | | | 32 | | | | | 32 | | | |
| Short term investments | 2,355 | | | 18 | | | 37 | | | — | | | 2,410 | | | |
| Loan receivable, included in Prepaid expenses and other assets | — | | | — | | | 11 | | | — | | | 11 | | | |
| Reinsurance related embedded derivative, included in Prepaid expenses and other assets | — | | | 109 | | | — | | | — | | | 109 | | | |
| Market risk benefits asset | — | | | — | | | 189 | | | — | | | 189 | | | |
| Total financial assets at fair value | $ | 5,060 | | | $ | 36,052 | | | $ | 11,642 | | | $ | 57 | | | $ | 52,811 | | | |
| Liabilities | | | | | | | | | | | |
| | | | | | | | | | | |
| Derivatives: | | | | | | | | | | | |
| Indexed annuities/ IUL embedded derivatives, included in Contractholder funds | $ | — | | | $ | — | | | $ | 5,220 | | | $ | — | | | $ | 5,220 | | | |
| | | | | | | | | | | |
| Interest rate swaps, included in Accounts payable and accrued liabilities | — | | | 10 | | | — | | | — | | | 10 | | | |
| Contingent consideration, included in Accounts payable and accrued liabilities | —�� | | | — | | | 74 | | | — | | | 74 | | | |
| Market risk benefits liability | — | | | — | | | 549 | | | — | | | 549 | | | |
| Total financial liabilities at fair value | $ | — | | | $ | 10 | | | $ | 5,843 | | | $ | — | | | $ | 5,853 | | | |
| | | | | | | | | | | | | | | | | | | | | | | | | | | | | | | |
| December 31, 2023 |
| Level 1 | | Level 2 | | Level 3 | | NAV | | Fair Value | | |
| Assets | | | | | | | | | | | |
| Cash and cash equivalents | $ | 1,563 | | | $ | — | | | $ | — | | | $ | — | | | $ | 1,563 | | | |
| Fixed maturity securities, available-for-sale: | | | | | | | | | | | |
| Asset-backed securities | — | | | 7,212 | | | 7,122 | | | — | | | 14,334 | | | |
| Commercial mortgage-backed securities | — | | | 4,392 | | | 18 | | | — | | | 4,410 | | | |
| Corporates | — | | | 14,609 | | | 1,970 | | | — | | | 16,579 | | | |
| Hybrids | 95 | | | 523 | | | — | | | — | | | 618 | | | |
| Municipals | — | | | 1,518 | | | 49 | | | — | | | 1,567 | | | |
| Residential mortgage-backed securities | — | | | 2,421 | | | 3 | | | — | | | 2,424 | | | |
| U.S. Government | 261 | | | — | | | — | | | — | | | 261 | | | |
| Foreign Governments | — | | | 210 | | | 16 | | | — | | | 226 | | | |
| Preferred securities | 152 | | | 310 | | | 7 | | | — | | | 469 | | | |
| Equity securities | 78 | | | — | | | — | | | 59 | | | 137 | | | |
| | | | | | | | | | | |
| Derivative investments | — | | | 740 | | | 57 | | | — | | | 797 | | | |
| Investment in unconsolidated affiliates | — | | | — | | | 285 | | | — | | | 285 | | | |
| Other long-term investments | — | | | — | | | 37 | | | — | | | 37 | | | |
| Short-term investments | 1,444 | | | 8 | | | — | | | — | | | 1,452 | | | |
| Reinsurance related embedded derivative, included in Prepaid expenses and other assets | — | | | 152 | | | — | | | — | | | 152 | | | |
| Market risk benefits asset | — | | | — | | | 88 | | | — | | | 88 | | | |
| Total financial assets at fair value | $ | 3,593 | | | $ | 32,095 | | | $ | 9,652 | | | $ | 59 | | | $ | 45,399 | | | |
| Liabilities | | | | | | | | | | | |
| | | | | | | | | | | |
| Derivatives: | | | | | | | | | | | |
| Indexed annuities/ IUL embedded derivatives, included in Contractholder funds | $ | — | | | $ | — | | | $ | 4,258 | | | $ | — | | | $ | 4,258 | | | |
| Market risk benefits liability | — | | | — | | | 403 | | | — | | | 403 | | | |
| | | | | | | | | | | |
| | | | | | | | | | | |
| Total financial liabilities at fair value | $ | — | | | $ | — | | | $ | 4,661 | | | $ | — | | | $ | 4,661 | | | |
Valuation Methodologies
Cash and Cash Equivalents
The carrying amounts reported in the Consolidated Balance Sheets for these instruments approximate fair value.
Fixed Maturity, Preferred and Equity Securities
We measure the fair value of our securities based on assumptions used by market participants in pricing the security. The most appropriate valuation methodology is selected based on the specific characteristics of the fixed maturity, preferred or equity security, and we will then consistently apply the valuation methodology to measure the security’s fair value. Our fair value measurement is based on a market approach, which utilizes prices and other relevant information generated by market transactions involving identical or comparable securities. Sources of inputs to the market approach include third-party pricing services, independent broker quotations, or pricing matrices. We use observable and unobservable inputs in our valuation methodologies. Observable inputs include benchmark yields, reported trades, broker-dealer quotes, issuer spreads, two-sided markets, benchmark securities, bids, offers, and reference data including market research publications. In addition, market indicators and industry and economic events are monitored and further market data will be acquired when certain thresholds are met.
For certain security types, additional inputs may be used, or some of the inputs described above may not be applicable. The significant input used in the fair value measurement of equity securities for which the market approach valuation technique is employed is yield for comparable securities. Increases or decreases in the yields would result in lower or higher, respectively, fair value measurements. For broker-quoted only securities, quotes
from market makers or broker-dealers are obtained from sources recognized to be market participants. We believe the broker quotes are prices at which trades could be executed based on historical trades executed at broker-quoted or slightly higher prices.
We analyze the third-party valuation methodologies and related inputs to perform assessments to determine the appropriate level within the fair value hierarchy. However, we did not adjust prices received from third parties as of December 31, 2024 or 2023.
Certain equity investments are measured using NAV as a practical expedient in determining fair value.
Derivative Financial Instruments
Our call options and put options (together referred to as “equity options”), futures contracts, and interest rate swaps can either be exchange traded or over the counter. Exchange traded derivatives typically fall within Level 1 of the fair value hierarchy if there is active trading activity. Two methods are used to value over-the-counter derivatives. When required inputs are available, certain derivatives are valued using valuation pricing models, which represent what we would expect to receive or pay at the balance sheet date if we cancelled or exercised the derivative or entered into offsetting positions. Valuation models require a variety of inputs, which include the use of market-observable inputs, including interest rate, yield curve volatilities, and other factors. These over-the-counter derivatives are typically classified within Level 2 of the fair value hierarchy as the majority trade in liquid markets, we can verify model inputs and model selection does not involve significant management judgment. When inputs aren’t available for valuation models, certain over-the-counter derivatives are valued using independent broker quotes, which are based on unobservable market data and classified within Level 3. Effective September 30, 2024, pricing for certain derivatives was obtained from internal models using substantially all market observable inputs, and those derivatives were transferred out of Level 3 to Level 2.
The fair value of the reinsurance-related embedded derivatives in our funds withheld reinsurance agreements are estimated based upon the fair value of the assets supporting the funds withheld from reinsurance liabilities. The fair value of the assets is based on a quoted market price of similar assets (Level 2), and therefore the fair value of the embedded derivative is based on market-observable inputs and classified as Level 2.
The fair value measurement of the indexed annuities/IUL embedded derivatives included in contractholder funds is determined through a combination of market observable information and significant unobservable inputs using the option budget method. The market observable inputs are the market value of option and treasury rates. The significant unobservable inputs are the budgeted option cost (i.e., the expected cost to purchase equity options in future periods to fund the equity indexed linked feature), surrender rates, mortality multiplier and non-performance spread. The mortality multiplier at December 31, 2024 and 2023 was applied to the 2012 Individual Annuity mortality tables. Increases or decreases in the market value of an option in isolation would result in a higher or lower, respectively, fair value measurement. Increases or decreases in treasury rates, mortality multiplier, surrender rates, or non-performance spread in isolation would result in a lower or higher fair value measurement, respectively. Generally, a change in any one unobservable input would not directly result in a change in any other unobservable input. Also refer to Management's Estimates in Note A - Business and Summary of Significant Accounting Policies regarding certain assumption updates.
Investments in Unconsolidated affiliates
We have elected the fair value option for certain investments in unconsolidated affiliates as we believe this better aligns them with other investments in unconsolidated affiliates that are measured using NAV as a practical expedient in determining fair value. Investments measured using the fair value option are included in Level 3 and the fair values of these investments are determined using a multiple of the affiliates’ EBITDA. The EBITDA is based on the affiliates’ financial information. The multiple is derived from market analysis of transactions involving comparable companies. The inputs are considered unobservable, as not all market participants have access to this data.
Other Long-term Investments
We hold a fund-linked note, which provides for an additional payment at maturity based on the value of an embedded derivative based on the actual return of a dedicated return fund. Fair value of the embedded derivative is based on an unobservable input, the NAV of the fund at the balance sheet date. The embedded derivative is similar to an equity option on the NAV of the fund with a strike price of zero since we will not be required to make any additional payments at maturity of the fund-linked note in order to receive the NAV of the fund on the maturity date. A Black-Scholes model determines the NAV of the fund as the fair value of the equity option regardless of the values used for the other inputs to the option pricing model. The NAV of the fund is provided by the fund manager at the end of each calendar month and represents the value an investor would receive if it withdrew its investment on the balance sheet date. Therefore, the key unobservable input used in the Black-Scholes model is the value of the fund. As the value of the fund increases or decreases, the fair value of the embedded derivative will increase or decrease. See further discussion on the available-for-sale embedded derivative in Note D - Derivative Financial Instruments.
The fair value of the credit-linked note is based on a weighted average of a broker quote and a discounted cash flow analysis. The discounted cash flow approach is based on the expected portfolio cash flows and amortization schedule reflecting investment expectations, adjusted for assumptions on the portfolio's default and recovery rates, and the note's discount rate. The fair value of the note is provided by the fund manager at the end of each quarter.
Short-term Investments
The carrying amounts reported in the Consolidated Balance Sheets for these instruments approximate fair value. Certain short-term investments are valued based on third-party pricing services or broker quotes and are classified as Level 2 or 3.
Loan receivable
Concurrent with the Roar purchase agreement, we executed a separate loan agreement with the sellers of Roar. The loan is collateralized by the sellers’ minority equity stake in Roar. The loan receivable is measured at fair value using a discounted cash flow model applied using a Monte Carlo simulation of estimated cash flows at each measurement period and for each simulated path relative to the estimated collateral value. The Monte Carlo simulation utilizes the outstanding principal balance, a risk-adjusted discount rate, and risk-free rates to discount the expected cash flows and compare to the estimated collateral value for each payment period and simulated path. The discounted cash flow approach applies a company-specific discount rate to future expected interest and payoff payments to calculate the estimated fair value based on the average outcome from the simulation. This loan receivable is included in Level 3 and the inputs are considered unobservable, as not all market participants have access to this data.
Market Risk Benefits
MRBs (inclusive of reinsured MRBs) are measured at fair value using an attributed fee measurement approach where attributed fees are explicit rider charges collectible from the policyholder (or paid to the reinsurer) used to cover the excess benefits. The fair value is calculated using a risk neutral valuation method and is based on current net amounts at risk, market data, internal and industry experience, and other factors. The balances are computed using assumptions including mortality, full and partial surrender, rider benefit utilization, risk-free rates including non-performance spread and risk margin, market value of options and economic scenarios. Policyholder behavior assumptions are reviewed at least annually, typically in the third quarter, for any revisions. Reinsured MRBs are valued using a methodology consistent with direct MRBs, with the exception of the non-performance spread which reflects the credit of the reinsurer. See further discussion on MRBs in Note G - Market Risk Benefits.
Contingent Consideration
The contingent consideration is measured at fair value using a discounted cash flow model applied using a Monte Carlo simulation of estimated EBITDA at each measurement period and for each simulated path relative to contractual EBITDA milestones. The Monte Carlo simulation utilizes a risk-adjusted discount rate, volatility assumption, and risk-free rates to assess the probability Roar's EBITDA trajectory reaches required milestones for the earn out payments to be made. The discounted cash flow approach applies a company-specific discount rate based on F&G credit profile to future expected earn out payments to calculate the estimated fair value based on the average outcome from the simulation. See further discussion on the contingent consideration in Note N - Commitments and Contingencies.
Quantitative information regarding significant unobservable inputs used for recurring Level 3 fair value measurements of financial instruments carried at fair value as of December 31, 2024 and 2023, excluding assets and liabilities for which significant quantitative unobservable inputs are not developed internally and not readily available to the Company (primarily those valued using broker quotes and certain third-party pricing services) are as follows (in millions):
| | | | | | | | | | | | | | | | | | | | | | | |
| December 31, 2024 |
| Fair Value | | Valuation Technique | | Unobservable Input(s) | | Range
(Weighted average) |
| Assets | | | | | | | |
| | | | | | | |
| | | | | | | |
| Fixed maturity securities, available-for-sale: | | | | | | | |
| Asset-backed securities | $ | 95 | | | Third-Party Valuation | | Discount Rate | | 4.83% - 7.15% (6.33%) |
| | | | | | | |
| | | | | | | |
| | | | | | | |
| | | | | | | |
| Corporates | 750 | | | Third-Party Valuation | | Discount Rate | | 2.00% - 22.53% (6.76%) |
| | | | | | | |
| | | | | | | |
| | | | | | | |
| Residential mortgage-backed securities | 3 | | | Third-Party Valuation | | Discount Rate | | 5.89% - 5.89% (5.89%) |
| Foreign governments | 4 | | | Third-Party Valuation | | Discount Rate | | 12.14% - 12.14% (12.14%) |
| Investment in unconsolidated affiliates | 272 | | | Market Comparable Company Analysis | | EBITDA Multiple | | 8.7x - 23.6x (14.6x) |
| Other long-term investments: | | | | | | | |
| Available-for-sale embedded derivative | 32 | | | Black Scholes Model | | Market Value of AnchorPath Fund | | 100.00% |
| Prepaid expenses and other assets: | | | | | | | |
| Loan receivable | 11 | | | Discounted Cash Flow | | Risk-Adjusted Discount Rate | | 7.22% - 7.22% (7.22%) |
| | | | | Collateral Volatility | | 35.00% - 35.00% (35.00%) |
| | | | | | | |
| | | | | | | |
| | | | | | | |
| | | | | | | |
| | | | | | | |
| | | | | | | |
| | | | | | | |
| | | | | | | |
| | | | | | | |
| | | | | | | |
| | | | | | | |
| | | | | | | |
| | | | | | | |
| | | | | | | |
| Market risk benefits asset | 189 | | Discounted Cash Flow | | Mortality | | 80.00% - 115.00% (100.00%) |
| | | | | Surrender Rates | | 0.25% - 30.00% (5.05%) |
| | | | | Partial Withdrawal Rates | | 2.00% - 24.39% (2.48%) |
| | | | | Non-Performance Spread | | 0.48% - 0.95% (0.75%) |
| | | | | GMWB Utilization | | 50.00% - 75.00% (61.77%) |
| Total financial assets at fair value (a) | $ | 1,356 | | | | | | | |
| | | | | | | |
| | | | | | | |
| | | | | | | |
| | | | | |
| | | | | | | | | | | | | | | | | | | | | | | |
| December 31, 2024 |
| Fair Value | | Valuation Technique | | Unobservable Input(s) | | Range
(Weighted average) |
| Liabilities | | | | | | | |
| | | | | | | |
| | | | | | | |
| | | | | | | |
| | | | | | | |
| | | | | | | |
| | | | | | | |
| | | | | | | |
| | | | | | | |
| Derivatives: | | | | | | | |
| Indexed annuities/IUL embedded derivatives, included in Contractholder funds | $ | 5,220 | | | Discounted Cash Flow | | Market Value of Option | | 0.00% - 20.81% (2.92%) |
| | | | | | | |
| | | | | Mortality Multiplier | | 80.00% - 115.00% (100.00%) |
| | | | | Surrender Rates | | 0.25% - 50.00% (6.94%) |
| | | | | Partial Withdrawals | | 2.00% - 35.71% (2.72%) |
| | | | | Non-Performance Spread | | 0.48% - 0.95% (0.75%) |
| | | | | Option Cost | | 0.07% - 5.70% (2.68%) |
| Accounts payable and accrued liabilities: | | | | | | | |
| Contingent consideration | 74 | | | Discounted Cash Flow | | Risk-Adjusted Discount Rate | | 13.50% - 13.50% (13.50%) |
| | | | | EBITDA Volatility | | 35.00% - 35.00% (35.00%) |
| | | | | Counterparty Discount Rate | | 6.50% - 6.50% (6.50%) |
| Market risk benefits liability | 549 | | | Discounted Cash Flow | | Mortality | | 80.00% - 115.00% (100.00%) |
| | | | | Surrender Rates | | 0.25% - 30.00% (5.05%) |
| | | | | Partial Withdrawal Rates | | 2.00% - 24.39% (2.48%) |
| | | | | Non-Performance Spread | | 0.48% - 0.95% (0.75%) |
| | | | | GMWB Utilization | | 50.00% - 75.00% (61.77%) |
| Total financial liabilities at fair value | $ | 5,843 | | | | | | | |
(a)Assets of $10,286 million for which significant quantitative unobservable inputs are not developed internally and not readily available to the Company (primarily those valued using broker quotes and certain third-party pricing services) are excluded from the respective totals in the table above.
| | | | | | | | | | | | | | | | | | | | | | | |
| December 31, 2023 |
| Fair Value | | Valuation Technique | | Unobservable Input(s) | | Range
(Weighted average) |
| Assets | | | | | | | |
| | | | | | | |
| Fixed maturity securities, available-for-sale: | | | | | | | |
| Asset-backed securities | $ | 57 | | | Third-Party Valuation | | Discount Rate | | 5.09% - 6.95% (6.00%) |
| | | | | | | |
| | | | | | | |
| | | | | | | |
| | | | | | | |
| | | | | | | |
| | | | | | | |
| Corporates | 787 | | | Third-Party Valuation | | Discount Rate | | 0.00% - 12.87% (6.91%) |
| | | | | | | |
| | | | | | | |
| | | | | | | |
| | | | | | | |
| Municipals | 32 | | | Third-Party Valuation | | Discount Rate | | 6.25% - 6.25% (6.25%) |
| Residential mortgage-backed securities | 3 | | | Third-Party Valuation | | Discount Rate | | 5.46% - 5.46% (5.46%) |
| | | | | | | |
| Foreign Governments | 16 | | | Third-Party Valuation | | Discount Rate | | 6.94% - 7.68% (7.45%) |
| Investment in unconsolidated affiliates | 285 | | | Market Comparable Company Analysis | | EBITDA Multiple | | 4.4x - 31.8x (23.2x) |
| | | | | | | |
| | | | | | | |
| Other long-term investments: | | | | | | | |
| | | | | | | |
| Available-for-sale embedded derivative | 28 | | | Black Scholes Model | | Market Value of Fund | | 100.00% |
| Market risk benefits asset | 88 | | | Discounted Cash Flow | | Mortality | | 100.00% - 100.00% (100.00%) |
| | | | | Surrender Rates | | 0.25% - 10.00% (5.22%) |
| | | | | Partial Withdrawal Rates | | 0.00% - 23.26% (2.50%) |
| | | | | Non-Performance Spread | | 0.38% - 1.10% (0.96%) |
| | | | | GMWB Utilization | | 50.00% - 60.00% (50.81%) |
| Total financial assets at fair value (a) | $ | 1,296 | | | | | | | |
| | | | | | | |
| Liabilities | | | | | | | |
| | | | | | | |
| | | | | | | |
| | | | | | | |
| | | | | | | |
| | | | | | | |
| | | | | | | |
| | | | | | | |
| | | | | | | |
| Derivatives: | | | | | | | |
| Indexed annuities/ IUL embedded derivatives, included in Contractholder funds | $ | 4,258 | | | Discounted Cash Flow | | Market Value of Option | | 0.00% - 18.93% (2.63%) |
| | | | | | | |
| | | | | Mortality Multiplier | | 100.00% - 100.00% (100.00%) |
| | | | | Surrender Rates | | 0.25% - 70.00% (6.83%) |
| | | | | Partial Withdrawals | | 2.00% - 34.48% (2.74%) |
| | | | | Non-Performance Spread | | 0.38% - 1.10% (0.96%) |
| | | | | Option Cost | | 0.07% - 5.48% (2.38%) |
| | | | | | | |
| | | | | | | |
| | | | | | | |
| | | | | | | |
| | | | | | | |
| | | | | |
| Market risk benefits liability | 403 | | | Discounted Cash Flow | | Mortality | | 100.00% - 100.00% (100.00%) |
| | | | | Surrender Rates | | 0.25% - 10.00% (5.22%) |
| | | | | Partial Withdrawal Rates | | 0.00% - 23.26% (2.50%) |
| | | | | Non-Performance Spread | | 0.38% - 1.10% (0.96%) |
| | | | | | | |
| | | | | | | |
| | | | | GMWB Utilization | | 50.00% - 60.00% (50.81%) |
| Total financial liabilities at fair value | $ | 4,661 | | | | | | | |
(a)Assets of $8,356 million for which significant quantitative unobservable inputs are not developed internally and not readily available to the Company (primarily those valued using broker quotes and certain third-party pricing services) are excluded from the respective totals in the table above.
The following tables summarize changes to the Company’s financial instruments carried at fair value and classified within Level 3 of the fair value hierarchy for the years ended December 31, 2024 and 2023, respectively (in millions). The gains and losses below may include changes in fair value due in part to observable inputs that are a component of the valuation methodology.
| | | | | | | | | | | | | | | | | | | | | | | | | | | | | | | | | | | | | | | | | | | | | | | | | | | | | |
| Year ended December 31, 2024 |
| Balance at Beginning
of Period | | Total Gains (Losses) for Assets and Losses for Liabilities | | Purchases | | Sales | | Settlements | | Net transfer In (Out) of
Level 3 (a) | | Balance at End of
Period | | Change in Unrealized Included in OCI |
| | Included in
Earnings | | Included in
AOCI | | | | | | |
| Assets | | | | | | | | | | | | | | | | | |
| Fixed maturity securities available-for-sale: | | | | | | | | | | | | | | | | | |
| Asset-backed securities | $ | 7,122 | | | $ | 19 | | | $ | 128 | | | $ | 5,104 | | | $ | (2,825) | | | $ | (1,210) | | | $ | (195) | | | $ | 8,143 | | | $ | 130 | |
| Commercial mortgage-backed securities | 18 | | | — | | | — | | | 58 | | | — | | | — | | | (76) | | | — | | | — | |
| Corporates | 1,970 | | | (2) | | | 81 | | | 1,146 | | | (97) | | | (139) | | | (18) | | | 2,941 | | | 80 | |
| | | | | | | | | | | | | | | | | |
| Municipals | 49 | | | — | | | 1 | | | — | | | (50) | | | — | | | — | | | — | | | 1 | |
| Residential mortgage-backed securities | 3 | | | — | | | — | | | 1 | | | — | | | — | | | (1) | | | 3 | | | — | |
| Foreign Governments | 16 | | | — | | | (1) | | | — | | | — | | | (11) | | | — | | | 4 | | | (1) | |
| | | | | | | | | | | | | | | | | |
| | | | | | | | | | | | | | | | | |
| | | | | | | | | | | | | | | | | |
| Preferred securities | 7 | | | — | | | — | | | — | | | — | | | — | | | — | | | 7 | | | — | |
| Derivative investments | 57 | | | (50) | | | 3 | | | — | | | — | | | — | | | (7) | | | 3 | | | 1 | |
| Investment in unconsolidated affiliates (b) | 285 | | | 79 | | | — | | | — | | | — | | | — | | | (92) | | | 272 | | | — | |
| Other long-term investments: | | | | | | | | | | | | | | | | | |
| Available-for-sale embedded derivative | 27 | | | — | | | 5 | | | — | | | — | | | — | | | — | | | 32 | | | 5 | |
| Credit linked note | 10 | | | 1 | | | — | | | — | | | — | | | (11) | | | — | | | — | | | — | |
| Short term investments | — | | | — | | | — | | | 236 | | | (190) | | | (9) | | | — | | | 37 | | | — | |
| Prepaid expenses and other assets: | | | | | | | | | | | | | | | | | |
| Loan receivable (c) | — | | | — | | | — | | | 11 | | | — | | | — | | | — | | | 11 | | | — | |
| | | | | | | | | | | | | | | | | |
| | | | | | | | | | | | | | | | | |
| | | | | | | | | | | | | | | | | |
| | | | | | | | | | | | | | | | | |
| | | | | | | | | | | | | | | | | |
Subtotal assets at Level 3 fair value | 9,564 | | | $ | 47 | | | $ | 217 | | | $ | 6,556 | | | $ | (3,162) | | | $ | (1,380) | | | $ | (389) | | | 11,453 | | | $ | 216 | |
| Market risk benefits asset (d) | 88 | | | | | | | | | | | | | | | 189 | | | |
| Total assets at Level 3 fair value | $ | 9,652 | | | | | | | | | | | | | | | $ | 11,642 | | | |
| Liabilities | | | | | | | | | | | | | | | | | |
| Derivatives: | | | | | | | | | | | | | | | | | |
| Indexed annuities/IUL embedded derivatives, included in Contractholder funds | $ | 4,258 | | | $ | 45 | | | $ | — | | | $ | 1,351 | | | $ | — | | | $ | (434) | | | $ | — | | | $ | 5,220 | | | $ | — | |
| Interest rate swaps | — | | | 28 | | | — | | | — | | | — | | | — | | | (28) | | | — | | | — | |
| Accounts payable and accrued liabilities | | | | | | | | | | | | | | | | | |
| Contingent consideration (e) | — | | | 26 | | | — | | | 48 | | | — | | | — | | | — | | | 74 | | | — | |
Subtotal liabilities at Level 3 fair value | 4,258 | | | $ | 99 | | | $ | — | | | $ | 1,399 | | | $ | — | | | $ | (434) | | | $ | (28) | | | 5,294 | | | — | |
| Market risk benefits liability (d) | 403 | | | | | | | | | | | | | | | 549 | | | |
Total liabilities at Level 3 fair value | $ | 4,661 | | | | | | | | | | | | | | | $ | 5,843 | | | |
(a)The net transfers out of Level 3 during the year ended December 31, 2024 were exclusively to Level 2 with the exception of (b) below.
(b)The transfer out of investments in unconsolidated affiliates reflects F&G’s majority acquisition of PALH on July 18, 2024. Refer to Note P - Acquisitions for details of the PALH majority acquisition.
(c)Purchases represent advances on the loan commitment to Roar. Refer to Note N - Commitments and Contingencies for further details.
(d)Refer to Note G - Market Risk Benefits for roll forward activity of the net Market Risk Benefits Asset and Liability.
(e)The initial contingent consideration recorded in the Roar transaction is included in purchases in the table above. Refer to Note P - Acquisitions for more information.
| | | | | | | | | | | | | | | | | | | | | | | | | | | | | | | | | | | | | | | | | | | | | | | | | | | | | |
| Year ended December 31, 2023 |
| Balance at Beginning
of Period | | Total Gains (Losses) for Assets and Losses for Liabilities | | Purchases | | Sales | | Settlements | | Net transfer In (Out) of Level 3 (a) | | Balance at End of
Period | | Change in Unrealized Included in OCI |
| | Included in
Earnings | | Included in
AOCI | | | | | | |
| Assets | | | | | | | | | | | | | | | | | |
| Fixed maturity securities available-for-sale: | | | | | | | | | | | | | | | | | |
| Asset-backed securities | $ | 6,263 | | | $ | (53) | | | $ | 186 | | | $ | 1,830 | | | $ | (125) | | | $ | (738) | | | $ | (241) | | | $ | 7,122 | | | $ | 185 | |
| Commercial mortgage-backed securities | 37 | | | — | | | 2 | | | 22 | | | — | | | — | | | (43) | | | 18 | | | 2 | |
| Corporates | 1,427 | | | (2) | | | (21) | | | 652 | | | — | | | (94) | | | 8 | | | 1,970 | | | (20) | |
| | | | | | | | | | | | | | | | | |
| Municipals | 29 | | | — | | | 20 | | | — | | | — | | | — | | | — | | | 49 | | | 20 | |
| Residential mortgage-backed securities | 302 | | | 1 | | | 7 | | | 32 | | | — | | | (9) | | | (330) | | | 3 | | | 7 | |
| Foreign Governments | 16 | | | — | | | — | | | — | | | — | | | — | | | — | | | 16 | | | — | |
| | | | | | | | | | | | | | | | | |
| | | | | | | | | | | | | | | | | |
| | | | | | | | | | | | | | | | | |
| Preferred securities | — | | | — | | | 1 | | | — | | | — | | | — | | | 6 | | | 7 | | | 1 | |
| Derivative investments | — | | | 57 | | | — | | | — | | | — | | | — | | | — | | | 57 | | | — | |
| Investment in unconsolidated affiliates | 23 | | | 13 | | | — | | | 249 | | | — | | | — | | | — | | | 285 | | | — | |
| Other long-term investments: | | | | | | | | | | | | | | | | | |
| | | | | | | | | | | | | | | | | |
| Available-for-sale embedded derivative | 23 | | | — | | | 4 | | | — | | | — | | | — | | | — | | | 27 | | | 4 | |
| | | | | | | | | | | | | | | | | |
| | | | | | | | | | | | | | | | | |
| Credit linked note | 15 | | | — | | | — | | | — | | | — | | | (5) | | | — | | | 10 | | | — | |
| Secured borrowing receivable | 10 | | | — | | | — | | | — | | | — | | | (10) | | | — | | | — | | | — | |
| Short term investments | — | | | — | | | — | | | 204 | | | (19) | | | (185) | | | — | | | — | | | — | |
| | | | | | | | | | | | | | | | | |
| | | | | | | | | | | | | | | | | |
| | | | | | | | | | | | | | | | | |
Subtotal assets at Level 3 fair value | 8,145 | | | $ | 16 | | | $ | 199 | | | $ | 2,989 | | | $ | (144) | | | $ | (1,041) | | | $ | (600) | | | 9,564 | | | $ | 199 | |
| Market risk benefits asset (b) | 117 | | | | | | | | | | | | | | | 88 | | | |
| Total assets at Level 3 fair value | $ | 8,262 | | | | | | | | | | | | | | | $ | 9,652 | | | |
| Liabilities | | | | | | | | | | | | | | | | | |
| | | | | | | | | | | | | | | | | |
| Derivatives: | | | | | | | | | | | | | | | | | |
| Indexed annuities/IUL embedded derivatives, included in Contractholder funds | $ | 3,115 | | | $ | 257 | | | $ | — | | | $ | 1,049 | | | $ | — | | | $ | (163) | | | $ | — | | | $ | 4,258 | | | $ | — | |
| | | | | | | | | | | | | | | | | |
Subtotal liabilities at Level 3 fair value | 3,115 | | | $ | 257 | | | $ | — | | | $ | 1,049 | | | $ | — | | | $ | (163) | | | $ | — | | | 4,258 | | | $ | — | |
| Market risk benefits liability (b) | 282 | | | | | | | | | | | | | | | 403 | | | |
Total liabilities at Level 3 fair value | $ | 3,397 | | | | | | | | | | | | | | | $ | 4,661 | | | |
(a)The net transfers out of Level 3 during the year ended December 31, 2023 were exclusively to Level 2.
(b)Refer to Note G - Market Risk Benefits for roll forward activity of the net Market Risk Benefits Asset and Liability.
Valuation Methodologies and Associated Inputs for Financial Instruments Not Carried at Fair Value
The following discussion outlines the methodologies and assumptions used to determine the fair value of our financial instruments not carried at fair value. Considerable judgment is required to develop these assumptions used to measure fair value. Accordingly, the estimates shown are not necessarily indicative of the amounts that would be realized in a one-time, current market exchange of all of our financial instruments.
Mortgage Loans
The fair value of mortgage loans is established using a discounted cash flow method based on internal credit rating, maturity and future income. This yield-based approach is sourced from our third-party vendor. The internal ratings for mortgages in good standing are based on property type, location, market conditions, occupancy, debt service coverage, loan-to-value, quality of tenancy, borrower, and payment record. The inputs used to measure the fair value of our mortgage loans are classified as Level 3 within the fair value hierarchy.
Investments in Unconsolidated affiliates
The fair value of investments in unconsolidated affiliates is primarily determined using NAV as a practical expedient. As discussed in Note A - Business and Summary of Significant Accounting Policies, recognition of income and adjustments to the carrying amount are delayed due to the availability of the related financial statements, which are obtained from the general partner generally on a one to three-month delay.
Policy Loans
Policy loans are reported at the unpaid principal balance and are fully collateralized by the cash surrender value of underlying insurance policies. The carrying value of the policy loans approximates the fair value and are classified as Level 3 in the fair value hierarchy.
Company Owned Life Insurance
Company owned life insurance (“COLI”) is a life insurance program used to finance certain employee benefit expenses. The fair value of COLI is based on net realizable value, which is generally cash surrender value. COLI is classified as Level 3 within the fair value hierarchy.
Investment Contracts
Investment contracts include deferred annuities (indexed annuities and fixed rate annuities), IUL policies, funding agreements and PRT and immediate annuity contracts without life contingencies. The indexed annuities/ IUL embedded derivatives, included in contractholder funds, are excluded as they are carried at fair value. The fair value of the deferred annuities (indexed annuities and fixed rate annuities) and IUL contracts is based on their cash surrender value (i.e., the cost the Company would incur to extinguish the liability) as these contracts are generally issued without an annuitization date. The fair value of funding agreements and PRT and immediate annuity contracts without life contingencies is derived by calculating a new fair value interest rate using the updated yield curve and treasury spreads as of the respective reporting date. The Company is not required to, and has not, estimated the fair value of the liabilities under contracts that involve significant mortality or morbidity risks, as these liabilities fall within the definition of insurance contracts that are exceptions from financial instruments that require disclosures of fair value.
Other
FHLB common stock is carried at cost, which approximates fair value. The carrying amount of FHLB common stock represents the value it can be sold back to the FHLB and is classified as Level 2 within the hierarchy.
Notes Payable
The fair value of notes payable, with the exception of the Revolving Credit Facility, is based on quoted market prices of debt with similar credit risk and tenor. The inputs used to measure the fair value of these notes payable results in a Level 2 classification within the fair value hierarchy.
The carrying value of the revolving credit facility approximates fair value as the rates are comparable to those at which we could currently borrow under similar terms. As such, the fair value of the revolving credit facility was classified as a Level 2 measurement. At December 31, 2024 and 2023, the outstanding balance on the revolving credit facility was $0 and $365 million, respectively.
The following tables provide the carrying value and estimated fair value of our financial instruments that are carried on the Consolidated Balance Sheets at amounts other than fair value, summarized according to the fair value hierarchy previously described (in millions).
| | | | | | | | | | | | | | | | | | | | | | | | | | | | | | | | | | | |
| December 31, 2024 |
| Level 1 | | Level 2 | | Level 3 | | NAV | | Total Estimated Fair Value | | Carrying Amount |
| Assets | | | | | | | | | | | |
| FHLB common stock | $ | — | | | $ | 153 | | | $ | — | | | $ | — | | | $ | 153 | | | $ | 153 | |
| Commercial mortgage loans | — | | | — | | | 2,404 | | | — | | | 2,404 | | | 2,705 | |
| Residential mortgage loans | — | | | — | | | 2,916 | | | — | | | 2,916 | | | 3,221 | |
| Investments in unconsolidated affiliates | — | | | — | | | 5 | | | 3,288 | | | 3,293 | | | 3,293 | |
| Policy loans | — | | | — | | | 104 | | | — | | | 104 | | | 104 | |
| | | | | | | | | | | |
| Company-owned life insurance | — | | | — | | | 395 | | | — | | | 395 | | | 395 | |
| | | | | | | | | | | |
| | | | | | | | | | | |
Total | $ | — | | | $ | 153 | | | $ | 5,824 | | | $ | 3,288 | | | $ | 9,265 | | | $ | 9,871 | |
| | | | | | | | | | | |
| | | | | | | | | | | |
| Liabilities | | | | | | | | | | | |
| Investment contracts, included in contractholder funds | $ | — | | | $ | — | | | $ | 46,339 | | | $ | — | | | $ | 46,339 | | | $ | 51,184 | |
| Notes payable | — | | | 2,228 | | | — | | | — | | | 2,228 | | | 2,171 | |
| | | | | | | | | | | |
Total | $ | — | | | $ | 2,228 | | | $ | 46,339 | | | $ | — | | | $ | 48,567 | | | $ | 53,355 | |
| | | | | | | | | | | | | | | | | | | | | | | | | | | | | | | | | | | |
| December 31, 2023 |
| Level 1 | | Level 2 | | Level 3 | | NAV | | Total Estimated Fair Value | | Carrying Amount |
| Assets | | | | | | | | | | | |
| FHLB common stock | $ | — | | | $ | 138 | | | $ | — | | | $ | — | | | $ | 138 | | | $ | 138 | |
| Commercial mortgage loans | — | | | — | | | 2,253 | | | — | | | 2,253 | | | 2,538 | |
| Residential mortgage loans | — | | | — | | | 2,545 | | | — | | | 2,545 | | | 2,798 | |
| Investments in unconsolidated affiliates | — | | | — | | | 7 | | | 2,779 | | | 2,786 | | | 2,786 | |
| Policy loans | — | | | — | | | 71 | | | — | | | 71 | | | 71 | |
| | | | | | | | | | | |
| Company-owned life insurance | — | | | — | | | 362 | | | — | | | 362 | | | 362 | |
| | | | | | | | | | | |
| | | | | | | | | | | |
Total | $ | — | | | $ | 138 | | | $ | 5,238 | | | $ | 2,779 | | | $ | 8,155 | | | $ | 8,693 | |
| | | | | | | | | | | |
| | | | | | | | | | | |
| Liabilities | | | | | | | | | | | |
| Investment contracts, included in contractholder funds | $ | — | | | $ | — | | | $ | 40,229 | | | $ | — | | | $ | 40,229 | | | $ | 44,540 | |
| Notes payable | — | | | 1,777 | | | — | | | — | | | 1,777 | | | 1,754 | |
| | | | | | | | | | | |
Total | $ | — | | | $ | 1,777 | | | $ | 40,229 | | | $ | — | | | $ | 42,006 | | | $ | 46,294 | |
For investments for which NAV is used, we do not have any significant restrictions in our ability to liquidate our positions in these investments, other than obtaining general partner approval, nor do we believe it is probable a price less than NAV would be received in the event of a liquidation.
We review the fair value hierarchy classifications each reporting period. Changes in the observability of the valuation attributes may result in a reclassification of certain financial assets or liabilities. Such reclassifications are reported as transfers in and out of Level 3, or between other levels, at the beginning fair value for the reporting period in which the changes occur. The transfers into and out of Level 3 were related to changes in the primary pricing source and changes in the observability of external information used in determining the fair value.
Note C - Investments
Our investments in fixed maturity securities have been designated as AFS and are carried at fair value, net of allowance for expected credit losses, with unrealized gains and losses included within AOCI, net of deferred income taxes. Our preferred and equity securities investments are carried at fair value with unrealized gains and losses included in net earnings. The Company’s consolidated investments are summarized as follows (in millions):
| | | | | | | | | | | | | | | | | | | | | | | | | | | | | | | |
| December 31, 2024 |
| Amortized Cost | | Allowance for Expected Credit Losses | | Gross Unrealized Gains | | Gross Unrealized Losses | | Fair Value | | |
| AFS securities | | | | | | | | | | | |
| Asset-backed securities | $ | 15,777 | | | $ | (13) | | | $ | 202 | | | $ | (317) | | | $ | 15,649 | | | |
| Commercial mortgage-backed securities | 5,327 | | | (49) | | | 53 | | | (200) | | | 5,131 | | | |
| Corporates | 23,177 | | | — | | | 103 | | | (2,802) | | | 20,478 | | | |
| Hybrids | 604 | | | — | | | 6 | | | (29) | | | 581 | | | |
| Municipals | 1,592 | | | — | | | 3 | | | (249) | | | 1,346 | | | |
| Residential mortgage-backed securities | 2,861 | | | — | | | 32 | | | (105) | | | 2,788 | | | |
| U.S. Government | 160 | | | — | | | 1 | | | (3) | | | 158 | | | |
| Foreign Governments | 231 | | | — | | | — | | | (45) | | | 186 | | | |
Total AFS securities | $ | 49,729 | | | $ | (62) | | | $ | 400 | | | $ | (3,750) | | | $ | 46,317 | | | |
| | | | | | | | | | | |
| | | | | | | | | | | |
| | | | | | | | | | | |
| | | | | | | | | | | |
| | | | | | | | | | | |
| | | | | | | | | | | |
| | | | | | | | | | | |
| | | | | | | | | | | |
| | | | | | | | | | | |
| | | | | | | | | | | | | | | | | | | | | | | | | | | | | | | |
| December 31, 2023 |
| Amortized Cost | | Allowance for Expected Credit Losses | | Gross Unrealized Gains | | Gross Unrealized Losses | | Fair Value | | |
| AFS securities | | | | | | | | | | | |
| Asset-backed securities | $ | 14,623 | | | $ | (11) | | | $ | 191 | | | $ | (469) | | | $ | 14,334 | | | |
| Commercial mortgage-backed securities | 4,732 | | | (22) | | | 23 | | | (323) | | | 4,410 | | | |
| Corporates | 18,780 | | | — | | | 178 | | | (2,379) | | | 16,579 | | | |
| Hybrids | 668 | | | — | | | 3 | | | (53) | | | 618 | | | |
| Municipals | 1,776 | | | — | | | 14 | | | (223) | | | 1,567 | | | |
| Residential mortgage-backed securities | 2,501 | | | (2) | | | 29 | | | (104) | | | 2,424 | | | |
| U.S. Government | 258 | | | — | | | 4 | | | (1) | | | 261 | | | |
| Foreign Governments | 263 | | | — | | | 2 | | | (39) | | | 226 | | | |
Total AFS securities | $ | 43,601 | | | $ | (35) | | | $ | 444 | | | $ | (3,591) | | | $ | 40,419 | | | |
| | | | | | | | | | | |
| | | | | | | | | | | |
| | | | | | | | | | | |
| | | | | | | | | | | |
| | | | | | | | | | | |
| | | | | | | | | | | |
| | | | | | | | | | | |
| | | | | | | | | | | |
| | | | | | | | | | | |
Securities held on deposit with various state regulatory authorities had a fair value of $866 million at December 31, 2024 and was immaterial at December 31, 2023.
As of December 31, 2024 and 2023, the Company held $32 million and $47 million, respectively, of investments that were non-income producing for a period greater than twelve months.
As of December 31, 2024 and 2023, the Company's accrued interest receivable balance, excluding accrued interest receivable balances related to mortgage loans discussed below under “Mortgage Loans,” was $465 million and $438 million, respectively. Accrued interest receivable is classified within Prepaid expenses and other assets within the Consolidated Balance Sheets.
In accordance with our FHLB agreements, the investments supporting the funding agreement liabilities are pledged as collateral to secure the FHLB funding agreement liabilities and are not available to us for general purposes. The collateral investments had a fair value of $4,289 million and $4,345 million as of December 31, 2024 and 2023, respectively.
The amortized cost and fair value of fixed maturity securities by contractual maturities, as applicable, are shown below (in millions). Actual maturities may differ from contractual maturities because issuers may have the right to call or prepay obligations.
| | | | | | | | | | | | | | | |
| December 31, 2024 | | |
| Amortized Cost | | Fair Value | | | | |
| Corporates, Non-structured Hybrids, Municipal, Foreign and U.S. Government Securities: | | | | | | | |
| Due in one year or less | $ | 525 | | | $ | 524 | | | | | |
| Due after one year through five years | 3,634 | | | 3,589 | | | | | |
| Due after five years through ten years | 4,930 | | | 4,756 | | | | | |
| Due after ten years | 16,675 | | | 13,880 | | | | | |
| Subtotal | 25,764 | | | 22,749 | | | | | |
| Other securities, which provide for periodic payments: | | | | | | | |
| Asset-backed securities | 15,777 | | | 15,649 | | | | | |
| Commercial mortgage-backed securities | 5,327 | | | 5,131 | | | | | |
| | | | | | | |
| Residential mortgage-backed securities | 2,861 | | | 2,788 | | | | | |
| Subtotal | 23,965 | | | 23,568 | | | | | |
| Total fixed maturity AFS securities | $ | 49,729 | | | $ | 46,317 | | | | | |
Allowance for Current Expected Credit Loss
We regularly review AFS securities for declines in fair value that we determine to be credit related. For our fixed maturity securities, we generally consider the following in determining whether our unrealized losses are credit related, and if so, the magnitude of the credit loss:
•The extent to which the fair value is less than the amortized cost basis;
•The reasons for the decline in value (credit event, currency or interest-rate related, including general credit spread widening);
•The financial condition of and near-term prospects of the issuer (including issuer's current credit rating and the probability of full recovery of principal based upon the issuer's financial strength);
•Current delinquencies and non-performing assets of underlying collateral;
•Expected future default rates;
•Collateral value by vintage, geographic region, industry concentration or property type;
•Subordination levels or other credit enhancements as of the balance sheet date as compared to origination; and
•Contractual and regulatory cash obligations and the issuer's plans to meet such obligations.
We recognize an allowance for current expected credit losses on fixed maturity securities in an unrealized loss position when it is determined, using the factors discussed above, a component of the unrealized loss is related to credit. We measure the credit loss using a discounted cash flow model that utilizes the single best estimate cash flow and the recognized credit loss is limited to the total unrealized loss on the security (i.e., the fair value floor). Cash flows are discounted using the implicit yield of bonds at their time of purchase and the current book yield for asset and mortgage backed securities as well as variable rate securities. We recognize the expected credit losses in Recognized gains and (losses), net in the Consolidated Statements of Operations, with an offset for the amount of non-credit impairments recognized in AOCI. We do not measure a credit loss allowance on accrued investment income because we write-off accrued interest through Interest and investment income when collectability concerns arise.
We consider the following in determining whether write-offs of a security’s amortized cost are necessary:
•We believe amounts related to securities have become uncollectible;
•We intend to sell a security; or
•It is more likely than not that we will be required to sell a security prior to recovery.
If we intend to sell a fixed maturity security or it is more likely than not that we will be required to sell the security before recovery of its amortized cost basis and the fair value of the security is below amortized cost, we will write down the security to current fair value, with a corresponding charge, net of any amount previously recognized as an allowance for expected credit loss, to Recognized gains and (losses), net in the Consolidated Statements of Operations. If we do not intend to sell a fixed maturity security or it is more likely than not that we will not be required to sell a fixed maturity security before recovery of its amortized cost basis but believe amounts related to a security are uncollectible, an impairment is deemed to have occurred and the amortized cost is written down to the estimated recovery value with a corresponding charge, net of any amount previously recognized as an allowance for expected credit loss, to Recognized gains and (losses), net in the Consolidated Statements of Operations. The remainder of unrealized loss is held in AOCI in the Consolidated Statements of Equity.
The activity in the allowance for expected credit losses of AFS securities aggregated by investment category was as follows (in millions):
| | | | | | | | | | | | | | | | | | | | | | | | | | | | | | | | | | | | | | | | | | | | | | | | | | | | | | | | |
| Year ended December 31, 2024 |
| | | Additions | | | | | Reductions | | | | | | | | | | |
| Balance at Beginning of Period | | For credit losses on securities for which losses were not previously recorded | | | | (Additions) reductions in allowance recorded on previously impaired securities | | | For securities sold during the period | | For securities intended/required to be sold prior to recovery of amortized cost basis | | Write offs charged against the allowance | | Recoveries of amounts previously written off | | | | | | Balance at End of Period |
| AFS securities | | | | | | | | | | | | | | | | | | | | | | |
| Asset-backed securities | $ | (11) | | | $ | (2) | | | | | $ | — | | | | $ | — | | | $ | — | | | $ | — | | | $ | — | | | | | | | $ | (13) | |
| Commercial mortgage-backed securities | (22) | | | (8) | | | | | (19) | | | | — | | | — | | | — | | | — | | | | | | | (49) | |
| | | | | | | | | | | | | | | | | | | | | | |
| | | | | | | | | | | | | | | | | | | | | | |
| | | | | | | | | | | | | | | | | | | | | | |
| Residential mortgage-backed securities | (2) | | | — | | | | | 2 | | | | — | | | — | | | — | | | — | | | | | | | — | |
| | | | | | | | | | | | | | | | | | | | | | |
| | | | | | | | | | | | | | | | | | | | | | |
| Total AFS securities | $ | (35) | | | $ | (10) | | | | | $ | (17) | | | | $ | — | | | $ | — | | | $ | — | | | $ | — | | | | | | | $ | (62) | |
| | | | | | | | | | | | | | | | | | | | | | | | | | | | | | | | | | | | | | | | | | | | | | | | | | | | | | | | |
| Year ended December 31, 2023 |
| | | Additions | | | | | Reductions | | | | | | | | | | |
| Balance at Beginning of Period | | For credit losses on securities for which losses were not previously recorded | | | | (Additions) reductions in allowance recorded on previously impaired securities | | | For securities sold during the period | | For securities intended/required to be sold prior to recovery of amortized cost basis | | Write offs charged against the allowance | | Recoveries of amounts previously written off | | | | | | Balance at End of Period |
| AFS securities | | | | | | | | | | | | | | | | | | | | | | |
| Asset-backed securities | $ | (8) | | | $ | (18) | | | | | $ | 15 | | | | $ | — | | | $ | — | | | $ | — | | | $ | — | | | | | | | $ | (11) | |
| Commercial mortgage-backed securities | (1) | | | (22) | | | | | 1 | | | | — | | | — | | | — | | | — | | | | | | | (22) | |
| Corporates | (15) | | | — | | | | | — | | | | 15 | | | — | | | — | | | — | | | | | | | — | |
| | | | | | | | | | | | | | | | | | | | | | |
| | | | | | | | | | | | | | | | | | | | | | |
| Residential mortgage-backed securities | (7) | | | (7) | | | | | 12 | | | | — | | | — | | | — | | | — | | | | | | | (2) | |
| | | | | | | | | | | | | | | | | | | | | | |
| | | | | | | | | | | | | | | | | | | | | | |
| Total AFS securities | $ | (31) | | | $ | (47) | | | | | $ | 28 | | | | $ | 15 | | | $ | — | | | $ | — | | | $ | — | | | | | | | $ | (35) | |
There were no purchases of purchased credit deteriorated AFS securities during the years ended December 31, 2024 and 2023.
The fair value and gross unrealized losses of AFS securities, excluding securities in an unrealized loss position with an allowance for expected credit loss, aggregated by investment category and duration of fair value below amortized cost as of December 31, 2024 and 2023 were as follows (dollars in millions):
| | | | | | | | | | | | | | | | | | | | | | | | | | | | | | | | | | | |
| December 31, 2024 |
| Less than 12 months | | 12 months or longer | | Total |
| Fair Value | | Gross Unrealized Losses | | Fair Value | | Gross Unrealized Losses | | Fair Value | | Gross Unrealized Losses |
| AFS securities | | | | | | | | | | | |
| Asset-backed securities | $ | 1,164 | | | $ | (30) | | | $ | 2,637 | | | $ | (276) | | | $ | 3,801 | | | $ | (306) | |
| Commercial mortgage-backed securities | 699 | | | (10) | | | 1,508 | | | (175) | | | 2,207 | | | (185) | |
| Corporates | 6,524 | | | (202) | | | 9,234 | | | (2,600) | | | 15,758 | | | (2,802) | |
| Hybrids | 105 | | | (4) | | | 380 | | | (25) | | | 485 | | | (29) | |
| Municipals | 261 | | | (12) | | | 966 | | | (237) | | | 1,227 | | | (249) | |
| Residential mortgage-backed securities | 898 | | | (16) | | | 459 | | | (89) | | | 1,357 | | | (105) | |
| U.S. Government | 93 | | | (2) | | | 10 | | | (1) | | | 103 | | | (3) | |
| Foreign Government | 51 | | | (1) | | | 128 | | | (44) | | | 179 | | | (45) | |
| Total AFS securities | $ | 9,795 | | | $ | (277) | | | $ | 15,322 | | | $ | (3,447) | | | $ | 25,117 | | | $ | (3,724) | |
| Total number of AFS securities in an unrealized loss position less than twelve months | | | | | | | | | | | 1,838 | |
| Total number of AFS securities in an unrealized loss position twelve months or longer | | | | | | | | | | | 2,113 |
| Total number of AFS securities in an unrealized loss position | | | | | | | | | | | 3,951 | |
| | | | | | | | | | | | | | | | | | | | | | | | | | | | | | | | | | | |
| December 31, 2023 |
| Less than 12 months | | 12 months or longer | | Total |
| Fair Value | | Gross Unrealized Losses | | Fair Value | | Gross Unrealized Losses | | Fair Value | | Gross Unrealized Losses |
| AFS securities | | | | | | | | | | | |
| Asset-backed securities | $ | 1,707 | | | $ | (56) | | | $ | 5,835 | | | $ | (404) | | | $ | 7,542 | | | $ | (460) | |
| Commercial mortgage-backed securities | 798 | | | (53) | | | 1,916 | | | (234) | | | 2,714 | | | (287) | |
| Corporates | 2,273 | | | (128) | | | 9,779 | | | (2,251) | | | 12,052 | | | (2,379) | |
| Hybrids | 60 | | | (2) | | | 483 | | | (51) | | | 543 | | | (53) | |
| Municipals | 392 | | | (48) | | | 884 | | | (174) | | | 1,276 | | | (222) | |
| Residential mortgage-backed securities | 334 | | | (5) | | | 660 | | | (89) | | | 994 | | | (94) | |
| U.S. Government | 5 | | | — | | | 9 | | | (1) | | | 14 | | | (1) | |
| Foreign Government | 25 | | | (1) | | | 145 | | | (38) | | | 170 | | | (39) | |
| Total AFS securities | $ | 5,594 | | | $ | (293) | | | $ | 19,711 | | | $ | (3,242) | | | $ | 25,305 | | | $ | (3,535) | |
| Total number of AFS securities in an unrealized loss position less than twelve months | | | | | | | | | | | 927 | |
| Total number of AFS securities in an unrealized loss position twelve months or longer | | | | | | | | | | | 2,602 |
| Total number of AFS securities in an unrealized loss position | | | | | | | | | | | 3,529 | |
We determined the unrealized losses were caused by higher treasury rates compared to those at the time of the FNF acquisition or the purchase of the security if later. For securities in an unrealized loss position as of December 31, 2024, our allowance for expected credit loss was $62 million. We believe the unrealized loss position for which we have not recorded an allowance for expected credit loss as of December 31, 2024 was primarily attributable to interest rate increases, near-term illiquidity, and other macroeconomic uncertainties as opposed to issuer specific credit concerns.
Mortgage Loans
Our mortgage loans are collateralized by commercial and residential properties.
Commercial Mortgage Loans
Commercial mortgage loans (“CMLs”) represented approximately 5% of our total investments as of December 31, 2024 and 2023. The mortgage loans in our investment portfolio, are generally comprised of high quality commercial first lien and mezzanine real estate loans. Mortgage loans are primarily on income producing properties including industrial properties, retail buildings, multifamily properties and office buildings. We diversify our CML portfolio by geographic region and property type to attempt to reduce concentration risk. We continuously evaluate CMLs based on relevant current information to ensure properties are performing at a consistent and acceptable level to secure the related debt. The distribution of CMLs, gross of valuation allowances, by property type and geographic region is reflected in the following tables (dollars in millions):
| | | | | | | | | | | | | | | | | | | | | | | |
| December 31, 2024 | | December 31, 2023 |
| Gross Carrying Value | | % of Total | | Gross Carrying Value | | % of Total |
| Property Type: | | | | | | | |
| Hotel | $ | 17 | | | 1 | % | | $ | 18 | | | 1 | % |
| Industrial | 657 | | | 24 | | | 616 | | | 24 | |
| Mixed Use | 11 | | | — | | | 11 | | | — | |
| Multifamily | 1,006 | | | 37 | | | 1,012 | | | 40 | |
| Office | 349 | | | 13 | | | 316 | | | 13 | |
| Retail | 98 | | | 4 | | | 102 | | | 4 | |
| Student Housing | 83 | | | 3 | | | 83 | | | 3 | |
| Other | 501 | | | 18 | | | 392 | | | 15 | |
| Total CMLs, gross of valuation allowance | 2,722 | | | 100 | % | | 2,550 | | | 100 | % |
| Allowance for expected credit loss | (17) | | | | | (12) | | | |
| Total CMLs, net of valuation allowance | $ | 2,705 | | | | | $ | 2,538 | | | |
| | | | | | | |
| U.S. Region: | | | | | | | |
| East North Central | $ | 98 | | | 4 | % | | $ | 151 | | | 6 | % |
| East South Central | 75 | | | 3 | | | 75 | | | 3 | |
| Middle Atlantic | 354 | | | 13 | | | 354 | | | 14 | |
| Mountain | 409 | | | 15 | | | 352 | | | 14 | |
| New England | 164 | | | 6 | | | 168 | | | 6 | |
| Pacific | 706 | | | 26 | | | 766 | | | 30 | |
| South Atlantic | 683 | | | 25 | | | 563 | | | 22 | |
| West North Central | 62 | | | 2 | | | 4 | | | — | |
| West South Central | 171 | | | 6 | | | 117 | | | 5 | |
| Total CMLs, gross of valuation allowance | 2,722 | | | 100 | % | | 2,550 | | | 100 | % |
| Allowance for expected credit loss | (17) | | | | | (12) | | | |
| Total CMLs, net of valuation allowance | $ | 2,705 | | | | | $ | 2,538 | | | |
CMLs segregated by aging of the loans and charge offs (by year of origination), gross of valuation allowances, were as follows for the years ended December 31, 2024 and 2023 (in millions):
| | | | | | | | | | | | | | | | | | | | | | | | | | | | | | | | | | | | | | | | | |
| December 31, 2024 |
| |
| Amortized Cost by Origination Year |
| 2024 | | 2023 | | 2022 | | 2021 | | 2020 | | Prior | | Total |
| Current (less than 30 days past due) | $ | 273 | | | $ | 227 | | | $ | 290 | | | $ | 1,253 | | | $ | 469 | | | $ | 201 | | | $ | 2,713 | |
| 30-89 days past due | — | | | — | | | — | | | — | | | — | | | — | | | — | |
| 90 days or more past due | — | | | — | | | — | | | — | | | — | | | 9 | | | 9 | |
| Total CMLs | $ | 273 | | | $ | 227 | | | $ | 290 | | | $ | 1,253 | | | $ | 469 | | | $ | 210 | | | $ | 2,722 | |
| | | | | | | | | | | | | |
| Charge offs | $ | — | | | $ | — | | | $ | — | | | $ | — | | | $ | — | | | $ | — | | | $ | — | |
| | | | | | | | | | | | | | | | | | | | | | | | | | | | | | | | | | | | | | | | | |
| December 31, 2023 |
| |
| Amortized Cost by Origination Year |
| 2023 | | 2022 | | 2021 | | 2020 | | 2019 | | Prior | | Total |
| Current (less than 30 days past due) | $ | 213 | | | $ | 288 | | | $ | 1,256 | | | $ | 512 | | | $ | — | | | $ | 259 | | | $ | 2,528 | |
| 30-89 days past due | — | | | — | | | — | | | — | | | — | | | — | | | — | |
| 90 days or more past due | — | | | — | | | — | | | — | | | — | | | — | | | — | |
| Total CMLs (a) | $ | 213 | | | $ | 288 | | | $ | 1,256 | | | $ | 512 | | | $ | — | | | $ | 259 | | | $ | 2,528 | |
| | | | | | | | | | | | | |
| Charge offs | $ | — | | | $ | — | | | $ | — | | | $ | — | | | $ | — | | | $ | 3 | | | $ | 3 | |
(a)Excludes loans under development with an amortized cost and estimated fair value of $22 million at December 31, 2023.
LTV and DSC ratios are measures commonly used to assess the risk and quality of mortgage loans. The LTV ratio is expressed as a percentage of the amount of the loan relative to the value of the underlying property. A LTV ratio in excess of 100% indicates the unpaid loan amount exceeds the underlying collateral. The DSC ratio, based upon the most recently received financial statements, is expressed as a percentage of the amount of a property’s net income to its debt service payments. A DSC ratio of less than 1.00 indicates that a property’s operations do not generate sufficient income to cover debt payments. We normalize our DSC ratios to a 25-year amortization period for purposes of our general loan allowance evaluation.
The following tables present the recorded investment in CMLs by LTV and DSC ratio categories and estimated fair value by the indicated loan-to-value ratios, gross of valuation allowances at December 31, 2024 and 2023 (dollars in millions):
| | | | | | | | | | | | | | | | | | | | | | | | | | | | | | | | | | | | | | | | | | | |
| Debt-Service Coverage Ratios | | | | Total Amount | | % of Total | | Estimated Fair Value | | % of Total |
| >1.25 | | 1.00 - 1.25 | | <1.00 | | | | | | |
| December 31, 2024 | | | | | | | | | | | | | | | |
| LTV Ratios: | | | | | | | | | | | | | | | |
| Less than 50.00% | $ | 490 | | | $ | 34 | | | $ | — | | | | | $ | 524 | | | 19 | % | | $ | 501 | | | 21 | % |
| 50.00% to 59.99% | 803 | | | 112 | | | 12 | | | | | 927 | | | 34 | | | 826 | | | 34 | |
| 60.00% to 74.99% | 1,238 | | | 16 | | | — | | | | | 1,254 | | | 46 | | | 1,060 | | | 44 | |
| 75.00% to 84.99% | 4 | | | 4 | | | 9 | | | | | 17 | | | 1 | | | 17 | | | 1 | |
| | | | | | | | | | | | | | | |
| CMLs | $ | 2,535 | | | $ | 166 | | | $ | 21 | | | | | $ | 2,722 | | | 100 | % | | $ | 2,404 | | | 100 | % |
| | | | | | | | | | | | | | | |
| December 31, 2023 | | | | | | | | | | | | | | | |
| LTV Ratios: | | | | | | | | | | | | | | | |
| Less than 50.00% | $ | 519 | | | $ | 4 | | | $ | 10 | | | | | $ | 533 | | | 21 | % | | $ | 510 | | | 23 | % |
| 50.00% to 59.99% | 764 | | | — | | | — | | | | | 764 | | | 30 | | | 679 | | | 30 | |
| 60.00% to 74.99% | 1,160 | | | 56 | | | — | | | | | 1,216 | | | 48 | | | 1,028 | | | 46 | |
| 75.00% to 84.99% | — | | | 6 | | | 9 | | | | | 15 | | | 1 | | | 14 | | | 1 | |
| CMLs (a) | $ | 2,443 | | | $ | 66 | | | $ | 19 | | | | | $ | 2,528 | | | 100 | % | | $ | 2,231 | | | 100 | % |
(a)Excludes loans under development with an amortized cost and estimated fair value of $22 million at December 31, 2023.
| | | | | | | | | | | | | | | | | | | | | | | | | | | | | | | | | | | | | | | | | |
| December 31, 2024 |
| |
| Amortized Cost by Origination Year |
| 2024 | | 2023 | | 2022 | | 2021 | | 2020 | | Prior | | Total |
| LTV Ratios: | | | | | | | | | | | | | |
| Less than 50.00% | $ | 66 | | | $ | 99 | | | $ | 19 | | | $ | 74 | | | $ | 189 | | | $ | 77 | | | $ | 524 | |
| 50.00% to 59.99% | 112 | | | 53 | | | 149 | | | 321 | | | 159 | | | 133 | | | 927 | |
| 60.00% to 74.99% | 91 | | | 71 | | | 113 | | | 858 | | | 121 | | | — | | | 1,254 | |
| 75.00% to 84.99% | 4 | | | 4 | | | 9 | | | — | | | — | | | — | | | 17 | |
| | | | | | | | | | | | | |
| Total CMLs | $ | 273 | | | $ | 227 | | | $ | 290 | | | $ | 1,253 | | | $ | 469 | | | $ | 210 | | | 2,722 | |
| DSCR | | | | | | | | | | | | | |
| Greater than 1.25x | $ | 140 | | | $ | 215 | | | $ | 278 | | | $ | 1,241 | | | $ | 469 | | | $ | 192 | | | $ | 2,535 | |
| 1.00x - 1.25x | 133 | | | 12 | | | 3 | | | — | | | — | | | 18 | | | 166 | |
| Less than 1.00x | — | | | — | | | 9 | | | 12 | | | — | | | — | | | 21 | |
| Total CMLs | $ | 273 | | | $ | 227 | | | $ | 290 | | | $ | 1,253 | | | $ | 469 | | | $ | 210 | | | $ | 2,722 | |
| | | | | | | | | | | | | | | | | | | | | | | | | | | | | | | | | | | | | | | | | |
| December 31, 2023 |
| |
| Amortized Cost by Origination Year |
| 2023 | | 2022 | | 2021 | | 2020 | | 2019 | | Prior | | Total |
| LTV Ratios: | | | | | | | | | | | | | |
| Less than 50.00% | $ | 85 | | | $ | 17 | | | $ | 77 | | | $ | 232 | | | $ | — | | | $ | 122 | | | $ | 533 | |
| 50.00% to 59.99% | 53 | | | 149 | | | 267 | | | 158 | | | — | | | 137 | | | 764 | |
| 60.00% to 74.99% | 69 | | | 113 | | | 912 | | | 122 | | | — | | | — | | | 1,216 | |
| 75.00% to 84.99% | 6 | | | 9 | | | — | | | — | | | — | | | — | | | 15 | |
| Total CMLs (a) | $ | 213 | | | $ | 288 | | | $ | 1,256 | | | $ | 512 | | | $ | — | | | $ | 259 | | | $ | 2,528 | |
| DSCR | | | | | | | | | | | | | |
| Greater than 1.25x | $ | 154 | | | $ | 276 | | | $ | 1,256 | | | $ | 512 | | | $ | — | | | $ | 245 | | | $ | 2,443 | |
| 1.00x - 1.25x | 59 | | | 3 | | | — | | | — | | | — | | | 4 | | | 66 | |
| Less than 1.00x | — | | | 9 | | | — | | | — | | | — | | | 10 | | | 19 | |
| Total CMLs (a) | $ | 213 | | | $ | 288 | | | $ | 1,256 | | | $ | 512 | | | $ | — | | | $ | 259 | | | $ | 2,528 | |
(a)Excludes loans under development with an amortized cost and estimated fair value of $22 million at December 31, 2023.
We recognize a mortgage loan as delinquent when payments on the loan are greater than 30 days past due. At December 31, 2024, we had one CML that was delinquent in principal or interest payments compared to none at December 31, 2023 as shown in the tables above.
Residential Mortgage Loans
Residential mortgage loans (“RMLs”) represented approximately 5% of our total investments as of December 31, 2024 and 2023. Our RMLs are closed end, amortizing loans and 100% of the properties are located in the United States. We diversify our RML portfolio by state to attempt to reduce concentration risk. The distribution of RMLs by state with highest-to-lowest concentration are reflected in the following tables, gross of valuation allowances (dollars in millions):
| | | | | | | | | | | |
| December 31, 2024 |
| U.S. States: | Amortized Cost | | % of Total |
| Florida | $ | 164 | | | 5 | % |
| | | |
| | | |
| | | |
| | | |
| | | |
| | | |
| All other states (a) | 3,110 | | | 95 | |
| Total RMLs, gross of valuation allowance | 3,274 | | | 100 | % |
| Allowance for expected credit loss | (53) | | | |
| Total RMLs, net of valuation allowance | $ | 3,221 | | | |
(a)The individual concentration of each state is less than 5% as of December 31, 2024.
| | | | | | | | | | | |
| December 31, 2023 |
| U.S. States: | Amortized Cost | | % of Total |
| Florida | $ | 163 | | | 6 | % |
| New York | 129 | | | 5 | |
| Texas | 129 | | | 5 | |
| | | |
| | | |
| | | |
| | | |
| All other states (a) | 2,431 | | | 84 | |
| Total RMLs, gross of valuation allowance | 2,852 | | | 100 | % |
| Allowance for expected credit loss | (54) | | | |
| Total RMLs, net of valuation allowance | $ | 2,798 | | | |
(a)The individual concentration of each state is less than 5% as of December 31, 2023.
RMLs have a primary credit quality indicator of either a performing or non-performing loan. We define non-performing residential mortgage loans as those that are 90 or more days past due or in non-accrual status, which is assessed monthly. The credit quality of RMLs was as follows (dollars in millions):
| | | | | | | | | | | | | | | | | | | | | | | |
| December 31, 2024 | | December 31, 2023 |
| Performance indicators: | Amortized Cost | | % of Total | | Amortized Cost | | % of Total |
| Performing | $ | 3,188 | | | 97 | % | | $ | 2,795 | | | 98 | % |
| Non-performing | 86 | | | 3 | | | 57 | | | 2 | |
| Total RMLs, gross of valuation allowance | 3,274 | | | 100 | % | | 2,852 | | | 100 | % |
| Allowance for expected loan loss | (53) | | | | | (54) | | | |
| Total RMLs, net of valuation allowance | $ | 3,221 | | | | | $ | 2,798 | | | |
There were no charge offs recorded for RMLs during the year ended December 31, 2024. RMLs segregated by aging of the loans (by year of origination) as of December 31, 2024 and 2023 were as follows, gross of valuation allowances (in millions):
| | | | | | | | | | | | | | | | | | | | | | | | | | | | | | | | | | | | | | | | | |
| December 31, 2024 |
| |
| Amortized Cost by Origination Year |
| 2024 | | 2023 | | 2022 | | 2021 | | 2020 | | Prior | | Total |
| Current (less than 30 days past due) | $ | 610 | | | $ | 368 | | | $ | 911 | | | $ | 805 | | | $ | 162 | | | $ | 312 | | | $ | 3,168 | |
| 30-89 days past due | 1 | | | 6 | | | 4 | | | 6 | | | 1 | | | 3 | | | 21 | |
| 90 days or more past due | 3 | | | 2 | | | 13 | | | 29 | | | 13 | | | 25 | | | 85 | |
| Total RML mortgages | $ | 614 | | | $ | 376 | | | $ | 928 | | | $ | 840 | | | $ | 176 | | | $ | 340 | | | $ | 3,274 | |
| | | | | | | | | | | | | |
| | | | | | | | | | | | | |
| | | | | | | | | | | | | | | | | | | | | | | | | | | | | | | | | | | | | | | | | |
| December 31, 2023 |
| |
| Amortized Cost by Origination Year |
| 2023 | | 2022 | | 2021 | | 2020 | | 2019 | | Prior | | Total |
| Current (less than 30 days past due) | $ | 373 | | | $ | 985 | | | $ | 854 | | | $ | 192 | | | $ | 183 | | | $ | 192 | | | $ | 2,779 | |
| 30-89 days past due | — | | | 4 | | | 7 | | | 3 | | | — | | | 2 | | | 16 | |
| 90 days or more past due | — | | | 6 | | | 16 | | | 13 | | | 21 | | | 1 | | | 57 | |
| Total RML mortgages | $ | 373 | | | $ | 995 | | | $ | 877 | | | $ | 208 | | | $ | 204 | | | $ | 195 | | | $ | 2,852 | |
Non-accrual loans by amortized cost as of December 31, 2024 and 2023, were as follows (in millions):
| | | | | | | | | | | | | | |
| December 31, | | | |
| 2024 | | 2023 | | | |
| Residential mortgage | $ | 85 | | | $ | 57 | | | | |
| Commercial mortgage | 9 | | | — | | | | |
| Total non-accrual mortgages | $ | 94 | | | $ | 57 | | | | |
| | | | | | |
| | | | | | |
| | | | | | |
| | | | | | |
| | | | | | |
| | | | | | |
Immaterial interest income was recognized on non-accrual financing receivables for the years ended December 31, 2024 and 2023.
It is our policy to cease to accrue interest on loans that are delinquent for 90 days or more. For loans less than 90 days delinquent, interest is accrued unless it is determined that the accrued interest is not collectible. If a loan becomes 90 days or more delinquent, it is our general policy to initiate foreclosure proceedings unless a workout arrangement to bring the loan current is in place. As of December 31, 2024 and 2023, we had $94 million and $57 million, respectively, of mortgage loans that were over 90 days past due.
As of December 31, 2024 and 2023, we had $81 million and $41 million, respectively, of residential mortgage loans that were in the process of foreclosure.
Loan Modifications
Under certain circumstances, modifications are granted to mortgage loans. Generally, the types of concessions may include interest rate reduction, term extension, payment deferrals, principal forgiveness or a combination of these concessions. We had an immaterial amount of mortgage loans modified during the years ended December 31, 2024 and 2023.
Allowance for Expected Credit Loss
We estimate expected credit losses for our commercial and residential mortgage loan portfolios using a probability of default/loss given default model. Significant inputs to this model include, where applicable, the loans' current performance, underlying collateral type, location, contractual life, LTV, DSC and Debt to Income or FICO. The model projects losses using a two year reasonable and supportable forecast and then reverts over a three year period to market-wide historical loss experience. Changes in our allowance for expected credit losses on mortgage loans are recognized in Recognized gains and losses, net in the Consolidated Statements of Operations.
The allowances for our mortgage loan portfolio are summarized as follows (in millions):
| | | | | | | | | | | | | | | | | | | | | | | | | | | | | | | | | | | | | | | | | | | | | | | | | | | | | |
| | | | | Year Ended December 31, |
| | | | | 2024 | | 2023 | | |
| | | | | | | | | | | | | | | | | | | | | | | | | | | | | |
| | | | | | | | | | | | | Residential
Mortgages | | Commercial
Mortgages | | Total | | Residential
Mortgages | | Commercial
Mortgages | | Total | | | | | | |
Beginning Balance | | | | | | | | | | | | | $ | (54) | | | $ | (12) | | | $ | (66) | | | $ | (32) | | | $ | (10) | | | $ | (42) | | | | | | | |
| Provision (expense) benefit for loan losses | | | | | | | | | | | | | 1 | | | (5) | | | (4) | | | (22) | | | (5) | | | (27) | | | | | | | |
| | | | | | | | | | | | | | | | | | | | | | | | | | | | | |
| Loans charged off | | | | | | | | | | | | | — | | | — | | | — | | | — | | | 3 | | | 3 | | | | | | | |
| | | | | | | | | | | | | | | | | | | | | | | | | | | | | |
| | | | | | | | | | | | | | | | | | | | | | | | | | | | | |
Ending Balance | | | | | | | | | | | | | $ | (53) | | | $ | (17) | | | $ | (70) | | | $ | (54) | | | $ | (12) | | | $ | (66) | | | | | | | |
An allowance for expected credit loss is not measured on accrued interest income for commercial mortgage loans as we have a process to write-off interest on loans that enter into non-accrual status (90 days or more past due). Allowances for expected credit losses are measured on accrued interest income for residential mortgage loans and were immaterial as of December 31, 2024 and 2023.
There were no purchases of purchased credit deteriorated mortgage loans during the years ended December 31, 2024 and 2023.
As of December 31, 2024 and 2023, the accrued interest receivable balance on CMLs totaled $8 million and $7 million, respectively, and the accrued interest receivable on RMLs totaled $28 million and $24 million, respectively. Accrued interest receivable is classified within Prepaid expenses and other assets within the Consolidated Balance Sheets.
Interest and Investment Income
The major sources of Interest and investment income reported on the Consolidated Statements of Operations were as follows (in millions):
| | | | | | | | | | | | | | | | | | | | |
| | Year ended December 31, |
| | | | 2024 | | 2023 | | 2022 |
| | | | | | | | |
| Fixed maturity securities, available-for-sale | | | | $ | 2,181 | | | $ | 1,843 | | | $ | 1,431 | |
| Equity securities | | | | 21 | | | 20 | | | 17 | |
| Preferred securities | | | | 23 | | | 41 | | | 49 | |
| | | | | | | | |
| Mortgage loans | | | | 273 | | | 229 | | | 186 | |
| Invested cash and short-term investments | | | | 161 | | | 76 | | | 33 | |
| | | | | | | | |
| Limited partnerships | | | | 323 | | | 229 | | | 110 | |
| Other investments | | | | 32 | | | 27 | | | 20 | |
| Gross investment income | | | | 3,014 | | | 2,465 | | | 1,846 | |
| Investment expense | | | | (295) | | | (254) | | | (191) | |
| | | | | | | | |
Interest and investment income | | | | $ | 2,719 | | | $ | 2,211 | | | $ | 1,655 | |
Interest and investment income is shown net of amounts attributable to certain funds withheld reinsurance agreements which is passed along to the reinsurer in accordance with the terms of these agreements. Interest and investment income attributable to these agreements, and thus excluded from the totals in the table above, was $636 million, $339 million and $109 million, for the years ended December 31, 2024, 2023 and 2022, respectively.
Recognized Gains and (Losses), Net
Details underlying Recognized gains and losses, net reported on the Consolidated Statements of Operations were as follows (in millions):
| | | | | | | | | | | | | | | | | | | | |
| | Year ended December 31, |
| | | | 2024 | | 2023 | | 2022 |
| | | | | | | | |
| Net realized (losses) gains on fixed maturity available-for-sale securities | | | | $ | (8) | | | $ | (155) | | | $ | (241) | |
Net realized/unrealized (losses) gains on equity securities (a) | | | | 11 | | | 18 | | | (40) | |
Net realized/unrealized (losses) gains on preferred securities (b) | | | | 6 | | | 2 | | | (167) | |
| Realized (losses) gains on other invested assets | | | | 67 | | | 24 | | | (13) | |
| Change in allowance for expected credit losses | | | | (34) | | | (37) | | | (34) | |
| Derivatives and embedded derivatives: | | | | | | | | |
| Realized (losses) gains on certain derivative instruments | | | | 254 | | | (211) | | | (164) | |
| Unrealized (losses) gains on certain derivative instruments | | | | (184) | | | 358 | | | (693) | |
| Change in fair value of reinsurance related embedded derivatives | | | | (32) | | | (128) | | | 352 | |
| Change in fair value of other derivatives and embedded derivatives | | | | 4 | | | 5 | | | (10) | |
| Realized (losses) gains on derivatives and embedded derivatives | | | | 42 | | | 24 | | | (515) | |
Recognized gains and losses, net | | | | $ | 84 | | | $ | (124) | | | $ | (1,010) | |
(a)Includes net valuation (losses) gains of $12 million, $18 million, and $(40) million for the years ended December 31, 2024, 2023 and 2022, respectively.
(b)Includes net valuation (losses) gains of $6 million, $73 million, and $(159) million for the years ended December 31, 2024, 2023 and 2022, respectively.
Recognized gains and (losses), net is shown net of amounts attributable to certain funds withheld reinsurance agreements which are passed along to the reinsurer in accordance with the terms of these agreements. Recognized gains and (losses) attributable to these agreements, and thus excluded from the totals in the table above, was $(30) million, $(123) million and $381 million for the years ended December 31, 2024, 2023 and 2022, respectively.
The proceeds from the sale of fixed-maturity securities and the gross gains and losses associated with those transactions were as follows (in millions):
| | | | | | | | | | | | | | | | | |
| Year ended December 31, |
| 2024 | | 2023 | | 2022 |
| | | | | |
| Proceeds | $ | 4,368 | | | $ | 2,590 | | | $ | 3,097 | |
| Gross gains | 44 | | | 8 | | | 13 | |
| Gross losses | (80) | | | (134) | | | (239) | |
Unconsolidated Variable Interest Entities
We own investments in VIEs that are not consolidated within our financial statements. A VIE is an entity that does not have sufficient equity to finance its own activities without additional financial support, where investors lack certain characteristics of a controlling financial interest, or where the entity is structured with non-substantive voting rights. VIEs are consolidated by their ‘primary beneficiary,’ a designation given to an entity that receives both the benefits from the VIE as well as the substantive power to make its key economic decisions. While we participate in the benefits from VIEs in which we invest, but do not consolidate, the substantive power to make the key economic decisions for each respective VIE resides with entities not under our common control. It is for this reason that we are not considered the primary beneficiary for the VIE investments that are not consolidated.
We invest in various limited partnerships and limited liability companies primarily as a passive investor. These investments are primarily in credit funds with a bias towards current income, real assets, or private equity. Limited partnership and limited liability company interests are accounted for under the equity method and are included in Investments in unconsolidated affiliates on our Consolidated Balance Sheets. In addition, we invest in structured investments, which may be VIEs, but for which we are not the primary beneficiary. These structured investments typically invest in fixed income investments and are managed by third parties and include asset-backed securities, commercial mortgage-backed securities and residential mortgage-backed securities included in fixed maturity securities available for sale on our Consolidated Balance Sheets.
Our maximum loss exposure with respect to these VIEs is limited to the investment carrying amounts reported in our Consolidated Balance Sheets for limited partnerships and the amortized costs of certain of our fixed maturity securities, in addition to any required unfunded commitments (also refer to Note N - Commitments and Contingencies).
The following table summarizes the carrying value and the maximum loss exposure of our unconsolidated VIEs as of December 31, 2024 and 2023 (in millions):
| | | | | | | | | | | | | | | | | | | | | | | |
| December 31, |
| 2024 | | 2023 |
| Carrying Value | | Maximum Loss Exposure | | Carrying Value | | Maximum Loss Exposure |
| Investment in unconsolidated affiliates | $ | 3,565 | | | $ | 4,703 | | | $ | 3,071 | | | $ | 4,806 | |
| Fixed maturity securities | 23,242 | | | 24,242 | | | 20,837 | | | 22,346 | |
| Total unconsolidated VIE investments | $ | 26,807 | | | $ | 28,945 | | | $ | 23,908 | | | $ | 27,152 | |
Concentrations
Our underlying investment concentrations that exceed 10% of shareholders equity as of December 31, 2024 and 2023 are as follows (in millions):
| | | | | | | | | | | |
| December 31, |
| 2024 | | 2023 |
| Blackstone Wave Asset Holdco (a) | $ | 710 | | | $ | 725 | |
| Blackstone Cooper Asset Holdco (a) | 472 | | | — | |
| Elba (b) (c) | — | | | 463 | |
| COLI (c) | — | | | 324 | |
| | | |
| | | |
| | | |
| | | |
| | | |
(a)Represents a special purpose vehicle that holds investments in numerous limited partnership investments whose underlying investments are further diversified by holding interest in multiple individual investments and industries.
(b)Represents special purpose vehicles that hold an underlying minority ownership interest in a single operating liquified natural gas export facility.
(c)Investments did not exceed 10% of shareholder’s equity as of December 31, 2024.
Note D - Derivative Financial Instruments
The notional and carrying amounts of derivative instruments, including derivative instruments embedded in indexed annuities and IUL contracts, and reinsurance is as follows (in millions):
| | | | | | | | | | | | | | | | | | | | | | | |
| December 31, 2024 | December 31, 2023 |
| Notional Amount | | Carrying Amount | | Notional Amount | | Carrying Amount |
| Assets: | | | | | | | |
| Derivative investments: | | | | | | | |
| Equity options | $ | 29,594 | | | $ | 773 | | | $ | 27,263 | | | $ | 739 | |
| Interest rate swaps | 2,340 | | | 16 | | | 2,705 | | | 57 | |
| | | | | | | |
| Other derivative investments | 157 | | | 3 | | | 137 | | | 1 | |
| Other long-term investments: | | | | | | | |
| Other embedded derivatives | | | 32 | | | | | 28 | |
| Prepaid expenses and other assets: | | | | | | | |
| Reinsurance related embedded derivatives | | | 109 | | | | | 152 | |
| Total | | | $ | 933 | | | | | $ | 977 | |
| | | | | | | |
| Liabilities | | | | | | | |
| Contractholder funds: | | | | | | | |
| Indexed annuities/IUL embedded derivatives | | | $ | 5,220 | | | | | $ | 4,258 | |
| Accounts payable and accrued liabilities: | | | | | | | |
| | | | | | | |
| | | | | | | |
| Interest rate swaps | $ | 2,700 | | | 10 | | | $ | — | | | — | |
| | | | | | | |
| | | | | | | |
| Total | | | $ | 5,230 | | | | | $ | 4,258 | |
The change in fair value of derivative instruments included within Recognized gains and (losses), net, in the Consolidated Statements of Operations is as follows (in millions):
| | | | | | | | | | | | | | | | | |
| Year ended December 31, |
| 2024 | | 2023 | | 2022 |
| Net investment gains (losses): | | | | | |
| Equity options | $ | 145 | | | $ | 92 | | | $ | (862) | |
| Interest rate swaps | (103) | | | 48 | | | — | |
| Futures contracts | 18 | | | 9 | | | (7) | |
| Other derivative investments | 10 | | | (2) | | | 12 | |
| Other embedded derivatives | 4 | | | 5 | | | (10) | |
| | | | | |
| Reinsurance related embedded derivatives | (32) | | | (128) | | | 352 | |
| Total net investment gains (losses) | $ | 42 | | | $ | 24 | | | $ | (515) | |
| | | | | |
| Benefits and other changes in policy reserves: | | | | | |
| Indexed annuities/IUL embedded derivatives increase (decrease) | $ | 962 | | | $ | 1,143 | | | $ | (768) | |
Additional Disclosures
See descriptions of the fair value methodologies used for derivative financial instruments in Note B - Fair Value of Financial Instruments.
Indexed Annuities/IUL Embedded Derivative, Equity Options and Futures
We have indexed annuities and IUL contracts that permit the holder to elect an interest rate return or an equity index linked component, where interest credited to the contracts is linked to the performance of various equity indices, such as the S&P 500 Index. This feature represents an embedded derivative under GAAP. The indexed annuities/IUL embedded derivatives are valued at fair value and included in the liability for contractholder funds in the Consolidated Balance Sheets with changes in fair value included as a component of Benefits and other changes in policy reserves in the Consolidated Statements of Operations.
We purchase derivatives consisting of a combination of equity options and futures contracts (specifically for indexed annuity contracts) on the applicable market indices to fund the index credits due to indexed annuity/IUL contractholders. The equity options are one, two, three, five and six year options purchased to match the funding requirements of the underlying policies. On the respective anniversary dates of the indexed policies, the index used to compute the interest credit is reset and we purchase new equity options to fund the next index credit. We manage the cost of these purchases through the terms of our indexed annuities/IUL contracts, which permit us to change caps, spreads or participation rates, subject to guaranteed minimums, on each contract’s anniversary date. The change in the fair value of the equity options and futures contracts is generally designed to offset the portion of the change in the fair value of the indexed annuities/IUL embedded derivatives related to index performance through the current credit period. The equity options and futures contracts are marked to fair value with the change in fair value included as a component of Recognized gains and (losses), net, in the Consolidated Statements of Operations. The change in fair value of the equity options and futures contracts includes the gains and losses recognized at the expiration of the instrument term or upon early termination and the changes in fair value of open positions.
Other market exposures are hedged periodically depending on market conditions and our risk tolerance. Our indexed annuities/IUL hedging strategy economically hedges the equity returns and exposes us to the risk that unhedged market exposures result in divergence between changes in the fair value of the liabilities and the hedging assets. We use a variety of techniques, including direct estimation of market sensitivities, to monitor this risk daily. We intend to continue to adjust the hedging strategy as market conditions and our risk tolerance changes.
Interest Rate Swaps
We utilize interest rate swaps to reduce market risks from interest rate changes on our earnings associated with our floating rate investments. With an interest rate swap, we agree with another party to exchange, at specified intervals, the difference between fixed-rate and floating-rate interest amounts tied to an agreed upon notional principal. The interest rate swaps are marked to fair value with the change in fair value, including accrued interest and related periodic cash flows received or paid, included as a component of Recognized gains and (losses), net, in the Consolidated Statements of Operations.
Reinsurance Related Embedded Derivatives
F&G cedes certain business on a coinsurance funds withheld basis. Investment results for the assets that support the coinsurances that are segregated within the funds withheld account are passed directly to the reinsurer pursuant to the contractual terms of the reinsurance agreement, which creates embedded derivatives considered to be total return swaps. These total return swaps are not clearly and closely related to the underlying reinsurance contract and thus require bifurcation. The fair value of the total return swaps is based on the change in fair value of the underlying assets held in the funds withheld account. These embedded derivatives are reported in Prepaid expenses and other assets if in a net gain position, or Accounts payable and accrued liabilities, if in a net loss position on the Consolidated Balance Sheets and the related gains or losses are reported in Recognized gains and (losses), net, on the Consolidated Statements of Operations.
Credit Risk
We are exposed to credit loss in the event of non-performance by our counterparties and reflect assumptions regarding this non-performance risk in the fair value of our derivatives. The non-performance risk is the net counterparty exposure based on the fair value of the open contracts less collateral held. We maintain a policy of requiring all derivative contracts to be governed by an International Swaps and Derivatives Association (“ISDA”) Master Agreement.
We manage credit risk related to non-performance by our counterparties by (i) entering into derivative transactions with creditworthy counterparties; (ii) obtaining collateral, such as cash and securities when appropriate; and (iii) establishing counterparty exposure limits, which are subject to periodic management review.
Information regarding our exposure to credit loss on the derivative instruments we hold, excluding futures contracts, is presented below (in millions):
| | | | | | | | | | | | | | | | | | |
| | Fair Value | | Collateral | | Net Credit Risk |
| | | | | | |
| December 31, 2024 | | $ | 782 | | | $ | 771 | | | $ | 34 | |
| December 31, 2023 | | 796 | | | 775 | | | 39 | |
Collateral Agreements
We are required to maintain minimum ratings as a matter of routine practice as part of our over-the-counter derivative agreements on ISDA forms. Under some ISDA agreements, we have agreed to maintain certain financial strength ratings. A downgrade below these levels provides the counterparty under the agreement the right to terminate the open derivative contracts between the parties, at which time any amounts payable by us or the counterparty would be dependent on the market value of the underlying contracts. Our current rating does not allow any counterparty the right to terminate ISDA agreements. In certain transactions, both us and the counterparty have entered into a collateral support agreement requiring either party to post collateral when the net exposures exceed pre-determined thresholds. For all counterparties, except one, the threshold is set to zero. As of December 31, 2024 and 2023 counterparties posted collateral of $771 million and $775 million, respectively, of which $679 million and $588 million, respectively, is included in Cash and cash equivalents with an associated payable for this collateral included in Accounts payable and accrued liabilities on the Consolidated Balance Sheets. Accordingly, the maximum amount of loss due to credit risk that we would incur if parties to the derivatives failed completely to perform according to the terms of the contracts was $34 million at December 31, 2024 and $39 million at December 31, 2023.
We are required to pay our counterparties the effective federal funds interest rate each day for cash collateral posted to us. Cash collateral is reinvested in overnight investment sweep products, which are included in Cash and cash equivalents on the Consolidated Balance Sheets, to reduce the interest cost. Changes in cash collateral are included in the Change in derivative collateral liabilities in the Consolidated Statements of Cash Flow.
We held 527 and 439 futures contracts at December 31, 2024 and 2023, respectively. The fair value of the futures contracts represents the cumulative unsettled variation margin (open trade equity, net of cash settlements). We provide cash collateral to the counterparties for the initial and variation margin on the futures contracts, which is included in Cash and cash equivalents in the Consolidated Balance Sheets. The amount of cash collateral held by the counterparties for such contracts was $7 million and $4 million at December 31, 2024 and 2023, respectively.
Note E - Reinsurance
F&G reinsures portions of its policy risks with other insurance companies. The use of indemnity reinsurance does not discharge an insurer from liability on the insurance ceded. The insurer is required to pay in full the amount of its insurance liability regardless of whether it is entitled to or able to receive payment from the reinsurer. The portion of risks exceeding F&G's retention limit is reinsured. F&G primarily seeks reinsurance coverage in order to manage loss exposures, to enhance our capital position, to diversify risks and earnings, and to manage new business volume. F&G follows reinsurance accounting when the treaty adequately transfers insurance risk and any acquisition cost reimbursements reduce policy acquisition costs deferred and maintenance expense reimbursements
reduce direct expenses incurred. Otherwise, F&G follows deposit accounting if there is inadequate transfer of insurance risk or if the underlying policy for which risk is being transferred is an investment contract that does not contain insurance risk. Refer to Note A - Business and Summary of Significant Accounting Policies for more information over our accounting policy for reinsurance agreements. As of December 31, 2024, we had an immaterial amount of COR included in Prepaid expenses and other assets on the Consolidated Balance Sheets compared to none as of December 31, 2023.
The effects of reinsurance on net premiums earned and net benefits incurred (benefits paid and reserve changes) for the years ended December 31, 2024, 2023, and 2022 respectively, were as follows (in millions):
| | | | | | | | | | | | | | | | | | | | | | | | | | | | | | | | | | | |
| Year Ended December 31, |
| 2024 | | 2023 | | 2022 |
| Net Premiums Earned | | Net Benefits Incurred | | Net Premiums Earned | | Net Benefits Incurred | | Net Premiums Earned | | Net Benefits Incurred |
| Direct | $ | 2,346 | | | $ | 3,987 | | | $ | 2,112 | | | $ | 3,728 | | | $ | 1,522 | | | $ | 3,640 | |
| | | | | | | | | | | |
| Ceded | (94) | | | (196) | | | (105) | | | (175) | | | (128) | | | (2,514) | |
| Net | $ | 2,252 | | | $ | 3,791 | | | $ | 2,007 | | | $ | 3,553 | | | $ | 1,394 | | | $ | 1,126 | |
Amounts payable or recoverable for reinsurance on paid and unpaid claims are not subject to periodic or maximum limits. No policies issued by F&G have been reinsured with any foreign company, which is controlled, either directly or indirectly, by a party not primarily engaged in the business of insurance. F&G has not entered into any reinsurance agreements in which the reinsurer may unilaterally cancel any reinsurance for reasons other than non-payment of premiums or other similar credit issues.
Reinsurance Transactions
The following summarizes significant changes to third-party reinsurance agreements for the years ended December 31, 2024 and 2023:
Somerset: Effective July 1, 2024, F&G amended the existing flow reinsurance agreement with Somerset Reinsurance Ltd. (“Somerset”), a third-party reinsurer, to additionally cede the base contract benefits and GMWB riders attached under certain FIA policies on a coinsurance funds withheld quota share basis.
Kubera: F&G has a reinsurance agreement with Kubera Insurance (SAC) Ltd. (“Kubera”), an unaffiliated reinsurer, to cede certain FIA statutory reserves on a coinsurance funds withheld quota share basis, net of applicable existing reinsurance. This agreement has been amended several times to include additional FIA policies, with the latest amendment effective December 1, 2024.
Everlake and Somerset: F&G executed flow reinsurance agreements with Everlake Life Insurance Company (“Everlake”) and Somerset, third-party reinsurers, to cede certain MYGA business written effective September 1, 2023, and December 1, 2023, respectively, on a coinsurance quota share basis.
Canada Life: Effective May 1, 2020, F&G entered into an indemnity reinsurance agreement with Canada Life Assurance Company (“Canada Life”) United States Branch, a third-party reinsurer, to reinsure FIA policies with GMWB riders. In accordance with the terms of this agreement, F&G cedes a quota share percentage of the net retention of guaranteed payments in excess of account value for GMWB. Effective December 31, 2023, we entered a Recapture and Termination Agreement with Canada Life whereby 100% of the liabilities and obligations were recaptured.
The following summarizes significant changes to third-party reinsurance agreements subsequent to the year ended December 31, 2024:
Everlake Reinsurance Amendment
Effective January 1, 2025, F&G amended the existing flow reinsurance agreement with Everlake to cede future additional MYGA business for agreed upon periods to Everlake pursuant to an offer and acceptance process, rather than on a flow basis. The amendment included a cession of an inforce block of certain MYGA policies on a coinsurance quota share basis.
The following summarizes our reinsurance recoverable (in millions):
| | | | | | | | | | | | | | | | | | | | | | | | | | | | | | | | |
Parent Company/
Principal Reinsurers | | Reinsurance Recoverable (a) | | Agreement Type | | Products
Covered | | Accounting |
| | December 31, 2024 | | December 31, 2023 | | | | | | |
| | | | | | | | |
| Aspida Life Re Ltd. | | $ | 7,844 | | | $ | 6,128 | | | Coinsurance Funds Withheld | | Certain MYGA (b) | | Deposit |
| Somerset (c) | | 2,822 | | | 716 | | | Coinsurance Funds Withheld | | Certain MYGA (b) and deferred annuities | | Deposit |
| | | | | | Coinsurance Funds Withheld | | Certain FIA | | Reinsurance |
| Everlake | | 1,168 | | | 509 | | | Coinsurance | | Certain MYGA (b) (d) | | Deposit |
| Wilton Reassurance Company | | 1,066 | | | 1,092 | | | Coinsurance | | Block of traditional, IUL, and UL (e) | | Reinsurance |
| Other (f) | | 489 | | | 536 | | | | | | | |
| Reinsurance recoverable, gross of allowance for credit losses | | 13,389 | | | 8,981 | | | | | | | |
| Allowance for expected credit loss | | (20) | | | (21) | | | | | | | |
| Reinsurance recoverable, net of allowance for credit losses | | $ | 13,369 | | | $ | 8,960 | | | | | | | |
| | | | | | | | | | |
|
|
|
|
|
(a)Reinsurance recoverables do not include unearned ceded premiums that would be recovered in the event of early termination of certain traditional life policies.
(b)The combined quota share flow reinsurance amongst all reinsurers for 2024 varied between 30% and 90%. As of December 31, 2024, the combined quota share flow reinsurance amongst all reinsurers was 90%.
(c)The balance represents the total reinsurance recoverable for all reinsurance agreements with Somerset.
(d)Reinsurance recoverable is collateralized by assets placed in a statutory comfort trust by the reinsurer and maintained for our sole benefit.
(e)Also includes certain FGL Insurance life insurance policies that are subject to redundant reserves, reported on a statutory basis, under Regulation XXX and Guideline AXXX.
(f)Represents all other reinsurers, with no single reinsurer having a carrying value in excess of 5% of total reinsurance recoverable
As of December 31, 2024 and December 31, 2023, F&G had a deposit asset of $11,039 million and $7,481 million, respectively, which is reported in the Reinsurance recoverable, net of allowance for credit losses on the Consolidated Balance Sheets.
F&G incurred risk charge fees of $42 million, $39 million, and $36 million during the years ended December 31, 2024, 2023, and 2022, respectively, in relation to reinsurance agreements.
Credit Losses
F&G estimates expected credit losses on reinsurance recoverables using a probability of default/loss given default model. Significant inputs to the model include the reinsurer's credit risk, expected timing of recovery, industry-wide historical default experience, senior unsecured bond recovery rates, and credit enhancement features.
The expected credit loss reserves were as follows (in millions):
| | | | | | | | | | | | | |
| Year Ended December 31, |
| 2024 | | 2023 | | |
| Balance at beginning of period | $ | (21) | | | $ | (10) | | | |
| Changes in the expected credit loss reserve | 1 | | | (11) | | | |
| Balance at end of period | $ | (20) | | | $ | (21) | | | |
Concentration of Reinsurance Risk
As indicated above, the Company has a significant concentration of reinsurance risk with third party reinsurers, Aspida Life Re Ltd. (“Aspida Re”), Wilton Reassurance (“Wilton Re”), Somerset, and Everlake that could have a material impact on our financial position in the event that any of these reinsurers fails to perform its obligations under the various reinsurance treaties. We monitor the financial condition and financial strength of individual reinsurers using public ratings (refer to table below) and ratings reports of individual reinsurers to attempt to reduce the risk of default by such reinsurers. In addition, the risk of non-performance is further mitigated with various forms of collateral or collateral arrangements, including secured trusts, funds withheld accounts and irrevocable letters of credit. We believe that all amounts due from Aspida Re, Wilton Re, Somerset and Everlake for periodic treaty settlements, net of any applicable credit loss reserves, are collectible as of December 31, 2024. The following table presents financial strength ratings as of December 31, 2024:
| | | | | | | | | | | | | | | | | | | | | | | |
| Parent Company/Principal Reinsurers | Financial Strength Rating |
| AM Best | | S&P | | Fitch | | Moody's |
| Aspida Re | A- | | — | | — | | — |
| Somerset | A- | | BBB+ | | — | | — |
| Everlake | A | | — | | — | | — |
| Wilton Re | A+ | | — | | A- | | — |
|
|
“—” indicates not rated
Intercompany Reinsurance Agreements
The Company executes various intercompany reinsurance agreements between its insurance subsidiaries, including off shore entities, for purposes of managing regulatory statutory capital and risk. Since these agreements are intercompany, the financial impacts are eliminated in the preparation of the Consolidated Financial Statements included within this Annual Report on Form 10-K.
Some of these intercompany transactions are executed with wholly owned reinsurance subsidiaries, Corbeau Re, Inc. (“Corbeau Re”), Raven Reinsurance Company (“Raven Re”) and F&G Cayman Re (“Cayman Re”), to finance the portion of statutory reserves considered to be non-economic. The financing arrangements involve Fidelity & Guaranty Life Insurance Company reinsuring certain annuity products and their related rider benefits to the captives and the captives executing third-party financing facilities that are classified as capital for statutory purposes.
The transactions with Raven Re and Cayman Re included the execution of letter of credits with Nomura Bank International plc (“NBI”) and Deutsche Bank AG, respectively, that are undrawn and have maximum borrowing capacities of $175 million and $400 million, respectively, as of December 31, 2024. The transaction with Corbeau Re included the execution of an excess of loss agreement (“XOL”) with Canada Life Barbados Branch that matures on December 31, 2043, and provides for coverage on losses up to $1,500 million as of December 31, 2024. With Corbeau Re, non-economic reserves were financed through the maturity date of the XOL and statutory reserves are recorded for all risks expected to be incurred after the maturity date of the XOL. The XOL is not accounted for as reinsurance as it does not satisfy the risk transfer requirements for GAAP; therefore, deposit accounting is applied.
Note F - Intangibles
The following table reconciles to Other intangible assets, net, on the Consolidated Balance Sheets as of December 31, 2024 and 2023 (in millions):
| | | | | | | | | | | |
| December 31, 2024 | | December 31, 2023 |
| VOBA | $ | 1,349 | | | $ | 1,446 | |
| DAC | 3,036 | | | 2,215 | |
| DSI | 625 | | | 346 | |
| VODA | 74 | | | 86 | |
| Computer software | 76 | | | 65 | |
| Definite lived trademarks, tradenames, and other | 131 | | | 41 | |
| Customer relationships and contracts | 273 | | | — | |
| Indefinite lived tradenames and other | 8 | | | 8 | |
| Total Other intangible assets, net | $ | 5,572 | | | $ | 4,207 | |
The following tables roll forward VOBA by product for the years ended December 31, 2024 and 2023 (in millions):
| | | | | | | | | | | | | | | | | | | | | | | | | | | | | | | | | | | | | | | | |
| Indexed Annuities | | Fixed Rate Annuities | | Immediate Annuities | | Universal Life | | Traditional Life | | | | | | | Total |
| Balance at January 1, 2024 | $ | 1,025 | | | $ | 27 | | | $ | 191 | | | $ | 134 | | | $ | 69 | | | | | | | | $ | 1,446 | |
| | | | | | | | | | | | | | | | |
| Amortization | (133) | | | (5) | | | (7) | | | (8) | | | (7) | | | | | | | | (160) | |
| Actuarial model updates and refinements (a) | — | | | — | | | — | | | — | | | 63 | | | | | | | | 63 | |
| Balance at December 31, 2024 | $ | 892 | | | $ | 22 | | | $ | 184 | | | $ | 126 | | | $ | 125 | | | | | | | | $ | 1,349 | |
(a)net of amortization of ($15 million).
| | | | | | | | | | | | | | | | | | | | | | | | | | | | | | | | | | | | | | | | |
| Indexed Annuities | | Fixed Rate Annuities | | Immediate Annuities | | Universal Life | | Traditional Life | | | | | | | Total |
| Balance at January 1, 2023 | $ | 1,166 | | | $ | 32 | | | $ | 201 | | | $ | 143 | | | $ | 73 | | | | | | | | $ | 1,615 | |
| | | | | | | | | | | | | | | | |
| Amortization | (141) | | | (5) | | | (10) | | | (9) | | | (4) | | | | | | | | (169) | |
| | | | | | | | | | | | | | | | |
| Balance at December 31, 2023 | $ | 1,025 | | | $ | 27 | | | $ | 191 | | | $ | 134 | | | $ | 69 | | | | | | | | $ | 1,446 | |
VOBA amortization expense of $175 million, $169 million, and $180 million, was recorded in Depreciation and amortization on the Consolidated Statements of Operations for the years ended December 31, 2024, 2023, and 2022, respectively.
The following tables roll forward DAC by product for the years ended December 31, 2024 and 2023 (in millions):
| | | | | | | | | | | | | | | | | | | | | | | |
| Indexed Annuities | | Fixed Rate Annuities | | Universal Life | | Total (a) |
| Balance at January 1, 2024 | $ | 1,378 | | | $ | 288 | | | $ | 545 | | | $ | 2,211 | |
| Capitalization | 652 | | | 174 | | | 274 | | | 1,100 | |
| Amortization | (156) | | | (86) | | | (38) | | | (280) | |
| | | | | | | |
| Balance at December 31, 2024 | $ | 1,874 | | | $ | 376 | | | $ | 781 | | | $ | 3,031 | |
| | | | | | | |
| Indexed Annuities | | Fixed Rate Annuities | | Universal Life | | Total (a) |
| Balance at January 1, 2023 | $ | 971 | | | $ | 83 | | | $ | 348 | | | $ | 1,402 | |
| Capitalization | 510 | | | 177 | | | 229 | | | 916 | |
| Amortization | (103) | | | (51) | | | (32) | | | (186) | |
| Reinsurance related adjustments | — | | | 79 | | | — | | | 79 | |
| Balance at December 31, 2023 | $ | 1,378 | | | $ | 288 | | | $ | 545 | | | $ | 2,211 | |
| | | | | | | |
| | | | | | | |
| | | | | | | |
| | | | | | | |
| | | | | | | |
| | | | | | | |
| | | | | | | |
| | | | | | | |
| | | | | | | |
| | | | | | | |
| | | | | | | |
| | | | | | | |
| | | | | | | |
(a)Excludes insignificant amounts of DAC related to FABN and PRT.
DAC amortization expense of $280 million, $186 million, and $99 million, was recorded in Depreciation and amortization on the Consolidated Statements of Operations for the years ended December 31, 2024, 2023, and 2022, respectively, excluding insignificant amounts related to FABN and PRT.
The following table presents a reconciliation of DAC to the table above which is reconciled to the Consolidated Balance Sheets as of December 31, 2024 and 2023 (in millions):
| | | | | | | | | | | |
| December 31, 2024 | | December 31, 2023 |
| Indexed Annuities | $ | 1,874 | | | $ | 1,378 | |
| Fixed Rate Annuities | 376 | | | 288 | |
| | | |
| Universal Life | 781 | | | 545 | |
| | | |
| Funding Agreements | 4 | | | 4 | |
| PRT | 1 | | | — | |
| Total | $ | 3,036 | | | $ | 2,215 | |
The following tables roll forward DSI for our indexed annuity products for the years ended December 31, 2024 and 2023 (in millions):
| | | | | | | | | | | |
| Years Ended December 31, |
| 2024 | | 2023 |
| Balance at January 1, | $ | 346 | | | $ | 200 | |
| Capitalization | 319 | | | 168 | |
| Amortization | (40) | | | (22) | |
| Balance at December 31, | $ | 625 | | | $ | 346 | |
| | | |
| | | |
| | | |
| | | |
| | | |
| | | |
| | | |
| | | |
| | | |
| | | |
| | | |
| | | |
| | | |
DSI amortization expense of $40 million, $22 million, and $14 million, was recorded in Depreciation and amortization on the Consolidated Statements of Operations for the years ended December 31, 2024, 2023, and 2022, respectively.
The cash flow assumptions used to amortize VOBA and DAC were consistent with the assumptions used to estimate the FPB for life contingent immediate annuities, and will be reviewed and unlocked, if applicable, in the same period as those balances. For nonparticipating traditional life contracts, the VOBA amortization is straight-line, without the use of cash flow assumptions. For indexed annuity contracts, the cash flow assumptions used to amortize VOBA, DAC, and DSI were consistent with the assumptions used to estimate the value of the embedded derivative and MRBs, and will be reviewed and unlocked, if applicable, in the same period as those balances. For fixed rate annuities and IUL the cash flow assumptions used to amortize VOBA, DAC and DSI reflect the Company’s best estimates for policyholder behavior, consistent with the development of assumptions for indexed annuities and immediate annuities. Refer to Note A - Business and Summary of Significant Accounting Policies for further information about accounting policies for amortization of VOBA, DAC and DSI.
We review cash flow assumptions annually, generally in the third quarter. In 2024 and 2023, we undertook a review of all significant assumptions and revised several assumptions relating to our deferred annuity (indexed annuity and fixed rate annuity) and IUL products. For the year ended December 31, 2024, we updated assumptions including surrender rates, GMWB election timing, premium persistency, mortality improvement, and option budgets. For the year ended December 31, 2023, we updated assumptions including surrender rates, GMWB election timing, premium persistency, and option budgets. All updates to these assumptions brought us more in line with our company and overall industry experience since the prior assumption update.
Definite and Indefinite Lived Other Intangible Assets
Other intangible assets as of December 31, 2024 and 2023 consist of the following (in millions):
| | | | | | | | | | | | | | | | | | | | | | | |
| December 31, 2024 |
| Cost | | Accumulated amortization | | Net carrying amount | | Weighted average useful life (years) |
| | | | | | | |
| Definite lived other intangible assets | | | | | | | |
| VODA | $ | 140 | | | $ | (66) | | | $ | 74 | | | 15 |
| Computer software | 114 | | | (38) | | | 76 | | | 2 to 10 |
| Definite lived trademarks, tradenames, and other (a) | 155 | | | (24) | | | 131 | | | 5 to 10 |
| Customer relationship intangibles and contracts (a) | 310 | | | (37) | | | 273 | | | 12 to 20 |
| Indefinite lived other intangible assets | | | | | | | |
| Indefinite lived tradenames and other | 8 | | | N/A | | 8 | | | Indefinite |
| Total | | | | | $ | 562 | | | |
(a)Includes intangible assets acquired with ROAR and PALH. Refer to Note P - Acquisitions for further details.
| | | | | | | | | | | | | | | | | | | | | | | |
| December 31, 2023 |
| Cost | | Accumulated amortization | | Net carrying amount | | Weighted average useful life (years) |
| Definite lived other intangible assets | | | | | | | |
| VODA | $ | 140 | | | $ | (54) | | | $ | 86 | | | 15 |
| Computer software | 94 | | | (29) | | | 65 | | | 2 to 10 |
| Definite lived trademarks, tradenames and other | 54 | | | (13) | | | 41 | | | 10 |
| Indefinite lived other intangible assets | | | | | | | |
| Indefinite lived tradenames and other | 8 | | | N/A | | 8 | | | Indefinite |
| Total | | | | | $ | 200 | | | |
Total amortization expense for definite lived other intangible assets, was $69 million, $26 million and $25 million for the years ended December 31, 2024, 2023 and 2022, respectively.
Within definite lived trademarks, tradenames, and other is an amount established to offset MRBs with no explicit rider charges, which had a balance of $94 million and $22 million as of December 31, 2024 and December 31, 2023, respectively. Amortization of $5 million, $1 million and $1 million was recorded in Depreciation and amortization on the Consolidated Statements of Operations for the years ended December 31, 2024, 2023, and 2022, respectively, and is included in total amortization expense noted above.
We recorded no impairment expense related to computer software during the year ended December 31, 2024, compared to $13 million and $14 million for the years ended December 31, 2023 and 2022, respectively.
The following table shows the estimated amortization expense in future fiscal periods for VOBA for the in-force liabilities, customer relationship intangibles and definite lived other intangible assets as of December 31, 2024 (in millions):
| | | | | | | | | | | | | | | | | |
| VOBA | | Customer Relationship
Intangibles | | Definite Lived Other
Intangible Assets |
| | | | | |
| 2025 | $ | 145 | | | $ | 35 | | | $ | 41 | |
| 2026 | 132 | | 30 | | 37 | |
| 2027 | 121 | | 26 | | 35 | |
| 2028 | 110 | | 23 | | 28 | |
| 2029 | 100 | | 20 | | 25 | |
| Thereafter | 741 | | | 139 | | 115 | |
| Total | $ | 1,349 | | | $ | 273 | | | $ | 281 | |
Note G - Market Risk Benefits
The following table presents the balances of and changes in MRBs associated with indexed annuities and fixed rate annuities for the years ended December 31, 2024 and 2023 (in millions):
| | | | | | | | | | | | | | | | | | | | | | | | | | | |
| December 31, 2024 | | December 31, 2023 | | |
| Indexed annuities | | Fixed rate annuities | | Indexed annuities | | Fixed rate annuities | | | | |
| Balance, beginning of period, net liability | $ | 314 | | | $ | 1 | | | $ | 164 | | | $ | 1 | | | | | |
| | | | | | | | | | | |
| Balance, beginning of period, before effect of changes in the instrument-specific credit risk | $ | 209 | | | $ | 1 | | | $ | 102 | | | $ | 1 | | | | | |
| Issuances and benefit payments | 109 | | | — | | | (10) | | | — | | | | | |
| Attributed fees collected and interest accrual | 147 | | | — | | | 131 | | | — | | | | | |
| Actual policyholder behavior different from expected | (5) | | | — | | | 27 | | | — | | | | | |
| Changes in assumptions and other | 24 | | | — | | | 29 | | | — | | | | | |
| | | | | | | | | | | |
| | | | | | | | | | | |
| Effects of market related movements | (162) | | | — | | | (70) | | | — | | | | | |
| Balance, end of period, before effect of changes in the instrument-specific credit risk | 322 | | | 1 | | | 209 | | | 1 | | | | | |
| Effect of changes in the instrument-specific credit risk | 98 | | | — | | | 105 | | | — | | | | | |
| Balance, end of period, net liability | 420 | | | 1 | | | 314 | | | 1 | | | | | |
| Less: reinsured market risk benefits | 61 | | | — | | | — | | | — | | | | | |
| Balance, end of period, net of reinsurance | $ | 359 | | | $ | 1 | | | $ | 314 | | | $ | 1 | | | | | |
| | | | | | | | | | | |
| Weighted-average attained age of policyholders weighted by total AV (years) | 67.98 | | 72.58 | | 68.28 | | 72.59 | | | | |
| Net amount at risk | $ | 1,327 | | | $ | 2 | | | $ | 1,059 | | | $ | 2 | | | | | |
The following table reconciles MRBs by amounts in an asset position and amounts in a liability position to the MRBs amounts in the Consolidated Balance Sheets (in millions):
| | | | | | | | | | | | | | | | | | | | | | | | | | | | | | | | | | | |
| December 31, 2024 | | December 31, 2023 |
| Direct | | Reinsured | | Net | | Direct | | Reinsured | | Net |
| MRB asset | | | | | | | | | | | |
| Indexed annuities | $ | 128 | | | $ | 61 | | | $ | 189 | | | $ | 88 | | | $ | — | | | $ | 88 | |
| Fixed rate annuities | — | | | — | | | — | | | — | | | — | | | — | |
| Total MRB asset | $ | 128 | | | $ | 61 | | | $ | 189 | | | $ | 88 | | | $ | — | | | $ | 88 | |
| | | | | | | | | | | |
| MRB liability | | | | | | | | | | | |
| Indexed annuities | $ | 548 | | | $ | — | | | $ | 548 | | | $ | 402 | | | $ | — | | | $ | 402 | |
| Fixed rate annuities | 1 | | | — | | | 1 | | | 1 | | | — | | | 1 | |
| Total MRB liability | $ | 549 | | | $ | — | | | $ | 549 | | | $ | 403 | | | $ | — | | | $ | 403 | |
| | | | | | | | | | | |
2024. The net MRB liability increased for the year ended December 31, 2024, primarily as a result of collection of attributed fees, interest accrual, MRB reserves for contracts issued within the period, and changes in actuarial assumptions. These increases were partially offset by the effects of market related movements, including the impacts of higher risk-free rates and increases in the equity market related projections.
For the year ended December 31, 2024, notable changes made to the inputs to the fair value estimates of MRBs calculations included an increase in risk-free rates leading to a favorable change in the MRBs associated with indexed annuities and fixed rate annuities; increases in the equity market related projections resulted in a decrease in the net amount at risk associated with indexed annuities, leading to a favorable change in the value of the associated MRBs; and an increase in the rider benefit utilization assumption, leading to an unfavorable change in the value of the associated MRBs.
2023. The net MRB liability increased for the year ended December 31, 2023, primarily as a result of attributed fees collected, increases as a result of actual policyholder behavior different than expected and changes in assumptions as discussed below. These increases were partially offset by the effects of market related movements, including the impacts of higher risk-free rates and increases in the equity market related projections.
For the year ended December 31, 2023, notable changes made to the inputs to the fair value estimates of MRBs calculations included a significant increase in risk-free rates leading to a favorable change in the MRBs associated with indexed annuities and fixed rate annuities; increases in the equity market related projections resulted in a decrease in the net amount at risk associated with indexed annuities, leading to a favorable change in the value of the associated MRBs; and F&G’s credit spread decreased, lead to a corresponding unfavorable change in the MRBs associated with both indexed annuities and fixed rate annuities.
In 2024 and 2023, F&G undertook a review of all significant assumptions and revised several assumptions relating to our deferred annuities (indexed annuities and fixed rate annuities) with MRBs. For the year ended December 31, 2024, we updated assumptions including surrender rates, rider benefit election utilization, mortality improvement, and option budgets. For the year ended December 31, 2023, we updated assumptions including surrender rates, partial withdrawal rates, mortality improvement, and option budgets. All updates to these assumptions brought us more in line with our Company and overall industry experience since the prior assumption updates. These updates, in total, led to increases in the net MRB liability for the years ended December 31, 2024 and 2023.
Note H - Income Taxes
Income tax expense (benefit) on continuing operations consists of the following (in millions):
| | | | | | | | | | | | | | | | | |
| Year Ended December 31, |
| 2024 | | 2023 | | 2022 |
| | | | | |
| Current | $ | 65 | | | $ | 27 | | | $ | (31) | |
| Deferred | 71 | | | (4) | | | 189 | |
| Total | $ | 136 | | | $ | 23 | | | $ | 158 | |
Total income tax expense (benefit) was allocated as follows (in millions):
| | | | | | | | | | | | | | | | | |
| Year Ended December 31, |
| 2024 | | 2023 | | 2022 |
| | | | | |
| Taxes on net earnings from continuing operations | $ | 136 | | | $ | 23 | | | $ | 158 | |
| | | | | |
| Other comprehensive income (loss): | | | | | |
| Changes in current discount rate - future policy benefits | 59 | | | (50) | | | 203 | |
| Changes in instrument-specific credit risk-market benefits | 1 | | | (9) | | | 18 | |
| Unrealized (loss) gain on investments and other financial instruments | (41) | | | 275 | | | (1,186) | |
| Unrealized gain (loss) on foreign currency translation and cash flow hedging | (1) | | | 1 | | | (1) | |
| Total income tax (benefit) expense allocated to other comprehensive income (loss) | 18 | | | 217 | | | (966) | |
| Total income taxes | $ | 154 | | | $ | 240 | | | $ | (808) | |
A reconciliation of the federal statutory rate to our effective tax rate is as follows:
| | | | | | | | | | | | | | | | | |
| Year Ended December 31, |
| 2024 | | 2023 | | 2022 |
| Federal statutory rate | 21.0 | % | | 21.0 | % | | 21.0 | % |
| State income taxes, net of federal benefit | 0.3 | | | (12.7) | | | 0.1 | |
| Benefit for capital loss carryback | — | | | — | | | (3.0) | |
| | | | | |
| | | | | |
| Officers Compensation | 1.2 | | | (11.2) | | | 0.3 | |
| Stock compensation | (0.8) | | | 2.7 | | | — | |
| Tax credits | (1.6) | | | 16.2 | | | (1.1) | |
| Dividends received deduction | (0.2) | | | 7.9 | | | (0.4) | |
| | | | | |
| | | | | |
| | | | | |
| | | | | |
| Valuation allowance for deferred tax assets | (1.8) | | | (100.1) | | | 3.4 | |
| | | | | |
| | | | | |
| | | | | |
| | | | | |
| | | | | |
| | | | | |
| COLI | (0.6) | | | 13.2 | | | (0.4) | |
| Non-deductible expenses and other, net | — | | | (3.2) | | | — | |
| Effective tax rate | 17.5 | % | | (66.2) | % | | 19.9 | % |
| | | | | |
| | | | | |
For the year ended December 31, 2024, the Company’s effective tax rate was 17.5%. The effective tax rate was positively impacted by favorable permanent adjustments, including low income housing tax credits (“LIHTC”), the dividends received deduction (“DRD”), and COLI, as well as the valuation allowance release on unrealized losses and capital loss carryforwards.
For the year ended December 31, 2023, the Company’s effective tax rate was (66.2)%. The effective tax rate was negatively impacted by the valuation allowance expense recorded on unrealized losses and capital loss carryforwards.
For the year ended December 31, 2022, the Company’s effective tax rate was 19.9%. The effective tax rate was positively impacted by favorable permanent adjustments, including LIHTC, DRD, and COLI. The effective tax rate was also impacted by the benefit of the capital loss carryback. This benefit is offset by the valuation allowance expense recorded on unrealized losses and capital loss carryforwards.
The significant components of deferred tax assets and liabilities consist of the following (in millions):
| | | | | | | | | | | |
| December 31, |
| 2024 | | 2023 |
| Deferred tax assets: | | | |
| Employee benefit accruals | $ | 29 | | | $ | 25 | |
| | | |
| Net operating loss carryforwards | 105 | | | 75 | |
| | | |
| | | |
| | | |
| | | |
| General business tax credits | 9 | | | 43 | |
| | | |
| Corporate Alternative Minimum Tax ("CAMT") Credit Carryforwards | 155 | | | 36 | |
| Bermuda CIT NOL Carryforward | 10 | | | 24 | |
| | | |
| Investment securities | 643 | | | 597 | |
| Capital loss carryover | 19 | | | 38 | |
| Market risk benefit | 56 | | | 61 | |
| Derivatives | 18 | | | — | |
| Life insurance and claim related adjustments | 451 | | | 547 | |
| Funds held under reinsurance agreements | 822 | | | 500 | |
| Other | 13 | | | 5 | |
| Total gross deferred tax asset | 2,330 | | | 1,951 | |
| Less: valuation allowance | 58 | | | 85 | |
| Total deferred tax asset | 2,272 | | | 1,866 | |
| Deferred Tax Liabilities: | | | |
| | | |
| Amortization of goodwill and intangible assets | (18) | | | (25) | |
| | | |
| Other | (2) | | | (5) | |
| | | |
| Depreciation | (11) | | | (15) | |
| Partnerships | (163) | | | (127) | |
| Value of business acquired | (283) | | | (304) | |
| | | |
| Derivatives | — | | | (3) | |
| Deferred acquisition costs | (543) | | | (361) | |
| Transition reserve on new reserve method | (8) | | | (17) | |
| Funds held under reinsurance agreements | (945) | | | (621) | |
| | | |
| | | |
| | | |
| Total deferred tax liability | (1,973) | | | (1,478) | |
| Net deferred tax asset (liability) | $ | 299 | | | $ | 388 | |
Our net deferred tax asset was $299 million as of December 31, 2024 and a net deferred tax asset of $388 million as of December 31, 2023. The significant changes in the deferred taxes are as follows: the deferred tax asset for investment securities increased by $46 million primarily due to unrealized capital losses on fixed maturities and the recognition of tax gains on commercial mortgage loans, which were carried at a zero tax basis as a result of an IRS Code Section 338(h)(10) election made on November 30, 2017. The deferred tax liability related to deferred acquisition costs increased by $182 million, which is consistent with the growth in sales in our U.S. life group. The life insurance reserves and claim related adjustments deferred tax asset decreased by $96 million primarily due to the tax reserves for the year increasing by more than the GAAP reserves. The reinsurance receivable deferred tax asset increased by $322 million, and the reinsurance receivable deferred tax liability increased by $324 million, both due to the increase in the Modco reinsurance.
As of December 31, 2024, we have net operating losses (“NOLs”) on a pretax basis of $503 million, which are available to carryforward and offset future federal taxable income subject to the 80% taxable income limitation. A portion of these NOLs are subject to Internal Revenue Code Section 382 limitations, however, such limitations are in excess of the relevant carryforward balances. Therefore, the carryforwards are effectively unlimited. These losses do not expire.
As of December 31, 2024 and 2023, we had $9 million and $43 million of general business tax credits, respectively, which expire between 2041 and 2044. None of the $9 million in tax credits are limited. As of December 31, 2024 and 2023, the Company also had $155 million and $36 million of CAMT credits. The CAMT credits are not limited by IRC Section 382, and have no expiration date.
As of December 31, 2024, the valuation allowance of $58 million consisted of a full valuation allowance of $2 million on the unrealized capital loss deferred tax assets for F&G Life Re Ltd. (“F&G Life Re”), F&G Cayman Re Ltd. (“F&G Cayman Re”), and the US Non-life Companies, a full valuation allowance of $10 million on the foreign deferred tax assets of F&G Life Re, a full valuation allowance of $1 million on the deferred capital loss carryforwards for the US Non-life Companies and F&G Cayman Re, and a partial valuation allowance of $45 million on the US Life Companies’ capital loss deferred tax assets.
The Company makes certain investments in limited partnerships, which invest in affordable housing projects that qualify for the LIHTC. The Company’s investment in the funds is amortized through income tax expense on the Consolidated Statements of Operations using the proportional amortization method.
The tax credits and other benefits recognized are included in the net change in income taxes on the Consolidated Statements of Cash Flows. The following table presents the impacts of the LIHTC investments included in income tax expense on the Consolidated Statements of Operations (in millions):
| | | | | | | | | | | | | | | | | |
| For the Year Ended December 31, |
| 2024 | | 2023 | | 2022 |
| Tax credits and other benefits recognized | $ | (36) | | | $ | (27) | | | $ | (26) | |
| Tax credit amortization expense | 26 | | | 22 | | | 18 | |
| Total | $ | (10) | | | $ | (5) | | | $ | (8) | |
At December 31, 2024 and December 31, 2023, LIHTC investments included in Prepaid expenses and other assets on the Consolidated Balance Sheets totaled $135 million and $108 million, respectively.
The U.S. Life insurance group is subject to a Tax Sharing Agreement within the members of the life insurance tax return group. The agreement provides for an allocation based on separate return calculations and allows for reimbursement of company tax benefits absorbed by other members of the group. The U.S. non-life group is subject to a Tax Sharing Agreement with its parent, FNF, with which it files a consolidated federal income tax return. The Company’s non-life group Tax Sharing Agreement allows for reimbursement of company tax benefits absorbed by FNF. If, during the year ended December 31, 2024, the Company had computed taxes using the separate return method, the pro-forma provision for income taxes would remain unchanged.
The U.S. Federal income tax returns of the Company for years prior to 2020 are no longer subject to examination by the taxing authorities. The Company does not have any unrecognized tax benefits (“UTBs”) at December 31, 2024 or December 31, 2023. In the event the Company has UTBs, interest and penalties related to uncertain tax positions would be recorded as part of income tax expense in the financial statements. The Company regularly assesses the likelihood of additional tax assessments by jurisdiction and, if necessary, adjusts its tax reserves based on new information or developments.
The Inflation Reduction Act of 2022 (the “Inflation Reduction Act”) was signed into law on August 16, 2022. Among other changes, the Inflation Reduction Act introduced a 15% CAMT on adjusted financial statement income and a 1% excise tax on treasury stock repurchases. These provisions were effective January 1, 2023. For purposes of calculating the adjusted financial statement income, the Company is included in the controlled group of FNF, its parent company. Though the Company is subject to the minimum tax, the Company does not expect to be in a perpetual CAMT position. The life companies will join the consolidated tax return group with FNF and file a life/non-life consolidated return once the five-year waiting period has completed in 2026, which should strengthen that position as FNF is not anticipating owing CAMT on its future returns. The Company has elected to consider the effects of CAMT separately in evaluating the need for a valuation allowance. For the year ended December 31, 2024, due to the reasons above, no valuation allowance is needed. For the year ended December 31, 2024, the Company was subject to CAMT, but there is no impact to total tax. A CAMT credit carryforward was created and is expected to be able to be utilized in future years.
The CIT Act of 2023 was passed in Bermuda on December 27, 2023. The CIT commenced on January 1, 2025 and applies a statutory rate of 15% to the taxable income or loss of Bermuda tax resident entities and permanent establishments. F&G Life Re, a 953(d) company with no or minimal US permanent tax differences, is not expected to owe any Bermuda CIT due to the foreign tax credit. The deferred tax asset recorded for the year ended December 31, 2024 of $10 million has a full valuation allowance. Since the CIT did not have any material impact to the financial statements, the deferred tax asset and offsetting valuation allowance were netted together in the rate reconciliation above.
Note I - Contractholder Funds
The following tables summarize balances of and changes in contractholder funds’ account balances (in millions):
| | | | | | | | | | | | | | | | | | | | | | | | | | | | | |
| December 31, 2024 |
| Indexed annuities | | Fixed rate annuities | | Universal Life | | FABN (b) | | FHLB (b) |
| Balance, beginning of year | $ | 27,164 | | | $ | 13,443 | | | $ | 2,391 | | | $ | 2,613 | | | $ | 2,539 | |
| Issuances | 6,649 | | | 5,125 | | | 208 | | | 600 | | | 1,804 | |
| Premiums received | 120 | | | 1 | | | 495 | | | — | | | — | |
| Policy charges (a) | (195) | | | — | | | (315) | | | — | | | — | |
| Surrenders and withdrawals | (3,832) | | | (1,479) | | | (101) | | | — | | | — | |
| Benefit payments | (495) | | | (315) | | | (18) | | | (820) | | | (1,606) | |
| | | | | | | | | |
| Interest credited | 821 | | | 667 | | | 157 | | | 71 | | | 117 | |
| Other | 3 | | | — | | | — | | | (1) | | | (2) | |
| Balance, end of year | 30,235 | | | 17,442 | | | 2,817 | | | 2,463 | | | 2,852 | |
| Embedded derivative adjustment (c) | 219 | | | — | | | 79 | | | — | | | — | |
| Gross liability, end of period | 30,454 | | | 17,442 | | | 2,896 | | | 2,463 | | | 2,852 | |
| Less: Reinsurance recoverable | 861 | | | 11,009 | | | 877 | | | — | | | — | |
| Net liability, after reinsurance recoverable | $ | 29,593 | | | $ | 6,433 | | | $ | 2,019 | | | $ | 2,463 | | | $ | 2,852 | |
| | | | | | | | | |
| Weighted-average crediting rate | 2.90 | % | | 4.42 | % | | 6.20 | % | | N/A | | N/A |
| Net amount at risk (d) | N/A | | N/A | | $ | 74,279 | | | N/A | | N/A |
| Cash surrender value (e) | $ | 27,865 | | | $ | 16,266 | | | $ | 2,177 | | | N/A | | N/A |
(a)Contracts included in the contractholder funds are generally charged a premium and/or monthly assessments on the basis of the account balance.
(b)FABN and FHLB are considered funding agreements that are investment contracts which follow the interest method of accounting, and therefore are not subject to Accounting Standards Update (“ASU”) 2018-12 disclosure requirements. However, the Company has elected to present the liability for these agreements within the disaggregated roll forward as we believe it will provide meaningful information for users of the financials.
(c)The embedded derivative adjustment reconciles the account balance to the gross GAAP liability and represents the combination of the host contract and the fair value of the embedded derivatives.
(d)For those guarantees of benefits that are payable in the event of death, the net amount at risk is generally defined as the current guaranteed minimum death benefit in excess of the current account balance at the balance sheet date.
(e)These amounts are gross of reinsurance.
| | | | | | | | | | | | | | | | | | | | | | | | | | | | | |
| December 31, 2023 |
| Indexed annuities | | Fixed rate annuities | | Universal Life | | FABN (b) | | FHLB (b) |
| Balance, beginning of year | $ | 24,766 | | | $ | 9,358 | | | $ | 2,112 | | | $ | 2,613 | | | $ | 1,982 | |
| Issuances | 4,722 | | | 5,061 | | | 199 | | | — | | | 1,256 | |
| Premiums received | 103 | | | 1 | | | 382 | | | — | | | — | |
| Policy charges (a) | (182) | | | — | | | (261) | | | — | | | — | |
| Surrenders and withdrawals | (2,005) | | | (1,142) | | | (90) | | | — | | | — | |
| Benefit payments | (526) | | | (240) | | | (27) | | | (53) | | | (763) | |
| | | | | | | | | |
| Interest credited | 270 | | | 405 | | | 76 | | | 54 | | | 64 | |
| Other | 16 | | | — | | | — | | | (1) | | | — | |
| Balance, end of year | 27,164 | | | 13,443 | | | 2,391 | | | 2,613 | | | 2,539 | |
| Embedded derivative adjustment (c) | 243 | | | — | | | 84 | | | — | | | — | |
| Gross liability, end of period | 27,407 | | | 13,443 | | | 2,475 | | | 2,613 | | | 2,539 | |
| Less: Reinsurance recoverable | 17 | | | 7,520 | | | 894 | | | — | | | — | |
| Net liability, after reinsurance recoverable | $ | 27,390 | | | $ | 5,923 | | | $ | 1,581 | | | $ | 2,613 | | | $ | 2,539 | |
| | | | | | | | | |
| Weighted-average crediting rate | 1.40 | % | | 4.85 | % | | 3.44 | % | | N/A | | N/A |
| Net amount at risk (d) | N/A | | N/A | | $ | 60,389 | | | N/A | | N/A |
| Cash surrender value (e) | $ | 25,099 | | | $ | 12,505 | | | $ | 1,872 | | | N/A | | N/A |
(a)Contracts included in the contractholder funds are generally charged a premium and/or monthly assessments on the basis of the account balance.
(b)FABN and FHLB are considered funding agreements that are investment contracts which follow the interest method of accounting, and therefore are not subject to ASU 2018-12 disclosure requirements. However, the Company has elected to present the liability for these agreements within the disaggregated roll forward as we believe it will provide meaningful information for users of the financials.
(c)The embedded derivative adjustment reconciles the account balance to the gross GAAP liability and represents the combination of the host contract and the fair value of the embedded derivatives.
(d)For those guarantees of benefits that are payable in the event of death, the net amount at risk is generally defined as the current guaranteed minimum death benefit in excess of the current account balance at the balance sheet date.
(e)These amounts are gross of reinsurance.
The following table reconciles contractholder funds’ account balances to the contractholder funds liability in the Consolidated Balance Sheets (in millions):
| | | | | | | | | | | | | |
| December 31, | | |
| 2024 | | 2023 | | |
| Indexed annuities | $ | 30,454 | | | $ | 27,407 | | | |
| Fixed rate annuities | 17,442 | | | 13,443 | | | |
| Immediate annuities | 286 | | | 311 | | | |
| Universal life | 2,896 | | | 2,475 | | | |
| Traditional life | 5 | | | 5 | | | |
| Funding Agreement-FABN | 2,463 | | | 2,613 | | | |
| FHLB | 2,852 | | | 2,539 | | | |
| PRT | 6 | | | 5 | | | |
| Total | $ | 56,404 | | | $ | 48,798 | | | |
Annually, typically in the third quarter, we review assumptions associated with reserves for policy benefits and product guarantees. During the third quarter of 2024 and for the year ended December 31, 2024, based on policyholder behavior, experience and interest rate movements, we reflected updates to surrender assumptions for recent and expected near term policyholder behavior, as well as updated certain indexed annuities assumptions used to calculate the fair value of the embedded derivative component within contractholder funds. These changes resulted in a decrease in total benefits and other changes in policy reserves of approximately $89 million for the year ended December 31, 2024.
During the third quarter of 2023 and for the year ended December 31, 2023, based on increases in interest rates and pricing changes, we updated certain indexed annuities assumptions used to calculate the fair value of the embedded derivative component within contractholder funds and also aligned reserves to actual policyholder
behavior. These changes resulted in an increase in total benefits and other changes in policy reserves of approximately $73 million for the year ended December 31, 2023.
The following tables present the account values by range of guaranteed minimum crediting rates and the related range of difference, in basis points, between rates being credited to policyholders and the respective guaranteed minimums (in millions):
| | | | | | | | | | | | | | | | | | | | | | | | | | | | | |
| December 31, 2024 |
| Range of guaranteed minimum crediting rate | At Guaranteed Minimum | | 1 Basis Point-50 Basis Points Above | | 51 Basis Points-150 Basis Points Above | | Greater Than 150 Basis Points Above | | Total |
| Indexed Annuities | | | | | | | | | |
| 0.00%-1.50% | $ | 23,540 | | | $ | 1,236 | | | $ | 492 | | | $ | 1,846 | | | $ | 27,114 | |
| 1.51%-2.50% | 875 | | | 1 | | | 684 | | | 1,242 | | | 2,802 | |
| Greater than 2.50% | 303 | | | 2 | | | — | | | 14 | | | 319 | |
| Total | $ | 24,718 | | | $ | 1,239 | | | $ | 1,176 | | | $ | 3,102 | | | $ | 30,235 | |
| | | | | | | | | |
| Fixed Rate Annuities | | | | | | | | | |
| 0.00%-1.50% | $ | 57 | | | $ | 20 | | | $ | 773 | | | $ | 14,407 | | | $ | 15,257 | |
| 1.51%-2.50% | 4 | | | 7 | | | 20 | | | 462 | | | 493 | |
| Greater than 2.50% | 804 | | | 2 | | | 5 | | | 881 | | | 1,692 | |
| Total | $ | 865 | | | $ | 29 | | | $ | 798 | | | $ | 15,750 | | | $ | 17,442 | |
| | | | | | | | | |
| Universal Life | | | | | | | | | |
| 0.00%-1.50% | $ | 2,421 | | | $ | 7 | | | $ | — | | | $ | 24 | | | $ | 2,452 | |
| 1.51%-2.50% | — | | | — | | | — | | | — | | | — | |
| Greater than 2.50% | 364 | | | — | | | 1 | | | — | | | 365 | |
| Total | $ | 2,785 | | | $ | 7 | | | $ | 1 | | | $ | 24 | | | $ | 2,817 | |
| | | | | | | | | | | | | | | | | | | | | | | | | | | | | |
| December 31, 2023 |
| Range of guaranteed minimum crediting rate | At Guaranteed Minimum | | 1 Basis Point-50 Basis Points Above | | 51 Basis Points-150 Basis Points Above | | Greater Than 150 Basis Points Above | | Total |
| Indexed Annuities | | | | | | | | | |
| 0.00%-1.50% | $ | 22,392 | | | $ | 1,444 | | | $ | 526 | | | $ | 1,953 | | | $ | 26,315 | |
| 1.51%-2.50% | 196 | | | 1 | | | 24 | | | 250 | | | 471 | |
| Greater than 2.50% | 377 | | | 1 | | | — | | | — | | | 378 | |
| Total | $ | 22,965 | | | $ | 1,446 | | | $ | 550 | | | $ | 2,203 | | | $ | 27,164 | |
| | | | | | | | | |
| Fixed Rate Annuities | | | | | | | | | |
| 0.00%-1.50% | $ | 23 | | | $ | 25 | | | $ | 1,532 | | | $ | 10,271 | | | $ | 11,851 | |
| 1.51%-2.50% | 5 | | | 8 | | | 23 | | | 453 | | | 489 | |
| Greater than 2.50% | 893 | | | 2 | | | 4 | | | 204 | | | 1,103 | |
| Total | $ | 921 | | | $ | 35 | | | $ | 1,559 | | | $ | 10,928 | | | $ | 13,443 | |
| | | | | | | | | |
| Universal Life | | | | | | | | | |
| 0.00%-1.50% | $ | 1,987 | | | $ | 5 | | | $ | — | | | $ | 21 | | | $ | 2,013 | |
| 1.51%-2.50% | — | | | — | | | — | | | — | | | — | |
| Greater than 2.50% | 361 | | | 16 | | | 1 | | | — | | | 378 | |
| Total | $ | 2,348 | | | $ | 21 | | | $ | 1 | | | $ | 21 | | | $ | 2,391 | |
Note J - Future Policy Benefits
The following table summarizes balances and changes in the present value of expected net premiums and the present value of the expected FPB for nonparticipating traditional contracts (in millions):
| | | | | | | | | | | | | |
| Traditional life |
| December 31, 2024 | | December 31, 2023 | | |
| Expected net premiums | | | | | |
| Balance, beginning of year | $ | 722 | | | $ | 797 | | | |
| Beginning balance at original discount rate | 874 | | | 974 | | | |
| | | | | |
| Effect of actual variances from expected experience | (4) | | | (1) | | | |
| Balance adjusted for variances from expectation | 870 | | | 973 | | | |
| | | | | |
| Interest accrual | 17 | | | 19 | | | |
| Net premiums collected | (107) | | | (118) | | | |
| | | | | |
| Ending Balance at original discount rate | 780 | | | 874 | | | |
| Effect of changes in discount rate assumptions | (149) | | | (152) | | | |
| Balance, end of year | $ | 631 | | | $ | 722 | | | |
| | | | | |
| Expected FPB | | | | | |
| Balance, beginning of year | $ | 2,071 | | | $ | 2,151 | | | |
| Beginning balance at original discount rate | 2,492 | | | 2,665 | | | |
| | | | | |
| Effect of actual variances from expected experience | 44 | | | (24) | | | |
| Balance adjusted for variances from expectation | 2,536 | | | 2,641 | | | |
| | | | | |
| Interest accrual | 54 | | | 56 | | | |
| Benefits payments | (222) | | | (205) | | | |
| | | | | |
| Ending Balance at original discount rate | 2,368 | | | 2,492 | | | |
| Effect of changes in discount rate assumptions | (435) | | | (421) | | | |
| Balance, end of year | $ | 1,933 | | | $ | 2,071 | | | |
| | | | | |
| Net liability for future policy benefits | $ | 1,302 | | | $ | 1,349 | | | |
| Less: Reinsurance recoverable | 513 | | | 413 | | | |
| Net liability for future policy benefits, after reinsurance recoverable | $ | 789 | | | $ | 936 | | | |
| | | | | |
| Weighted-average duration of liability for future policyholder benefits (years) | 6.28 | | 7.36 | | |
The following tables summarize balances and changes in the present value of the expected FPB for limited-payment contracts (in millions):
| | | | | | | | | | | | | |
| PRT |
| December 31, 2024 | | December 31, 2023 | | |
| Balance, beginning of year | $ | 4,189 | | | $ | 2,165 | | | |
| Beginning balance at original discount rate | 4,351 | | | 2,475 | | | |
| Effect of changes in cash flow assumptions | (3) | | | (9) | | | |
| Effect of actual variances from expected experience | (11) | | | (7) | | | |
| Balance adjusted for variances from expectation | 4,337 | | | 2,459 | | | |
| Issuances | 2,324 | | | 2,041 | | | |
| Interest accrual | 240 | | | 109 | | | |
| Benefits payments | (484) | | | (258) | | | |
| | | | | |
| Ending Balance at original discount rate | 6,417 | | | 4,351 | | | |
| Effect of changes in discount rate assumptions | (363) | | | (162) | | | |
| Balance, end of year | $ | 6,054 | | | $ | 4,189 | | | |
| | | | | |
| | | | | |
| | | | | |
| Net liability for future policy benefits, after reinsurance recoverable | $ | 6,054 | | | $ | 4,189 | | | |
| | | | | |
| Weighted-average duration of liability for future policyholder benefits (years) | 7.78 | | 8.23 | | |
| | | | | | | | | | | | | |
| Immediate annuities |
| December 31, 2024 | | December 31, 2023 | | |
| Balance, beginning of year | $ | 1,415 | | | $ | 1,429 | | | |
| Beginning balance at original discount rate | 1,788 | | | 1,858 | | | |
| Effect of changes in cash flow assumptions | — | | | — | | | |
| Effect of actual variances from expected experience | (27) | | | (15) | | | |
| Balance adjusted for variances from expectation | 1,761 | | | 1,843 | | | |
| Issuances | 30 | | | 22 | | | |
| Interest accrual | 59 | | | 51 | | | |
| Benefits payments | (118) | | | (128) | | | |
| | | | | |
| Ending Balance at original discount rate | 1,732 | | | $ | 1,788 | | | |
| Effect of changes in discount rate assumptions | (435) | | | (373) | | | |
| Balance, end of year | $ | 1,297 | | | $ | 1,415 | | | |
| | | | | |
| Net liability for future policy benefits | $ | 1,297 | | | $ | 1,415 | | | |
| Less: Reinsurance recoverable | 109 | | | 116 | | | |
| Net liability for future policy benefits, after reinsurance recoverable | $ | 1,188 | | | $ | 1,299 | | | |
| | | | | |
| Weighted-average duration of liability for future policyholder benefits (years) | 12.63 | | 12.47 | | |
The following tables summarize balances and changes in the liability for DPL for limited-payment contracts (in millions):
| | | | | | | | | | | | | | | | | | | | | | | | | | | |
| December 31, 2024 | | December 31, 2023 | | |
| Immediate annuities | | PRT | | Immediate annuities | | PRT | | | | |
| Balance, beginning of year | $ | 87 | | | $ | 10 | | | $ | 69 | | | $ | 4 | | | | | |
| Effect of modeling changes | — | | | — | | | 4 | | | — | | | | | |
| Effect of changes in cash flow assumptions | — | | | (8) | | | — | | | 1 | | | | | |
| Effect of actual variances from expected experience | 8 | | | — | | | 16 | | | 5 | | | | | |
| Balance adjusted for variances from expectation | 95 | | | 2 | | | 89 | | | 10 | | | | | |
| Issuances | 3 | | | 1 | | | 3 | | | — | | | | | |
| Interest accrual | 1 | | | 4 | | | 2 | | | 1 | | | | | |
| Amortization | (9) | | | (1) | | | (7) | | | (1) | | | | | |
| Balance, end of year | $ | 90 | | | $ | 6 | | | $ | 87 | | | $ | 10 | | | | | |
The following table reconciles the net FPB to the FPB in the Consolidated Balance Sheets (in millions). The DPL for Immediate Annuities and PRT is presented together with the FPB in the Consolidated Balance Sheets and has been included as a reconciling item in the table below:
| | | | | | | | | | | | | |
| December 31, | | |
| 2024 | | 2023 | | |
| Traditional life | $ | 1,302 | | | $ | 1,349 | | | |
| Immediate annuities | 1,297 | | | 1,415 | | | |
| PRT | 6,054 | | | 4,189 | | | |
| Immediate annuities DPL | 90 | | | 87 | | | |
| PRT DPL | 6 | | | 10 | | | |
| Total | $ | 8,749 | | | $ | 7,050 | | | |
The following table provides the amount of undiscounted and discounted expected gross premiums and expected future benefits and expenses for nonparticipating traditional and limited-payment contracts (in millions):
| | | | | | | | | | | | | | | | | | | | | | | |
| Undiscounted | | Discounted |
| December 31, 2024 | | December 31, 2023 | | December 31, 2024 | | December 31, 2023 |
| Traditional life | | | | | | | |
| Expected future benefit payments | $ | 2,705 | | | $ | 2,935 | | | $ | 1,948 | | | $ | 2,075 | |
| Expected future gross premiums | 914 | | | 1,082 | | | 681 | | | 789 | |
| Immediate annuities | | | | | | | |
| Expected future benefit payments | $ | 3,189 | | | $ | 3,291 | | | $ | 1,297 | | | $ | 1,413 | |
| Expected future gross premiums | — | | | — | | | — | | | — | |
| PRT | | | | | | | |
| Expected future benefit payments | $ | 10,038 | | | $ | 6,709 | | | $ | 6,054 | | | $ | 4,350 | |
| Expected future gross premiums | — | | | — | | | — | | | — | |
The following table summarizes the amount of revenue and interest related to nonparticipating traditional and limited-payment contracts recognized in the Consolidated Statements of Operations (in millions):
| | | | | | | | | | | | | | | | | | | | | | | | | | | | | | | | | | | |
| Gross Premiums (a) | | Interest Expense (b) |
| December 31, | | December 31, |
| 2024 | | 2023 | | 2022 | | 2024 | | 2023 | | 2022 |
| Traditional life | $ | 111 | | | $ | 123 | | | $ | 137 | | | $ | 37 | | | $ | 37 | | | $ | 39 | |
| Immediate annuities | 18 | | | 24 | | | 23 | | | 59 | | | 51 | | | 60 | |
| PRT | 2,217 | | | 1,964 | | | 1,362 | | | 240 | | | 109 | | | 50 | |
| Total | $ | 2,346 | | | $ | 2,111 | | | $ | 1,522 | | | $ | 336 | | | $ | 197 | | | $ | 149 | |
(a)Included in Life insurance premiums and other fees on the Consolidated Statements of Operations.
(b)Included in Benefits and other changes in policy reserves (remeasurement gains (losses) (a)) on the Consolidated Statements of Operations.
The following table presents the weighted-average interest rate:
| | | | | | | | | | | | | | | | | |
| December 31, |
| 2024 | | 2023 | | 2022 |
| Traditional life | | | | | |
| Interest accretion rate | 2.34 | % | | 2.33 | % | | 2.32 | % |
| Current discount rate | 5.44 | % | | 5.03 | % | | 5.37 | % |
| Immediate annuities | | | | | |
| Interest accretion rate | 3.17 | % | | 3.14 | % | | 3.07 | % |
| Current discount rate | 5.45 | % | | 4.98 | % | | 5.21 | % |
| PRT | | | | | |
| Interest accretion rate | 4.72 | % | | 4.61 | % | | 3.20 | % |
| Current discount rate | 5.54 | % | | 5.03 | % | | 5.40 | % |
The following tables summarize the actual experience and expected experience for mortality and lapses of the FPB:
| | | | | | | | | | | | | | | | | |
| December 31, 2024 |
| Traditional life | | Immediate annuities | | PRT |
| Mortality | | | | | |
| Actual experience | 1.4 | % | | 2.7 | % | | 2.7 | % |
| Expected experience | 1.5 | % | | 1.9 | % | | 2.5 | % |
| Lapses | | | | | |
| Actual experience | 0.1 | % | | — | % | | — | % |
| Expected experience | 0.5 | % | | — | % | | — | % |
| | | | | | | | | | | | | | | | | |
| December 31, 2023 |
| Traditional life | | Immediate annuities | | PRT |
| Mortality | | | | | |
| Actual experience | 1.7 | % | | 3.2 | % | | 3.2 | % |
| Expected experience | 1.4 | % | | 1.8 | % | | 2.3 | % |
| Lapses | | | | | |
| Actual experience | — | % | | — | % | | — | % |
| Expected experience | 0.3 | % | | — | % | | — | % |
| | | | | | | | | | | | | | | | | |
| | | | | |
| December 31, 2022 |
| Traditional life | | Immediate annuities | | PRT |
| Mortality | | | | | |
| Actual experience | 1.5 | % | | 3.0 | % | | 1.9 | % |
| Expected experience | 1.3 | % | | 1.9 | % | | 2.5 | % |
| Lapses | | | | | |
| Actual experience | — | % | | — | % | | — | % |
| Expected experience | 0.3 | % | | — | % | | — | % |
The following table provides additional information for periods in which a cohort has a net premium ratio (“NPR”) greater than 100% (and therefore capped at 100%) (dollars in millions):
| | | | | | | | | | | | | | | |
| | | December 31, 2024 |
| | | | | Cohort X | | Description |
| NPR before capping | | | | | 108 | % | | Term with return of premium Non-NY Cohort |
| Reserves before NPR capping | | | | | $ | 1,147 | | | Term with return of premium Non-NY Cohort |
| Reserves after NPR capping | | | | | 1,174 | | | Term with return of premium Non-NY Cohort |
| Loss Expense | | | | | 27 | | | Term with return of premium Non-NY Cohort |
F&G realized actual-to-expected experience variances and made changes to assumptions during the years ended December 31, 2024 and 2023 as follows:
Traditional life
The traditional life line of business primarily consists of policies that were sold prior to 2010. As this line of business continues to age, benefit payments made from these contracts will be the primary driver of the emergence of reserves, decreasing the reserve balance.
Significant assumption inputs to the calculation of the FPB for traditional life include mortality, lapses (including lapses due to nonpayment of premium and surrenders for cash surrender value), and discount rates (both accretion and current). We review the cash flow assumptions annually, typically in the third quarter. In 2024, F&G made an adjustment to the calculation to reflect additional actuarial precision, unrelated to the assumptions, driving an increase to the FPB liability. In 2023, F&G undertook a review of all significant assumptions and revised the lapse assumption, resulting in a slight decrease to the FPB. There have been no other significant changes.
Market data that underlies current discount rates was updated in 2024 from that utilized in 2023 resulting in increased discount rates that drove a decrease to the FPB. Market data that underlies current discount rates was updated in 2023 from that utilized in 2022, resulting in decreased discount rates that drove a material increase to the FPB.
Immediate annuities (life contingent)
Significant assumption inputs to the calculation of the FPB for immediate annuities (life contingent) include mortality and discount rates (both accretion and current). We review the cash flow assumptions annually, typically in the third quarter. In 2024 and 2023, F&G undertook a review of the significant cash flow assumptions and did not make any changes to mortality. Market data that underlies current discount rates was updated in 2024 from that utilized in 2023 resulting in increased discount rates that drove a decrease to the FPB. Market data that underlies current discount rates was updated in 2023 from that utilized in 2022, resulting in decreased discount rates that drove a material increase to the FPB.
PRT (life contingent)
The PRT line of business has issued a significant volume of contracts for both 2024 and 2023, which is the primary impact in increasing the reserve balance in each of those periods.
Significant assumption inputs to the calculation of the FPB for PRT (life contingent) include mortality and discount rates (both accretion and current). Additionally, for PRT contracts with deferred payment streams, retirement age and elected payment form are significant assumptions. We review the cash flow assumptions annually, typically in the third quarter. In 2024 and 2023, F&G undertook a review of the significant cash flow assumptions and did not make any changes to mortality. Market data that underlies current discount rates was updated in 2024 from that utilized in 2023 resulting in increased discount rates that drove a decrease to the FPB. Market data that underlies current discount rates was updated in 2023 from that utilized in 2022, resulting in decreased discount rates that drove a material increase to the FPB.
Premium deficiency testing
F&G conducts annual premium deficiency testing for its long-duration contracts except for the FPB for nonparticipating traditional and limited-payment contracts. F&G also conducts annual premium deficiency testing for the VOBA of all long-duration contracts. Premium deficiency testing is performed by reviewing assumptions used to calculate the insurance liabilities and determining whether the sum of the existing contract liabilities and the present value of future gross premiums is sufficient to cover the present value of future benefits to be paid to or on behalf of policyholders and settlement costs and recover unamortized present value of future profits. Anticipated investment income, based on F&G’s experience, is considered when performing premium deficiency testing for long-duration contracts. During 2024, F&G did not pass premium deficiency testing for the traditional life block of business, related to the recoverability of VOBA. Due to that result, F&G began accruing a liability in the fourth quarter of 2024 that increases the amortization of traditional life VOBA. The liability balance was immaterial at December 31, 2024. During 2023, F&G was not required to establish any additional liabilities as a result of premium deficiency testing.
Note K - Accounts Payable and Accrued Liabilities
As of December 31, 2024 and 2023, the total URL balance of $401 million and $270 million, respectively, is included in Accounts payable and accrued liabilities on the Consolidated Balance Sheets. The following table presents a reconciliation of Accounts payable and accrued liabilities to the Consolidated Balance Sheets as of December 31, 2024 and 2023 (in millions):
| | | | | | | | | | | |
| December 31, |
| 2024 | | 2023 |
| Salaries and incentives | $ | 116 | | | $ | 99 | |
| Accrued benefits | 67 | | | 60 | |
| URL | 401 | | | 270 | |
| Trade accounts payable | 147 | | | 297 | |
| Liability for policy and contract claims | 102 | | | 92 | |
| Retained asset account | 60 | | | 81 | |
| Remittances and items not allocated | 224 | | | 284 | |
| Option collateral liabilities | 679 | | | 588 | |
| Lease liability | 10 | | | 11 | |
| Investment purchases payable | 100 | | | 21 | |
| Contingent consideration | 74 | | | — | |
| Accrued interest on notes payable | 31 | | | 23 | |
| Interest rate swaps | 10 | | | — | |
| Other accrued liabilities | 198 | | | 185 | |
| Accounts payable and accrued liabilities | $ | 2,219 | | | $ | 2,011 | |
The following tables roll forward URL for our universal life product for the years ended December 31, 2024 and 2023 (in millions):
| | | | | | | | | | | | | | | | | |
| December 31, | | | | | | |
| 2024 | | 2023 | | | | | | |
| Balance at January 1, | $ | 270 | | | $ | 166 | | | | | | | |
| Capitalization | 151 | | | 119 | | | | | | | |
| Amortization | (20) | | | (15) | | | | | | | |
| Balance at December 31, | $ | 401 | | | $ | 270 | | | | | | | |
| | | | | | | | | |
| | | | | | | | | |
| | | | | | | | | |
| | | | | | | | | |
| | | | | | | | | |
| | | | | | | | | |
| | | | | | | | | |
| | | | | | | | | |
| | | | | | | | | |
| | | | | | | | | |
| | | | | | | | | |
| | | | | | | | | |
| | | | | | | | | |
| | | | | | | | | |
| | | | | | | | | |
| | | | | | | | | |
| | | | | | | | | |
| | | | | | | | | |
| | | | | | | | | |
For IUL the cash flow assumptions used to amortize URL reflect the Company’s best estimates for policyholder behavior. We review cash flow assumptions annually, generally in the third quarter. In 2024, F&G undertook a review of all significant assumptions, resulting in a revision to the IUL assumptions involving premium persistency and mortality improvement. In 2023, F&G undertook a review of all significant assumptions, resulting in revisions to IUL assumptions involving surrender rates, partial withdrawal rates, mortality improvement, premium persistency, and option budgets.
Note L - Notes Payable
Notes payable consists of the following (dollars in millions):
| | | | | | | | | | | |
| December 31, |
| 2024 | | 2023 |
| |
| 6.250% F&G Notes, net of $8 and $0 of deferred issuance costs at December 31, 2024 and 2023, respectively | $ | 492 | | | $ | — | |
| 6.50% F&G Notes, net of $5 and $0 of deferred issuance costs at December 31, 2024 and 2023, respectively | 545 | | | — | |
| 7.95% F&G Notes, net of $9 and $9 of deferred issuance costs at December 31, 2024 and 2023, respectively | 336 | | | 336 | |
| 7.40% F&G Notes, net of $3 and $5 of deferred issuance costs at December 31, 2024 and 2023, respectively | 497 | | | 495 | |
| 5.50% F&G Notes, net of $1 and $11 of purchase premium at December 31, 2024 and 2023, respectively | 301 | | | 561 | |
| Revolving Credit Facility - Short-term, net of deferred issuance costs of $0 and $3 at December 31, 2024 and 2023, respectively | — | | | 362 | |
| Total | $ | 2,171 | | | $ | 1,754 | |
6.250% F&G Notes - On October 4, 2024, F&G completed its public offering of $500 million aggregate principal amount of its 6.250% Senior Notes due 2034. The 6.250% F&G Notes were issued at 99.36% of face value net of deferred issuance costs of approximately $8 million. The 6.250% F&G Notes are guaranteed on an unsecured, unsubordinated basis by each of F&G’s subsidiaries that are guarantors of F&G’s obligations under its existing credit agreement. The 6.250% F&G Notes mature on October 4, 2034, and become callable on July 4, 2034. Interest is payable semi-annually at a fixed rate of 6.250%, and if the 6.250% F&G Notes are downgraded, the interest rate payable is subject to adjustment from time to time per the terms of the indenture. A portion of the net proceeds were used to pay off the outstanding balance of $365 million on the Company’s revolving credit facility described below. F&G intends to use the remaining net proceeds of this offering for general corporate purposes, including the support of organic growth opportunities.
6.50% F&G Senior Notes - On June 4, 2024, F&G completed its public offering of $550 million aggregate principal amount of its 6.50% Senior Notes due 2029. The 6.50% F&G Notes were issued at 99.74% of face value net of deferred issuance costs of approximately $6 million. The 6.50% F&G Notes are guaranteed on an unsecured, unsubordinated basis by each of F&G’s subsidiaries that are guarantors of F&G’s obligations under its existing credit agreement. The 6.50% F&G Notes mature on June 4, 2029, and become callable on May 4, 2029. Interest is payable semi-annually at a fixed rate of 6.50%, and, if the 6.50% F&G Notes are downgraded, the interest rate payable is subject to adjustment from time to time per the terms of the indenture. F&G used a portion of the net proceeds from the 6.50% F&G Notes offering to repay an aggregate principal amount of $250 million of the 5.50% F&G Notes described below and intends to use the remaining net proceeds of this offering for general corporate purposes, which may include the repurchase, redemption or repayment at maturity of outstanding indebtedness.
7.95% F&G Notes - On December 6, 2023, F&G issued $345 million of its 7.95% Senior Notes due 2053 (the
“7.95% F&G Notes”). The 7.95% F&G Notes were issued at par, net of deferred issuance costs of approximately $9 million. The 7.95% F&G Notes are senior unsecured, unsubordinated obligations of F&G and are guaranteed by each of F&G’s subsidiaries that are guarantors of F&G’s obligations under its existing credit agreement. The 7.95% F&G Notes mature on December 15, 2053, and become callable on or after December 15, 2028. Interest is payable quarterly at a fixed rate of 7.95%, and, if the 7.95% F&G Notes are downgraded, the interest rate payable is subject to adjustment from time to time per the terms of the indenture.
7.40% F&G Notes - On January 13, 2023, F&G issued $500 million of its 7.40% F&G Notes due 2028 (the “7.40% F&G Notes”). The 7.40% F&G Notes were issued at par, net of deferred issuance costs of approximately $6 million. The 7.40% F&G Notes are senior, unsecured unsubordinated obligations of F&G and are fully and unconditionally guaranteed on an unsecured, unsubordinated basis by each of F&G’s subsidiaries that are guarantors of F&G’s obligations under its existing credit agreement. The 7.40% F&G Notes mature on January 13, 2028, and become callable on or after December 13, 2027. Interest is payable semi-annually at a fixed rate of 7.40%, and if, the 7.40% F&G Notes are downgraded, the interest rate payable is subject to adjustment from time to time per the terms of the indenture.
5.50% F&G Notes - On April 20, 2018, FGLH, our indirect wholly owned subsidiary, completed a debt offering of $550 million aggregate principal amount of 5.50% senior notes due May 1, 2025 at 99.5% of face value for proceeds of $547 million. As a result of the FNF acquisition, a premium of $39 million was established for these notes and is being amortized over the remaining life of the debt through 2025. In conjunction with the acquisition, FNF became a guarantor of FGLH’s obligations under the 5.50% F&G Notes and agreed to fully and unconditionally guarantee the 5.50% F&G Notes, on a joint and several basis. A portion of the net proceeds of the 6.50% F&G Notes were used for a $250 million cash tender offer of the 5.50% F&G Notes in June 2024.
Refer to Note A - Business and Summary of Significant Accounting Policies for a discussion of the redemption of the 5.50% F&G Notes on February 1, 2025.
Revolving Credit Facility - On November 22, 2022, we entered into a Credit Agreement with certain lenders (the “Lenders”) and Bank of America, N.A. as administrative agent, swing line lender and an issuing bank, pursuant to which the Lenders have made available an unsecured revolving credit facility in an aggregate principal amount of $550 million to be used for working capital and general corporate purposes. On February 21, 2023, we entered into an amendment with the Lenders to increase the available aggregate principal amount of the Credit Agreement by $115 million to $665 million. On February 16, 2024, we entered into an amendment with the Lenders to increase the available aggregate principal amount of the Credit Agreement by $85 million to $750 million, and the maturity date of the Credit Agreement was extended from November 22, 2025 to November 22, 2027. Pricing and advance rates remain unchanged. Financial covenants also remained essentially the same.
Revolving loans under the Credit Agreement generally bear interest at a variable rate based on either (i) the base rate (which is the highest of (a) one-half of one percent in excess of the federal funds rate, (b) the Administrative Agent’s “prime rate,” or (c) the sum of one percent plus Term The Secured Overnight Financing Rate (“SOFR”) plus a margin of between 30.0 and 80.0 basis points depending on the non-credit-enhanced, senior unsecured long-term debt ratings of F&G or (ii) Term SOFR plus a margin of between 130.0 and 180.0 basis points depending on the non-credit-enhanced, senior unsecured long-term debt ratings of F&G. In addition, we pay a facility fee of between 20.0 and 45.0 basis points on the entire facility, also depending on the non-credit-enhanced, senior unsecured long-term debt ratings, which is payable quarterly in arrears. The average variable interest rate on the revolving credit facility for the period the debt was outstanding in 2024 was 7.06% compared to 7.11% for the year ended December 31, 2023.
F&G used a portion of the net proceeds from the 6.250% F&G Notes offering to pay off the revolving credit facility in October 2024. As of December 31, 2024, no balance was outstanding on the revolving credit facility, and we had $750 million of remaining borrowing availability.
FNF Credit Facility - On December 29, 2020, we entered into a revolving note agreement with FNF for up to $200 million capacity (the "FNF Credit Facility") to be used for working capital and other general corporate
purposes. No amounts were outstanding under this revolving note agreement as of December 31, 2024 or December 31, 2023. The FNF Credit Facility matures on October 29, 2025 or when the Revolving Credit Facility described above is terminated, whichever occurs first.
Refer to Note A - Business and Summary of Significant Accounting Policies for a discussion related to the public offering of its $375 million aggregate principal amount of the 7.300% F&G Junior Subordinated Notes completed on January 13, 2025.
Covenants - The Credit Agreement imposes and the indentures governing the 6.250% F&G Notes, 6.50% F&G Senior Notes, 7.95% F&G Notes, the 7.40% F&G Notes and the 5.50% F&G Notes impose certain operating and financial restrictions on F&G. The Credit Agreement imposes certain financial covenants on F&G, and as of December 31, 2024, we were in compliance with all covenants.
Interest Expense - Amortization of deferred issuance costs and purchase premiums are recognized as a component of interest expense. Interest expense on F&G’s outstanding notes payable for the years ended December 31, 2024, 2023 and 2022 was as follows (in millions):
| | | | | | | | | | | | | | | | | |
| Year ended December 31, |
| 2024 | | 2023 | | 2022 |
| 6.250% F&G Notes | $ | 8 | | | $ | — | | | $ | — | |
| 6.50% F&G Notes | 21 | | | — | | | — | |
| 7.95% F&G Notes | 28 | | | 1 | | | — | |
| 7.40% F&G Notes | 38 | | | 37 | | | — | |
| 5.50% F&G Notes | 14 | | | 22 | | | 22 | |
| Revolving Credit Facility | 23 | | | 37 | | | 1 | |
| FNF Promissory Note (a) | — | | | — | | | 6 | |
| Total | $ | 132 | | | $ | 97 | | | $ | 29 | |
(a)In June 2022, the $400 million FNF Promissory Note was exchanged for F&G common stock, and the note was retired.
Maturities - Gross principal maturities of notes payable at December 31, 2024 are as follows (in millions):
| | | | | |
| |
| 2025 | $ | 300 | |
| 2026 | — | |
| 2027 | — | |
| 2028 | 500 | |
| 2029 | 550 | |
| Thereafter | 845 | |
| Total | $ | 2,195 | |
Note M - Supplemental Cash Flow Information
The following supplemental cash flow information is provided with respect to certain cash payment and non-cash investing and financing activities (in millions).
| | | | | | | | | | | | | | | | | |
| | Year ended December 31, |
| 2024 | | 2023 | | 2022 |
| | | | | |
| Cash paid (refunded) for: | | | | | |
| Interest paid | $ | 127 | | | $ | 84 | | | $ | 34 | |
| Income taxes paid (refunded) | 8 | | | 4 | | | (72) | |
| Deferred sales inducements | 319 | | | 168 | | | 87 | |
| Non-cash investing and financing activities: | | | | | |
| Investments received from pension risk transfer premiums | $ | 129 | | | $ | 464 | | | $ | — | |
| Change in proceeds of sales of investments available for sale receivable in period | (79) | | | 34 | | | 115 | |
| Change in purchases of investments available for sale payable in period | 84 | | | 20 | | | (10) | |
Refer to Note P -Acquisitions for information on the acquisitions of Roar and PALH including the assets acquired and liabilities and non-controlling interest assumed as of the respective acquisition dates.
Note N - Commitments and Contingencies
Contingent Consideration
Under the terms of the purchase agreement for Roar, we have agreed to make cash payments of up to approximately $90 million over a three-year period upon the achievement by Roar of certain EBITDA milestones. The contingent consideration is recorded at fair value in Accounts payable and accrued liabilities on the Consolidated Balance Sheets. Refer to Note P - Acquisitions for more information on the Roar acquisition and refer to Note B - Fair Value of Financial Instruments for more information regarding the fair value of the contingent consideration.
Legal and Regulatory Contingencies
In the ordinary course of business, we are involved in various pending and threatened litigation matters related to our operations, some of which include claims for punitive or exemplary damages. Like other companies, our ordinary course litigation includes a number of class action and purported class action lawsuits, which make allegations related to aspects of our operations. We believe that no actions, other than the matters discussed below, if any, depart from customary litigation incidental to our business.
We review lawsuits and other legal and regulatory matters (collectively “legal proceedings”) on an ongoing basis when making accrual and disclosure decisions. When assessing reasonably possible and probable outcomes, management bases its decision on its assessment of the ultimate outcome assuming all appeals have been exhausted. For legal proceedings in which it has been determined that a loss is both probable and reasonably estimable, a liability based on known facts and that represents our best estimate has been recorded. Our accrual for legal and regulatory matters was insignificant as of December 31, 2024 and 2023. We do not consider (i) the amounts we have currently recorded for all legal proceedings in which it has been determined that a loss is both probable and reasonably estimable and (ii) reasonably possible losses for all pending legal proceedings to be material to our financial statements either individually or in the aggregate. Actual losses may materially differ from the amounts recorded and the ultimate outcome of our pending legal proceedings is generally not yet determinable. While some of these matters could be material to our operating results or cash flows for any particular period if an unfavorable outcome results, at present we do not believe that the ultimate resolution of currently pending legal proceedings, either individually or in the aggregate, will have a material adverse effect on our financial condition.
Fidelity & Guaranty Life Insurance Company (“FGL Insurance”) is a defendant in a lawsuit filed in U.S. District Court for the Southern District of Texas styled, Insurance Distribution Consulting, LLC v. Fidelity & Guaranty Life Insurance Company, Case No. 3:23-cv-00126. Plaintiff, which provides consulting services to independent marketing organizations (“IMO”), alleges FGL Insurance failed to pay commissions owed to Plaintiff and diverted commissions from one of Plaintiff’s IMO customers, Syncis, to another IMO, Freedom Equity Group, LLC (“Freedom Equity”). Further, Plaintiff alleges after FGL Insurance purportedly purchased a partial ownership interest in Syncis and Freedom Equity, Plaintiff offered to sell its interests in its contracts with Syncis but FGL Insurance declined, leading Plaintiff to allege a statutory violation of 42 U.S.C. §1981 for discrimination where Plaintiff’s sole member is a racial minority. Plaintiff claims its damages for breach of contract from FGL Insurance’s purported failure to pay commissions are more than $162 million and its damages from FGL Insurance’s declining to purchase Plaintiff’s interest in its contracts with Syncis are over $11 million. FGL Insurance denies the allegations and denies any contract or agreement existed with Plaintiff to pay commissions. Dispositive motions are due April 21, 2025, and the case is expected to be set for trial in the summer of 2025. FGL Insurance will vigorously contest the Plaintiff’s claims in the action. As this case continues to evolve, it is not possible to reasonably estimate the probability that Plaintiff will ultimately prevail on its claims or that FGL Insurance will be held liable for the dispute. At this time, FGL Insurance does not believe the lawsuit will have a material impact on its business, operations, or financial results.
On May 28, 2024, a stockholder derivative lawsuit styled, Roofers Local 149 Pension Fund v. Fidelity National Financial Inc., William P. Foley, F&G Annuities & Life Inc., C.A. No. 2024-0562-LWW, was filed in the Chancery Court of the State of Delaware against defendants FNF, in its capacity as F&G’s controlling stockholder, and William P. Foley, Executive Chairman of F&G and Chairman of FNF, alleging breach of fiduciary duty related to F&G’s January 11, 2024 sale of $250 million of 6.875% Series A Mandatory Convertible Preferred Stock to FNF. Plaintiff alleges that, based upon the unfair process and unfair price, the preferred stock investment was advantageous to FNF and unfair to F&G. Plaintiff seeks to recover damages on behalf of F&G for the alleged unfair preferred stock investment and the adoption of certain corporate governance measures. On July 24, 2024, F&G filed its answer to plaintiff’s complaint, and the remaining defendants filed their motion to dismiss. On September 23, 2024, plaintiff voluntarily dismissed its action against William P. Foley, leaving FNF’s motion to dismiss pending with briefing completed on October 24, 2024. On February 4, 2025, FNF argued the motion to dismiss before the court. The defendants will vigorously contest the plaintiff’s claims in the action.
F&G is a defendant in two putative class action lawsuits that allege some customers’ personally identifiable information was disclosed due to a vulnerability in the MOVEit file transfer software. F&G’s vendor, Pension Benefit Information, LLC (“PBI”), used the MOVEit software in the course of providing audit and address research services to F&G and many other corporate customers. Miller v. F&G, No. 4:23-cv-00326 (“Miller”), was filed against F&G in the Southern District of Iowa on August 31, 2023. Miller alleges that he is a F&G customer whose personally identifiable information was disclosed in the MOVEit incident and brings common law tort and implied contract claims. Plaintiff seeks injunctive relief and damages. Cooper v. Progress Software Corp., No. 1:23-cv-12067 (“Cooper”), was filed against F&G and five other defendants in the District of Massachusetts on September 7, 2023. Cooper also alleges that he is a F&G customer whose personally identifiable information was disclosed and brings similar common law tort claims and alleges claims as a purported third-party beneficiary of an alleged contract. Plaintiff seeks declaratory and injunctive relief and damages.
Well over 150 similar lawsuits have been filed against other entities impacted by the MOVEit incident including a number of such lawsuits related to PBI’s use of MOVEit. On October 4, 2023, the U.S. Judicial Panel on Multidistrict Litigation created a multidistrict litigation (“MDL”) pursuant to 28 U.S.C. § 1407 to handle all litigation brought by individuals whose information was potentially compromised in connection with the alleged MOVEit vulnerability. Both Miller and Cooper have been transferred to the MDL and are proceeding under MDL Case No. 1:23-md-03083-ADB-PGL. Plaintiffs filed amendments to their complaints, and the Defendants filed their omnibus motion to dismiss for lack of Article III standing on July 23, 2024. The case is proceeding under a modified bellwether structure to decide critical issues and facilitate reciprocal discovery. At this time, F&G does not believe the incident will have a material impact on its business, operations, or financial results.
From time to time, we receive inquiries and requests for information from state insurance departments, attorneys general and other regulatory agencies about various matters relating to our business. Sometimes these take the form of civil investigative demands or subpoenas. We cooperate with all such inquiries, and we have responded to or are currently responding to inquiries from multiple governmental agencies. From time to time, we are assessed fines for violations of regulations or other matters or enter into settlements with such authorities, which may require us to pay fines or claims or take other actions. We do not anticipate such fines and settlements, either individually or in the aggregate, will have a material adverse effect on our business, operations or financial condition.
Commitments
We have unfunded commitments as of December 31, 2024 based upon the timing of when investments and agreements are executed or signed compared to when the actual investments and agreements are funded or closed. Some investments require that funding occur over a period of months or years. A summary of unfunded commitments by commitment type as of December 31, 2024 is included below (in millions):
| | | | | | | |
| December 31, 2024 | | |
| Commitment Type | | | |
| Unconsolidated VIEs: | | | |
| Limited partnerships | $ | 1,138 | | | |
| Whole loans | 278 | | | |
| Fixed maturity securities, ABS | 338 | | | |
| Direct Lending | 1,618 | | | |
| Other fixed maturity securities, AFS | 70 | | | |
| Commercial mortgage loans | 116 | | | |
| Residential mortgage loans | 35 | | | |
| Other assets | 162 | | | |
| Other invested assets | 134 | | | |
| | | |
Total | $ | 3,889 | | | |
Concurrent with the Roar purchase agreement, we executed a separate loan agreement with the sellers of Roar for us to lend up to $40 million. The loan matures on August 5, 2027. The principal balance outstanding as of December 31, 2024 was $11 million and is included in Prepaid expenses and other assets on the Consolidated Balance Sheets. Changes in fair value are reported within Recognized gains and losses, net in the Consolidated Statements of Operations. Interest income is recorded in Interest and investment income in the Consolidated Statements of Operations and recognized when earned. The remainder of the unfunded loan commitment is included in the unfunded commitments table above in the “Other assets” line item. Refer to Note P - Acquisitions for more information on the Roar acquisition, and refer to Note B - Fair Value of Financial Instruments for information regarding the fair value calculation of this loan receivable.
See Note A - Business and Summary of Significant Accounting Policies, for discussion of funding agreements that have been issued pursuant to the FABN Program as well as to the FHLB that are included in Contractholder funds.
The Company leases office space under operating leases. The largest leases expire in 2030. Rent expense and minimum rental commitments under all leases are immaterial.
F&G has a reinsurance agreement with Kubera to cede certain FIA statutory reserves on a coinsurance funds withheld basis, net of applicable existing reinsurance. To enhance Kubera's ability to pay its obligations under the amended reinsurance agreement, effective October 31, 2021, F&G entered into a Variable Note Purchase Agreement (the “NPA”), whereby F&G agreed to fund a note to Kubera to be used to ultimately settle with F&G, with principal increases up to a maximum amount of $300 million, to the extent a potential funding shortfall (treaty assets are less than the total funding requirement) is projected relative to the business ceded to Kubera from F&G as part of the amended reinsurance agreement. The potential funding shortfall will be determined quarterly and, among other items, is impacted by the market value of the assets in the funds withheld account related to the reinsurance agreement and Kubera's capital as calculated on a Bermuda regulatory basis. The NPA matures on November 30, 2071. Based on the current level of the treaty assets and projections that these policies will be profitable over the lifetime of the agreement, we do not expect significant fundings to occur under the NPA. As of December 31, 2024 and 2023, the amount funded under the NPA was insignificant.
Note O - Insurance Subsidiary Financial Information and Regulatory Matters
Our U.S. insurance subsidiaries, FGL Insurance, FGL NY Insurance, Raven Re and Corbeau Re file financial statements with state insurance regulatory authorities and, except for Raven Re, with the National Association of Insurance Commissioners (“NAIC”) that are prepared in accordance with Statutory Accounting Principles (“SAP”) prescribed or permitted by such authorities, which may vary materially from GAAP. Prescribed SAP includes the Accounting Practices and Procedures Manual of the NAIC as well as state laws, regulations and administrative rules. Permitted SAP encompasses all accounting practices not so prescribed but approved by state regulators. The principal differences between SAP financial statements and financial statements prepared in accordance with GAAP are that SAP financial statements do not reflect VOBA, DAC, and DSI, some bond portfolios may be carried at amortized cost, assets and liabilities are presented net of reinsurance, contractholder liabilities are generally valued using more conservative assumptions and certain assets are non-admitted. Accordingly, SAP operating results and SAP capital and surplus may differ substantially from amounts reported in the GAAP basis financial statements for comparable items.
Our non-U.S. insurance subsidiaries, F&G Life Re (Bermuda) and F&G Cayman Re (Cayman Islands) file financial statements with their respective regulators.
U.S. Companies
Our principal insurance subsidiaries' statutory financial statements are based on a December 31 year end. Statutory net income and statutory capital and surplus of our wholly owned U.S. regulated insurance subsidiaries were as follows (in millions):
| | | | | | | | | | | | | | | | | | | | | | | |
| Subsidiary (state of domicile) (a) |
| FGL Insurance (IA) | | FGL NY Insurance (NY) | | Raven Re (VT) | | Corbeau Re (VT) |
| Statutory Net income (loss): | | | | | | | |
| Year ended December 31, 2024 | $ | 150 | | | $ | 8 | | | $ | 54 | | | $ | (458) | |
| Year ended December 31, 2023 | (462) | | | 5 | | | 60 | | | (644) | |
| Year ended December 31, 2022 | (243) | | | (15) | | | (111) | | | — | |
| Statutory Capital and Surplus: | | | | | | | |
| December 31, 2024 | $ | 1,654 | | | $ | 97 | | | $ | 168 | | | $ | 178 | |
| December 31, 2023 | 2,009 | | | 86 | | | 140 | | | 171 | |
| | | | | | | |
(a)FGL NY Insurance, Raven Re and Corbeau Re are subsidiaries of FGL Insurance, and the columns should not be added together. Corbeau Re was incorporated on September 1, 2023.
Regulation - U.S. Companies
FGL Insurance, FGL NY Insurance, Raven Re and Corbeau Re’s respective statutory capital and surplus satisfy the applicable minimum regulatory requirements.
To enhance the regulation of insurers’ solvency, the NAIC adopted a model law to implement risk-based capital (“RBC”) requirements for life, health and property and casualty insurance companies. All states have adopted the NAIC’s model law or a substantially similar law. RBC is used to evaluate the adequacy of capital and surplus maintained by an insurance company in relation to risks associated with: (i) asset risk, (ii) insurance risk, (iii) interest rate risk, and (iv) business risk. As of the most recent annual statutory financial statements filed with insurance regulators, the RBC ratios for each of our U.S. Insurance Companies exceeded the minimum RBC requirements.
Dividends
The insurance laws of Iowa and New York regulate the amount of dividends that may be paid in any year by FGL Insurance and FGL NY Insurance, respectively.
FGL Insurance dividends are paid as declared by its Board of Directors. Pursuant to Iowa insurance law, any proposed payment of a dividend is classified as an “extraordinary dividend” if it, together with the aggregate fair market value of other dividends or distributions made during the preceding twelve months, exceeds the greater of (i)
10% of capital and surplus as of the preceding December 31 or (ii) net gain from operations before realized capital gains or losses for twelve month period ending December 31 of the preceding year. No extraordinary dividends may be paid without prior approval of the IID. In addition, no ordinary dividends may be paid except from the earned profits arising from FGL Insurance’s business, which does not include contributed capital or contributed surplus.
FGL Insurance did not pay dividends to its parent, Fidelity & Guaranty Life Holdings, Inc. (“FGLH”), for the years ended December 31, 2024, 2023, and 2022. Pursuant to the limitations described above, it is estimated that FGL Insurance’s maximum ordinary dividend capacity for 2025 is $0.
Each year, FGL NY Insurance may pay a certain limited amount of ordinary dividends or other distributions without being required to obtain the prior consent of the New York State Department of Financial Services (“NYDFS”). However, to pay any dividends or distributions in a calendar year immediately following a calendar year in which the FGL NY’s net gain from operations, not including realized capital gains, was negative, approval from the NY Superintendent is required.
FGL NY Insurance has historically not paid dividends. Based on the limitations described above, it’s estimated that the maximum amount of ordinary dividends FGL NY Insurance will be permitted to distribute during 2025 is approximately $10 million.
Raven Re and Corbeau Re dividends are paid as declared by their Board of Directors. Under the laws of the State of Vermont, no captive insurance company may pay a dividend out of, or other distribution with respect to, capital or surplus, without prior approval. Based on the limitations described above, no dividends may be paid in 2025 by either Raven Re or Corbeau Re without prior regulatory approval.
Prescribed and permitted practices
FGL Insurance - FGL Insurance applies Iowa-prescribed accounting practices prescribed by Iowa Administrative Code (“ IAC “) Chapter 97, “Accounting for Certain Derivative Instruments Used to Hedge the Growth in Interest Credited for Indexed Insurance Products and Accounting for the Indexed Insurance Products Reserve,” for its indexed annuities and IUL products. Under these alternative accounting practices, the equity option derivative instruments that hedge the growth in interest credited on index products are accounted for at amortized cost with the corresponding amortization recorded as a decrease to net investment income and indexed annuity reserves are calculated based on Standard Valuation Law and Actuarial Guideline XXXV assuming the market value of the equity options associated with the current index term is zero regardless of the observable market value for such options.
In addition, based on a permitted practice received from the IID, FGL Insurance carries one of its limited partnership interests which qualifies for accounting under SSAP No. 48, “Investments in Joint Ventures, Partnerships and Limited Liability Companies,” on a net asset value per share basis. This is a departure from SSAP No. 48 which requires such investments to be carried based on the investees underlying GAAP equity (prior to any impairment considerations). This limited partnership investment was redeemed as of December 31, 2024. In addition, the financial statements of Raven Re and Corbeau Re include certain permitted practices approved by the Vermont Department of Financial Regulations. Without these permitted practices, the carry value of these two entities would be zero.
The prescribed and permitted practices resulted in increases to statutory capital and surplus of $454 million and $194 million at December 31, 2024 and 2023, respectively.
FGL Insurance’s statutory carrying value of Raven Re reflects the effect of permitted practices Raven Re received to treat the available amount of a letter of credit as an admitted asset, which increased Raven Re’s statutory capital and surplus by $175 million and $200 million at December 31, 2024 and 2023, respectively. In addition, FGL Insurance’s statutory carrying value of Corbeau Re reflects the effect of permitted practices Corbeau Re received to treat the excess of loss as an admitted asset, which increased Corbeau Re’s statutory capital and surplus by $1,230
million and $765 million at December 31, 2024 and 2023, respectively. Refer to Note E - Reinsurance for a discussion of the XOL and letter of credit.
Raven Re - Raven Re is also permitted to follow Iowa prescribed statutory accounting practice for its reserves on reinsurance assumed from FGL Insurance and also has approval to include as an admitted asset the value of a letter of credit serving as collateral for reinsurance credit taken by FGL Insurance. Without such permitted statutory accounting practices, Raven Re’s statutory capital and surplus (deficit) would be $(13) million and $(89) million as of December 31, 2024 and 2023, respectively, and its risk-based capital would fall below the minimum regulatory requirements. The letter of credit facility is collateralized by NAIC 1 rated debt securities. If the permitted practice was revoked, the letter of credit could be replaced by the collateral assets with Nomura’s consent (refer to discussion of letter of credit in Note E- Reinsurance). FGL Insurance’s statutory carrying value of Raven Re was $168 million and $140 million at December 31, 2024 and 2023, respectively.
Corbeau Re - Corbeau Re has four permitted practices pursuant to Vermont Statute, Title 8, Chapter 141 – (8 V.S.A. § 6048k(a)(2), whereby the Vermont Department authorizes the Company to (i) account for the amount equal to the excess of loss amount (“XOL Asset”) as an asset on its statutory financial statements; (ii) calculate the reserves with respect to the Retirement Pro Contracts in accordance with the following reserving methodology: the reserves are calculated as the present value of reinsured benefits when account value equals zero less the present value of reinsurance premiums from the winning integrated stream, floored at zero and capped as necessary to keep the net statutory reserve at the net cash surrender value. For benefits associated with all other contracts (“the GMWB Riders”), the reserves are calculated as the statutory reserves for the entire contract (i.e., the base contracts plus the GMWB Riders) minus the statutory reserves for the base contracts only (“Reserve Calculation Permitted Practice”); (iii) calculate its company action level risk-based capital as defined in Section 8301(13)(A) and, calculated using the risk-based capital factors and formulas prescribed by the NAIC, applying a factor of 0.62% to the XOL Asset Value; and (iv) annually perform a total company solvency analysis in lieu of cash flow testing and actuarial opinion and memorandum under Section 2010-2 of the Vermont Administrative Code. In addition, Corbeau Re assumes reserves that are equal to the reserves ceded by FGL Insurance which includes application of IAC Insurance 191, Chapter 97, “Accounting for Certain Derivative Instruments Used to Hedge the Growth in Interest Credited for Indexed Insurance Products and Accounting for the Indexed Insurance Products Reserve.” Without such permitted statutory accounting practices, the Company’s statutory capital and surplus (deficit) would be $(1,052) million and $(594) million as of December 31, 2024 and 2023, respectively, and its risk-based capital would fall below the minimum regulatory requirements. FGL Insurance’s statutory carrying value of Corbeau Re was $178 million and $171 million at December 31, 2024 and 2023, respectively.
FGL NY Insurance - As of December 31, 2024 and 2023, FGL NY Insurance did not follow any prescribed or permitted statutory accounting practices that differ from the NAIC's statutory accounting practices.
Non-U.S. Companies
Our non-U.S. insurance subsidiaries, F&G Cayman Re and F&G Life Re, file financial statements with their respective regulators. For the annual period ended December 31, 2023, F&G Cayman Re began to file financial statements that are prepared in accordance with SAP prescribed or permitted by such authorities, which may vary materially from GAAP. Accordingly, SAP operating results and SAP capital and surplus may differ substantially from amounts reported in the GAAP basis financial statements for comparable items.
F&G Cayman Re has two permitted practices which have been approved by the Cayman Islands Monetary Authority (“CIMA”). F&G Cayman Re has a permitted practice approved by CIMA to include, as an admitted asset, the value of the letters of credit (“LOCs”) acquired to support reinsurance transactions. Also, F&G Cayman Re has a permitted practice, approved by CIMA, for PRT reinsurance transactions to use U.S. statutory book value adjusted for best estimate reserve calculations (consistent with GAAP prior to ASU 2018-12, Financial Services-Insurance (Topic 944), Targeted Improvements to the Accounting for Long-Duration Contracts). These reserve calculations will be subject to annual assumption reviews consistent with other GAAP liability balances. If F&G Cayman Re had not been permitted to calculate PRT assumed reserves using best estimate reserve calculations or include the value of the LOCs as an admitted asset, statutory surplus would be $(64) million and $102 million as of December 31,
2024 and December 31, 2023, respectively. Without such permitted statutory accounting practices, F&G Cayman Re’s risk-based capital would fall below the minimum regulatory requirements as of December 31, 2024 and December 31, 2023.
F&G Life Re files financial statements based on GAAP.
Net income and capital and surplus of our wholly owned Cayman Islands and Bermuda regulated insurance subsidiaries under SAP and GAAP, respectively, were as follows (in millions):
| | | | | | | | | | | |
| Subsidiary (country of domicile) |
| F&G Cayman Re (Cayman Islands) | | F&G Life Re (Bermuda) |
| Statutory Net income (loss): | | | |
| Year ended December 31, 2024 | $ | (11) | | | $ | 139 | |
| Year ended December 31, 2023 | 133 | | | 151 | |
| Year ended December 31, 2022 | 71 | | | (339) | |
| Statutory Capital and Surplus (Deficit): | | | |
| December 31, 2024 | $ | 734 | | | $ | 123 | |
| December 31, 2023 | 543 | | | 11 | |
| | | |
Regulation - Bermuda
F&G Life Re is a Bermuda exempted company incorporated under the Companies Act 1981, as amended (the “Bermuda Companies Act”) and registered as a Class E insurer under the Insurance Act 1978, as amended, and its related regulations (the “Bermuda Insurance Act”). F&G Life Re is regulated by the Bermuda Monetary Authority (“BMA”).
In addition to the requirements under the Bermuda Companies Act (as discussed below), the Bermuda Insurance Act limits the maximum amount of annual dividends and distributions that may be paid or distributed by F&G Life Re without prior regulatory approval. F&G Life Re is prohibited from declaring or paying a dividend if it fails to meet its minimum solvency margin, or ECR, or if the declaration or payment of such dividend would cause such breach. If F&G Life Re were to fail to meet its minimum solvency margin on the last day of any financial year, it would be prohibited from declaring or paying any dividends during the next financial year without the approval of the BMA. In addition, as a Class E insurer, F&G Life Re must not declare or pay a dividend to any person other than a policyholder unless the value of the assets of such insurer, as certified by the insurer’s approved actuary, exceeds its liabilities (as so certified) by the greater of its margin of solvency or ECR. In the event a dividend complies with the above, F&G Life Re must ensure the amount of any such dividend does not exceed that excess.
Furthermore, as a Class E insurer, F&G Life Re must not declare or pay a dividend in any financial year which would exceed 25% of its total statutory capital and surplus, as set out in its previous year’s Bermuda statutory financial statements, unless at least seven days before payment of such dividend F&G Life Re files with the BMA an affidavit signed by at least two directors of F&G Life Re and its principal representative under the Bermuda Insurance Act stating that, in the opinion of those signing, declaration of such dividend has not caused the insurer to fail to meet its relevant margins. The Bermuda Companies Act also limits F&G Life Re’s ability to pay dividends and make distributions to its shareholders. F&G Life Re is not permitted to declare or pay a dividend, or make a distribution out of its contributed surplus, if it is, or would after the payment be, unable to pay its liabilities as they become due or if the realizable value of its assets would be less than its liabilities.
F&G Life Re’s ability to pay dividends in 2025 is subject to the limitations described above.
Regulation - Cayman Islands
F&G Cayman Re is a Cayman Islands exempted company incorporated under the Companies Act, as amended (2023 Revision) and licensed as a Class D insurer in the Cayman Islands under the Insurance Act, 2010 as amended and its related regulation (the “Cayman Islands Insurance Act”). F&G Cayman Re is regulated by CIMA.
F&G Cayman Re dividends are paid as declared by its Board of Directors. The dividends will be in accordance with CIMA regulatory requirements and contractual obligations and any dividends require approval by CIMA. F&G Cayman Re can only request approval for dividends if (i) the ending capital, including considerations for future business plans, will maintain a surplus over the CIMA approved and permitted target modified RBC, and (ii) contractual language pursuant to the PRT reinsurance agreement requiring a US RBC above specified target is met. As of the most recent annual financial statement filed with CIMA, the RBC ratios for F&G Cayman Re exceeded these minimum requirements. Pursuant to the limitations described above, no dividends may be paid in 2025 by F&G Cayman Re without prior regulatory approval.
The prescribed and permitted statutory accounting practices have no impact on our audited Consolidated Financial Statements, which are prepared in accordance with GAAP.
Note P — Acquisitions
Owned Distribution - Acquisition of Roar Joint Venture, LLC
On January 2, 2024, F&G acquired a 70% majority ownership stake in the equity of Roar Joint Venture, LLC (“Roar”). Roar wholesales life insurance and annuity products to banks and broker-dealers through a network of agents. Under the terms of the purchase agreement, the Company has agreed to make cash payments of up to approximately $90 million over a three-year period upon the achievement of certain EBITDA milestones of Roar.
The initial purchase price is as follows (in millions):
| | | | | |
| Cash paid for 70% majority interest of Roar shares | $ | 269 | |
| Less: Cash acquired net of non-controlling interests | 1 | |
| Net cash paid for 70% majority interest of Roar | 268 | |
| Initial fair value of contingent consideration | 48 | |
| Total initial consideration | $ | 316 | |
The following table summarizes the fair value amounts recognized for the assets acquired and liabilities assumed as of the acquisition date (in millions):
| | | | | |
| | Fair value as of
January 2, 2024 |
| |
| |
| Goodwill | $ | 268 | |
| Prepaid expenses and other assets | 3 | |
| Other intangible assets | 183 | |
| Total assets acquired | 454 | |
| | |
| Accounts payable and accrued liabilities | 2 | |
| Total liabilities assumed | 2 | |
| |
| Non-controlling interests (fair value determined using income approach) | 136 | |
| Total liabilities assumed and non-controlling interests | 138 | |
| | |
| Net assets acquired | $ | 316 | |
The gross carrying value and weighted average estimated useful lives of Other intangible assets acquired in the Roar acquisition consist of the following (dollars in millions):
| | | | | | | | | | | |
| Gross Carrying Value | | Estimated Useful Life
(in years) |
| Other intangible assets: | | | |
| Customer relationships | $ | 179 | | | 12 |
| Definite lived trademarks, tradenames, and other | 4 | | | 10 |
| Total Other intangible assets | $ | 183 | | | |
| | | |
Goodwill consists primarily of intangible assets that do not qualify for separate recognition, such as the assembled workforce and synergies between the entities. The total amount of goodwill recorded is expected to be deductible for tax purposes.
Roar’s revenues of $78 million and net earnings attributable to F&G common shareholders of $6 million are included in the Consolidated Statements of Operations for the year ended December 31, 2024.
Unaudited Supplemental Pro-Forma Financial Results
For comparative purposes, selected unaudited pro-forma consolidated results of operations of F&G for the year ended December 31, 2023 are presented below (in millions). Unaudited pro-forma results presented assume the acquisition of Roar occurred as of January 1, 2023 and are not intended to represent or be indicative of actual or future results of operations. Pro-forma results for the year ended December 31, 2024 are not included because there is no material variance from actual results due to the timing of the acquisition.
| | | | | | | |
| | | | Year ended December 31, |
| | | 2023 |
| Total revenues | | | $ | 4,561 | |
| Net earnings (loss) attributable to F&G common shareholders | | | (94) | |
| | | |
| | | |
Amounts reflect certain pro forma adjustments to revenue and net earnings (loss) attributable to F&G common shareholders that were directly attributable to the acquisition, primarily reflecting the elimination of intercompany activity between the entities.
Owned Distribution - Acquisition of PALH, LLC
On July 18, 2024, F&G acquired a 100% ownership stake in the equity of PALH, LLC (“PALH”). PALH markets and sells life insurance and annuity products of various insurance carriers to individuals through a network of agents. Prior to the acquisition date, PALH owned a 70% ownership stake in an operating company of which F&G owned 30% equity. Immediately before the acquisition date, the fair value of F&G’s minority stake in the operating company was approximately $92 million, derived from the transaction value. The transaction value contemplates measures such as EBITDA margin, revenue growth over time periods and growth opportunities. This remeasurement resulted in a realized gain of $2 million recorded in Recognized gains and (losses), net in the Consolidated Statements of Operations during the year ended December 31, 2024.
The initial purchase price is as follows (in millions):
| | | | | |
| Cash consideration | $ | 215 | |
| Less: Cash acquired | 1 | |
| Net cash paid | 214 | |
| Settlement of prepaid asset | 8 | |
| Acquisition date fair value of previously held interests | 92 | |
| Total consideration | $ | 314 | |
The following table summarizes the fair value amounts recognized for the assets acquired and liabilities assumed as of the acquisition date (in millions):
| | | | | |
| | Fair value as of
July 18, 2024 |
| |
| |
| Goodwill | $ | 162 | |
| Prepaid expenses and other assets | 5 | |
| Other intangible assets | 149 | |
| Total assets acquired | 316 | |
| | |
| Accounts payable and accrued liabilities | 2 | |
| Total liabilities assumed | 2 | |
| Net assets acquired | $ | 314 | |
The gross carrying value and weighted average estimated useful lives of Other intangible assets acquired in the PALH acquisition consist of the following (dollars in millions):
| | | | | | | | | | | |
| Gross Carrying Value | | Estimated Useful Life
(in years) |
| Other intangible assets: | | | |
| Customer relationships | $ | 131 | | | 20 |
| Definite lived trademarks, tradenames, and other | 18 | | | 5 to 10 |
| Total Other intangible assets | $ | 149 | | | |
| | | |
Goodwill consists primarily of intangible assets that do not qualify for separate recognition, such as the assembled workforce and synergies between the entities. A portion of the total amount of goodwill recorded is expected to be deductible for tax purposes.
PALH’s revenues and net loss attributable to F&G common shareholders of $3 million and $6 million, respectively, are included in the Consolidated Statements of Operations for the year ended December 31, 2024.
Unaudited Supplemental Pro-Forma Financial Results
For comparative purposes, selected unaudited pro-forma consolidated results of operations of F&G for the years ended December 31, 2024 and 2023 are presented below (in millions). Unaudited pro-forma results presented assume the acquisition of PALH occurred as of January 1, 2023 and are not intended to represent or be indicative of actual or future results of operations.
| | | | | | | | | | | |
| | Year ended December 31, |
| 2024 | | 2023 |
| Total revenues | $ | 5,746 | | | $ | 4,504 | |
| Net earnings (loss) attributable to F&G common shareholders | 616 | | | (69) | |
| | | |
| | | |
Amounts reflect certain pro forma adjustments to revenue and net earnings (loss) attributable to F&G common shareholders that were directly attributable to the acquisition, primarily reflecting the elimination of intercompany activity between the entities.
Note Q - Related Party Transactions
The Company has determined that related parties would fall into the following categories; (i) affiliates of the entity, (ii) entities for which investments in their equity securities would be required to be accounted for by the equity method by the investing entity, (iii) trusts for the benefit of employees, such as pension and profit-sharing trusts that are managed by or under the trusteeship of management, (iv) principal owners ( greater than 10% equity stake) of the entity and members of their immediate families, (v) management (including FNF’s Board of Directors, Chief Executive Officer, and other persons responsible for achieving the objectives of the entity and who have the
authority to establish policies and make decisions) of the entity and other members of their immediate families, (vi) other parties with which the entity may deal if one party controls or can significantly influence the management or operating policies of the other to an extent that one of the transacting parties might be prevented from fully pursuing its own separate interests (vii) other parties that can significantly influence management or operating policies of the transacting parties or that have an ownership interest in one of the transacting parties and can significantly influence the other to an extent that one or more of the transacting parties might be prevented from fully pursuing its own separate business, (viii) attorney in fact of a reciprocal reporting entity or any affiliate of the attorney in fact, and (ix) a U.S. manager of a U.S. branch or any affiliate of the U.S. manager of a U.S. branch.
The Company has determined that FNF as well as FNF's directors and officers (along with their immediate family members) are related parties.
FNF
Separation Agreement
F&G has entered into the Separation Agreement with FNF to provide for, among other things, the principal corporate transactions required to effect the separation and distribution, certain conditions to the separation and distribution and provisions governing our relationship with FNF with respect to and resulting from the separation and distribution. Refer to “Risk Factors - Risks Related to the Separation and Distribution and our Status as a subsidiary of FNF” in this Annual Report on Form 10-K for additional information on the separation.
Notes Payable
For a description of our financing arrangements with FNF see Note L - Notes Payable to the Consolidated Financial Statements included in this Annual Report on Form 10-K.
Governance
Because FNF owns approximately 85% of the shares of outstanding F&G common stock, we are a controlled company within the meaning of the corporate governance standards of the NYSE. A controlled company does not need its board of directors to have a majority of independent directors or to form an independent compensation committee or nominating and corporate governance committee. Refer to “Risk Factors - Risks Related to the Separation and Distribution and our Status as a subsidiary of FNF” in this Annual Report on Form 10-K for additional information on management and governance.
FNF $250 million Preferred Stock Investment
Refer to Note U - Equity for a discussion of the $250 million preferred stock investment from FNF.
Tax Sharing Agreement
Refer to Note H - Income Taxes for a discussion of the tax matters agreement between FNF and the Company.
Stock Split
On June 24, 2022, a stock split in a ratio of 105,000 for 1 previously approved by the F&G board of directors became effective. FNF, as the sole shareholder, received, in the form of a dividend, 104,999 additional shares of common stock for each share of common stock held.
Corporate Services Agreement
FNF has entered into a Corporate Services Agreement with F&G, which we refer to as the Corporate Services Agreement. Pursuant to such agreement, FNF will provide F&G with certain corporate services, including internal
audit services, litigation and dispute management services, compliance services, corporate and transactional support services, SEC & reporting services, insurance and risk management services, human resources support services and real estate services. The Corporate Services Agreement terminates after the date upon which all corporate services or transition assistance have been terminated or upon the mutual agreement of the parties. F&G may terminate corporate services by providing 90 days written notice to FNF.
Reverse Corporate Services Agreement
F&G has entered into a Reverse Corporate Services Agreement with FNF. Pursuant to such agreement, F&G will provide FNF with certain services, including employee services. The Reverse Corporate Services Agreement terminates after the date upon which all corporate services or transition assistance has been terminated or upon the mutual agreement of the parties. FNF may terminate corporate services by providing 90 days written notice to F&G.
Shared Services
For the three-year period ended December 31, 2024, FNF provided certain operational support services for F&G including tax, insurance, legal, risk management, information technology, employee benefits and accounting. Expenses incurred by F&G for all services were insignificant for the years ended December 31, 2024, 2023 and 2022.
Owned Distribution Investments
On January 2, 2024, F&G acquired a 70% majority ownership stake in the equity of Roar resulting in the consolidation of Roar in F&G’s financial statements. Under the terms of the purchase agreement, the Company has agreed to make cash payments of up to approximately $90 million over a three year period upon the achievement by Roar of certain EBITDA milestones. Refer to Note A - Business and Summary of Significant Accounting Policies - Principles of Consolidation and Basis of Presentation for discussions of contingent consideration and non-controlling interests and to Consolidated Statements of Equity for activity with non-controlling interests.
Concurrent with the Roar purchase agreement, we executed a separate loan agreement with the sellers of Roar for us to lend up to $40 million. The principal balance outstanding as of December 31, 2024 was $11 million. Refer to Note B - Fair Value of Financial Instruments for information regarding the fair value calculation of this loan receivable. Refer to Note N - Commitments and Contingencies for more information regarding this loan commitment. Refer to Note P - Acquisitions for more information on the Roar acquisition.
On July 18, 2024, F&G acquired a 100% ownership stake in the equity of PALH. Prior to the acquisition date, PALH owned a 70% ownership stake in an operating company of which F&G owned 30% equity.
In 2023, we purchased a 40% minority ownership stake in DCMT and a 49% minority ownership stake in Syncis. We have elected the fair value option to account for these investments and have included them in Investments in unconsolidated affiliates on the Consolidated Balance Sheets.
For the years ended December 31, 2024, 2023 and 2022, we expensed approximately $119 million, $154 million, and $74 million in commissions on sales through our funded unconsolidated owned distribution investments and their affiliates. Acquisition expenses are deferred and amortized in Depreciation and amortization on the Consolidated Statements of Operations.
Other Investments
In 2023, we purchased a 30% minority ownership stake in Quility. We have elected the fair value option to account for this investment and have included Quility in Investments in unconsolidated affiliates on the
Consolidated Balance Sheets. Commissions expensed on sales through Quility were insignificant for the years ended December 31, 2024 and 2023.
The Company has a 10% ownership stake in Specialty Lending Company LLC with a 50% voting interest. Specialty Lending is a specialty finance company focused on consumer credit. Specialty Lending is accounted for using the equity method of accounting and is included in Investments in unconsolidated affiliates on the Consolidated Balance Sheets.
Refer to Note A - Business and Summary of Significant Accounting Policies - Investments in Unconsolidated Affiliates for more information regarding the accounting for Investments in unconsolidated affiliates.
Note R - Employee Benefit Plans
FNF Stock Purchase Plan
During the year ended December 31, 2022, our eligible employees could voluntarily participate in FNF's employee stock purchase plan (“ESPP”) sponsored by FNF. Company matching contributions are funded one year after employee contributions are made pursuant to the ESPP. We provided FNF an insignificant amount with respect to our matching contributions to the ESPP in the year ended December 31, 2022. Effective January 1, 2023, our employees were no longer eligible to participate in the ESPP.
F&G Stock Purchase Plan
On January 1, 2023, the Company adopted an Employee Stock Purchase Plan (“F&G ESPP”), enabling employees to purchase the Company stock in an amount between 3% and 15% of their base salary and certain commissions. Based on employee contributions the Company will match either 33.3% or 50% one year after initial employee contributions are made pursuant to the F&G ESPP. Our matching expense related to the F&G ESPP was immaterial for the years ended December 31, 2024 and December 31, 2023.
401(k) Plan
During the three-year period ended December 31, 2024, we offered our employees the opportunity to participate in our 401(k) plan (the “401(k) Plan”), a qualified voluntary contributory savings plan that is available to substantially all of our employees. Eligible employees may contribute up to 75% of their pre-tax annual compensation, up to the amount allowed pursuant to the Internal Revenue Code.
We make an employer match on the 401(k) Plan of $1.00 on each $1.00 contributed up to the first 5% of eligible earnings contributed to the 401(k) Plan by employees. We may also make discretionary non-elective contributions to the 401(k) Plan for eligible employees, and any such contributions are subject to approval by the Board of Directors for each plan year. The employer match and discretionary non-elective contributions are credited based on the participant's individual investment elections in the 401(k) Plan and recorded in personnel costs in the Consolidated Statements of Operations.
The employer match was $8 million, $7 million, and $5 million for the years ended December 31, 2024, 2023, and 2022, respectively. Discretionary non-elective contributions were immaterial for the years ended December 31, 2024, 2023, and 2022, respectively.
Stock-Based Compensation
We account for stock-based compensation plans in accordance with GAAP on share-based payments, which requires that compensation cost relating to share-based payments be recognized in the consolidated financial statements based on the fair value of each award. Using the fair value method of accounting, compensation cost is measured based on the fair value of the award at the grant date and recognized over the service period. A forfeiture rate, derived from historical experience, is used in the calculation of total stock-based compensation expense. Total
stock-based compensation costs recorded in personnel costs in the Consolidated Statements of Operations for the years ended December 31, 2024, 2023, and 2022 were $29 million, $23 million and $12 million, respectively. F&G’s income tax expense for the years ended December 31, 2024, 2023 and 2022 included an immaterial amount of tax benefit related to the vesting and forfeiture of share-based payments.
2022 F&G Omnibus Incentive Plan
On December 1, 2022, we established the F&G Annuities & Life, Inc. 2022 Omnibus Incentive Plan (the “2022 F&G Omnibus Plan”), authorizing the issuance of up to 6 million shares of F&G common stock, subject to the terms of the 2022 F&G Omnibus Plan. The 2022 F&G Omnibus Plan provides for the grant of stock options, stock appreciation rights, restricted stock, restricted stock units and performance shares, performance units, other cash and stock-based awards and dividend equivalents. As of December 31, 2024, there were 1,801,618 shares of restricted stock outstanding under the 2022 F&G Omnibus Plan. Awards granted are approved by the Compensation Committee of the Board of Directors. Awards vest over a 3-year period and have a performance restriction that must be met for shares awarded to vest. If the performance restriction is not satisfied during the measurement period, all of the shares that do not satisfy the performance criteria will be forfeited to the Company for no consideration.
F&G restricted stock transactions under the 2022 F&G Omnibus Plan during the years ended December 31, 2024, 2023, and 2022 are as follows:
| | | | | | | | | | | | | | | | | | | | | | | | | | | | | | | | | | | |
| 2024 | | 2023 | | 2022 |
| Shares | | Weighted Average
Grant Date
Fair Value | | Shares | | Weighted Average
Grant Date
Fair Value | | Shares | | Weighted Average
Grant Date
Fair Value |
| Outstanding January 1, | 1,784,142 | | | $ | 30.88 | | | 1,409,904 | | | $ | 21.80 | | | — | | | $ | — | |
| Granted | 829,899 | | | 46.05 | | | 876,736 | | | 40.28 | | | 1,411,369 | | | 21.80 | |
| Canceled | (118,063) | | | 29.04 | | | (48,900) | | | 21.80 | | | (1,465) | | | 21.80 | |
| Vested | (694,360) | | | 29.17 | | | (453,598) | | | 21.80 | | | — | | | — | |
| Balance at December 31, | 1,801,618 | | | $ | 38.65 | | | 1,784,142 | | | $ | 30.88 | | | 1,409,904 | | | $ | 21.80 | |
Fair value of restricted stock awards and units is based on the grant date value of the underlying stock derived from quoted market prices. The total fair value of restricted stock awards granted in the years ended December 31, 2024, 2023, and 2022 was $38 million, $35 million, and $31 million, respectively. There were 694,360, 453,598, and 0 restricted stock awards which vested in the years ended December 31, 2024, 2023, and 2022, respectively. Net earnings (loss) reflects stock-based compensation expense amounts of $28 million, $19 million, and $1 million for the years ended December 31, 2024, 2023, and 2022, respectively, which are recorded in personnel costs in the Consolidated Statements of Operations.
For the period ended December 31, 2024, the total unrecognized compensation costs related to non-vested restricted stock grants pursuant to the 2022 F&G Omnibus Plan are $51 million, which is expected to be recognized in pre-tax income over a weighted average period of 2.54 years.
FGL Incentive Plan and 2020 F&G Omnibus Incentive Plan
We have outstanding restricted stock grants and stock options under the FGL Holdings 2017 Omnibus Incentive Plan, as amended and restated (the “2020 F&G Omnibus Plan”), which was assumed by FNF. The outstanding awards and options are settled by issuance of FNF common stock. All of the outstanding options are vested and expire at various dates through August 2026. As of December 31, 2024, there were no shares of restricted stock and 100,000 stock options outstanding under the 2020 F&G Omnibus Plan.
Stock option transactions under the 2020 F&G Omnibus Plan during the years ended December 31, 2024, 2023, 2022 are as follows:
| | | | | | | | | | | | | | | | | | | | | | | | | | | | | | | | | | | |
| 2024 | | 2023 | | 2022 |
| Options | | Weighted Average
Exercise Price | | Options | | Weighted Average
Exercise Price | | Options | | Weighted Average
Exercise Price |
| Balance at January 1, | 643,623 | | | $ | 38.80 | | | 1,172,607 | | | $ | 35.15 | | | 1,527,936 | | | $ | 35.97 | |
| Granted | — | | | — | | | — | | | — | | | — | | | — | |
| Exercised | (543,623) | | | 38.74 | | | (502,414) | | | 30.31 | | | (352,614) | | | 38.79 | |
| Canceled | — | | | — | | | (26,570) | | | 38.07 | | | (2,715) | | | 28.00 | |
| Balance at December 31, | 100,000 | | | $ | 39.10 | | | 643,623 | | | $ | 38.80 | | | 1,172,607 | | | $ | 35.15 | |
There were 100,000, 643,623, and 1,172,607 exercisable stock options under the 2020 F&G Omnibus Plan at the year ended December 31, 2024, 2023, and 2022, respectively.
The following table summarizes information related to stock options outstanding and exercisable as of December 31, 2024:
| | | | | | | | | | | | | | | | | | | | | | | | | | | | | | | | | | | | | | | | | | | | | | | |
| Options Outstanding | | Options Exercisable |
| Range of Exercise Prices | Number of Options | | Weighted Average Remaining Contractual Life | | Weighted Average Exercise Price | | Intrinsic Value | | Number of Options | | Weighted Average Remaining Contractual Life | | Weighted Average Exercise Price | | Intrinsic Value |
| | | (In years) | | | | (In millions) | | | | (In years) | | | | (In millions) |
| | | | | | | | | | | | | | | |
| | | | | | | | | | | | | | | |
| $0.00 - $39.10 | 100,000 | | | 0.97 | | $ | 39.10 | | | $ | 2 | | | 100,000 | | | 0.97 | | $ | 39.10 | | | $ | 2 | |
| | | | | | | | | | | | | | | |
| | | | | | | | | | | | | | | |
| 100,000 | | | | | | | $ | 2 | | | 100,000 | | | | | | | $ | 2 | |
Option awards are measured at fair value on the grant date using the Black Scholes Option Pricing Model. The intrinsic value of options exercised was $9 million and $8 million for the years ended December 31, 2024 and December 31, 2023, respectively, and insignificant for the year ended December 31, 2022.
Restricted stock transactions under the 2020 F&G Omnibus Plan during the years ended December 31, 2024, 2023, and 2022 are as follows:
| | | | | | | | | | | | | | | | | | | | | | | | | | | | | | | | | | | |
| 2024 | | 2023 | | 2022 |
| Shares | | Weighted Average
Grant Date Fair Value | | Shares | | Weighted Average
Grant Date Fair Value | | Shares | | Weighted Average
Grant Date Fair Value |
| Balance at January 1, | 181,479 | | | $ | 41.08 | | | 501,548 | | | $ | 42.31 | | | 718.641 | | | $ | 40.24 | |
| Granted | — | | | — | | | — | | | — | | | — | | | — | |
| Canceled | (13,082) | | | 48.28 | | | (15,965) | | | 45.63 | | | (78,551) | | | 37.79 | |
| Vested | (168,397) | | | 40.53 | | | (304,104) | | | 42.87 | | | (138,542) | | | 34.11 | |
| Balance at December 31, | — | | | $ | — | | | 181,479 | | | $ | 41.08 | | | 501,548 | | | $ | 42.31 | |
There were no restricted stock awards granted under the 2020 F&G Omnibus Plan in the years ended December 31, 2024, 2023 and 2022. The total fair value of restricted stock awards that vested in the years ended December 31, 2024, 2023, and 2022 was $7 million, $13 million and $5 million, respectively. Net earnings (loss) reflects stock-based compensation expense amounts of $1 million, $3 million and $12 million for the years ended December 31, 2024, 2023 and 2022, respectively, which are included in personnel costs in the Consolidated Statements of Operations.
At December 31, 2024, there were no unrecognized compensation cost related to restricted stock grants pursuant to the FGL Incentive Plan and the 2020 F&G Omnibus Plan.
Non-Qualified Deferred Compensation Plan
We have established the F&G Annuities & Life, Inc. Deferred Compensation Plan (the “Deferred Compensation Plan”), which allows eligible employees and directors to make voluntary contributions to the Deferred Compensation Plan. Employer contributions to the Deferred Compensation Plan are discretionary. For the years ended December 31, 2024, 2023 and 2022, we did not make any discretionary contributions. At December 31, 2024 and 2023, the total liability for the Deferred Compensation Plan was $13 million and $11 million, respectively.
Note S - Earnings Per Share
The following table sets forth the computation of basic and diluted earnings per share (dollars and shares in millions except per share data):
| | | | | | | | | | | | | | | | | |
| Year Ended December 31, |
| 2024 | | 2023 | | 2022 |
| | | | | |
| | | | | |
| Net earnings (loss) | $ | 642 | | | $ | (58) | | | $ | 635 | |
| Less: Non-controlling interests | 3 | | | — | | | — | |
| Net earnings (loss) attributable to F&G | 639 | | | (58) | | | 635 | |
| Less: Preferred stock dividend | 17 | | | — | | | — | |
| Net earnings (loss) attributable to F&G common shareholders | $ | 622 | | | $ | (58) | | | $ | 635 | |
| | | | | |
| Weighted-average common shares outstanding - basic | 125 | | | 124 | | | 115 | |
| Dilutive effect of unvested restricted stock | 1 | | | — | | | — | |
| Dilutive effect of mandatory convertible preferred stock | 5 | | | — | | | — | |
| Weighted-average shares outstanding - diluted | 131 | | | 124 | | | 115 | |
| | | | | |
| Net earnings (loss) per share attributable to F&G common shareholders | | | | | |
| | | | | |
| | | | | |
| Basic - net | $ | 4.98 | | | $ | (0.47) | | | $ | 5.52 | |
| | | | | |
| | | | | |
| | | | | |
| Diluted - net | $ | 4.88 | | | $ | (0.47) | | | $ | 5.52 | |
Under applicable accounting guidance, companies in a loss position are required to use basic weighted average common shares outstanding in the calculation of diluted loss per share. Therefore, as a result of our net loss for the year ended December 31, 2023, we were required to use basic weighted-average common shares outstanding in the calculation of diluted loss per share, as the inclusion of 593 thousand restricted shares would have been antidilutive to the calculation. If we had not incurred a net loss for the year ended December 31, 2023, dilutive potential common shares would have been 125 million.
Restricted stock, options or other instruments, which provide the ability to acquire shares of our common stock that are antidilutive are excluded from the computation of diluted earnings per share. For the years ended December 31, 2024, 2023, and 2022 the diluted earnings per share calculation excluded the weighted average effect of 122 thousand, 111 thousand and 120 thousand restricted stock units, respectively, issued under the 2022 F&G Omnibus Plan due to their antidilutive effect.
On June 24, 2022, a stock split in a ratio of 105,000 for 1 previously approved by the F&G board of directors became effective. Earnings per share has been retrospectively adjusted to reflect as if the split occurred as of June 1, 2020, in accordance with GAAP.
Note T - Recent Accounting Pronouncements
Adopted Pronouncements
In March 2023, the FASB issued ASU 2023-02, Accounting for Investments in Tax Credit Structure Using the Proportional Amortization Method (a consensus of the Emerging Issues Task Force). The amendments in this update permit reporting entities to elect to account for their tax equity investments, regardless of the tax credit program from which the income tax credits are received, using the proportional amortization method if certain conditions are met. We adopted this standard on January 1, 2024, as required, and there was no material impact to our Consolidated Financial Statements. Refer to Note H - Income Taxes for further information.
In November 2023, the FASB issued ASU 2023-07, Segment Reporting (Topic 280): Improvements to Reportable Segment Disclosures. The amendments in this update improve reportable segment disclosure requirements, primarily through enhanced disclosures about significant segment expense categories that are regularly provided to the CODM and included in each reported measure of a segment’s profit or loss. In addition, the amendments enhance interim disclosure requirements that are currently required annually, clarify circumstances in which an entity can disclose multiple segment measures of profit or loss, and contain other disclosure requirements. Additionally, the amendments require that entities with a single reportable segment must now provide all the disclosures previously required under Topic 280. The amendments in this update are incremental to the current requirements of Topic 280 and do not change how a public entity identifies its operating segments, aggregates those operating segments, or applies the quantitative thresholds to determine its reportable segments. We adopted this standard using the retrospective approach for all periods presented as required. Refer to Note V - Segment Information for additional information.
Pronouncements Not Yet Adopted
In December 2023, the FASB issued ASU 2023-09, Income Taxes (Topic 740): Improvements to Income Tax Disclosures. The amendments in this update enhance the transparency of the income tax disclosures by expanding on the disclosures required annually. The amendments require entities to disclose in their rate reconciliation table additional categories of information about federal, state, and foreign income taxes, in addition to providing details about the reconciling items in some categories if above a quantitative threshold. Additionally, the amendments require annual disclosure of income taxes paid (net of refunds received) disaggregated by jurisdiction based on a quantitative threshold. The amendments in this update are effective for public business entities for annual periods beginning after December 15, 2024. Early adoption is permitted for annual financial statements that have not yet been issued or made available for issuance. The amendments should be applied on a prospective basis, and retrospective application is permitted. We do not currently expect to early adopt this standard and are in the process of assessing its impact on our disclosures upon adoption.
In November 2024, the FASB issued ASU 2024-03, Income Statement—Reporting Comprehensive Income—Expense Disaggregation Disclosures (Subtopic 220-40): Disaggregation of Income Statement Expenses. The amendments in this update enhance transparency of certain expense captions by disclosing more granular information of specific expenses within those captions such as personnel costs, depreciation, and amortization. The amendments also require disclosure of qualitative description of amounts remaining in relevant expense captions that are not separately disaggregated. The amendments in this update are effective for all public companies for annual reporting periods beginning after December 15, 2026, and interim reporting periods beginning after December 15, 2027. Early adoption is permitted, and the amendments should be applied either prospectively to financial statements issued for reporting periods after the effective date or retrospectively to all prior periods presented in the financial statements. We do not expect to early adopt this standard and are in the process of assessing its impact on our disclosures upon adoption.
Note U - Equity
Common Stock
The total number of common stock shares we are authorized to issue is 500,000,000, par value $0.001 per share.
We intend to announce the record date and payment date for each common stock dividend, subject to quarterly review and approval by our Board of Directors and any required regulatory approvals, following completion of the relevant fiscal quarter and with payment in the third month of each subsequent quarter, based on our view of the prevailing and prospective macroeconomic conditions, regulatory landscape and business performance.
Changes in common shares outstanding during the years ended December 31, 2024, 2023, and 2022 were as follows:
| | | | | | | | | | | | | | | | | |
| For the Year Ended December 31, |
| 2024 | | 2023 | | 2022 |
| Shares outstanding at January 1, | 126,332,142 | | | 126,409,904 | | | 105,000,000 | |
| Shares issued (a) | 717,241 | | | 824,998 | | | 21,409,904 | |
| Shares repurchased (b) | (256,539) | | | (902,760) | | | — | |
| Shares outstanding at December 31, | 126,792,844 | | | 126,332,142 | | | 126,409,904 | |
(a)2022 includes 20,000,000 shares in an exchange agreement with FNF pursuant to which F&G transferred shares of its common stock to FNF in exchange for the $400 million FNF Promissory Note, after which the note was retired.
(b)Includes shares of common stock withheld with respect to tax withholding obligations associated with the vesting of share-based compensation awards under our 2020 F&G Omnibus Plan and 2022 F&G Omnibus Plan.
Share Repurchases
On March 21, 2023, our Board of Directors approved the three-year stock repurchase program, which was amended on November 7, 2023, to authorize the aggregate repurchase of $50 million of F&G common stock. The Company believes the share repurchase program is an efficient means of returning cash to shareholders when we consider the shares to be undervalued. No shares were purchased pursuant to the program during the year ended December 31, 2024. During the year ended December 31, 2023, the Company purchased approximately 869,000 shares pursuant to the program, for a total cost of approximately $18 million with an average cost per share of $21.07. At December 31, 2024 and 2023, the total remaining authorization of F&G common stock that may be repurchased was approximately $32 million.
Purchases may be made from time to time by the Company in the open market at prevailing market prices or through privately negotiated transactions or accelerated share repurchase transactions through November 6, 2026. All purchases are held as treasury stock. The extent to which the Company repurchases its shares, and the timing of such purchases, will depend upon a variety of factors, including market conditions, regulatory requirements and other considerations, as determined by the Company.
Preferred Stock
The total number of preferred stock shares we are authorized to issue is 25,000,000, par value $0.001 per share.
Refer to Note A - Business and Summary of Significant Accounting Policies to the Consolidated Financial Statements for details of the issuance of 5,000,000 shares of FNF Preferred Stock on January 12, 2024. Preferred stock dividends of approximately $17 million were declared during the year ended December 31, 2024.
Subject to certain exceptions, so long as any share of FNF Preferred Stock remains outstanding, no dividend or distribution will be declared or paid on shares of the Company’s Common Stock, or any other class or series of stock ranking junior to the FNF Preferred Stock, and no Common Stock or any other class or series of stock ranking junior to or on parity with the FNF Preferred Stock will be purchased, redeemed, or otherwise acquired for consideration
by the Company or any of its subsidiaries unless, in each case, all accumulated and unpaid dividends for all preceding dividend periods have been declared and paid in cash, shares of Common Stock or a combination thereof, or a sufficient sum of cash or number of shares of Common Stock has been set aside for the payment of such dividends, on all outstanding shares of FNF Preferred Stock. In addition, when dividends on shares of the FNF Preferred Stock (i) have not been declared and paid in full on any dividend payment date (or, in the case of any parity stock having dividend payment dates different from such dividend payment dates, on a dividend payment date falling within a regular dividend period related to such dividend payment date), or (ii) have been declared but a sum of cash or number of shares of Common Stock sufficient for payment thereof has not been set aside for the benefit of the holders thereof on the applicable regular record date, no dividends may be declared or paid on any parity stock unless dividends are declared on the shares of FNF Preferred Stock such that the respective amounts of such dividends declared on the shares of FNF Preferred Stock and such shares of parity stock shall be allocated pro rata among the holders of the shares of FNF Preferred Stock and the holders of any shares of parity stock then outstanding.
Unless converted earlier in accordance with the terms of the Certificate of Designations, each share of the FNF Preferred Stock will automatically convert on the mandatory conversion date, which is expected to be January 15, 2027, into between 0.9456 shares and 1.1111 shares of Common Stock, in each case, subject to customary anti-dilution adjustments described in the Certificate of Designations. The number of shares of Common Stock issuable upon conversion will be determined based on the average volume weighted average price per share of Common Stock over the 20 consecutive trading day period beginning on, and including, the 21st scheduled trading day immediately prior to January 15, 2027.
Dividends on the FNF Preferred Stock will be payable on a cumulative basis when, as and if declared by the Company’s board of directors, or an authorized committee thereof, at an annual rate of 6.875% on the liquidation preference of $50.00 per share of FNF Preferred Stock, and may be paid in cash or, subject to certain limitations, in shares of Common Stock or, subject to certain limitations, any combination of cash and shares of Common Stock. If declared, dividends on the FNF Preferred Stock will be payable quarterly on January 15, April 15, July 15 and October 15 of each year to, and including, January 15, 2027, commencing on April 15, 2024. With respect to any decision to declare or pay dividends, the board of directors or an authorized committee thereof, as the case may be, shall be required to act in accordance with the recommendation of a committee (whether or not formally constituted) consisting of all of the independent and disinterested directors at any time sitting on the board of directors.
Holders of the FNF Preferred Stock will have the option to convert all or any portion of their shares of FNF Preferred Stock at any time prior to the mandatory conversion date. Early conversions that are not made in connection with a Fundamental Change (as defined in Certificate of Designations) will be settled at the minimum conversion rate of 0.9456 shares of Common Stock per share of the FNF Preferred Stock (subject to anti-dilution adjustments). In addition, the conversion rate applicable to any such early conversion may in certain circumstances be increased to compensate holders of the FNF Preferred Stock for certain unpaid accumulated dividends.
If a Fundamental Change occurs on or prior to January 15, 2027, then holders of the FNF Preferred Stock will be entitled to convert all or any portion of their FNF Preferred Stock at the Fundamental Change Conversion Rate (as defined in the Certificate of Designations) for a specified period of time and to also receive an amount to compensate them for certain unpaid accumulated dividends and any remaining future scheduled dividend payments.
The FNF Preferred Stock will not be subject to redemption at the Company’s option.
Upon the Company’s voluntary or involuntary liquidation, winding-up or dissolution, each holder of the FNF Preferred Stock will be entitled to receive a liquidation preference in the amount of $50.00 per share of FNF Preferred Stock, plus an amount equal to accumulated and unpaid dividends on such shares, whether or not declared, to, but excluding, the date fixed for liquidation, winding-up or dissolution, to be paid out of the Company’s assets legally available for distribution to its stockholders after satisfaction of debt and other liabilities owed to the Company’s creditors and holders of shares of its stock ranking senior to the FNF Preferred Stock and before any payment or distribution is made to holders of any stock ranking junior to the FNF Preferred Stock, including, without limitation, Common Stock.
Dividends
The following table shows the quarterly common stock dividends declared during the years ended December 31, 2024, 2023, and 2022:
| | | | | | | | | | | | | | | | | |
| Year ended December 31, |
| 2024 | | 2023 | | 2022 |
| First quarter | $ | 0.21 | | | $ | 0.20 | | | $ | — | |
| Second quarter | 0.21 | | | 0.20 | | | — | |
| Third quarter | 0.21 | | | 0.20 | | | — | |
| Fourth quarter | 0.22 | | | 0.21 | | | 0.20 | |
| Total | $ | 0.85 | | | $ | 0.81 | | | $ | 0.20 | |
On February 20, 2025, our Board of Directors declared a quarterly cash dividend of $0.22 per share, payable on March 31, 2025, to F&G common shareholders of record as of March 17, 2025. On February 20, 2025, our Board of Directors also declared a quarterly cash dividend of $0.8594 per share on the FNF Preferred Stock for the period from January 15, 2025 to and excluding April 15, 2025, to be paid on April 15, 2025, to FNF Preferred Stock shareholders of record as of April 1, 2025.
Accumulated other comprehensive income (loss)
Changes in the balance of Accumulated other comprehensive income (loss) for the years ended December 31, 2024, 2023 and 2022, by component are as follows (in millions).
| | | | | | | | | | | | | | | | | | | | | | | | | | | | | | |
| Year Ended December 31, 2024 |
| Unrealized gain
(loss) on
investments and
other financial
instruments, net
(excluding
investments in
unconsolidated
affiliates) | | Change in
current discount rate - future
policy benefits | | Change in
instrument-
specific credit
risk - market
risk benefits | | Foreign Currency Translation | | Total Accumulated Other Comprehensive Income (Loss) | |
| Balance at December 31, 2023 | $ | (2,479) | | | $ | 574 | | | $ | (83) | | | $ | (2) | | | $ | (1,990) | | |
| Reclassification adjustments included in net earnings (a) | 6 | | | — | | | | | 1 | | | 7 | | |
| Other comprehensive income (loss) before tax, net of reclassifications | (207) | | | 283 | | | 6 | | | (6) | | | 76 | | |
| Deferred income tax (expense) benefit | 43 | | | (59) | | | (1) | | | 1 | | | (16) | | |
| Balance at December 31, 2024 | $ | (2,637) | | | $ | 798 | | | $ | (78) | | | $ | (6) | | | $ | (1,923) | | |
| | | | | | | | | | |
| Year Ended December 31, 2023 |
| Unrealized gain
(loss) on
investments and
other financial
instruments, net
(excluding
investments in
unconsolidated
affiliates) | | Change in
current discount rate - future
policy benefits | | Change in
instrument-
specific credit
risk - market
risk benefits | | Foreign Currency Translation | | Total Accumulated Other Comprehensive Income (Loss) | |
| Balance at December 31, 2022 | $ | (3,528) | | | $ | 763 | | | $ | (49) | | | $ | (4) | | | $ | (2,818) | | |
| Reclassification adjustments included in net earnings (a) | 130 | | | — | | | — | | | — | | | 130 | | |
| Other comprehensive income (loss) before tax, net of reclassifications | 1,159 | | | (239) | | | (43) | | | 3 | | | 880 | | |
| Deferred income tax (expense) benefit | (240) | | | 50 | | | 9 | | | (1) | | | (182) | | |
| Balance at December 31, 2023 | $ | (2,479) | | | $ | 574 | | | $ | (83) | | | $ | (2) | | | $ | (1,990) | | |
| | | | | | | | | | |
| |
| | | | | | | | | | |
| | | | | | | | | | |
| | | | | | | | | | |
| | | | | | | | | | |
| | | | | | | | | | |
| | | | | | | | | | |
| | | | | | | | | | | | | | | | | | | | | | | | | | | | | |
| Year Ended December 31, 2022 |
| Unrealized gain
(loss) on
investments and
other financial
instruments, net
(excluding
investments in
unconsolidated
affiliates) | | Change in
current discount rate - future
policy benefits | | Change in
instrument-
specific credit
risk - market
risk benefits | | Foreign Currency Translation | | Total Accumulated Other Comprehensive Income (Loss) |
| Balance at December 31, 2021 | $ | 949 | | | $ | (1) | | | $ | (116) | | | $ | 1 | | | $ | 833 | |
| Reclassification adjustments included in net earnings (a) | 212 | | | — | | | — | | | — | | | 212 | |
| Other comprehensive income (loss) before tax, net of reclassifications | (5,931) | | | 967 | | | 85 | | | (6) | | | (4,885) | |
| Deferred income tax (expense) benefit | 1,242 | | | (203) | | | (18) | | | 1 | | | 1,022 | |
| Balance at December 31, 2022 | $ | (3,528) | | | $ | 763 | | | $ | (49) | | | $ | (4) | | | $ | (2,818) | |
(a)Net of income tax expense of $2 million, $35 million and $56 million for the year ended December 31, 2024, 2023, and 2022, respectively.
Note V - Segment Information
F&G has one reportable segment, which reflects the manner by which our CODM, the Chief Executive Officer of F&G, views and manages the business. F&G’s CODM uses the consolidated net earnings (loss) as reported on the Consolidated Statements of Operations to evaluate F&G’s results and measure profitability and performance. The measure of segment assets is reported on the Consolidated Balance Sheets as total consolidated assets.
Summarized financial information concerning our single reportable segment is shown in the following table (in millions).
| | | | | | | | | | | | | | | | | |
| Year Ended December 31, |
| 2024 | | 2023 | | 2022 |
| Revenues: | | | | | |
| Life-contingent pension risk transfer premiums | $ | 2,217 | | | $ | 1,964 | | | $ | 1,362 | |
| Traditional life insurance and life-contingent immediate annuity premiums | 35 | | | 43 | | | 33 | |
| Surrender charges | 268 | | | 103 | | | 58 | |
| Policyholder fees and other income | 340 | | | 303 | | | 251 | |
| Life insurance premiums and other fees | 2,860 | | | 2,413 | | | 1,704 | |
| Owned distribution revenues | 81 | | | — | | | — | |
| Revenues from external customers | 2,941 | | | 2,413 | | | 1,704 | |
| Interest and investment income | 2,719 | | | 2,211 | | | 1,655 | |
| Recognized gains and losses, net | 84 | | | (124) | | | (1,010) | |
| Total revenues | 5,744 | | | 4,500 | | | 2,349 | |
| Significant expenses (a): | | | | | |
| Benefits and other changes in policy reserves | 3,791 | | | 3,553 | | | 1,126 | |
| Personnel costs | 296 | | | 232 | | | 157 | |
| Other operating expenses | 203 | | | 146 | | | 102 | |
| Total significant expenses: | 4,290 | | | 3,931 | | | 1,385 | |
| Other segment items | | | | | |
| Market risk benefit (gains) losses | (25) | | | 95 | | | (182) | |
| Depreciation and amortization | 569 | | | 412 | | | 324 | |
| Interest expense | 132 | | | 97 | | | 29 | |
| Total other segment items: | 676 | | | 604 | | | 171 | |
| Total expenses | 4,966 | | | 4,535 | | | 1,556 | |
| Earnings (loss) before income taxes | 778 | | | (35) | | | 793 | |
| Income tax (benefit) expense | 136 | | | 23 | | | 158 | |
| Net earnings (loss) | $ | 642 | | | $ | (58) | | | $ | 635 | |
| | | | | |
| | | | | |
| | | | | |
| | | | | |
| | | | | |
|
| | | | | |
| | | | | |
| | | | | |
(a)The significant expense categories and amounts align with the segment-level information that is regularly provided to the CODM.
Item 9. Changes in and Disagreements With Accountants on Accounting and Financial Disclosures
None.
Item 9A. Controls and Procedures
Evaluation of Disclosure Controls and Procedures
An evaluation was performed under the supervision and with participation of the Company’s management, including the Chief Executive Officer (“CEO”) and Chief Financial Officer (“CFO”), of the effectiveness of the design and operation of the Company’s disclosure controls and procedures (as defined in Rules 13a-15(e) and 15d-15(e) of the Securities Exchange Act of 1934, as amended (the “Exchange Act”), as of the end of the period covered by this report. Based on that evaluation, the Company’s management, including the CEO and CFO, concluded that, as of December 31, 2024, the Company’s disclosure controls and procedures were effective to ensure that information we are required to disclose in reports that we file or submit under the Exchange Act is
recorded, processed, summarized and reported within the time periods specified in the SEC’s rules and forms, and is accumulated and communicated to the Company’s management, including the Company’s CEO and CFO, as appropriate to allow timely decisions regarding required disclosure.
Notwithstanding the foregoing, there can be no assurance that the Company’s disclosure controls and procedures will detect or uncover all failures of persons within the Company to disclose material information otherwise required to be set forth in the Company’s periodic reports. There are inherent limitations to the effectiveness of any system of disclosure controls and procedures, including the possibility of human error and the circumvention or overriding of the controls and procedures. Accordingly, even effective disclosure controls and procedures can only provide reasonable, not absolute, assurance of achieving their control objectives.
Management’s Report on Internal Control Over Financial Reporting
The Company’s management is responsible for establishing and maintaining adequate internal control over financial reporting for the Company, as such term is defined in Exchange Act Rules 13a-15(f) and 15d-15(f). Internal control over financial reporting is a process designed to provide reasonable assurance regarding the reliability of financial reporting and the preparation of financial statements for external purposes in accordance with generally accepted accounting principles. Internal control over financial reporting includes those policies and procedures that: (i) pertain to the maintenance of records that, in reasonable detail, accurately and fairly reflect the transactions and dispositions of the Company’s assets; (ii) provide reasonable assurance that transactions are recorded as necessary to permit preparation of the financial statements in accordance with generally accepted accounting principles, and that receipts and expenditures are being made only with proper authorizations; and (iii) provide reasonable assurance regarding prevention or timely detection of unauthorized acquisition, use or disposition of the Company’s assets that could have a material effect on the financial statements.
Because of its inherent limitations, internal control over financial reporting may not prevent or detect misstatements. These inherent limitations are an intrinsic part of the financial reporting process. Therefore, although the Company’s management is unable to eliminate this risk, it is possible to develop safeguards to reduce it. Also, projections of any evaluation of effectiveness to future periods are subject to the risk that controls may become inadequate because of changes in conditions, or that the degree of compliance with the policies or procedures may deteriorate.
We completed the Roar acquisition on January 2, 2024 (see Note P - Acquisitions of the Notes to Consolidated Financial Statements included in Part II. Item 8 of this Annual Report on Form 10-K). The scope of management’s assessment of the effectiveness of the Company’s disclosure controls and procedures did not include the internal controls over financial reporting of Roar. This exclusion is in accordance with the SEC Staff’s general guidance that an assessment of a recently acquired business may be omitted from the scope of management’s assessment for one year following the acquisition. Roar represented approximately 1.4% of our total revenues for the year ended December 31, 2024. Total assets of the acquired business as of December 31, 2024 represented approximately 0.5% of total consolidated assets, consisting principally of goodwill and intangible assets.
As a result of the closing of the Roar acquisition, we have incorporated internal controls over significant processes specific to the acquisition that we believe are appropriate and necessary in consideration of the level of related integration. As the post-closing integration continues, we will continue to review the internal controls and processes of Roar and may take further steps to integrate such controls and processes with those of the Company.
The Company's management, under the supervision of and with the participation of the CEO and CFO, assessed the effectiveness of the Company's internal control over financial reporting as of December 31, 2024 based on criteria for effective control over financial reporting described in Internal Control - Integrated Framework issued by the Committee of Sponsoring Organizations of the Treadway Commission (“COSO”) in 2013. Based on this assessment the Company's management concluded that its internal control over financial reporting was effective as of December 31, 2024 in accordance with the COSO criteria. The Company's independent registered public accounting firm, Ernst & Young LLP, has issued an attestation report on the effectiveness of the Company's internal control over financial reporting, which is included herein.
Changes in Internal Control Over Financial Reporting
An evaluation was performed under the supervision of the Company's management, including the CEO and CFO, of whether any change in the Company's internal control over financial reporting (as defined in the Exchange Act Rules 13a-15(f) and 15d-15(f)) occurred during the quarter ended December 31, 2024.
Based on that evaluation, the Company’s management, including the CEO and CFO, concluded that no change in the Company’s internal control over financial reporting occurred during the quarter ended December 31, 2024 that has materially affected, or is reasonably likely to materially affect, the Company’s internal control over financial reporting.
Limitations on the Effectiveness of Controls
A control system, no matter how well conceived and operated, can provide only reasonable, not absolute, assurance that the objectives of the control system are met. Because of the inherent limitations in all control systems, no evaluation of controls can provide absolute assurance that all control issues and instances of fraud, if any, within the Company have been detected.
Item 9B. Other Information
Refer to Note A - Business and Summary of Significant Accounting Policies, Recent Developments for a discussion of subsequent events.
During the quarter ended December 31, 2024, none of the Company’s directors or executive officers adopted or terminated any contract, instruction or written plan for the purchase or sale of Company securities that was intended to satisfy the affirmative defense conditions of Rule 10b5-1(c) or any “non-Rule 10b5-1 trading arrangement.”
Item 9C. Disclosures Regarding Foreign Jurisdiction that Prevent Inspections
Not applicable.
Part III
Items 10-14
Codes of Ethics
Our board of directors has adopted a Code of Ethics for Senior Financial Officers, which is applicable to our Chief Executive Officer, our Chief Financial Officer and our Chief Accounting Officer, and a Code of Business Conduct and Ethics, which is applicable to all our directors, officers and employees. The purpose of these codes is to: (i) promote honest and ethical conduct, including the ethical handling of conflicts of interest; (ii) promote full, fair, accurate, timely and understandable disclosure; (iii) promote compliance with applicable laws and governmental rules and regulations; (iv) ensure the protection of our legitimate business interests, including corporate opportunities, assets and confidential information; and (v) deter wrongdoing. Our codes of ethics are designed to maintain our commitment to our longstanding standards for ethical business practices. Our reputation for integrity is one of our most important assets and each of our employees and directors is expected to contribute to the care and preservation of that asset. Under our codes of ethics, an amendment to or a waiver or modification of any ethics policy applicable to our directors or executive officers must be disclosed to the extent required under Securities and Exchange Commission and/or New York Stock Exchange rules. We intend to disclose any such amendment or waiver by posting it on our website at www.investors.fglife.com.
Copies of our Code of Business Conduct and Ethics and our Code of Ethics for Senior Financial Officers are available for review on our website at www.investors.fglife.com.
Policy Prohibiting Insider Trading and Related Procedures
We have adopted an Insider Trading and Tipping Policy prohibiting insider trading and provides related procedures governing the purchase, sale, and other dispositions of the registrant's securities. This policy also prohibits tipping or disclosing material nonpublic information (“MNPI”) to outsiders. This policy is applicable to all directors, officers, employees, their immediate family, and any entities controlled by them who have regular access to MNPI. A copy of the insider trading policy is filed as an exhibit to this Annual Report on Form 10-K.
Within 120 days after the close of our fiscal year, we intend to file with the Securities and Exchange Commission the matters required by these items.
Part IV
Item 15. Exhibits, Financial Statement Schedules
List of Documents Filed
1) Financial Statements
See Index to Consolidated Financial Statements on Page 101 included in Item. 8 of Part II in this Annual Report on Form 10-K.
2) Financial Statement Schedules
Schedule I - Summary of Investments - Other than Investments in Related Parties
Schedule II - Condensed Financial Information of Parent Only
Schedule III - Supplementary Insurance Information
Schedule IV - Reinsurance
All other schedules have been omitted since they are either not applicable or the information is contained within the accompanying consolidated financial statements.
List of Exhibits
The following is a list of exhibits filed or incorporated by reference as a part of this Annual Report on Form 10-K.
| | | | | | | | | |
Exhibit No. | | Description of Exhibits | |
| 2.1 | | | |
| 3.1 | | | |
| 3.2 | | | |
| 3.3 | | | |
| 4.1 | | | |
| 4.2 | | | |
| 4.3 | | | |
| 4.4 | | | |
| | | | | | | | | |
| 4.5 | | | |
| 4.6 | | | |
| 4.7 | | | |
| 4.8 | | | |
| 4.9 | | | |
| 4.10 | | | |
| 4.11 | | | |
| 4.12 | | | |
| 4.13 | | Indenture, dated as of April 20, 2018, among Fidelity Guaranty & Life Holdings, Inc., the guarantors party thereto and Wells Fargo Bank, National Association, as trustee, including the form of 5.50% Note due 2025 (incorporated by reference to Exhibit No. 4.1 to the Company’s Amendment No. 3 to Form 10, filed with the Commission on November 10, 2022). | |
| 4.14 | | | |
| 4.15 | | Second Supplemental Indenture, dated as of June 1, 2020, among Fidelity National Financial, Inc., Fidelity & Guaranty Life Holdings, Inc., and Wells Fargo Bank, National Association, as trustee (incorporated by reference to Exhibit No. 4.3 to the Company’s Amendment No. 3 to Form 10, filed with the Commission on November 10, 2022). | |
| 4.16 | | | |
| 4.17 | | | |
| 10.1 | | | |
| 10.2 | | | |
| 10.3 | | | |
10.4† | | | |
| | | | | | | | | |
10.5† | | | |
10.6† | | | |
10.7† | | | |
10.8† | | | |
10.9† | | | |
| 10.10† | | | |
| 10.11 | | | |
| 10.12 | | | |
| 10.13 | | | |
| 10.14 | | | |
| 10.15 | | | |
| 10.16 | | | |
| 10.17 | | | |
| 10.18 | | | |
| 10.19 | | | |
| | | | | | | | | |
| 10.20 | | | |
| 10.21 | | | |
| 10.22 | | | |
| 10.23 | | | |
| 10.24 | | | |
10.25† | | | |
| 10.26 | | Amended and Restated Credit Agreement, dated as of February 16, 2024, by and among F&G Annuities & Life, Inc., a Delaware corporation, as the borrower, the guarantors party thereto, Bank of America, N.A., as administrative agent, and the financial institutions party thereto as lenders (incorporated by reference to Exhibit No. 10.1 to the Company’s Current Report on Form 8-K, filed with the Commission on February 16, 2024). | |
| 10.27 | | Registration Rights Agreement relating to the 7.400% Senior Notes due 2028, dated as of January 13, 2023, among F&G Annuities & Life, Inc., the guarantors named therein and BofA Securities, Inc., J.P. Morgan Securities LLC and RBC Capital Markets, LLC, as representatives of the initial purchasers (incorporated by reference to Exhibit No. 10.1 to the Company’s Current Report on Form 8-K, filed with the Commission on January 13, 2023). | |
| 10.28 | | | |
| 10.29 | | | |
10.30† | | | |
10.31† | | | |
| 10.32* | | | |
| 10.33*† | | | |
| 10.34*† | | | |
| 10.35 * | | | |
| 10.36*†^ | | | |
| 19.1* | | | |
| | | | | | | | | |
| 21.1* | | | |
| 23.1* | | | |
| 24* | | Power of Attorney (set forth on the signature page to this Annual Report on Form 10-K and incorporated by reference herein). | |
| 31.1* | | | |
| 31.2* | | | |
| 32.1** | | | |
| 32.2** | | | |
97 † | | | |
| 101.INS * | | Inline XBRL Instance Document-the instance document does not appear in the Interactive Data File because its XBRL tags are embedded within the Inline XBRL Document. | |
| 101.SCH * | | Inline XBRL Taxonomy Extension Schema Document. | |
| 101.CAL * | | Inline XBRL Taxonomy Extension Calculation Linkbase Document. | |
| 101.DEF * | | Inline XBRL Taxonomy Extension Definition Linkbase Document. | |
| 101.PRE * | | Inline XBRL Taxonomy Extension Presentation Linkbase Document. | |
| 101.LAB * | | Inline XBRL Taxonomy Extension Label Linkbase Document. | |
| 104* | | The cover page from the Company’s Annual Report on Form 10-K for the twelve-month period ended December 31, 2024 is formatted in Inline XBRL (Extensible Business Reporting Language) and contained in Exhibit 101. | |
| | | | | |
| * | Filed herewith. |
| ** | Furnished herewith. |
| † | Indicates management contract or compensatory plan or agreement. |
| ^ | Certain identified information has been excluded from the exhibit because it both (i) is not material and (ii) is the type of information that the company treats as confidential or private. |
Item 16. Form 10-K Summary
None.
Signatures
Pursuant to the requirements of section 13 or 15(d) of the Securities Exchange Act of 1934, the Registrant has duly caused this report to be signed on its behalf by the undersigned, thereunto duly authorized.
| | | | | | | | | | | |
| | F&G Annuities & Life, Inc. (Registrant) |
| | | |
| Date: | February 28, 2025 | By: | /s/ Wendy J.B. Young |
| | | Executive Vice President, Chief Financial Officer |
| | | (on behalf of the Registrant and as Principal Financial Officer) |
POWERS OF ATTORNEY
KNOW ALL BY THESE PRESENT, that each person whose signature appears below constitutes and appoints Christopher O. Blunt and Wendy J.B. Young, and each of them, acting individually, as his true and lawful attorney-in-fact and agent, each with full power of substitution and resubstitution, for him and in his name, place and stead, in any and all capacities, to sign any and all amendments to this report, and to file the same, with all exhibits thereto, and other documents in connection therewith, with the Securities and Exchange Commission, granting unto said attorneys-in-fact and agents, full power and authority to do and perform each and every act and thing requisite or necessary to be done in and about the premises, as fully to all intents and purposes as he might or could do in person, hereby ratifying and confirming all that said attorneys-in-fact and agents, or any of them, or their substitute or substitutes, may lawfully do or cause to be done by virtue hereof.
Pursuant to the requirements of the Securities Exchange Act of 1934, this report has been signed below by the following persons on behalf of the registrant and in the capacities and on the dates indicated.
| | | | | | | | | | | | | | |
| | | | |
| Signature | | Title | | Date |
| | | | |
| /s/ Christopher O. Blunt | | Director, Chief Executive Officer | | February 28, 2025 |
| Christopher O. Blunt | | (Principal Executive Officer) | | |
| | | | |
| /s/ Wendy J.B. Young | | Executive Vice President, Chief Financial Officer | | February 28, 2025 |
| Wendy J.B. Young | | (Principal Financial and Accounting Officer) | | |
| | | | |
| /s/ William P. Foley, II | | Director and Executive Chairman of the Board | | February 28, 2025 |
| William P. Foley, II | | | | |
| | | | |
| /s/ Douglas K. Ammerman | | Director | | February 28, 2025 |
| Douglas K. Ammerman | | | | |
| | | | |
| /s/ Celina J. Wang Doka | | Director | | February 28, 2025 |
| Celina Wang Doka | | | | |
| | | | |
| /s/ Douglas Martinez | | Director | | February 28, 2025 |
| Douglas Martinez | | | | |
| | | | |
| /s/ Michael J. Nolan | | Director | | February 28, 2025 |
| Michael J. Nolan | | | | |
| | | | |
| /s/ Raymond R. Quirk | | Director | | February 28, 2025 |
| Raymond R. Quirk | | | | |
| | | | |
| /s/ John D. Rood | | Director | | February 28, 2025 |
| John D. Rood | | | | |
| | | | |
Schedule I
F&G ANNUITIES & LIFE, INC. AND SUBSIDIARIES
SUMMARY OF INVESTMENTS - OTHER THAN INVESTMENTS IN RELATED PARTIES
| | | | | | | | | | | | | | | | | |
| December 31, 2024 |
| (In millions) | Amortized Cost | | Fair Value | | Amount Shown on Consolidated Balance Sheets |
| Fixed maturity securities, available for sale: | | | | | |
| United States Government full faith and credit | $ | 160 | | | $ | 158 | | | $ | 158 | |
| United States Government sponsored entities | 98 | | | 95 | | | 95 | |
| United States municipalities, states and territories | 1,592 | | | 1,346 | | | 1,346 | |
| Foreign Governments | 231 | | | 186 | | | 186 | |
| Corporate securities: | | | | | |
| Finance, insurance and real estate | 9,284 | | | 8,611 | | | 8,611 | |
| Manufacturing, construction and mining | 1,299 | | | 1,139 | | | 1,139 | |
| Utilities, energy and related sectors | 3,498 | | | 2,971 | | | 2,971 | |
| Wholesale/retail trade | 3,694 | | | 3,210 | | | 3,210 | |
| Services, media and other | 5,402 | | | 4,547 | | | 4,547 | |
| Hybrid securities | 604 | | | 581 | | | 581 | |
| Non-agency residential mortgage-backed securities | 2,763 | | | 2,693 | | | 2,693 | |
| Commercial mortgage-backed securities | 5,327 | | | 5,131 | | | 5,131 | |
| Asset-backed securities | 10,478 | | | 10,270 | | | 10,270 | |
| Collateralized loan obligations | 5,299 | | | 5,379 | | | 5,379 | |
| Total fixed maturity securities, available for sale | $ | 49,729 | | | $ | 46,317 | | | $ | 46,317 | |
| Equity securities | 468 | | | 415 | | | 415 | |
| Limited partnerships: | | | | | |
| Private equity | 1,830 | | | 1,830 | | | 1,830 | |
| Real assets | 444 | | | 437 | | | 437 | |
| Credit | 1,021 | | | 1,021 | | | 1,021 | |
| Limited partnerships | 3,295 | | | 3,288 | | | 3,288 | |
| Commercial mortgage loans | 2,705 | | | 2,404 | | | 2,705 | |
| Residential mortgage loans | 3,221 | | | 2,916 | | | 3,221 | |
| Other (primarily derivatives and company owned life insurance) | 1,489 | | | 1,476 | | | 1,476 | |
| Short term investments | 2,410 | | | 2,410 | | | 2,410 | |
| Total investments | $ | 63,317 | | | $ | 59,226 | | | $ | 59,832 | |
See Report of Independent Registered Public Accounting Firm
Schedule II
F&G ANNUITIES & LIFE, INC. (Parent Only)
CONDENSED FINANCIAL INFORMATION OF PARENT ONLY
SUPPLEMENTAL CONDENSED BALANCE SHEETS
| | | | | | | | | | | |
| (In millions) | December 31, |
| 2024 | | 2023 |
| Assets | | | |
| Investments in consolidated subsidiaries | $ | 5,545 | | | $ | 4,236 | |
| Fixed maturity securities, available for sale | — | | | 54 | |
| Mortgage loans, net of allowance for credit losses of $3 and $0 at December 31, 2024 and 2023, respectively | 84 | | | — | |
| Cash and cash equivalents | 202 | | | 12 | |
| Prepaid expenses and other assets | 11 | | | 3 | |
| | | |
| | | |
| Income taxes receivable | 22 | | | 13 | |
| Total assets | $ | 5,864 | | | $ | 4,318 | |
| | | |
| Liabilities and Equity | | | |
| Accounts payable and other liabilities | $ | 37 | | | $ | 20 | |
| Intercompany payables | 6 | | | 1 | |
| Notes payable | 1,870 | | | 1,194 | |
| Total liabilities | 1,913 | | | 1,215 | |
| | | |
| Equity: | | | |
| Preferred stock $0.001 par value; authorized 25,000,000 shares as of December 31, 2024 and 2023; outstanding and issued 5,000,000 and 0 shares as of December 31, 2024 and 2023, respectively | — | | | — | |
| F&G common stock, $0.001 par value; authorized 500,000,000 shares as of December 31, 2024 and 2023; outstanding of 126,792,844 and 126,332,142 as of December 31, 2024 and 2023, respectively, and issued of 127,952,143 and 127,234,902 as of December 31, 2024 and 2023, respectively | — | | | — | |
| Additional paid-in-capital | 3,464 | | | 3,185 | |
| Retained earnings | 2,440 | | | 1,926 | |
| Accumulated other comprehensive income (loss) | (1,923) | | | (1,990) | |
Treasury stock, at cost (1,159,299 shares and 902,760 shares as of December 31, 2024 and 2023, respectively) | (30) | | | (18) | |
| Total equity | 3,951 | | | 3,103 | |
| Total liabilities and equity | $ | 5,864 | | | $ | 4,318 | |
See Report of Independent Registered Public Accounting Firm.
Schedule II (continued)
F&G ANNUITIES & LIFE, INC. (Parent Only)
CONDENSED FINANCIAL INFORMATION OF PARENT ONLY
SUPPLEMENTAL CONDENSED INCOME STATEMENTS
| | | | | | | | | | | | | | | | | |
| (In millions) | Year ended December 31, |
| 2024 | | 2023 | | 2022 |
| Revenues: | | | | | |
| Life insurance premiums and other fees | $ | 2 | | | $ | 3 | | | $ | — | |
| Interest and investment income | 18 | | | 16 | | | 3 | |
| Total revenues | 20 | | | 19 | | | 3 | |
| Expenses: | | | | | |
| Other operating expenses | 7 | | | 5 | | | — | |
| Interest expense | 118 | | | 75 | | | 7 | |
| Total expenses | 125 | | | 80 | | | 7 | |
| Earnings (loss) before income tax expense and equity in earnings of subsidiaries | (105) | | | (61) | | | (4) | |
| Income tax benefit | (21) | | | (13) | | | (24) | |
| Earnings (loss) before equity in earnings of subsidiaries | (84) | | | (48) | | | 20 | |
| Equity in earnings (loss) of subsidiaries | 723 | | | (10) | | | 615 | |
| Net earnings (loss) | 639 | | | (58) | | | 635 | |
| Less: Preferred stock dividend | 17 | | | — | | | — | |
| Net earnings (loss) attributable to F&G common shareholders | $ | 622 | | | $ | (58) | | | $ | 635 | |
See Report of Independent Registered Public Accounting Firm.
Schedule II (continued)
F&G ANNUITIES & LIFE, INC. (Parent Only)
CONDENSED FINANCIAL INFORMATION OF PARENT ONLY
SUPPLEMENTAL CONDENSED CASH FLOW STATEMENTS
| | | | | | | | | | | | | | | | | |
| (In millions) | Year ended December 31, |
| 2024 | | 2023 | | 2022 |
| Cash Flows from Operating Activities: | | | | | |
| Net earnings (loss) | $ | 639 | | | $ | (58) | | | $ | 635 | |
| Adjustments to reconcile net earnings to net cash (used in) provided by operating activities: | | | | | |
| Equity in (earnings) loss of subsidiaries | (723) | | | 10 | | | (615) | |
| Loss on sales of investments | 2 | | | — | | | 1 | |
| Stock-based compensation cost | 29 | | | 23 | | | 12 | |
| Net change in income taxes | (9) | | | 47 | | | (25) | |
| Net change in other assets and other liabilities | (65) | | | (28) | | | (9) | |
| Net cash used in operating activities | (127) | | | (6) | | | (1) | |
| | | | | |
| Cash Flows from Investing Activities: | | | | | |
| Proceeds from sales, calls and maturities of investments | 28 | | | 2 | | | 4 | |
| Net cash provided by investing activities | 28 | | | 2 | | | 4 | |
| | | | | |
| Cash Flows from Financing Activities: | | | | | |
| Borrowings | 1,050 | | | 845 | | | 550 | |
| Debt issuance costs | (20) | | | (12) | | | (4) | |
| | | | | |
| Capital contributions | (493) | | | (589) | | | (500) | |
| Net revolving credit facility (repayments) borrowings | (365) | | | (185) | | | — | |
| Dividends paid | (121) | | | (77) | | | — | |
| Purchases of treasury stock | (12) | | | (18) | | | — | |
| Issuance of preferred stock | 250 | | | — | | | — | |
| Net cash provided by (used in) financing activities | 289 | | | (36) | | | 46 | |
| | | | | |
| Net increase (decrease) in cash and cash equivalents | 190 | | | (40) | | | 49 | |
| Cash and cash equivalents at beginning of period | 12 | | | 52 | | | 3 | |
| Cash and cash equivalents at end of period | $ | 202 | | | $ | 12 | | | $ | 52 | |
See Report of Independent Registered Public Accounting Firm.
Schedule III
F&G ANNUITIES & LIFE, INC. AND SUBSIDIARIES
SUPPLEMENTARY INSURANCE INFORMATION
| | | | | | | | | | | | | | | | | |
| (In millions) | Year ended December 31, |
| 2024 | | 2023 | | 2022 |
| | | | | |
| Deferred acquisition costs | $ | 3,036 | | | $ | 2,215 | | | $ | 1,411 | |
| Future policy benefits, losses, claims and loss expenses | 8,749 | | | 7,050 | | | 5,021 | |
| Other policy claims and benefits payable | 102 | | | 92 | | | 109 | |
| Life insurance premiums and other fees | 2,860 | | | 2,413 | | | 1,704 | |
| Interest and investment income | 2,719 | | | 2,211 | | | 1,655 | |
| Benefits, claims, losses and settlement expenses | (3,791) | | | (3,553) | | | (1,126) | |
| Amortization of deferred policy acquisition costs | (280) | | | (191) | | | (99) | |
| Other operating expenses, net of deferrals | (203) | | | (146) | | | (102) | |
See Report of Independent Registered Public Accounting Firm.
Schedule IV
F&G ANNUITIES & LIFE, INC. AND SUBSIDIARIES
SUPPLEMENTAL REINSURANCE SCHEDULE
(In millions)
| | | | | | | | | | | | | | | | | | | | | | | | | | | | | |
| For the year ended December 31, 2024 | Gross Amount | | Ceded to other companies | | Assumed from other companies | | Net Amount | | Percentage of amount assumed to net |
| Life insurance in force | $ | 10,906 | | | $ | (1,370) | | | $ | — | | | $ | 9,536 | | | — | % |
| | | | | | | | | |
| Premiums and other considerations: | | | | | | | | | |
| Traditional life insurance premiums | 129 | | | (94) | | | — | | | 35 | | | — | |
| Life-contingent PRT premiums | 2,217 | | | — | | | — | | | 2,217 | | | — | |
| Annuity product charges and other fees | 655 | | | (47) | | | — | | | 608 | | | — | |
| Total premiums and other considerations | $ | 3,001 | | | $ | (141) | | | $ | — | | | $ | 2,860 | | | — | % |
| | | | | | | | | | | | | | | | | | | | | | | | | | | | | |
| For the year ended December 31, 2023 | Gross Amount | | Ceded to other companies | | Assumed from other companies | | Net Amount | | Percentage of amount assumed to net |
| Life insurance in force | $ | 8,448 | | | $ | (1,436) | | | $ | — | | | $ | 7,012 | | | — | % |
| | | | | | | | | |
| Premiums and other considerations: | | | | | | | | | |
| Traditional life insurance premiums | 148 | | | (105) | | | — | | | 43 | | | — | |
| Life-contingent PRT premiums | 1,964 | | | — | | | — | | | 1,964 | | | — | |
| Annuity product charges and other fees | 455 | | | (49) | | | — | | | 406 | | | — | |
| Total premiums and other considerations | $ | 2,567 | | | $ | (154) | | | $ | — | | | $ | 2,413 | | | — | % |
| | | | | | | | | | | | | | | | | | | | | | | | | | | | | |
| For the year ended December 31, 2022 | Gross Amount | | Ceded to other companies | | Assumed from other companies | | Net Amount | | Percentage of amount assumed to net |
| Life insurance in force | $ | 6,296 | | | $ | (1,524) | | | $ | — | | | $ | 4,772 | | | — | % |
| | | | | | | | | |
| Premiums and other considerations: | | | | | | | | | |
| Traditional life insurance premiums | 160 | | | (128) | | | — | | | 32 | | | — | |
| Life-contingent PRT premiums | 1,362 | | | — | | | — | | | 1,362 | | | — | |
| Annuity product charges and other fees | 360 | | | (50) | | | — | | | 310 | | | — | |
| Total premiums and other considerations | $ | 1,882 | | | $ | (178) | | | $ | — | | | $ | 1,704 | | | — | % |
See Report of Independent Registered Public Accounting Firm.