UNITED STATES
SECURITIES AND EXCHANGE COMMISSION
Washington, D.C. 20549
FORM N-CSR
CERTIFIED SHAREHOLDER REPORT OF REGISTERED
MANAGEMENT INVESTMENT COMPANIES
Investment Company Act File Number:
811-23812
Elevation Series Trust
(Exact Name of Registrant as Specified in Charter)
1700 Broadway, Suite 1850
Denver, CO 80290
(Address of Principal Executive Offices) (Zip Code)
Chris Moore
Elevation Series Trust
1700 Broadway, Suite 1850
Denver, CO 80290
(Name and Address of Agent for Service)
Registrant’s Telephone Number, including Area Code:
303-226-4150
With a copy to:
JoAnn M. Strasser
Thompson Hine LLP
17th Floor
41 South High Street
Columbus, Ohio 43215
Date of Fiscal Year End: October 31st
Date of Reporting Period: November 1, 2023 – October 31, 2024
Item 1. Reports to Stockholders.
(a) The Reports to Stockholders are attached herewith.
This annual shareholder report contains important information about the SRH REIT Covered Call ETF for the period of November 1, 2023 (commencement of operations) to October 31, 2024. Please contact us at 877-524-9155 or SRHetfs@paralel.com or visit our website at https://srhfunds.com/srhr for additional information.
ANNUAL SHAREHOLDER REPORT
October 31, 2024
WHAT WERE THE FUND'S COSTS FOR THE PAST YEAR?
(based on a hypothetical $10,000 investment)
| FUND NAME | COSTS OF A $10,000 INVESTMENTFootnote Reference1 | COSTS PAID AS A PERCENTAGE OF A $10,000 INVESTMENT |
|---|
| SRH REIT Covered Call ETF | $85 | 0.75% |
| Footnote | Description |
Footnote1 | The costs paid by the Fund reflect the period of November 1, 2023 (commencement of operations) to October 31, 2024. Such costs would be higher for a full year. |
HOW DID THE FUND PERFORM THE PAST YEAR?
From its inception on November 1, 2023, through October 31, 2024 (the “Period”), the SRH REIT Covered Call ETF (the “Fund”) delivered a 26.42% return on a net asset value (NAV) basis. By comparison, its benchmark, the Morningstar US Real Estate Index, returned 33.57%, while the S&P 500 Index achieved a return of 36.58%.
As anticipated, the Fund's covered call strategy typically underperforms non-covered call strategies, such as those employed by its benchmark and the S&P 500 Index, during periods of strong market gains, such as those seen during the Period. However, management is not satisfied with the extent of the underperformance. The Fund’s sub-sector allocation contributed to some of the underperformance. Specifically, the Fund’s overweight position in Hotel REITs and underweight in Healthcare REITs detracted from performance relative to the benchmark. On a positive note, the Fund’s overweight position in Office REITs relative to the index helped provide some outperformance. The Fund underperformed relative to the S&P 500 Index, which experienced significant gains during the Period, primarily driven by the technology sector's strong performance. Unlike the S&P 500, the Fund had no exposure to the technology sector, contributing to its relative underperformance.
Management is focused on using insights gained from the Fund's first year to continually enhance its strategy. Thank you for your investment in the Fund.
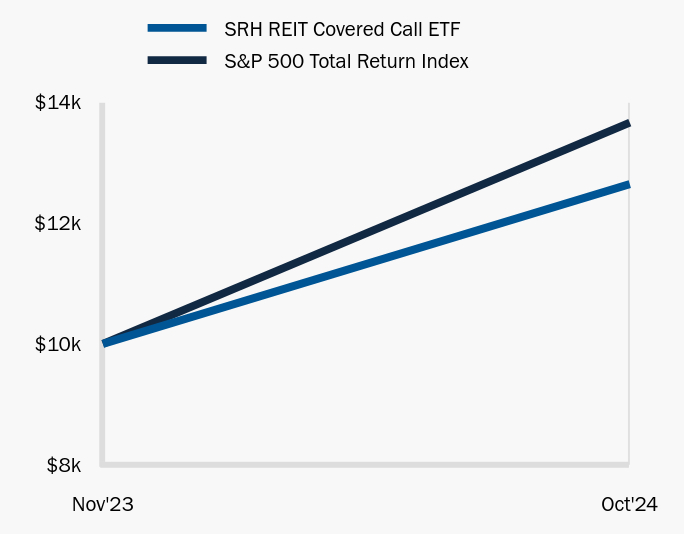
HOW DID THE FUND PERFORM SINCE INCEPTION?
This chart shows the value of a $10,000 investment in the share class noted since inception. The result is compared with the Fund's benchmark.
TOTAL RETURN BASED ON A $10,000 INVESTMENT
| SRH REIT Covered Call ETF | S&P 500 Total Return Index |
|---|
| Nov'23 | 10,000 | 10,000 |
| Oct'24 | 12,642 | 13,658 |
The chart above represents historical performance of a hypothetical investment of $10,000 in the Fund since inception. Performance data quoted represents past performance and does not guarantee future results. Returns shown are total returns, which assume the reinvestment of dividends and capital gains. The table presented below and graph presented above do not reflect the deduction of taxes a shareholder would pay on fund distributions or the redemption of fund shares.
| Total Net Assets | $53,416,584 |
| # of Portfolio Holdings | 27 |
| Portfolio Turnover Rate | 44% |
| Total Advisory Fees Paid | $383,817 |
AVERAGE ANNUAL TOTAL RETURNS
| . | Since Inception (November 1, 2023) |
|---|
| SRH REIT Covered Call ETF | 26.42% |
| S&P 500 Total Return Index | 36.58% |
Past performance does not guarantee future results. Call 877-524-9155 or visit https://srhfunds.com/srhr for current month-end performance.
Returns are cumulative for periods of less than one year.
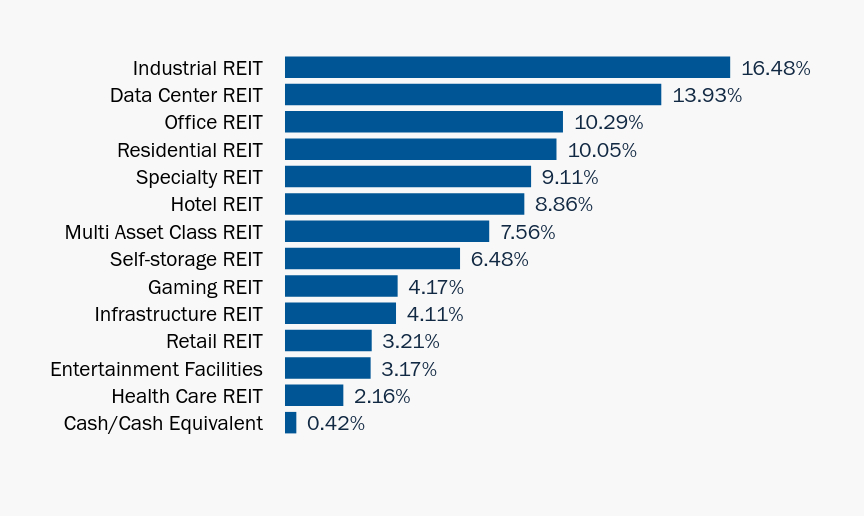
WHAT DID THE FUND INVEST IN?
REIT SUBSECTOR
(Expressed as % of Total Investments)
| Value | Value |
|---|
| Cash/Cash Equivalent | 0.42% |
| Health Care REIT | 2.16% |
| Entertainment Facilities | 3.17% |
| Retail REIT | 3.21% |
| Infrastructure REIT | 4.11% |
| Gaming REIT | 4.17% |
| Self-storage REIT | 6.48% |
| Multi Asset Class REIT | 7.56% |
| Hotel REIT | 8.86% |
| Specialty REIT | 9.11% |
| Residential REIT | 10.05% |
| Office REIT | 10.29% |
| Data Center REIT | 13.93% |
| Industrial REIT | 16.48% |
SRH REIT COVERED CALL ETF
ANNUAL SHAREHOLDER REPORT
October 31, 2024
877-524-9155
SRHetfs@paralel.com
If you wish to view additional information about the Fund; including but not limited to fund prospectus, financial statements, holdings, or proxy voting information, please visit https://srhfunds.com/srhr.
This annual shareholder report contains important information about the SRH U.S. Quality ETF for the period of November 1, 2023 to October 31, 2024. Please contact us at 877-524-9155 or SRHetfs@paralel.com or visit our website at https://srhfunds.com/srhq for additional information.
ANNUAL SHAREHOLDER REPORT
October 31, 2024
WHAT WERE THE FUND'S COSTS FOR THE PAST YEAR?
(based on a hypothetical $10,000 investment)
| FUND NAME | COSTS OF A $10,000 INVESTMENT | COSTS PAID AS A PERCENTAGE OF A $10,000 INVESTMENT |
|---|
| SRH U.S. Quality ETF | $41 | 0.35% |
HOW DID THE FUND PERFORM THE PAST YEAR?
For the fiscal year ended October 31, 2024, the SRH U.S. Quality ETF (the “Fund”) delivered a 34.00% return on a net asset value (NAV) basis. U.S. equity markets, marked by volatility, saw strong gains in the period, with large-cap technology stocks leading the way. The S&P 500 Index returned 38.02% during the period, driven by positive U.S. economic sentiment, a strong labor market, and easing inflation. During the period, the Fund’s portfolio exposure was tilted toward mid-cap equities, which, although saw strong gains, underperformed relative to large-cap equities, on average. The Fund’s underperformance relative to the S&P 500 Index was partly attributed to its relatively lower exposure to large-cap equities compared to the S&P 500 Index.
Dell Technologies was the Fund’s top-performing investment, contributing 2.02% to the NAV return, while Humana was the largest detractor, reducing NAV return by -1.10%. Technology sector investments provided the highest positive returns overall. Looking forward, the U.S. equity market’s performance will likely depend on interest rates, inflation, corporate earnings, and fiscal and monetary policies. While the Fund’s track record is limited, we believe its strategy provides a basis to deliver positive long-term shareholder value. Thank you for your investment in the Fund.
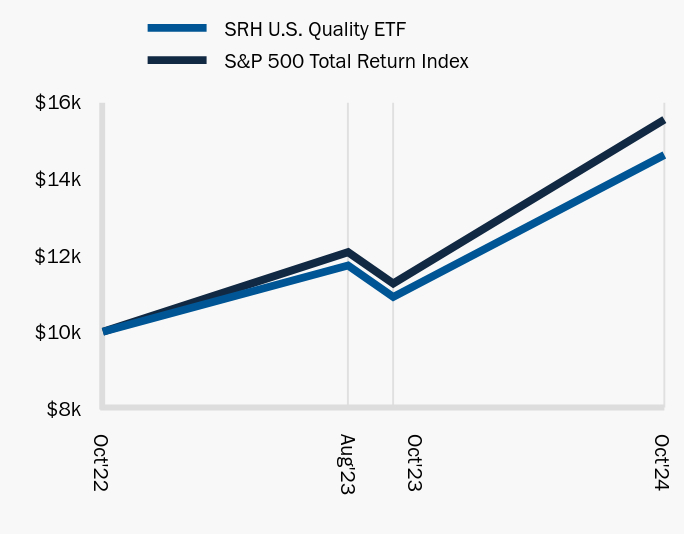
HOW DID THE FUND PERFORM SINCE INCEPTION?
This chart shows the value of a $10,000 investment in the share class noted since inception. The result is compared with the Fund's benchmark.
TOTAL RETURN BASED ON A $10,000 INVESTMENT
| SRH U.S. Quality ETF | S&P 500 Total Return Index |
|---|
| Oct'22 | 10,000 | 10,000 |
| Aug'23 | 11,729 | 12,078 |
| Oct'23 | 10,908 | 11,260 |
| Oct'24 | 14,617 | 15,541 |
The chart above represents historical performance of a hypothetical investment of $10,000 in the Fund since inception. Performance data quoted represents past performance and does not guarantee future results. Returns shown are total returns, which assume the reinvestment of dividends and capital gains. The table presented below and graph presented above do not reflect the deduction of taxes a shareholder would pay on fund distributions or the redemption of fund shares.
| Total Net Assets | $147,544,024 |
| # of Portfolio Holdings | 63 |
| Portfolio Turnover Rate | 40% |
| Total Advisory Fees Paid | $472,624 |
AVERAGE ANNUAL TOTAL RETURNS
| . | 1 YR | Since Inception (October 4, 2022) |
|---|
| SRH U.S. Quality ETF | 34.00% | 20.09% |
| S&P 500 Total Return Index | 38.02% | 23.69% |
Past performance does not guarantee future results. Call 877-524-9155 or visit https://srhfunds.com/srhq for current month-end performance.
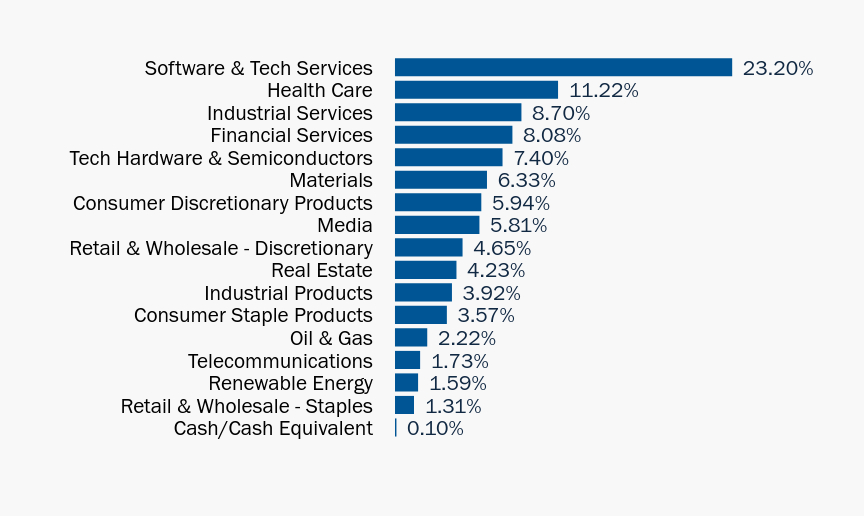
WHAT DID THE FUND INVEST IN?
INDUSTRY
(Expressed as % of Total Investments)
| Value | Value |
|---|
| Cash/Cash Equivalent | 0.10% |
| Retail & Wholesale - Staples | 1.31% |
| Renewable Energy | 1.59% |
| Telecommunications | 1.73% |
| Oil & Gas | 2.22% |
| Consumer Staple Products | 3.57% |
| Industrial Products | 3.92% |
| Real Estate | 4.23% |
| Retail & Wholesale - Discretionary | 4.65% |
| Media | 5.81% |
| Consumer Discretionary Products | 5.94% |
| Materials | 6.33% |
| Tech Hardware & Semiconductors | 7.40% |
| Financial Services | 8.08% |
| Industrial Services | 8.70% |
| Health Care | 11.22% |
| Software & Tech Services | 23.20% |
ANNUAL SHAREHOLDER REPORT
October 31, 2024
877-524-9155
SRHETFs@paralel.com
If you wish to view additional information about the Fund; including but not limited to fund prospectus, financial statements, holdings, or proxy voting information, please visit https://srhfunds.com/srhq.
This annual shareholder report contains important information about the TrueShares Quarterly Bear Hedge ETF for the period of June 28, 2024 (commencement of operations) to October 31, 2024. Please contact us at 877-774-TRUE (8783) or info@true-shares.com or visit our website at https://www.true-shares.com/qber/ for additional information.
ANNUAL SHAREHOLDER REPORT
October 31, 2024
Cboe Exchange, Inc.: QBER
TRUESHARES QUARTERLY BEAR HEDGE ETF
WHAT WERE THE FUND'S COSTS FOR THE PAST YEAR?
(based on a hypothetical $10,000 investment)
| FUND NAME | COSTS OF A $10,000 INVESTMENTFootnote Reference1 | COSTS PAID AS A PERCENTAGE OF A $10,000 INVESTMENT |
|---|
| TrueShares Quarterly Bear Hedge ETF | $27 | 0.79% |
| Footnote | Description |
Footnote1 | The costs paid by the Fund reflect the period of June 28, 2024 (commencement of operations) to October 31, 2024. Such costs would be higher for a full year. |
HOW DID THE FUND PERFORM THE PAST YEAR?
TrueShares Quarterly Bear Hedge ETF (QBER) is designed to deliver principal protection with modest capital appreciation potential during equity market drawdowns. The fund utilizes an option-based strategy that purchases long puts to capture upside if the markets trend downward. During the reporting period (since June 28, 2024 inception), the fund underperformed the S&P 500 by 4.61% with a total return of 0.32%. The Fund’s T-bill holdings provided most of the Fund’s positive performance. Additionally, the Fund’s put option exposure detracted from performance as the U.S. equity markets were positive during the period. The Fund’s lack of exposure to the U.S. equity market accounts for the 4.61% lag when compared to the S&P 500, which is to be expected given the Fund’s partial mandate to provide substantial protection of principal. This period underscored the relevance of products that allow investors to make tactical decisions on how to protect their capital, especially during times of uncertainly like the 2024 election cycle. While markets continued to rise, QBER offered the potential for peace of mind.
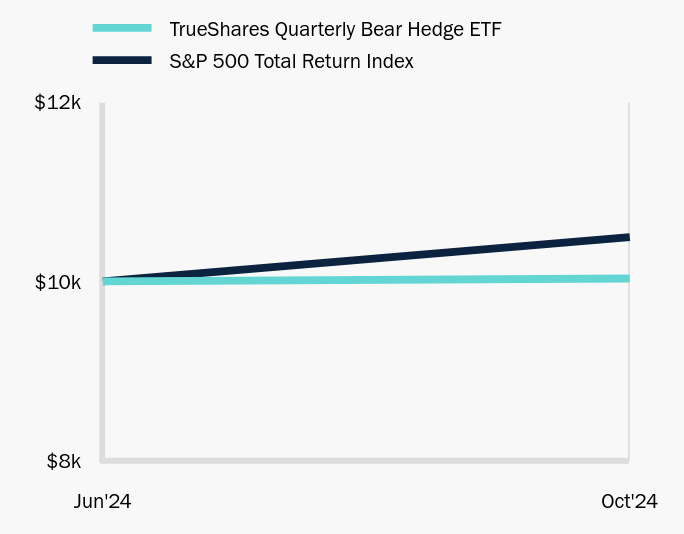
HOW DID THE FUND PERFORM SINCE INCEPTION?
This chart shows the value of a $10,000 investment in the share class noted since inception. The result is compared with the Fund's benchmark.
TOTAL RETURN BASED ON A $10,000 INVESTMENT
| TrueShares Quarterly Bear Hedge ETF | S&P 500 Total Return Index |
|---|
| Jun'24 | 10,000 | 10,000 |
| Oct'24 | 10,032 | 10,493 |
The chart above represents historical performance of a hypothetical investment of $10,000 in the Fund since inception. Performance data quoted represents past performance and does not guarantee future results. Returns shown are total returns, which assume the reinvestment of dividends and capital gains. The table presented below and graph presented above do not reflect the deduction of taxes a shareholder would pay on fund distributions or the redemption of fund shares.
| Total Net Assets | $80,504,483 |
| # of Portfolio Holdings | 3 |
| Portfolio Turnover Rate | 0% |
| Total Advisory Fees Paid | $150,458 |
AVERAGE ANNUAL TOTAL RETURNS
| . | Since Inception (June 28, 2024) |
|---|
| TrueShares Quarterly Bear Hedge ETF | 0.32% |
| S&P 500 Total Return Index | 4.93% |
Past performance does not guarantee future results. Call 877-774-TRUE (8783) or visit https://www.true-shares.com/qber/ for current month-end performance.
Returns are cumulative for periods of less than one year.
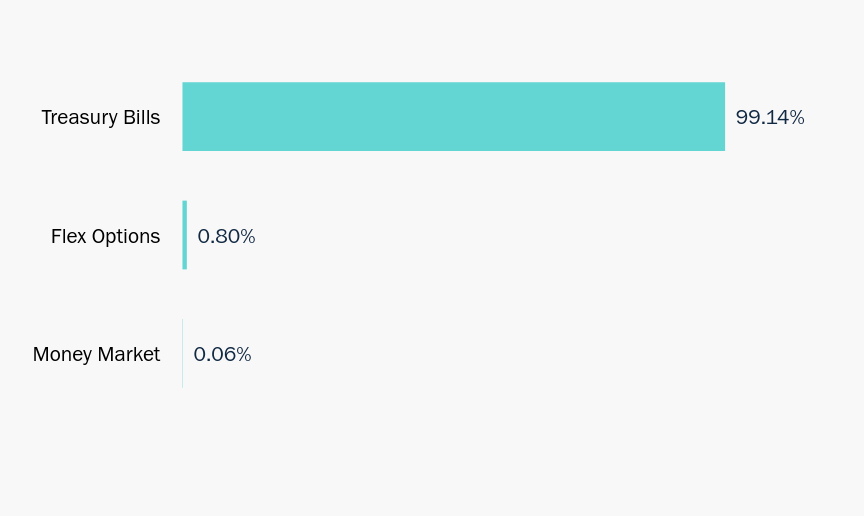
WHAT DID THE FUND INVEST IN?
INVESTMENT TYPE
(Expressed as % of Total Investments)
| Value | Value |
|---|
| Money Market | 0.06% |
| Flex Options | 0.80% |
| Treasury Bills | 99.14% |
TRUESHARES QUARTERLY BEAR HEDGE ETF
ANNUAL SHAREHOLDER REPORT
October 31, 2024
Cboe Exchange, Inc.: QBER
877-774-TRUE (8783)
info@true-shares.com
If you wish to view additional information about the Fund; including but not limited to fund prospectus, financial statements, holdings, or proxy voting information, please visit https://www.true-shares.com/qber/.
This annual shareholder report contains important information about the TrueShares Quarterly Bull Hedge ETF for the period of June 28, 2024 (commencement of operations) to October 31, 2024. Please contact us at 877-774-TRUE (8783) or info@true-shares.com or visit our website at https://www.true-shares.com/qbul/ for additional information.
ANNUAL SHAREHOLDER REPORT
October 31, 2024
Cboe Exchange, Inc.: QBUL
TRUESHARES QUARTERLY BULL HEDGE ETF
WHAT WERE THE FUND'S COSTS FOR THE PAST YEAR?
(based on a hypothetical $10,000 investment)
| FUND NAME | COSTS OF A $10,000 INVESTMENTFootnote Reference1 | COSTS PAID AS A PERCENTAGE OF A $10,000 INVESTMENT |
|---|
| TrueShares Quarterly Bull Hedge ETF | $27 | 0.79% |
| Footnote | Description |
Footnote1 | The costs paid by the Fund reflect the period of June 28, 2024 (commencement of operations) to October 31, 2024. Such costs would be higher for a full year. |
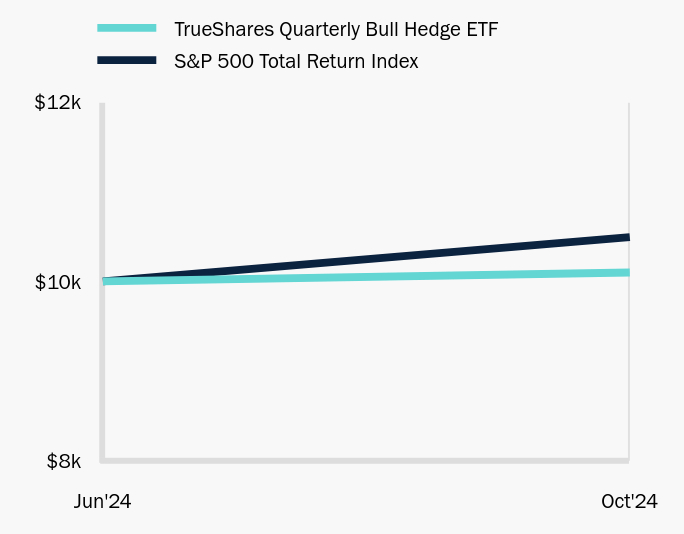
HOW DID THE FUND PERFORM THE PAST YEAR?
TrueShares Quarterly Bull Hedge ETF (QBUL) is designed to pursue capital appreciation while prioritizing the protection of principal. The fund utilizes an option-based strategy that purchases long calls to capture upside if the markets trend upward. During the reporting period (since June 28, 2024 inception), the fund underperformed the S&P 500 by 3.93% with a total return of 1.00%. The Fund’s call options on the SPDR S&P 500 ETF Trust provided most of the Fund’s positive performance. However, the option exposure was not scaled to provide full exposure the U.S. equity markets, which accounts for most of the 3.93% lag when compared to the S&P 500. This is to be expected given the Fund’s partial mandate to provide substantial protection of principal. This period was shaped by volatile global markets, lower interest rates, and heightened political tensions. Equity markets presented both opportunities and risks, but continued to rise to record highs. Facing unsteady economic data, and inflationary pressures globally, the bullish approach continued to illustrate the importance of maintaining long equity participation.
HOW DID THE FUND PERFORM SINCE INCEPTION?
This chart shows the value of a $10,000 investment in the share class noted since inception. The result is compared with the Fund's benchmark.
TOTAL RETURN BASED ON A $10,000 INVESTMENT
| TrueShares Quarterly Bull Hedge ETF | S&P 500 Total Return Index |
|---|
| Jun'24 | 10,000 | 10,000 |
| Oct'24 | 10,100 | 10,493 |
The chart above represents historical performance of a hypothetical investment of $10,000 in the Fund since inception. Performance data quoted represents past performance and does not guarantee future results. Returns shown are total returns, which assume the reinvestment of dividends and capital gains. The table presented below and graph presented above do not reflect the deduction of taxes a shareholder would pay on fund distributions or the redemption of fund shares.
| Total Net Assets | $46,965,103 |
| # of Portfolio Holdings | 3 |
| Portfolio Turnover Rate | 0% |
| Total Advisory Fees Paid | $106,350 |
AVERAGE ANNUAL TOTAL RETURNS
| . | Since Inception (June 28, 2024) |
|---|
| TrueShares Quarterly Bull Hedge ETF | 1.00% |
| S&P 500 Total Return Index | 4.93% |
Past performance does not guarantee future results. Call 877-774-TRUE (8783) or visit https://www.true-shares.com/qbul/ for current month-end performance.
Returns are cumulative for periods of less than one year.
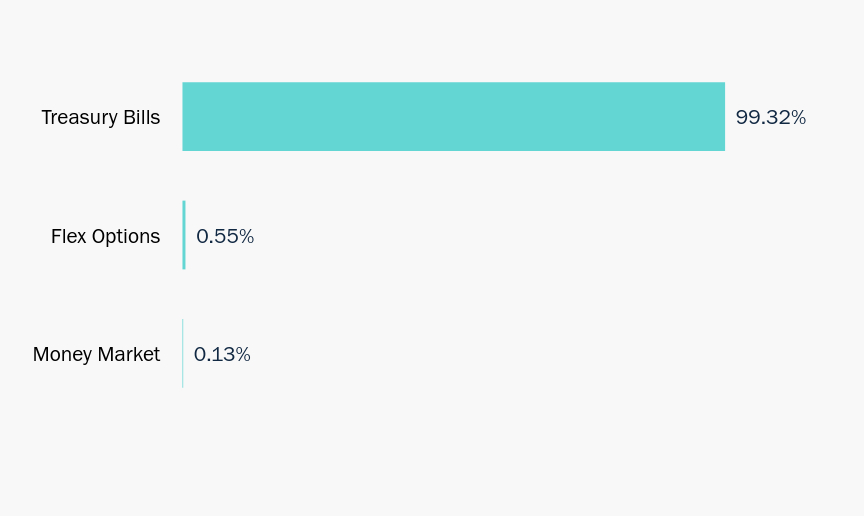
WHAT DID THE FUND INVEST IN?
INVESTMENT TYPE
(Expressed as % of Total Investments)
| Value | Value |
|---|
| Money Market | 0.13% |
| Flex Options | 0.55% |
| Treasury Bills | 99.32% |
TRUESHARES QUARTERLY BULL HEDGE ETF
ANNUAL SHAREHOLDER REPORT
October 31, 2024
Cboe Exchange, Inc.: QBUL
877-774-TRUE (8783)
info@true-shares.com
If you wish to view additional information about the Fund; including but not limited to fund prospectus, financial statements, holdings, or proxy voting information, please visit https://www.true-shares.com/qbul/.
(b) Not applicable.
Item 2. Code of Ethics.
(a) As of the end of the period covered by this report, the Registrant has adopted a code of ethics that applies to the Registrant’s principal executive officer, principal financial officer, principal accounting officer or controller, or persons performing similar functions, regardless of whether these individuals are employed by the Registrant or a third party.
(b) For purposes of this item, “code of ethics” means written standards that are reasonably designed to deter wrongdoing and to promote:
(1) Honest and ethical conduct, including the ethical handling of actual or apparent conflicts of interest between personal and professional relationships;
(2) Full, fair, accurate, timely, and understandable disclosure in reports and documents that a Registrant files with, or submits to, the Commission and in other public communications made by the Registrant;
(3) Compliance with applicable governmental laws, rules, and regulations;
(4) The prompt internal reporting of violations of the code to an appropriate person or persons identified in the code; and
(5) Accountability for adherence to the code.
(c) During the period covered by this report, there were no amendments to the provisions of the code of ethics adopted in Item 2(a) of this report.
(d) During the period covered by this report, the Registrant had not granted any express or implicit waivers from the provisions of the code of ethics adopted in Item 2(a) of this report.
(e) Not applicable.
(f) The Registrant’s code of ethics referred to in Item 2(a) above is attached as Exhibit 19(a)(l), hereto.
Item 3. Audit Committee Financial Expert.
As of the end of the period covered by the report, the Registrant’s Board of Trustees has determined that Kimberly Storms is qualified to serve as an audit committee financial expert serving on its audit committee and that she is “independent,” as defined in paragraph (a)(2) of Item 3 to Form N-CSR.
Item 4. Principal Accountant Fees and Services.
The following table sets forth the aggregate audit and non-audit fees billed to the Registrant for each of the last two fiscal years for professional services rendered by the Registrant’s principal accountant, Cohen & Company, Ltd. (“Cohen”).
| SRH U.S. Quality ETF | Fiscal year ended October 31, 2024 | Fiscal period ended October 31, 2023 |
| (a) Audit Fees (1) | $14,600 | $14,000 |
| (b) Audit-Related Fees (2) | $0 | $0 |
| (c) Tax Fees (3) | $3,500 | $3,500 |
| (d) All Other Fees (4) | $0 | $0 |
| (g) Aggregate Non-Audit Fees (5) | $0 | $0 |
| (1) | Audit Fees are fees billed for professional services rendered by Cohen for the audit of the Registrant’s annual financial statements and for the services that are normally provided by Cohen in connection with the statutory and regulatory filings or engagements. |
| (2) | Audit-Related Fees are fees billed for assurance and related services by Cohen that are reasonably related to the performance of the audit of the Registrant’s financial statements and are not reported under the caption “Audit Fees”. |
| (3) | Tax Fees are fees billed for professional services rendered by Cohen for tax compliance, tax advice and tax planning. |
| (4) | All Other Fees are fees billed for products and services provided by Cohen, other than the services reported under the captions “Audit Fees”, “Audit-Related Fees” and “Tax Fees”. |
| (5) | Aggregate Non-Audit Fees are non-audit fees billed by Cohen for services rendered to the Registrant. The Aggregate Non-Audit Fee includes the Tax Fees disclosed pursuant to Footnote 3 above. |
| SRH REIT Covered Call ETF | Fiscal period ended October 31, 2024 | |
| (a) Audit Fees (1) | $17,600 | |
| (b) Audit-Related Fees (2) | $0 | |
| (c) Tax Fees (3) | $3,500 | |
| (d) All Other Fees (4) | $0 | |
| (g) Aggregate Non-Audit Fees (5) | $0 | |
| (1) | Audit Fees are fees billed for professional services rendered by Cohen for the audit of the Registrant’s annual financial statements and for the services that are normally provided by Cohen in connection with the statutory and regulatory filings or engagements. |
| (2) | Audit-Related Fees are fees billed for assurance and related services by Cohen that are reasonably related to the performance of the audit of the Registrant’s financial statements and are not reported under the caption “Audit Fees”. |
| (3) | Tax Fees are fees billed for professional services rendered by Cohen for tax compliance, tax advice and tax planning. |
| (4) | All Other Fees are fees billed for products and services provided by Cohen, other than the services reported under the captions “Audit Fees”, “Audit-Related Fees” and “Tax Fees”. |
| (5) | Aggregate Non-Audit Fees are non-audit fees billed by Cohen for services rendered to the Registrant. The Aggregate Non-Audit Fee includes the Tax Fees disclosed pursuant to Footnote 3 above. |
| TrueShares Quarterly Bull Hedge ETF | Fiscal period ended October 31, 2024 | |
| (a) Audit Fees (1) | $14,080 | |
| (b) Audit-Related Fees (2) | $0 | |
| (c) Tax Fees (3) | $3,500 | |
| (d) All Other Fees (4) | $0 | |
| (g) Aggregate Non-Audit Fees (5) | $0 | |
| (1) | Audit Fees are fees billed for professional services rendered by Cohen for the audit of the Registrant’s annual financial statements and for the services that are normally provided by Cohen in connection with the statutory and regulatory filings or engagements. |
| (2) | Audit-Related Fees are fees billed for assurance and related services by Cohen that are reasonably related to the performance of the audit of the Registrant’s financial statements and are not reported under the caption “Audit Fees”. |
| (3) | Tax Fees are fees billed for professional services rendered by Cohen for tax compliance, tax advice and tax planning. |
| (4) | All Other Fees are fees billed for products and services provided by Cohen, other than the services reported under the captions “Audit Fees”, “Audit-Related Fees” and “Tax Fees”. |
| (5) | Aggregate Non-Audit Fees are non-audit fees billed by Cohen for services rendered to the Registrant. The Aggregate Non-Audit Fee includes the Tax Fees disclosed pursuant to Footnote 3 above. |
| TrueShares Quarterly Bear Hedge ETF | Fiscal period ended October 31, 2024 | |
| (a) Audit Fees (1) | $14,080 | |
| (b) Audit-Related Fees (2) | $0 | |
| (c) Tax Fees (3) | $3,500 | |
| (d) All Other Fees (4) | $0 | |
| (g) Aggregate Non-Audit Fees (5) | $0 | |
| (1) | Audit Fees are fees billed for professional services rendered by Cohen for the audit of the Registrant’s annual financial statements and for the services that are normally provided by Cohen in connection with the statutory and regulatory filings or engagements. |
| (2) | Audit-Related Fees are fees billed for assurance and related services by Cohen that are reasonably related to the performance of the audit of the Registrant’s financial statements and are not reported under the caption “Audit Fees”. |
| (3) | Tax Fees are fees billed for professional services rendered by Cohen for tax compliance, tax advice and tax planning. |
| (4) | All Other Fees are fees billed for products and services provided by Cohen, other than the services reported under the captions “Audit Fees”, “Audit-Related Fees” and “Tax Fees”. |
| (5) | Aggregate Non-Audit Fees are non-audit fees billed by Cohen for services rendered to the Registrant. The Aggregate Non-Audit Fee includes the Tax Fees disclosed pursuant to Footnote 3 above. |
(e) (1) Audit Committee Pre-Approval Policies and Procedures: All services to be performed by the Registrant’s principal auditors must be pre-approved by the Registrant’s audit committee.
(e) (2) No services described in paragraphs (b) through (d) were approved by the audit committee pursuant to paragraph (c)(7)(i)(C) of Rule 2-01 of Regulation S-X.
(f) Not applicable.
(h) Not applicable.
(i) Not applicable.
(j) Not applicable.
Item 5. Audit Committee of Listed Registrants.
The Registrant has an audit committee which was established by its Board of Trustees in accordance with Section 3(a)(58)(A) of the Securities Exchange Act of 1934 as amended. The members of the Registrant’s audit committee are Kimberly Storms and Steven Norgaard.
Item 6. Investments.
(a) The Registrant’s full schedule of investments is included as part of the Reports to Stockholders filed under Item 7 of this Form.
(b) Not applicable.
| Item 7. | Financial Statements and Financial Highlights for Open-End Management Investment Companies. |
SRH Funds
SRH REIT Covered Call ETF (NYSE ARCA, Inc.: SRHR)
SRH U.S. Quality ETF (NYSE ARCA, Inc.: SRHQ)
Annual Financial Statements
October 31, 2024
TABLE OF CONTENTS
SRH REIT Covered Call ETF
SCHEDULE OF INVESTMENTS
October 31, 2024
| | | | Shares | | | | Value | |
| COMMON STOCKS - 100.42% | | | | | | | | |
| Data Center REIT - 14.05% | | | | | | | | |
| Equinix, Inc.(a) | | | 8,266 | | | $ | 7,506,189 | |
| | | | | | | | | |
| Entertainment Facilities - 3.20% | | | | | | | | |
| Vail Resorts, Inc.(a) | | | 10,300 | | | | 1,706,607 | |
| | | | | | | | | |
| Gaming REIT - 4.20% | | | | | | | | |
| Gaming and Leisure Properties, Inc. | | | 11,960 | | | | 600,272 | |
| VICI Properties, Inc. | | | 51,763 | | | | 1,643,993 | |
| | | | | | | | 2,244,265 | |
| | | | | | | | | |
| Health Care REIT - 2.18% | | | | | | | | |
| Healthpeak Properties, Inc. | | | 51,763 | | | | 1,162,080 | |
| | | | | | | | | |
| Hotel REIT - 8.93% | | | | | | | | |
| Apple Hospitality REIT, Inc. | | | 75,000 | | | | 1,107,750 | |
| Host Hotels & Resorts, Inc. | | | 103,525 | | | | 1,784,771 | |
| Sunstone Hotel Investors, Inc. | | | 186,325 | | | | 1,880,019 | |
| | | | | | | | 4,772,540 | |
| | | | | | | | | |
| Industrial REIT - 16.62% | | | | | | | | |
| Eastgroup Properties, Inc. | | | 7,395 | | | | 1,266,616 | |
| First Industrial Realty Trust, Inc. | | | 41,260 | | | | 2,165,737 | |
| Prologis, Inc.(a) | | | 13,200 | | | | 1,490,808 | |
| Rexford Industrial Realty, Inc.(a) | | | 40,000 | | | | 1,715,600 | |
| STAG Industrial, Inc.(a) | | | 60,000 | | | | 2,236,800 | |
| | | | | | | | 8,875,561 | |
| | | | | | | | | |
| Infrastructure REIT - 4.15% | | | | | | | | |
| Crown Castle, Inc.(a) | | | 20,600 | | | | 2,214,294 | |
| | | | | | | | | |
| Multi Asset Class REIT - 7.62% | | | | | | | | |
| Global Net Lease, Inc. | | | 296,000 | | | | 2,305,840 | |
| Safehold, Inc.(a) | | | 83,000 | | | | 1,766,240 | |
| | | | | | | | 4,072,080 | |
| Office REIT - 10.38% | | | | | | | | |
| Easterly Government Properties, Inc., Class A(a) | | | 116,000 | | | | 1,572,960 | |
| Highwoods Properties, Inc.(a) | | | 118,411 | | | | 3,971,505 | |
| | | | | | | | 5,544,465 | |
| | | Shares | | | Value | |
| Residential REIT - 10.13% | | | | | | | | |
| Invitation Homes, Inc. | | | 20,628 | | | $ | 647,925 | |
| Mid-America Apartment Communities, Inc.(a) | | | 8,000 | | | | 1,210,720 | |
| NexPoint Residential Trust, Inc. | | | 52,482 | | | | 2,185,875 | |
| Sun Communities, Inc. | | | 10,314 | | | | 1,368,462 | |
| | | | | | | | 5,412,982 | |
| | | | | | | | | |
| Retail REIT - 3.24% | | | | | | | | |
| Brixmor Property Group Inc. | | | 64,200 | | | | 1,730,190 | |
| | | | | | | | | |
| Self-storage REIT - 6.54% | | | | | | | | |
| Extra Space Storage, Inc.(a) | | | 12,350 | | | | 2,016,755 | |
| National Storage Affiliates Trust | | | 35,000 | | | | 1,475,250 | |
| | | | | | | | 3,492,005 | |
| Specialty REIT - 9.18% | | | | | | | | |
| Lamar Advertising Co., Class A | | | 37,168 | | | | 4,906,176 | |
| | | | | | | | | |
| TOTAL COMMON STOCKS | | | | | | | | |
| (Cost $48,337,687) | | | | | | | 53,639,434 | |
| | | | | | | | | |
| MONEY MARKET FUNDS - 0.42% | | | | | | | | |
| Invesco Government & Agency Portfolio, Institutional Class, 7-Day Yield - 4.77%(b) | | | 225,309 | | | | 225,309 | |
| | | | | | | | | |
| TOTAL MONEY MARKET FUNDS | | | | | | | | |
| (Cost $225,309) | | | | | | | 225,309 | |
| | | | | | | | | |
| TOTAL INVESTMENTS - 100.84% | | | | | | | | |
| (Cost $48,562,996) | | | | | | $ | 53,864,743 | |
| | | | | | | | | |
| Liabilities In Excess of Other Assets - (0.84%) | | | | | | | (448,159 | ) |
| | | | | | | | | |
| NET ASSETS - 100.00% | | | | | | $ | 53,416,584 | |
| (a) | Pledged security; a portion or all of the security is pledged as collateral for written options in the amount of $254,839 as of October 31, 2024. |
| (b) | Rate disclosed is 7-Day Yield as of October 31, 2024. |
Percentages are stated as a percent of net assets.
See Notes to Financial Statements
SRH REIT Covered Call ETF
SCHEDULE OF INVESTMENTS
October 31, 2024 (Continued)
Call Options Written
| Underlying Security | | Expiration Date | | Strike Price | | | Contracts | | | Premiums
Received | | Notional Value | | | Value | |
| Crown Castle, Inc. | | 4/17/2025 | | | $120 | | | | (200) | | | $ | 63,393 | | $ | (2,149,800 | ) | | $ | (54,000 | ) |
| Easterly Government Properties, Inc. | | 12/20/2024 | | | 15 | | | | (1,160) | | | | 27,773 | | | (1,572,960 | ) | | | (8,120 | ) |
| Equinix, Inc. | | 1/17/2025 | | | 940 | | | | (80) | | | | 160,533 | | | (7,264,640 | ) | | | (212,800 | ) |
| Extra Space Storage, Inc. | | 1/17/2025 | | | 195 | | | | (50) | | | | 26,348 | | | (816,500 | ) | | | (2,000 | ) |
| Highwoods Properties, Inc. | | 2/21/2025 | | | 40 | | | | (1,100) | | | | 81,089 | | | (3,689,400 | ) | | | (66,000 | ) |
| Mid-America Apartment Communities, Inc. | | 3/21/2025 | | | 180 | | | | (80) | | | | 21,357 | | | (1,210,720 | ) | | | (8,400 | ) |
| Vail Resorts, Inc. | | 12/20/2024 | | | 190 | | | | (100) | | | | 22,157 | | | (1,656,900 | ) | | | (17,750 | ) |
| Prologis, Inc. | | 11/15/2024 | | | 135 | | | | (130) | | | | 43,805 | | | (1,468,220 | ) | | | (325 | ) |
| Rexford Industrial Realty, Inc. | | 12/20/2024 | | | 55 | | | | (400) | | | | 52,788 | | | (1,715,600 | ) | | | (15,000 | ) |
| Safehold, Inc. | | 1/17/2025 | | | 25 | | | | (800) | | | | 73,575 | | | (1,702,400 | ) | | | (22,000 | ) |
| STAG Industrial, Inc. | | 12/20/2024 | | | 40 | | | | (600) | | | | 79,181 | | | (2,236,800 | ) | | | (21,000 | ) |
| | | | | | | | | | | | | $ | 651,999 | | $ | (25,483,940 | ) | | $ | (427,395 | ) |
See Notes to Financial Statements
SRH U.S. Quality ETF
SCHEDULE OF INVESTMENTS
October 31, 2024
| | | Shares | | | Value | |
| COMMON STOCKS - 99.90% | | | | | | | | |
| Consumer Discretionary Products - 5.94% | | | | | | | | |
| Masco Corp. | | | 28,930 | | | $ | 2,311,796 | |
| NVR, Inc.(a) | | | 281 | | | | 2,571,940 | |
| Polaris, Inc. | | | 22,799 | | | | 1,593,878 | |
| Tapestry, Inc. | | | 48,076 | | | | 2,281,206 | |
| | | | | | | | 8,758,820 | |
| | | | | | | | | |
| Consumer Staple Products - 3.57% | | | | | | | | |
| Coca-Cola Consolidated, Inc. | | | 2,697 | | | | 3,032,129 | |
| Conagra Brands, Inc. | | | 77,012 | | | | 2,228,727 | |
| | | | | | | | 5,260,856 | |
| | | | | | | | | |
| Financial Services - 8.08% | | | | | | | | |
| Cboe Global Markets, Inc. | | | 12,424 | | | | 2,653,394 | |
| Credit Acceptance Corp.(a) | | | 4,139 | | | | 1,759,075 | |
| Essent Group Ltd. | | | 38,358 | | | | 2,301,863 | |
| Federated Hermes, Inc., Class B | | | 63,196 | | | | 2,536,055 | |
| Nasdaq, Inc. | | | 36,166 | | | | 2,673,391 | |
| | | | | | | | 11,923,778 | |
| | | | | | | | | |
| Health Care - 11.22% | | | | | | | | |
| Cencora, Inc. | | | 9,394 | | | | 2,142,584 | |
| Cardinal Health, Inc. | | | 20,443 | | | | 2,218,474 | |
| Elevance Health, Inc. | | | 4,403 | | | | 1,786,561 | |
| Humana, Inc. | | | 6,584 | | | | 1,697,553 | |
| Labcorp Holdings, Inc. | | | 10,449 | | | | 2,385,193 | |
| United Therapeutics Corp.(a) | | | 9,937 | | | | 3,716,140 | |
| UnitedHealth Group, Inc. | | | 4,615 | | | | 2,605,167 | |
| | | | | | | | 16,551,672 | |
| | | | | | | | | |
| Industrial Products - 3.92% | | | | | | | | |
| Huntington Ingalls Industries, Inc. | | | 7,832 | | | | 1,448,607 | |
| Keysight Technologies, Inc.(a) | | | 14,597 | | | | 2,175,099 | |
| The Timken Co. | | | 26,109 | | | | 2,167,047 | |
| | | | | | | | 5,790,753 | |
| | | | | | | | | |
| Industrial Services - 8.70% | | | | | | | | |
| Applied Industrial Technologies, Inc. | | | 11,555 | | | | 2,676,023 | |
| EMCOR Group, Inc. | | | 6,519 | | | | 2,907,930 | |
| Insperity, Inc. | | | 20,825 | | | | 1,640,385 | |
| Jacobs Solutions, Inc. | | | 14,849 | | | | 2,087,472 | |
| TriNet Group, Inc. | | | 17,229 | | | | 1,462,570 | |
| United Parcel Service, Inc., Class B | | | 15,358 | | | | 2,058,894 | |
| | | | | | | | 12,833,274 | |
| | | Shares | | | Value | |
| Materials - 6.33% | | | | | | |
| Eagle Materials, Inc. | | | 8,400 | | | $ | 2,397,864 | |
| HB Fuller Co. | | | 28,626 | | | | 2,094,851 | |
| Owens Corning | | | 13,685 | | | | 2,419,371 | |
| Silgan Holdings, Inc. | | | 47,007 | | | | 2,432,142 | |
| | | | | | | | 9,344,228 | |
| | | | | | | | | |
| Media - 5.81% | | | | | | | | |
| Comcast Corp., Class A | | | 52,656 | | | | 2,299,488 | |
| Fox Corp., Class A | | | 72,998 | | | | 3,065,916 | |
| GoDaddy, Inc., Class A(a) | | | 19,234 | | | | 3,208,231 | |
| | | | | | | | 8,573,635 | |
| | | | | | | | | |
| Oil & Gas - 2.22% | | | | | | | | |
| CNX Resources Corp.(a) | | | 96,233 | | | | 3,274,809 | |
| | | | | | | | | |
| Real Estate - 4.23% | | | | | | | | |
| CBRE Group, Inc., Class A(a) | | | 23,475 | | | | 3,074,521 | |
| Jones Lang LaSalle, Inc.(a) | | | 11,701 | | | | 3,170,503 | |
| | | | | | | | 6,245,024 | |
| | | | | | | | | |
| Renewable Energy - 1.59% | | | | | | | | |
| EnerSys | | | 24,166 | | | | 2,340,719 | |
| | | | | | | | | |
| Retail & Wholesale - Discretionary - 4.65% | | | | | | | | |
| AutoZone, Inc.(a) | | | 725 | | | | 2,181,525 | |
| The Home Depot, Inc. | | | 5,949 | | | | 2,342,419 | |
| O'Reilly Automotive, Inc.(a) | | | 2,023 | | | | 2,332,802 | |
| | | | | | | | 6,856,746 | |
| | | | | | | | | |
| Retail & Wholesale - Staples - 1.31% | | | | | | | | |
| Target Corp. | | | 12,881 | | | | 1,932,665 | |
See Notes to Financial Statements
SRH U.S. Quality ETF
SCHEDULE OF INVESTMENTS
October 31, 2024 (Continued)
| | | Shares | | | Value | |
| Software & Tech Services - 23.20% | | | | | | | | |
| Akamai Technologies, Inc.(a) | | | 20,982 | | | $ | 2,120,861 | |
| Amentum Holdings, Inc.(a) | | | 14,849 | | | | 441,609 | |
| ASGN, Inc.(a) | | | 21,790 | | | | 2,006,859 | |
| Box, Inc., Class A(a) | | | 80,602 | | | | 2,559,919 | |
| CACI International, Inc., Class A(a) | | | 6,026 | | | | 3,329,727 | |
| Corpay, Inc.(a) | | | 7,399 | | | | 2,439,598 | |
| Dropbox, Inc., Class A(a) | | | 93,936 | | | | 2,428,246 | |
| DXC Technology Co.(a) | | | 107,594 | | | | 2,136,817 | |
| Euronet Worldwide, Inc.(a) | | | 20,765 | | | | 2,044,730 | |
| Gartner, Inc.(a) | | | 4,789 | | | | 2,406,472 | |
| Genpact Ltd. | | | 69,276 | | | | 2,644,265 | |
| Insight Enterprises, Inc.(a) | | | 12,304 | | | | 2,152,216 | |
| Leidos Holdings, Inc. | | | 17,413 | | | | 3,189,365 | |
| PayPal Holdings, Inc.(a) | | | 34,067 | | | | 2,701,513 | |
| Qualys, Inc.(a) | | | 13,680 | | | | 1,631,203 | |
| | | | | | | | 34,233,400 | |
| | | | | | | | | |
| Tech Hardware & Semiconductors - 7.40% | | | | | | | | |
| Broadcom, Inc. | | | 17,220 | | | | 2,923,439 | |
| Ciena Corp.(a) | | | 46,260 | | | | 2,937,973 | |
| Extreme Networks, Inc.(a) | | | 197,802 | | | | 2,953,184 | |
| Jabil, Inc. | | | 17,078 | | | | 2,102,131 | |
| | | | | | | | 10,916,727 | |
| | | | | | | | | |
| Telecommunications - 1.73% | | | | | | | | |
| Iridium Communications, Inc. | | | 87,257 | | | | 2,559,248 | |
| | | | | | | | | |
| TOTAL COMMON STOCKS | | | | | | | | |
| (Cost $118,241,290) | | | | | | | 147,396,354 | |
| | | | | | | | | |
| MONEY MARKET FUNDS - 0.10% | | | | | | | | |
| Invesco Government & Agency Portfolio, Institutional Class, 7-Day Yield - 4.77%(b) | | | 145,577 | | | | 145,577 | |
| | | | | | | | | |
| TOTAL MONEY MARKET FUNDS | | | | | | | | |
| (Cost $145,577) | | | | | | | 145,577 | |
| | | | | | | | | |
| TOTAL INVESTMENTS - 100.00% | | | | | | | | |
| (Cost $118,386,867) | | | | | | $ | 147,541,931 | |
| | | | | | | | | |
| Other Assets In Excess of Liabilities - 0.00%(c) | | | | | | | 2,093 | |
| | | | | | | | | |
| NET ASSETS - 100.00% | | | | | | $ | 147,544,024 | |
| (a) | Non-income producing security. |
| (b) | Rate disclosed is 7-Day Yield as of October 31, 2024. |
Percentages are stated as a percent of net assets.
See Notes to Financial Statements
SRH Funds
STATEMENTS OF ASSETS AND LIABILITIES
October 31, 2024
| | | SRH REIT
Covered Call ETF | | | SRH U.S. Quality
ETF | |
| | | | | | | |
| ASSETS: | | | | | | |
| Investments, at value | | $ | 53,864,743 | | | $ | 147,541,931 | |
| Dividends receivable | | | 14,135 | | | | 46,701 | |
| Total Assets | | | 53,878,878 | | | | 147,588,632 | |
| LIABILITIES: | | | | | | | | |
| Written options, at value | | | 427,395 | | | | – | |
| Payable to investment advisor | | | 34,899 | | | | 44,608 | |
| Total Liabilities | | | 462,294 | | | | 44,608 | |
| NET ASSETS | | $ | 53,416,584 | | | $ | 147,544,024 | |
| | | | | | | | | |
| NET ASSETS CONSIST OF | | | | | | | | |
| Paid in capital | | $ | 47,941,246 | | | $ | 122,661,491 | |
| Total distributable earnings | | | 5,475,338 | | | | 24,882,533 | |
| NET ASSETS | | $ | 53,416,584 | | | $ | 147,544,024 | |
| | | | | | | | | |
| INVESTMENTS, AT COST | | $ | 48,562,996 | | | $ | 118,386,867 | |
| PREMIUMS RECEIVED ON WRITTEN OPTIONS | | $ | (651,999 | ) | | $ | – | |
| | | | | | | | | |
| Net asset value: | | | | | | | | |
| Net assets | | $ | 53,416,584 | | | $ | 147,544,024 | |
| Shares of beneficial interest outstanding (unlimited number of shares authorized, no par value) | | | 900,000 | | | | 4,004,000 | |
| Net asset value, price per share | | $ | 59.35 | | | $ | 36.85 | |
See Notes to Financial Statements
SRH Funds
STATEMENTS OF OPERATIONS
| | | SRH REIT Covered Call ETF
For the Period
November 1, 2023
(Commencement of
Operations) through
October 31, 2024 | | | SRH U.S. Quality ETF
For the Year Ended
October 31, 2024 | |
| INVESTMENT INCOME: | | | | | | | | |
| Dividends | | $ | 1,697,978 | | | $ | 1,471,562 | |
| Interest and other income | | | 32,322 | | | | 9,179 | |
| Total Investment Income | | | 1,730,300 | | | | 1,480,741 | |
| EXPENSES: | | | | | | | | |
| Investment advisory fees | | | 383,817 | | | | 472,624 | |
| Total Expenses | | | 383,817 | | | | 472,624 | |
| NET INVESTMENT INCOME | | | 1,346,483 | | | | 1,008,117 | |
| Net realized gain/(loss) on: | | | | | | | | |
| Investments | | | 1,712,919 | | | | (3,268,230 | ) |
| Written Options | | | 68,835 | | | | – | |
| Investments sold in-kind | | | 1,281,884 | | | | 14,849,539 | |
| Total Net Realized Gain | | | 3,063,638 | | | | 11,581,309 | |
| Net change in unrealized appreciation/depreciation on: | | | | | | | | |
| Investments | | | 5,301,747 | | | | 24,991,136 | |
| Written options | | | 224,604 | | | | – | |
| Total Net Change in Unrealized Appreciation/Depreciation | | | 5,526,351 | | | | 24,991,136 | |
| NET REALIZED AND UNREALIZED GAIN ON INVESTMENTS | | | 8,589,989 | | | | 36,572,445 | |
| NET INCREASE IN NET ASSETS RESULTING FROM OPERATIONS | | $ | 9,936,472 | | | $ | 37,580,562 | |
See Notes to Financial Statements
SRH REIT Covered Call ETF
STATEMENTS OF CHANGES IN NET ASSETS
| | | | For the Period | |
| | | | November 1, 2023 | |
| | | | (Commencement of | |
| | | | Operations) through | |
| | | | October 31, 2024 | |
| OPERATIONS | | | | |
| Net investment income | | $ | 1,346,483 | |
| Net realized gain | | | 3,063,638 | |
| Net change in unrealized appreciation/depreciation | | | 5,526,351 | |
| Net increase in net assets resulting from operations | | | 9,936,472 | |
| DISTRIBUTIONS TO SHAREHOLDERS | | | | |
| From distributable earnings | | | (3,173,667) | |
| Return of Capital | | | (349,239) | |
| Net decrease in net assets from distributions | | | | (3,522,906 | ) |
| SHARE TRANSACTIONS | | | | | |
| Shares sold | | | | 57,436,058 | |
| Shares redeemed | | | | (10,433,040 | ) |
| Net increase in net assets derived from share transactions | | | | 47,003,018 | |
| Net increase in net assets | | | | 53,416,584 | |
| NET ASSETS | | | | | |
| Beginning of period | | | | – | |
| End of period | | | $ | 53,416,584 | |
See Notes to Financial Statements
SRH U.S. Quality ETF
STATEMENTS OF CHANGES IN NET ASSETS
| | | For the Year
Ended October 31, 2024 | | | For the Period
Ended October 31, 2023 (a) | | | For the Period October 4,
2022 (Commencement of
Operations through
August 31, 2023 | |
| OPERATIONS | | | | | | | | | | | | |
| Net investment income | | $ | 1,008,117 | | | $ | 193,700 | | | $ | 942,907 | |
| Net realized gain/(loss) | | | 11,581,309 | | | | (1,556 | ) | | | 3,399,785 | |
| Net change in unrealized appreciation/depreciation | | | 24,991,136 | | | | (8,538,980 | ) | | | 12,702,908 | |
| Net increase/(decrease) in net assets resulting from operations | | | 37,580,562 | | | | (8,346,836 | ) | | | 17,045,600 | |
| DISTRIBUTIONS TO SHAREHOLDERS | | | | | | | | | | | | |
| From distributable earnings | | | (1,044,283 | ) | | | (290,650 | ) | | | (781,269 | ) |
| Net decrease in net assets from distributions | | | (1,044,283 | ) | | | (290,650 | ) | | | (781,269 | ) |
| SHARE TRANSACTIONS | | | | | | | | | | | | |
| Shares sold | | | 51,349,485 | | | | – | | | | 142,308,030 | |
| Shares redeemed | | | (51,302,055 | ) | | | – | | | | (39,074,560 | ) |
| Net increase in net assets derived from share transactions | | | 47,430 | | | | – | | | | 103,233,470 | |
| Net increase/decrease in net assets | | | 36,583,709 | | | | (8,637,486 | ) | | | 119,497,801 | |
| NET ASSETS | | | | | | | | | | | | |
| Beginning of period | | | 110,960,315 | | | | 119,597,801 | | | | 100,000 | |
| End of period | | $ | 147,544,024 | | | $ | 110,960,315 | | | $ | 119,597,801 | |
| (a) | Effective September 1, 2023, the Board approved changing the fiscal year-end of the Fund from August 31 to October 31. |
See Notes to Financial Statements
SRH REIT Covered Call ETF
FINANCIAL HIGHLIGHTS
| | | For the Period |
| | | November 1, 2023 |
| | | (Commencement of |
| | | Operations) through |
| | | October 31, 2024 (a) |
| Net Asset Value, Beginning of Period | | $ | 50.23 | |
| | | | | |
| INCOME FROM INVESTMENT OPERATIONS: | | | | |
| Net investment income(b) | | | 1.50 | |
| Net realized and unrealized gain on investments | | | 11.52 | |
| Total from Investment Operations | | | 13.02 | |
| | | | | |
| DISTRIBUTIONS: | | | | |
| From distributable earnings | | | (3.51 | ) |
| From tax return of capital | | | (0.39 | ) |
| Total Distributions | | | (3.90 | ) |
| | | | | |
| Net Increase in net asset value | | | 9.12 | |
| Net Asset Value - End of Period | | $ | 59.35 | |
| TOTAL RETURN(c) | | | 26.42 | % |
| | | | | |
| RATIOS AND SUPPLEMENTAL DATA: | | | | |
| Net Assets, end of period (000s) | | $ | 53,417 | |
| Ratio of net operating expenses to average net assets | | | 0.75 | %(d) |
| Ratio of net investment income to average net assets | | | 2.61 | %(d) |
| Portfolio turnover rate(e)(f) | | | 44 | % |
| (a) | The net asset value at the beginning of the period represents the initial shares outstanding on November 1, 2023 (Commencement of Operations). |
| (b) | Calculated based on the average number of Fund shares outstanding during each fiscal period. |
| (c) | Total return is calculated assuming an initial investment made at the net asset value at the beginning of the period and redemption at the net asset value on the last day of the period and assuming all distributions are reinvested. Total return calculated for a period of less than one year is not annualized. |
| (e) | Excludes the impact of in-kind transactions. |
| (f) | Portfolio turnover rate for periods less than one full year have not been annualized. |
See Notes to Financial Statements
SRH U.S. Quality ETF
FINANCIAL HIGHLIGHTS
| | | For the Year
Ended
October 31, 2024 | | For the Period Ended
October 31, 2023 (a) | | For the Period
October 4, 2022
(Commencement of
Operations) through
August 31, 2023 (b) |
| Net Asset Value, Beginning of Period | | $ | 27.71 | | | $ | 29.87 | | | $ | 25.66 | |
| | | | | | | | | | | | | |
| INCOME FROM INVESTMENT OPERATIONS: | | | | | | | | | | | | |
| Net investment income(c) | | | 0.25 | | | | 0.05 | | | | 0.25 | |
| Net realized and unrealized gain/(loss) on investments | | | 9.15 | | | | (2.14 | ) | | | 4.17 | |
| Total from Investment Operations | | | 9.40 | | | | (2.09 | ) | | | 4.42 | |
| | | | | | | | | | | | | |
| DISTRIBUTIONS: | | | | | | | | | | | | |
| From distributable earnings | | | (0.26 | ) | | | (0.07 | ) | | | (0.21 | ) |
| Total Distributions | | | (0.26 | ) | | | (0.07 | ) | | | (0.21 | ) |
| | | | | | | | | | | | | |
| Net Increase/(Decrease) in net asset value | | | 9.14 | | | | (2.16 | ) | | | 4.21 | |
| Net Asset Value - End of Period | | $ | 36.85 | | | $ | 27.71 | | | $ | 29.87 | |
| TOTAL RETURN(d) | | | 34.00 | % | | | (7.00 | %) | | | 17.29 | % |
| | | | | | | | | | | | | |
| RATIOS AND SUPPLEMENTAL DATA: | | | | | | | | | | | | |
| Net Assets, end of period (000s) | | $ | 147,544 | | | $ | 110,960 | | | $ | 119,598 | |
| Ratio of net operating expenses to average net assets | | | 0.35 | % | | | 0.35 | %(e) | | | 0.35 | %(e) |
| Ratio of net investment income to average net assets | | | 0.74 | % | | | 1.01 | %(e) | | | 0.98 | %(e) |
| Portfolio turnover rate(f)(g) | | | 40 | % | | | 0 | % | | | 41 | % |
| (a) | Effective September 1, 2023, the Board approved changing the fiscal year-end of the Fund from August 31 to October 31. |
| (b) | The net asset value at the beginning of the period represents the initial shares outstanding on October 4, 2022 (Commencement of Operations). |
| (c) | Calculated based on the average number of Fund shares outstanding during each fiscal period. |
| (d) | Total return is calculated assuming an initial investment made at the net asset value at the beginning of the period and redemption at the net asset value on the last day of the period and assuming all distributions are reinvested. Total return calculated for a period of less than one year is not annualized. |
| (f) | Excludes the impact of in-kind transactions. |
| (g) | Portfolio turnover rate for periods less than one full year have not been annualized. |
See Notes to Financial Statements
SRH Funds
NOTES TO FINANCIAL STATEMENTS
October 31, 2024
NOTE 1 - ORGANIZATION
Elevation Series Trust (the “Trust”) was organized on March 7, 2022, as a Delaware statutory trust, and is authorized to issue multiple investment series. The Trust is registered with the Securities and Exchange Commission under the Investment Company Act of 1940, as amended (the “1940 Act”), as an open-end management investment company. These financial statements relate to two series of the Trust, SRH REIT Covered Call ETF and SRH U.S. Quality ETF (each a “Fund” and collectively the “Funds”). SRH REIT Covered Call ETF’s investment objective is to provide total return. Under normal circumstances, the Fund invests at least 80% of its net assets in Real Estate Investment Trusts (“REITs”) that are publicly traded on domestic stock exchanges. In addition, the Fund strategically implements an option strategy consisting of writing (selling) U.S. exchange-traded covered call options on the REITs in the Fund’s portfolio. The Fund commenced operations on November 1, 2023. SRH U.S. Quality ETF’s investment objective is to provide investment results (before fees and expenses) that correspond to the SRH U.S. Quality Index (the “Index”). The Index is intended to capture the performance of U.S. companies that exhibit consistent and moderate revenue growth but do not trade at excessive valuations. The creator of the Index, SRH Advisors, LLC (formerly known as Rocky Mountain Advisors, LLC) (“SRH”), has designed the Index to provide exposure to a diversified portfolio of U.S. companies featuring value, growth, and quality characteristics while maintaining overall market exposure close to that of widely followed, broad-based U.S. equity benchmarks. The Fund commenced operations on October 4, 2022.
The Funds currently offer an unlimited number of one class of shares, without par value, which are listed and traded on the NYSE Arca, Inc (the “Exchange”). The Funds issue and redeem shares only in creation units (“Creation Units”) which are offered on a continuous basis through Paralel Distributors LLC (the “Distributor”), without a sales load (but subject to transaction fees, if applicable), at the net asset value per share next determined after receipt of an order in proper form pursuant to the terms of the Authorized Participant Agreement, calculated as of the scheduled close of regular trading on the Exchange on any day on which the Exchange is open for business. The Funds do not issue fractional Creation Units. The offerings of the Funds’ shares are registered under the Securities Act of 1933, as amended.
NOTE 2 - SIGNIFICANT ACCOUNTING POLICIES
The following is a summary of significant accounting policies consistently followed by the Funds in the preparation of their financial statements. The accompanying financial statements were prepared in accordance with accounting principles generally accepted in the United States (“GAAP”). This requires management to make estimates and assumptions that affect the reported amounts in the financial statements. Actual results could differ from those estimates. The Funds are investment companies and follow accounting and reporting guidance in the Financial Accounting Standards Board (“FASB”) Accounting Standards Topic 946 “Financial Services – Investment Companies,” including Accounting Standard Update 2013-08.
Portfolio Valuation: The net asset value per share (“NAV”) of the Funds is determined no less frequently than daily, on each day that the New York Stock Exchange (“NYSE”) is open for trading, as of the close of regular trading on the NYSE (normally 4:00 p.m. Eastern time). The NAV is determined by dividing the value of the Funds’ total assets less its liabilities by the number of shares outstanding.
Domestic equity securities traded on any exchange other than the NASDAQ Stock Market LLC (“NASDAQ”) are valued at the last sale price on the business day. If there has been no sale that business day, the securities are valued at the mean of the most recent bid and ask prices on the business day. Securities traded on NASDAQ are valued at the NASDAQ Official Closing Price as determined by NASDAQ. Portfolio securities traded on more than one securities exchange are valued at the last sale price on the business day. Portfolio securities traded in the over-the-counter market, but excluding NASDAQ, are valued at the last quoted sale price in such market. Options are valued at the mean of the highest bid and lowest ask prices on the principal exchange on which the option trades. If no quotations are available, fair value procedures will be used. Debt obligations with maturities of 60 days or less are valued at amortized cost.
Securities for which market quotations are not readily available, including circumstances under which Paralel Advisors LLC (the “Adviser”) determines that prices received are unreliable, are valued at fair value according to procedures established and adopted by the Funds’ Board of Trustees (the “Board”). Pursuant to Rule 2a-5 under the 1940 Act, the Board has designated the Adviser as the Funds’ valuation designee with respect to the fair valuation of the Funds’ portfolio securities, subject to oversight by and periodic reporting to the Board.
The Funds disclose the classification of their fair value measurements following a three-tier hierarchy based on the inputs used to measure fair value. Inputs refer broadly to the assumptions that market participants would use in pricing the asset or liability, including assumptions about risk. Inputs may be observable or unobservable. Observable inputs reflect the assumptions market participants would use in pricing the asset or liability that are developed based on market data obtained from sources independent of the reporting entity. Unobservable inputs reflect the reporting entity’s own assumptions about the assumptions market participants would use in pricing the asset or liability that are developed based on the best information available.
Various inputs are used in determining the value of the Funds’ investments as of the end of the reporting period. When inputs used fall into different levels of the fair value hierarchy, the level in the hierarchy within which the fair value measurement falls is determined based on the lowest level input that is significant to the fair value measurement in its entirety. The designated input levels are not necessarily an indication of the risk or liquidity associated with these investments. These inputs are categorized in the following hierarchy under applicable financial accounting standards:
Level 1 – Unadjusted quoted prices in active markets for identical investments, unrestricted assets or liabilities that the Fund has the ability to access at the measurement date;
Level 2 – Quoted prices which are not active, quoted prices for similar assets or liabilities in active markets or inputs other than quoted prices that are observable (either directly or indirectly) for substantially the full term of the asset or liability; and
Level 3 – Significant unobservable prices or inputs (including the Fund’s own assumptions in determining the fair value of investments) where there is little or no market activity for the asset or liability at the measurement date.
SRH Funds
NOTES TO FINANCIAL STATEMENTS
October 31, 2024 (Continued)
The following is a summary of the Funds’ investments in the fair value hierarchy as of October 31, 2024:
| SRH REIT Covered Call ETF | | | | | | | | | | | | |
| | | | | | | | | | | | | |
| Investments in Securities at Value(a) | | Level 1 | | | Level 2 | | | Level 3 | | | Total | |
| Common Stocks | | $ | 53,639,434 | | | $ | – | | | $ | – | | | $ | 53,639,434 | |
| Money Market Funds | | | 225,309 | | | | – | | | | – | | | | 225,309 | |
| Total | | $ | 53,864,743 | | | $ | – | | | $ | – | | | $ | 53,864,743 | |
| Other Financial Instruments(b) | | | | | | | | | | | | | | | | |
| Written Options | | $ | (427,395 | ) | | $ | – | | | $ | – | | | $ | (427,395 | ) |
| Total | | $ | (427,395 | ) | | $ | – | | | $ | – | | | $ | (427,395 | ) |
| SRH U.S. Quality ETF | | | | | | | | | | | | |
| | | | | | | | | | | | | |
| Investments in Securities at Value(a) | | Level 1 | | | Level 2 | | | Level 3 | | | Total | |
| Common Stocks | | $ | 147,396,354 | | | $ | – | | | $ | – | | | $ | 147,396,354 | |
| Money Market Funds | | | 145,577 | | | | – | | | | – | | | | 145,577 | |
| Total | | $ | 147,541,931 | | | $ | – | | | $ | – | | | | $147,541,931 | |
| (a) | For detailed descriptions and other security classifications, see the accompanying Schedule of Investments. |
| (b) | Other financial instruments are derivative instruments reflected in the Schedule of Investments. |
Cash and Cash Equivalents: Cash and cash equivalents may include demand deposits and highly liquid investments, typically with original maturities of three months or less. Cash and cash equivalents are carried at cost, which approximates fair value.
Securities Transactions and Investment Income: Securities transactions are recorded as of the trade date. Realized gains and losses from securities sold are recorded on the identified cost basis. Dividend income is recorded as of the ex-dividend date or for certain foreign securities when the information becomes available to the Funds. Certain dividend income from foreign securities will be recorded, in the exercise of reasonable diligence, as soon as the Funds are informed of the dividend if such information is obtained subsequent to the ex-dividend date and may be subject to withholding taxes in these jurisdictions. Withholding taxes on foreign dividends have been provided for in accordance with the Funds’ understanding of the applicable country’s tax rules and rates. Non-cash dividends included in dividend income, if any, are recorded at the fair value of the securities received. Interest income, including amortization of premium and accretion of discount on debt securities, as required, is recorded on the accrual basis using the effective yield method.
REITs: The Funds may invest in REITs and are subject to certain risks associated with those investments. The value of investments in REIT shares may decline because of adverse developments affecting the real estate industry and real property values. Real estate values can be affected by a variety of factors, including supply and demand for properties, the economic health of the country or of different regions, and the strength of specific industries that rent properties. Also, qualification as a REIT under the Internal Revenue Code of 1986, as amended, in any particular year is a complex analysis that depends on a number of factors. There can be no assurance that an entity in which the Fund invests with the expectation that it will be taxed as a REIT will, in fact, qualify as a REIT. An entity that fails to qualify as a REIT would be subject to a corporate level tax, would not be entitled to a deduction for dividends paid to its shareholders and would not pass through to its shareholders the character of income earned by the entity.
Distributions received by the Funds from REITs may consist of dividends, capital gains and/or return of capital. Dividend income from REITs is recognized on the ex-dividend date. The calendar year-end amounts of ordinary income, capital gains, and return of capital included in distributions received from the Funds’ investments in REITs are reported to the Funds after the end of the calendar year, and the Funds estimate these amounts for accounting purposes until the characterization of REIT distributions is reported to the Funds after the end of the calendar year. Estimates are based on the most recent REIT distribution information available.
Distributions to Shareholders: Dividends from net investment income of the Funds, if any, are declared and paid monthly for SRH REIT Covered Call ETF and quarterly for SRH U.S. Quality ETF, or as the Board may determine from time to time. Distributions of net realized capital gains earned by the Funds, if any, are declared and distributed at least annually.
Federal Income Tax: For federal income tax purposes, the Funds currently intend to qualify, as regulated investment companies under the provisions of Subchapter M of the Internal Revenue Code of 1986, as amended, by distributing substantially all of their earnings to their stockholders. Accordingly, no provision for federal income or excise taxes has been made.
Income and capital gain distributions are determined and characterized in accordance with income tax regulations, which may differ from GAAP. These differences are primarily due to differing treatments of income and gains on various investment securities held by each Fund, timing differences and differing characterization of distributions made by each Fund as a whole.
As of and during the period ended October 31, 2024, the Funds did not have liabilities for any unrecognized tax benefits. The Funds recognize interest and penalties, if any, related to unrecognized tax benefits as income tax expenses, in the Statements of Operations. As of October 31, 2024, there were no interest or penalties incurred by the Funds. The Funds file U.S. federal, state, and local tax returns as required. The Funds’ tax returns are subject to examination by the relevant tax authorities until expiration of the applicable statute of limitations, which is generally three years after the filing of the tax return for federal purposes and four years for most state returns. There are no uncertain tax positions that require a provision for income taxes.
SRH Funds
NOTES TO FINANCIAL STATEMENTS
October 31, 2024 (Continued)
NOTE 3 - DERIVATIVE FINANCIAL INSTRUMENTS
As a part of SRH REIT Covered Call ETF’s investment strategy, the Fund may invest to a lesser extent in derivatives contracts. In doing so, the Fund will employ strategies in differing combinations to permit them to increase, decrease, or change the level or types of exposure to market factors. Central to those strategies are features inherent in derivatives that make them more attractive for this purpose than equity or debt securities; they require little or no initial cash investment, they can focus exposure on only certain selected risk factors, and they may not require the ultimate receipt or delivery of the underlying security (or securities) to the contract. This may allow the Fund to pursue its objectives more quickly and efficiently than if it were to make direct purchases or sales of securities capable of affecting a similar response to market factors.
Risk of Investing in Derivatives: The Fund’s use of derivatives can result in losses due to unanticipated changes in the market risk factors and the overall market. In instances where the Fund is using derivatives to decrease, or hedge, exposures to market risk factors for securities held by the Fund, there are also risks that those derivatives may not perform as expected, resulting in losses for the combined or hedged positions.
Derivatives may have little or no initial cash investment relative to their market value exposure and therefore can produce significant gains or losses in excess of their cost. This use of embedded leverage allows the Fund to increase its market value exposure relative to its net assets and can substantially increase the volatility of the Fund’s performance.
Associated risks from investing in derivatives also exist and potentially could have significant effects on the valuation of the derivative and the Fund. Typically, the associated risks are not the risks that the Fund is attempting to increase or decrease exposure to, per its investment objectives, but are the additional risks from investing in derivatives.
Examples of these associated risks are liquidity risk, which is the risk that the Fund will not be able to sell or close out the derivative in a timely manner, and counterparty credit risk, which is the risk that the counterparty will not fulfill its obligation to the Fund. In addition, use of derivatives may increase or decrease exposure to the following risk factors:
Equity Risk: Equity risk relates to the change in value of equity securities as they relate to increases or decreases in the general market. Associated risks can be different for each type of derivative and are discussed by each derivative type in the notes that follow
Option Contracts: The Fund may enter into options transactions for hedging purposes and for non-hedging purposes such as seeking to enhance return. The Fund may write U.S. exchange-traded covered call options on REITs held by the Fund. A call option on an asset written by the Fund obligates the Fund to sell the specified asset to the holder (purchaser) at a stated price (the exercise price) if the option is exercised before a specified date (the expiration date). Premiums received when writing options are recorded as liabilities and are subsequently adjusted to the current value of the options written. Premiums received from writing options that expire are treated as realized gains. Premiums received from writing options, which are either exercised or closed, are offset against the proceeds received or amount paid on the transaction to determine realized gains or losses.
As of October 31, 2024, the effects of derivative instruments on the Statement of Assets and Liabilities were as follows:
| | | Liability Derivatives Statement of | |
| | | Assets and Liabilities Location | |
| | | Location | | | Value | |
| SRH REIT Covered Call ETF | | | | | | |
| Equity Contracts (Written Options) | | Written options, at | | $ | 427,395 | |
| | | value | | | | |
| Total | | | | $ | 427,395 | |
For the period November 1, 2023 (commencement of operations) through October 31, 2024, the effects of derivative instruments on the Statement of Operations were as follows:
| Risk Exposure | | Statement of Operations Location | | Realized Gain on
Derivatives | | | Change in
Unrealized
Appreciation/
Depreciation on
Derivatives | |
| SRH REIT Covered Call ETF | | | | | | | | |
| Equity Contracts (Written Options) | | Net realized gain on written options/Net change in unrealized appreciation/depreciation on written options | | $ | 68,835 | | | $ | 224,604 | |
| Total | | | | $ | 68,835 | | | $ | 224,604 | |
The average monthly notional value of written option contracts for the Fund was $22,763,069 during the period November 1, 2023 (commencement of operations) through October 31, 2024.
SRH Funds
NOTES TO FINANCIAL STATEMENTS
October 31, 2024 (Continued)
NOTE 4 - ADVISORY FEES AND OTHER AFFILIATED TRANSACTIONS
The Adviser serves as the investment adviser to the Funds. Pursuant to the Investment Advisory Agreements, the Funds pay the Adviser a Unitary Management Fee, which is calculated daily and paid monthly, at an annual rate of 0.75% for the SRH REIT Covered Call ETF and 0.35% for the SRH U.S. Quality ETF of the Funds’ average daily net assets. Out of the Unitary Management Fees, the Adviser has agreed to pay substantially all of the expenses of the Fund, including the cost of transfer agency, custody, fund administration, trustees and other non-distribution related services necessary for the Funds to operate, except for: the fees paid to the Adviser pursuant to the Investment Advisory Agreement, interest charges on any borrowings, dividends and other expenses on securities sold short, taxes, brokerage commissions and other expenses incurred in placing orders for the purchase and sale of securities and other investment instruments, acquired fund fees and expenses, accrued deferred tax liability, distribution (12b-1) fees and expenses, litigation expenses, and other non-routine or extraordinary expenses.
SRH has served as the primary sub-adviser to SRH REIT Covered Call ETF since inception. Pursuant to a Sub-Advisory Agreement between the Trust, the Adviser, and SRH. SRH is responsible for the day-to-day management of the Fund’s portfolio and determining the portfolio securities to be bought and sold.
Vident Asset Management (“VA”) has served as the trading sub-adviser to SRH REIT Covered Call ETF since inception and has served as the sub-adviser to SRH U.S. Quality ETF since July 14, 2023. Pursuant to a Sub- Advisory Agreement between the Trust, the Adviser, and VA, VA is responsible for trading portfolio securities on behalf of the Funds, including selecting broker-dealers to execute purchase and sale transactions as instructed by the Adviser or in connection with any rebalancing or reconstitution of SRH U.S. Quality ETF’s Index.
For the services SRH and VA provide to the Funds, they are compensated by the Adviser out of its Unitary Management Fee.
Vident Investment Advisory, LLC (“VIA”), an affiliate of VA, served as the Fund’s sub-adviser to SRH U.S. Quality ETF from the Fund’s commencement until July 14, 2023, when its sub-advisory agreement with the Adviser and the Trust was terminated due to a change of control of VIA’s parent company, at which point VA replaced VIA in the sub-advisory role. During the period it served as the Fund’s sub-adviser, VIA provided materially identical services as VA and was compensated by the Adviser out of its Unitary Management Fee.
Paralel Technologies LLC (the “Administrator”), the parent company of the Adviser and the Distributor, serves as the Funds’ administrator and fund accountant pursuant to an Administration and Fund Accounting Agreement. The Administrator provides the Fund with certain administrative, tax and accounting services. Fees for these services are paid by the Adviser out of its Unitary Management Fees.
The Distributor, a wholly owned subsidiary of the Administrator and affiliate of the Adviser, acts as the principal underwriter for the Funds and distributes shares pursuant to a Distribution Agreement. Shares are continuously offered for sale by the Distributor only in Creation Units as described in Note 1. The Distributor is a broker-dealer registered under the Securities Exchange Act of 1934, as amended, and is a member of the Financial Industry Regulatory Authority.
State Street Bank and Trust Company (“State Street”) serves as the custodian of the Funds’ assets pursuant to a Custody Agreement and as the transfer agent pursuant to a Transfer Agent Agreement. Fees for these services are paid by the Adviser out of its Unitary Management Fee.
The officers and the Interested Trustee of the Trust are officers or employees of the Adviser, Administrator, and/or Distributor. No persons (other than the Independent Trustees) receive compensation for acting as a trustee or officer. For their services, Independent Trustees receive a quarterly retainer, meeting fees, as well as reimbursement for reasonable travel, lodging and other expenses in connection with attendance at meetings. Trustee fees and expenses are paid by the Adviser out of its Unitary Management Fee.
NOTE 5 - PURCHASES AND SALES OF SECURITIES
For the periods ended October 31, 2024, the cost of purchases and proceeds from sales of investment securities, excluding short-term investments and in-kind transactions, were as follows:
| Fund | | Purchases | | | Sales | |
| SRH REIT Covered Call ETF | | $ | 21,642,680 | | | $ | 21,196,260 | |
| SRH U.S. Quality ETF | | | 53,518,575 | | | | 53,913,391 | |
For the periods ended October 31, 2024, in-kind transactions associated with creations and redemptions for the Funds were as follows:
| Fund | | In-Kind Purchases | | | In-Kind Sales | |
| SRH REIT Covered Call ETF | | $ | 56,095,641 | | | $ | 10,486,589 | |
| SRH U.S. Quality ETF | | | 51,273,899 | | | | 50,818,397 | |
NOTE 6 - BENEFICIAL INTEREST TRANSACTIONS
Shares are purchased from or redeemed by the Funds only in Creation Unit size aggregations generally of 25,000 and 50,000 Shares for SRH REIT Covered Call ETF and SRH U.S. Quality ETF, respectively with Authorized Participants. Authorized Participants must be either broker-dealers or other participants in the clearing process through the Continuous Net Settlement System of the NSCC, clearing agencies registered with the SEC, or DTC Participants and must execute a Participant Agreement with the Distributor and accepted by State Street. Transactions of Creation Units generally consist of an in-kind designated portfolio of securities (“Deposit Securities”), with a cash component equal to the difference between the Deposit Securities and the NAV per unit of the Fund on the transaction date. The Fund may require cash to replace Deposit Securities if such securities are not available in sufficient quantities for delivery, are not eligible to be transferred or traded, are restricted under securities laws, or as a result of other situations.
SRH Funds
NOTES TO FINANCIAL STATEMENTS
October 31, 2024 (Continued)
Beneficial Interest transactions were as follows:
| | | For the Period | |
| | | November 1, 2023 | |
| | | (Commencement of | |
| | | Operations) through | |
| | | October 31, 2024 | |
| SRH REIT Covered Call ETF | | | | |
| Shares sold | | | 1,075,000 | |
| Shares redeemed | | | (175,000 | ) |
| Net increase in shares outstanding | | | 900,000 | |
| | | For the Year Ended | | | For the Period Ended | | | For the Period Ended | |
| | | October 31, 2024 | | | October 31, 2023 | | | August 31, 2023 | |
| SRH U.S. Quality ETF | | | | | | | | | | | | |
| Shares sold | | | 1,550,000 | | | | – | | | | 5,400,000 | |
| Shares redeemed | | | (1,550,000 | ) | | | – | | | | (1,400,000 | ) |
| Net increase in shares outstanding | | | – | | | | – | | | | 4,000,000 | |
NOTE 7 - TAX BASIS DISTRIBUTIONS AND TAX BASIS INFORMATION
As determined on October 31, 2024, permanent differences resulting primarily from in-kind redemptions were reclassified at fiscal year-end. These reclassifications had no effect on net increase in net assets resulting from operations, net assets applicable to common stockholder or net asset value per common share outstanding. Permanent book and tax differences were reclassified at October 31, 2024 among paid in capital and total distributable earnings for the Funds as follows:
| | | | | | Total Distributable | |
| Fund | | Paid-in Capital | | | Earnings | |
| SRH REIT Covered Call ETF | | $ | 1,287,467 | | | $ | (1,287,467 | ) |
| SRH U.S. Quality ETF | | | 14,849,539 | | | | (14,849,539 | ) |
The character of distributions for SRH REIT Covered Call ETF paid on a tax basis during the period ended October 31, 2024 was as follows:
| | | | | | Long-Term | | | | |
| | | Ordinary | | | Capital | | | Tax Return of | |
| Fund | | Income | | | Gain | | | Capital | |
| SRH REIT Covered Call ETF | | $ | 2,991,424 | | | $ | 182,243 | | | $ | 349,239 | |
The character of distributions for SRH U.S. Quality ETF paid on a tax basis during the period ended October 31, 2024 was as follows:
| | | | | | Long-Term | |
| | | Ordinary | | | Capital | |
| Fund | | Income | | | Gain | |
| SRH U.S. Quality ETF | | $ | 1,044,283 | | | $ | – | |
The character of distributions for SRH U.S. Quality ETF paid on a tax basis during the period ended October 31, 2023 was as follows:
| | | | | | Long-Term | |
| | | Ordinary | | | Capital | |
| Fund | | Income | | | Gain | |
| SRH U.S. Quality ETF | | $ | 290,650 | | | $ | – | |
The character of distributions for SRH U.S. Quality ETF paid on a tax basis during the period ended August 31, 2023 was as follows:
| | | | | | Long-Term | |
| | | Ordinary | | | Capital | |
| Fund | | Income | | | Gain | |
| SRH U.S. Quality ETF | | $ | 781,269 | | | $ | – | |
SRH Funds
NOTES TO FINANCIAL STATEMENTS
October 31, 2024 (Continued)
The amounts of net unrealized appreciation/depreciation and the cost of investment securities for tax purposes at October 31, 2024 were as follows:
| | | | | | | | | Net | | | | | | | |
| | | Gross | | | Gross | | | Appreciation/ | | | | | | Cost of | |
| | | Appreciation | | | Depreciation | | | (Depreciation) | | | Net Unrealized | | | Investments for | |
| | | (excess of value | | | (excess of tax | | | of written call | | | Appreciation/ | | | Income Tax | |
| | | over tax cost) | | | cost over value) | | | options | | | (Depreciation) | | | Purposes | |
| SRH REIT Covered Call ETF | | $ | 6,686,565 | | | $ | (1,386,022 | ) | | $ | 224,604 | | | $ | 5,525,147 | | | $ | 48,564,200 | |
| SRH U.S. Quality ETF | | | 33,968,325 | | | | (4,819,801 | ) | | | – | | | | 29,148,524 | | | | 118,393,407 | |
The primary difference between book and tax basis unrealized appreciation is attributable to wash sale loss deferrals.
As of October 31, 2024, the components of distributable earnings on a tax basis were as follows:
| | | Undistributed | | | | | | | | | | | | | |
| | | Net | | | Accumulated Net | | | Unrealized | | | Other | | | | |
| | | Investment | | | Realized | | | Appreciation/ | | | Accumulated | | | | |
| | | Income/(Loss) | | | Gain/(Loss) | | | (Depreciation) | | | Gain/(Loss) | | | Total | |
| SRH REIT Covered Call ETF | | $ | — | | | $ | – | | | $ | 5,525,147 | | | $ | (49,809 | ) | | $ | 5,475,338 | |
| SRH U.S. Quality ETF | | | 28,522 | | | | (4,294,513 | ) | | | 29,148,524 | | | | – | | | | 24,882,533 | |
As of October 31, 2024, the following amounts are available as capital loss carry forwards to the next tax year:
| | | No Expiration | | | No Expiration | |
| Fund | | Short-Term | | | Long-Term | |
| SRH U.S. Quality ETF | | $ | 2,914,209 | | | $ | 1,380,304 | |
NOTE 8 - INDEMNIFICATIONS
In the normal course of business, the Trust or Funds enter into contracts that contain a variety of representations which provide general indemnifications. Additionally, the Declaration of Trust provides that the Trust shall indemnify each person who is, or has been, a Trustee, officer, employee or agent of the Trust against certain liabilities arising out of the performance of their duties. The Funds’ maximum exposure under these arrangements is unknown, however, the Funds expect the risk of loss to be remote.
NOTE 9 - SUBSEQUENT EVENTS
On November 22, 2024, the SRH REIT Covered Call ETF paid a distribution of $0.30861 per share to shareholders of record on November 21, 2024.
Effective December 1, 2024 the sub-adviser for SRH REIT Covered Call ETF and the index provider for SRH U.S. Quality ETF, Rocky Mountain Advisers, LLC, changed its name to SRH Advisors, LLC.
SRH Funds
REPORT OF INDEPENDENT REGISTERED PUBLIC ACCOUNTING FIRM
To the Shareholders of SRH REIT Covered Call ETF and SRH U.S. Quality ETF and Board of Trustees of Elevation Series Trust
Opinion on the Financial Statements
We have audited the accompanying statements of assets and liabilities, including the schedules of investments, of Elevation Series Trust comprising the funds listed below (the “Funds”) as of October 31, 2024, the related statements of operations, the statement of changes in net assets, and the financial highlights for each of the periods indicated below, and the related notes (collectively referred to as the “financial statements”). In our opinion, the financial statements present fairly, in all material respects, the financial position of each of the Funds as of October 31, 2024, the results of their operations, the changes in net assets, and the financial highlights for each of the periods indicated below in conformity with accounting principles generally accepted in the United States of America.
| | | | |
| Fund Name | Statements of Operations | Statement(s) of Changes
in Net Assets | Financial Highlights |
| SRH REIT Covered Call ETF | For the period November 1, 2023 (commencement of operations) through October 31, 2024 |
| SRH U.S. Quality ETF | For the year ended October 31, 2024 | For the year ended October 31, 2024, for the period September 1, 2023 through October 31, 2023 and for the period October 4, 2022 (commencement of operations) through August 31, 2023 |
| | | | |
Basis for Opinion
These financial statements are the responsibility of the Funds’ management. Our responsibility is to express an opinion on the Funds’ financial statements based on our audits. We are a public accounting firm registered with the Public Company Accounting Oversight Board (United States) (“PCAOB”) and are required to be independent with respect to the Funds in accordance with the U.S. federal securities laws and the applicable rules and regulations of the Securities and Exchange Commission and the PCAOB.
We conducted our audits in accordance with the standards of the PCAOB. Those standards require that we plan and perform the audit to obtain reasonable assurance about whether the financial statements are free of material misstatement whether due to error or fraud.
Our audits included performing procedures to assess the risks of material misstatement of the financial statements, whether due to error or fraud, and performing procedures that respond to those risks. Such procedures included examining, on a test basis, evidence regarding the amounts and disclosures in the financial statements. Our procedures included confirmation of securities owned as of October 31, 2024 by correspondence with the custodian and brokers. Our audits also included evaluating the accounting principles used and significant estimates made by management, as well as evaluating the overall presentation of the financial statements. We believe that our audits provide a reasonable basis for our opinion.
We have served as the auditor of one or more investment companies advised by Paralel Advisors, LLC since 2021.

COHEN & COMPANY, LTD.
Cleveland, Ohio
December 23, 2024
SRH Funds
UNAUDITED TAX DESIGNATIONS
October 31, 2024 (Unaudited)
The Funds designate the following as percentages of taxable ordinary income distributions, up to the maximum amount allowable, for the calendar year ended December 31, 2023:
| | Dividends Received | Qualified Dividend |
| | Deduction | Income Percentage |
| SRH REIT Covered Call ETF | 4.23% | 5.14% |
| SRH U.S. Quality ETF | 100.00% | 100.00% |
In early 2024, if applicable, shareholders of record received this information for the distributions paid to them by the Funds during the calendar year 2023 via Form 1099. The Fund will notify shareholders in early 2025 of amounts paid to them by the Funds, if any, during the calendar year 2024.
Pursuant to Section 852(b)(3) of the Internal Revenue Code, the SRH REIT Covered Call ETF designated $182,243 as long-term capital gain distribution for the year ended October 31, 2024.
Must be accompanied or preceded by a prospectus.
Paralel Distributors LLC is the Distributor for SRH REIT Covered Call ETF and SRH U.S. Quality ETF.
TrueShares ETFs
TrueShares Quarterly Bear Hedge ETF (CBOE: QBER)
TrueShares Quarterly Bull Hedge ETF (CBOE: QBUL)
Annual Financial Statements
October 31, 2024
TABLE OF CONTENTS
TrueShares Quarterly Bear Hedge ETF
SCHEDULE OF INVESTMENTS
October 31, 2024
| Underlying Security/Expiration Date/ | | | | | | |
| Exercise Price/Notional Amount | | Contracts | | | Value | |
| PURCHASED OPTIONS - 0.80% | | | | | | | | |
| Put Options Purchased - 0.80% | | | | | | | | |
| SPDR S&P 500 ETF Trust 12/20/2024, $539.84, $56,579,680 | | | 995 | | | $ | 643,586 | |
| | | | | | | | | |
| TOTAL PURCHASED OPTIONS | | | | | | | | |
| (Cost $712,613) | | | | | | | 643,586 | |
| | | Principal | | | | |
| Description/Maturity Date/Rate | | Amount | | | Value | |
| U.S. TREASURY OBLIGATIONS - 99.17% | | | | | | | | |
| | | | | | | | | |
| Treasury Bills | | | | | | | | |
| 12/19/2024, 4.670% | | | 80,320,000 | | | | 79,833,261 | |
| | | | | | | | | |
| TOTAL U.S. TREASURY OBLIGATIONS | | | | | | | | |
| (Cost $79,827,337) | | | | | | | 79,833,261 | |
| Description | | Shares | | | Value | |
| MONEY MARKET FUNDS - 0.06% | | | | | | | | |
| State Street Institutional U.S. Government Money Market Fund, Administration Class, 4.580% (7- day yield)(a) | | | 51,281 | | | | 51,281 | |
| | | | | | | | | |
| TOTAL MONEY MARKET FUNDS | | | | | | | | |
| (Cost $51,281) | | | | | | | 51,281 | |
| | | | | | | | | |
| TOTAL INVESTMENTS - 100.03% | | | | | | | | |
| (Cost $80,591,231) | | | | | | $ | 80,528,128 | |
| | | | | | | | | |
| Liabilities in Excess of Other Assets - (0.03)% | | | | | | | (23,645 | ) |
| | | | | | | | | |
| NET ASSETS - 100.00% | | | | | | $ | 80,504,483 | |
| (a) | Rate disclosed is a 7-Day Yield as of October 31, 2024. |
Percentages are stated as a percent of net assets.
See Notes to Financial Statements
TrueShares Quarterly Bull Hedge ETF
SCHEDULE OF INVESTMENTS
October 31, 2024
| Underlying Security/Expiration Date/ | | | | | | |
| Exercise Price/Notional Amount | | Contracts | | | Value | |
| PURCHASED OPTIONS - 0.55% | | | | | | | | |
| Call Options Purchased - 0.55% | | | | | | | | |
| SPDR S&P 500 ETF Trust 12/20/2024, $596.66, $41,055,808 | | | 722 | | | $ | 256,527 | |
| | | | | | | | | |
| TOTAL PURCHASED OPTIONS | | | | | | | | |
| (Cost $415,735) | | | | | | | 256,527 | |
| | | Principal | | | | |
| Description/Maturity Date/Rate | | Amount | | | Value | |
| U.S. TREASURY OBLIGATIONS - 99.29% | | | | | | | | |
| | | | | | | | | |
| Treasury Bills | | | | | | | | |
| 12/19/2024, 4.670% | | | 46,916,000 | | | | 46,631,689 | |
| | | | | | | | | |
| TOTAL U.S. TREASURY OBLIGATIONS | | | | | | | | |
| (Cost $46,628,244) | | | | | | | 46,631,689 | |
| Description | | Shares | | | Value | |
| MONEY MARKET FUNDS - 0.13% | | | | | | | | |
| State Street Institutional U.S. Government Money Market Fund, Administration Class, 4.580% (7- day yield)(a) | | | 61,796 | | | | 61,796 | |
| | | | | | | | | |
| TOTAL MONEY MARKET FUNDS | | | | | | | | |
| (Cost $61,796) | | | | | | | 61,796 | |
| | | | | | | | | |
| TOTAL INVESTMENTS - 99.97% | | | | | | | | |
| (Cost $47,105,775) | | | | | | $ | 46,950,012 | |
| | | | | | | | | |
| Other Assets in Excess of Liabilities - 0.03% | | | | | | | 15,091 | |
| | | | | | | | | |
| NET ASSETS - 100.00% | | | | | | $ | 46,965,103 | |
| (a) | Rate disclosed is a 7-Day Yield as of October 31, 2024. |
Percentages are stated as a percent of net assets.
See Notes to Financial Statements
TrueShares ETFs
STATEMENTS OF ASSETS AND LIABILITIES
October 31, 2024
| | | TrueShares
Quarterly Bear
Hedge ETF | | | TrueShares
Quarterly Bull
Hedge ETF | |
| | | | | | | |
| ASSETS: | | | | | | |
| Investments, at value | | $ | 80,528,128 | | | $ | 46,950,012 | |
| Deposits with broker for purchased options | | | 29,076 | | | | 46,034 | |
| Dividends receivable | | | 221 | | | | 263 | |
| Total Assets | | | 80,557,425 | | | | 46,996,309 | |
| LIABILITIES: | | | | | | | | |
| Payable to investment advisor | | | 52,942 | | | | 31,206 | |
| Total Liabilities | | | 52,942 | | | | 31,206 | |
| NET ASSETS | | $ | 80,504,483 | | | $ | 46,965,103 | |
| | | | | | | | | |
| NET ASSETS CONSIST OF | | | | | | | | |
| Paid in capital | | $ | 80,202,925 | | | $ | 46,841,366 | |
| Total distributable earnings | | | 301,558 | | | | 123,737 | |
| NET ASSETS | | $ | 80,504,483 | | | $ | 46,965,103 | |
| | | | | | | | | |
| INVESTMENTS, AT COST | | $ | 80,591,231 | | | $ | 47,105,775 | |
| | | | | | | | | |
| Net asset value: | | | | | | | | |
| Net assets | | $ | 80,504,483 | | | $ | 46,965,103 | |
| Shares of beneficial interest outstanding (unlimited number of shares authorized, no par value) | | | 3,210,000 | | | | 1,860,000 | |
| Net asset value, price per share | | $ | 25.08 | | | $ | 25.25 | |
See Notes to Financial Statements
TrueShares ETFs
STATEMENTS OF OPERATIONS
For the Period June 28, 2024 (Commencement of Operations) through October 31, 2024
| | | TrueShares Quarterly | | | TrueShares Quarterly | |
| | | Bear Hedge ETF | | | Bull Hedge ETF | |
| INVESTMENT INCOME: | | | | | | | | |
| Interest and other income | | $ | 965,073 | | | $ | 687,398 | |
| Total Investment Income | | | 965,073 | | | | 687,398 | |
| EXPENSES: | | | | | | | | |
| Investment advisory fees | | | 150,458 | | | | 106,350 | |
| Total Expenses | | | 150,458 | | | | 106,350 | |
| NET INVESTMENT INCOME | | | 814,615 | | | | 581,048 | |
| Net realized gain/(loss) on: | | | | | | | | |
| Investments | | | (449,954 | ) | | | (301,548 | ) |
| Investments sold in-kind | | | (1,840 | ) | | | – | |
| Total Net Realized Loss | | | (451,794 | ) | | | (301,548 | ) |
| Net change in unrealized appreciation/depreciation on: | | | | | | | | |
| Investments | | | (63,103 | ) | | | (155,763 | ) |
| Total Net Change in Unrealized Appreciation/Depreciation | | | (63,103 | ) | | | (155,763 | ) |
| NET REALIZED AND UNREALIZED LOSS ON INVESTMENTS | | | (514,897 | ) | | | (457,311 | ) |
| NET INCREASE IN NET ASSETS RESULTING FROM OPERATIONS | | $ | 299,718 | | | $ | 123,737 | |
See Notes to Financial Statements
TrueShares Quarterly Bear Hedge ETF
STATEMENTS OF CHANGES IN NET ASSETS
| | | For the Period
June 28, 2024
(Commencement of
Operations) through
October 31, 2024 | |
| OPERATIONS | | | |
| Net investment income | | $ | 814,615 | |
| Net realized loss | | | (451,794 | ) |
| Net change in unrealized appreciation/depreciation | | | (63,103 | ) |
| Net increase in net assets resulting from operations | | | 299,718 | |
| DISTRIBUTIONS TO SHAREHOLDERS | | | | |
| From distributable earnings | | | – | |
| Net decrease in net assets from distributions | | | – | |
| BENEFICIAL INTEREST TRANSACTIONS (NOTE 5) | | | | |
| Shares sold | | | 81,459,535 | |
| Shares redeemed | | | (1,254,770 | ) |
| Net increase in net assets derived from beneficial interest transactions | | | 80,204,765 | |
| Net increase in net assets | | | 80,504,483 | |
| NET ASSETS | | | | |
| Beginning of period | | | – | |
| End of period | | $ | 80,504,483 | |
See Notes to Financial Statements
TrueShares Quarterly Bull Hedge ETF
STATEMENTS OF CHANGES IN NET ASSETS
| | | For the Period
June 28, 2024
(Commencement of
Operations) through
October 31, 2024 | |
| OPERATIONS | | | |
| Net investment income | | $ | 581,048 | |
| Net realized loss | | | (301,548 | ) |
| Net change in unrealized appreciation/depreciation | | | (155,763 | ) |
| Net increase in net assets resulting from operations | | | 123,737 | |
| DISTRIBUTIONS TO SHAREHOLDERS | | | | |
| From distributable earnings | | | – | |
| Net decrease in net assets from distributions | | | – | |
| BENEFICIAL INTEREST TRANSACTIONS (NOTE 5) | | | | |
| Shares sold | | | 48,103,574 | |
| Shares redeemed | | | (1,262,208 | ) |
| Net increase in net assets derived from beneficial interest transactions | | | 46,841,366 | |
| Net increase in net assets | | | 46,965,103 | |
| NET ASSETS | | | | |
| Beginning of period | | | – | |
| End of period | | $ | 46,965,103 | |
See Notes to Financial Statements
TrueShares Quarterly Bear Hedge ETF
FINANCIAL HIGHLIGHTS
| | | For the Period
June 28, 2024
(Commencement of
Operations) through
October 31, 2024(a) | |
| Net Asset Value, Beginning of Period | | $ | 25.00 | |
| | | | | |
| INCOME FROM INVESTMENT OPERATIONS: | | | | |
| Net investment income(b) | | | 0.36 | |
| Net realized and unrealized (loss) on investments | | | (0.28 | ) |
| Total from Investment Operations | | | 0.08 | |
| | | | | |
| DISTRIBUTIONS: | | | | |
| From distributable earnings | | | – | |
| Total Distributions | | | – | |
| | | | | |
| Net Increase in net asset value | | | 0.08 | |
| Net Asset Value - End of Period | | $ | 25.08 | |
| TOTAL RETURN(c) | | | 0.32 | % |
| | | | | |
| RATIOS AND SUPPLEMENTAL DATA: | | | | |
| Net Assets, end of period (000s) | | $ | 80,504 | |
| Ratio of net operating expenses to average net assets | | | 0.79 | %(d) |
| Ratio of net investment income to average net assets | | | 4.23 | %(d) |
| Portfolio turnover rate(e) | | | – | |
| (a) | The net asset value at the beginning of the period represents the initial shares outstanding on June 28, 2024 (Commencement of Operations). |
| (b) | Calculated based on the average number of common shares outstanding during each fiscal period. |
| (c) | Total return is calculated assuming an initial investment made at the net asset value at the beginning of the period and redemption at the net asset value on the last day of the period and assuming all distributions are reinvested. Total return calculated for a period of less than one year is not annualized. |
| (e) | Portfolio turnover rate for periods less than one full year have not been annualized. |
See Notes to Financial Statements
TrueShares Quarterly Bull Hedge ETF
FINANCIAL HIGHLIGHTS
| | | For the Period
June 28, 2024
(Commencement of
Operations) through
October 31, 2024(a) | |
| Net Asset Value, Beginning of Period | | $ | 25.00 | |
| | | | | |
| INCOME FROM INVESTMENT OPERATIONS: | | | | |
| Net investment income(b) | | | 0.37 | |
| Net realized and unrealized (loss) on investments | | | (0.12 | ) |
| Total from Investment Operations | | | 0.25 | |
| | | | | |
| DISTRIBUTIONS: | | | | |
| From distributable earnings | | | – | |
| Total Distributions | | | – | |
| | | | | |
| Net Increase in net asset value | | | 0.25 | |
| Net Asset Value - End of Period | | $ | 25.25 | |
| TOTAL RETURN(c) | | | 1.00 | % |
| | | | | |
| RATIOS AND SUPPLEMENTAL DATA: | | | | |
| Net Assets, end of period (000s) | | $ | 46,965 | |
| Ratio of net operating expenses to average net assets | | | 0.79 | %(d) |
| Ratio of net investment income to average net assets | | | 4.27 | %(d) |
| Portfolio turnover rate(e) | | | – | |
| (a) | The net asset value at the beginning of the period represents the initial shares outstanding on June 28, 2024 (Commencement of Operations). |
| (b) | Calculated based on the average number of common shares outstanding during each fiscal period. |
| (c) | Total return is calculated assuming an initial investment made at the net asset value at the beginning of the period and redemption at the net asset value on the last day of the period and assuming all distributions are reinvested. Total return calculated for a period of less than one year is not annualized. |
| (e) | Portfolio turnover rate for periods less than one full year have not been annualized. |
See Notes to Financial Statements
TrueShares ETFs
NOTES TO FINANCIAL STATEMENTS
October 31, 2024
NOTE 1 - ORGANIZATION
Elevation Series Trust (the “Trust”) was organized on March 7, 2022, as a Delaware statutory trust, and is authorized to issue multiple investment series. The Trust is registered with the Securities and Exchange Commission under the Investment Company Act of 1940, as amended (the “1940 Act”), as an open-end management investment company. These financial statements relate to two series of the Trust, TrueShares Quarterly Bear Hedge ETF and TrueShares Quarterly Bull Hedge ETF (each a “Fund” and collectively the “Funds”). TrueShares Quarterly Bear Hedge ETF’s investment objective is substantial protection of principal with total return. TrueShares Quarterly Bull Hedge ETF’s investment objective is total return with substantial protection of principal. Both Funds commenced operations on June 28, 2024.
The Funds currently offer an unlimited number of one class of shares, without par value, which are listed and traded on the Cboe BZX Exchange, Inc. (“Cboe” or the “Exchange”). The Funds issue and redeem shares only in creation units (“Creation Units”) which are offered on a continuous basis through Paralel Distributors LLC (the “Distributor”), without a sales load (but subject to transaction fees, if applicable), at the net asset value per share next determined after receipt of an order in proper form pursuant to the terms of the Authorized Participant Agreement, calculated as of the scheduled close of regular trading on the Exchange on any day on which the Exchange is open for business. The Funds do not issue fractional Creation Units. The offerings of the Funds’ shares are registered under the Securities Act of 1933, as amended.
NOTE 2 - SIGNIFICANT ACCOUNTING POLICIES
The following is a summary of significant accounting policies consistently followed by the Funds in the preparation of their financial statements. The accompanying financial statements were prepared in accordance with accounting principles generally accepted in the United States (“GAAP”). This requires management to make estimates and assumptions that affect the reported amounts in the financial statements. Actual results could differ from those estimates. The Fund is an investment company and follows accounting and reporting guidance in the Financial Accounting Standards Board (“FASB”) Accounting Standards Topic 946 “Financial Services – Investment Companies,” including Accounting Standard Update 2013-08 .”
Portfolio Valuation: The net asset value per share (“NAV”) of the Funds is determined no less frequently than daily, on each day that the New York Stock Exchange (“NYSE”) is open for trading, as of the close of regular trading on the NYSE (normally 4:00 p.m. Eastern time). The NAV is determined by dividing the value of the Funds’ total assets less its liabilities by the number of shares outstanding.
U.S. government bonds and notes are valued at the mean of the most recent bid and asked prices on the business day. Options are valued at the mean of the highest bid and lowest ask prices on the principal exchange on which the option trades. If no quotations are available, fair value procedures will be used. Debt obligations with maturities of 60 days or less are valued at amortized cost.
Securities for which market quotations are not readily available, including circumstances under which TrueMark Investments, LLC (the “Adviser”) determines that prices received are unreliable, are valued at fair value according to procedures established and adopted by the Funds’ Board of Trustees (the “Board”). Pursuant to Rule 2a-5 under the 1940 Act, the Board has designated the Adviser as the Funds’ valuation designee with respect to the fair valuation of the Funds’ portfolio securities, subject to oversight by and periodic reporting to the Board.
The Funds disclose the classification of their fair value measurements following a three-tier hierarchy based on the inputs used to measure fair value. Inputs refer broadly to the assumptions that market participants would use in pricing the asset or liability, including assumptions about risk. Inputs may be observable or unobservable. Observable inputs reflect the assumptions market participants would use in pricing the asset or liability that are developed based on market data obtained from sources independent of the reporting entity. Unobservable inputs reflect the reporting entity’s own assumptions about the assumptions market participants would use in pricing the asset or liability that are developed based on the best information available.
Various inputs are used in determining the value of the Funds’ investments as of the end of the reporting period. When inputs used fall into different levels of the fair value hierarchy, the level in the hierarchy within which the fair value measurement falls is determined based on the lowest level input that is significant to the fair value measurement in its entirety. The designated input levels are not necessarily an indication of the risk or liquidity associated with these investments. These inputs are categorized in the following hierarchy under applicable financial accounting standards:
Level 1 – Unadjusted quoted prices in active markets for identical investments, unrestricted assets or liabilities that the Fund has the ability to access at the measurement date;
Level 2 – Quoted prices which are not active, quoted prices for similar assets or liabilities in active markets or inputs other than quoted prices that are observable (either directly or indirectly) for substantially the full term of the asset or liability; and
Level 3 – Significant unobservable prices or inputs (including the Fund’s own assumptions in determining the fair value of investments) where there is little or no market activity for the asset or liability at the measurement date.
The following is a summary of the Funds’ investments in the fair value hierarchy as of October 31, 2024:
TrueShares Quarterly Bear Hedge ETF
| Investments in Securities at Value(a) | | Level 1 - Unadjusted Quoted Prices | | | Level 2 - Other Significant Observable Inputs | | | Level 3 - Significant Unobservable Inputs | | | Total | |
| Purchased Options | | $ | – | | | $ | 643,586 | | | $ | – | | | $ | 643,586 | |
| U.S. Treasury Obligations | | | – | | | | 79,833,261 | | | | – | | | | 79,833,261 | |
| Money Market Funds | | | 51,281 | | | | – | | | | – | | | | 51,281 | |
| Total | | $ | 51,281 | | | $ | 80,476,847 | | | $ | – | | | $ | 80,528,128 | |
TrueShares ETFs
NOTES TO FINANCIAL STATEMENTS
October 31, 2024 (Continued)
TrueShares Quarterly Bull Hedge ETF
| Investments in Securities at Value(a) | | Level 1 - Unadjusted Quoted Prices | | | Level 2 - Other Significant Observable Inputs | | | Level 3 - Significant Unobservable Inputs | | | Total | |
| Purchased Options | | $ | – | | | $ | 256,527 | | | $ | – | | | $ | 256,527 | |
| U.S. Treasury Obligations | | | – | | | | 46,631,689 | | | | – | | | | 46,631,689 | |
| Money Market Funds | | | 61,796 | | | | – | | | | – | | | | 61,796 | |
| Total | | $ | 61,796 | | | $ | 46,888,216 | | | $ | – | | | $ | 46,950,012 | |
| (a) | For detailed descriptions and other security classifications, see the accompanying Schedule of Investments. |
Cash and Cash Equivalents – Cash and cash equivalents may include demand deposits and highly liquid investments, typically with original maturities of three months or less. Cash and cash equivalents are carried at cost, which approximates fair value.
Securities Transactions and Investment Income: Securities transactions are recorded as of the trade date. Realized gains and losses from securities sold are recorded on the identified cost basis. Dividend income is recorded as of the ex-dividend date or for certain foreign securities when the information becomes available to the Fund. Certain dividend income from foreign securities will be recorded, in the exercise of reasonable diligence, as soon as the Funds are informed of the dividend if such information is obtained subsequent to the ex-dividend date and may be subject to withholding taxes in these jurisdictions. Withholding taxes on foreign dividends have been provided for in accordance with the Fund's understanding of the applicable country's tax rules and rates. Non-cash dividends included in dividend income, if any, are recorded at the fair value of the securities received. Interest income, including amortization of premium and accretion of discount on debt securities, as required, is recorded on the accrual basis using the effective yield method.
Distributions to Shareholders: Dividends and distributions from net investment income and net realized capital gains and losses of the Funds, if any, are declared and paid annually or as the Board may determine from time to time.
Federal Income Tax: For federal income tax purposes, the Funds currently intend to qualify, as regulated investment companies under the provisions of Subchapter M of the Internal Revenue Code of 1986, as amended, by distributing substantially all of their earnings to their stockholders. Accordingly, no provision for federal income or excise taxes has been made.
Income and capital gain distributions are determined and characterized in accordance with income tax regulations, which may differ from GAAP. These differences are primarily due to differing treatments of income and gains on various investment securities held by each Fund, timing differences and differing characterization of distributions made by each Fund as a whole.
As of and during the period ended October 31, 2024, the Funds did not have liabilities for any unrecognized tax benefits. The Funds recognize interest and penalties, if any, related to unrecognized tax benefits as income tax expenses, in the Statements of Operations. As of October 31, 2024, there were no interest or penalties incurred by the Funds. The Funds file U.S. federal, state, and local tax returns as required. The Funds’ tax returns are subject to examination by the relevant tax authorities until expiration of the applicable statute of limitations, which is generally three years after the filing of the tax return for federal purposes and four years for most state returns. There are no uncertain tax positions that require a provision for income taxes.
NOTE 3 - DERIVATIVE FINANCIAL INSTRUMENTS
As a part of their investment strategy, the Funds may invest to a lesser extent in derivatives contracts. In doing so, the Funds will employ strategies in differing combinations to permit them to increase, decrease, or change the level or types of exposure to market factors. Central to those strategies are features inherent in derivatives that make them more attractive for this purpose than equity or debt securities; they require little or no initial cash investment, they can focus exposure on only certain selected risk factors, and they may not require the ultimate receipt or delivery of the underlying security (or securities) to the contract. This may allow the Funds to pursue its objectives more quickly and efficiently than if it were to make direct purchases or sales of securities capable of affecting a similar response to market factors.
Risk of Investing in Derivatives: The Funds’ use of derivatives can result in losses due to unanticipated changes in the market risk factors and the overall market. In instances where the Funds are using derivatives to decrease, or hedge, exposures to market risk factors for securities held by the Funds, there are also risks that those derivatives may not perform as expected, resulting in losses for the combined or hedged positions.
Derivatives may have little or no initial cash investment relative to their market value exposure and therefore can produce significant gains or losses in excess of their cost. This use of embedded leverage allow the Funds to increase their market value exposure relative to their net assets and can substantially increase the volatility of the Funds’ performance.
Associated risks from investing in derivatives also exist and potentially could have significant effects on the valuation of the derivative and the Funds. Typically, the associated risks are not the risks that the Fund is attempting to increase or decrease exposure to, per its investment objectives, but are the additional risks from investing in derivatives.
Examples of these associated risks are liquidity risk, which is the risk that the Funds will not be able to sell or close out the derivative in a timely manner, and counterparty credit risk, which is the risk that the counterparty will not fulfill its obligation to the Funds. In addition, use of derivatives may increase or decrease exposure to the following risk factors:
Equity Risk: Equity risk relates to the change in value of equity securities as they relate to increases or decreases in the general market. Associated risks can be different for each type of derivative and are discussed by each derivative type in the notes that follow
Option Writing/Purchasing: Each Fund may purchase or write (sell) put and call options. One of the risks associated with purchasing an option among others, is that a Fund pays a premium whether or not the option is exercised. Additionally, a Fund bears the risk of loss of premium and change in value should the
TrueShares ETFs
NOTES TO FINANCIAL STATEMENTS
October 31, 2024 (Continued)
counterparty not perform under the contract. The cost of securities acquired through the exercise of call options is increased by premiums paid. The proceeds from securities sold through the exercise of put options are decreased by the premiums paid. Each Fund is obligated to pay interest to the broker for any debit balance of the margin account relating to options. Each Fund pledges cash or liquid assets as collateral to satisfy the current obligations with respect to written options. The cash amount, if any, is reported on the Statements of Assets and Liabilities as Deposit with broker for written options, which is held with one counterparty. The interest incurred, if any, on the Funds is reported on the Statements of Operations as Interest expense – margin account. Interest amounts payable by the Funds, if any, are reported on the Statements of Assets and Liabilities as Interest payable – margin account.
When a Fund writes an option, an amount equal to the premium received by a Fund is recorded as a liability and is subsequently adjusted to the current value of the option written. Premiums received from writing options that expire unexercised are treated by a Fund on the expiration date as realized gains. The difference between the premium received and the amount paid on effecting a closing purchase transaction, including brokerage commissions, is recorded as a realized gain or loss. If a call option is exercised, the premium is added to the proceeds from the sale of the underlying security or currency in determining whether a Fund has realized a gain or loss. If a put option is exercised, the premium reduces the cost basis of the securities purchased by a Fund. Each Fund, as writer of an option, bears the market risk of an unfavorable change in the price of the security underlying the written option.
As of October 31, 2024, the effects of derivatives instruments on each Fund’s Statement of Assets and Liabilities were as follows:
| TrueShares Quarterly Bear Hedge ETF | | | | | |
| Risk Exposure | | Statements of Assets and Liabilities Location | | Value | |
| Asset Derivatives | | | | | | |
| Equity (Purchased Options) | | Investments, at value | | $ | 643,586 | |
| Total | | | | $ | 643,586 | |
| TrueShares Quarterly Bull Hedge ETF | | | | | |
| Risk Exposure | | Statements of Assets and Liabilities Location | | Value | |
| Asset Derivatives | | | | | | |
| Equity (Purchased Options) | | Investments, at value | | $ | 256,527 | |
| Total | | | | $ | 256,527 | |
For the period June 28, 2024 (commencement of operations) through October 31, 2024, the effects of derivative instruments on each Fund’s Statement of Operations were as follows:
| TrueShares Quarterly Bear Hedge ETF | | | | | | | | |
| Risk Exposure | | Statement of Operations Location | | Realized Gain/
(Loss) on
Derivatives | | | Change in
Unrealized
Appreciation/
Depreciation on
Derivatives | |
| Equity (Purchased Options) | | Net realized gain/(loss) on investment securities/Net change in unrealized appreciation/depreciation on investment securities | | $ | (449,955 | ) | | $ | (69,027 | ) |
| Total | | | | $ | (449,955 | ) | | $ | (69,027 | ) |
| TrueShares Quarterly Bull Hedge ETF | | | | | | | | |
| Risk Exposure | | Statement of Operations Location | | Realized Gain/
(Loss) on
Derivatives | | | Change in
Unrealized
Appreciation/
Depreciation on
Derivatives | |
| Equity (Purchased Options) | | Net realized gain/(loss) on investment securities/Net change in unrealized appreciation/depreciation on investment securities | | $ | (301,654 | ) | | $ | (159,208 | ) |
| Total | | | | $ | (301,654 | ) | | $ | (159,208 | ) |
The average monthly notional value of written option contracts, for the TrueShares Quarterly Bear Hedge ETF and TrueShares Quarterly Bull Hedge ETF were $63,411,819 and $34,671,271, respectively during the period June 28, 2024 (commencement of operations) through October 31, 2024.
NOTE 4 - ADVISORY FEES AND OTHER AFFILIATED TRANSACTIONS
The Adviser serves as the investment adviser to the Funds. Pursuant to the Investment Advisory Agreements, each Fund pays the Adviser a Unitary Management Fee, which is calculated daily and paid monthly, at an annual rate of 0.79% of each Fund’s average daily net assets. Out of the Unitary Management Fees, the Adviser has agreed to pay substantially all of the expenses of the Funds, including the cost of transfer agency, custody, fund administration, trustees and other non-distribution related services necessary for the Funds to operate, except for: the fees paid to the Adviser pursuant to the Investment Advisory Agreement, interest charges on any borrowings, dividends and other expenses on securities sold short, taxes, brokerage commissions and other expenses incurred in placing orders for the purchase and sale of securities and other investment instruments, acquired fund fees and expenses, accrued deferred tax liability, distribution (12b-1) fees and expenses, litigation expenses, and other non-routine or extraordinary expenses.
TrueShares ETFs
NOTES TO FINANCIAL STATEMENTS
October 31, 2024 (Continued)
Paralel Technologies LLC (the “Administrator”), the parent company of the Distributor, serves as the Funds’ administrator and fund accountant pursuant to an Administration and Fund Accounting Agreement. The Administrator provides the Funds with certain administrative, tax and accounting services. Fees for these services are paid by the Adviser out of its Unitary Management Fees.
The Distributor, a wholly owned subsidiary of the Administrator, acts as the principal underwriter for the Funds and distributes shares pursuant to a Distribution Agreement. Shares are continuously offered for sale by the Distributor only in Creation Units as described in Note 1. The Distributor is a broker-dealer registered under the Securities Exchange Act of 1934, as amended, and is a member of the Financial Industry Regulatory Authority.
State Street Bank and Trust Company (“State Street”) serves as the custodian of the Funds’ assets pursuant to a Custody Agreement and as the transfer agent pursuant to a Transfer Agent Agreement. Fees for these services are paid by the Adviser out of its Unitary Management Fee.
The officers and the Interested Trustee of the Trust are officers or employees of the Administrator, and/or Distributor. No persons (other than the Independent Trustees) receive compensation for acting as a trustee or officer. For their services, Independent Trustees receive a quarterly retainer, meeting fees, as well as reimbursement for reasonable travel, lodging and other expenses in connection with attendance at meetings. Trustee fees and expenses are paid by the Adviser out of its Unitary Management Fee.
NOTE 5 - PURCHASES AND SALES OF SECURITIES
For the period June 28, 2024 (commencement of operations) through October 31, 2024, the Funds made no purchases or sales of investment securities, other than short-term investments and in-kind transactions.
For the period June 28, 2024 (commencement of operations) through October 31, 2024, in-kind transactions associated with creations and redemptions for the Funds were as follows:
| Fund | | In-Kind Purchases | | | In-Kind Sales | |
| TrueShares Quarterly Bear Hedge ETF | | $ | — | | | $ | 1,238,745 | |
| TrueShares Quarterly Bull Hedge ETF | | | — | | | | — | |
NOTE 6 - BENEFICIAL INTEREST TRANSACTIONS
Shares are purchased from or redeemed by the Funds only in Creation Unit size aggregations generally of 10,000 Shares with Authorized Participants. Authorized Participants must be either broker-dealers or other participants in the clearing process through the Continuous Net Settlement System of the NSCC, clearing agencies registered with the SEC, or DTC Participants and must execute a Participant Agreement with the Distributor and accepted by State Street. Transactions of Creation Units generally consist of an in-kind designated portfolio of securities (“Deposit Securities”), with a cash component equal to the difference between the Deposit Securities and the NAV per unit of the Fund on the transaction date. The Fund may require cash to replace Deposit Securities if such securities are not available in sufficient quantities for delivery, are not eligible to be transferred or traded, are restricted under securities laws, or as a result of other situations.
| Beneficial Interest transactions were as follows: | | | | | | |
| | | TrueShares Quarterly
Bear Hedge ETF
For the Period June 28,
2024 (Commencement of
Operations) through
October 31, 2024 | | | TrueShares Quarterly
Bull Hedge ETF
For the Period June 28,
2024 (Commencement of
Operations) through
October 31, 2024 | |
| Shares sold | | | 3,260,000 | | | | 1,910,000 | |
| Shares redeemed | | | (50,000 | ) | | | (50,000 | ) |
| Net increase in shares outstanding | | | 3,210,000 | | | | 1,860,000 | |
NOTE 7 - TAX BASIS DISTRIBUTIONS AND TAX BASIS INFORMATION
As determined on October 31, 2024, permanent differences resulting primarily from in-kind redemptions were reclassified at fiscal year-end. These reclassifications had no effect on net increase in net assets resulting from operations, net assets applicable to common stockholder or net asset value per common share outstanding. Permanent book and tax differences were reclassified at October 31, 2024 among paid in capital and total distributable earnings for the Funds as follows:
| | | | | | Total Distributable | |
| Fund | | Paid-in Capital | | | Earnings | |
| TrueShares Quarterly Bear Hedge ETF | | $ | (1,840 | ) | | $ | 1,840 | |
| TrueShares Quarterly Bull Hedge ETF | | | — | | | | — | |
| | | | | | | | | |
| The Funds did not declare any distributions during the period ended October 31, 2024. | | | | | | | | |
TrueShares ETFs
NOTES TO FINANCIAL STATEMENTS
October 31, 2024 (Continued)
The amount of net unrealized appreciation/depreciation and the costs of investment securities for tax purposes at October 31, 2024 were as follows:
| | | Gross
Appreciation
(excess of value
over tax cost) | | | Gross
Depreciation
(excess of tax
cost over value) | | | Net Unrealized
Appreciation/
(Depreciation) | | | Cost of
Investments for
Income Tax
Purposes | |
| TrueShares Quarterly Bear Hedge ETF | | $ | 11,920 | | | $ | (75,023 | ) | | $ | (63,103 | ) | | $ | 80,591,231 | |
| TrueShares Quarterly Bull Hedge ETF | | | 3,596 | | | | (159,373 | ) | | | (155,777 | ) | | | 47,105,789 | |
The primary difference between book and tax basis unrealized depreciation is attributable to wash sale loss deferrals.
As of October 31, 2024, the components of distributable earnings on a tax basis were as follows:
| | | Undistributed Net
Investment
Income/(Loss) | | | Accumulated Net
Realized
Gain/(Loss) | | | Unrealized
Appreciation/
(Depreciation) | | | Total | |
| TrueShares Quarterly Bear Hedge ETF | | $ | 814,615 | | | $ | (449,954 | ) | | $ | (63,103 | ) | | $ | 301,558 | |
| TrueShares Quarterly Bull Hedge ETF | | | 581,048 | | | | (301,534 | ) | | | (155,777 | ) | | | 123,737 | |
As of October 31, 2024, the following amounts are available as capital loss carry forwards to the next tax year:
| Fund | | No Expiration
Short-Term | |
| TrueShares Quarterly Bear Hedge ETF | | $ | 449,954 | |
| TrueShares Quarterly Bull Hedge ETF | | | 301,534 | |
NOTE 8 - INDEMNIFICATIONS
In the normal course of business, the Trust or Funds enter into contracts that contain a variety of representations which provide general indemnifications. Additionally, the Declaration of Trust provides that the Trust shall indemnify each person who is, or has been, a Trustee, officer, employee or agent of the Trust against certain liabilities arising out of the performance of their duties. The Funds’ maximum exposure under these arrangements is unknown, however, the Funds expect the risk of loss to be remote.
NOTE 9 - SUBSEQUENT EVENTS
Management has evaluated subsequent events through the date these financial statements were issued and has determined that there were no subsequent events to report through the issuance of these financial statements.
TrueShares ETFs
REPORT OF INDEPENDENT REGISTERED PUBLIC ACCOUNTING FIRM
To the Shareholders of TrueShares Quarterly Bear Hedge ETF and TrueShares Quarterly Bull Hedge ETF and Board of Trustees of Elevation Series Trust
Opinion on the Financial Statements
We have audited the accompanying statements of assets and liabilities, including the schedules of investments, of TrueShares Quarterly Bear Hedge ETF and TrueShares Quarterly Bull Hedge ETF (the “Funds”), each a series of Elevation Series Trust, as of October 31, 2024, the related statements of operations and changes in net assets, and the financial highlights, for the period from June 28, 2024 (commencement of operations) through October 31, 2024, and the related notes (collectively referred to as the “financial statements”). In our opinion, the financial statements present fairly, in all material respects, the financial position of each of the Funds as of October 31, 2024, the results of their operations, the changes in net assets, and the financial highlights for the period from June 28, 2024 (commencement of operations) through October 31, 2024, in conformity with accounting principles generally accepted in the United States of America.
Basis for Opinion
These financial statements are the responsibility of the Funds’ management. Our responsibility is to express an opinion on the Funds’ financial statements based on our audits. We are a public accounting firm registered with the Public Company Accounting Oversight Board (United States) (“PCAOB”) and are required to be independent with respect to the Funds in accordance with the U.S. federal securities laws and the applicable rules and regulations of the Securities and Exchange Commission and the PCAOB.
We conducted our audits in accordance with the standards of the PCAOB. Those standards require that we plan and perform the audit to obtain reasonable assurance about whether the financial statements are free of material misstatement whether due to error or fraud.
Our audits included performing procedures to assess the risks of material misstatement of the financial statements, whether due to error or fraud, and performing procedures that respond to those risks. Such procedures included examining, on a test basis, evidence regarding the amounts and disclosures in the financial statements. Our procedures included confirmation of securities owned as of October 31, 2024, by correspondence with the custodian and brokers. Our audits also included evaluating the accounting principles used and significant estimates made by management, as well as evaluating the overall presentation of the financial statements. We believe that our audits provide a reasonable basis for our opinion.
We have served as the auditor of one or more investment companies advised by TrueMark Investments, LLC since 2019.

COHEN & COMPANY, LTD.
Greenwood Village, Colorado
December 23, 2024
Must be accompanied or preceded by a prospectus.
Paralel Distributors LLC is the Distributor for the TrueShares Quarterly Bear Hedge ETF and TrueShares Quarterly
Bull Hedge ETF.
| Item 8. | Changes in and Disagreements with Accountants for Open-End Management Investment Companies. |
There were no changes in or disagreements with accountants on accounting and financial disclosure during the period covered by this report.
| Item 9. | Proxy Disclosures for Open-End Management Investment Companies. |
There were no matters submitted to a vote of shareholders during the period covered by this report.
| Item 10. | Remuneration Paid to Directors, Officers, and Others of Open-End Management Investment Companies. |
The aggregate remuneration paid by the Registrant is included in the financial statements as part of the report to shareholders filed under Item 7 of this Form.
| Item 11. | Statement Regarding Basis for Approval of Investment Advisory Contract. |
TrueShares Quarterly Bull Hedge ETF and TrueShares Quarterly Bear Hedge ETF Investment Advisory Approval
At a meeting held on June 6, 2024 (the “Meeting”), the Board of Trustees (the “Board”) of Elevation Series Trust (the “Trust”) considered the approval of an Advisory Agreement (the “Advisory Agreement”) between the Trust and TrueMark Investments, LLC (“TMI”) on behalf of TrueShares Quarterly Bull Hedge ETF (“QBUL”) and TrueShares Quarterly Bear Hedge ETF (“QBER”) (together the “Funds”).
The Board was assisted by independent legal counsel throughout the Advisory Agreement review process. The Board relied upon the advice of independent legal counsel and its own business judgment in determining the material factors to be considered in evaluating the Advisory Agreement and the weight to be given to each factor considered. The Board’s conclusions were based on a comprehensive evaluation of all the information provided and were not the result of any one factor. Moreover, each Trustee might have afforded different weights to the various factors in reaching his or her conclusions with respect to the approval of the Advisory Agreement.
Nature, Extent, and Quality of Services Provided. The Trustees considered the scope of services to be provided under the Advisory Agreement, noting that TMI would provide a full range of services to QBUL and QBER including, but not limited to, portfolio management, management of vendor relationships, interactions with the Trust, as well as portfolio compliance and trading. The Board noted the depth of TMI’s management of other registered funds, including a suite of 18 ETFs listed on the NYSE, Cboe and NASDAQ exchanges. The Board reviewed TMI’s best execution practices and its process for evaluating broker-dealers to ensure best execution. In examining the nature, extent and quality of the investment advisory services to be provided by TMI, the Trustees considered the qualifications, experience and capabilities of TMI’s management team and other personnel. The Board acknowledged the proposed investment team’s experience and knowledge in investment operations similar to that of the New Funds. The Board considered the firm’s detailed strategies proposed for QBUL and QBER, noting that TMI would identify and mitigate risks by confirming that the necessary policies and procedures to address inherent risks including portfolio risks, conflicts of interest, investment limitations etc., are included in TMI’s compliance manual.
The Board noted that it had received a copy of TMI’s Form ADV, as well as the response of TMI to a detailed series of questions which included, among other things, information about the background and experience of the firm’s key personnel, the firm’s compliance program, and the services proposed to be provided by TMI. The Board considered the growth of TMI over recent periods and the strong support available to the firm. In conclusion, the Board agreed that TMI can be expected to provide satisfactory service to QBUL and QBER and its future shareholders.
Performance. The Board considered the research cited by TMI underlying each Fund’s strategy and observed that the proposed strategies for QBUL and QBER appear to be well-aligned with the cited research. In conclusion, the Trustees agreed that TMI’s proposed investment strategies for QBUL and QBER appeared to be reasonably designed to achieve satisfactory performance for the Funds’ future shareholders.
Cost of Services Provided. The Board reviewed the proposed advisory fees for QBUL and QBER, which were each proposed as a “unitary fee” under which TMI would pay all expenses of the respective funds except for the management fee and certain other costs such as interest, brokerage, acquired fund fees and expenses, and extraordinary expenses. Accordingly, the Board agreed that a comparison of each New Fund’s unitary management fee to the respective peer funds’ total expense ratio in the report provided by FUSE, an independent third-party data provider, was appropriate. The Board also stated that as all fees were paid from this unitary fee, the proposed unitary management fee reflected a not-unreasonable allocation of the advisory fees paid to the firm given the work performed by it.
The Board considered that it was provided a comparison of each Fund’s fees to a group of actively managed ETFs that used an option-based approach to seek downside mitigation while preserving capital and/or capturing market upside selected by FUSE (“FUSE Peer Group”). The Board noted that, when compared to the FUSE Options Trading Peer Group, each Fund’s proposed unitary management fee was slightly higher than the median fund in the FUSE Peer Group but within the range of the FUSE Peer Group funds. With the context of each of the above items, the Board concluded that the proposed unitary management fees for QBUL and QBER were not unreasonable.
Economies of Scale and Profitability. The Board evaluated the compensation and benefits to be received by TMI from its relationship with QBUL and QBER and reviewed an analysis of TMI’s expected profitability with respect to the work to be completed for each Fund, noting it was anticipating a modest but not-unreasonable profit across the initial two-year term of the Advisory Agreements. The Board also noted that economies of scale had not yet been reached by TMI, as QBUL and QBER had not yet launched. The Trustees agreed that, should assets of QBUL and QBER grow and create opportunities for breakpoints in the future, it would revisit this issue at that time.
Conclusion. Having requested and received information from TMI as it believed to be reasonably necessary to evaluate the terms of the Advisory Agreement, and as assisted by the advice and guidance of legal counsel, the Board concluded that approval of the Advisory Agreement was in the best interests of QBUL and QBER and its future shareholders.
SRH U.S. Quality ETF Investment Advisory Approvals
At a meeting held on September 18, 2024 (the “Meeting”), the Board of Trustees (the “Board”) of Elevation Series Trust (the “Trust”) considered the renewal of an Advisory Agreement (the “SRHQ Advisory Agreement”) between the Trust and Paralel Advisors LLC (“PAL”) on behalf of SRH U.S. Quality ETF (“SRHQ or the “Fund”) and the investment sub-advisory agreement between PAL and Vident Advisory, LLC (“VA”) (the “Sub-Advisory Agreement” and together with SRHQ Advisory Agreement, the “SRHQ Agreements”).
The Board was assisted by independent legal counsel throughout the SRHQ Agreement review process. The Board relied upon the advice of independent legal counsel and its own business judgment in determining the material factors to be considered in evaluating the SRHQ Agreements and the weight to be given to each factor considered. The Board’s conclusions were based on a comprehensive evaluation of all the information provided and were not the result of any one factor. Moreover, each Trustee might have afforded different weights to the various factors in reaching his or her conclusions with respect to the approval of the SRHQ Agreements.
SRHQ Advisory Agreement
Nature, Extent, and Quality of Services Provided. The Trustees considered the scope of services provided under SRHQ Advisory Agreement, noting that PAL provides general investment management services to SRHQ. In examining the nature, extent and quality of the investment advisory services provided by PAL, the Trustees considered the qualifications, experience and capabilities of PAL’s management team and other personnel. The Trustees also evaluated PAL’s and its parent company, PTL’s, history, growth and financial position. Furthermore, the Trustees considered the qualifications and experience of PAL’s senior personnel, including its Chief Executive Officer and founder of PAL and the Paralel entities, and the experience of several members of PAL’s senior management team.
The Board noted that it had received a copy of PAL’s Form ADV, as well as the response of PAL to a detailed series of questions which included, among other things, information about the background and experience of the firm’s key personnel, the firm’s compliance program, and the services provided by PAL. The Board considered that Rocky Mountain Advisers, LLC, (“RMA”) an investor in PTL, the parent company of PAL, was the index provider to SRHQ. The Board also reviewed other services provided by PAL to SRHQ, such as monitoring adherence to the Fund’s investment restrictions, oversight of VA, the Fund’s sub-adviser, monitoring compliance with various policies and procedures and with applicable securities regulations, and monitoring the extent to which the Fund achieved its investment objective as a passively-managed fund. The Board noted that PAL had reported no regulatory compliance or litigation issues since the prior approval of the firm by the Board. In conclusion, the Board concluded that it was satisfied with the service provided by PAL to the Fund and its shareholders.
Performance. The Board noted that it had received information on SRHQ’s performance relative to certain peer funds selected by FUSE in the FUSE Report (“FUSE Peer Group”). The Board noted SRHQ had performed well since inception, falling in the top performance quartile since its inception among the FUSE Peer Group funds. Following review, the Board agreed that the Fund’s strategy appeared to operating as intended.
Cost of Services Provided. The Board reviewed the advisory fee for SRHQ, noting that it was a “unitary fee” under which PAL paid all expenses of the Fund except for the advisory fee and certain other costs such as interest, brokerage, acquired fund fees and expenses, and extraordinary expenses, among others. Accordingly, the Board agreed that a comparison of the Fund’s expense ratio to the funds in the FUSE Peer Group was appropriate. The Board noted that the expense ratio for SRHQ was below the FUSE Peer Group median fee. The Board further acknowledged that while PAL did not manage any other funds or accounts that utilized a directly similar strategy to that of which the Fund employs, it did provide advisory services to a registered closed-end fund and other ETF in the Trust, each of which had a higher advisory fee than the Fund. In consideration of these factors, the Board agreed that fee paid under the SRHQ Advisory Agreement was not unreasonable.
Economies of Scale and Profitability. The Board noted that PAL was responsible for compensating the Fund’s other service providers and paying the Fund’s other expenses out of its own fee and resources. The Trustees reviewed an analysis of PAL’s profitability with respect to the Fund, noting it had not earned a profit across the prior year from its work with the Fund pursuant to the SRHQ Advisory Agreement. The Board also evaluated other compensation and benefits received by PAL from its relationship with SRHQ, noting PTL was the Fund’s administrator and PDL was the Fund’s distributor. Further, it was noted that an affiliate of the Fund’s index provider, RMA, held an indirect non-controlling investment in PTL, PAL’s parent company. The Board agreed that economies of scale had not yet been achieved with the Fund, and, in the event there were to be significant asset growth in the Fund, at such time the Board would reassess whether the fee appropriately took into account any economies of scale realized as a result of that growth.
Conclusion. Based on consideration of all the factors in their totality, the Board, including a majority of the Independent Trustees, determined that SRHQ Advisory Agreement, including the compensation payable under the agreement, was fair and reasonable to the Fund. The Board, including a majority of the Independent Trustees, therefore determined that the renewal of the SRHQ Advisory Agreement was in the best interests of SRHQ and its shareholders.
SRHQ Sub-Advisory Agreement
Nature, Extent, and Quality of Services Provided. The Trustees considered the scope of services provided under the Sub-Advisory Agreement, noting that VA provides portfolio management services to SRHQ. The Board considered the quality of VA’s compliance program, as well as the experience of VA in providing similar services to other ETFs. The Board noted that it had received a copy of VA’s Form ADV, financial statements, as well as VA’s response to a detailed series of questions that included, among other things, information about VA’s decision-making process, the background and experience of the firm’s key personnel, and the firm’s compliance policies, brokerage information and other practices.
The Board considered the fact that VA held responsibility for the general management of the day-to-day investment and reinvestment of the assets of the Fund; determining the daily baskets of deposit securities and cash components; executing portfolio security trades for purchases and redemptions of the Fund’s shares conducted on a cash-in-lieu basis, among others. The Board also considered VA’s recognized status in the industry with respect to portfolio management services given the number of ETFs for which it provides similar sub advisory services. Further, the Trustees acknowledged PAL’s satisfaction with the services provided by VA.
Performance. The Board agreed that, because VA’s role was primarily to track an index, overall performance considerations were more appropriately considered as part of the consideration of SRHQ Advisory Agreement at the adviser level. The Trustees also considered PAL’s representation that it was satisfied with VA’s performance ensuring that SRHQ had successfully tracked the underlying index.
Cost of Services Provided. The Board reviewed the sub-advisory fees paid by PAL to VA for its services to SRHQ. The Board considered that the fees paid to VA were paid by PAL, not the Fund, as part of its unitary fee arrangement and agreed that fund-to-fund comparisons were most appropriate at the advisory level. The Board agreed that the VA fees reflected a not-unreasonable allocation of the advisory fees paid to each firm given the work performed by each firm and noted that the fees were in line with those charged by VA for managing other funds.
Economies of Scale and Profitability. The Board evaluated the compensation and benefits received by VA from its relationship with SRHQ and reviewed an analysis of VA’s profitability with respect to the work completed for SRHQ, noting that it earned a modest and not-unreasonable profit from its work with the Fund. The Board noted that economies of scale were more appropriately considered at the adviser-level due to the unitary fee structure of SRHQ and should be considered with respect to the overall SRHQ Advisory Agreement taking into consideration the impact of the sub-advisory expense.
Conclusion. Based on a consideration of all the factors in their totality, the Board, including a majority of the Independent Trustees, determined that the Sub-Advisory Agreement, including the compensation payable under the agreement, was fair and reasonable to the Fund. The Board, including a majority of the Independent Trustees, therefore determined that the renewal of the SRHQ Sub-Advisory Agreement was in the best interests of SRHQ and its shareholders.
| Item 12. | Disclosure of Proxy Voting Policies and Procedures for Closed-End Management Investment Companies. |
Not applicable to open-end investment companies.
| Item 13. | Portfolio Managers of Closed-End Management Investment Companies. |
Not applicable to open-end investment companies.
| Item 14. | Purchases of Equity Securities by Closed-End Management Investment Company and Affiliated Purchasers. |
Not applicable to open-end investment companies.
| Item 15. | Submission of Matters to a Vote of Security Holders. |
No material changes to the procedures by which shareholders may recommend nominees to the Registrant’s Board of Trustees have been implemented after the Registrant last provided disclosure in response to the requirements of Item 407(c)(2)(iv) of Regulation S-K (17 CFR 229.407) (as required by Item 22(b)(15) of Schedule 14A (17 CFR 240.14a-101)), or this Item.
| Item 16. | Controls and Procedures. |
(a) The Registrant’s principal executive and principal financial officers, or persons performing similar functions, have concluded that the Registrant’s disclosure controls and procedures (as defined in Rule 30a-3(c) under the Investment Company Act of 1940, as amended (the “1940 Act”) (17 CFR 270.30a-3(c))) are effective, as of a date within 90 days of the filing date of the report that includes the disclosure required by this paragraph, based on their evaluation of these controls and procedures required by Rule 30a-3(b) under the 1940 Act (17 CFR 270.30a-3(b)) and Rules 13a-15(b) or 15d-15(b) under the Securities Exchange Act of 1934, as amended (17 CFR 240.13a-15(b) or 240.15d-15(b)).
(b) There were no changes in the Registrant’s internal control over financial reporting (as defined in Rule 30a-3(d) under the 1940 Act (17 CFR 270.30a-3(d)) that occurred during the period covered by this report that has materially affected, or is reasonably likely to materially affect, the Registrant’s internal control over financial reporting.
| Item 17. | Disclosure of Securities Lending Activities for Closed-End Management Investment Companies. |
Not applicable to open-end investment companies.
| Item 18. | Recovery of Erroneously Awarded Compensation. |
| (a)(5) | There was no change in the Registrant’s independent public accountant during the period covered by the report. |
SIGNATURES
Pursuant to the requirements of the Securities Exchange Act of 1934, as amended, and the Investment Company Act of 1940, as amended, the Registrant has duly caused this report to be signed on its behalf by the undersigned, thereunto duly authorized.
| (Registrant) | ELEVATION SERIES TRUST | |
| By (Signature and Title) | /s/ Bradley Swenson | |
| | Bradley Swenson, President
(Principal Executive Officer) |
Pursuant to the requirements of the Securities Exchange Act of 1934, as amended, and the Investment Company Act of 1940, as amended, this report has been signed below by the following persons on behalf of the Registrant and in the capacities and on the date indicated.
| By (Signature and Title) | /s/ Bradley Swenson | |
| | Bradley Swenson, President
(Principal Executive Officer) |
| By (Signature and Title) | /s/ Nicholas Austin | |
| | Nicholas Austin, Treasurer
(Principal Financial Officer) | |