Exhibit 99.1

PRESS RELEASE FINANCIAL SUPPLEMENT
FIRST QUARTER 2003
TABLE OF CONTENTS
| | | |
J.P. MORGAN CHASE & CO.
TABLE OF CONTENTS | |  |
| | | | | |
| | | Page |
JPMorgan Chase Consolidated | | | | |
| Statement of Income — Reported Basis | | | 3 | |
| Lines of Business Financial Highlights Summary | | | 4 | |
| Statement of Income — Operating Basis | | | 5 | |
| Reconciliation from Reported to Operating Basis | | | 6 | |
| |
Segment Detail | | | | |
Investment Bank | | | 7 | |
| Business-Related Metrics | | | 8 | |
| |
Treasury & Securities Services | | | 9 | |
| |
Investment Management & Private Banking | | | 10 | |
| |
JPMorgan Partners | | | 11 | |
| Investment Portfolio — Private and Public Securities | | | 12 | |
| |
Chase Financial Services | | | 13 | |
| Business-Related Metrics | | | 14 | |
| |
Supplemental Detail | | | | |
| Noninterest Revenue and Noninterest Expense Detail | | | 15 | |
| Consolidated Balance Sheet | | | 16 | |
| Condensed Average Balance Sheet and Annualized Yields | | | 17 | |
| Credit-Related Information | | | 18-23 | |
| Capital | | | 24 | |
| |
Glossary of Terms | | | 25 | |
Note: Prior periods have been adjusted to conform with current methodologies.
Page 2
| | | |
J.P. MORGAN CHASE & CO.
STATEMENT OF INCOME — REPORTED BASIS
(in millions, except per share, ratio and employee data) | | |
| | | | | | | | | | | | | | | | | | | | | | | | | | | | | | | |
| | | | | | | | | | | | | | | | | | | | | | | | | 1QTR 2003 |
| | | | | | | | | | | | | | | | | | | | | | | | | Over (Under) |
| | | | | 1QTR | | 4QTR | | 3QTR | | 2QTR | | 1QTR | |
|
| | | | | 2003 | | 2002 | | 2002 | | 2002 | | 2002 | | 4Q 2002 | | 1Q 2002 |
| | | | |
| |
| |
| |
| |
| |
| |
|
REVENUE | | | | | | | | | | | | | | | | | | | | | | | | | | | | |
| Investment Banking Fees | | $ | 616 | | | $ | 678 | | | $ | 545 | | | $ | 785 | | | $ | 755 | | | | (9 | )% | | | (18 | )% |
| Trading Revenue | | | 1,232 | | | | 585 | | | | (21 | ) | | | 731 | | | | 1,299 | | | | 111 | | | | (5 | ) |
| Fees and Commissions | | | 2,598 | | | | 2,282 | | | | 3,005 | | | | 2,885 | | | | 2,584 | | | | 14 | | | | 1 | |
| Private Equity — Realized Gains (Losses) | | | (4 | ) | | | (45 | ) | | | (40 | ) | | | (10 | ) | | | (10 | ) | | | 91 | | | | 60 | |
| Private Equity — Unrealized Gains (Losses) | | | (217 | ) | | | (23 | ) | | | (275 | ) | | | (115 | ) | | | (228 | ) | | NM | | | 5 | |
| Securities Gains | | | 485 | | | | 747 | | | | 578 | | | | 124 | | | | 114 | | | | (35 | ) | | | 325 | |
| Other Revenue | | | 481 | | | | 290 | | | | 419 | | | | 292 | | | | 157 | | | | 66 | | | | 206 | |
| | | |
| | | |
| | | |
| | | |
| | | |
| | | | | | | | | |
Total Noninterest Revenue | | | 5,191 | | | | 4,514 | | | | 4,211 | | | | 4,692 | | | | 4,671 | | | | 15 | | | | 11 | |
| Interest Income | | | 6,263 | | | | 6,184 | | | | 6,316 | | | | 6,498 | | | | 6,286 | | | | 1 | | | | — | |
| Interest Expense | | | 3,048 | | | | 3,203 | | | | 3,580 | | | | 3,616 | | | | 3,359 | | | | (5 | ) | | | (9 | ) |
| | | |
| | | |
| | | |
| | | |
| | | |
| | | | | | | | | |
Net Interest Income | | | 3,215 | | | | 2,981 | | | | 2,736 | | | | 2,882 | | | | 2,927 | | | | 8 | | | | 10 | |
| | | |
| | | |
| | | |
| | | |
| | | |
| | | | | | | | | |
| Revenue before Provision for Credit Losses | | | 8,406 | | | | 7,495 | | | | 6,947 | | | | 7,574 | | | | 7,598 | | | | 12 | | | | 11 | |
| Provision for Credit Losses | | | 743 | | | | 921 | | | | 1,836 | | | | 821 | | | | 753 | | | | (19 | ) | | | (1 | ) |
| | | |
| | | |
| | | |
| | | |
| | | |
| | | | | | | | | |
| | TOTAL NET REVENUE | | | 7,663 | | | | 6,574 | | | | 5,111 | | | | 6,753 | | | | 6,845 | | | | 17 | | | | 12 | |
| | | |
| | | |
| | | |
| | | |
| | | |
| | | | | | | | | |
EXPENSE | | | | | | | | | | | | | | | | | | | | | | | | | | | | |
| Compensation Expense | | | 3,174 | | | | 3,032 | | | | 2,367 | | | | 2,761 | | | | 2,823 | | | | 5 | | | | 12 | |
| Occupancy Expense (a) | | | 496 | | | | 425 | | | | 478 | | | | 365 | | | | 338 | | | | 17 | | | | 47 | |
| Technology and Communications Expense | | | 637 | | | | 635 | | | | 625 | | | | 629 | | | | 665 | | | | — | | | | (4 | ) |
| Amortization of Intangibles | | | 74 | | | | 82 | | | | 80 | | | | 92 | | | | 69 | | | | (10 | ) | | | 7 | |
| Other Expense | | | 1,160 | | | | 1,294 | | | | 1,168 | | | | 1,118 | | | | 1,208 | | | | (10 | ) | | | (4 | ) |
| Surety Settlement and Litigation Reserve (a) | | | — | | | | 1,300 | | | | — | | | | — | | | | — | | | NM | | NM |
| Merger and Restructuring Costs | | | — | | | | 393 | | | | 333 | | | | 229 | | | | 255 | | | NM | | NM |
| | | |
| | | |
| | | |
| | | |
| | | |
| | | | | | | | | |
| | | TOTAL NONINTEREST EXPENSE | | | 5,541 | | | | 7,161 | | | | 5,051 | | | | 5,194 | | | | 5,358 | | | | (23 | ) | | | 3 | |
| | | |
| | | |
| | | |
| | | |
| | | |
| | | | | | | | | |
| Income (Loss) before Income Tax Expense | | | 2,122 | | | | (587 | ) | | | 60 | | | | 1,559 | | | | 1,487 | | | NM | | | 43 | |
| Income Tax Expense (Benefit) | | | 722 | | | | (200 | ) | | | 20 | | | | 531 | | | | 505 | | | NM | | | 43 | |
| | | |
| | | |
| | | |
| | | |
| | | |
| | | | | | | | | |
NET INCOME (LOSS) | | $ | 1,400 | | | $ | (387 | ) | | $ | 40 | | | $ | 1,028 | | | $ | 982 | | | NM | | | 43 | |
| | | |
| | | |
| | | |
| | | |
| | | |
| | | | | | | | | |
NET INCOME APPLICABLE TO COMMON STOCK | | $ | 1,387 | | | $ | (399 | ) | | $ | 27 | | | $ | 1,015 | | | $ | 969 | | | NM | | | 43 | |
| | | |
| | | |
| | | |
| | | |
| | | |
| | | | | | | | | |
| |
NET INCOME (LOSS) PER COMMON SHARE | | | | | | | | | | | | | | | | | | | | | | | | | | | | |
| Basic | | $ | 0.69 | | | $ | (0.20 | ) | | $ | 0.01 | | | $ | 0.51 | | | $ | 0.49 | | | NM | | | 41 | |
| Diluted | | | 0.69 | | | | (0.20 | ) | | | 0.01 | | | | 0.50 | | | | 0.48 | | | NM | | | 44 | |
| |
PERFORMANCE RATIOS (b) | | | | | | | | | | | | | | | | | | | | | | | | | | | | |
| Return on Average Assets | | | 0.73 | % | | NM | | | 0.02 | % | | | 0.56 | % | | | 0.55 | % | | NM | | 18 bp |
| Return on Average Common Equity | | | 13.4 | | | NM | | | 0.3 | | | | 10.0 | | | | 9.7 | | | NM | | | 370 | |
| |
FULL-TIME EQUIVALENT EMPLOYEES | | | 93,878 | | | | 94,335 | | | | 95,637 | | | | 95,878 | | | | 96,938 | | | | — | % | | | (3 | )% |
| (a) | | In the fourth quarter of 2002, a $1,300 million (pre-tax) charge was recorded related to the settlement of the Enron surety litigation and the establishment of a reserve for certain material litigation, proceedings and investigations. In the third quarter of 2002, $98 million (pre-tax) in real estate charges were recorded in “Occupancy Expense” on a reported basis. |
| |
| (b) | | Quarterly ratios are based on annualized amounts. |
Page 3
| | | |
J.P. MORGAN CHASE & CO.
LINES OF BUSINESS FINANCIAL HIGHLIGHTS SUMMARY
(in millions, except per share and ratio data) | | |
| | | | | | | | | | | | | | | | | | | | | | | | | | | | | | | | |
| | | | | | | | | | | | | | | | | | | | | | | | | | 1QTR 2003 |
| | | | | | | | | | | | | | | | | | | | | | | | | | Over (Under) |
| | | | | | 1QTR | | 4QTR | | 3QTR | | 2QTR | | 1QTR | |
|
| | | | | | 2003 | | 2002 | | 2002 | | 2002 | | 2002 | | 4Q 2002 | | 1Q 2002 |
| | | | | |
| |
| |
| |
| |
| |
| |
|
OPERATING REVENUE | | | | | | | | | | | | | | | | | | | | | | | | | | | | |
| Investment Bank | | $ | 4,012 | | | $ | 3,311 | | | $ | 2,427 | | | $ | 3,109 | | | $ | 3,607 | | | | 21 | % | | | 11 | % |
| Treasury & Securities Services | | | 966 | | | | 962 | | | | 1,057 | | | | 1,019 | | | | 968 | | | | — | | | | — | |
| Investment Management & Private Banking | | | 652 | | | | 663 | | | | 702 | | | | 738 | | | | 773 | | | | (2 | ) | | | (16 | ) |
| Chase Financial Services | | | 3,737 | | | | 3,378 | | | | 3,710 | | | | 3,441 | | | | 3,091 | | | | 11 | | | | 21 | |
| JPMorgan Partners | | | (290 | ) | | | (95 | ) | | | (371 | ) | | | (205 | ) | | | (321 | ) | | NM | | | 10 | |
| Support Units and Corporate | | | (214 | ) | | | (294 | ) | | | (224 | ) | | | (194 | ) | | | (199 | ) | | | 27 | | | | (8 | ) |
| | | |
| | | |
| | | |
| | | |
| | | |
| | | | | | | | | |
| | | OPERATING REVENUE (a) | | $ | 8,863 | | | $ | 7,925 | | | $ | 7,301 | | | $ | 7,908 | | | $ | 7,919 | | | | 12 | | | | 12 | |
| | | |
| | | |
| | | |
| | | |
| | | |
| | | | | | | | | |
| |
EARNINGS | | | | | | | | | | | | | | | | | | | | | | | | | | | | |
| Investment Bank | | $ | 932 | | | $ | 361 | | | $ | (249 | ) | | $ | 502 | | | $ | 764 | | | | 158 | | | | 22 | |
| Treasury & Securities Services | | | 147 | | | | 136 | | | | 211 | | | | 176 | | | | 143 | | | | 8 | | | | 3 | |
| Investment Management & Private Banking | | | 64 | | | | 43 | | | | 99 | | | | 111 | | | | 129 | | | | 49 | | | | (50 | ) |
| Chase Financial Services | | | 704 | | | | 496 | | | | 791 | | | | 674 | | | | 508 | | | | 42 | | | | 39 | |
| JPMorgan Partners | | | (224 | ) | | | (101 | ) | | | (284 | ) | | | (175 | ) | | | (252 | ) | | NM | | | 11 | |
| Support Units and Corporate | | | (223 | ) | | | (205 | ) | | | (243 | ) | | | (109 | ) | | | (142 | ) | | | (9 | ) | | | (57 | ) |
| | | |
| | | |
| | | |
| | | |
| | | |
| | | | | | | | | |
| | | OPERATING EARNINGS (a) | | | 1,400 | | | | 730 | | | | 325 | | | | 1,179 | | | | 1,150 | | | | 92 | | | | 22 | |
| Special Items (Net of Taxes): | | | | | | | | | | | | | | | | | | | | | | | | | | | | |
| | Real Estate Charge | | | — | | | | — | | | | (65 | ) | | | — | | | | — | | | NM | | NM |
| | Surety Settlement and Litigation Reserve | | | — | | | | (858 | ) | | | — | | | | — | | | | — | | | NM | | NM |
| | Merger and Restructuring Costs | | | — | | | | (259 | ) | | | (220 | ) | | | (151 | ) | | | (168 | ) | | NM | | NM |
| | | |
| | | |
| | | |
| | | |
| | | |
| | | | | | | | | |
| | | NET INCOME (LOSS) (a) | | $ | 1,400 | | | $ | (387 | ) | | $ | 40 | | | $ | 1,028 | | | $ | 982 | | | NM | | | 43 | |
| | | |
| | | |
| | | |
| | | |
| | | |
| | | | | | | | | |
| |
EARNINGS PER SHARE — DILUTED | | | | | | | | | | | | | | | | | | | | | | | | | | | | |
OPERATING EARNINGS (a) | | $ | 0.69 | | | $ | 0.36 | | | $ | 0.16 | | | $ | 0.58 | | | $ | 0.57 | | | | 92 | | | | 21 | |
| Special Items (Net of Taxes): | | | | | | | | | | | | | | | | | | | | | | | | | | | | |
| | Real Estate Charge | | | — | | | | — | | | | (0.03 | ) | | | — | | | | — | | | NM | | NM |
| | Surety Settlement and Litigation Reserve | | | — | | | | (0.43 | ) | | | — | | | | — | | | | — | | | NM | | NM |
| | Merger and Restructuring Costs | | | — | | | | (0.13 | ) | | | (0.12 | ) | | | (0.08 | ) | | | (0.09 | ) | | NM | | NM |
| | | |
| | | |
| | | |
| | | |
| | | |
| | | | | | | | | |
NET INCOME (LOSS) (a) | | $ | 0.69 | | | $ | (0.20 | ) | | $ | 0.01 | | | $ | 0.50 | | | $ | 0.48 | | | NM | | | 44 | |
| | | |
| | | |
| | | |
| | | |
| | | |
| | | | | | | | | |
| |
OPERATING RETURN ON COMMON EQUITY | | | | | | | | | | | | | | | | | | | | | | | | | | | | |
| Investment Bank | | | 19.7 | % | | | 7.6 | % | | NM | | | 10.8 | % | | | 16.3 | % | | 1,210 bp | | 340 bp |
| Treasury & Securities Services | | | 19.5 | | | | 18.4 | | | | 28.2 | % | | | 23.2 | | | | 19.6 | | | | 110 | | | | (10 | ) |
| Investment Management & Private Banking | | | 4.2 | | | | 2.7 | | | | 6.4 | | | | 7.1 | | | | 8.5 | | | | 150 | | | | (430 | ) |
| Chase Financial Services | | | 27.5 | | | | 18.9 | | | | 29.8 | | | | 25.8 | | | | 20.2 | | | | 860 | | | | 730 | |
OPERATING RETURN ON COMMON EQUITY (a) | | | 13.4 | | | | 6.8 | | | | 2.9 | | | | 11.4 | | | | 11.4 | | | | 660 | | | | 200 | |
| (a) | | Represents consolidated JPMorgan Chase. |
Page 4
| | | |
J.P. MORGAN CHASE & CO.
STATEMENT OF INCOME — OPERATING BASIS
(in millions, except per share and ratio data) | | |
| | | | | | | | | | | | | | | | | | | | | | | | | | | | | | | | |
| | | | | | | | | | | | | | | | | | | | | | | | | | 1QTR 2003 |
| | | | | | | | | | | | | | | | | | | | | | | | | | Over (Under) |
| | | | | | 1QTR | | 4QTR | | 3QTR | | 2QTR | | 1QTR | |
|
| | | | | | 2003 | | 2002 | | 2002 | | 2002 | | 2002 | | 4Q 2002 | | 1Q 2002 |
| | | | | |
| |
| |
| |
| |
| |
| |
|
OPERATING REVENUE | | | | | | | | | | | | | | | | | | | | | | | | | | | | |
| Investment Banking Fees | | $ | 616 | | | $ | 678 | | | $ | 545 | | | $ | 785 | | | $ | 755 | | | | (9 | )% | | | (18 | )% |
| Trading-Related Revenue (Includes Trading NII) | | | 1,915 | | | | 1,253 | | | | 365 | | | | 1,136 | | | | 1,720 | | | | 53 | | | | 11 | |
| Fees and Commissions | | | 2,429 | | | | 2,052 | | | | 2,768 | | | | 2,745 | | | | 2,493 | | | | 18 | | | | (3 | ) |
| Private Equity — Realized Gains (Losses) | | | (4 | ) | | | (45 | ) | | | (40 | ) | | | (10 | ) | | | (10 | ) | | | 91 | | | | 60 | |
| Private Equity — Unrealized Gains (Losses) | | | (217 | ) | | | (23 | ) | | | (275 | ) | | | (115 | ) | | | (228 | ) | | NM | | | 5 | |
| Securities Gains | | | 485 | | | | 747 | | | | 578 | | | | 124 | | | | 114 | | | | (35 | ) | | | 325 | |
| Other Revenue | | | 477 | | | | 303 | | | | 409 | | | | 273 | | | | 137 | | | | 57 | | | | 248 | |
| Net Interest Income (Excludes Trading NII) | | | 3,162 | | | | 2,960 | | | | 2,951 | | | | 2,970 | | | | 2,938 | | | | 7 | | | | 8 | |
| | | |
| | | |
| | | |
| | | |
| | | |
| | | | | | | | | |
| | | TOTAL OPERATING REVENUE | | | 8,863 | | | | 7,925 | | | | 7,301 | | | | 7,908 | | | | 7,919 | | | | 12 | | | | 12 | |
| | | |
| | | |
| | | |
| | | |
| | | |
| | | | | | | | | |
OPERATING EXPENSE | | | | | | | | | | | | | | | | | | | | | | | | | | | | |
| Compensation Expense (a) | | | 3,174 | | | | 3,032 | | | | 2,367 | | | | 2,761 | | | | 2,823 | | | | 5 | | | | 12 | |
| Noncompensation Expense (a) (b) | | | 2,367 | | | | 2,436 | | | | 2,253 | | | | 2,204 | | | | 2,280 | | | | (3 | ) | | | 4 | |
| | | |
| | | |
| | | |
| | | |
| | | |
| | | | | | | | | |
| | | TOTAL OPERATING EXPENSE | | | 5,541 | | | | 5,468 | | | | 4,620 | | | | 4,965 | | | | 5,103 | | | | 1 | | | | 9 | |
| Credit Costs | | | 1,200 | | | | 1,351 | | | | 2,190 | | | | 1,155 | | | | 1,074 | | | | (11 | ) | | | 12 | |
| | | |
| | | |
| | | |
| | | |
| | | |
| | | | | | | | | |
| Operating Income before Income Tax Expense | | | 2,122 | | | | 1,106 | | | | 491 | | | | 1,788 | | | | 1,742 | | | | 92 | | | | 22 | |
| Income Tax Expense | | | 722 | | | | 376 | | | | 166 | | | | 609 | | | | 592 | | | | 92 | | | | 22 | |
| | | |
| | | |
| | | |
| | | |
| | | |
| | | | | | | | | |
OPERATING EARNINGS | | $ | 1,400 | | | $ | 730 | | | $ | 325 | | | $ | 1,179 | | | $ | 1,150 | | | | 92 | | | | 22 | |
| | | |
| | | |
| | | |
| | | |
| | | |
| | | | | | | | | |
OPERATING BASIS | | | | | | | | | | | | | | | | | | | | | | | | | | | | |
| Diluted Earnings per Share | | $ | 0.69 | | | $ | 0.36 | | | $ | 0.16 | | | $ | 0.58 | | | $ | 0.57 | | | | 92 | | | | 21 | |
| Shareholder Value Added | | | 148 | | | | (551 | ) | | | (964 | ) | | | (57 | ) | | | (59 | ) | | NM | | NM |
| Return on Average Managed Assets (c) | | | 0.70 | % | | | 0.37 | % | | | 0.17 | % | | | 0.62 | % | | | 0.63 | % | | 33 bp | | 7 bp |
| Return on Common Equity (c) | | | 13.4 | | | | 6.8 | | | | 2.9 | | | | 11.4 | | | | 11.4 | | | | 660 | | | | 200 | |
| Common Dividend Payout Ratio | | | 50 | | | | 96 | | | | 222 | | | | 59 | | | | 60 | | | | (4,600 | ) | | | (1,000 | ) |
| Effective Income Tax Rate | | | 34 | | | | 34 | | | | 34 | | | | 34 | | | | 34 | | | | — | | | | — | |
| Compensation Expense as a % of Operating Revenue | | | 36 | | | | 38 | | | | 32 | | | | 35 | | | | 36 | | | | (200 | ) | | | — | |
| Noncompensation Expense as a % of Operating Revenue | | | 27 | | | | 31 | | | | 31 | | | | 28 | | | | 29 | | | | (400 | ) | | | (200 | ) |
| Overhead Ratio | | | 63 | | | | 69 | | | | 63 | | | | 63 | | | | 64 | | | | (600 | ) | | | (100 | ) |
| (a) | | Includes severance and other related costs associated with expense containment programs implemented in 2002. |
| |
| (b) | | Includes Occupancy Expense, Technology and Communications Expense, Amortization of Intangibles and Other Expense. |
| |
| (c) | | Quarterly ratios are based on annualized amounts. |
Page 5
| | | |
J.P. MORGAN CHASE & CO.
RECONCILIATION FROM REPORTED TO OPERATING BASIS
(in millions) | | |
| | | | | | | | | | | | | | | | | | | | | | | | | | | | | | | |
| | | | | | | | | | | | | | | | | | | | | | | | | 1QTR 2003 |
| | | | | | | | | | | | | | | | | | | | | | | | | Over (Under) |
| | | | | 1QTR | | 4QTR | | 3QTR | | 2QTR | | 1QTR | |
|
| | | | | 2003 | | 2002 | | 2002 | | 2002 | | 2002 | | 4Q 2002 | | 1Q 2002 |
| | | | |
| |
| |
| |
| |
| |
| |
|
REVENUE | | | | | | | | | | | | | | | | | | | | | | | | | | | | |
TRADING REVENUE | | | | | | | | | | | | | | | | | | | | | | | | | | | | |
| | | Reported | | $ | 1,232 | | | $ | 585 | | | $ | (21 | ) | | $ | 731 | | | $ | 1,299 | | | | 111 | % | | | (5 | )% |
| | | Trading-Related NII | | | 683 | | | | 668 | | | | 386 | | | | 405 | | | | 421 | | | | 2 | | | | 62 | |
| | | |
| | | |
| | | |
| | | |
| | | |
| | | | | | | | | |
| | | Operating | | $ | 1,915 | | | $ | 1,253 | | | $ | 365 | | | $ | 1,136 | | | $ | 1,720 | | | | 53 | | | | 11 | |
| | | |
| | | |
| | | |
| | | |
| | | |
| | | | | | | | | |
CREDIT CARD REVENUE (a) | | | | | | | | | | | | | | | | | | | | | | | | | | | | |
| | | Reported | | $ | 692 | | | $ | 807 | | | $ | 806 | | | $ | 669 | | | $ | 587 | | | | (14 | ) | | | 18 | |
| | | Credit Card Securitizations | | | (169 | ) | | | (230 | ) | | | (237 | ) | | | (140 | ) | | | (91 | ) | | | 27 | | | | (86 | ) |
| | | |
| | | |
| | | |
| | | |
| | | |
| | | | | | | | | |
| | | Operating | | $ | 523 | | | $ | 577 | | | $ | 569 | | | $ | 529 | | | $ | 496 | | | | (9 | ) | | | 5 | |
| | | |
| | | |
| | | |
| | | |
| | | |
| | | | | | | | | |
OTHER REVENUE | | | | | | | | | | | | | | | | | | | | | | | | | | | | |
| | | Reported | | $ | 481 | | | $ | 290 | | | $ | 419 | | | $ | 292 | | | $ | 157 | | | | 66 | | | | 206 | |
| | | Credit Card Securitizations | | | (4 | ) | | | 13 | | | | (10 | ) | | | (19 | ) | | | (20 | ) | | NM | | | 80 | |
| | | |
| | | |
| | | |
| | | |
| | | |
| | | | | | | | | |
| | | Operating | | $ | 477 | | | $ | 303 | | | $ | 409 | | | $ | 273 | | | $ | 137 | | | | 57 | | | | 248 | |
| | | |
| | | |
| | | |
| | | |
| | | |
| | | | | | | | | |
NET INTEREST INCOME | | | | | | | | | | | | | | | | | | | | | | | | | | | | |
| | | Reported | | $ | 3,215 | | | $ | 2,981 | | | $ | 2,736 | | | $ | 2,882 | | | $ | 2,927 | | | | 8 | | | | 10 | |
| | | Credit Card Securitizations | | | 630 | | | | 647 | | | | 601 | | | | 493 | | | | 432 | | | | (3 | ) | | | 46 | |
| | | Trading-Related NII | | | (683 | ) | | | (668 | ) | | | (386 | ) | | | (405 | ) | | | (421 | ) | | | 2 | | | | 62 | |
| | | |
| | | |
| | | |
| | | |
| | | |
| | | | | | | | | |
| | | Operating | | $ | 3,162 | | | $ | 2,960 | | | $ | 2,951 | | | $ | 2,970 | | | $ | 2,938 | | | | 7 | | | | 8 | |
| | | |
| | | |
| | | |
| | | |
| | | |
| | | | | | | | | |
TOTAL REVENUE | | | | | | | | | | | | | | | | | | | | | | | | | | | | |
| | | Reported | | $ | 8,406 | | | $ | 7,495 | | | $ | 6,947 | | | $ | 7,574 | | | $ | 7,598 | | | | 12 | | | | 11 | |
| | | Credit Card Securitizations | | | 457 | | | | 430 | | | | 354 | | | | 334 | | | | 321 | | | | 6 | | | | 42 | |
| | | |
| | | |
| | | |
| | | |
| | | |
| | | | | | | | | |
| | | Total Operating Revenue | | $ | 8,863 | | | $ | 7,925 | | | $ | 7,301 | | | $ | 7,908 | | | $ | 7,919 | | | | 12 | | | | 12 | |
| | | |
| | | |
| | | |
| | | |
| | | |
| | | | | | | | | |
NONINTEREST EXPENSE | | | | | | | | | | | | | | | | | | | | | | | | | | | | |
| | Reported | | $ | 5,541 | | | $ | 7,161 | | | $ | 5,051 | | | $ | 5,194 | | | $ | 5,358 | | | | (23 | ) | | | 3 | |
| | Real Estate Reserves | | | — | | | | — | | | | (98 | ) | | | — | | | | — | | | NM | | NM |
| | Surety Settlement and Litigation Reserve | | | — | | | | (1,300 | ) | | | — | | | | — | | | | — | | | NM | | NM |
| | Merger and Restructuring Costs | | | — | | | | (393 | ) | | | (333 | ) | | | (229 | ) | | | (255 | ) | | NM | | NM |
| | | |
| | | |
| | | |
| | | |
| | | |
| | | | | | | | | |
| | Total Operating Expense | | $ | 5,541 | | | $ | 5,468 | | | $ | 4,620 | | | $ | 4,965 | | | $ | 5,103 | | | | 1 | | | | 9 | |
| | | |
| | | |
| | | |
| | | |
| | | |
| | | | | | | | | |
CREDIT COSTS | | | | | | | | | | | | | | | | | | | | | | | | | | | | |
| | Provision for Credit Losses — Reported | | $ | 743 | | | $ | 921 | | | $ | 1,836 | | | $ | 821 | | | $ | 753 | | | | (19 | ) | | | (1 | ) |
| | Credit Card Securitizations | | | 457 | | | | 430 | | | | 354 | | | | 334 | | | | 321 | | | | 6 | | | | 42 | |
| | | |
| | | |
| | | |
| | | |
| | | |
| | | | | | | | | |
| | Credit Costs — Operating | | $ | 1,200 | | | $ | 1,351 | | | $ | 2,190 | | | $ | 1,155 | | | $ | 1,074 | | | | (11 | ) | | | 12 | |
| | | |
| | | |
| | | |
| | | |
| | | |
| | | | | | | | | |
| (a) | | Included in Fees and Commissions. |
Page 6
SEGMENT DETAIL
| | | |
J.P. MORGAN CHASE & CO.
INVESTMENT BANK
FINANCIAL HIGHLIGHTS
(in millions, except ratios and employees) | | |
| | | | | | | | | | | | | | | | | | | | | | | | | | | | | | | | |
| | | | | | | | | | | | | | | | | | | | | | | | | | | | 1QTR 2003 | | | | |
| | | | | | | | | | | | | | | | | | | | | | | | | | | | Over (Under) | | | | |
| | | | | | 1QTR | | 4QTR | | 3QTR | | 2QTR | | 1QTR | | | |
| | | | |
| | | | | | 2003 | | 2002 | | 2002 | | 2002 | | 2002 | | 4Q 2002 | | 1Q 2002 |
| | | | | |
| |
| |
| |
| |
| |
| |
|
OPERATING INCOME STATEMENT | | | | | | | | | | | | | | | | | | | | | | | | | | | | |
REVENUE: | | | | | | | | | | | | | | | | | | | | | | | | | | | | |
| | Trading Revenue (Includes Trading NII): | | | | | | | | | | | | | | | | | | | | | | | | | | | | |
| | | | Fixed Income and Other | | $ | 1,732 | | | $ | 1,300 | | | $ | 632 | | | $ | 1,035 | | | $ | 1,504 | | | | 33 | % | | | 15 | % |
| | | | Equities | | | 199 | | | | (32 | ) | | | (254 | ) | | | 95 | | | | 200 | | | NM | | | (1 | ) |
| | | |
| | | |
| | | |
| | | |
| | | |
| | | | | | | | | |
| | | | 1,931 | | | | 1,268 | | | | 378 | | | | 1,130 | | | | 1,704 | | | | 52 | | | | 13 | |
| | Investment Banking Fees | | | 621 | | | | 650 | | | | 529 | | | | 781 | | | | 736 | | | | (4 | ) | | | (16 | ) |
| | Net Interest Income | | | 684 | | | | 626 | | | | 630 | | | | 639 | | | | 712 | | | | 9 | | | | (4 | ) |
| | Fees and Commissions | | | 372 | | | | 357 | | | | 422 | | | | 420 | | | | 385 | | | | 4 | | | | (3 | ) |
| | Securities Gains | | | 383 | | | | 376 | | | | 465 | | | | 108 | | | | 127 | | | | 2 | | | | 202 | |
| | All Other Revenue | | | 21 | | | | 34 | | | | 3 | | | | 31 | | | | (57 | ) | | | (38 | ) | | NM |
| | | |
| | | |
| | | |
| | | |
| | | |
| | | | | | | | | |
| | | | TOTAL OPERATING REVENUE | | | 4,012 | | | | 3,311 | | | | 2,427 | | | | 3,109 | | | | 3,607 | | | | 21 | | | | 11 | |
| | | |
| | | |
| | | |
| | | |
| | | |
| | | | | | | | | |
EXPENSE: | | | | | | | | | | | | | | | | | | | | | | | | | | | | |
| | Compensation Expense | | | 1,329 | | | | 1,070 | | | | 728 | | | | 1,063 | | | | 1,137 | | | | 24 | | | | 17 | |
| | Noncompensation Expense | | | 823 | | | | 868 | | | | 816 | | | | 816 | | | | 899 | | | | (5 | ) | | | (8 | ) |
| | | |
| | | |
| | | |
| | | |
| | | |
| | | | | | | | | |
| | | Operating Expense (Excludes Severance and Related Costs) | | | 2,152 | | | | 1,938 | | | | 1,544 | | | | 1,879 | | | | 2,036 | | | | 11 | | | | 6 | |
| | Severance and Related Costs | | | 104 | | | | 338 | | | | 79 | | | | 124 | | | | 47 | | | | (69 | ) | | | 121 | |
| | | |
| | | |
| | | |
| | | |
| | | |
| | | | | | | | | |
| | | TOTAL OPERATING EXPENSE | | | 2,256 | | | | 2,276 | | | | 1,623 | | | | 2,003 | | | | 2,083 | | | | (1 | ) | | | 8 | |
| | | |
| | | |
| | | |
| | | |
| | | |
| | | | | | | | | |
| | Operating Margin | | | 1,756 | | | | 1,035 | | | | 804 | | | | 1,106 | | | | 1,524 | | | | 70 | | | | 15 | |
| | Credit Costs | | | 246 | | | | 489 | | | | 1,316 | | | | 306 | | | | 282 | | | | (50 | ) | | | (13 | ) |
| | | |
| | | |
| | | |
| | | |
| | | |
| | | | | | | | | |
| | Operating Income (Loss) Before Income Tax Expense | | | 1,510 | | | | 546 | | | | (512 | ) | | | 800 | | | | 1,242 | | | | 177 | | | | 22 | |
| | Income Tax Expense (Benefit) | | | 578 | | | | 185 | | | | (263 | ) | | | 298 | | | | 478 | | | | 212 | | | | 21 | |
| | | |
| | | |
| | | |
| | | |
| | | |
| | | | | | | | | |
OPERATING EARNINGS (LOSS) | | $ | 932 | | | $ | 361 | | | $ | (249 | ) | | $ | 502 | | | $ | 764 | | | | 158 | | | | 22 | |
| | | |
| | | |
| | | |
| | | |
| | | |
| | | | | | | | | |
| | Average Common Equity | | $ | 19,099 | | | $ | 18,745 | | | $ | 17,655 | | | $ | 18,388 | | | $ | 18,890 | | | | 2 | | | | 1 | |
| | Average Assets | | | 523,675 | | | | 515,605 | | | | 494,810 | | | | 503,368 | | | | 467,714 | | | | 2 | | | | 12 | |
| | Shareholder Value Added | | | 363 | | | | (210 | ) | | | (788 | ) | | | (53 | ) | | | 200 | | | NM | | | 82 | |
| | Return on Common Equity | | | 19.7 | % | | | 7.6 | % | | NM | | | 10.8 | % | | | 16.3 | % | | 1,210 bp | | 340 bp |
| | Overhead Ratio | | | 56 | | | | 69 | | | | 67 | % | | | 64 | | | | 58 | | | | (1,300 | ) | | | (200 | ) |
| | Overhead Ratio Excl. Severance and Related Costs | | | 54 | | | | 59 | | | | 64 | | | | 60 | | | | 56 | | | | (500 | ) | | | (200 | ) |
| | Compensation Expense as a % of Operating Revenue Excl. Severance and Related Costs | | | 33 | | | | 32 | | | | 30 | | | | 34 | | | | 32 | | | | 100 | | | | 100 | |
FULL-TIME EQUIVALENT EMPLOYEES | | | 14,633 | | | | 15,158 | | | | 16,381 | | | | 16,705 | | | | 17,674 | | | | (3 | )% | | | (17 | )% |
Page 7
| | | |
J.P. MORGAN CHASE & CO.
INVESTMENT BANK
BUSINESS-RELATED METRICS
(in millions) | | |
| | | | | | | | | | | | | | | | | | | | | | | | | | | | | | | | | |
| | | | | | | | | | | | | | | | | | | | | | | | | | | 1QTR 2003 |
| | | | | | | | | | | | | | | | | | | | | | | | | | | Over (Under) |
| | | | | | | 1QTR | | 4QTR | | 3QTR | | 2QTR | | 1QTR | |
|
| | | | | | | 2003 | | 2002 | | 2002 | | 2002 | | 2002 | | 4Q 2002 | | 1Q 2002 |
| | | | | | |
| |
| |
| |
| |
| |
| |
|
BUSINESS REVENUE: | | | | | | | | | | | | | | | | | | | | | | | | | | | | |
INVESTMENT BANKING FEES | | | | | | | | | | | | | | | | | | | | | | | | | | | | |
| | | | | Advisory | | $ | 160 | | | $ | 216 | | | $ | 139 | | | $ | 194 | | | $ | 194 | | | | (26 | )% | | | (18 | )% |
| | | | | Underwriting and Other Fees | | | 461 | | | | 434 | | | | 390 | | | | 587 | | | | 542 | | | | 6 | | | | (15 | ) |
| | | |
| | | |
| | | |
| | | |
| | | |
| | | | | | | | | |
TOTAL | | | 621 | | | | 650 | | | | 529 | | | | 781 | | | | 736 | | | | (4 | ) | | | (16 | ) |
| | | |
| | | |
| | | |
| | | |
| | | |
| | | | | | | | | |
CAPITAL MARKETS & LENDING | | | | | | | | | | | | | | | | | | | | | | | | | | | | |
| | | | | Fixed Income | | | 1,981 | | | | 1,566 | | | | 887 | | | | 1,269 | | | | 1,746 | | | | 27 | | | | 13 | |
| | | | | Treasury | | | 608 | | | | 578 | | | | 607 | | | | 269 | | | | 385 | | | | 5 | | | | 58 | |
| | | | | Credit Portfolio | | | 366 | | | | 324 | | | | 409 | | | | 414 | | | | 297 | | | | 13 | | | | 23 | |
| | | | | Equities | | | 436 | | | | 193 | | | | (5 | ) | | | 376 | | | | 443 | | | | 126 | | | | (2 | ) |
| | | |
| | | |
| | | |
| | | |
| | | |
| | | | | | | | | |
TOTAL | | | 3,391 | | | | 2,661 | | | | 1,898 | | | | 2,328 | | | | 2,871 | | | | 27 | | | | 18 | |
| | | |
| | | |
| | | |
| | | |
| | | |
| | | | | | | | | |
TOTAL OPERATING REVENUE | | $ | 4,012 | | | $ | 3,311 | | | $ | 2,427 | | | $ | 3,109 | | | $ | 3,607 | | | | 21 | | | | 11 | |
| | | |
| | | |
| | | |
| | | |
| | | |
| | | | | | | | | |
MEMO: | | | | | | | | | | | | | | | | | | | | | | | | | | | | |
CAPITAL MARKETS & LENDING TOTAL RETURN REVENUE (a) | | | | | | | | | | | | | | | | | | | | | | | | | | | | |
| | | Fixed Income | | $ | 1,945 | | | $ | 1,482 | | | $ | 921 | | | $ | 1,341 | | | $ | 1,703 | | | | 31 | | | | 14 | |
| | | Treasury | | | | 536 | | | | 465 | | | | 364 | | | | 215 | | | | 470 | | | | 15 | | | | 14 | |
| | | Credit Portfolio | | | 366 | | | | 324 | | | | 409 | | | | 414 | | | | 297 | | | | 13 | | | | 23 | |
| | | Equities | | | | 436 | | | | 193 | | | | (5 | ) | | | 376 | | | | 443 | | | | 126 | | | | (2 | ) |
| | | |
| | | |
| | | |
| | | |
| | | |
| | | | | | | | | |
TOTAL | | $ | 3,283 | | | $ | 2,464 | | | $ | 1,689 | | | $ | 2,346 | | | $ | 2,913 | | | | 33 | | | | 13 | |
| | | |
| | | |
| | | |
| | | |
| | | |
| | | | | | | | | |
MARKET SHARE / RANKINGS: (b) | | | | | | | | | | | | | | | | | | | | | | | | | | | | |
| | Global Syndicated Loans | | | 16% / #1 | | | | 19% / #1 | | | | 22% / #1 | | | | 28% / #1 | | | | 22% / #1 | | | | | | | | | |
| | U.S. Investment Grade Bonds | | | 15% / #2 | | | | 14% / #2 | | | | 15% / #2 | | | | 18% / #2 | | | | 16% / #2 | | | | | | | | | |
| | Euro-Denominated Corporate International Bonds | | | 4% / #10 | | | | 7% / #4 | | | | 5% / #9 | | | | 5% / #7 | | | | 6% / #4 | | | | | | | | | |
| | Global Equity and Equity-Related | | | 10% / #3 | | | | 3% / #9 | | | | 2% / #14 | | | | 6% / #6 | | | | 5% / #6 | | | | | | | | | |
| | U.S. Equity and Equity-Related | | | 15% / #1 | | | | 5% / #7 | | | | 3% / #8 | | | | 9% / #5 | | | | 5% / #7 | | | | | | | | | |
| | Global Announced M&A | | | 19% / #3 | | | | 15% / #5 | | | | 12% / #7 | | | | 17% / #3 | | | | 12% / #8 | | | | | | | | | |
| (a) | | Total return revenue includes operating revenues plus the unrealized gains or losses on third-party or internally transfer priced assets and liabilities in treasury and fixed income activities, which are not accounted for on a mark-to-market basis through earnings. |
| |
| (b) | | Derived from Thomson Financial Securities Data which reflects subsequent updates to prior period information. Global announced M&A is based on rank value; all other rankings are based on proceeds, with full credit to each book manager/equal if joint. U.S. Equity and Equity-Related adjusted to reflect all equity issuances in the U.S. market for both U.S. and non-U.S. issuers. |
Page 8
| | | |
J.P. MORGAN CHASE & CO.
TREASURY & SECURITIES SERVICES
FINANCIAL HIGHLIGHTS
(in millions, except ratios and employees) | | |
| | | | | | | | | | | | | | | | | | | | | | | | | | | | | | | | | |
| | | | | | | | | | | | | | | | | | | | | | | | | | | 1QTR 2003 |
| | | | | | | | | | | | | | | | | | | | | | | | | | | Over (Under) |
| | | | | | | 1QTR | | 4QTR | | 3QTR | | 2QTR | | 1QTR | |
|
| | | | | | | 2003 | | 2002 | | 2002 | | 2002 | | 2002 | | 4Q 2002 | | 1Q 2002 |
| | | | | | |
| |
| |
| |
| |
| |
| |
|
OPERATING INCOME STATEMENT | | | | | | | | | | | | | | | | | | | | | | | | | | | | |
REVENUE: | | | | | | | | | | | | | | | | | | | | | | | | | | | | |
| Fees and Commissions | | $ | 607 | | | $ | 593 | | | $ | 615 | | | $ | 630 | | | $ | 609 | | | | 2 | % | | | — | % |
| Net Interest Income | | | 323 | | | | 337 | | | | 336 | | | | 334 | | | | 323 | | | | (4 | ) | | | — | |
| All Other Revenue | | | 36 | | | | 32 | | | | 106 | | | | 55 | | | | 36 | | | | 13 | | | | — | |
| | | |
| | | |
| | | |
| | | |
| | | |
| | | | | | | | | |
| | | | TOTAL OPERATING REVENUE | | | 966 | | | | 962 | | | | 1,057 | | | | 1,019 | | | | 968 | | | | — | | | | — | |
| | | |
| | | |
| | | |
| | | |
| | | |
| | | | | | | | | |
EXPENSE: | | | | | | | | | | | | | | | | | | | | | | | | | | | | |
| Compensation Expense | | | 319 | | | | 285 | | | | 291 | | | | 302 | | | | 304 | | | | 12 | | | | 5 | |
| Noncompensation Expense | | | 422 | | | | 465 | | | | 443 | | | | 447 | | | | 443 | | | | (9 | ) | | | (5 | ) |
| | | |
| | | |
| | | |
| | | |
| | | |
| | | | | | | | | |
| | | | TOTAL OPERATING EXPENSE | | | 741 | | | | 750 | | | | 734 | | | | 749 | | | | 747 | | | | (1 | ) | | | (1 | ) |
| | | |
| | | |
| | | |
| | | |
| | | |
| | | | | | | | | |
| Operating Margin | | | 225 | | | | 212 | | | | 323 | | | | 270 | | | | 221 | | | | 6 | | | | 2 | |
| Credit Costs | | | 1 | | | | 2 | | | | — | | | | (1 | ) | | | 1 | | | | (50 | ) | | | — | |
| | | |
| | | |
| | | |
| | | |
| | | |
| | | | | | | | | |
| Operating Income Before Income Tax Expense | | | 224 | | | | 210 | | | | 323 | | | | 271 | | | | 220 | | | | 7 | | | | 2 | |
| Income Tax Expense | | | 77 | | | | 74 | | | | 112 | | | | 95 | | | | 77 | | | | 4 | | | | — | |
| | | |
| | | |
| | | |
| | | |
| | | |
| | | | | | | | | |
OPERATING EARNINGS | | $ | 147 | | | $ | 136 | | | $ | 211 | | | $ | 176 | | | $ | 143 | | | | 8 | | | | 3 | |
| | | |
| | | |
| | | |
| | | |
| | | |
| | | | | | | | | |
| Average Common Equity | | $ | 3,046 | | | $ | 2,904 | | | $ | 2,952 | | | $ | 3,026 | | | $ | 2,943 | | | | 5 | | | | 3 | |
| Average Assets | | | 19,590 | | | | 19,277 | | | | 15,940 | | | | 18,915 | | | | 16,974 | | | | 2 | | | | 15 | |
| Shareholder Value Added | | | 56 | | | | 47 | | | | 121 | | | | 84 | | | | 55 | | | | 19 | | | | 2 | |
| Return on Common Equity | | | 19.5 | % | | | 18.4 | % | | | 28.2 | % | | | 23.2 | % | | | 19.6 | % | | 110 bp | | (10) bp |
| Overhead Ratio | | | 77 | | | | 78 | | | | 69 | | | | 74 | | | | 77 | | | | (100 | ) | | | — | |
| Assets under Custody (in billions) | | $ | 6,269 | | | $ | 6,336 | | | $ | 6,251 | | | $ | 6,417 | | | $ | 6,428 | | | | (1 | )% | | | (2 | )% |
FULL-TIME EQUIVALENT EMPLOYEES | | | 14,357 | | | | 14,445 | | | | 14,745 | | | | 14,867 | | | | 15,257 | | | | (1 | ) | | | (6 | ) |
| |
OPERATING REVENUE BY BUSINESS: | | | | | | | | | | | | | | | | | | | | | | | | | | | | |
| | | Treasury Services | | $ | 496 | | | $ | 478 | | | $ | 482 | | | $ | 454 | | | $ | 459 | | | | 4 | | | | 8 | |
| | | Investor Services | | | 346 | | | | 340 | | | | 390 | | | | 423 | | | | 386 | | | | 2 | | | | (10 | ) |
| | | Institutional Trust Services | | | 207 | | | | 228 | | | | 223 | | | | 224 | | | | 205 | | | | (9 | ) | | | 1 | |
| | | Other | | | (83 | ) | | | (84 | ) | | | (38 | ) | | | (82 | ) | | | (82 | ) | | | 1 | | | | (1 | ) |
| | | |
| | | |
| | | |
| | | |
| | | |
| | | | | | | | | |
| | | Total Treasury & Securities Services | | $ | 966 | | | $ | 962 | | | $ | 1,057 | | | $ | 1,019 | | | $ | 968 | | | | — | | | | — | |
| | | |
| | | |
| | | |
| | | |
| | | |
| | | | | | | | | |
Page 9
| | | |
J.P. MORGAN CHASE & CO.
INVESTMENT MANAGEMENT & PRIVATE BANKING
FINANCIAL HIGHLIGHTS
(in millions, except ratios and employees) | | |
| | | | | | | | | | | | | | | | | | | | | | | | | | | | | | | | | |
| | | | | | | | | | | | | | | | | | | | | | | | | | | 1QTR 2003 |
| | | | | | | | | | | | | | | | | | | | | | | | | | | Over (Under) |
| | | | | | | 1QTR | | 4QTR | | 3QTR | | 2QTR | | 1QTR | |
|
| | | | | | | 2003 | | 2002 | | 2002 | | 2002 | | 2002 | | 4Q 2002 | | 1Q 2002 |
| | | | | | |
| |
| |
| |
| |
| |
| |
|
OPERATING INCOME STATEMENT | | | | | | | | | | | | | | | | | | | | | | | | | | | | |
REVENUE: | | | | | | | | | | | | | | | | | | | | | | | | | | | | |
| Fees and Commissions | | $ | 511 | | | $ | 507 | | | $ | 519 | | | $ | 560 | | | $ | 590 | | | | 1 | % | | | (13 | )% |
| Net Interest Income | | | 125 | | | | 117 | | | | 124 | | | | 122 | | | | 120 | | | | 7 | | | | 4 | |
| All Other Revenue | | | 16 | | | | 39 | | | | 59 | | | | 56 | | | | 63 | | | | (59 | ) | | | (75 | ) |
| | | |
| | | |
| | | |
| | | |
| | | |
| | | | | | | | | |
| | | | TOTAL OPERATING REVENUE | | | 652 | | | | 663 | | | | 702 | | | | 738 | | | | 773 | | | | (2 | ) | | | (16 | ) |
| | | |
| | | |
| | | |
| | | |
| | | |
| | | | | | | | | |
EXPENSE: | | | | | | | | | | | | | | | | | | | | | | | | | | | | |
| Compensation Expense | | | 285 | | | | 311 | | | | 267 | | | | 261 | | | | 286 | | | | (8 | ) | | | — | |
| Noncompensation Expense | | | 289 | | | | 314 | | | | 293 | | | | 317 | | | | 297 | | | | (8 | ) | | | (3 | ) |
| | | |
| | | |
| | | |
| | | |
| | | |
| | | | | | | | | |
| | | | TOTAL OPERATING EXPENSE | | | 574 | | | | 625 | | | | 560 | | | | 578 | | | | 583 | | | | (8 | ) | | | (2 | ) |
| | | |
| | | |
| | | |
| | | |
| | | |
| | | | | | | | | |
| Operating Margin | | | 78 | | | | 38 | | | | 142 | | | | 160 | | | | 190 | | | | 105 | | | | (59 | ) |
| Credit Costs | | | 6 | | | | 13 | | | | 26 | | | | 23 | | | | 23 | | | | (54 | ) | | | (74 | ) |
| | | |
| | | |
| | | |
| | | |
| | | |
| | | | | | | | | |
| Operating Income Before Income Tax Expense | | | 72 | | | | 25 | | | | 116 | | | | 137 | | | | 167 | | | | 188 | | | | (57 | ) |
| Income Tax Expense | | | 8 | | | | (18 | ) | | | 17 | | | | 26 | | | | 38 | | | NM | | | (79 | ) |
| | | |
| | | |
| | | |
| | | |
| | | |
| | | | | | | | | |
OPERATING EARNINGS | | $ | 64 | | | $ | 43 | | | $ | 99 | | | $ | 111 | | | $ | 129 | | | | 49 | | | | (50 | ) |
| | | |
| | | |
| | | |
| | | |
| | | |
| | | | | | | | | |
| Average Common Equity | | $ | 6,044 | | | $ | 6,148 | | | $ | 6,044 | | | $ | 6,180 | | | $ | 6,108 | | | | (2 | ) | | | (1 | ) |
| Average Assets | | | 33,577 | | | | 33,522 | | | | 34,968 | | | | 36,478 | | | | 38,007 | | | | — | | | | (12 | ) |
| Shareholder Value Added | | | (116 | ) | | | (144 | ) | | | (86 | ) | | | (75 | ) | | | (53 | ) | | | 19 | | | NM |
| Tangible Shareholder Value Added | | | 9 | | | | (15 | ) | | | 43 | | | | 53 | | | | 74 | | | NM | | | (88 | ) |
| Return on Common Equity | | | 4.2 | % | | | 2.7 | % | | | 6.4 | % | | | 7.1 | % | | | 8.5 | % | | 150 bp | | (430) bp |
| Return on Tangible Common Equity | | | 13.9 | | | | 9.0 | | | | 21.0 | | | | 22.5 | | | | 27.1 | | | | 490 | | | | (1,320 | ) |
| Overhead Ratio | | | 88 | | | | 94 | | | | 80 | | | | 78 | | | | 75 | | | | (600 | ) | | | 1,300 | |
| Pre-Tax Margin Ratio | | | 11 | | | | 4 | | | | 17 | | | | 19 | | | | 22 | | | | 700 | | | | (1,100 | ) |
FULL-TIME EQUIVALENT EMPLOYEES | | | 7,511 | | | | 7,828 | | | | 8,081 | | | | 8,103 | | | | 8,022 | | | | (4 | )% | | | (6 | )% |
| |
ASSETS UNDER SUPERVISION (in billions) | | | | | | | | | | | | | | | | | | | | | | | | | | | | |
| Client Segment: | | | | | | | | | | | | | | | | | | | | | | | | | | | | |
| | | Private Banking | | $ | 125 | (a) | | $ | 130 | | | $ | 126 | | | $ | 138 | | | $ | 145 | | | | (4 | ) | | | (14 | ) |
| | | Institutional | | | 298 | (a) | | | 305 | | | | 298 | | | | 318 | | | | 345 | | | | (2 | ) | | | (14 | ) |
| | | Retail | | | 72 | (a) | | | 80 | | | | 77 | | | | 89 | | | | 96 | | | | (10 | ) | | | (25 | ) |
| | | |
| | | |
| | | |
| | | |
| | | |
| | | | | | | | | |
| | | | Assets under Management | | | 495 | (a) | | | 515 | | | | 501 | | | | 545 | | | | 586 | | | | (4 | ) | | | (16 | ) |
| | | Custody / restricted stock / brokerage / administration / deposits | | | 127 | (a) | | | 129 | | | | 131 | | | | 140 | | | | 147 | | | | (2 | ) | | | (14 | ) |
| | | |
| | | |
| | | |
| | | |
| | | |
| | | | | | | | | |
| | | | Assets under Supervision | | $ | 622 | (a) | | $ | 644 | | | $ | 632 | | | $ | 685 | | | $ | 733 | | | | (3 | ) | | | (15 | ) |
| | | |
| | | |
| | | |
| | | |
| | | |
| | | | | | | | | |
| Geographic Region: | | | | | | | | | | | | | | | | | | | | | | | | | | | | |
| | | Americas | | $ | 350 | (a) | | $ | 362 | | | $ | 352 | | | $ | 381 | | | $ | 424 | | | | (3 | ) | | | (17 | ) |
| | | Europe and Asia | | | 145 | (a) | | | 153 | | | | 149 | | | | 164 | | | | 162 | | | | (5 | ) | | | (10 | ) |
| | | |
| | | |
| | | |
| | | |
| | | |
| | | | | | | | | |
| | | | Assets under Management | | | 495 | (a) | | | 515 | | | | 501 | | | | 545 | | | | 586 | | | | (4 | ) | | | (16 | ) |
| | | Custody / restricted stock / brokerage / administration / deposits | | | 127 | (a) | | | 129 | | | | 131 | | | | 140 | | | | 147 | | | | (2 | ) | | | (14 | ) |
| | | |
| | | |
| | | |
| | | |
| | | |
| | | | | | | | | |
| | | | Assets under Supervision | | $ | 622 | (a) | | $ | 644 | | | $ | 632 | | | $ | 685 | | | $ | 733 | | | | (3 | ) | | | (15 | ) |
| | | |
| | | |
| | | |
| | | |
| | | |
| | | | | | | | | |
| Product Class: | | | | | | | | | | | | | | | | | | | | | | | | | | | | |
| | | Fixed Income | | $ | 144 | (a) | | $ | 149 | | | $ | 150 | | | $ | 156 | | | $ | 157 | | | | (3 | ) | | | (8 | ) |
| | | Liquidity | | | 144 | (a) | | | 144 | | | | 130 | | | | 131 | | | | 148 | | | | — | | | | (3 | ) |
| | | Equities and Other | | | 207 | (a) | | | 222 | | | | 221 | | | | 258 | | | | 281 | | | | (7 | ) | | | (26 | ) |
| | | |
| | | |
| | | |
| | | |
| | | |
| | | | | | | | | |
| | | | Assets under Management | | | 495 | (a) | | | 515 | | | | 501 | | | | 545 | | | | 586 | | | | (4 | ) | | | (16 | ) |
| | | Custody / restricted stock / brokerage / administration / deposits | | | 127 | (a) | | | 129 | | | | 131 | | | | 140 | | | | 147 | | | | (2 | ) | | | (14 | ) |
| | | |
| | | |
| | | |
| | | |
| | | |
| | | | | | | | | |
| | | | Assets under Supervision | | $ | 622 | (a) | | $ | 644 | | | $ | 632 | | | $ | 685 | | | $ | 733 | | | | (3 | ) | | | (15 | ) |
| | | |
| | | |
| | | |
| | | |
| | | |
| | | |
| | | |
| |
(a) Estimated
Page 10
| | | |
J.P. MORGAN CHASE & CO.
JPMORGAN PARTNERS
FINANCIAL HIGHLIGHTS
(in millions, except ratios and employees) | | |
| | | | | | | | | | | | | | | | | | | | | | | | | | | | | | | | | |
| | | | | | | | | | | | | | | | | | | | | | | | | | | 1QTR 2003 |
| | | | | | | | | | | | | | | | | | | | | | | | | | | Over (Under) |
| | | | | | | 1QTR | | 4QTR | | 3QTR | | 2QTR | | 1QTR | |
|
| | | | | | | 2003 | | 2002 | | 2002 | | 2002 | | 2002 | | 4Q 2002 | | 1Q 2002 |
| | | | | | |
| |
| |
| |
| |
| |
| |
|
|
|
|
|
|
|
OPERATING INCOME STATEMENT | | | | | | | | | | | | | | | | | | | | | | | | | | | | |
|
|
|
|
|
|
REVENUE: | | | | | | | | | | | | | | | | | | | | | | | | | | | | |
| Private Equity: | | | | | | | | | | | | | | | | | | | | | | | | | | | | |
| | Cash Gains | | $ | 62 | | | $ | 169 | | | $ | 111 | | | $ | 111 | | | $ | 172 | | | | (63 | )% | | | (64 | )% |
| | Write-offs | | | (65 | ) | | | (195 | ) | | | (152 | ) | | | (122 | ) | | | (185 | ) | | | 67 | | | | 65 | |
| | | |
| | | |
| | | |
| | | |
| | | |
| | | | | | | | | |
| | | Realized Gains (Losses) | | | (3 | ) | | | (26 | ) | | | (41 | ) | | | (11 | ) | | | (13 | ) | | | 88 | | | | 77 | |
| | | |
| | | |
| | | |
| | | |
| | | |
| | | | | | | | | |
| | Public Mark-to-Market | | | (6 | ) | | | 108 | | | | (120 | ) | | | (21 | ) | | | (177 | ) | | NM | | | 97 | |
| | Private Write-downs | | | (221 | ) | | | (135 | ) | | | (138 | ) | | | (94 | ) | | | (65 | ) | | | (64 | ) | | NM |
| | | |
| | | |
| | | |
| | | |
| | | |
| | | | | | | | | |
| | | Unrealized Gains (Losses) | | | (227 | ) | | | (27 | ) | | | (258 | ) | | | (115 | ) | | | (242 | ) | | NM | | | 6 | |
| | | |
| | | |
| | | |
| | | |
| | | |
| | | | | | | | | |
| Total Private Equity Gains (Losses) | | | (230 | ) | | | (53 | ) | | | (299 | ) | | | (126 | ) | | | (255 | ) | | NM | | | 10 | |
| Net Interest Income (Loss) | | | (74 | ) | | | (69 | ) | | | (75 | ) | | | (87 | ) | | | (86 | ) | | | (7 | ) | | | 14 | |
| Fees and Other Revenue | | | 14 | | | | 27 | | | | 3 | | | | 8 | | | | 20 | | | | (48 | ) | | | (30 | ) |
| | | |
| | | |
| | | |
| | | |
| | | |
| | | | | | | | | |
| | | | TOTAL OPERATING REVENUE | | | (290 | ) | | | (95 | ) | | | (371 | ) | | | (205 | ) | | | (321 | ) | | NM | | | 10 | |
| | | |
| | | |
| | | |
| | | |
| | | |
| | | | | | | | | |
EXPENSE: | | | | | | | | | | | | | | | | | | | | | | | | | | | | |
| Compensation Expense | | | 34 | | | | 23 | | | | 33 | | | | 34 | | | | 37 | | | | 48 | | | | (8 | ) |
| Noncompensation Expense | | | 29 | | | | 45 | | | | 44 | | | | 39 | | | | 41 | | | | (36 | ) | | | (29 | ) |
| | | |
| | | |
| | | |
| | | |
| | | |
| | | | | | | | | |
| | | | TOTAL OPERATING EXPENSE | | | 63 | | | | 68 | | | | 77 | | | | 73 | | | | 78 | | | | (7 | ) | | | (19 | ) |
| | | |
| | | |
| | | |
| | | |
| | | |
| | | | | | | | | |
| Operating Income (Loss) Before Income Tax Expense | | | (353 | ) | | | (163 | ) | | | (448 | ) | | | (278 | ) | | | (399 | ) | | NM | | | 12 | |
| Income Tax Expense (Benefit) | | | (129 | ) | | | (62 | ) | | | (164 | ) | | | (103 | ) | | | (147 | ) | | NM | | | 12 | |
| | | |
| | | |
| | | |
| | | |
| | | |
| | | | | | | | | |
OPERATING EARNINGS (LOSS) | | $ | (224 | ) | | $ | (101 | ) | | $ | (284 | ) | | $ | (175 | ) | | $ | (252 | ) | | NM | | | 11 | |
| | | |
| | | |
| | | |
| | | |
| | | |
| | | | | | | | | |
| Average Common Equity | | $ | 5,055 | | | $ | 5,210 | | | $ | 5,292 | | | $ | 5,392 | | | $ | 5,609 | | | | (3 | ) | | | (10 | ) |
| Average Assets | | | 9,428 | | | | 9,629 | | | | 9,404 | | | | 9,611 | | | | 10,074 | | | | (2 | ) | | | (6 | ) |
| Shareholder Value Added | | | (413 | ) | | | (300 | ) | | | (485 | ) | | | (378 | ) | | | (461 | ) | | | (38 | ) | | | 10 | |
FULL-TIME EQUIVALENT EMPLOYEES | | | 342 | | | | 357 | | | | 364 | | | | 357 | | | | 338 | | | | (4 | ) | | | 1 | |
Page 11
| | | |
J.P. MORGAN CHASE & CO.
JPMORGAN PARTNERS
INVESTMENT PORTFOLIO — PRIVATE AND PUBLIC SECURITIES
(in millions) | | |
| | | | | | | | | | | | | | | | | | | | | | | | | | | | | | |
| | | | | | | | | | | | | | | | | | �� | | | | | | Mar 31, 2003 |
| | | | | | | | | | | | | | | | | | | | | | | | Over (Under) |
| | | | | | | | | | | | | | | | | | | | | | | |
|
| | | | Mar 31 | | Dec 31 | | Sep 30 | | Jun 30 | | Mar 31 | | Dec 31 | | Mar 31 | |
| | | | 2003 | | 2002 | | 2002 | | 2002 | | 2002 | | 2002 | | 2002 |
| | | |
| |
| |
| |
| |
| |
| |
|
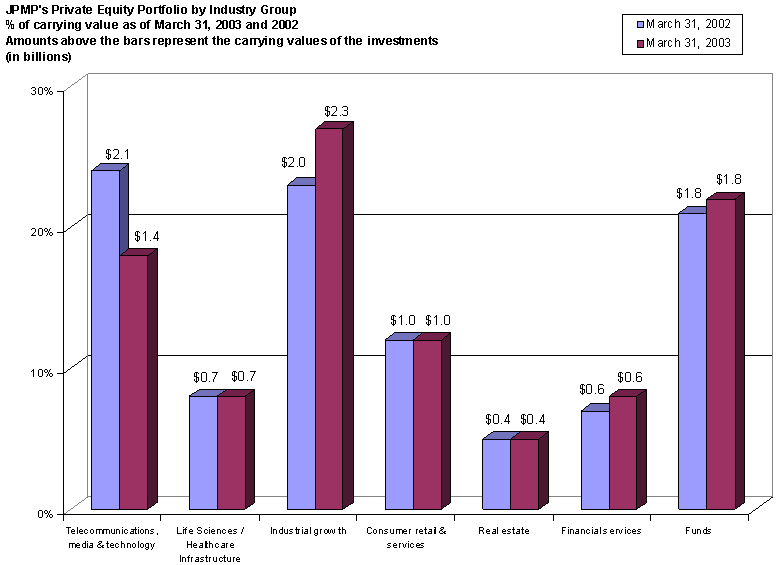
PORTFOLIO INFORMATION | | | | | | | | | | | | | | | | | | | | | | | | | | | | |
| Public Securities (89 companies) (a) (b) |
| | Carrying Value | $ | 478 | | | $ | 520 | | | $ | 488 | | | $ | 695 | | | $ | 705 | | | | (8 | )% | | | (32 | )% |
| | Cost | | | 624 | | | | 663 | | | | 764 | | | | 860 | | | | 809 | | | | (6 | ) | | | (23 | ) |
| Private Direct Securities (945 companies) (b) |
| | Carrying Value | | 5,912 | | | | 5,865 | | | | 5,694 | | | | 5,707 | | | | 6,054 | | | | 1 | | | | (2 | ) |
| | Cost | | | 7,439 | | | | 7,316 | | | | 7,186 | | | | 7,066 | | | | 7,317 | | | | 2 | | | | 2 | |
Private Fund Investments (312 funds) (b) |
| | Carrying Value | | 1,780 | | | | 1,843 | | | | 1,831 | | | | 1,827 | | | | 1,794 | | | | (3 | ) | | | (1 | ) |
| | Cost | | | 2,360 | | | | 2,333 | | | | 2,216 | | | | 2,164 | | | | 2,119 | | | | 1 | | | | 11 | |
| | | |
| | | |
| | | |
| | | |
| | | |
| | | | | | | | | |
| Total Investment Portfolio — Carrying Value | | $ | 8,170 | | | $ | 8,228 | | | $ | 8,013 | | | $ | 8,229 | | | $ | 8,553 | | | | (1 | ) | | | (4 | ) |
| | | |
| | | |
| | | |
| | | |
| | | |
| | | | | | | | | |
| Total Investment Portfolio — Cost | | $ | 10,423 | | | $ | 10,312 | | | $ | 10,166 | | | $ | 10,090 | | | $ | 10,245 | | | | 1 | | | | 2 | |
| | | |
| | | |
| | | |
| | | |
| | | |
| | | | | | | | | |
| (a) | �� | Publicly traded positions only. |
| |
| (b) | | Represents the number of companies and funds at March 31, 2003. |
Page 12
| | | |
J.P. MORGAN CHASE & CO.
CHASE FINANCIAL SERVICES
FINANCIAL HIGHLIGHTS
(in millions, except ratios and employees) | | |
| | | | | | | | | | | | | | | | | | | | | | | | | | | | | | | | |
| | | | | | | | | | | | | | | | | | | | | | | | | | 1QTR 2003 |
| | | | | | | | | | | | | | | | | | | | | | | | | | Over (Under) |
| | | | | | 1QTR | | 4QTR | | 3QTR | | 2QTR | | 1QTR | |
|
| | | | | | 2003 | | 2002 | | 2002 | | 2002 | | 2002 | | 4Q 2002 | | 1Q 2002 |
| | | | | |
| |
| |
| |
| |
| |
| |
|
OPERATING INCOME STATEMENT | | | | | | | | | | | | | | | | | | | | | | | | | | | | |
REVENUE: | | | | | | | | | | | | | | | | | | | | | | | | | | | | |
| Net Interest Income | | $ | 2,360 | | | $ | 2,171 | | | $ | 2,150 | | | $ | 2,112 | | | $ | 2,023 | | | | 9 | % | | | 17 | % |
| Fees and Commissions | | | 935 | | | | 603 | | | | 1,233 | | | | 1,134 | | | | 894 | | | | 55 | | | | 5 | |
| Securities Gains | | | 102 | | | | 375 | | | | 112 | | | | 19 | | | | (13 | ) | | | (73 | ) | | NM |
| All Other Revenue | | | 340 | | | | 229 | | | | 215 | | | | 176 | | | | 187 | | | | 48 | | | | 82 | |
| | | |
| | | |
| | | |
| | | |
| | | |
| | | | | | | | | |
| | | TOTAL OPERATING REVENUE | | | 3,737 | | | | 3,378 | | | | 3,710 | | | | 3,441 | | | | 3,091 | | | | 11 | | | | 21 | |
| | | |
| | | |
| | | |
| | | |
| | | |
| | | | | | | | | |
EXPENSE: | | | | | | | | | | | | | | | | | | | | | | | | | | | | |
| Compensation Expense | | | 734 | | | | 633 | | | | 677 | | | | 669 | | | | 645 | | | | 16 | | | | 14 | |
| Noncompensation Expense | | | 1,014 | | | | 1,076 | | | | 973 | | | | 958 | | | | 900 | | | | (6 | ) | | | 13 | |
| | | |
| | | |
| | | |
| | | |
| | | |
| | | | | | | | | |
| | | TOTAL OPERATING EXPENSE | | | 1,748 | | | | 1,709 | | | | 1,650 | | | | 1,627 | | | | 1,545 | | | | 2 | | | | 13 | |
| | | |
| | | |
| | | |
| | | |
| | | |
| | | | | | | | | |
| Operating Margin | | | 1,989 | | | | 1,669 | | | | 2,060 | | | | 1,814 | | | | 1,546 | | | | 19 | | | | 29 | |
| Credit Costs | | | 878 | | | | 874 | | | | 823 | | | | 736 | | | | 726 | | | | — | | | | 21 | |
| | | |
| | | |
| | | |
| | | |
| | | |
| | | | | | | | | |
| Operating Income Before Income Tax Expense | | | 1,111 | | | | 795 | | | | 1,237 | | | | 1,078 | | | | 820 | | | | 40 | | | | 35 | |
| Income Tax Expense | | | 407 | | | | 299 | | | | 446 | | | | 404 | | | | 312 | | | | 36 | | | | 30 | |
| | | |
| | | |
| | | |
| | | |
| | | |
| | | | | | | | | |
OPERATING EARNINGS | | $ | 704 | | | $ | 496 | | | $ | 791 | | | $ | 674 | | | $ | 508 | | | | 42 | | | | 39 | |
| | | |
| | | |
| | | |
| | | |
| | | |
| | | | | | | | | |
| Average Common Equity | | $ | 10,331 | | | $ | 10,371 | | | $ | 10,488 | | | $ | 10,433 | | | $ | 10,142 | | | | — | | | | 2 | |
| Average Managed Assets (a) | | | 202,358 | | | | 188,479 | | | | 178,826 | | | | 175,556 | | | | 175,593 | | | | 7 | | | | 15 | |
| Shareholder Value Added | | | 396 | | | | 179 | | | | 470 | | | | 358 | | | | 205 | | | | 121 | | | | 93 | |
| Return on Common Equity | | | 27.5 | % | | | 18.9 | % | | | 29.8 | % | | | 25.8 | % | | | 20.2 | % | | 860 bp | | 730 bp |
| Overhead Ratio | | | 47 | | | | 51 | | | | 44 | | | | 47 | | | | 50 | | | | (400 | ) | | | (300 | ) |
FULL-TIME EQUIVALENT EMPLOYEES | | | 44,393 | | | | 43,612 | | | | 42,910 | | | | 42,642 | | | | 42,331 | | | | 2 | % | | | 5 | % |
| |
CHASE FINANCIAL SERVICES’ BUSINESSES | | | | | | | | | | | | | | | | | | | | | | | | | | | | |
CHASE HOME FINANCE: | | | | | | | | | | | | | | | | | | | | | | | | | | | | |
| Operating Revenue | | $ | 1,143 | | | $ | 646 | | | $ | 977 | | | $ | 776 | | | $ | 530 | | | | 77 | | | | 116 | |
| Operating Expense | | | 360 | | | | 379 | | | | 310 | | | | 313 | | | | 298 | | | | (5 | ) | | | 21 | |
| Operating Earnings | | | 435 | | | | 152 | | | | 390 | | | | 265 | | | | 130 | | | | 186 | | | | 235 | |
| |
CHASE CARDMEMBER SERVICES: | | | | | | | | | | | | | | | | | | | | | | | | | | | | |
| Operating Revenue | | $ | 1,475 | | | $ | 1,579 | | | $ | 1,563 | | | $ | 1,493 | | | $ | 1,359 | | | | (7 | ) | | | 9 | |
| Operating Expense | | | 534 | | | | 606 | | | | 545 | | | | 523 | | | | 482 | | | | (12 | ) | | | 11 | |
| Operating Earnings | | | 157 | | | | 147 | | | | 237 | | | | 170 | | | | 142 | | | | 7 | | | | 11 | |
| |
CHASE AUTO FINANCE: | | | | | | | | | | | | | | | | | | | | | | | | | | | | |
| Operating Revenue | | $ | 201 | | | $ | 190 | | | $ | 167 | | | $ | 167 | | | $ | 172 | | | | 6 | | | | 17 | |
| Operating Expense | | | 67 | | | | 65 | | | | 61 | | | | 61 | | | | 61 | | | | 3 | | | | 10 | |
| Operating Earnings | | | 40 | | | | 37 | | | | 26 | | | | 80 | | | | 31 | | | | 8 | | | | 29 | |
| |
CHASE REGIONAL BANKING: | | | | | | | | | | | | | | | | | | | | | | | | | | | | |
| Operating Revenue | | $ | 630 | | | $ | 692 | | | $ | 697 | | | $ | 709 | | | $ | 724 | | | | (9 | ) | | | (13 | ) |
| Operating Expense | | | 561 | | | | 564 | | | | 546 | | | | 551 | | | | 557 | | | | (1 | ) | | | 1 | |
| Operating Earnings | | | 35 | | | | 78 | | | | 76 | | | | 88 | | | | 112 | | | | (55 | ) | | | (69 | ) |
| |
CHASE MIDDLE MARKET: | | | | | | | | | | | | | | | | | | | | | | | | | | | | |
| Operating Revenue | | $ | 369 | | | $ | 365 | | | $ | 384 | | | $ | 369 | | | $ | 376 | | | | 1 | | | | (2 | ) |
| Operating Expense | | | 210 | | | | 222 | | | | 198 | | | | 208 | | | | 204 | | | | (5 | ) | | | 3 | |
| Operating Earnings | | | 96 | | | | 63 | | | | 102 | | | | 97 | | | | 89 | | | | 52 | | | | 8 | |
| (a) | | Includes credit card receivables that have been securitized. |
Page 13
| | | |
J.P. MORGAN CHASE & CO.
CHASE FINANCIAL SERVICES
BUSINESS-RELATED METRICS
(in billions, except ratios and where otherwise noted) | | |
| | | | | | | | | | | | | | | | | | | | | | | | | | | | | | |
| | | | | | | | | | | | | | | | | | | | | | | | 1QTR 2003 |
| | | | | | | | | | | | | | | | | | | | | | | | Over (Under) |
| | | | 1QTR | | 4QTR | | 3QTR | | 2QTR | | 1QTR | |
|
| | | | 2003 | | 2002 | | 2002 | | 2002 | | 2002 | | 4Q 2002 | | 1Q 2002 |
| | | |
| |
| |
| |
| |
| |
| |
|
Chase Home Finance | | | | | | | | | | | | | | | | | | | | | | | | | | | | |
| Originations: | | | | | | | | | | | | | | | | | | | | | | | | | �� | | | |
| | Retail, Wholesale and Correspondent | | $ | 41 | | | $ | 40 | | | $ | 29 | | | $ | 22 | | | $ | 23 | | | | 3 | % | | | 78 | % |
| | Correspondent Negotiated Transactions | | | 21 | | | | 21 | | | | 7 | | | | 5 | | | | 10 | | | | — | | | | 110 | |
| Loans Serviced | | | 432 | | | | 426 | | | | 435 | | | | 436 | | | | 426 | | | | 1 | | | | 1 | |
| End-of-Period Outstandings | | | 67.3 | | | | 63.6 | | | | 55.6 | | | | 53.6 | | | | 54.4 | | | | 6 | | | | 24 | |
| Total Average Loans Owned | | | 64.4 | | | | 59.7 | | | | 54.2 | | | | 54.1 | | | | 56.9 | | | | 8 | | | | 13 | |
| Number of Customers (in millions) | | | 4.0 | | | | 4.0 | | | | 4.0 | | | | 4.0 | | | | 4.0 | | | | — | | | | — | |
| MSR Carrying Value | | | 3.2 | | | | 3.2 | | | | 3.6 | | | | 5.7 | | | | 6.9 | | | | — | | | | (54 | ) |
| Net Charge-Off Ratio | | | 0.20 | % | | | 0.27 | % | | | 0.21 | % | | | 0.30 | % | | | 0.21 | % | | (7) bp | | (1) bp |
| Overhead Ratio | | | 31 | | | | 59 | | | | 32 | | | | 40 | | | | 56 | | | | (2,800 | ) | | | (2,500 | ) |
| |
Chase Cardmember Services — Managed Basis | | | | | | | | | | | | | | | | | | | | | | | | | | | | |
| End-of-Period Outstandings | | $ | 50.6 | | | $ | 51.1 | | | $ | 51.1 | | | $ | 49.5 | | | $ | 48.9 | | | | (1 | )% | | | 3 | % |
| Average Outstandings | | | 50.9 | | | | 50.7 | | | | 50.4 | | | | 48.9 | | | | 46.3 | | | | — | | | | 10 | |
| Total Purchases & Cash Advances (a) | | | 20.7 | | | | 21.2 | | | | 23.0 | | | | 20.9 | | | | 18.9 | | | | (2 | ) | | | 10 | |
| Total Accounts (in millions) | | | 29.8 | | | | 29.2 | | | | 28.6 | | | | 28.1 | | | | 27.7 | | | | 2 | | | | 8 | |
| Active Accounts (in millions) | | | 16.5 | | | | 16.5 | | | | 16.5 | | | | 16.3 | | | | 16.5 | | | | — | | | | — | |
| Net Charge-Off Ratio | | | 5.87 | % | | | 5.75 | % | | | 5.59 | % | | | 6.41 | % | | | 5.82 | % | | 12 bp | | 5 bp |
| 30+ Day Delinquency Rate | | | 4.59 | | | | 4.67 | | | | 4.47 | | | | 4.17 | | | | 4.58 | | | | (8 | ) | | | 1 | |
| Overhead Ratio | | | 36 | | | | 38 | | | | 35 | | | | 35 | | | | 35 | | | | (200 | ) | | | 100 | |
| |
Chase Auto Finance | | | | | | | | | | | | | | | | | | | | | | | | | | | | |
| Loan and Lease Receivables | | $ | 41.1 | | | $ | 37.4 | | | $ | 33.8 | | | $ | 29.3 | | | $ | 29.4 | | | | 10 | % | | | 40 | % |
| Average Loan and Lease Receivables | | | 39.6 | | | | 35.8 | | | | 31.5 | | | | 29.6 | | | | 29.9 | | | | 11 | | | | 32 | |
| Auto Origination Volume | | | 7.4 | | | | 6.8 | | | | 7.6 | | | | 5.2 | | | | 5.8 | | | | 9 | | | | 28 | |
| Auto Market Share | | | 6.4% | (c) | | | 5.7 | % | | | 5.8 | % | | | 5.1 | % | | | 5.2 | % | | 70 bp | | 120 bp |
| Net Charge-Off Ratio | | | 0.48 | | | | 0.53 | | | | 0.59 | | | | 0.38 | | | | 0.53 | | | | (5 | ) | | | (5 | ) |
| Overhead Ratio | | | 33 | | | | 34 | | | | 37 | | | | 36 | | | | 35 | | | | (100 | ) | | | (200 | ) |
| |
Chase Regional Banking | | | | | | | | | | | | | | | | | | | | | | | | | | | | |
| Total Average Deposits | | $ | 72.6 | | | $ | 70.1 | | | $ | 70.1 | | | $ | 69.9 | | | $ | 69.2 | | | | 4 | % | | | 5 | % |
| Total Average Assets Under Management (b) | | | 103.9 | (c) | | | 102.6 | | | | 102.6 | | | | 104.3 | | | | 104.8 | | | | 1 | | | | (1 | ) |
| Number of Branches | | | 527 | | | | 528 | | | | 533 | | | | 533 | | | | 538 | | | | — | | | | (2 | ) |
| Number of ATMs | | | 1,873 | (c) | | | 1,876 | | | | 1,884 | | | | 1,878 | | | | 1,895 | | | | — | | | | (1 | ) |
| Number of Online Customers (in thousands) | | | 1,259 | | | | 1,185 | | | | 1,128 | | | | 1,066 | | | | 1,003 | | | | 6 | | | | 26 | |
| Overhead Ratio | | | 89 | % | | | 82 | % | | | 78 | % | | | 78 | % | | | 77 | % | | 700 bp | | 1,200 bp |
| |
Chase Middle Market | | | | | | | | | | | | | | | | | | | | | | | | | | | | |
| Total Average Loans | | $ | 14.3 | | | $ | 14.1 | | | $ | 13.7 | | | $ | 13.5 | | | $ | 13.6 | | | | 1 | % | | | 5 | % |
| Total Average Deposits | | | 28.0 | | | | 25.8 | | | | 24.0 | | | | 24.0 | | | | 22.7 | | | | 9 | | | | 23 | |
| Nonperforming Average Loans as a % of Total Average Loans | | | 1.47 | % | | | 1.59 | % | | | 1.95 | % | | | 1.89 | % | | | 2.20 | % | | (12) bp | | (73) bp |
| Overhead Ratio | | | 57 | | | | 61 | | | | 52 | | | | 57 | | | | 54 | | | | (400 | ) | | | 300 | |
| (a) | | Sum of total customer purchases, cash advances and balance transfers. |
| |
| (b) | | Assets under management includes deposits. |
| |
| (c) | | Estimated |
Page 14
SUPPLEMENTAL DETAIL
| | | |
| J.P. MORGAN CHASE & CO | | |
| NONINTEREST REVENUE AND NONINTEREST EXPENSE DETAIL ON A REPORTED BASIS | | |
| (in millions) | | |
| | | | | | | | | | | | | | | | | | | | | | | | | | | | | | | |
| | | | | | | | | | | | | | | | | | | | | | | | | 1QTR 2003 |
| | | | | | | | | | | | | | | | | | | | | | | | | Over (Under) |
| | | | | 1QTR | | 4QTR | | 3QTR | | 2QTR | | 1QTR | |
|
| NONINTEREST REVENUE | | 2003 | | 2002 | | 2002 | | 2002 | | 2002 | | 4Q 2002 | | 1Q 2002 |
| |
| |
| |
| |
| |
| |
| |
|
Investment Banking Fees: | | | | | | | | | | | | | | | | | | | | | | | | | | | | |
| | Advisory | | $ | 166 | | | $ | 233 | | | $ | 143 | | | $ | 189 | | | $ | 191 | | | | (29 | )% | | | (13 | )% |
| | Underwriting: | | | | | | | | | | | | | | | | | | | | | | | | | | | | |
| | | Equity | | | 108 | | | | 84 | | | | 57 | | | | 184 | | | | 139 | | | | 29 | | | | (22 | ) |
| | | Debt | | | 342 | | | | 361 | | | | 345 | | | | 412 | | | | 425 | | | | (5 | ) | | | (20 | ) |
| | | |
| | | |
| | | |
| | | |
| | | |
| | | | | | | | | |
| | Total | | $ | 616 | | | $ | 678 | | | $ | 545 | | | $ | 785 | | | $ | 755 | | | | (9 | ) | | | (18 | ) |
| | | |
| | | |
| | | |
| | | |
| | | |
| | | | | | | | | |
Trading-Related Revenue:(a) | | | | | | | | | | | | | | | | | | | | | | | | | | | | |
| | Equities | | $ | 194 | | | $ | (20 | ) | | $ | (211 | ) | | $ | 120 | | | $ | 223 | | | NM | | | (13 | ) |
| | Fixed Income and Other | | | 1,721 | | | | 1,273 | | | | 576 | | | | 1,016 | | | | 1,497 | | | | 35 | | | | 15 | |
| | | |
| | | |
| | | |
| | | |
| | | |
| | | | | | | | | |
| | Total | | $ | 1,915 | | | $ | 1,253 | | | $ | 365 | | | $ | 1,136 | | | $ | 1,720 | | | | 53 | | | | 11 | |
| | | |
| | | |
| | | |
| | | |
| | | |
| | | | | | | | | |
Fees and Commissions: | | | | | | | | | | | | | | | | | | | | | | | | | | | | |
| | Investment Management, Custody and Processing Services | | $ | 885 | | | $ | 863 | | | $ | 923 | | | $ | 981 | | | $ | 992 | | | | 3 | | | | (11 | ) |
| | Credit Card Revenue | | | 692 | | | | 807 | | | | 806 | | | | 669 | | | | 587 | | | | (14 | ) | | | 18 | |
| | Brokerage and Investment Services | | | 277 | | | | 273 | | | | 321 | | | | 333 | | | | 304 | | | | 1 | | | | (9 | ) |
| | Mortgage Servicing Fees, Net of Amortization, Writedowns and Derivatives Hedging | | | 90 | | | | (330 | ) | | | 323 | | | | 257 | | | | 48 | | | NM | | | 88 | |
| | Other Lending-Related Service Fees | | | 124 | | | | 160 | | | | 128 | | | | 128 | | | | 130 | | | | (23 | ) | | | (5 | ) |
| | Deposit Service Fees | | | 285 | | | | 277 | | | | 288 | | | | 273 | | | | 290 | | | | 3 | | | | (2 | ) |
| | Other Fees | | | 245 | | | | 232 | | | | 216 | | | | 244 | | | | 233 | | | | 6 | | | | 5 | |
| | | |
| | | |
| | | |
| | | |
| | | |
| | | | | | | | | |
| | Total | | $ | 2,598 | | | $ | 2,282 | | | $ | 3,005 | | | $ | 2,885 | | | $ | 2,584 | | | | 14 | | | | 1 | |
| | | |
| | | |
| | | |
| | | |
| | | |
| | | | | | | | | |
Other Revenue: | | | | | | | | | | | | | | | | | | | | | | | | | | | | |
| | Residential Mortgage Origination/Sales Activities | | $ | 378 | | | $ | 212 | | | $ | 213 | | | $ | 146 | | | $ | 100 | | | | 78 | | | | 278 | |
| | All Other Revenue | | | 103 | | | | 78 | | | | 206 | | | | 146 | | | | 57 | | | | 32 | | | | 81 | |
| | | |
| | | |
| | | |
| | | |
| | | |
| | | | | | | | | |
| | Total | | $ | 481 | | | $ | 290 | | | $ | 419 | | | $ | 292 | | | $ | 157 | | | | 66 | | | | 206 | |
| | | |
| | | |
| | | |
| | | |
| | | |
| | | | | | | | | |
NONINTEREST EXPENSE | | | | | | | | | | | | | | | | | | | | | | | | | | | | |
Other Expense: | | | | | | | | | | | | | | | | | | | | | | | | | | | | |
| Professional Services | | $ | 325 | | | $ | 378 | | | $ | 307 | | | $ | 311 | | | $ | 307 | | | | (14 | ) | | | 6 | |
| Outside Services | | | 272 | | | | 249 | | | | 256 | | | | 240 | | | | 249 | | | | 9 | | | | 9 | |
| Marketing | | | 164 | | | | 220 | | | | 179 | | | | 144 | | | | 146 | | | | (25 | ) | | | 12 | |
| Travel and Entertainment | | | 89 | | | | 96 | | | | 102 | | | | 112 | | | | 101 | | | | (7 | ) | | | (12 | ) |
| All Other | | | 310 | | | | 351 | | | | 324 | | | | 311 | | | | 405 | | | | (12 | ) | | | (23 | ) |
| | | |
| | | |
| | | |
| | | |
| | | |
| | | | | | | | | |
Total | | $ | 1,160 | | | $ | 1,294 | | | $ | 1,168 | | | $ | 1,118 | | | $ | 1,208 | | | | (10 | ) | | | (4 | ) |
| | | |
| | | |
| | | |
| | | |
| | | |
| | | | | | | | | |
| (a) | | Includes trading-related net interest income. See reconciliation from reported to operating basis on page 6. |
Page 15
| | | |
| J.P. MORGAN CHASE & CO | | |
| CONSOLIDATED BALANCE SHEET | | |
| (in millions) | | |
| | | | | | | | | | | | | | | | | | | | | | | | | | | | | | | |
| | | | | | | | | | | | | | | | | | | | | | | | | Mar 31, 2003 |
| | | | | | | | | | | | | | | | | | | | | | | | | Over (Under) |
| | | | | | | | | | | | | | | | | | | | | | | | |
|
| | | | | Mar 31 | | Dec 31 | | Sep 30 | | Jun 30 | | Mar 31 | | Dec 31 | | Mar 31 |
| | | | | 2003 | | 2002 | | 2002 | | 2002 | | 2002 | | 2002 | | 2002 |
| | | | |
| |
| |
| |
| |
| |
| |
|
ASSETS | | | | | | | | | | | | | | | | | | | | | | | | | | | | |
| Cash and Due from Banks | | $ | 22,229 | | | $ | 19,218 | | | $ | 18,159 | | | $ | 21,878 | | | $ | 22,637 | | | | 16 | % | | | (2 | )% |
| Deposits with Banks | | | 6,896 | | | | 8,942 | | | | 13,447 | | | | 10,517 | | | | 9,691 | | | | (23 | ) | | | (29 | ) |
| Federal Funds Sold and Securities Purchased under Resale Agreements | | | 69,764 | | | | 65,809 | | | | 63,748 | | | | 71,740 | | | | 76,719 | | | | 6 | | | | (9 | ) |
| Securities Borrowed | | | 39,188 | | | | 34,143 | | | | 35,283 | | | | 48,429 | | | | 40,880 | | | | 15 | | | | (4 | ) |
| Trading Assets: | | | | | | | | | | | | | | | | | | | | | | | | | | | | |
| | Debt and Equity Instruments | | | 146,783 | | | | 165,199 | | | | 151,264 | | | | 159,746 | | | | 144,992 | | | | (11 | ) | | | 1 | |
| | Derivative Receivables | | | 86,649 | | | | 83,102 | | | | 87,518 | | | | 69,858 | | | | 63,224 | | | | 4 | | | | 37 | |
| Securities | | | 85,178 | | | | 84,463 | | | | 79,768 | | | | 64,526 | | | | 61,225 | | | | 1 | | | | 39 | |
| Loans (Net of Allowance for Loan Losses) | | | 212,256 | | | | 211,014 | | | | 206,215 | | | | 207,080 | | | | 209,541 | | | | 1 | | | | 1 | |
| Private Equity Investments | | | 8,170 | | | | 8,228 | | | | 8,013 | | | | 8,229 | | | | 8,553 | | | | (1 | ) | | | (4 | ) |
| Goodwill | | | 8,122 | | | | 8,096 | | | | 8,108 | | | | 8,089 | | | | 8,055 | | | | — | | | | 1 | |
| Mortgage Servicing Rights | | | 3,235 | | | | 3,230 | | | | 3,606 | | | | 5,689 | | | | 6,918 | | | | — | | | | (53 | ) |
| Other Intangibles: | | | | | | | | | | | | | | | | | | | | | | | | | | | | |
| | Purchased Credit Card Relationships | | | 1,205 | | | | 1,269 | | | | 1,337 | | | | 1,426 | | | | 1,508 | | | | (5 | ) | | | (20 | ) |
| | All Other Intangibles | | | 294 | | | | 307 | | | | 311 | | | | 313 | | | | 327 | | | | (4 | ) | | | (10 | ) |
| Other Assets | | | 65,187 | | | | 65,780 | | | | 64,982 | | | | 63,026 | | | | 58,238 | | | | (1 | ) | | | 12 | |
| | | |
| | | |
| | | |
| | | |
| | | |
| | | | | | | | | |
TOTAL ASSETS | | $ | 755,156 | | | $ | 758,800 | | | $ | 741,759 | | | $ | 740,546 | | | $ | 712,508 | | | | — | | | | 6 | |
| | | |
| | | |
| | | |
| | | |
| | | |
| | | | | | | | | |
LIABILITIES | | | | | | | | | | | | | | | | | | | | | | | | | | | | |
| Deposits: | | | | | | | | | | | | | | | | | | | | | | | | | | | | |
| | Noninterest-Bearing | | $ | 77,822 | | | $ | 82,029 | | | $ | 74,724 | | | $ | 73,529 | | | $ | 72,659 | | | | (5 | ) | | | 7 | |
| | Interest-Bearing | | | 222,845 | | | | 222,724 | | | | 217,447 | | | | 220,300 | | | | 209,378 | | | | — | | | | 6 | |
| | | |
| | | |
| | | |
| | | |
| | | |
| | | | | | | | | |
| | | Total Deposits | | | 300,667 | | | | 304,753 | | | | 292,171 | | | | 293,829 | | | | 282,037 | | | | (1 | ) | | | 7 | |
| Federal Funds Purchased and Securities Sold under Repurchase Agreements | | | 160,221 | | | | 169,483 | | | | 154,745 | | | | 162,656 | | | | 152,837 | | | | (5 | ) | | | 5 | |
| Commercial Paper | | | 14,039 | | | | 16,591 | | | | 13,775 | | | | 14,561 | | | | 23,726 | | | | (15 | ) | | | (41 | ) |
| Other Borrowed Funds | | | 12,848 | | | | 8,946 | | | | 12,646 | | | | 17,352 | | | | 16,968 | | | | 44 | | | | (24 | ) |
| Trading Liabilities: | | | | | | | | | | | | | | | | | | | | | | | | | | | | |
| | Debt and Equity Instruments | | | 64,427 | | | | 66,864 | | | | 71,607 | | | | 67,952 | | | | 71,141 | | | | (4 | ) | | | (9 | ) |
| | Derivative Payables | | | 64,804 | | | | 66,227 | | | | 70,593 | | | | 55,575 | | | | 44,997 | | | | (2 | ) | | | 44 | |
| Accounts Payable, Accrued Expenses and Other Liabilities (including the Allowance for Lending-Related Commitments) | | | 46,776 | | | | 38,440 | | | | 38,233 | | | | 38,083 | | | | 36,910 | | | | 22 | | | | 27 | |
| Long-Term Debt | | | 42,851 | | | | 39,751 | | | | 39,113 | | | | 42,363 | | | | 37,322 | | | | 8 | | | | 15 | |
| Guaranteed Preferred Beneficial Interests in the Firm’s Junior Subordinated Deferrable Interest Debentures | | | 5,439 | | | | 5,439 | | | | 5,439 | | | | 5,439 | | | | 5,439 | | | | — | | | | — | |
| | | |
| | | |
| | | |
| | | |
| | | |
| | | | | | | | | |
TOTAL LIABILITIES | | | 712,072 | | | | 716,494 | | | | 698,322 | | | | 697,810 | | | | 671,377 | | | | (1 | ) | | | 6 | |
STOCKHOLDERS’ EQUITY | | | | | | | | | | | | | | | | | | | | | | | | | | | | |
| Preferred Stock | | | 1,009 | | | | 1,009 | | | | 1,009 | | | | 1,009 | | | | 1,009 | | | | — | | | | — | |
| Common Stock | | | 2,032 | | | | 2,024 | | | | 2,023 | | | | 2,020 | | | | 2,016 | | | | — | | | | 1 | |
| Capital Surplus | | | 12,477 | | | | 13,222 | | | | 13,113 | | | | 13,111 | | | | 12,783 | | | | (6 | ) | | | (2 | ) |
| Retained Earnings | | | 26,538 | | | | 25,851 | | | | 26,940 | | | | 27,605 | | | | 27,278 | | | | 3 | | | | (3 | ) |
| Accumulated Other Comprehensive Income (Loss) | | | 1,113 | | | | 1,227 | | | | 1,465 | | | | 79 | | | | (909 | ) | | | (9 | ) | | NM |
| Treasury Stock, at Cost | | | (85 | ) | | | (1,027 | ) | | | (1,113 | ) | | | (1,088 | ) | | | (1,046 | ) | | | 92 | | | | 92 | |
| | | |
| | | |
| | | |
| | | |
| | | |
| | | | | | | | | |
TOTAL STOCKHOLDERS’ EQUITY | | | 43,084 | | | | 42,306 | | | | 43,437 | | | | 42,736 | | | | 41,131 | | | | 2 | | | | 5 | |
| | | |
| | | |
| | | |
| | | |
| | | |
| | | | | | | | | |
TOTAL LIABILITIES AND STOCKHOLDERS’ EQUITY | | $ | 755,156 | | | $ | 758,800 | | | $ | 741,759 | | | $ | 740,546 | | | $ | 712,508 | | | | — | | | | 6 | |
| | | |
| | | |
| | | |
| | | |
| | | |
| | | | | | | | | |
Page 16
| | | |
| J.P. MORGAN CHASE & CO | | |
| CONDENSED AVERAGE BALANCE SHEET AND ANNUALIZED YIELDS | | |
| (in millions, except rates) | | |
| | | | | | | | | | | | | | | | | | | | | | | | | | | | | |
| | | | | | | | | | | | | | | | | | | | | | | 1QTR 2003 |
| | | | | | | | | | | | | | | | | | | | | | | Over (Under) |
| | | | | | | | | | | | | | | | | | | | | | |
|
| | | 1QTR | | 4QTR | | 3QTR | | 2QTR | | 1QTR | | 4Q | | 1Q |
| AVERAGE BALANCES | | 2003 | | 2002 | | 2002 | | 2002 | | 2002 | | 2002 | | 2002 |
| |
| |
| |
| |
| |
| |
| |
|
ASSETS | | | | | | | | | | | | | | | | | | | | | | | | | | | | |
| Deposits with Banks | | $ | 9,998 | | | $ | 13,074 | | | $ | 13,071 | | | $ | 9,287 | | | $ | 12,326 | | | | (24 | )% | | | (19 | )% |
| Federal Funds Sold and Securities Purchased under Resale Agreements | | | 87,657 | | | | 88,974 | | | | 83,402 | | | | 83,317 | | | | 81,004 | | | | (1 | ) | | | 8 | |
| Securities and Trading Assets | | | 246,007 | | | | 229,120 | | | | 205,232 | | | | 201,512 | | | | 180,951 | | | | 7 | | | | 36 | |
| Securities Borrowed | | | 38,654 | | | | 40,673 | | | | 41,881 | | | | 46,537 | | | | 41,739 | | | | (5 | ) | | | (7 | ) |
| Loans | | | 215,882 | | | | 211,489 | | | | 205,037 | | | | 211,495 | | | | 217,847 | | | | 2 | | | | (1 | ) |
| | | |
| | | |
| | | |
| | | |
| | | |
| | | | | | | | | |
| Total Interest-Earning Assets | | | 598,198 | | | | 583,330 | | | | 548,623 | | | | 552,148 | | | | 533,867 | | | | 3 | | | | 12 | |
| Noninterest-Earning Assets | | | 180,040 | | | | 171,836 | | | | 175,743 | | | | 182,798 | | | | 184,779 | | | | 5 | | | | (3 | ) |
| | | |
| | | |
| | | |
| | | |
| | | |
| | | | | | | | | |
TOTAL ASSETS | | $ | 778,238 | | | $ | 755,166 | | | $ | 724,366 | | | $ | 734,946 | | | $ | 718,646 | | | | 3 | | | | 8 | |
| | | |
| | | |
| | | |
| | | |
| | | |
| | | | | | | | | |
LIABILITIES | | | | | | | | | | | | | | | | | | | | | | | | | | | | |
| Interest-Bearing Deposits | | $ | 225,389 | | | $ | 215,061 | | | $ | 214,932 | | | $ | 221,687 | | | $ | 218,049 | | | | 5 | | | | 3 | |
| Federal Funds Purchased and Securities Sold under Repurchase Agreements | | | 191,163 | | | | 182,526 | | | | 170,266 | | | | 166,919 | | | | 153,662 | | | | 5 | | | | 24 | |
| Commercial Paper | | | 14,254 | | | | 13,469 | | | | 13,740 | | | | 18,514 | | | | 18,901 | | | | 6 | | | | (25 | ) |
| Other Borrowings (a) | | | 68,453 | | | | 65,591 | | | | 66,014 | | | | 78,614 | | | | 67,408 | | | | 4 | | | | 2 | |
| Long-Term Debt | | | 46,001 | | | | 44,621 | | | | 45,525 | | | | 42,482 | | | | 43,046 | | | | 3 | | | | 7 | |
| | | |
| | | |
| | | |
| | | |
| | | |
| | | | | | | | | |
| Total Interest-Bearing Liabilities | | | 545,260 | | | | 521,268 | | | | 510,477 | | | | 528,216 | | | | 501,066 | | | | 5 | | | | 9 | |
| Noninterest-Bearing Liabilities | | | 190,111 | | | | 190,919 | | | | 170,712 | | | | 164,832 | | | | 175,800 | | | | — | | | | 8 | |
| | | |
| | | |
| | | |
| | | |
| | | |
| | | | | | | | | |
TOTAL LIABILITIES | | | 735,371 | | | | 712,187 | | | | 681,189 | | | | 693,048 | | | | 676,866 | | | | 3 | | | | 9 | |
| | | |
| | | |
| | | |
| | | |
| | | |
| | | | | | | | | |
PREFERRED STOCK OF SUBSIDIARY (b) | | | — | | | | — | | | | — | | | | — | | | | 354 | | | NM | | NM |
| | | |
| | | |
| | | |
| | | |
| | | |
| | | | | | | | | |
| Preferred Stock | | | 1,009 | | | | 1,009 | | | | 1,009 | | | | 1,009 | | | | 1,009 | | | | — | | | | — | |
| Common Stockholders’ Equity | | | 41,858 | | | | 41,970 | | | | 42,168 | | | | 40,889 | | | | 40,417 | | | | — | | | | 4 | |
| | | |
| | | |
| | | |
| | | |
| | | |
| | | | | | | | | |
TOTAL STOCKHOLDERS’ EQUITY | | | 42,867 | | | | 42,979 | | | | 43,177 | | | | 41,898 | | | | 41,426 | | | | — | | | | 3 | |
| | | |
| | | |
| | | |
| | | |
| | | |
| | | | | | | | | |
TOTAL LIABILITIES, PREFERRED STOCK OF SUBSIDIARY AND STOCKHOLDERS’ EQUITY | | $ | 778,238 | | | $ | 755,166 | | | $ | 724,366 | | | $ | 734,946 | | | $ | 718,646 | | | | 3 | | | | 8 | |
| | | |
| | | |
| | | |
| | | |
| | | |
| | | | | | | | | |
AVERAGE RATES | | | | | | | | | | | | | | | | | | | | | | | | | | | | |
INTEREST-EARNING ASSETS | | | | | | | | | | | | | | | | | | | | | | | | | | | | |
| Deposits with Banks | | | 2.58 | % | | | 1.48 | % | | | 2.65 | % | | | 3.31 | % | | | 2.96 | % | | 110 bp | | (38) bp |
| Federal Funds Sold and Securities Purchased under Resale Agreements | | | 2.19 | | | | 2.33 | | | | 2.52 | | | | 2.58 | | | | 2.45 | | | | (14 | ) | | | (26 | ) |
| Securities and Trading Assets | | | 4.64 | | | | 4.62 | | | | 4.98 | | | | 5.18 | | | | 5.35 | | | | 2 | | | | (71 | ) |
| Securities Borrowed | | | 1.02 | | | | 1.42 | | | | 1.70 | | | | 1.49 | | | | 1.77 | | | | (40 | ) | | | (75 | ) |
| Loans | | | 5.32 | | | | 5.29 | | | | 5.73 | | | | 5.95 | | | | 5.87 | | | | 3 | | | | (55 | ) |
Total Interest-Earning Assets | | | 4.26 | | | | 4.22 | | | | 4.58 | | | | 4.74 | | | | 4.79 | | | | 4 | | | | (53 | ) |
INTEREST-BEARING LIABILITIES | | | | | | | | | | | | | | | | | | | | | | | | | | | | |
| Interest-Bearing Deposits | | | 1.92 | | | | 2.17 | | | | 2.62 | | | | 2.38 | | | | 2.49 | | | | (25 | ) | | | (57 | ) |
| Federal Funds Purchased and Securities Sold under Repurchase Agreements | | | 1.54 | | | | 1.71 | | | | 2.06 | | | | 2.06 | | | | 2.07 | | | | (17 | ) | | | (53 | ) |
| Commercial Paper | | | 1.30 | | | | 1.53 | | | | 1.81 | | | | 1.84 | | | | 1.76 | | | | (23 | ) | | | (46 | ) |
| Other Borrowings | | | 4.99 | | | | 4.69 | | | | 5.06 | | | | 5.24 | | | | 4.81 | | | | 30 | | | | 18 | |
| Long-Term Debt | | | 3.23 | | | | 3.68 | | | | 3.22 | | | | 3.10 | | | | 3.35 | | | | (45 | ) | | | (12 | ) |
Total Interest-Bearing Liabilities | | | 2.27 | | | | 2.44 | | | | 2.78 | | | | 2.75 | | | | 2.72 | | | | (17 | ) | | | (45 | ) |
INTEREST RATE SPREAD | | | 1.99 | % | | | 1.78 | % | | | 1.80 | % | | | 1.99 | % | | | 2.07 | % | | | 21 | | | | (8 | ) |
| | | |
| | | |
| | | |
| | | |
| | | |
| | | | | | | | | |
NET INTEREST MARGIN | | | 2.19 | % | | | 2.04 | % | | | 1.99 | % | | | 2.11 | % | | | 2.24 | % | | | 15 | | | | (5 | ) |
| | | |
| | | |
| | | |
| | | |
| | | |
| | | | | | | | | |
NET INTEREST MARGIN ADJUSTED FOR SECURITIZATIONS | | | 2.49 | % | | | 2.36 | % | | | 2.31 | % | | | 2.36 | % | | | 2.47 | % | | | 13 | | | | 2 | |
| | | |
| | | |
| | | |
| | | |
| | | |
| | | |
| | | |
| |
| (a) | | Includes securities sold but not yet purchased. |
| |
| (b) | | On February 28, 2002, all outstanding shares were redeemed. |
Page 17
| | | |
| J.P. MORGAN CHASE & CO | | |
| CREDIT-RELATED INFORMATION | | |
| (in millions, except ratios) | | |
| | | | | | | | | | | | | | | | | | | | | | | | | | | | | | |
| | | | | | | | | | | | | | | | | | | | | | | | March 31, 2003 |
| | | | | | | | | | | | | | | | | | | | | | | | Over (Under) |
| | | | | | | | | | | | | | | | | | | | | | | |
|
| | | | Mar 31 | | Dec 31 | | Sep 30 | | Jun 30 | | Mar 31 | | Dec 31 | | Mar 31 |
| CREDIT EXPOSURE | | 2003 | | 2002 | | 2002 | | 2002 | | 2002 | | 2002 | | 2002 |
| |
| |
| |
| |
| |
| |
| |
|
COMMERCIAL | | | | | | | | | | | | | | | | | | | | | | | | | | | | |
| Loans | | $ | 88,446 | | | $ | 91,548 | | | $ | 97,486 | | | $ | 104,701 | | | $ | 101,752 | | | | (3 | )% | | | (13 | )% |
| Derivative Receivables (a) | | | 86,649 | | | | 83,102 | | | | 87,518 | | | | 69,858 | | | | 63,224 | | | | 4 | | | | 37 | |
| Other Receivables (b) | | | 108 | | | | 108 | | | | 1,130 | | | | 1,130 | | | | — | | | | — | | | NM |
| | | |
| | | |
| | | |
| | | |
| | | |
| | | | | | | | | |
TOTAL COMMERCIAL CREDIT-RELATED ASSETS | | | 175,203 | | | | 174,758 | | | | 186,134 | | | | 175,689 | | | | 164,976 | | | | — | | | | 6 | |
| Lending-Related Commitments | | | 230,698 | | | | 238,120 | | | | 238,150 | | | | 239,240 | | | | 242,827 | | | | (3 | ) | | | (5 | ) |
| | | |
| | | |
| | | |
| | | |
| | | |
| | | | | | | | | |
TOTAL COMMERCIAL CREDIT EXPOSURE (c) | | | 405,901 | | | | 412,878 | | | | 424,284 | | | | 414,929 | | | | 407,803 | | | | (2 | ) | | | — | |
| | | |
| | | |
| | | |
| | | |
| | | |
| | | | | | | | | |
CONSUMER | | | | | | | | | | | | | | | | | | | | | | | | | | | | |
| 1-4 Family Residential Mortgages — First Liens | | | 51,711 | | | | 49,357 | | | | 41,934 | | | | 39,602 | | | | 42,429 | | | | 5 | | | | 22 | |
| Home Equity | | | 15,363 | | | | 14,643 | | | | 13,741 | | | | 13,067 | | | | 12,031 | | | | 5 | | | | 28 | |
| | | |
| | | |
| | | |
| | | |
| | | |
| | | | | | | | | |
| | 1-4 Family Residential Mortgages | | | 67,074 | | | | 64,000 | | | | 55,675 | | | | 52,669 | | | | 54,460 | | | | 5 | | | | 23 | |
| Credit Card — Reported (d) | | | 17,509 | | | | 19,677 | | | | 20,508 | | | | 21,036 | | | | 24,746 | | | | (11 | ) | | | (29 | ) |
| Credit Card Securitizations | | | 31,399 | | | | 30,722 | | | | 29,843 | | | | 27,499 | | | | 23,225 | | | | 2 | | | | 35 | |
| | | |
| | | |
| | | |
| | | |
| | | |
| | | | | | | | | |
| Credit Card — Managed (d) | | | 48,908 | | | | 50,399 | | | | 50,351 | | | | 48,535 | | | | 47,971 | | | | (3 | ) | | | 2 | |
| Auto Financings | | | 36,865 | | | | 33,615 | | | | 30,612 | | | | 26,666 | | | | 26,002 | | | | 10 | | | | 42 | |
| Other Consumer (e) | | | 7,577 | | | | 7,524 | | | | 7,197 | | | | 7,014 | | | | 7,586 | | | | 1 | | | | — | |
| | | |
| | | |
| | | |
| | | |
| | | |
| | | | | | | | | |
TOTAL MANAGED CONSUMER LOANS | | | 160,424 | | | | 155,538 | | | | 143,835 | | | | 134,884 | | | | 136,019 | | | | 3 | | | | 18 | |
| | | |
| | | |
| | | |
| | | |
| | | |
| | | | | | | | | |
TOTAL CREDIT PORTFOLIO | | $ | 566,325 | | | $ | 568,416 | | | $ | 568,119 | | | $ | 549,813 | | | $ | 543,822 | | | | — | | | | 4 | |
| | | |
| | | |
| | | |
| | | |
| | | |
| | | | | | | | | |
| (a) | | Includes $141 million of Enron-related surety receivables at March 31, 2003 that were the subject of settled litigation. |
| |
| (b) | | Represents at March 31, 2003 the Enron-related letter of credit, which continues to be the subject of litigation and was classified in Other Assets. |
| |
| (c) | | Credit exposure excludes risk participations and does not reflect the benefit of credit derivative hedges or liquid collateral held against derivatives contracts. |
| |
| (d) | | At March 31, 2003, excludes $978 million of accrued interest and fees on securitized credit card loans that was classified in Other Assets. |
| |
| (e) | | Consists of installment loans (direct and indirect types of consumer finance), student loans, unsecured revolving lines of credit and non-U.S. consumer loans. |
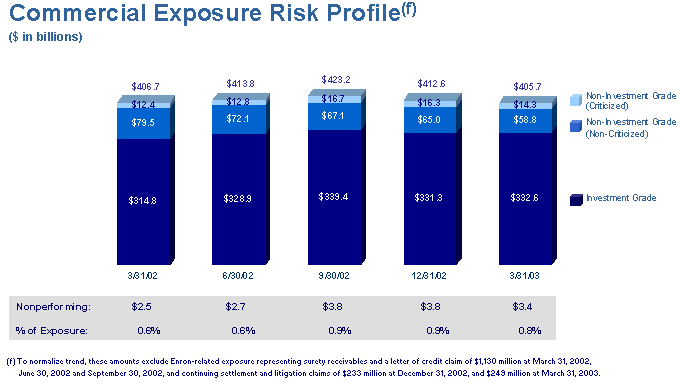
Page 18
| | | |
J.P. MORGAN CHASE & CO.
CREDIT-RELATED INFORMATION (CONT.) | | |
| (in millions, except ratios) | | |
| | | | | | | | | | | | | | | | | | | | | | | | | | | | | | |
| | | | | | | | | | | | | | | | | | | | | | | | March 31, 2003 |
| | | | | | | | | | | | | | | | | | | | | | | | Over (Under) |
| | | | | | | | | | | | | | | | | | | | | | | |
|
| | | | Mar 31 | | Dec 31 | | Sep 30 | | Jun 30 | | Mar 31 | | Dec 31 | | Mar 31 |
| | | | 2003 | | 2002 | | 2002 | | 2002 | | 2002 | | 2002 | | 2002 |
| | | |
| |
| |
| |
| |
| |
| |
|
NONPERFORMING ASSETS AND RATIOS | | | | | | | | | | | | | | | | | | | | | | | | | | | | |
COMMERCIAL | | | | | | | | | | | | | | | | | | | | | | | | | | | | |
| Loans | | $ | 3,286 | | | $ | 3,672 | | | $ | 3,596 | | | $ | 2,512 | | | $ | 2,359 | | | | (11 | )% | | | 39 | % |
| Derivative Receivables (a) | | | 277 | | | | 289 | | | | 169 | | | | 144 | | | | 1,285 | | | | (4 | ) | | | (78 | ) |
| Other Receivables (b) | | | 108 | | | | 108 | | | | 1,130 | | | | 1,130 | | | | — | | | | — | | | NM |
| | | |
| | | |
| | | |
| | | |
| | | |
| | | | | | | | | |
TOTAL COMMERCIAL CREDIT EXPOSURE | | | 3,671 | | | | 4,069 | | | | 4,895 | | | | 3,786 | | | | 3,644 | | | | (10 | ) | | | 1 | |
| | | |
| | | |
| | | |
| | | |
| | | |
| | | | | | | | | |
CONSUMER | | | | | | | | | | | | | | | | | | | | | | | | | | | | |
| 1-4 Family Residential Mortgages — First Liens | | | 249 | | | | 259 | | | | 265 | | | | 226 | | | | 297 | | | | (4 | ) | | | (16 | ) |
| Home Equity | | | 54 | | | | 53 | | | | 49 | | | | 49 | | | | 54 | | | | 2 | | | | — | |
| | | |
| | | |
| | | |
| | | |
| | | |
| | | | | | | | | |
| | 1-4 Family Residential Mortgages | | | 303 | | | | 312 | | | | 314 | | | | 275 | | | | 351 | | | | (3 | ) | | | (14 | ) |
| Credit Card — Reported | | | 14 | | | | 15 | | | | 17 | | | | 18 | | | | 19 | | | | (7 | ) | | | (26 | ) |
| Credit Card Securitizations | | | — | | | | — | | | | — | | | | — | | | | — | | | NM | | NM |
| | | |
| | | |
| | | |
| | | |
| | | |
| | | | | | | | | |
| Credit Card — Managed | | | 14 | | | | 15 | | | | 17 | | | | 18 | | | | 19 | | | | (7 | ) | | | (26 | ) |
| Auto Financings | | | 112 | | | | 118 | | | | 108 | | | | 103 | | | | 98 | | | | (5 | ) | | | 14 | |
| Other Consumer (c) | | | 66 | | | | 76 | | | | 68 | | | | 54 | | | | 66 | | | | (13 | ) | | | — | |
| | | |
| | | |
| | | |
| | | |
| | | |
| | | | | | | | | |
TOTAL MANAGED CONSUMER LOANS | | | 495 | | | | 521 | | | | 507 | | | | 450 | | | | 534 | | | | (5 | ) | | | (7 | ) |
| | | |
| | | |
| | | |
| | | |
| | | |
| | | | | | | | | |
| Assets Acquired in Loan Satisfactions | | | 225 | | | | 190 | | | | 140 | | | | 142 | | | | 130 | | | | 18 | | | | 73 | |
| | | |
| | | |
| | | |
| | | |
| | | |
| | | | | | | | | |
TOTAL CREDIT PORTFOLIO (d) | | $ | 4,391 | | | $ | 4,780 | | | $ | 5,542 | | | $ | 4,378 | | | $ | 4,308 | | | | (8 | ) | | | 2 | |
| | | |
| | | |
| | | |
| | | |
| | | |
| | | | | | | | | |
TOTAL NONPERFORMING ASSETS TO TOTAL ASSETS | | | 0.58 | % | | | 0.63 | % | | | 0.75 | % | | | 0.59 | % | | | 0.60 | % | | (5)bp | | (2)bp |
| | | |
| | | |
| | | |
| | | |
| | | |
| | | | | | | | | |
PAST DUE 90 DAYS AND OVER AND ACCRUING | | | | | | | | | | | | | | | | | | | | | | | | | | | | |
COMMERCIAL | | | | | | | | | | | | | | | | | | | | | | | | | | | | |
| Loans | | $ | 39 | | | $ | 57 | | | $ | 33 | | | $ | 31 | | | $ | 52 | | | | (32 | )% | | | (25 | )% |
| Derivative Receivables | | | — | | | | — | | | | — | | | | — | | | | — | | | NM | | NM |
| | | |
| | | |
| | | |
| | | |
| | | |
| | | | | | | | | |
TOTAL COMMERCIAL CREDIT EXPOSURE | | | 39 | | | | 57 | | | | 33 | | | | 31 | | | | 52 | | | | (32 | ) | | | (25 | ) |
| | | |
| | | |
| | | |
| | | |
| | | |
| | | | | | | | | |
CONSUMER | | | | | | | | | | | | | | | | | | | | | | | | | | | | |
| 1-4 Family Residential Mortgages — First Liens | | | — | | | | — | | | | 1 | | | | — | | | | — | | | NM | | NM |
| Home Equity | | | — | | | | — | | | | — | | | | — | | | | — | | | NM | | NM |
| | | |
| | | |
| | | |
| | | |
| | | |
| | | | | | | | | |
| | 1-4 Family Residential Mortgages | | | — | | | | — | | | | 1 | | | | — | | | | — | | | NM | | NM |
| Credit Card — Reported (e) | | | 269 | | | | 451 | | | | 447 | | | | 505 | | | | 619 | | | | (40 | ) | | | (57 | ) |
| Credit Card Securitizations | | | 664 | | | | 630 | | | | 526 | | | | 457 | | | | 478 | | | | 5 | | | | 39 | |
| | | |
| | | |
| | | |
| | | |
| | | |
| | | | | | | | | |
| Credit Card — Managed (e) | | | 933 | | | | 1,081 | | | | 973 | | | | 962 | | | | 1,097 | | | | (14 | ) | | | (15 | ) |
| Auto Financings | | | — | | | | — | | | | — | | | | — | | | | — | | | NM | | NM |
| Other Consumer (c) | | | 22 | | | | 22 | | | | 26 | | | | 37 | | | | 45 | | | | — | | | | (51 | ) |
| | | |
| | | |
| | | |
| | | |
| | | |
| | | | | | | | | |
TOTAL MANAGED CONSUMER LOANS | | | 955 | | | | 1,103 | | | | 1,000 | | | | 999 | | | | 1,142 | | | | (13 | ) | | | (16 | ) |
| | | |
| | | |
| | | |
| | | |
| | | |
| | | | | | | | | |
TOTAL CREDIT PORTFOLIO | | $ | 994 | | | $ | 1,160 | | | $ | 1,033 | | | $ | 1,030 | | | $ | 1,194 | | | | (14 | ) | | | (17 | ) |
| | | |
| | | |
| | | |
| | | |
| | | |
| | | | | | | | | |
| (a) | | Includes $141 million of Enron-related surety receivables at March 31, 2003 that were the subject of settled litigation. |
| |
| (b) | | Represents at March 31, 2003 the Enron-related letter of credit, which continues to be the subject of litigation and was classified in Other Assets. |
| |
| (c) | | Consists of installment loans (direct and indirect types of consumer finance), student loans, unsecured revolving lines of credit and non-U.S. consumer loans. |
| |
| (d) | | Nonperforming assets at March 31, 2003 have not been reduced for credit protection (single name credit default swaps and collateralized loan obligations) relating to nonperforming counterparties in amounts aggregating $50 million at March 31, 2003. Nonperforming assets exclude nonaccrual loans held for sale (“HFS”) of $58 million at March 31, 2003. HFS loans are carried at the lower of cost or market, and declines in value are recorded in Other Revenue. |
| |
| (e) | | At March 31, 2003, excludes $144 million of accrued interest and fees on securitized credit card loans past due 90 days and over and accruing that was classified in Other Assets. |
Page 19
| | | |
J.P. MORGAN CHASE & CO.
CREDIT-RELATED INFORMATION (CONT.) | | |
| (in millions, except ratios) | | |
| | | | | | | | | | | | | | | | | | | | | | | | | | | | | | |
| | | | | | | | | | | | | | | | | | | | | | | | 1QTR 2003 |
| | | | 1QTR | | 4QTR | | 3QTR | | 2QTR | | 1QTR | | Over (Under) |
| | | | 2003 | | 2002 | | 2002 | | 2002 | | 2002 | | 4Q 2002 | | 1Q 2002 |
| | | |
| |
| |
| |
| |
| |
| |
|
NET CHARGE-OFFS | | | | | | | | | | | | | | | | | | | | | | | | | | | | |
COMMERCIAL | | | | | | | | | | | | | | | | | | | | | | | | | | | | |
| Loans | | $ | 292 | | | $ | 434 | | | $ | 834 | | | $ | 293 | | | $ | 320 | | | | (33 | )% | | | (9 | )% |
| Lending-Related Commitments | | | — | | | | 212 | | | | — | | | | — | | | | — | | | NM | | NM |
| | | |
| | | |
| | | |
| | | |
| | | |
| | | |
TOTAL COMMERCIAL CREDIT EXPOSURE | | | 292 | | | | 646 | | | | 834 | | | | 293 | | | | 320 | | | | (55 | ) | | | (9 | ) |
| | | |
| | | |
| | | |
| | | |
| | | |
| | | |
CONSUMER | | | | | | | | | | | | | | | | | | | | | | | | | | | | |
| 1-4 Family Residential Mortgages — First Liens | | | 5 | | | | 11 | | | | 6 | | | | 21 | | | | 11 | | | | (55 | ) | | | (55 | ) |
| Home Equity | | | 2 | | | | 4 | | | | 1 | | | | — | | | | 2 | | | | (50 | ) | | | — | |
| | | |
| | | |
| | | |
| | | |
| | | |
| | | |
| | 1-4 Family Residential Mortgages | | | 7 | | | | 15 | | | | 7 | | | | 21 | | | | 13 | | | | (53 | ) | | | (46 | ) |
| Credit Card — Reported | | | 275 | | | | 286 | | | | 333 | | | | 433 | | | | 337 | | | | (4 | ) | | | (18 | ) |
| Credit Card Securitizations | | | 457 | | | | 430 | | | | 354 | | | | 334 | | | | 321 | | | | 6 | | | | 42 | |
| | | |
| | | |
| | | |
| | | |
| | | |
| | | |
| Credit Card — Managed | | | 732 | | | | 716 | | | | 687 | | | | 767 | | | | 658 | | | | 2 | | | | 11 | |
| Auto Financings | | | 46 | | | | 47 | | | | 47 | | | | 29 | | | | 38 | | | | (2 | ) | | | 21 | |
| Other Consumer (a) | | | 50 | | | | 54 | | | | 45 | | | | 45 | | | | 45 | | | | (7 | ) | | | 11 | |
| | | |
| | | |
| | | |
| | | |
| | | |
| | | |
TOTAL MANAGED CONSUMER LOANS | | | 835 | | | | 832 | | | | 786 | | | | 862 | | | | 754 | | | | — | | | | 11 | |
| | | |
| | | |
| | | |
| | | |
| | | |
| | | |
TOTAL CREDIT PORTFOLIO | | $ | 1,127 | | | $ | 1,478 | | | $ | 1,620 | | | $ | 1,155 | | | $ | 1,074 | | | | (24 | ) | | | 5 | |
| | | |
| | | |
| | | |
| | | |
| | | |
| | | |
NET CHARGE-OFF RATES — ANNUALIZED COMMERCIAL | | | | | | | | | | | | | | | | | | | | | | | | | | | | |
| Loans | | | 1.32 | % | | | 1.88 | % | | | 3.53 | % | | | 1.17 | % | | | 1.27 | % | | (56)bp | | 5bp |
| Lending-Related Commitments | | | — | | | | 0.35 | | | | — | | | | — | | | | — | | | | (35 | ) | | | — | |
TOTAL COMMERCIAL CREDIT EXPOSURE | | | 0.37 | | | | 0.78 | | | | 1.00 | | | | 0.34 | | | | 0.37 | | | | (41 | ) | | | — | |
CONSUMER | | | | | | | | | | | | | | | | | | | | | | | | | | | | |
| 1-4 Family Residential Mortgages — First Liens | | | 0.04 | | | | 0.09 | | | | 0.06 | | | | 0.20 | | | | 0.10 | | | | (5 | ) | | | (6 | ) |
| Home Equity | | | 0.05 | | | | 0.11 | | | | 0.03 | | | | — | | | | 0.07 | | | | (6 | ) | | | (2 | ) |
| | 1-4 Family Residential Mortgages | | | 0.04 | | | | 0.10 | | | | 0.05 | | | | 0.16 | | | | 0.09 | | | | (6 | ) | | | (5 | ) |
| Credit Card — Reported | | | 6.17 | | | | 5.90 | | | | 6.27 | | | | 7.67 | | | | 5.78 | | | | 27 | | | | 39 | |
| Credit Card Securitizations | | | 5.82 | | | | 5.58 | | | | 4.95 | | | | 5.30 | | | | 5.98 | | | | 24 | | | | (16 | ) |
| Credit Card — Managed | | | 5.95 | | | | 5.70 | | | | 5.51 | | | | 6.42 | | | | 5.87 | | | | 25 | | | | 8 | |
| Auto Financings | | | 0.53 | | | | 0.58 | | | | 0.64 | | | | 0.43 | | | | 0.58 | | | | (5 | ) | | | (5 | ) |
| Other Consumer (a) | | | 2.54 | | | | 2.77 | | | | 2.53 | | | | 2.35 | | | | 2.16 | | | | (23 | ) | | | 38 | |
TOTAL MANAGED CONSUMER LOANS | | | 2.14 | | | | 2.20 | | | | 2.23 | | | | 2.53 | | | | 2.22 | | | | (6 | ) | | | (8 | ) |
TOTAL CREDIT PORTFOLIO | | | 0.95 | | | | 1.22 | | | | 1.36 | | | | 0.97 | | | | 0.90 | | | | (27 | ) | | | 5 | |
| (a) | | Consists of installment loans (direct and indirect types of consumer finance), student loans, unsecured revolving lines of credit and non-U.S. consumer loans. |
Page 20
| | | |
J.P. MORGAN CHASE & CO.
CREDIT-RELATED INFORMATION (CONT.) | | |
| (in millions, except ratios) | | |
| | | | | | | | | | | | | | | | | | | | | | | | | | | | | | |
| | | | | | | | | | | | | | | | | | | | | | | | 1QTR 2003 |
| | | | 1QTR | | 4QTR | | 3QTR | | 2QTR | | 1QTR | | Over (Under) |
| | | | 2003 | | 2002 | | 2002 | | 2002 | | 2002 | | 4Q 2002 | | 1Q 2002 |
| | | |
| |
| |
| |
| |
| |
| |
|
SUMMARY OF CHANGES IN THE ALLOWANCE | | | | | | | | | | | | | | | | | | | | | | | | | | | | |
LOANS: | | | | | | | | | | | | | | | | | | | | | | | | | | | | |
| Beginning Balance | | $ | 5,350 | | | $ | 5,263 | | | $ | 5,006 | | | $ | 5,005 | | | $ | 4,524 | | | | 2 | % | | | 18 | % |
| | Net Charge-Offs | | | (670 | ) | | | (836 | ) | | | (1,266 | ) | | | (821 | ) | | | (753 | ) | | | (20 | ) | | | (11 | ) |
| | Provision for Loan Losses | | | 670 | | | | 921 | | | | 1,544 | | | | 821 | | | | 753 | | | | (27 | ) | | | (11 | ) |
| | Other | | | (135 | ) | | | 2 | | | | (21 | ) | | | 1 | | | | 481 | | | NM | | NM |
| | | |
| | | |
| | | |
| | | |
| | | |
| | | |
Ending Balance | | $ | 5,215 | | | $ | 5,350 | | | $ | 5,263 | | | $ | 5,006 | | | $ | 5,005 | | | | (3 | ) | | | 4 | |
| | | |
| | | |
| | | |
| | | |
| | | |
| | | |
LENDING-RELATED COMMITMENTS: | | | | | | | | | | | | | | | | | | | | | | | | | | | | |
| Beginning Balance | | $ | 363 | | | $ | 573 | | | $ | 281 | | | $ | 281 | | | $ | 282 | | | | (37 | ) | | | 29 | |
| | Net Charge-Offs | | | — | | | | (212 | ) | | | — | | | | — | | | | — | | | NM | | NM |
| | Provision for Lending-Related Commitments | | | 73 | | | | — | | | | 292 | | | | — | | | | — | | | NM | | NM |
| | Other | | | — | | | | 2 | | | | — | | | | — | | | | (1 | ) | | NM | | NM |
| | | |
| | | |
| | | |
| | | |
| | | |
| | | |
Ending Balance | | $ | 436 | | | $ | 363 | | | $ | 573 | | | $ | 281 | | | $ | 281 | | | | 20 | | | | 55 | |
| | | |
| | | |
| | | |
| | | |
| | | |
| | | |
ALLOWANCE COMPONENTS AND RATIOS | | | | | | | | | | | | | | | | | | | | | | | | | | | | |
LOANS: | | | | | | | | | | | | | | | | | | | | | | | | | | | | |
| Commercial — Specific | | $ | 1,528 | | | $ | 1,603 | | | $ | 1,525 | | | $ | 1,212 | | | $ | 1,163 | | | | (5 | )% | | | 31 | % |
| Commercial — Expected | | | 590 | | | | 613 | | | | 554 | | | | 594 | | | | 635 | | | | (4 | ) | | | (7 | ) |
| | | |
| | | |
| | | |
| | | |
| | | |
| | | |
| | Total Commercial | | | 2,118 | | | | 2,216 | | | | 2,079 | | | | 1,806 | | | | 1,798 | | | | (4 | ) | | | 18 | |
| Consumer Expected | | | 2,255 | | | | 2,360 | | | | 2,365 | | | | 2,387 | | | | 2,518 | | | | (4 | ) | | | (10 | ) |
| | | |
| | | |
| | | |
| | | |
| | | |
| | | |
| | Total Specific and Expected | | | 4,373 | | | | 4,576 | | | | 4,444 | | | | 4,193 | | | | 4,316 | | | | (4 | ) | | | 1 | |
| Residual Component | | | 842 | | | | 774 | | | | 819 | | | | 813 | | | | 689 | | | | 9 | | | | 22 | |
| | | |
| | | |
| | | |
| | | |
| | | |
| | | |
| | Total Allowance for Loans Losses | | $ | 5,215 | | | $ | 5,350 | | | $ | 5,263 | | | $ | 5,006 | | | $ | 5,005 | | | | (3 | ) | | | 4 | |
| | | |
| | | |
| | | |
| | | |
| | | |
| | | |
LENDING-RELATED COMMITMENTS: | | | | | | | | | | | | | | | | | | | | | | | | | | | | |
| Commercial — Specific | | $ | 305 | | | $ | 237 | | | $ | 426 | | | $ | 165 | | | $ | 165 | | | | 29 | | | | 85 | |
| Commercial — Expected | | | 84 | | | | 87 | | | | 83 | | | | 78 | | | | 79 | | | | (3 | ) | | | 6 | |
| | | |
| | | |
| | | |
| | | |
| | | |
| | | |
| | Total Specific and Expected | | | 389 | | | | 324 | | | | 509 | | | | 243 | | | | 244 | | | | 20 | | | | 59 | |
| Residual Component | | | 47 | | | | 39 | | | | 64 | | | | 38 | | | | 37 | | | | 21 | | | | 27 | |
| | | |
| | | |
| | | |
| | | |
| | | |
| | | |
Total Allowance for Lending-Related Commitments | | $ | 436 | | | $ | 363 | | | $ | 573 | | | $ | 281 | | | $ | 281 | | | | 20 | | | | 55 | |
| | | |
| | | |
| | | |
| | | |
| | | |
| | | |
| Allowance for Loan Losses to Total Loans | | | 2.40 | % | | | 2.47 | % | | | 2.49 | % | | | 2.36 | % | | | 2.33 | % | | (7)bp | | 7bp |
| Allowance for Loan Losses to Total Nonperforming Loans | | | 138 | | | | 128 | | | | 128 | | | | 169 | | | | 173 | | | | 1,000 | | | | (3,500 | ) |
| Allowance for Loan Losses to Total Nonperforming Assets | | | 119 | | | | 112 | | | | 95 | | | | 114 | | | | 116 | | | | 700 | | | | 300 | |
CREDIT COSTS | | | | | | | | | | | | | | | | | | | | | | | | | | | | |
| Loans: | | | | | | | | | | | | | | | | | | | | | | | | | | | | |
| | Commercial | | $ | 194 | | | $ | 526 | | | $ | 1,107 | | | $ | 344 | | | $ | 394 | | | | (63 | )% | | | (51 | )% |
| | Consumer | | | 411 | | | | 395 | | | | 438 | | | | 391 | | | | 365 | | | | 4 | | | | 13 | |
| | | |
| | | |
| | | |
| | | |
| | | |
| | | |
Total Specific and Expected | | | 605 | | | | 921 | | | | 1,545 | | | | 735 | | | | 759 | | | | (34 | ) | | | (20 | ) |
| | Residual Component | | | 65 | | | | — | | | | (1 | ) | | | 86 | | | | (6 | ) | | NM | | NM |
| | | |
| | | |
| | | |
| | | |
| | | |
| | | |
Total Provision for Loan Losses | | | 670 | | | | 921 | | | | 1,544 | | | | 821 | | | | 753 | | | | (27 | ) | | | (11 | ) |
| | | |
| | | |
| | | |
| | | |
| | | |
| | | |
| Lending-Related Commitments: | | | | | | | | | | | | | | | | | | | | | | | | | | | | |
| | Commercial | | | 65 | | | | 25 | | | | 266 | | | | (1 | ) | | | 19 | | | | 160 | | | | 242 | |
| | Residual Component | | | 8 | | | | (25 | ) | | | 26 | | | | 1 | | | | (19 | ) | | NM | | NM |
| | | |
| | | |
| | | |
| | | |
| | | |
| | | |
Total Provision for Lending-Related Commitments | | | 73 | | | | — | | | | 292 | | | | — | | | | — | | | NM | | NM |
| | | |
| | | |
| | | |
| | | |
| | | |
| | | |
Securitized Credit Losses | | | 457 | | | | 430 | | | | 354 | | | | 334 | | | | 321 | | | | 6 | | | | 42 | |
| | | |
| | | |
| | | |
| | | |
| | | |
| | | |
Total Managed Credit Costs | | $ | 1,200 | | | $ | 1,351 | | | $ | 2,190 | | | $ | 1,155 | | | $ | 1,074 | | | | (11 | ) | | | 12 | |
| | | |
| | | |
| | | |
| | | |
| | | |
| | | |
Page 21
| | | |
J.P. MORGAN CHASE & CO.
CREDIT-RELATED INFORMATION (CONT.)
| | |
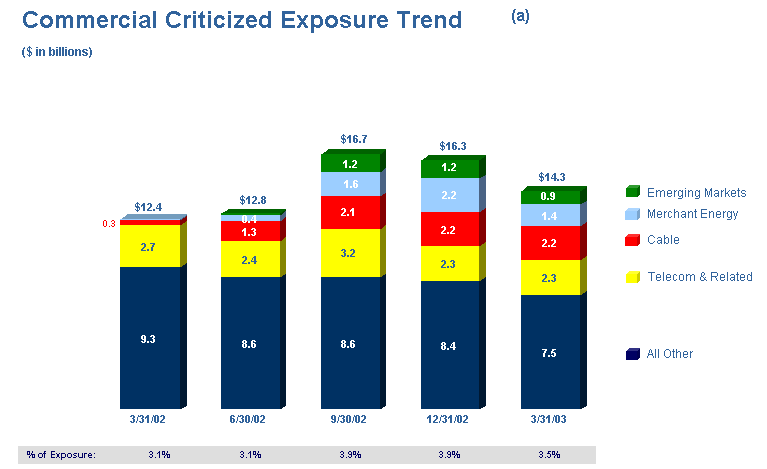
| (a) | | To normalize trend, these amounts exclude Enron-related exposure representing surety receivables and a letter of credit claim of $1,130 million at March 31, 2002, June 30, 2002 and September 30, 2002, and continuing settlement and litigation claims of $233 million at December 31, 2002, and $249 million at March 31, 2003. |
Page 22
| | | |
J.P. MORGAN CHASE & CO.
CREDIT-RELATED INFORMATION (CONT.)
| | |
| (in millions, except ratios) | | |
| | | | | | | | | | | | | | | | | | | | | | | | | | | | | | | | | | | | | | | | | | | | | | | | | | |
| | | | Mar 31 | | Dec 31 | | Sep 30 | | Jun 30 | | Mar 31 | | Mar 31, 2003 |
| | | | 2003 | | 2002 | | 2002 | | 2002 | | 2002 | | Over (Under) |
| | | |
| |
| |
| |
| |
| |
| |
| | | | $ | | % | | $ | | % | | $ | | % | | $ | | % | | $ | | % | | Dec 31
2002 | | | Mar 31
2002 |
| | | |
| |
| |
| |
| |
| |
| |
| |
| |
| |
| |
| |
|
TELECOM AND RELATED INDUSTRIES (a) | | | | | | | | | | | | | | | | | | | | | | | | | | | | | | | | | | | | | | | | | | | | | | | | |
| Credit Exposure (b) | | $ | 16,739 | | | | 100 | % | | $ | 16,770 | | | | 100 | % | | $ | 18,208 | | | | 100 | % | | $ | 19,973 | | | | 100 | % | | $ | 19,888 | | | | 100 | % | | | — | % | | | (16 | )% |
| | | |
| | | |
| | | |
| | | |
| | | |
| | | |
| | | |
| | | |
| | | |
| | | |
| | | |
| Risk Profile of Credit Exposure: | | | | | | | | | | | | | | | | | | | | | | | | | | | | | | | | | | | | | | | | | | | | | | | | |
| Investment-Grade | | | 11,061 | | | | 66 | % | | | 9,376 | | | | 56 | % | | | 10,107 | | | | 56 | % | | | 11,677 | | | | 58 | % | | | 11,233 | | | | 57 | % | | | 18 | | | | (2 | ) |
| Noninvestment-Grade: | | | | | | | | | | | | | | | | | | | | | | | | | | | | | | | | | | | | | | | | | | | | | | | | |
| | Noncriticized | | | 3,381 | | | | 20 | % | | | 5,076 | | | | 30 | % | | | 4,928 | | | | 27 | % | | | 5,865 | | | | 29 | % | | | 5,965 | | | | 30 | % | | | (33 | ) | | | (43 | ) |
| | Criticized Performing | | | 1,756 | | | | 11 | % | | | 1,487 | | | | 9 | % | | | 2,421 | | | | 13 | % | | | 2,116 | | | | 11 | % | | | 2,439 | | | | 12 | % | | | 18 | | | | (28 | ) |
| | Criticized Nonperforming (c) | | | 541 | | | | 3 | % | | | 831 | | | | 5 | % | | | 752 | | | | 4 | % | | | 315 | | | | 2 | % | | | 251 | | | | 1 | % | | | (35 | ) | | | 116 | |
CABLE INDUSTRY | | | | | | | | | | | | | | | | | | | | | | | | | | | | | | | | | | | | | | | | | | | | | | | | |
| Credit Exposure (b) | | $ | 5,312 | | | | 100 | % | | $ | 5,982 | | | | 100 | % | | $ | 5,427 | | | | 100 | % | | $ | 4,556 | | | | 100 | % | | $ | 4,590 | | | | 100 | % | | | (11 | ) | | | 16 | |
| | | |
| | | |
| | | |
| | | |
| | | |
| | | |
| | | |
| | | |
| | | |
| | | |
| | | |
| Risk Profile of Credit Exposure: | | | | | | | | | | | | | | | | | | | | | | | | | | | | | | | | | | | | | | | | | | | | | | | | |
| Investment-Grade | | | 2,112 | | | | 40 | % | | | 2,681 | | | | 45 | % | | | 1,913 | | | | 35 | % | | | 1,371 | | | | 30 | % | | | 1,519 | | | | 33 | % | | | (21 | ) | | | 39 | |
| Noninvestment-Grade: | | | | | | | | | | | | | | | | | | | | | | | | | | | | | | | | | | | | | | | | | | | | | | | | |
| | Noncriticized | | | 977 | | | | 18 | % | | | 1,096 | | | | 18 | % | | | 1,385 | | | | 26 | % | | | 1,878 | | | | 41 | % | | | 2,777 | | | | 61 | % | | | (11 | ) | | | (65 | ) |
| | Criticized Performing | | | 1,717 | | | | 32 | % | | | 1,673 | | | | 28 | % | | | 1,735 | | | | 32 | % | | | 1,209 | | | | 27 | % | | | 259 | | | | 5 | % | | | 3 | | | NM |
| | Criticized Nonperforming (c) | | | 506 | | | | 10 | % | | | 532 | | | | 9 | % | | | 394 | | | | 7 | % | | | 98 | | | | 2 | % | | | 35 | | | | 1 | % | | | (5 | ) | | NM |
MERCHANT ENERGY AND RELATED INDUSTRIES (d) | | | | | | | | | | | | | | | | | | | | | | | | | | | | | | | | | | | | | | | | | | | | | | | | |
| Credit Exposure (b) | | $ | 6,170 | | �� | | 100 | % | | $ | 6,230 | | | | 100 | % | | $ | 6,241 | | | | 100 | % | | $ | 6,201 | | | | 100 | % | | $ | 6,945 | | | | 100 | % | | | (1 | ) | | | (11 | ) |
| | | |
| | | |
| | | |
| | | |
| | | |
| | | |
| | | |
| | | |
| | | |
| | | |
| | | |
| Risk Profile of Credit Exposure: | | | | | | | | | | | | | | | | | | | | | | | | | | | | | | | | | | | | | | | | | | | | | | | | |
| Investment-Grade | | | 3,744 | | | | 61 | % | | | 3,580 | | | | 57 | % | | | 3,470 | | | | 56 | % | | | 3,682 | | | | 59 | % | | | 5,203 | | | | 75 | % | | | 5 | | | | (28 | ) |
| Noninvestment-Grade: | | | | | | | | | | | | | | | | | | | | | | | | | | | | | | | | | | | | | | | | | | | | | | | | |
| | Noncriticized | | | 1,066 | | | | 17 | % | | | 423 | | | | 7 | % | | | 1,196 | | | | 19 | % | | | 2,141 | | | | 35 | % | | | 1,649 | | | | 24 | % | | | 152 | | | | (35 | ) |
| | Criticized Performing | | | 1,156 | | | | 19 | % | | | 1,849 | | | | 30 | % | | | 1,405 | | | | 22 | % | | | 358 | | | | 6 | % | | | 72 | | | | 1 | % | | | (37 | ) | | NM |
| | Criticized Nonperforming (c) | | | 204 | | | | 3 | % | | | 378 | | | | 6 | % | | | 170 | | | | 3 | % | | | 20 | | | | 0 | % | | | 21 | | | | 0 | % | | | (46 | ) | | NM |
| Note: | | The risk profile is based on JPMorgan Chase’s internal risk ratings, which generally correspond to the following ratings as defined by Standard & Poor’s / Moody’s:
Investment Grade: AAA / Aaa to BBB- / Baa3
Noninvestment Grade: BB+ / Ba1 to B- / B3
Criticized: CCC+ / Caa1 & below |
| |
| (a) | | Telecom and Related Industries includes other companies with an interdependence upon the telecommunications sector. |
| |
| (b) | | Credit exposure excludes risk participations and does not reflect the benefit of credit derivative hedges or liquid collateral held against derivatives contracts. |
| |
| (c) | | Nonperforming assets exclude nonaccrual HFS loans, which are carried at the lower of cost or market and declines in value are recorded in Other Revenue. |
| |
| (d) | | These amounts exclude Enron-related exposure. |
Page 23
| | | |
J.P. MORGAN CHASE & CO.
CAPITAL | | |
| | | | | | | | | | | | | | | | | | | | | | | | | | | | | | | | | | |
| | | | | | | | | | | | | | | | | | | | | | | | | | | | 1QTR 2003 |
| | | | | | | | | | | | | | | | | | | | | | | | | | | | Over (Under) |
| | | | 1QTR | | | | | | 4QTR | | 3QTR | | 2QTR | | 1QTR | |
|
| | | | 2003 | | | | | | 2002 | | 2002 | | 2002 | | 2002 | | 4Q 2002 | | 1Q 2002 |
| | | |
| | | | | |
| |
| |
| |
| |
| |
|
SOURCES AND USES OF TIER 1 CAPITAL | | | | | | | | | | | | | | | | | | | | | | | | | | | | | | | | |
(in billions) | | | | | | | | | | | | | | | | | | | | | | | | | | | | | | | | |
Sources of Free Cash Flow | | | | | | | | | | | | | | | | | | | | | | | | | | | | | | | | |
| | Operating Earnings Less Dividends | | $ | 0.7 | | | | (a | ) | | $ | — | | | $ | (0.4 | ) | | $ | 0.5 | | | $ | 0.5 | | | NM | | | 40 | % |
| | Preferred Stock and Equivalents/Other Items | | | — | | | | (a | ) | | | (1.2 | ) | | | (0.1 | ) | | | (0.5 | ) | | | 0.2 | | | NM | | NM |
| | Capital for Internal Asset Growth | | | (0.3 | ) | | | (a | ) | | | (1.3 | ) | | | (0.1 | ) | | | 0.6 | | | | 0.5 | | | | 77 | % | | NM |
| | | | |
| | | | | | | |
| | | |
| | | |
| | | |
| | | | | | | | | |
Total Sources of Free Cash Flow | | $ | 0.4 | | | | | | | $ | (2.5 | ) | | $ | (0.6 | ) | | $ | 0.6 | | | $ | 1.2 | | | NM | | | (67 | ) |
| | | | |
| | | | | | | |
| | | |
| | | |
| | | |
| | | | | | | | | |
Uses of Free Cash Flow | | | | | | | | | | | | | | | | | | | | | | | | | | | | | | | | |
| | Increases (Decreases) in Capital Ratios | | $ | 0.6 | | | | (a | ) | | $ | (2.3 | ) | | $ | (0.6 | ) | | $ | 0.9 | | | $ | 1.4 | | | NM | | | (57 | ) |
| | Acquisitions | | | — | | | | (a | ) | | | — | | | | — | | | | — | | | | — | | | NM | | NM |
| | Repurchases Net of Stock Issuances | | | (0.2 | ) | | | (a | ) | | | (0.2 | ) | | | — | | | | (0.3 | ) | | | (0.2 | ) | | | — | | | | — | |
| | | | |
| | | | | | | |
| | | |
| | | |
| | | |
| | | | | | | | | |
Total Uses of Free Cash Flow | | $ | 0.4 | | | | | | | $ | (2.5 | ) | | $ | (0.6 | ) | | $ | 0.6 | | | $ | 1.2 | | | NM | | | (67 | ) |
| | | | |
| | | | | | | |
| | | |
| | | |
| | | |
| | | | | | | | | |
COMMON SHARES OUTSTANDING | | | | | | | | | | | | | | | | | | | | | | | | | | | | | | | | |
(in millions) | | | | | | | | | | | | | | | | | | | | | | | | | | | | | | | | |
| | Basic Weighted-Average Shares Outstanding | | | 1,999.8 | | | | | | | | 1,990.0 | | | | 1,986.0 | | | | 1,982.6 | | | | 1,978.2 | | | | — | | | | 1 | |
| | Diluted Weighted-Average Shares Outstanding | | | 2,021.9 | | | | | | | | 2,008.5 | | | | 2,005.8 | | | | 2,016.0 | | | | 2,005.8 | | | | 1 | | | | 1 | |
| | Common Shares Outstanding — at Period End | | | 2,030.0 | | | | | | | | 1,998.7 | | | | 1,995.9 | | | | 1,993.4 | | | | 1,990.2 | | | | 2 | | | | 2 | |
| | CASH DIVIDENDS DECLARED PER SHARE | | $ | 0.34 | | | | | | | $ | 0.34 | | | $ | 0.34 | | | $ | 0.34 | | | $ | 0.34 | | | | — | | | | — | |
| | BOOK VALUE PER SHARE | | | 20.73 | | | | | | | | 20.66 | | | | 21.26 | | | | 20.93 | | | | 20.16 | | | | — | | | | 3 | |
SHARE PRICE | | | | | | | | | | | | | | | | | | | | | | | | | | | | | | | | |
| | High | | $ | 28.29 | | | | | | | $ | 26.14 | | | $ | 33.68 | | | $ | 38.75 | | | $ | 39.68 | | | | 8 | | | | (29 | ) |
| | Low | | | 20.13 | | | | | | | | 15.26 | | | | 17.86 | | | | 30.15 | | | | 26.70 | | | | 32 | | | | (25 | ) |
| | Close | | | 23.71 | | | | | | | | 24.00 | | | | 18.99 | | | | 33.92 | | | | 35.65 | | | | (1 | ) | | | (33 | ) |
CAPITAL RATIOS | | | | | | | | | | | | | | | | | | | | | | | | | | | | | | | | |
| Tier I Capital Ratio | | | 8.4 | % | | | (a | ) | | | 8.2 | % | | | 8.7 | % | | | 8.8 | % | | | 8.6 | % | | 20bp | | (20)bp |
| Total Capital Ratio | | | 12.1 | | | | (a | ) | | | 12.0 | | | | 12.4 | | | | 12.7 | | | | 12.5 | | | | 10 | | | | (40 | ) |
| Tier I Leverage Ratio | | | 5.0 | | | | (a | ) | | | 5.1 | | | | 5.4 | | | | 5.4 | | | | 5.4 | | | | (10 | ) | | | (40 | ) |
Page 24
| | | |
J.P. MORGAN CHASE & CO.
Glossary of Terms | | |
Assets Under Management:Represent assets actively managed by Investment Management & Private Banking on behalf of institutional and Private Banking clients. Excludes assets managed at American Century Companies Inc., in which the Firm has a 45% ownership interest.
Assets Under Supervision:Represent assets under management as well as custody, restricted stock, brokerage, administration and deposit accounts.
Average Managed Assets:Excludes the impact of credit card securitizations.
bp:Denotes basis points; 100 bp equals 1%.
Corporate:Includes Support Units and the effect remaining at the corporate level after the implementation of management accounting policies.
JPMorgan Partners (“JPMP”):JPMorgan Chase’s private equity business. The fair value of public investments held by JPMP are marked-to-market at the quoted public value. To determine the carrying values of these investments, JPMP incorporates the use of liquidity discounts to take into account the fact that it cannot immediately realize or hedge the quoted public values as a result of regulatory, corporate and/or contractual sales restrictions imposed on these holdings. Private investments are initially valued based on cost. The carrying values of private investments are adjusted from cost to reflect both positive and negative changes evidenced by financing events with third-party capital providers. In addition, these investments are subject to ongoing impairment reviews by JPMP’s senior investment professionals. A variety of factors are reviewed and monitored to assess impairment including, but not limited to, operating performance and future expectations, comparable industry valuations of public companies, changes in market outlook and changes in the third-party financing environment.
Managed Credit Card Receivables or Managed Basis:Refer to the credit card receivables on JPMorgan Chase’s balance sheet plus securitized credit card receivables.
NM:Not meaningful
Operating Basis or Operating Earnings:Represents reported results excluding the impact of merger and restructuring costs, special items and credit card securitizations.
Other Consumer Loans:Consists of installment loans (direct and indirect types of consumer finance), student loans, unsecured lines of credit and non-U.S. consumer.
Overhead Ratio:Operating expense (excluding merger and restructuring costs and special items) as a percentage of the operating revenues.
Reported Basis:Financial statements prepared under generally accepted accounting principles. The reported basis includes the impact of credit card securitizations, merger and restructuring costs and special items.
Return on Tangible Common Equity:Excludes the impact of goodwill on operating earnings and average common equity.
Segment Results —All periods are on a comparable basis, although restatements may occur in future periods to reflect further alignment of management accounting policies or changes in organizational structures between businesses.
Shareholder Value Added (“SVA”):Represents operating earnings less preferred dividends and an explicit charge for capital.
Special Items:Includes merger and restructuring costs and special items.
Tangible Common Equity:Excludes the impact of goodwill.
Tangible Shareholder Value Added:Excludes the impact of goodwill on operating earnings and capital charges.
Trading-Related Revenue: Includes net interest income (“NII”) attributable to trading activities.
Unaudited:The financial statements and information included throughout this document are unaudited.
Page 25