 June 1, 2009 J P M O R G A N C H A S E & C O . JPMorgan Chase & Co. has filed a registration statement (including a prospectus) with the SEC for the offering to which this communication relates. Before you invest, you should read the prospectus in that registration statement and other documents JPMorgan Chase & Co. has filed with the SEC for more complete information about JPMorgan Chase & Co. and this offering. You may get these documents for free by visiting EDGAR on the SEC web site at www.sec.gov. Alternatively, JPMorgan Chase & Co. or J.P. Morgan Securities Inc. will arrange to send to you the prospectus if you request it by calling toll-free 1-866-430-0686. Exhibit 99.2 |
 Issuer: JPMorgan Chase & Co. Ticker / Listing: JPM / NYSE Offering size: $5.0 billion of common stock Overallotment option: 15% Share composition: 100% primary shares Stock price (as of May 29, 2009): $36.90 Shares outstanding — pre-offer (as of April 30, 2009): 3,759,160,375 Market cap (as of May 29, 2009): $138.7 billion Lock-up agreement: 90 days (Company, Directors and Executive Officers) Sole manager: J.P. Morgan Use of proceeds: General corporate purposes Anticipated pricing: June 2, 2009 (before market open) Equity offering overview 1 Key terms of the equity offering |
 Rationale for equity issuance JPM is raising $5B in common equity to satisfy a supervisory condition for redemption of all preferred capital issued to the U.S. Treasury under the Troubled Asset Relief Program (TARP) We believe all other requirements for repayment have been met JPM will fully redeem the $25B of TARP preferred capital before the end of June, upon receipt of approval 2 |
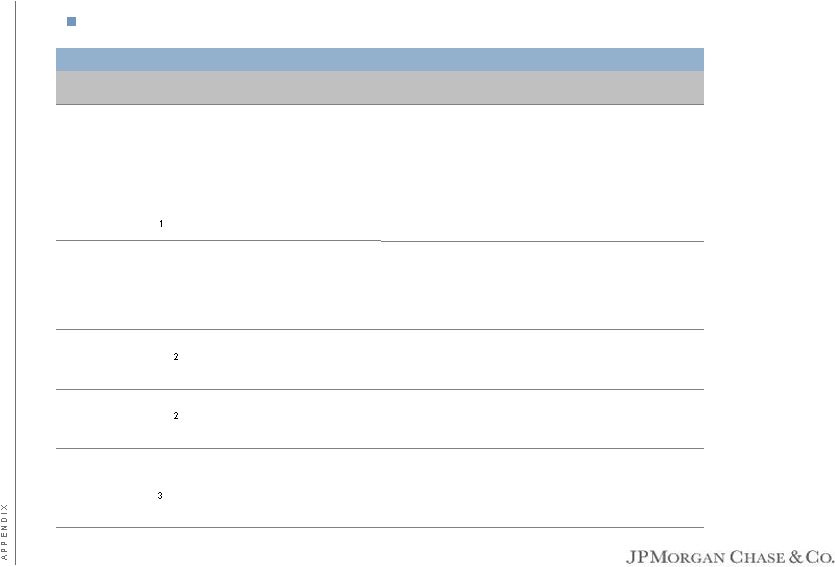
 JPM capital position remains strong Following the capital raise and TARP preferred capital repayment, JPM expects to have a Tier 1 ratio of 9.3% and a Tier 1 Common ratio of 7.3% at 6/30/09 JPM anticipates maintaining approximately similar capital levels even in a two-year highly stressed environment JPM actual and anticipated capital position ($ in billions) 1 Estimated for 6/30/09 includes capital raise and TARP preferred shares repayment 3 Actual Anticipated As of 3/31/09 as of 6/30/09 1 Tier 1 Capital (ex. TARP) $112 $118 Tier 1 Common Capital 88 93 Tier 1 Ratio (ex. TARP) 9.3 % 9.3 % Tier 1 Common Ratio 7.3 7.3 1 |
 2Q09 outlook Current outlook remains the same as most recent guidance issued on May 27, 2009 (see Appendix), key highlights include: Credit costs will remain high across all lending businesses (IB, RFS, Card, CB); quarterly loss outlooks for RFS and Card (Chase and WaMu) loan portfolios remain unchanged Quarterly revenue outlooks for CB, TSS, AM remain unchanged Expect trading volatility in the IB and the investment portfolio in Corporate One-time items remain unchanged (MSR 1Q results not likely to repeat; FDIC special assessment of $700mm-$750mm in 2Q) 4 |
 Agenda Page 5 Appendix 5 |
 Earnings power of franchise and fortress balance sheet position JPM well for the future Each standalone business has a top 1, 2, or 3 position Leadership positions — very difficult to replicate Significant market share and efficiency gains in each business Continued investment across LOBs drives organic growth Businesses operate stronger together than apart Creates additional revenue opportunities in each business 1 Resources to absorb losses include pre-provision net revenue less the change in the allowance for losses on loans and leases 2 Excludes the impact of purchased credit-impaired loans acquired as part of the WaMu transaction Solid earnings power helps counter impact of economic environment: JPM estimates $80B of Resources Other Than Capital to Absorb Losses 1 for ‘09-‘10 under Supervisory Capital Assessment Program (SCAP) More Adverse scenario; positions JPM to withstand tough environment On-going, but heightened operating discipline on expense, balance sheet, etc. 1Q09 Tier 1 ratio ex. TARP of 9.3%, Tier 1 Common ratio of 7.3% and Tier 1 Common Capital of $88B $28B in allowance for credit losses as of 3/31/09; firmwide loan loss coverage ratio of 4.53% 2 6 Excellent Franchises Solid Earnings Power Fortress Balance Sheet |
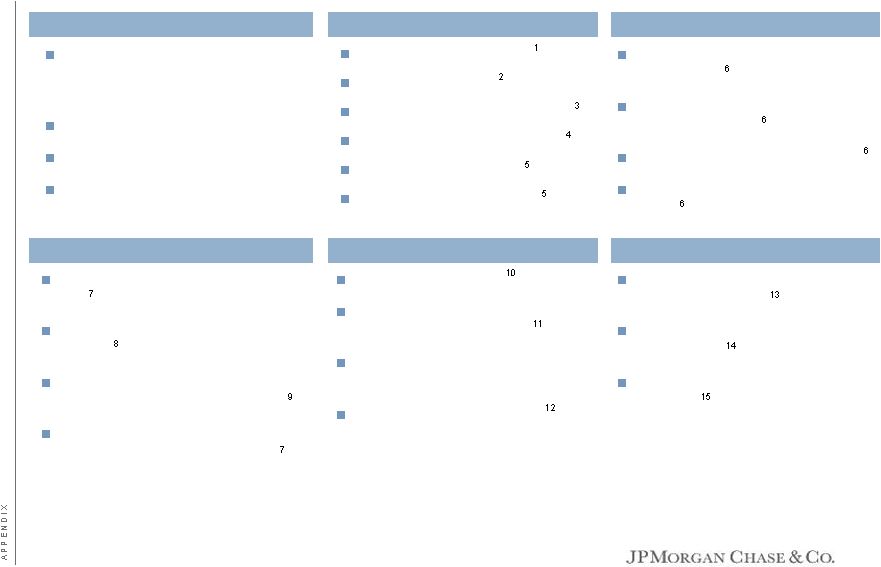 The firm’s world-class franchises are market leaders Investment Bank Retail Financial Services Card Services Commercial Banking Treasury & Securities Services Asset Management Continue to rank #1 in two capital raising league tables for 1Q09 YTD per Thomson Reuters Global Debt, Equity & Equity-related Global Equity & Equity-related Ranked #1 in Global Fees for 1Q09 with 8.3% market share per Dealogic #1 U.S. Credit Card Issuer (by outstandings) #2 U.S. Merchant Acquirer (by acquiring volumes) #1 U.S. Visa Issuer (by # of cards) #1 U.S. MasterCard Issuer (by # of cards) #2 Large Middle-market lender in U.S. #1 originator of multi-family loans in the U.S. Among top 3 banks nationally in market penetration and lead share #1 ranking in market penetration and lead share in 3 of the top 4 MSAs Largest manager of AAA-rated global liquidity funds One of the largest managers of Hedge Funds 42% of customer assets in 4 & 5 star funds #1 in ACH Originations #1 in U.S. Dollar Treasury Clearing and Commercial Payments A global leader in assets under custody ($13.5T) Named top Global Custodian #3 in deposit market share #3 in branch network #1 in Auto Finance (non-captive) #2 in Home Equity Originations #3 in Mortgage Servicing #3 in Mortgage Originations 1 Source: SNL Corporation; market share data as of June 2008, updated for subsequent acquisitions for all banks through March 2009. Includes deposits in domestic offices (50 states and D.C.), Puerto Rico and U.S. Territories only and non-retail branches are not included 2 Source: 1Q09 company reports 3 Source: Autocount (franchise), March 2009 4 Source: National Mortgage News, 4Q08 5 Source: Inside Mortgage Finance, 1Q09 6 Source: Nilson Reports. Merchant Acquirer data adjusted for dissolution of First Data JV 7 Loan Pricing Corporation, 1Q09 8 FDIC and OTS as of 12/31/08 9 TNS Market Study, FY08 10 Ernst & Young 11 FLmetrix 12 AsianInvestor, Global Pensions, International Custody & Fund Administration (ICFA), The Asset 13 iMoneyNet, December 2008 14 Absolute Return Magazine, March 2009 issue (data as of year-end 2008) 15 Derived from Morningstar for the U.S.; Micropal for the UK, Luxembourg, Hong Kong, & Taiwan; & Nomura for Japan 7 |
 Consistently investing in revenue growth 1 Actual numbers for all periods, not % change YoY 2 Includes deposits and deposits swept to on-balance sheet liabilities 3 Reflects the transfer in 2007 of held-for-investment prime mortgage loans from AM to Corporate within the Corporate/Private Equity segment Good underlying momentum in core business drivers propelling organic growth across businesses Growth drivers - % change YoY 8 1Q09 4Q08 3Q08 2Q08 1Q08 Retail Financial Services Retail Banking Average Deposits 62% 63% 2% 3% 4% # of ATMs 53% 59% 61% 8% 8% # of Branches 65% 74% 75% 2% 2% # of Branch Bankers & Sales Specialists 50% 56% 58% 9% 21% Credit Cards Originated in Branches 50% 56% 6% 4% 18% Deposit margin 2.85% 2.94% 3.06% 2.88% 2.64% Card Services (excl. WaMu) Average Outstandings 1% 5% 6% 4% 3% Charge Volume (16%) (8%) 5% 6% 5% Sales Volume (9%) (4%) 5% 7% 10% # of New accts opened (36%) (25%) (8%) (3%) - Commercial Banking Liability Balances 16% 18% 13% 18% 22% Average Loans 67% 80% 18% 19% 18% Treasury & Securities Services Liability Balances 9% 34% 10% 23% 21% Assets under Custody (14%) (17%) (8%) 2% 7% Asset Management Assets under Management (6%) (5%) (1%) 7% 13% Average Loans (6%) 13% 29% 37% 43% Deposits 20% 19% 10% 25% 24% |
 1Q09 Managed results $ in millions 1 Managed basis presents revenue and credit costs without the effect of credit card securitizations. Revenue is on a fully taxable-equivalent (FTE) basis. All references to credit costs refer to managed provision for credit losses. See notes 2 and 3 on slide 14 2 Merger-related items relate to the Bear Stearns and WaMu transactions 3 Actual numbers for all periods, not over/under 4 See note 1 on slide 14 9 1Q09 4Q08 1Q08 Results excl. Merger-related items 2 Revenue (FTE) 1 $27,062 $7,740 $9,164 Credit Costs 1 10,060 1,477 4,955 Expense 13,136 2,129 4,205 Merger-related items 2 (after-tax) (234) (1,298) (234) Reported Net Income $2,141 $1,439 ($232) Reported EPS $0.40 $0.34 ($0.27) ROE 3 5% 1% 8% ROE Net of GW 3 7% 1% 12% ROTCE 3,4 8% 1% 13% $ O/(U) |
  1Q09 4Q08 1Q08 Investment Bank $1,606 $3,970 $1,693 Retail Financial Services 474 (150) 785 Card Services (547) (176) (1,156) Commercial Banking 338 (142) 46 Treasury & Securities Services 308 (225) (95) Asset Management 224 (31) (132) Corporate (262) (1,807) (1,373) Net Income $2,141 $1,439 ($232) $ O/(U) 1Q09 Managed line of business results 1 Managed basis presents revenue and credit costs without the effect of credit card securitizations. Revenue is on a fully taxable-equivalent (FTE) basis. All references to credit costs refer to managed provision for credit losses. See notes 2 and 3 on slide 14 10 $ in millions |
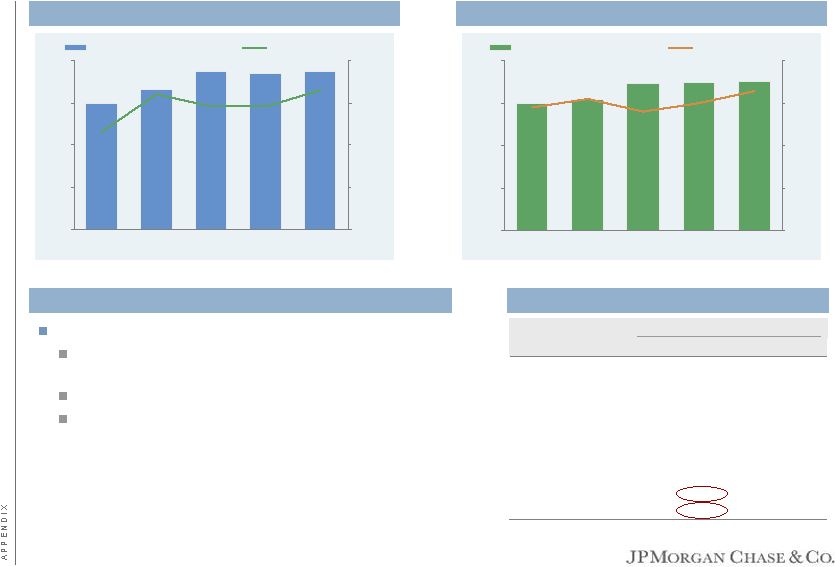 $112 $90 $99 $112 $111 8.3% 8.9% 9.3% 8.9% 9.2% $0 $30 $60 $90 $120 1Q08 2Q08 3Q08 4Q08 1Q09 6.0% 7.0% 8.0% 9.0% 10.0% Tier 1 Capital ex. TARP Tier 1 Ratio ex. TARP Fortress balance sheet strengthened further in 1Q09 Tier 1 ratio (ex. TARP) of 9.3% and Tier 1 Common ratio of 7.3% as of 3/31/09 Strong reserve coverage ratios compared to peers Strong liquidity and funding position with total deposits to loans of 128% as of 3/31/09 – Total deposits of $907B across retail and wholesale businesses – Deposits and liability balances provide a stable and consistent source of funding Fortress balance sheet $75 $77 $86 $88 $87 7.0% 7.3% 7.1% 6.9% 6.8% $0 $25 $50 $75 $100 1Q08 2Q08 3Q08 4Q08 1Q09 4.0% 5.0% 6.0% 7.0% 8.0% Tier 1 Common Capital Tier 1 Common Ratio Tier 1 Capital ex. TARP ($ in billions) Tier 1 Common ($ in billions) Reserve coverage ratios vs. peers Note: Reserve coverage ratios exclude the impact of purchased credit-impaired loans acquired as part of the WaMu transaction. If these loans were included, the loan loss reserve ratio at 1Q09 would have been 3.95% 1 Peer average reflects equivalent metrics for key competitors. Consumer and Firmwide peers are defined as C, BAC and WFC. Wholesale peers are defined as C and BAC Key points 11 1Q09 JPM Peer Avg. 1 Consumer LLR/Total Loans 5.20% 3.46 % LLR/NPLs 252% 173% Wholesale LLR/Total Loans 3.43% 2.81 % LLR/NPLs 219% 75% Firmwide LLR/Total Loans 4.53% 3.08 % LLR/NPLs 241% 138% |
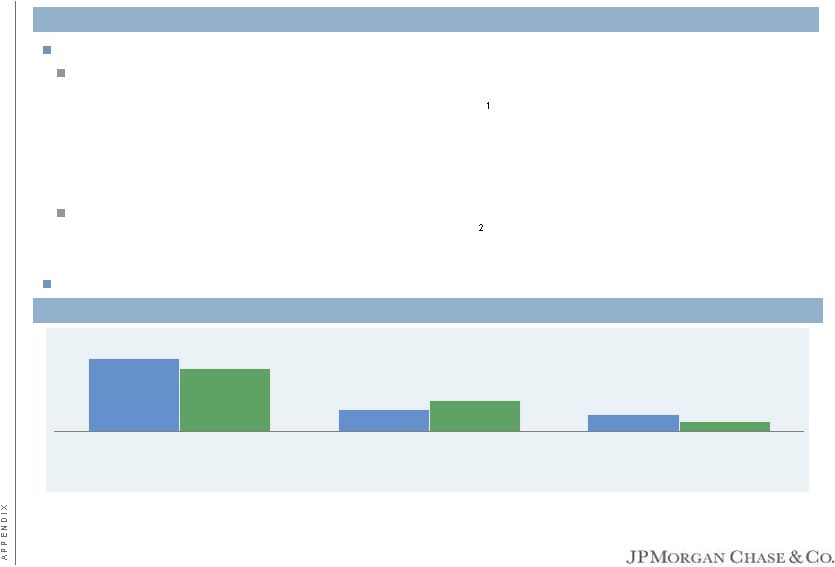 JPM remains committed to safe and sound lending JPM extended more than $150B in new loans and lines to retail and wholesale clients during 1Q09, including: $62B in consumer and small business originations. JPM extended over 4.5mm new loans and lines to consumers and small businesses – More than 2mm new credit card lines and 2mm line increases – 185,000 new mortgages (including refinancings) and home equity loans and lines – Almost 400,000 auto and education loans – Consumer lending is up 2% from 4Q08 with declines in credit card originations offset by growth in mortgage, auto and student lending ~$95B in new and renewed commitments to mid-sized businesses, large corporates and JPM’s full range of Treasury & Securities Services and Asset Management clients – Wholesale lending is down about 15% from 4Q08 due to lower customer demand JPM also purchased over $34B of mortgage-backed and asset-backed securities in 1Q09 Lending update 1 Card figures are US only 2 1Q09 wholesale gross new exposure includes $0.9B Held-For-Sale/Fair Value loans $34 $26 $46 $16 ~$110 ~$95 Wholesale gross new exposure Consumer (excl. Card) and small bus. loan orig. Card gross new exposure $ in billions 1 4Q08 1Q09 4Q08 1Q09 4Q08 1Q09 12 |
 Outlook Private Equity At current market levels, expect modest possible write- downs over near term Corporate More sizable investment portfolio; higher net interest income, some trading volatility At current market levels, quarterly revenue of $1.8B +/- is a reasonable run rate for the near term Trading can be volatile; DVA expected to be negative Uncertain environment, risks still remain Credit costs expected to remain elevated Current revenue level is a reasonable expectation Higher credit costs expected Revenue of $2.0B +/- for next couple of quarters driven by lower assets under custody and lower liability balances and spreads Home lending quarterly losses (incl. WaMu) over the next several quarters could be as high as: Home equity – $1.4B Prime mortgage – $500mm Subprime mortgage – $375mm-$475mm Solid underlying growth in Consumer Banking Strong 1Q09 MSR risk management results – not likely to be repeated Special FDIC assessment of $700mm to $750mm (pretax) to be finalized and assessed in 2Q09 If economy weakens further, additional reserving actions may be required Chase losses will approach 9% +/- next quarter; could trend up further depending on unemployment in 2009 WaMu losses to approach 18-24% by end of 2009 Lower charge volume 13 Investment Bank Retail Financial Services Card Services Commercial Banking Treasury & Securities Services Asset Management Corporate/Private Equity Overall |
 This presentation includes non-GAAP financial measures 1. Tangible Common Equity ("TCE") is calculated, for all purposes, as common stockholders equity (i.e., total stockholders' equity less preferred stock) less identifiable intangible assets (other than MSRs) and goodwill, net of related deferred tax liabilities. TCE is, in management's view, a meaningful measure of capital quality. The TCE measures used in this presentation are not necessarily comparable to similarly titled measures provided by other firms due to differences in calculation methodologies. 2. Financial results are presented on a managed basis, as such basis is described in the firm’s Quarterly Report on Form 10-Q for the quarter ended March 31, 2009 and Annual Report on Form 10-K for the year ended December 31, 2008. 3. All non-GAAP financial measures included in this presentation are provided to assist readers in understanding certain trend information. Additional information concerning such non-GAAP financial measures can be found in the above-referenced filings, to which reference is hereby made. Notes on non-GAAP financial measures and forward-looking statements 14 Forward looking statements This presentation contains forward-looking statements within the meaning of the Private Securities Litigation Reform Act of 1995. Such statements are based upon the current beliefs and expectations of JPMorgan Chase’s management and are subject to significant risks and uncertainties. Actual results may differ from those set forth in the forward-looking statements. Factors that could cause JPMorgan Chase’s actual results to differ materially from those described in the forward-looking statements can be found in JPMorgan Chase’s Quarterly Report on Form 10-Q for the quarter ended March 31, 2009 and its Annual Report on Form 10-K for the year ended December 31, 2008, each of which has been filed with the Securities and Exchange Commission and is available on JPMorgan Chase’s website (www.jpmorganchase.com) and on the Securities and Exchange Commission’s website (1www.sec.gov1). JPMorgan Chase does not undertake to update the forward-looking statements to reflect the impact of circumstances or events that may arise after the date of the forward-looking statements. |