united states
securities and exchange commission
washington, d.c. 20549
form n-csr
certified shareholder report of registered management
investment companies
Investment Company Act file number 811-22655
Grandeur Peak Global Trust
(Exact name of registrant as specified in charter)
225 Pictoria Drive, Suite 450, Cincinnati, OH 45246
(Address of principal executive offices) (Zip code)
The Corporation Trust Company
1209 Orange Street, Wilmington, DE 19801
(Name and address of agent for service)
Registrant's telephone number, including area code: (631) 490-4300
Date of fiscal year end: 3/31
Date of reporting period: 10/31/23
Item 1. Reports to Stockholders.

TABLE OF CONTENTS
| Shareholder Letter | 1 |
| Performance Update | 13 |
| Disclosure of Fund Expenses | 43 |
| Portfolio of Investments | |
| Grandeur Peak Emerging Markets Opportunities Fund | 45 |
| Grandeur Peak Global Contrarian Fund | 48 |
| Grandeur Peak Global Explorer Fund | 51 |
| Grandeur Peak Global Micro Cap Fund | 56 |
| Grandeur Peak Global Opportunities Fund | 59 |
| Grandeur Peak Global Reach Fund | 62 |
| Grandeur Peak Global Stalwarts Fund | 67 |
| Grandeur Peak International Opportunities Fund | 70 |
| Grandeur Peak International Stalwarts Fund | 74 |
| Grandeur Peak US Stalwarts Fund | 77 |
| Statements of Assets and Liabilities | 79 |
| Statements of Operations | 81 |
| Statement of Changes in Net Assets | |
| Grandeur Peak Emerging Markets Opportunities Fund | 83 |
| Grandeur Peak Global Contrarian Fund | 84 |
| Grandeur Peak Global Explorer Fund | 85 |
| Grandeur Peak Global Micro Cap Fund | 86 |
| Grandeur Peak Global Opportunities Fund | 87 |
| Grandeur Peak Global Reach Fund | 88 |
| Grandeur Peak Global Stalwarts Fund | 89 |
| Grandeur Peak International Opportunities Fund | 90 |
| Grandeur Peak International Stalwarts Fund | 91 |
| Grandeur Peak US Stalwarts Fund | 92 |
| Financial Highlights | |
| Grandeur Peak Emerging Markets Opportunities Fund | 93 |
| Grandeur Peak Global Contrarian Fund | 95 |
| Grandeur Peak Global Explorer Fund | 96 |
| Grandeur Peak Global Micro Cap Fund | 97 |
| Grandeur Peak Global Opportunities Fund | 98 |
| Grandeur Peak Global Reach Fund | 100 |
| Grandeur Peak Global Stalwarts Fund | 102 |
| Grandeur Peak International Opportunities Fund | 104 |
| Grandeur Peak International Stalwarts Fund | 106 |
| Grandeur Peak US Stalwarts Fund | 108 |
| Notes to Financial Statements | 109 |
| Disclosure Regarding Approval of Fund Advisory Agreement | 124 |
| Privacy Policy | 130 |
| Grandeur Peak Funds® | Shareholder Letter |
| October 31, 2023 (Unaudited) |
Dear Fellow Shareholders,
High-Level Thoughts
| ● | Interest rates have been near a two-decade high, and the market is forecasting rates to remain high for an extended period. |
| ● | Global debt levels have reached a record high, increasing over $50 trillion in the past three years alone. |
| ● | High-quality companies (i.e., companies with high Return on Assets (ROA)1 and low leverage) have outperformed the broader market consistently over time. |
| ● | Historically, the outperformance of high-quality companies over the broader market has been prominent during periods when interest rates are relatively high. |
| ● | The Grandeur portfolios have significantly better fundamentals than their respective benchmarks. |
The Burger Bill Comes Due
E.C. Segar’s early 20th century comic strip, Popeye the Sailor, features a character named J. Wellington Wimpy. Wimpy, as he is known, is a stout man with a serious hamburger addiction and no money. As a result, he is commonly found trying to entice others into buying him a hamburger today for payment on Tuesday. Fortunately for Wimpy, “Tuesday”, or the day of repayment never comes thus allowing him to run up what seems like an endless burger tab.
Segar leaves readers with many questions when it comes to Wimpy and his “pull forward” burger consumption tactics. For example, what are the financing terms of Wimpy’s arrangement? Surely, his cost of burger capital isn’t free. His credit worthiness must be abysmal. How do his lenders get comfortable with extending his credit line to consume more burgers when he already has a lot of burger leverage on his balance sheet? We must assume that at some point Wimpy’s burger bill will come due. When it does, it won’t be pretty for him or his creditors. He will have to do a burger detox and find another, less expensive, source of sustenance. Perhaps a steady diet of spinach is in Wimpy’s future?
Over the past 15 years, many of the world’s largest central banks have implemented monetary policies that have kept the cost of capital exceptionally low. These policies have incentivized governments, corporations, and households to employ a “buy now, pay later” consumption strategy that would give even someone like Wimpy great pause. As of June 30, 2023, the Institute of International Finance reported that total global debt was $307 trillion dollars, an increase of 19.36% or $53 trillion dollars in the past 3 years alone2.
| 1 | Return on Assets (ROA) is a measure of how efficiently a company uses its assets to generate a profit and is calculated by dividing company’s net income by total assets. |
| 2 | Institute of International Finance, Global Debt, 6/30/2023 |
1
| Grandeur Peak Funds® | Shareholder Letter |
| October 31, 2023 (Unaudited) |
FIGURE 1
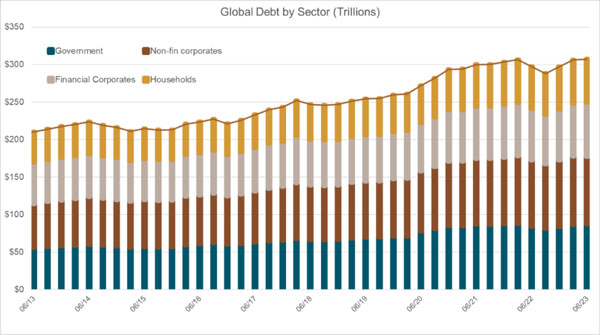
Low interest rates combined with the aggressive stimulus pumped into the global economy by many fiscal and monetary policy makers at the onset of Covid resulted in a meaningful inflation increase that did not recede nearly as much as was initially expected. This prompted policy makers to rapidly increase interest rates to stem the inflationary pressures. Interest rates have now reached two-decade highs in many economies3.
| 3 | Bank for International Settlements, GDP Policy rate calculated using country/region central bank policy rates and multiplying by their share of GDP. |
2
| Grandeur Peak Funds® | Shareholder Letter |
| October 31, 2023 (Unaudited) |
FIGURE 2
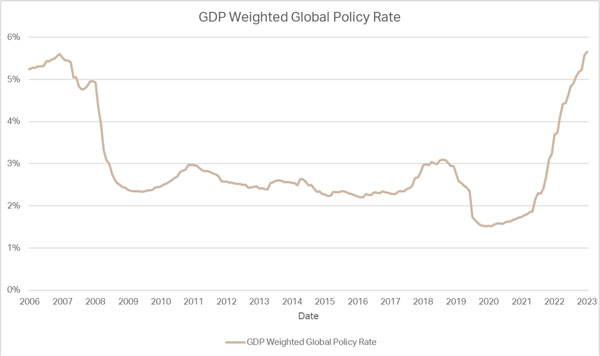
While inflationary pressures have abated somewhat, inflation continues to trend well above central bank targets. As a result, consensus expectations are that short-term lending rates will stay elevated for an extended period. If they do remain high, it will present serious long-term problems for borrowers at every level that have large outstanding “burger bills”. When their bills come due, and some already have, the consequences will likely be much more severe than Wimpy’s burger detox.
Historically, high-quality companies, those with attributes such as high return on assets (ROA) and lower leverage, have significantly outperformed in markets where the cost of capital is high. Why? Because companies with high leverage experience a material increase in debt service costs which erodes company earnings. Furthermore, companies with lower ROAs that finance growth with debt are less incentivized to do so, which can also negatively impact earnings growth potential and ultimately stock price performance.
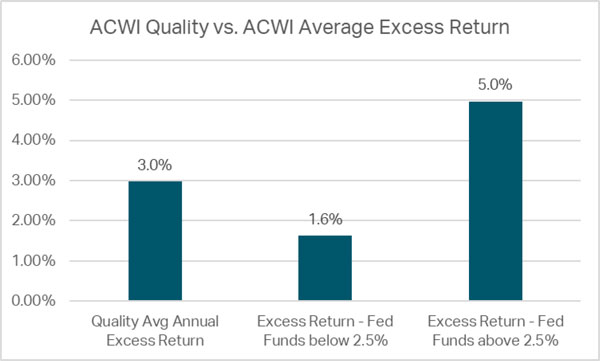
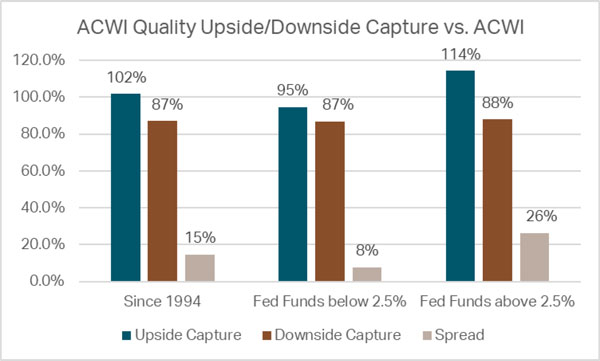
As illustrated in Figure 3 below, high-quality stocks, represented by the ACWI Quality index, have consistently outperformed the broad market over time. However, the level of outperformance has been three times higher during periods when the cost of capital is high, defined here as periods where the Fed Fund’s rate exceeds 2.5%4.
| 4 | MSCI, 6/30/94 – 9/30/23 |
3
| Grandeur Peak Funds® | Shareholder Letter |
| October 31, 2023 (Unaudited) |
FIGURE 3
As seen in Figure 4, when interest rates are low, high-quality stocks realize or “capture” an average of 95% of the broader market’s monthly return when the return is positive. When the broader market’s monthly return is negative, high-quality stocks capture an average of 87% of the return. The differential between the upside capture percentage and the downside capture percentage, or the spread, is favorable at +8% when interest rates are low.
On the other hand, when interest rates are high, high-quality stocks capture an average of 114% of the market’s monthly return when it is positive and 88% when it is negative. So, the spread increases to +26%, a much more favorable outcome, with high-quality stocks capturing +19% more market upside without really sacrificing their lower downside capture5.
| 5 | MSCI, 6/30/94 – 9/30/23 |
4
| Grandeur Peak Funds® | Shareholder Letter |
| October 31, 2023 (Unaudited) |
FIGURE 4
The sizable increase observed historically in the upside/downside capture spread when interest rates are high suggests that balance sheet fundamentals matter much more in high-rate environments. During these periods, it is not nearly as easy for companies with lower returns on assets, which rely on debt financing, to grow their earnings. Put differently, when rates are high, the size of a company’s burger tab and its reliance on debt to sustain its burger habit (i.e., growth plan) are much more significant factors in its future success. As a result, lower quality companies can’t keep up with more fundamentally stable, high-quality companies and high-quality companies tend to outperform.
As the market adapts to a “higher for longer” interest rate environment, where the cost of borrowed capital is no longer cheap, there will be much more performance dispersion across markets. Sound fundamentals will likely be a more significant determinant of success than they have been in the “lower for longer” interest rate world we have invested in over most of the past 15 years. As a result, we believe actively managed, fundamentally driven investment strategies, such as the Grandeur Peak portfolios, should have a clear advantage over strategies that disregard the fundamentals.
5
| Grandeur Peak Funds® | Shareholder Letter |
| October 31, 2023 (Unaudited) |
Portfolio Thoughts
| ● | Quality: We believe our portfolios are sound, on an absolute and relative basis. Technical market turbulence continues to offer us opportunities to gain exposure to high-quality companies that have historically been too expensive to own. |
| ● | Value: Despite disappointing 2022 and YTD price performance, our portfolios’ captured earnings growth continues to be resilient. |
| ● | Momentum: Business momentum within our portfolios has slowed but not as much as the broader market and global economy. Our portfolios’ earnings growth has been positive year-to-date, in contrast to the MSCI ACWI Small Index, where earnings have fallen 10% over the same period. We expect momentum for our portfolio companies to pick up in 2024. |
| ● | Given our high-quality bias, we are positioned for a return to quality growth being rewarded, but we also believe our portfolios should perform well on a relative basis should we realize a pronounced slowdown in global economic growth. |
QUALITY
As illustrated in Figure 5, our portfolios consistently display stronger fundamentals than their respective benchmarks, namely higher ROA and lower debt. Last year’s sell-off in quality stocks allowed us to upgrade our portfolios’ overall quality. This has resulted in a more concentrated portfolio, with increased exposure to higher conviction names. In addition, we have been able to add some stocks on our “Watch-A” list to the portfolio. These are stocks with very high quality that we felt were previously too expensive to buy.
6
| Grandeur Peak Funds® | Shareholder Letter |
| October 31, 2023 (Unaudited) |
| FIGURE 5 | ||
| RETURN | DEBT / | |
| ON | EQUITY | |
| ASSETS | ||
| Global Reach | 10.0% | 53% |
| Index Variance | 5.1% | -40% |
| Global Explorer | 9.9% | 52% |
| Index Variance | 5.0% | -41% |
| Global Opportunities | 11.5% | 56% |
| Index Variance | 6.6% | -37% |
| International Opportunities | 12.2% | 50% |
| Index Variance | 5.8% | -41% |
| Emerging Markets Opportunities | 12.3% | 50% |
| Index Variance | 4.4% | -36% |
| Global Micro Cap | 10.1% | 28% |
| Index Variance | 5.2% | -65% |
| Global Stalwarts | 10.7% | 60% |
| Index Variance | 4.0% | -37% |
| International Stalwarts | 12.8% | 56% |
| Index Variance | 6.3% | -30% |
| US Stalwarts | 7.4% | 61% |
| Index Variance | 0.5% | -41% |
| Global Contrarian | 9.6% | 46% |
| Index Variance | 4.9% | -54% |
| Source: Internal Data as of 9/30/23 | ||
While quality is paramount throughout our portfolio, it may prove to be a more important risk factor in some sectors versus others given the current economic climate. For example, within the Financial sector broadly, we see a credit maturity wall coming, which could be painful for many small businesses and commercial real estate companies. We believe that numerous businesses previously had access to capital that they were likely not qualified for. Stricter lending standards and/or significantly higher borrowing costs will likely inflict pain on lower-quality companies. However, in our Financials portfolio, we are cautiously optimistic. We have shifted more risk-off over the course of the year, and we feel good about positioning for an economic slow-down. We’re avoiding investments with significant balance sheet risk, and we’re being careful to not overpay for our more growthy companies. Also, we believe our exposure is balanced enough so that we’ll keep up if the environment turns out to be better than expected.
The Consumer sector is another area where we remain very focused on owning high-quality names. Continued rate hikes and the combination of savings and aid programs drying up in the US and around the world have put many consumer businesses in more vulnerable positions. In building out the Consumer tranche within our portfolios, we have been very focused on understanding the sensitivities that each of our companies has to various potential economic environments, factoring in inflation, rates, consumer appetites, etc. With that understanding, we
7
| Grandeur Peak Funds® | Shareholder Letter |
| October 31, 2023 (Unaudited) |
have tried to strike the right balance of exposure across Consumer Staple and Discretionary names so that our portfolio will hold up amid various economic outcomes. Furthermore, we currently feel that it is more defensive to own more Consumer names outside of the US vs. inside. The basis for this view is that we believe the worst parts of the late economic cycle are mostly behind international markets, while things feel more uncertain in the US. Regardless of shorter-term positioning, we have confidence in our Consumer portfolio due to the attractive valuations and captured earnings growth in our companies.
VALUE
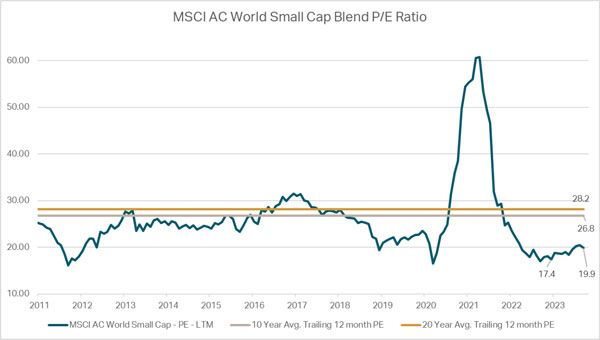
As shown in Figure 6, small cap stocks have most recently been trading at a price-earnings multiple6 that is 25-30% less than the long-term historical average (27-28x). The modest increase we’ve seen in the MSCI ACWI Small Cap Index multiple from the end of 2022, from 17.4x to 19.9x, is the result of a -10.13% decline in the index’s earnings relative to only a -0.26% drop in its price.
FIGURE 6
The depressed multiples and market turbulence continue to allow us to find stocks that offer attractive relative value. For example, our team is currently very excited about opportunities to invest in the Japanese market, where small cap growth stocks have underperformed on the year. As a result, the country has become a major focus of screening and travel for our team. Over the last year, we’ve had more company touches in Japan than any other country except for the US. We feel that captured earnings growth there has not been properly rewarded as it should, but that it’s only a matter of time before it will be.
| 6 | A Price-Earnings (P/E) multiple is a ratio of current share price to earnings per share (EPS) and is a measure of relative valuation of a company’s shares. |
8
| Grandeur Peak Funds® | Shareholder Letter |
| October 31, 2023 (Unaudited) |
Some of the attractive investment opportunities we see within Health Care have come as a result of volatility stemming from impact GLP-1 drugs (e.g., Ozempic), Large swaths of the sector, particularly those areas tied to obesity and Type-2 diabetes, have been significantly impacted. It will take years to grasp the full extent to which these drugs may reshape the industry, but the current uncertainty is producing large stock price fluctuations. We believe that much of our exposure will likely benefit from the shifting dynamics within Health Care.
MOMENTUM
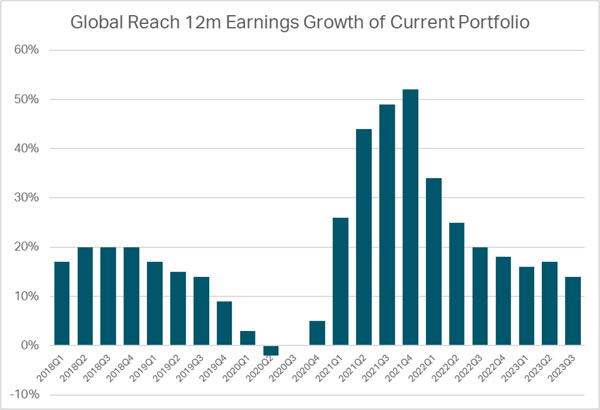
As previously noted, business momentum has slowed throughout the market this year, with earnings turning broadly negative year-to-date. We have seen the business momentum decline in our portfolio companies as well, however the slowdown has been much less pronounced. As illustrated in Figure 7, our portfolios continue to generate relatively strong, positive earnings growth amid slow market business momentum. Furthermore, we anticipate that momentum will pick back up in 2024 for our portfolio companies. As the momentum improves, we expect our portfolios to further distinguish their collective earnings strength.
FIGURE 7
One area within our portfolio where we have seen a significant decline in business momentum this year is in our Technology - Semiconductor names, which have detracted from performance. Business momentum within the space remains weak given excess inventories, but we believe we are getting close to an inflection point where things will turn favorably. In addition, we are starting to see some improvement in the monthly revenue numbers from some of our Taiwan-
9
| Grandeur Peak Funds® | Shareholder Letter |
| October 31, 2023 (Unaudited) |
based semiconductor companies. While this is a welcome sign, the recovery has come quite a bit later than we initially expected.
Many companies within Industrials that were able to increase their prices over the last several years are now experiencing some margin compression off high-priced inventory while their pricing power weakens. While they have generally worked through much of their backlogs, new orders haven’t quite kept up. Purchasing Managers’ Index (PMI) numbers across the world are weakening, which is hurting investment and capital expenditure-driven companies. However, our focus on higher-quality names within the sector has allowed us to avoid much of the cyclical earnings downturn.
To summarize, within our Quality, Valuation, and Momentum (QVM) Framework, our current portfolios exhibit high Quality, attractive Valuation, and lower but relatively resilient Business Momentum. In an environment of heightened macroeconomic and geopolitical uncertainty, we believe we are positioned to lessen downside risks should market conditions deteriorate further without giving up significant upside potetnial. As Business Momentum improves, we believe our portfolio companies will further strengthen their businesses and deliver attractive earnings growth. Furthermore, as favorable price momentum returns to the market, we believe our portfolios will be in position to reward shareholders for their patience.
Notes from the Road
Mark Madsen, Portfolio Manager – Global Contrarian, Tyler Glauser, Portfolio Manager – Global Reach, Lead Analyst – Consumer, and Karson Schrader, Lead Analyst – Financials, met with 26 companies in Sau Paulo, Brazil. In addition to meeting with several companies on our Owned list, they also visited every Watch A company in the country. Our Watch A names are what we consider to be high-quality companies we would like to own but are currently too expensive.
Here are some key thoughts from Mark Madsen about the visit:
Tyler, Karson, and I took another trip to Brazil recently as the market has experienced several favorable macro trends recently.
Inflation has come down meaningfully to 5% after peaking out at 10.1% in 2021 and is expected to trend even lower in coming years. Also, the currency has been relatively stable and interest rates have come down from 13% to 9%. Many of the companies we met with were cautiously optimistic about the future.
The Brazilian equity market realized double digit declines in 2020 and 2021 but has bounced back in 2022 and YTD in 2023. So, while we see signs of positive price momentum, net returns are flat to slightly negative over the past four years.
Most companies we met with have business plans that are very dependent on the Brazilian economy for success. Few were focused on exports or expanding sales efforts outside of the country.
10
| Grandeur Peak Funds® | Shareholder Letter |
| October 31, 2023 (Unaudited) |
Of the companies we visited, those that scored the highest were mostly service-oriented (e.g., investment management, payment processing, internet, etc.). A third of our visits felt like easy passes as we left – where neither the numbers nor the stories felt very compelling. The remaining two-thirds had a fairly balanced list of pluses and minuses, and we committed to follow them more closely in case the QVM profiles become more favorable.
It’s interesting to look at the differences and similarities between Brazil to India. Both countries have young populations and have had issues with corruption. Brazil is smaller geographically and GDP growth is slower, but it has more natural resources than India. Also, valuations on the ground level in Brazil seem much more reasonable than what we currently see in India.
In sum, we came back from the trip with heightened confidence in the companies we own in our portfolios and better understanding and appreciation for some of our Watch A names. While there are some great high-quality companies in Brazil that have real growth potential, Brazil continues to be a wildcard in our minds because of the challenge in assessing the currency risk. Will the Brazilian Real continue to be stable, or will it revert to being a volatile currency that has the potential to depreciate meaningfully and eat up solid investment returns? If the Brazilian government can maintain a stable currency for an extended period, it may eventually allow us to lower the currency risk premium we demand for investing in the Brazilian market and make the country a much more attractive area of our investment opportunity set.
Business Update
We completed the back-office provider transition for our mutual funds to Ultimus Fund Solutions. As a reminder, the reorganization of the Funds were non-taxable transactions for federal income tax purposes. The transition did not impact the ownership of Grandeur Peak Global Advisors, the composition of our team, or our investment research process.
We are happy to welcome Dane Nielson back to Salt Lake City after completing his MBA at Cambridge University in the UK. Dane continues his role as part of the Global Contrarian Fund team and as a member of the Resource Rich geography team. We appreciate the additional insights and expertise he brings to the firm from his educational experience.
As always, please feel free to reach out anytime with any questions, requests, or comments. We appreciate the opportunity to work on your behalf.
Sincerely,
Your Grandeur Peak Team
11
| Grandeur Peak Funds® | Shareholder Letter |
| October 31, 2023 (Unaudited) |
RISKS: Investing in small and micro-cap funds will be more volatile and loss of principal could be greater than investing in large cap or more diversified funds. Investing in foreign securities entails special risks, such as currency fluctuations and political uncertainties, which are described in more detail in the prospectus. Investments in emerging markets are subject to the same risks as other foreign securities and may be subject to greater risks than investments in foreign countries with more established economies and securities markets.
An investor should consider investment objectives, risks, charges, and expenses carefully before investing. To obtain a Grandeur Peak Funds prospectus, containing this and other information, visit www.grandeurpeakglobal.com or call 1-855-377-7325. Please read it carefully before investing.
The views and information discussed in this commentary are as of the date of publication, are subject to change, and may not reflect the writer’s current views. The views expressed represent an assessment of market conditions at a specific point in time, are opinions only and should not be relied upon as investment advice regarding a particular investment or markets in general. Such information does not constitute a recommendation to buy or sell specific securities or investment vehicles. It should not be assumed that any investment will be profitable or will equal the performance of the Funds or any securities or any sectors mentioned herein. The subject matter contained herein has been derived from several sources believed to be reliable and accurate at the time of compilation. The Funds do not accept any liability for losses either direct or consequential caused by the use of this information. Past performance does not guarantee future results.
Grandeur Peak Funds are distributed by Northern Lights Distributors, which is not affiliated with Grandeur Peak Global Advisors.
17758892-NLD-1/4/2024
12
| Grandeur Peak Emerging Markets Opportunities Fund | Performance Update |
| October 31, 2023 (Unaudited) |
Annualized Total Return Performance for the periods ended October 31, 2023
| Since | Expense Ratio(b) | ||||||
| Six Months | 1 Year | 3 Years | 5 Years | Inception(a) | Gross | Net(c) | |
| Grandeur Peak Emerging Markets Opportunities Fund – Investor (GPEOX) | -6.27% | 3.22% | -1.57% | 5.24% | 3.72% | 1.75% | 1.72% |
| Grandeur Peak Emerging Markets Opportunities Fund – Institutional (GPEIX) | -6.13% | 3.43% | -1.35% | 5.48% | 3.95% | 1.50% | 1.47% |
| MSCI Emerging Markets SMID Cap Index(d) | -0.13% | 14.05% | 6.19% | 5.73% | 3.23% | ||
| MSCI Emerging Markets IMI Index(e) | -3.41% | 12.15% | -1.83% | 2.74% | 2.33% | ||
Performance data quoted represents past performance. Past performance does not guarantee future results. Investment return and principal value of an investment will fluctuate so that an investor’s shares, when sold or redeemed, may be worth more or less than the original cost. The Fund imposes a 2.00% redemption fee on shares held for less than 60 days. Current performance data may be higher or lower than actual data quoted. For the most current month-end performance data, please call 1-855-377-PEAK (7325).
The table does not reflect the deduction of taxes a shareholder would pay on Fund distributions or redemption of Fund shares.
Subject to investment risks, including possible loss of the principal amount invested.
Returns for periods less than 1 year are cumulative.
| (a) | Fund inception date of December 16, 2013. The Fund reorganized into the Trust on October 20, 2023. |
| (b) | Ratios as of the Prospectus dated October 20, 2023 and may differ from the ratios presented in the Financial Highlights. |
| (c) | Grandeur Peak Global Advisors, LLC (the “Adviser”), has agreed to waive and/or reimburse fees or expenses in order to limit Total Annual Fund Operating Expenses After Fee Waiver/Expense Reimbursement (excluding any front-end or contingent deferred loads, brokerage fees and commissions, acquired fund fees and expenses, borrowing costs (such as interest and dividend expense on securities sold short), taxes, and extraordinary expenses, such as litigation expenses (which may increase indemnification of the Funds’ officers and trustees, contractual indemnification of the Fund’s service providers (other than the Advisor))) to 1.95% and 1.70% of the Fund’s average daily net assets for the Fund’s Investor Class Shares and Institutional Class Shares, respectively. This agreement (the “Expense Agreement”) shall continue at least through October 6, 2024. The Adviser will be permitted to recapture, on a class-by-class basis, expenses it has borne the Expense Agreement to the extent that the Fund’s expenses in later periods fall below annual rates set forth in the Expense Agreement or in previous letter agreements; provided, however, that such recapture payments do not cause the Fund’s expense ratio (after recapture) to exceed the lesser of (i) the expense cap in effect at the time of the waiver and (ii) the expense cap in effect at the time of the recapture. Notwithstanding the foregoing, the Fund will not pay any such deferred fees and expenses more than three years after the date on which the fee and expenses were deferred. The Expense Agreement may not be terminated or modified prior to October 6, 2024, except with the approval of the Trust’s Board of Trustees. |
| (d) | The MSCI Emerging Markets SMID Cap Index is designed to measure the equity market performance of small and mid-cap companies across emerging markets. MSCI makes no express or implied warranties or representations and shall have no liability whatsoever with respect to any MSCI data contained herein. The MSCI data may not be further redistributed or used to create indices or financial products. The Index is not actively managed and does not reflect any deductions for fees, expenses or taxes. An investor may not invest directly into the Index. |
| (e) | The MSCI Emerging Markets IMI Index is designed to measure the equity market performance of large, mid, and small-cap companies across emerging markets. The Index is not actively managed and does not reflect any deductions for fees, expenses or taxes. An investor may not invest directly into the Index. |
13
| Grandeur Peak Emerging Markets Opportunities Fund | Performance Update |
| October 31, 2023 (Unaudited) |
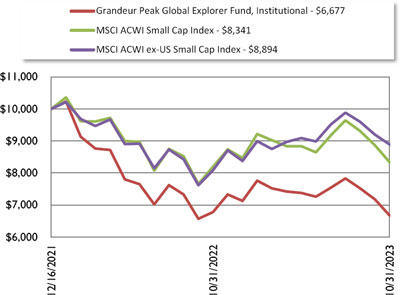
Growth of $10,000 for the period ended October 31, 2023
The chart shown above represent a hypothetical investment of $10,000 in the Fund’s Institutional Class shares for the period from inception to October 31, 2023. All returns reflect reinvested dividends, but do not reflect the deduction of taxes that an investor would pay on distributions or redemptions.
Investing in the Fund is subject to investment risks, including possible loss of the principal amount invested.
The Fund also offers Investor Class shares, performance for which is not reflected in the graphs above. The performance of Institutional Class shares may be higher or lower than the performance of the Investor Class shares shown in the graphs above based upon differences in fees paid by shareholders investing in the Investor Class shares and Institutional Class shares.
14
| Grandeur Peak Emerging Markets Opportunities Fund | Performance Update |
| October 31, 2023 (Unaudited) |
| Regional Allocation (as a% of Net Assets)* | % of Net Assets | |||
| Asia ex Japan | 48.4 | % | ||
| Latin America | 15.7 | % | ||
| Africa/Middle East | 13.6 | % | ||
| North America | 8.1 | % | ||
| Europe | 6.1 | % | ||
| Cash, Cash Equivalents, & Other Net Assets | 8.1 | % | ||
| 100.0 | % | |||
| Top 10 Holdings (as a% of Net Assets) | % of Net Assets | |||
| Globant S.A. | 2.7 | % | ||
| WuXi AppTec Co., Ltd. | 2.6 | % | ||
| FPT Corporation | 2.2 | % | ||
| Dino Polska SA | 2.2 | % | ||
| Inter Cars SA | 1.9 | % | ||
| Sporton International, Inc. | 1.7 | % | ||
| Techtronic Industries Co., Ltd. | 1.7 | % | ||
| Regional SAB de CV | 1.7 | % | ||
| Sinbon Electronics Co., Ltd. | 1.6 | % | ||
| Silergy Corporation | 1.6 | % | ||
| 20.0 | % | |||
| * | Holdings are subject to change, and may not reflect the current or future position of the portfolio. |
Please refer to the Schedule of Investments in this semi-annual report for a listing of the Fund’s holdings.
15
| Grandeur Peak Global Contrarian Fund | Performance Update |
| October 31, 2023 (Unaudited) |
Annualized Total Return Performance for the periods ended October 31, 2023
| Since | Expense Ratio(b) | |||||
| Six Months | 1 Year | 3 Years | Inception(a) | Gross | Net(c) | |
| Grandeur Peak Global Contrarian Fund – Institutional (GPGCX) | -1.36% | 10.97% | 9.78% | 9.54% | 1.35% | 1.35% |
| MSCI ACWI Small Cap Index(d) | -5.62% | 1.78% | 5.15% | 4.21% | ||
| MSCI ACWI ex-US Small Cap Index(e) | -6.42% | 9.36% | 3.43% | 3.44% | ||
| MSCI ACWI Small Cap Value Index(f) | -4.04% | 1.82% | 9.87% | 4.38% | ||
Performance data quoted represents past performance. Past performance does not guarantee future results. Investment return and principal value of an investment will fluctuate so that an investor’s shares, when sold or redeemed, may be worth more or less than the original cost. The Fund imposes a 2.00% redemption fee on shares held for less than 60 days. Current performance data may be higher or lower than actual data quoted. For the most current month-end performance data, please call 1-855-377-PEAK (7325).
The table does not reflect the deduction of taxes a shareholder would pay on Fund distributions or redemption of Fund shares.
Subject to investment risks, including possible loss of the principal amount invested.
Returns for periods less than 1 year are cumulative.
| (a) | Fund inception date of September 17, 2019. The Fund reorganized into the Trust on October 20, 2023. |
| (b) | Ratios as of the Prospectus dated October 20, 2023 and may differ from the ratios presented in the Financial Highlights. |
| (c) | Grandeur Peak Global Advisors, LLC (the “Adviser”), has agreed to waive and/or reimburse fees or expenses in order to limit Total Annual Fund Operating Expenses After Fee Waiver/Expense Reimbursement (excluding any front-end or contingent deferred loads, brokerage fees and commissions, acquired fund fees and expenses, borrowing costs (such as interest and dividend expense on securities sold short), taxes, and extraordinary expenses, such as litigation expenses (which may increase indemnification of the Funds’ officers and trustees, contractual indemnification of the Fund’s service providers (other than the Advisor))) to 1.35% of the Fund’s average daily net assets for the Fund’s Institutional Class Shares. This agreement (the “Expense Agreement”) shall continue at least through October 6, 2024. The Adviser will be permitted to recapture, on a class-by-class basis, expenses it has borne the Expense Agreement to the extent that the Fund’s expenses in later periods fall below annual rates set forth in the Expense Agreement or in previous letter agreements; provided, however, that such recapture payments do not cause the Fund’s expense ratio (after recapture) to exceed the lesser of (i) the expense cap in effect at the time of the waiver and (ii) the expense cap in effect at the time of the recapture. Notwithstanding the foregoing, the Fund will not pay any such deferred fees and expenses more than three years after the date on which the fee and expenses were deferred. The Expense Agreement may not be terminated or modified prior to October 6, 2024, except with the approval of the Trust’s Board of Trustees. |
| (d) | The MSCI ACWI Small Cap Index is designed to measure the equity market performance of performance of small-cap companies across developed and emerging markets globally. MSCI makes no express or implied warranties or representations and shall have no liability whatsoever with respect to any MSCI data contained herein. The MSCI data may not be further redistributed or used to create indices or financial products. The Index is not actively managed and does not reflect any deductions for fees, expenses or taxes. An investor may not invest directly into the Index. |
| (e) | The MSCI ACWI ex USA Small Cap Index is designed to measure the equity market performance of small-cap companies across developed and emerging markets globally, excluding the United States. MSCI makes no express or implied warranties or representations and shall have no liability whatsoever with respect to any MSCI data contained herein. The MSCI data may not be further redistributed or used to create indices or financial products. The Index is not actively managed and does not reflect any deductions for fees, expenses or taxes. An investor may not invest directly into the Index. |
| (f) | The MSCI ACWI Small Cap Value Index is designed to measure small cap companies exhibiting overall value style characteristics across developed and emerging markets globally. The Index is not actively managed and does not reflect any deductions for fees, expenses or taxes. An investor may not invest directly into the Index. |
16
| Grandeur Peak Global Contrarian Fund | Performance Update |
| October 31, 2023 (Unaudited) |
Growth of $10,000 for the period ended October 31, 2023

The chart shown above represent a hypothetical investment of $10,000 in the Fund’s Institutional Class shares for the period from inception to October 31, 2023. All returns reflect reinvested dividends, but do not reflect the deduction of taxes that an investor would pay on distributions or redemptions.
Investing in the Fund is subject to investment risks, including possible loss of the principal amount invested.
17
| Grandeur Peak Global Contrarian Fund | Performance Update |
| October 31, 2023 (Unaudited) |
| Regional Allocation (as a% of Net Assets)* | % of Net Assets | |||
| Asia ex Japan | 27.4 | % | ||
| Europe | 23.9 | % | ||
| North America | 21.0 | % | ||
| Japan | 9.3 | % | ||
| Australia/New Zealand | 5.7 | % | ||
| Africa/Middle East | 5.5 | % | ||
| Latin America | 4.9 | % | ||
| Cash, Cash Equivalents, & Other Net Assets | 2.3 | % | ||
| 100.0 | % | |||
| Top 10 Holdings (as a% of Net Assets) | % of Net Assets | |||
| Petershill Partners PLC | 4.3 | % | ||
| Riverstone Holdings Ltd. | 4.1 | % | ||
| Plover Bay Technologies Ltd. | 3.3 | % | ||
| China Yongda Automobiles Services Holdings Ltd. | 2.4 | % | ||
| Xin Point Holdings Ltd. | 2.3 | % | ||
| Beenos, Inc. | 2.3 | % | ||
| Gulf Oil Lubricants India Ltd. | 2.2 | % | ||
| B&M European Value Retail SA | 1.9 | % | ||
| Parex Resources, Inc. | 1.8 | % | ||
| FPT Corporation | 1.8 | % | ||
| 26.3 | % | |||
| * | Holdings are subject to change, and may not reflect the current or future position of the portfolio. |
Please refer to the Schedule of Investments in this semi-annual report for a listing of the Fund’s holdings.
18
| Grandeur Peak Global Explorer Fund | Performance Update |
| October 31, 2023 (Unaudited) |
Annualized Total Return Performance for the periods ended October 31, 2023
| Since | Expense Ratio(b) | ||||
| Six Months | 1 Year | Inception(a) | Gross | Net(c) | |
| Grandeur Peak Global Explorer Fund – Institutional (GPGEX) | -9.51% | 1.52% | 19.39% | 3.45% | 1.25% |
| MSCI ACWI Small Cap Index(d) | -5.62% | 1.78% | -9.23% | ||
| MSCI ACWI IMI Index(e) | -2.13% | 9.98% | -6.06% | ||
Performance data quoted represents past performance. Past performance does not guarantee future results. Investment return and principal value of an investment will fluctuate so that an investor’s shares, when sold or redeemed, may be worth more or less than the original cost. The Fund imposes a 2.00% redemption fee on shares held for less than 60 days. Current performance data may be higher or lower than actual data quoted. For the most current month-end performance data, please call 1-855-377-PEAK (7325).
The table does not reflect the deduction of taxes a shareholder would pay on Fund distributions or redemption of Fund shares.
Subject to investment risks, including possible loss of the principal amount invested.
Returns for periods less than 1 year are cumulative.
| (a) | Fund inception date of December 16, 2021. The Fund reorganized into the Trust on October 20, 2023. |
| (b) | Ratios as of the Prospectus dated October 20, 2023 and may differ from the ratios presented in the Financial Highlights. |
| (c) | Grandeur Peak Global Advisors, LLC (the “Adviser”), has agreed to waive and/or reimburse fees or expenses in order to limit Total Annual Fund Operating Expenses After Fee Waiver/Expense Reimbursement (excluding any front-end or contingent deferred loads, brokerage fees and commissions, acquired fund fees and expenses, borrowing costs (such as interest and dividend expense on securities sold short), taxes, and extraordinary expenses, such as litigation expenses (which may increase indemnification of the Funds’ officers and trustees, contractual indemnification of the Fund’s service providers (other than the Advisor))) to 1.25% of the Fund’s average daily net assets for the Fund’s Institutional Class Shares. This agreement (the “Expense Agreement”) is in effect through October 6, 2024. The Adviser will be permitted to recapture expenses it has borne through the Expense Agreement to the extent that the Fund’s expenses in later periods fall below annual rates set forth in the Expense Agreement; provided, however, that such recapture payments do not cause the Fund’s expense ratio (after recapture) to exceed the lesser of (i) the expense cap in effect at the time of the waiver and (ii) the expense cap in effect at the time of the recapture. Notwithstanding the foregoing, the Fund will not pay any such deferred fees and expenses more than three years after the date on which the fee and expenses were deferred. The Expense Agreement may not be terminated or modified prior to October 6, 2024, except with the approval of the Trust’s Board of Trustees. |
| (d) | The MSCI ACWI Small Cap Index is designed to measure the equity market performance of performance of small-cap companies across developed and emerging markets globally. MSCI makes no express or implied warranties or representations and shall have no liability whatsoever with respect to any MSCI data contained herein. The MSCI data may not be further redistributed or used to create indices or financial products. The Index is not actively managed and does not reflect any deductions for fees, expenses or taxes. An investor may not invest directly into the Index. |
| (e) | The MSCI ACWI IMI Index captures large, mid and small cap representation across 23 Developed Markets (DM) and 24 Emerging Markets (EM) countries. With 9,189 constituents, the index is comprehensive, covering approximately 99% of the global equity investment opportunity set. The Index is not actively managed and does not reflect any deductions for fees, expenses or taxes. An investor may not invest directly into the Index. |
19
| Grandeur Peak Global Explorer Fund | Performance Update |
| October 31, 2023 (Unaudited) |
Growth of $10,000 for the period ended October 31, 2023
The chart shown above represent a hypothetical investment of $10,000 in the Fund’s Institutional Class shares for the period from inception to October 31, 2023. All returns reflect reinvested dividends, but do not reflect the deduction of taxes that an investor would pay on distributions or redemptions.
Investing in the Fund is subject to investment risks, including possible loss of the principal amount invested.
20
| Grandeur Peak Global Explorer Fund | Performance Update |
| October 31, 2023 (Unaudited) |
| Regional Allocation (as a% of Net Assets)* | % of Net Assets | |||
| North America | 31.6 | % | ||
| Europe | 28.5 | % | ||
| Asia ex Japan | 15.6 | % | ||
| Japan | 12.3 | % | ||
| Latin America | 4.2 | % | ||
| Africa/Middle East | 3.9 | % | ||
| Australia/New Zealand | 3.3 | % | ||
| Cash, Cash Equivalents, & Other Net Assets | 0.6 | % | ||
| 100.0 | % | |||
| Top 10 Holdings (as a% of Net Assets) | % of Net Assets | |||
| Virbac SA | 1.0 | % | ||
| Globant SA | 1.0 | % | ||
| Parex Resources, Inc. | 1.0 | % | ||
| PJT Partners, Inc. | 1.0 | % | ||
| Endava plc, ADR | 0.9 | % | ||
| Volution Group PLC | 0.9 | % | ||
| Sporton International, Inc. | 0.9 | % | ||
| Ollie’s Bargain Outlet Holdings, Inc. | 0.9 | % | ||
| FPT Corporation | 0.9 | % | ||
| CVS Group plc | 0.9 | % | ||
| 9.3 | % | |||
| * | Holdings are subject to change, and may not reflect the current or future position of the portfolio. |
Please refer to the Schedule of Investments in this semi-annual report for a listing of the Fund’s holdings.
21
| Grandeur Peak Global Micro Cap Fund | Performance Update |
| October 31, 2023 (Unaudited) |
Annualized Total Return Performance for the periods ended October 31, 2023
| Since | Expense Ratio(b) | ||||||
| Six Months | 1 Year | 3 Years | 5 Years | Inception(a) | Gross | Net(c) | |
| Grandeur Peak Global Micro Cap Fund – | |||||||
| Institutional (GPMCX) | -7.72% | 1.15% | -2.96% | 6.11% | 6.76% | 1.85% | 1.85% |
| MSCI ACWI Small Cap Index(d) | -5.62% | 1.78% | 5.15% | 4.90% | 6.21% | ||
| MSCI ACWI ex-US Small Cap Index(e) | -5.62% | 1.78% | 5.15% | 4.90% | 6.21% | ||
| MSCI World Micro Cap Index(f) | -10.41% | -3.40% | 1.13% | 2.07% | 4.71% | ||
Performance data quoted represents past performance. Past performance does not guarantee future results. Investment return and principal value of an investment will fluctuate so that an investor’s shares, when sold or redeemed, may be worth more or less than the original cost. The Fund imposes a 2.00% redemption fee on shares held for less than 60 days. Current performance data may be higher or lower than actual data quoted. For the most current month-end performance data, please call 1-855-377-PEAK (7325).
The table does not reflect the deduction of taxes a shareholder would pay on Fund distributions or redemption of Fund shares.
Subject to investment risks, including possible loss of the principal amount invested.
Returns for periods less than 1 year are cumulative.
| (a) | Fund inception date of October 20, 2015. The Fund reorganized into the Trust on October 20, 2023. |
| (b) | Ratios as of the Prospectus dated October 20, 2023 and may differ from the ratios presented in the Financial Highlights. |
| (c) | Grandeur Peak Global Advisors, LLC (the “Adviser”), has agreed to waive and/or reimburse fees or expenses in order to limit Total Annual Fund Operating Expenses After Fee Waiver/ Expense Reimbursement (excluding any front-end or contingent deferred loads, brokerage fees and commissions, acquired fund fees and expenses, borrowing costs (such as interest and dividend expense on securities sold short), taxes, and extraordinary expenses, such as litigation expenses (which may increase indemnification of the Funds’ officers and trustees, contractual indemnification of the Fund’s service providers (other than the Advisor))) to 2.00% of the Fund’s average daily net assets for the Fund’s Institutional Class Shares. This agreement (the “Expense Agreement”) is in effect through October 6, 2024. The Adviser will be permitted to recapture expenses it has borne through the Expense Agreement to the extent that the Fund’s expenses in later periods fall below annual rates set forth in the Expense Agreement; provided, however, that such recapture payments do not cause the Fund’s expense ratio (after recapture) to exceed the lesser of (i) the expense cap in effect at the time of the waiver and (ii) the expense cap in effect at the time of the recapture. Notwithstanding the foregoing, the Fund will not pay any such deferred fees and expenses more than three years after the date on which the fee and expenses were deferred. The Expense Agreement may not be terminated or modified prior to October 6, 2024, except with the approval of the Trust’s Board of Trustees. |
| (d) | The MSCI ACWI Small Cap Index is designed to measure the equity market performance of performance of small-cap companies across developed and emerging markets globally. MSCI makes no express or implied warranties or representations and shall have no liability whatsoever with respect to any MSCI data contained herein. The MSCI data may not be further redistributed or used to create indices or financial products. The Index is not actively managed and does not reflect any deductions for fees, expenses or taxes. An investor may not invest directly into the Index. |
| (e) | The MSCI ACWI ex USA Small Cap Index is designed to measure the equity market performance of small-cap companies across developed and emerging markets globally, excluding the United States. MSCI makes no express or implied warranties or representations and shall have no liability whatsoever with respect to any MSCI data contained herein. The MSCI data may not be further redistributed or used to create indices or financial products. The Index is not actively managed and does not reflect any deductions for fees, expenses or taxes. An investor may not invest directly into the Index. |
| (f) | The MSCI World Micro Cap Index is designed to measure the equity market performance of micro-cap companies across developed markets globally. It does not include emerging markets. The Index is not actively managed and does not reflect any deductions for fees, expenses or taxes. An investor may not invest directly into the Index. |
22
| Grandeur Peak Global Micro Cap Fund | Performance Update |
| October 31, 2023 (Unaudited) |
Growth of $10,000 for the period ended October 31, 2023
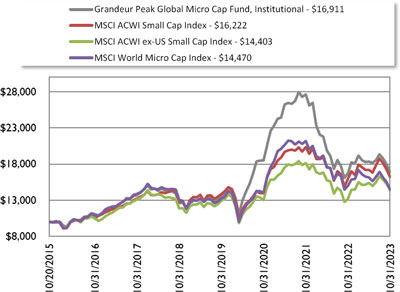
The chart shown above represent a hypothetical investment of $10,000 in the Fund’s Institutional Class shares for the period from inception to October 31, 2023. All returns reflect reinvested dividends, but do not reflect the deduction of taxes that an investor would pay on distributions or redemptions.
Investing in the Fund is subject to investment risks, including possible loss of the principal amount invested.
23
| Grandeur Peak Global Micro Cap Fund | Performance Update |
| October 31, 2023 (Unaudited) |
| Regional Allocation (as a% of Net Assets)* | % of Net Assets | |||
| Europe | 34.2 | % | ||
| Japan | 24.7 | % | ||
| North America | 12.8 | % | ||
| Asia ex Japan | 11.9 | % | ||
| Australia/New Zealand | 8.7 | % | ||
| Africa/Middle East | 6.5 | % | ||
| Latin America | 0.7 | % | ||
| Cash, Cash Equivalents, & Other Net Assets | 0.5 | % | ||
| 100.0 | % | |||
| Top 10 Holdings (as a% of Net Assets) | % of Net Assets | |||
| Swedencare AB | 3.1 | % | ||
| Beenos, Inc. | 2.3 | % | ||
| Kogan.com Ltd. | 2.2 | % | ||
| ULS Group, Inc. | 2.2 | % | ||
| Gulf Oil Lubricants India Ltd. | 1.9 | % | ||
| Hackett Group, Inc. (The) | 1.9 | % | ||
| Musti Group Oyj | 1.9 | % | ||
| Fiducian Group Ltd. | 1.9 | % | ||
| Barrett Business Services, Inc. | 1.8 | % | ||
| Bowman Consulting Group Ltd. | 1.6 | % | ||
| 20.8 | % | |||
| * | Holdings are subject to change, and may not reflect the current or future position of the portfolio. |
Please refer to the Schedule of Investments in this semi-annual report for a listing of the Fund’s holdings.
24
| Grandeur Peak Global Opportunities Fund | Performance Update |
| October 31, 2023 (Unaudited) |
Annualized Total Return Performance for the periods ended October 31, 2023
| Since | Expense Ratio(b) | |||||||
| Six Months | 1 Year | 3 Years | 5 Years | 10 Years | Inception(a) | Gross | Net(c) | |
| Grandeur Peak Global Opportunities Fund – Investor (GPGOX) | -11.40% | -0.27% | -2.51% | 6.02% | 6.15% | 9.68% | 1.60% | 1.54% |
| Grandeur Peak Global Opportunities Fund –Institutional (GPGIX) | -11.40% | -0.14% | -2.28% | 6.28% | 6.40% | 9.96% | 1.35% | 1.29% |
| MSCI ACWI Small Cap Index(d) | -5.62% | 1.78% | 5.15% | 4.90% | 5.64% | 8.22% | ||
| MSCI ACWI IMI Index(e) | -2.13% | 9.98% | 6.95% | 7.63% | 7.15% | 9.04% | ||
Performance data quoted represents past performance. Past performance does not guarantee future results. Investment return and principal value of an investment will fluctuate so that an investor’s shares, when sold or redeemed, may be worth more or less than the original cost. The Fund imposes a 2.00% redemption fee on shares held for less than 60 days. Current performance data may be higher or lower than actual data quoted. For the most current month-end performance data, please call 1-855-377-PEAK (7325).
The table does not reflect the deduction of taxes a shareholder would pay on Fund distributions or redemption of Fund shares.
Subject to investment risks, including possible loss of the principal amount invested.
Returns for periods less than 1 year are cumulative.
| (a) | Fund inception date of October 17, 2011. The Fund reorganized into the Trust on October 20, 2023. |
| (b) | Ratios as of the Prospectus dated October 20, 2023 and may differ from the ratios presented in the Financial Highlights. |
| (c) | Grandeur Peak Global Advisors, LLC (the “Adviser”), has agreed to waive and/or reimburse fees or expenses in order to limit Total Annual Fund Operating Expenses After Fee Waiver/ Expense Reimbursement (excluding any front-end or contingent deferred loads, brokerage fees and commissions, acquired fund fees and expenses, borrowing costs (such as interest and dividend expense on securities sold short), taxes, and extraordinary expenses, such as litigation expenses (which may increase indemnification of the Funds’ officers and trustees, contractual indemnification of the Fund’s service providers (other than the Advisor))) to 1.75% and 1.50% of the Fund’s average daily net assets for the Fund’s Investor Class Shares and Institutional Class Shares, respectively. This agreement (the “Expense Agreement”) shall continue at least through October 6, 2024. The Adviser will be permitted to recapture, on a class-by-class basis, expenses it has borne the Expense Agreement to the extent that the Fund’s expenses in later periods fall below annual rates set forth in the Expense Agreement or in previous letter agreements; provided, however, that such recapture payments do not cause the Fund’s expense ratio (after recapture) to exceed the lesser of (i) the expense cap in effect at the time of the waiver and (ii) the expense cap in effect at the time of the recapture. Notwithstanding the foregoing, the Fund will not pay any such deferred fees and expenses more than three years after the date on which the fee and expenses were deferred. The Expense Agreement may not be terminated or modified prior to October 6, 2024, except with the approval of the Trust’s Board of Trustees. |
| (d) | The MSCI ACWI Small Cap Index is designed to measure the equity market performance of performance of small-cap companies across developed and emerging markets globally. MSCI makes no express or implied warranties or representations and shall have no liability whatsoever with respect to any MSCI data contained herein. The MSCI data may not be further redistributed or used to create indices or financial products. The Index is not actively managed and does not reflect any deductions for fees, expenses or taxes. An investor may not invest directly into the Index. |
| (e) | The MSCI ACWI IMI Index is designed to measure the equity market performance of large, mid, and small-cap companies across developed and emerging markets globally. The Index is not actively managed and does not reflect any deductions for fees, expenses or taxes. An investor may not invest directly into the Index. |
25
| Grandeur Peak Global Opportunities Fund | Performance Update |
| October 31, 2023 (Unaudited) |
Growth of $10,000 for the period ended October 31, 2023
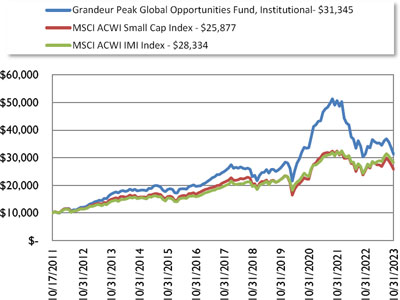
The chart shown above represent a hypothetical investment of $10,000 in the Fund’s Institutional Class shares for the period from inception to October 31, 2023. All returns reflect reinvested dividends, but do not reflect the deduction of taxes that an investor would pay on distributions or redemptions.
Investing in the Fund is subject to investment risks, including possible loss of the principal amount invested.
The Fund also offers Investor Class shares, performance for which is not reflected in the graphs above. The performance of Institutional Class shares may be higher or lower than the performance of the Investor Class shares shown in the graphs above based upon differences in fees paid by shareholders investing in the Investor Class shares and Institutional Class shares.
26
| Grandeur Peak Global Opportunities Fund | Performance Update |
| October 31, 2023 (Unaudited) |
| Regional Allocation (as a% of Net Assets)* | % of Net Assets | |||
| Europe | 43.3 | % | ||
| North America | 26.2 | % | ||
| Japan | 12.4 | % | ||
| Asia ex Japan | 11.8 | % | ||
| Latin America | 3.2 | % | ||
| Africa/Middle East | 1.8 | % | ||
| Australia/New Zealand | 0.1 | % | ||
| Cash, Cash Equivalents, & Other Net Assets | 1.2 | % | ||
| 100.0 | % | |||
| Top 10 Holdings (as a% of Net Assets) | % of Net Assets | |||
| B&M European Value Retail SA | 4.1 | % | ||
| Littelfuse, Inc. | 2.8 | % | ||
| CVS Group plc | 2.4 | % | ||
| Endava plc, ADR | 2.3 | % | ||
| Virbac SA | 2.1 | % | ||
| Alten SA | 1.5 | % | ||
| Dino Polska SA | 1.5 | % | ||
| Qualys, Inc. | 1.5 | % | ||
| Musti Group Oyj | 1.4 | % | ||
| Melexis NV | 1.3 | % | ||
| 20.9 | % | |||
| * | Holdings are subject to change, and may not reflect the current or future position of the portfolio. |
Please refer to the Schedule of Investments in this semi-annual report for a listing of the Fund’s holdings.
27
| Grandeur Peak Global Reach Fund | Performance Update |
| October 31, 2023 (Unaudited) |
Annualized Total Return Performance for the periods ended October 31, 2023
| Since | Expense Ratio(b) | |||||||
| Six Months | 1 Year | 3 Years | 5 Years | 10 Years | Inception(a) | Gross | Net(c) | |
| Grandeur Peak Global Reach Fund – Investor (GPROX) | -9.56% | -1.85% | -3.76% | -4.68% | 5.87% | 7.07% | 1.50% | 1.50% |
| Grandeur Peak Global Reach Fund –Institutional (GPRIX) | -9.38% | -1.56% | -3.52% | 4.95% | 6.13% | 7.33% | 1.25% | 1.25% |
| MSCI ACWI Small Cap Index(d) | -5.62% | 1.78% | 5.15% | 4.90% | 5.64% | 6.57% | ||
| MSCI ACWI IMI Index(e) | -2.13% | 9.98% | 6.95% | 7.63% | 7.15% | 7.86% | ||
Performance data quoted represents past performance. Past performance does not guarantee future results. Investment return and principal value of an investment will fluctuate so that an investor’s shares, when sold or redeemed, may be worth more or less than the original cost. The Fund imposes a 2.00% redemption fee on shares held for less than 60 days. Current performance data may be higher or lower than actual data quoted. For the most current month-end performance data, please call 1-855-377-PEAK (7325).
The table does not reflect the deduction of taxes a shareholder would pay on Fund distributions or redemption of Fund shares.
Subject to investment risks, including possible loss of the principal amount invested.
Returns for periods less than 1 year are cumulative.
| (a) | Fund inception date of June 19, 2013. The Fund reorganized into the Trust on October 20, 2023. |
| (b) | Ratios as of the Prospectus dated October 20, 2023 and may differ from the ratios presented in the Financial Highlights. |
| (c) | Grandeur Peak Global Advisors, LLC (the “Adviser”), has agreed to waive and/or reimburse fees or expenses in order to limit Total Annual Fund Operating Expenses After Fee Waiver/Expense Reimbursement (excluding any front-end or contingent deferred loads, brokerage fees and commissions, acquired fund fees and expenses, borrowing costs (such as interest and dividend expense on securities sold short), taxes, and extraordinary expenses, such as litigation expenses (which may increase indemnification of the Funds’ officers and trustees, contractual indemnification of the Fund’s service providers (other than the Advisor))) to 1.50% and 1.25% of the Fund’s average daily net assets for the Fund’s Investor Class Shares and Institutional Class Shares, respectively. This agreement (the “Expense Agreement”) shall continue at least through October 6, 2024. The Adviser will be permitted to recapture, on a class-by-class basis, expenses it has borne the Expense Agreement to the extent that the Fund’s expenses in later periods fall below annual rates set forth in the Expense Agreement or in previous letter agreements; provided, however, that such recapture payments do not cause the Fund’s expense ratio (after recapture) to exceed the lesser of (i) the expense cap in effect at the time of the waiver and (ii) the expense cap in effect at the time of the recapture. Notwithstanding the foregoing, the Fund will not pay any such deferred fees and expenses more than three years after the date on which the fee and expenses were deferred. The Expense Agreement may not be terminated or modified prior to October 6, 2024, except with the approval of the Trust’s Board of Trustees. |
| (d) | The MSCI ACWI Small Cap Index is designed to measure the equity market performance of performance of small-cap companies across developed and emerging markets globally. MSCI makes no express or implied warranties or representations and shall have no liability whatsoever with respect to any MSCI data contained herein. The MSCI data may not be further redistributed or used to create indices or financial products. The Index is not actively managed and does not reflect any deductions for fees, expenses or taxes. An investor may not invest directly into the Index. |
| (e) | The MSCI ACWI IMI Index is designed to measure the equity market performance of large, mid, and small-cap companies across developed and emerging markets globally. The Index is not actively managed and does not reflect any deductions for fees, expenses or taxes. An investor may not invest directly into the Index. |
28
| Grandeur Peak Global Reach Fund | Performance Update |
| October 31, 2023 (Unaudited) |
Growth of $10,000 for the period ended October 31, 2023
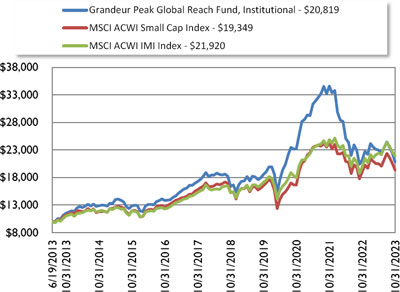
The chart shown above represent a hypothetical investment of $10,000 in the Fund’s Institutional Class shares for the period from inception to October 31, 2023. All returns reflect reinvested dividends, but do not reflect the deduction of taxes that an investor would pay on distributions or redemptions.
Investing in the Fund is subject to investment risks, including possible loss of the principal amount invested.
The Fund also offers Investor Class shares, performance for which is not reflected in the graphs above. The performance of Institutional Class shares may be higher or lower than the performance of the Investor Class shares shown in the graphs above based upon differences in fees paid by shareholders investing in the Investor Class shares and Institutional Class shares.
29
| Grandeur Peak Global Reach Fund | Performance Update |
| October 31, 2023 (Unaudited) |
| Regional Allocation (as a% of Net Assets)* | % of Net Assets | |||
| North America | 29.9 | % | ||
| Europe | 31.8 | % | ||
| Asia ex Japan | 16.3 | % | ||
| Japan | 9.6 | % | ||
| Latin America | 4.0 | % | ||
| Africa/Middle East | 3.7 | % | ||
| Australia/New Zealand | 1.8 | % | ||
| Cash, Cash Equivalents, & Other Net Assets | 2.9 | % | ||
| 100.0 | % | |||
| Top 10 Holdings (as a% of Net Assets) | % of Net Assets | |||
| B&M European Value Retail SA | 1.7 | % | ||
| BayCurrent Consulting, Inc. | 1.5 | % | ||
| PJT Partners, Inc. | 1.2 | % | ||
| CVS Group plc | 1.1 | % | ||
| JTC plc | 1.0 | % | ||
| Parex Resources, Inc. | 1.0 | % | ||
| Endava plc, ADR | 1.0 | % | ||
| EQT AB | 1.0 | % | ||
| Vietnam Technological & Commercial Joint Stock Bank | 1.0 | % | ||
| Globant SA | 0.9 | % | ||
| 11.4 | % | |||
| * | Holdings are subject to change, and may not reflect the current or future position of the portfolio. |
Please refer to the Schedule of Investments in this semi-annual report for a listing of the Fund’s holdings.
30
| Grandeur Peak Global Stalwarts Fund | Performance Update |
| October 31, 2023 (Unaudited) |
Annualized Total Return Performance for the periods ended October 31, 2023
| Since | Expense Ratio(b) | ||||||
| Six Months | 1 Year | 3 Years | 5 Years | Inception(a) | Gross | Net(c) | |
| Grandeur Peak Global Stalwarts Fund –Investor (GGSOX) | -11.06% | -5.92% | -7.31% | 2.94% | 5.67% | 1.19% | 1.19% |
| Grandeur Peak Global Stalwarts Fund –Institutional (GGSYX) | -10.96% | -5.67% | -7.07% | 3.20% | 5.94% | 0.94% | 0.94% |
| MSCI ACWI Mid Cap Index(d) | -6.08% | 3.65% | 4.21% | 5.27% | 6.41% | ||
| MSCI ACWI Small Cap Index(e) | -5.62% | 1.78% | 5.15% | 4.92% | 6.63% | ||
Performance data quoted represents past performance. Past performance does not guarantee future results. Investment return and principal value of an investment will fluctuate so that an investor’s shares, when sold or redeemed, may be worth more or less than the original cost. The Fund imposes a 2.00% redemption fee on shares held for less than 60 days. Current performance data may be higher or lower than actual data quoted. For the most current month-end performance data, please call 1-855-377-PEAK (7325).
The table does not reflect the deduction of taxes a shareholder would pay on Fund distributions or redemption of Fund shares.
Subject to investment risks, including possible loss of the principal amount invested.
Returns for periods less than 1 year are cumulative.
| (a) | Fund inception date of September 1, 2015. The Fund reorganized into the Trust on October 20, 2023. |
| (b) | Ratios as of the Prospectus dated October 20, 2023 and may differ from the ratios presented in the Financial Highlights. |
| (c) | Grandeur Peak Global Advisors, LLC (the “Adviser”), has agreed to waive and/or reimburse fees or expenses in order to limit Total Annual Fund Operating Expenses After Fee Waiver/ Expense Reimbursement (excluding any front-end or contingent deferred loads, brokerage fees and commissions, acquired fund fees and expenses, borrowing costs (such as interest and dividend expense on securities sold short), taxes, and extraordinary expenses, such as litigation expenses (which may increase indemnification of the Funds’ officers and trustees, contractual indemnification of the Fund’s service providers (other than the Advisor))) to 1.35% and 1.10% of the Fund’s average daily net assets for the Fund’s Investor Class Shares and Institutional Class Shares, respectively.This agreement (the “Expense Agreement”) shall continue at least through October 6, 2024. The Adviser will be permitted to recapture, on a class-by-class basis, expenses it has borne through the Expense Agreement to the extent that the Fund’s expenses in later periods fall below annual rates set forth in the Expense Agreement or in previous letter agreements; provided, however, that such recapture payments do not cause the Fund’s expense ratio (after recapture) to exceed the lesser of (i) the expense cap in effect at the time of the waiver and (ii) the expense cap in effect at the time of the recapture. Notwithstanding the foregoing, the Funds will not pay any such deferred fees and expenses more than three years after the date on which the fee and expenses were deferred. The Expense Agreement may not be terminated or modified prior to October 6, 2024, except with the approval of the Trust’s Board of Trustees. |
| (d) | The MSCI ACWI Mid Cap Index is designed to measure the equity market performance of performance of mid-cap companies across developed and emerging markets globally. MSCI makes no express or implied warranties or representations and shall have no liability whatsoever with respect to any MSCI data contained herein. The MSCI data may not be further redistributed or used to create indices or financial products. The Index is not actively managed and does not reflect any deductions for fees, expenses or taxes. An investor may not invest directly into the Index. |
| (e) | The MSCI ACWI Small Cap Index is designed to measure the equity market performance of small-cap companies across developed and emerging markets globally. The Index is not actively managed and does not reflect any deductions for fees, expenses or taxes. An investor may not invest directly into the Index. |
31
| Grandeur Peak Global Stalwarts Fund | Performance Update |
| October 31, 2023 (Unaudited) |
Growth of $10,000 for the period ended October 31, 2023
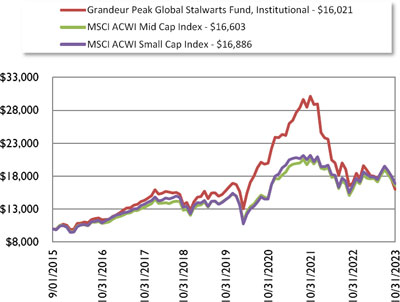
The chart shown above represent a hypothetical investment of $10,000 in the Fund’s Institutional Class shares for the period from inception to October 31, 2023. All returns reflect reinvested dividends, but do not reflect the deduction of taxes that an investor would pay on distributions or redemptions.
Investing in the Fund is subject to investment risks, including possible loss of the principal amount invested.
The Fund also offers Investor Class shares, performance for which is not reflected in the graphs above. The performance of Institutional Class shares may be higher or lower than the performance of the Investor Class shares shown in the graphs above based upon differences in fees paid by shareholders investing in the Investor Class shares and Institutional Class shares.
32
| Grandeur Peak Global Stalwarts Fund | Performance Update |
| October 31, 2023 (Unaudited) |
| Regional Allocation (as a% of Net Assets)* | % of Net Assets | |||
| North America | 44.2 | % | ||
| Europe | 30.3 | % | ||
| Asia ex Japan | 12.9 | % | ||
| Latin America | 5.5 | % | ||
| Japan | 5.2 | % | ||
| Africa/Middle East | 1.8 | % | ||
| Cash, Cash Equivalents, & Other Net Assets | 0.1 | % | ||
| 100.0 | % | |||
| Top 10 Holdings (as a% of Net Assets) | % of Net Assets | |||
| B&M European Value Retail SA | 3.4 | % | ||
| Littelfuse, Inc. | 3.3 | % | ||
| Globant SA | 3.2 | % | ||
| PJT Partners, Inc. | 2.8 | % | ||
| BayCurrent Consulting, Inc. | 2.5 | % | ||
| EQT AB | 2.4 | % | ||
| Silergy Corporation | 2.3 | % | ||
| Endava plc, ADR | 2.3 | % | ||
| Techtronic Industries Co., Ltd. | 2.3 | % | ||
| CVS Group plc | 2.1 | % | ||
| 26.6 | % | |||
| * | Holdings are subject to change, and may not reflect the current or future position of the portfolio. |
Please refer to the Schedule of Investments in this semi-annual report for a listing of the Fund’s holdings.
33
| Grandeur Peak International Opportunities Fund | Performance Update |
| October 31, 2023 (Unaudited) |
Annualized Total Return Performance for the periods ended October 31, 2023
| Since | Expense Ratio(b) | |||||||
| Six Months | 1 Year | 3 Years | 5 Years | 10 Years | Inception(a) | Gross | Net(c) | |
| Grandeur Peak International Opportunities Fund – Investor (GPIOX) | -14.88% | -2.68% | -6.04% | 2.64% | 4.00% | 7.67% | 1.60% | 1.55% |
| Grandeur Peak International Opportunities Fund – Institutional (GPIIX) | -14.45% | -2.48% | -5.77% | 2.85% | 4.25% | 7.91% | 1.35% | 1.30% |
| MSCI ACWI ex USA Small Cap Index(d) | -6.42% | 9.36% | 3.43% | 3.95% | 3.84% | 5.73% | ||
| MSCI ACWI IMI ex USA Index(e) | -6.80% | -8.14% | 3.52% | 3.95% | 3.13% | 4.96% | ||
Performance data quoted represents past performance. Past performance does not guarantee future results. Investment return and principal value of an investment will fluctuate so that an investor’s shares, when sold or redeemed, may be worth more or less than the original cost. The Fund imposes a 2.00% redemption fee on shares held for less than 60 days. Current performance data may be higher or lower than actual data quoted. For the most current month-end performance data, please call 1-855-377-PEAK (7325).
The table does not reflect the deduction of taxes a shareholder would pay on Fund distributions or redemption of Fund shares.
Subject to investment risks, including possible loss of the principal amount invested.
Returns for periods less than 1 year are cumulative.
| (a) | Fund inception date of October 17, 2011. The Fund reorganized into the Trust on October 20, 2023. |
| (b) | Ratios as of the Prospectus dated October 20, 2023 and may differ from the ratios presented in the Financial Highlights. |
| (c) | Grandeur Peak Global Advisors, LLC (the “Adviser”), has agreed to waive and/or reimburse fees or expenses in order to limit Total Annual Fund Operating Expenses After Fee Waiver/Expense Reimbursements (excluding any front-end or contingent deferred loads, brokerage fees and commissions, acquired fund fees and expenses, borrowing costs (such as interest and dividend expense on securities sold short), taxes, and extraordinary expenses, such as litigation expenses (which may increase indemnification of the Funds’ officers and trustees, contractual indemnification of the Fund’s service providers (other than the Advisor))) to 1.75% and 1.50% of the Fund’s average daily net assets for the Fund’s Investor Class Shares and Institutional Class Shares, respectively. This agreement (the “Expense Agreement”) shall continue at least through October 6, 2024. The Adviser will be permitted to recapture, on a class-by-class basis, expenses it has borne through the Expense Agreement to the extent that the Fund’s expenses in later periods fall below annual rates set forth in the Expense Agreement or in previous letter agreements; provided, however, that such recapture payments do not cause the Fund’s expense ratio (after recapture) to exceed the lesser of (i) the expense cap in effect at the time of the waiver and (ii) the expense cap in effect at the time of the recapture. Notwithstanding the foregoing, the Fund will not pay any such deferred fees and expenses more than three years after the date on which the fee and expenses were deferred. The Expense Agreement may not be terminated or modified prior to October 6, 2024, except with the approval of the Trust’s Board of Trustees. |
| (d) | The MSCI ACWI ex USA Small Cap Index is designed to measure the equity market performance of small-cap companies across developed and emerging markets globally, excluding the United States. MSCI makes no express or implied warranties or representations and shall have no liability whatsoever with respect to any MSCI data contained herein. The MSCI data may not be further redistributed or used to create indices or financial products. The Index is not actively managed and does not reflect any deductions for fees, expenses or taxes. An investor may not invest directly into the Index. |
| (e) | The MSCI ACWI ex USA IMI Index is designed to measure the equity market performance of large, mid, and small-cap companies across developed and emerging markets globally, excluding the United States. The Index is not actively managed and does not reflect any deductions for fees, expenses or taxes. An investor may not invest directly into the Index. |
34
| Grandeur Peak International Opportunities Fund | Performance Update |
| October 31, 2023 (Unaudited) |
Growth of $10,000 for the period ended October 31, 2023
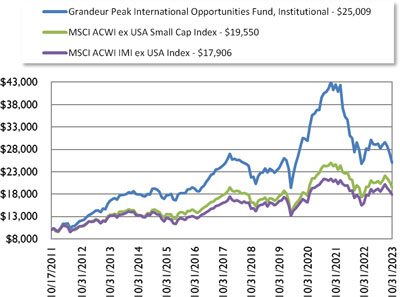
The chart shown above represent a hypothetical investment of $10,000 in the Fund’s Institutional Class shares for the period from inception to October 31, 2023. All returns reflect reinvested dividends, but do not reflect the deduction of taxes that an investor would pay on distributions or redemptions.
Investing in the Fund is subject to investment risks, including possible loss of the principal amount invested.
The Fund also offers Investor Class shares, performance for which is not reflected in the graphs above. The performance of Institutional Class shares may be higher or lower than the performance of the Investor Class shares shown in the graphs above based upon differences in fees paid by shareholders investing in the Investor Class shares and Institutional Class shares.
35
| Grandeur Peak International Opportunities Fund | Performance Update |
| October 31, 2023 (Unaudited) |
| Regional Allocation (as a% of Net Assets)* | % of Net Assets | |||
| Europe | 48.2 | % | ||
| Asia ex Japan | 17.5 | % | ||
| Japan | 15.5 | % | ||
| North America | 7.8 | % | ||
| Africa/Middle East | 5.2 | % | ||
| Latin America | 3.5 | % | ||
| Australia/New Zealand | 0.7 | % | ||
| Cash, Cash Equivalents, & Other Net Assets | 1.6 | % | ||
| 100.0 | % | |||
| Top 10 Holdings (as a% of Net Assets) | % of Net Assets | |||
| B&M European Value Retail SA | 2.5 | % | ||
| CVS Group plc | 2.3 | % | ||
| Volution Group PLC | 2.2 | % | ||
| Virbac SA | 2.2 | % | ||
| Endava plc, ADR | 2.1 | % | ||
| Sporton International, Inc. | 1.5 | % | ||
| Alten SA | 1.5 | % | ||
| Musti Group Oyj | 1.5 | % | ||
| JTC plc | 1.4 | % | ||
| Melexis NV | 1.3 | % | ||
| 18.4 | % | |||
| * | Holdings are subject to change, and may not reflect the current or future position of the portfolio. |
Please refer to the Schedule of Investments in this semi-annual report for a listing of the Fund’s holdings.
36
| Grandeur Peak International Stalwarts Fund | Performance Update |
| October 31, 2023 (Unaudited) |
Annualized Total Return Performance for the periods ended October 31, 2023
| Since | Expense Ratio(b) | ||||||
| Six Months | 1 Year | 3 Years | 5 Years | Inception(a) | Gross | Net(c) | |
| Grandeur Peak International Stalwarts Fund – Investor (GISOX) | -15.08% | -4.54% | -6.42% | 3.20% | 5.90% | 1.13% | 1.13% |
| Grandeur Peak International Stalwarts Fund – Institutional (GISYX) | -15.00% | -4.32% | -6.19% | 3.46% | 6.15% | 0.88% | 0.88% |
| MSCI ACWI ex USA Mid Cap Index(d) | -7.63% | 10.45% | 2.23% | 2.83% | 4.21% | ||
| MSCI ACWI ex USA Small Index(e) | -6.42% | 9.36% | 3.43% | 3.95% | 5.18% | ||
Performance data quoted represents past performance. Past performance does not guarantee future results. Investment return and principal value of an investment will fluctuate so that an investor’s shares, when sold or redeemed, may be worth more or less than the original cost. The Fund imposes a 2.00% redemption fee on shares held for less than 60 days. Current performance data may be higher or lower than actual data quoted. For the most current month-end performance data, please call 1-855-377-PEAK (7325).
The table does not reflect the deduction of taxes a shareholder would pay on Fund distributions or redemption of Fund shares.
Subject to investment risks, including possible loss of the principal amount invested.
Returns for periods less than 1 year are cumulative.
| (a) | Fund inception date of September 1, 2015. The Fund reorganized into the Trust on October 20, 2023. |
| (b) | Ratios as of the Prospectus dated October 20, 2023 and may differ from the ratios presented in the Financial Highlights. |
| (c) | Grandeur Peak Global Advisors, LLC (the “Adviser”), has agreed to waive and/or reimburse fees or expenses in order to limit Total Annual Fund Operating Expenses After Fee Waiver/ Expense Reimbursements (excluding any front-end or contingent deferred loads, brokerage fees and commissions, acquired fund fees and expenses, borrowing costs (such as interest and dividend expense on securities sold short), taxes, and extraordinary expenses, such as litigation expenses (which may increase indemnification of the Funds’ officers and trustees, contractual indemnification of the Fund’s service providers (other than the Advisor))) to 1.35% and 1.10% of the Fund’s average daily net assets for the Fund’s Investor Class Shares and Institutional Class Shares, respectively. This agreement (the “Expense Agreement”) shall continue at least through October 6, 2024. The Adviser will be permitted to recapture, on a class-by-class basis, expenses it has borne through the Expense Agreement to the extent that the Fund’s expenses in later periods fall below annual rates set forth in the Expense Agreement or in previous letter agreements; provided, however, that such recapture payments do not cause the Fund’s expense ratio (after recapture) to exceed the lesser of (i) the expense cap in effect at the time of the waiver and (ii) the expense cap in effect at the time of the recapture. Notwithstanding the foregoing, the Funds will not pay any such deferred fees and expenses more than three years after the date on which the fee and expenses were deferred. The Expense Agreement may not be terminated or modified prior to October 6, 2024, except with the approval of the Trust’s Board of Trustees. |
| (d) | The MSCI ACWI ex USA Mid Cap Index is designed to measure the equity market performance of midcap companies across developed and emerging markets globally, excluding the United States. MSCI makes no express or implied warranties or representations and shall have no liability whatsoever with respect to any MSCI data contained herein. The MSCI data may not be further redistributed or used to create indices or financial products. The Index is not actively managed and does not reflect any deductions for fees, expenses or taxes. An investor may not invest directly into the Index. |
| (e) | The MSCI ACWI ex USA Small Cap Index is designed to measure the equity market performance of small-cap companies across developed and emerging markets globally, excluding the United States. The Index is not actively managed and does not reflect any deductions for fees, expenses or taxes. An investor may not invest directly into the Index. |
37
| Grandeur Peak International Stalwarts Fund | Performance Update |
| October 31, 2023 (Unaudited) |
Growth of $10,000 for the period ended October 31, 2023

The chart shown above represent a hypothetical investment of $10,000 in the Fund’s Institutional Class shares for the period from inception to October 31, 2023. All returns reflect reinvested dividends, but do not reflect the deduction of taxes that an investor would pay on distributions or redemptions.
Investing in the Fund is subject to investment risks, including possible loss of the principal amount invested.
The Fund also offers Investor Class shares, performance for which is not reflected in the graphs above. The performance of Institutional Class shares may be higher or lower than the performance of the Investor Class shares shown in the graphs above based upon differences in fees paid by shareholders investing in the Investor Class shares and Institutional Class shares.
38
| Grandeur Peak International Stalwarts Fund | Performance Update |
| October 31, 2023 (Unaudited) |
| Regional Allocation (as a% of Net Assets)* | % of Net Assets | |||
| Europe | 46.1 | % | ||
| Asia ex Japan | 17.4 | % | ||
| North America | 13.0 | % | ||
| Japan | 8.8 | % | ||
| Africa/Middle East | 4.4 | % | ||
| Latin America | 3.4 | % | ||
| Australia/New Zealand | 1.1 | % | ||
| Cash, Cash Equivalents, & Other Net Assets | 5.8 | % | ||
| 100.0 | % | |||
| Top 10 Holdings (as a% of Net Assets) | % of Net Assets | |||
| B&M European Value Retail SA | 4.8 | % | ||
| Globant SA | 3.6 | % | ||
| EQT AB | 3.2 | % | ||
| BayCurrent Consulting, Inc. | 2.9 | % | ||
| Techtronic Industries Co., Ltd. | 2.8 | % | ||
| Endava plc, ADR | 2.7 | % | ||
| Silergy Corporation | 2.3 | % | ||
| Dino Polska SA | 2.3 | % | ||
| Melexis NV | 2.0 | % | ||
| Halma PLC | 1.9 | % | ||
| 28.5 | % | |||
| * | Holdings are subject to change, and may not reflect the current or future position of the portfolio. |
Please refer to the Schedule of Investments in this semi-annual report for a listing of the Fund’s holdings.
39
| Grandeur Peak US Stalwarts Fund | Performance Update |
| October 31, 2023 (Unaudited) |
Annualized Total Return Performance for the periods ended October 31, 2023
| Since | Expense Ratio(b) | |||||
| Six Months | 1 Year | 3 Years | Inception(a) | Gross | Net(c) | |
| Grandeur Peak US Stalwarts Fund – Institutional (GUSYX) | -4.01% | -6.66% | -3.40% | 12.77% | 0.90% | 0.90% |
| MSCI USA Mid Cap Index(d) | -4.57% | -2.18% | 6.05% | 17.20% | ||
| MSCI USA Small Cap Index(e) | -4.84% | -4.54% | 6.69% | 18.17% | ||
Performance data quoted represents past performance. Past performance does not guarantee future results. Investment return and principal value of an investment will fluctuate so that an investor’s shares, when sold or redeemed, may be worth more or less than the original cost. The Fund imposes a 2.00% redemption fee on shares held for less than 60 days. Current performance data may be higher or lower than actual data quoted. For the most current month-end performance data, please call 1-855-377-PEAK (7325).
The table does not reflect the deduction of taxes a shareholder would pay on Fund distributions or redemption of Fund shares.
Subject to investment risks, including possible loss of the principal amount invested.
Returns for periods less than 1 year are cumulative.
| (a) | Fund inception date of March 19, 2020. The Fund reorganized into the Trust on October 20, 2023. |
| (b) | Ratios as of the Prospectus dated October 20, 2023 and may differ from the ratios presented in the Financial Highlights. |
| (c) | Grandeur Peak Global Advisors, LLC (the “Adviser”), has agreed to waive and/or reimburse fees or expenses in order to limit Total Annual Fund Operating Expenses After Fee Waiver/Expense Reimbursement (excluding any front-end or contingent deferred loads, brokerage fees and commissions, acquired fund fees and expenses, borrowing costs (such as interest and dividend expense on securities sold short), taxes, and extraordinary expenses, such as litigation expenses (which may increase indemnification of the Funds’ officers and trustees, contractual indemnification of the Fund’s service providers (other than the Advisor))) to 1.00% of the Fund’s average daily net assets for the Fund’s Institutional Class Shares. This agreement (the “Expense Agreement”) shall continue at least through October 6, 2024. The Adviser will be permitted to recapture, on a class-by-class basis, expenses it has borne through the Expense Agreement to the extent that the Fund’s expenses in later periods fall below annual rates set forth in the Expense Agreement or in previous letter agreements; provided, however, that such recapture payments do not cause the Fund’s expense ratio (after recapture) to exceed the lesser of (i) the expense cap in effect at the time of the waiver and (ii) the expense cap in effect at the time of the recapture. Notwithstanding the foregoing, the Funds will not pay any such deferred fees and expenses more than three years after the date on which the fee and expenses were deferred. The Expense Agreement may not be terminated or modified prior to October 6, 2024, except with the approval of the Trust’s Board of Trustees. |
| (d) | The MSCI USA Mid Cap Index is designed to measure the performance of the mid cap segments of the US market. With 339 constituents, the index covers approximately 15% of the free float-adjusted market capitalization in the US. The Index is not actively managed and does not reflect any deductions for fees, expenses or taxes. An investor may not invest directly into the Index. |
| (e) | The MSCI USA Small Cap Index is designed to measure the performance of the small cap segment of the US equity market. With 1,740 constituents, the index represents approximately 14% of the free float-adjusted market capitalization in the US. The Index is not actively managed and does not reflect any deductions for fees, expenses or taxes. An investor may not invest directly into the Index. |
40
| Grandeur Peak US Stalwarts Fund | Performance Update |
| October 31, 2023 (Unaudited) |
Growth of $10,000 for the period ended October 31, 2023
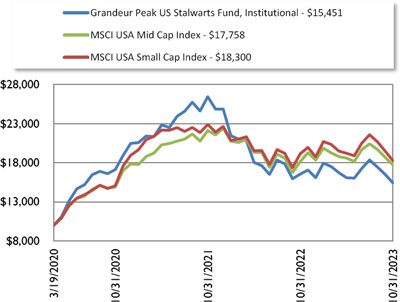
The chart shown above represent a hypothetical investment of $10,000 in the Fund’s Institutional Class shares for the period from inception to October 31, 2023. All returns reflect reinvested dividends, but do not reflect the deduction of taxes that an investor would pay on distributions or redemptions.
Investing in the Fund is subject to investment risks, including possible loss of the principal amount invested.
41
| Grandeur Peak US Stalwarts Fund | Performance Update |
| October 31, 2023 (Unaudited) |
| Regional Allocation (as a% of Net Assets)* | % of Net Assets | |||
| North America | 88.0 | % | ||
| Europe | 4.5 | % | ||
| Asia ex Japan | 2.8 | % | ||
| Latin America | 2.5 | % | ||
| Cash, Cash Equivalents, & Other Net Assets | 2.2 | % | ||
| 100.0 | % | |||
| Top 10 Holdings (as a% of Net Assets) | % of Net Assets | |||
| PJT Partners, Inc. | 5.0 | % | ||
| Littelfuse, Inc. | 4.0 | % | ||
| Paycom Software, Inc. | 3.1 | % | ||
| Techtronic Industries Co., Ltd. | 2.8 | % | ||
| Crowdstrike Holdings, Inc. | 2.7 | % | ||
| Qualys, Inc. | 2.5 | % | ||
| Globant SA | 2.5 | % | ||
| Monolithic Power Systems, Inc. | 2.4 | % | ||
| Tradeweb Markets, Inc. | 2.2 | % | ||
| Ollie’s Bargain Outlet Holdings, Inc. | 2.2 | % | ||
| 29.5 | % | |||
| * | Holdings are subject to change, and may not reflect the current or future position of the portfolio. |
Please refer to the Schedule of Investments in this semi-annual report for a listing of the Fund’s holdings.
42
| Grandeur Peak Funds® | Disclosure of Fund Expenses |
| October 31, 2023 (Unaudited) |
As a shareholder of a Fund, you incur two types of costs: (1) transaction costs, including sales charges (loads) on purchases of Class A shares; and (2) ongoing costs, including management fees, distribution and/or service (12b-1) fees, and other Fund expenses. This example is intended to help you understand your ongoing costs (in dollars) of investing in a Fund and to compare these costs with the ongoing costs of investing in other mutual funds.
The example for Grandeur Peak Emerging Markets Opportunities Fund, Grandeur Peak Global Contrarian Fund, Grandeur Peak Global Explorer Fund, Grandeur Peak Global Micro Cap Fund, Grandeur Peak Global Opportunities Fund, Grandeur Peak Global Reach Fund, Grandeur Peak Global Stalwarts Fund, Grandeur Peak International Opportunities Fund, Grandeur Peak International Stalwarts Fund, and Grandeur Peak US Stalwarts Fund is based on an investment of $1,000 invested at the beginning of the period and held for the entire period from May 1, 2023 through October 31, 2023.
Actual Expenses
The “Actual” columns in the table below provide information about actual account values and actual expenses. You may use the information below, together with the amount you invested, to estimate the expenses that you paid over the period. Simply divide your account value by $1,000 (for example, an $8,600 account value divided by $1,000 = 8.6), then multiply the result by the number in the table under the heading entitled “Expenses Paid During Period” to estimate the expenses you paid on your account during this period.
Hypothetical Example for Comparison Purposes
The “Hypothetical” columns in the table below provide information about hypothetical account values and hypothetical expenses based on the actual expense ratio of each of Grandeur Peak Emerging Markets Opportunities Fund, Grandeur Peak Global Contrarian Fund, Grandeur Peak Global Explorer Fund, Grandeur Peak Global Micro Cap Fund, Grandeur Peak Global Opportunities Fund, Grandeur Peak Global Reach Fund, Grandeur Peak Global Stalwarts Fund, Grandeur Peak International Opportunities Fund, Grandeur Peak International Stalwarts Fund, and Grandeur Peak US Stalwarts Fund and an assumed rate of return of 5% per year before expenses, which is not the Funds’ actual returns. The hypothetical account values and expenses may not be used to estimate the actual ending account balances or expenses you paid for the period. You may use this information to compare this 5% hypothetical example with the 5% hypothetical examples that appear in the shareholder reports of other funds.
Please note that the expenses shown in the table are meant to highlight your ongoing costs only and do not reflect any transactional costs, such as sales charges (loads), or redemption fees. Therefore, the table is useful in comparing ongoing costs only, and will not help you determine the relative total costs of owning different funds. In addition, if these transactional costs were included, your costs would have been higher.
43
| Grandeur Peak Funds® | Disclosure of Fund Expenses |
| October 31, 2023 (Unaudited) |
| Hypothetical | |||||||
| Actual | (5% return before expenses) | ||||||
| Ending | Ending | ||||||
| Funds’ | Beginning | Account | Expenses | Account | Expense Paid | ||
| Annualized | Account | Value | Paid During | Value | During | ||
| Expense | Value | 10/31/23 | Period* | 10/31/23 | Period | ||
| Grandeur Peak Emerging Markets Opportunities Fund - Investor Class | 1.73% | $1,000.00 | $937.30 | $8.42 | $1,016.44 | $8.77 | |
| Grandeur Peak Emerging Markets Opportunities Fund - Institutional Class | 1.49% | 1,000.00 | 938.70 | 7.25 | 1,017.65 | 7.55 | |
| Grandeur Peak Global Contrarian Fund - Institutional Class | 1.35% | 1,000.00 | 986.40 | 6.74 | 1,018.35 | 6.85 | |
| Grandeur Peak Global Explorer Fund - Institutional Class | 1.25% | 1,000.00 | 904.90 | 5.98 | 1,018.86 | 6.34 | |
| Grandeur Peak Global Micro Cap Fund - Institutional Class | 1.95% | 1,000.00 | 922.80 | 9.41 | 1,015.34 | 9.87 | |
| Grandeur Peak Global Opportunities Fund - Investor Class | 1.42% | 1,000.00 | 886.00 | 6.73 | 1,018.00 | 7.20 | |
| Grandeur Peak Global Opportunities Fund - Institutional Class | 1.31% | 1,000.00 | 886.00 | 6.21 | 1,018.55 | 6.65 | |
| Grandeur Peak Global Reach Fund - Investor Class | 1.50% | 1,000.00 | 904.40 | 7.18 | 1,017.60 | 7.61 | |
| Grandeur Peak Global Reach Fund - Institutional Class | 1.25% | 1,000.00 | 906.20 | 5.97 | 1,018.87 | 6.32 | |
| Grandeur Peak Global Stalwarts Fund - Investor Class | 1.25% | 1,000.00 | 889.40 | 5.93 | 1,018.86 | 6.34 | |
| Grandeur Peak Global Stalwarts Fund -International Class | 1.00% | 1,000.00 | 890.40 | 4.76 | 1,020.10 | 5.09 | |
| Grandeur Peak International Opportunities Fund - Investor Class | 1.60% | 1,000.00 | 851.20 | 7.45 | 1,017.09 | 8.11 | |
| Grandeur Peak International Opportunities Fund - Institutional Class | 1.33% | 1,000.00 | 855.50 | 6.22 | 1,018.44 | 6.76 | |
| Grandeur Peak International Stalwarts Fund - Investor Class | 1.17% | 1,000.00 | 849.20 | 5.42 | 1,019.27 | 5.92 | |
| Grandeur Peak International Stalwarts Fund - Institutional Class | 0.92% | 1,000.00 | 850.00 | 4.27 | 1,020.52 | 4.66 | |
| Grandeur Peak US Stalwarts Fund - Institutional Class | 0.91% | 1,000.00 | 959.90 | 4.47 | 1,020.57 | 4.61 | |
| * | Expenses are equal to the average account value over the period, multiplied by the Funds’ annualized expense ratio, multiplied by the number of days in the period (184) divided by the number of days in the fiscal year (366). |
44
| Grandeur Peak Emerging Markets Opportunities Fund | Portfolio of Investments |
| October 31, 2023 (Unaudited) |
| Shares | Fair Value | |||||||
| COMMON STOCKS — 91.86% | ||||||||
| Argentina — 2.75% | ||||||||
| Globant SA(a) | 65,091 | $ | 11,084,346 | |||||
| Brazil — 11.67% | ||||||||
| Armac Locacao Logistica E Servicos SA(a) | 883,000 | 2,124,777 | ||||||
| BR Advisory Partners(a) | 899,600 | 1,993,400 | ||||||
| CI&T, Inc.(a) | 260,514 | 1,198,364 | ||||||
| Grupo Mateus SA(a) | 4,950,300 | 5,705,577 | ||||||
| Hypera SA | 955,100 | 5,748,524 | ||||||
| Locaweb Servicos de Internet SA(a)(b)(c) | 5,433,200 | 5,863,359 | ||||||
| MercadoLibre, Inc.(a) | 3,813 | 4,730,942 | ||||||
| Pagseguro Digital Ltd., Class A(a) | 176,953 | 1,249,288 | ||||||
| Patria Investments Ltd.(a) | 451,839 | 5,824,206 | ||||||
| Raia Drogasil SA(a) | 897,208 | 4,593,810 | ||||||
| Track & Field Co. SA(a) | 861,300 | 2,274,178 | ||||||
| Vinci Partners Invest Ltd.(a) | 319,185 | 3,131,205 | ||||||
| XP, Inc., Class A(a) | 130,227 | 2,604,540 | ||||||
| 47,042,170 | ||||||||
| China — 16.36% | ||||||||
| Adicon Holdings Ltd.(a) | 1,395,400 | 1,993,620 | ||||||
| Aier Eye Hospital Group Co., Ltd.(a) | 1,359,600 | 3,402,670 | ||||||
| Alibaba Group Holding Ltd.(a) | 216,000 | 2,209,616 | ||||||
| ANTA Sports Products Ltd. | 554,600 | 6,261,642 | ||||||
| Beijing Huafeng Test & Control Technology Co., Ltd.(a) | 54,400 | 893,766 | ||||||
| Chaoju Eye Care Holdings Ltd.(a) | 4,173,000 | 2,218,419 | ||||||
| China Yongda Automobiles Services | ||||||||
| Holdings Ltd. | 6,195,000 | 2,375,004 | ||||||
| CSPC Pharmaceutical Group Ltd. | 3,028,720 | 2,643,514 | ||||||
| Hangzhou Tigermed Consulting Co., Ltd.(a) | 256,134 | 2,335,143 | ||||||
| JD.com, Inc.(a) | 148,500 | 1,893,908 | ||||||
| Man Wah Holdings Ltd.(a) | 6,759,500 | 4,198,098 | ||||||
| ManpowerGroup Greater China Ltd.(a)(c) | 1,494,550 | 1,126,845 | ||||||
| Shanghai Chicmax Cosmetic Co., Ltd.(a) | 397,800 | 1,245,468 | ||||||
| Shanghai Hanbell Precise Machinery Co., Ltd.(a) | 1,347,300 | 4,305,555 | ||||||
| Shenzhen Mindray Bio-Medical Electronics Co.(a) | 61,200 | 2,392,589 | ||||||
| Silergy Corporation(a) | 728,288 | 6,425,279 | ||||||
| Suofeiya Home Collection Co., Ltd., CLASS A(a) | 2,199,386 | 5,420,229 | ||||||
| TK Group Holdings Ltd.(a) | 10,499,117 | 1,811,291 | ||||||
| WuXi AppTec Co., Ltd.(a)(b)(c) | 871,500 | 10,468,804 | ||||||
| Wuxi Biologics Cayman, Inc.(a)(b)(c) | 373,500 | 2,319,683 | ||||||
| 65,941,143 | ||||||||
| Colombia — 1.28% | ||||||||
| Parex Resources, Inc. | 269,031 | 5,156,512 | ||||||
| Greece — 0.86% | ||||||||
| Sarantis SA(a) | 418,362 | 3,475,650 | ||||||
| Shares | Fair Value | |||||||
| COMMON STOCKS — (continued) | ||||||||
| Hong Kong — 2.39% | ||||||||
| Plover Bay Technologies Ltd.(a)(c) | 9,628,000 | $ | 2,743,739 | |||||
| Techtronic Industries Co., Ltd. | 755,400 | 6,882,849 | ||||||
| 9,626,588 | ||||||||
| India — 11.88% | ||||||||
| Ajanta Pharma Ltd.(a) | 150,942 | 3,196,331 | ||||||
| AU Small Finance Bank Ltd.(a)(b) | 270,705 | 2,175,341 | ||||||
| Bajaj Finance Ltd.(a) | 34,611 | 3,114,510 | ||||||
| Cera Sanitaryware Ltd.(a) | 29,843 | 3,040,517 | ||||||
| City Union Bank Ltd.(a) | 598,321 | 992,357 | ||||||
| Gulf Oil Lubricants India Ltd. | 324,958 | 2,436,663 | ||||||
| HCL Technologies Ltd. | 107,117 | 1,641,531 | ||||||
| Home First Finance Co. India Ltd.(a)(b)(c) | 226,876 | 2,458,417 | ||||||
| IndiaMart InterMesh Ltd.(a)(b)(c) | 161,943 | 5,153,267 | ||||||
| Kotak Mahindra Bank Ltd.(a) | 194,666 | 4,066,584 | ||||||
| Mankind Pharma Ltd.(a) | 130,182 | 2,722,871 | ||||||
| Metropolis Healthcare Ltd.(a)(b)(c) | 275,352 | 4,647,761 | ||||||
| Motherson Sumi Wiring India Ltd.(a) | 5,253,786 | 3,782,698 | ||||||
| Polycab India Ltd.(a) | 53,050 | 3,135,999 | ||||||
| SJS Enterprises Ltd.(a) | 464,559 | 3,775,245 | ||||||
| WNS Holdings Ltd., ADR(a) | 29,259 | 1,589,349 | ||||||
| 47,929,441 | ||||||||
| Indonesia — 4.58% | ||||||||
| Arwana Citramulia Tbk PT(a) | 41,025,200 | 1,699,299 | ||||||
| Avia Avian Tbk PT(a) | 95,716,200 | 3,003,521 | ||||||
| Bank BTPN Syariah Tbk PT(a) | 21,107,600 | 2,086,386 | ||||||
| Metrodata Electronics Tbk(a) | 100,348,900 | 3,180,381 | ||||||
| Selamat Sempurna Tbk PT(a) | 35,850,000 | 4,882,295 | ||||||
| Ultrajaya Milk Industry & Trading Co.(a) | 34,286,900 | 3,615,037 | ||||||
| 18,466,919 | ||||||||
| Malaysia — 0.79% | ||||||||
| Mr DIY Group Berhad(a) | 10,263,100 | 3,188,770 | ||||||
| Mexico 5.32% | ||||||||
| Arca Continental COM NPV | 240,000 | 2,153,501 | ||||||
| Bolsa Mexicana de Valores SAB(a) | 1,696,800 | 2,641,692 | ||||||
| Grupo Aeroportuario del Centro Norte SAB de CV(a) | 458,200 | 3,512,397 | ||||||
| Grupo Financiero Banorte SAB de CV | 272,700 | 2,209,000 | ||||||
| Grupo Rotoplas SAB de CV(a) | 1,534,300 | 2,065,329 | ||||||
| Regional SAB de CV(a) | 891,000 | 6,752,501 | ||||||
| Vesta Real Estate Corporation(a) | 67,516 | 2,122,703 | ||||||
| 21,457,123 | ||||||||
| Philippines — 3.66% | ||||||||
| Century Pacific Food, Inc.(a) | 6,407,200 | 3,159,591 | ||||||
| Concepcion Industrial Corporation(a) | 1,861,792 | 491,188 | ||||||
| Philippine Seven Corporation(a) | 791,050 | 1,058,820 | ||||||
| Puregold Price Club, Inc.(a) | 6,467,600 | 3,086,861 | ||||||
| Robinsons Land Corporation(a) | 8,321,200 | 2,042,929 | ||||||
| Wilcon Depot, Inc.(a) | 14,126,800 | 4,926,218 | ||||||
| 14,765,607 | ||||||||
| Poland — 5.27% | ||||||||
| Auto Partner SA | 426,942 | 2,417,686 | ||||||
See accompanying notes to financial statements.
45
| Grandeur Peak Emerging Markets Opportunities Fund | Portfolio of Investments |
| October 31, 2023 (Unaudited) |
| Shares | Fair Value | |||||||
| COMMON STOCKS — (continued) | ||||||||
| Poland — 5.27% (continued) | ||||||||
| Dino Polska SA(a)(b)(c) | 92,887 | $ | 8,788,725 | |||||
| Inter Cars SA(a) | 56,190 | 7,604,601 | ||||||
| Text SA | 90,164 | 2,427,665 | ||||||
| 21,238,677 | ||||||||
| Singapore — 2.04% | ||||||||
| iFast Corporation(a) | 1,022,400 | 4,928,381 | ||||||
| Keppel DC REIT(a) | 1,464,800 | 1,808,025 | ||||||
| Riverstone Holdings Ltd. | 3,475,200 | 1,497,515 | ||||||
| 8,233,921 | ||||||||
| South Africa — 1.71% | ||||||||
| Clicks Group Ltd.(a) | 316,876 | 4,669,197 | ||||||
| Italtile Ltd.(a) | 3,636,472 | 2,243,712 | ||||||
| 6,912,909 | ||||||||
| South Korea — 3.97% | ||||||||
| Coupang, Inc.(a) | 121,815 | 2,070,855 | ||||||
| Douzone Bizon Co., Ltd(a) | 93,973 | 1,897,490 | ||||||
| Eo Technics Co., Ltd.(a) | 28,840 | 2,971,392 | ||||||
| Hyundai Ezwel Co., Ltd.(a) | 478,474 | 2,187,059 | ||||||
| LEENO Industrial, Inc.(a) | 48,014 | 4,882,972 | ||||||
| Tokai Carbon Korea Co., Ltd.(a) | 32,334 | 1,982,566 | ||||||
| 15,992,334 | ||||||||
| Taiwan — 8.73% | ||||||||
| 91APP, Inc.(a) | 598,000 | 1,714,412 | ||||||
| Acer E-Enabling Service Business, Inc.(a) | 170,000 | 1,340,149 | ||||||
| Asia Vital Components Co., Ltd.(a) | 227,000 | 1,981,724 | ||||||
| ASPEED Technology, Inc.(a) | 25,000 | 1,978,506 | ||||||
| FineTek Co. Ltd.(a) | 742,818 | 1,990,059 | ||||||
| GEM Services, Inc.(a) | 881,000 | 1,774,262 | ||||||
| M3 Technology, Inc.(a) | 855,000 | 3,106,792 | ||||||
| Realtek Semiconductor Corporation(a) | 171,000 | 2,114,199 | ||||||
| Sinbon Electronics Co., Ltd.(a) | 778,000 | 6,636,262 | ||||||
| Sporton International, Inc.(a) | 1,050,805 | 6,924,687 | ||||||
| Voltronic Power Technology Corporation(a) | 73,108 | 2,915,405 | ||||||
| Wistron Information Technology and Services Corporation(a) | 819,248 | 2,737,218 | ||||||
| 35,213,675 | ||||||||
| Thailand — 1.47% | ||||||||
| Humanica PCL(a) | 8,383,900 | 2,192,097 | ||||||
| Netbay PCL(a) | 2,801,100 | 1,565,531 | ||||||
| TQM Alpha PCL(a) | 2,584,121 | 2,180,693 | ||||||
| 5,938,321 | ||||||||
| United States — 2.73% | ||||||||
| BizLink Holding, Inc.(a) | 677,202 | 5,244,697 | ||||||
| Frontage Holdings Corporation(a)(b)(c) | 15,271,982 | 3,805,676 | ||||||
| Genpact Ltd. | 59,905 | 2,009,214 | ||||||
| 11,059,587 | ||||||||
| Vietnam — 4.40% | ||||||||
| Asia Commercial Bank JSC(a) | 3,183,100 | 2,773,209 | ||||||
| FPT Corporation(a) | 2,646,642 | 8,943,178 | ||||||
| Shares | Fair Value | |||||||
| COMMON STOCKS — (continued) | ||||||||
| Vietnam — 4.40% (continued) | ||||||||
| Vietnam Technological & Commercial Joint Stock Bank(a) | 3,440,269 | $ | 3,879,634 | |||||
| Vincom Retail JSC(a) | 2,386,220 | 2,156,662 | ||||||
| 17,752,683 | ||||||||
| Total Common Stocks | ||||||||
| (Cost $354,511,283) | 370,476,376 | |||||||
| EXCHANGE-TRADED FUNDS — 1.06% | ||||||||
| iShares MSCI India ETF | 98,654 | 4,265,799 | ||||||
| Total Exchange-Traded Funds | ||||||||
| (Cost $4,362,963) | 4,265,799 | |||||||
| Total Investments — 92.92% | ||||||||
| (Cost $358,874,246) | 374,742,175 | |||||||
| Other Assets in Excess of Liabilities — 7.08% | $ | 28,544,040 | ||||||
| NET ASSETS — 100.00% | $ | 403,286,215 | ||||||
| (a) | Non-income producing security. |
| (b) | Security exempt from registration under Rule 144A of the Securities Act of 1933. These securities may be resold in the ordinary course of business in transactions exempt from registration, normally to qualified institutional buyers. As of October 31, 2023, these securities had a total aggregate market value of $45,681,033, representing 11.33% of net assets. |
| (c) | Security was purchased pursuant to Regulation S under the Securities Act of 1933, which exempts securities offered and sold outside of the United States from registration. Such security cannot be sold in the United States without either an effective registration statement filed pursuant to the Securities Act of 1933, or pursuant to an exemption from registration. As of October 31, 2023, the aggregate market value of these securities was $44,632,537, representing 11.07% of net assets. |
See accompanying notes to financial statements.
46
| Grandeur Peak Emerging Markets Opportunities Fund | Portfolio of Investments |
| October 31, 2023 (Unaudited) |
| Sector Composition (October 31, 2023) | |
| Technology | 20.3% |
| Consumer Discretionary | 19.7% |
| Financials | 12.1% |
| Health Care | 11.8% |
| Consumer Staples | 10.3% |
| Industrials | 9.8% |
| Communications | 3.3% |
| Real Estate | 2.0% |
| Materials | 1.3% |
| Energy | 1.3% |
| Equity | 1.0% |
| Other Assets in Excess of Liabilities | 7.1% |
| Total | 100.0% |
| Industry Composition (October 31, 2023) | |
| Food & Drug Stores | 6.9% |
| Banks | 6.2% |
| IT Services | 5.9% |
| Health Care Services | 5.5% |
| Online Marketplace | 4.0% |
| Auto Parts | 3.7% |
| Specialty & Generic Pharma | 3.6% |
| Internet Media & Services | 3.3% |
| Home Products Stores | 3.0% |
| Electronics Components | 2.8% |
| Furniture | 2.4% |
| Private Equity | 2.2% |
| Other Commercial Support Services | 2.2% |
| Semiconductor Mfg | 1.9% |
| Automotive Wholesalers | 1.9% |
| Application Software | 1.8% |
| Consumer Electronics | 1.8% |
| Semiconductor Devices | 1.8% |
| Other Machinery & Equipment | 1.7% |
| Packaged Food | 1.7% |
| Technology Distributors | 1.6% |
| Specialty Apparel Stores | 1.6% |
| Electrical Components | 1.5% |
| It Services | 1.4% |
| Specialty Chemicals | 1.3% |
| Exploration & Production | 1.3% |
| Personal Care Products | 1.2% |
| Flow Control Equipment | 1.1% |
| Equity | 1.1% |
| Other Industries (each less than 1%) | 16.9% |
| Other Assets in Excess of Liabilities | 7.1% |
| Total | 100.0% |
See accompanying notes to financial statements.
47
| Grandeur Peak Global Contrarian Fund | Portfolio of Investments |
| October 31, 2023 (Unaudited) |
| Shares | Fair Value | |||||||
| COMMON STOCKS — 97.76% | ||||||||
| Australia — 5.71% | ||||||||
| Atturra, Ltd.(a) | 2,223,659 | $ | 1,170,792 | |||||
| Emeco Holdings Ltd.(a) | 4,087,041 | 1,490,769 | ||||||
| Fiducian Group Ltd.(a) | 364,458 | 1,271,580 | ||||||
| Kogan.com Ltd.(a) | 180,232 | 500,771 | ||||||
| PeopleIN Ltd.(a) | 834,791 | 796,981 | ||||||
| QANTM Intellectual Property Ltd.(a) | 2,814,634 | 1,660,499 | ||||||
| 6,891,392 | ||||||||
| Bangladesh — 1.14% | ||||||||
| Square Pharmaceuticals Ltd.(a) | 715,482 | 1,371,454 | ||||||
| Belgium — 2.59% | ||||||||
| Melexis NV | 16,046 | 1,177,680 | ||||||
| X-Fab Silicon Foundries SE(a)(b)(c) | 215,040 | 1,943,530 | ||||||
| 3,121,210 | ||||||||
| Brazil — 3.07% | ||||||||
| Hypera SA | 115,000 | 692,158 | ||||||
| Pagseguro Digital Ltd., Class A(a) | 100,000 | 706,000 | ||||||
| Patria Investments Ltd.(a) | 129,543 | 1,669,809 | ||||||
| Vinci Partners Invest Ltd.(a) | 65,000 | 637,650 | ||||||
| 3,705,617 | ||||||||
| Canada — 2.12% | ||||||||
| BioSyent, Inc.(a) | 113,187 | 640,307 | ||||||
| Converge Technology Solutions Corporation(a) | 545,779 | 1,086,236 | ||||||
| Gildan Activewear, Inc.(a) | 29,170 | 828,555 | ||||||
| 2,555,098 | ||||||||
| China — 10.69% | ||||||||
| Alibaba Group Holding Ltd.(a) | 110,600 | 1,131,405 | ||||||
| Chaoju Eye Care Holdings Ltd.(a) | 4,013,500 | 2,133,626 | ||||||
| China Yongda Automobiles Services Holdings Ltd. | 7,470,500 | 2,863,998 | ||||||
| CSPC Pharmaceutical Group Ltd. | 1,750,300 | 1,527,689 | ||||||
| ManpowerGroup Greater China Ltd.(a) | 382,100 | 288,092 | ||||||
| TK Group Holdings Ltd.(a) | 8,707,283 | 1,502,167 | ||||||
| WH Group Ltd. | 1,912,000 | 1,141,055 | ||||||
| Xin Point Holdings Ltd.(a)(c) | 7,576,984 | 2,749,898 | ||||||
| 13,337,930 | ||||||||
| Colombia — 1.83% | ||||||||
| Canacol Energy Ltd.(a) | 865 | 4,279 | ||||||
| Parex Resources, Inc. | 114,772 | 2,199,833 | ||||||
| 2,204,112 | ||||||||
| France — 3.02% | ||||||||
| Antin Infrastructure Partners(a) | 125,456 | 1,492,354 | ||||||
| Thermador Groupe(a) | 8,677 | 616,178 | ||||||
| Virbac SA(a) | 5,347 | 1,533,535 | ||||||
| 3,642,067 | ||||||||
| Shares | Fair Value | |||||||
| COMMON STOCKS — (continued) | ||||||||
| Germany — 1.09% | ||||||||
| Friedrich Vorwerrk Group SE(a) | 100,000 | $ | 1,320,775 | |||||
| Hong Kong — 3.31% | ||||||||
| Plover Bay Technologies Ltd.(a)(c) | 13,996,539 | 3,988,663 | ||||||
| India — 3.41% | ||||||||
| City Union Bank Ltd.(a) | 900,496 | 1,493,536 | ||||||
| Gulf Oil Lubricants India Ltd. | 349,589 | 2,621,356 | ||||||
| 4,114,892 | ||||||||
| Indonesia — 1.39% | ||||||||
| Bank BTPN Syariah Tbk PT(a) | 9,322,200 | 921,456 | ||||||
| Selamat Sempurna Tbk PT(a) | 5,508,600 | 750,198 | ||||||
| 1,671,654 | ||||||||
| Japan 9.34% | ||||||||
| Beenos, Inc.(a) | 292,300 | 2,722,927 | ||||||
| Central Automotive Products Ltd.(a) | 48,900 | 1,088,817 | ||||||
| Gakujo Co., Ltd.(a) | 45,000 | 495,794 | ||||||
| geechs, Inc.(a) | 15,200 | 63,578 | ||||||
| Medikit Co., Ltd.(a) | 83,400 | 1,474,047 | ||||||
| Seria Co., Ltd.(a) | 60,000 | 830,480 | ||||||
| System Support, Inc.(a) | 90,100 | 1,156,157 | ||||||
| Systena Corporation(a) | 549,000 | 923,602 | ||||||
| ULS Group, Inc.(a) | 48,000 | 1,463,038 | ||||||
| YAMADA Consulting Group Co., Ltd.(a) | 102,700 | 1,058,337 | ||||||
| 11,276,777 | ||||||||
| Netherlands — 1.11% | ||||||||
| Flow Traders Ltd.(a) | 73,342 | 1,340,477 | ||||||
| Oman — 0.99% | ||||||||
| Tethys Oil AB(a) | 234,129 | 1,195,072 | ||||||
| Philippines — 1.06% | ||||||||
| AllHome Corporation(a) | 15,088,000 | 398,591 | ||||||
| Concepcion Industrial Corporation(a) | 1,259,700 | 332,341 | ||||||
| Pryce Corporation(a) | 6,013,600 | 550,735 | ||||||
| 1,281,667 | ||||||||
| Poland — 1.79% | ||||||||
| Auto Partner SA | 202,656 | 1,147,599 | ||||||
| Inter Cars SA(a) | 7,500 | 1,015,030 | ||||||
| 2,162,629 | ||||||||
| Singapore — 4.12% | ||||||||
| Riverstone Holdings Ltd. | 11,534,575 | 4,970,420 | ||||||
| South Korea — 0.66% | ||||||||
| MegaStudyEdu Co., Ltd.(a) | 17,400 | 796,624 | ||||||
| Sweden — 1.43% | ||||||||
| Fasadgruppen Group AB(a) | 122,140 | 520,812 | ||||||
| Knowit AB | 40,760 | 511,186 | ||||||
See accompanying notes to financial statements.
48
| Grandeur Peak Global Contrarian Fund | Portfolio of Investments |
| October 31, 2023 (Unaudited) |
| Shares | Fair Value | |||||||
| COMMON STOCKS — (continued) | ||||||||
| Sweden — 1.43% (continued) | ||||||||
| RVRC Holding AB(a) | 200,000 | $ | 690,133 | |||||
| 1,722,131 | ||||||||
| Taiwan — 2.67% | ||||||||
| Allied Supreme Corporation(a) | 100,000 | 959,229 | ||||||
| FineTek Co. Ltd.(a) | 179,465 | 480,799 | ||||||
| Fuzetec Technology Co., Ltd.(a) | 487,363 | 693,359 | ||||||
| M3 Technology, Inc.(a) | 81,000 | 294,328 | ||||||
| Sporton International, Inc.(a) | 120,750 | 795,729 | ||||||
| 3,223,444 | ||||||||
| United Kingdom — 12.82% | ||||||||
| B&M European Value Retail SA | 364,661 | 2,343,502 | ||||||
| CVS Group plc(a) | 35,386 | 630,019 | ||||||
| Endava plc, ADR(a) | 32,262 | 1,618,262 | ||||||
| Foresight Group Holdings Ltd.(a) | 234,417 | 1,048,387 | ||||||
| FRP Advisory Group PLC(a) | 1,501,096 | 2,079,686 | ||||||
| Hotel Chocolat Group PLC(a) | 206,346 | 339,797 | ||||||
| Intermediate Capital Group PLC(a) | 58,127 | 921,524 | ||||||
| Manolete Partners PLC(a) | 171,578 | 308,609 | ||||||
| Marlowe PLC(a) | 150,000 | 1,009,917 | ||||||
| Petershill Partners PLC(a)(b)(c) | 2,889,630 | 5,183,381 | ||||||
| 15,483,084 | ||||||||
| United States — 18.02% | ||||||||
| Bank of NT Butterfield & Son Ltd. (The) | 81,306 | 2,053,789 | ||||||
| Barrett Business Services, Inc. | 14,825 | 1,355,894 | ||||||
| BizLink Holding, Inc.(a) | 104,324 | 807,954 | ||||||
| Bowman Consulting Group Ltd.(a) | 22,146 | 588,419 | ||||||
| Dollar General Corporation | 6,000 | 714,240 | ||||||
| Enhabit, Inc.(a) | 37,835 | 278,844 | ||||||
| Esquire Financial Holdings, Inc.(a) | 35,450 | 1,623,610 | ||||||
| Evercore, Inc., Class A | 14,176 | 1,845,432 | ||||||
| Frontage Holdings Corporation(a)(b)(c) | 4,749,000 | 1,183,419 | ||||||
| GQG Partners, Inc.(a) | 1,106,824 | 912,757 | ||||||
| Hackett Group, Inc. (The) | 70,290 | 1,566,763 | ||||||
| Healthcare Services Group, Inc. | 90,601 | 860,710 | ||||||
| Littelfuse, Inc. | 5,485 | 1,188,435 | ||||||
| P10, Inc.(a) | 86,768 | 817,355 | ||||||
| Perella Weinberg Partners LP | 195,700 | 1,919,817 | ||||||
| Plumas Bancorp(a) | 53,575 | 1,829,586 | ||||||
| Sprouts Farmers Market, Inc.(a) | 27,343 | 1,148,953 | ||||||
| Western Alliance Bancorp | 25,730 | 1,057,503 | ||||||
| 21,753,480 | ||||||||
| Vietnam — 4.01% | ||||||||
| Asia Commercial Bank JSC(a) | 1,213,800 | 1,057,498 | ||||||
| FPT Corporation(a) | 637,267 | 2,153,367 | ||||||
| Vietnam Technological & Commercial Joint Stock Bank(a) | 1,445,900 | 1,630,560 | ||||||
| 4,841,425 | ||||||||
| Total Common Stocks (Cost $127,610,941) | 117,972,094 | |||||||
| Shares | Fair Value | |||||||
| Total Investments — 97.76% | ||||||||
| (Cost $127,610,941) | $ | 117,972,094 | ||||||
| Other Assets in Excess of Liabilities — 2.24% | 2,702,157 | |||||||
| NET ASSETS — 100.00% | $ | 120,674,251 | ||||||
| (a) | Non-income producing security. |
| (b) | Security exempt from registration under Rule 144A of the Securities Act of 1933. These securities may be resold in the ordinary course of business in transactions exempt from registration, normally to qualified institutional buyers. As of October 31, 2023, these securities had a total aggregate market value of $8,310,330, representing 6.89% of net assets. |
| (c) | Security was purchased pursuant to Regulation S under the Securities Act of 1933, which exempts securities offered and sold outside of the United States from registration. Such security cannot be sold in the United States without either an effective registration statement filed pursuant to the Securities Act of 1933, or pursuant to an exemption from registration. As of October 31, 2023, the aggregate market value of these securities was $15,048,891, representing 12.47% of net assets. |
See accompanying notes to financial statements.
49
| Grandeur Peak Global Contrarian Fund | Portfolio of Investments |
| October 31, 2023 (Unaudited) |
| Sector Composition (October 31, 2023) | |
| Financials | 27.4% |
| Technology | 15.8% |
| Industrials | 15.7% |
| Health Care | 13.6% |
| Consumer Discretionary | 11.4% |
| Consumer Staples | 5.4% |
| Energy | 3.9% |
| Materials | 3.4% |
| Communications | 0.7% |
| Utilities | 0.5% |
| Other Assets in Excess of Liabilities | 2.2% |
| Total | 100.0% |
| Industry Composition (October 31, 2023) | |
| Banks | 9.7% |
| Private Equity | 5.6% |
| Health Care Supplies | 5.3% |
| It Services | 5.3% |
| Specialty & Generic Pharma | 4.8% |
| Professional Services | 4.6% |
| Investment Companies | 4.3% |
| Institutional Brokerage | 4.2% |
| Online Marketplace | 3.6% |
| Communications Equipment | 3.3% |
| Mass Merchants | 3.2% |
| IT Services | 3.1% |
| Exploration & Production | 2.8% |
| Health Care Services | 2.5% |
| Automotive Retailers | 2.4% |
| Fabricated Metal & Hardware | 2.3% |
| Specialty Chemicals | 2.2% |
| Other Commercial Support Services | 2.0% |
| Automotive Wholesalers | 1.7% |
| Wealth Management | 1.7% |
| Investment Management | 1.6% |
| Semiconductor Manufacturing | 1.6% |
| Auto Parts | 1.6% |
| Electrical Components | 1.6% |
| Apparel, Footwear & Acc Design | 1.3% |
| Rubber & Plastic | 1.2% |
| Industrial Wholesale & Rental | 1.2% |
| Packaged Food | 1.2% |
| Semiconductor Devices | 1.2% |
| Midstream - Oil & Gas | 1.1% |
| Biotech | 1.0% |
| Food & Drug Stores | 1.0% |
| Other Industries (each less than 1%) | 7.5% |
| Other Assets in Excess of Liabilities | 2.2% |
| Total | 100.0% |
See accompanying notes to financial statements.
50
| Grandeur Peak Global Explorer Fund | Portfolio of Investments |
| October 31, 2023 (Unaudited) |
| Shares | Fair Value | |||||||
| COMMON STOCKS — 99.31% | ||||||||
| Argentina — 0.98% | ||||||||
| Globant SA(a) | 620 | $ | 105,580 | |||||
| Australia — 3.28% | ||||||||
| Atturra, Ltd.(a) | 75,437 | 39,719 | ||||||
| Domino’s Pizza Enterprises Ltd.(a) | 957 | 30,840 | ||||||
| EQT Holdings Ltd.(a) | 2,715 | 43,056 | ||||||
| HUB24 Ltd.(a) | 1,672 | 32,063 | ||||||
| Imdex Ltd.(a) | 16,571 | 17,345 | ||||||
| Johns Lyng Group Ltd.(a) | 8,843 | 34,219 | ||||||
| Kogan.com Ltd.(a) | 16,401 | 45,570 | ||||||
| Netwealth Group Ltd.(a) | 3,528 | 28,423 | ||||||
| PeopleIN Ltd.(a) | 28,341 | 27,057 | ||||||
| Pinnacle Investment Management Group(a) | 5,163 | 25,350 | ||||||
| QANTM Intellectual Property Ltd.(a) | 48,896 | 28,846 | ||||||
| 352,488 | ||||||||
| Belgium — 1.41% | ||||||||
| Melexis NV | 921 | 67,596 | ||||||
| Warehouses De Pauw CVA(a) | 1,754 | 43,288 | ||||||
| X-Fab Silicon Foundries SE(a)(b)(c) | 4,483 | 40,517 | ||||||
| 151,401 | ||||||||
| Brazil — 2.25% | ||||||||
| Armac Locacao Logistica E Servicos SA(a) | 6,700 | 16,122 | ||||||
| CI&T, Inc.(a) | 1,866 | 8,584 | ||||||
| Grupo Mateus SA(a) | 30,000 | 34,577 | ||||||
| Hypera SA | 4,200 | 25,279 | ||||||
| Locaweb Servicos de Internet SA(a)(b)(c) | 29,447 | 31,778 | ||||||
| Patria Investments Ltd.(a) | 6,651 | 85,732 | ||||||
| Vinci Partners Invest Ltd.(a) | 1,690 | 16,579 | ||||||
| XP, Inc., Class A(a) | 1,115 | 22,300 | ||||||
| 240,951 | ||||||||
| Canada — 1.32% | ||||||||
| Aritzia, Inc.(a) | 1,334 | 20,749 | ||||||
| Converge Technology Solutions Corporation(a) | 13,002 | 25,877 | ||||||
| Docebo, Inc.(a) | 905 | 35,717 | ||||||
| Gildan Activewear, Inc.(a) | 939 | 26,672 | ||||||
| Richelieu Hardware Ltd.(a) | 1,078 | 32,245 | ||||||
| 141,260 | ||||||||
| China — 5.84% | ||||||||
| Adicon Holdings Ltd.(a) | 37,000 | 52,862 | ||||||
| Aier Eye Hospital Group Co., Ltd.(a) | 6,700 | 16,768 | ||||||
| Alibaba Group Holding Ltd.(a) | 2,200 | 22,505 | ||||||
| Angelalign Technology, Inc.(a)(b)(c) | 2,500 | 17,188 | ||||||
| ANTA Sports Products Ltd. | 3,200 | 36,129 | ||||||
| Beijing Huafeng Test & Control Technology Co., Ltd.(a) | 842 | 13,834 | ||||||
| Chaoju Eye Care Holdings Ltd.(a) | 32,600 | 17,331 | ||||||
| China Yongda Automobiles Services Holdings Ltd. | 23,400 | 8,971 | ||||||
| CSPC Pharmaceutical Group Ltd. | 18,000 | 15,711 | ||||||
| Shares | Fair Value | |||||||
| COMMON STOCKS — (continued) | ||||||||
| China — 5.84% (continued) | ||||||||
| Guangzhou Kingmed Diagnostics Group Co., Ltd.(a) | 3,600 | $ | 30,459 | |||||
| Hangzhou Robam Appliances Co., Ltd.(a) | 8,831 | 27,883 | ||||||
| Hangzhou Tigermed Consulting Co., Ltd.(a) | 4,721 | 43,041 | ||||||
| Li Ning Company Ltd. | 4,000 | 12,268 | ||||||
| Man Wah Holdings Ltd.(a) | 56,900 | 35,339 | ||||||
| Shanghai Hanbell Precise Machinery Co., Ltd.(a) | 11,500 | 36,750 | ||||||
| Shenzhen Mindray Bio-Medical Electronics Co.(a) | 800 | 31,276 | ||||||
| Silergy Corporation(a) | 9,000 | 79,402 | ||||||
| Suofeiya Home Collection Co., Ltd., CLASS A(a) | 6,700 | 16,512 | ||||||
| TK Group Holdings Ltd.(a) | 32,900 | 5,676 | ||||||
| WuXi AppTec Co., Ltd.(a)(b)(c) | 5,534 | 66,476 | ||||||
| Wuxi Biologics Cayman, Inc.(a)(b)(c) | 6,500 | 40,369 | ||||||
| 626,750 | ||||||||
| Colombia — 0.97% | ||||||||
| Parex Resources, Inc. | 5,440 | 104,268 | ||||||
| Finland — 1.33% | ||||||||
| Evli Oyj(a) | 938 | 17,720 | ||||||
| Musti Group Oyj(a) | 4,222 | 83,153 | ||||||
| Revenio Group Oyj(a) | 1,134 | 26,355 | ||||||
| Vaisala Oyj(a) | 469 | 15,982 | ||||||
| 143,210 | ||||||||
| France — 3.31% | ||||||||
| Alten SA(a) | 604 | 71,145 | ||||||
| Antin Infrastructure Partners(a) | 3,050 | 36,281 | ||||||
| Aubay SA(a) | 398 | 13,331 | ||||||
| BioMerieux(a) | 302 | 28,925 | ||||||
| Esker SA(a) | 139 | 17,609 | ||||||
| Neurones SA(a) | 240 | 8,725 | ||||||
| Thermador Groupe(a) | 602 | 42,750 | ||||||
| Virbac SA(a) | 376 | 107,838 | ||||||
| Wavestone(a) | 624 | 28,363 | ||||||
| 354,967 | ||||||||
| Germany — 2.70% | ||||||||
| AIXTRON SE(a) | 570 | 15,962 | ||||||
| Atoss Software AG(a) | 177 | 37,277 | ||||||
| Dermapharm Holding SE(a) | 1,987 | 76,670 | ||||||
| Friedrich Vorwerrk Group SE(a) | 643 | 8,493 | ||||||
| Mensch und Maschine Software SE(a) | 783 | 40,894 | ||||||
| Nagarro SE(a) | 344 | 24,192 | ||||||
| Nexus AG(a) | 1,446 | 70,471 | ||||||
| QIAGEN NV(a) | 417 | 15,608 | ||||||
| 289,567 | ||||||||
| Hong Kong — 0.71% | ||||||||
| Plover Bay Technologies Ltd.(a)(c) | 106,861 | 30,453 | ||||||
| Techtronic Industries Co., Ltd. | 5,000 | 45,557 | ||||||
| 76,010 | ||||||||
See accompanying notes to financial statements.
51
| Grandeur Peak Global Explorer Fund | Portfolio of Investments |
| October 31, 2023 (Unaudited) |
| Shares | Fair Value | |||||||
| COMMON STOCKS — (continued) | ||||||||
| India — 3.27% | ||||||||
| Ajanta Pharma Ltd.(a) | 806 | $ | 17,068 | |||||
| AU Small Finance Bank Ltd.(a) | 2,529 | 20,323 | ||||||
| Bajaj Finance Ltd.(a) | 227 | 20,427 | ||||||
| Cera Sanitaryware Ltd.(a) | 125 | 12,735 | ||||||
| Gulf Oil Lubricants India Ltd. | 9,077 | 68,063 | ||||||
| IndiaMart InterMesh Ltd.(a)(b)(c) | 1,421 | 45,218 | ||||||
| Kotak Mahindra Bank Ltd.(a) | 3,363 | 70,254 | ||||||
| Motherson Sumi Wiring India Ltd.(a) | 25,701 | 18,505 | ||||||
| Polycab India Ltd.(a) | 284 | 16,788 | ||||||
| SJS Enterprises Ltd.(a) | 4,747 | 38,576 | ||||||
| WNS Holdings Ltd., ADR(a) | 413 | 22,434 | ||||||
| 350,391 | ||||||||
| Indonesia — 1.48% | ||||||||
| Arwana Citramulia Tbk PT(a) | 677,300 | 28,054 | ||||||
| Avia Avian Tbk PT(a) | 871,500 | 27,347 | ||||||
| Bank BTPN Syariah Tbk PT(a) | 123,800 | 12,237 | ||||||
| Metrodata Electronics Tbk(a) | 336,400 | 10,662 | ||||||
| Selamat Sempurna Tbk PT(a) | 445,500 | 60,671 | ||||||
| Ultrajaya Milk Industry & Trading Co.(a) | 188,000 | 19,822 | ||||||
| 158,793 | ||||||||
| Ireland — 0.86% | ||||||||
| ICON PLC, ADR(a) | 94 | 22,932 | ||||||
| Keywords Studios plc(a) | 3,027 | 48,008 | ||||||
| Uniphar PLC(a) | 9,638 | 21,369 | ||||||
| 92,309 | ||||||||
| Israel — 0.38% | ||||||||
| Monday.com Ltd.(a) | 117 | 15,209 | ||||||
| Wix.com Ltd.(a) | 324 | 25,887 | ||||||
| 41,096 | ||||||||
| Italy — 1.39% | ||||||||
| Interpump Group SpA(a) | 912 | 38,028 | ||||||
| Recordati Industria Chimica e Farmaceutica SpA(a) | 1,274 | 58,786 | ||||||
| Sesa SpA(a) | 515 | 51,914 | ||||||
| 148,728 | ||||||||
| Japan — 12.28% | ||||||||
| BayCurrent Consulting, Inc. | 2,900 | 71,919 | ||||||
| Beenos, Inc.(a) | 6,673 | 62,163 | ||||||
| Bengo4.com, Inc.(a) | 700 | 19,350 | ||||||
| Carenet, Inc. NPV(a) | 10,000 | 56,473 | ||||||
| Central Automotive Products Ltd.(a) | 1,300 | 28,946 | ||||||
| Charm Care Corporation KK(a) | 6,700 | 48,358 | ||||||
| Comture Corporation(a) | 1,200 | 15,818 | ||||||
| Creema Ltd.(a) | 3,600 | 7,054 | ||||||
| CrowdWorks, Inc.(a) | 1,200 | 9,888 | ||||||
| Cyber Security Cloud, Inc.(a) | 3,500 | 46,597 | ||||||
| Digital Arts, Inc.(a) | 600 | 16,388 | ||||||
| eGuarantee, Inc.(a) | 3,800 | 43,346 | ||||||
| eWeLL Co., Ltd.(a) | 600 | 12,370 | ||||||
| F&M Co., Ltd.(a) | 1,600 | 21,460 | ||||||
| FP Partner, Inc.(a) | 500 | 13,591 | ||||||
| Shares | Fair Value | |||||||
| COMMON STOCKS — (continued) | ||||||||
| Japan — 12.28% (continued) | ||||||||
| Gakujo Co., Ltd.(a) | 1,700 | $ | 18,730 | |||||
| GENOVA, Inc.(a) | 1,600 | 14,356 | ||||||
| GMO Payment Gateway, Inc. NPV(a) | 400 | 15,797 | ||||||
| Hennge KK(a) | 5,000 | 32,657 | ||||||
| Integral Corporation(a) | 2,600 | 29,195 | ||||||
| JMDC, Inc.(a) | 600 | 16,614 | ||||||
| M&A Capital Partners Company Ltd.(a) | 2,300 | 41,273 | ||||||
| M&A Research Institute, Inc.(a) | 1,200 | 25,809 | ||||||
| M3, Inc. | 700 | 10,686 | ||||||
| MarkLines Co., Ltd.(a) | 3,000 | 54,588 | ||||||
| Medikit Co., Ltd.(a) | 1,400 | 24,744 | ||||||
| Meitec Corporation(a) | 1,400 | 24,375 | ||||||
| MonotaRO Co., Ltd.(a) | 6,100 | 48,313 | ||||||
| OBIC Business Consultants Co., Ltd.(a) | 600 | 25,516 | ||||||
| Open Door, Inc.(a) | 1,400 | 6,863 | ||||||
| Oro Co., Ltd.(a) | 1,300 | 17,634 | ||||||
| Prestige International, Inc.(a) | 5,300 | 21,294 | ||||||
| SBI Global Asset Management Co.(a) | 5,400 | 19,096 | ||||||
| Seria Co., Ltd.(a) | 3,000 | 41,525 | ||||||
| SMS Company Ltd.(a) | 600 | 9,381 | ||||||
| Sun*, Inc.(a) | 7,300 | 60,586 | ||||||
| Synchro Food Co., Ltd.(a) | 7,400 | 26,949 | ||||||
| System Support, Inc.(a) | 2,300 | 29,513 | ||||||
| Syuppin Company, Ltd.(a) | 3,100 | 21,065 | ||||||
| TechnoPro Holdings, Inc.(a) | 700 | 13,577 | ||||||
| Tsuruha Holdings, Inc. | 400 | 29,160 | ||||||
| ULS Group, Inc.(a) | 2,500 | 76,200 | ||||||
| User Local, Inc.(a) | 1,300 | 13,362 | ||||||
| Visional, Inc.(a) | 800 | 38,687 | ||||||
| WDB coco Co., Ltd.(a) | 300 | 10,213 | ||||||
| Yakuodo Holdings Co., Ltd.(a) | 1,500 | 27,392 | ||||||
| 1,318,871 | ||||||||
| Luxembourg — 0.21% | ||||||||
| Sword Group(a) | 615 | 22,357 | ||||||
| Mexico — 0.80% | ||||||||
| Bolsa Mexicana de Valores SAB(a) | 10,300 | 16,036 | ||||||
| Grupo Aeroportuario del Centro Norte SAB de CV(a) | 1,151 | 8,823 | ||||||
| Regional SAB de CV(a) | 5,750 | 43,577 | ||||||
| Vesta Real Estate Corporation(a) | 550 | 17,292 | ||||||
| 85,728 | ||||||||
| Netherlands — 0.39% | ||||||||
| Alfen Beheer BV(a)(b)(c) | 229 | 7,191 | ||||||
| ASM International NV(a) | 40 | 16,446 | ||||||
| Redcare Pharmacy NV(a) | 162 | 18,045 | ||||||
| 41,682 | ||||||||
| Norway — 0.67% | ||||||||
| Bouvet ASA(a) | 7,352 | 35,411 | ||||||
| Nordic Semiconductor ASA(a) | 1,330 | 10,735 | ||||||
| SmartCraft ASA(a) | 13,607 | 25,947 | ||||||
| 72,093 | ||||||||
See accompanying notes to financial statements.
52
| Grandeur Peak Global Explorer Fund | Portfolio of Investments |
| October 31, 2023 (Unaudited) |
| Shares | Fair Value | |||||||
| COMMON STOCKS — (continued) | ||||||||
| Philippines — 0.83% | ||||||||
| Century Pacific Food, Inc.(a) | 56,600 | $ | 27,911 | |||||
| Philippine Seven Corporation(a) | 16,120 | 21,577 | ||||||
| Puregold Price Club, Inc.(a) | 35,797 | 17,085 | ||||||
| Wilcon Depot, Inc.(a) | 63,033 | 21,981 | ||||||
| 88,554 | ||||||||
| Poland — 1.16% | ||||||||
| Auto Partner SA | 5,436 | 30,783 | ||||||
| Dino Polska SA(a)(b)(c) | 654 | 61,879 | ||||||
| Inter Cars SA(a) | 233 | 31,534 | ||||||
| 124,196 | ||||||||
| Singapore — 0.65% | ||||||||
| iFast Corporation(a) | 5,800 | 27,958 | ||||||
| Keppel DC REIT(a) | 12,000 | 14,812 | ||||||
| Riverstone Holdings Ltd. | 61,445 | 26,478 | ||||||
| 69,248 | ||||||||
| South Africa — 0.22% | ||||||||
| Italtile Ltd.(a) | 37,806 | 23,326 | ||||||
| South Korea — 1.36% | ||||||||
| Coupang, Inc.(a) | 1,926 | 32,742 | ||||||
| Hyundai Ezwel Co., Ltd.(a) | 6,797 | 31,068 | ||||||
| LEENO Industrial, Inc.(a) | 283 | 28,781 | ||||||
| MegaStudyEdu Co., Ltd.(a) | 484 | 22,159 | ||||||
| SaraminHR Co., Ltd.(a) | 1,500 | 21,157 | ||||||
| Tokai Carbon Korea Co., Ltd.(a) | 162 | 9,933 | ||||||
| 145,840 | ||||||||
| Sweden — 4.75% | ||||||||
| AddTech AB(a) | 2,708 | 39,638 | ||||||
| Beijer Alma AB(a) | 3,001 | 47,691 | ||||||
| BoneSupport Holding AB(a) | 1,119 | 14,555 | ||||||
| Byggfakta Group Nordic Holdco AB(a) | 4,150 | 9,982 | ||||||
| EQT AB(a) | 2,050 | 37,261 | ||||||
| Knowit AB | 4,632 | 58,092 | ||||||
| Lifco AB, Class B(a) | 2,069 | 37,773 | ||||||
| Lyko Group AB(a)(c) | 640 | 5,492 | ||||||
| Nibe Industrier AB | 2,458 | 14,132 | ||||||
| OX2 AB(a) | 6,219 | 25,103 | ||||||
| Sagax AB(a) | 2,361 | 42,617 | ||||||
| Sdiptech AB(a) | 3,995 | 78,232 | ||||||
| Swedencare AB | 5,854 | 23,719 | ||||||
| Teqnion AB(a) | 865 | 15,924 | ||||||
| Vitec Software Group(a) | 628 | 25,023 | ||||||
| Vitrolife AB(a) | 2,684 | 34,887 | ||||||
| 510,121 | ||||||||
| Taiwan — 2.60% | ||||||||
| Acer E-Enabling Service Business, Inc.(a) | 2,000 | 15,766 | ||||||
| Brighten Optix Corporation(a) | 3,000 | 16,721 | ||||||
| FineTek Co. Ltd.(a) | 7,392 | 19,804 | ||||||
| Fuzetec Technology Co., Ltd.(a) | 11,000 | 15,649 | ||||||
| M3 Technology, Inc.(a) | 4,000 | 14,535 | ||||||
| Sinbon Electronics Co., Ltd.(a) | 7,000 | 59,709 | ||||||
| Shares | Fair Value | |||||||
| COMMON STOCKS — (continued) | ||||||||
| Taiwan — 2.60% (continued) | ||||||||
| Sporton International, Inc.(a) | 14,700 | $ | 96,872 | |||||
| Voltronic Power Technology Corporation(a) | 1,000 | 39,878 | ||||||
| 278,934 | ||||||||
| Thailand — 0.70% | ||||||||
| Humanica PCL(a) | 144,600 | 37,808 | ||||||
| Netbay PCL(a) | 15,500 | 8,663 | ||||||
| TQM Alpha PCL(a) | 33,500 | 28,270 | ||||||
| 74,741 | ||||||||
| United Kingdom — 10.32% | ||||||||
| AB Dynamics PLC(a) | 2,371 | 41,349 | ||||||
| Advanced Medical Solutions Group plc(a) | 8,113 | 19,108 | ||||||
| B&M European Value Retail SA | 14,245 | 91,546 | ||||||
| Big Technologies plc(a) | 5,807 | 12,703 | ||||||
| CVS Group plc(a) | 5,238 | 93,258 | ||||||
| Diploma plc | 1,236 | 42,690 | ||||||
| Elixirr International PLC(a) | 5,312 | 30,342 | ||||||
| Endava plc, ADR(a) | 2,016 | 101,123 | ||||||
| Foresight Group Holdings Ltd.(a) | 7,371 | 32,965 | ||||||
| FRP Advisory Group PLC(a) | 25,867 | 35,837 | ||||||
| GlobalData PLC(a) | 9,303 | 16,959 | ||||||
| Halma PLC | 1,912 | 42,872 | ||||||
| Hotel Chocolat Group PLC(a) | 11,805 | 19,440 | ||||||
| Impax Asset Management Group plc(a) | 15,905 | 74,418 | ||||||
| Intermediate Capital Group PLC(a) | 1,074 | 17,027 | ||||||
| JTC plc(a)(b)(c) | 11,287 | 87,584 | ||||||
| Marlowe PLC(a) | 8,129 | 54,731 | ||||||
| Pensionbee Group PLC(a) | 13,468 | 9,870 | ||||||
| Petershill Partners PLC(a)(b)(c) | 14,892 | 26,713 | ||||||
| Pets at Home Group PLC(a) | 14,481 | 49,417 | ||||||
| SDI Group PLC(a) | 15,401 | 18,998 | ||||||
| Softcat PLC(a) | 3,674 | 56,483 | ||||||
| Volution Group PLC(a) | 22,246 | 98,031 | ||||||
| YouGov plc(a) | 3,442 | 35,556 | ||||||
| 1,109,020 | ||||||||
| United States — 29.51% | ||||||||
| Alexandria Real Estate Equities, Inc. | 304 | 28,312 | ||||||
| Align Technology, Inc.(a) | 120 | 22,151 | ||||||
| Ares Management Corporation, CLASS A | 587 | 57,872 | ||||||
| Ashtead Group PLC | 729 | 41,675 | ||||||
| Barrett Business Services, Inc. | 465 | 42,529 | ||||||
| BILL Holdings, Inc.(a) | 238 | 21,727 | ||||||
| BizLink Holding, Inc.(a) | 8,283 | 64,149 | ||||||
| Blue Owl Capital, Inc. | 1,556 | 19,185 | ||||||
| Bowman Consulting Group Ltd.(a) | 1,197 | 31,804 | ||||||
| Cactus, Inc., Class A | 374 | 17,556 | ||||||
| Charles River Laboratories International, Inc.(a) | 194 | 32,662 | ||||||
| Chewy, Inc.(a) | 919 | 17,764 | ||||||
| Cloudflare, Inc., Class A(a) | 533 | 30,216 | ||||||
| Crowdstrike Holdings, Inc., CLASS A(a) | 350 | 61,870 | ||||||
| Datadog, Inc., Class A(a) | 288 | 23,463 | ||||||
See accompanying notes to financial statements.
53
| Grandeur Peak Global Explorer Fund | Portfolio of Investments |
| October 31, 2023 (Unaudited) |
| Shares | Fair Value | |||||||
| COMMON STOCKS — (continued) | ||||||||
| United States — 29.51% (continued) | ||||||||
| DexCom, Inc.(a) | 381 | $ | 33,844 | |||||
| Digital Realty Trust, Inc. | 177 | 22,012 | ||||||
| DigitalOcean Holdings, Inc.(a) | 1,665 | 34,066 | ||||||
| Dollar General Corporation | 177 | 21,070 | ||||||
| Doximity, Inc.(a) | 1,099 | 22,453 | ||||||
| Elastic NV(a) | 1,038 | 77,892 | ||||||
| Envista Holdings Corporation(a) | 633 | 14,730 | ||||||
| Esquire Financial Holdings, Inc.(a) | 536 | 24,549 | ||||||
| Etsy, Inc.(a) | 514 | 32,022 | ||||||
| Evercore, Inc., Class A | 335 | 43,610 | ||||||
| Fastenal Co. | 371 | 21,644 | ||||||
| Five Below, Inc.(a) | 175 | 30,447 | ||||||
| Freshpet, Inc.(a) | 402 | 23,075 | ||||||
| Frontage Holdings Corporation(a)(b)(c) | 260,200 | 64,840 | ||||||
| Genpact Ltd. | 1,797 | 60,271 | ||||||
| Gitlab, Inc.(a) | 378 | 16,360 | ||||||
| Global Industrial Co. | 678 | 21,662 | ||||||
| Goosehead Insurance, Inc., CLASS A(a) | 387 | 25,105 | ||||||
| GQG Partners, Inc.(a) | 64,344 | 53,062 | ||||||
| Hackett Group, Inc. (The) | 2,553 | 56,906 | ||||||
| HealthEquity, Inc.(a) | 545 | 39,066 | ||||||
| Herc Holdings, Inc. | 197 | 21,038 | ||||||
| Houlihan Lokey, Inc. | 549 | 55,185 | ||||||
| HubSpot, Inc.(a) | 47 | 19,917 | ||||||
| I3 Verticals, Inc., Class A(a) | 1,004 | 18,825 | ||||||
| Insperity, Inc. | 478 | 50,592 | ||||||
| Insulet Corporation(a) | 241 | 31,949 | ||||||
| JFrog Ltd.(a) | 3,740 | 84,113 | ||||||
| Joint Corporation (The)(a) | 2,745 | 21,438 | ||||||
| Littelfuse, Inc. | 327 | 70,851 | ||||||
| Lululemon Athletica, Inc.(a) | 70 | 27,544 | ||||||
| MarketAxess Holdings, Inc. | 182 | 38,903 | ||||||
| Marvell Technology, Inc. | 345 | 16,291 | ||||||
| MaxCyte, Inc.(a) | 9,334 | 27,629 | ||||||
| Medpace Holdings, Inc.(a) | 108 | 26,208 | ||||||
| Microchip Technology, Inc. | 769 | 54,822 | ||||||
| Moelis & Co., Class A | 615 | 25,609 | ||||||
| Monolithic Power Systems, Inc. | 71 | 31,364 | ||||||
| MSCI, Inc. | 47 | 22,163 | ||||||
| Neogen Corporation(a) | 1,056 | 15,724 | ||||||
| New Relic, Inc.(a) | 123 | 10,660 | ||||||
| NV5 Global, Inc.(a) | 572 | 53,968 | ||||||
| Ollie’s Bargain Outlet Holdings, Inc.(a) | 1,226 | 94,696 | ||||||
| P10, Inc.(a) | 9,190 | 86,571 | ||||||
| PagerDuty, Inc.(a) | 2,814 | 56,758 | ||||||
| Paycom Software, Inc. | 380 | 93,088 | ||||||
| Paylocity Holding Corporation(a) | 107 | 19,196 | ||||||
| Perella Weinberg Partners LP | 3,386 | 33,217 | ||||||
| PJT Partners, Inc., Class A | 1,302 | 102,025 | ||||||
| Planet Fitness, Inc., A(a) | 619 | 34,212 | ||||||
| Pool Corporation | 124 | 39,155 | ||||||
| Shares | Fair Value | |||||||
| COMMON STOCKS — (continued) | ||||||||
| United States — 29.51% (continued) | ||||||||
| Power Integrations, Inc. | 203 | $ | 14,074 | |||||
| Qualys, Inc.(a) | 567 | 86,723 | ||||||
| Rexford Industrial Realty, Inc. | 781 | 33,770 | ||||||
| Ross Stores, Inc. | 254 | 29,456 | ||||||
| Shoals Technologies Group, Inc., Class A(a) | 3,142 | 48,261 | ||||||
| Silicon Laboratories, Inc.(a) | 268 | 24,704 | ||||||
| SiTime Corporation(a) | 148 | 14,770 | ||||||
| Skechers USA, Inc., Class A(a) | 425 | 20,494 | ||||||
| Smartsheet, Inc., CLASS A(a) | 1,291 | 51,046 | ||||||
| Sprouts Farmers Market, Inc.(a) | 897 | 37,692 | ||||||
| Squarespace, Inc.(a) | 1,896 | 53,865 | ||||||
| Terreno Realty Corporation | 526 | 28,025 | ||||||
| Texas Roadhouse, Inc. | 296 | 30,056 | ||||||
| TPG, Inc.(a) | 1,346 | 37,203 | ||||||
| Tradeweb Markets, Inc., CLASS A | 429 | 38,614 | ||||||
| TriMas Corporation | 742 | 17,964 | ||||||
| United Rentals, Inc. | 56 | 22,751 | ||||||
| WW Grainger, Inc. | 30 | 21,895 | ||||||
| Zscaler, Inc.(a) | 129 | 20,471 | ||||||
| 3,167,166 | ||||||||
| Vietnam — 1.38% | ||||||||
| FPT Corporation(a) | 27,600 | 93,262 | ||||||
| Vietnam Technological & Commercial Joint Stock Bank(a) | 49,000 | 55,258 | ||||||
| 148,520 | ||||||||
| Total Common Stocks (Cost $12,767,391) | 10,658,166 | |||||||
| Total Investments — 99.31% | ||||||||
| (Cost $12,767,391) | 10,658,166 | |||||||
| Other Assets in Excess of Liabilities — 0.69% | 73,581 | |||||||
| NET ASSETS — 100.00% | $ | 10,731,747 | ||||||
| (a) | Non-income producing security. |
| (b) | Security exempt from registration under Rule 144A of the Securities Act of 1933. These securities may be resold in the ordinary course of business in transactions exempt from registration, normally to qualified institutional buyers. As of October 31, 2023, these securities had a total aggregate market value of $489,753, representing 4.57% of net assets. |
| (c) | Security was purchased pursuant to Regulation S under the Securities Act of 1933, which exempts securities offered and sold outside of the United States from registration. Such security cannot be sold in the United States without either an effective registration statement filed pursuant to the Securities Act of 1933, or pursuant to an exemption from registration. As of October 31, 2023, the aggregate market value of these securities was $525,698, representing 4.90% of net assets. |
See accompanying notes to financial statements.
54
| Grandeur Peak Global Explorer Fund | Portfolio of Investments |
| October 31, 2023 (Unaudited) |
| Sector Composition (October 31, 2023) | |
| Technology | 30.2% |
| Industrials | 15.3% |
| Financials | 14.7% |
| Health Care | 13.7% |
| Consumer Discretionary | 11.8% |
| Consumer Staples | 5.5% |
| Communications | 2.9% |
| Real Estate | 2.1% |
| Energy | 1.7% |
| Materials | 1.2% |
| Other Assets in Excess of Liabilities | 0.7% |
| Total | 100.0% |
| Industry Composition (October 31, 2023) | |
| Application Software | 8.5% |
| IT Services | 5.2% |
| Health Care Services | 4.9% |
| It Services | 4.3% |
| Investment Management | 3.8% |
| Infrastructure Software | 3.4% |
| Professional Services | 3.4% |
| Institutional Brokerage | 3.0% |
| Specialty & Generic Pharma | 3.0% |
| Private Equity | 2.9% |
| Mass Merchants | 2.6% |
| Semiconductor Devices | 2.3% |
| Online Marketplace | 2.3% |
| Food & Drug Stores | 2.3% |
| Internet Media & Services | 2.1% |
| Banks | 2.1% |
| Industrial Wholesale & Rental | 1.9% |
| Auto Parts | 1.8% |
| Medical Equipment | 1.7% |
| Engineering Services | 1.7% |
| Other Commercial Support Services | 1.7% |
| Electrical Components | 1.3% |
| Health Care Supplies | 1.3% |
| Specialty Apparel Stores | 1.2% |
| Wealth Management | 1.1% |
| Home Products Stores | 1.1% |
| Technology Distributors | 1.0% |
| Electronics Components | 1.0% |
| Exploration & Production | 1.0% |
| Industrial Reit | 1.0% |
| Other Industries (each less than 1%) | 25.1% |
| Other Assets in Excess of Liabilities | 0.7% |
| Total | 100.0% |
See accompanying notes to financial statements.
55
| Grandeur Peak Global Micro Cap Fund | Portfolio of Investments |
| October 31, 2023 (Unaudited) |
| Shares | Fair Value | |||||||
| COMMON STOCKS — 99.48% | ||||||||
| Australia — 8.72% | ||||||||
| Atturra, Ltd.(a) | 765,242 | $ | 402,912 | |||||
| EQT Holdings Ltd.(a) | 14,824 | 235,093 | ||||||
| Fiducian Group Ltd.(a) | 208,133 | 726,167 | ||||||
| Imdex Ltd.(a) | 178,344 | 186,671 | ||||||
| Kogan.com Ltd.(a) | 314,487 | 873,797 | ||||||
| Megaport Ltd.(a) | 28,540 | 172,174 | ||||||
| PeopleIN Ltd.(a) | 292,940 | 279,672 | ||||||
| Silk Logistics Holdings Ltd.(a) | 294,436 | 336,199 | ||||||
| Whispir Ltd.(a) | 909,737 | 178,901 | ||||||
| 3,391,586 | ||||||||
| Belgium — 0.79% | ||||||||
| X-Fab Silicon Foundries SE(a)(b)(c) | 34,079 | 308,006 | ||||||
| Brazil — 0.68% | ||||||||
| Locaweb Servicos de Internet SA(a) | 107,000 | 115,471 | ||||||
| Vinci Partners Invest Ltd.(a) | 15,260 | 149,701 | ||||||
| 265,172 | ||||||||
| Canada — 0.70% | ||||||||
| BioSyent, Inc.(a) | 48,100 | 272,105 | ||||||
| China — 1.17% | ||||||||
| Chaoju Eye Care Holdings Ltd.(a) | 380,000 | 202,013 | ||||||
| TK Group Holdings Ltd.(a) | 1,462,600 | 252,326 | ||||||
| 454,339 | ||||||||
| Finland — 2.25% | ||||||||
| Musti Group Oyj(a) | 36,931 | 727,364 | ||||||
| Revenio Group Oyj(a) | 6,394 | 148,600 | ||||||
| 875,964 | ||||||||
| France — 2.85% | ||||||||
| Aubay SA(a) | 3,600 | 120,584 | ||||||
| Esker SA(a) | 991 | 125,540 | ||||||
| Neurones SA(a) | 8,295 | 301,548 | ||||||
| Thermador Groupe(a) | 4,607 | 327,156 | ||||||
| Wavestone(a) | 5,180 | 235,455 | ||||||
| 1,110,283 | ||||||||
| Germany — 1.71% | ||||||||
| Friedrich Vorwerrk Group SE(a) | 5,285 | 69,803 | ||||||
| Mensch und Maschine Software SE(a) | 5,555 | 290,125 | ||||||
| Nexus AG(a) | 6,251 | 304,645 | ||||||
| 664,573 | ||||||||
| Greece — 1.81% | ||||||||
| Kri-Kri Milk Industry SA(a) | 42,365 | 364,961 | ||||||
| Sarantis SA(a) | 40,988 | 340,518 | ||||||
| 705,479 | ||||||||
| Hong Kong — 1.01% | ||||||||
| Plover Bay Technologies Ltd.(a)(c) | 1,383,600 | 394,291 | ||||||
| India — 5.63% | ||||||||
| Cera Sanitaryware Ltd.(a) | 5,942 | 605,393 | ||||||
| Shares | Fair Value | |||||||
| COMMON STOCKS — (continued) | ||||||||
| India — 5.63% (continued) | ||||||||
| Gulf Oil Lubricants India Ltd. | 98,696 | $ | 740,062 | |||||
| Metropolis Healthcare Ltd.(a)(b)(c) | 19,428 | 327,932 | ||||||
| SJS Enterprises Ltd.(a) | 31,500 | 255,985 | ||||||
| Vaibhav Global Ltd.(a) | 51,651 | 259,668 | ||||||
| 2,189,040 | ||||||||
| Indonesia — 1.08% | ||||||||
| Arwana Citramulia Tbk PT(a) | 2,517,600 | 104,281 | ||||||
| Selamat Sempurna Tbk PT(a) | 2,309,700 | 314,551 | ||||||
| 418,832 | ||||||||
| Ireland — 0.52% | ||||||||
| Uniphar PLC(a) | 90,411 | 200,456 | ||||||
| Japan — 24.71% | ||||||||
| Beenos, Inc.(a) | 97,100 | 904,536 | ||||||
| Bengo4.com, Inc.(a) | 6,600 | 182,444 | ||||||
| Carenet, Inc. NPV(a) | 87,300 | 493,015 | ||||||
| Central Automotive Products Ltd.(a) | 12,400 | 276,101 | ||||||
| Charm Care Corporation KK(a) | 70,600 | 509,559 | ||||||
| Comture Corporation(a) | 10,200 | 134,452 | ||||||
| Creema Ltd.(a) | 49,200 | 96,404 | ||||||
| CrowdWorks, Inc.(a) | 29,000 | 238,964 | ||||||
| Cyber Security Cloud, Inc.(a) | 14,700 | 195,709 | ||||||
| eGuarantee, Inc.(a) | 26,000 | 296,579 | ||||||
| eWeLL Co., Ltd.(a) | 7,500 | 154,626 | ||||||
| F&M Co., Ltd.(a) | 10,500 | 140,831 | ||||||
| FP Partner, Inc.(a) | 4,900 | 133,188 | ||||||
| GENOVA, Inc.(a) | 19,100 | 171,374 | ||||||
| Hennge KK(a) | 55,100 | 359,881 | ||||||
| Integral Corporation(a) | 13,400 | 150,465 | ||||||
| M&A Capital Partners Company Ltd.(a) | 31,000 | 556,293 | ||||||
| MarkLines Co., Ltd.(a) | 23,000 | 418,500 | ||||||
| Open Door, Inc.(a) | 11,300 | 55,391 | ||||||
| Oro Co., Ltd.(a) | 32,500 | 440,838 | ||||||
| Prestige International, Inc.(a) | 50,000 | 200,891 | ||||||
| Sun*, Inc.(a) | 74,200 | 615,824 | ||||||
| Synchro Food Co., Ltd.(a) | 53,100 | 193,378 | ||||||
| System Support, Inc.(a) | 38,700 | 496,596 | ||||||
| Syuppin Company, Ltd.(a) | 43,400 | 294,917 | ||||||
| ULS Group, Inc.(a) | 27,800 | 847,342 | ||||||
| User Local, Inc.(a) | 9,000 | 92,509 | ||||||
| WDB coco Co., Ltd.(a) | 5,000 | 170,213 | ||||||
| Yakuodo Holdings Co., Ltd.(a) | 31,200 | 569,762 | ||||||
| YMIRLINK, Inc.(a) | 26,600 | 214,274 | ||||||
| 9,604,856 | ||||||||
| Luxembourg — 0.70% | ||||||||
| Sword Group(a) | 7,482 | 271,994 | ||||||
| Norway — 1.29% | ||||||||
| Bouvet ASA(a) | 38,828 | 187,014 | ||||||
See accompanying notes to financial statements.
56
| Grandeur Peak Global Micro Cap Fund | Portfolio of Investments |
| October 31, 2023 (Unaudited) |
| Shares | Fair Value | |||||||
| COMMON STOCKS — (continued) | ||||||||
| Norway — 1.29% (continued) | ||||||||
| SmartCraft ASA(a) | 166,002 | $ | 316,548 | |||||
| 503,562 | ||||||||
| Oman — 0.86% | ||||||||
| Tethys Oil AB(a) | 65,711 | 335,411 | ||||||
| Philippines — 1.09% | ||||||||
| AllHome Corporation(a) | 3,701,098 | 97,775 | ||||||
| Pryce Corporation(a) | 3,545,900 | 324,739 | ||||||
| 422,514 | ||||||||
| Poland — 1.71% | ||||||||
| Auto Partner SA | 77,576 | 439,297 | ||||||
| Shoper Spolka Akcyjna(a) | 30,600 | 224,503 | ||||||
| 663,800 | ||||||||
| Singapore — 1.32% | ||||||||
| Riverstone Holdings Ltd. | 1,194,125 | 514,566 | ||||||
| South Korea — 0.84% | ||||||||
| Hyundai Ezwel Co., Ltd.(a) | 25,910 | 118,432 | ||||||
| MegaStudyEdu Co., Ltd.(a) | 4,572 | 209,320 | ||||||
| 327,752 | ||||||||
| Sweden — 6.94% | ||||||||
| BoneSupport Holding AB(a) | 13,900 | 180,800 | ||||||
| Knowit AB | 31,682 | 397,335 | ||||||
| Lyko Group AB(a)(c) | 10,547 | 90,513 | ||||||
| RVRC Holding AB(a) | 65,929 | 227,499 | ||||||
| Sdiptech AB(a) | 14,961 | 292,973 | ||||||
| Swedencare AB | 298,913 | 1,211,121 | ||||||
| Teqnion AB(a) | 10,963 | 201,817 | ||||||
| Vitec Software Group(a) | 2,401 | 95,669 | ||||||
| 2,697,727 | ||||||||
| Taiwan — 4.34% | ||||||||
| Acer E-Enabling Service Business, Inc.(a) | 40,000 | 315,329 | ||||||
| FineTek Co. Ltd.(a) | 80,204 | 214,872 | ||||||
| Fuzetec Technology Co., Ltd.(a) | 61,955 | 88,142 | ||||||
| GEM Services, Inc.(a) | 107,000 | 215,489 | ||||||
| M3 Technology, Inc.(a) | 53,000 | 192,585 | ||||||
| Sporton International, Inc.(a) | 76,699 | 505,438 | ||||||
| Wistron Information Technology and Services Corporation(a) | 47,477 | 158,627 | ||||||
| 1,690,482 | ||||||||
| Thailand — 1.04% | ||||||||
| Humanica PCL(a) | 1,280,000 | 334,676 | ||||||
| Netbay PCL(a) | 125,000 | 69,862 | ||||||
| 404,538 | ||||||||
| United Kingdom — 13.62% | ||||||||
| AB Dynamics PLC(a) | 19,430 | 338,851 | ||||||
| Advanced Medical Solutions Group plc(a) | 88,459 | 208,344 | ||||||
| CVS Group plc(a) | 5,800 | 103,264 | ||||||
| EKF Diagnostics Holdings PLC(a) | 400,873 | 130,565 | ||||||
| Elixirr International PLC(a) | 93,105 | 531,810 | ||||||
| Foresight Group Holdings Ltd.(a) | 65,739 | 294,006 | ||||||
| Franchise Brands PLC(a) | 133,559 | 218,313 | ||||||
| FRP Advisory Group PLC(a) | 325,991 | 451,642 | ||||||
| Shares | Fair Value | |||||||
| COMMON STOCKS — (continued) | ||||||||
| United Kingdom — 13.62% (continued) | ||||||||
| Hotel Chocolat Group PLC(a) | 89,449 | $ | 147,299 | |||||
| Impax Asset Management Group plc(a) | 75,916 | 355,204 | ||||||
| JTC plc(a)(b)(c) | 38,251 | 296,817 | ||||||
| Marlowe PLC(a) | 47,353 | 318,817 | ||||||
| Pensionbee Group PLC(a) | 256,812 | 188,199 | ||||||
| Premier Miton Group PLC(a) | 268,041 | 167,762 | ||||||
| SDI Group PLC(a) | 225,400 | 278,038 | ||||||
| Victorian Plumbing Group PLC(a) | 305,715 | 284,225 | ||||||
| Volution Group PLC(a) | 136,926 | 603,390 | ||||||
| XPS Pensions Group PLC(a)(c) | 147,229 | 381,116 | ||||||
| 5,297,662 | ||||||||
| United States 12.10% | ||||||||
| 4imprint Group PLC(a) | 2,421 | 147,701 | ||||||
| Barrett Business Services, Inc. | 7,561 | 691,529 | ||||||
| Bowman Consulting Group Ltd.(a) | 23,255 | 617,885 | ||||||
| FIGS, Inc.(a) | 40,006 | 220,433 | ||||||
| Frontage Holdings Corporation(a)(b)(c) | 1,093,800 | 272,568 | ||||||
| Global Industrial Co. | 15,340 | 490,113 | ||||||
| Hackett Group, Inc. (The) | 33,010 | 735,793 | ||||||
| Joint Corporation (The)(a) | 57,499 | 449,067 | ||||||
| LeMaitre Vascular, Inc. | 3,305 | 160,557 | ||||||
| MaxCyte, Inc.(a) | 115,776 | 342,697 | ||||||
| Perella Weinberg Partners LP | 35,540 | 348,647 | ||||||
| Plumas Bancorp(a) | 6,666 | 227,644 | ||||||
| 4,704,634 | ||||||||
| Total Common Stocks (Cost $40,989,391) | 38,689,624 | |||||||
| Total Investments — 99.48% | ||||||||
| (Cost $40,989,391) | 38,689,624 | |||||||
| Other Assets in Excess of Liabilities — 0.52% | 203,812 | |||||||
| NET ASSETS — 100.00% | $ | 38,893,436 | ||||||
| (a) | Non-income producing security. |
| (b) | Security exempt from registration under Rule 144A of the Securities Act of 1933. These securities may be resold in the ordinary course of business in transactions exempt from registration, normally to qualified institutional buyers. As of October 31, 2023, these securities had a total aggregate market value of $1,205,323, representing 3.10% of net assets. |
| (c) | Security was purchased pursuant to Regulation S under the Securities Act of 1933, which exempts securities offered and sold outside of the United States from registration. Such security cannot be sold in the United States without either an effective registration statement filed pursuant to the Securities Act of 1933, or pursuant to an exemption from registration. As of October 31, 2023, the aggregate market value of these securities was $2,071,243, representing 5.33% of net assets. |
See accompanying notes to financial statements.
57
| Grandeur Peak Global Micro Cap Fund | Portfolio of Investments |
| October 31, 2023 (Unaudited) |
| Sector Composition (October 31, 2023) | |
| Technology | 24.4% |
| Industrials | 19.3% |
| Consumer Discretionary | 18.6% |
| Health Care | 13.9% |
| Financials | 10.3% |
| Communications | 5.0% |
| Consumer Staples | 3.7% |
| Materials | 2.4% |
| Energy | 1.0% |
| Utilities | 0.8% |
| Other Assets in Excess of Liabilities | 0.5% |
| Total | 100.0% |
| Industry Composition (October 31, 2023) | |
| It Services | 10.7% |
| Professional Services | 9.4% |
| Application Software | 7.2% |
| Health Care Services | 5.2% |
| Online Marketplace | 4.8% |
| Internet Media & Services | 4.1% |
| Auto Parts | 3.5% |
| Other Spec Retail - Discr | 3.1% |
| Investment Management | 2.7% |
| Private Equity | 2.6% |
| Health Care Facilities | 2.5% |
| Infrastructure Software | 2.2% |
| Wealth Management | 1.9% |
| Specialty Chemicals | 1.9% |
| Health Care Supplies | 1.9% |
| Other Commercial Support Services | 1.9% |
| Industrial Wholesale & Rental | 1.8% |
| Specialty Online Retailers | 1.7% |
| Engineering Services | 1.6% |
| Biotech | 1.6% |
| Building Products | 1.6% |
| Comml & Res Bldg Equipment & Sys | 1.6% |
| Specialty Technology Hardware | 1.5% |
| Food & Drug Stores | 1.5% |
| Home Products Stores | 1.4% |
| Packaged Food | 1.3% |
| Specialty & Generic Pharma | 1.2% |
| Apparel, Footwear & Acc Design | 1.2% |
| Communications Equipment | 1.0% |
| Other Industries (each less than 1%) | 15.4% |
| Other Assets in Excess of Liabilities | 0.5% |
| Total | 100.0% |
See accompanying notes to financial statements.
58
| Grandeur Peak Global Opportunities Fund | Portfolio of Investments |
| October 31, 2023 (Unaudited) |
| Shares | Fair Value | |||||||
| COMMON STOCKS — 98.43% | ||||||||
| Argentina — 1.16% | ||||||||
| Globant SA(a) | 38,199 | $ | 6,504,908 | |||||
| Australia — 0.11% | ||||||||
| Fiducian Group Ltd.(a) | 182,850 | 637,957 | ||||||
| Belgium — 2.41% | ||||||||
| Melexis NV | 102,099 | 7,493,455 | ||||||
| X-Fab Silicon Foundries SE(a)(b)(c) | 666,184 | 6,020,967 | ||||||
| 13,514,422 | ||||||||
| Brazil — 1.39% | ||||||||
| Hypera SA | 784,200 | 4,719,917 | ||||||
| Patria Investments Ltd.(a) | 238,699 | 3,076,830 | ||||||
| 7,796,747 | ||||||||
| Canada — 1.50% | ||||||||
| Aritzia, Inc.(a) | 137,700 | 2,141,819 | ||||||
| Gildan Activewear, Inc.(a) | 119,825 | 3,403,550 | ||||||
| Richelieu Hardware Ltd.(a) | 95,665 | 2,861,479 | ||||||
| 8,406,848 | ||||||||
| China — 3.16% | ||||||||
| Hangzhou Robam Appliances Co., Ltd.(a) | 1,241,826 | 3,920,966 | ||||||
| Man Wah Holdings Ltd.(a) | 4,687,300 | 2,911,125 | ||||||
| Shanghai Hanbell Precise Machinery Co., Ltd.(a) | 1,202,300 | 3,842,180 | ||||||
| Silergy Corporation(a) | 553,008 | 4,878,881 | ||||||
| Suofeiya Home Collection Co., Ltd., CLASS A(a) | 871,633 | 2,148,077 | ||||||
| 17,701,229 | ||||||||
| Colombia — 0.63% | ||||||||
| Parex Resources, Inc. | 183,302 | 3,513,346 | ||||||
| Finland — 1.45% | ||||||||
| Musti Group Oyj(a) | 411,649 | 8,107,512 | ||||||
| France — 6.67% | ||||||||
| Alten SA(a) | 72,385 | 8,526,247 | ||||||
| Antin Infrastructure Partners(a) | 94,688 | 1,126,355 | ||||||
| BioMerieux(a) | 31,769 | 3,042,750 | ||||||
| Esker SA(a) | 14,780 | 1,872,331 | ||||||
| Neurones SA(a) | 110,960 | 4,033,735 | ||||||
| Thermador Groupe(a) | 64,104 | 4,552,205 | ||||||
| Virbac SA(a) | 40,133 | 11,510,259 | ||||||
| Wavestone(a) | 59,623 | 2,710,136 | ||||||
| 37,374,018 | ||||||||
| Germany — 2.98% | ||||||||
| Dermapharm Holding SE(a) | 131,338 | 5,067,821 | ||||||
| Friedrich Vorwerrk Group SE(a) | 60,903 | 804,391 | ||||||
| Nagarro SE(a) | 30,956 | 2,176,978 | ||||||
| Nexus AG(a) | 79,645 | 3,881,524 | ||||||
| QIAGEN NV(a) | 128,030 | 4,792,163 | ||||||
| 16,722,877 | ||||||||
| Shares | Fair Value | |||||||
| COMMON STOCKS — (continued) | ||||||||
| Hong Kong — 0.75% | ||||||||
| Techtronic Industries Co., Ltd. | 459,000 | $ | 4,182,192 | |||||
| India — 1.52% | ||||||||
| Cera Sanitaryware Ltd.(a) | 28,284 | 2,881,680 | ||||||
| Gulf Oil Lubricants India Ltd. | 186,873 | 1,401,247 | ||||||
| IndiaMart InterMesh Ltd.(a) | 30,514 | 971,001 | ||||||
| 8,526,663 | ||||||||
| Indonesia — 1.50% | ||||||||
| Arwana Citramulia Tbk PT(a) | 46,609,800 | 1,930,618 | ||||||
| Selamat Sempurna Tbk PT(a) | 33,500,600 | 4,562,339 | ||||||
| Ultrajaya Milk Industry & Trading Co.(a) | 18,240,200 | 1,923,154 | ||||||
| 8,416,111 | ||||||||
| Ireland — 1.21% | ||||||||
| ICON PLC, ADR(a) | 11,046 | 2,694,782 | ||||||
| Keywords Studios plc(a) | 256,516 | 4,068,268 | ||||||
| 6,763,050 | ||||||||
| Italy — 2.04% | ||||||||
| Interpump Group SpA(a) | 101,151 | 4,217,747 | ||||||
| Recordati Industria Chimica e Farmaceutica SpA(a) | 92,959 | 4,289,356 | ||||||
| Sesa SpA(a) | 29,070 | 2,930,382 | ||||||
| 11,437,485 | ||||||||
| Japan — 12.43% | ||||||||
| AIT Corporation(a) | 54,800 | 594,729 | ||||||
| BayCurrent Consulting, Inc. | 142,600 | 3,536,424 | ||||||
| Carenet, Inc. NPV(a) | 521,400 | 2,944,538 | ||||||
| Charm Care Corporation KK(a) | 191,500 | 1,382,161 | ||||||
| Comture Corporation(a) | 162,900 | 2,147,282 | ||||||
| Create SD Holdings Co., Ltd.(a) | 124,400 | 2,646,809 | ||||||
| CrowdWorks, Inc.(a) | 246,200 | 2,028,724 | ||||||
| F&M Co., Ltd.(a) | 72,100 | 967,041 | ||||||
| FP Partner, Inc.(a) | 75,700 | 2,057,622 | ||||||
| Funai Soken Holdings, Inc.(a) | 110,800 | 1,800,431 | ||||||
| Hennge KK(a) | 305,700 | 1,996,655 | ||||||
| Integral Corporation(a) | 247,600 | 2,780,242 | ||||||
| Kitz Corporation | 344,900 | 2,300,471 | ||||||
| M&A Capital Partners Company Ltd.(a) | 221,000 | 3,965,827 | ||||||
| MarkLines Co., Ltd.(a) | 247,400 | 4,501,594 | ||||||
| MonotaRO Co., Ltd.(a) | 216,500 | 1,714,717 | ||||||
| Prestige International, Inc.(a) | 807,000 | 3,242,375 | ||||||
| Seria Co., Ltd.(a) | 266,200 | 3,684,562 | ||||||
| Strike Co., Ltd. | 219,800 | 5,321,893 | ||||||
| Sun*, Inc.(a) | 367,100 | 3,046,754 | ||||||
| Synchro Food Co., Ltd.(a) | 482,000 | 1,755,329 | ||||||
| Trancom Co., Ltd.(a) | 92,570 | 4,232,295 | ||||||
| Tsuruha Holdings, Inc. | 45,000 | 3,280,554 | ||||||
| ULS Group, Inc.(a) | 13,800 | 420,623 | ||||||
| User Local, Inc.(a) | 113,700 | 1,168,693 | ||||||
| Visional, Inc.(a) | 65,000 | 3,143,328 | ||||||
| Yakuodo Holdings Co., Ltd.(a) | 164,800 | 3,009,509 | ||||||
| 69,671,182 | ||||||||
See accompanying notes to financial statements.
59
| Grandeur Peak Global Opportunities Fund | Portfolio of Investments |
| October 31, 2023 (Unaudited) |
| Shares | Fair Value | |||||||
| COMMON STOCKS — (continued) | ||||||||
| Luxembourg — 0.27% | ||||||||
| Sword Group(a) | 41,691 | $ | 1,515,595 | |||||
| Mexico — 2.21% | ||||||||
| Grupo Aeroportuario del Centro Norte SAB de CV(a) | 310,000 | 2,376,349 | ||||||
| Grupo Financiero Banorte SAB de CV | 349,100 | 2,827,877 | ||||||
| Regional SAB de CV(a) | 656,927 | 4,978,564 | ||||||
| Vesta Real Estate Corporation(a) | 69,644 | 2,189,607 | ||||||
| 12,373,397 | ||||||||
| Netherlands — 0.50% | ||||||||
| Redcare Pharmacy NV(a) | 25,369 | 2,825,788 | ||||||
| Norway — 0.94% | ||||||||
| Bouvet ASA(a) | 230,309 | 1,109,277 | ||||||
| Nordic Semiconductor ASA(a) | 169,734 | 1,370,028 | ||||||
| SmartCraft ASA(a) | 1,457,082 | 2,778,501 | ||||||
| 5,257,806 | ||||||||
| Philippines — 1.33% | �� | |||||||
| Century Pacific Food, Inc.(a) | 3,004,500 | 1,481,613 | ||||||
| Concepcion Industrial Corporation(a) | 1,020,252 | 269,168 | ||||||
| Puregold Price Club, Inc.(a) | 8,009,700 | 3,822,876 | ||||||
| Wilcon Depot, Inc.(a) | 5,330,600 | 1,858,857 | ||||||
| 7,432,514 | ||||||||
| Poland — 1.93% | ||||||||
| Dino Polska SA(a)(b)(c) | 88,606 | 8,383,668 | ||||||
| Inter Cars SA(a) | 17,951 | 2,429,439 | ||||||
| 10,813,107 | ||||||||
| Singapore — 0.86% | ||||||||
| Riverstone Holdings Ltd. | 11,229,300 | 4,838,872 | ||||||
| South Africa — 0.26% | ||||||||
| Italtile Ltd.(a) | 2,394,999 | 1,477,720 | ||||||
| South Korea — 0.90% | ||||||||
| Eo Technics Co., Ltd.(a) | 25,905 | 2,668,999 | ||||||
| LEENO Industrial, Inc.(a) | 23,594 | 2,399,484 | ||||||
| 5,068,483 | ||||||||
| Sweden — 5.12% | ||||||||
| AddTech AB(a) | 216,712 | 3,172,133 | ||||||
| Beijer Alma AB(a) | 240,995 | 3,829,816 | ||||||
| Byggfakta Group Nordic Holdco AB(a) | 570,528 | 1,372,264 | ||||||
| Hexpol AB | 380,806 | 3,366,955 | ||||||
| Knowit AB | 187,743 | 2,354,551 | ||||||
| Lifco AB, Class B(a) | 147,038 | 2,684,418 | ||||||
| Lyko Group AB(a)(c) | 48,531 | 416,487 | ||||||
| RVRC Holding AB(a) | 436,418 | 1,505,932 | ||||||
| Sdiptech AB(a) | 292,432 | 5,726,528 | ||||||
| Swedencare AB | 651,855 | 2,641,155 | ||||||
| Vitrolife AB(a) | 125,023 | 1,625,076 | ||||||
| 28,695,315 | ||||||||
| Taiwan — 1.65% | ||||||||
| Fuzetec Technology Co., Ltd.(a) | 278,482 | 396,190 | ||||||
| Shares | Fair Value | |||||||
| COMMON STOCKS — (continued) | ||||||||
| Taiwan — 1.65% (continued) | ||||||||
| M3 Technology, Inc.(a) | 712,000 | $ | 2,587,177 | |||||
| Sporton International, Inc.(a) | 949,151 | 6,254,798 | ||||||
| 9,238,165 | ||||||||
| United Kingdom — 17.80% | ||||||||
| B&M European Value Retail SA | 3,608,355 | 23,189,175 | ||||||
| City of London Investment Group PLC(a) | 385,437 | 1,501,295 | ||||||
| CVS Group plc(a) | 745,787 | 13,278,134 | ||||||
| Diploma plc | 82,742 | 2,857,819 | ||||||
| Elixirr International PLC(a) | 108,470 | 619,572 | ||||||
| Endava plc, ADR(a) | 253,670 | 12,724,087 | ||||||
| Foresight Group Holdings Ltd.(a) | 617,350 | 2,760,984 | ||||||
| FRP Advisory Group PLC(a) | 875,323 | 1,212,712 | ||||||
| GlobalData PLC(a) | 1,283,338 | 2,339,467 | ||||||
| Halma PLC | 156,992 | 3,520,128 | ||||||
| Impax Asset Management Group plc(a) | 609,471 | 2,851,664 | ||||||
| Intertek Group PLC(a) | 99,935 | 4,643,085 | ||||||
| JTC plc(a)(b)(c) | 602,443 | 4,674,783 | ||||||
| Marlowe PLC(a) | 660,886 | 4,449,599 | ||||||
| On The Beach Group PLC(a)(b)(c) | 1,126,330 | 1,300,391 | ||||||
| Petershill Partners PLC(a) | 1,147,692 | 2,058,715 | ||||||
| Pets at Home Group PLC(a) | 839,119 | 2,863,553 | ||||||
| Premier Miton Group PLC(a) | 1,939,173 | 1,213,692 | ||||||
| Softcat PLC(a) | 251,172 | 3,861,414 | ||||||
| Victorian Plumbing Group PLC(a) | 1,039,569 | 966,494 | ||||||
| Volution Group PLC(a) | 1,557,641 | 6,864,039 | ||||||
| 99,750,802 | ||||||||
| United States — 22.07% | ||||||||
| 4imprint Group PLC(a) | 49,399 | 3,013,745 | ||||||
| Bank of NT Butterfield & Son Ltd. (The) | 113,455 | 2,865,874 | ||||||
| BizLink Holding, Inc.(a) | 659,078 | 5,104,334 | ||||||
| Charles River Laboratories International, Inc.(a) | 21,483 | 3,616,878 | ||||||
| Crowdstrike Holdings, Inc., CLASS A(a) | 34,460 | 6,091,493 | ||||||
| DigitalOcean Holdings, Inc.(a) | 70,999 | 1,452,640 | ||||||
| Elastic NV(a) | 20,635 | 1,548,450 | ||||||
| Evercore, Inc., Class A | 28,195 | 3,670,425 | ||||||
| Five Below, Inc.(a) | 32,273 | 5,614,857 | ||||||
| Frontage Holdings Corporation(a)(b)(c) | 11,448,283 | 2,852,836 | ||||||
| Global Industrial Co. | 157,991 | 5,047,812 | ||||||
| GQG Partners, Inc.(a) | 2,094,198 | 1,727,009 | ||||||
| Hackett Group, Inc. (The) | 98,183 | 2,188,499 | ||||||
| Hingham Institution for Savings | 4,431 | 658,358 | ||||||
| Insperity, Inc. | 27,905 | 2,953,465 | ||||||
| Insulet Corporation(a) | 12,785 | 1,694,908 | ||||||
| JFrog Ltd.(a) | 67,577 | 1,519,807 | ||||||
| Littelfuse, Inc. | 73,007 | 15,818,427 | ||||||
| MaxCyte, Inc.(a) | 259,488 | 768,084 | ||||||
| MaxCyte, Inc.(a) | 286,500 | 818,233 | ||||||
| Medpace Holdings, Inc.(a) | 10,938 | 2,654,324 | ||||||
| Neogen Corporation(a) | 100,578 | 1,497,606 | ||||||
| NV5 Global, Inc.(a) | 52,764 | 4,978,283 | ||||||
See accompanying notes to financial statements.
60
| Grandeur Peak Global Opportunities Fund | Portfolio of Investments |
| October 31, 2023 (Unaudited) |
| Shares | Fair Value | |||||||
| COMMON STOCKS — (continued) | ||||||||
| United States — 22.07% (continued) | ||||||||
| Ollie’s Bargain Outlet Holdings, Inc.(a) | 77,132 | $ | 5,957,675 | |||||
| P10, Inc.(a) | 400,806 | 3,775,593 | ||||||
| PagerDuty, Inc.(a) | 106,997 | 2,158,129 | ||||||
| Paycom Software, Inc. | 23,213 | 5,686,489 | ||||||
| PJT Partners, Inc., Class A | 76,625 | 6,004,335 | ||||||
| Plumas Bancorp(a) | 31,329 | 1,069,885 | ||||||
| Power Integrations, Inc. | 21,062 | 1,460,228 | ||||||
| Qualys, Inc.(a) | 54,145 | 8,281,477 | ||||||
| Silicon Laboratories, Inc.(a) | 16,034 | 1,478,014 | ||||||
| SiTime Corporation(a) | 18,514 | 1,847,698 | ||||||
| Texas Roadhouse, Inc. | 38,457 | 3,904,924 | ||||||
| TriMas Corporation | 158,318 | 3,832,879 | ||||||
| 123,613,673 | ||||||||
| Vietnam — 1.68% | ||||||||
| Asia Commercial Bank JSC(a) | 3,107,100 | 2,706,996 | ||||||
| Vietnam Technological & Commercial Joint Stock Bank(a) | 5,964,004 | 6,725,681 | ||||||
| 9,432,677 | ||||||||
| Total Common Stocks (Cost $537,391,369) | 551,609,461 | |||||||
| PREFERRED STOCKS — 0.34% | ||||||||
| United States — 0.34% | ||||||||
| Dataminr, Inc.- Private Placement(a)(d) | 96,640 | 1,923,136 | ||||||
| Total Preferred Stocks | ||||||||
| (Cost $1,923,136) | 1,923,136 | |||||||
| Total Investments — 98.77% | ||||||||
| (Cost $539,314,505) | 553,532,597 | |||||||
| Other Assets in Excess of Liabilities — 1.23% | 6,900,331 | |||||||
| NET ASSETS — 100.00% | $ | 560,432,928 | ||||||
| (a) | Non-income producing security. |
| (b) | Security exempt from registration under Rule 144A of the Securities Act of 1933. These securities may be resold in the ordinary course of business in transactions exempt from registration, normally to qualified institutional buyers. As of October 31, 2023, these securities had a total aggregate market value of $23,232,645, representing 4.15% of net assets. |
| (c) | Security was purchased pursuant to Regulation S under the Securities Act of 1933, which exempts securities offered and sold outside of the United States from registration. Such security cannot be sold in the United States without either an effective registration statement filed pursuant to the Securities Act of 1933, or pursuant to an exemption from registration. As of October 31, 2023, the aggregate market value of these securities was $23,649,132, representing 4.22% of net assets. (d) As a result of the use of significant unobservable inputs to determine fair value, this investment has been classified as level 3 assets. See also Note 2 to the financial statements for additional information. |
| Sector Composition (October 31, 2023) | |
| Technology | 25.6% |
| Industrials | 19.9% |
| Health Care | 15.3% |
| Financials | 12.2% |
| Consumer Staples | 11.7% |
| Consumer Discretionary | 9.5% |
| Communications | 2.4% |
| Materials | 0.9% |
| Energy | 0.8% |
| Real Estate | 0.4% |
| Other Assets in Excess of Liabilities | 1.2% |
| Total | 100.0% |
| Industry Composition (October 31, 2023) | |
| Mass Merchants | 6.9% |
| Health Care Services | 6.1% |
| IT Services | 5.9% |
| Application Software | 5.0% |
| Specialty & Generic Pharma | 4.6% |
| Food & Drug Stores | 4.3% |
| Banks | 3.9% |
| It Services | 3.1% |
| Infrastructure Software | 3.0% |
| Electrical Components | 2.9% |
| Semiconductor Devices | 2.9% |
| Professional Services | 2.8% |
| Institutional Brokerage | 2.7% |
| Engineering Services | 2.4% |
| Private Equity | 2.0% |
| Other Commercial Support Services | 2.0% |
| Flow Control Equipment | 1.9% |
| Investment Management | 1.8% |
| Home Products Stores | 1.7% |
| Life Science & Diagnostics | 1.6% |
| Industrial Wholesale & Rental | 1.5% |
| Health Care Supplies | 1.4% |
| Electronics Components | 1.3% |
| Comml & Res Bldg Equipment & Sys | 1.3% |
| Internet Media & Services | 1.2% |
| Rubber & Plastic | 1.1% |
| Semiconductor Manufacturing | 1.1% |
| Wealth Management | 1.0% |
| Building Products | 1.0% |
| Specialty Technology Hardware | 1.0% |
| Other Spec Retail - Discr | 1.0% |
| Other Industries (each less than 1%) | 16.9% |
| Other Assets in Excess of Liabilities | 1.2% |
| Total | 100.0% |
See accompanying notes to financial statements.
61
| Grandeur Peak Global Reach Fund | Portfolio of Investments |
| October 31, 2023 (Unaudited) |
| Shares | Fair Value | |||||||
| COMMON STOCKS — 96.21% | ||||||||
| Argentina — 0.93% | ||||||||
| Globant SA(a) | 11,478 | $ | 1,954,589 | |||||
| Australia — 1.78% | ||||||||
| EQT Holdings Ltd.(a) | 46,050 | 730,303 | ||||||
| Imdex Ltd.(a) | 496,245 | 519,414 | ||||||
| Johns Lyng Group Ltd.(a) | 180,059 | 696,752 | ||||||
| Netwealth Group Ltd.(a) | 89,313 | 719,535 | ||||||
| PeopleIN Ltd.(a) | 593,251 | 566,381 | ||||||
| Pinnacle Investment Management Group(a) | 102,200 | 501,794 | ||||||
| 3,734,179 | ||||||||
| Belgium — 1.30% | ||||||||
| Melexis NV | 12,468 | 915,077 | ||||||
| Warehouses De Pauw CVA(a) | 31,610 | 780,130 | ||||||
| X-Fab Silicon Foundries SE(a)(b)(c) | 113,341 | 1,024,375 | ||||||
| 2,719,582 | ||||||||
| Brazil — 2.04% | ||||||||
| CI&T, Inc.(a) | 81,500 | 374,900 | ||||||
| Grupo Mateus SA(a) | 434,787 | 501,123 | ||||||
| Hypera SA | 85,800 | 516,410 | ||||||
| Locaweb Servicos de Internet SA(a)(b)(c) | 708,568 | 764,667 | ||||||
| Patria Investments Ltd.(a) | 77,699 | 1,001,540 | ||||||
| Raia Drogasil SA(a) | 64,500 | 330,248 | ||||||
| Vinci Partners Invest Ltd.(a) | 33,047 | 324,191 | ||||||
| XP, Inc., Class A(a) | 23,213 | 464,260 | ||||||
| 4,277,339 | ||||||||
| Canada — 1.19% | ||||||||
| Aritzia, Inc.(a) | 45,179 | 702,725 | ||||||
| Docebo, Inc.(a) | 15,600 | 615,671 | ||||||
| Gildan Activewear, Inc.(a) | 12,020 | 341,420 | ||||||
| Pet Valu Holdings Ltd.(a) | 28,400 | 508,708 | ||||||
| Richelieu Hardware Ltd.(a) | 11,094 | 331,838 | ||||||
| 2,500,362 | ||||||||
| China — 5.24% | ||||||||
| Adicon Holdings Ltd.(a) | 633,100 | 904,515 | ||||||
| Aier Eye Hospital Group Co., Ltd.(a) | 131,300 | 328,604 | ||||||
| Angelalign Technology, Inc.(a)(b)(c) | 59,200 | 407,011 | ||||||
| ANTA Sports Products Ltd. | 63,200 | 713,552 | ||||||
| Beijing Huafeng Test & Control Technology Co., Ltd.(a) | 12,100 | 198,797 | ||||||
| Chaoju Eye Care Holdings Ltd.(a) | 840,000 | 446,554 | ||||||
| China Yongda Automobiles Services Holdings Ltd. | 1,125,100 | 431,334 | ||||||
| CSPC Pharmaceutical Group Ltd. | 353,220 | 308,296 | ||||||
| Guangzhou Kingmed Diagnostics Group Co., Ltd.(a) | 82,800 | 700,554 | ||||||
| Hangzhou Tigermed Consulting Co., Ltd.(a) | 70,600 | 643,652 | ||||||
| Li Ning Company Ltd. | 249,600 | 765,522 | ||||||
| Man Wah Holdings Ltd.(a) | 938,400 | 582,809 | ||||||
| ManpowerGroup Greater China Ltd.(a)(c) | 145,800 | 109,929 | ||||||
| Shares | Fair Value | |||||||
| COMMON STOCKS — (continued) | ||||||||
| China — 5.24% (continued) | ||||||||
| Shanghai Hanbell Precise Machinery Co., Ltd.(a)(c) | 183,200 | $ | 585,451 | |||||
| Shenzhen Mindray Bio-Medical Electronics Co.(a) | 15,100 | 590,328 | ||||||
| Silergy Corporation(a) | 101,700 | 897,242 | ||||||
| TK Group Holdings Ltd.(a) | 1,492,400 | 257,467 | ||||||
| WuXi AppTec Co., Ltd.(a)(b)(c) | 111,412 | 1,338,324 | ||||||
| Wuxi Biologics Cayman, Inc.(a)(b)(c) | 135,500 | 841,545 | ||||||
| 11,051,486 | ||||||||
| Colombia — 1.04% | ||||||||
| Canacol Energy Ltd.(a) | 3,887 | 19,228 | ||||||
| Parex Resources, Inc. | 112,657 | 2,159,295 | ||||||
| 2,178,523 | ||||||||
| Finland — 1.15% | ||||||||
| Evli Oyj(a) | 27,312 | 515,948 | ||||||
| Musti Group Oyj(a) | 78,138 | 1,538,944 | ||||||
| Revenio Group Oyj(a) | 14,900 | 346,284 | ||||||
| 2,401,176 | ||||||||
| France — 3.07% | ||||||||
| Alten SA(a) | 11,365 | 1,338,686 | ||||||
| Antin Infrastructure Partners(a) | 94,558 | 1,124,809 | ||||||
| Aubay SA(a) | 5,771 | 193,303 | ||||||
| BioMerieux(a) | 6,000 | 574,664 | ||||||
| Esker SA(a) | 3,867 | 489,872 | ||||||
| Neurones SA(a) | 11,386 | 413,916 | ||||||
| Thermador Groupe(a) | 4,977 | 353,431 | ||||||
| Virbac SA(a) | 6,769 | 1,941,368 | ||||||
| 6,430,049 | ||||||||
| Germany — 2.25% | ||||||||
| Atoss Software AG(a) | 1,418 | 298,637 | ||||||
| Dermapharm Holding SE(a) | 20,563 | 793,446 | ||||||
| Elmos Semiconductor AG | 4,778 | 311,993 | ||||||
| Friedrich Vorwerrk Group SE(a) | 40,255 | 531,678 | ||||||
| Mensch und Maschine Software SE(a) | 8,301 | 433,543 | ||||||
| Nagarro SE(a) | 8,375 | 588,971 | ||||||
| Nexus AG(a) | 15,717 | 765,973 | ||||||
| QIAGEN NV(a) | 26,493 | 991,633 | ||||||
| 4,715,874 | ||||||||
| Hong Kong — 1.00% | ||||||||
| Plover Bay Technologies Ltd.(a) | 4,118,000 | 1,173,527 | ||||||
| Techtronic Industries Co., Ltd. | 101,500 | 924,820 | ||||||
| 2,098,347 | ||||||||
| India — 2.62% | ||||||||
| Ajanta Pharma Ltd.(a) | 15,672 | 331,869 | ||||||
| Cera Sanitaryware Ltd.(a) | 4,267 | 434,738 | ||||||
| Gulf Oil Lubricants India Ltd. | 146,334 | 1,097,270 | ||||||
| IndiaMart InterMesh Ltd.(a)(b)(c) | 21,336 | 678,943 | ||||||
| Kotak Mahindra Bank Ltd.(a) | 24,838 | 518,867 | ||||||
| Metropolis Healthcare Ltd.(a)(b)(c) | 38,641 | 652,235 | ||||||
| Motherson Sumi Wiring India Ltd.(a) | 612,241 | 440,810 | ||||||
| Polycab India Ltd.(a) | 6,071 | 358,881 | ||||||
See accompanying notes to financial statements.
62
| Grandeur Peak Global Reach Fund | Portfolio of Investments |
| October 31, 2023 (Unaudited) |
| Shares | Fair Value | |||||||
| COMMON STOCKS — (continued) | ||||||||
| India — 2.62% (continued) | ||||||||
| SJS Enterprises Ltd.(a) | 86,869 | $ | 705,942 | |||||
| WNS Holdings Ltd., ADR(a) | 4,835 | 262,637 | ||||||
| 5,482,192 | ||||||||
| Indonesia — 1.57% | ||||||||
| Arwana Citramulia Tbk PT(a) | 11,519,400 | 477,143 | ||||||
| Avia Avian Tbk PT(a) | 18,442,000 | 578,700 | ||||||
| Bank BTPN Syariah Tbk PT(a) | 4,558,400 | 450,576 | ||||||
| Selamat Sempurna Tbk PT(a) | 10,020,400 | 1,364,646 | ||||||
| Ultrajaya Milk Industry & Trading Co.(a) | 4,006,000 | 422,372 | ||||||
| 3,293,437 | ||||||||
| Ireland — 1.32% | ||||||||
| ICON PLC, ADR(a) | 4,675 | 1,140,512 | ||||||
| Keywords Studios plc(a) | 58,166 | 922,496 | ||||||
| Uniphar PLC(a) | 315,297 | 699,066 | ||||||
| 2,762,074 | ||||||||
| Israel — 0.26% | ||||||||
| Monday.com Ltd.(a) | 4,142 | 538,419 | ||||||
| Italy — 1.26% | ||||||||
| DiaSorin SpA(a) | 4,483 | 400,903 | ||||||
| Interpump Group SpA(a) | 12,429 | 518,259 | ||||||
| Recordati Industria Chimica e Farmaceutica SpA(a) | 15,169 | 699,935 | ||||||
| Sesa SpA(a) | 10,025 | 1,010,563 | ||||||
| 2,629,660 | ||||||||
| Japan — 9.64% | ||||||||
| AIT Corporation(a) | 23,900 | 259,380 | ||||||
| Atrae, Inc.(a) | 31,200 | 204,604 | ||||||
| BayCurrent Consulting, Inc. | 124,900 | 3,097,470 | ||||||
| Beenos, Inc.(a) | 36,500 | 340,016 | ||||||
| Carenet, Inc. NPV(a) | 169,100 | 954,971 | ||||||
| Central Automotive Products Ltd.(a) | 23,800 | 529,936 | ||||||
| Charm Care Corporation KK(a) | 30,000 | 216,526 | ||||||
| Comture Corporation(a) | 33,600 | 442,902 | ||||||
| CrowdWorks, Inc.(a) | 56,200 | 463,096 | ||||||
| Cyber Security Cloud, Inc.(a) | 29,300 | 390,087 | ||||||
| Digital Arts, Inc.(a) | 10,000 | 273,132 | ||||||
| eWeLL Co., Ltd.(a) | 16,500 | 340,178 | ||||||
| F&M Co., Ltd.(a) | 23,700 | 317,876 | ||||||
| FP Partner, Inc.(a) | 27,400 | 744,767 | ||||||
| Funai Soken Holdings, Inc.(a) | 18,500 | 300,614 | ||||||
| GMO Payment Gateway, Inc. NPV(a) | 6,800 | 268,546 | ||||||
| gremz, Inc.(a) | 37,100 | 484,631 | ||||||
| Hennge KK(a) | 105,000 | 685,798 | ||||||
| Integral Corporation(a) | 50,800 | 570,421 | ||||||
| JMDC, Inc.(a) | 12,400 | 343,347 | ||||||
| Lifedrink Co., Inc.(a) | 14,300 | 352,842 | ||||||
| M&A Capital Partners Company Ltd.(a) | 37,400 | 671,140 | ||||||
| M&A Research Institute, Inc.(a) | 30,400 | 653,828 | ||||||
| M3, Inc. | 22,500 | 343,493 | ||||||
| MarkLines Co., Ltd.(a) | 53,300 | 969,827 | ||||||
| Shares | Fair Value | |||||||
| COMMON STOCKS — (continued) | ||||||||
| Japan — 9.64% (continued) | ||||||||
| Medikit Co., Ltd.(a) | 29,000 | $ | 512,558 | |||||
| MonotaRO Co., Ltd.(a) | 53,200 | 421,354 | ||||||
| Prestige International, Inc.(a) | 135,800 | 545,618 | ||||||
| SBI Global Asset Management Co.(a) | 126,000 | 445,562 | ||||||
| Sun*, Inc.(a) | 36,000 | 298,783 | ||||||
| Synchro Food Co., Ltd.(a) | 162,700 | 592,515 | ||||||
| System Support, Inc.(a) | 38,600 | 495,312 | ||||||
| Systena Corporation(a) | 256,800 | 432,024 | ||||||
| Syuppin Company, Ltd.(a) | 42,400 | 288,121 | ||||||
| ULS Group, Inc.(a) | 26,800 | 816,862 | ||||||
| User Local, Inc.(a) | 35,000 | 359,756 | ||||||
| Visional, Inc.(a) | 7,300 | 353,020 | ||||||
| WDB coco Co., Ltd.(a) | 11,900 | 405,106 | ||||||
| 20,186,019 | ||||||||
| Luxembourg 0.14% | ||||||||
| Sword Group(a) | 8,334 | 302,966 | ||||||
| Malaysia — 0.42% | ||||||||
| Mr DIY Group Berhad(a)(b)(c) | 2,845,700 | 884,166 | ||||||
| Mexico — 1.18% | ||||||||
| Arca Continental COM NPV | 78,800 | 707,066 | ||||||
| Bolsa Mexicana de Valores SAB(a) | 163,700 | 254,859 | ||||||
| Corp Inmobiliaria Vesta SAB de CV(a) | 112,600 | 353,105 | ||||||
| Grupo Financiero Banorte SAB de CV | 41,900 | 339,410 | ||||||
| Regional SAB de CV(a) | 106,900 | 810,149 | ||||||
| 2,464,589 | ||||||||
| Netherlands — 0.36% | ||||||||
| Alfen Beheer BV(a)(b)(c) | 12,592 | 395,391 | ||||||
| ASM International NV(a) | 879 | 361,405 | ||||||
| 756,796 | ||||||||
| Norway — 0.66% | ||||||||
| Bouvet ASA(a) | 120,257 | 579,215 | ||||||
| Nordic Semiconductor ASA(a) | 25,476 | 205,633 | ||||||
| SmartCraft ASA(a) | 313,578 | 597,959 | ||||||
| 1,382,807 | ||||||||
| Oman — 0.41% | ||||||||
| Tethys Oil AB(a) | 168,263 | 858,870 | ||||||
| Philippines — 1.45% | ||||||||
| Century Pacific Food, Inc.(a) | 1,024,500 | 505,213 | ||||||
| Concepcion Industrial Corporation(a) | 1,793,920 | 473,281 | ||||||
| Philippine Seven Corporation(a) | 292,400 | 391,377 | ||||||
| Pryce Corporation(a) | 6,894,800 | 631,436 | ||||||
| Puregold Price Club, Inc.(a) | 861,100 | 410,987 | ||||||
| Wilcon Depot, Inc.(a) | 1,803,300 | 628,837 | ||||||
| 3,041,131 | ||||||||
| Poland — 1.67% | ||||||||
| Auto Partner SA | 121,437 | 687,673 | ||||||
| Dino Polska SA(a)(b)(c) | 12,866 | 1,217,347 | ||||||
| Inter Cars SA(a) | 9,739 | 1,318,050 | ||||||
See accompanying notes to financial statements.
63
| Grandeur Peak Global Reach Fund | Portfolio of Investments |
| October 31, 2023 (Unaudited) |
| Shares | Fair Value | |||||||
| COMMON STOCKS — (continued) | ||||||||
| Poland — 1.67% (continued) | ||||||||
| Text SA | 10,262 | $ | 276,304 | |||||
| 3,499,374 | ||||||||
| Singapore — 1.16% | ||||||||
| iFast Corporation(a) | 263,100 | 1,268,248 | ||||||
| Keppel DC REIT(a) | 400,300 | 494,096 | ||||||
| Riverstone Holdings Ltd. | 1,521,700 | 655,723 | ||||||
| 2,418,067 | ||||||||
| South Africa 0.41% | ||||||||
| Clicks Group Ltd.(a) | 27,746 | 408,840 | ||||||
| Italtile Ltd.(a) | 717,806 | 442,888 | ||||||
| 851,728 | ||||||||
| South Korea — 0.94% | ||||||||
| Coupang, Inc.(a) | 41,211 | 700,587 | ||||||
| Hyundai Ezwel Co., Ltd.(a) | 96,236 | 439,886 | ||||||
| LEENO Industrial, Inc.(a) | 3,790 | 385,439 | ||||||
| Tokai Carbon Korea Co., Ltd.(a) | 7,139 | 437,729 | ||||||
| 1,963,641 | ||||||||
| Sweden — 5.13% | ||||||||
| AddTech AB(a) | 30,000 | 439,127 | ||||||
| Beijer Alma AB(a) | 26,524 | 421,511 | ||||||
| Byggfakta Group Nordic Holdco AB(a) | 96,749 | 232,706 | ||||||
| EQT AB(a) | 112,670 | 2,047,890 | ||||||
| Fasadgruppen Group AB(a) | 50,000 | 213,203 | ||||||
| Knowit AB | 66,725 | 836,822 | ||||||
| Lifco AB, Class B(a) | 35,265 | 643,820 | ||||||
| Lyko Group AB(a)(c) | 11,255 | 96,589 | ||||||
| Nibe Industrier AB | 114,917 | 660,694 | ||||||
| OX2 AB(a) | 117,378 | 473,799 | ||||||
| RVRC Holding AB(a) | 94,129 | 324,808 | ||||||
| Sagax AB(a) | 17,771 | 321,573 | ||||||
| Sagax AB(a) | 24,922 | 449,857 | ||||||
| Sdiptech AB(a) | 59,055 | 1,156,440 | ||||||
| Swedencare AB | 245,298 | 993,887 | ||||||
| Teqnion AB(a) | 23,954 | 440,967 | ||||||
| Vitec Software Group(a) | 13,247 | 527,835 | ||||||
| Vitrolife AB(a) | 35,200 | 457,537 | ||||||
| 10,739,065 | ||||||||
| Taiwan — 2.59% | ||||||||
| Allied Supreme Corporation(a) | 50,000 | 479,614 | ||||||
| Asia Vital Components Co., Ltd.(a) | 47,000 | 410,313 | ||||||
| Brighten Optix Corporation(a) | 47,000 | 261,963 | ||||||
| Fuzetec Technology Co., Ltd.(a) | 227,519 | 323,686 | ||||||
| GEM Services, Inc.(a) | 166,000 | 334,311 | ||||||
| M3 Technology, Inc.(a) | 114,000 | 414,239 | ||||||
| Sinbon Electronics Co., Ltd.(a) | 56,000 | 477,675 | ||||||
| Sporton International, Inc.(a) | 266,868 | 1,758,631 | ||||||
| Voltronic Power Technology Corporation(a) | 7,247 | 288,996 | ||||||
| Wistron Information Technology and Services Corporation(a) | 175,803 | 587,381 | ||||||
| 5,336,809 | ||||||||
| Shares | Fair Value | |||||||
| COMMON STOCKS — (continued) | ||||||||
| Thailand — 0.23% | ||||||||
| Humanica PCL(a) | 1,869,000 | $ | 488,678 | |||||
| United Kingdom — 13.47% | ||||||||
| AB Dynamics PLC(a) | 72,465 | 1,263,761 | ||||||
| Advanced Medical Solutions Group plc(a) | 162,800 | 383,436 | ||||||
| B&M European Value Retail SA | 545,149 | 3,503,412 | ||||||
| Big Technologies plc(a) | 219,199 | 479,508 | ||||||
| CVS Group plc(a) | 131,435 | 2,340,094 | ||||||
| Darktrace plc(a) | 276,032 | 1,174,118 | ||||||
| Diploma plc | 13,359 | 461,405 | ||||||
| dotdigital group plc(a) | 378,995 | 331,628 | ||||||
| Elixirr International PLC(a) | 204,772 | 1,169,642 | ||||||
| Endava plc, ADR(a) | 41,557 | 2,084,499 | ||||||
| Foresight Group Holdings Ltd.(a) | 216,892 | 970,009 | ||||||
| FRP Advisory Group PLC(a) | 566,926 | 785,445 | ||||||
| Gamma Communications PLC(a) | 37,522 | 476,982 | ||||||
| GlobalData PLC(a) | 337,000 | 614,336 | ||||||
| Halma PLC | 9,762 | 218,887 | ||||||
| Hotel Chocolat Group PLC(a) | 458,986 | 755,829 | ||||||
| Impax Asset Management Group plc(a) | 351,017 | 1,642,379 | ||||||
| Intermediate Capital Group PLC(a) | 34,887 | 553,086 | ||||||
| JTC plc(a)(b)(c) | 279,191 | 2,166,442 | ||||||
| Keystone Law Group PLC(a) | 102,373 | 590,968 | ||||||
| Marlowe PLC(a) | 249,243 | 1,678,098 | ||||||
| Pensionbee Group PLC(a) | 776,513 | 569,050 | ||||||
| Petershill Partners PLC(a)(b)(c) | 641,913 | 1,151,455 | ||||||
| Pets at Home Group PLC(a) | 337,561 | 1,151,951 | ||||||
| SDI Group PLC(a) | 199,856 | 246,529 | ||||||
| Softcat PLC(a) | 24,537 | 377,222 | ||||||
| Volution Group PLC(a) | 121,147 | 533,857 | ||||||
| YouGov plc(a) | 53,463 | 552,277 | ||||||
| 28,226,305 | ||||||||
| United States — 26.63% | ||||||||
| 4imprint Group PLC(a) | 7,309 | 445,909 | ||||||
| Alexandria Real Estate Equities, Inc. | 9,919 | 923,757 | ||||||
| Align Technology, Inc.(a) | 2,682 | 495,070 | ||||||
| Ares Management Corporation, CLASS A | 16,624 | 1,638,960 | ||||||
| Ashtead Group PLC | 8,512 | 486,613 | ||||||
| Barrett Business Services, Inc. | 12,931 | 1,182,669 | ||||||
| BILL Holdings, Inc.(a) | 2,999 | 273,779 | ||||||
| Bio-Techne Corporation | 6,692 | 365,584 | ||||||
| BizLink Holding, Inc.(a) | 101,476 | 785,897 | ||||||
| Blue Owl Capital, Inc. | 72,860 | 898,364 | ||||||
| Bowman Consulting Group Ltd.(a) | 50,373 | 1,338,411 | ||||||
| Cactus, Inc., Class A | 12,877 | 604,446 | ||||||
| Charles River Laboratories International, Inc.(a) | 2,925 | 492,453 | ||||||
| Chewy, Inc.(a) | 19,161 | 370,382 | ||||||
| Cloudflare, Inc., Class A(a) | 8,763 | 496,774 | ||||||
| Crocs, Inc.(a) | 3,730 | 333,164 | ||||||
See accompanying notes to financial statements.
64
| Grandeur Peak Global Reach Fund | Portfolio of Investments |
| October 31, 2023 (Unaudited) |
| Shares | Fair Value | |||||||
| COMMON STOCKS — (continued) | ||||||||
| United States — 26.63% (continued) | ||||||||
| Cross Creek Lucid LP/Partnership Interest(a)(d) | 1,000,000 | $ | 786,666 | |||||
| Crowdstrike Holdings, Inc., CLASS A(a) | 6,338 | 1,120,368 | ||||||
| Cytek Biosciences, Inc.(a) | 33,131 | 139,482 | ||||||
| Datadog, Inc., Class A(a) | 3,651 | 297,447 | ||||||
| DexCom, Inc.(a) | 7,486 | 664,981 | ||||||
| DigitalOcean Holdings, Inc.(a) | 38,950 | 796,917 | ||||||
| Dollar General Corporation | 3,308 | 393,784 | ||||||
| Elastic NV(a) | 18,178 | 1,364,076 | ||||||
| Envista Holdings Corporation(a) | 12,050 | 280,404 | ||||||
| Esquire Financial Holdings, Inc.(a) | 18,400 | 842,720 | ||||||
| Etsy, Inc.(a) | 16,470 | 1,026,081 | ||||||
| Evercore, Inc., Class A | 5,549 | 722,369 | ||||||
| Fastenal Co. | 4,511 | 263,172 | ||||||
| Five Below, Inc.(a) | 2,958 | 514,633 | ||||||
| Floor & Decor Holdings, Inc., Class A(a) | 6,307 | 519,697 | ||||||
| Freshpet, Inc.(a) | 8,772 | 503,513 | ||||||
| Frontage Holdings Corporation(a)(b)(c) | 6,030,000 | 1,502,636 | ||||||
| Genpact Ltd. | 9,106 | 305,415 | ||||||
| Gitlab, Inc.(a) | 7,545 | 326,548 | ||||||
| Global Industrial Co. | 22,970 | 733,891 | ||||||
| GQG Partners, Inc.(a) | 880,386 | 726,022 | ||||||
| Hackett Group, Inc. (The) | 32,726 | 729,463 | ||||||
| Healthcare Services Group, Inc. | 50,208 | 476,976 | ||||||
| HealthEquity, Inc.(a) | 7,136 | 511,508 | ||||||
| Houlihan Lokey, Inc. | 7,352 | 739,023 | ||||||
| HubSpot, Inc.(a) | 960 | 406,819 | ||||||
| I3 Verticals, Inc., Class A(a) | 20,080 | 376,500 | ||||||
| Insperity, Inc. | 6,663 | 705,212 | ||||||
| Insulet Corporation(a) | 2,050 | 271,769 | ||||||
| JFrog Ltd.(a) | 56,491 | 1,270,483 | ||||||
| Littelfuse, Inc. | 6,196 | 1,342,487 | ||||||
| Lululemon Athletica, Inc.(a) | 1,867 | 734,627 | ||||||
| MarketAxess Holdings, Inc. | 2,311 | 493,976 | ||||||
| Marvell Technology, Inc. | 4,881 | 230,481 | ||||||
| MaxCyte, Inc.(a) | 71,488 | 211,604 | ||||||
| MaxCyte, Inc.(a) | 147,600 | 421,540 | ||||||
| Medpace Holdings, Inc.(a) | 3,177 | 770,963 | ||||||
| Microchip Technology, Inc. | 11,043 | 787,255 | ||||||
| Monolithic Power Systems, Inc. | 699 | 308,776 | ||||||
| Neogen Corporation(a) | 35,629 | 530,516 | ||||||
| NV5 Global, Inc.(a) | 11,241 | 1,060,588 | ||||||
| Ollie’s Bargain Outlet Holdings, Inc.(a) | 18,131 | 1,400,439 | ||||||
| P10, Inc.(a) | 189,000 | 1,780,380 | ||||||
| PagerDuty, Inc.(a) | 47,328 | 954,606 | ||||||
| Paycom Software, Inc. | 3,508 | 859,355 | ||||||
| Paylocity Holding Corporation(a) | 1,722 | 308,927 | ||||||
| Perella Weinberg Partners LP | 94,328 | 925,358 | ||||||
| PJT Partners, Inc., Class A | 30,897 | 2,421,089 | ||||||
| Planet Fitness, Inc., A(a) | 13,440 | 742,829 | ||||||
| Pool Corporation | 957 | 302,192 | ||||||
| Power Integrations, Inc. | 4,008 | 277,875 | ||||||
| Shares | Fair Value | |||||||
| COMMON STOCKS — (continued) | ||||||||
| United States — 26.63% (continued) | ||||||||
| Qualys, Inc.(a) | 10,665 | $ | 1,631,211 | |||||
| Revolve Group, Inc.(a) | 23,484 | 322,905 | ||||||
| Rexford Industrial Realty, Inc. | 18,039 | 780,006 | ||||||
| Ross Stores, Inc. | 4,525 | 524,764 | ||||||
| Shoals Technologies Group, Inc., Class A(a) | 39,096 | 600,515 | ||||||
| Silicon Laboratories, Inc.(a) | 3,200 | 294,976 | ||||||
| Smartsheet, Inc., CLASS A(a) | 17,836 | 705,235 | ||||||
| Squarespace, Inc.(a) | 21,109 | 599,707 | ||||||
| Terreno Realty Corporation | 15,935 | 849,017 | ||||||
| Texas Roadhouse, Inc. | 8,409 | 853,850 | ||||||
| TPG, Inc.(a) | 11,137 | 307,827 | ||||||
| Tradeweb Markets, Inc., CLASS A | 7,923 | 713,149 | ||||||
| Zscaler, Inc.(a) | 1,855 | 294,370 | ||||||
| 55,794,202 | ||||||||
| Vietnam — 1.70% | ||||||||
| Asia Commercial Bank JSC(a) | 574,500 | 500,521 | ||||||
| FPT Corporation(a) | 308,477 | 1,042,364 | ||||||
| Vietnam Technological & Commercial Joint Stock Bank(a) | 1,789,681 | 2,018,246 | ||||||
| 3,561,131 | ||||||||
| Total Common Stocks (Cost $198,396,181) | 201,523,632 | |||||||
| PREFERRED STOCKS — 0.90% | ||||||||
| United States — 0.90% | ||||||||
| Dataminr, Inc. — Private Placement(a)(d) | 45,833 | 912,077 | ||||||
| Gusto, Inc., Series E Preferred(a)(d) | 32,241 | 980,126 | ||||||
| 1,892,203 | ||||||||
| Total Preferred Stocks | ||||||||
| (Cost $1,892,053) | 1,892,203 | |||||||
| Total Investments — 97.11% | ||||||||
| (Cost $200,288,234) | 203,415,835 | |||||||
| Other Assets in Excess of Liabilities — 2.89% | 6,053,811 | |||||||
| NET ASSETS — 100.00% | $ | 209,469,646 | ||||||
| (a) | Non-income producing security. |
| (b) | Security exempt from registration under Rule 144A of the Securities Act of 1933. These securities may be resold in the ordinary course of business in transactions exempt from registration, normally to qualified institutional buyers. As of October 31, 2023, these securities had a total aggregate market value of $13,025,033, representing 6.22% of net assets. |
| (c) | Security was purchased pursuant to Regulation S under the Securities Act of 1933, which exempts securities offered and sold outside of the United States from registration. Such security cannot be sold in the United States without either an effective registration statement filed pursuant to the Securities Act of 1933, or pursuant to an exemption from registration. As of October 31, 2023, the aggregate market value of these securities was $13,816,506, representing 6.60% of net assets. |
| (d) | As a result of the use of significant unobservable inputs to determine fair value, these investments have been classified as level 3 assets. See also Note 2 to the financial statements for additional information. |
See accompanying notes to financial statements.
65
| Grandeur Peak Global Reach Fund | Portfolio of Investments |
| October 31, 2023 (Unaudited) |
| Sector Composition (October 31, 2023) | |
| Technology | 25.8% |
| Financials | 16.2% |
| Health Care | 14.2% |
| Industrials | 13.2% |
| Consumer Discretionary | 12.0% |
| Consumer Staples | 5.6% |
| Communications | 3.2% |
| Real Estate | 2.4% |
| Energy | 2.2% |
| Materials | 1.4% |
| Utilities | 0.5% |
| Listed Private Equity Investments | 0.4% |
| Other Assets in Excess of Liabilities | 2.9% |
| Total | 100.0% |
| Industry Composition (October 31, 2023) | |
| Application Software | 7.7% |
| Health Care Services | 5.9% |
| IT Services | 4.8% |
| Investment Management | 4.4% |
| Private Equity | 3.5% |
| Professional Services | 3.4% |
| It Services | 3.0% |
| Institutional Brokerage | 3.0% |
| Mass Merchants | 2.8% |
| Banks | 2.6% |
| Infrastructure Software | 2.6% |
| Specialty & Generic Pharma | 2.2% |
| Auto Parts | 2.1% |
| Internet Media & Services | 2.0% |
| Engineering Services | 1.8% |
| Semiconductor Devices | 1.8% |
| Specialty Apparel Stores | 1.6% |
| Home Products Stores | 1.6% |
| Food & Drug Stores | 1.6% |
| Other Spec Retail - Discr | 1.5% |
| Exploration & Production | 1.5% |
| Medical Equipment | 1.5% |
| Wealth Management | 1.4% |
| Health Care Supplies | 1.3% |
| Life Science & Diagnostics | 1.3% |
| Online Marketplace | 1.3% |
| Other Commercial Support Services | 1.3% |
| Industrial Reit | 1.2% |
| Industrial Wholesale & Rental | 1.1% |
| Electrical Components | 1.1% |
| Communications Equipment | 1.0% |
| Other Industries (each less than 1%) | 23.3% |
| Other Assets in Excess of Liabilities | 2.9% |
| Total | 100.0% |
See accompanying notes to financial statements.
66
| Grandeur Peak Global Stalwarts Fund | Portfolio of Investments |
| October 31, 2023 (Unaudited) |
| Shares | Fair Value | |||||||
| COMMON STOCKS — 98.56% | ||||||||
| Argentina — 3.20% | ||||||||
| Globant SA(a) | 25,724 | $ | 4,380,540 | |||||
| Belgium — 1.76% | ||||||||
| Melexis NV | 22,663 | 1,663,328 | ||||||
| Warehouses De Pauw CVA(a) | 29,971 | 739,680 | ||||||
| 2,403,008 | ||||||||
| Brazil — 2.28% | ||||||||
| Hypera SA | 115,800 | 696,973 | ||||||
| Patria Investments Ltd.(a) | 147,625 | 1,902,886 | ||||||
| Raia Drogasil SA(a) | 102,092 | 522,723 | ||||||
| 3,122,582 | ||||||||
| Canada — 0.36% | ||||||||
| Aritzia, Inc.(a) | 31,644 | 492,198 | ||||||
| China — 4.82% | ||||||||
| Guangzhou Kingmed Diagnostics Group Co., Ltd.(a) | 66,000 | 558,412 | ||||||
| Shanghai Hanbell Precise Machinery Co., Ltd.(a) | 249,400 | 797,006 | ||||||
| Shenzhen Mindray Bio-Medical Electronics Co.(a) | 15,000 | 586,419 | ||||||
| Silergy Corporation(a) | 358,000 | 3,158,434 | ||||||
| WuXi AppTec Co., Ltd.(a)(b)(c) | 72,471 | 870,551 | ||||||
| Wuxi Biologics Cayman, Inc.(a)(b)(c) | 99,900 | 620,445 | ||||||
| 6,591,267 | ||||||||
| Finland — 0.39% | ||||||||
| Musti Group Oyj(a) | 27,381 | 539,274 | ||||||
| France — 3.31% | ||||||||
| Alten SA(a) | 7,562 | 890,730 | ||||||
| Antin Infrastructure Partners(a) | 63,815 | 759,107 | ||||||
| BioMerieux(a) | 10,456 | 1,001,448 | ||||||
| Virbac SA(a) | 6,571 | 1,884,581 | ||||||
| 4,535,866 | ||||||||
| Germany — 2.19% | ||||||||
| AIXTRON SE(a) | 22,680 | 635,107 | ||||||
| Atoss Software AG(a) | 2,201 | 463,540 | ||||||
| Dermapharm Holding SE(a) | 33,429 | 1,289,895 | ||||||
| Hensoldt AG(a) | 20,558 | 607,015 | ||||||
| 2,995,557 | ||||||||
| Hong Kong — 2.27% | ||||||||
| Techtronic Industries Co., Ltd. | 340,200 | 3,099,743 | ||||||
| India — 1.76% | ||||||||
| Avenue Supermarts Ltd.(a)(b)(c) | 12,051 | 525,868 | ||||||
| Bajaj Finance Ltd.(a) | 6,796 | 611,546 | ||||||
| IndiaMart InterMesh Ltd.(a)(b)(c) | 26,782 | 852,242 | ||||||
| Motherson Sumi Wiring India Ltd.(a) | 586,601 | 422,350 | ||||||
| 2,412,006 | ||||||||
| Ireland — 0.92% | ||||||||
| ICON PLC, ADR(a) | 4,037 | 984,866 | ||||||
| Shares | Fair Value | |||||||
| COMMON STOCKS — (continued) | ||||||||
| Ireland — 0.92% (continued) | ||||||||
| Keywords Studios plc(a) | 17,535 | $ | 278,100 | |||||
| 1,262,966 | ||||||||
| Italy — 0.55% | ||||||||
| Recordati Industria Chimica e Farmaceutica SpA(a) | 16,273 | 750,876 | ||||||
| Japan — 5.17% | ||||||||
| BayCurrent Consulting, Inc. | 136,500 | 3,385,147 | ||||||
| Lasertec Corporation | 4,000 | 665,149 | ||||||
| M&A Capital Partners Company Ltd.(a) | 54,300 | 974,409 | ||||||
| M&A Research Institute, Inc.(a) | 23,500 | 505,426 | ||||||
| MonotaRO Co., Ltd.(a) | 194,700 | 1,542,057 | ||||||
| 7,072,188 | ||||||||
| Mexico — 2.38% | ||||||||
| Corp Inmobiliaria Vesta SAB de CV(a) | 360,865 | 1,131,644 | ||||||
| Grupo Aeroportuario del Centro Norte SAB de CV(a) | 72,460 | 555,452 | ||||||
| Regional SAB de CV(a) | 207,933 | 1,575,834 | ||||||
| 3,262,930 | ||||||||
| Netherlands — 0.56% | ||||||||
| ASM International NV(a) | 1,856 | 763,103 | ||||||
| Poland — 1.46% | ||||||||
| Dino Polska SA(a)(b)(c) | 21,093 | 1,995,764 | ||||||
| South Korea — 1.16% | ||||||||
| HPSP Company Ltd.(a) | 8,988 | 207,078 | ||||||
| LEENO Industrial, Inc.(a) | 13,622 | 1,385,343 | ||||||
| 1,592,421 | ||||||||
| Sweden — 6.09% | ||||||||
| AddTech AB(a) | 52,058 | 762,002 | ||||||
| EQT AB(a) | 180,339 | 3,277,842 | ||||||
| HMS Networks AB(a) | 13,071 | 432,302 | ||||||
| Lifco AB, Class B(a) | 63,279 | 1,155,261 | ||||||
| Nibe Industrier AB | 115,726 | 665,345 | ||||||
| OX2 AB(a) | 137,250 | 554,013 | ||||||
| Sagax AB(a) | 27,163 | 490,308 | ||||||
| Swedencare AB | 125,638 | 509,054 | ||||||
| Vitrolife AB(a) | 37,506 | 487,511 | ||||||
| 8,333,638 | ||||||||
| Switzerland — 0.43% | ||||||||
| VAT Group AG(a) | 1,669 | 588,431 | ||||||
| Taiwan — 2.49% | ||||||||
| Asia Vital Components Co., Ltd.(a) | 88,000 | 768,245 | ||||||
| ASPEED Technology, Inc.(a) | 13,000 | 1,028,823 | ||||||
| Chroma Ate Inc(a) | 102,000 | 684,732 | ||||||
| Sinbon Electronics Co., Ltd.(a) | 62,500 | 533,119 | ||||||
| Voltronic Power Technology Corporation(a) | 9,975 | 397,784 | ||||||
| 3,412,703 | ||||||||
See accompanying notes to financial statements.
67
| Grandeur Peak Global Stalwarts Fund | Portfolio of Investments |
| October 31, 2023 (Unaudited) |
| Shares | Fair Value | |||||||
| COMMON STOCKS — (continued) | ||||||||
| United Kingdom — 12.59% | ||||||||
| B&M European Value Retail SA | 729,740 | $ | 4,689,690 | |||||
| CVS Group plc(a) | 161,883 | 2,882,196 | ||||||
| Darktrace plc(a) | 252,699 | 1,074,871 | ||||||
| Diploma plc | 27,275 | 942,049 | ||||||
| Endava plc, ADR(a) | 61,970 | 3,108,415 | ||||||
| Halma PLC | 72,284 | 1,620,777 | ||||||
| Impax Asset Management Group plc(a) | 196,738 | 920,521 | ||||||
| JTC plc(a)(b)(c) | 165,893 | 1,287,281 | ||||||
| Softcat PLC(a) | 46,092 | 708,599 | ||||||
| 17,234,399 | ||||||||
| United States — 40.23% | ||||||||
| Alexandria Real Estate Equities, Inc. | 8,001 | 745,133 | ||||||
| Align Technology, Inc.(a) | 3,192 | 589,211 | ||||||
| Ares Management Corporation, CLASS A | 17,821 | 1,756,972 | ||||||
| Ashtead Group PLC | 29,744 | 1,700,401 | ||||||
| BILL Holdings, Inc.(a) | 3,724 | 339,964 | ||||||
| Cactus, Inc., Class A | 14,501 | 680,677 | ||||||
| Charles River Laboratories International, Inc.(a) | 5,400 | 909,144 | ||||||
| Cloudflare, Inc., Class A(a) | 22,990 | 1,303,303 | ||||||
| Cross Creek Lucid LP/Partnership Interest(a)(d) | 1,300,000 | 1,022,666 | ||||||
| Crowdstrike Holdings, Inc., CLASS A(a) | 13,848 | 2,447,912 | ||||||
| Datadog, Inc., Class A(a) | 7,921 | 645,324 | ||||||
| DexCom, Inc.(a) | 5,289 | 469,822 | ||||||
| DigitalOcean Holdings, Inc.(a) | 52,739 | 1,079,040 | ||||||
| Doximity, Inc.(a) | 23,230 | 474,589 | ||||||
| Elastic NV(a) | 19,555 | 1,467,407 | ||||||
| Etsy, Inc.(a) | 17,936 | 1,117,413 | ||||||
| Evercore, Inc., Class A | 6,904 | 898,763 | ||||||
| Five Below, Inc.(a) | 6,933 | 1,206,203 | ||||||
| Global Industrial Co. | 27,979 | 893,929 | ||||||
| Herc Holdings, Inc. | 4,970 | 530,746 | ||||||
| Houlihan Lokey, Inc. | 13,520 | 1,359,030 | ||||||
| HubSpot, Inc.(a) | 1,399 | 592,854 | ||||||
| IDEXX Laboratories, Inc.(a) | 1,294 | 516,914 | ||||||
| Insulet Corporation(a) | 4,080 | 540,886 | ||||||
| JFrog Ltd.(a) | 50,604 | 1,138,084 | ||||||
| Littelfuse, Inc. | 21,061 | 4,563,287 | ||||||
| Lululemon Athletica, Inc.(a) | 3,398 | 1,337,045 | ||||||
| MarketAxess Holdings, Inc. | 2,788 | 595,935 | ||||||
| Marvell Technology, Inc. | 16,321 | 770,678 | ||||||
| MaxCyte, Inc.(a) | 175,193 | 518,571 | ||||||
| Medpace Holdings, Inc.(a) | 2,809 | 681,660 | ||||||
| Microchip Technology, Inc. | 8,177 | 582,938 | ||||||
| Moelis & Co., Class A | 17,460 | 727,034 | ||||||
| Monolithic Power Systems, Inc. | 3,581 | 1,581,871 | ||||||
| Neogen Corporation(a) | 41,074 | 611,592 | ||||||
| NV5 Global, Inc.(a) | 7,983 | 753,196 | ||||||
| Ollie’s Bargain Outlet Holdings, Inc.(a) | 15,037 | 1,161,458 | ||||||
| P10, Inc.(a) | 124,311 | 1,171,010 | ||||||
| Shares | Fair Value | |||||||
| COMMON STOCKS — (continued) | ||||||||
| United States — 40.23% (continued) | ||||||||
| PagerDuty, Inc.(a) | 33,989 | $ | 685,558 | |||||
| Paycom Software, Inc. | 9,631 | 2,359,306 | ||||||
| PJT Partners, Inc., Class A | 49,152 | 3,851,551 | ||||||
| Pool Corporation | 2,557 | 807,424 | ||||||
| Qualys, Inc.(a) | 10,218 | 1,562,843 | ||||||
| Rexford Industrial Realty, Inc. | 16,495 | 713,244 | ||||||
| Shoals Technologies Group, Inc., Class A(a) | 77,808 | 1,195,131 | ||||||
| Silicon Laboratories, Inc.(a) | 11,488 | 1,058,964 | ||||||
| SiTime Corporation(a) | 5,573 | 556,185 | ||||||
| Terreno Realty Corporation | 9,799 | 522,091 | ||||||
| Tradeweb Markets, Inc., CLASS A | 15,993 | 1,439,530 | ||||||
| Zscaler, Inc.(a) | 5,113 | 811,382 | ||||||
| 55,045,871 | ||||||||
| Vietnam — 2.19% | ||||||||
| Asia Commercial Bank JSC(a) | 622,000 | 541,904 | ||||||
| FPT Corporation(a) | 295,205 | 997,517 | ||||||
| Vietnam Technological & Commercial Joint Stock Bank(a) | 1,291,505 | 1,456,447 | ||||||
| 2,995,868 | ||||||||
| Total Common Stocks (Cost $133,670,912) | 134,883,199 | |||||||
| PREFERRED STOCKS — 1.19% | ||||||||
| United States — 1.19% | ||||||||
| Dataminr, Inc. Private Placement(a)(d) | 24,262 | 482,814 | ||||||
| Gusto, Inc., Series E Preferred(a)(d) | 37,637 | 1,144,165 | ||||||
| 1,626,979 | ||||||||
| Total Preferred Stocks | ||||||||
| (Cost $1,626,803) | 1,626,979 | |||||||
| Total Investments — 99.75% | ||||||||
| (Cost $135,297,715) | 136,510,178 | |||||||
| Other Assets in Excess of Liabilities — 0.25% | 335,340 | |||||||
| NET ASSETS — 100.00% | $ | 136,845,518 | ||||||
| (a) | Non-income producing security. |
| (b) | Security exempt from registration under Rule 144A of the Securities Act of 1933. These securities may be resold in the ordinary course of business in transactions exempt from registration, normally to qualified institutional buyers. As of October 31, 2023, these securities had a total aggregate market value of $6,152,151, representing 4.50% of net assets. |
| (c) | Security was purchased pursuant to Regulation S under the Securities Act of 1933, which exempts securities offered and sold outside of the United States from registration. Such security cannot be sold in the United States without either an effective registration statement filed pursuant to the Securities Act of 1933, or pursuant to an exemption from registration. As of October 31, 2023, the aggregate market value of these securities was $6,152,151, representing 4.50% of net assets. |
| (d) | As a result of the use of significant unobservable inputs to determine fair value, these investments have been classified as level 3 assets. See also Note 2 to the financial statements for additional information. |
See accompanying notes to financial statements.
68
| Grandeur Peak Global Stalwarts Fund | Portfolio of Investments |
| October 31, 2023 (Unaudited) |
| Sector Composition (October 31, 2023) | |
| Technology | 34.4% |
| Financials | 17.6% |
| Industrials | 16.1% |
| Health Care | 14.0% |
| Consumer Staples | 7.4% |
| Consumer Discretionary | 5.2% |
| Real Estate | 3.2% |
| Energy | 1.3% |
| Listed Private Equity Investments | 0.6% |
| Other Assets in Excess of Liabilities | 0.3% |
| Total | 100.0% |
| Industry Composition (October 31, 2023) | |
| IT Services | 9.4% |
| Application Software | 8.1% |
| Institutional Brokerage | 6.4% |
| Health Care Services | 5.9% |
| Semiconductor Devices | 5.9% |
| Private Equity | 5.2% |
| Mass Merchants | 5.2% |
| Infrastructure Software | 4.3% |
| Electrical Components | 3.6% |
| Specialty & Generic Pharma | 3.4% |
| Electronics Components | 3.3% |
| Industrial Wholesale & Rental | 2.8% |
| Banks | 2.6% |
| Medical Equipment | 2.4% |
| Other Machinery & Equipment | 2.3% |
| Food & Drug Stores | 2.2% |
| Investment Management | 2.0% |
| Measurement Instruments | 1.7% |
| Semiconductor Mfg | 1.5% |
| Industrial Reit | 1.4% |
| Online Marketplace | 1.4% |
| Specialty Apparel Stores | 1.3% |
| Engineering Services | 1.2% |
| Industrial Owners & Developers | 1.2% |
| Specialty Online Retailers | 1.1% |
| Life Science & Diagnostics | 1.1% |
| Flow Control Equipment | 1.1% |
| Other Industries (each less than 1%) | 11.8% |
| Other Assets in Excess of Liabilities | 0.3% |
| Total | 100.0% |
See accompanying notes to financial statements.
69
| Grandeur Peak International Opportunities Fund | Portfolio of Investments |
| October 31, 2023 (Unaudited) |
| Shares | Fair Value | |||||||
| COMMON STOCKS — 98.36% | ||||||||
| Argentina — 1.11% | ||||||||
| Globant SA(a) | 33,755 | $ | 5,748,139 | |||||
| Australia — 0.66% | ||||||||
| Fiducian Group Ltd.(a) | 215,640 | 752,360 | ||||||
| PeopleIN Ltd.(a) | 1,501,201 | 1,433,207 | ||||||
| Pinnacle Investment Management Group(a) | 247,111 | 1,213,295 | ||||||
| 3,398,862 | ||||||||
| Belgium — 3.23% | ||||||||
| Melexis NV | 89,020 | 6,533,535 | ||||||
| Warehouses De Pauw CVA(a) | 178,074 | 4,394,842 | ||||||
| X-Fab Silicon Foundries SE(a)(b)(c) | 639,845 | 5,782,915 | ||||||
| 16,711,292 | ||||||||
| Brazil — 1.74% | ||||||||
| Hypera SA | 418,400 | 2,518,252 | ||||||
| Locaweb Servicos de Internet SA(a)(b)(c) | 2,558,300 | 2,760,847 | ||||||
| Patria Investments Ltd.(a) | 287,046 | 3,700,023 | ||||||
| 8,979,122 | ||||||||
| Canada — 1.95% | ||||||||
| Aritzia, Inc.(a) | 220,401 | 3,428,170 | ||||||
| Gildan Activewear, Inc.(a) | 92,922 | 2,639,388 | ||||||
| Richelieu Hardware Ltd.(a) | 134,736 | 4,030,149 | ||||||
| 10,097,707 | ||||||||
| China — 5.09% | ||||||||
| Adicon Holdings Ltd.(a) | 1,856,500 | 2,652,397 | ||||||
| Guangzhou Kingmed Diagnostics Group Co., Ltd.(a) | 228,200 | 1,930,753 | ||||||
| Hangzhou Robam Appliances Co., Ltd.(a) | 1,160,377 | 3,663,796 | ||||||
| Man Wah Holdings Ltd.(a) | 4,669,500 | 2,900,070 | ||||||
| Shanghai Hanbell Precise Machinery Co., Ltd.(a) | 1,152,700 | 3,683,674 | ||||||
| Silergy Corporation(a) | 704,996 | 6,219,787 | ||||||
| Suofeiya Home Collection Co., Ltd., CLASS A(a) | 620,100 | 1,528,192 | ||||||
| TK Group Holdings Ltd.(a) | 6,312,500 | 1,089,023 | ||||||
| WuXi AppTec Co., Ltd.(a)(b)(c) | 218,000 | 2,618,702 | ||||||
| 26,286,394 | ||||||||
| Colombia — 0.65% | ||||||||
| Parex Resources, Inc. | 174,306 | 3,340,919 | ||||||
| Finland — 1.46% | ||||||||
| Musti Group Oyj(a) | 384,110 | 7,565,126 | ||||||
| France — 6.40% | ||||||||
| Alten SA(a) | 66,453 | 7,827,515 | ||||||
| Antin Infrastructure Partners(a) | 141,072 | 1,678,113 | ||||||
| Aubay SA(a) | 13,151 | 440,501 | ||||||
| BioMerieux(a) | 31,849 | 3,050,412 | ||||||
| Esker SA(a) | 13,831 | 1,752,112 | ||||||
| Neurones SA(a) | 77,697 | 2,824,523 | ||||||
| Thermador Groupe(a) | 61,268 | 4,350,813 | ||||||
| Shares | Fair Value | |||||||
| COMMON STOCKS — (continued) | ||||||||
| France — 6.40% (continued) | ||||||||
| Virbac SA(a) | 38,869 | $ | 11,147,740 | |||||
| 33,071,729 | ||||||||
| Germany — 4.63% | ||||||||
| Atoss Software AG(a) | 14,854 | 3,128,316 | ||||||
| Dermapharm Holding SE(a) | 165,476 | 6,385,072 | ||||||
| Friedrich Vorwerrk Group SE(a) | 99,654 | 1,316,205 | ||||||
| Mensch und Maschine Software SE(a) | 76,966 | 4,019,761 | ||||||
| Nagarro SE(a) | 25,475 | 1,791,527 | ||||||
| Nexus AG(a) | 81,206 | 3,957,600 | ||||||
| QIAGEN NV(a) | 89,137 | 3,336,398 | ||||||
| 23,934,879 | ||||||||
| Hong Kong — 0.66% | ||||||||
| Techtronic Industries Co., Ltd. | 374,200 | 3,409,535 | ||||||
| India — 4.78% | ||||||||
| Ajanta Pharma Ltd.(a) | 133,905 | 2,835,558 | ||||||
| Cera Sanitaryware Ltd.(a) | 31,552 | 3,214,636 | ||||||
| Gulf Oil Lubricants India Ltd. | 161,771 | 1,213,023 | ||||||
| IndiaMart InterMesh Ltd.(a)(b)(c) | 122,694 | 3,904,305 | ||||||
| Kotak Mahindra Bank Ltd.(a) | 115,766 | 2,418,358 | ||||||
| Metropolis Healthcare Ltd.(a)(b)(c) | 207,987 | 3,510,684 | ||||||
| Motherson Sumi Wiring India Ltd.(a) | 2,715,755 | 1,955,329 | ||||||
| Polycab India Ltd.(a) | 57,111 | 3,376,061 | ||||||
| WNS Holdings Ltd., ADR(a) | 41,706 | 2,265,470 | ||||||
| 24,693,424 | ||||||||
| Indonesia — 2.06% | ||||||||
| Arwana Citramulia Tbk PT(a) | 48,815,300 | 2,021,972 | ||||||
| Avia Avian Tbk PT(a) | 22,774,300 | 714,645 | ||||||
| Bank BTPN Syariah Tbk PT(a) | 17,877,500 | 1,767,106 | ||||||
| Selamat Sempurna Tbk PT(a) | 28,534,800 | 3,886,062 | ||||||
| Ultrajaya Milk Industry & Trading Co.(a) | 21,448,900 | 2,261,463 | ||||||
| 10,651,248 | ||||||||
| Ireland — 2.32% | ||||||||
| ICON PLC, ADR(a) | 15,398 | 3,756,496 | ||||||
| Keywords Studios plc(a) | 260,220 | 4,127,013 | ||||||
| Uniphar PLC(a) | 1,850,749 | 4,103,417 | ||||||
| 11,986,926 | ||||||||
| Italy — 2.59% | ||||||||
| Interpump Group SpA(a) | 124,272 | 5,181,836 | ||||||
| Recordati Industria Chimica e Farmaceutica SpA(a) | 88,215 | 4,070,456 | ||||||
| Sesa SpA(a) | 40,842 | 4,117,050 | ||||||
| 13,369,342 | ||||||||
| Japan — 15.46% | ||||||||
| AIT Corporation(a) | 156,500 | 1,698,450 | ||||||
| Atrae, Inc.(a) | 183,100 | 1,200,735 | ||||||
| BayCurrent Consulting, Inc. | 165,700 | 4,109,294 | ||||||
| Beenos, Inc.(a) | 112,700 | 1,049,859 | ||||||
| Carenet, Inc. NPV(a) | 526,300 | 2,972,210 | ||||||
| Central Automotive Products Ltd.(a) | 37,900 | 843,889 | ||||||
| Charm Care Corporation KK(a) | 480,900 | 3,470,920 | ||||||
See accompanying notes to financial statements.
70
| Grandeur Peak International Opportunities Fund | Portfolio of Investments |
| October 31, 2023 (Unaudited) |
| Shares | Fair Value | |||||||
| COMMON STOCKS — (continued) | ||||||||
| Japan — 15.46% (continued) | ||||||||
| Comture Corporation(a) | 190,200 | $ | 2,507,139 | |||||
| Create SD Holdings Co., Ltd.(a) | 115,500 | 2,457,447 | ||||||
| CrowdWorks, Inc.(a) | 425,700 | 3,507,830 | ||||||
| eGuarantee, Inc.(a) | 184,100 | 2,100,010 | ||||||
| F&M Co., Ltd.(a) | 58,400 | 783,290 | ||||||
| FP Partner, Inc.(a) | 69,900 | 1,899,970 | ||||||
| Funai Soken Holdings, Inc.(a) | 86,100 | 1,399,072 | ||||||
| gremz, Inc.(a) | 153,100 | 1,999,921 | ||||||
| Hennge KK(a) | 279,100 | 1,822,919 | ||||||
| Integral Corporation(a) | 251,200 | 2,820,666 | ||||||
| Kitz Corporation | 333,200 | 2,222,432 | ||||||
| M&A Capital Partners Company Ltd.(a) | 216,400 | 3,883,278 | ||||||
| MarkLines Co., Ltd.(a) | 270,000 | 4,912,815 | ||||||
| MonotaRO Co., Ltd.(a) | 211,700 | 1,676,700 | ||||||
| Prestige International, Inc.(a) | 800,100 | 3,214,652 | ||||||
| Seria Co., Ltd.(a) | 97,800 | 1,353,682 | ||||||
| Strike Co., Ltd. | 147,500 | 3,571,334 | ||||||
| Sun*, Inc.(a) | 351,100 | 2,913,963 | ||||||
| Synchro Food Co., Ltd.(a) | 643,100 | 2,342,017 | ||||||
| Systena Corporation(a) | 1,290,400 | 2,170,886 | ||||||
| Trancom Co., Ltd.(a) | 70,990 | 3,245,658 | ||||||
| Tsuruha Holdings, Inc. | 54,100 | 3,943,955 | ||||||
| ULS Group, Inc.(a) | 35,400 | 1,078,991 | ||||||
| User Local, Inc.(a) | 110,100 | 1,131,689 | ||||||
| Visional, Inc.(a) | 56,600 | 2,737,114 | ||||||
| Yakuodo Holdings Co., Ltd.(a) | 156,800 | 2,863,417 | ||||||
| 79,906,204 | ||||||||
| Luxembourg — 0.44% | ||||||||
| Sword Group(a) | 62,260 | 2,263,341 | ||||||
| Mexico — 2.80% | ||||||||
| Bolsa Mexicana de Valores SAB(a) | 1,436,400 | 2,236,284 | ||||||
| Corp Inmobiliaria Vesta SAB de CV(a) | 468,200 | 1,468,237 | ||||||
| Grupo Aeroportuario del Centro Norte SAB de CV(a) | 339,500 | 2,602,486 | ||||||
| Grupo Financiero Banorte SAB de CV | 366,300 | 2,967,205 | ||||||
| Regional SAB de CV(a) | 416,500 | 3,156,472 | ||||||
| Vesta Real Estate Corporation(a) | 64,778 | 2,036,620 | ||||||
| 14,467,304 | ||||||||
| Netherlands — 0.56% | ||||||||
| Redcare Pharmacy NV(a) | 26,026 | 2,898,970 | ||||||
| Norway — 1.07% | ||||||||
| Bouvet ASA(a) | 326,244 | 1,571,345 | ||||||
| Nordic Semiconductor ASA(a) | 172,183 | 1,389,796 | ||||||
| SmartCraft ASA(a) | 1,335,830 | 2,547,286 | ||||||
| 5,508,427 | ||||||||
| Philippines — 1.84% | ||||||||
| Century Pacific Food, Inc.(a) | 3,704,800 | 1,826,953 | ||||||
| Puregold Price Club, Inc.(a) | 6,141,500 | 2,931,220 | ||||||
| Robinsons Land Corporation(a) | 11,279,400 | 2,769,194 | ||||||
| Shares | Fair Value | |||||||
| COMMON STOCKS — (continued) | ||||||||
| Philippines — 1.84% (continued) | ||||||||
| Wilcon Depot, Inc.(a) | 5,738,600 | $ | 2,001,132 | |||||
| 9,528,499 | ||||||||
| Poland — 1.66% | ||||||||
| Dino Polska SA(a)(b)(c) | 60,569 | 5,730,880 | ||||||
| Inter Cars SA(a) | 21,003 | 2,842,489 | ||||||
| 8,573,369 | ||||||||
| Singapore — 1.06% | ||||||||
| iFast Corporation(a) | 135,600 | 653,647 | ||||||
| Keppel DC REIT(a) | 1,208,200 | 1,491,300 | ||||||
| Riverstone Holdings Ltd. | 7,661,900 | 3,301,626 | ||||||
| 5,446,573 | ||||||||
| South Africa — 0.45% | ||||||||
| Italtile Ltd.(a) | 3,754,710 | 2,316,665 | ||||||
| South Korea — 1.70% | ||||||||
| Eo Technics Co., Ltd.(a) | 26,786 | 2,759,769 | ||||||
| Hyundai Ezwel Co., Ltd.(a) | 317,703 | 1,452,190 | ||||||
| LEENO Industrial, Inc.(a) | 38,262 | 3,891,204 | ||||||
| Tokai Carbon Korea Co., Ltd.(a) | 11,482 | 704,021 | ||||||
| 8,807,184 | ||||||||
| Sweden — 5.82% | ||||||||
| AddTech AB(a) | 235,018 | 3,440,088 | ||||||
| Beijer Alma AB(a) | 233,081 | 3,704,050 | ||||||
| Byggfakta Group Nordic Holdco AB(a) | 650,446 | 1,564,487 | ||||||
| EQT AB(a) | 108,667 | 1,975,132 | ||||||
| Knowit AB | 292,109 | 3,663,442 | ||||||
| Lifco AB, Class B(a) | 131,184 | 2,394,977 | ||||||
| Lyko Group AB(a)(c) | 59,177 | 507,849 | ||||||
| Nibe Industrier AB | 219,321 | 1,260,945 | ||||||
| OX2 AB(a) | 261,656 | 1,056,181 | ||||||
| RVRC Holding AB(a) | 183,655 | 633,732 | ||||||
| Sagax AB(a) | 117,372 | 2,118,634 | ||||||
| Sdiptech AB(a) | 245,106 | 4,799,770 | ||||||
| Swedencare AB | 519,457 | 2,104,711 | ||||||
| Vitrolife AB(a) | 64,556 | 839,113 | ||||||
| 30,063,111 | ||||||||
| Taiwan — 3.14% | ||||||||
| M3 Technology, Inc.(a) | 559,000 | 2,031,225 | ||||||
| Sinbon Electronics Co., Ltd.(a) | 373,000 | 3,181,653 | ||||||
| Sporton International, Inc.(a) | 1,189,338 | 7,837,603 | ||||||
| Voltronic Power Technology Corporation(a) | 47,850 | 1,908,165 | ||||||
| Wistron Information Technology and Services Corporation(a) | 376,312 | 1,257,309 | ||||||
| 16,215,955 | ||||||||
| United Kingdom — 18.04% | ||||||||
| AB Dynamics PLC(a) | 29,969 | 522,647 | ||||||
| B&M European Value Retail SA | 2,013,461 | 12,939,553 | ||||||
| CVS Group plc(a) | 666,755 | 11,871,033 | ||||||
| Diploma plc | 135,284 | 4,672,562 | ||||||
| Endava plc, ADR(a) | 216,852 | 10,877,296 | ||||||
| Foresight Group Holdings Ltd.(a) | 833,342 | 3,726,968 | ||||||
See accompanying notes to financial statements.
71
| Grandeur Peak International Opportunities Fund | Portfolio of Investments |
| October 31, 2023 (Unaudited) |
| Shares | Fair Value | |||||||
| COMMON STOCKS — (continued) | ||||||||
| United Kingdom — 18.04% (continued) | ||||||||
| FRP Advisory Group PLC(a) | 1,083,932 | $ | 1,501,729 | |||||
| GlobalData PLC(a) | 1,466,966 | 2,674,212 | ||||||
| Halma PLC | 133,695 | 2,997,755 | ||||||
| Hotel Chocolat Group PLC(a) | 719,776 | 1,185,281 | ||||||
| Impax Asset Management Group plc(a) | 985,124 | 4,609,313 | ||||||
| Intermediate Capital Group PLC(a) | 118,005 | 1,870,807 | ||||||
| JTC plc(a)(b)(c) | 923,122 | 7,163,160 | ||||||
| Marlowe PLC(a) | 603,955 | 4,066,296 | ||||||
| On The Beach Group PLC(a)(b)(c) | 1,269,458 | 1,465,637 | ||||||
| Pensionbee Group PLC(a) | 946,427 | 693,568 | ||||||
| Petershill Partners PLC(a) | 1,152,782 | 2,067,846 | ||||||
| Pets at Home Group PLC(a) | 492,287 | 1,679,964 | ||||||
| Premier Miton Group PLC(a) | 1,050,931 | 657,758 | ||||||
| Softcat PLC(a) | 296,728 | 4,561,773 | ||||||
| Volution Group PLC(a) | 2,602,618 | 11,468,928 | ||||||
| 93,274,086 | ||||||||
| United States — 3.00% | ||||||||
| Bank of NT Butterfield & Son Ltd. (The) | 91,729 | 2,317,075 | ||||||
| BizLink Holding, Inc.(a) | 470,264 | 3,642,034 | ||||||
| Frontage Holdings Corporation(a)(b)(c) | 12,426,000 | 3,096,476 | ||||||
| Genpact Ltd. | 76,807 | 2,576,107 | ||||||
| GQG Partners, Inc.(a) | 1,987,710 | 1,639,192 | ||||||
| JFrog Ltd.(a) | 99,887 | 2,246,459 | ||||||
| 15,517,343 | ||||||||
| Vietnam — 1.99% | ||||||||
| Asia Commercial Bank JSC(a) | 2,833,200 | 2,468,366 | ||||||
| FPT Corporation(a) | 934,432 | 3,157,507 | ||||||
| Vietnam Technological & Commercial Joint Stock Bank(a) | 4,151,773 | 4,682,007 | ||||||
| 10,307,880 | ||||||||
| Total Common Stocks (Cost $521,005,131) | 508,339,555 | |||||||
| Total Investments — 98.36% | ||||||||
| (Cost $521,005,131) | 508,339,555 | |||||||
| Other Assets in Excess of Liabilities — 1.64% | 8,478,952 | |||||||
| NET ASSETS — 100.00% | $ | 516,818,507 | ||||||
| (a) | Non-income producing security. |
| (b) | Security exempt from registration under Rule 144A of the Securities Act of 1933. These securities may be resold in the ordinary course of business in transactions exempt from registration, normally to qualified institutional buyers. As of October 31, 2023, these securities had a total aggregate market value of $36,033,606, representing 6.98% of net assets. |
| (c) | Security was purchased pursuant to Regulation S under the Securities Act of 1933, which exempts securities offered and sold outside of the United States from registration. Such security cannot be sold in the United States without either an effective registration statement filed pursuant to the Securities Act of 1933, or pursuant to an exemption from registration. As of October 31, 2023, the aggregate market value of these securities was $36,541,455, representing 7.07% of net assets. |
See accompanying notes to financial statements.
72
| Grandeur Peak International Opportunities Fund | Portfolio of Investments |
| October 31, 2023 (Unaudited) |
| Sector Composition (October 31, 2023) | |
| Technology | 25.1% |
| Industrials | 17.7% |
| Health Care | 16.4% |
| Financials | 12.7% |
| Consumer Discretionary | 10.7% |
| Consumer Staples | 7.8% |
| Communications | 3.3% |
| Real Estate | 2.8% |
| Energy | 1.1% |
| Utilities | 0.4% |
| Materials | 0.4% |
| Other Assets in Excess of Liabilities | 1.6% |
| Total | 100.0% |
| Industry Composition (October 31, 2023) | |
| IT Services | 7.2% |
| Health Care Services | 6.6% |
| Specialty & Generic Pharma | 5.2% |
| Application Software | 4.5% |
| Food & Drug Stores | 4.0% |
| Banks | 3.8% |
| It Services | 3.8% |
| Mass Merchants | 2.8% |
| Private Equity | 2.5% |
| Internet Media & Services | 2.3% |
| Investment Management | 2.3% |
| Comml & Res Bldg Equipment & Sys | 2.2% |
| Flow Control Equipment | 2.1% |
| Home Products Stores | 2.1% |
| Other Commercial Support Services | 2.0% |
| Professional Services | 2.0% |
| Electronics Components | 2.0% |
| Semiconductor Devices | 1.9% |
| Wealth Management | 1.7% |
| Engineering Services | 1.5% |
| Technology Distributors | 1.4% |
| Building Products | 1.4% |
| Life Science & Diagnostics | 1.2% |
| Auto Parts | 1.2% |
| Semiconductor Manufacturing | 1.1% |
| Rubber & Plastic | 1.1% |
| Electrical Components | 1.0% |
| Packaged Food | 1.0% |
| Online Marketplace | 1.0% |
| Other Industries (each less than 1%) | 25.4% |
| Other Assets in Excess of Liabilities | 1.6% |
| Total | 100.0% |
See accompanying notes to financial statements.
73
| Grandeur Peak International Stalwarts Fund | Portfolio of Investments |
| October 31, 2023 (Unaudited) |
| Shares | Fair Value | |||||||
| COMMON STOCKS — 97.63% | ||||||||
| Argentina — 3.62% | ||||||||
| Globant SA(a) | 295,153 | $ | 50,261,604 | |||||
| Australia — 1.11% | ||||||||
| Domino’s Pizza Enterprises Ltd.(a) | 331,348 | 10,677,797 | ||||||
| Netwealth Group Ltd.(a) | 582,736 | 4,694,714 | ||||||
| 15,372,511 | ||||||||
| Belgium — 3.04% | ||||||||
| Melexis NV | 372,166 | 27,314,755 | ||||||
| Warehouses De Pauw CVA(a) | 606,268 | 14,962,609 | ||||||
| 42,277,364 | ||||||||
| Brazil — 3.38% | ||||||||
| CI&T, Inc.(a) | 497,181 | 2,287,033 | ||||||
| Hypera SA | 2,523,185 | 15,186,462 | ||||||
| Patria Investments Ltd.(a) | 1,155,126 | 14,889,574 | ||||||
| Raia Drogasil SA(a) | 2,841,756 | 14,550,124 | ||||||
| 46,913,193 | ||||||||
| Canada — 0.50% | ||||||||
| Aritzia, Inc.(a) | 446,727 | 6,948,500 | ||||||
| China — 6.64% | ||||||||
| Guangzhou Kingmed Diagnostics Group Co., Ltd.(a) | 633,102 | 5,356,544 | ||||||
| Hangzhou Tigermed Consulting Co., Ltd.(a) | 770,713 | 7,026,497 | ||||||
| Man Wah Holdings Ltd.(a) | 6,006,261 | 3,730,287 | ||||||
| Shanghai Hanbell Precise Machinery Co., Ltd.(a) | 2,961,071 | 9,462,670 | ||||||
| Shenzhen Mindray Bio-Medical Electronics Co.(a) | 266,900 | 10,434,349 | ||||||
| Silergy Corporation(a) | 3,700,805 | 32,650,140 | ||||||
| WuXi AppTec Co., Ltd.(a)(b)(c) | 1,264,676 | 15,191,789 | ||||||
| Wuxi Biologics Cayman, Inc.(a)(b)(c) | 1,349,400 | 8,380,670 | ||||||
| 92,232,946 | ||||||||
| Finland — 0.41% | ||||||||
| Musti Group Oyj(a) | 287,787 | 5,668,024 | ||||||
| France — 4.96% | ||||||||
| Alten SA(a) | 158,472 | 18,666,455 | ||||||
| Antin Infrastructure Partners(a) | 709,212 | 8,436,388 | ||||||
| BioMerieux(a) | 222,562 | 21,316,395 | ||||||
| Virbac SA(a) | 71,568 | 20,525,905 | ||||||
| 68,945,143 | ||||||||
| Germany — 3.81% | ||||||||
| AIXTRON SE(a) | 267,193 | 7,482,196 | ||||||
| Atoss Software AG(a) | 46,501 | 9,793,310 | ||||||
| Dermapharm Holding SE(a) | 444,565 | 17,154,027 | ||||||
| Hensoldt AG(a) | 280,335 | 8,277,433 | ||||||
| QIAGEN NV(a) | 275,338 | 10,305,901 | ||||||
| 53,012,867 | ||||||||
| Hong Kong — 2.80% | ||||||||
| Techtronic Industries Co., Ltd. | 4,269,300 | 38,899,855 | ||||||
| Shares | Fair Value | |||||||
| COMMON STOCKS — (continued) | ||||||||
| India — 4.40% | ||||||||
| Ajanta Pharma Ltd.(a) | 245,324 | $ | 5,194,954 | |||||
| Avenue Supermarts Ltd.(a)(b)(c) | 193,495 | 8,443,511 | ||||||
| Bajaj Finance Ltd.(a) | 136,389 | 12,273,118 | ||||||
| IndiaMart InterMesh Ltd.(a)(b)(c) | 372,625 | 11,857,481 | ||||||
| Kotak Mahindra Bank Ltd.(a) | 418,049 | 8,733,067 | ||||||
| Metropolis Healthcare Ltd.(a)(b)(c) | 348,082 | 5,875,395 | ||||||
| Motherson Sumi Wiring India Ltd.(a) | 12,111,741 | 8,720,390 | ||||||
| 61,097,916 | ||||||||
| Ireland — 2.15% | ||||||||
| ICON PLC, ADR(a) | 95,900 | 23,395,764 | ||||||
| Keywords Studios plc(a) | 408,605 | 6,480,355 | ||||||
| 29,876,119 | ||||||||
| Italy — 2.86% | ||||||||
| Interpump Group SpA(a) | 338,389 | 14,109,987 | ||||||
| Recordati Industria Chimica e Farmaceutica SpA(a) | 336,733 | 15,537,685 | ||||||
| Sesa SpA(a) | 99,883 | 10,068,638 | ||||||
| 39,716,310 | ||||||||
| Japan — 8.75% | ||||||||
| BayCurrent Consulting, Inc. | 1,653,223 | 40,999,276 | ||||||
| GMO Payment Gateway, Inc. NPV(a) | 183,400 | 7,242,833 | ||||||
| Lasertec Corporation | 41,700 | 6,934,181 | ||||||
| M&A Capital Partners Company Ltd.(a) | 652,800 | 11,714,439 | ||||||
| M&A Research Institute, Inc.(a) | 313,300 | 6,738,301 | ||||||
| MonotaRO Co., Ltd.(a) | 2,817,914 | 22,318,362 | ||||||
| Systena Corporation(a) | 6,826,500 | 11,484,463 | ||||||
| Tsuruha Holdings, Inc. | 144,100 | 10,505,064 | ||||||
| Visional, Inc.(a) | 77,700 | 3,757,486 | ||||||
| 121,694,405 | ||||||||
| Mexico — 4.62% | ||||||||
| Corp Inmobiliaria Vesta SAB de CV(a) | 5,330,800 | 16,716,959 | ||||||
| Grupo Aeroportuario del Centro Norte SAB de CV(a) | 1,324,852 | 10,155,842 | ||||||
| Grupo Financiero Banorte SAB de CV | 1,047,400 | 8,484,441 | ||||||
| Regional SAB de CV(a) | 2,491,700 | 18,883,509 | ||||||
| Wal-Mart de Mexico SAB de CV | 2,801,500 | 10,037,654 | ||||||
| 64,278,405 | ||||||||
| Netherlands — 0.65% | ||||||||
| ASM International NV(a) | 21,869 | 8,991,540 | ||||||
| Philippines — 0.48% | ||||||||
| Wilcon Depot, Inc.(a) | 19,282,400 | 6,724,049 | ||||||
| Poland — 2.25% | ||||||||
| Dino Polska SA(a)(b)(c) | 330,947 | 31,313,337 | ||||||
| Singapore — 0.64% | ||||||||
| Keppel DC REIT(a) | 7,166,937 | 8,846,261 | ||||||
| South Korea — 1.44% | ||||||||
| HPSP Company Ltd.(a) | 106,983 | 2,464,827 | ||||||
74
| Grandeur Peak International Stalwarts Fund | Portfolio of Investments |
| October 31, 2023 (Unaudited) |
| Shares | Fair Value | |||||||
| COMMON STOCKS — (continued) | ||||||||
| South Korea — 1.44% (continued) | ||||||||
| LEENO Industrial, Inc.(a) | 172,898 | $ | 17,583,541 | |||||
| 20,048,368 | ||||||||
| Sweden — 8.83% | ||||||||
| AddTech AB(a) | 853,769 | 12,497,087 | ||||||
| EQT AB(a) | 2,410,322 | 43,810,021 | ||||||
| HMS Networks AB(a) | 125,392 | 4,147,132 | ||||||
| Lagercrantz Group AB(a) | 796,367 | 7,255,220 | ||||||
| Lifco AB, Class B(a) | 816,984 | 14,915,372 | ||||||
| Nibe Industrier AB | 1,981,734 | 11,393,612 | ||||||
| OX2 AB(a) | 1,757,530 | 7,094,312 | ||||||
| Sagax AB(a) | 519,907 | 9,384,628 | ||||||
| Swedencare AB | 1,359,064 | 5,506,591 | ||||||
| Vitrolife AB(a) | 524,690 | 6,820,034 | ||||||
| 122,824,009 | ||||||||
| Switzerland — 0.51% | ||||||||
| VAT Group AG(a) | 20,182 | 7,115,463 | ||||||
| Taiwan — 4.18% | ||||||||
| Asia Vital Components Co., Ltd.(a) | 1,123,000 | 9,803,859 | ||||||
| ASPEED Technology, Inc.(a) | 195,145 | 15,443,821 | ||||||
| Chroma Ate Inc(a) | 1,549,000 | 10,398,534 | ||||||
| Sinbon Electronics Co., Ltd.(a) | 1,523,000 | 12,991,039 | ||||||
| Voltronic Power Technology Corporation(a) | 236,490 | 9,430,762 | ||||||
| 58,068,015 | ||||||||
| United Kingdom — 16.58% | ||||||||
| B&M European Value Retail SA | 10,437,790 | 67,078,694 | ||||||
| CVS Group plc(a) | 1,321,086 | 23,520,867 | ||||||
| Darktrace plc(a) | 3,814,544 | 16,225,395 | ||||||
| Diploma plc | 704,060 | 24,317,468 | ||||||
| Endava plc, ADR(a) | 734,651 | 36,850,094 | ||||||
| Halma PLC | 1,181,212 | 26,485,540 | ||||||
| Impax Asset Management Group plc(a) | 2,230,760 | 10,437,541 | ||||||
| JTC plc(a)(b)(c) | 1,877,367 | 14,567,824 | ||||||
| Softcat PLC(a) | 724,263 | 11,134,518 | ||||||
| 230,617,941 | ||||||||
| United States — 7.85% | ||||||||
| Ashtead Group PLC | 437,417 | 25,006,193 | ||||||
| Cloudflare, Inc., Class A(a) | 224,172 | 12,708,311 | ||||||
| JFrog Ltd.(a) | 939,323 | 21,125,374 | ||||||
| Lululemon Athletica, Inc.(a) | 61,106 | 24,043,989 | ||||||
| Monolithic Power Systems, Inc. | 59,315 | 26,201,808 | ||||||
| 109,085,675 | ||||||||
| Vietnam — 1.17% | ||||||||
| Asia Commercial Bank JSC(a) | 7,767,000 | 6,766,836 | ||||||
| Vietnam Technological & Commercial Joint Stock Bank(a) | 8,443,926 | 9,522,320 | ||||||
| 16,289,156 | ||||||||
| Total Common Stocks | ||||||||
| (Cost $1,417,974,773) | 1,357,118,976 | |||||||
| Fair Value | ||||
| COMMON STOCKS — (continued) | ||||
| Total Investments — 97.63% | ||||
| (Cost $1,417,974,773) | $ | 1,357,118,976 | ||
| Other Assets in Excess of Liabilities — 2.37% | 32,874,978 | |||
| NET ASSETS — 100.00% | $ | 1,389,993,954 | ||
| (a) | Non-income producing security. |
| (b) | Security exempt from registration under Rule 144A of the Securities Act of 1933. These securities may be resold in the ordinary course of business in transactions exempt from registration, normally to qualified institutional buyers. As of October 31, 2023, these securities had a total aggregate market value of $95,630,007, representing 6.88% of net assets. |
| (c) | Security was purchased pursuant to Regulation S under the Securities Act of 1933, which exempts securities offered and sold outside of the United States from registration. Such security cannot be sold in the United States without either an effective registration statement filed pursuant to the Securities Act of 1933, or pursuant to an exemption from registration. As of October 31, 2023, the aggregate market value of these securities was $95,630,007, representing 6.88% of net assets. |
75
| Grandeur Peak International Stalwarts Fund | Portfolio of Investments |
| October 31, 2023 (Unaudited) |
| Sector Composition (October 31, 2023) | |
| Technology | 29.5% |
| Industrials | 17.8% |
| Health Care | 16.7% |
| Financials | 12.1% |
| Consumer Staples | 10.2% |
| Consumer Discretionary | 7.2% |
| Real Estate | 3.6% |
| Energy | 0.5% |
| Other Assets in Excess of Liabilities | 2.4% |
| Total | 100.0% |
| Industry Composition (October 31, 2023) | |
| IT Services | 10.5% |
| Health Care Services | 6.8% |
| Semiconductor Devices | 5.7% |
| Mass Merchants | 5.5% |
| Specialty & Generic Pharma | 5.3% |
| Private Equity | 4.8% |
| Food & Drug Stores | 4.7% |
| Banks | 3.8% |
| Electronics Components | 3.6% |
| Application Software | 3.6% |
| Other Machinery & Equipment | 2.8% |
| Industrial Wholesale & Rental | 2.7% |
| Measurement Instruments | 2.7% |
| Life Science & Diagnostics | 2.3% |
| Specialty Apparel Stores | 2.2% |
| Industrial Owners & Developers | 1.9% |
| Medical Equipment | 1.8% |
| Rubber & Plastic | 1.8% |
| Flow Control Equipment | 1.7% |
| Semiconductor Mfg | 1.7% |
| Technology Distributors | 1.7% |
| Specialty Online Retailers | 1.6% |
| Engineering Services | 1.3% |
| Professional Services | 1.1% |
| Investment Management | 1.1% |
| Industrial Reit | 1.1% |
| Wealth Management | 1.1% |
| Other Industries (each less than 1%) | 12.9% |
| Other Assets in Excess of Liabilities | 2.4% |
| Total | 100.0% |
76
| Grandeur Peak US Stalwarts Fund | Portfolio of Investments |
| October 31, 2023 (Unaudited) |
| Shares | Fair Value | |||||||
| COMMON STOCKS — 97.16% | ||||||||
| Argentina — 2.50% | ||||||||
| Globant SA(a) | 14,998 | $ | 2,554,009 | |||||
| Canada — 0.56% | ||||||||
| Aritzia, Inc.(a) | 36,900 | 573,952 | ||||||
| Germany — 0.60% | ||||||||
| QIAGEN NV(a) | 16,429 | 614,937 | ||||||
| Hong Kong — 2.76% | ||||||||
| Techtronic Industries Co., Ltd. | 310,000 | 2,824,574 | ||||||
| Ireland — 1.84% | ||||||||
| ICON PLC, ADR(a) | 7,686 | 1,875,077 | ||||||
| United Kingdom — 2.09% | ||||||||
| Endava plc, ADR(a) | 42,570 | 2,135,311 | ||||||
| United States — 86.81% | ||||||||
| Alexandria Real Estate Equities, Inc. | 14,297 | 1,331,480 | ||||||
| Align Technology, Inc.(a) | 5,784 | 1,067,668 | ||||||
| Ares Management Corporation, CLASS A | 22,834 | 2,251,203 | ||||||
| Ashtead Group PLC | 32,297 | 1,846,350 | ||||||
| BILL Holdings, Inc.(a) | 4,014 | 366,438 | ||||||
| Bio-Techne Corporation | 7,898 | 431,468 | ||||||
| Cactus, Inc., Class A | 23,150 | 1,086,661 | ||||||
| Charles River Laboratories International, Inc.(a) | 6,623 | 1,115,048 | ||||||
| Cloudflare, Inc., Class A(a) | 30,107 | 1,706,766 | ||||||
| Cross Creek Lucid LP/Partnership Interest(a)(b) | 700,000 | 550,666 | ||||||
| Crowdstrike Holdings, Inc., CLASS A(a) | 15,812 | 2,795,088 | ||||||
| Datadog, Inc., Class A(a) | 8,842 | 720,358 | ||||||
| DexCom, Inc.(a) | 11,243 | 998,716 | ||||||
| Digital Realty Trust, Inc. | 5,975 | 743,051 | ||||||
| DigitalOcean Holdings, Inc.(a) | 65,979 | 1,349,930 | ||||||
| Doximity, Inc.(a) | 34,764 | 710,229 | ||||||
| Elastic NV(a) | 27,793 | 2,085,587 | ||||||
| Etsy, Inc.(a) | 24,680 | 1,537,564 | ||||||
| Evercore, Inc., Class A | 6,358 | 827,684 | ||||||
| Fastenal Co. | 17,875 | 1,042,828 | ||||||
| Five Below, Inc.(a) | 8,434 | 1,467,347 | ||||||
| Floor & Decor Holdings, Inc., Class A(a) | 8,013 | 660,271 | ||||||
| Frontage Holdings Corporation(a)(c)(d) | 3,314,900 | 826,050 | ||||||
| Global Industrial Co. | 48,182 | 1,539,415 | ||||||
| GQG Partners, Inc.(a) | 401,671 | 331,244 | ||||||
| HealthEquity, Inc.(a) | 10,506 | 753,070 | ||||||
| Herc Holdings, Inc. | 5,265 | 562,249 | ||||||
| Houlihan Lokey, Inc. | 15,335 | 1,541,475 | ||||||
| HubSpot, Inc.(a) | 1,703 | 721,680 | ||||||
| IDEXX Laboratories, Inc.(a) | 3,427 | 1,368,983 | ||||||
| Insulet Corporation(a) | 5,315 | 704,610 | ||||||
| JFrog Ltd.(a) | 60,586 | 1,362,579 | ||||||
| Shares | Fair Value | |||||||
| COMMON STOCKS — (continued) | ||||||||
| United States — 86.81% (continued) | ||||||||
| Littelfuse, Inc. | 19,020 | $ | 4,121,063 | |||||
| Lululemon Athletica, Inc.(a) | 4,265 | 1,678,192 | ||||||
| MarketAxess Holdings, Inc. | 6,277 | 1,341,709 | ||||||
| Marvell Technology, Inc. | 29,759 | 1,405,220 | ||||||
| MaxCyte, Inc.(a) | 163,586 | 484,215 | ||||||
| Medpace Holdings, Inc.(a) | 4,521 | 1,097,111 | ||||||
| Microchip Technology, Inc. | 14,307 | 1,019,946 | ||||||
| Moelis & Co., Class A | 33,132 | 1,379,616 | ||||||
| Monolithic Power Systems, Inc. | 5,631 | 2,487,439 | ||||||
| MSCI, Inc. | 1,357 | 639,893 | ||||||
| Neogen Corporation(a) | 70,662 | 1,052,157 | ||||||
| NV5 Global, Inc.(a) | 14,320 | 1,351,092 | ||||||
| Ollie’s Bargain Outlet Holdings, Inc.(a) | 29,321 | 2,264,754 | ||||||
| P10, Inc.(a) | 143,618 | 1,352,882 | ||||||
| PagerDuty, Inc.(a) | 46,356 | 935,001 | ||||||
| Paycom Software, Inc. | 12,952 | 3,172,852 | ||||||
| Paylocity Holding Corporation(a) | 4,601 | 825,419 | ||||||
| Perella Weinberg Partners LP | 85,016 | 834,007 | ||||||
| PJT Partners, Inc., Class A | 64,639 | 5,065,113 | ||||||
| Planet Fitness, Inc., A(a) | 15,182 | 839,109 | ||||||
| Pool Corporation | 4,802 | 1,516,328 | ||||||
| Power Integrations, Inc. | 12,589 | 872,795 | ||||||
| Qualys, Inc.(a) | 16,718 | 2,557,018 | ||||||
| Rexford Industrial Realty, Inc. | 35,429 | 1,531,950 | ||||||
| Shoals Technologies Group, Inc., Class A(a) | 97,509 | 1,497,738 | ||||||
| Silicon Laboratories, Inc.(a) | 19,247 | 1,774,189 | ||||||
| SiTime Corporation(a) | 7,363 | 734,827 | ||||||
| Terreno Realty Corporation | 16,632 | 886,153 | ||||||
| Texas Roadhouse, Inc. | 8,093 | 821,763 | ||||||
| TPG, Inc.(a) | 19,713 | 544,867 | ||||||
| Tradeweb Markets, Inc., CLASS A | 25,349 | 2,281,664 | ||||||
| United Rentals, Inc. | 2,320 | 942,546 | ||||||
| WW Grainger, Inc. | 2,591 | 1,890,990 | ||||||
| Zscaler, Inc.(a) | 6,816 | 1,081,631 | ||||||
| 88,685,005 | ||||||||
| Total Common Stocks (Cost $102,086,393) | 99,262,865 | |||||||
| PREFERRED STOCKS — 0.61% | ||||||||
| United States — 0.61% | ||||||||
| Gusto, Inc., Series E Preferred(a)(b) | 20,595 | 626,088 | ||||||
| Total Preferred Stocks | ||||||||
| (Cost $625,992) | 626,088 | |||||||
| Total Investments — 97.77% | ||||||||
| (Cost $102,712,385) | 99,888,953 | |||||||
| Other Assets in Excess of Liabilities — 2.23% | 2,278,320 | |||||||
| NET ASSETS — 100.00% | $ | 102,167,273 | ||||||
| (a) | Non-income producing security. |
See accompanying notes to financial statements.
77
| Grandeur Peak US Stalwarts Fund | Portfolio of Investments |
| October 31, 2023 (Unaudited) |
| (b) | As a result of the use of significant unobservable inputs to determine fair value, this investment has been classified as level 3 assets. See also Note 2 to the financial statements for additional information. |
| (c) | Security exempt from registration under Rule 144A of the Securities Act of 1933. These securities may be resold in the ordinary course of business in transactions exempt from registration, normally to qualified institutional buyers. As of October 31, 2023, these securities had a total aggregate market value of $826,050, representing 0.81% of net assets. |
| (d) | Security was purchased pursuant to Regulation S under the Securities Act of 1933, which exempts securities offered and sold outside of the United States from registration. Such security cannot be sold in the United States without either an effective registration statement filed pursuant to the Securities Act of 1933, or pursuant to an exemption from registration. As of October 31, 2023, the aggregate market value of these securities was $826,050, representing 0.81% of net assets. |
| Sector Composition (October 31, 2023) | |
| Technology | 34.4% |
| Financials | 17.6% |
| Industrials | 16.1% |
| Health Care | 14.0% |
| Consumer Staples | 7.4% |
| Consumer Discretionary | 5.2% |
| Real Estate | 3.2% |
| Energy | 1.3% |
| Listed Private Equity Investments | 0.7% |
| Other Assets in Excess of Liabilities | 0.2% |
| Total | 100.0% |
| Industry Composition (October 31, 2023) | |
| IT Services | 9.4% |
| Application Software | 8.1% |
| Institutional Brokerage | 6.4% |
| Health Care Services | 5.9% |
| Semiconductor Devices | 5.9% |
| Private Equity | 5.2% |
| Mass Merchants | 5.2% |
| Infrastructure Software | 4.3% |
| Electrical Components | 3.6% |
| Specialty & Generic Pharma | 3.4% |
| Electronics Components | 3.3% |
| Industrial Wholesale & Rental | 2.8% |
| Banks | 2.6% |
| Medical Equipment | 2.4% |
| Other Machinery & Equipment | 2.3% |
| Food & Drug Stores | 2.2% |
| Investment Management | 2.0% |
| Measurement Instruments | 1.7% |
| Semiconductor Mfg | 1.5% |
| Industrial Reit | 1.4% |
| Online Marketplace | 1.4% |
| Specialty Apparel Stores | 1.3% |
| Engineering Services | 1.2% |
| Industrial Owners & Developers | 1.2% |
| Specialty Online Retailers | 1.1% |
| Life Science & Diagnostics | 1.1% |
| Flow Control Equipment | 1.1% |
| Other Industries (each less than 1%) | 11.8% |
| Other Assets in Excess of Liabilities | 0.2% |
| Total | 100.0% |
See accompanying notes to financial statements.
78
| Grandeur Peak Funds® | Statements of Assets and Liabilities |
| October 31, 2023 (Unaudited) |
| Grandeur Peak | Grandeur Peak | Grandeur Peak | Grandeur Peak | |||||||||||||||||
| Emerging Markets | Global Contrarian | Grandeur Peak | Global Micro Cap | Global Opportunities | ||||||||||||||||
| Opportunities Fund | Fund | Global Explorer Fund | Fund | Fund | ||||||||||||||||
| ASSETS | ||||||||||||||||||||
| Investments, at cost | $ | 358,874,246 | $ | 127,610,941 | $ | 12,767,391 | $ | 40,989,391 | $ | 539,314,505 | ||||||||||
| Investments, at value | $ | 374,742,175 | $ | 117,972,094 | $ | 10,658,166 | $ | 38,689,624 | $ | 553,532,597 | ||||||||||
| Cash held at custodian | 23,466,890 | 1,677,361 | 155,160 | 69,866 | 3,703,984 | |||||||||||||||
| Foreign currency at fair value (Cost $121,241, $331,646, $851, $0 and $158,625) | 108,260 | 315,066 | 832 | — | 155,745 | |||||||||||||||
| Receivable for securities sold | 6,667,555 | 1,368,660 | 101,862 | 149,367 | 3,553,795 | |||||||||||||||
| Receivable for Fund shares sold | 865 | 119,241 | — | 60 | 32,488 | |||||||||||||||
| Dividends and interest receivable | 284,075 | 187,381 | 7,205 | 44,916 | 906,479 | |||||||||||||||
| Due from advisor | — | — | 11,263 | — | — | |||||||||||||||
| Prepaid expenses and other assets | 3,377 | 14,401 | 13,409 | 21,189 | 33,562 | |||||||||||||||
| TOTAL ASSETS | 405,273,197 | 121,654,204 | 10,947,897 | 38,975,022 | 561,918,650 | |||||||||||||||
| LIABILITIES | ||||||||||||||||||||
| Due to custodian from foreign cash (Cost $0, $0, $0,$64 and $0) | — | — | — | 48 | — | |||||||||||||||
| Payable for investments purchased | 1,184,712 | 750,933 | 76,578 | 7,953 | 291,220 | |||||||||||||||
| Payable for Fund shares repurchased | 288,846 | 3,471 | — | 25 | 546,759 | |||||||||||||||
| Management fees payable | 474,331 | 123,932 | — | 50,303 | 621,190 | |||||||||||||||
| Distribution (12b-1) fees payable | 599 | — | — | — | 12,179 | |||||||||||||||
| Payable to related parties | 8,823 | 3,520 | 2,086 | 2,811 | 11,380 | |||||||||||||||
| Accrued expenses and other liabilities | 29,671 | 98,097 | 137,486 | 20,446 | 2,994 | |||||||||||||||
| TOTAL LIABILITIES | 1,986,982 | 979,953 | 216,150 | 81,586 | 1,485,722 | |||||||||||||||
| NET ASSETS | $ | 403,286,215 | $ | 120,674,251 | $ | 10,731,747 | $ | 38,893,436 | $ | 560,432,928 | ||||||||||
| NET ASSETS CONSISTS OF | ||||||||||||||||||||
| Paid in capital | $ | 371,098,537 | $ | 132,739,885 | $ | 14,594,302 | $ | 42,892,774 | $ | 547,823,809 | ||||||||||
| Total distributable earnings (losses) | 32,187,678 | (12,065,634 | ) | (3,862,555 | ) | (3,999,338 | ) | 12,609,119 | ||||||||||||
| NET ASSETS | $ | 403,286,215 | $ | 120,674,251 | $ | 10,731,747 | $ | 38,893,436 | $ | 560,432,928 | ||||||||||
| PRICING OF SHARES: | ||||||||||||||||||||
| Investor Class | ||||||||||||||||||||
| Net Assets | $ | 7,554,951 | $ | — | $ | — | $ | — | $ | 53,080,801 | ||||||||||
| Shares of beneficial interest outstanding (a) | 640,152 | — | — | — | 17,542,861 | |||||||||||||||
| Net Asset Value, offering and redemption price per share | $ | 11.80 | $ | — | $ | — | $ | — | $ | 3.03 | ||||||||||
| Institutional Class | ||||||||||||||||||||
| Net Assets | $ | 395,731,264 | $ | 120,674,251 | $ | 10,731,747 | $ | 38,893,436 | $ | 507,352,127 | ||||||||||
| Shares of beneficial interest outstanding (a) | 33,122,306 | 9,226,715 | 1,610,713 | 3,387,943 | 163,203,027 | |||||||||||||||
| Net Asset Value, offering and redemption price per share | $ | 11.95 | $ | 13.08 | $ | 6.66 | $ | 11.48 | $ | 3.11 | ||||||||||
| (a) | Unlimited number of shares of beneficial interest authorized, no par value. |
79
| Grandeur Peak Funds® | Statements of Assets and Liabilities |
| October 31, 2023 (Unaudited) |
| Grandeur Peak | Grandeur Peak | Grandeur Peak | ||||||||||||||||||
| Grandeur Peak | Global Stalwarts | International | International | Grandeur Peak US | ||||||||||||||||
| Global Reach Fund | Fund | Opportunities Fund | Stalwarts Fund | Stalwarts Fund | ||||||||||||||||
| ASSETS | ||||||||||||||||||||
| Investments, at cost | $ | 200,288,234 | $ | 135,297,715 | $ | 521,005,131 | $ | 1,417,974,773 | $ | 102,712,385 | ||||||||||
| Investments, at value | $ | 203,415,835 | $ | 136,510,178 | $ | 508,339,555 | $ | 1,357,118,976 | $ | 99,888,953 | ||||||||||
| Cash held at custodian | 4,978,834 | — | 8,656,945 | 31,257,114 | 2,271,496 | |||||||||||||||
| Foreign currency at fair value (Cost $37,903, $0, $87,518, $67,609 and $0) | 43,136 | — | 83,689 | 41,165 | 67 | |||||||||||||||
| Receivable for securities sold | 2,321,427 | 1,121,798 | 2,275,163 | 5,003,367 | 646,885 | |||||||||||||||
| Receivable for Fund shares sold | 161,058 | 11,708 | 444,282 | 1,349,184 | 15,000 | |||||||||||||||
| Dividends and interest receivable | 194,174 | 148,098 | 836,275 | 1,925,882 | 18,976 | |||||||||||||||
| Prepaid expenses and other assets | 13,834 | 57,052 | 19,635 | 56,282 | 26,769 | |||||||||||||||
| TOTAL ASSETS | 211,128,298 | 137,848,834 | 520,655,544 | 1,396,751,970 | 102,868,146 | |||||||||||||||
| LIABILITIES | ||||||||||||||||||||
| Due to custodian | — | 251,120 | — | — | — | |||||||||||||||
| Due to custodian from foreign cash (Cost $0, $525, $0, $0 and $0) | — | 490 | — | — | — | |||||||||||||||
| Payable for investments purchased | 1,372,146 | 598,764 | 430,027 | 2,708,372 | 611,152 | |||||||||||||||
| Payable for Fund shares repurchased | 76,434 | 24,212 | 2,812,696 | 3,002,757 | — | |||||||||||||||
| Management fees payable | 185,080 | 98,555 | 564,581 | 1,007,565 | 67,662 | |||||||||||||||
| Distribution (12b-1) fees payable | 574 | 4,991 | 4,942 | 4,953 | — | |||||||||||||||
| Payable to related parties | 6,443 | 5,705 | 10,189 | 26,908 | 3,491 | |||||||||||||||
| Accrued expenses and other liabilities | 17,975 | 19,479 | 14,602 | 7,461 | 18,568 | |||||||||||||||
| TOTAL LIABILITIES | 1,658,652 | 1,003,316 | 3,837,037 | 6,758,016 | 700,873 | |||||||||||||||
| NET ASSETS | $ | 209,469,646 | $ | 136,845,518 | $ | 516,818,507 | $ | 1,389,993,954 | $ | 102,167,273 | ||||||||||
| Composition of Net Assets: | ||||||||||||||||||||
| Paid in capital | $ | 208,475,243 | $ | 174,742,632 | $ | 527,610,277 | $ | 1,547,082,117 | $ | 138,687,414 | ||||||||||
| Total distributable earnings (losses) | 994,403 | (37,897,114 | ) | (10,791,770 | ) | (157,088,163 | ) | (36,520,141 | ) | |||||||||||
| NET ASSETS | $ | 209,469,646 | $ | 136,845,518 | $ | 516,818,507 | $ | 1,389,993,954 | $ | 102,167,273 | ||||||||||
| PRICING OF SHARES | ||||||||||||||||||||
| Investor Class | ||||||||||||||||||||
| Net Assets | $ | 22,183,022 | $ | 22,281,302 | $ | 22,382,448 | $ | 21,717,200 | $ | — | ||||||||||
| Shares of beneficial interest outstanding (a) | 1,673,775 | 1,731,702 | 7,826,759 | 1,549,304 | — | |||||||||||||||
| Net Asset Value, offering and redemption price per share | $ | 13.25 | $ | 12.87 | $ | 2.86 | $ | 14.02 | $ | — | ||||||||||
| Institutional Class | ||||||||||||||||||||
| Net Assets | $ | 187,286,624 | $ | 114,564,216 | $ | 494,436,059 | $ | 1,368,276,754 | $ | 102,167,273 | ||||||||||
| Shares of beneficial interest outstanding (a) | 13,947,243 | 8,760,195 | 170,704,333 | 96,584,638 | 6,764,860 | |||||||||||||||
| Net Asset Value, offering and redemption price per share | $ | 13.43 | $ | 13.08 | $ | 2.90 | $ | 14.17 | $ | 15.10 | ||||||||||
| (a) | Unlimited number of shares of beneficial interest authorized, no par value. |
See accompanying notes to financial statements.
80
| Grandeur Peak Funds® | Statements of Operations |
| October 31, 2023 (Unaudited) |
| Grandeur Peak | Grandeur Peak | Grandeur Peak | Grandeur Peak | |||||||||||||||||
| Emerging Markets | Global Contrarian | Grandeur Peak | Global Micro Cap | Global Opportunities | ||||||||||||||||
| Opportunities Fund | Fund | Global Explorer Fund | Fund | Fund | ||||||||||||||||
| INVESTMENT INCOME | ||||||||||||||||||||
| Dividends | $ | 6,808,821 | $ | 3,014,569 | $ | 123,599 | $ | 597,724 | $ | 7,171,830 | ||||||||||
| Interest | 392,387 | 90,352 | 4,164 | 21,489 | 416,685 | |||||||||||||||
| Less: Foreign dividend withholding taxes | (770,886 | ) | (135,867 | ) | (11,794 | ) | (56,903 | ) | (612,735 | ) | ||||||||||
| TOTAL INVESTMENT INCOME | 6,430,322 | 2,969,054 | 115,969 | 562,310 | 6,975,780 | |||||||||||||||
| EXPENSES | ||||||||||||||||||||
| Investment advisor fees | 3,002,499 | 628,183 | 67,242 | 332,657 | 4,075,010 | |||||||||||||||
| Distribution and service fees - Investor Class | 10,757 | — | — | — | 80,731 | |||||||||||||||
| Custodian fees | 169,344 | 80,788 | 73,166 | 22,862 | 97,836 | |||||||||||||||
| Administrative fees | 78,753 | 31,479 | 28,696 | 19,096 | 107,802 | |||||||||||||||
| Registration fees | 23,957 | 11,552 | 5,794 | 8,407 | 14,064 | |||||||||||||||
| Transfer agent fees | 21,386 | 20,384 | 25,169 | 20,928 | 29,932 | |||||||||||||||
| Audit fees | 18,730 | 15,209 | 10,600 | 15,381 | 17,217 | |||||||||||||||
| Trustees fees and expenses | 17,192 | 3,203 | 3,356 | 2,064 | 12,491 | |||||||||||||||
| Chief compliance officer fees | 4,953 | 884 | 95 | 477 | 7,281 | |||||||||||||||
| Printing fees | 4,666 | 796 | 5,057 | 952 | 14,765 | |||||||||||||||
| Insurance expense | 3,158 | 1,534 | 4,157 | 400 | 4,149 | |||||||||||||||
| Legal fees | 1,571 | 235 | 5,014 | 113 | 7,897 | |||||||||||||||
| Other expenses | 25,400 | 8,546 | 45,209 | 9,424 | 24,105 | |||||||||||||||
| TOTAL EXPENSES | 3,382,366 | 802,793 | 273,555 | 432,761 | 4,493,280 | |||||||||||||||
| Less: Fees waived/reimbursed by the investment advisor | (74,601 | ) | — | (197,205 | ) | (778 | ) | (186,587 | ) | |||||||||||
| Plus: Recapture of fees previously waived | — | 45,374 | — | — | — | |||||||||||||||
| NET EXPENSES | 3,307,765 | 848,167 | 76,350 | 431,983 | 4,306,693 | |||||||||||||||
| NET INVESTMENT INCOME | 3,122,557 | 2,120,887 | 39,619 | 130,327 | 2,669,087 | |||||||||||||||
| REALIZED AND UNREALIZED GAIN (LOSS) FROM INVESTMENTS | ||||||||||||||||||||
| Net realized gain (loss) from: | ||||||||||||||||||||
| Investments | 3,617,089 | 7,685,587 | (220,232 | ) | 1,187,490 | 30,142,170 | ||||||||||||||
| Foreign currency transactions | (251,513 | ) | (34,774 | ) | (369 | ) | (6,745 | ) | 9,808 | |||||||||||
| Net realized gain (loss) | 3,365,576 | 7,650,813 | (220,601 | ) | 1,180,745 | 30,151,978 | ||||||||||||||
| Net change in unrealized appreciation (depreciation) on: | ||||||||||||||||||||
| Investments | (33,532,658 | ) | (11,286,110 | ) | (957,499 | ) | (4,722,547 | ) | (105,428,763 | ) | ||||||||||
| Foreign currency translations | 464,628 | 366 | (426 | ) | 13,625 | (20,345 | ) | |||||||||||||
| Net change in unrealized depreciation | (33,068,030 | ) | (11,285,744 | ) | (957,925 | ) | (4,708,922 | ) | (105,449,108 | ) | ||||||||||
| NET REALIZED AND UNREALIZED LOSS FROM INVESTMENTS | (29,702,454 | ) | (3,634,931 | ) | (1,178,526 | ) | (3,528,177 | ) | (75,297,130 | ) | ||||||||||
| NET DECREASE IN NET ASSETS RESULTING FROM OPERATIONS | $ | (26,579,897 | ) | $ | (1,514,044 | ) | $ | (1,138,907 | ) | $ | (3,397,850 | ) | $ | (72,628,043 | ) | |||||
See accompanying notes to financial statements.
81
| Grandeur Peak Funds® | Statements of Operations |
| October 31, 2023 (Unaudited) |
| Grandeur Peak | Grandeur Peak | Grandeur Peak | ||||||||||||||||||
| Grandeur Peak | Global Stalwarts | International | International | Grandeur Peak US | ||||||||||||||||
| Global Reach Fund | Fund | Opportunities Fund | Stalwarts Fund | Stalwarts Fund | ||||||||||||||||
| INVESTMENT INCOME | ||||||||||||||||||||
| Dividend income | $ | 2,514,484 | $ | 1,493,677 | $ | 7,390,628 | $ | 17,138,647 | $ | 556,493 | ||||||||||
| Interest | 62,554 | 7,438 | 440,419 | 245,178 | 50,590 | |||||||||||||||
| Less: Foreign dividend withholding taxes | (208,309 | ) | (110,247 | ) | (790,074 | ) | (1,753,183 | ) | — | |||||||||||
| TOTAL INVESTMENT INCOME | 2,368,729 | 1,390,868 | 7,040,973 | 15,630,642 | 607,083 | |||||||||||||||
| EXPENSES | ||||||||||||||||||||
| Investment advisor fees | 1,340,396 | 717,340 | 3,770,687 | 6,639,614 | 419,352 | |||||||||||||||
| Distribution and service fees - Investor Class | 33,565 | 33,871 | 32,657 | 34,369 | — | |||||||||||||||
| Custodian fees | 75,325 | 50,018 | 120,577 | 299,562 | 10,343 | |||||||||||||||
| Administrative fees | 56,284 | 38,368 | 103,310 | 288,813 | 24,985 | |||||||||||||||
| Transfer agent fees | 26,053 | 20,991 | 21,716 | 83,202 | 21,667 | |||||||||||||||
| Registration fees | 20,253 | 13,302 | 15,914 | 25,580 | 373 | |||||||||||||||
| Audit fees | 18,305 | 17,231 | 18,800 | 22,227 | 15,312 | |||||||||||||||
| Trustees fees and expenses | 10,381 | 7,890 | 20,293 | 75,567 | 4,816 | |||||||||||||||
| Printing fees | 10,378 | 8,847 | 16,167 | 74,632 | 1,734 | |||||||||||||||
| Legal fees | 3,760 | 3,769 | 8,453 | 19,418 | 1,702 | |||||||||||||||
| Chief compliance officer fees | 3,051 | 2,340 | 5,316 | 22,035 | 1,340 | |||||||||||||||
| Insurance expense | 2,103 | 1,676 | 4,247 | 11,491 | 613 | |||||||||||||||
| Other expenses | 16,707 | 16,724 | 27,750 | 55,121 | 5,485 | |||||||||||||||
| TOTAL EXPENSES | 1,616,561 | 932,367 | 4,165,887 | 7,651,631 | 507,722 | |||||||||||||||
| Less: Fees waived/reimbursed by the investment advisor | (61,796 | ) | — | (125,722 | ) | — | — | |||||||||||||
| NET EXPENSES | 1,554,765 | 932,367 | 4,040,165 | 7,651,631 | 507,722 | |||||||||||||||
| NET INVESTMENT INCOME | 813,964 | 458,501 | 3,000,808 | 7,979,011 | 99,361 | |||||||||||||||
| REALIZED AND UNREALIZED GAIN (LOSS) FROM INVESTMENTS | ||||||||||||||||||||
| Net realized gain (loss) from: | ||||||||||||||||||||
| Investments | 9,065,816 | 420,590 | 17,885,354 | (22,652,529 | ) | (2,045,265 | ) | |||||||||||||
| Foreign currency transactions | (30,533 | ) | (25,466 | ) | (24,011 | ) | (400,142 | ) | (892 | ) | ||||||||||
| Net realized gain (loss) from: | 9,035,283 | 395,124 | 17,861,343 | (23,052,671 | ) | (2,046,157 | ) | |||||||||||||
| Net change in unrealized appreciation (depreciation) on: | ||||||||||||||||||||
| Investments | (32,036,862 | ) | (17,309,815 | ) | (111,291,670 | ) | (232,950,851 | ) | (2,650,793 | ) | ||||||||||
| Foreign currency translations | (2,869 | ) | (4,452 | ) | 479,331 | (6,896 | ) | 49 | ||||||||||||
| Net change in unrealized depreciation on: | (32,039,731 | ) | (17,314,267 | ) | (110,812,339 | ) | (232,957,747 | ) | (2,650,744 | ) | ||||||||||
| NET REALIZED AND UNREALIZED LOSS FROM INVESTMENTS | (23,004,448 | ) | (16,919,143 | ) | (92,950,996 | ) | (256,010,418 | ) | (4,696,901 | ) | ||||||||||
| NET DECREASE IN NET ASSETS RESULTING FROM OPERATIONS | $ | (22,190,484 | ) | $ | (16,460,642 | ) | $ | (89,950,188 | ) | $ | (248,031,407 | ) | $ | (4,597,540 | ) | |||||
See accompanying notes to financial statements.
82
| Grandeur Peak Emerging Markets Opportunities Fund | Statements of Changes in Net Assets |
| For the | For the | |||||||
| Six Months Ended | Year Ended | |||||||
| October 31, 2023 | April 30, 2023 | |||||||
| (Unaudited) | ||||||||
| OPERATIONS | ||||||||
| Net investment income | $ | 3,122,557 | $ | 2,818,503 | ||||
| Net realized gain | 3,365,576 | 17,342,803 | ||||||
| Net change in unrealized depreciation | (33,068,030 | ) | (44,342,979 | ) | ||||
| Net decrease in net assets resulting from operations | (26,579,897 | ) | (24,181,673 | ) | ||||
| DISTRIBUTIONS TO SHAREHOLDERS | ||||||||
| Investor Class | — | (14,330 | ) | |||||
| Institutional Class | — | (1,228,754 | ) | |||||
| Net decrease in net assets from distributions | — | (1,243,084 | ) | |||||
| CAPITAL SHARE TRANSACTIONS | ||||||||
| Proceeds from sales of shares: | ||||||||
| Investor Class | 74,152 | 613,572 | ||||||
| Institutional Class | 32,569,987 | 51,238,758 | ||||||
| Distributions reinvested: | ||||||||
| Investor Class | — | 14,035 | ||||||
| Institutional Class | — | 1,153,392 | ||||||
| Redemption fees: | ||||||||
| Investor Class | 49 | 20 | ||||||
| Institutional Class | 8,632 | 1,888 | ||||||
| Cost of shares redeemed: | ||||||||
| Investor Class | (796,352 | ) | (2,185,292 | ) | ||||
| Institutional Class | (27,629,664 | ) | (95,848,913 | ) | ||||
| Net increase/(decrease) from capital shares transactions | 4,226,804 | (45,012,540 | ) | |||||
| NET DECREASE IN NET ASSETS | (22,353,093 | ) | (70,437,297 | ) | ||||
| NET ASSETS | ||||||||
| Beginning of Period/Year | 425,639,308 | 496,076,605 | ||||||
| End of Period/Year | $ | 403,286,215 | $ | 425,639,308 | ||||
| OTHER INFORMATION | ||||||||
| Shares Transactions | ||||||||
| Investor Class | ||||||||
| Issued | 5,822 | 49,029 | ||||||
| Issued to shareholders in reinvestment of distributions | — | 1,167 | ||||||
| Redeemed | (62,324 | ) | (174,437 | ) | ||||
| Net decrease in share transactions | (56,502 | ) | (124,241 | ) | ||||
| Institutional Class | ||||||||
| Issued | 2,516,925 | 4,050,696 | ||||||
| Issued to shareholders in reinvestment of distributions | — | 94,851 | ||||||
| Redeemed | (2,157,831 | ) | (7,718,184 | ) | ||||
| Net increase (decrease) in share transactions | 359,094 | (3,572,637 | ) | |||||
See accompanying notes to financial statements.
83
| Grandeur Peak Global Contrarian Fund | Statements of Changes in Net Assets |
| For the | For the | |||||||
| Six Months Ended | Year Ended | |||||||
| October 31, 2023 | April 30, 2023 | |||||||
| (Unaudited) | ||||||||
| OPERATIONS | ||||||||
| Net investment income | $ | 2,120,887 | $ | 2,325,042 | ||||
| Net realized gain (loss) | 7,650,813 | (12,166,283 | ) | |||||
| Net change in unrealized appreciation (depreciation) | (11,285,744 | ) | 8,452,852 | |||||
| Net decrease in net assets resulting from operations | (1,514,044 | ) | (1,388,389 | ) | ||||
| DISTRIBUTIONS TO SHAREHOLDERS | ||||||||
| Institutional Class | — | (2,503,330 | ) | |||||
| Total distributions to shareholders | — | (2,503,330 | ) | |||||
| CAPITAL SHARE TRANSACTIONS | ||||||||
| Proceeds from sales of shares: | ||||||||
| Institutional Class | 18,860,777 | 52,743,021 | ||||||
| Distributions reinvested: | ||||||||
| Institutional Class | — | 2,426,838 | ||||||
| Redemption fees: | ||||||||
| Institutional Class | 2,640 | 7,491 | ||||||
| Cost of shares redeemed: | ||||||||
| Institutional Class | (14,080,767 | ) | (40,008,507 | ) | ||||
| Net increase from capital shares transactions | 4,782,650 | 15,168,843 | ||||||
| NET INCREASE IN NET ASSETS | 3,268,606 | 11,277,124 | ||||||
| NET ASSETS | ||||||||
| Beginning of Period/Year | 117,405,645 | 106,128,521 | ||||||
| End of Period/Year | $ | 120,674,251 | $ | 117,405,645 | ||||
| OTHER INFORMATION | ||||||||
| Shares Transactions | ||||||||
| Institutional Class | ||||||||
| Issued | 1,397,058 | 3,970,518 | ||||||
| Issued to shareholders in reinvestment of distributions | — | 192,912 | ||||||
| Redeemed | (1,025,054 | ) | (3,111,613 | ) | ||||
| Net increase in share transactions | 372,004 | 1,051,817 | ||||||
See accompanying notes to financial statements.
84
| Grandeur Peak Global Explorer Fund | Statements of Changes in Net Assets |
| For the | For the | |||||||
| Six Months Ended | Year Ended | |||||||
| October 31, 2023 | April 30, 2023 | |||||||
| (Unaudited) | ||||||||
| OPERATIONS | ||||||||
| Net investment income | $ | 39,619 | $ | 28,927 | ||||
| Net realized loss | (220,601 | ) | (1,455,685 | ) | ||||
| Net change in unrealized appreciation (depreciation) | (957,925 | ) | 1,073,911 | |||||
| Net decrease in net assets resulting from operations | (1,138,907 | ) | (352,847 | ) | ||||
| DISTRIBUTIONS TO SHAREHOLDERS | ||||||||
| Total Distributions Paid | ||||||||
| Institutional Class | — | (24,043 | ) | |||||
| Net decrease in net assets from distributions | — | (24,043 | ) | |||||
| CAPITAL SHARE TRANSACTIONS | ||||||||
| Proceeds from sales of shares: | ||||||||
| Institutional Class | 177,132 | 4,855,871 | ||||||
| Distributions reinvested: | ||||||||
| Institutional Class | — | 23,263 | ||||||
| Redemption fees: | ||||||||
| Institutional Class | 19 | 1,033 | ||||||
| Cost of shares redeemed: | ||||||||
| Institutional Class | (750,359 | ) | (1,520,472 | ) | ||||
| Net increase (decrease) from capital shares transactions | (573,208 | ) | 3,359,695 | |||||
| NET INCREASE (DECREASE) IN NET ASSETS | (1,712,115 | ) | 2,982,805 | |||||
| NET ASSETS | ||||||||
| Beginning of Period/Year | 12,443,862 | 9,461,057 | ||||||
| End of Period/Year | $ | 10,731,747 | $ | 12,443,862 | ||||
| OTHER INFORMATION | ||||||||
| Shares Transactions | ||||||||
| Institutional Class | ||||||||
| Issued | 21,605 | 680,904 | ||||||
| Issued to shareholders in reinvestment of distributions | — | 3,272 | ||||||
| Redeemed | (102,743 | ) | (205,464 | ) | ||||
| Net increase (decrease) in share transactions | (81,138 | ) | 478,712 | |||||
See accompanying notes to financial statements.
85
| Grandeur Peak Global Micro Cap Fund | Statements of Changes in Net Assets |
| For the | For the | |||||||
| Six Months Ended | Year Ended | |||||||
| October 31, 2023 | April 30, 2023 | |||||||
| (Unaudited) | ||||||||
| OPERATIONS | ||||||||
| Net investment income | $ | 130,327 | $ | 60,577 | ||||
| Net realized gain(loss) | 1,180,745 | (858,745 | ) | |||||
| Net change in unrealized (depreciation) | (4,708,922 | ) | (3,472,808 | ) | ||||
| Net decrease in net assets resulting from operations | (3,397,850 | ) | (4,270,976 | ) | ||||
| CAPITAL SHARE TRANSACTIONS | ||||||||
| Proceeds from sales of shares: | ||||||||
| Institutional Class | 1,505,693 | 5,982,899 | ||||||
| Redemption fees: | ||||||||
| Institutional Class | 104 | 2 | ||||||
| Cost of shares redeemed: | ||||||||
| Institutional Class | (4,446,213 | ) | (9,655,549 | ) | ||||
| Net decrease from capital shares transactions | (2,940,416 | ) | (3,672,648 | ) | ||||
| NET DECREASE IN NET ASSETS | (6,338,266 | ) | (7,943,624 | ) | ||||
| NET ASSETS | ||||||||
| Beginning of Period/Year | 45,231,702 | 53,175,326 | ||||||
| End of Period/Year | $ | 38,893,436 | $ | 45,231,702 | ||||
| OTHER INFORMATION | ||||||||
| Shares Transactions | ||||||||
| Institutional Class | ||||||||
| Issued | 114,320 | 490,504 | ||||||
| Redeemed | (361,713 | ) | (795,840 | ) | ||||
| Net decrease in share transactions | (247,393 | ) | (305,336 | ) | ||||
See accompanying notes to financial statements.
86
| Grandeur Peak Global Opportunities Fund | Statements of Changes in Net Assets |
| For the | For the | |||||||
| Six Months Ended | Year Ended | |||||||
| October 31, 2023 | April 30, 2023 | |||||||
| (Unaudited) | ||||||||
| OPERATIONS | ||||||||
| Net investment income | $ | 2,669,087 | $ | 2,798,218 | ||||
| Net realized gain (loss) | 30,151,978 | (28,625,725 | ) | |||||
| Net change in unrealized depreciation | (105,449,108 | ) | (22,316,079 | ) | ||||
| Net decrease in net assets resulting from operations | (72,628,043 | ) | (48,143,586 | ) | ||||
| DISTRIBUTIONS TO SHAREHOLDERS | ||||||||
| Investor Class | — | (1,234,811 | ) | |||||
| Institutional Class | — | (9,962,438 | ) | |||||
| Net decrease in net assets from distributions | — | (11,197,249 | ) | |||||
| CAPITAL SHARE TRANSACTIONS | ||||||||
| Proceeds from sales of shares: | ||||||||
| Investor Class | 2,103,721 | 6,815,397 | ||||||
| Institutional Class | 23,718,964 | 97,065,543 | ||||||
| Distributions reinvested: | ||||||||
| Investor Class | — | 1,229,951 | ||||||
| Institutional Class | — | 9,217,749 | ||||||
| Redemption fees: | ||||||||
| Investor Class | 223 | 590 | ||||||
| Institutional Class | 776 | 10,111 | ||||||
| Cost of shares redeemed: | ||||||||
| Investor Class | (14,051,701 | ) | (20,587,851 | ) | ||||
| Institutional Class | (54,923,973 | ) | (130,357,753 | ) | ||||
| Net decrease from capital shares transactions | (43,151,990 | ) | (36,606,263 | ) | ||||
| NET DECREASE IN NET ASSETS | (115,780,033 | ) | (95,947,098 | ) | ||||
| NET ASSETS | ||||||||
| Beginning of Period/Year | 676,212,961 | 772,160,059 | ||||||
| End of Period/Year | $ | 560,432,928 | $ | 676,212,961 | ||||
| OTHER INFORMATION | ||||||||
| Shares Transactions | ||||||||
| Investor Class | ||||||||
| Issued | 619,825 | 2,037,656 | ||||||
| Issued to shareholders in reinvestment of distributions | — | 379,614 | ||||||
| Redeemed | (4,248,705 | ) | (6,171,045 | ) | ||||
| Net decrease in share transactions | (3,628,880 | ) | (3,753,775 | ) | ||||
| Institutional Class | ||||||||
| Issued | 7,169,484 | 28,386,407 | ||||||
| Issued to shareholders in reinvestment of distributions | — | 2,768,093 | ||||||
| Redeemed | (15,960,323 | ) | (38,623,807 | ) | ||||
| Net decrease in share transactions | (8,790,839 | ) | (7,469,307 | ) | ||||
See accompanying notes to financial statements.
87
| Grandeur Peak Global Reach Fund | Statements of Changes in Net Assets |
| For the | For the | |||||||
| Six Months Ended | Year Ended | |||||||
| October 31, 2023 | April 30, 2023 | |||||||
| (Unaudited) | ||||||||
| OPERATIONS | ||||||||
| Net investment income | $ | 813,964 | $ | 961,436 | ||||
| Net realized gain (loss) | 9,035,283 | (7,305,144 | ) | |||||
| Net change in depreciation | (32,039,731 | ) | (21,389,299 | ) | ||||
| Net decrease in net assets resulting from operations | (22,190,484 | ) | (27,733,007 | ) | ||||
| DISTRIBUTIONS TO SHAREHOLDERS | ||||||||
| Institutional Class | — | (128,741 | ) | |||||
| Net decrease in net assets from distributions | — | (128,741 | ) | |||||
| CAPITAL SHARE TRANSACTIONS | ||||||||
| Proceeds from sales of shares: | ||||||||
| Investor Class | 1,001,124 | 2,593,183 | ||||||
| Institutional Class | 13,596,433 | 34,183,813 | ||||||
| Distributions reinvested: | ||||||||
| Institutional Class | — | 116,486 | ||||||
| Redemption fees: | ||||||||
| Investor Class | 91 | 27 | ||||||
| Institutional Class | 2,279 | 1,562 | ||||||
| Cost of shares redeemed: | ||||||||
| Investor Class | (3,789,035 | ) | (5,684,434 | ) | ||||
| Institutional Class | (44,191,209 | ) | (59,269,232 | ) | ||||
| Net decrease from capital shares transactions | (33,380,317 | ) | (28,058,595 | ) | ||||
| NET DECREASE IN NET ASSETS | (55,570,801 | ) | (55,920,343 | ) | ||||
| NET ASSETS | ||||||||
| Beginning of Period/Year | 265,040,447 | 320,960,790 | ||||||
| End of Period/Year | $ | 209,469,646 | $ | 265,040,447 | ||||
| OTHER INFORMATION | ||||||||
| Shares Transactions | ||||||||
| Investor Class | ||||||||
| Issued | 68,905 | 177,920 | ||||||
| Issued to shareholders in reinvestment of distributions | — | — | ||||||
| Redeemed | (267,477 | ) | (395,196 | ) | ||||
| Net decrease in share transactions | (198,572 | ) | (217,276 | ) | ||||
| Institutional Class | ||||||||
| Issued | 931,514 | 2,343,747 | ||||||
| Issued to shareholders in reinvestment of distributions | — | 8,146 | ||||||
| Redeemed | (3,014,773 | ) | (4,098,540 | ) | ||||
| Net decrease in share transactions | (2,083,259 | ) | (1,746,647 | ) | ||||
See accompanying notes to financial statements.
88
| Grandeur Peak Global Stalwarts Fund | Statements of Changes in Net Assets |
| For the | For the | |||||||
| Six Months Ended | Year Ended | |||||||
| October 31, 2023 | April 30, 2023 | |||||||
| (Unaudited) | ||||||||
| OPERATIONS | ||||||||
| Net investment income | $ | 458,501 | $ | 339,907 | ||||
| Net realized gain (loss) | 395,124 | (37,174,210 | ) | |||||
| Net change in unrealized appreciation/(depreciation) | (17,314,267 | ) | (782,805 | ) | ||||
| Net decrease in net assets resulting from operations | (16,460,642 | ) | (37,617,108 | ) | ||||
| DISTRIBUTIONS TO SHAREHOLDERS | ||||||||
| Return of Capital | — | (323,040 | ) | |||||
| Net decrease in net assets from distributions | — | (323,040 | ) | |||||
| FROM SHARES OF BENEFICIAL INTEREST | ||||||||
| Proceeds from sales of shares: | ||||||||
| Investor Class | 1,002,521 | 4,381,138 | ||||||
| Institutional Class | 8,124,117 | 61,912,119 | ||||||
| Distributions reinvested: | ||||||||
| Institutional Class | — | 304,452 | ||||||
| Redemption fees: | ||||||||
| Investor Class | 244 | 3,549 | ||||||
| Institutional Class | 27,303 | 22,409 | ||||||
| Cost of shares redeemed: | ||||||||
| Investor Class | (6,664,321 | ) | (19,837,801 | ) | ||||
| Institutional Class | (47,798,317 | ) | (147,754,620 | ) | ||||
| Net decrease from capital shares transactions | (45,308,453 | ) | (100,968,754 | ) | ||||
| NET DECREASE IN NET ASSETS | (61,769,095 | ) | (138,908,902 | ) | ||||
| NET ASSETS | ||||||||
| Beginning of Period/Year | 198,614,613 | 337,523,515 | ||||||
| End of Period/Year | $ | 136,845,518 | $ | 198,614,613 | ||||
| OTHER INFORMATION | ||||||||
| Shares Transactions | ||||||||
| Investor Class | ||||||||
| Issued | 69,435 | 294,329 | ||||||
| Redeemed | (458,166 | ) | (1,321,990 | ) | ||||
| Net decrease in share transactions | (388,731 | ) | (1,027,661 | ) | ||||
| Institutional Class | ||||||||
| Issued | 575,177 | 4,074,362 | ||||||
| Issued to shareholders in reinvestment of distributions | — | 21,084 | ||||||
| Redeemed | (3,249,671 | ) | (9,713,154 | ) | ||||
| Net decrease in share transactions | (2,674,494 | ) | (5,617,708 | ) | ||||
See accompanying notes to financial statements.
89
| Grandeur Peak International Opportunities Fund | Statements of Changes in Net Assets |
| For the | For the | |||||||
| Six Months Ended | Year Ended | |||||||
| October 31, 2023 | April 30, 2023 | |||||||
| (Unaudited) | ||||||||
| OPERATIONS | ||||||||
| Net investment income | $ | 3,000,808 | $ | 3,187,352 | ||||
| Net realized gain (loss) | 17,861,343 | (8,627,989 | ) | |||||
| Net change in unrealized depreciation | (110,812,339 | ) | (35,924,300 | ) | ||||
| Net decrease in net assets resulting from operations | (89,950,188 | ) | (41,364,937 | ) | ||||
| DISTRIBUTIONS TO SHAREHOLDERS | ||||||||
| Investor Class | — | (12,024 | ) | |||||
| Institutional Class | — | (1,283,282 | ) | |||||
| Net decrease in net assets from distributions | — | (1,295,306 | ) | |||||
| FROM SHARES OF BENEFICIAL INTEREST | ||||||||
| Proceeds from sales of shares: | ||||||||
| Investor Class | 1,206,320 | 4,113,677 | ||||||
| Institutional Class | 15,624,943 | 125,533,553 | ||||||
| Distributions reinvested: | ||||||||
| Investor Class | — | 11,774 | ||||||
| Institutional Class | — | 1,149,581 | ||||||
| Redemption fees: | ||||||||
| Investor Class | 15 | 549 | ||||||
| Institutional Class | 283 | 513 | ||||||
| Cost of shares redeemed: | ||||||||
| Investor Class | (4,132,753 | ) | (12,851,897 | ) | ||||
| Institutional Class | (39,055,366 | ) | (140,172,258 | ) | ||||
| Net increase/(decrease) from capital shares transactions | (26,356,558 | ) | (22,214,508 | ) | ||||
| NET DECREASE IN NET ASSETS | (116,306,746 | ) | (64,874,751 | ) | ||||
| NET ASSETS | ||||||||
| Beginning of Period/Year | 633,125,253 | 698,000,004 | ||||||
| End of Period/Year | $ | 516,818,507 | $ | 633,125,253 | ||||
| OTHER INFORMATION | ||||||||
| Shares Transactions | ||||||||
| Investor Class | ||||||||
| Issued | 370,803 | 1,255,558 | ||||||
| Issued to shareholders in reinvestment of distributions | — | 3,703 | ||||||
| Redeemed | (1,267,301 | ) | (3,983,035 | ) | ||||
| Net decrease in share transactions | (896,498 | ) | (2,723,774 | ) | ||||
| Institutional Class | ||||||||
| Issued | 4,853,962 | 38,471,407 | ||||||
| Issued to shareholders in reinvestment of distributions | — | 358,125 | ||||||
| Redeemed | (12,008,607 | ) | (43,196,954 | ) | ||||
| Net decrease in share transactions | (7,154,645 | ) | (4,367,422 | ) | ||||
See accompanying notes to financial statements.
90
| Grandeur Peak International Stalwarts Fund | Statements of Changes in Net Assets |
| For the | For the | |||||||
| Six Months Ended | Year Ended | |||||||
| October 31, 2023 | April 30, 2023 | |||||||
| (Unaudited) | ||||||||
| OPERATIONS | ||||||||
| Net investment income | $ | 7,979,011 | $ | 8,587,723 | ||||
| Net realized loss | (23,052,671 | ) | (67,741,816 | ) | ||||
| Net change in unrealized depreciation | (232,957,747 | ) | (53,374,756 | ) | ||||
| Net decrease in net assets resulting from operations | (248,031,407 | ) | (112,528,849 | ) | ||||
| DISTRIBUTIONS TO SHAREHOLDERS | ||||||||
| Investor Class | — | (28,865 | ) | |||||
| Institutional Class | — | (3,931,419 | ) | |||||
| Net decrease in net assets from distributions | — | (3,960,284 | ) | |||||
| FROM SHARES OF BENEFICIAL INTEREST | ||||||||
| Proceeds from sales of shares: | ||||||||
| Investor Class | 572,755 | 2,633,104 | ||||||
| Institutional Class | 154,338,618 | 599,089,862 | ||||||
| Distributions reinvested: | ||||||||
| Investor Class | — | 28,703 | ||||||
| Institutional Class | — | 3,830,117 | ||||||
| Redemption fees: | ||||||||
| Investor Class | 327 | 2,441 | ||||||
| Institutional Class | 6,145 | 30,156 | ||||||
| Cost of shares redeemed: | ||||||||
| Investor Class | (5,832,802 | ) | (19,013,074 | ) | ||||
| Institutional Class | �� | (240,026,674 | ) | (375,516,743 | ) | |||
| Net increase (decrease) from capital shares transactions | (90,941,631 | ) | 211,084,566 | |||||
| NET INCREASE (DECREASE) IN NET ASSETS | (338,973,038 | ) | 94,595,433 | |||||
| NET ASSETS | ||||||||
| Beginning of Period/Year | 1,728,966,992 | 1,634,371,559 | ||||||
| End of Period/Year | $ | 1,389,993,954 | $ | 1,728,966,992 | ||||
| OTHER INFORMATION | ||||||||
| Shares Transactions | ||||||||
| Investor Class | ||||||||
| Issued | 35,956 | 159,819 | ||||||
| Issued to shareholders in reinvestment of distributions | — | 1,810 | ||||||
| Redeemed | (368,307 | ) | (1,141,972 | ) | ||||
| Net decrease in share transactions | (332,351 | ) | (980,343 | ) | ||||
| Institutional Class | ||||||||
| Issued | 9,930,666 | 37,183,737 | ||||||
| Issued to shareholders in reinvestment of distributions | — | 239,383 | ||||||
| Redeemed | (15,201,967 | ) | (23,214,152 | ) | ||||
| Net increase (decrease) in share transactions | (5,271,301 | ) | 14,208,968 | |||||
See accompanying notes to financial statements.
91
| Grandeur Peak US Stalwarts Fund | Statements of Changes in Net Assets |
| For the | For the | |||||||
| Six Months Ended | Year Ended | |||||||
| October 31, 2023 | April 30, 2023 | |||||||
| (Unaudited) | ||||||||
| OPERATIONS | ||||||||
| Net investment income (loss) | $ | 99,361 | $ | (146,277 | ) | |||
| Net realized loss | (2,046,157 | ) | (27,885,294 | ) | ||||
| Net change in unrealized appreciation (depreciation) | (2,650,744 | ) | 12,726,238 | |||||
| Net decrease in net assets resulting from operations | (4,597,540 | ) | (15,305,333 | ) | ||||
| DISTRIBUTIONS TO SHAREHOLDERS | ||||||||
| Institutional Class | — | (13,503 | ) | |||||
| Net decrease in net assets from distributions | — | (13,503 | ) | |||||
| FROM SHARES OF BENEFICIAL INTEREST | ||||||||
| Proceeds from sales of shares: | ||||||||
| Institutional Class | 19,548,992 | 56,471,344 | ||||||
| Distributions reinvested: | ||||||||
| Institutional Class | — | 11,569 | ||||||
| Redemption fees: | ||||||||
| Institutional Class | — | 1,337 | ||||||
| Cost of shares redeemed: | ||||||||
| Institutional Class | (17,242,896 | ) | (68,240,742 | ) | ||||
| Net increase (decrease) from capital shares transactions | 2,306,096 | (11,756,492 | ) | |||||
| NET DECREASE IN NET ASSETS | (2,291,444 | ) | (27,075,328 | ) | ||||
| NET ASSETS | ||||||||
| Beginning of Period/Year | 104,458,717 | 131,534,045 | ||||||
| End of Period/Year | $ | 102,167,273 | $ | 104,458,717 | ||||
| OTHER INFORMATION | ||||||||
| Shares Transactions | ||||||||
| Institutional Class | ||||||||
| Issued | 4,853,962 | 3,367,288 | ||||||
| Issued to shareholders in reinvestment of distributions | — | 729 | ||||||
| Redeemed | (12,008,607 | ) | (4,182,186 | ) | ||||
| Net decrease in share transactions | (7,154,645 | ) | (814,169 | ) | ||||
See accompanying notes to financial statements.
92
| Grandeur Peak Emerging Markets Opportunities Fund | Financial Highlights |
| For a Share Outstanding Throughout the Years or Periods Presented | |
| Six Months | ||||||||||||||||||||||||
| Ended | Year Ended | Year Ended | Year Ended | Year Ended | Year Ended | |||||||||||||||||||
| Investor Class | October 31, 2023 | April 30, 2023 | April 30, 2022 | April 30, 2021 | April 30, 2020 | April 30, 2019 | ||||||||||||||||||
| (Unaudited) | ||||||||||||||||||||||||
| NET ASSET VALUE, BEGINNING OF PERIOD | $ | 12.58 | $ | 13.21 | $ | 17.70 | $ | 11.07 | $ | 11.82 | $ | 13.05 | ||||||||||||
| INCOME FROM INVESTMENT OPERATIONS | ||||||||||||||||||||||||
| Net investment income/(loss)(a) | 0.08 | 0.06 | (0.01 | ) | (0.08 | ) | 0.01 | 0.01 | ||||||||||||||||
| Net realized and unrealized gain/(loss) on investments | (0.86 | ) | (0.67 | ) | (2.48 | ) | 6.71 | (0.75 | ) | (1.13 | ) | |||||||||||||
| Total income/(loss) from investment operations | (0.78 | ) | (0.61 | ) | (2.49 | ) | 6.63 | (0.74 | ) | (1.12 | ) | |||||||||||||
| DISTRIBUTIONS | ||||||||||||||||||||||||
| From net investment income | — | (0.02 | ) | — | (0.00 | ) (b) | (0.01 | ) | (0.02 | ) | ||||||||||||||
| From net realized gain on investments | — | — | (2.00 | ) | — | — | (0.09 | ) | ||||||||||||||||
| Return of capital | — | — | — | — | — | — | ||||||||||||||||||
| Total distributions | — | (0.02 | ) | (2.00 | ) | (0.00 | ) (b) | (0.01 | ) | (0.11 | ) | |||||||||||||
| REDEMPTION FEES ADDED TO PAID-IN CAPITAL | 0.00 | (b) | 0.00 | (b) | — | 0.00 | (b) | — | 0.00 | (b) | ||||||||||||||
| NET ASSET VALUE, END OF PERIOD | $ | 11.80 | $ | 12.58 | $ | 13.21 | $ | 17.70 | $ | 11.07 | $ | 11.82 | ||||||||||||
| TOTAL RETURN(c) | (6.27 | )% (d) | (4.62 | )% | (16.01 | )% | 59.92 | % | (6.29 | )% | (8.48 | )% | ||||||||||||
| Net assets, at end of period (000s) | $ | 7,555 | $ | 8,767 | $ | 10,846 | $ | 15,011 | $ | 10,056 | $ | 13,869 | ||||||||||||
| Expenses (excluding fees waived/reimbursed by investment advisor) | 1.76 | % (e) | 1.70 | % | 1.76 | % | 1.75 | % | 1.76 | % | 1.77 | % | ||||||||||||
| Expenses (including fees waived/reimbursed by investment advisor) | 1.73 | % (e) | 1.68 | % | 1.63 | % | 1.68 | % | 1.74 | % | 1.76 | % | ||||||||||||
| Net investment income/(loss) | 1.19 | % (e) | 0.45 | % | (0.09 | )% | (0.50 | )% | 0.09 | % | 0.11 | % | ||||||||||||
| PORTFOLIO TURNOVER RATE | 27 | % (d) | 32 | % | 31 | % | 35 | % | 24 | % | 34 | % | ||||||||||||
| (a) | Per share numbers have been calculated using the average shares method. |
| (b) | Less than $0.005 or ($0.005) per share. |
| (c) | Total return in the above table is historical in nature and represents the rate that the investor would have earned or lost on an investment in the Fund assuming reinvestment of dividends and capital gain distributions, if any. Had the investment advisor not waived a portion of the Fund’s expenses in certain periods, total returns would have been lower. |
| (d) | Not annualized. |
| (e) | Annualized. |
See accompanying notes to financial statements.
93
| Grandeur Peak Emerging Markets Opportunities Fund | Financial Highlights |
| For a Share Outstanding Throughout the Years or Periods Presented | |
| Six Months | ||||||||||||||||||||||||
| Ended | Year Ended | Year Ended | Year Ended | Year Ended | Year Ended | |||||||||||||||||||
| Institutional Class | October 31, 2023 | April 30, 2023 | April 30, 2022 | April 30, 2021 | April 30, 2020 | April 30, 2019 | ||||||||||||||||||
| (Unaudited) | ||||||||||||||||||||||||
| NET ASSET VALUE, BEGINNING OF PERIOD | $ | 12.72 | $ | 13.35 | $ | 17.83 | $ | 11.14 | $ | 11.88 | $ | 13.12 | ||||||||||||
| INCOME FROM INVESTMENT OPERATIONS | ||||||||||||||||||||||||
| Net investment income/(loss)(a) | 0.09 | 0.08 | 0.03 | (0.04 | ) | 0.04 | 0.03 | |||||||||||||||||
| Net realized and unrealized gain/(loss) on investments | (0.86 | ) | (0.67 | ) | (2.51 | ) | 6.67 | (0.75 | ) | (1.14 | ) | |||||||||||||
| Total income/(loss) from investment operations | (0.77 | ) | (0.59 | ) | (2.48 | ) | 6.72 | (0.71 | ) | (1.11 | ) | |||||||||||||
| DISTRIBUTIONS | ||||||||||||||||||||||||
| From net investment income | — | (0.04 | ) | — | (0.01 | ) | (0.03 | ) | (0.04 | ) | ||||||||||||||
| From net realized gain on investments | — | — | (2.00 | ) | (0.02 | ) | — | (0.09 | ) | |||||||||||||||
| Return of capital | — | — | — | — | — | — | ||||||||||||||||||
| Total distributions | — | (0.04 | ) | (2.00 | ) | (0.03 | ) | (0.03 | ) | (0.13 | ) | |||||||||||||
| REDEMPTION FEES ADDED TO PAID-IN CAPITAL(b) | 0.00 | 0.00 | 0.00 | 0.00 | 0.00 | 0.00 | ||||||||||||||||||
| NET ASSET VALUE, END OF PERIOD | $ | 11.95 | $ | 12.72 | $ | 13.35 | $ | 17.83 | $ | 11.14 | $ | 11.88 | ||||||||||||
| TOTAL RETURN(c) | (6.13 | )% (d) | (4.42 | )% | (15.82 | )% | 6.30 | % | (6.03 | )% | (8.32 | )% | ||||||||||||
| Net assets, at end of period (000s) | $ | 395,731 | $ | 416,872 | $ | 485,230 | $ | 623,538 | $ | 389,373 | $ | 452,530 | ||||||||||||
| Expenses (excluding fees waived/reimbursed by investment advisor) | 1.52 | % (e) | 1.51 | % | 1.52 | % | 1.52 | % | 1.53 | % | 1.53 | % | ||||||||||||
| Expenses (including fees waived/reimbursed by investment advisor) | 1.49 | % (e) | 1.48 | % | 1.39 | % | 1.45 | % | 1.51 | % | 1.52 | % | ||||||||||||
| Net investment income/(loss) | 1.41 | % (e) | 0.66 | % | 0.15 | % | (0.27 | )% | 0.29 | % | 0.29 | % | ||||||||||||
| PORTFOLIO TURNOVER RATE | 27 | % (d) | 32 | % | 31 | % | 35 | % | 24 | % | 34 | % | ||||||||||||
| (a) | Per share numbers have been calculated using the average shares method. |
| (b) | Less than $0.005 or ($0.005) per share. |
| (c) | Total return in the above table is historical in nature and represents the rate that the investor would have earned or lost on an investment in the Fund assuming reinvestment of dividends and capital gain distributions, if any. Had the investment advisor not waived a portion of the Fund’s expenses in certain periods, total returns would have been lower. |
| (d) | Not annualized. |
| (e) | Annualized. |
See accompanying notes to financial statements.
94
| Grandeur Peak Global Contrarian Fund | Financial Highlights |
| For a Share Outstanding Throughout the Years or Periods Presented | |
| Six Months | ||||||||||||||||||||
| Ended | Year Ended | Year Ended | Year Ended | Period Ended | ||||||||||||||||
| Institutional Class | October 31, 2023 | April 30, 2023 | April 30, 2022 | April 30, 2021 | April 30, 2020(a) | |||||||||||||||
| (Unaudited) | ||||||||||||||||||||
| NET ASSET VALUE, BEGINNING OF PERIOD | $ | 13.26 | $ | 13.60 | $ | 15.41 | $ | 8.78 | $ | 10.00 | ||||||||||
| INCOME FROM INVESTMENT OPERATIONS | ||||||||||||||||||||
| Net investment income(b) | 0.23 | 0.30 | 0.20 | 0.25 | 0.06 | |||||||||||||||
| Net realized and unrealized gain/(loss) on investments | (0.39 | ) | (0.26 | ) | (1.12 | ) | 6.61 | (1.25 | ) | |||||||||||
| Total income/(loss) from investment operations | (0.16 | ) | 0.04 | (0.92 | ) | 6.86 | (1.19 | ) | ||||||||||||
| DISTRIBUTIONS | ||||||||||||||||||||
| From net investment income | — | (0.29 | ) | (0.14 | ) | (0.23 | ) | (0.01 | ) | |||||||||||
| From net realized gain on investments | — | (0.09 | ) | (0.75 | ) | — | (0.02 | ) | ||||||||||||
| Return of capital | (0.02 | ) | — | — | — | — | ||||||||||||||
| Total distributions | (0.02 | ) | (0.38 | ) | (0.89 | ) | (0.23 | ) | (0.03 | ) | ||||||||||
| REDEMPTION FEES ADDED TO PAID-IN CAPITAL(c) | 0.00 | 0.00 | 0.00 | 0.00 | 0.00 | |||||||||||||||
| NET ASSET VALUE, END OF PERIOD | $ | 13.08 | $ | 13.26 | $ | 13.60 | $ | 15.41 | $ | 8.78 | ||||||||||
| TOTAL RETURN(d) | (1.36 | )% (e) | 0.42 | % | (6.51 | )% | 78.51 | % | (11.96 | )% (e) | ||||||||||
| Net assets, at end of period (000s) | $ | 120,674 | $ | 117,406 | $ | 106,129 | $ | 49,403 | $ | 8,861 | ||||||||||
| Expenses (excluding fees waived/reimbursed/recaptured by investment advisor) | 1.35 | % (f) | 1.35 | % | 1.40 | % | 1.87 | % | 4.69 | %(f)(g) | ||||||||||
| Expenses (including fees waived/reimbursed/recaptured by investment advisor) | 1.35 | % (f) | 1.35 | % | 1.35 | % | 1.35 | % | 1.35 | % (f)(g) | ||||||||||
| Net investment income | 3.37 | % (f) | 2.29 | % | 1.33 | % | 1.91 | % | 1.05 | % (f) | ||||||||||
| PORTFOLIO TURNOVER RATE | 28 | % (e) | 81 | % | 50 | % | 54 | % | 34 | % (e) | ||||||||||
| (a) | Grandeur Peak Global Contrarian Fund commenced on September 18, 2019 and reorganized into the Trust on October 20, 2023. |
| (b) | Per share numbers have been calculated using the average shares method. |
| (c) | Less than $0.005 or ($0.005) per share. |
| (d) | Total return in the above table is historical in nature and represents the rate that the investor would have earned or lost on an investment in the Fund assuming reinvestment of dividends and capital gain distributions, if any. Had the investment advisor not waived or recaptured a portion of the Fund’s expenses in certain periods, total returns would have been lower. |
| (e) | Not annualized. |
| (f) | Annualized. |
| (g) | Expense ratios during startup periods may not be representative of longer term operating periods. |
See accompanying notes to financial statements.
95
| Grandeur Peak Global Explorer Fund | Financial Highlights |
| For a Share Outstanding Throughout the Year or Periods Presented | |
| Six Months | ||||||||||||
| Ended | Year Ended | Period Ended | ||||||||||
| Institutional Class | October 31, 2023 | April 30, 2023 | April 30, 2022(a) | |||||||||
| (Unaudited) | ||||||||||||
| NET ASSET VALUE, BEGINNING OF PERIOD | $ | 7.36 | $ | 7.80 | $ | 10.00 | ||||||
| INCOME FROM INVESTMENT OPERATIONS | ||||||||||||
| Net investment income/(loss)(b) | 0.02 | 0.02 | (0.01 | ) | ||||||||
| Net realized and unrealized loss on investments | (0.72 | ) | (0.44 | ) | (2.19 | ) | ||||||
| Total loss from investment operations | (0.70 | ) | (0.42 | ) | (2.20 | ) | ||||||
| DISTRIBUTIONS | ||||||||||||
| From net investment income | — | (0.02 | ) | — | ||||||||
| From net realized gain on investments | — | — | — | |||||||||
| Return of capital | — | — | — | |||||||||
| Total distributions | — | (0.02 | ) | — | ||||||||
| REDEMPTION FEES ADDED TO PAID-IN CAPITAL(c) | 0.00 | 0.00 | 0.00 | |||||||||
| NET ASSET VALUE, END OF PERIOD | $ | 6.66 | $ | 7.36 | $ | 7.80 | ||||||
| TOTAL RETURN(d) | (9.51 | )% | (5.40 | )% | (22.00 | )% (e) | ||||||
| Net assets, at end of period (000s) | $ | 10,732 | $ | 12,444 | $ | 9,461 | ||||||
| Expenses (excluding fees waived/reimbursed by investment advisor) | 4.47 | % | 3.97 | % | 2.45 | % (f)(g) | ||||||
| Expenses (including fees waived/reimbursed by investment advisor) | 1.25 | % | 1.25 | % | 1.25 | % (f)(g) | ||||||
| Net investment income/(loss) | 0.65 | % | 0.29 | % | (0.16 | )% (f) | ||||||
| PORTFOLIO TURNOVER RATE | 20 | % | 38 | % | 8 | % (e) | ||||||
| (a) | Grandeur Peak Global Explorer Fund commenced on December 16, 2021 and reorganized into the Trust on October 20, 2023. |
| (b) | Per share numbers have been calculated using the average shares method. |
| (c) | Less than $0.005 or ($0.005) per share. |
| (d) | Total return in the above table is historical in nature and represents the rate that the investor would have earned or lost on an investment in the Fund assuming reinvestment of dividends and capital gain distributions, if any. Had the investment advisor not waived a portion of the Fund’s expenses in certain periods, total returns would have been lower. |
| (e) | Not annualized. |
| (f) | Annualized. |
| (g) | Expense ratios during startup periods may not be representative of longer term operating periods. |
See accompanying notes to financial statements.
96
| Grandeur Peak Global Micro Cap Fund | Financial Highlights |
| For a Share Outstanding Throughout the Years or Periods Presented | |
| Six Months | ||||||||||||||||||||||||
| Ended | Year Ended | Year Ended | Year Ended | Year Ended | Year Ended | |||||||||||||||||||
| Institutional Class | October 31, 2023 | April 30, 2023 | April 30, 2022 | April 30, 2021 | April 30, 2020 | April 30, 2019 | ||||||||||||||||||
| (Unaudited) | ||||||||||||||||||||||||
| NET ASSET VALUE, BEGINNING OF PERIOD | $ | 12.44 | $ | 13.49 | $ | 20.65 | $ | 11.05 | $ | 11.31 | $ | 13.12 | ||||||||||||
| INCOME FROM INVESTMENT OPERATIONS | ||||||||||||||||||||||||
| Net investment income/(loss)(a) | 0.04 | 0.02 | (0.09 | ) | (0.10 | ) | 0.01 | (0.01 | ) | |||||||||||||||
| Net realized and unrealized gain/(loss) on investments | (1.00 | ) | (1.07 | ) | (4.24 | ) | 11.17 | (0.19 | ) | (1.08 | ) | |||||||||||||
| Total income/(loss) from investment operations | (0.96 | ) | (1.05 | ) | (4.33 | ) | 11.07 | (0.18 | ) | (1.09 | ) | |||||||||||||
| DISTRIBUTIONS | ||||||||||||||||||||||||
| From net investment income | — | — | — | (0.14 | ) | (0.03 | ) | — | ||||||||||||||||
| From net realized gain on investments | — | — | (2.83 | ) | (1.33 | ) | (0.05 | ) | (0.72 | ) | ||||||||||||||
| Total distributions | — | — | (2.83 | ) | (1.47 | ) | (0.08 | ) | (0.72 | ) | ||||||||||||||
| REDEMPTION FEES ADDED TO PAID-IN CAPITAL | 0.00 | (b) | 0.00 | (b) | 0.00 | (b) | — | 0.00 | (b) | 0.00 | (b) | |||||||||||||
| NET ASSET VALUE, END OF PERIOD | $ | 11.48 | $ | 12.44 | $ | 13.49 | $ | 20.65 | $ | 11.05 | $ | 11.31 | ||||||||||||
| TOTAL RETURN(c) | (7.72 | )% (d) | (7.78 | )% | (24.25 | )% | 102.43 | % | (1.62 | )% | (7.67 | )% | ||||||||||||
| Net assets, at end of period (000s) | $ | 38,893 | $ | 45,232 | $ | 53,175 | $ | 70,375 | $ | 29,634 | $ | 35,654 | ||||||||||||
| Expenses (excluding fees waived/reimbursed by investment advisor) | 1.95 | % (e) | 1.85 | % | 1.94 | % | 2.02 | % | 2.06 | % | 2.05 | % | ||||||||||||
| Expenses (including fees waived/reimbursed by investment advisor) | 1.95 | % (e) | 1.85 | % | 1.94 | % | 2.00 | % | 2.00 | % | 2.00 | % | ||||||||||||
| Net investment income/(loss) | 0.59 | % (e) | 0.13 | % | (0.50 | )% | (0.62 | )% | 0.09 | % | (0.06 | )% | ||||||||||||
| PORTFOLIO TURNOVER RATE | 16 | % (d) | 37 | % | 36 | % | 36 | % | 33 | % | 37 | % | ||||||||||||
| (a) | Per share numbers have been calculated using the average shares method. |
| (b) | Less than $0.005 or ($0.005) per share. |
| (c) | Total return in the above table is historical in nature and represents the rate that the investor would have earned or lost on an investment in the Fund assuming reinvestment of dividends and capital gain distributions, if any. Had the investment advisor not waived a portion of the Fund’s expenses in certain periods, total returns would have been lower. |
| (d) | Not annualized. |
| (e) | Annualized. |
See accompanying notes to financial statements.
97
| Grandeur Peak Global Opportunities Fund | Financial Highlights |
| For a Share Outstanding Throughout the Years or Periods Presented | |
| Six Months | ||||||||||||||||||||||||
| Ended | Year Ended | Year Ended | Year Ended | Year Ended | Year Ended | |||||||||||||||||||
| Investor Class | October 31, 2023 | April 30, 2023 | April 30, 2022 | April 30, 2021 | April 30, 2020 | April 30, 2019 | ||||||||||||||||||
| (Unaudited) | ||||||||||||||||||||||||
| NET ASSET VALUE, BEGINNING OF PERIOD | $ | 3.42 | $ | 3.70 | $ | 5.51 | $ | 3.24 | $ | 3.48 | $ | 3.95 | ||||||||||||
| INCOME FROM INVESTMENT OPERATIONS | ||||||||||||||||||||||||
| Net investment income/(loss)(a) | 0.05 | 0.01 | (0.01 | ) | (0.02 | ) | (0.01 | ) (b) | (0.00 | ) (c) | ||||||||||||||
| Net realized and unrealized gain/(loss) on investments | (0.44 | ) | (0.23 | ) | (0.82 | ) | 2.66 | (0.03 | ) | (0.14 | ) | |||||||||||||
| Total income/(loss) from investment operations | (0.39 | ) | (0.22 | ) | (0.83 | ) | 2.64 | (0.04 | ) | (0.14 | ) | |||||||||||||
| DISTRIBUTIONS | ||||||||||||||||||||||||
| From net investment income | — | — | — | (0.00 | ) (c) | — | (0.00 | ) (c) | ||||||||||||||||
| From net realized gain on investments | — | (0.06 | ) | (0.98 | ) | (0.37 | ) | (0.20 | ) | (0.33 | ) | |||||||||||||
| Return of capital | — | (0.06 | ) | (0.98 | ) | (0.37 | ) | (0.20 | ) | (0.33 | ) | |||||||||||||
| REDEMPTION FEES ADDED TO PAID-IN CAPITAL(c) | 0.00 | 0.00 | 0.00 | 0.00 | 0.00 | 0.00 | ||||||||||||||||||
| NET ASSET VALUE, END OF PERIOD | $ | 3.03 | $ | 3.42 | $ | 3.70 | $ | 5.51 | $ | 3.24 | $ | 3.48 | ||||||||||||
| TOTAL RETURN(d) | (11.40 | )% (e) | (5.99 | )% | (19.49 | )% | 82.94 | % | (1.73 | )% | (1.83 | )% | ||||||||||||
| Net assets, at end of period (000s) | $ | 53,081 | $ | 72,420 | $ | 92,173 | $ | 131,739 | $ | 92,843 | $ | 130,745 | ||||||||||||
| Expenses (excluding fees waived/reimbursed by investment advisor) | 1.61 | % (f) | 1.60 | % | 1.57 | % | 1.60 | % | 1.61 | % | 1.61 | % | ||||||||||||
| Expenses (including fees waived/reimbursed by investment advisor) | 1.47 | % (f) | 1.54 | % | 1.45 | % | 1.51 | % | 1.57 | % | 1.57 | % | ||||||||||||
| Net investment income/(loss) | 1.79 | % (f) | 0.21 | % | (0.14 | )% | (0.34 | )% | (0.17 | )% | (0.12 | )% | ||||||||||||
| PORTFOLIO TURNOVER RATE | 16 | % (e) | 28 | % | 33 | % | 47 | % | 41 | % | 38 | % | ||||||||||||
| (a) | Per share numbers have been calculated using the average shares method. |
| (b) | The per share amount does not correspond to activity reflected in the Statement of Operations due to class specific expenses during the period. |
| (c) | Less than $0.005 or ($0.005) per share. |
| (d) | Total return in the above table is historical in nature and represents the rate that the investor would have earned or lost on an investment in the Fund assuming reinvestment of dividends and capital gain distributions, if any. Had the investment advisor not waived a portion of the Fund’s expenses in certain periods, total returns would have been lower. |
| (e) | Not annualized. |
| (f) | Annualized. |
See accompanying notes to financial statements.
98
| Grandeur Peak Global Opportunities Fund | Financial Highlights |
| For a Share Outstanding Throughout the Years or Periods Presented | |
| Six Months | ||||||||||||||||||||||||
| Ended | Year Ended | Year Ended | Year Ended | Year Ended | Year Ended | |||||||||||||||||||
| Institutional Class | October 31, 2023 | April 30, 2023 | April 30, 2022 | April 30, 2021 | April 30, 2020 | April 30, 2019 | ||||||||||||||||||
| (Unaudited) | ||||||||||||||||||||||||
| NET ASSET VALUE, BEGINNING OF PERIOD | $ | 3.51 | $ | 3.79 | $ | 5.61 | $ | 3.29 | $ | 3.52 | $ | 4.00 | ||||||||||||
| INCOME FROM INVESTMENT OPERATIONS | ||||||||||||||||||||||||
| Net investment income(a) | 0.01 | 0.02 | 0.00 | 0.00 | 0.00 | 0.00 | ||||||||||||||||||
| Net realized and unrealized gain/(loss) on investments | (0.41 | ) | (0.24 | ) | (0.84 | ) | 2.70 | (0.03 | ) | (0.14 | ) | |||||||||||||
| Total income/(loss) from investment operations | (0.40 | ) | (0.22 | ) | (0.84 | ) | 2.70 | (0.03 | ) | (0.14 | ) | |||||||||||||
| DISTRIBUTIONS | ||||||||||||||||||||||||
| From net investment income | — | (0.00 | ) | (0.00 | ) | (0.01 | ) | �� | (0.01 | ) | ||||||||||||||
| From net realized gain on investments | — | (0.06 | ) | (0.98 | ) | (0.37 | ) | (0.20 | ) | (0.33 | ) | |||||||||||||
| — | (0.06 | ) | (0.98 | ) | (0.37 | ) | (0.20 | ) | (0.34 | ) | ||||||||||||||
| REDEMPTION FEES ADDED TO PAID-IN CAPITAL(b) | 0.00 | 0.00 | 0.00 | 0.00 | 0.00 | 0.00 | ||||||||||||||||||
| NET ASSET VALUE, END OF PERIOD | $ | 3.11 | $ | 3.51 | $ | 3.79 | $ | 5.61 | $ | 3.29 | $ | 3.52 | ||||||||||||
| TOTAL RETURN(c) | (11.40 | )% (d) | (5.74 | )% | (19.30 | )% | 83.44 | % | (1.42 | )% | (1.84 | )% | ||||||||||||
| Net assets, at end of period (000s) | $ | 507,352 | $ | 603,793 | $ | 679,987 | $ | 889,823 | $ | 470,142 | $ | 523,862 | ||||||||||||
| Expenses (excluding fees waived/reimbursed by investment advisor) | 1.36 | % (e) | 1.36 | % | 1.34 | % | 1.35 | % | 1.37 | % | 1.37 | % | ||||||||||||
| Expenses (including fees waived/reimbursed by investment advisor) | 1.31 | % (e) | 1.30 | % | 1.22 | % | 1.27 | % | 1.33 | % | 1.33 | % | ||||||||||||
| Net investment income/(loss) | 0.66 | % (e) | 0.44 | % | 0.09 | % | (0.08 | )% | 0.05 | % | 0.13 | % | ||||||||||||
| PORTFOLIO TURNOVER RATE | 16 | % (d) | 28 | % | 33 | % | 47 | % | 41 | % | 38 | % | ||||||||||||
| (a) | Per share numbers have been calculated using the average shares method. |
| (b) | Less than $0.005 or ($0.005) per share. |
| (c) | Total return in the above table is historical in nature and represents the rate that the investor would have earned or lost on an investment in the Fund assuming reinvestment of dividends and capital gain distributions, if any. Had the investment advisor not waived a portion of the Fund’s expenses in certain periods, total returns would have been lower. |
| (d) | Not annualized. |
| (e) | Annualized. |
See accompanying notes to financial statements.
99
| Grandeur Peak Global Reach Fund | Financial Highlights |
| For a Share Outstanding Throughout the Years or Periods Presented | |
| Six Months | ||||||||||||||||||||||||
| Ended | Year Ended | Year Ended | Year Ended | Year Ended | Year Ended | |||||||||||||||||||
| Investor Class | October 31, 2023 | April 30, 2023 | April 30, 2022 | April 30, 2021 | April 30, 2020 | April 30, 2019 | ||||||||||||||||||
| (Unaudited) | ||||||||||||||||||||||||
| NET ASSET VALUE, BEGINNING OF PERIOD | $ | 14.65 | $ | 16.01 | $ | 23.16 | $ | 14.12 | $ | 14.98 | $ | 16.97 | ||||||||||||
| INCOME FROM INVESTMENT OPERATIONS | ||||||||||||||||||||||||
| Net investment income/(loss)(a) | 0.03 | 0.02 | (0.07 | ) | (0.07 | ) | (0.01 | ) (b) | 0.01 | |||||||||||||||
| Net realized and unrealized gain/(loss) on investments | (1.43 | ) | (1.38 | ) | (3.77 | ) | 10.79 | (0.44 | ) | (0.58 | ) | |||||||||||||
| Total income/(loss) from investment operations | (1.40 | ) | (1.36 | ) | (3.84 | ) | 10.72 | (0.45 | ) | (0.57 | ) | |||||||||||||
| DISTRIBUTIONS | ||||||||||||||||||||||||
| From net investment income | — | — | — | (0.01 | ) | — | (0.00 | ) (c) | ||||||||||||||||
| From net realized gain on investments | — | — | (3.31 | ) | (1.67 | ) | (0.41 | ) | (1.42 | ) | ||||||||||||||
| — | — | (3.31 | ) | (1.68 | ) | (0.41 | ) | (1.42 | ) | |||||||||||||||
| REDEMPTION FEES ADDED TO PAID-IN CAPITAL(c) | 0.00 | 0.00 | 0.00 | 0.00 | 0.00 | 0.00 | ||||||||||||||||||
| NET ASSET VALUE, END OF PERIOD | $ | 13.25 | $ | 14.65 | $ | 16.01 | $ | 23.16 | $ | 14.12 | $ | 14.98 | ||||||||||||
| TOTAL RETURN(d) | (9.56 | )% (e) | (8.49 | )% | (20.17 | )% | 77.38 | % | (3.31 | )% | (1.61 | )% | ||||||||||||
| Net assets, at end of period (000s) | $ | 22,183 | $ | 27,427 | $ | 33,459 | $ | 59,164 | $ | 40,307 | $ | 56,307 | ||||||||||||
| Expenses (excluding fees waived/reimbursed by investment advisor) | 1.57 | % (f) | 1.49 | % | 1.49 | % | 1.52 | % | 1.52 | % | 1.52 | % | ||||||||||||
| Expenses (including fees waived/reimbursed by investment advisor) | 1.50 | % (f) | 1.49 | % | 1.48 | % | 1.52 | % | 1.52 | % | 1.52 | % | ||||||||||||
| Net investment income/(loss) | 0.45 | % (f) | 0.16 | % | (0.32 | )% | (0.38 | )% | (0.04 | )% | 0.05 | % | ||||||||||||
| PORTFOLIO TURNOVER RATE | 21 | % (e) | 42 | % | 42 | % | 41 | % | 32 | % | 50 | % | ||||||||||||
| (a) | Per share numbers have been calculated using the average shares method. |
| (b) | The per share amount does not correspond to activity reflected in the Statement of Operations due to class specific expenses during the period. |
| (c) | Less than $0.005 or ($0.005) per share. |
| (d) | Total return in the above table is historical in nature and represents the rate that the investor would have earned or lost on an investment in the Fund assuming reinvestment of dividends and capital gain distributions, if any. Had the investment advisor not waived a portion of the Fund’s expenses in certain periods, total returns would have been lower. |
| (e) | Not annualized. |
| (f) | Annualized. |
See accompanying notes to financial statements.
100
| Grandeur Peak Global Reach Fund | Financial Highlights |
| For a Share Outstanding Throughout the Years or Periods Presented | |
| Six Months | ||||||||||||||||||||||||
| Ended | Year Ended | Year Ended | Year Ended | Year Ended | Year Ended | |||||||||||||||||||
| Institutional Class | October 31, 2023 | April 30, 2023 | April 30, 2022 | April 30, 2021 | April 30, 2020 | April 30, 2019 | ||||||||||||||||||
| (Unaudited) | ||||||||||||||||||||||||
| NET ASSET VALUE, BEGINNING OF PERIOD | $ | 14.82 | $ | 16.17 | $ | 23.31 | $ | 14.19 | $ | 15.04 | $ | 17.02 | ||||||||||||
| INCOME FROM INVESTMENT OPERATIONS | ||||||||||||||||||||||||
| Net investment income/(loss)(a) | 0.05 | 0.06 | (0.02 | ) | (0.03 | ) | 0.03 | 0.05 | ||||||||||||||||
| Net realized and unrealized gain/(loss) on investments | (1.44 | ) | (1.40 | ) | (3.81 | ) | 10.86 | (0.45 | ) | (0.58 | ) | |||||||||||||
| Total income/(loss) from investment operations | (1.39 | ) | (1.34 | ) | (3.83 | ) | 10.83 | (0.42 | ) | (0.53 | ) | |||||||||||||
| DISTRIBUTIONS | ||||||||||||||||||||||||
| From net investment income | — | (0.01 | ) | — | (0.04 | ) | (0.02 | ) | (0.03 | ) | ||||||||||||||
| From net realized gain on investments | — | — | (3.31 | ) | (1.67 | ) | (0.41 | ) | (1.42 | ) | ||||||||||||||
| — | (0.01 | ) | (3.31 | ) | (1.71 | ) | (0.43 | ) | (1.45 | ) | ||||||||||||||
| REDEMPTION FEES ADDED TO PAID-IN CAPITAL(b) | 0.00 | 0.00 | 0.00 | 0.00 | 0.00 | 0.00 | ||||||||||||||||||
| NET ASSET VALUE, END OF PERIOD | $ | 13.43 | $ | 14.82 | $ | 16.17 | $ | 23.31 | $ | 14.19 | $ | 15.04 | ||||||||||||
| TOTAL RETURN(c) | (9.38 | )% (d) | (8.30 | )% | (19.99 | )% | 77.81 | % | (3.09 | )% | (1.33 | )% | ||||||||||||
| Net assets, at end of period (000s) | $ | 187,287 | $ | 237,614 | $ | 287,502 | $ | 317,828 | $ | 200,988 | $ | 272,743 | ||||||||||||
| Expenses (excluding fees waived/reimbursed by investment advisor) | 1.30 | % (e) | 1.26 | % | 1.25 | % | 1.27 | % | 1.27 | % | 1.27 | % | ||||||||||||
| Expenses (including fees waived/reimbursed by investment advisor) | 1.25 | % (e) | 1.25 | % | 1.24 | % | 1.27 | % | 1.27 | % | 1.27 | % | ||||||||||||
| Net investment income/(loss) | 0.70 | % (e) | 0.40 | % | (0.09 | )% | (0.14 | )% | 0.21 | % | 0.29 | % | ||||||||||||
| PORTFOLIO TURNOVER RATE | 21 | % (d) | 42 | % | 42 | % | 41 | % | 32 | % | 50 | % | ||||||||||||
| (a) | Per share numbers have been calculated using the average shares method. |
| (b) | Less than $0.005 or ($0.005) per share. |
| (c) | Total return in the above table is historical in nature and represents the rate that the investor would have earned or lost on an investment in the Fund assuming reinvestment of dividends and capital gain distributions, if any. Had the investment advisor not waived a portion of the Fund’s expenses in certain periods, total returns would have been lower. |
| (d) | Not annualized. |
| (e) | Annualized. |
See accompanying notes to financial statements.
101
| Grandeur Peak Global Stalwarts Fund | Financial Highlights |
| For a Share Outstanding Throughout the Years or Periods Presented |
| Six Months | ||||||||||||||||||||||||
| Ended | Year Ended | Year Ended | Year Ended | Year Ended | Year Ended | |||||||||||||||||||
| Investor Class | October 31, 2023 | April 30, 2023 | April 30, 2022 | April 30, 2021 | April 30, 2020 | April 30, 2019 | ||||||||||||||||||
| (Unaudited) | ||||||||||||||||||||||||
| NET ASSET VALUE, BEGINNING OF PERIOD | $ | 14.47 | $ | 16.51 | $ | 23.26 | $ | 14.26 | $ | 14.83 | $ | 15.06 | ||||||||||||
| INCOME FROM INVESTMENT OPERATIONS | ||||||||||||||||||||||||
| Net investment income/(loss)(a) | 0.02 | (0.01 | ) | (0.06 | ) | (0.04 | ) | (0.01 | ) (b) | 0.01 | ||||||||||||||
| Net realized and unrealized gain/(loss) on investments | (1.60 | ) | (2.03 | ) | (4.21 | ) | 9.72 | 0.31 | 0.16 | |||||||||||||||
| Total income/(loss) from investment operations | (1.58 | ) | (2.04 | ) | (4.27 | ) | 9.68 | (0.32 | ) | 0.17 | ||||||||||||||
| DISTRIBUTIONS | ||||||||||||||||||||||||
| From net investment income | — | — | — | — | (0.00 | ) (c) | — | |||||||||||||||||
| From net realized gain on investments | (0.03 | ) | — | (2.48 | ) | (0.68 | ) | (0.25 | ) | (0.40 | ) | |||||||||||||
| (0.03 | ) | — | (2.48 | ) | (0.68 | ) | (0.25 | ) | (0.40 | ) | ||||||||||||||
| REDEMPTION FEES ADDED TO PAID-IN CAPITAL(c) | 0.00 | 0.00 | 0.00 | 0.00 | 0.00 | 0.00 | ||||||||||||||||||
| NET ASSET VALUE, END OF PERIOD | $ | 12.87 | $ | 14.47 | $ | 16.51 | $ | 23.26 | $ | 14.26 | $ | 14.83 | ||||||||||||
| TOTAL RETURN(d) | (11.06 | )% (e) | (12.36 | )% | (21.45 | )% | 68.36 | % | (2.22 | )% | 1.78 | % | ||||||||||||
| Net assets, at end of period (000s) | $ | 22,281 | $ | 30,682 | $ | 51,984 | $ | 103,891 | $ | 85,310 | $ | 90,400 | ||||||||||||
| Expenses (excluding fees waived/reimbursed by investment advisor) | 1.25 | % (f) | 1.21 | % | 1.17 | % | 1.21 | % | 1.24 | % | 1.27 | % | ||||||||||||
| Expenses (including fees waived/reimbursed by investment advisor) | 1.25 | % (f) | 1.21 | % | 1.17 | % | 1.21 | % | 1.24 | % | 1.27 | % | ||||||||||||
| Net investment income/(loss) | 0.30 | % (f) | (0.06 | )% | (0.24 | )% | (0.23 | )% | (0.10 | )% | 0.05 | % | ||||||||||||
| PORTFOLIO TURNOVER RATE | 27 | % (e) | 32 | % | 49 | % | 50 | % | 50 | % | 52 | % | ||||||||||||
| (a) | Per share numbers have been calculated using the average shares method. |
| (b) | The per share amount does not correspond to activity reflected in the Statement of Operations due to class specific expenses during the period. |
| (c) | Less than $0.005 or ($0.005) per share. |
| (d) | Total return in the above table is historical in nature and represents the rate that the investor would have earned or lost on an investment in the Fund assuming reinvestment of dividends and capital gain distributions, if any. Had the investment advisor not waived a portion of the Fund’s expenses in certain periods, total returns would have been lower. |
| (e) | Not annualized. |
| (f) | Annualized. |
See accompanying notes to financial statements.
102
| Grandeur Peak Global Stalwarts Fund | Financial Highlights |
| For a Share Outstanding Throughout the Years or Periods Presented |
| Six Months | ||||||||||||||||||||||||
| Ended | Year Ended | Year Ended | Year Ended | Year Ended | Year Ended | |||||||||||||||||||
| Institutional Class | October 31, 2023 | April 30, 2023 | April 30, 2022 | April 30, 2021 | April 30, 2020 | April 30, 2019 | ||||||||||||||||||
| (Unaudited) | ||||||||||||||||||||||||
| NET ASSET VALUE, BEGINNING OF PERIOD | $ | 14.69 | $ | 16.74 | $ | 23.50 | $ | 14.37 | $ | 14.93 | $ | 15.14 | ||||||||||||
| INCOME FROM INVESTMENT OPERATIONS | ||||||||||||||||||||||||
| Net investment income/(loss)(a) | 0.04 | 0.03 | (0.00 | ) (b) | 0.01 | 0.03 | 0.04 | |||||||||||||||||
| Net realized and unrealized gain/(loss) on investments | (1.63 | ) | (2.05 | ) | (4.28 | ) | 9.80 | (0.31 | ) | 0.17 | ||||||||||||||
| Total income/(loss) from investment operations | (1.58 | ) | (2.02 | ) | (4.28 | ) | 9.81 | (0.28 | ) | 0.21 | ||||||||||||||
| DISTRIBUTIONS | ||||||||||||||||||||||||
| From net investment income | — | (0.03 | ) | — | — | (0.03 | ) | (0.02 | ) | |||||||||||||||
| From net realized gain on investments | (0.03 | ) | — | (2.48 | ) | (0.68 | ) | (0.25 | ) | (0.40 | ) | |||||||||||||
| (0.03 | ) | (0.03 | ) | (2.48 | ) | (0.68 | ) | (0.28 | ) | (0.42 | ) | |||||||||||||
| REDEMPTION FEES ADDED TO PAID-IN CAPITAL(b) | 0.00 | 0.00 | 0.00 | 0.00 | 0.00 | 0.00 | ||||||||||||||||||
| NET ASSET VALUE, END OF PERIOD | $ | 13.08 | $ | 14.69 | $ | 16.74 | $ | 23.50 | $ | 14.37 | $ | 14.93 | ||||||||||||
| TOTAL RETURN(c) | (10.96 | )% (d) | (12.09 | )% | (21.26 | )% | 68.74 | % | (2.05 | )% | 2.08 | % | ||||||||||||
| Net assets, at end of period (000s) | $ | 114,564 | $ | 167,932 | $ | 285,539 | $ | 263,711 | $ | 119,600 | $ | 108,934 | ||||||||||||
| Expenses (excluding fees waived/reimbursed by investment advisor) | 1.00 | % (e) | 0.94 | % | 0.93 | % | 0.96 | % | 0.99 | % | 1.02 | % | ||||||||||||
| Expenses (including fees waived/reimbursed by investment advisor) | 1.00 | % (e) | 0.94 | % | 0.93 | % | 0.96 | % | 0.99 | % | 1.02 | % | ||||||||||||
| Net investment income/(loss) | 0.55 | % (e) | 0.21 | % | (0.01 | )% | 0.06 | % | 0.17 | % | 0.27 | % | ||||||||||||
| PORTFOLIO TURNOVER RATE | 27 | % (d) | 32 | % | 49 | % | 50 | % | 50 | % | 52 | % | ||||||||||||
| (a) | Per share numbers have been calculated using the average shares method. |
| (b) | Less than $0.005 or ($0.005) per share. |
| (c) | Total return in the above table is historical in nature and represents the rate that the investor would have earned or lost on an investment in the Fund assuming reinvestment of dividends and capital gain distributions, if any. Had the investment advisor not waived a portion of the Fund’s expenses in certain periods, total returns would have been lower. |
| (d) | Not annualized. |
| (e) | Annualized. |
See accompanying notes to financial statements.
103
| Grandeur Peak International Opportunities Fund | Financial Highlights |
| For a Share Outstanding Throughout the Years or Periods Presented | |
| Six Months | ||||||||||||||||||||||||
| Ended | Year Ended | Year Ended | Year Ended | Year Ended | Year Ended | |||||||||||||||||||
| Investor Class | October 31, 2023 | April 30, 2023 | April 30, 2022 | April 30, 2021 | April 30, 2020 | April 30, 2019 | ||||||||||||||||||
| (Unaudited) | ||||||||||||||||||||||||
| NET ASSET VALUE, BEGINNING OF PERIOD | $ | 3.36 | $ | 3.57 | $ | 5.17 | $ | 3.04 | $ | 3.34 | $ | 4.10 | ||||||||||||
| INCOME FROM INVESTMENT OPERATIONS | ||||||||||||||||||||||||
| Net investment income/(loss)(a) | 0.01 | 0.01 | (0.01 | ) | (0.01 | ) | 0.00 | (b) | 0.00 | (b) | ||||||||||||||
| Net realized and unrealized gain/(loss) on investments | (0.51 | ) | (0.22 | ) | (0.94 | ) | 2.30 | (0.18 | ) | (0.38 | ) | |||||||||||||
| Total income/(loss) from investment operations | (0.50 | ) | (0.21 | ) | (0.95 | ) | 2.29 | (0.18 | ) | (0.38 | ) | |||||||||||||
| DISTRIBUTIONS | ||||||||||||||||||||||||
| From net investment income | — | (0.00 | ) (b) | — | (0.01 | ) | (0.00 | ) (b) | (0.01 | ) | ||||||||||||||
| From net realized gain on investments | — | — | (0.65 | ) | (0.15 | ) | (0.12 | ) | (0.37 | ) | ||||||||||||||
| — | (0.00 | ) (b) | (0.65 | ) | (0.16 | ) | (0.12 | ) | (0.38 | ) | ||||||||||||||
| REDEMPTION FEES ADDED TO PAID-IN CAPITAL(b) | 0.00 | 0.00 | 0.00 | 0.00 | 0.00 | 0.00 | ||||||||||||||||||
| NET ASSET VALUE, END OF PERIOD | $ | 2.86 | $ | 3.36 | $ | 3.57 | $ | 5.17 | $ | 3.04 | $ | 3.34 | ||||||||||||
| TOTAL RETURN(c) | (14.88 | )% (d) | (5.85 | )% | (21.60 | )% | 75.87 | % | (5.79 | )% | (7.40 | )% | ||||||||||||
| Net assets, at end of period (000s) | $ | 22,382 | $ | 29,277 | $ | 40,835 | $ | 69,041 | $ | 41,351 | $ | 58,070 | ||||||||||||
| Expenses (excluding fees waived/reimbursed by investment advisor) | 1.64 | % (e) | 1.60 | % | 1.60 | % | 1.60 | % | 1.61 | % | 1.62 | % | ||||||||||||
| Expenses (including fees waived/reimbursed by investment advisor) | 1.60 | % (e) | 1.55 | % | 1.48 | % | 1.53 | % | 1.58 | % | 1.57 | % | ||||||||||||
| Net investment income/(loss) | 0.78 | % (e) | 0.29 | % | (0.24 | )% | (0.27 | )% | 0.01 | % | 0.11 | % | ||||||||||||
| PORTFOLIO TURNOVER RATE | 16 | % (d) | 28 | % | 26 | % | 36 | % | 27 | % | 34 | % | ||||||||||||
| (a) | Per share numbers have been calculated using the average shares method. |
| (b) | Less than $0.005 or ($0.005) per share. |
| (c) | Total return in the above table is historical in nature and represents the rate that the investor would have earned or lost on an investment in the Fund assuming reinvestment of dividends and capital gain distributions, if any. Had the investment advisor not waived a portion of the Fund’s expenses in certain periods, total returns would have been lower. |
| (d) | Not annualized. |
| (e) | Annualized. |
See accompanying notes to financial statements.
104
| Grandeur Peak International Opportunities Fund | Financial Highlights |
| For a Share Outstanding Throughout the Years or Periods Presented | |
| Six Months | ||||||||||||||||||||||||
| Ended | Year Ended | Year Ended | Year Ended | Year Ended | Year Ended | |||||||||||||||||||
| Institutional Class | October 31, 2023 | April 30, 2023 | April 30, 2022 | April 30, 2021 | April 30, 2020 | April 30, 2019 | ||||||||||||||||||
| (Unaudited) | ||||||||||||||||||||||||
| NET ASSET VALUE, BEGINNING OF PERIOD | $ | 3.40 | $ | 3.61 | $ | 5.21 | $ | 3.06 | $ | 3.36 | $ | 4.12 | ||||||||||||
| INCOME FROM INVESTMENT OPERATIONS | ||||||||||||||||||||||||
| Net investment income/(loss)(a) | 0.02 | 0.02 | (0.00 | ) (b) | (0.00 | ) (b) | 0.01 | 0.01 | ||||||||||||||||
| Net realized and unrealized gain/(loss) on investments | (0.52 | ) | (0.22 | ) | (0.95 | ) | 2.31 | (0.18 | ) | (0.38 | ) | |||||||||||||
| Total income/(loss) from investment operations | (0.50 | ) | (0.20 | ) | (0.95 | ) | 2.31 | (0.17 | ) | (0.37 | ) | |||||||||||||
| DISTRIBUTIONS | ||||||||||||||||||||||||
| From net investment income | — | (0.01 | ) | (0.00 | ) (b) | (0.01 | ) | (0.01 | ) | (0.02 | ) | |||||||||||||
| From net realized gain on investments | — | — | (0.65 | ) | (0.15 | ) | (0.12 | ) | (0.37 | ) | ||||||||||||||
| — | (0.01 | ) | (0.65 | ) | (0.16 | ) | (0.13 | ) | (0.39 | ) | ||||||||||||||
| REDEMPTION FEES ADDED TO PAID-IN CAPITAL(b) | 0.00 | 0.00 | 0.00 | 0.00 | 0.00 | 0.00 | ||||||||||||||||||
| NET ASSET VALUE, END OF PERIOD | $ | 2.90 | $ | 3.40 | $ | 3.61 | $ | 5.21 | $ | 3.06 | $ | 3.36 | ||||||||||||
| TOTAL RETURN(c) | (14.45 | )% (d) | (5.61 | )% | (21.38 | )% | 76.29 | % | (5.60 | )% | (7.19 | )% | ||||||||||||
| Net assets, at end of period (000s) | $ | 494,436 | $ | 603,848 | $ | 657,165 | $ | 904,059 | $ | 473,820 | $ | 653,241 | ||||||||||||
| Expenses (excluding fees waived/reimbursed by investment advisor) | 1.37 | % (e) | 1.36 | % | 1.35 | % | 1.36 | % | 1.37 | % | 1.37 | % | ||||||||||||
| Expenses (including fees waived/reimbursed by investment advisor) | 1.33 | % (e) | 1.31 | % | 1.23 | % | 1.28 | % | 1.34 | % | 1.32 | % | ||||||||||||
| Net investment income/(loss) | 1.00 | % (e) | 0.51 | % | (0.01 | )% | (0.02 | )% | 0.24 | % | 0.41 | % | ||||||||||||
| PORTFOLIO TURNOVER RATE | 16 | % (d) | 28 | % | 26 | % | 36 | % | 27 | % | 34 | % | ||||||||||||
| (a) | Per share numbers have been calculated using the average shares method. |
| (b) | Less than $0.005 or ($0.005) per share. |
| (c) | Total return in the above table is historical in nature and represents the rate that the investor would have earned or lost on an investment in the Fund assuming reinvestment of dividends and capital gain distributions, if any. Had the investment advisor not waived a portion of the Fund’s expenses in certain periods, total returns would have been lower. |
| (d) | Not annualized. |
| (e) | Annualized. |
See accompanying notes to financial statements.
105
| Grandeur Peak International Stalwarts Fund | Financial Highlights |
| For a Share Outstanding Throughout the Years or Periods Presented | |
| Six Months | ||||||||||||||||||||||||
| Ended | Year Ended | Year Ended | Year Ended | Year Ended | Year Ended | |||||||||||||||||||
| Investor Class | October 31, 2023 | April 30, 2023 | April 30, 2022 | April 30, 2021 | April 30, 2020 | April 30, 2019 | ||||||||||||||||||
| (Unaudited) | ||||||||||||||||||||||||
| NET ASSET VALUE, BEGINNING OF PERIOD | $ | 16.51 | $ | 17.91 | $ | 24.05 | $ | 14.40 | $ | 14.70 | $ | 15.53 | ||||||||||||
| INCOME FROM INVESTMENT OPERATIONS | ||||||||||||||||||||||||
| Net investment income/(loss)(a) | 0.06 | 0.05 | (0.03 | ) | (0.00 | ) (b) | 0.01 | 0.04 | ||||||||||||||||
| Net realized and unrealized gain/(loss) on investments | (2.55 | ) | (1.44 | ) | (3.93 | ) | 9.70 | (0.29 | ) | (0.53 | ) | |||||||||||||
| Total income/(loss) from investment operations | (2.49 | ) | (1.39 | ) | (3.96 | ) | 9.70 | (0.28 | ) | (0.49 | ) | |||||||||||||
| DISTRIBUTIONS | ||||||||||||||||||||||||
| From net investment income | — | (0.01 | ) | — | — | (0.02 | ) | (0.05 | ) | |||||||||||||||
| From net realized gain on investments | — | — | (2.18 | ) | (0.05 | ) | — | (0.29 | ) | |||||||||||||||
| — | (0.01 | ) | (2.18 | ) | (0.05 | ) | (0.02 | ) | (0.34 | ) | ||||||||||||||
| REDEMPTION FEES ADDED TO PAID-IN CAPITAL(b) | 0.00 | 0.00 | 0.00 | 0.00 | 0.00 | 0.00 | ||||||||||||||||||
| NET ASSET VALUE, END OF PERIOD | $ | 14.02 | $ | 16.51 | $ | 17.91 | $ | 9.65 | $ | 14.40 | $ | 14.70 | ||||||||||||
| TOTAL RETURN(c) | (15.08 | )% (d) | (7.73 | )% | (19.07 | )% | 67.36 | % | (1.91 | )% | (2.69 | )% | ||||||||||||
| Net assets, at end of period (000s) | $ | 21,717 | $ | 31,075 | $ | 51,250 | $ | 67,688 | $ | 82,289 | $ | 72,204 | ||||||||||||
| Expenses (excluding fees waived/reimbursed by investment advisor) | 1.17 | % (e) | 1.15 | % | 1.14 | % | 1.15 | % | 1.17 | % | 1.19 | % | ||||||||||||
| Expenses (including fees waived/reimbursed by investment advisor) | 1.17 | % (e) | 1.15 | % | 1.14 | % | 1.15 | % | 1.17 | % | 1.19 | % | ||||||||||||
| Net investment income/(loss) | 0.75 | % (e) | 0.32 | % | (0.13 | )% | (0.01 | )% | 0.04 | % | 0.26 | % | ||||||||||||
| PORTFOLIO TURNOVER RATE | 28 | % (d) | 32 | % | 43 | % | 33 | % | 32 | % | 42 | % | ||||||||||||
| (a) | Per share numbers have been calculated using the average shares method. |
| (b) | Less than $0.005 or ($0.005) per share. |
| (c) | Total return in the above table is historical in nature and represents the rate that the investor would have earned or lost on an investment in the Fund assuming reinvestment of dividends and capital gain distributions, if any. Had the investment advisor not waived a portion of the Fund’s expenses in certain periods, total returns would have been lower. |
| (d) | Not annualized. |
| (e) | Annualized. |
See accompanying notes to financial statements.
106
| Grandeur Peak International Stalwarts Fund | Financial Highlights |
| For a Share Outstanding Throughout the Years or Periods Presented | |
| Six Months | ||||||||||||||||||||||||
| Ended | Year Ended | Year Ended | Year Ended | Year Ended | Year Ended | |||||||||||||||||||
| Institutional Class | October 31, 2023 | April 30, 2023 | April 30, 2022 | April 30, 2021 | April 30, 2020 | April 30, 2019 | ||||||||||||||||||
| (Unaudited) | ||||||||||||||||||||||||
| NET ASSET VALUE, BEGINNING OF PERIOD | $ | 16.67 | $ | 18.06 | $ | 24.19 | $ | 14.46 | $ | 14.74 | $ | 15.57 | ||||||||||||
| INCOME FROM INVESTMENT OPERATIONS | ||||||||||||||||||||||||
| Net investment income(a) | 0.08 | 0.09 | 0.03 | 0.06 | 0.05 | 0.07 | ||||||||||||||||||
| Net realized and unrealized gain/(loss) on investments | (2.58 | ) | (1.44 | ) | (3.98 | ) | 9.75 | (0.29 | ) | (0.54 | ) | |||||||||||||
| Total income/(loss) from investment operations | (2.50 | ) | (1.35 | ) | (3.95 | ) | 9.81 | (0.24 | ) | (0.47 | ) | |||||||||||||
| DISTRIBUTIONS | ||||||||||||||||||||||||
| From net investment income | — | (0.04 | ) | (0.00 | ) (b) | (0.03 | ) | (0.04 | ) | (0.07 | ) | |||||||||||||
| From net realized gain on investments | — | — | (2.18 | ) | (0.05 | ) | — | (0.29 | ) | |||||||||||||||
| — | (0.04 | ) | (2.18 | ) | (0.08 | ) | (0.04 | ) | (0.36 | ) | ||||||||||||||
| REDEMPTION FEES ADDED TO PAID-IN CAPITAL(b) | 0.00 | 0.00 | 0.00 | 0.00 | 0.00 | 0.00 | ||||||||||||||||||
| NET ASSET VALUE, END OF PERIOD | $ | 14.17 | $ | 16.67 | $ | 18.06 | $ | 9.73 | $ | 14.46 | $ | 14.74 | ||||||||||||
| TOTAL RETURN(c) | (15.00 | )% (d) | (7.45 | )% | (18.90 | )% | 67.84 | % | (1.63 | )% | (2.50 | )% | ||||||||||||
| Net assets, at end of period (000s) | $ | 1,368,277 | $ | 1,697,892 | $ | 1,583,122 | $ | 1,966,043 | $ | 870,916 | $ | 561,100 | ||||||||||||
| Expenses (excluding fees waived/reimbursed by investment advisor) | 0.92 | % (e) | 0.90 | % | 0.89 | % | 0.90 | % | 0.92 | % | 0.94 | % | ||||||||||||
| Expenses (including fees waived/reimbursed by investment advisor) | 0.92 | % (e) | 0.90 | % | 0.89 | % | 0.90 | % | 0.92 | % | 0.94 | % | ||||||||||||
| Net investment income | 0.96 | % (e) | 0.55 | % | 0.13 | % | 0.31 | % | 0.32 | % | 0.51 | % | ||||||||||||
| PORTFOLIO TURNOVER RATE | 28 | % (d) | 32 | % | 43 | % | 33 | % | 32 | % | 42 | % | ||||||||||||
| (a) | Per share numbers have been calculated using the average shares method. |
| (b) | Less than $0.005 or ($0.005) per share. |
| (c) | Total return in the above table is historical in nature and represents the rate that the investor would have earned or lost on an investment in the Fund assuming reinvestment of dividends and capital gain distributions, if any. Had the investment advisor not waived a portion of the Fund’s expenses in certain periods, total returns would have been lower. |
| (d) | Not annualized. |
| (e) | Annualized. |
See accompanying notes to financial statements.
107
| Grandeur Peak US Stalwarts Fund | Financial Highlights |
| For a Share Outstanding Throughout the Years or Periods Presented |
| Six Months | ||||||||||||||||||||
| Ended | Year Ended | Year Ended | Year Ended | Period Ended | ||||||||||||||||
| Investor Class | October 31, 2023 | April 30, 2023 | April 30, 2022 | April 30, 2021 | April 30, 2020(a) | |||||||||||||||
| (Unaudited) | ||||||||||||||||||||
| NET ASSET VALUE, BEGINNING OF PERIOD | $ | 15.73 | $ | 17.65 | $ | 22.71 | $ | 13.15 | $ | 10.00 | ||||||||||
| INCOME FROM INVESTMENT OPERATIONS | ||||||||||||||||||||
| Net investment income/(loss)(b) | 0.01 | (0.01 | ) | (0.03 | ) | (0.06 | ) | (0.01 | ) | |||||||||||
| Net realized and unrealized gain/(loss) on investments | (0.64 | ) | (1.91 | ) | (4.62 | ) | 9.73 | 3.16 | ||||||||||||
| Total income/(loss) from investment operations | (0.63 | ) | (1.92 | ) | (4.65 | ) | 9.67 | 3.15 | ||||||||||||
| DISTRIBUTIONS | ||||||||||||||||||||
| From net investment income | — | (0.00 | ) (c) | — | — | — | ||||||||||||||
| From net realized gain on investments | — | — | (0.42 | ) | (0.11 | ) | — | |||||||||||||
| — | (0.00 | ) (c) | (0.42 | ) | (0.11 | ) | — | |||||||||||||
| REDEMPTION FEES ADDED TO PAID-IN CAPITAL | — | 0.00 | (c) | 0.01 | 0.00 | (c) | 0.00 | (c) | ||||||||||||
| NET ASSET VALUE, END OF PERIOD | $ | 15.10 | $ | 15.73 | $ | 17.65 | $ | 9.56 | $ | 13.15 | ||||||||||
| TOTAL RETURN(d) | (4.01 | )% (e) | (10.87 | )% | (20.93 | )% | 73.67 | % | 31.50 | % (e) | ||||||||||
| Net assets, at end of period (000s) | $ | 102,167 | $ | 104,459 | $ | 131,534 | $ | 126,106 | $ | 9,421 | ||||||||||
| Expenses (excluding fees waived/reimbursed by investment advisor) | 0.91 | % (f) | 0.90 | % | 0.91 | % | 1.11 | % | 6.23 | % (f)(g) | ||||||||||
| Expenses (including fees waived/reimbursed by investment advisor) | 0.91 | % (f) | 0.90 | % | 0.91 | % | 1.00 | % | 1.00 | % (f)(g) | ||||||||||
| Net investment income/(loss) | 0.18 | % (f) | (0.07 | )% | (0.14 | )% | 0.30 | % | (0.53 | )% (f) | ||||||||||
| PORTFOLIO TURNOVER RATE | 32 | % (e) | 56 | % | 31 | % | 24 | % | 2 | % (e) | ||||||||||
| (a) | Grandeur Peak US Stalwarts Fund commenced on March 20, 2020 and reorganized into the Trust on October 20, 2023. |
| (b) | Per share numbers have been calculated using the average shares method. |
| (b) | The per share amount does not correspond to activity reflected in the Statement of Operations due to class specific expenses during the period. |
| (c) | Less than $0.005 or ($0.005) per share. |
| (d) | Total return in the above table is historical in nature and represents the rate that the investor would have earned or lost on an investment in the Fund assuming reinvestment of dividends and capital gain distributions, if any. Had the investment advisor not waived a portion of the Fund’s expenses in certain periods, total returns would have been lower. |
| (e) | Not annualized. |
| (f) | Annualized. |
| (g) | Expense ratios during startup periods may not be representative of longer term operating periods. |
See accompanying notes to financial statements.
108
| Grandeur Peak Funds® | Notes to Financial Statements |
| October 31, 2023 (Unaudited) |
| 1. | ORGANIZATION |
The Grandeur Peak Emerging Markets Opportunities Fund, Grandeur Peak Global Contrarian Fund, Grandeur Peak Global Explorer Fund, Grandeur Peak Global Micro Cap Fund, Grandeur Peak Global Opportunities Fund, Grandeur Peak Global Reach Fund, Grandeur Peak Global Stalwarts Fund, Grandeur Peak International Opportunities Fund, Grandeur Peak International Stalwarts Fund and Grandeur Peak US Stalwarts Fund (each a “Fund” and collectively the “Funds”) are diversified series of shares of beneficial interest of Grandeur Peak Global Trust, (the “Trust”), a statutory trust organized under the laws of the State of Delaware on October 6, 2023, and registered under the Investment Company Act of 1940, as amended (the “1940 Act”), as an open-end management investment company. Each Fund reorganized on October 20, 2023 from their predecessor fund to a series of Grandeur Peak Global Trust. The Funds seek long-term growth of capital. The Grandeur Peak Emerging Markets Opportunities Fund’s inception date is December 16, 2023. The Grandeur Peak Global Contrarian Fund’s inception date is September 17, 2019. The Grandeur Peak Global Explorer Fund’s inception date is December 16, 2013. The Grandeur Peak Global Micro Cap Fund’s inception date is October 20, 2015. The Grandeur Peak Global Opportunities Fund’s and Grandeur Peak International Opportunities Fund’s inception date is October 17, 2011. The Grandeur Peak Global Reach Fund’s inception date is June 19, 2013. The Grandeur Peak Global Stalwarts Fund’s and Grandeur Peak International Stalwarts Fund’s inception date is September 1, 2015. The Grandeur Peak US Stalwarts Fund’s inception date is March 19, 2020. Each Fund reorganized into the Trust on October 20, 2023.
The Board of Trustees of the Financial Investors Trust held a Special Meeting of the Shareholders of the Funds, each a series of the Financial Investors Trust (the “Predecessor Funds”), on June 14, 2023, for the purpose of approving an Agreement and Plan of Reorganization and Termination, under which all of the assets of the Predecessor Funds were transferred to a correspondingly named series of Grandeur Peak Global Trust. The transfer (a) exchanged your shares of the Predecessor Fund for shares of the corresponding Fund equivalent in value to the outstanding shares of the Predecessor Fund; and (b) each Fund assumed the liabilities of the relevant Predecessor Fund.
The Funds offer Investor Class and Institutional Class shares. The Grandeur Peak Emerging Markets Fund, Grandeur Peak Global Opportunities Fund, Grandeur Peak Global Reach Fund, Grandeur Peak Global Stalwarts Fund, Grandeur Peak International Opportunities Fund and Grandeur Peak International Stalwarts Fund also offer Investor Class shares. All classes of shares for each of the Funds have identical rights to earnings, assets and voting privileges, except for class-specific expenses and exclusive rights to vote on matters affecting only individual classes.
| 2. | SUMMARY OF SIGNIFICANT ACCOUNTING POLICIES |
The following is a summary of significant accounting policies followed by the Funds in preparation of their financial statements. The policies are in conformity with accounting principles generally accepted in the United States of America (“GAAP”). The preparation of the financial statements requires management to make estimates and assumptions that affect the reported amounts of assets and liabilities and disclosure of contingent assets and liabilities at the date of the financial statements and the reported amounts of income and expenses for the year then ended. Actual results could differ from those estimates. Each Fund is an investment company and accordingly follows the investment company accounting and reporting guidance of the Financial Accounting Standards Board (“FASB”) Accounting Standards Codification Topic 946 “Financial Services Investment Companies” including Accounting Standards Update 2013-08.
a. Investment Valuation – The Funds record their investments at fair value. In determining each Fund’s Net Asset Value (“NAV”) per share as of the close of the New York Stock Exchange (“NYSE”), currently 4:00 pm Eastern Time (“ET”) (the “Valuation Time”), securities traded on one or more securities exchanges. for which market quotations are readily available are valued at current market value using the last reported sales price. NASDAQ traded securities are valued using the NASDAQ Official Closing Price (“NOCP”). If no sale price is reported, the mean between the current bid and ask is used. Securities not traded or dealt in on any securities exchange and for which over-the-counter market (whether domestic or foreign) quotations are readily available generally shall be valued at the last sale price or, in the absence of a sale, at the current mean price on such over-the-counter market, (and if there is only a bid or only an ask price on such date, valuation will be at such bid or ask price for long or short positions, respectively).
The value of foreign currencies and of foreign securities whose value is quoted or calculated in a foreign currency shall be converted into US dollars based on foreign exchange rates provided by a major banking institution(s) or currency dealer(s) selected by the pricing agent providing such price, or by the Advisor in the case of securities for which the Advisor provides a fair value determination, at 4:00 pm ET or the nearest time prior to the Valuation Time, at which such foreign currency quotations are available.
The Funds may invest in warrants to participate in an anticipated increase in the market value of the security. A warrant entitles the holder to buy a security at a set price during a set period of time. If such market value increases, the warrant may be exercised and sold at a gain. A loss will be incurred if the market value decreases or if the term of the warrant expires before it is exercised. Warrants convey no rights to dividends or voting. An implied pricing method is used to value the rights.
When such prices or quotations are not available, or when Grandeur Peak Global Advisers, LLC (the “Advisor” or “Grandeur Park”) believes that they are unreliable, securities may be priced using the Trust’s fair value procedures.
109
| Grandeur Peak Funds® | Notes to Financial Statements |
| October 31, 2023 (Unaudited) |
Money market-type instruments that have a remaining maturity of 60 days or less are valued at bid prices from a pricing vendor, unless the Advisor believes another valuation is more appropriate.
Forward currency contracts shall be valued at the forward currency contract rates, determined at 4:00 pm ET or the nearest time prior to the Valuation Time, provided by a bank or dealer that the pricing agent or, if applicable, the Advisor believes to be reliable.
The Funds may hold investments, such as private investments, interests in commodity pools, other non-traded securities or temporarily illiquid securities, for which market quotations are not readily available or are determined to be unreliable. These securities will be valued using the “fair value” procedures approved by the Board. The Board has delegated execution of these procedures to the Adviser as its valuation designee (the “Valuation Designee”). The Board may also enlist third party consultants such a valuation specialist at a public accounting firm, valuation consultant or financial officer of a security issuer on an as-needed basis to assist the Valuation Designee in determining a security-specific fair value. The Board is responsible for reviewing and approving fair value methodologies utilized by the Valuation Designee, which approval shall be based upon whether the Valuation Designee followed the valuation procedures established by the Board.
Fair Valuation Process – The applicable investments are valued by the Valuation Designee pursuant to valuation procedures established by the Board. For example, fair value determinations are required for the following securities: (i) securities for which market quotations are insufficient or not readily available on a particular business day (including securities for which there is a short and temporary lapse in the provision of a price by the regular pricing source); (ii) securities for which, in the judgment of the Valuation Designee, the prices or values available do not represent the fair value of the instrument; factors which may cause the Valuation Designee to make such a judgment include, but are not limited to, the following: only a bid price or an asked price is available; the spread between bid and asked prices is substantial; the frequency of sales; the thinness of the market; the size of reported trades; and actions of the securities markets, such as the suspension or limitation of trading; (iii) securities determined to be illiquid; and (iv) securities with respect to which an event that will affect the value thereof has occurred (a “significant event”) since the closing prices were established on the principal exchange on which they are traded, but prior to a Fund’s calculation of its net asset value. Specifically, interests in commodity pools or managed futures pools are valued on a daily basis by reference to the closing market prices of each futures contract or other asset held by a pool, as adjusted for pool expenses. Restricted or illiquid investments, such as private investments or non-traded securities are valued based upon the current bid for the security from two or more independent dealers or other parties reasonably familiar with the facts and circumstances of the security (who should take into consideration all relevant factors as may be appropriate under the circumstances). If a current bid from such independent dealers or other independent parties is unavailable, the Valuation Designee shall determine, the fair value of such security using the following factors: (i) the type of security; (ii) the cost at date of purchase; (iii) the size and nature of the Fund’s holdings; (iv) the discount from market value of unrestricted securities of the same class at the time of purchase and subsequent thereto; (v) information as to any transactions or offers with respect to the security; (vi) the nature and duration of restrictions on disposition of the security and the existence of any registration rights; (vii) how the yield of the security compares to similar securities of companies of similar or equal creditworthiness; (viii) the level of recent trades of similar or comparable securities; (ix) the liquidity characteristics of the security; (x) current market conditions; and (xi) the market value of any securities into which the security is convertible or exchangeable.
The Funds utilize various methods to measure the fair value of most of their investments on a recurring basis. GAAP establishes a hierarchy that prioritizes inputs to valuation methods. The three levels of input are:
Level 1 – Unadjusted quoted prices in active markets for identical assets and liabilities.
Level 2 – Observable inputs other than quoted prices included in Level 1 that are observable for the asset or liability, either directly or indirectly. These inputs may include quoted prices for the identical instrument on an inactive market, prices for similar instruments, interest rates, prepayment speeds, credit risk, yield curves, default rates and similar data.
Level 3 – Unobservable inputs for the asset or liability, to the extent relevant observable inputs are not available, representing the Funds’ own assumptions about the assumptions a market participant would use in valuing the asset or liability, and would be based on the best information available.
The availability of observable inputs can vary from security to security and is affected by a wide variety of factors, including, for example, the type of security, whether the security is new and not yet established in the marketplace, the liquidity of markets and other characteristics particular to the security. To the extent that valuation is based on models or inputs that are less observable or unobservable in the market, the determination of fair value requires more judgment. Accordingly, the degree of judgment exercised in determining fair value is greatest for instruments categorized in Level 3.
110
| Grandeur Peak Funds® | Notes to Financial Statements |
| October 31, 2023 (Unaudited) |
The inputs used to measure fair value may fall into different levels of the fair value hierarchy. In such cases, for disclosure purposes, the level in the fair value hierarchy within which the fair value measurement falls in its entirety, is determined based on the lowest level input that is significant to the fair value measurement in its entirety. The inputs or methodology used for valuing securities are not necessarily an indication of the risk associated with investing in those securities.
The inputs or methodology used for valuing securities are not necessarily an indication of the risk associated with investing in those securities. The following tables summarize the inputs used for the six months ended as of October 31, 2023, for the Funds’ assets and liabilities measured at fair value:
| Investments in Securities at Value | Level 1 | Level 2 | Level 3 | Total | ||||||||||||
| Grandeur Peak Emerging Markets Opportunities Fund | ||||||||||||||||
| Common Stocks* | $ | 370,476,376 | $ | — | $ | — | $ | 370,476,376 | ||||||||
| Exchange-Traded Funds | 4,265,799 | — | — | 4,265,799 | ||||||||||||
| Total | $ | 374,742,175 | $ | — | $ | — | $ | 374,742,175 | ||||||||
| Investments in Securities at Value | Level 1 | Level 2 | Level 3 | Total | ||||||||||||
| Grandeur Peak Global Contrarian Fund | ||||||||||||||||
| Common Stocks* | $ | 117,972,094 | $ | — | $ | — | $ | 117,972,094 | ||||||||
| Total | $ | 117,972,094 | $ | — | $ | — | $ | 117,972,094 | ||||||||
| Investments in Securities at Value | Level 1 | Level 2 | Level 3 | Total | ||||||||||||
| Grandeur Peak Global Explorer Fund | ||||||||||||||||
| Common Stocks* | $ | 10,658,166 | $ | — | $ | — | $ | 10,658,166 | ||||||||
| Total | $ | 10,658,166 | $ | — | $ | — | $ | 10,658,166 | ||||||||
| Investments in Securities at Value | Level 1 | Level 2 | Level 3 | Total | ||||||||||||
| Grandeur Peak Global Micro Cap Fund | ||||||||||||||||
| Common Stocks* | $ | 38,689,624 | $ | — | $ | — | $ | 38,689,624 | ||||||||
| Total | $ | 38,689,624 | $ | — | $ | — | $ | 38,689,624 | ||||||||
| Investments in Securities at Value | Level 1 | Level 2 | Level 3 | Total | ||||||||||||
| Grandeur Peak Global Opportunities Fund | ||||||||||||||||
| Common Stocks* | $ | 551,609,461 | $ | — | $ | — | $ | 551,609,461 | ||||||||
| Preferred Stocks | — | — | 1,923,136 | 1,923,136 | ||||||||||||
| Total | $ | 551,609,461 | $ | — | $ | 1,923,136 | $ | 553,532,597 | ||||||||
| Investments in Securities at Value | Level 1 | Level 2 | Level 3 | Total | ||||||||||||
| Grandeur Peak Global Reach Fund | ||||||||||||||||
| Common Stocks* | $ | 200,736,966 | $ | — | $ | 786,666 | $ | 201,523,632 | ||||||||
| Preferred Stocks | — | — | 1,892,203 | 1,892,203 | ||||||||||||
| Total | $ | 200,736,966 | $ | — | $ | 2,678,869 | $ | 203,415,835 | ||||||||
| Investments in Securities at Value | Level 1 | Level 2 | Level 3 | Total | ||||||||||||
| Grandeur Peak Global Stalwarts Fund | ||||||||||||||||
| Common Stocks* | $ | 133,860,533 | $ | — | $ | 1,022,666 | $ | 134,883,199 | ||||||||
| Preferred Stocks | — | — | 1,626,979 | 1,626,979 | ||||||||||||
| Total | $ | 133,860,533 | $ | — | $ | 2,649,645 | $ | 136,510,178 | ||||||||
111
| Grandeur Peak Funds® | Notes to Financial Statements |
| October 31, 2023 (Unaudited) |
| Investments in Securities at Value | Level 1 | Level 2 | Level 3 | Total | ||||||||||||
| Grandeur Peak International Opportunities Fund | ||||||||||||||||
| Common Stocks* | $ | 508,339,555 | $ | — | $ | — | $ | 508,339,555 | ||||||||
| Total | $ | 508,339,555 | $ | — | $ | — | $ | 508,339,555 | ||||||||
| Investments in Securities at Value | Level 1 | Level 2 | Level 3 | Total | ||||||||||||
| Grandeur Peak International Stalwarts Fund | ||||||||||||||||
| Common Stocks* | $ | 1,357,118,976 | $ | — | $ | — | $ | 1,357,118,976 | ||||||||
| Total | $ | 1,357,118,976 | $ | — | $ | — | $ | 1,357,118,976 | ||||||||
| Investments in Securities at Value | Level 1 | Level 2 | Level 3 | Total | ||||||||||||
| Grandeur Peak US Stalwarts Fund | ||||||||||||||||
| Common Stocks* | $ | 98,712,199 | $ | — | $ | 550,666 | $ | 99,262,865 | ||||||||
| Preferred Stocks | — | — | 626,088 | 626,088 | ||||||||||||
| Total | $ | 98,712,199 | $ | — | $ | 1,176,754 | $ | 99,888,953 | ||||||||
| * | For a detailed country breakdown, see the accompanying Schedule of Investments. |
The following is a reconciliation of the investments in which significant unobservable inputs (Level 3) were used in determining fair value:
| Grandeur Peak Global Opportunities Fund | Common Stocks | Preferred Stocks | Total | |||||||||
| Balance as of April 30, 2023 | $ | — | $ | 1,923,136 | $ | 1,923,136 | ||||||
| Accrued discount/ premium | — | — | — | |||||||||
| Realized Gain (Loss) | — | — | — | |||||||||
| Change in Unrealized Appreciation (Depreciation) | — | — | — | |||||||||
| Purchases | — | — | — | |||||||||
| Sales Proceeds | — | — | — | |||||||||
| Transfer in/out Level 3 | — | — | — | |||||||||
| Balance as of October 31, 2023 | $ | — | $ | 1,923,136 | $ | 1,923,136 | ||||||
| Net change in unrealized appreciation (depreciation) included in the Statements of Operations attributable to | ||||||||||||
| Level 3 investments held at October 31, 2023 | $ | — | $ | — | $ | — | ||||||
| Grandeur Peak Global Reach Fund | Common Stocks | Preferred Stocks | Total | |||||||||
| Balance as of April 30, 2023 | $ | 786,666 | $ | 1,892,203 | $ | 2,678,869 | ||||||
| Accrued discount/ premium | — | — | — | |||||||||
| Realized Gain (Loss) | — | — | — | |||||||||
| Change in Unrealized Appreciation (Depreciation) | — | — | — | |||||||||
| Purchases | — | — | — | |||||||||
| Sales Proceeds | — | — | — | |||||||||
| Transfer in/out Level 3 | — | — | — | |||||||||
| Balance as of October 31, 2023 | $ | 786,666 | $ | 1,892,203 | $ | 2,678,869 | ||||||
| Net change in unrealized appreciation (depreciation) included in the Statements of Operations attributable to | ||||||||||||
| Level 3 investments held at October 31, 2023 | $ | — | $ | — | $ | — | ||||||
| Grandeur Peak Global Stalwarts Fund | Common Stocks | Preferred Stocks | Total | |||||||||
| Balance as of April 30, 2023 | $ | 1,022,666 | $ | 1,626,979 | $ | 2,649,645 | ||||||
| Accrued discount/ premium | — | — | — | |||||||||
| Realized Gain (Loss) | — | — | — | |||||||||
| Change in Unrealized Appreciation (Depreciation) | — | — | — | |||||||||
| Purchases | — | — | — | |||||||||
| Sales Proceeds | — | — | — | |||||||||
| Transfer in/out Level 3 | — | — | — | |||||||||
| Balance as of October 31, 2023 | $ | 1,022,666 | $ | 1,626,979 | $ | 2,649,645 | ||||||
| Net change in unrealized appreciation/(depreciation) included in the Statements of Operations attributable to | ||||||||||||
| Level 3 investments held at October 31, 2023 | $ | — | $ | — | $ | — | ||||||
112
| Grandeur Peak Funds® | Notes to Financial Statements |
| October 31, 2023 (Unaudited) |
| Grandeur Peak US Stalwarts Fund | Common Stocks | Preferred Stocks | Total | |||||||||
| Balance as of April 30, 2023 | $ | 550,666 | $ | 626,088 | $ | 1,176,754 | ||||||
| Accrued discount/ premium | — | — | — | |||||||||
| Realized Gain (Loss) | — | — | — | |||||||||
| Change in Unrealized Appreciation (Depreciation) | — | — | — | |||||||||
| Purchases | — | — | — | |||||||||
| Sales Proceeds | — | — | — | |||||||||
| Transfer in/out Level 3 | — | — | — | |||||||||
| Balance as of October 31, 2023 | $ | 550,666 | $ | 626,088 | $ | 1,176,754 | ||||||
| Net change in unrealized appreciation (depreciation) included in the Statements of Operations attributable to Level 3 investments held at October 31, 2023 | $ | — | $ | — | $ | — | ||||||
The table below provides additional information about the Level 3 Fair Value Measurements as of October 31, 2023:
Quantitative Information about Level 3 Fair Value Measurements
| Grandeur Peak Global Opportunities Fund | ||||||||||
| Fair Value (USD) at | ||||||||||
| Asset Class | 10/31/23 | Valuation Technique | Unobservable Inputs(a) | Value/Range | ||||||
| Preferred Stocks | $ | 1,923,136 | Market Approach | Enterprise Value-to-Sales Multiple | 4.00x | |||||
| Grandeur Peak Global Reach Fund | ||||||||||
| Fair Value (USD) at | ||||||||||
| Asset Class | 10/31/23 | Valuation Technique | Unobservable Inputs(a) | Value/Range | ||||||
| Common Stocks | $ | 786,666 | Discount/Third Party Valuation | Third-Party Valuation | Discounted Partnership Interest | |||||
| Preferred Stocks | $ | 912,077 | Market Approach | Enterprise Value-to-Sales Multiple | 4.00x | |||||
| Preferred Stocks | $ | 980,126 | Market Approach | Enterprise Value-to-Sales Multiple | 4.80x | |||||
| Grandeur Peak Global Stalwarts Fund | ||||||||||
| Fair Value (USD) at | ||||||||||
| Asset Class | 10/31/23 | Valuation Technique | Unobservable Inputs(a) | Value/Range | ||||||
| Common Stocks | $ | 1,022,666 | Discount/Third Party Valuation | Third-Party Valuation | Discounted Partnership Interest | |||||
| Preferred Stocks | $ | 482,814 | Market Approach | Enterprise Value-to-Sales Multiple | 4.00x | |||||
| Preferred Stocks | $ | 1,144,164 | Market Approach | Enterprise Value-to-Sales Multiple | 4.80x | |||||
| Grandeur Peak US Stalwarts Fund | ||||||||||
| Fair Value (USD) at | ||||||||||
| Asset Class | 10/31/23 | Valuation Technique | Unobservable Inputs(a) | Value/Range | ||||||
| Common Stocks | $ | 550,666 | Discount/Third Party Valuation | Third-Party Valuation | Discounted Partnership Interest | |||||
| Preferred Stocks | $ | 626,088 | Market Approach | Enterprise Value-to-Sales Multiple | 4.80x | |||||
b. Exchange Traded Funds – The Funds may invest in exchange traded funds (“ETFs”). ETFs are a type of fund bought and sold on a securities exchange. An ETF trades like common stock and represents a fixed portfolio of securities. The risks of owning an ETF generally reflect the risks of owning the underlying securities they are designed to track, although the lack of liquidity in an ETF could result in it being more volatile. Additionally, ETFs have fees and expenses that reduce their value.
c. Security Transactions and Related Income – Security transactions are accounted for on a trade date basis. Interest income is recognized on an accrual basis. Discounts are accreted and premiums are amortized on securities purchased over the lives of the respective securities using the effective interest method. Dividend income is recorded on the ex-dividend date. Realized gains or losses from sales of securities are determined by comparing the identified cost of the security lot sold with the net sales proceeds.
113
| Grandeur Peak Funds® | Notes to Financial Statements |
| October 31, 2023 (Unaudited) |
d. Foreign Securities Risk - Investing in securities of foreign issuers and currency transactions may involve certain considerations and risks not typically associated with investments in the United States. These risks include revaluation of currencies, adverse fluctuations in foreign currency values and possible adverse political, social and economic developments, including those particular to a specific industry, country or region. These conditions could cause the securities and their markets to be less liquid and prices more volatile than those of comparable US companies and US government securities.
e. Foreign Currency Translations – The books and records of the Funds are maintained in US dollars. The market values of securities which are not traded in US currency are recorded in the financial statements after translation to US dollars based on the applicable exchange rates at the end of the period. The costs of such securities are translated at exchange rates prevailing when acquired. Related interest, dividends and withholding taxes are accrued at the rates of exchange prevailing on the respective dates of such transactions.
Net realized gains and losses on foreign currency transactions represent net gains and losses from currency realized between the trade and settlement dates on securities transactions and the difference between income accrued versus income received. The effect of changes in foreign currency exchange rates on investments in securities are included with the net realized and unrealized gain or loss on investment securities.
f. Forward Foreign Currency Contracts – As foreign securities are purchased and sold, the Funds may enter into forward foreign currency contracts in order to hedge against foreign currency exchange rate risks. The market value of the contracts fluctuate with changes in currency exchange rates. The contract is marked-to-market daily and the change in market value is recorded by the Funds as an unrealized gain or loss. As foreign securities are sold, a portion of the contract is generally closed and the Funds record a realized gain or loss equal to the difference between the value of the contract at the time it was opened and the value at the time it was closed.
A Fund investing in forward foreign currency contracts is exposed to risk if the value of the currency changes unfavorably, if the counterparties to the contracts are unable to meet the terms of their contracts or if the Fund is unable to enter into a closing position. There were no forward foreign currency contracts outstanding, as of October 31, 2023.
g. Special Purpose Vehicle - The Funds may invest in a Special Purpose Vehicle (a “SPV”). A SPV is a separate legal entity created by an organization. The SPV is a distinct company with its own assets and liabilities, as well as its own legal status. Usually, they are created for a specific objective, often to isolate financial risk. As it is a separate legal entity, if the parent company goes bankrupt, the special purpose vehicle can carry on.
h. Cash Management Transactions – The Funds subscribe to the Brown Brothers Harriman & Co. (“BBH”) Cash Management Service (“CMS”), whereby cash balances are automatically swept into overnight offshore demand deposits with either the BBH Grand Cayman branch or a branch of a pre-approved commercial bank. This fully automated program allows the Funds to earn interest on cash balances. Excess cash with deposit institutions domiciled outside of the U.S. are subject to sovereign actions in the jurisdiction of the deposit institution including, but not limited to, freeze, seizure or diminution. Cash balances in the BBH CMS are included on the Statements of Assets and Liabilities under Cash and Foreign Cash, at Value. As of October 31, 2023, the Funds had the following cash balances participating in the BBH CMS:
| Fund | ||||
| Grandeur Peak Emerging Markets Opportunities Fund | $ | 62,717 | ||
| Grandeur Peak Global Contrarian Fund | 674,067 | |||
| Grandeur Peak Global Explorer Fund | 606 | |||
| Grandeur Peak Global Micro Cap Fund | 278 | |||
| Grandeur Peak Global Opportunities Fund | 381,291 | |||
| Grandeur Peak Global Reach Fund | 9,762 | |||
| Grandeur Peak Global Stalwarts Fund | — | |||
| Grandeur Peak International Opportunities Fund | 338,637 | |||
| Grandeur Peak International Stalwarts Fund | 892,442 | |||
| Grandeur Peak US Stalwarts Fund | 4,635 |
114
| Grandeur Peak Funds® | Notes to Financial Statements |
| October 31, 2023 (Unaudited) |
As of October 31, 2023, the Funds had the following foreign cash balances following foreign Cash balances participating in the BBH CMS (cost and value of foreign cash balances are equal):
| Fund | ||||
| Grandeur Peak Emerging Markets Opportunities Fund | $ | 23,404,173 | ||
| Grandeur Peak Global Contrarian Fund | 1,003,294 | |||
| Grandeur Peak Global Explorer Fund | 154,554 | |||
| Grandeur Peak Global Micro Cap Fund | 69,588 | |||
| Grandeur Peak Global Opportunities Fund | 3,322,693 | |||
| Grandeur Peak Global Reach Fund | 4,969,072 | |||
| Grandeur Peak Global Stalwarts Fund | — | |||
| Grandeur Peak International Opportunities Fund | 8,318,308 | |||
| Grandeur Peak International Stalwarts Fund | 30,364,672 | |||
| Grandeur Peak US Stalwarts Fund | 2,266,861 |
i. Federal Income Taxes – It is each Fund’s policy to continue to comply with all sections of the Internal Revenue Code applicable to regulated investment companies and to distribute all of its taxable income and gains, if any, to its shareholders and therefore, no provision for federal income tax has been made. Each Fund is treated as a separate taxpayer for federal income tax purposes. The Funds recognize the tax benefits of uncertain tax positions only when the position is “more likely than not” to be sustained assuming examination by tax authorities. Management has analyzed the Funds’ tax positions and has concluded that no liability for unrecognized tax benefits should be recorded related to uncertain tax positions taken on returns filed for open tax years of 2021 through 2023, or expected to be taken in the Funds’ April 30, 2024 year-end tax returns. The Funds identify their major tax jurisdiction as US federal, Ohio and foreign jurisdictions where a Fund makes significant investments. No Fund is aware of any tax positions for which it is reasonably possible that the total amounts of unrecognized tax benefits will change materially in the next twelve months. The Funds recognize interest and penalties, if any, related to unrecognized tax benefits as income tax expense in the Statements of Operations. During the six months ended October 31, 2023, the Funds did not incur any interest or penalties.
j. Distributions to Shareholders – It is each Fund’s policy to distribute its respective net investment income and net capital gains, if any, annually. Distributions of net investment income and net capital gains are determined in accordance with income tax regulations which may differ from GAAP. Differences in dividends from net investment income per share between the classes are due to service and distribution related expenses. Dividends and distributions to shareholders are recorded on the ex-date.
k. Class Accounting – Each class represents an interest in the same assets of the Fund and classes are identical except for differences in their sales charge structures, ongoing service fees and distribution charges. All classes of shares of a Fund have equal voting privileges with respect to such Fund except that each class has exclusive voting rights with respect to its service and/or distribution plans. A Fund’s income, expenses (other than class specific distribution and service fees) and realized and unrealized gains and losses are allocated proportionately each day based upon the relative net assets of each class of such Fund.
l. Foreign Taxes – Withholding taxes on foreign dividends have been provided for in accordance with the Trust’s understanding of the applicable country’s tax rules and rates. Each Fund may be subject to foreign taxes (a portion of which may be reclaimable) on income.
m. Indemnification – The Trust indemnifies its officers and the Board for certain liabilities that may arise from the performance of their duties to the Trust. Additionally, in the normal course of business, the Funds enter into contracts that contain a variety of representations and warranties and which provide general indemnities. The Funds’ maximum exposure under these arrangements is unknown, as this would involve future claims that may be made against the Funds that have not yet occurred. However, based on experience, the risk of loss due to these warranties and indemnities appears to be remote.
n. Expenses – Expenses of the Trust that are directly identifiable to a specific fund are charged to that fund. Expenses which are not readily identifiable to a specific fund, are allocated in such a manner as deemed equitable, taking into consideration the nature and type of expense and the relative sizes of the funds in the Trust.
o. Market Risk – The value of each Fund’s portfolio holdings may fluctuate in response to events specific to the companies or markets in which the Fund invests, as well as economic, political, or social events in the United States or abroad. Each Fund is subject to the risk that the securities markets will move down, sometimes rapidly and unpredictably, based on overall economic conditions and other factors, which may negatively affect the Fund’s performance. Securities markets may experience long periods of decline in value.
115
| Grandeur Peak Funds® | Notes to Financial Statements |
| October 31, 2023 (Unaudited) |
Local, state, regional, national or global events such as war, acts of terrorism, the spread of infectious illness or other public health issues, recessions, or other events could have a significant impact on a Fund and its investments and could result in decreases to the Fund’s net asset value. Political, geopolitical, natural and other events, including war, terrorism, trade disputes, government shutdowns, market closures, natural and environmental disasters, climate change and climate-related events, epidemics, pandemics and other public health crises and related events and governments’ reactions to such events have led, and in the future may lead, to economic uncertainty, decreased economic activity, increased market volatility and other disruptive effects on U.S. and global economies and markets. Such events may have significant adverse direct or indirect effects on a Fund and its investments. For example, a widespread health crisis such as a global pandemic could cause substantial market volatility, exchange trading suspensions and closures, impact the ability to complete redemptions, and affect Fund performance. A health crisis may exacerbate other preexisting political, social and economic risks. In addition, the increasing interconnectedness of markets around the world may result in many markets being affected by events or conditions in a single country or region or events affecting a single or small number of issuers.
| 3. | INVESTMENT ADVISORY AGREEMENT AND TRANSACTIONS WITH RELATED PARTIES |
a. Management Fees – The Advisor serves as each Fund’s investment advisor. Pursuant to an investment advisory agreement with the Trust, on behalf of the Funds, the Advisor, subject to the oversight of the Board and in conformity with the stated policies of the Funds, manages all business activities of the Funds. As compensation for its services, each Fund pays the Advisor an annual management fee based on each Fund’s average daily net assets, accrued daily and paid monthly. The following table reflects the Funds’ Advisory fee rates.
| Fund | Advisory Fee | |
| Grandeur Peak Emerging Markets Opportunities Fund | 1.35% | |
| Grandeur Peak Global Contrarian Fund | 1.00% | |
| Grandeur Peak Global Explorer Fund | 1.10% | |
| Grandeur Peak Global Micro Cap Fund | 1.50% | |
| Grandeur Peak Global Opportunities Fund | 1.25% | |
| Grandeur Peak Global Reach Fund | 1.10% | |
| Grandeur Peak Global Stalwarts Fund | 0.80% | |
| Grandeur Peak International Opportunities Fund | 1.25% | |
| Grandeur Peak International Stalwarts Fund | 0.80% | |
| Grandeur Peak US Stalwarts Fund | 0.75% |
116
| Grandeur Peak Funds® | Notes to Financial Statements |
| October 31, 2023 (Unaudited) |
Pursuant to an operating expense limitation agreement between the Advisor and the Trust, the Advisor has agreed to waive its fees and/or expenses for each Fund to the extent necessary to maintain each Fund’s Total Annual Fund Operating Expenses (excluding any front-end or contingent deferred loads, brokerage fees and commissions, acquired fund fees and expenses, borrowing costs (such as interest and dividend expense on securities sold short), taxes, and extraordinary expenses, such as litigation expenses (which may increase indemnification of the Funds’ officers and trustees, contractual indemnification of the Fund’s service providers (other than the Advisor))) at a certain level through October 6, 2024. This operating expense limitation agreement can be terminated only by, or with the consent of, the Board. The Advisor is permitted to receive reimbursement from a Fund for fees it waived and Fund expenses it paid, subject to the limitation that: (1) the reimbursement for fees and expenses will be made only if payable within three years from the date the fees and expenses were initially waived or paid; and (2) the reimbursement may not be made if it would cause the expense limitation currently in effect or in effect at the time of the waiver or payment, whichever is lower, to be exceeded. The following table reflects the Funds’ expense cap.
| Fund | Expense Cap | |
| Grandeur Peak Emerging Markets Opportunities Fund | ||
| Investor Class | 1.95% | |
| Institutional Class | 1.70% | |
| Grandeur Peak Global Contrarian Fund | ||
| Institutional Class | 1.35% | |
| Grandeur Peak Global Explorer Fund | ||
| Institutional Class | 1.25% | |
| Grandeur Peak Global Micro Cap Fund | ||
| Institutional Class | 2.00% | |
| Grandeur Peak Global Opportunities Fund | ||
| Investor Class | 1.75% | |
| Institutional Class | 1.50% | |
| Grandeur Peak Global Reach Fund | ||
| Investor Class | 1.50% | |
| Institutional Class | 1.25% | |
| Grandeur Peak Global Stalwarts Fund | ||
| Investor Class | 1.35% | |
| Institutional Class | 1.10% | |
| Grandeur Peak International Opportunities Fund | ||
| Investor Class | 1.75% | |
| Institutional Class | 1.50% | |
| Grandeur Peak International Stalwarts Fund | ||
| Investor Class | 1.35% | |
| Institutional Class | 1.10% | |
| Grandeur Peak US Stalwarts Fund | ||
| Institutional Class | 1.00% |
In addition to the foregoing contractual arrangements, the Advisor has contractually agreed to waive, with respect to the Grandeur Peak Global Opportunities Fund and the Grandeur Peak International Opportunities Fund, annual management fees to the extent such fees exceed 1.00% on assets above $500 million (the annual management fee rate with respect to such funds will remain 1.25% on the first $500 million in assets). Additionally, the Advisor with respect to the Grandeur Peak Emerging Markets Opportunities Fund, annual management fees to the extent such fees exceed 1.00% on all assets above $400 million (the annual management fee rate with respect to the Fund will remain 1.35% on the first $400 million in assets). Previously, the Adviser had voluntarily agreed, effective January 1, 2018, to waive, with respect to the Grandeur Peak Emerging Markets Opportunities Fund, annual management fees to the extent such fees exceed 1.20% on all assets above $400 million (the annual management fee rate with respect to the Fund will remain 1.35% on the first $400 million in assets). These additional contractual waivers are not subject to recoupment by the Advisor. Additional fees waived by the Advisor for the six months ended October 31, 2023 are disclosed in the Statements of Operations.
117
| Grandeur Peak Funds® | Notes to Financial Statements |
| October 31, 2023 (Unaudited) |
For the six months ended October 31, 2023, the fee waivers/reimbursements and/or recoupments were as follows:
| Fees | Recoupment of | |||||||
| Waived/Reimbursed By | Previously Waived Fees | |||||||
| Fund | Advisor | by Advisor | ||||||
| Grandeur Peak Emerging Markets Opportunities Fund | $ | 74,601 | $ | — | ||||
| Grandeur Peak Global Contrarian Fund | — | 45,374 | ||||||
| Grandeur Peak Global Explorer Fund | 197,205 | — | ||||||
| Grandeur Peak Global Micro Cap Fund | 778 | — | ||||||
| Grandeur Peak Global Opportunities Fund | 186,587 | — | ||||||
| Grandeur Peak Global Reach Fund | 61,796 | — | ||||||
| Grandeur Peak Global Stalwarts Fund | — | — | ||||||
| Grandeur Peak International Opportunities Fund | 125,722 | — | ||||||
| Grandeur Peak International Stalwarts Fund | — | — | ||||||
| Grandeur Peak US Stalwarts Fund | — | — | ||||||
As of October 31, 2023, the Advisor has waived/reimbursed expenses that may be recovered no later than April 30 of the years indicated below:
| Fund | Expires 2024 | Expires 2025 | Expires 2026 | Total | ||||||||||||
| Grandeur Peak Emerging Markets Opportunities Fund | $ | — | $ | — | $ | — | $ | — | ||||||||
| Grandeur Peak Global Contrarian Fund | 109,006 | 40,900 | — | 149,906 | ||||||||||||
| Grandeur Peak Global Explorer Fund | — | 39,713 | 280,910 | 320,623 | ||||||||||||
| Grandeur Peak Global Micro Cap Fund | — | — | — | — | ||||||||||||
| Grandeur Peak Global Opportunities Fund | — | — | — | — | ||||||||||||
| Grandeur Peak Global Reach Fund | — | 49,396 | 28,389 | 77,785 | ||||||||||||
| Grandeur Peak Global Stalwarts Fund | — | — | — | — | ||||||||||||
| Grandeur Peak International Opportunities Fund | — | — | — | — | ||||||||||||
| Grandeur Peak International Stalwarts Fund | — | — | — | — | ||||||||||||
| Grandeur Peak US Stalwarts Fund | 625 | — | — | 625 | ||||||||||||
Each Fund was reorganized on October 20, 2023 from a series of Financial Investors Trust to a series of Grandeur Peak Global Trust (the “Reorganizations”). Prior to the Reorganizations, the Funds had advisory and expense limitation agreements with Financial Investors Trust. The fees charged to the Funds did not change as a result of the Reorganizations and the amounts waived by the predecessor funds are still subject to recapture by the Advisor.
b. Distributor – The Distributor of the Funds is Northern Lights Distributors, LLC (the “Distributor”). The Trust has adopted, with respect to the Funds, the Trust’s Master Distribution and Shareholder Servicing Plan for the Funds’ Investor Class shares (the “Plan”) pursuant to Rule 12b-1 under the 1940 Act, to pay for certain distribution activities and shareholder services. The Plan provides a monthly service and/or distribution fee that is calculated at an annual rate of 0.25% per year of the average daily net assets of each Fund’s Investor Class shares and paid to the Distributor to be used to pay for distribution and shareholder servicing activities. Prior to October 20, 2023, ALPS Distributors, Inc. (“ADI”) acted as the distributor of the Funds’ shares pursuant to a Distribution Agreement with the Financial Investors Trust. ADI is not entitled to any compensation for its services as Distributor. ADI is registered as a broker-dealer with the U.S. Securities and Exchange Commission. The following table reflects the Funds incurred distribution fees for the six months ended October 31, 2023.
| Fund | Distribution Fees | |||
| Grandeur Peak Emerging Markets Opportunities Fund | $ | 10,757 | ||
| Grandeur Peak Global Contrarian Fund | — | |||
| Grandeur Peak Global Explorer Fund | — | |||
| Grandeur Peak Global Micro Cap Fund | — | |||
| Grandeur Peak Global Opportunities Fund | 80,731 | |||
| Grandeur Peak Global Reach Fund | 33,565 | |||
| Grandeur Peak Global Stalwarts Fund | 33,871 | |||
| Grandeur Peak International Opportunities Fund | 32,657 | |||
| Grandeur Peak International Stalwarts Fund | 34,369 | |||
| Grandeur Peak US Stalwarts Fund | — | |||
118
| Grandeur Peak Funds® | Notes to Financial Statements |
| October 31, 2023 (Unaudited) |
c. Administration, Fund Accounting and Transfer Agency Fees
Administrator Fees and Expenses
Ultimus Fund Solutions, LLC (“UFS”) – UFS, an affiliate of the Distributor, provides administration, fund accounting, and transfer agent services to the Trust. Pursuant to a separate servicing agreement with UFS, the Funds pays UFS customary fees for providing administration, fund accounting and transfer agency services to the Funds. Certain officers of the Trust are also officers of UFS and are not paid any fees directly by the Funds for serving in such capacities. Prior to October 20, 2023, ALPS Fund Services, Inc. (“ALPS”) served as administrator to the Funds providing operational services to the Funds including, but not limited to, fund accounting, fund administration and transfer agency and generally assists in the Funds’ operations.
Compliance Services
Northern Lights Compliance Services, LLC (“NLCS”) – NLCS, an affiliate of UFS and the Distributor, provides a Chief Compliance Officer to the Trust, as well as related compliance services, pursuant to a consulting agreement between NLCS and the Trust. Under the terms of such agreement, NLCS receives customary fees from the Funds. Prior to October 20, 2023, ALPS provides services that assist the Trust’s chief compliance officer in monitoring and testing the policies and procedures of the Trust in conjunction with requirements under Rule 38a-1 under the 1940 Act and received an annual base fee. ALPS was reimbursed for certain out-of-pocket expenses by the Funds.
Printing Services
BluGiant, LLC (“BluGiant”) – BluGiant, an affiliate of management services for the Funds on an ad-hoc basis. UFS and the Distributor, provides EDGAR conversion and filing services as well as print For the provision of these services, BluGiant receives customary fees from the Funds.
| 4. | INVESTMENT TRANSACTIONS |
The cost of purchases and the proceeds from sales of investments, other than short-term investments, for the six months ended October 31, 2023 were as follows:
| Proceeds From Sales of | ||||||||
| Fund | Purchases of Securities | Securities | ||||||
| Grandeur Peak Emerging Markets Opportunities Fund | $ | 111,362,813 | $ | 121,353,379 | ||||
| Grandeur Peak Global Contrarian Fund | 45,194,374 | 33,615,987 | ||||||
| Grandeur Peak Global Explorer Fund | 2,403,660 | 2,788,563 | ||||||
| Grandeur Peak Global Micro Cap Fund | 7,001,051 | 9,883,608 | ||||||
| Grandeur Peak Global Opportunities Fund | 102,044,949 | 129,470,801 | ||||||
| Grandeur Peak Global Reach Fund | 48,791,973 | 77,027,863 | ||||||
| Grandeur Peak Global Stalwarts Fund | 48,213,198 | 89,106,965 | ||||||
| Grandeur Peak International Opportunities Fund | 92,537,799 | 107,318,795 | ||||||
| Grandeur Peak International Stalwarts Fund | 455,349,262 | 525,264,954 | ||||||
| Grandeur Peak US Stalwarts Fund | 37,544,449 | 35,236,429 | ||||||
| 5. | SHARES OF BENEFICIAL INTEREST |
The capitalization of the Trust consists of an unlimited number of shares of beneficial interest with no par value per share. Holders of the shares of the Funds of the Trust have one vote for each share held and a proportionate fraction of a vote for each fractional share. All shares issued and outstanding are fully paid and are transferable and redeemable at the option of the shareholder. Purchasers of the share do not have any obligation to make payments to the Trust or its creditors solely by reason of the purchasers’ ownership of the shares. Shares have no pre-emptive rights.
Shares redeemed within 60 days of purchase may incur a 2% short-term redemption fee deducted from the redemption amount. For the six months ended October 31, 2023, the redemption fees charged by the Funds are presented in the Statement of Changes in Net Assets.
119
| Grandeur Peak Funds® | Notes to Financial Statements |
| October 31, 2023 (Unaudited) |
| 6. | DISTRIBUTIONS AND TAX COMPONENTS OF CAPITAL |
The Statement of Assets and Liabilities represents cost for financial reporting purposes. The aggregate cost for federal tax purposes is listed in the table below and differs from market value by net unrealized appreciation (depreciation) which consisted of:
| Aggregate Cost for | Net Unrealized | |||||||||||||||
| Federal Tax | Gross Unrealized | Gross Unrealized | Appreciation/ | |||||||||||||
| Fund | Purposes | Appreciation | Depreciation | (Depreciation) | ||||||||||||
| Grandeur Peak Emerging Markets Opportunities Fund | $ | 359,353,855 | $ | 57,589,726 | $ | (42,201,406 | ) | $ | 15,388,320 | |||||||
| Grandeur Peak Global Contrarian Fund | 129,781,525 | 7,735,128 | (19,544,559 | ) | (11,809,431 | ) | ||||||||||
| Grandeur Peak Global Explorer Fund | 12,863,024 | 532,987 | (2,737,845 | ) | (2,204,858 | ) | ||||||||||
| Grandeur Peak Global Micro Cap Fund | 41,262,939 | 5,386,410 | (7,959,725 | ) | (2,573,315 | ) | ||||||||||
| Grandeur Peak Global Opportunities Fund | 540,867,975 | 96,878,380 | (84,213,758 | ) | 12,664,622 | |||||||||||
| Grandeur Peak Global Reach Fund | 201,221,509 | 35,583,323 | (33,388,997 | ) | 2,194,326 | |||||||||||
| Grandeur Peak Global Stalwarts Fund | 137,350,079 | 19,922,287 | (20,762,188 | ) | (839,901 | ) | ||||||||||
| Grandeur Peak International Opportunities Fund | 521,778,848 | 73,538,121 | (86,977,414 | ) | (13,439,293 | ) | ||||||||||
| Grandeur Peak International Stalwarts Fund | 1,422,585,650 | 138,163,413 | (203,630,087 | ) | (65,466,674 | ) | ||||||||||
| Grandeur Peak US Stalwarts Fund | 104,110,333 | 9,892,218 | (14,113,598 | ) | (4,221,380 | ) | ||||||||||
Reclassifications: As of April 30, 2023, permanent differences in book and tax accounting were reclassified. These differences had no effect on net assets and are primarily attributed to tax equalization. The reclassifications were as follows:
| Distributable | ||||||||
| Fund | Paid-in Capital | Earnings | ||||||
| Grandeur Peak Emerging Markets Opportunities Fund | $ | 95,417 | $ | (95,417 | ) | |||
| Grandeur Peak Global Contrarian Fund | — | — | ||||||
| Grandeur Peak Global Explorer Fund | — | — | ||||||
| Grandeur Peak Global Micro Cap Fund | (70,275 | ) | 70,275 | |||||
| Grandeur Peak Global Opportunities Fund | — | — | ||||||
| Grandeur Peak Global Reach Fund | (11,291 | ) | 11,291 | |||||
| Grandeur Peak Global Stalwarts Fund | (144,252 | ) | 144,252 | |||||
| Grandeur Peak International Opportunities Fund | — | — | ||||||
| Grandeur Peak International Stalwarts Fund | — | — | ||||||
| Grandeur Peak US Stalwarts Fund | (185,212 | ) | 185,212 | |||||
120
| Grandeur Peak Funds® | Notes to Financial Statements |
| October 31, 2023 (Unaudited) |
Components of Earnings: As of April 30, 2023, components of distributable earnings on a tax basis were as follows:
| Net Unrealized | ||||||||||||||||||||
| Appreciation/ | ||||||||||||||||||||
| Accumulated | Other | (Depreciation) on | Total | |||||||||||||||||
| Undistributed | Capital | Accumulated | Investments and | Distributable | ||||||||||||||||
| Fund | Ordinary Income | Gains/(Losses) | Gain/(Loss) | Foreign Currency | Earnings | |||||||||||||||
| Grandeur Peak Emerging | ||||||||||||||||||||
| Markets Opportunities Fund | $ | — | $ | 8,794,327 | $ | 1,529,448 | $ | 48,443,800 | $ | 58,767,575 | ||||||||||
| Grandeur Peak Global Contrarian Fund | 1,000,254 | (11,020,894 | ) | — | (530,950 | ) | (10,551,590 | ) | ||||||||||||
| Grandeur Peak Global Explorer Fund | 24,088 | (1,500,267 | ) | — | (1,247,469 | ) | (2,723,648 | ) | ||||||||||||
| Grandeur Peak Global Micro Cap Fund | — | (2,688,892 | ) | (46,560 | ) | 2,133,964 | (601,488 | ) | ||||||||||||
| Grandeur Peak Global Opportunities Fund | 901,833 | (33,747,224 | ) | — | 118,082,553 | 85,237,162 | ||||||||||||||
| Grandeur Peak Global Reach Fund | — | (11,004,017 | ) | — | 34,188,904 | 23,184,887 | ||||||||||||||
| Grandeur Peak Global Stalwarts Fund | — | (37,871,516 | ) | (21,353 | ) | 16,456,396 | (21,436,473 | ) | ||||||||||||
| Grandeur Peak International Opportunities Fund | 714,729 | (18,895,819 | ) | — | 97,339,509 | 79,158,419 | ||||||||||||||
| Grandeur Peak International Stalwarts Fund | 2,842,788 | (79,373,810 | ) | — | 167,474,266 | 90,943,244 | ||||||||||||||
| Grandeur Peak US Stalwarts Fund | — | (30,273,474 | ) | (78,540 | ) | (1,570,587 | ) | (31,922,601 | ) | |||||||||||
Tax Basis of Distributions to Shareholders: The character of distributions made during the year from net investment income or net realized gains may differ from its ultimate characterization for federal income tax purposes. Also, due to the timing of dividend distributions, the fiscal year in which amounts are distributed may differ from the fiscal year in which the income or realized gain were recorded by the Funds.
The tax character of distributions paid by the Funds for the year ended April 30, 2023 were as follows:
| Long-Term Capital | ||||||||||||
| Fund | Ordinary Income | Gain | Return of Capital | |||||||||
| Grandeur Peak Emerging Markets Opportunities Fund | $ | 926,920 | $ | 316,164 | $ | — | ||||||
| Grandeur Peak Global Contrarian Fund | 1,928,652 | 574,678 | — | |||||||||
| Grandeur Peak Global Explorer Fund | 24,043 | — | — | |||||||||
| Grandeur Peak Global Micro Cap Fund | — | — | — | |||||||||
| Grandeur Peak Global Opportunities Fund | 691,880 | 10,505,369 | — | |||||||||
| Grandeur Peak Global Reach Fund | 128,741 | — | — | |||||||||
| Grandeur Peak Global Stalwarts Fund | — | — | 323,040 | |||||||||
| Grandeur Peak International Opportunities Fund | 1,295,306 | — | — | |||||||||
| Grandeur Peak International Stalwarts Fund | 3,960,284 | — | — | |||||||||
| Grandeur Peak US Stalwarts Fund | 13,503 | — | — | |||||||||
121
| Grandeur Peak Funds® | Notes to Financial Statements |
| October 31, 2023 (Unaudited) |
The tax character of distributions paid by the Funds for the year ended April 30, 2022 were as follows:
| Long-Term Capital | ||||||||||||
| Fund | Ordinary Income | Gain | Return of Capital | |||||||||
| Grandeur Peak Emerging Markets Opportunities Fund | $ | 726,332 | $ | 68,462,853 | $ | 549,374 | ||||||
| Grandeur Peak Global Contrarian Fund | 3,862,022 | 1,773,223 | — | |||||||||
| Grandeur Peak Global Explorer Fund | — | — | — | |||||||||
| Grandeur Peak Global Micro Cap Fund | 805,398 | 8,908,310 | — | |||||||||
| Grandeur Peak Global Opportunities Fund | 13,505,418 | 162,339,284 | — | |||||||||
| Grandeur Peak Global Reach Fund | 5,530,237 | 52,203,184 | — | |||||||||
| Grandeur Peak Global Stalwarts Fund | 4,870,113 | 39,430,293 | — | |||||||||
| Grandeur Peak International Opportunities Fund | 12,992,299 | 108,524,120 | — | |||||||||
| Grandeur Peak International Stalwarts Fund | 2,961,918 | 178,478,056 | — | |||||||||
| Grandeur Peak US Stalwarts Fund | 1,608,892 | 1,295,457 | — | |||||||||
Under current law, capital losses maintain their character as short-term or long-term and are carried forward to the next tax year without expiration. As of the current fiscal year end, the following amounts are available as carry forwards to the next tax year:
| Fund | Capital Losses Recognized | |||
| Grandeur Peak Emerging Markets Opportunities Fund | $ | — | ||
| Grandeur Peak Global Contrarian Fund | 9,449,037 | |||
| Grandeur Peak Global Explorer Fund | 650,311 | |||
| Grandeur Peak Global Micro Cap Fund | 2,688,892 | |||
| Grandeur Peak Global Opportunities Fund | 12,234,886 | |||
| Grandeur Peak Global Reach Fund | 7,965,844 | |||
| Grandeur Peak Global Stalwarts Fund | 25,545,628 | |||
| Grandeur Peak International Opportunities Fund | 10,966,568 | |||
| Grandeur Peak International Stalwarts Fund | 59,952,517 | |||
| Grandeur Peak US Stalwarts Fund | 17,249,892 | |||
The Funds elect to defer to the period ending April 30, 2024, capital losses recognized during the period 11/1/2022 - 04/30/2023 in the amount of:
| Fund | Capital Losses Recognized | |||
| Grandeur Peak Emerging Markets Opportunities Fund | $ | — | ||
| Grandeur Peak Global Contrarian Fund | 1,571,857 | |||
| Grandeur Peak Global Explorer Fund | 849,956 | |||
| Grandeur Peak Global Micro Cap Fund | 46,560 | |||
| Grandeur Peak Global Opportunities Fund | 21,512,338 | |||
| Grandeur Peak Global Reach Fund | 3,038,173 | |||
| Grandeur Peak Global Stalwarts Fund | 12,325,888 | |||
| Grandeur Peak International Opportunities Fund | 7,929,251 | |||
| Grandeur Peak International Stalwarts Fund | 19,421,293 | |||
| Grandeur Peak US Stalwarts Fund | 13,023,582 | |||
122
| Grandeur Peak Funds® | Notes to Financial Statements |
| October 31, 2023 (Unaudited) |
The following Funds elect to defer to the period ending April 30, 2024, late year ordinary losses in the amount of:
| Fund | Capital Losses Recognized | |||
| Grandeur Peak Emerging Markets Opportunities Fund | $ | — | ||
| Grandeur Peak Global Contrarian Fund | — | |||
| Grandeur Peak Global Explorer Fund | — | |||
| Grandeur Peak Global Micro Cap Fund | 46,560 | |||
| Grandeur Peak Global Opportunities Fund | 257,734 | |||
| Grandeur Peak Global Reach Fund | — | |||
| Grandeur Peak Global Stalwarts Fund | 21,353 | |||
| Grandeur Peak International Opportunities Fund | — | |||
| Grandeur Peak International Stalwarts Fund | — | |||
| Grandeur Peak US Stalwarts Fund | 78,540 | |||
| 7. | CONTROL OWNERSHIP |
The beneficial ownership, either directly or indirectly, of 25% or more of the outstanding shares of a fund creates a presumption of control of the fund under Section 2(a)(9) of the 1940 Act. Such control may affect the voting rights of other shareholders. The following table provides the name and address of any person who owns of record or beneficially 5% or more of the outstanding shares of each class of the Fund as of October 31, 2023:
| Fund | Shareholder Name | Percentage of Interest | ||
| Grandeur Peak Emerging Markets Opportunities Fund | National Financial Services, LLC | 34.5% | ||
| Charles Schwab & Co. Inc. | 21.0% | |||
| Grandeur Peak Global Contrarian Fund | Charles Schwab & Co. Inc. | 53.6% | ||
| National Financial Services, LLC | 25.3% | |||
| Grandeur Peak Global Explorer Fund | Grandeur Peak Global Advisors, LLC | 31.7% | ||
| Charles Schwab & Co. Inc. | 31.1% | |||
| Grandeur Peak Global Micro Cap Fund | Charles Schwab & Co. Inc. | 25.5% | ||
| Grandeur Peak Global Opportunities Fund | Charles Schwab & Co. Inc. | 43.1% | ||
| Grandeur Peak Global Reach Fund | Charles Schwab & Co. Inc. | 31.2% | ||
| Grandeur Peak Global Stalwarts Fund | National Financial Services, LLC | 38.1% | ||
| Charles Schwab & Co. Inc. | 32.2% | |||
| Grandeur Peak International Opportunities Fund | National Financial Services, LLC | 28.5% | ||
| Grandeur Peak US Stalwarts Fund | Charles Schwab & Co. Inc. | 54.4% | ||
| Saxon & co. | 33.9% |
| 8. | RECENT REGULATORY UPDATES |
On January 24, 2023, the SEC adopted rule and form amendments to require mutual funds and ETFs to transmit concise and visually engaging streamlined annual and semiannual reports to shareholders that highlight key information. Other information, including financial statements, will not appear in a streamlined shareholder report but must be available online, delivered free of charge upon request, and filed on a semiannual basis on Form N-CSR. The rule and form amendments have a compliance date of July 24, 2024. At this time, management is evaluating the impact of these amendments on the shareholder reports for the Funds.
| 9. | SUBSEQUENT EVENTS |
Subsequent events after the date of the Statements of Assets and Liabilities have been evaluated through the date the financial statements were issued. Management has determined that no events or transactions occurred requiring adjustment or disclosure in the financial statements.
123
| Grandeur Peak Funds® | Disclosure Regarding Approval |
| of Fund Advisory Agreement | |
| October 31, 2023 (Unaudited) |
Approval of Advisory Agreement – Grandeur Peak Emerging Markets Opportunities Fund, Grandeur Peak Global Contrarian Fund, Grandeur Peak Global Micro Cap Fund, Grandeur Peak Global Opportunities Fund, Grandeur Peak Global Reach Fund, Grandeur Peak Global Stalwarts Fund, Grandeur Peak International Opportunities Fund, Grandeur Peak International Stalwarts Fund, Grandeur Peak US Stalwarts Fund, and Grandeur Peak Global Explorer Fund*
In connection with a meeting held on February 23, 2023, the Board, including a majority of the Trustees who are not “interested persons,” as that term is defined in the 1940 Act, discussed the approval of the proposed investment advisory agreement (the “Advisory Agreement”) between the Adviser and the Trust, with respect to each of the Grandeur Peak Emerging Markets Opportunities Fund (“Emerging Markets”), Grandeur Peak Global Contrarian Fund (“Global Contrarian”), Grandeur Peak Global Micro Cap Fund (“Global Micro Cap”), Grandeur Peak Global Opportunities Fund (“Global Opportunities”), Grandeur Peak Global Reach Fund (“Global Reach”), Grandeur Peak Global Stalwarts Fund (“Global Stalwarts”), Grandeur Peak International Opportunities Fund (“International Opportunities”), Grandeur Peak International Stalwarts Fund (“International Stalwarts”), Grandeur Peak US Stalwarts Fund (“US Stalwarts”), and Grandeur Peak Global Explorer Fund (“Global Explorer”) (collectively, the “Funds”). In considering the approval of the Advisory Agreement, the Board received materials specifically relating to the Funds and the Advisory Agreement.
The Board relied upon the advice of counsel and its own business judgment in determining the material factors to be considered in evaluating the Advisory Agreement and the weight to be given to each such factor. The Board’s conclusions were based on a comprehensive evaluation of all of the information provided and were not the result of any one factor. Moreover, each Trustee might have afforded different weight to the various factors in reaching his or her conclusions with respect to the approval of the Advisory Agreement.
Nature, Extent and Quality of Service. The Board observed that the Adviser was founded in 2011 and managed approximately $6.2 billion in assets as of December 31, 2022. The Board reviewed the background information of the key investment professionals that would service the Funds and noted their educational backgrounds, years of financial industry experience, and broad investment backgrounds. The Board discussed that the Adviser’s investment process was highly fundamental and involved independent research that relied on proprietary screens, hands-on evaluations, earnings growth modeling, and other information derived from in-person meetings with portfolio companies’ management personnel. The Board observed that the Adviser ultimately strived to identify high quality growth companies with long term potential and invest in those companies at prices it believed to be appropriate based on the information gathered through its research. The Board acknowledged that the Adviser maintained a risk committee responsible for monitoring and assessing firmwide risk. The Board discussed that the Adviser utilized various pre- and post-trade compliance checklists to ensure compliance with investment restrictions and portfolio guidelines. The Board observed that the Adviser had a cross-functional pricing committee to conduct valuations for any securities that may require fair value pricing. The Board acknowledged that the Adviser selected broker-dealers on the basis of best execution, noting that best execution required the consideration of the full range and quality of a broker’s services. The Board noted that the Adviser represented that it had no material regulatory, compliance or litigation issues over the past 36 months. After further discussion, the Board agreed that the Adviser had the resources necessary to provide quality service to each Fund.
124
| Grandeur Peak Funds® | Disclosure Regarding Approval |
| of Fund Advisory Agreement | |
| October 31, 2023 (Unaudited) |
Performance.
Emerging Markets—The Board reviewed the performance information regarding the predecessor fund of Emerging Markets. The Board acknowledged that the predecessor fund was a 4-star Morningstar rated fund that outperformed its peer group, Morningstar category and benchmark over the 5-year and since inception periods. The Board observed that the predecessor fund underperformed its peer group, Morningstar category and benchmark over the 1-year period. The Board recalled that the Adviser attributed underperformance to a focus on growth, quality, and small-cap stocks which were out of favor in 2022. The Board further noted that the predecessor fund outperformed its peer group and Morningstar category over the 3-year period and performed on par with its benchmark over the same period. The Board concluded that the Adviser could be expected to provide satisfactory performance for Emerging Markets.
Global Contrarian—The Board reviewed the performance information regarding the predecessor fund to Global Contrarian. The Board acknowledged that the predecessor fund was a 4-star Morningstar rated fund and outperformed its Morningstar category, peer group, and the MSCI ACWI Small Cap Index across all periods. The Board also considered the performance of the MSCI ACWI Small Cap Value Index compared to that of the Fund. The Board concluded that the Adviser could be expected to provide satisfactory performance for Global Contrarian.
Global Micro Cap—The Board reviewed the performance information regarding the predecessor fund to Global Micro Cap. The Board acknowledged that the predecessor fund was a 5-star Morningstar rated fund and outperformed its peer group over the 1-year period but underperformed its benchmark and Morningstar category over the same period. The Board recalled that the Adviser attributed underperformance to its focus on growth, quality, and small cap stocks which were out of favor in 2022 compared to its peer funds that used different investment styles. The Board acknowledged that the predecessor fund outperformed its peer group, Morningstar category and benchmark across all other periods. The Board concluded that the Adviser could be expected to provide satisfactory performance for Global Micro Cap.
Global Opportunities—The Board reviewed the performance information regarding the predecessor fund and Global Opportunities. The Board acknowledged that the predecessor fund was a 4-star Morningstar rated fund and underperformed its peer group, Morningstar category and benchmark over the 1-year period but outperformed each across all other periods. The Board recalled the Adviser’s position that the market shift from growth stocks to value stocks was the largest detractor from performance in 2022. The Board concluded that the Adviser could be expected to provide satisfactory performance for Global Opportunities.
Global Reach—The Board reviewed the performance information regarding the predecessor fund to Global Reach. The Board observed that the predecessor fund was a 3-star Morningstar rated fund. The Board noted that the predecessor fund underperformed its peer group, Morningstar category, and benchmark over the 1-year period. The Board noted that the predecessor fund outperformed its Morningstar category and benchmark over the 3-year period and performed on par with its peer group over the same period. The Board further noted that the predecessor fund outperformed its Morningstar category and benchmark over the 5-year period but underperformed its peer group over the same period. The Board observed that the predecessor fund outperformed its peer group, Morningstar category and benchmark over the since inception period. The Board recalled the Adviser’s position that the market shift from growth stocks to value stocks was the largest detractor from performance in 2022. The Board concluded that the Adviser could be expected to provide satisfactory performance for Global Reach.
125
| Grandeur Peak Funds® | Disclosure Regarding Approval |
| of Fund Advisory Agreement | |
| October 31, 2023 (Unaudited) |
Global Stalwarts—The Board reviewed the performance information regarding the predecessor fund to Global Stalwarts. The Board observed that the predecessor fund was a 3-star Morningstar rated fund. The Board noted that the predecessor fund underperformed its peer group, Morningstar category, and benchmark over the 1-year, 3-year, and 5-year periods. The Board observed that the predecessor fund outperformed its Morningstar category, peer group, and benchmark over the since inception period. The Board recalled the Adviser’s position that the market shift from growth stocks to value stocks was the largest detractor from performance in 2022 and that the predecessor fund performed worse than other funds due to its stronger bent towards quality stocks. The Board concluded that the Adviser could be expected to provide satisfactory performance for Global Stalwarts over a full market cycle.
International Opportunities— The Board reviewed the performance information regarding the predecessor fund to International Opportunities. The Board observed that the predecessor fund was a 4-star Morningstar rated fund. The Board noted that the predecessor fund underperformed its peer group, Morningstar category, and the MSCI ACWI Small GR Index over the 1-year period. The Board observed that the predecessor fund outperformed its peer group and Morningstar category over the 3-year and 5-year periods but underperformed the MSCI ACWI Small GR Index over the same periods. The Board observed that the predecessor fund outperformed its Morningstar category, peer group, and the MSCI ACWI Small GR Index over the since inception period. The Board also considered that the Adviser provided data showing the predecessor fund underperformed the MSCI ACWI ex-USA Small Cap Index over the 1-year period but outperformed the index across all other periods. The Board discussed the Adviser’s view that the MSCI ACWI ex-USA Small Cap Index was a better comparison to International Opportunities because the predecessor fund invested primarily in small- and micro-cap companies economically tied to countries outside the United States, and under normal market conditions, these companies will be tied to at least five of the countries included in the MSCI ACWI ex-USA Small Cap Index. The Board recalled the Adviser’s position that the market shift from growth stocks to value stocks was the largest detractor from performance in 2022. The Board concluded that the Adviser could be expected to provide satisfactory performance for International Opportunities.
International Stalwarts—The Board reviewed the performance information regarding the predecessor fund to International Stalwarts. The Board observed that the predecessor fund was a 4-star Morningstar rated fund. The Board noted that the predecessor fund underperformed its peer group, Morningstar category, and the MSCI ACWI ex USA Mid Cap Index over the 1-year period but outperformed each benchmark across all other periods. The Board recalled the Adviser’s position that the market shift from growth stocks to value stocks was the largest detractor from performance in 2022 and that the predecessor fund performed worse than other funds due to its even stronger bent towards quality. The Board concluded that the Adviser could be expected to provide satisfactory performance for International Stalwarts.
US Stalwarts—The Board reviewed the performance information regarding the predecessor fund to US Stalwarts. The Board noted that the predecessor fund underperformed its peer group, Morningstar category, and benchmark over the 1-year period. The Board observed that the predecessor fund outperformed its Morningstar category and peer group over the since inception period but underperformed its benchmark over the same period. The Board recalled the Adviser’s position that the market shift from growth stocks to value stocks was the largest detractor from performance in 2022. The Board concluded that the Adviser could be expected to provide satisfactory performance for US Stalwarts.
Global Explorer—The Board reviewed the performance information regarding the predecessor fund to Global Explorer. The Board acknowledged that the predecessor fund underperformed its Morningstar category, peer group, and benchmark over the 1-year and since inception periods. The Board recalled the Adviser’s position that the market shift from growth stocks to value stocks was the largest detractor from performance in 2022 which coincided with the launch of the predecessor fund. The Board concluded that the Adviser could be expected to provide satisfactory performance for Global Explorer.
126
| Grandeur Peak Funds® | Disclosure Regarding Approval |
| of Fund Advisory Agreement | |
| October 31, 2023 (Unaudited) |
Fees and Expenses. The Board observed that the Adviser’s proposed advisory fee for each Fund was identical to the fee charged by the Adviser to each Fund’s predecessor fund.
Emerging Markets—The Board observed that the Adviser’s proposed advisory fee for Emerging Markets was higher than the advisory fee of Emerging Markets’ peer group and Morningstar category averages and medians. The Board commented that Emerging Markets’ net expense ratio was also higher than its peer group and Morningstar category medians and averages. The Board noted that the Adviser attributed the higher fees to capacity constraints and the extensive involvement of personnel and resources needed to analyze a wider variety of potential investments than its peers. The Board further noted the Adviser’s position that Emerging Markets was one of the smaller funds among its peers. The Board acknowledged that the Adviser proposed to limit the operating expenses of Emerging Markets’ Investor Class shares and Institutional Class shares to 1.95% and 1.70%, respectively.
Global Contrarian— The Board noted that the proposed advisory fee and net expense ratio were higher than the medians and averages of its peer group and Morningstar category but below the highs of each. The Board noted that the Adviser attributed the higher fees to capacity constraints and the extensive involvement of personnel and resources needed to analyze a wider variety of potential investments than its peers. The Board acknowledged that the Adviser proposed to limit the operating expenses of Global Contrarian’s Institutional Class shares to 1.35%.
Global Micro Cap—The Board observed that the Adviser’s proposed advisory fee for Global Micro Cap was higher than the advisory fee of Global Micro Cap’s peer group and Morningstar category averages and medians. The Board commented that Global Micro Cap’s net expense ratio was also higher than its peer group and Morningstar category medians and averages. The Board noted that the Adviser attributed the higher fees to capacity constraints and the extensive involvement of personnel and resources needed to analyze a wider variety of potential investments than its peers. The Board acknowledged that the Adviser proposed to limit the operating expenses of Global Micro Cap’s Institutional Class shares to 2.00%.
Global Opportunities— The Board noted that the proposed advisory fee and net expense ratio were higher than the medians and averages of its peer group and Morningstar category. The Board noted that the Adviser attributed the higher fees to capacity constraints and the extensive involvement of personnel and resources needed to analyze a wider variety of potential investments than its peers. The Board compared the Adviser’s fees with the fees charged by the Adviser to manage a limited partnership with a strategy similar to that of Global Opportunities, acknowledging that private funds had less regulatory requirements and other terms that made it difficult to compare the costs of managing Global Opportunities. The Board recalled the Adviser’s position that it had structured the fees for the private fund such that the net fee received by the Adviser would be roughly equivalent to the fee received from Global Opportunities. The Board acknowledged that the Adviser proposed to limit the operating expenses of Global Opportunities’ Investor Class shares and Institutional Class shares to 1.75% and 1.50%, respectively.
Global Reach— The Board noted that the proposed advisory fee and net expense ratio were higher than the medians and averages of Global Reach’s peer group and Morningstar category but below the highs of each. The Board noted that the Adviser attributed the higher fees to capacity constraints and the extensive involvement of personnel and resources needed to analyze a wider variety of potential investments than its peers. The Board acknowledged the Adviser’s advisory fee was higher than the fee charged by the Adviser for similar managed accounts due to the lower operating costs and regulatory requirements required to operate separate accounts. The Board acknowledged that the Adviser proposed to limit the operating expenses of Global Reach’s Investor Class shares and Institutional Class shares to 1.50% and 1.25%, respectively.
127
| Grandeur Peak Funds® | Disclosure Regarding Approval |
| of Fund Advisory Agreement | |
| October 31, 2023 (Unaudited) |
Global Stalwarts— The Board noted that the proposed advisory fee and net expense ratio were lower than the medians and averages of Global Stalwarts’ peer group and Morningstar category. The Board acknowledged the Adviser’s advisory fee was higher than the fee charged by the Adviser for similar managed accounts due to the lower operating costs and regulatory requirements required to operate large separate accounts. The Board recalled the Adviser’s position that it had structure the fees for similar managed accounts such that the net fee received by the Adviser would be roughly equivalent to the fee received from a mutual fund. The Board acknowledged that the Adviser proposed to limit the operating expenses of Global Stalwarts’ Investor Class shares and Institutional Class shares to 1.35% and 1.10%, respectively.
International Opportunities— The Board noted that the proposed advisory fee and net expense ratio were higher than the medians and averages of International Opportunities’ peer group and Morningstar category but below the highs of each. The Board noted that the Adviser attributed the higher fees to capacity constraints and the extensive involvement of personnel and resources needed to analyze a wider variety of potential investments than its peers. The Board acknowledged the Adviser’s advisory fee was higher than the fee charged by the Adviser for similar managed accounts due to the lower operating costs and regulatory requirements required to operate large separate accounts. The Board recalled the Adviser’s position that it had structure the fees for similar managed accounts such that the net fee received by the Adviser would be roughly equivalent to the fee received from a mutual fund. The Board acknowledged that the Adviser proposed to limit the operating expenses of International Opportunities’ Investor Class shares and Institutional Class shares to 1.75% and 1.50%, respectively.
International Stalwarts— The Board noted that the proposed advisory fee and net expense ratio were lower than the medians and averages of International Stalwarts’ peer group and Morningstar category. The Board acknowledged the Adviser’s advisory fee was higher than the fee charged by the Adviser for similar managed accounts and similarly managed limited partnership due to the lower operating costs and regulatory requirements in managing large separate accounts and investment products. The Board recalled the Adviser’s position that it had structured the fees for different investment products with similar strategies such that the net fee received by the Adviser would be roughly equivalent to the fee received from managing International Stalwarts. The Board acknowledged that the Adviser proposed to limit the operating expenses of International Stalwarts’ Investor Class shares and Institutional Class shares to 1.35% and 1.10%, respectively.
US Stalwarts— The Board noted that the proposed advisory fee was below the peer group average, equivalent to the peer group and Morningstar category median, and slightly above the Morningstar category average. The Board observed that US Stalwarts’ net expense ratio was equal to its peer group average but higher than peer group median and Morningstar category median and average. The Board noted that the Adviser attributed the higher fees to capacity constraints and the extensive involvement of personnel and resources needed to analyze a wider variety of potential investments than its peers. The Board acknowledged that the Adviser proposed to limit the operating expenses of US Stalwarts’ Institutional Class shares to 1.00%.
Global Explorer— The Board noted that the proposed advisory fee and net expense ratio were higher than the medians and averages of its Morningstar category and peer group but below the highs of each. The Board noted that the Adviser attributed the higher fees to capacity constraints and the extensive involvement of personnel and resources needed to analyze a wider variety of potential investments than its peers. The Board acknowledged the Adviser’s advisory fee was higher than the fee charged by the Adviser for similar managed accounts due to the lower operating costs and regulatory requirements involved with managing large separate accounts. The Board acknowledged that the Adviser proposed to limit the operating expenses of Global Explorer’s Institutional Class shares to 1.25%.
The Board concluded that the proposed advisory fee for each Fund was not unreasonable.
128
| Grandeur Peak Funds® | Disclosure Regarding Approval |
| of Fund Advisory Agreement | |
| October 31, 2023 (Unaudited) |
Economies of Scale. The Board discussed the anticipated size of each Fund and their respective prospects for growth. The Board noted the Adviser’s position that it had competitively priced its management fee at inception in order to effectively provide the benefits of economies to shareholders prior to achieving scale. The Board acknowledged the Adviser’s general concerns regarding capacity constraints and the possibility of soft and/or hard closes for some of the Funds. The Board agreed to monitor and revisit the issue at the appropriate time.
Profitability. The Board reviewed the Adviser’s projected profitability analysis in connection with the operation of each Fund individually and whether the amount of profit was a fair entrepreneurial profit with respect to the services to be provided to each Fund. The Board also considered the benefits that could be derived by the Adviser from its soft dollar arrangements. The Board recognized that the Adviser expected to realize a reasonable profit over the initial term of the Advisory Agreement with respect to each Fund except that the Adviser expected to manage Global Explorer at a loss over the initial term of the Advisory Agreement. The Board acknowledged the overhead and expenses required to manage each Fund and the capacity constraints of each Fund. After further discussion, the Board concluded that the Adviser’s estimated profits for each Fund, both in terms of actual dollars and as a percent of total revenue, would not be excessive.
Conclusion. Having requested and received such information from the Adviser as the Board believed to be reasonably necessary to evaluate the terms of the Advisory Agreement, and as assisted by the advice of counsel, the Board concluded that approval of the Advisory Agreement was in the best interest of future shareholders of each Fund.
| * | Due to the timing of contract approval, these deliberations may or may not relate to the current performance results of the Funds. |
129
ATTACHMENT 13.A - GRANDEUR PEAK PRIVACY POLICY
PRIVACY NOTICE
February 2023
PRIVACY NOTICE
| FACTS | WHAT DOES GRANDEUR PEAK GLOBAL TRUST DO WITH YOUR PERSONAL INFORMATION? | |
| Why? | Financial companies choose how they share your personal information. Federal law gives consumers the right to limit some but not all sharing. Federal law also requires us to tell you how we collect, share, and protect your personal information. Please read this notice carefully to understand what we do. | |
| What? | The types of personal information we collect and share depend on the product or service you have with us. This information can include: | |
Social Security number
Assets
Retirement Assets
Transaction History
Checking Account Information | Purchase History
Account Balances
Account Transactions
Wire Transfer Instructions | |
| When you are no longer our customer, we continue to share your information as described in this notice. | ||
| How? | All financial companies need to share customers’ personal information to run their everyday business. In the section below, we list the reasons financial companies can share their customers’ personal information; the reasons Grandeur Peak Global Trust chooses to share; and whether you can limit this sharing. | |
| Reasons we can share your personal information | Does Grandeur Peak Global Trust share? | Can you limit this sharing? |
For our everyday business purposes – such as to process your transactions, maintain your account(s), respond to court orders and legal investigations, or report to credit bureaus | Yes | No |
For our marketing purposes – to offer our products and services to you | No | We don’t share |
| For joint marketing with other financial companies | No | We don’t share |
For our affiliates’ everyday business purposes – information about your transactions and experiences | No | We don’t share |
For our affiliates’ everyday business purposes – information about your creditworthiness | No | We don’t share |
| For nonaffiliates to market to you | No | We don’t share |
| Questions? | Call (631) 490-4300 |
130
| Who we are | |
| Who is providing this notice? | Grandeur Peak Global Trust |
| What we do | |
How does Grandeur Peak Global Trust protect my personal information?
| To protect your personal information from unauthorized access and use, we use security measures that comply with federal law. These measures include computer safeguards and secured files and buildings.
Our service providers are held accountable for adhering to strict policies and procedures to prevent any misuse of your nonpublic personal information. |
| How does Grandeur Peak Global Trust collect my personal information? | We collect your personal information, for example, when you
● Open an account
● Provide account information
● Give us your contact information
● Make deposits or withdrawals from your account
● Make a wire transfer
● Tell us where to send the money
● Tells us who receives the money
● Show your government-issued ID
● Show your driver’s license
We also collect your personal information from other companies. |
Why can’t I limit all sharing?
| Federal law gives you the right to limit only
● Sharing for affiliates’ everyday business purposes – information about your creditworthiness
● Affiliates from using your information to market to you
● Sharing for nonaffiliates to market to you
State laws and individual companies may give you additional rights to limit sharing. |
| Definitions | |
| Affiliates | Companies related by common ownership or control. They can be financial and nonfinancial companies.
● Grandeur Peak Global Trust does not share with our affiliates. |
| Nonaffiliates | Companies not related by common ownership or control. They can be financial and nonfinancial |
131
| PROXY VOTING POLICY |
| Information regarding how the Funds voted proxies relating to portfolio securities for the most recent 12-month period ended June 30 as well as a description of the policies and procedures that the Funds use to determine how to vote proxies is available without charge, upon request, by calling 1-855-377-PEAK (7325) or by referring to the Securities and Exchange Commission’s (“SEC”) website at http://www.sec.gov. |
| PORTFOLIO HOLDINGS |
| Each Fund files its complete portfolio of portfolio holdings with the SEC for the first and third quarters of each fiscal year as an exhibit to its reports on Form N-PORT, within sixty days after the end of the period. Form N-PORT reports are available at the SEC’s website at www.sec.gov. The information on Form N-PORT is available without charge, upon request, by calling 1-855-377-PEAK (7325). |
132

| Contact Us | |||
| Mail: | Grandeur Peak Funds, P.O. Box 13664, Denver, CO 80201 | E-Mail: | grandeurpeakglobal@alpsinc.com |
| Phone: | 1.855.377.PEAK (7325) | Web: | www.GrandeurPeakGlobal.com |
GP-SAR23
(b) Not applicable
Item 2. Code of Ethics. Not applicable.
Item 3. Audit Committee Financial Expert. Not applicable.
Item 4. Principal Accountant Fees and Services. Not applicable.
Item 5. Audit Committee of Listed Companies. Not applicable to open-end investment companies.
Item 6. Schedule of Investments.
| (a) | Schedule of investments in securities of unaffiliated issuers is included under Item 1. |
| (b) | Not applicable. |
Item 7. Disclosure of Proxy Voting Policies and Procedures for Closed-End Funds. Not applicable to open-end investment companies.
Item 8. Portfolio Managers of Closed-End Management Investment Companies. Not applicable to open-end investment companies.
Item 9. Purchases of Equity Securities by Closed-End Funds. Not applicable to open-end investment companies.
Item 10. Submission of Matters to a Vote of Security Holders. None.
Item 11. Controls and Procedures.
(a) Based on an evaluation of the Registrant’s disclosure controls and procedures as of a date within 90 days of filing date of this Form N-CSR, the principal executive officer and principal financial officer of the Registrant have concluded that the disclosure controls and procedures of the Registrant are reasonably designed to ensure that the information required in filings on Form N-CSR is recorded, processed, summarized, and reported by the filing date, including that information required to be disclosed is accumulated and communicated to the Registrant’s management, including the Registrant’s principal executive officer and principal financial officer, as appropriate to allow timely decisions regarding required disclosure.
(b) There were no significant changes in the Registrant’s internal control over financial reporting that occurred during the period covered by this report that have materially affected, or are reasonably likely to materially affect, the Registrant’s internal control over financial reporting.
Item 12. Disclosure of Securities Lending Activities for Closed-End Management Investment Companies.
Not applicable to open-end investment companies.
Item 13. Exhibits.
(a)(1) Not applicable.
(a)(3) Not applicable.
SIGNATURES
Pursuant to the requirements of the Securities Exchange Act of 1934 and the Investment Company Act of 1940, the registrant has duly caused this report to be signed on its behalf by the undersigned, thereunto duly authorized.
(Registrant) Grandeur Peak Global Trust
By (Signature and Title)
/s/ Brian Curley
Brian Curley, Principal Executive Officer/President
Date 1/3/2024
Pursuant to the requirements of the Securities Exchange Act of 1934 and the Investment Company Act of 1940, this report has been signed below by the following persons on behalf of the registrant and in the capacities and on the dates indicated.
By (Signature and Title)
/s/ Brian Curley
Brian Curley, Principal Executive Officer/President
Date 1/3/2024
By (Signature and Title)
/s/ Richard Gleason
Richard Gleason, Principal Financial Officer/Treasurer
Date 1/3/2024