united states
securities and exchange commission
washington, d.c. 20549
form n-csr
certified shareholder report of registered
management investment companies
| Investment Company Act file number | 811-22655 |
Grandeur Peak Global Trust
(Exact name of registrant as specified in charter)
225 Pictoria Drive, Suite 450,
Cincinnati, OH 45246
(Address of principal executive offices)
(Zip code)
CT Corporation Trust Company
1209 Orange Street,
Wilmington, DE 19801
(Name and address of agent for service)
| Registrant’s telephone number, including area code: | 631-490-4300 |
| Date of fiscal year end: | 4/30 | |
| Date of reporting period: | 10/31/24 |
Item 1. Reports to Stockholders.
| (a) |
Grandeur Peak Emerging Markets Opportunities Fund
Institutional Class (GPEIX)
Semi-Annual Shareholder Report - October 31, 2024

Fund Overview
This semi-annual shareholder report contains important information about Grandeur Peak Emerging Markets Opportunities Fund for the period of May 1, 2024 to December 31, 2024. You can find additional information about the Fund at https://grandeurpeakglobal.com/literature/. You can also request this information by contacting us at 1.855.377.7325 (PEAK). This report describes changes to the Fund that occurred during the reporting period.
What were the Fund’s costs for the last six months?
(based on a hypothetical $10,000 investment)
| Class Name | Costs of a $10,000 investment | Costs paid as a percentage of a $10,000 investment |
|---|---|---|
| Institutional Class | $79 | 1.55%Footnote Reference* |
* Annualized
How did the Fund perform during the reporting period?
For the latest management letter and Fund performance please visit grandeurpeakglobal.com.
Fund Statistics
| Net Assets | $307,736,846 |
|---|---|
| Number of Portfolio Holdings | 107 |
| Advisory Fee #ERROR:A result could not be returned because the conditional could not be evaluated to a True/False value ((history)) | $2,237,111 |
| Portfolio Turnover | 15% |
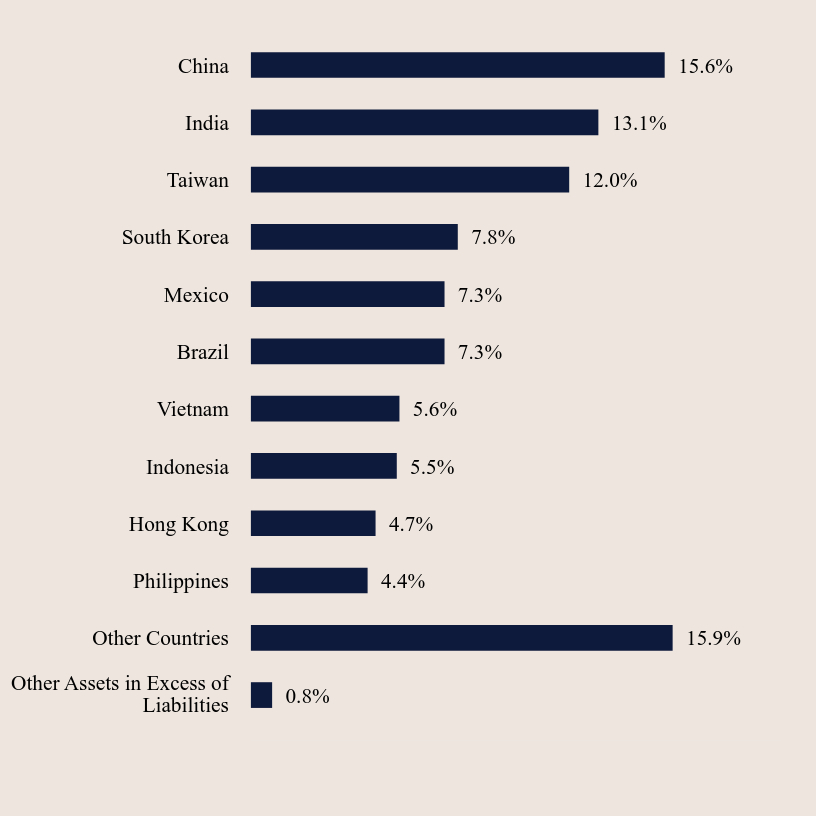
Country Weighting (% of net assets)
| Value | Value |
|---|---|
| Other Assets in Excess of Liabilities | 0.8% |
| Other Countries | 15.9% |
| Philippines | 4.4% |
| Hong Kong | 4.7% |
| Indonesia | 5.5% |
| Vietnam | 5.6% |
| Brazil | 7.3% |
| Mexico | 7.3% |
| South Korea | 7.8% |
| Taiwan | 12.0% |
| India | 13.1% |
| China | 15.6% |
Top 10 Holdings (% of net assets)
| Holding Name | % of Net Assets |
| Silergy Corp | 4.3% |
| Techtronic Industries Co Limited | 2.6% |
| Sporton International, Inc. | 2.4% |
| FPT Corp | 2.3% |
| Sinbon Electronics Co., Limited | 2.3% |
| Globant S.A. | 2.2% |
| SJS Enterprises Ltd | 2.2% |
| Plover Bay Tech | 2.2% |
| Regional SAB de cv | 1.9% |
| iFast Corporation | 1.8% |
What did the Fund invest in?
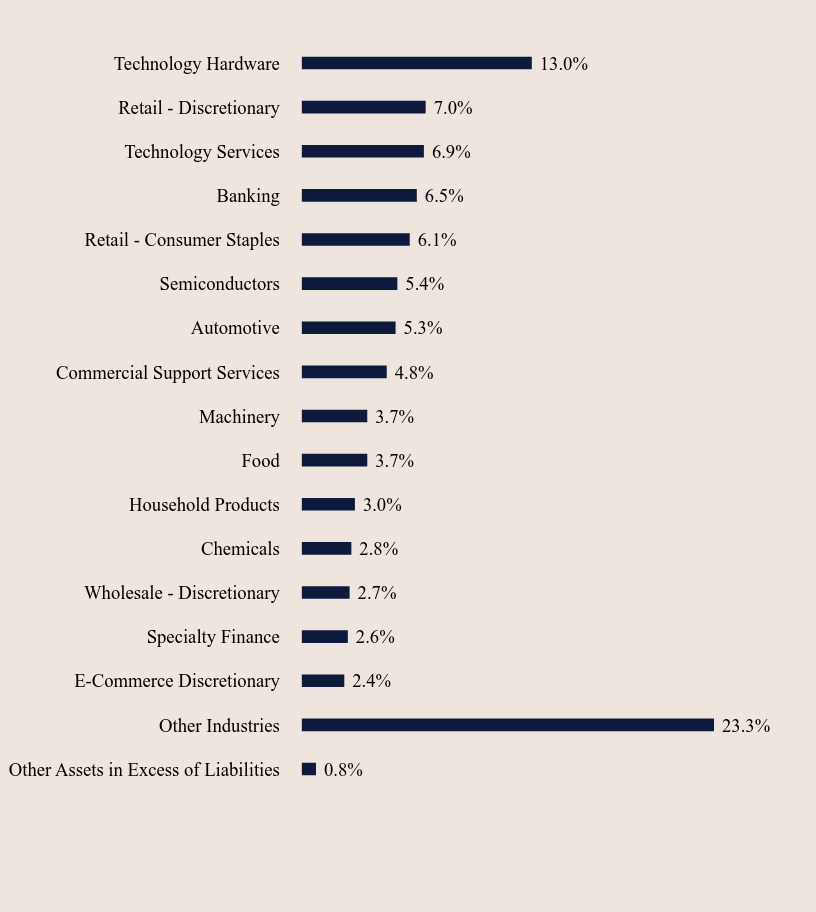
Industry Weighting (% of net assets)
| Value | Value |
|---|---|
| Other Assets in Excess of Liabilities | 0.8% |
| Other Industries | 23.3% |
| E-Commerce Discretionary | 2.4% |
| Specialty Finance | 2.6% |
| Wholesale - Discretionary | 2.7% |
| Chemicals | 2.8% |
| Household Products | 3.0% |
| Food | 3.7% |
| Machinery | 3.7% |
| Commercial Support Services | 4.8% |
| Automotive | 5.3% |
| Semiconductors | 5.4% |
| Retail - Consumer Staples | 6.1% |
| Banking | 6.5% |
| Technology Services | 6.9% |
| Retail - Discretionary | 7.0% |
| Technology Hardware | 13.0% |
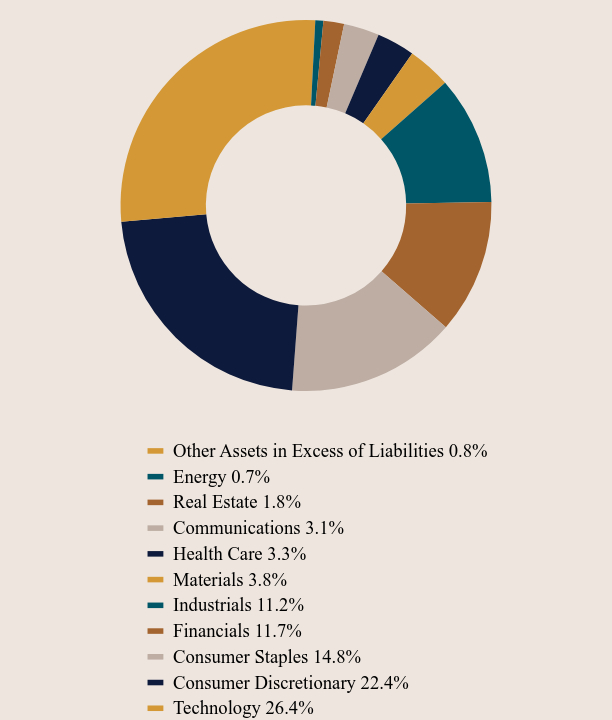
Sector Weighting (% of net assets)
| Value | Value |
|---|---|
| Other Assets in Excess of Liabilities | 0.8% |
| Energy | 0.7% |
| Real Estate | 1.8% |
| Communications | 3.1% |
| Health Care | 3.3% |
| Materials | 3.8% |
| Industrials | 11.2% |
| Financials | 11.7% |
| Consumer Staples | 14.8% |
| Consumer Discretionary | 22.4% |
| Technology | 26.4% |
Go Paperless! Update your communication preferences on our website, www.grandeurpeakglobal.com, or call 1-855-377-7325 (PEAK).
Material Fund Changes
No material changes occurred during the period ended October 31, 2024.
Where can I find additional information about the Fund?
Additional information is available on the Fund's website ( https://grandeurpeakglobal.com/literature/ ), including its:
Prospectus
Financial information
Holdings
Proxy voting information
TSR-SAR 103124-GPEIX
Grandeur Peak Emerging Markets Opportunities Fund - Institutional Class (GPEIX)
Semi-Annual Shareholder Report - October 31, 2024
Grandeur Peak Emerging Markets Opportunities Fund
Investor Class (GPEOX)
Semi-Annual Shareholder Report - October 31, 2024

Fund Overview
This semi-annual shareholder report contains important information about Grandeur Peak Emerging Markets Opportunities Fund for the period of May 1, 2024 to October 31, 2024. You can find additional information about the Fund at https://grandeurpeakglobal.com/literature/. You can also request this information by contacting us at 1.855.377.7325 (PEAK).
What were the Fund’s costs for the last six months?
(based on a hypothetical $10,000 investment)
| Class Name | Costs of a $10,000 investment | Costs paid as a percentage of a $10,000 investment |
|---|---|---|
| Investor Class | $91 | 1.80%Footnote Reference* |
* Annualized
How did the Fund perform during the reporting period?
For the latest management letter and Fund performance please visit grandeurpeakglobal.com.
Fund Statistics
| Net Assets | $307,736,846 |
| Number of Portfolio Holdings | 107 |
| Advisory Fee | $2,237,111 |
| Portfolio Turnover | 15% |
Country Weighting (% of net assets)

| Value | Value |
|---|---|
| Other Assets in Excess of Liabilities | 0.8% |
| Other Countries | 15.9% |
| Philippines | 4.4% |
| Hong Kong | 4.7% |
| Indonesia | 5.5% |
| Vietnam | 5.6% |
| Brazil | 7.3% |
| Mexico | 7.3% |
| South Korea | 7.8% |
| Taiwan | 12.0% |
| India | 13.1% |
| China | 15.6% |
Top 10 Holdings (% of net assets)
| Holding Name | % of Net Assets |
| Silergy Corp | 4.3% |
| Techtronic Industries Co Limited | 2.6% |
| Sporton International, Inc. | 2.4% |
| FPT Corp | 2.3% |
| Sinbon Electronics Co., Limited | 2.3% |
| Globant S.A. | 2.2% |
| SJS Enterprises Ltd | 2.2% |
| Plover Bay Tech | 2.2% |
| Regional SAB de cv | 1.9% |
| iFast Corporation | 1.8% |
What did the Fund invest in?
Industry Weighting (% of net assets)

| Value | Value |
|---|---|
| Other Assets in Excess of Liabilities | 0.8% |
| Other Industries | 23.3% |
| E-Commerce Discretionary | 2.4% |
| Specialty Finance | 2.6% |
| Wholesale - Discretionary | 2.7% |
| Chemicals | 2.8% |
| Household Products | 3.0% |
| Food | 3.7% |
| Machinery | 3.7% |
| Commercial Support Services | 4.8% |
| Automotive | 5.3% |
| Semiconductors | 5.4% |
| Retail - Consumer Staples | 6.1% |
| Banking | 6.5% |
| Technology Services | 6.9% |
| Retail - Discretionary | 7.0% |
| Technology Hardware | 13.0% |
Sector Weighting (% of net assets)

| Value | Value |
|---|---|
| Other Assets in Excess of Liabilities | 0.8% |
| Energy | 0.7% |
| Real Estate | 1.8% |
| Communications | 3.1% |
| Health Care | 3.3% |
| Materials | 3.8% |
| Industrials | 11.2% |
| Financials | 11.7% |
| Consumer Staples | 14.8% |
| Consumer Discretionary | 22.4% |
| Technology | 26.4% |
Go Paperless! Update your communication preferences on our website, www.grandeurpeakglobal.com, or call 1-855-377-7325 (PEAK).
Material Fund Changes
No material changes occurred during the period ended October 31, 2024.
Where can I find additional information about the Fund?
Additional information is available on the Fund's website ( https://grandeurpeakglobal.com/literature/ ), including its:
Prospectus
Financial information
Holdings
Proxy voting information
TSR-SAR 103124-GPEOX
Grandeur Peak Emerging Markets Opportunities Fund - Investor Class (GPEOX)
Semi-Annual Shareholder Report - October 31, 2024
Grandeur Peak Global Contrarian Fund
Institutional Class (GPGCX)
Semi-Annual Shareholder Report - October 31, 2024

Fund Overview
This semi-annual shareholder report contains important information about Grandeur Peak Global Contrarian Fund for the period of May 1, 2024 to October 31, 2024. You can find additional information about the Fund at https://grandeurpeakglobal.com/literature/. You can also request this information by contacting us at 1.855.377.7325 (PEAK).
What were the Fund’s costs for the last six months?
(based on a hypothetical $10,000 investment)
| Class Name | Costs of a $10,000 investment | Costs paid as a percentage of a $10,000 investment |
|---|---|---|
| Institutional Class | $64 | 1.21%Footnote Reference* |
* Annualized
How did the Fund perform during the reporting period?
For the latest management letter and Fund performance please visit grandeurpeakglobal.com.
Fund Statistics
| Net Assets | $154,881,808 |
| Number of Portfolio Holdings | 90 |
| Advisory Fee | $756,618 |
| Portfolio Turnover | 30% |
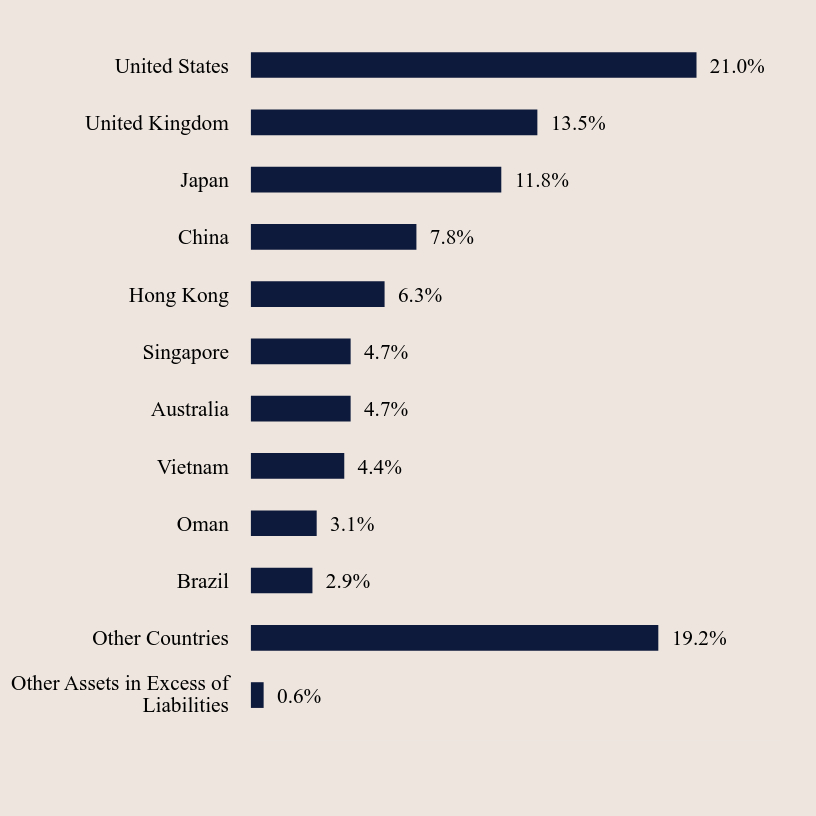
Country Weighting (% of net assets)
| Value | Value |
|---|---|
| Other Assets in Excess of Liabilities | 0.6% |
| Other Countries | 19.2% |
| Brazil | 2.9% |
| Oman | 3.1% |
| Vietnam | 4.4% |
| Australia | 4.7% |
| Singapore | 4.7% |
| Hong Kong | 6.3% |
| China | 7.8% |
| Japan | 11.8% |
| United Kingdom | 13.5% |
| United States | 21.0% |
Top 10 Holdings (% of net assets)
| Holding Name | % of Net Assets |
| Plover Bay Tech | 6.3% |
| Riverstone Holdings Ltd. | 4.6% |
| Petershill Partners PLC | 4.1% |
| Tethys Oil AB | 3.1% |
| P10 Inc | 2.1% |
| BayCurrent Consulting, Inc. | 1.9% |
| Rise Consulting Group Inc | 1.8% |
| Vietnam Technological & Comm Joint-stock Bank | 1.8% |
| Five Below, Inc. | 1.8% |
| CVS Group plc | 1.6% |
What did the Fund invest in?
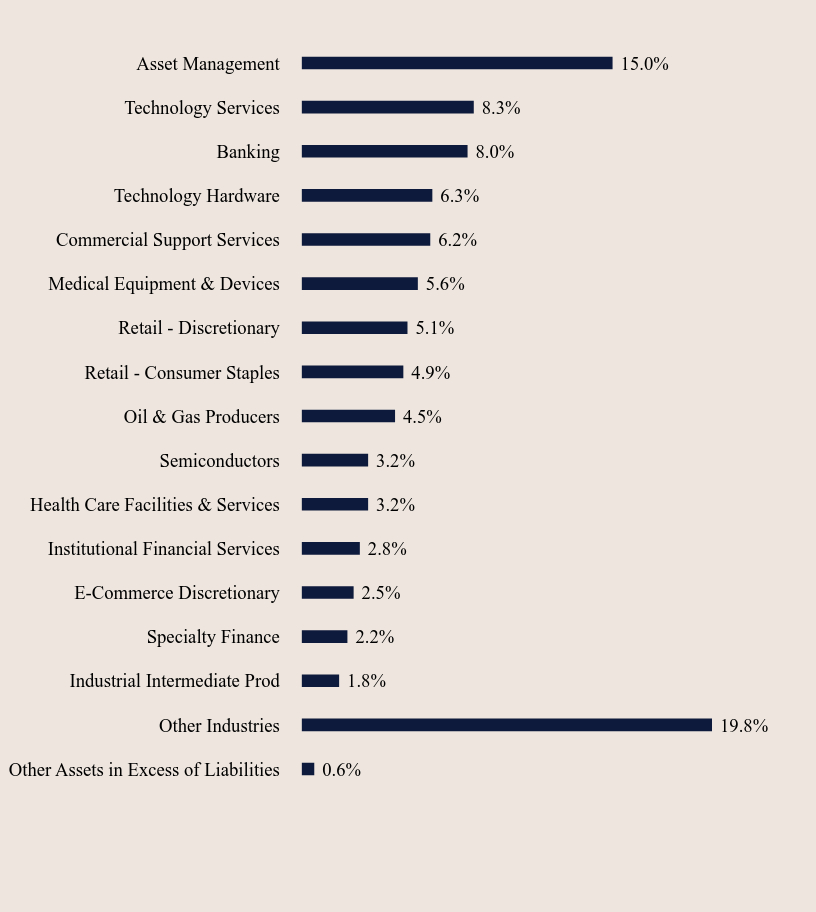
Industry Weighting (% of net assets)
| Value | Value |
|---|---|
| Other Assets in Excess of Liabilities | 0.6% |
| Other Industries | 19.8% |
| Industrial Intermediate Prod | 1.8% |
| Specialty Finance | 2.2% |
| E-Commerce Discretionary | 2.5% |
| Institutional Financial Services | 2.8% |
| Health Care Facilities & Services | 3.2% |
| Semiconductors | 3.2% |
| Oil & Gas Producers | 4.5% |
| Retail - Consumer Staples | 4.9% |
| Retail - Discretionary | 5.1% |
| Medical Equipment & Devices | 5.6% |
| Commercial Support Services | 6.2% |
| Technology Hardware | 6.3% |
| Banking | 8.0% |
| Technology Services | 8.3% |
| Asset Management | 15.0% |
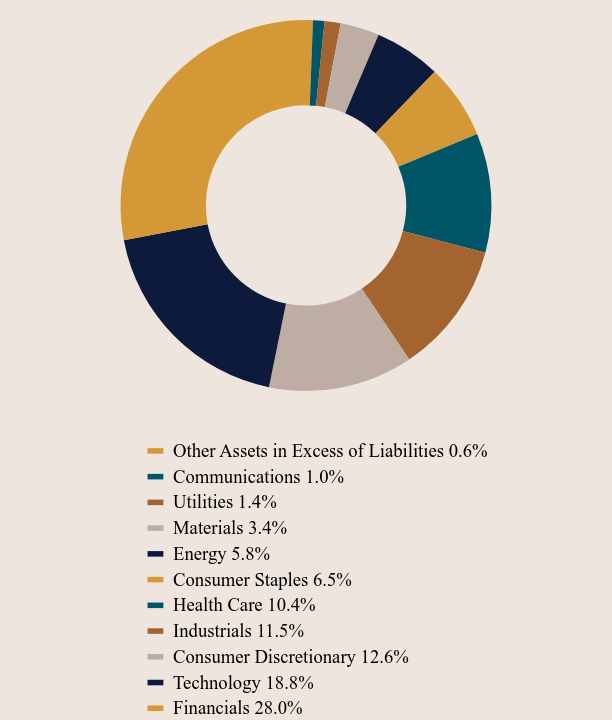
Sector Weighting (% of net assets)
| Value | Value |
|---|---|
| Other Assets in Excess of Liabilities | 0.6% |
| Communications | 1.0% |
| Utilities | 1.4% |
| Materials | 3.4% |
| Energy | 5.8% |
| Consumer Staples | 6.5% |
| Health Care | 10.4% |
| Industrials | 11.5% |
| Consumer Discretionary | 12.6% |
| Technology | 18.8% |
| Financials | 28.0% |
Go Paperless! Update your communication preferences on our website, www.grandeurpeakglobal.com, or call 1-855-377-7325 (PEAK).
Material Fund Changes
No material changes occurred during the period ended October 31, 2024.
Where can I find additional information about the Fund?
Additional information is available on the Fund's website ( https://grandeurpeakglobal.com/literature/ ), including its:
Prospectus
Financial information
Holdings
Proxy voting information
TSR-SAR 103124-GPGCX
Grandeur Peak Global Contrarian Fund - Institutional Class (GPGCX)
Semi-Annual Shareholder Report - October 31, 2024
Grandeur Peak Global Explorer Fund
Institutional Class (GPGEX)
Semi-Annual Shareholder Report - October 31, 2024

Fund Overview
This semi-annual shareholder report contains important information about Grandeur Peak Global Explorer Fund for the period of May 1, 2024 to October 31, 2024. You can find additional information about the Fund at https://grandeurpeakglobal.com/literature/. You can also request this information by contacting us at 1.855.377.7325 (PEAK).
What were the Fund’s costs for the last six months?
(based on a hypothetical $10,000 investment)
| Class Name | Costs of a $10,000 investment | Costs paid as a percentage of a $10,000 investment |
|---|---|---|
| Institutional Class | $64 | 1.25%Footnote Reference* |
* Annualized
How did the Fund perform during the reporting period?
For the latest management letter and Fund performance please visit grandeurpeakglobal.com.
Fund Statistics
| Net Assets | $12,243,884 |
| Number of Portfolio Holdings | 298 |
| Advisory Fee | $7,797 |
| Portfolio Turnover | 24% |
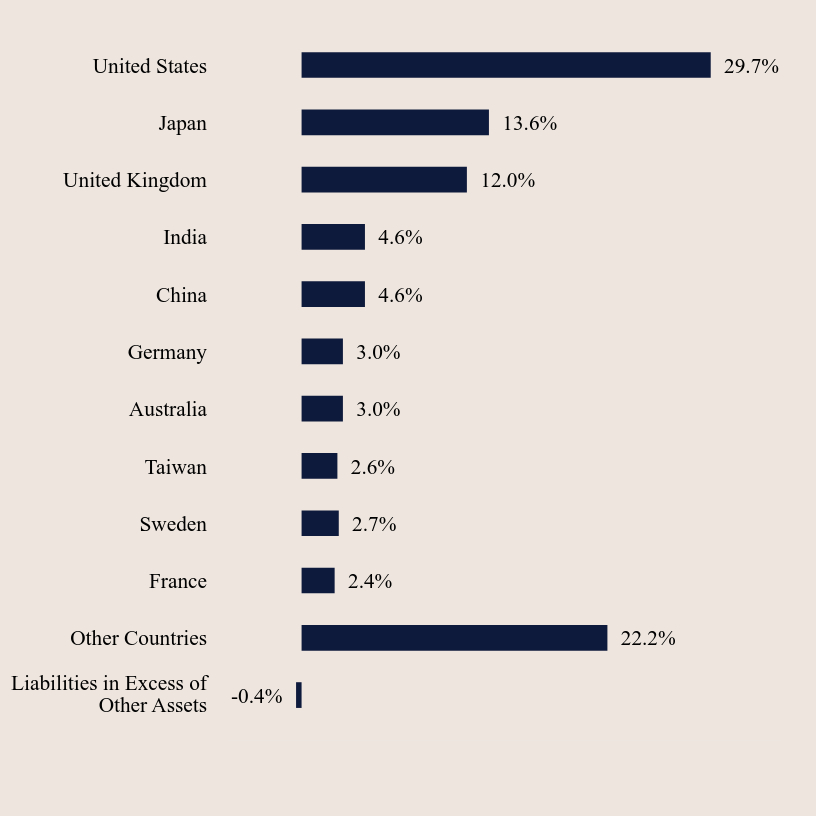
Country Weighting (% of net assets)
| Value | Value |
|---|---|
| Liabilities in Excess of Other Assets | -0.4% |
| Other Countries | 22.2% |
| France | 2.4% |
| Sweden | 2.7% |
| Taiwan | 2.6% |
| Australia | 3.0% |
| Germany | 3.0% |
| China | 4.6% |
| India | 4.6% |
| United Kingdom | 12.0% |
| Japan | 13.6% |
| United States | 29.7% |
Top 10 Holdings (% of net assets)
| Holding Name | % of Net Assets |
| JTC plc | 1.1% |
| ULS Group Inc | 1.0% |
| Virbac SA | 1.0% |
| B & M European Value Retail SA | 0.9% |
| Silergy Corp | 0.9% |
| P10 Inc | 0.8% |
| Five Below, Inc. | 0.8% |
| Globant S.A. | 0.8% |
| Beenos Inc | 0.8% |
| Sporton International, Inc. | 0.8% |
What did the Fund invest in?
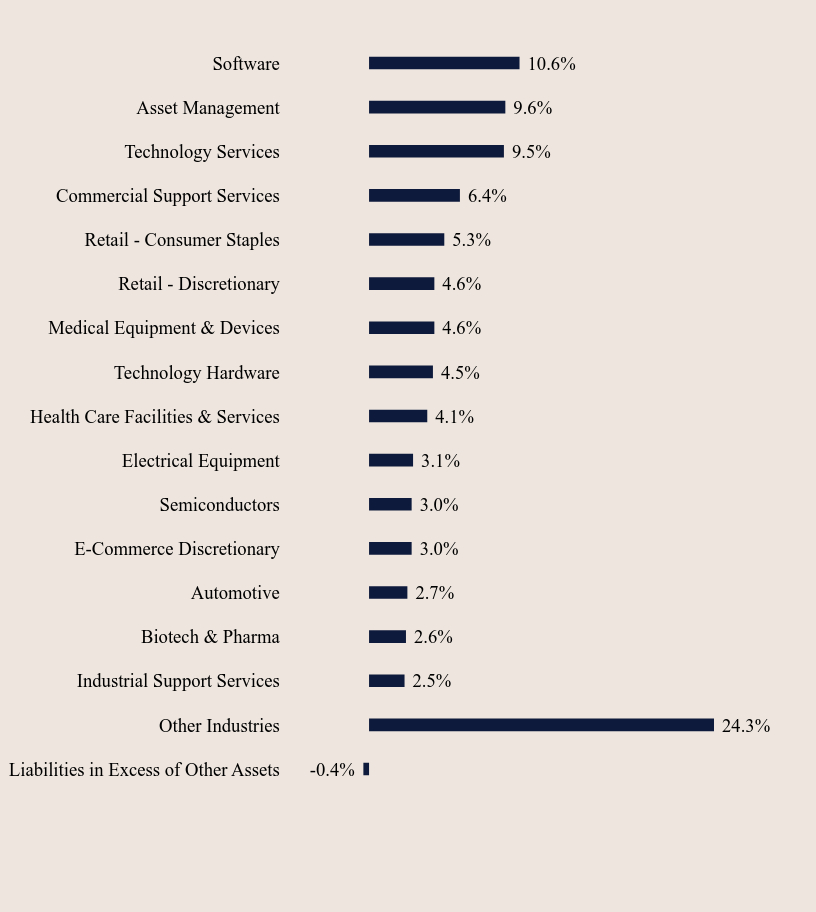
Industry Weighting (% of net assets)
| Value | Value |
|---|---|
| Liabilities in Excess of Other Assets | -0.4% |
| Other Industries | 24.3% |
| Industrial Support Services | 2.5% |
| Biotech & Pharma | 2.6% |
| Automotive | 2.7% |
| E-Commerce Discretionary | 3.0% |
| Semiconductors | 3.0% |
| Electrical Equipment | 3.1% |
| Health Care Facilities & Services | 4.1% |
| Technology Hardware | 4.5% |
| Medical Equipment & Devices | 4.6% |
| Retail - Discretionary | 4.6% |
| Retail - Consumer Staples | 5.3% |
| Commercial Support Services | 6.4% |
| Technology Services | 9.5% |
| Asset Management | 9.6% |
| Software | 10.6% |
Sector Weighting (% of net assets)
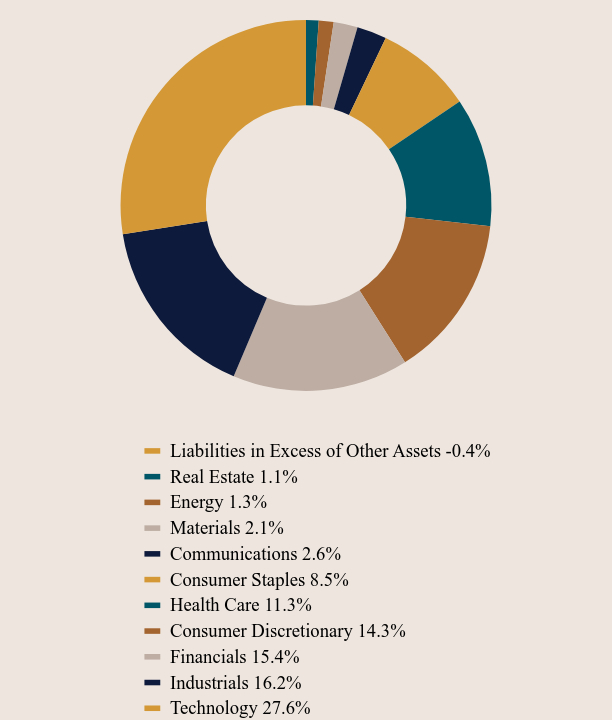
| Value | Value |
|---|---|
| Liabilities in Excess of Other Assets | -0.4% |
| Real Estate | 1.1% |
| Energy | 1.3% |
| Materials | 2.1% |
| Communications | 2.6% |
| Consumer Staples | 8.5% |
| Health Care | 11.3% |
| Consumer Discretionary | 14.3% |
| Financials | 15.4% |
| Industrials | 16.2% |
| Technology | 27.6% |
Go Paperless! Update your communication preferences on our website, www.grandeurpeakglobal.com, or call 1-855-377-7325 (PEAK).
Material Fund Changes
No material changes occurred during the period ended October 31, 2024.
Where can I find additional information about the Fund?
Additional information is available on the Fund's website ( https://grandeurpeakglobal.com/literature/ ), including its:
Prospectus
Financial information
Holdings
Proxy voting information
TSR-SAR 103124-GPGEX
Grandeur Peak Global Explorer Fund - Institutional Class (GPGEX)
Semi-Annual Shareholder Report - October 31, 2024
Grandeur Peak Global Micro Cap Fund
Institutional Class (GPMCX)
Semi-Annual Shareholder Report - October 31, 2024

Fund Overview
This semi-annual shareholder report contains important information about Grandeur Peak Global Micro Cap Fund for the period of May 1, 2024 to October 31, 2024. You can find additional information about the Fund at https://grandeurpeakglobal.com/literature/. You can also request this information by contacting us at 1.855.377.7325 (PEAK).
What were the Fund’s costs for the last six months?
(based on a hypothetical $10,000 investment)
| Class Name | Costs of a $10,000 investment | Costs paid as a percentage of a $10,000 investment |
|---|---|---|
| Institutional Class | $104 | 2.00%Footnote Reference* |
* Annualized
How did the Fund perform during the reporting period?
For the latest management letter and Fund performance please visit grandeurpeakglobal.com.
Fund Statistics
| Net Assets | $44,788,890 |
| Number of Portfolio Holdings | 121 |
| Advisory Fee | $348,023 |
| Portfolio Turnover | 16% |
Country Weighting (% of net assets)
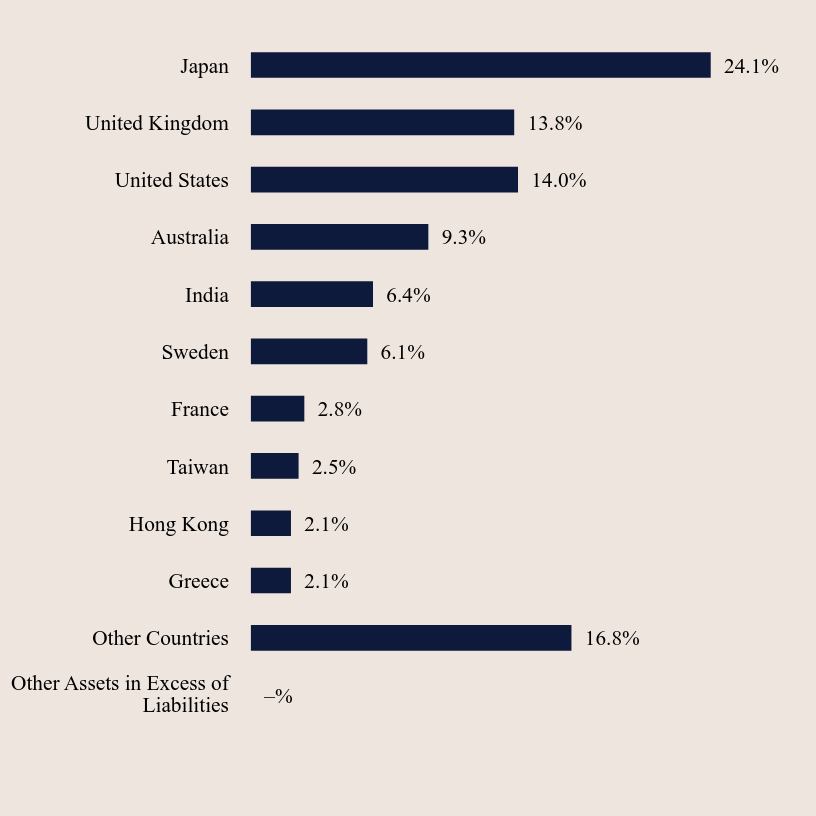
| Value | Value |
|---|---|
| Other Assets in Excess of Liabilities | -% |
| Other Countries | 16.8% |
| Greece | 2.1% |
| Hong Kong | 2.1% |
| Taiwan | 2.5% |
| France | 2.8% |
| Sweden | 6.1% |
| India | 6.4% |
| Australia | 9.3% |
| United States | 14.0% |
| United Kingdom | 13.8% |
| Japan | 24.1% |
Top 10 Holdings (% of net assets)
| Holding Name | % of Net Assets |
| Pennant Group, Inc. (The) | 4.1% |
| Fiducian Group Ltd | 2.8% |
| Beenos Inc | 2.7% |
| ULS Group Inc | 2.6% |
| Yatharth Hospital | 2.4% |
| Kogan.com Ltd | 2.2% |
| Plover Bay Tech | 2.2% |
| Swedencare AB | 2.1% |
| Barrett Business Services, Inc. | 2.1% |
| Elixirr International PLC | 2.0% |
What did the Fund invest in?
Industry Weighting (% of net assets)
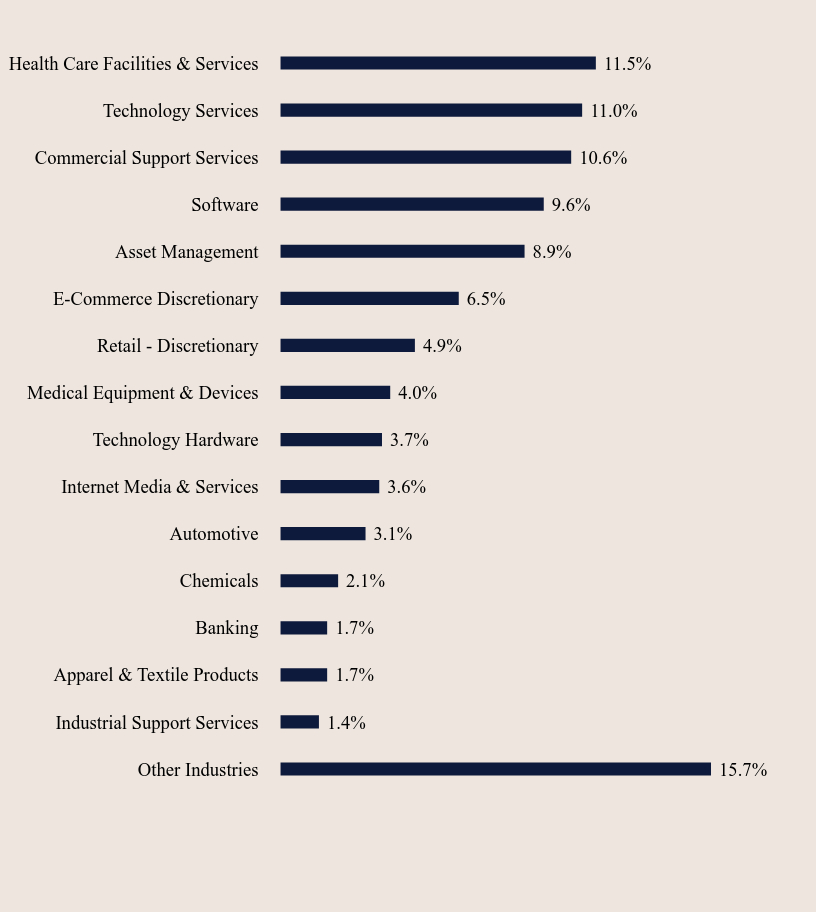
| Value | Value |
|---|---|
| Other Industries | 15.7% |
| Industrial Support Services | 1.4% |
| Apparel & Textile Products | 1.7% |
| Banking | 1.7% |
| Chemicals | 2.1% |
| Automotive | 3.1% |
| Internet Media & Services | 3.6% |
| Technology Hardware | 3.7% |
| Medical Equipment & Devices | 4.0% |
| Retail - Discretionary | 4.9% |
| E-Commerce Discretionary | 6.5% |
| Asset Management | 8.9% |
| Software | 9.6% |
| Commercial Support Services | 10.6% |
| Technology Services | 11.0% |
| Health Care Facilities & Services | 11.5% |
Sector Weighting (% of net assets)
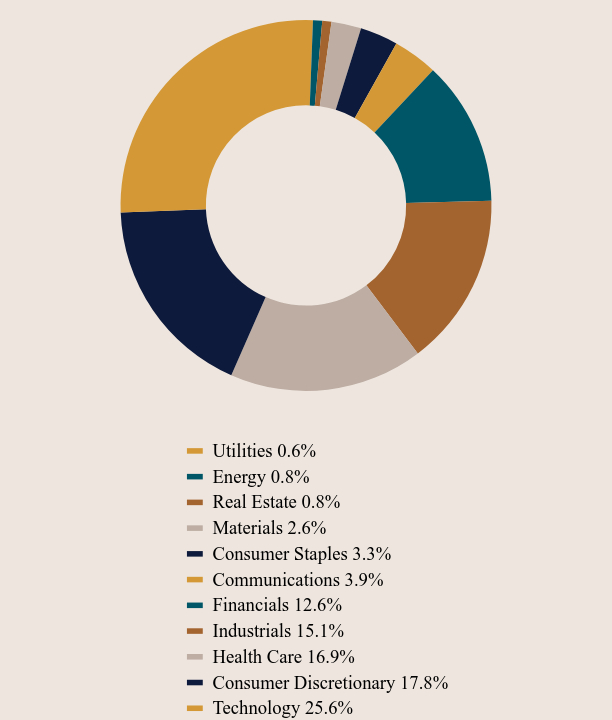
| Value | Value |
|---|---|
| Utilities | 0.6% |
| Energy | 0.8% |
| Real Estate | 0.8% |
| Materials | 2.6% |
| Consumer Staples | 3.3% |
| Communications | 3.9% |
| Financials | 12.6% |
| Industrials | 15.1% |
| Health Care | 16.9% |
| Consumer Discretionary | 17.8% |
| Technology | 25.6% |
Go Paperless! Update your communication preferences on our website, www.grandeurpeakglobal.com, or call 1-855-377-7325 (PEAK).
Material Fund Changes
No material changes occurred during the period ended October 31, 2024.
Where can I find additional information about the Fund?
Additional information is available on the Fund's website ( https://grandeurpeakglobal.com/literature/ ), including its:
Prospectus
Financial information
Holdings
Proxy voting information
TSR-SAR 103124-GPMCX
Grandeur Peak Global Micro Cap Fund - Institutional Class (GPMCX)
Semi-Annual Shareholder Report - October 31, 2024
Grandeur Peak Global Opportunities Fund
Institutional Class (GPGIX)
Semi-Annual Shareholder Report - October 31, 2024

Fund Overview
This semi-annual shareholder report contains important information about Grandeur Peak Global Opportunities Fund for the period of May 1, 2024 to October 31, 2024. You can find additional information about the Fund at https://grandeurpeakglobal.com/literature/. You can also request this information by contacting us at 1.855.377.7325 (PEAK).
What were the Fund’s costs for the last six months?
(based on a hypothetical $10,000 investment)
| Class Name | Costs of a $10,000 investment | Costs paid as a percentage of a $10,000 investment |
|---|---|---|
| Institutional Class | $67 | 1.32%Footnote Reference* |
* Annualized
How did the Fund perform during the reporting period?
For the latest management letter and Fund performance please visit grandeurpeakglobal.com.
Fund Statistics
| Net Assets | $584,279,654 |
| Number of Portfolio Holdings | 157 |
| Advisory Fee | $3,548,925 |
| Portfolio Turnover | 22% |
Country Weighting (% of net assets)
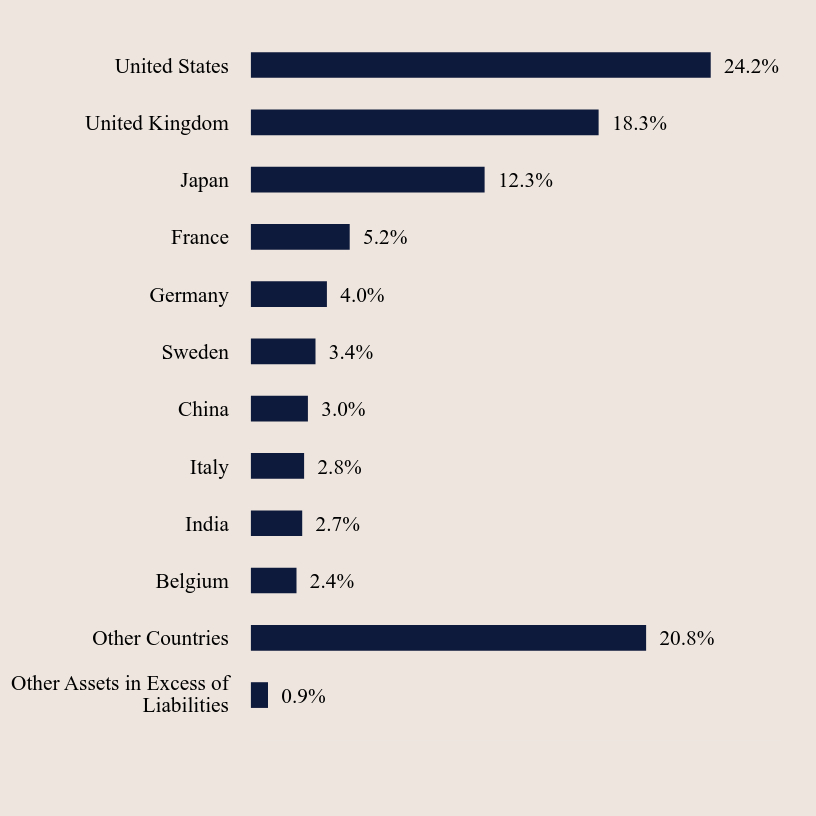
| Value | Value |
|---|---|
| Other Assets in Excess of Liabilities | 0.9% |
| Other Countries | 20.8% |
| Belgium | 2.4% |
| India | 2.7% |
| Italy | 2.8% |
| China | 3.0% |
| Sweden | 3.4% |
| Germany | 4.0% |
| France | 5.2% |
| Japan | 12.3% |
| United Kingdom | 18.3% |
| United States | 24.2% |
Top 10 Holdings (% of net assets)
| Holding Name | % of Net Assets |
| B & M European Value Retail SA | 3.3% |
| BayCurrent Consulting, Inc. | 2.7% |
| Virbac SA | 2.7% |
| Littelfuse, Inc. | 2.5% |
| CVS Group plc | 1.7% |
| Volution Group PLC | 1.6% |
| JTC plc | 1.5% |
| Silergy Corp | 1.5% |
| Diploma plc | 1.3% |
| Melexis NV | 1.3% |
What did the Fund invest in?
Industry Weighting (% of net assets)
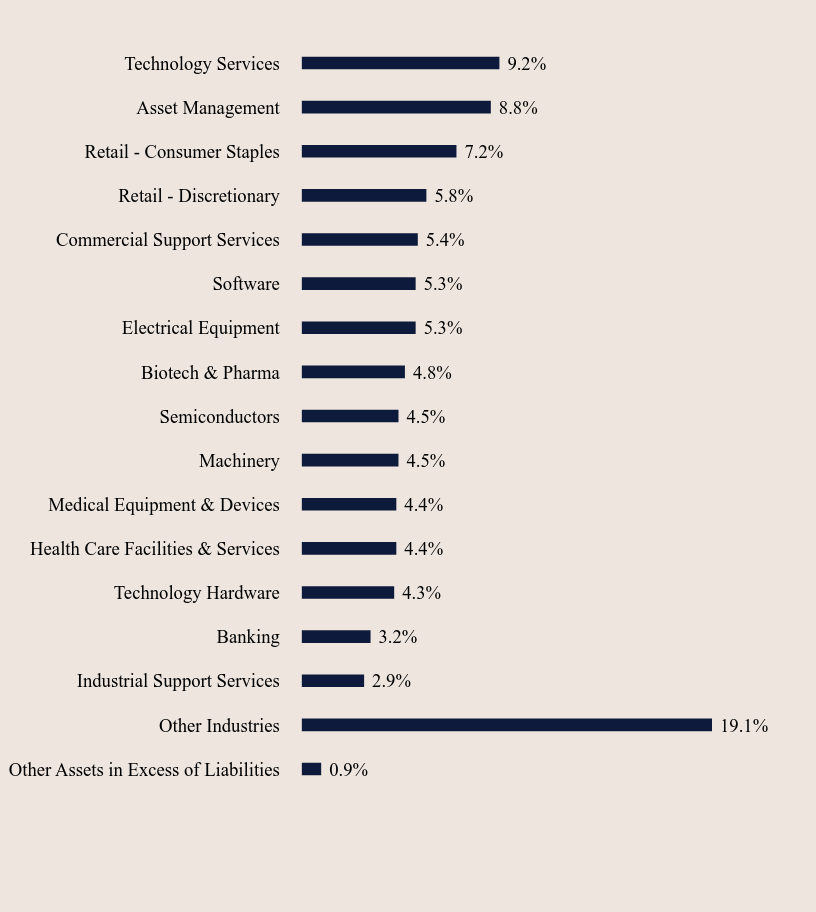
| Value | Value |
|---|---|
| Other Assets in Excess of Liabilities | 0.9% |
| Other Industries | 19.1% |
| Industrial Support Services | 2.9% |
| Banking | 3.2% |
| Technology Hardware | 4.3% |
| Health Care Facilities & Services | 4.4% |
| Medical Equipment & Devices | 4.4% |
| Machinery | 4.5% |
| Semiconductors | 4.5% |
| Biotech & Pharma | 4.8% |
| Electrical Equipment | 5.3% |
| Software | 5.3% |
| Commercial Support Services | 5.4% |
| Retail - Discretionary | 5.8% |
| Retail - Consumer Staples | 7.2% |
| Asset Management | 8.8% |
| Technology Services | 9.2% |
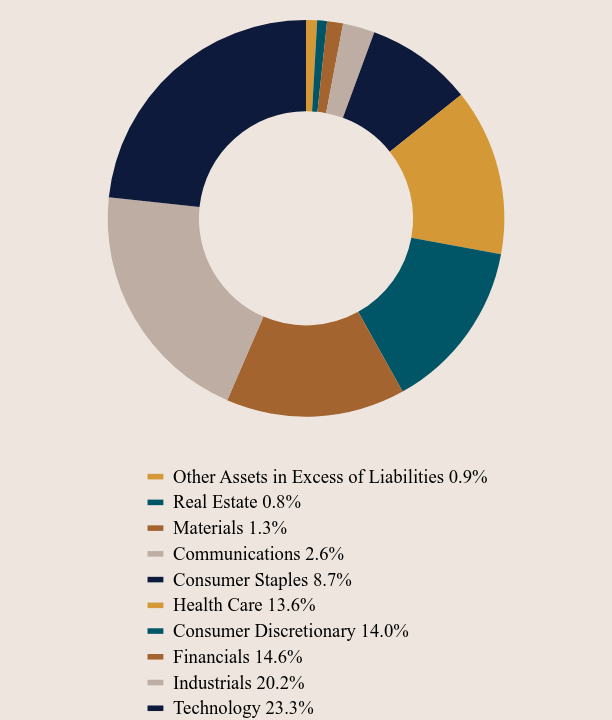
Sector Weighting (% of net assets)

| Value | Value |
|---|---|
| Other Assets in Excess of Liabilities | 0.9% |
| Real Estate | 0.8% |
| Materials | 1.3% |
| Communications | 2.6% |
| Consumer Staples | 8.7% |
| Health Care | 13.6% |
| Consumer Discretionary | 14.0% |
| Financials | 14.6% |
| Industrials | 20.2% |
| Technology | 23.3% |
Go Paperless! Update your communication preferences on our website, www.grandeurpeakglobal.com, or call 1-855-377-7325 (PEAK).
Material Fund Changes
No material changes occurred during the period ended October 31, 2024.
Where can I find additional information about the Fund?
Additional information is available on the Fund's website ( https://grandeurpeakglobal.com/literature/ ), including its:
Prospectus
Financial information
Holdings
Proxy voting information
TSR-SAR 103124-GPGIX
Grandeur Peak Global Opportunities Fund - Institutional Class (GPGIX)
Semi-Annual Shareholder Report - October 31, 2024
Grandeur Peak Global Opportunities Fund
Investor Class (GPGOX)
Semi-Annual Shareholder Report - October 31, 2024

Fund Overview
This semi-annual shareholder report contains important information about Grandeur Peak Global Opportunities Fund for the period of May 1, 2024 to October 31, 2024. You can find additional information about the Fund at https://grandeurpeakglobal.com/literature/. You can also request this information by contacting us at 1.855.377.7325 (PEAK).
What were the Fund’s costs for the last six months?
(based on a hypothetical $10,000 investment)
| Class Name | Costs of a $10,000 investment | Costs paid as a percentage of a $10,000 investment |
|---|---|---|
| Investor Class | $80 | 1.57%Footnote Reference* |
* Annualized
How did the Fund perform during the reporting period?
For the latest management letter and Fund performance please visit grandeurpeakglobal.com.
Fund Statistics
| Net Assets | $584,279,654 |
| Number of Portfolio Holdings | 157 |
| Advisory Fee | $3,548,925 |
| Portfolio Turnover | 22% |
Country Weighting (% of net assets)

| Value | Value |
|---|---|
| Other Assets in Excess of Liabilities | 0.9% |
| Other Countries | 20.8% |
| Belgium | 2.4% |
| India | 2.7% |
| Italy | 2.8% |
| China | 3.0% |
| Sweden | 3.4% |
| Germany | 4.0% |
| France | 5.2% |
| Japan | 12.3% |
| United Kingdom | 18.3% |
| United States | 24.2% |
Top 10 Holdings (% of net assets)
| Holding Name | % of Net Assets |
| B & M European Value Retail SA | 3.3% |
| BayCurrent Consulting, Inc. | 2.7% |
| Virbac SA | 2.7% |
| Littelfuse, Inc. | 2.5% |
| CVS Group plc | 1.7% |
| Volution Group PLC | 1.6% |
| JTC plc | 1.5% |
| Silergy Corp | 1.5% |
| Diploma plc | 1.3% |
| Melexis NV | 1.3% |
What did the Fund invest in?
Industry Weighting (% of net assets)

| Value | Value |
|---|---|
| Other Assets in Excess of Liabilities | 0.9% |
| Other Industries | 19.1% |
| Industrial Support Services | 2.9% |
| Banking | 3.2% |
| Technology Hardware | 4.3% |
| Health Care Facilities & Services | 4.4% |
| Medical Equipment & Devices | 4.4% |
| Machinery | 4.5% |
| Semiconductors | 4.5% |
| Biotech & Pharma | 4.8% |
| Electrical Equipment | 5.3% |
| Software | 5.3% |
| Commercial Support Services | 5.4% |
| Retail - Discretionary | 5.8% |
| Retail - Consumer Staples | 7.2% |
| Asset Management | 8.8% |
| Technology Services | 9.2% |
Sector Weighting (% of net assets)
| Value | Value |
|---|---|
| Other Assets in Excess of Liabilities | 0.9% |
| Real Estate | 0.8% |
| Materials | 1.3% |
| Communications | 2.6% |
| Consumer Staples | 8.7% |
| Health Care | 13.6% |
| Consumer Discretionary | 14.0% |
| Financials | 14.6% |
| Industrials | 20.2% |
| Technology | 23.3% |
Go Paperless! Update your communication preferences on our website, www.grandeurpeakglobal.com, or call 1-855-377-7325 (PEAK).
Material Fund Changes
No material changes occurred during the period ended October 31, 2024.
Where can I find additional information about the Fund?
Additional information is available on the Fund's website ( https://grandeurpeakglobal.com/literature/ ), including its:
Prospectus
Financial information
Holdings
Proxy voting information
TSR-SAR 103124-GPGOX
Grandeur Peak Global Opportunities Fund - Investor Class (GPGOX)
Semi-Annual Shareholder Report - October 31, 2024
Grandeur Peak Global Reach Fund
Institutional Class (GPRIX)
Semi-Annual Shareholder Report - October 31, 2024

Fund Overview
This semi-annual shareholder report contains important information about Grandeur Peak Global Reach Fund for the period of May 1, 2024 to October 31, 2024. You can find additional information about the Fund at https://grandeurpeakglobal.com/literature/. You can also request this information by contacting us at 1.855.377.7325 (PEAK).
What were the Fund’s costs for the last six months?
(based on a hypothetical $10,000 investment)
| Class Name | Costs of a $10,000 investment | Costs paid as a percentage of a $10,000 investment |
|---|---|---|
| Institutional Class | $65 | 1.25%Footnote Reference* |
* Annualized
How did the Fund perform during the reporting period?
For the latest management letter and Fund performance please visit grandeurpeakglobal.com.
Fund Statistics
| Net Assets | $187,809,491 |
| Number of Portfolio Holdings | 286 |
| Advisory Fee | $1,079,343 |
| Portfolio Turnover | 26% |
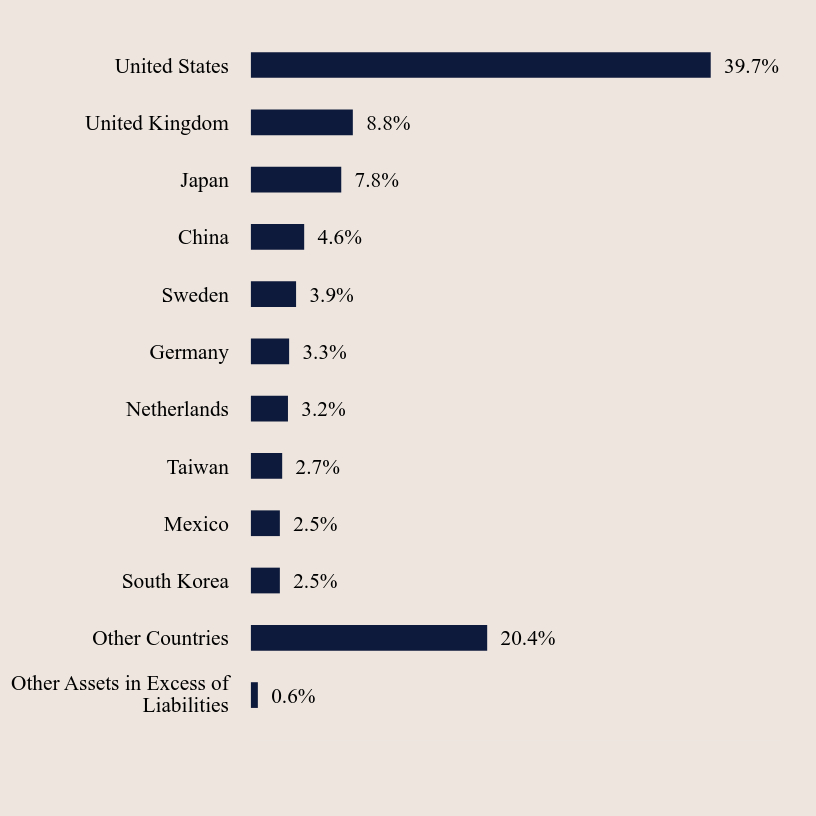
Country Weighting (% of net assets)
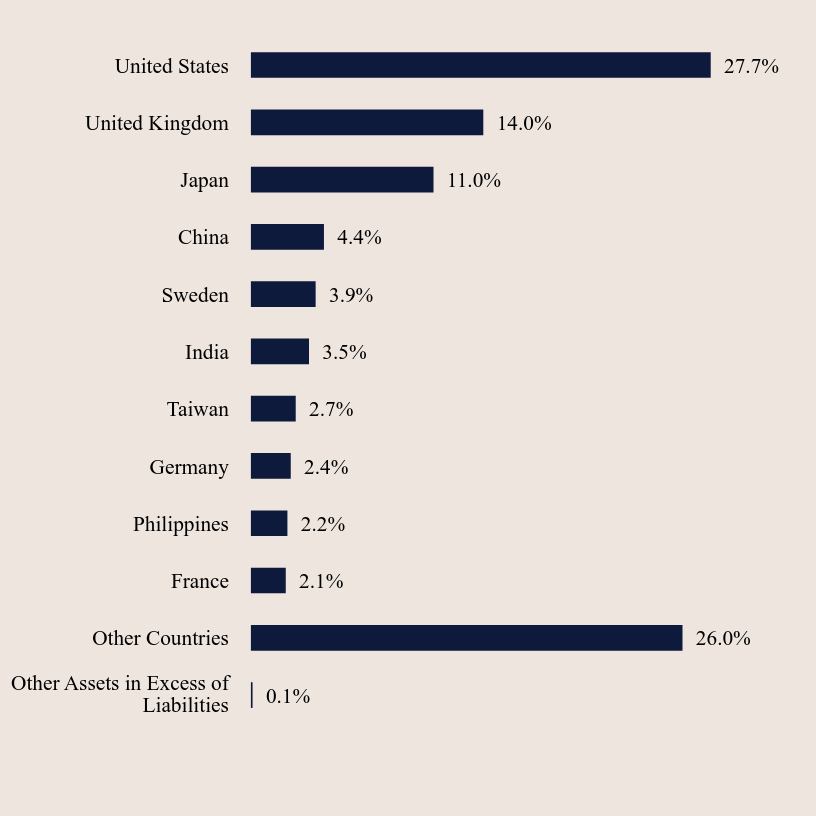
| Value | Value |
|---|---|
| Other Assets in Excess of Liabilities | 0.1% |
| Other Countries | 26.0% |
| France | 2.1% |
| Philippines | 2.2% |
| Germany | 2.4% |
| Taiwan | 2.7% |
| India | 3.5% |
| Sweden | 3.9% |
| China | 4.4% |
| Japan | 11.0% |
| United Kingdom | 14.0% |
| United States | 27.7% |
Top 10 Holdings (% of net assets)
| Holding Name | % of Net Assets |
| BayCurrent Consulting, Inc. | 1.7% |
| Plover Bay Tech | 1.5% |
| B & M European Value Retail SA | 1.1% |
| Virbac SA | 1.1% |
| JTC plc | 1.1% |
| Perella Weinberg Partners | 1.1% |
| Silergy Corp | 1.1% |
| Globant S.A. | 1.0% |
| CVS Group plc | 0.9% |
| Ace Hardware Indonesia Tbk P.T. | 0.9% |
What did the Fund invest in?
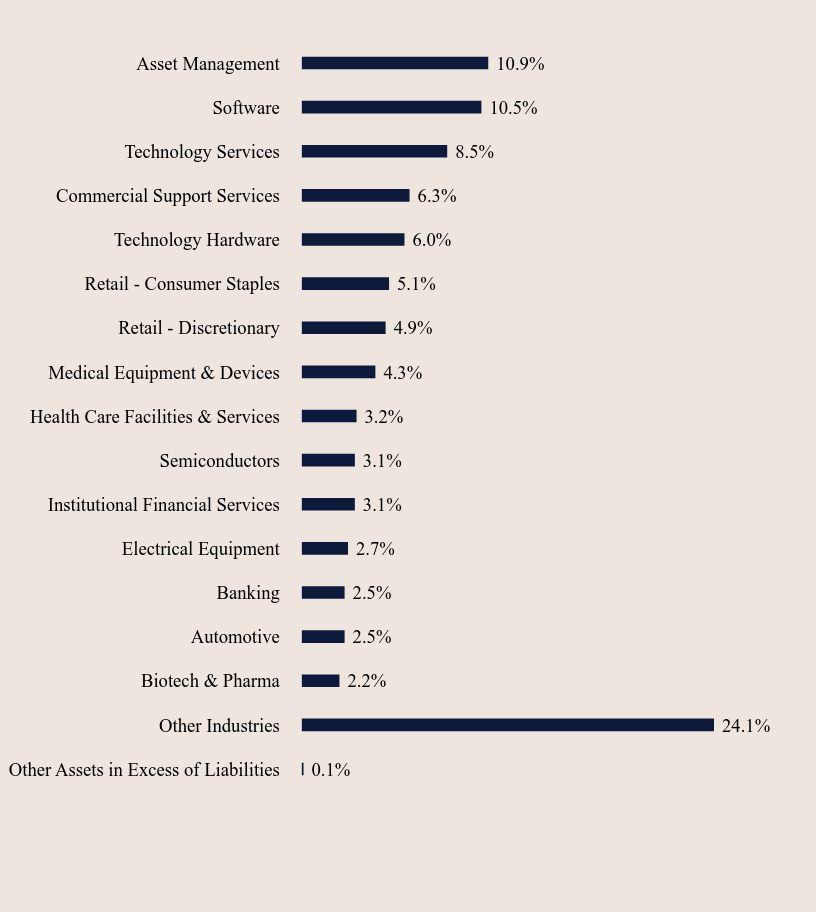
Industry Weighting (% of net assets)

| Value | Value |
|---|---|
| Other Assets in Excess of Liabilities | 0.1% |
| Other Industries | 24.1% |
| Biotech & Pharma | 2.2% |
| Automotive | 2.5% |
| Banking | 2.5% |
| Electrical Equipment | 2.7% |
| Institutional Financial Services | 3.1% |
| Semiconductors | 3.1% |
| Health Care Facilities & Services | 3.2% |
| Medical Equipment & Devices | 4.3% |
| Retail - Discretionary | 4.9% |
| Retail - Consumer Staples | 5.1% |
| Technology Hardware | 6.0% |
| Commercial Support Services | 6.3% |
| Technology Services | 8.5% |
| Software | 10.5% |
| Asset Management | 10.9% |
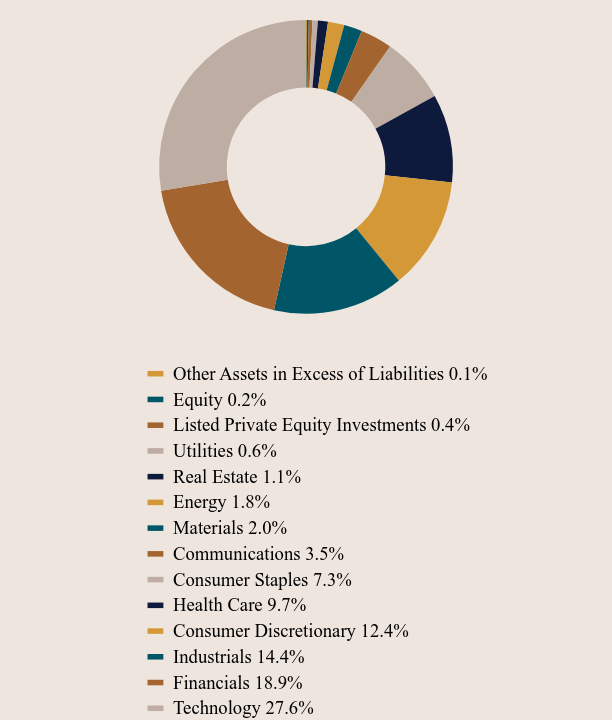
Sector Weighting (% of net assets)
| Value | Value |
|---|---|
| Other Assets in Excess of Liabilities | 0.1% |
| Equity | 0.2% |
| Listed Private Equity Investments | 0.4% |
| Utilities | 0.6% |
| Real Estate | 1.1% |
| Energy | 1.8% |
| Materials | 2.0% |
| Communications | 3.5% |
| Consumer Staples | 7.3% |
| Health Care | 9.7% |
| Consumer Discretionary | 12.4% |
| Industrials | 14.4% |
| Financials | 18.9% |
| Technology | 27.6% |
Go Paperless! Update your communication preferences on our website, www.grandeurpeakglobal.com, or call 1-855-377-7325 (PEAK).
Material Fund Changes
No material changes occurred during the period ended October 31, 2024.
Where can I find additional information about the Fund?
Additional information is available on the Fund's website ( https://grandeurpeakglobal.com/literature/ ), including its:
Prospectus
Financial information
Holdings
Proxy voting information
TSR-SAR 103124-GPRIX
Grandeur Peak Global Reach Fund - Institutional Class (GPRIX)
Semi-Annual Shareholder Report - October 31, 2024
Grandeur Peak Global Reach Fund
Investor Class (GPROX)
Semi-Annual Shareholder Report - October 31, 2024

Fund Overview
This semi-annual shareholder report contains important information about Grandeur Peak Global Reach Fund for the period of May 1, 2024 to October 31, 2024. You can find additional information about the Fund at https://grandeurpeakglobal.com/literature/. You can also request this information by contacting us at 1.855.377.7325 (PEAK).
What were the Fund’s costs for the last six months?
(based on a hypothetical $10,000 investment)
| Class Name | Costs of a $10,000 investment | Costs paid as a percentage of a $10,000 investment |
|---|---|---|
| Investor Class | $78 | 1.50%Footnote Reference* |
* Annualized
How did the Fund perform during the reporting period?
For the latest management letter and Fund performance please visit grandeurpeakglobal.com.
Fund Statistics
| Net Assets | $187,809,491 |
| Number of Portfolio Holdings | 286 |
| Advisory Fee | $1,079,343 |
| Portfolio Turnover | 26% |
Country Weighting (% of net assets)

| Value | Value |
|---|---|
| Other Assets in Excess of Liabilities | 0.1% |
| Other Countries | 26.0% |
| France | 2.1% |
| Philippines | 2.2% |
| Germany | 2.4% |
| Taiwan | 2.7% |
| India | 3.5% |
| Sweden | 3.9% |
| China | 4.4% |
| Japan | 11.0% |
| United Kingdom | 14.0% |
| United States | 27.7% |
Top 10 Holdings (% of net assets)
| Holding Name | % of Net Assets |
| BayCurrent Consulting, Inc. | 1.7% |
| Plover Bay Tech | 1.5% |
| B & M European Value Retail SA | 1.1% |
| Virbac SA | 1.1% |
| JTC plc | 1.1% |
| Perella Weinberg Partners | 1.1% |
| Silergy Corp | 1.1% |
| Globant S.A. | 1.0% |
| CVS Group plc | 0.9% |
| Ace Hardware Indonesia Tbk P.T. | 0.9% |
What did the Fund invest in?
Industry Weighting (% of net assets)
| Value | Value |
|---|---|
| Other Assets in Excess of Liabilities | 0.1% |
| Other Industries | 24.1% |
| Biotech & Pharma | 2.2% |
| Automotive | 2.5% |
| Banking | 2.5% |
| Electrical Equipment | 2.7% |
| Institutional Financial Services | 3.1% |
| Semiconductors | 3.1% |
| Health Care Facilities & Services | 3.2% |
| Medical Equipment & Devices | 4.3% |
| Retail - Discretionary | 4.9% |
| Retail - Consumer Staples | 5.1% |
| Technology Hardware | 6.0% |
| Commercial Support Services | 6.3% |
| Technology Services | 8.5% |
| Software | 10.5% |
| Asset Management | 10.9% |
Sector Weighting (% of net assets)

| Value | Value |
|---|---|
| Other Assets in Excess of Liabilities | 0.1% |
| Equity | 0.2% |
| Listed Private Equity Investments | 0.4% |
| Utilities | 0.6% |
| Real Estate | 1.1% |
| Energy | 1.8% |
| Materials | 2.0% |
| Communications | 3.5% |
| Consumer Staples | 7.3% |
| Health Care | 9.7% |
| Consumer Discretionary | 12.4% |
| Industrials | 14.4% |
| Financials | 18.9% |
| Technology | 27.6% |
Go Paperless! Update your communication preferences on our website, www.grandeurpeakglobal.com, or call 1-855-377-7325 (PEAK).
Material Fund Changes
No material changes occurred during the period ended October 31, 2024.
Where can I find additional information about the Fund?
Additional information is available on the Fund's website ( https://grandeurpeakglobal.com/literature/ ), including its:
Prospectus
Financial information
Holdings
Proxy voting information
TSR-SAR 103124-GPROX
Grandeur Peak Global Reach Fund - Investor Class (GPROX)
Semi-Annual Shareholder Report - October 31, 2024
Grandeur Peak Global Stalwarts Fund
Institutional Class (GGSYX)
Semi-Annual Shareholder Report - October 31, 2024

Fund Overview
This semi-annual shareholder report contains important information about Grandeur Peak Global Stalwarts Fund for the period of May 1, 2024 to October 31, 2024. You can find additional information about the Fund at https://grandeurpeakglobal.com/literature/. You can also request this information by contacting us at 1.855.377.7325 (PEAK).
What were the Fund’s costs for the last six months?
(based on a hypothetical $10,000 investment)
| Class Name | Costs of a $10,000 investment | Costs paid as a percentage of a $10,000 investment |
|---|---|---|
| Institutional Class | $56 | 1.09%Footnote Reference* |
* Annualized
How did the Fund perform during the reporting period?
For the latest management letter and Fund performance please visit grandeurpeakglobal.com.
Fund Statistics
| Net Assets | $120,295,277 |
| Number of Portfolio Holdings | 148 |
| Advisory Fee | $532,452 |
| Portfolio Turnover | 35% |
Country Weighting (% of net assets)
| Value | Value |
|---|---|
| Other Assets in Excess of Liabilities | 0.6% |
| Other Countries | 20.4% |
| South Korea | 2.5% |
| Mexico | 2.5% |
| Taiwan | 2.7% |
| Netherlands | 3.2% |
| Germany | 3.3% |
| Sweden | 3.9% |
| China | 4.6% |
| Japan | 7.8% |
| United Kingdom | 8.8% |
| United States | 39.7% |
Top 10 Holdings (% of net assets)
| Holding Name | % of Net Assets |
| Silergy Corp | 3.3% |
| BayCurrent Consulting, Inc. | 3.1% |
| B & M European Value Retail SA | 3.1% |
| Littelfuse, Inc. | 2.7% |
| Globant S.A. | 1.8% |
| JTC plc | 1.8% |
| Lululemon Athletica, Inc. | 1.5% |
| Techtronic Industries Co Limited | 1.4% |
| Virbac SA | 1.3% |
| Silicon Laboratories, Inc. | 1.2% |
What did the Fund invest in?
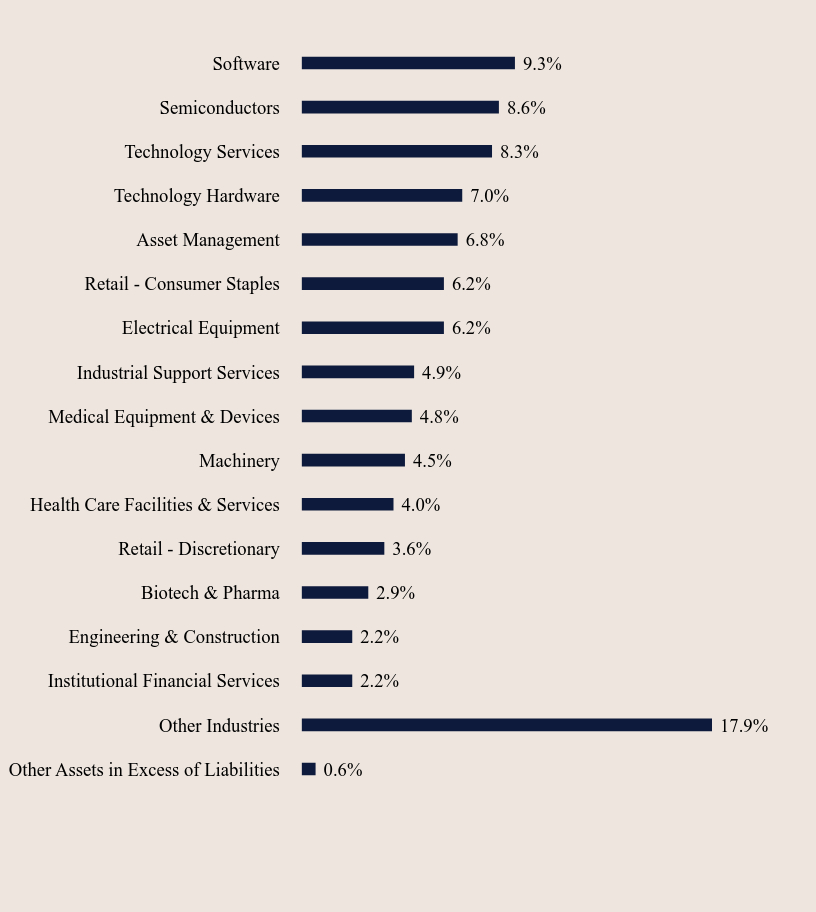
Industry Weighting (% of net assets)
| Value | Value |
|---|---|
| Other Assets in Excess of Liabilities | 0.6% |
| Other Industries | 17.9% |
| Institutional Financial Services | 2.2% |
| Engineering & Construction | 2.2% |
| Biotech & Pharma | 2.9% |
| Retail - Discretionary | 3.6% |
| Health Care Facilities & Services | 4.0% |
| Machinery | 4.5% |
| Medical Equipment & Devices | 4.8% |
| Industrial Support Services | 4.9% |
| Electrical Equipment | 6.2% |
| Retail - Consumer Staples | 6.2% |
| Asset Management | 6.8% |
| Technology Hardware | 7.0% |
| Technology Services | 8.3% |
| Semiconductors | 8.6% |
| Software | 9.3% |
Sector Weighting (% of net assets)
| Value | Value |
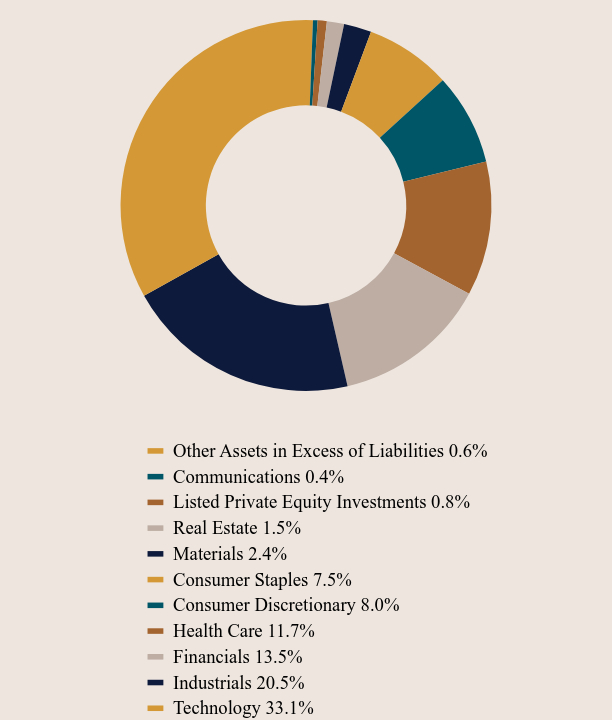
|---|---|
| Other Assets in Excess of Liabilities | 0.6% |
| Communications | 0.4% |
| Listed Private Equity Investments | 0.8% |
| Real Estate | 1.5% |
| Materials | 2.4% |
| Consumer Staples | 7.5% |
| Consumer Discretionary | 8.0% |
| Health Care | 11.7% |
| Financials | 13.5% |
| Industrials | 20.5% |
| Technology | 33.1% |
Go Paperless! Update your communication preferences on our website, www.grandeurpeakglobal.com, or call 1-855-377-7325 (PEAK).
Material Fund Changes
No material changes occurred during the period ended October 31, 2024.
Where can I find additional information about the Fund?
Additional information is available on the Fund's website ( https://grandeurpeakglobal.com/literature/ ), including its:
Prospectus
Financial information
Holdings
Proxy voting information
TSR-SAR 103124-GGSYX
Grandeur Peak Global Stalwarts Fund - Institutional Class (GGSYX)
Semi-Annual Shareholder Report - October 31, 2024
Grandeur Peak Global Stalwarts Fund
Investor Class (GGSOX)
Semi-Annual Shareholder Report - October 31, 2024

Fund Overview
This semi-annual shareholder report contains important information about Grandeur Peak Global Stalwarts Fund for the period of May 1, 2024 to December 31, 2024. You can find additional information about the Fund at https://grandeurpeakglobal.com/literature/. You can also request this information by contacting us at 1.855.377.7325 (PEAK). This report describes changes to the Fund that occurred during the reporting period.
What were the Fund’s costs for the last six months?
(based on a hypothetical $10,000 investment)
| Class Name | Costs of a $10,000 investment | Costs paid as a percentage of a $10,000 investment |
|---|---|---|
| Investor Class | $69 | 1.34%Footnote Reference* |
* Annualized
How did the Fund perform during the reporting period?
For the latest management letter and Fund performance please visit grandeurpeakglobal.com.
Fund Statistics
| Net Assets | $120,295,277 |
|---|---|
| Number of Portfolio Holdings | 148 |
| Advisory Fee #ERROR:A result could not be returned because the conditional could not be evaluated to a True/False value ((history)) | $532,452 |
| Portfolio Turnover | 35% |
Country Weighting (% of net assets)

| Value | Value |
|---|---|
| Other Assets in Excess of Liabilities | 0.6% |
| Other Countries | 20.4% |
| South Korea | 2.5% |
| Mexico | 2.5% |
| Taiwan | 2.7% |
| Netherlands | 3.2% |
| Germany | 3.3% |
| Sweden | 3.9% |
| China | 4.6% |
| Japan | 7.8% |
| United Kingdom | 8.8% |
| United States | 39.7% |
Top 10 Holdings (% of net assets)
| Holding Name | % of Net Assets |
| Silergy Corp | 3.3% |
| BayCurrent Consulting, Inc. | 3.1% |
| B & M European Value Retail SA | 3.1% |
| Littelfuse, Inc. | 2.7% |
| Globant S.A. | 1.8% |
| JTC plc | 1.8% |
| Lululemon Athletica, Inc. | 1.5% |
| Techtronic Industries Co Limited | 1.4% |
| Virbac SA | 1.3% |
| Silicon Laboratories, Inc. | 1.2% |
What did the Fund invest in?
Industry Weighting (% of net assets)

| Value | Value |
|---|---|
| Other Assets in Excess of Liabilities | 0.6% |
| Other Industries | 17.9% |
| Institutional Financial Services | 2.2% |
| Engineering & Construction | 2.2% |
| Biotech & Pharma | 2.9% |
| Retail - Discretionary | 3.6% |
| Health Care Facilities & Services | 4.0% |
| Machinery | 4.5% |
| Medical Equipment & Devices | 4.8% |
| Industrial Support Services | 4.9% |
| Electrical Equipment | 6.2% |
| Retail - Consumer Staples | 6.2% |
| Asset Management | 6.8% |
| Technology Hardware | 7.0% |
| Technology Services | 8.3% |
| Semiconductors | 8.6% |
| Software | 9.3% |
Sector Weighting (% of net assets)

| Value | Value |
|---|---|
| Other Assets in Excess of Liabilities | 0.6% |
| Communications | 0.4% |
| Listed Private Equity Investments | 0.8% |
| Real Estate | 1.5% |
| Materials | 2.4% |
| Consumer Staples | 7.5% |
| Consumer Discretionary | 8.0% |
| Health Care | 11.7% |
| Financials | 13.5% |
| Industrials | 20.5% |
| Technology | 33.1% |
Go Paperless! Update your communication preferences on our website, www.grandeurpeakglobal.com, or call 1-855-377-7325 (PEAK).
Material Fund Changes
No material changes occurred during the period ended October 31, 2024.
Where can I find additional information about the Fund?
Additional information is available on the Fund's website ( https://grandeurpeakglobal.com/literature/ ), including its:
Prospectus
Financial information
Holdings
Proxy voting information
TSR-SAR 103124-GGSOX
Grandeur Peak Global Stalwarts Fund - Investor Class (GGSOX)
Semi-Annual Shareholder Report - October 31, 2024
Grandeur Peak International Opportunities Fund
Institutional Class (GPIIX)
Semi-Annual Shareholder Report - October 31, 2024

Fund Overview
This semi-annual shareholder report contains important information about Grandeur Peak International Opportunities Fund for the period of May 1, 2024 to October 31, 2024. You can find additional information about the Fund at https://grandeurpeakglobal.com/literature/. You can also request this information by contacting us at 1.855.377.7325 (PEAK).
What were the Fund’s costs for the last six months?
(based on a hypothetical $10,000 investment)
| Class Name | Costs of a $10,000 investment | Costs paid as a percentage of a $10,000 investment |
|---|---|---|
| Institutional Class | $69 | 1.36%Footnote Reference* |
* Annualized
How did the Fund perform during the reporting period?
For the latest management letter and Fund performance please visit grandeurpeakglobal.com.
Fund Statistics
| Net Assets | $428,399,587 |
| Number of Portfolio Holdings | 142 |
| Advisory Fee | $3,131,917 |
| Portfolio Turnover | 15% |
Country Weighting (% of net assets)
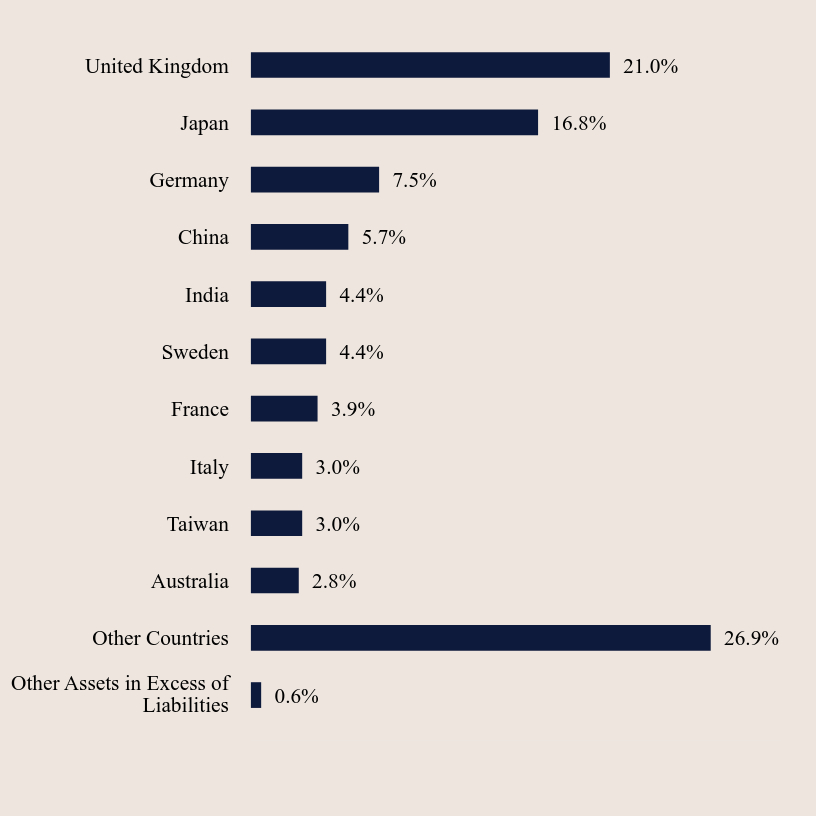
| Value | Value |
|---|---|
| Other Assets in Excess of Liabilities | 0.6% |
| Other Countries | 26.9% |
| Australia | 2.8% |
| Taiwan | 3.0% |
| Italy | 3.0% |
| France | 3.9% |
| Sweden | 4.4% |
| India | 4.4% |
| China | 5.7% |
| Germany | 7.5% |
| Japan | 16.8% |
| United Kingdom | 21.0% |
Top 10 Holdings (% of net assets)
| Holding Name | % of Net Assets |
| B & M European Value Retail SA | 3.0% |
| JTC plc | 2.7% |
| Silergy Corp | 2.6% |
| BayCurrent Consulting, Inc. | 2.6% |
| Virbac SA | 2.0% |
| Volution Group PLC | 2.0% |
| Sporton International, Inc. | 1.7% |
| CVS Group plc | 1.7% |
| Integral Corp | 1.6% |
| Interpump Group SpA | 1.4% |
What did the Fund invest in?
Industry Weighting (% of net assets)
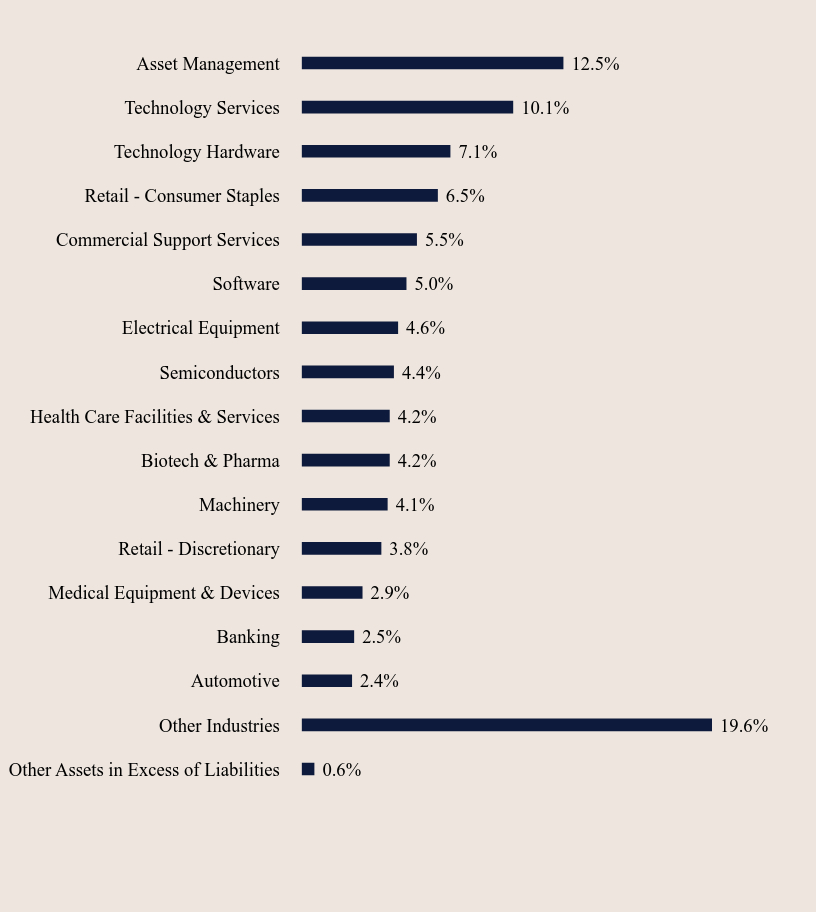
| Value | Value |
|---|---|
| Other Assets in Excess of Liabilities | 0.6% |
| Other Industries | 19.6% |
| Automotive | 2.4% |
| Banking | 2.5% |
| Medical Equipment & Devices | 2.9% |
| Retail - Discretionary | 3.8% |
| Machinery | 4.1% |
| Biotech & Pharma | 4.2% |
| Health Care Facilities & Services | 4.2% |
| Semiconductors | 4.4% |
| Electrical Equipment | 4.6% |
| Software | 5.0% |
| Commercial Support Services | 5.5% |
| Retail - Consumer Staples | 6.5% |
| Technology Hardware | 7.1% |
| Technology Services | 10.1% |
| Asset Management | 12.5% |
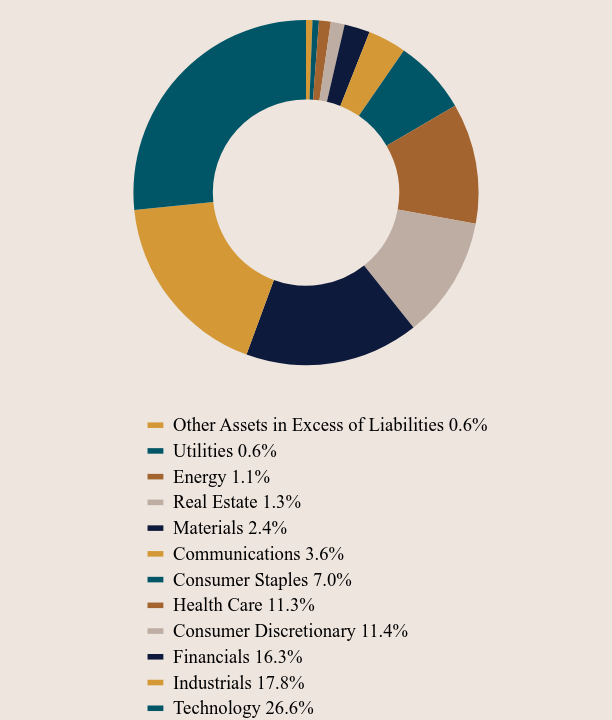
Sector Weighting (% of net assets)

| Value | Value |
|---|---|
| Other Assets in Excess of Liabilities | 0.6% |
| Utilities | 0.6% |
| Energy | 1.1% |
| Real Estate | 1.3% |
| Materials | 2.4% |
| Communications | 3.6% |
| Consumer Staples | 7.0% |
| Health Care | 11.3% |
| Consumer Discretionary | 11.4% |
| Financials | 16.3% |
| Industrials | 17.8% |
| Technology | 26.6% |
Go Paperless! Update your communication preferences on our website, www.grandeurpeakglobal.com, or call 1-855-377-7325 (PEAK).
Material Fund Changes
No material changes occurred during the period ended October 31, 2024.
Where can I find additional information about the Fund?
Additional information is available on the Fund's website ( https://grandeurpeakglobal.com/literature/ ), including its:
Prospectus
Financial information
Holdings
Proxy voting information
TSR-SAR 103124-GPIIX
Grandeur Peak International Opportunities Fund - Institutional Class (GPIIX)
Semi-Annual Shareholder Report - October 31, 2024
Grandeur Peak International Opportunities Fund
Investor Class (GPIOX)
Semi-Annual Shareholder Report - October 31, 2024

Fund Overview
This semi-annual shareholder report contains important information about Grandeur Peak International Opportunities Fund for the period of May 1, 2024 to October 31, 2024. You can find additional information about the Fund at https://grandeurpeakglobal.com/literature/. You can also request this information by contacting us at 1.855.377.7325 (PEAK).
What were the Fund’s costs for the last six months?
(based on a hypothetical $10,000 investment)
| Class Name | Costs of a $10,000 investment | Costs paid as a percentage of a $10,000 investment |
|---|---|---|
| Investor Class | $82 | 1.61%Footnote Reference* |
* Annualized
How did the Fund perform during the reporting period?
For the latest management letter and Fund performance please visit grandeurpeakglobal.com.
Fund Statistics
| Net Assets | $428,399,587 |
| Number of Portfolio Holdings | 142 |
| Advisory Fee | $3,131,917 |
| Portfolio Turnover | 15% |
Country Weighting (% of net assets)

| Value | Value |
|---|---|
| Other Assets in Excess of Liabilities | 0.6% |
| Other Countries | 26.9% |
| Australia | 2.8% |
| Taiwan | 3.0% |
| Italy | 3.0% |
| France | 3.9% |
| Sweden | 4.4% |
| India | 4.4% |
| China | 5.7% |
| Germany | 7.5% |
| Japan | 16.8% |
| United Kingdom | 21.0% |
Top 10 Holdings (% of net assets)
| Holding Name | % of Net Assets |
| B & M European Value Retail SA | 3.0% |
| JTC plc | 2.7% |
| Silergy Corp | 2.6% |
| BayCurrent Consulting, Inc. | 2.6% |
| Virbac SA | 2.0% |
| Volution Group PLC | 2.0% |
| Sporton International, Inc. | 1.7% |
| CVS Group plc | 1.7% |
| Integral Corp | 1.6% |
| Interpump Group SpA | 1.4% |
What did the Fund invest in?
Industry Weighting (% of net assets)

| Value | Value |
|---|---|
| Other Assets in Excess of Liabilities | 0.6% |
| Other Industries | 19.6% |
| Automotive | 2.4% |
| Banking | 2.5% |
| Medical Equipment & Devices | 2.9% |
| Retail - Discretionary | 3.8% |
| Machinery | 4.1% |
| Biotech & Pharma | 4.2% |
| Health Care Facilities & Services | 4.2% |
| Semiconductors | 4.4% |
| Electrical Equipment | 4.6% |
| Software | 5.0% |
| Commercial Support Services | 5.5% |
| Retail - Consumer Staples | 6.5% |
| Technology Hardware | 7.1% |
| Technology Services | 10.1% |
| Asset Management | 12.5% |
Sector Weighting (% of net assets)
| Value | Value |
|---|---|
| Other Assets in Excess of Liabilities | 0.6% |
| Utilities | 0.6% |
| Energy | 1.1% |
| Real Estate | 1.3% |
| Materials | 2.4% |
| Communications | 3.6% |
| Consumer Staples | 7.0% |
| Health Care | 11.3% |
| Consumer Discretionary | 11.4% |
| Financials | 16.3% |
| Industrials | 17.8% |
| Technology | 26.6% |
Go Paperless! Update your communication preferences on our website, www.grandeurpeakglobal.com, or call 1-855-377-7325 (PEAK).
Material Fund Changes
No material changes occurred during the period ended October 31, 2024.
Where can I find additional information about the Fund?
Additional information is available on the Fund's website ( https://grandeurpeakglobal.com/literature/ ), including its:
Prospectus
Financial information
Holdings
Proxy voting information
TSR-SAR 103124-GPIOX
Grandeur Peak International Opportunities Fund - Investor Class (GPIOX)
Semi-Annual Shareholder Report - October 31, 2024
Grandeur Peak International Stalwarts Fund
Institutional Class (GISYX)
Semi-Annual Shareholder Report - October 31, 2024

Fund Overview
This semi-annual shareholder report contains important information about Grandeur Peak International Stalwarts Fund for the period of May 1, 2024 to October 31, 2024. You can find additional information about the Fund at https://grandeurpeakglobal.com/literature/. You can also request this information by contacting us at 1.855.377.7325 (PEAK).
What were the Fund’s costs for the last six months?
(based on a hypothetical $10,000 investment)
| Class Name | Costs of a $10,000 investment | Costs paid as a percentage of a $10,000 investment |
|---|---|---|
| Institutional Class | $45 | 0.89%Footnote Reference* |
* Annualized
How did the Fund perform during the reporting period?
For the latest management letter and Fund performance please visit grandeurpeakglobal.com.
Fund Statistics
| Net Assets | $1,635,443,997 |
| Number of Portfolio Holdings | 118 |
| Advisory Fee | $6,742,283 |
| Portfolio Turnover | 27% |
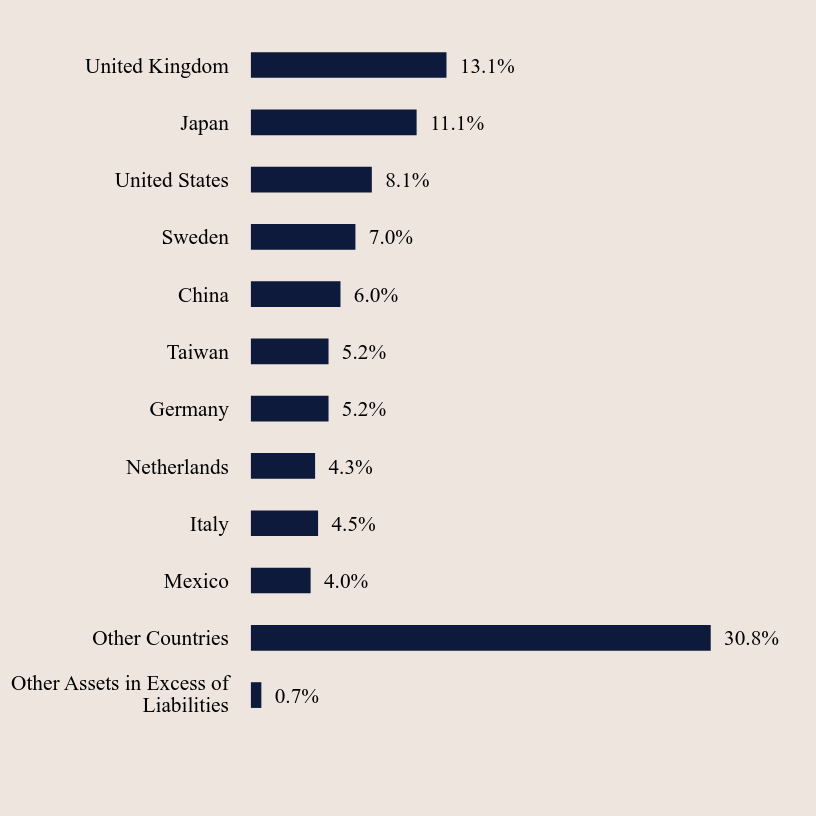
Country Weighting (% of net assets)

| Value | Value |
|---|---|
| Other Assets in Excess of Liabilities | 0.7% |
| Other Countries | 30.8% |
| Mexico | 4.0% |
| Italy | 4.5% |
| Netherlands | 4.3% |
| Germany | 5.2% |
| Taiwan | 5.2% |
| China | 6.0% |
| Sweden | 7.0% |
| United States | 8.1% |
| Japan | 11.1% |
| United Kingdom | 13.1% |
Top 10 Holdings (% of net assets)
| Holding Name | % of Net Assets |
| B & M European Value Retail SA | 4.2% |
| BayCurrent Consulting, Inc. | 3.6% |
| Silergy Corp | 3.6% |
| Diploma plc | 2.3% |
| Techtronic Industries Co Limited | 2.1% |
| JFrog Ltd. | 1.9% |
| Lululemon Athletica, Inc. | 1.9% |
| Melexis NV | 1.8% |
| Globant S.A. | 1.8% |
| Interpump Group SpA | 1.7% |
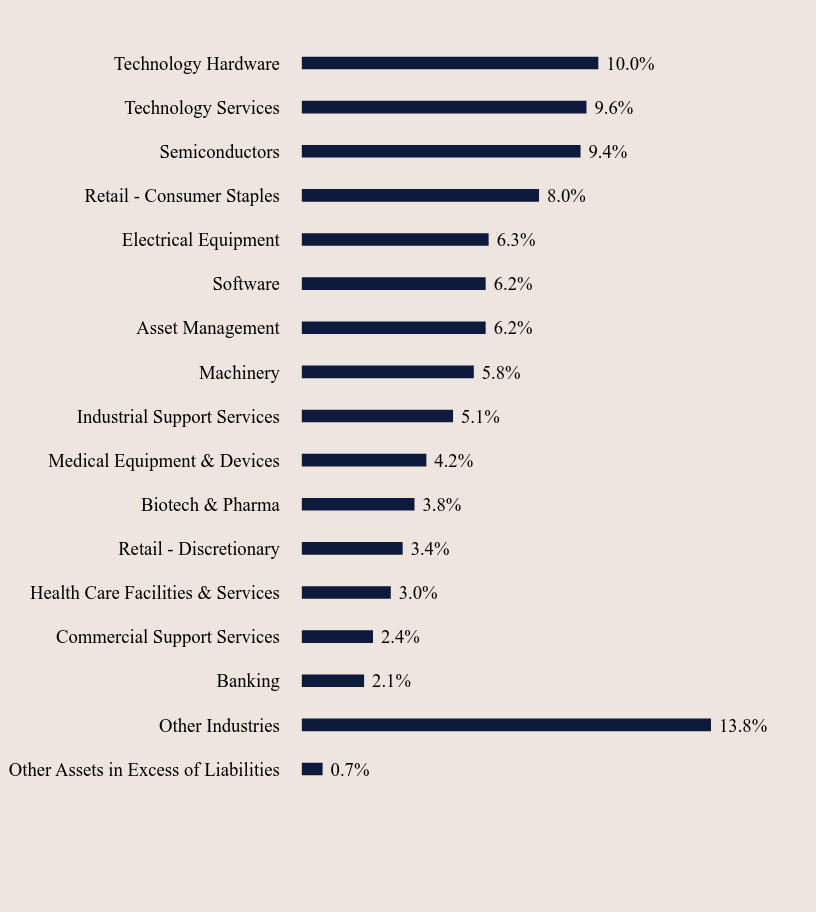
What did the Fund invest in?
Industry Weighting (% of net assets)

| Value | Value |
|---|---|
| Other Assets in Excess of Liabilities | 0.7% |
| Other Industries | 13.8% |
| Banking | 2.1% |
| Commercial Support Services | 2.4% |
| Health Care Facilities & Services | 3.0% |
| Retail - Discretionary | 3.4% |
| Biotech & Pharma | 3.8% |
| Medical Equipment & Devices | 4.2% |
| Industrial Support Services | 5.1% |
| Machinery | 5.8% |
| Asset Management | 6.2% |
| Software | 6.2% |
| Electrical Equipment | 6.3% |
| Retail - Consumer Staples | 8.0% |
| Semiconductors | 9.4% |
| Technology Services | 9.6% |
| Technology Hardware | 10.0% |
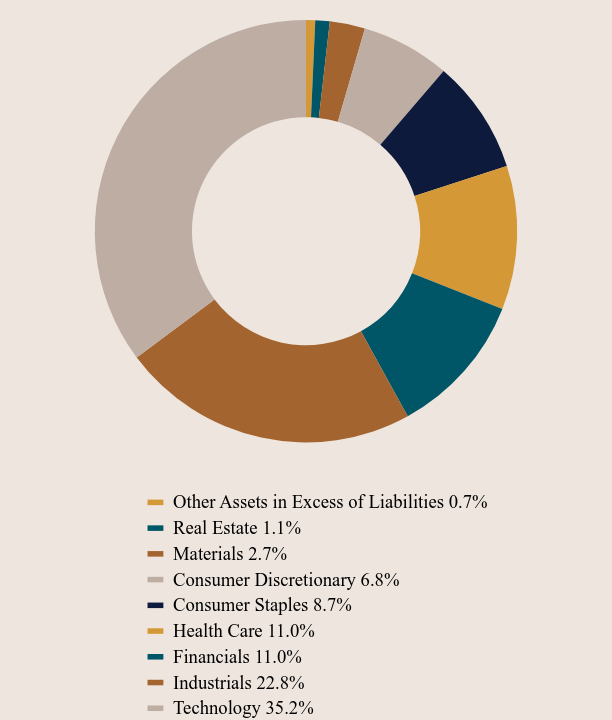
Sector Weighting (% of net assets)

| Value | Value |
|---|---|
| Other Assets in Excess of Liabilities | 0.7% |
| Real Estate | 1.1% |
| Materials | 2.7% |
| Consumer Discretionary | 6.8% |
| Consumer Staples | 8.7% |
| Health Care | 11.0% |
| Financials | 11.0% |
| Industrials | 22.8% |
| Technology | 35.2% |
Go Paperless! Update your communication preferences on our website, www.grandeurpeakglobal.com, or call 1-855-377-7325 (PEAK).
Material Fund Changes
No material changes occurred during the period ended October 31, 2024.
Where can I find additional information about the Fund?
Additional information is available on the Fund's website ( https://grandeurpeakglobal.com/literature/ ), including its:
Prospectus
Financial information
Holdings
Proxy voting information
TSR-SAR 103124-GISYX
Grandeur Peak International Stalwarts Fund - Institutional Class (GISYX)
Semi-Annual Shareholder Report - October 31, 2024
Grandeur Peak International Stalwarts Fund
Investor Class (GISOX)
Semi-Annual Shareholder Report - October 31, 2024

Fund Overview
This semi-annual shareholder report contains important information about Grandeur Peak International Stalwarts Fund for the period of May 1, 2024 to October 31, 2024. You can find additional information about the Fund at https://grandeurpeakglobal.com/literature/. You can also request this information by contacting us at 1.855.377.7325 (PEAK).
What were the Fund’s costs for the last six months?
(based on a hypothetical $10,000 investment)
| Class Name | Costs of a $10,000 investment | Costs paid as a percentage of a $10,000 investment |
|---|---|---|
| Investor Class | $58 | 1.15%Footnote Reference* |
* Annualized
How did the Fund perform during the reporting period?
For the latest management letter and Fund performance please visit grandeurpeakglobal.com.
Fund Statistics
| Net Assets | $1,635,443,997 |
| Number of Portfolio Holdings | 118 |
| Advisory Fee | $6,742,283 |
| Portfolio Turnover | 27% |
Country Weighting (% of net assets)
| Value | Value |
|---|---|
| Other Assets in Excess of Liabilities | 0.7% |
| Other Countries | 30.8% |
| Mexico | 4.0% |
| Italy | 4.5% |
| Netherlands | 4.3% |
| Germany | 5.2% |
| Taiwan | 5.2% |
| China | 6.0% |
| Sweden | 7.0% |
| United States | 8.1% |
| Japan | 11.1% |
| United Kingdom | 13.1% |
Top 10 Holdings (% of net assets)
| Holding Name | % of Net Assets |
| B & M European Value Retail SA | 4.2% |
| BayCurrent Consulting, Inc. | 3.6% |
| Silergy Corp | 3.6% |
| Diploma plc | 2.3% |
| Techtronic Industries Co Limited | 2.1% |
| JFrog Ltd. | 1.9% |
| Lululemon Athletica, Inc. | 1.9% |
| Melexis NV | 1.8% |
| Globant S.A. | 1.8% |
| Interpump Group SpA | 1.7% |
What did the Fund invest in?
Industry Weighting (% of net assets)
| Value | Value |
|---|---|
| Other Assets in Excess of Liabilities | 0.7% |
| Other Industries | 13.8% |
| Banking | 2.1% |
| Commercial Support Services | 2.4% |
| Health Care Facilities & Services | 3.0% |
| Retail - Discretionary | 3.4% |
| Biotech & Pharma | 3.8% |
| Medical Equipment & Devices | 4.2% |
| Industrial Support Services | 5.1% |
| Machinery | 5.8% |
| Asset Management | 6.2% |
| Software | 6.2% |
| Electrical Equipment | 6.3% |
| Retail - Consumer Staples | 8.0% |
| Semiconductors | 9.4% |
| Technology Services | 9.6% |
| Technology Hardware | 10.0% |
Sector Weighting (% of net assets)
| Value | Value |
|---|---|
| Other Assets in Excess of Liabilities | 0.7% |
| Real Estate | 1.1% |
| Materials | 2.7% |
| Consumer Discretionary | 6.8% |
| Consumer Staples | 8.7% |
| Health Care | 11.0% |
| Financials | 11.0% |
| Industrials | 22.8% |
| Technology | 35.2% |
Go Paperless! Update your communication preferences on our website, www.grandeurpeakglobal.com, or call 1-855-377-7325 (PEAK).
Material Fund Changes
No material changes occurred during the period ended October 31, 2024.
Where can I find additional information about the Fund?
Additional information is available on the Fund's website ( https://grandeurpeakglobal.com/literature/ ), including its:
Prospectus
Financial information
Holdings
Proxy voting information
TSR-SAR 103124-GISOX
Grandeur Peak International Stalwarts Fund - Investor Class (GISOX)
Semi-Annual Shareholder Report - October 31, 2024
Grandeur Peak US Stalwarts Fund
Institutional Class (GUSYX)
Semi-Annual Shareholder Report - October 31, 2024

Fund Overview
This semi-annual shareholder report contains important information about Grandeur Peak US Stalwarts Fund for the period of May 1, 2024 to October 31, 2024. You can find additional information about the Fund at https://grandeurpeakglobal.com/literature/. You can also request this information by contacting us at 1.855.377.7325 (PEAK).
What were the Fund’s costs for the last six months?
(based on a hypothetical $10,000 investment)
| Class Name | Costs of a $10,000 investment | Costs paid as a percentage of a $10,000 investment |
|---|---|---|
| Institutional | $48 | 0.92%Footnote Reference* |
* Annualized
How did the Fund perform during the reporting period?
For the latest management letter and Fund performance please visit grandeurpeakglobal.com.
Fund Statistics
| Net Assets | $139,557,654 |
| Number of Portfolio Holdings | 89 |
| Advisory Fee | $496,761 |
| Portfolio Turnover | 44% |
Country Weighting (% of net assets)
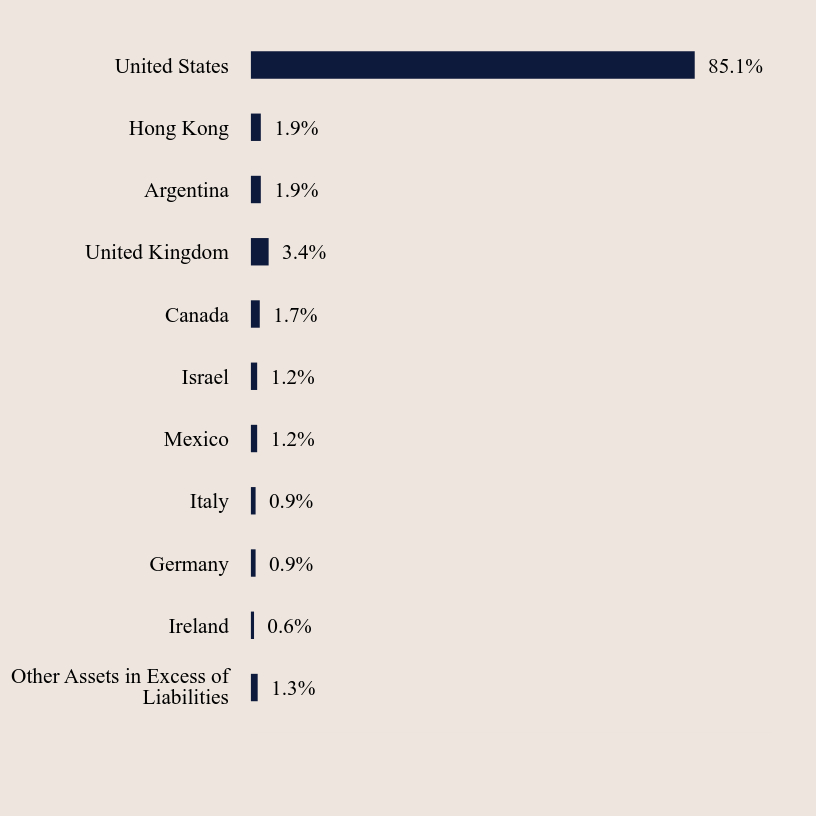
| Value | Value |
|---|---|
| Other Assets in Excess of Liabilities | 1.3% |
| Ireland | 0.6% |
| Germany | 0.9% |
| Italy | 0.9% |
| Mexico | 1.2% |
| Israel | 1.2% |
| Canada | 1.7% |
| United Kingdom | 3.4% |
| Argentina | 1.9% |
| Hong Kong | 1.9% |
| United States | 85.1% |
Top 10 Holdings (% of net assets)
| Holding Name | % of Net Assets |
| Littelfuse, Inc. | 2.9% |
| Lululemon Athletica, Inc. | 2.3% |
| Silicon Laboratories, Inc. | 2.0% |
| JFrog Ltd. | 1.9% |
| Techtronic Industries Co Limited | 1.9% |
| Globant S.A. | 1.9% |
| Ares Management Corporation, CLASS A | 1.9% |
| Herc Holdings, Inc. | 1.8% |
| Goosehead Insurance, Inc., CLASS A | 1.8% |
| Primoris Services Corporation | 1.7% |
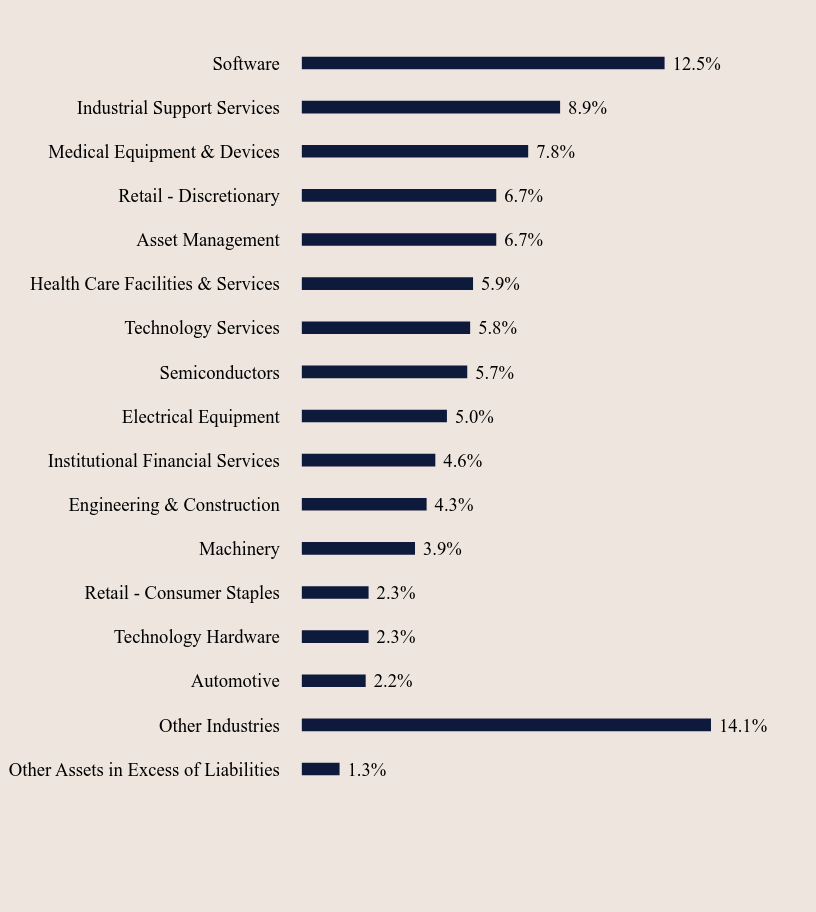
What did the Fund invest in?
Industry Weighting (% of net assets)
| Value | Value |
|---|---|
| Other Assets in Excess of Liabilities | 1.3% |
| Other Industries | 14.1% |
| Automotive | 2.2% |
| Technology Hardware | 2.3% |
| Retail - Consumer Staples | 2.3% |
| Machinery | 3.9% |
| Engineering & Construction | 4.3% |
| Institutional Financial Services | 4.6% |
| Electrical Equipment | 5.0% |
| Semiconductors | 5.7% |
| Technology Services | 5.8% |
| Health Care Facilities & Services | 5.9% |
| Asset Management | 6.7% |
| Retail - Discretionary | 6.7% |
| Medical Equipment & Devices | 7.8% |
| Industrial Support Services | 8.9% |
| Software | 12.5% |
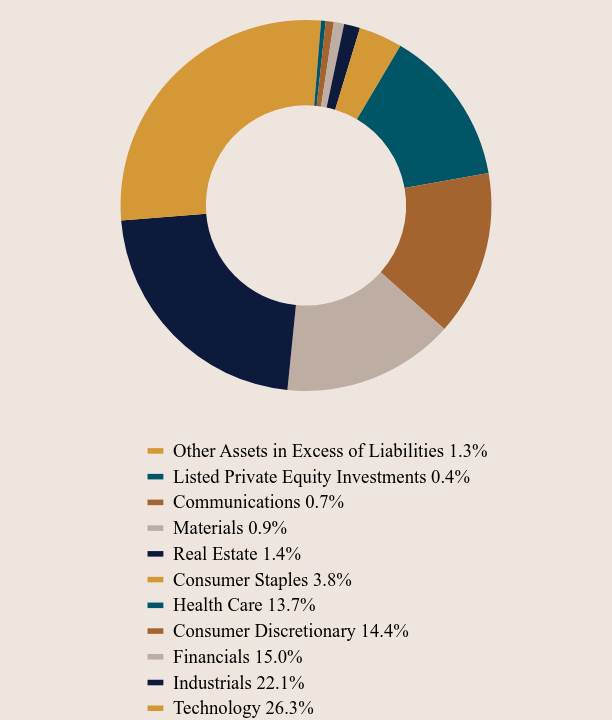
Sector Weighting (% of net assets)
| Value | Value |
|---|---|
| Other Assets in Excess of Liabilities | 1.3% |
| Listed Private Equity Investments | 0.4% |
| Communications | 0.7% |
| Materials | 0.9% |
| Real Estate | 1.4% |
| Consumer Staples | 3.8% |
| Health Care | 13.7% |
| Consumer Discretionary | 14.4% |
| Financials | 15.0% |
| Industrials | 22.1% |
| Technology | 26.3% |
Go Paperless! Update your communication preferences on our website, www.grandeurpeakglobal.com, or call 1-855-377-7325 (PEAK).
Material Fund Changes
No material changes occurred during the period ended October 31, 2024.
Where can I find additional information about the Fund?
Additional information is available on the Fund's website ( https://grandeurpeakglobal.com/literature/ ), including its:
Prospectus
Financial information
Holdings
Proxy voting information
TSR-SAR 103124-GUSYX
Grandeur Peak US Stalwarts Fund - Institutional (GUSYX)
Semi-Annual Shareholder Report - October 31, 2024
| (b) | Not applicable. |
Item 2. Code of Ethics.
Not applicable.
Item 3. Audit Committee Financial Expert.
Not applicable.
Item 4. Principal Accountant Fees and Services.
Not applicable.
Item 5. Audit Committee of Listed Registrants
Not applicable.
Item 6. Investments.
The Registrant’s schedule of investments in unaffiliated issuers is included in the Financial Statements under Item 7 of this form.
Item 7. Financial Statements and Financial Highlights for Open-End Management Investment Companies.
| (a) |

![]()
TABLE OF CONTENTS
| Schedule of Investments | ||
| Grandeur Peak Emerging Markets Opportunities Fund | 1 | |
| Grandeur Peak Global Contrarian Fund | 4 | |
| Grandeur Peak Global Explorer Fund | 7 | |
| Grandeur Peak Global Micro Cap Fund | 12 | |
| Grandeur Peak Global Opportunities Fund | 15 | |
| Grandeur Peak Global Reach Fund | 18 | |
| Grandeur Peak Global Stalwarts Fund | 23 | |
| Grandeur Peak International Opportunities Fund | 26 | |
| Grandeur Peak International Stalwarts Fund | 29 | |
| Grandeur Peak US Stalwarts Fund | 32 | |
| Statements of Assets and Liabilities | 34 | |
| Statements of Operations | 36 | |
| Statement of Changes in Net Assets | ||
| Grandeur Peak Emerging Markets Opportunities Fund | 38 | |
| Grandeur Peak Global Contrarian Fund | 39 | |
| Grandeur Peak Global Explorer Fund | 40 | |
| Grandeur Peak Global Micro Cap Fund | 41 | |
| Grandeur Peak Global Opportunities Fund | 42 | |
| Grandeur Peak Global Reach Fund | 43 | |
| Grandeur Peak Global Stalwarts Fund | 44 | |
| Grandeur Peak International Opportunities Fund | 45 | |
| Grandeur Peak International Stalwarts Fund | 46 | |
| Grandeur Peak US Stalwarts Fund | 47 | |
| Financial Highlights | ||
| Grandeur Peak Emerging Markets Opportunities Fund | 48 | |
| Grandeur Peak Global Contrarian Fund | 50 | |
| Grandeur Peak Global Explorer Fund | 51 | |
| Grandeur Peak Global Micro Cap Fund | 52 | |
| Grandeur Peak Global Opportunities Fund | 53 | |
| Grandeur Peak Global Reach Fund | 55 | |
| Grandeur Peak Global Stalwarts Fund | 57 | |
| Grandeur Peak International Opportunities Fund | 59 | |
| Grandeur Peak International Stalwarts Fund | 61 | |
| Grandeur Peak US Stalwarts Fund | 63 |
![]()
TABLE OF CONTENTS
| Notes to Financial Statements | 64 | |
| Additional Information | 78 |
Grandeur Peak Emerging Markets Opportunities Fund | Schedule of Investments |
| October 31, 2024 (Unaudited) |
| Shares | Fair Value | |||||||
| COMMON STOCKS — 99.21% | ||||||||
| Argentina — 2.19% | ||||||||
| Globant S.A.(a) | 32,049 | $ | 6,726,765 | |||||
| Brazil — 7.26% | ||||||||
| Armac Locacao Logistica | 1,985,900 | 2,569,410 | ||||||
| BR Advisory Partners | 1,211,300 | 3,140,710 | ||||||
| Grupo Mateus SA(a) | 3,561,100 | 4,656,723 | ||||||
| Locaweb Servicos de Internet S(a)(b)(c) | 2,050,300 | 1,475,317 | ||||||
| MercadoLibre, Inc.(a) | 1,217 | 2,479,248 | ||||||
| Raia Drogasil S.A. | 490,008 | 2,072,319 | ||||||
| Track & Field Co SA | 500,800 | 882,700 | ||||||
| Vinci Partners Invest Ltd | 240,732 | 2,469,910 | ||||||
| XP, Inc., Class A() | 147,973 | 2,583,609 | ||||||
| 22,329,946 | ||||||||
| China — 14.98% | ||||||||
| Adicon Holdings Ltd(a) | 1,721,100 | 1,413,144 | ||||||
| Angelalign Technology, Inc. | 202,600 | 1,591,885 | ||||||
| ANTA Sports Products Ltd. | 453,500 | 4,840,404 | ||||||
| Beijing Huafeng Test & Control | 98,100 | 1,649,553 | ||||||
| Centre Testing Int | 1,245,500 | 2,415,116 | ||||||
| Chaoju Eye Care Holdings Ltd | 4,540,000 | 1,667,326 | ||||||
| Man Wah Holdings Limited(a) | 4,972,200 | 3,612,577 | ||||||
| ManpowerGroup Greater China Lt(c) | 1,494,050 | 869,301 | ||||||
| Proya Cosmetics Co Ltd | 131,120 | 1,767,429 | ||||||
| Shanghai Hanbell Precise Machi | 884,000 | 2,287,639 | ||||||
| Shenzhen Mindray Bio-Medical Electronics Co. | 66,100 | 2,475,710 | ||||||
| Silergy Corp | 848,288 | 13,196,901 | ||||||
| Suofeiya Home Collection Co., Ltd., Class A | 1,077,300 | 2,936,889 | ||||||
| TK Group Holdings Ltd(b)(c) | 6,623,117 | 1,507,980 | ||||||
| Yum China Holdings Inc | 86,900 | 3,904,978 | ||||||
| 46,136,832 | ||||||||
| Colombia — 0.69% | ||||||||
| Parex Resources, Inc.(a) | 227,431 | 2,112,028 | ||||||
| Czech Republic — 0.49% | ||||||||
| CTP NV(a) | 90,261 | 1,509,801 | ||||||
| Greece — 1.54% | ||||||||
| Sarantis SA | 396,405 | 4,743,732 | ||||||
| Hong Kong — 4.73% | ||||||||
| Plover Bay Tech(c) | 9,628,000 | 6,679,788 | ||||||
| Techtronic Industries Co Limited(a) | 543,500 | 7,862,153 | ||||||
| 14,541,941 | ||||||||
| India — 13.09% | ||||||||
| Bajaj Finance Ltd | 34,611 | 2,827,519 | ||||||
| Cera Sanitaryware Ltd | 18,118 | 1,543,739 | ||||||
| City Union Bank Ltd | 1,267,053 | 2,638,934 | ||||||
| Five-Star Business(a) | 248,604 | 2,098,101 | ||||||
| Gulf Oil Lubricants India Ltd. | 270,796 | 3,804,325 | ||||||
| Home First Finance Co India Ltd.(a)(b)(c) | 226,876 | 3,176,289 | ||||||
| IndiaMart InterMesh Ltd(b)(c) | 102,407 | 3,037,736 | ||||||
| Indigo Paints Ltd | 165,285 | 3,229,325 | ||||||
| Shares | Fair Value | |||||||
| COMMON STOCKS — 99.21% (continued) | ||||||||
| India — 13.09% (continued) | ||||||||
| Likhitha Infrastructure Ltd(a) | 257,257 | $ | 1,118,810 | |||||
| LT Foods Ltd | 846,851 | 3,915,459 | ||||||
| Mankind Pharma Ltd.(a)(b) | 72,227 | 2,286,000 | ||||||
| Marksans Pharma Ltd. | 162,906 | 559,654 | ||||||
| Motherson Sumi Wiring India Ltd. | 4,553,786 | 3,391,122 | ||||||
| SJS Enterprises Ltd(a) | 464,559 | 6,693,848 | ||||||
| 40,320,861 | ||||||||
| Indonesia — 5.46% | ||||||||
| Arwana Citramulia Tbk P.T. | 41,025,200 | 1,998,119 | ||||||
| Aspirasi Hidup Indonesia | 54,890,900 | 3,144,515 | ||||||
| Bank BTPN Syariah Tbk PT | 8,656,300 | 587,419 | ||||||
| Metrodata Electronics Tbk | 90,095,500 | 3,650,888 | ||||||
| Selamat Sempurna Tbk PT | 29,476,800 | 3,624,966 | ||||||
| Ultrajaya Milk Industry & Trad | 34,286,900 | 3,801,402 | ||||||
| 16,807,309 | ||||||||
| Malaysia — 1.83% | ||||||||
| Bermaz Auto Bhd | 3,174,000 | 1,486,121 | ||||||
| Mr D.I.Y. Group Berhad | 8,298,800 | 4,135,716 | ||||||
| 5,621,837 | ||||||||
| Mexico — 7.32% | ||||||||
| Arca Continental S.A.B. de C.V. | 534,500 | 4,558,044 | ||||||
| BBB Foods Inc(a) | 68,399 | 2,184,664 | ||||||
| Corporativo Fragua SAB de CV(a) | 33,400 | 1,468,425 | ||||||
| Grupo Cementos de Chihuahua, S.A.B. de C.V(a) | 190,500 | 1,561,898 | ||||||
| Grupo Financiero Banorte SAB de CV | 300,000 | 2,093,076 | ||||||
| Grupo Rotoplas SAB de CV(a) | 1,073,611 | 1,095,817 | ||||||
| Kimberly-Clark de Mexico S.A.B. de C.V. | 922,900 | 1,329,297 | ||||||
| Regional SAB de cv(a) | 921,600 | 5,860,834 | ||||||
| Vesta Real Estate Corp. - ADR (a) | 90,516 | 2,358,847 | ||||||
| 22,510,902 | ||||||||
| Philippines — 4.37% | ||||||||
| Century Pacific Food, Inc. | 5,124,400 | 3,692,311 | ||||||
| Philippine Seven Corp(a) | 1,582,100 | 1,981,357 | ||||||
| Puregold Price Club Inc | 5,516,100 | 3,080,299 | ||||||
| Robinsons Land Corporation | 5,753,900 | 1,514,924 | ||||||
| Wilcon Depot Inc | 11,517,700 | 3,178,478 | ||||||
| 13,447,369 | ||||||||
| Poland — 4.13% | ||||||||
| Auto Partner SA | 505,712 | 2,691,033 | ||||||
| Dino Polska SA(a)(b)(c) | 65,496 | 5,427,456 | ||||||
| Inter Cars SA | 38,906 | 4,577,977 | ||||||
| 12,696,466 | ||||||||
| Singapore — 3.14% | ||||||||
| iFast Corporation | 990,100 | 5,602,051 | ||||||
| Riverstone Holdings Ltd.(a) | 2,348,100 | 1,607,729 | ||||||
| Venture Corp LTD.(a) | 245,900 | 2,466,500 | ||||||
| 9,676,280 | ||||||||
| South Africa — 0.53% | ||||||||
| Italtile Limited | 2,206,898 | 1,640,191 | ||||||
See accompanying notes to financial statements.
1
Grandeur Peak Emerging Markets Opportunities Fund | Schedule of Investments |
| October 31, 2024 (Unaudited) |
| Shares | Fair Value | |||||||
| COMMON STOCKS — 99.21% (continued) | ||||||||
| South Korea — 7.84% | ||||||||
| APR Corp/Korea(a) | 40,345 | $ | 1,452,220 | |||||
| Coupang Inc(a) | 66,417 | 1,712,894 | ||||||
| Eo Technics Co Ltd(a) | 22,189 | 2,701,566 | ||||||
| FNS Tech Co Ltd(a) | 209,673 | 1,414,859 | ||||||
| HPSP Company Ltd. | 67,925 | 1,490,201 | ||||||
| Hyundai Ezwel Co Ltd | 389,069 | 1,578,924 | ||||||
| iFamilySC Co Ltd(a) | 92,325 | 1,255,787 | ||||||
| Innox Advanced Materials | 62,025 | 1,100,857 | ||||||
| Kinx Inc. | 48,973 | 2,474,993 | ||||||
| LEENO Industrial Inc.(a) | 24,682 | 3,228,750 | ||||||
| Segyung Hitech Co Ltd | 378,214 | 1,977,969 | ||||||
| SOLUM Co Ltd(a) | 161,941 | 2,244,684 | ||||||
| Tokai Carbon Korea Co Ltd(a) | 24,086 | 1,481,742 | ||||||
| 24,115,446 | ||||||||
| Taiwan — 12.57% | ||||||||
| 91APP Inc | 598,000 | 1,735,500 | ||||||
| Acer E-Enabling Service Busine | 325,000 | 2,500,044 | ||||||
| Allied Supreme Corporation | 154,000 | 1,585,169 | ||||||
| Asia Vital Components Co., Ltd. | 149,000 | 2,862,211 | ||||||
| ASPEED Technology, Inc. | 23,000 | 2,924,597 | ||||||
| Gem Services Inc | 765,000 | 1,718,766 | ||||||
| M3 Technology Inc | 715,000 | 2,314,116 | ||||||
| Realtek Semiconductor Corporation(a) | 160,000 | 2,354,061 | ||||||
| Sinbon Electronics Co., Limited(a) | 848,000 | 6,960,562 | ||||||
| Sporton International, Inc.(a) | 1,139,805 | 7,458,137 | ||||||
| Voltronic Power Technology(a) | 56,108 | 3,700,064 | ||||||
| WITS Corp | 718,248 | 2,566,968 | ||||||
| 38,680,195 | ||||||||
| Thailand — 1.41% | ||||||||
| Humanica PCL | 8,383,900 | 2,699,977 | ||||||
| Sappe PCL(a) | 821,000 | 1,648,626 | ||||||
| 4,348,603 | ||||||||
| Vietnam — 5.64% | ||||||||
| Asia Commercial Bank JSC | 3,660,565 | 3,670,772 | ||||||
| FPT Corp | 1,327,109 | 7,105,982 | ||||||
| Hoa Phat Group(a) | 1,494,500 | 1,585,748 | ||||||
| Vietnam Technological & Comm Joint-stock Bank(a) | 5,285,138 | 4,978,751 | ||||||
| 17,341,253 | ||||||||
| Total Common Stocks (Cost $250,059,977) | 305,307,757 | |||||||
| Total Common Stocks/ Investments — 99.21% (Cost $250,059,977) | 305,307,757 | |||||||
| Other Assets in Excess of Liabilities — 0.79% | 2,429,089 | |||||||
| NET ASSETS — 100.00% | $ | 307,736,846 | ||||||
| (a) | Non-income producing security. |
| (b) | Security exempt from registration under Rule 144A of the Securities Act of 1933. These securities may be resold in the ordinary course of business in transactions exempt from registration, normally to qualified institutional buyers. As of October 31, 2024, these securities had a total aggregate market value of $16,910,778, representing 5.50% of net assets. |
| (c) | Security was purchased pursuant to Regulation S under the Securities Act of 1933, which exempts securities offered and sold outside of the United States from registration. Such security cannot be sold in the United States without either an effective registration statement filed pursuant to the Securities Act of 1933, or pursuant to an exemption from registration. As of October 31, 2024, these securities had a total aggregate market value of $22,173,867 representing 7.21% of net assets. |
| Sector Composition (October 31, 2024) | ||||
| Technology | 26.4 | % | ||
| Consumer Discretionary | 22.4 | % | ||
| Consumer Staples | 14.8 | % | ||
| Financials | 11.7 | % | ||
| Industrials | 11.2 | % | ||
| Materials | 3.8 | % | ||
| Health Care | 3.3 | % | ||
| Communications | 3.1 | % | ||
| Real Estate | 1.8 | % | ||
| Energy | 0.7 | % | ||
| Other Assets in Excess of Liabilities | 0.8 | % | ||
| Total | 100 | % | ||
See accompanying notes to financial statements.
2
Grandeur Peak Emerging Markets Opportunities Fund | Schedule of Investments |
| October 31, 2024 (Unaudited) |
| Industry Composition (October 31, 2024) | ||||
| Banks | 6.4 | % | ||
| Electronics Components | 6.2 | % | ||
| IT Services | 6.2 | % | ||
| Food & Drug Stores | 6.1 | % | ||
| Auto Parts | 5.3 | % | ||
| Home Products Stores | 4.6 | % | ||
| Packaged Food | 3.7 | % | ||
| Other Commercial Support Services | 3.7 | % | ||
| Personal Care Products | 3.0 | % | ||
| Semiconductor Devices | 3.0 | % | ||
| Other Machinery & Equipment | 2.6 | % | ||
| Semiconductor Mfg | 2.5 | % | ||
| Online Marketplace | 2.4 | % | ||
| Internet Media & Services | 2.3 | % | ||
| Specialty Chemicals | 2.3 | % | ||
| Technology Distributors | 2.3 | % | ||
| Communications Equipment | 2.2 | % | ||
| Furniture | 2.1 | % | ||
| Non-Alcoholic Beverages | 2.0 | % | ||
| Electrical Components | 1.8 | % | ||
| Specialty Apparel Stores | 1.6 | % | ||
| Automotive Wholesalers | 1.5 | % | ||
| Restaurants | 1.3 | % | ||
| Industrial Owners & Developers | 1.3 | % | ||
| Consumer Elec & Applc Whslrs | 1.2 | % | ||
| Professional Services | 1.2 | % | ||
| Application Software | 1.1 | % | ||
| Mortgage Finance | 1.0 | % | ||
| Institutional Brokerage | 1.0 | % | ||
| Other Industries (each less than 1%) | 17.3 | % | ||
| Other Assets in Excess of Liabilities | 0.8 | % | ||
| Total | 100 | % | ||
See accompanying notes to financial statements.
3
Grandeur Peak Global Contrarian Fund | Schedule of Investments |
| October 31, 2024 (Unaudited) |
| Shares | Fair Value | |||||||
| COMMON STOCKS — 99.38% | ||||||||
| Australia — 4.65% | ||||||||
| Atturra ltd(a) | 1,873,659 | $ | 1,430,180 | |||||
| Emeco Holdings Ltd.(a) | 4,287,041 | 2,171,180 | ||||||
| Fiducian Group Ltd | 364,458 | 2,194,375 | ||||||
| PeopleIN Ltd | 2,610,546 | 1,413,209 | ||||||
| 7,208,944 | ||||||||
| Belgium — 2.07% | ||||||||
| Melexis NV | 21,606 | 1,410,946 | ||||||
| X-Fab Silicon Foundries S.E.(a)(b)(c) | 378,221 | 1,802,727 | ||||||
| 3,213,673 | ||||||||
| Brazil — 2.87% | ||||||||
| Armac Locacao Logistica E Servicos SA | 979,900 | 1,267,821 | ||||||
| Patria Investments Limited(a) | 215,893 | 2,512,994 | ||||||
| Vinci Partners Invest Ltd | 65,000 | 666,900 | ||||||
| 4,447,715 | ||||||||
| Canada — 2.13% | ||||||||
| BioSyent Inc | 113,187 | 878,767 | ||||||
| Converge Technology Solutions Corporation | 545,779 | 1,175,952 | ||||||
| Winpak Ltd.(a) | 35,083 | 1,250,022 | ||||||
| 3,304,741 | ||||||||
| China — 7.84% | ||||||||
| Alibaba.Com Limited | 164,600 | 2,013,486 | ||||||
| Chaoju Eye Care Holdings Ltd | 6,026,500 | 2,213,247 | ||||||
| China Meidong Auto Holdings(a) | 5,155,000 | 1,488,276 | ||||||
China Yongda Automobiles Services Holdings Limited(a) | 6,874,500 | 1,418,233 | ||||||
| Li Ning Company Limited | 431,000 | 879,437 | ||||||
| TK Group Holdings Ltd | 8,707,283 | 1,982,513 | ||||||
| WH Group Ltd.(a) | 1,726,000 | 1,343,405 | ||||||
| Xin Point Holdings Ltd(c) | 1,719,984 | 798,714 | ||||||
| 12,137,311 | ||||||||
| Colombia — 1.43% | ||||||||
| Parex Resources, Inc.(a) | 239,203 | 2,221,349 | ||||||
France — 2.00% | ||||||||
| Antin Infrastructure Partners | 76,295 | 877,806 | ||||||
| Thermador Groupe | 8,677 | 680,887 | ||||||
| Virbac SA | 4,047 | 1,538,021 | ||||||
| 3,096,714 | ||||||||
| Germany — 0.96% | ||||||||
| Elmos Semiconductor AG(a) | 24,984 | 1,492,574 | ||||||
Hong Kong — 6.27% | ||||||||
| Plover Bay Tech(c) | 13,996,539 | 9,710,626 | ||||||
India — 1.21% | ||||||||
| City Union Bank Ltd | 900,496 | 1,875,493 | ||||||
| Shares | Fair Value | |||||||
| COMMON STOCKS — 99.38% (continued) | ||||||||
| Indonesia — 1.53% | ||||||||
| Aspirasi Hidup Indonesia | 20,871,600 | $ | 1,195,664 | |||||
| Bank BTPN Syariah Tbk PT | 7,245,900 | 491,709 | ||||||
| Selamat Sempurna Tbk PT | 5,508,600 | 677,431 | ||||||
| 2,364,804 | ||||||||
| Japan — 11.83% | ||||||||
| BayCurrent Consulting, Inc. | 90,000 | 2,924,907 | ||||||
| Beenos Inc | 100,000 | 1,813,130 | ||||||
| Central Automotive NPV(a) | 48,900 | 1,472,801 | ||||||
| gremz Inc | 78,400 | 1,333,316 | ||||||
| Halows Company Ltd. | 49,200 | 1,375,663 | ||||||
| Jeol Ltd. | 40,000 | 1,483,816 | ||||||
| Rise Consulting Group Inc(a) | 624,100 | 2,792,552 | ||||||
| Sun*, Inc.(a) | 225,400 | 774,977 | ||||||
| System Support, Inc. | 132,100 | 1,580,262 | ||||||
| ULS Group Inc | 48,000 | 1,695,724 | ||||||
| User Local, Inc. | 70,000 | 843,762 | ||||||
| WDB coco Co., Ltd. | 9,200 | 229,186 | ||||||
| 18,320,096 | ||||||||
| Mexico — 1.03% | ||||||||
| Grupo Cementos de Chihuahua, S.A.B. de C.V(a) | 100,000 | 819,895 | ||||||
| Regional SAB de CV(a) | 122,134 | 776,700 | ||||||
| 1,596,595 | ||||||||
| Netherlands — 1.48% | ||||||||
| Flow Traders Ltd. | 100,141 | 2,291,676 | ||||||
Oman — 3.09% | ||||||||
| Tethys Oil AB | 899,822 | 4,788,758 | ||||||
Philippines — 0.81% | ||||||||
| Concepcion Industrial | 1,259,700 | 303,424 | ||||||
| Pryce Corp | 6,013,600 | 949,136 | ||||||
| 1,252,560 | ||||||||
| Poland — 1.33% | ||||||||
| Auto Partner SA | 222,656 | 1,184,814 | ||||||
| Inter Cars SA | 7,500 | 882,507 | ||||||
| 2,067,321 | ||||||||
| Singapore — 4.66% | ||||||||
| Riverstone Holdings Ltd.(a) | 10,534,575 | 7,212,954 | ||||||
Sweden — 1.06% | ||||||||
| Fasadgruppen Group AB | 182,140 | 850,450 | ||||||
| RVRC Holding AB | 183,225 | 798,138 | ||||||
| 1,648,588 | ||||||||
| Taiwan — 2.31% | ||||||||
| Acer E-Enabling Service Busine | 242,000 | 1,861,571 | ||||||
| Allied Supreme Corp | 77,000 | 792,585 | ||||||
| M3 Technology Inc | 81,000 | 262,159 | ||||||
| Sporton International, Inc.(a) | 100,750 | 659,242 | ||||||
| 3,575,557 | ||||||||
See accompanying notes to financial statements.
4
Grandeur Peak Global Contrarian Fund | Schedule of Investments |
| October 31, 2024 (Unaudited) |
| Shares | Fair Value | |||||||
| COMMON STOCKS — 99.38% (continued) | ||||||||
| United Kingdom — 13.45% | ||||||||
| B & M European Value Retail SA | 403,347 | $ | 2,017,590 | |||||
| CVS Group plc | 206,656 | 2,535,260 | ||||||
| Endava plc - ADR(a) | 42,700 | 1,009,855 | ||||||
| Foresight Group Holdings Ltd | 284,417 | 1,705,050 | ||||||
| FRP Advisory Group PLC | 1,212,240 | 2,422,417 | ||||||
| Intermediate Capital Group PLC | 25,049 | 665,296 | ||||||
| Marex Group PLC(a) | 69,124 | 1,820,726 | ||||||
| Marlowe plc(a) | 270,192 | 1,171,271 | ||||||
| Petershill Partners PLC(a)(b)(c) | 2,272,299 | 6,350,872 | ||||||
| Pollen Street Group Ltd | 129,693 | 1,126,951 | ||||||
| 20,825,288 | ||||||||
| United States — 20.96% | ||||||||
| Alamo Group, Inc. | 9,225 | 1,564,007 | ||||||
| Barrett Business Services, Inc. | 25,000 | 904,750 | ||||||
| Burford Capital Ltd(a) | 115,666 | 1,561,491 | ||||||
| Dollar General Corporation | 18,350 | 1,468,734 | ||||||
| Esquire Financial Holdings, Inc. | 24,000 | 1,597,920 | ||||||
| Five Below, Inc.(a) | 28,575 | 2,708,623 | ||||||
| GQG Partners Inc | 742,902 | 1,348,334 | ||||||
| Grocery Outlet Holding Corporation(a) | 78,075 | 1,116,473 | ||||||
| Hackett Group, Inc. (The) | 60,315 | 1,466,861 | ||||||
| Healthcare Services Group, Inc.(a) | 109,976 | 1,206,437 | ||||||
| Littelfuse, Inc. | 5,485 | 1,341,796 | ||||||
| Lululemon Athletica, Inc.(a) | 7,325 | 2,182,118 | ||||||
| Malibu Boats, Inc., Class A(a) | 34,780 | 1,560,926 | ||||||
| P10 Inc | 296,793 | 3,279,562 | ||||||
| Perella Weinberg Partners | 102,450 | 2,072,564 | ||||||
| Plumas Bancorp(a) | 29,350 | 1,218,319 | ||||||
| Shoals Technologies Group, Inc., Class A(a) | 353,373 | 1,911,748 | ||||||
| Upwork, Inc.(a) | 115,875 | 1,571,265 | ||||||
| Western Alliance Bancorp | 28,405 | 2,363,579 | ||||||
| 32,445,507 | ||||||||
| Vietnam — 4.41% | ||||||||
| Asia Commercial Bank JSC | 1,395,870 | 1,399,762 | ||||||
| FPT Corp | 216,192 | 1,157,596 | ||||||
| Hoa Phat Group(a) | 1,456,800 | 1,545,746 | ||||||
Vietnam Technological & Comm Joint- stock Bank(a) | 2,891,800 | 2,724,159 | ||||||
| 6,827,263 | ||||||||
| Total Common Stocks (Cost $139,308,931) | 153,926,107 | |||||||
| Total Common Stocks/ Investments — 99.38% (Cost $139,308,931) | 153,926,107 | |||||||
| Other Assets in Excess of Liabilities — 0.62% | 955,701 | |||||||
| NET ASSETS — 100.00% | $ | 154,881,808 | ||||||
| (a) | Non-income producing security. |
| (b) | Security exempt from registration under Rule 144A of the Securities Act of 1933. These securities may be resold in the ordinary course of business in transactions exempt from registration, normally to qualified institutional buyers. As of October 31, 2024, these securities had a total aggregate market value of $8,153,599, representing 5.26% of net assets. |
| (c) | Security was purchased pursuant to Regulation S under the Securities Act of 1933, which exempts securities offered and sold outside of the United States from registration. Such security cannot be sold in the United States without either an effective registration statement filed pursuant to the Securities Act of 1934, or pursuant to an exemption from registration. As of October 31, 2024, these securities had a total aggregate market value of $18,662,939, representing 12.05% of net assets. |
| Sector Composition (October 31, 2024) | ||||
| Financials | 28.0 | % | ||
| Technology | 18.8 | % | ||
| Consumer Discretionary | 12.6 | % | ||
| Industrials | 11.5 | % | ||
| Health Care | 10.4 | % | ||
| Consumer Staples | 6.5 | % | ||
| Energy | 5.8 | % | ||
| Materials | 3.4 | % | ||
| Utilities | 1.4 | % | ||
| Communications | 1.0 | % | ||
| Other Assets in Excess of Liabilities | 0.6 | % | ||
| Total | 100 | % | ||
See accompanying notes to financial statements.
5
Grandeur Peak Global Contrarian Fund | Schedule of Investments |
| October 31, 2024 (Unaudited) |
| Industry Composition (October 31, 2024) | ||||
| Private Equity | 11.4 | % | ||
| IT Services | 8.3 | % | ||
| Banks | 8.0 | % | ||
| Communications Equipment | 6.3 | % | ||
| Health Care Supplies | 4.7 | % | ||
| Exploration & Production | 4.5 | % | ||
| Professional Services | 4.2 | % | ||
| Mass Merchants | 4.0 | % | ||
| Health Care Services | 3.2 | % | ||
| Institutional Brokerage | 2.8 | % | ||
| Online Marketplace | 2.5 | % | ||
| Semiconductor Devices | 2.0 | % | ||
| Investment Management | 2.0 | % | ||
| Specialty Apparel Stores | 2.0 | % | ||
| Automotive Retailers | 1.9 | % | ||
| Specialty & Generic Pharma | 1.6 | % | ||
| Wealth Management | 1.6 | % | ||
| Automotive Wholesalers | 1.5 | % | ||
| Industrial Wholesale & Rental | 1.4 | % | ||
| Rubber & Plastic | 1.3 | % | ||
| Renewable Energy Equipment | 1.2 | % | ||
| Home Products Stores | 1.2 | % | ||
| Auto Parts | 1.2 | % | ||
| Other Financial Services | 1.2 | % | ||
| Semiconductor Mfg | 1.2 | % | ||
| Application Software | 1.1 | % | ||
| Agricultural Machinery | 1.0 | % | ||
| Internet Media & Services | 1.0 | % | ||
| Commercial Finance | 1.0 | % | ||
| Recreational Vehicles | 1.0 | % | ||
| Steel Producers | 1.0 | % | ||
| Life Science & Diagnostics | 1.0 | % | ||
| Other Industries (each less than 1%) | 11.1 | % | ||
| Other Assets in Excess of Liabilities | 0.6 | % | ||
| Total | 100 | % | ||
See accompanying notes to financial statements.
6
Grandeur Peak Global Explorer Fund | Schedule of Investments |
| October 31, 2024 (Unaudited) |
| Shares | Fair Value | |||||||
| COMMON STOCKS — 100.40% | ||||||||
| Argentina — 0.81% | ||||||||
| Globant S.A.(a) | 470 | $ | 98,648 | |||||
| Australia — 3.01% | ||||||||
| Atturra ltd(a) | 75,437 | 57,582 | ||||||
| EQT Holdings Ltd | 1,825 | 37,165 | ||||||
| Imdex Ltd | 16,571 | 28,148 | ||||||
| IPD Group Ltd/Australia(a) | 10,251 | 31,119 | ||||||
| Johns Lyng Group Ltd | 24,719 | 61,887 | ||||||
| Kogan.com Ltd(a) | 24,200 | 73,617 | ||||||
| PeopleIN Ltd | 64,209 | 34,759 | ||||||
| Pinnacle Investment Management Group | 3,363 | 44,166 | ||||||
| 368,443 | ||||||||
| Belgium — 0.81% | ||||||||
| Melexis NV | 925 | 60,406 | ||||||
| X-Fab Silicon Foundries S.E.(a)(b)(c) | 8,161 | 38,898 | ||||||
| 99,304 | ||||||||
| Brazil — 2.08% | ||||||||
| Armac Locacao Logistica E Servicos SA | 24,100 | 31,181 | ||||||
| Grupo Mateus SA(a) | 30,000 | 39,230 | ||||||
| Hypera S.A.(a) | 4,200 | 16,113 | ||||||
| Patria Investments Limited(a) | 6,011 | 69,969 | ||||||
| Raia Drogasil S.A. | 4,600 | 19,454 | ||||||
| Track & Field Co SA | 20,600 | 36,309 | ||||||
| Vinci Partners Invest Ltd | 2,236 | 22,941 | ||||||
| XP, Inc., Class A(a) | 1,115 | 19,468 | ||||||
| 254,665 | ||||||||
| Canada — 1.46% | ||||||||
| Aritzia Inc(a) | 1,334 | 42,951 | ||||||
| BioSyent, Inc.(b) | 2,900 | 22,515 | ||||||
| Descartes Systems Group, Inc. (The)(a) | 270 | 28,050 | ||||||
| Docebo Inc(a) | 905 | 41,223 | ||||||
| Kinaxis Inc.(a) | 200 | 22,213 | ||||||
| Richelieu Hardware, Ltd.(a) | 833 | 21,950 | ||||||
| 178,902 | ||||||||
| China — 4.35% | ||||||||
| Adicon Holdings Ltd(a) | 35,100 | 28,820 | ||||||
| Angelalign Technology Inc(b)(c) | 4,900 | 38,501 | ||||||
| ANTA Sports Products Ltd. | 4,400 | 46,963 | ||||||
| Beijing Huafeng Test & Control | 2,342 | 39,381 | ||||||
| Centre Testing Int | 20,000 | 38,781 | ||||||
| Chaoju Eye Care Holdings Ltd | 53,100 | 19,501 | ||||||
| Man Wah Holdings Limited(a) | 83,700 | 60,813 | ||||||
| Proya Cosmetics Co Ltd | 3,600 | 48,526 | ||||||
| Shenzhen Mindray Bio-Medical Electronics Co. | 1,300 | 48,690 | ||||||
| Silergy Corp | 7,000 | 108,899 | ||||||
| Yum China Holdings Inc | 1,200 | 53,924 | ||||||
| 532,799 | ||||||||
| Colombia — 0.31% | ||||||||
| Parex Resources, Inc.(a) | 4,090 | 37,982 | ||||||
| Shares | Fair Value | |||||||
| COMMON STOCKS — 100.40% (continued) | ||||||||
| Denmark — 0.31% | ||||||||
| ROCKWOOL International A/S(a) | 87 | $ | 37,649 | |||||
| Finland — 0.17% | ||||||||
| Revenio Group Oyj | 667 | 21,401 | ||||||
| France — 2.40% | ||||||||
| Antin Infrastructure Partners | 3,050 | 35,092 | ||||||
| bioMerieux SA | 220 | 24,621 | ||||||
| Neurones SA | 240 | 12,164 | ||||||
| Planisware SAS(a) | 982 | 24,013 | ||||||
| Sidetrade(a) | 108 | 26,195 | ||||||
| Thermador Groupe | 250 | 19,618 | ||||||
| Virbac SA | 312 | 118,572 | ||||||
| Wavestone | 624 | 33,214 | ||||||
| 293,489 | ||||||||
| Germany — 2.96% | ||||||||
| AIXTRON SE | 957 | 15,195 | ||||||
| Atoss Software AG | 247 | 32,487 | ||||||
| Dermapharm Holding SE | 2,158 | 73,299 | ||||||
| Elmos Semiconductor AG(a) | 673 | 40,205 | ||||||
| Mensch und Maschine Software S | 783 | 45,563 | ||||||
| Nexus AG | 1,446 | 75,728 | ||||||
| QIAGEN N.V.(a) | 736 | 30,986 | ||||||
| RENK Group AG | 869 | 17,461 | ||||||
| Stabilus SE | 796 | 31,511 | ||||||
| 362,435 | ||||||||
| Greece — 0.47% | ||||||||
| Sarantis SA | 4,776 | 57,154 | ||||||
| Hong Kong — 1.04% | ||||||||
| Plover Bay Tech(c) | 106,861 | 74,139 | ||||||
| Techtronic Industries Co Limited(a) | 3,700 | 53,523 | ||||||
| 127,662 | ||||||||
| India — 4.60% | ||||||||
| Bajaj Finance Ltd | 544 | 44,441 | ||||||
| City Union Bank Ltd | 12,110 | 25,222 | ||||||
| Five-Star Business(a) | 4,472 | 37,742 | ||||||
| Gulf Oil Lubricants India Ltd. | 2,685 | 37,721 | ||||||
| Home First Finance Co India Lt(a) | 2,560 | 35,840 | ||||||
| IndiaMart InterMesh Ltd(b)(c) | 1,421 | 42,152 | ||||||
| Indigo Paints Ltd | 2,231 | 43,588 | ||||||
| Ksolves India Ltd | 1,044 | 11,780 | ||||||
| Likhitha Infrastructure Ltd(a) | 5,122 | 22,276 | ||||||
| LT Foods Ltd | 11,337 | 52,417 | ||||||
| Marksans Pharma Ltd. | 10,478 | 35,997 | ||||||
| Motherson Sumi Wiring India Ltd | 25,701 | 19,139 | ||||||
| PB Fintech Ltd(a) | 1,673 | 33,808 | ||||||
| SJS Enterprises Ltd(a) | 4,747 | 68,399 | ||||||
| Yatharth Hospital(a) | 6,663 | 52,123 | ||||||
| 562,645 | ||||||||
See accompanying notes to financial statements.
7
Grandeur Peak Global Explorer Fund | Schedule of Investments |
| October 31, 2024 (Unaudited) |
| Shares | Fair Value | |||||||
| COMMON STOCKS — 100.40% (continued) | ||||||||
| Indonesia — 1.61% | ||||||||
| Arwana Citramulia Tbk P.T. | 677,300 | $ | 32,988 | |||||
| Aspirasi Hidup Indonesia | 953,100 | 54,599 | ||||||
| Bank BTPN Syariah Tbk PT | 298,800 | 20,277 | ||||||
| Metrodata Electronics Tbk | 336,400 | 13,632 | ||||||
| Selamat Sempurna Tbk PT | 445,500 | 54,786 | ||||||
| Ultrajaya Milk Industry & Trade | 188,000 | 20,844 | ||||||
| 197,126 | ||||||||
| Ireland — 0.20% | ||||||||
| Uniphar PLC(a) | 9,638 | 23,972 | ||||||
| Israel — 1.14% | ||||||||
| CyberArk Software Ltd.(a) | 108 | 29,864 | ||||||
| Monday.com Ltd(a) | 117 | 34,383 | ||||||
| Next Vision Stabilized Systems(a) | 1,930 | 21,944 | ||||||
| Wix.com Ltd.(a) | 323 | 53,980 | ||||||
| 140,171 | ||||||||
| Italy — 1.70% | ||||||||
| Diasorin SPA(a) | 264 | 28,670 | ||||||
| Interpump Group SpA | 1,357 | 60,291 | ||||||
| Recordati SpA(a) | 904 | 51,287 | ||||||
| Sesa SpA | 515 | 44,722 | ||||||
| Stevanato Group SpA | 1,250 | 23,763 | ||||||
| 208,733 | ||||||||
| Japan — 13.60% | ||||||||
| Amvis Holdings Inc | 3,400 | 44,136 | ||||||
| AZOOM Co Ltd | 800 | 30,617 | ||||||
| BayCurrent Consulting, Inc. | 2,900 | 94,247 | ||||||
| Beenos Inc | 5,373 | 97,420 | ||||||
| Bengo4.com Inc(a) | 4,400 | 84,037 | ||||||
| Charm Care Corp KK | 9,100 | 74,098 | ||||||
| Cosmos Pharmeceutical Corporation(a) | 600 | 28,838 | ||||||
| Creema Ltd(a) | 600 | 929 | ||||||
| Cyber Security Cloud Inc(a) | 3,000 | 35,222 | ||||||
| eGuarantee Inc | 2,400 | 23,781 | ||||||
| eWeLL Co Ltd(a) | 4,700 | 48,835 | ||||||
| FP Partner Inc(a) | 1,000 | 19,131 | ||||||
| Hennge KK(a) | 6,400 | 46,197 | ||||||
| Insource Co Ltd | 7,500 | 47,000 | ||||||
| Integral Corp(a) | 2,200 | 55,795 | ||||||
| Internet Initiative Japan, Inc. | 2,000 | 38,402 | ||||||
| Japan Elevator Service Holdings Company Ltd. | 1,600 | 30,635 | ||||||
| Jeol Ltd. | 1,000 | 37,095 | ||||||
| JMDC Inc | 1,600 | 44,588 | ||||||
| Lasertec Corporation(a) | 200 | 27,139 | ||||||
| MarkLines Company Ltd.(a) | 3,000 | 53,722 | ||||||
| Oro Co Ltd | 1,300 | 20,290 | ||||||
| Plus Alpha Consulting Company Ltd. | 2,100 | 29,354 | ||||||
| Prestige International Inc | 5,300 | 23,693 | ||||||
| Rise Consulting Group Inc(a) | 8,600 | 38,481 | ||||||
| Seria Co Ltd | 3,500 | 73,121 | ||||||
| Sun* Inc(a) | 21,000 | 72,204 | ||||||
| Synchro Food Co Ltd(a) | 7,400 | 22,582 | ||||||
| System Support, Inc. | 6,400 | 76,561 | ||||||
| Shares | Fair Value | |||||||
| COMMON STOCKS — 100.40% (continued) | ||||||||
| Japan — 13.60% (continued) | ||||||||
| Syuppin Company, Ltd. | 5,500 | $ | 37,820 | |||||
| Timee Inc(a) | 4,600 | 35,117 | ||||||
| Tokyo Seimitsu Company Limited | 300 | 16,143 | ||||||
| ULS Group Inc | 3,500 | 123,646 | ||||||
| User Local Inc. | 1,300 | 15,670 | ||||||
| Visional Inc(a) | 1,500 | 80,263 | ||||||
| WDB coco Co Ltd | 700 | 17,438 | ||||||
| Yakuodo Holdings Company Limited | 1,500 | 20,862 | ||||||
| 1,665,109 | ||||||||
| Luxembourg — 0.59% | ||||||||
| Eurofins Scientific S.E. | 990 | 48,825 | ||||||
| Sword Group | 615 | 23,931 | ||||||
| 72,756 | ||||||||
| Mexico — 1.86% | ||||||||
| Arca Continental COM NPV | 2,500 | 21,319 | ||||||
| BBB Foods Inc(a) | 880 | 28,107 | ||||||
| Bolsa Mexicana de Valores SAB | 16,400 | 26,793 | ||||||
| Grupo Cementos de Chihuahua, S.A.B. de C.V(a) | 6,700 | 54,933 | ||||||
| Grupo Financiero Banorte SAB de CV | 2,900 | 20,233 | ||||||
| Kimberly-Clark de Mexico S.A.B. de C.V. | 11,600 | 16,708 | ||||||
| Regional SAB de cv(a) | 5,750 | 36,567 | ||||||
| Vesta Real Estate Corp. – ADR(a) | 883 | 23,011 | ||||||
| 227,671 | ||||||||
| Netherlands — 0.80% | ||||||||
| Alfen Beheer BV(a)(b)(c) | 473 | 6,343 | ||||||
| ASM International N.V.(a) | 31 | 17,312 | ||||||
| CVC Capital Partners PLC(a) | 867 | 18,191 | ||||||
| IMCD N.V.(a) | 198 | 31,478 | ||||||
| Redcare Pharmacy N.V.(a) | 162 | 24,808 | ||||||
| 98,132 | ||||||||
| Norway — 0.87% | ||||||||
| Bouvet ASA | 7,352 | 45,300 | ||||||
| Medistim ASA | 1,654 | 24,055 | ||||||
| SmartCraft ASA(a) | 13,607 | 36,982 | ||||||
| 106,337 | ||||||||
| Oman — 0.31% | ||||||||
| Tethys Oil AB | 7,102 | 37,796 | ||||||
| Philippines — 1.15% | ||||||||
| Century Pacific Food, Inc. | 56,600 | 40,782 | ||||||
| Philippine Seven Corp(a) | 50,240 | 62,918 | ||||||
| Puregold Price Club, Inc. | 35,797 | 19,990 | ||||||
| Wilcon Depot Inc | 63,033 | 17,395 | ||||||
| 141,085 | ||||||||
| Poland — 1.02% | ||||||||
| Auto Partner SA | 5,436 | 28,926 | ||||||
| Dino Polska SA(a)(b)(c) | 537 | 44,500 | ||||||
| Inter Cars SA | 441 | 51,891 | ||||||
| 125,317 | ||||||||
See accompanying notes to financial statements.
8
Grandeur Peak Global Explorer Fund | Schedule of Investments |
| October 31, 2024 (Unaudited) |
| Shares | Fair Value | |||||||
| COMMON STOCKS — 100.40% (continued) | ||||||||
| Singapore — 0.61% | ||||||||
| iFast Corporation | 5,800 | $ | 32,817 | |||||
| Riverstone Holdings Ltd.(a) | 61,445 | 42,071 | ||||||
| 74,888 | ||||||||
| South Korea — 1.20% | ||||||||
| APR Corp/Korea(a) | 640 | 23,037 | ||||||
| Coupang Inc(a) | 1,868 | 48,177 | ||||||
| Eo Technics Co Ltd(a) | 100 | 12,175 | ||||||
| LEENO Industrial Inc.(a) | 197 | 25,770 | ||||||
| MegaStudyEdu Co Ltd(a) | 484 | 15,117 | ||||||
| SOLUM Co Ltd(a) | 878 | 12,170 | ||||||
| Tokai Carbon Korea Co Ltd(a) | 162 | 9,966 | ||||||
| 146,412 | ||||||||
| Spain — 0.22% | ||||||||
| Allfunds Group Plc | 4,410 | 26,972 | ||||||
| Sweden — 2.66% | ||||||||
| Beijer Alma AB | 1,700 | 27,391 | ||||||
| Momentum Group AB(a) | 2,216 | 37,423 | ||||||
| Nibe Industrier A.B. | 4,733 | 22,949 | ||||||
| Sdiptech AB(a) | 2,268 | 51,216 | ||||||
| Swedencare AB(a) | 8,697 | 37,982 | ||||||
| Swedish Logistic(a) | 14,167 | 49,830 | ||||||
| Teqnion AB | 865 | 15,737 | ||||||
| Vimian Group AB(a) | 13,223 | 55,503 | ||||||
| Vitec Software Group | 628 | 27,374 | ||||||
| 325,405 | ||||||||
| Taiwan — 2.77% | ||||||||
| Acer E-Enabling Service Busine | 5,000 | 38,462 | ||||||
| Fuzetec Technology Co Ltd(b) | 11,000 | 23,241 | ||||||
| Gem Services, Inc. | 10,000 | 22,468 | ||||||
| M3 Technology Inc | 11,000 | 35,601 | ||||||
| Sinbon Electronics Co., Limited(a) | 7,000 | 57,457 | ||||||
| Sporton International, Inc.(a) | 14,700 | 96,188 | ||||||
| Voltronic Power Technology(a) | 1,000 | 65,946 | ||||||
| 339,363 | ||||||||
| Thailand — 0.38% | ||||||||
| Humanica PCL | 144,600 | 46,567 | ||||||
| United Kingdom — 11.95% | ||||||||
| AB Dynamics PLC | 1,394 | 31,451 | ||||||
| Advanced Medical Solutions Gro | 8,234 | 24,186 | ||||||
| Ashtead Technology Holdings Ord | 3,442 | 24,495 | ||||||
| B & M European Value Retail SA | 22,572 | 112,908 | ||||||
| CVS Group plc | 5,238 | 64,260 | ||||||
| Diploma plc | 1,114 | 61,230 | ||||||
| dotdigital group plc | 16,041 | 18,344 | ||||||
| Elixirr International PLC | 8,884 | 75,280 | ||||||
| Endava plc - ADR(a) | 2,093 | 49,499 | ||||||
| Foresight Group Holdings Ltd | 10,231 | 61,334 | ||||||
| Franchise Brands PLC | 14,726 | 32,370 | ||||||
| FRP Advisory Group PLC | 32,241 | 64,427 | ||||||
| GlobalData PLC | 9,303 | 24,347 | ||||||
| Halma plc(a) | 706 | 22,550 | ||||||
| Shares | Fair Value | |||||||
| COMMON STOCKS — 100.40% (continued) | ||||||||
| United Kingdom — 11.95% (continued) | ||||||||
| Impax Asset Management Group P | 16,088 | $ | 73,078 | |||||
| Intermediate Capital Group PLC | 1,378 | 36,599 | ||||||
| JTC plc(b)(c) | 10,170 | 134,785 | ||||||
| Judges Scientific plc | 203 | 25,020 | ||||||
| Kitwave Group Plc(a) | 5,778 | 23,651 | ||||||
| Marex Group PLC(a) | 1,081 | 28,474 | ||||||
| Marlowe plc(a) | 8,833 | 38,291 | ||||||
| Pensionbee Group PLC(a) | 11,468 | 24,247 | ||||||
| Petershill Partners PLC(a)(b)(c) | 20,037 | 56,002 | ||||||
| Pets at Home Group PLC | 14,481 | 55,298 | ||||||
| Pollen Street Group Ltd | 2,640 | 22,940 | ||||||
| Raspberry PI Ltd(a) | 4,534 | 20,447 | ||||||
| Safestore Holdings PLC(a) | 2,626 | 27,382 | ||||||
| Softcat PLC(a) | 1,614 | 35,379 | ||||||
| Tatton Asset Mgmt | 3,861 | 33,948 | ||||||
| Trustpilot Group PLC(a) | 9,131 | 29,180 | ||||||
| Victorian Plumbing Group PLC(a) | 20,314 | 29,069 | ||||||
| Volution Group PLC | 9,761 | 72,821 | ||||||
| YouGov PLC(a) | 5,124 | 30,517 | ||||||
| 1,463,809 | ||||||||
| United States — 29.69% | ||||||||
| Alamo Group, Inc. | 284 | 48,150 | ||||||
| Align Technology, Inc.(a) | 120 | 24,604 | ||||||
| Apollo Global Management, Inc. | 206 | 29,512 | ||||||
| Ares Management Corporation, Class A | 162 | 27,164 | ||||||
| Ashtead Group PLC | 729 | 54,524 | ||||||
| ATRICURE, INC.(a) | 2,182 | 72,399 | ||||||
| Barrett Business Services, Inc. | 1,860 | 67,313 | ||||||
| Bel Fuse, Inc., Class B | 318 | 23,984 | ||||||
| BILL Holdings, Inc.(a) | 475 | 27,721 | ||||||
| Blue Owl Capital, Inc. | 2,575 | 57,577 | ||||||
| Bowman Consulting Group Limited(a) | 1,197 | 24,299 | ||||||
| Burlington Stores, Inc.(a) | 240 | 59,465 | ||||||
| Cactus, Inc., Class A | 374 | 22,174 | ||||||
| Celsius Holdings, Inc.(a) | 751 | 22,590 | ||||||
| Charles River Laboratories International, Inc.(a) | 238 | 42,503 | ||||||
| Clearwater Analytics Holdings, Inc., Class A(a) | 2,802 | 73,160 | ||||||
| Cloudflare, Inc., Class A(a) | 366 | 32,102 | ||||||
| Core & Main, Inc.(a) | 586 | 25,948 | ||||||
| Datadog, Inc., Class A(a) | 211 | 26,468 | ||||||
| DexCom, Inc.(a) | 388 | 27,346 | ||||||
| DigitalOcean Holdings, Inc.(a) | 1,665 | 65,901 | ||||||
| Dollar General Corporation | 590 | 47,224 | ||||||
| Dorman Products, Inc.(a) | 458 | 52,226 | ||||||
| Elastic N.V.(a) | 931 | 74,695 | ||||||
| Enerpac Tool Group Corporation | 625 | 27,575 | ||||||
| Ensign Group, Inc. (The) | 175 | 27,123 | ||||||
| Esquire Financial Holdings, Inc. | 896 | 59,656 | ||||||
| Etsy, Inc.(a) | 717 | 36,882 | ||||||
| Five Below, Inc.(a) | 1,044 | 98,961 | ||||||
| Freshpet, Inc.(a) | 193 | 25,580 | ||||||
| Gentex Corporation | 1,685 | 51,072 | ||||||
| GitLab, Inc. - Class A(a) | 474 | 25,478 | ||||||
See accompanying notes to financial statements.
9
Grandeur Peak Global Explorer Fund | Schedule of Investments |
| October 31, 2024 (Unaudited) |
| Shares | Fair Value | |||||||
| COMMON STOCKS — 100.40% (continued) | ||||||||
| United States — 29.69% (continued) | ||||||||
| Global Industrial Company | 713 | $ | 18,916 | |||||
| Goosehead Insurance, Inc., Class A(a) | 728 | 79,279 | ||||||
| GQG Partners Inc | 42,444 | 77,034 | ||||||
| Grocery Outlet Holding Corporation(a) | 4,543 | 64,965 | ||||||
| Hackett Group, Inc. (The) | 2,553 | 62,089 | ||||||
| HealthEquity, Inc.(a) | 800 | 68,200 | ||||||
| Herc Holdings, Inc.(a) | 197 | 41,201 | ||||||
| HubSpot, Inc.(a) | 47 | 26,075 | ||||||
| Insperity, Inc. | 478 | 37,652 | ||||||
| Insulet Corporation(a) | 279 | 64,597 | ||||||
| JFrog Ltd.(a) | 2,734 | 79,778 | ||||||
| Klaviyo, Inc.(a) | 739 | 28,104 | ||||||
| Littelfuse, Inc. | 327 | 79,994 | ||||||
| Lululemon Athletica, Inc.(a) | 290 | 86,391 | ||||||
| Malibu Boats, Inc., Class A(a) | 641 | 28,768 | ||||||
| MarketAxess Holdings, Inc. | 225 | 65,120 | ||||||
| Medpace Holdings, Inc.(a) | 70 | 21,995 | ||||||
| Modine Manufacturing Company(a) | 192 | 22,612 | ||||||
| Monolithic Power Systems, Inc. | 34 | 25,816 | ||||||
| MSCI, Inc. | 50 | 28,560 | ||||||
| Neogen Corporation(a) | 1,894 | 27,046 | ||||||
| NV5 Global, Inc.(a) | 2,288 | 52,281 | ||||||
| Ollie’s Bargain Outlet Holdings, Inc.(a) | 498 | 45,731 | ||||||
| P10 Inc | 9,190 | 101,549 | ||||||
| PagerDuty, Inc.(a) | 1,190 | 21,491 | ||||||
| Paylocity Holding Corporation(a) | 193 | 35,622 | ||||||
| Pennant Group, Inc. (The)(a) | 1,054 | 33,697 | ||||||
| Perella Weinberg Partners | 3,960 | 80,111 | ||||||
| Pjt Partners, Inc., Class A | 193 | 26,819 | ||||||
| Pool Corporation | 66 | 23,868 | ||||||
| Primoris Services Corporation | 452 | 28,304 | ||||||
| Qualys, Inc.(a) | 605 | 72,140 | ||||||
| Rexford Industrial Realty, Inc. | 781 | 33,497 | ||||||
| Robert Half International, Inc. | 406 | 27,653 | ||||||
| Ross Stores, Inc. | 254 | 35,489 | ||||||
| SentinelOne, Inc.(a) | 1,106 | 28,524 | ||||||
| Shoals Technologies Group, Inc., Class A(a) | 7,357 | 39,801 | ||||||
| Silicon Laboratories, Inc.(a) | 206 | 21,395 | ||||||
| Skechers U.S.A., Inc., Class A(a) | 1,113 | 68,405 | ||||||
| Texas Roadhouse, Inc. | 145 | 27,712 | ||||||
| The Joint Corporation(a) | 2,209 | 24,409 | ||||||
| Thermon Group Holdings, Inc.(a) | 786 | 20,601 | ||||||
| TPG, Inc. | 1,346 | 91,097 | ||||||
| Tradeweb Markets Inc., Class A | 322 | 40,894 | ||||||
| Trex Company, Inc.(a) | 398 | 28,198 | ||||||
| Ulta Beauty, Inc.(a) | 136 | 50,181 | ||||||
| Upwork, Inc.(a) | 1,960 | 26,578 | ||||||
| WillScot Holdings Corporation(a) | 626 | 20,746 | ||||||
| WW Grainger, Inc. | 30 | 33,277 | ||||||
| Yeti Holdings, Inc.(a) | 660 | 23,239 | ||||||
| Zscaler, Inc.(a) | 304 | 54,960 | ||||||
| 3,633,837 | ||||||||
| Shares | Fair Value | |||||||
| COMMON STOCKS — 100.40% (continued) | ||||||||
| Vietnam — 1.29% | ||||||||
| FPT Corp | 12,240 | $ | 65,539 | |||||
| Vietnam Technological & Comm Joint-stock Bank(a) | 98,000 | 92,319 | ||||||
| 157,858 | ||||||||
| Total Common Stocks (Cost $12,106,654) | 12,292,494 | |||||||
| Total Common Stocks/ Investments — 100.40% (Cost $12,106,654) | 12,292,494 | |||||||
| Liabilities in Excess of Other Assets — (0.40)% | (48,610 | ) | ||||||
| NET ASSETS — 100.00% | $ | 12,243,884 | ||||||
| (a) | Non-income producing security. |
| (b) | Security exempt from registration under Rule 144A of the Securities Act of 1933. These securities may be resold in the ordinary course of business in transactions exempt from registration, normally to qualified institutional buyers. As of October 31, 2024, these securities had a total aggregate market value of $406,937, representing 3.32% of net assets. |
| (c) | Security was purchased pursuant to Regulation S under the Securities Act of 1933, which exempts securities offered and sold outside of the United States from registration. Such security cannot be sold in the United States without either an effective registration statement filed pursuant to the Securities Act of 1933, or pursuant to an exemption from registration. As of October 31, 2024, these securities had a total aggregate market value of $435,320, representing 3.56% of net assets. |
| Sector Composition (October 31, 2024) | ||||
| Technology | 27.6 | % | ||
| Industrials | 16.2 | % | ||
| Financials | 15.4 | % | ||
| Consumer Discretionary | 14.3 | % | ||
| Health Care | 11.3 | % | ||
| Consumer Staples | 8.5 | % | ||
| Communications | 2.6 | % | ||
| Materials | 2.1 | % | ||
| Energy | 1.3 | % | ||
| Real Estate | 1.1 | % | ||
| Liabilities in Excess of Other Assets | -0.4 | % | ||
| Total | 100 | % | ||
See accompanying notes to financial statements.
10
Grandeur Peak Global Explorer Fund | Schedule of Investments |
| October 31, 2024 (Unaudited) |
| Industry Composition (October 31, 2024) | ||||
| Application Software | 9.2 | % | ||
| IT Services | 7.1 | % | ||
| Investment Management | 4.4 | % | ||
| Professional Services | 3.5 | % | ||
| Private Equity | 3.5 | % | ||
| Mass Merchants | 3.1 | % | ||
| Auto Parts | 2.7 | % | ||
| Specialty & Generic Pharma | 2.6 | % | ||
| Industrial Wholesale & Rental | 2.5 | % | ||
| Online Marketplace | 2.4 | % | ||
| Other Commercial Support Services | 2.2 | % | ||
| Specialty Apparel Stores | 2.2 | % | ||
| Infrastructure Software | 2.2 | % | ||
| Food & Drug Stores | 2.2 | % | ||
| Health Care Services | 2.1 | % | ||
| Banks | 2.1 | % | ||
| Internet Media & Services | 2.0 | % | ||
| Health Care Facilities | 1.8 | % | ||
| Wealth Management | 1.8 | % | ||
| Medical Equipment | 1.7 | % | ||
| Electrical Components | 1.7 | % | ||
| Semiconductor Devices | 1.5 | % | ||
| Semiconductor Mfg | 1.5 | % | ||
| Information Services | 1.3 | % | ||
| Institutional Brokerage | 1.2 | % | ||
| Personal Care Products | 1.2 | % | ||
| Electronics Components | 1.1 | % | ||
| Technology Distributors | 1.1 | % | ||
| Comml & Res Bldg Equipment & Sys | 1.0 | % | ||
| Home Products Stores | 1.0 | % | ||
| Life Science & Diagnostics | 1.0 | % | ||
| Other Spec Retail - Discr | 1.0 | % | ||
| Health Care Supplies | 1.0 | % | ||
| Other Industries (each less than 1%) | 23.5 | % | ||
| Liabilities in Excess of Other Assets | -0.4 | % | ||
| Total | 100 | % | ||
See accompanying notes to financial statements.
11
Grandeur Peak Global Micro Cap Fund | Schedule of Investments |
| October 31, 2024 (Unaudited) |
| Shares | Fair Value | |||||||
| COMMON STOCKS — 100.05% | ||||||||
| Australia — 9.34% | ||||||||
| Atturra ltd(a) | 765,242 | $ | 584,116 | |||||
| Fiducian Group Ltd | 208,133 | 1,253,153 | ||||||
| Imdex Ltd | 144,029 | 244,653 | ||||||
| IPD Group Ltd/Australia(a) | 74,199 | 225,246 | ||||||
| Kogan.com Ltd(a) | 329,412 | 1,002,079 | ||||||
| MA Financial Group Ltd | 78,320 | 328,831 | ||||||
| Megaport Ltd(a) | 33,940 | 154,024 | ||||||
| PeopleIN Ltd | 301,641 | 163,292 | ||||||
| Silk Logistics Holdings Ltd | 267,793 | 229,960 | ||||||
| 4,185,354 | ||||||||
| Belgium — 0.36% | ||||||||
| X-Fab Silicon Foundries S.E.(a)(b)(c) | 34,079 | 162,432 | ||||||
| Brazil — 1.08% | ||||||||
| Armac Locacao Logistica E Servicos SA | 163,200 | 211,152 | ||||||
| Track & Field Co SA | 64,700 | 114,039 | ||||||
| Vinci Partners Invest Ltd | 15,260 | 156,568 | ||||||
| 481,759 | ||||||||
| Canada — 0.83% | ||||||||
| BioSyent Inc(b) | 48,100 | 373,441 | ||||||
| China — 1.11% | ||||||||
| Chaoju Eye Care Holdings Ltd | 452,000 | 165,998 | ||||||
| TK Group Holdings Ltd(b) | 1,462,600 | 333,011 | ||||||
| 499,009 | ||||||||
| Finland — 0.46% | ||||||||
| Revenio Group Oyj | 6,394 | 205,159 | ||||||
| France — 2.75% | ||||||||
| Neurones SA | 8,295 | 420,434 | ||||||
| Sidetrade(a) | 713 | 172,938 | ||||||
| Thermador Groupe | 4,607 | 361,513 | ||||||
| Wavestone | 5,180 | 275,713 | ||||||
| 1,230,598 | ||||||||
| Germany — 1.45% | ||||||||
| Mensch und Maschine Software S | 5,555 | 323,246 | ||||||
| Nexus AG | 6,251 | 327,372 | ||||||
| 650,618 | ||||||||
| Greece — 2.05% | ||||||||
| Kri-Kri Milk Industry SA | 28,265 | 428,628 | ||||||
| Sarantis SA | 40,988 | 490,499 | ||||||
| 919,127 | ||||||||
| Hong Kong — 2.14% | ||||||||
| Plover Bay Tech(c) | 1,383,600 | 959,925 | ||||||
| Shares | Fair Value | |||||||
| COMMON STOCKS — 100.5% (continued) | ||||||||
| India — 6.44% | ||||||||
| Gulf Oil Lubricants India Ltd. | 32,095 | $ | 450,892 | |||||
| Indigo Paints Ltd | 24,458 | 477,859 | ||||||
| Ksolves India Ltd | 16,000 | 180,535 | ||||||
| Likhitha Infrastructure Ltd(a) | 32,500 | 141,342 | ||||||
| SJS Enterprises Ltd(a) | 18,246 | 262,907 | ||||||
| Vaibhav Global Ltd | 80,463 | 281,831 | ||||||
| Yatharth Hospital(a) | 139,000 | 1,087,356 | ||||||
| 2,882,722 | ||||||||
| Indonesia — 1.62% | ||||||||
| Arwana Citramulia Tbk P.T. | 3,364,400 | 163,862 | ||||||
| Aspirasi Hidup Indonesia | 4,810,100 | 275,554 | ||||||
| Selamat Sempurna Tbk PT | 2,309,700 | 284,040 | ||||||
| 723,456 | ||||||||
| Ireland — 0.50% | ||||||||
| Uniphar PLC(a) | 90,411 | 224,871 | ||||||
| Italy — 0.50% | ||||||||
| Pharmanutra SpA(a) | 3,754 | 224,160 | ||||||
| Japan — 24.14% | ||||||||
| AZOOM Co Ltd | 9,800 | 375,055 | ||||||
| Beenos Inc | 67,800 | 1,229,302 | ||||||
| Bengo4.com Inc(a) | 31,300 | 597,804 | ||||||
| Charm Care Corp KK | 85,700 | 697,818 | ||||||
| Creema Ltd(a) | 16,700 | 25,862 | ||||||
| CrowdWorks Inc(a) | 20,100 | 174,023 | ||||||
| Cyber Security Cloud Inc(a) | 15,300 | 179,630 | ||||||
| eGuarantee Inc | 26,000 | 257,633 | ||||||
| eWeLL Co Ltd(a) | 19,100 | 198,457 | ||||||
| FP Partner Inc(a) | 12,700 | 242,963 | ||||||
| Halows Company Ltd. | 7,400 | 206,909 | ||||||
| Hennge KK(a) | 76,500 | 552,196 | ||||||
| Insource Co Ltd | 28,000 | 175,468 | ||||||
| Integral Corp(a) | 11,900 | 301,799 | ||||||
| MarkLines Company Ltd.(a) | 23,000 | 411,872 | ||||||
| Oro Co Ltd | 44,900 | 700,787 | ||||||
| Plus Alpha Consulting Company Ltd. | 11,900 | 166,341 | ||||||
| Prestige International Inc | 50,000 | 223,514 | ||||||
| Rise Consulting Group Inc(a) | 63,200 | 282,790 | ||||||
| Sun* Inc(a) | 191,100 | 657,045 | ||||||
| Synchro Food Co Ltd(a) | 53,100 | 162,041 | ||||||
| System Support, Inc. | 64,400 | 770,393 | ||||||
| Syuppin Company, Ltd. | 37,700 | 259,240 | ||||||
| Timee Inc(a) | 21,400 | 163,373 | ||||||
| ULS Group Inc | 32,400 | 1,144,615 | ||||||
| User Local Inc | 9,000 | 108,484 | ||||||
| WDB coco Co Ltd | 5,000 | 124,558 | ||||||
| Yakuodo Holdings Company Limited | 10,100 | 140,473 | ||||||
| YMIRLINK Inc(a) | 32,600 | 275,220 | ||||||
| 10,805,665 | ||||||||
See accompanying notes to financial statements.
12
Grandeur Peak Global Micro Cap Fund | Schedule of Investments |
| October 31, 2024 (Unaudited) |
| Shares | Fair Value | |||||||
| COMMON STOCKS — 100.5% (continued) | ||||||||
| Luxembourg — 0.65% | ||||||||
| Sword Group | 7,482 | $ | 291,144 | |||||
| Norway — 1.88% | ||||||||
| Bouvet ASA | 38,828 | 239,245 | ||||||
| Medistim ASA | 10,500 | 152,708 | ||||||
| SmartCraft ASA(a) | 166,002 | 451,167 | ||||||
| 843,120 | ||||||||
| Oman — 0.78% | ||||||||
| Tethys Oil AB | 65,711 | 349,707 | ||||||
| Philippines — 0.64% | ||||||||
| Pryce Corp(b) | 1,811,900 | 285,975 | ||||||
| Poland — 1.41% | ||||||||
| Auto Partner SA | 77,576 | 412,803 | ||||||
| Shoper Spolka Akcyjna | 20,858 | 218,856 | ||||||
| 631,659 | ||||||||
| Singapore — 1.29% | ||||||||
| Riverstone Holdings Ltd.(a) | 841,725 | 576,324 | ||||||
| South Korea — 0.76% | ||||||||
| FNS Tech Co Ltd(a) | 28,998 | 195,676 | ||||||
| MegaStudyEdu Co Ltd(a) | 4,572 | 142,804 | ||||||
| 338,480 | ||||||||
| Sweden — 6.14% | ||||||||
| ADDvise Group AB(a) | 538,100 | 236,622 | ||||||
| Idun Industrier AB(a) | 9,600 | 228,870 | ||||||
| Momentum Group AB(a) | 20,800 | 351,268 | ||||||
| RVRC Holding AB | 45,828 | 199,629 | ||||||
| Sdiptech AB(a) | 11,425 | 257,998 | ||||||
| Swedencare AB(a) | 218,921 | 956,077 | ||||||
| Swedish Logistic(a) | 105,935 | 372,608 | ||||||
| Teqnion AB | 8,129 | 147,891 | ||||||
| 2,750,963 | ||||||||
| Taiwan — 3.03% | ||||||||
| Acer E-Enabling Service Business | 56,000 | 430,777 | ||||||
| Gem Services Inc | 107,000 | 240,402 | ||||||
| M3 Technology Inc | 53,000 | 171,536 | ||||||
| Sporton International, Inc.(a) | 52,699 | 344,828 | ||||||
| WITS Corp | 47,477 | 169,679 | ||||||
| 1,357,222 | ||||||||
| Thailand — 0.92% | ||||||||
| Humanica PCL | 1,280,000 | 412,215 | ||||||
| United Kingdom — 13.79% | ||||||||
| AB Dynamics PLC | 18,515 | 417,725 | ||||||
| Advanced Medical Solutions Gro | 89,754 | 263,633 | ||||||
| Brickability Group PLC(a) | 193,311 | 168,265 | ||||||
| CVS Group plc | 65,938 | 808,929 | ||||||
| Elixirr International PLC | 108,513 | 919,512 | ||||||
| Foresight Group Holdings Ltd | 65,739 | 394,098 | ||||||
| Franchise Brands PLC | 162,415 | 357,009 | ||||||
| FRP Advisory Group PLC | 325,991 | 651,426 | ||||||
| Shares | Fair Value | |||||||
| COMMON STOCKS — 100.05% (continued) | ||||||||
| United Kingdom — 13.79% (continued) | ||||||||
| Impax Asset Management Group P | 75,916 | $ | 344,842 | |||||
| Kitwave Group Plc(a) | 52,830 | 216,248 | ||||||
| Marlowe plc(a) | 36,611 | 158,707 | ||||||
| Pensionbee Group PLC(a) | 93,570 | 197,838 | ||||||
| Raspberry PI Ltd(a) | 29,173 | 131,562 | ||||||
| Tatton Asset Mgmt | 37,444 | 329,227 | ||||||
| Victorian Plumbing Group PLC(a) | 271,436 | 388,424 | ||||||
| Volution Group PLC | 57,773 | 431,014 | ||||||
| 6,178,459 | ||||||||
| United States — 13.99% | ||||||||
| Advanced Oxygen Therapy(a) | 92,746 | 150,659 | ||||||
| Barrett Business Services, Inc. | 25,972 | 939,927 | ||||||
| Bowman Consulting Group Limited(a) | 10,761 | 218,448 | ||||||
| Esquire Financial Holdings, Inc. | 7,091 | 472,118 | ||||||
| Figs, Inc.(a) | 73,388 | 458,675 | ||||||
| Global Industrial Company | 5,242 | 139,070 | ||||||
| Hackett Group, Inc. (The) | 33,010 | 802,803 | ||||||
| Pennant Group, Inc. (The)(a) | 58,150 | 1,859,055 | ||||||
| Perella Weinberg Partners | 10,988 | 222,287 | ||||||
| Plumas Bancorp(a) | 6,666 | 276,706 | ||||||
| The Joint Corporation(a) | 17,690 | 195,475 | ||||||
| The Lovesac Company(a) | 10,945 | 319,156 | ||||||
| Treace Medical(a) | 45,630 | 212,636 | ||||||
| 6,267,015 | ||||||||
| Total Common Stocks (Cost $38,778,503) | 44,810,580 | |||||||
| Total Common Stocks/ Investments — 100.05% (Cost $38,778,503) | 44,810,580 | |||||||
| Liabilities in Excess of Other Assets — (0.05)% | (21,689 | ) | ||||||
| NET ASSETS — 100.00% | $ | 44,788,890 | ||||||
| (a) | Non-income producing security. |
| (b) | Security exempt from registration under Rule 144A of the Securities Act of 1933. These securities may be resold in the ordinary course of business in transactions exempt from registration, normally to qualified institutional buyers. As of October 31, 2024, these securities had a total aggregate market value of $1,154,859, representing 2.58% of net assets |
| (c) | Security was purchased pursuant to Regulation S under the Securities Act of 1933, which exempts securities offered and sold outside of the United States from registration. Such security cannot be sold in the United States without either an effective registration statement filed pursuant to the Securities Act of 1933, or pursuant to an exemption from registration. As of October 31, 2024, these securities had a total aggregate market value of $1,122,357, representing 2.51% of net assets. |
See accompanying notes to financial statements.
13
Grandeur Peak Global Micro Cap Fund | Schedule of Investments |
| October 31, 2024 (Unaudited) |
| Sector Composition (October 31, 2024) | ||||
| Technology | 25.6 | % | ||
| Consumer Discretionary | 17.8 | % | ||
| Health Care | 16.9 | % | ||
| Industrials | 15.1 | % | ||
| Financials | 12.6 | % | ||
| Communications | 3.9 | % | ||
| Consumer Staples | 3.3 | % | ||
| Materials | 2.6 | % | ||
| Real Estate | 0.8 | % | ||
| Energy | 0.8 | % | ||
| Utilities | 0.6 | % | ||
| Liabilities in Excess of Other Assets | -0.0 | % | ||
| Total | 100 | % | ||
| Industry Composition (October 31, 2024) | ||||
| It Services | 11.0 | % | ||
| Professional Services | 7.9 | % | ||
| Application Software | 7.7 | % | ||
| Health Care Services | 6.6 | % | ||
| Online Marketplace | 5.0 | % | ||
| Health Care Facilities | 4.4 | % | ||
| Private Equity | 3.8 | % | ||
| Internet Media & Services | 3.6 | % | ||
| Investment Management | 3.1 | % | ||
| Auto Parts | 3.1 | % | ||
| Other Commercial Support Services | 2.4 | % | ||
| Health Care Supplies | 2.4 | % | ||
| Home Products Stores | 2.2 | % | ||
| Communications Equipment | 2.1 | % | ||
| Other Spec Retail - Discr | 2.1 | % | ||
| Specialty Chemicals | 2.1 | % | ||
| Infrastructure Software | 1.9 | % | ||
| Apparel, Footwear & Acc Design | 1.7 | % | ||
| Banks | 1.7 | % | ||
| Wealth Management | 1.5 | % | ||
| Specialty Online Retailers | 1.5 | % | ||
| Industrial Wholesale & Rental | 1.4 | % | ||
| Specialty & Generic Pharma | 1.3 | % | ||
| Medical Equipment | 1.1 | % | ||
| Personal Care Products | 1.1 | % | ||
| Comml & Res Bldg Equipment & Sys | 1.0 | % | ||
| Packaged Food | 1.0 | % | ||
| Other Industries (each less than 1%) | 15.3 | % | ||
| Liabilities in Excess of Other Assets | -0.0 | % | ||
| Total | 100 | % | ||
See accompanying notes to financial statements.
14
Grandeur Peak Global Opportunities Fund | Schedule of Investments |
| October 31, 2024 (Unaudited) |
| Shares | Fair Value | |||||||
| COMMON STOCKS — 99.14% | ||||||||
| Argentina — 1.08% | ||||||||
| Globant S.A.(a) | 30,083 | $ | 6,314,121 | |||||
| Australia — 1.33% | ||||||||
| Fiducian Group Ltd | 201,670 | 1,214,240 | ||||||
| IPD Group Ltd/Australia(a) | 468,875 | 1,423,365 | ||||||
| Johns Lyng Group Ltd. | 1,386,867 | 3,472,172 | ||||||
| MA Financial Group Ltd | 396,467 | 1,664,591 | ||||||
| 7,774,368 | ||||||||
| Belgium — 2.35% | ||||||||
| Melexis NV | 112,292 | 7,333,053 | ||||||
| Warehouses De Pauw CVA(a) | 124,508 | 2,962,899 | ||||||
| X-Fab Silicon Foundries S.E.(a)(b)(c) | 725,523 | 3,458,085 | ||||||
| 13,754,037 | ||||||||
| Brazil — 1.76% | ||||||||
| Armac Locacao Logistica E Servicos SA | 1,855,700 | 2,400,954 | ||||||
| Grupo Mateus SA(a) | 2,382,700 | 3,115,772 | ||||||
| Patria Investments Limited(a) | 263,643 | 3,068,804 | ||||||
| Vinci Partners Invest Ltd | 164,875 | 1,691,618 | ||||||
| 10,277,148 | ||||||||
| Canada — 1.33% | ||||||||
| Aritzia Inc(a) | 109,861 | 3,537,235 | ||||||
| Foran Mining Corp(a) | 550,275 | 1,727,081 | ||||||
| Richelieu Hardware, Ltd.(a) | 94,288 | 2,484,596 | ||||||
| 7,748,912 | ||||||||
| China — 3.04% | ||||||||
| Man Wah Holdings Limited(a) | 6,922,599 | 5,029,650 | ||||||
| Shanghai Hanbell Precise Machi | 147,900 | 382,740 | ||||||
| Silergy Corp | 553,008 | 8,603,200 | ||||||
| Yum China Holdings Inc | 83,200 | 3,738,713 | ||||||
| 17,754,303 | ||||||||
| France — 5.21% | ||||||||
| Alten SA | 21,489 | 1,817,616 | ||||||
| Antin Infrastructure Partners | 134,449 | 1,546,892 | ||||||
| Neurones SA | 77,552 | 3,930,741 | ||||||
| Thermador Groupe | 55,615 | 4,364,128 | ||||||
| Virbac SA | 40,791 | 15,502,205 | ||||||
| Wavestone | 61,344 | 3,265,127 | ||||||
| 30,426,709 | ||||||||
| Germany — 4.04% | ||||||||
| Dermapharm Holding SE | 158,581 | 5,386,416 | ||||||
| Elmos Semiconductor AG(a) | 47,445 | 2,834,420 | ||||||
| Nexus AG | 79,613 | 4,169,421 | ||||||
| QIAGEN N.V.(a) | 107,673 | 4,533,034 | ||||||
| Schott Pharma AG & Co | 114,868 | 3,713,157 | ||||||
| Stabilus SE | 74,946 | 2,966,834 | ||||||
| 23,603,282 | ||||||||
| Hong Kong — 0.76% | ||||||||
| Techtronic Industries Co Limited(a) | 307,300 | 4,445,335 | ||||||
| Shares | Fair Value | |||||||
| COMMON STOCKS — 99.14% (continued) | ||||||||
| India — 2.73% | ||||||||
| Five-Star Business(a) | 359,500 | $ | 3,034,011 | |||||
| Gulf Oil Lubricants India Ltd. | 186,873 | 2,625,318 | ||||||
| IndiaMart InterMesh Ltd | 89,038 | 2,641,167 | ||||||
| Indigo Paints Ltd | 179,351 | 3,504,145 | ||||||
| SJS Enterprises Ltd(a) | 286,718 | 4,131,331 | ||||||
| 15,935,972 | ||||||||
| Indonesia — 1.85% | ||||||||
| Arwana Citramulia Tbk P.T. | 51,386,669 | 2,502,771 | ||||||
| Aspirasi Hidup Indonesia | 58,356,925 | 3,343,071 | ||||||
| Selamat Sempurna Tbk PT | 22,307,464 | 2,743,304 | ||||||
| Ultrajaya Milk Industry & Trad | 20,072,590 | 2,225,456 | ||||||
| 10,814,602 | ||||||||
| Italy — 2.80% | ||||||||
| Diasorin SPA(a) | 18,345 | 1,992,308 | ||||||
| Interpump Group SpA | 146,616 | 6,514,057 | ||||||
| Recordati SpA(a) | 123,293 | 6,994,865 | ||||||
| Sesa SpA | 9,983 | 866,910 | ||||||
| 16,368,140 | ||||||||
| Japan — 12.27% | ||||||||
| BayCurrent Consulting, Inc. | 488,226 | 15,866,837 | ||||||
| Charm Care Corp KK | 189,129 | 1,539,997 | ||||||
| Comture Corp | 179,450 | 2,710,597 | ||||||
| CrowdWorks Inc(a) | 267,291 | 2,314,172 | ||||||
| eWeLL Co., Ltd.(a) | 103,930 | 1,079,875 | ||||||
| F&M Co Ltd | 133,517 | 1,388,254 | ||||||
| FP Partner Inc(a) | 122,947 | 2,352,091 | ||||||
| Hennge KK(a) | 505,302 | 3,647,394 | ||||||
| Insource Co Ltd | 778,226 | 4,876,917 | ||||||
| Integral Corp(a) | 273,236 | 6,929,618 | ||||||
| Japan Elevator Service Holdings Company Ltd. | 21,190 | 405,732 | ||||||
| Kitz Corp(a) | 447,384 | 3,086,169 | ||||||
| MarkLines Company Ltd.(a) | 269,404 | 4,824,351 | ||||||
| Medley Inc(a) | 46,400 | 1,132,139 | ||||||
| Monotaro Company, Ltd. | 118,034 | 1,780,697 | ||||||
| Prestige International Inc | 384,300 | 1,717,930 | ||||||
| Rise Consulting Group Inc(a) | 380,940 | 1,704,526 | ||||||
| Seria Co Ltd | 125,323 | 2,618,220 | ||||||
| Strike Company Limited(a) | 90,070 | 2,190,185 | ||||||
| Synchro Food Co Ltd(a) | 521,513 | 1,591,461 | ||||||
| ULS Group Inc | 61,035 | 2,156,219 | ||||||
| User Local Inc | 125,006 | 1,506,789 | ||||||
| Visional Inc(a) | 80,223 | 4,292,647 | ||||||
| 71,712,817 | ||||||||
| Luxembourg — 1.39% | ||||||||
| Eurofins Scientific S.E. | 128,059 | 6,315,637 | ||||||
| Sword Group | 45,908 | 1,786,398 | ||||||
| 8,102,035 | ||||||||
| Mexico — 1.58% | ||||||||
| Grupo Financiero Banorte SAB de CV | 384,774 | 2,684,537 | ||||||
| Regional SAB de cv(a) | 721,202 | 4,586,421 | ||||||
| Vesta Real Estate Corp. - ADR(a) | 76,071 | 1,982,410 | ||||||
| 9,253,368 |
See accompanying notes to financial statements.
15
Grandeur Peak Global Opportunities Fund | Schedule of Investments |
| October 31, 2024 (Unaudited) |
| Shares | Fair Value | |||||||
| COMMON STOCKS — 99.14% (continued) | ||||||||
| Netherlands — 1.15% | ||||||||
| Aalberts N.V.(a) | 80,410 | $ | 2,901,397 | |||||
| CVC Capital Partners PLC(a) | 45,184 | 948,009 | ||||||
| Redcare Pharmacy N.V.(a) | 18,926 | 2,898,279 | ||||||
| 6,747,685 | ||||||||
| Norway — 0.97% | ||||||||
| Bouvet ASA | 250,838 | 1,545,576 | ||||||
| SmartCraft ASA(a) | 1,507,977 | 4,098,442 | ||||||
| 5,644,018 | ||||||||
| Philippines — 0.67% | ||||||||
| Century Pacific Food, Inc. | 3,143,966 | 2,265,338 | ||||||
| Wilcon Depot Inc | 5,880,839 | 1,622,904 | ||||||
| 3,888,242 | ||||||||
| Poland — 1.40% | ||||||||
| Dino Polska SA(a)(b)(c) | 70,841 | 5,870,381 | ||||||
| Inter Cars SA | 19,683 | 2,316,052 | ||||||
| 8,186,433 | ||||||||
| Singapore — 1.08% | ||||||||
| Kulicke & Soffa Industries, Inc. | 43,168 | 1,936,516 | ||||||
| Riverstone Holdings Ltd.(a) | 6,385,742 | 4,372,276 | ||||||
| 6,308,792 | ||||||||
| South Korea — 1.33% | ||||||||
| Eo Technics Co Ltd(a) | 25,905 | 3,153,998 | ||||||
| LEENO Industrial Inc.(a) | 25,220 | 3,299,127 | ||||||
| SOLUM Co Ltd(a) | 96,566 | 1,338,513 | ||||||
| 7,791,638 | ||||||||
| Sweden — 3.43% | ||||||||
| Beijer Alma AB | 106,794 | 1,720,674 | ||||||
| Momentum Group AB(a) | 182,986 | 3,090,246 | ||||||
| RVRC Holding AB | 729,212 | 3,176,489 | ||||||
| Sdiptech AB(a) | 184,903 | 4,175,457 | ||||||
| Swedencare AB(a) | 902,344 | 3,940,738 | ||||||
| Vimian Group AB(a) | 937,954 | 3,937,088 | ||||||
| 20,040,692 | ||||||||
| Taiwan — 1.52% | ||||||||
| Fuzetec Technology Co Ltd(b) | 278,482 | 588,384 | ||||||
| M3 Technology Inc | 640,000 | 2,071,377 | ||||||
| Sporton International, Inc.(a) | 949,151 | 6,210,622 | ||||||
| 8,870,383 | ||||||||
| United Kingdom — 18.25% | ||||||||
| Advanced Medical Solutions Group plc | 1,235,309 | 3,628,451 | ||||||
| B & M European Value Retail SA | 3,833,532 | 19,175,790 | ||||||
| CVS Group plc | 796,585 | 9,772,521 | ||||||
| Diploma plc | 133,688 | 7,348,042 | ||||||
| Elixirr International PLC | 244,518 | 2,071,983 | ||||||
| Endava plc - ADR(a) | 189,891 | 4,490,922 | ||||||
| Foresight Group Holdings Ltd | 724,410 | 4,342,762 | ||||||
| FRP Advisory Group PLC | 1,331,655 | 2,661,044 | ||||||
| GlobalData PLC | 1,353,413 | 3,542,052 | ||||||
| Halma plc(a) | 67,463 | 2,154,774 | ||||||
| Impax Asset Management Group P | 665,792 | 3,024,302 | ||||||
| JTC plc(b)(c) | 662,109 | 8,775,083 | ||||||
| Marex Group PLC(a) | 124,811 | 3,287,522 | ||||||
| Shares | Fair Value | |||||||
COMMON STOCKS — 99.14% (continued) | ||||||||
| United Kingdom — 18.25% (continued) | ||||||||
| Marlowe plc(a) | 825,170 | $ | 3,577,078 | |||||
| Petershill Partners PLC(a) | 1,253,554 | 3,503,571 | ||||||
| Pets at Home Group PLC | 1,226,328 | 4,682,958 | ||||||
| Softcat PLC(a) | 310,596 | 6,808,209 | ||||||
| Tatton Asset Mgmt | 161,761 | 1,422,286 | ||||||
| Victorian Plumbing Group PLC(a) | 1,143,988 | 1,637,043 | ||||||
| Volution Group PLC | 1,254,427 | 9,358,615 | ||||||
| YouGov PLC(a) | 228,689 | 1,362,018 | ||||||
| 106,627,026 | ||||||||
| United States — 24.24% | ||||||||
| 4Imprint Group | 27,624 | 1,819,292 | ||||||
| Alamo Group, Inc. | 17,529 | 2,971,867 | ||||||
| Atmus Filtration Tech(a) | 84,097 | 3,274,737 | ||||||
| ATRICURE, INC.(a) | 113,231 | 3,757,005 | ||||||
| Burlington Stores, Inc.(a) | 17,682 | 4,381,069 | ||||||
| Charles River Laboratories International, Inc.(a) | 16,235 | 2,899,246 | ||||||
| Clearwater Analytics Holdings, Inc., Class A(a) | 123,749 | 3,231,086 | ||||||
| Core & Main, Inc.(a) | 68,173 | 3,018,700 | ||||||
| DigitalOcean Holdings, Inc.(a) | 77,325 | 3,060,524 | ||||||
| Dorman Products, Inc.(a) | 38,534 | 4,394,032 | ||||||
| Elastic N.V.(a) | 42,048 | 3,373,510 | ||||||
| Enerpac Tool Group Corporation | 68,555 | 3,024,646 | ||||||
| Esquire Financial Holdings, Inc. | 34,694 | 2,309,927 | ||||||
| Five Below, Inc.(a) | 60,455 | 5,730,529 | ||||||
| Global Industrial Company | 139,157 | 3,691,836 | ||||||
| GQG Partners Inc | 2,307,673 | 4,188,324 | ||||||
| Grocery Outlet Holding Corporation(a) | 286,500 | 4,096,950 | ||||||
| Hackett Group, Inc. (The) | 106,950 | 2,601,024 | ||||||
| HealthEquity, Inc.(a) | 51,688 | 4,406,402 | ||||||
| Insperity, Inc. | 27,023 | 2,128,602 | ||||||
| Insulet Corporation(a) | 8,580 | 1,986,527 | ||||||
| JFrog Ltd.(a) | 119,470 | 3,486,134 | ||||||
| Littelfuse, Inc. | 61,075 | 14,940,778 | ||||||
| Lululemon Athletica, Inc.(a) | 17,918 | 5,337,772 | ||||||
| Medpace Holdings, Inc.(a) | 6,306 | 1,981,471 | ||||||
| Neogen Corporation(a) | 147,098 | 2,100,559 | ||||||
| NV5 Global, Inc.(a) | 230,784 | 5,273,414 | ||||||
| Ollie’s Bargain Outlet Holdings, Inc.(a) | 31,741 | 2,914,776 | ||||||
| P10 Inc | 583,810 | 6,451,101 | ||||||
| PACS Group Inc(a) | 95,549 | 4,078,032 | ||||||
| PagerDuty, Inc.(a) | 116,561 | 2,105,092 | ||||||
| Pennant Group, Inc. (The)(a) | 45,593 | 1,457,608 | ||||||
| Perella Weinberg Partners | 195,440 | 3,953,751 | ||||||
| Qualys, Inc.(a) | 45,294 | 5,400,857 | ||||||
| Silicon Laboratories, Inc.(a) | 17,508 | 1,818,381 | ||||||
| Sitime Corporation(a) | 20,172 | 3,409,270 | ||||||
| Texas Roadhouse, Inc. | 17,475 | 3,339,822 | ||||||
| Yeti Holdings, Inc.(a) | 91,482 | 3,221,081 | ||||||
| 141,615,734 |
See accompanying notes to financial statements.
16
Grandeur Peak Global Opportunities Fund | Schedule of Investments |
| October 31, 2024 (Unaudited) |
| Shares | Fair Value | |||||||
| COMMON STOCKS — 99.14% (continued) | ||||||||
| Vietnam — 1.58% | ||||||||
| Asia Commercial Bank JSC | 3,573,165 | $ | 3,583,128 | |||||
| Vietnam Technological & Comm Joint-stock Bank(a) | 6,013,808 | 5,665,179 | ||||||
| 9,248,307 | ||||||||
| Total Common Stocks (Cost $492,849,332) | 579,254,099 | |||||||
| Total Common Stocks/ Investments — 99.14% (Cost $492,849,332) | 579,254,099 | |||||||
| Other Assets in Excess of Liabilities — 0.86% | 5,025,555 | |||||||
| NET ASSETS — 100.00% | $ | 584,279,654 | ||||||
| (a) | Non-income producing security. |
| (b) | Security exempt from registration under Rule 144A of the Securities Act of 1933. These securities may be resold in the ordinary course of business in transactions exempt from registration, normally to qualified institutional buyers. As of October 31, 2024, these securities had a total aggregate market value of $18,691,933, representing 3.20% of net assets. |
| (c) | Security was purchased pursuant to Regulation S under the Securities Act of 1933, which exempts securities offered and sold outside of the United States from registration. Such security cannot be sold in the United States without either an effective registration statement filed pursuant to the Securities Act of 1933, or pursuant to an exemption from registration. As of October 31, 2024, these securities had a total aggregate market value of $18,103,549, representing 3.10% of net assets. |
| Sector Composition (October 31, 2024) | ||||
| Technology | 23.3 | % | ||
| Industrials | 20.2 | % | ||
| Financials | 14.6 | % | ||
| Consumer Discretionary | 14.0 | % | ||
| Health Care | 13.6 | % | ||
| Consumer Staples | 8.7 | % | ||
| Communications | 2.6 | % | ||
| Materials | 1.3 | % | ||
| Real Estate | 0.8 | % | ||
| Other Assets in Excess of Liabilities | 0.9 | % | ||
| Total | 100 | % | ||
| Industry Composition (October 31, 2024) | ||||
| IT Services | 8.4 | % | ||
| Mass Merchants | 5.2 | % | ||
| Specialty & Generic Pharma | 4.8 | % | ||
| Application Software | 4.6 | % | ||
| Private Equity | 4.3 | % | ||
| Health Care Services | 3.4 | % | ||
| Banks | 3.2 | % | ||
| Electrical Components | 3.2 | % | ||
| Semiconductor Devices | 3.0 | % | ||
| Industrial Wholesale & Rental | 2.9 | % | ||
| Flow Control Equipment | 2.7 | % | ||
| Investment Management | 2.5 | % | ||
| Health Care Supplies | 2.4 | % | ||
| Specialty Apparel Stores | 2.3 | % | ||
| Professional Services | 2.3 | % | ||
| Other Commercial Support Services | 2.2 | % | ||
| Electronics Components | 2.0 | % | ||
| Comml & Res Bldg Equipment & Sys | 2.0 | % | ||
| Food & Drug Stores | 2.0 | % | ||
| Home Products Stores | 2.0 | % | ||
| Wealth Management | 2.0 | % | ||
| Auto Parts | 1.9 | % | ||
| Other Spec Retail - Discr | 1.5 | % | ||
| Infrastructure Software | 1.4 | % | ||
| Other Machinery & Equipment | 1.3 | % | ||
| Internet Media & Services | 1.2 | % | ||
| Restaurants | 1.2 | % | ||
| Engineering Services | 1.2 | % | ||
| Life Science & Diagnostics | 1.1 | % | ||
| Institutional Brokerage | 1.1 | % | ||
| Specialty Chemicals | 1.1 | % | ||
| Health Care Facilities | 1.0 | % | ||
| Specialty Technology Hardware | 1.0 | % | ||
| Other Industries (each less than 1%) | 16.7 | % | ||
| Other Assets in Excess of Liabilities | 0.9 | % | ||
| Total | 100 | % | ||
See accompanying notes to financial statements.
17
| Grandeur Peak Global Reach Fund | Schedule of Investments |
| October 31, 2024 (Unaudited) |
| Shares | Fair Value | |||||||
| COMMON STOCKS — 99.13% | ||||||||
| Argentina — 0.95% | ||||||||
| Globant S.A.(a) | 8,498 | $ | 1,783,645 | |||||
| Australia — 2.05% | ||||||||
| EQT Holdings Ltd | 26,829 | 546,363 | ||||||
| Imdex Ltd | 229,427 | 389,713 | ||||||
| IPD Group Ltd/Australia(a) | 150,956 | 458,257 | ||||||
| Johns Lyng Group Ltd | 101,947 | 255,235 | ||||||
| Kogan.com Ltd(a) | 128,469 | 390,806 | ||||||
| MA Financial Group Ltd | 170,524 | 715,956 | ||||||
| Mader Group Ltd(a) | 44,370 | 176,761 | ||||||
| PeopleIN Ltd | 297,706 | 161,162 | ||||||
| Pinnacle Investment Management Group | 57,938 | 760,887 | ||||||
| 3,855,140 | ||||||||
| Belgium — 1.08% | ||||||||
| Azelis Group N.V. | 21,463 | 429,954 | ||||||
| Melexis NV | 13,088 | 854,691 | ||||||
| Warehouses De Pauw CVA(a) | 14,066 | 334,727 | ||||||
| X-Fab Silicon Foundries S.E.(a)(b)(c) | 84,952 | 404,910 | ||||||
| 2,024,282 | ||||||||
| Brazil — 1.33% | ||||||||
| Armac Locacao Logistica E Servicos SA | 448,600 | 580,411 | ||||||
| Grupo Mateus SA(a) | 527,387 | 689,645 | ||||||
| Locaweb Servicos de Internet S(a)(b)(c) | 244,868 | 176,198 | ||||||
| Raia Drogasil S.A. | 72,600 | 307,036 | ||||||
| Vinci Partners Invest Ltd | 33,047 | 339,062 | ||||||
| XP, Inc., Class A(a) | 23,213 | 405,299 | ||||||
| 2,497,651 | ||||||||
| Canada — 1.49% | ||||||||
| Aritzia Inc(a) | 24,379 | 784,940 | ||||||
| Descartes Systems Group, Inc. (The)(a) | 4,400 | 457,112 | ||||||
| Docebo Inc(a) | 7,000 | 318,842 | ||||||
| Foran Mining Corp(a) | 174,349 | 547,208 | ||||||
| Kinaxis Inc.(a) | 3,500 | 388,724 | ||||||
| Richelieu Hardware, Ltd.(a) | 11,094 | 292,339 | ||||||
| 2,789,165 | ||||||||
| China — 4.40% | ||||||||
| Adicon Holdings Ltd(a) | 796,500 | 653,982 | ||||||
| Aier Eye Hospital Group Co., Ltd. | 151,800 | 308,734 | ||||||
| Angelalign Technology Inc(b)(c) | 19,200 | 150,860 | ||||||
| Beijing Huafeng Test & Control | 52,200 | 877,744 | ||||||
| Centre Testing Int | 354,700 | 687,789 | ||||||
| DPC Dash LTD. | 50,300 | 410,544 | ||||||
| Man Wah Holdings Limited(a) | 830,500 | 603,404 | ||||||
| ManpowerGroup Greater China Ltd(c) | 145,800 | 84,833 | ||||||
| Proya Cosmetics Co Ltd | 41,200 | 555,355 | ||||||
| Shenzhen Mindray Bio-Medical Electronics Co. | 20,600 | 771,552 | ||||||
| Silergy Corp | 129,700 | 2,017,757 | ||||||
| TK Group Holdings Ltd | 1,492,400 | 339,796 | ||||||
| Yum China Holdings Inc | 18,000 | 808,856 | ||||||
| 8,271,206 | ||||||||
| Shares | Fair Value | |||||||
| COMMON STOCKS — 99.13% (continued) | ||||||||
| Colombia — 0.52% | ||||||||
| Parex Resources, Inc.(a) | 104,616 | $ | 971,512 | |||||
| Finland — 0.23% | ||||||||
| Revenio Group Oyj | 13,200 | 423,537 | ||||||
| France — 2.08% | ||||||||
| Planisware SAS(a) | 17,078 | 417,605 | ||||||
| Sidetrade(a) | 1,837 | 445,564 | ||||||
| Thermador Groupe | 4,977 | 390,547 | ||||||
| Virbac SA | 5,569 | 2,116,441 | ||||||
| Wavestone | 9,912 | 527,581 | ||||||
| 3,897,738 | ||||||||
| Germany — 2.44% | ||||||||
| 2G Energy AG(a) | 12,828 | 308,468 | ||||||
| Atoss Software AG | 2,836 | 373,004 | ||||||
| Dermapharm Holding SE | 23,363 | 793,556 | ||||||
| Elmos Semiconductor AG(a) | 8,322 | 497,166 | ||||||
| Mensch und Maschine Software S | 10,141 | 590,106 | ||||||
| Nexus AG | 15,717 | 823,116 | ||||||
| QIAGEN N.V.(a) | 16,148 | 679,831 | ||||||
| Schott Pharma AG & Co | 15,800 | 510,742 | ||||||
| 4,575,989 | ||||||||
| Hong Kong — 1.95% | ||||||||
| Plover Bay Tech(c) | 4,118,000 | 2,857,018 | ||||||
| Techtronic Industries Co Limited(a) | 55,500 | 802,851 | ||||||
| 3,659,869 | ||||||||
| India — 3.47% | ||||||||
| Bajaj Finance Ltd | 4,263 | 348,262 | ||||||
| BLS International Services Ltd(a) | 150,500 | 708,856 | ||||||
| Five-Star Business(a) | 81,240 | 685,628 | ||||||
| Home First Finance Co India Lt(a) | 39,980 | 559,725 | ||||||
| IndiaMart InterMesh Ltd(b)(c) | 15,336 | 454,917 | ||||||
| Indigo Paints Ltd | 24,500 | 478,679 | ||||||
| Ksolves India Ltd | 30,684 | 346,221 | ||||||
| Likhitha Infrastructure Ltd(a) | 88,000 | 382,712 | ||||||
| LT Foods Ltd | 173,979 | 804,401 | ||||||
| PB Fintech Ltd(a) | 20,373 | 411,693 | ||||||
| SJS Enterprises Ltd(a) | 92,715 | 1,335,934 | ||||||
| 6,517,028 | ||||||||
| Indonesia — 1.45% | ||||||||
| Aspirasi Hidup Indonesia | 28,600,500 | 1,638,426 | ||||||
| Selamat Sempurna Tbk PT | 5,872,100 | 722,133 | ||||||
| Ultrajaya Milk Industry & Trad | 3,242,000 | 359,442 | ||||||
| 2,720,001 | ||||||||
| Ireland — 0.48% | ||||||||
| ICON plc(a) | 1,350 | 299,849 | ||||||
| Uniphar PLC(a) | 239,197 | 594,931 | ||||||
| 894,780 | ||||||||
| Israel — 1.11% | ||||||||
| CyberArk Software Ltd.(a) | 2,535 | 700,978 | ||||||
| Monday.com Ltd(a) | 1,808 | 531,317 | ||||||
| Next Vision Stabilized Systems(a) | 30,203 | 343,411 | ||||||
See accompanying notes to financial statements.
18
| Grandeur Peak Global Reach Fund | Schedule of Investments |
| October 31, 2024 (Unaudited) |
| Shares | Fair Value | |||||||
| COMMON STOCKS — 99.13% (continued) | ||||||||
| Israel — 1.11% (continued) | ||||||||
| Wix.com Ltd.(a) | 3,093 | $ | 516,902 | |||||
| 2,092,608 | ||||||||
| Italy — 1.78% | ||||||||
| Diasorin SPA(a) | 3,445 | 374,135 | ||||||
| Interpump Group SpA | 9,386 | 417,014 | ||||||
| Pharmanutra SpA(a) | 6,804 | 406,282 | ||||||
| Recordati SpA(a) | 15,169 | 860,592 | ||||||
| Sesa SpA | 9,237 | 802,129 | ||||||
| Stevanato Group SpA | 25,875 | 491,884 | ||||||
| 3,352,036 | ||||||||
| Japan — 10.96% | ||||||||
| Amvis Holdings Inc | 22,500 | 292,079 | ||||||
| AZOOM Co Ltd | 14,100 | 539,620 | ||||||
| BayCurrent Consulting, Inc. | 96,800 | 3,145,899 | ||||||
| Central Automotive NPV(a) | 23,800 | 716,823 | ||||||
| Charm Care Corp KK | 30,000 | 244,277 | ||||||
| Comture Corp | 59,200 | 894,219 | ||||||
| CrowdWorks Inc(a) | 56,200 | 486,573 | ||||||
| Cyber Security Cloud Inc(a) | 23,500 | 275,903 | ||||||
| eWeLL Co Ltd(a) | 56,000 | 581,863 | ||||||
| F&M Co Ltd | 33,400 | 347,279 | ||||||
| FP Partner Inc(a) | 39,600 | 757,585 | ||||||
| Gmo Payment Gateway NPV | 6,800 | 407,299 | ||||||
| gremz Inc | 37,100 | 630,944 | ||||||
| Halows Company Ltd. | 14,700 | 411,021 | ||||||
| Hennge KK(a) | 112,200 | 809,887 | ||||||
| Insource Co Ltd | 136,300 | 854,153 | ||||||
| Integral Corp(a) | 33,200 | 841,995 | ||||||
| Internet Initiative Japan, Inc. | 24,800 | 476,182 | ||||||
| Japan Elevator Service Holdings Company Ltd. | 20,700 | 396,350 | ||||||
| JMDC Inc | 22,400 | 624,230 | ||||||
| MarkLines Company Ltd.(a) | 46,400 | 830,907 | ||||||
| MISUMI Group Inc | 25,500 | 415,025 | ||||||
| Plus Alpha Consulting Company Ltd. | 38,000 | 531,172 | ||||||
| Prestige International Inc | 103,200 | 461,333 | ||||||
| Rise Consulting Group Inc(a) | 100,000 | 447,453 | ||||||
| Seria Co., Ltd. | 21,300 | 444,995 | ||||||
| Synchro Food Co Ltd(a) | 144,200 | 440,044 | ||||||
| System Support, Inc. | 49,500 | 592,150 | ||||||
| Tokyo Seimitsu Company Limited | 8,100 | 435,854 | ||||||
| ULS Group Inc | 23,800 | 840,797 | ||||||
| User Local Inc. | 53,900 | 649,696 | ||||||
| Visional Inc(a) | 10,200 | 545,791 | ||||||
| WDB coco Co Ltd | 8,600 | 214,239 | ||||||
| 20,583,637 | ||||||||
| Luxembourg — 0.41% | ||||||||
| Eurofins Scientific S.E. | 15,500 | 764,432 | ||||||
| Malaysia — 0.22% | ||||||||
| Mr D.I.Y. Group Berhad(b)(c) | 840,400 | 418,814 | ||||||
| Shares | Fair Value | |||||||
| COMMON STOCKS — 99.13% (continued) | ||||||||
| Mexico — 1.42% | ||||||||
| Arca Continental COM NPV | 39,900 | $ | 340,254 | |||||
| BBB Foods Inc(a) | 13,760 | 439,494 | ||||||
| Corp Inmobiliaria Vesta SAB de CV | 112,600 | 293,089 | ||||||
| Corporativo Fragua SAB de CV(a) | 7,400 | 325,340 | ||||||
| Grupo Cementos de Chihuahua, S.A.B. de C.V(a) | 46,300 | 379,611 | ||||||
| Grupo Financiero Banorte SAB de CV | 31,200 | 217,680 | ||||||
| Regional SAB de cv(a) | 106,900 | 679,821 | ||||||
| 2,675,289 | ||||||||
| Netherlands — 0.95% | ||||||||
| ASM International N.V.(a) | 661 | 369,145 | ||||||
| CVC Capital Partners PLC(a) | 34,149 | 716,483 | ||||||
| IMCD N.V.(a) | 1,897 | 301,583 | ||||||
| Topicus.com, Inc.(a) | 4,700 | 402,336 | ||||||
| 1,789,547 | ||||||||
| New Zealand — 0.39% | ||||||||
| NZX Ltd | 917,297 | 741,728 | ||||||
| Norway — 0.84% | ||||||||
| Bouvet ASA | 120,257 | 740,981 | ||||||
| Medistim ASA | 19,700 | 286,510 | ||||||
| SmartCraft ASA(a) | 205,307 | 557,992 | ||||||
| 1,585,483 | ||||||||
| Oman — 0.76% | ||||||||
| Tethys Oil AB | 267,087 | 1,421,409 | ||||||
| Philippines — 2.20% | ||||||||
| Century Pacific Food, Inc. | 528,500 | 380,803 | ||||||
| Concepcion Industrial | 1,259,920 | 303,477 | ||||||
| Philippine Seven Corp(a) | 998,380 | 1,250,331 | ||||||
| Pryce Corp | 3,251,100 | 513,126 | ||||||
| Puregold Price Club, Inc. | 2,170,100 | 1,211,826 | ||||||
| Wilcon Depot Inc | 1,721,500 | 475,073 | ||||||
| 4,134,636 | ||||||||
| Poland — 1.23% | ||||||||
| Auto Partner SA | 132,253 | 703,755 | ||||||
| Dino Polska SA(a)(b)(c) | 14,810 | 1,227,260 | ||||||
| Inter Cars SA | 3,144 | 369,947 | ||||||
| 2,300,962 | ||||||||
| Singapore — 1.09% | ||||||||
| iFast Corporation | 199,200 | 1,127,087 | ||||||
| Riverstone Holdings Ltd.(a) | 1,341,700 | 918,653 | ||||||
| 2,045,740 | ||||||||
| South Korea — 1.59% | ||||||||
| APR Corp/Korea(a) | 10,295 | 370,569 | ||||||
| Eo Technics Co Ltd(a) | 2,808 | 341,881 | ||||||
| FNS Tech Co Ltd(a) | 50,000 | 337,396 | ||||||
| HPSP Company Ltd. | 24,665 | 541,124 | ||||||
| iFamilySC Co Ltd(a) | 21,805 | 296,587 | ||||||
| Kinx Inc. | 6,993 | 353,412 | ||||||
| LEENO Industrial Inc.(a) | 3,407 | 445,683 | ||||||
| Tokai Carbon Korea Co Ltd(a) | 4,971 | 305,810 | ||||||
| 2,992,462 | ||||||||
See accompanying notes to financial statements.
19
| Grandeur Peak Global Reach Fund | Schedule of Investments |
| October 31, 2024 (Unaudited) |
| Shares | Fair Value | |||||||
| COMMON STOCKS — 99.13% (continued) | ||||||||
| Spain — 0.29% | ||||||||
| Allfunds Group Plc | 88,703 | $ | 542,519 | |||||
| Sweden — 3.94% | ||||||||
| Beijer Alma AB | 26,524 | 427,357 | ||||||
| Epiroc AB | 23,600 | 406,575 | ||||||
| EQT A.B. | 21,222 | 615,741 | ||||||
| Fasadgruppen Group AB | 50,000 | 233,461 | ||||||
| Idun Industrier AB(a) | 8,775 | 209,201 | ||||||
| Momentum Group AB(a) | 45,746 | 772,553 | ||||||
| RVRC Holding AB | 110,726 | 482,329 | ||||||
| Sdiptech AB(a) | 59,055 | 1,333,572 | ||||||
| Swedencare AB(a) | 186,580 | 814,837 | ||||||
| Swedish Logistic(a) | 152,320 | 535,759 | ||||||
| Teqnion AB | 17,260 | 314,012 | ||||||
| Vimian Group AB(a) | 160,500 | 673,703 | ||||||
| Vitec Software Group | 13,247 | 577,415 | ||||||
| 7,396,515 | ||||||||
| Switzerland — 0.20% | ||||||||
| Inficon Holding A.G. | 318 | 381,048 | ||||||
| Taiwan — 2.68% | ||||||||
| 91APP, Inc. | 154,000 | 446,935 | ||||||
| Acer E-Enabling Service Business, Inc. | 56,000 | 430,777 | ||||||
| Allied Supreme Corp | 46,000 | 473,492 | ||||||
| Asia Vital Components Co., Ltd. | 17,000 | 326,561 | ||||||
| Chroma Ate Inc | 39,000 | 494,312 | ||||||
| Fuzetec Technology Co Ltd | 227,519 | 480,708 | ||||||
| M3 Technology Inc | 114,000 | 368,964 | ||||||
| Sinbon Electronics Co., Limited(a) | 56,000 | 459,660 | ||||||
| Sporton International, Inc.(a) | 164,868 | 1,078,788 | ||||||
| Voltronic Power Technology(a) | 7,247 | 477,906 | ||||||
| 5,038,103 | ||||||||
| Thailand — 0.32% | ||||||||
| Humanica PCL | 1,869,000 | 601,899 | ||||||
| United Kingdom — 13.95% | ||||||||
| AB Dynamics PLC | 29,269 | 660,351 | ||||||
| Advanced Medical Solutions Group plc | 274,580 | 806,519 | ||||||
| Ashtead Technology Holdings Ord | 55,439 | 394,533 | ||||||
| B & M European Value Retail SA | 430,685 | 2,154,338 | ||||||
| CVS Group plc | 137,384 | 1,685,430 | ||||||
| Diploma plc | 13,359 | 734,266 | ||||||
| dotdigital group plc | 396,188 | 453,058 | ||||||
| Elixirr International PLC | 177,968 | 1,508,055 | ||||||
| Endava plc - ADR(a) | 36,907 | 872,851 | ||||||
| Foresight Group Holdings Ltd | 177,466 | 1,063,890 | ||||||
| FRP Advisory Group PLC | 566,926 | 1,132,887 | ||||||
| Gamma Communications PLC | 25,293 | 517,821 | ||||||
| GlobalData PLC | 337,000 | 881,971 | ||||||
| Halma plc(a) | 9,762 | 311,799 | ||||||
| Impax Asset Management Group P | 204,922 | 930,840 | ||||||
| Intermediate Capital Group PLC | 14,849 | 394,386 | ||||||
| JTC plc(b)(c) | 159,490 | 2,113,757 | ||||||
| Shares | Fair Value | |||||||
| COMMON STOCKS — 99.13% (continued) | ||||||||
| United Kingdom — 13.95% (continued) | ||||||||
| Keystone Law Group PLC | 82,683 | $ | 647,259 | |||||
| Kitwave Group Plc(a) | 91,823 | 375,858 | ||||||
| Marex Group PLC(a) | 46,575 | 1,226,786 | ||||||
| Marlowe plc(a) | 167,676 | 726,869 | ||||||
| Pensionbee Group PLC(a) | 247,733 | 523,789 | ||||||
| Petershill Partners PLC(a)(b)(c) | 530,908 | 1,483,839 | ||||||
| Pets at Home Group PLC | 311,295 | 1,188,737 | ||||||
| Pollen Street Group Ltd | 57,791 | 502,168 | ||||||
| Raspberry PI Ltd(a) | 74,466 | 335,820 | ||||||
| Safestore Holdings PLC(a) | 45,465 | 474,083 | ||||||
| Softcat PLC(a) | 18,132 | 397,450 | ||||||
| Tatton Asset Mgmt | 86,817 | 763,340 | ||||||
| Victorian Plumbing Group PLC(a) | 324,921 | 464,961 | ||||||
| Volution Group PLC | 64,285 | 479,596 | ||||||
| 26,207,307 | ||||||||
| United States — 26.93% | ||||||||
| 4Imprint Group | 12,613 | 830,681 | ||||||
| Advanced Oxygen Therapy(a) | 119,607 | 194,292 | ||||||
| Alamo Group, Inc. | 2,700 | 457,758 | ||||||
| Align Technology, Inc.(a) | 2,207 | 452,501 | ||||||
| Apollo Global Management, Inc. | 6,253 | 895,805 | ||||||
| Ares Management Corporation, Class A | 7,274 | 1,219,704 | ||||||
| ATRICURE, INC.(a) | 14,937 | 495,610 | ||||||
| Barrett Business Services, Inc. | 27,481 | 994,537 | ||||||
| Bel Fuse, Inc., CLASS B | 5,851 | 441,282 | ||||||
| Blue Owl Capital, Inc. | 43,690 | 976,908 | ||||||
| Burlington Stores, Inc.(a) | 3,230 | 800,297 | ||||||
| Cactus, Inc., Class A | 5,052 | 299,533 | ||||||
| Celsius Holdings, Inc.(a) | 12,067 | 362,975 | ||||||
| Clearwater Analytics Holdings, Inc., Class A(a) | 37,669 | 983,538 | ||||||
| Cloudflare, Inc., Class A(a) | 4,848 | 425,218 | ||||||
| Core & Main, Inc.(a) | 16,850 | 746,118 | ||||||
| Crocs, Inc.(a) | 2,690 | 290,036 | ||||||
| Cross Creek LP(a)(d) | 1,000,000 | 731,724 | ||||||
| Datadog, Inc., Class A(a) | 2,940 | 368,794 | ||||||
| DexCom, Inc.(a) | 12,286 | 865,917 | ||||||
| DigitalOcean Holdings, Inc.(a) | 26,034 | 1,030,426 | ||||||
| Dorman Products, Inc.(a) | 8,144 | 928,660 | ||||||
| Dynatrace, Inc.(a) | 7,802 | 419,748 | ||||||
| Elastic N.V.(a) | 16,077 | 1,289,858 | ||||||
| Enerpac Tool Group Corporation | 13,059 | 576,163 | ||||||
| Ensign Group, Inc. (The) | 4,975 | 771,076 | ||||||
| Esquire Financial Holdings, Inc. | 18,400 | 1,225,072 | ||||||
| Etsy, Inc.(a) | 6,572 | 338,064 | ||||||
| Evercore, Inc., Class A | 1,686 | 445,391 | ||||||
| Five Below, Inc.(a) | 12,944 | 1,226,961 | ||||||
| Freshpet, Inc.(a) | 2,946 | 390,463 | ||||||
| Gentex Corporation | 13,754 | 416,884 | ||||||
| Global Industrial Company | 7,285 | 193,271 | ||||||
| Goosehead Insurance, Inc., Class A(a) | 7,860 | 855,954 | ||||||
| GQG Partners Inc | 544,101 | 987,519 | ||||||
| Grocery Outlet Holding Corporation(a) | 45,134 | 645,416 | ||||||
| Hackett Group, Inc. (The) | 32,726 | 795,896 | ||||||
See accompanying notes to financial statements.
20
| Grandeur Peak Global Reach Fund | Schedule of Investments |
| October 31, 2024 (Unaudited) |
| Shares | Fair Value | |||||||
| COMMON STOCKS — 99.13% (continued) | ||||||||
| United States — 26.93% (continued) | ||||||||
| HealthEquity, Inc.(a) | 6,663 | $ | 568,021 | |||||
| HOULIHAN LOKEY, INC. | 3,235 | 558,911 | ||||||
| Insperity, Inc. | 6,663 | 524,845 | ||||||
| Insulet Corporation(a) | 1,775 | 410,966 | ||||||
| JFrog Ltd.(a) | 40,824 | 1,191,244 | ||||||
| Klaviyo, Inc.(a) | 16,066 | 610,990 | ||||||
| Littelfuse, Inc. | 5,595 | 1,368,705 | ||||||
| Lululemon Athletica, Inc.(a) | 3,864 | 1,151,086 | ||||||
| MarketAxess Holdings, Inc. | 3,578 | 1,035,545 | ||||||
| Medpace Holdings, Inc.(a) | 1,552 | 487,669 | ||||||
| Monolithic Power Systems, Inc. | 598 | 454,061 | ||||||
| Neogen Corporation(a) | 20,729 | 296,010 | ||||||
| NV5 Global, Inc.(a) | 39,964 | 913,177 | ||||||
| Ollie’s Bargain Outlet Holdings, Inc.(a) | 3,908 | 358,872 | ||||||
| P10 Inc | 125,743 | 1,389,460 | ||||||
| PACS Group Inc(a) | 7,615 | 325,008 | ||||||
| PagerDuty, Inc.(a) | 22,053 | 398,277 | ||||||
| Perella Weinberg Partners | 101,410 | 2,051,523 | ||||||
| Pjt Partners, Inc., Class A | 7,887 | 1,095,978 | ||||||
| Primoris Services Corporation | 10,300 | 644,986 | ||||||
| Qualys, Inc.(a) | 9,760 | 1,163,782 | ||||||
| Rexford Industrial Realty, Inc. | 8,600 | 368,854 | ||||||
| SentinelOne, Inc.(a) | 20,806 | 536,587 | ||||||
| Shoals Technologies Group, Inc., Class A(a) | 36,680 | 198,439 | ||||||
| Silicon Laboratories, Inc.(a) | 3,200 | 332,352 | ||||||
| Skechers U.S.A., Inc., Class A(a) | 12,509 | 768,803 | ||||||
| Texas Roadhouse, Inc. | 2,477 | 473,404 | ||||||
| TPG, Inc. | 21,488 | 1,454,309 | ||||||
| Tradeweb Markets, Inc., Class A | 3,737 | 474,599 | ||||||
| Ulta Beauty, Inc.(a) | 2,102 | 775,596 | ||||||
| Upwork, Inc.(a) | 66,625 | 903,435 | ||||||
| Western Alliance Bancorp | 6,234 | 518,731 | ||||||
| Yeti Holdings, Inc.(a) | 20,993 | 739,164 | ||||||
| Zscaler, Inc.(a) | 3,598 | 650,482 | ||||||
| 50,563,921 | ||||||||
| Vietnam — 1.95% | ||||||||
| Asia Commercial Bank JSC | 660,675 | 662,517 | ||||||
| FPT Corp | 217,738 | 1,165,874 | ||||||
| Hoa Phat Group(a) | 358,500 | 380,389 | ||||||
| Vietnam Technological & Comm Joint-stock Bank(a) | 1,544,202 | 1,454,683 | ||||||
| 3,663,463 | ||||||||
| Total Common Stocks (Cost $148,092,406) | 186,175,101 | |||||||
| EXCHANGE-TRADED FUNDS — 0.22% | ||||||||
| Invesco Solar ETF(a) | 10,425 | 415,228 | ||||||
| Total Exchange-Traded Funds (Cost $388,723) | 415,228 | |||||||
| Shares | Fair Value | |||||||
| PREFERRED STOCKS — 0.52% | ||||||||
| United States — 0.52% | ||||||||
| Gusto Inc. Preferred Series E(a)(d) | 32,241 | $ | 980,126 | |||||
| Total Preferred Stocks (Cost $979,976) | 980,126 | |||||||
| Total Investments — 99.87% (Cost $149,461,105) | 187,570,455 | |||||||
| Other Assets in Excess of Liabilities — 0.13% | 239,036 | |||||||
| NET ASSETS — 100.00% | $ | 187,809,491 | ||||||
| (a) | Non-income producing security. |
| (b) | Security was purchased pursuant to Regulation S under the Securities Act of 1933, which exempts securities offered and sold outside of the United States from registration. Such security cannot be sold in the United States without either an effective registration statement filed pursuant to the Securities Act of 1933, or pursuant to an exemption from registration. As of October 31, 2024, these securities had a total aggregate market value of $6,430,555, representing 3.42% of net assets. |
(c) | Security was purchased pursuant to Regulation S under the Securities Act of 1933, which exempts securities offered and sold outside of the United States from registration. Such security cannot be sold in the United States without either an effective registration statement filed pursuant to the Securities Act of 1933, or pursuant to an exemption from registration. As of October 31, 2024, these securities had a total aggregate market value of $9,372,406, representing 4.99% of net assets. |
| (d) | As a result of the use of significant unobservable inputs to determine fair value, these investments have been classified as Level 3 assets. |
| Sector Composition (October 31, 2024) | ||||
| Technology | 27.6 | % | ||
| Financials | 18.9 | % | ||
| Industrials | 14.4 | % | ||
| Consumer Discretionary | 12.4 | % | ||
| Health Care | 9.7 | % | ||
| Consumer Staples | 7.3 | % | ||
| Communications | 3.5 | % | ||
| Materials | 2.0 | % | ||
| Energy | 1.8 | % | ||
| Real Estate | 1.1 | % | ||
| Utilities | 0.6 | % | ||
| Listed Private Equity Investments | 0.4 | % | ||
| Equity | 0.2 | % | ||
| Other Assets in Excess of Liabilities | 0.1 | % | ||
| Total | 100 | % | ||
See accompanying notes to financial statements.
21
| Grandeur Peak Global Reach Fund | Schedule of Investments |
| October 31, 2024 (Unaudited) |
| Industry Composition (October 31, 2024) | ||||
| Application Software | 8.8 | % | ||
| IT Services | 6.5 | % | ||
| Investment Management | 5.5 | % | ||
| Professional Services | 3.6 | % | ||
| Private Equity | 3.4 | % | ||
| Food & Drug Stores | 2.9 | % | ||
| Banks | 2.5 | % | ||
| Auto Parts | 2.5 | % | ||
| Infrastructure Software | 2.5 | % | ||
| Institutional Brokerage | 2.5 | % | ||
| Mass Merchants | 2.2 | % | ||
| Specialty & Generic Pharma | 2.2 | % | ||
| Other Commercial Support Services | 2.0 | % | ||
| Wealth Management | 1.9 | % | ||
| Internet Media & Services | 1.9 | % | ||
| Medical Equipment | 1.8 | % | ||
| Health Care Services | 1.8 | % | ||
| Communications Equipment | 1.7 | % | ||
| Electrical Components | 1.7 | % | ||
| Industrial Wholesale & Rental | 1.7 | % | ||
| Semiconductor Devices | 1.6 | % | ||
| Health Care Supplies | 1.6 | % | ||
| Home Products Stores | 1.6 | % | ||
| Electronics Components | 1.5 | % | ||
| Specialty Apparel Stores | 1.5 | % | ||
| Other Spec Retail - Discr | 1.4 | % | ||
| Exploration & Production | 1.3 | % | ||
| Semiconductor Mfg | 1.2 | % | ||
| Information Services | 1.2 | % | ||
| Health Care Facilities | 1.0 | % | ||
| Other Industries (each less than 1%) | 26.4 | % | ||
| Other Assets in Excess of Liabilities | 0.1 | % | ||
| Total | 100 | % | ||
See accompanying notes to financial statements.
22
| Grandeur Peak Global Stalwarts Fund | Schedule of Investments |
| October 31, 2024 (Unaudited) |
| Shares | Fair Value | |||||||
| COMMON STOCKS — 98.41% | ||||||||
| Argentina — 1.80% | ||||||||
| Globant S.A.(a) | 10,327 | $ | 2,167,534 | |||||
| Australia — 0.85% | ||||||||
| Lovisa Holdings Limited(a) | 5,229 | 101,593 | ||||||
| Pinnacle Investment Management Group | 33,663 | 442,089 | ||||||
| Steadfast Group Ltd.(a) | 134,077 | 482,818 | ||||||
| 1,026,500 | ||||||||
| Belgium — 1.55% | ||||||||
| Azelis Group N.V. | 32,326 | 647,566 | ||||||
| Melexis NV | 18,720 | 1,222,480 | ||||||
| 1,870,046 | ||||||||
| Brazil — 0.89% | ||||||||
| Patria Investments Limited(a) | 39,722 | 462,364 | ||||||
| Raia Drogasil S.A. | 142,692 | 603,466 | ||||||
| 1,065,830 | ||||||||
| Canada — 2.03% | ||||||||
| Aritzia Inc(a) | 17,244 | 555,211 | ||||||
| Descartes Systems Group, Inc. (The)(a) | 6,981 | 725,250 | ||||||
| Kinaxis Inc.(a) | 5,200 | 577,533 | ||||||
| Stantec, Inc.(a) | 7,200 | 584,026 | ||||||
| 2,442,020 | ||||||||
| China — 4.58% | ||||||||
| ANTA Sports Products Ltd. | 29,800 | 318,068 | ||||||
| Proya Cosmetics Co Ltd | 15,700 | 211,628 | ||||||
| Shanghai Hanbell Precise Machinery Co., Ltd. | 94,100 | 243,514 | ||||||
| Silergy Corp | 257,000 | 3,998,176 | ||||||
| Yum China Holdings Inc | 16,500 | 741,451 | ||||||
| 5,512,837 | ||||||||
| France — 1.91% | ||||||||
| Antin Infrastructure Partners | 31,256 | 359,613 | ||||||
| bioMerieux SA | 3,734 | 417,890 | ||||||
| Virbac SA | 4,009 | 1,523,580 | ||||||
| 2,301,083 | ||||||||
| Germany — 3.28% | ||||||||
| AIXTRON SE | 40,445 | 642,156 | ||||||
| Atoss Software AG | 2,872 | 377,739 | ||||||
| Dermapharm Holding SE | 28,561 | 970,113 | ||||||
| Hensoldt A.G. | 18,037 | 613,651 | ||||||
| RENK Group AG | 21,631 | 434,637 | ||||||
| Schott Pharma AG & Co | 28,054 | 906,858 | ||||||
| 3,945,154 | ||||||||
| Hong Kong — 1.37% | ||||||||
| Techtronic Industries Co Limited(a) | 113,900 | 1,647,653 | ||||||
| India — 2.01% | ||||||||
| Bajaj Finance Ltd | 7,442 | 607,969 | ||||||
| Devyani International Ltd.(a) | 31,420 | 63,104 | ||||||
| Five-Star Business(a) | 67,450 | 569,246 | ||||||
| IndiaMart InterMesh Ltd(b)(c) | 13,153 | 390,162 | ||||||
| Jubilant Foodworks Ltd(a) | 45,307 | 309,589 | ||||||
| PB Fintech Ltd(a) | 23,386 | 472,580 | ||||||
| 2,412,650 | ||||||||
| Shares | Fair Value | |||||||
| COMMON STOCKS — 98.41% (continued) | ||||||||
| Ireland — 0.36% | ||||||||
| ICON plc(a) | 1,950 | 433,115 | ||||||
| Israel — 0.70% | ||||||||
| CyberArk Software Ltd.(a) | 3,041 | 840,897 | ||||||
| Italy — 2.24% | ||||||||
| Interpump Group SpA | 27,777 | 1,234,114 | ||||||
| Recordati SpA(a) | 16,641 | 944,105 | ||||||
| Stevanato Group SpA | 27,459 | 521,996 | ||||||
| 2,700,215 | ||||||||
| Japan — 7.82% | ||||||||
| Amvis Holdings Inc | 61,300 | 795,753 | ||||||
| BayCurrent Consulting, Inc. | 116,300 | 3,779,628 | ||||||
| Internet Initiative Japan, Inc. | 32,000 | 614,429 | ||||||
| Japan Elevator Service Holdings Company Ltd. | 30,700 | 587,823 | ||||||
| Jeol Ltd. | 20,100 | 745,618 | ||||||
| Lasertec Corporation(a) | 4,900 | 664,907 | ||||||
| M&A Research Institute, Inc.(a) | 32,400 | 469,009 | ||||||
| Tokyo Seimitsu Company Limited | 13,100 | 704,900 | ||||||
| Visional Inc(a) | 19,500 | 1,043,424 | ||||||
| 9,405,491 | ||||||||
| Mexico — 2.49% | ||||||||
| BBB Foods Inc(a) | 32,112 | 1,025,657 | ||||||
| Corp Inmobiliaria Vesta SAB de CV | 452,565 | 1,177,990 | ||||||
| Grupo Cementos de Chihuahua, S.A.B. de C.V(a) | 95,900 | 786,278 | ||||||
| 2,989,925 | ||||||||
| Netherlands — 3.15% | ||||||||
| Aalberts N.V.(a) | 20,796 | 750,372 | ||||||
| ASM International N.V.(a) | 1,005 | 561,257 | ||||||
| BE Semiconductor Industries N.V. | 4,465 | 475,245 | ||||||
| CVC Capital Partners PLC(a) | 18,165 | 381,121 | ||||||
| IMCD N.V.(a) | 6,342 | 1,008,244 | ||||||
| Topicus.com, Inc.(a) | 7,000 | 599,224 | ||||||
| 3,775,463 | ||||||||
| Norway — 0.19% | ||||||||
| Kongsberg Gruppen ASA(a) | 2,148 | 224,208 | ||||||
| Poland — 1.16% | ||||||||
| Dino Polska SA(a)(b)(c) | 16,876 | 1,398,463 | ||||||
| Singapore — 0.54% | ||||||||
| Venture Corp LTD.(a) | 64,800 | 649,976 | ||||||
| South Korea — 2.51% | ||||||||
| APR Corp/Korea(a) | 11,205 | 403,325 | ||||||
| Eo Technics Co Ltd(a) | 7,078 | 861,763 | ||||||
| HPSP Company Ltd. | 32,832 | 720,299 | ||||||
| LEENO Industrial Inc.(a) | 7,944 | 1,039,186 | ||||||
| 3,024,573 | ||||||||
See accompanying notes to financial statements.
23
| Grandeur Peak Global Stalwarts Fund | Schedule of Investments |
| October 31, 2024 (Unaudited) |
| Shares | Fair Value | |||||||
| COMMON STOCKS — 98.41% (continued) | ||||||||
| Spain — 0.81% | ||||||||
| Allfunds Group Plc | 99,908 | $ | 611,051 | |||||
| Indra Sistemas S.A. | 20,406 | 359,719 | ||||||
| 970,770 | ||||||||
| Sweden — 3.89% | ||||||||
| AddTech AB | 14,805 | 412,208 | ||||||
| Beijer Ref AB | 53,620 | 807,744 | ||||||
| Epiroc AB | 31,590 | 544,225 | ||||||
| EQT A.B. | 24,436 | 708,992 | ||||||
| Lifco AB, Class B | 14,268 | 425,746 | ||||||
| Munters Group AB | 23,451 | 379,912 | ||||||
| Nibe Industrier A.B. | 116,648 | 565,597 | ||||||
| Vimian Group AB(a) | 112,825 | 473,586 | ||||||
| Vitec Software Group | 8,375 | 365,053 | ||||||
| 4,683,063 | ||||||||
| Switzerland — 0.57% | ||||||||
| Belimo Holding AG(a) | 389 | 257,710 | ||||||
| VAT Group AG | 1,036 | 431,425 | ||||||
| 689,135 | ||||||||
| Taiwan — 2.74% | ||||||||
| Asia Vital Components Co., Ltd. | 35,000 | 672,332 | ||||||
| ASPEED Technology, Inc. | 9,000 | 1,144,407 | ||||||
| Chroma Ate Inc | 63,000 | 798,504 | ||||||
| Sinbon Electronics Co., Limited(a) | 82,500 | 677,177 | ||||||
| 3,292,420 | ||||||||
| United Kingdom — 8.81% | ||||||||
| B & M European Value Retail SA | 749,990 | 3,751,541 | ||||||
| CVS Group plc | 37,195 | 456,309 | ||||||
| Diploma plc | 22,222 | 1,221,412 | ||||||
| Halma plc(a) | 20,018 | 639,377 | ||||||
| Intermediate Capital Group PLC | 23,448 | 622,773 | ||||||
| JTC plc(b)(c) | 158,863 | 2,105,448 | ||||||
| Marex Group PLC(a) | 28,485 | 750,295 | ||||||
| nVent Electric PLC | 7,611 | 567,552 | ||||||
| Softcat PLC(a) | 21,901 | 480,066 | ||||||
| 10,594,773 | ||||||||
| United States — 38.76% | ||||||||
| 4imprint Group PLC | 6,454 | 425,055 | ||||||
| Alamo Group, Inc. | 3,970 | 673,074 | ||||||
| Align Technology, Inc.(a) | 3,387 | 694,437 | ||||||
| Apollo Global Management, Inc. | 3,389 | 485,508 | ||||||
| Ares Management Corporation, CLASS A | 5,376 | 901,448 | ||||||
| Ashtead Group PLC | 17,143 | 1,282,204 | ||||||
| Atricure, Inc.(a) | 11,571 | 383,926 | ||||||
| Blue Owl Capital, Inc. | 12,472 | 278,874 | ||||||
| Burlington Stores, Inc.(a) | 3,649 | 904,113 | ||||||
| Cactus, Inc., Class A | 5,107 | 302,794 | ||||||
| Charles River Laboratories International, Inc.(a) | 2,339 | 417,699 | ||||||
| Clearwater Analytics Holdings, Inc., Class A(a) | 35,204 | 919,176 | ||||||
| Cloudflare, Inc., Class A(a) | 10,345 | 907,360 | ||||||
| Core & Main, Inc.(a) | 28,123 | 1,245,286 | ||||||
| Cross Creek LP(a)(d) | 1,300,000 | 951,242 | ||||||
| DexCom, Inc.(a) | 15,448 | 1,088,774 | ||||||
| DigitalOcean Holdings, Inc.(a) | 29,200 | 1,155,735 | ||||||
| Shares | Fair Value | |||||||
| COMMON STOCKS — 98.41% (continued) | ||||||||
| United States — 38.76% (continued) | ||||||||
| Dorman Products, Inc.(a) | 3,372 | $ | 384,509 | |||||
| Elastic N.V.(a) | 15,161 | 1,216,368 | ||||||
| EMCOR Group, Inc. | 896 | 399,679 | ||||||
| Ensign Group, Inc. (The) | 8,953 | 1,387,625 | ||||||
| Etsy, Inc.(a) | 17,720 | 911,517 | ||||||
| FirstCash Holdings, Inc. | 4,751 | 491,586 | ||||||
| Five Below, Inc.(a) | 13,190 | 1,250,280 | ||||||
| FormFactor, Inc.(a) | 18,551 | 704,567 | ||||||
| Goosehead Insurance, Inc., Class A(a) | 11,263 | 1,226,541 | ||||||
| GQG Partners, Inc. | 337,069 | 611,765 | ||||||
| Grocery Outlet Holding Corporation(a) | 63,777 | 912,011 | ||||||
| HealthEquity, Inc.(a) | 7,124 | 607,321 | ||||||
| Herc Holdings, Inc.(a) | 4,961 | 1,037,544 | ||||||
| JFrog Ltd.(a) | 46,471 | 1,356,024 | ||||||
| KKR & Company, Inc. | 6,069 | 838,979 | ||||||
| Littelfuse, Inc. | 13,526 | 3,308,865 | ||||||
| Lululemon Athletica, Inc.(a) | 5,960 | 1,775,484 | ||||||
| Medpace Holdings, Inc.(a) | 2,892 | 908,724 | ||||||
| Modine Manufacturing Company(a) | 5,989 | 705,325 | ||||||
| Monolithic Power Systems, Inc. | 838 | 636,293 | ||||||
| Neogen Corporation(a) | 37,275 | 532,287 | ||||||
| NV5 Global, Inc.(a) | 19,444 | 444,295 | ||||||
| Ollie’s Bargain Outlet Holdings, Inc.(a) | 5,249 | 482,016 | ||||||
| Perella Weinberg Partners LP | 31,247 | 632,127 | ||||||
| Pjt Partners, Inc., Class A | 6,720 | 933,811 | ||||||
| Primoris Services Corporation | 19,174 | 1,200,676 | ||||||
| Rexford Industrial Realty, Inc. | 13,452 | 576,956 | ||||||
| SentinelOne Inc(a) | 20,588 | 530,965 | ||||||
| Silicon Laboratories, Inc.(a) | 13,723 | 1,425,271 | ||||||
| Sitime Corporation(a) | 4,317 | 729,616 | ||||||
| Skechers U.S.A., Inc., Class A(a) | 15,124 | 929,521 | ||||||
| SPS Commerce, Inc.(a) | 5,448 | 898,920 | ||||||
| TRADEWEB MARKETS INC. Class A | 4,398 | 558,546 | ||||||
| Trex Company, Inc.(a) | 6,679 | 473,207 | ||||||
| Ulta Beauty, Inc.(a) | 2,244 | 827,991 | ||||||
| WillScot Holdings Corporation(a) | 9,451 | 313,206 | ||||||
| Yeti Holdings, Inc.(a) | 20,972 | 738,424 | ||||||
| Zscaler, Inc.(a) | 3,964 | 716,652 | ||||||
| 46,632,199 | ||||||||
| Vietnam — 1.40% | ||||||||
| Asia Commercial Bank JSC | 715,300 | 717,295 | ||||||
| FPT Corp | 68,625 | 367,451 | ||||||
| Vietnam Technological & Comm Joint-stock Bank(a) | 641,310 | 604,132 | ||||||
| 1,688,878 | ||||||||
| Total Common Stocks (Cost $100,025,103) | 118,384,871 | |||||||
| PREFERRED STOCKS — 0.95% | ||||||||
| United States — 0.95% | ||||||||
| Gusto Inc. Preferred Series E(a)(d) | 37,637 | 1,144,165 | ||||||
| Total Preferred Stocks (Cost $1,143,989) | 1,144,165 | |||||||
See accompanying notes to financial statements.
24
| Grandeur Peak Global Stalwarts Fund | Schedule of Investments |
| October 31, 2024 (Unaudited) |
| Total Investments — 99.36% (Cost $101,169,092) | $ | 119,529,037 | ||||||
| Other Assets in Excess of Liabilities — 0.64% | 766,241 | |||||||
| NET ASSETS — 100.00% | $ | 120,295,277 |
| (a) | Non-income producing security. |
(b) | Security exempt from registration under Rule 144A of the Securities Act of 1933. These securities may be resold in the ordinary course of business in transactions exempt from registration, normally to qualified institutional buyers. As of October 31, 2024, these securities had a total aggregate market value of $3,894,073, representing 3.24% of net assets. |
(c) | Security was purchased pursuant to Regulation S under the Securities Act of 1933, which exempts securities offered and sold outside of the United States from registration. Such security cannot be sold in the United States without either an effective registration statement filed pursuant to the Securities Act of 1933, or pursuant to an exemption from registration. As of October 31, 2024, these securities had a total aggregate market value of $3,894,073, representing 3.24% of net assets. |
| (d) | As a result of the use of significant unobservable inputs to determine fair value, these investments have been classified as Level 3 assets. |
| Sector Composition (October 31, 2024) | ||||
| Technology | 33.1 | % | ||
| Industrials | 20.5 | % | ||
| Financials | 13.5 | % | ||
| Health Care | 11.7 | % | ||
| Consumer Discretionary | 8.0 | % | ||
| Consumer Staples | 7.5 | % | ||
| Materials | 2.4 | % | ||
| Real Estate | 1.5 | % | ||
| Listed Private Equity Investments | 0.8 | % | ||
| Communications | 0.4 | % | ||
| Other Assets in Excess of Liabilities | 0.6 | % | ||
| Total | 100 | % | ||
| Industry Composition (October 31, 2024) | ||||
| Application Software | 8.6 | % | ||
| IT Services | 6.1 | % | ||
| Semiconductor Devices | 5.4 | % | ||
| Industrial Wholesale & Rental | 4.9 | % | ||
| Mass Merchants | 4.6 | % | ||
| Electronics Components | 4.2 | % | ||
| Electrical Components | 3.8 | % | ||
| Specialty Apparel Stores | 3.0 | % | ||
| Specialty & Generic Pharma | 2.9 | % | ||
| Private Equity | 2.8 | % | ||
| Semiconductor Mfg | 2.3 | % | ||
| Investment Management | 2.3 | % | ||
| Health Care Services | 2.2 | % | ||
| Institutional Brokerage | 2.2 | % | ||
| Flow Control Equipment | 2.1 | % | ||
| Medical Equipment | 1.8 | % | ||
| Health Care Facilities | 1.8 | % | ||
| Wealth Management | 1.8 | % | ||
| Infrastructure Software | 1.7 | % | ||
| Food & Drug Stores | 1.7 | % | ||
| Health Care Supplies | 1.6 | % | ||
| Insurance Brokers & Services | 1.4 | % | ||
| Other Machinery & Equipment | 1.4 | % | ||
| Data & Transaction Processors | 1.4 | % | ||
| Comml & Res Bldg Equipment & Sys | 1.2 | % | ||
| Banks | 1.1 | % | ||
| Online Marketplace | 1.1 | % | ||
| Fabricated Metal & Hardware | 1.0 | % | ||
| Infrastructure Construction | 1.0 | % | ||
| Semiconductor Manufacturing | 1.0 | % | ||
| Industrial Owners & Developers | 1.0 | % | ||
| Life Science & Diagnostics | 1.0 | % | ||
| Other Industries (each less than 1%) | 19.0 | % | ||
| Other Assets in Excess of Liabilities | 0.6 | % | ||
| Total | 100 | % | ||
See accompanying notes to financial statements.
25
| Grandeur Peak International Opportunities Fund | Schedule of Investments |
| October 31, 2024 (Unaudited) |
| Shares | Fair Value | |||||||
| COMMON STOCKS — 99.42% | ||||||||
| Argentina — 1.12% | ||||||||
| Globant S.A.(a) | 22,907 | $ | 4,807,950 | |||||
| Australia — 2.80% | ||||||||
| Fiducian Group Ltd | 116,341 | 700,480 | ||||||
| Imdex Ltd | 1,554,030 | 2,639,733 | ||||||
| IPD Group Ltd/Australia(a) | 398,222 | 1,208,883 | ||||||
| Johns Lyng Group Ltd | 1,069,204 | 2,676,868 | ||||||
| MA Financial Group Ltd | 337,505 | 1,417,036 | ||||||
| Pinnacle Investment Management Group | 254,493 | 3,342,204 | ||||||
| 11,985,204 | ||||||||
| Belgium — 1.90% | ||||||||
| Melexis NV | 78,267 | 5,111,104 | ||||||
| X-Fab Silicon Foundries S.E.(a)(b)(c) | 639,845 | 3,049,715 | ||||||
| 8,160,819 | ||||||||
| Brazil — 2.29% | ||||||||
| Armac Locacao Logistica E Servicos SA | 1,724,100 | 2,230,687 | ||||||
| Grupo Mateus SA(a) | 1,791,600 | 2,342,811 | ||||||
| Patria Investments Limited(a) | 287,046 | 3,341,216 | ||||||
| Vinci Partners Invest Ltd | 183,667 | 1,884,423 | ||||||
| 9,799,137 | ||||||||
| Canada — 2.23% | ||||||||
| Aritzia Inc(a) | 135,801 | 4,372,434 | ||||||
| Descartes Systems Group, Inc. (The)(a) | 10,200 | 1,059,669 | ||||||
| Foran Mining Corp(a) | 651,400 | 2,044,470 | ||||||
| Richelieu Hardware, Ltd.(a) | 78,636 | 2,072,148 | ||||||
| 9,548,721 | ||||||||
| China — 5.73% | ||||||||
| Adicon Holdings Ltd(a) | 1,769,000 | 1,452,473 | ||||||
| Centre Testing Int | 1,778,600 | 3,448,837 | ||||||
| Man Wah Holdings Limited(a) | 4,669,500 | 3,392,650 | ||||||
| Shanghai Hanbell Precise Machi | 798,300 | 2,065,862 | ||||||
| Silergy Corp | 718,996 | 11,185,491 | ||||||
| Yum China Holdings Inc | 66,600 | 2,992,768 | ||||||
| 24,538,081 | ||||||||
| Colombia — 0.38% | ||||||||
| Parex Resources, Inc.(a) | 174,306 | 1,618,685 | ||||||
| Finland — 0.27% | ||||||||
| Revenio Group Oyj | 35,645 | 1,143,711 | ||||||
| France — 3.91% | ||||||||
| Antin Infrastructure Partners | 141,072 | 1,623,093 | ||||||
| Neurones SA | 43,022 | 2,180,580 | ||||||
| Planisware SAS(a) | 66,707 | 1,631,174 | ||||||
| Thermador Groupe | 33,636 | 2,639,428 | ||||||
| Virbac SA | 22,801 | 8,665,288 | ||||||
| 16,739,563 | ||||||||
| Germany — 7.45% | ||||||||
| 2G Energy AG(a) | 57,492 | 1,382,481 | ||||||
| Atoss Software AG | 25,865 | 3,401,884 | ||||||
| Dermapharm Holding SE | 159,728 | 5,425,375 | ||||||
| Elmos Semiconductor AG(a) | 59,451 | 3,551,673 | ||||||
| Shares | Fair Value | |||||||
| COMMON STOCKS — 99.42% (continued) | ||||||||
| Germany — 7.45% (continued) | ||||||||
| Mensch und Maschine Software S | 72,676 | $ | 4,229,025 | |||||
| Nexus AG | 73,646 | 3,856,923 | ||||||
| QIAGEN N.V.(a) | 74,172 | 3,122,641 | ||||||
| RENK Group AG | 117,701 | 2,364,995 | ||||||
| Schott Pharma AG & Co | 65,306 | 2,111,045 | ||||||
| Stabilus SE | 62,210 | 2,462,663 | ||||||
| 31,908,705 | ||||||||
| Hong Kong — 0.51% | ||||||||
| Techtronic Industries Co Limited(a) | 151,300 | 2,188,673 | ||||||
| India — 4.44% | ||||||||
| Bajaj Housing Finance Ltd(a) | 749,929 | 1,196,268 | ||||||
| Five-Star Business(a) | 335,990 | 2,835,598 | ||||||
| Gulf Oil Lubricants India Ltd. | 161,771 | 2,272,668 | ||||||
| IndiaMart InterMesh Ltd(b)(c) | 95,864 | 2,843,649 | ||||||
| Indigo Paints Ltd | 162,298 | 3,170,965 | ||||||
| Motherson Sumi Wiring India Ltd | 2,715,755 | 2,022,373 | ||||||
| SJS Enterprises Ltd(a) | 325,813 | 4,694,653 | ||||||
| 19,036,174 | ||||||||
| Indonesia — 1.88% | ||||||||
| Aspirasi Hidup Indonesia | 52,125,900 | 2,986,117 | ||||||
| Bank BTPN Syariah Tbk PT | 8,640,500 | 586,347 | ||||||
| Selamat Sempurna Tbk PT | 18,351,500 | 2,256,811 | ||||||
| Ultrajaya Milk Industry & Trad | 20,234,000 | 2,243,352 | ||||||
| 8,072,627 | ||||||||
| Ireland — 0.63% | ||||||||
| Uniphar PLC(a) | 1,082,840 | 2,693,244 | ||||||
| Italy — 3.02% | ||||||||
| Interpump Group SpA | 134,705 | 5,984,859 | ||||||
| Recordati SpA(a) | 68,948 | 3,911,673 | ||||||
| Sesa SpA | 35,146 | 3,052,032 | ||||||
| 12,948,564 | ||||||||
| Japan — 16.82% | ||||||||
| Amvis Holdings Inc | 99,900 | 1,296,830 | ||||||
| BayCurrent Consulting, Inc. | 342,400 | 11,127,643 | ||||||
| Central Automotive NPV(a) | 32,400 | 975,844 | ||||||
| Charm Care Corp KK | 395,300 | 3,218,760 | ||||||
| CrowdWorks Inc(a) | 275,500 | 2,385,244 | ||||||
| Cyber Security Cloud Inc(a) | 169,000 | 1,984,152 | ||||||
| eWeLL Co., Ltd.(a) | 52,300 | 543,418 | ||||||
| F&M Co Ltd | 76,100 | 791,256 | ||||||
| Future Corporation | 159,200 | 2,038,435 | ||||||
| gremz Inc | 153,100 | 2,603,708 | ||||||
| Hennge KK(a) | 406,300 | 2,932,773 | ||||||
| Insource Co Ltd | 687,800 | 4,310,244 | ||||||
| Integral Corp(a) | 271,400 | 6,883,054 | ||||||
| Japan Elevator Service Holdings Company Ltd. | 130,800 | 2,504,471 | ||||||
| JMDC, Inc. | 38,600 | 1,075,681 | ||||||
| Kitz Corp(a) | 380,200 | 2,622,717 | ||||||
| MarkLines Company Ltd.(a) | 257,900 | 4,618,343 | ||||||
| Medley Inc(a) | 129,100 | 3,149,981 | ||||||
| Plus Alpha Consulting | 114,000 | 1,593,516 | ||||||
See accompanying notes to financial statements.
26
| Grandeur Peak International Opportunities Fund | Schedule of Investments |
| October 31, 2024 (Unaudited) |
| Shares | Fair Value | |||||||
| COMMON STOCKS — 99.42% (continued) | ||||||||
| Japan — 16.82% (continued) | ||||||||
| Prestige International Inc | 168,444 | $ | 752,993 | |||||
| Sun* Inc(a) | 400,300 | 1,376,324 | ||||||
| Synchro Food Co Ltd(a) | 643,100 | 1,962,499 | ||||||
| Tokyo Seimitsu Company Ltd. | 47,900 | 2,577,458 | ||||||
| ULS Group Inc | 59,900 | 2,116,122 | ||||||
| User Local Inc. | 110,100 | 1,327,116 | ||||||
| Visional Inc(a) | 61,700 | 3,301,501 | ||||||
| Yakuodo Holdings Company Limited | 144,000 | 2,002,786 | ||||||
| 72,072,869 | ||||||||
| Luxembourg — 0.51% | ||||||||
| Sword Group | 55,600 | 2,163,539 | ||||||
| Mexico — 1.80% | ||||||||
| Corp Inmobiliaria Vesta SAB de CV | 468,200 | 1,218,686 | ||||||
| Grupo Financiero Banorte SAB de CV | 308,500 | 2,152,379 | ||||||
| Regional SAB de cv(a) | 416,500 | 2,648,696 | ||||||
| Vesta Real Estate Corp. – ADR(a) | 64,778 | 1,688,115 | ||||||
| 7,707,876 | ||||||||
| Netherlands — 1.58% | ||||||||
| Aalberts N.V.(a) | 59,164 | 2,134,787 | ||||||
| Redcare Pharmacy N.V.(a) | 15,600 | 2,388,944 | ||||||
| Topicus.com, Inc.(a) | 26,100 | 2,234,251 | ||||||
| 6,757,982 | ||||||||
| Norway — 1.09% | ||||||||
| Bouvet ASA | 297,747 | 1,834,613 | ||||||
| SmartCraft ASA(a) | 1,046,804 | 2,845,047 | ||||||
| 4,679,660 | ||||||||
| Philippines — 1.11% | ||||||||
| Puregold Price Club, Inc. | 5,699,000 | 3,182,433 | ||||||
| Wilcon Depot Inc | 5,738,600 | 1,583,651 | ||||||
| 4,766,084 | ||||||||
| Poland — 1.66% | ||||||||
| Dino Polska SA(a)(b)(c) | 61,375 | 5,085,962 | ||||||
| Inter Cars SA | 17,177 | 2,021,177 | ||||||
| 7,107,139 | ||||||||
| Singapore — 2.00% | ||||||||
| iFast Corporation | 468,400 | 2,650,238 | ||||||
| Kulicke & Soffa Industries, Inc. | 56,978 | 2,556,033 | ||||||
| Riverstone Holdings Ltd.(a) | 4,905,300 | 3,358,627 | ||||||
| 8,564,898 | ||||||||
| South Korea — 1.80% | ||||||||
| Eo Technics Co Ltd(a) | 23,229 | 2,828,188 | ||||||
| LEENO Industrial Inc.(a) | 21,991 | 2,876,728 | ||||||
| SOLUM Co Ltd(a) | 143,231 | 1,985,343 | ||||||
| 7,690,259 | ||||||||
| Spain — 0.61% | ||||||||
| Allfunds Group Plc | 429,273 | 2,625,491 | ||||||
| Sweden — 4.38% | ||||||||
| Beijer Alma AB | 115,687 | 1,863,959 | ||||||
| Beijer Ref A.B. | 106,780 | 1,608,561 | ||||||
| Nibe Industrier A.B. | 462,323 | 2,241,688 | ||||||
| Shares | Fair Value | |||||||
| COMMON STOCKS — 99.42% (continued) | ||||||||
| Sweden — 4.38% (continued) | ||||||||
| RVRC Holding AB | 268,300 | $ | 1,168,730 | |||||
| Sdiptech AB(a) | 167,547 | 3,783,526 | ||||||
| Swedencare AB(a) | 447,317 | 1,953,533 | ||||||
| Swedish Logistic(a) | 805,859 | 2,834,466 | ||||||
| Vimian Group AB(a) | 789,062 | 3,312,110 | ||||||
| 18,766,573 | ||||||||
| Taiwan — 2.95% | ||||||||
| M3 Technology Inc | 596,000 | 1,928,970 | ||||||
| Sinbon Electronics Co., Limited(a) | 398,000 | 3,266,867 | ||||||
| Sporton International, Inc.(a) | 1,134,338 | 7,422,364 | ||||||
| 12,618,201 | ||||||||
| United Kingdom — 20.96% | ||||||||
| AB Dynamics PLC | 65,213 | 1,471,299 | ||||||
| Advanced Medical Solutions Group plc | 918,400 | 2,697,600 | ||||||
| Ashtead Technology Holdings ORD | 231,581 | 1,648,051 | ||||||
| B & M European Value Retail SA | 2,560,390 | 12,807,379 | ||||||
| CVS Group plc | 595,836 | 7,309,728 | ||||||
| Diploma plc | 98,367 | 5,406,655 | ||||||
| Endava plc - ADR(a) | 86,325 | 2,041,586 | ||||||
| Foresight Group Holdings Ltd | 696,452 | 4,175,156 | ||||||
| FRP Advisory Group PLC | 1,353,390 | 2,704,477 | ||||||
| GlobalData PLC | 847,904 | 2,219,072 | ||||||
| Halma plc(a) | 68,435 | 2,185,820 | ||||||
| Impax Asset Management Group P | 633,622 | 2,878,173 | ||||||
| Intermediate Capital Group PLC | 137,060 | 3,640,282 | ||||||
| JTC plc(b)(c) | 886,484 | 11,748,775 | ||||||
| Marex Group PLC(a) | 52,699 | 1,388,092 | ||||||
| Marlowe plc(a) | 512,842 | 2,223,149 | ||||||
| Petershill Partners PLC(a) | 1,164,000 | 3,253,275 | ||||||
| Pets at Home Group PLC | 736,517 | 2,812,525 | ||||||
| Softcat PLC(a) | 198,068 | 4,341,616 | ||||||
| Tatton Asset Mgmt | 285,628 | 2,511,388 | ||||||
| Volution Group PLC | 1,141,571 | 8,516,655 | ||||||
| YouGov PLC(a) | 307,946 | 1,834,055 | ||||||
| 89,814,808 | ||||||||
| United States — 1.53% | ||||||||
| GQG Partners Inc | 1,835,727 | 3,331,762 | ||||||
| JFrog Ltd.(a) | 111,025 | 3,239,710 | ||||||
| 6,571,472 | ||||||||
| Vietnam — 2.06% | ||||||||
| Asia Commercial Bank JSC | 3,258,180 | 3,267,266 | ||||||
| FPT Corp | 629,177 | 3,368,917 | ||||||
| Vietnam Technological & Comm Joint-stock Bank(a) | 2,332,246 | 2,197,042 | ||||||
| 8,833,225 | ||||||||
| Total Common Stocks (Cost $365,971,713) | 425,929,934 | |||||||
| Total Investments — 99.42% (Cost $365,971,713) | $ | 425,929,934 | ||||||
| Other Assets in Excess of Liabilities — 0.58% | 2,469,653 | |||||||
| NET ASSETS — 100.00% | $ | 428,399,587 | ||||||
See accompanying notes to financial statements.
27
| Grandeur Peak International Opportunities Fund | Schedule of Investments |
| October 31, 2024 (Unaudited) |
| (a) | Non-income producing security. |
| (b) | Security exempt from registration under Rule 144A of the Securities Act of 1933. These securities may be resold in the ordinary course of business in transactions exempt from registration, normally to qualified institutional buyers. As of October 31, 2024, these securities had a total aggregate market value of $22,728,101, representing 5.31% of net assets. |
| (c) | Security was purchased pursuant to Regulation S under the Securities Act of 1933, which exempts securities offered and sold outside of the United States from registration. Such security cannot be sold in the United States without either an effective registration statement filed pursuant to the Securities Act of 1933, or pursuant to an exemption from registration. As of October 31, 2024, the aggregate market value of these securities was $22,728,101, representing 5.31% of net assets. |
| Sector Composition (October 31, 2024) | ||||
| Technology | 26.6 | % | ||
| Industrials | 17.8 | % | ||
| Financials | 16.3 | % | ||
| Consumer Discretionary | 11.4 | % | ||
| Health Care | 11.3 | % | ||
| Consumer Staples | 7.0 | % | ||
| Communications | 3.6 | % | ||
| Materials | 2.4 | % | ||
| Real Estate | 1.3 | % | ||
| Energy | 1.1 | % | ||
| Utilities | 0.6 | % | ||
| Other Assets in Excess of Liabilities | 0.6 | % | ||
| Total | 100 | % | ||
| Industry Composition (October 31, 2024) | ||||
| IT Services | 9.2 | % | ||
| Application Software | 5.8 | % | ||
| Private Equity | 5.0 | % | ||
| Specialty & Generic Pharma | 4.2 | % | ||
| Investment Management | 4.1 | % | ||
| Food & Drug Stores | 3.5 | % | ||
| Comml & Res Bldg Equipment & Sys | 3.5 | % | ||
| Wealth Management | 3.4 | % | ||
| Electronics Components | 3.3 | % | ||
| Flow Control Equipment | 3.0 | % | ||
| Mass Merchants | 3.0 | % | ||
| Other Commercial Support Services | 2.9 | % | ||
| Banks | 2.5 | % | ||
| Health Care Services | 2.5 | % | ||
| Semiconductor Devices | 2.5 | % | ||
| Auto Parts | 2.4 | % | ||
| Internet Media & Services | 2.3 | % | ||
| Professional Services | 2.1 | % | ||
| Health Care Supplies | 1.9 | % | ||
| Technology Distributors | 1.8 | % | ||
| Home Products Stores | 1.7 | % | ||
| Industrial Owners & Developers | 1.3 | % | ||
| Specialty Technology Hardware | 1.3 | % | ||
| Specialty Chemicals | 1.3 | % | ||
| Industrial Wholesale & Rental | 1.3 | % | ||
| Semiconductor Mfg | 1.3 | % | ||
| Other Spec Retail - Discr | 1.1 | % | ||
| Other Machinery & Equipment | 1.1 | % | ||
| Health Care Facilities | 1.1 | % | ||
| Specialty Apparel Stores | 1.0 | % | ||
| Educational Services | 1.0 | % | ||
| Other Industries (each less than 1%) | 17.0 | % | ||
| Other Assets in Excess of Liabilities | 0.6 | % | ||
| Total | 100 | % | ||
See accompanying notes to financial statements.
28
| Grandeur Peak International Stalwarts Fund | Schedule of Investments |
| October 31, 2024 (Unaudited) |
| Shares | Fair Value | |||||||
| COMMON STOCKS — 99.26% | ||||||||
| Argentina — 1.78% | ||||||||
| Globant S.A.(a) | 138,327 | $ | 29,033,454 | |||||
| Australia — 1.04% | ||||||||
| Lovisa Holdings Limited(a) | 70,340 | 1,366,624 | ||||||
| Pinnacle Investment Management Group | 535,755 | 7,035,958 | ||||||
| Steadfast Group Ltd.(a) | 2,369,685 | 8,533,344 | ||||||
| 16,935,926 | ||||||||
| Belgium — 2.57% | ||||||||
| Azelis Group N.V. | 644,495 | 12,910,745 | ||||||
| Melexis NV | 445,712 | 29,106,525 | ||||||
| 42,017,270 | ||||||||
| Brazil — 2.07% | ||||||||
| Grupo Mateus SA(a) | 5,316,300 | 6,951,936 | ||||||
| Patria Investments Limited(a) | 1,070,596 | 12,461,737 | ||||||
| Raia Drogasil S.A. | 3,399,856 | 14,378,510 | ||||||
| 33,792,183 | ||||||||
| Canada — 3.21% | ||||||||
| Aritzia Inc(a) | 443,319 | 14,273,703 | ||||||
| Constellation Software, Inc. | 2,707 | 8,163,753 | ||||||
| Descartes Systems Group, Inc. (The)(a) | 104,827 | 10,890,384 | ||||||
| Kinaxis Inc.(a) | 89,323 | 9,920,572 | ||||||
| Stantec, Inc.(a) | 113,520 | 9,208,136 | ||||||
| 52,456,548 | ||||||||
| China — 6.02% | ||||||||
| ANTA Sports Products Ltd. | 503,400 | 5,373,008 | ||||||
| Centre Testing Int | 3,403,700 | 6,600,026 | ||||||
| Proya Cosmetics Co Ltd | 213,700 | 2,880,565 | ||||||
| Shanghai Hanbell Precise Machi | 1,899,291 | 4,915,036 | ||||||
| Silergy Corp | 3,780,805 | 58,818,359 | ||||||
| Yum China Holdings Inc | 442,106 | 19,866,675 | ||||||
| 98,453,669 | ||||||||
| France — 2.64% | ||||||||
| Antin Infrastructure Partners | 525,297 | 6,043,763 | ||||||
| bioMerieux SA | 109,438 | 12,247,730 | ||||||
| Virbac SA | 65,339 | 24,831,422 | ||||||
| 43,122,915 | ||||||||
| Germany — 5.17% | ||||||||
| AIXTRON SE | 738,708 | 11,728,681 | ||||||
| Atoss Software AG | 77,653 | 10,213,281 | ||||||
| Dermapharm Holding SE | 460,437 | 15,639,359 | ||||||
| Hensoldt A.G. | 394,434 | 13,419,358 | ||||||
| QIAGEN N.V.(a) | 304,072 | 12,801,431 | ||||||
| RENK Group AG | 363,896 | 7,311,851 | ||||||
| Schott Pharma AG & Co | 414,244 | 13,390,615 | ||||||
| 84,504,576 | ||||||||
| Hong Kong — 2.11% | ||||||||
| Techtronic Industries Co Limited(a) | 2,382,181 | 34,460,113 | ||||||
| India — 3.41% | ||||||||
| Avenue Supermarts Ltd(a)(b)(c) | 139,852 | 6,528,316 | ||||||
| Bajaj Finance Ltd | 149,536 | 12,216,229 | ||||||
| Devyani International Ltd.(a) | 422,643 | 848,838 | ||||||
| Shares | Fair Value | |||||||
| COMMON STOCKS — 99.26% (continued) | ||||||||
| India — 3.41% (continued) | ||||||||
| Five-Star Business(a) | 1,178,801 | $ | 9,948,527 | |||||
| IndiaMart InterMesh Ltd(b)(c) | 276,336 | 8,197,056 | ||||||
| Jubilant Foodworks Ltd(a) | 609,462 | 4,164,537 | ||||||
| Motherson Sumi Wiring India Ltd | 7,004,052 | 5,215,790 | ||||||
| PB Fintech Ltd(a) | 431,545 | 8,720,581 | ||||||
| 55,839,874 | ||||||||
| Ireland — 0.93% | ||||||||
| ICON plc(a) | 68,768 | 15,274,060 | ||||||
| Israel — 1.12% | ||||||||
| CyberArk Software Ltd.(a) | 66,271 | 18,325,257 | ||||||
| Italy — 4.52% | ||||||||
| Brembo NV(a) | 813,025 | 8,538,138 | ||||||
| Interpump Group SpA | 620,722 | 27,578,289 | ||||||
| Recordati SpA(a) | 376,630 | 21,367,604 | ||||||
| Sesa SpA | 91,273 | 7,926,025 | ||||||
| Stevanato Group SpA | 445,631 | 8,471,445 | ||||||
| 73,881,501 | ||||||||
| Japan — 11.14% | ||||||||
| Amvis Holdings Inc | 1,055,783 | 13,705,417 | ||||||
| BayCurrent Consulting, Inc. | 1,827,410 | 59,388,924 | ||||||
| Gmo Payment Gateway NPV | 116,349 | 6,968,948 | ||||||
| Internet Initiative Japan, Inc. | 487,747 | 9,365,180 | ||||||
| Japan Elevator Service Holdings Company Ltd. | 566,916 | 10,854,930 | ||||||
| Jeol Ltd. | 332,950 | 12,350,914 | ||||||
| JMDC Inc | 237,994 | 6,632,272 | ||||||
| Lasertec Corporation(a) | 79,040 | 10,725,359 | ||||||
| M&A Research Institute Inc(a) | 487,500 | 7,056,853 | ||||||
| MISUMI Group Inc | 304,721 | 4,959,488 | ||||||
| Monotaro Company, Ltd. | 596,097 | 8,992,899 | ||||||
| Tokyo Seimitsu Company Limited | 201,862 | 10,862,020 | ||||||
| Visional Inc(a) | 379,501 | 20,306,689 | ||||||
| 182,169,893 | ||||||||
| Luxembourg — 0.70% | ||||||||
| Eurofins Scientific S.E. | 232,770 | 11,479,792 | ||||||
| Mexico — 3.96% | ||||||||
| BBB Foods Inc(a) | 594,769 | 18,996,923 | ||||||
| Corp Inmobiliaria Vesta SAB de CV | 7,098,829 | 18,477,667 | ||||||
| Grupo Cementos de Chihuahua, S.A.B. de C.V(a) | 1,309,276 | 10,734,676 | ||||||
| Regional SAB de cv(a) | 1,311,575 | 8,340,846 | ||||||
| Wal-Mart de Mexico SAB de CV | 2,994,076 | 8,264,523 | ||||||
| 64,814,635 | ||||||||
| Netherlands — 4.33% | ||||||||
| Aalberts N.V.(a) | 383,949 | 13,853,853 | ||||||
| ASM International N.V.(a) | 19,403 | 10,835,877 | ||||||
| BE Semiconductor Industries N.V. | 73,547 | 7,828,188 | ||||||
| CVC Capital Partners PLC(a) | 272,999 | 5,727,812 | ||||||
| IMCD N.V.(a) | 127,058 | 20,199,542 | ||||||
| Topicus.com, Inc.(a) | 144,149 | 12,339,656 | ||||||
| 70,784,928 | ||||||||
See accompanying notes to financial statements.
29
| Grandeur Peak International Stalwarts Fund | Schedule of Investments |
| October 31, 2024 (Unaudited) |
| Shares | Fair Value | |||||||
| COMMON STOCKS — 99.26% (continued) | ||||||||
| Norway — 0.30% | ||||||||
| Kongsberg Gruppen ASA(a) | 46,234 | $ | 4,825,907 | |||||
| Poland — 1.55% | ||||||||
| Dino Polska SA(a)(b)(c) | 305,112 | 25,283,714 | ||||||
| Singapore — 0.74% | ||||||||
| Venture Corp LTD.(a) | 1,207,661 | 12,113,444 | ||||||
| South Korea — 2.97% | ||||||||
| APR Corp/Korea(a) | 215,795 | 7,767,552 | ||||||
| Eo Technics Co Ltd(a) | 118,821 | 14,466,751 | ||||||
| HPSP Company Ltd. | 451,571 | 9,906,980 | ||||||
| LEENO Industrial Inc.(a) | 126,038 | 16,487,522 | ||||||
| 48,628,805 | ||||||||
| Spain — 0.97% | ||||||||
| Allfunds Group Plc | 1,613,535 | 9,868,597 | ||||||
| Indra Sistemas S.A. | 343,192 | 6,049,830 | ||||||
| 15,918,427 | ||||||||
| Sweden — 6.95% | ||||||||
| AddTech AB | 313,550 | 8,730,000 | ||||||
| Beijer Ref AB | 828,902 | 12,486,791 | ||||||
| Epiroc AB | 569,811 | 9,816,570 | ||||||
| EQT A.B. | 809,337 | 23,482,306 | ||||||
| HMS Networks AB | 104,538 | 3,889,770 | ||||||
| Lagercrantz Group A.B. | 420,038 | 8,226,358 | ||||||
| Lifco AB, Class B | 336,386 | 10,037,487 | ||||||
| Munters Group AB | 438,497 | 7,103,766 | ||||||
| Nibe Industrier A.B. | 2,922,338 | 14,169,677 | ||||||
| Swedencare AB(a) | 1,142,865 | 4,991,147 | ||||||
| Vimian Group AB(a) | 1,510,000 | 6,338,267 | ||||||
| Vitec Software Group | 102,243 | 4,456,606 | ||||||
| 113,728,745 | ||||||||
| Switzerland — 1.12% | ||||||||
| Belimo Holding AG(a) | 6,009 | 3,980,927 | ||||||
| Inficon Holding A.G. | 4,769 | 5,714,522 | ||||||
| VAT Group AG | 20,895 | 8,701,363 | ||||||
| 18,396,812 | ||||||||
| Taiwan — 5.16% | ||||||||
| Asia Vital Components Co., Ltd. | 669,000 | 12,851,137 | ||||||
| ASPEED Technology, Inc. | 181,145 | 23,033,742 | ||||||
| Chroma Ate Inc | 1,707,000 | 21,635,661 | ||||||
| Sinbon Electronics Co., Limited(a) | 1,902,000 | 15,612,012 | ||||||
| Voltronic Power Technology(a) | 170,490 | 11,243,030 | ||||||
| 84,375,582 | ||||||||
| United Kingdom — 13.10% | ||||||||
| B & M European Value Retail SA | 13,817,945 | 69,119,030 | ||||||
| CVS Group plc | 1,080,540 | 13,256,087 | ||||||
| Diploma plc | 684,673 | 37,632,443 | ||||||
| Halma plc(a) | 678,113 | 21,658,991 | ||||||
| Impax Asset Management Group P | 1,577,033 | 7,163,535 | ||||||
| Intermediate Capital Group PLC | 516,263 | 13,711,826 | ||||||
| JTC plc(b)(c) | 1,939,060 | 25,698,808 | ||||||
| Shares | Fair Value | |||||||
| COMMON STOCKS — 99.26% (continued) | ||||||||
| United Kingdom — 13.10% (continued) | ||||||||
| Marex Group PLC(a) | 282,951 | $ | 7,452,929 | |||||
| nVent Electric PLC | 112,540 | 8,392,108 | ||||||
| Softcat PLC(a) | 461,403 | 10,113,872 | ||||||
| 214,199,629 | ||||||||
| United States — 8.14% | ||||||||
| Ashtead Group PLC | 340,674 | 25,480,563 | ||||||
| Cloudflare, Inc., Class A(a) | 191,517 | 16,797,956 | ||||||
| Elastic N.V.(a) | 149,095 | 11,961,892 | ||||||
| JFrog Ltd.(a) | 1,094,133 | 31,926,801 | ||||||
| Lululemon Athletica, Inc.(a) | 102,013 | 30,389,673 | ||||||
| Monolithic Power Systems, Inc. | 21,801 | 16,553,499 | ||||||
| 133,110,384 | ||||||||
| Vietnam — 1.54% | ||||||||
| Asia Commercial Bank JSC | 9,410,950 | 9,437,191 | ||||||
| Vietnam Technological & Comm Joint-stock Bank(a) | 16,887,852 | 15,908,840 | ||||||
| 25,346,031 | ||||||||
| Total Common Stocks (Cost $1,452,791,693) | 1,623,274,074 | |||||||
| Total Common Stocks/ Investments — 99.26% (Cost $1,452,791,693) | 1,623,274,074 | |||||||
| Other Assets in Excess of Liabilities — 0.74% | 12,169,923 | |||||||
| NET ASSETS — 100.00% | $ | 1,635,443,997 | ||||||
| (a) | Non-income producing security. |
| (b) | Security exempt from registration under Rule 144A of the Securities Act of 1933. These securities may be resold in the ordinary course of business in transactions exempt from registration, normally to qualified institutional buyers. As of October 31, 2024, these securities had a total aggregate market value of $65,707,894, representing 4.02% of net assets. |
| (c) | Security was purchased pursuant to Regulation S under the Securities Act of 1933, which exempts securities offered and sold outside of the United States from registration. Such security cannot be sold in the United States without either an effective registration statement filed pursuant to the Securities Act of 1933, or pursuant to an exemption from registration. As of October 31, 2024, the aggregate market value of these securities was $65,707,894, representing 4.02% of net assets. |
| Sector Composition (October 31, 2024) | ||||
| Technology | 35.2 | % | ||
| Industrials | 22.8 | % | ||
| Financials | 11.0 | % | ||
| Health Care | 11.0 | % | ||
| Consumer Staples | 8.7 | % | ||
| Consumer Discretionary | 6.8 | % | ||
| Materials | 2.7 | % | ||
| Real Estate | 1.1 | % | ||
| Other Assets in Excess of Liabilities | 0.7 | % | ||
| Total | 100 | % | ||
See accompanying notes to financial statements.
30
| Grandeur Peak International Stalwarts Fund | Schedule of Investments |
| October 31, 2024 (Unaudited) |
| Industry Composition (October 31, 2024) | ||||
| Application Software | 7.0 | % | ||
| IT Services | 6.9 | % | ||
| Semiconductor Devices | 5.6 | % | ||
| Industrial Wholesale & Rental | 5.1 | % | ||
| Mass Merchants | 4.7 | % | ||
| Electronics Components | 4.6 | % | ||
| Specialty & Generic Pharma | 3.8 | % | ||
| Private Equity | 3.8 | % | ||
| Semiconductor Mfg | 3.3 | % | ||
| Food & Drug Stores | 3.3 | % | ||
| Specialty Apparel Stores | 3.1 | % | ||
| Flow Control Equipment | 2.8 | % | ||
| Life Science & Diagnostics | 2.3 | % | ||
| Comml & Res Bldg Equipment & Sys | 2.2 | % | ||
| Health Care Services | 2.1 | % | ||
| Other Machinery & Equipment | 2.1 | % | ||
| Banks | 2.1 | % | ||
| Electrical Components | 1.9 | % | ||
| Data & Transaction Processors | 1.6 | % | ||
| Wealth Management | 1.6 | % | ||
| Restaurants | 1.5 | % | ||
| Technology Distributors | 1.4 | % | ||
| Health Care Supplies | 1.3 | % | ||
| Measurement Instruments | 1.3 | % | ||
| Fabricated Metal & Hardware | 1.3 | % | ||
| Professional Services | 1.2 | % | ||
| Specialty Chemicals | 1.2 | % | ||
| Industrial Owners & Developers | 1.1 | % | ||
| Infrastructure Software | 1.1 | % | ||
| Other Commercial Support Services | 1.1 | % | ||
| Information Services | 1.0 | % | ||
| Other Industries (each less than 1%) | 15.9 | % | ||
| Other Assets in Excess of Liabilities | 0.7 | % | ||
| Total | 100 | % | ||
See accompanying notes to financial statements.
31
| Grandeur Peak US Stalwarts Fund | Schedule of Investments |
| October 31, 2024 (Unaudited) |
| Shares | Fair Value | |||||||
| COMMON STOCKS — 98.29% | ||||||||
| Argentina — 1.89% | ||||||||
| Globant S.A.(a) | 12,599 | $ | 2,644,404 | |||||
| Canada — 1.70% | ||||||||
| Aritzia Inc(a) | 44,900 | 1,445,661 | ||||||
| Kinaxis Inc. (a) | 8,400 | 932,938 | ||||||
| 2,378,599 | ||||||||
| Germany — 0.86% | ||||||||
| QIAGEN N.V. (a) | 28,645 | 1,205,955 | ||||||
| Hong Kong — 1.90% | ||||||||
| Techtronic Industries Co Limited(a) | 183,400 | 2,653,025 | ||||||
| Ireland — 0.56% | ||||||||
| ICON plc(a) | 3,541 | 786,492 | ||||||
| Israel — 1.22% | ||||||||
| CyberArk Software Ltd.(a) | 6,135 | 1,696,450 | ||||||
| Italy — 0.87% | ||||||||
| Stevanato Group SpA | 63,734 | 1,211,583 | ||||||
| Mexico — 1.24% | ||||||||
| BBB Foods Inc(a) | 54,016 | 1,725,271 | ||||||
| United Kingdom — 1.78% | ||||||||
| Marex Group PLC(a) | 47,042 | 1,239,086 | ||||||
| nVent Electric PLC | 16,499 | 1,230,330 | ||||||
| 2,469,416 | ||||||||
| United States — 86.27% | ||||||||
| 4imprint Group PLC | 15,757 | 1,037,742 | ||||||
| Alamo Group, Inc. | 8,318 | 1,410,234 | ||||||
| Align Technology, Inc.(a) | 8,034 | 1,647,211 | ||||||
| Apollo Global Management, Inc. | 7,396 | 1,059,551 | ||||||
| Ares Management Corporation, Class A | 15,710 | 2,634,252 | ||||||
| Ashtead Group PLC | 30,907 | 2,311,676 | ||||||
| ATRICURE, INC.(a) | 26,293 | 872,402 | ||||||
| Blue Owl Capital, Inc. | 26,876 | 600,947 | ||||||
| Burlington Stores, Inc.(a) | 7,893 | 1,955,649 | ||||||
| Cactus, Inc., Class A | 6,953 | 412,243 | ||||||
| Charles River Laboratories International, Inc.(a) | 5,558 | 992,548 | ||||||
| Clearwater Analytics Holdings, Inc., Class A(a) | 70,094 | 1,830,154 | ||||||
| Cloudflare, Inc., Class A(a) | 21,853 | 1,916,727 | ||||||
| Core & Main, Inc.(a) | 50,569 | 2,239,195 | ||||||
| Cross Creek LP(a)(b) | 700,000 | 512,201 | ||||||
| Crowdstrike Holdings, Inc., Class A(a) | 3,465 | 1,028,655 | ||||||
| DexCom, Inc.(a) | 31,498 | 2,219,979 | ||||||
| DigitalOcean Holdings, Inc.(a) | 55,522 | 2,197,560 | ||||||
| Dorman Products, Inc.(a) | 4,610 | 525,678 | ||||||
| Elastic N.V.(a) | 29,156 | 2,339,186 | ||||||
| EMCOR Group, Inc. | 1,676 | 747,613 | ||||||
| Enerpac Tool Group Corporation | 21,361 | 942,447 | ||||||
| Shares | Fair Value | |||||||
| COMMON STOCKS — 98.29% (continued) | ||||||||
| United States — 86.27% (continued) | ||||||||
| Ensign Group, Inc. (The) | 12,973 | $ | 2,010,685 | |||||
| Etsy, Inc.(a) | 34,935 | 1,797,056 | ||||||
| FirstCash Holdings, Inc. | 13,214 | 1,367,253 | ||||||
| Five Below, Inc.(a) | 23,866 | 2,262,258 | ||||||
| Floor & Decor Holdings, Inc., Class A(a) | 11,618 | 1,197,235 | ||||||
| FormFactor, Inc.(a) | 28,194 | 1,070,808 | ||||||
| Gentex Corporation | 36,389 | 1,102,951 | ||||||
| Global Industrial Company | 32,607 | 865,064 | ||||||
| Goosehead Insurance, Inc., Class A(a) | 23,173 | 2,523,540 | ||||||
| GQG Partners Inc | 649,472 | 1,178,763 | ||||||
| Grocery Outlet Holding Corporation(a) | 147,529 | 2,109,665 | ||||||
| HealthEquity, Inc.(a) | 16,945 | 1,444,561 | ||||||
| Herc Holdings, Inc. (a) | 12,181 | 2,547,535 | ||||||
| Houlihan Lokey, Inc. | 4,388 | 758,115 | ||||||
| HubSpot, Inc.(a) | 1,145 | 635,235 | ||||||
| IDEXX Laboratories, Inc.(a) | 4,208 | 1,712,319 | ||||||
| Insulet Corporation(a) | 3,000 | 694,590 | ||||||
| JFrog Ltd.(a) | 92,190 | 2,690,105 | ||||||
| KKR & Company, Inc. | 7,853 | 1,085,599 | ||||||
| Littelfuse, Inc. | 16,685 | 4,081,652 | ||||||
| Lululemon Athletica, Inc.(a) | 10,644 | 3,170,847 | ||||||
| MarketAxess Holdings, Inc. | 6,635 | 1,920,302 | ||||||
| Marvell Technology, Inc. | 12,145 | 972,936 | ||||||
| Medpace Holdings, Inc.(a) | 7,484 | 2,351,623 | ||||||
| Modine Manufacturing Company(a) | 11,949 | 1,407,234 | ||||||
| Monolithic Power Systems, Inc. | 1,859 | 1,411,539 | ||||||
| MSCI, Inc. | 608 | 347,290 | ||||||
| Neogen Corporation(a) | 87,607 | 1,251,028 | ||||||
| NV5 Global, Inc.(a) | 84,012 | 1,919,674 | ||||||
| Ollie’s Bargain Outlet Holdings, Inc.(a) | 10,316 | 947,318 | ||||||
| P10 Inc | 96,780 | 1,069,419 | ||||||
| PACS Group Inc. (a) | 13,990 | 597,093 | ||||||
| PagerDuty, Inc.(a) | 27,155 | 490,419 | ||||||
| Pennant Group, Inc. (The)(a) | 47,418 | 1,515,953 | ||||||
| Perella Weinberg Partners | 104,106 | 2,106,064 | ||||||
| Pjt Partners, Inc., Class A | 10,405 | 1,445,879 | ||||||
| Primoris Services Corporation | 38,727 | 2,425,085 | ||||||
| Quanta Services, Inc. | 3,274 | 987,537 | ||||||
| Rexford Industrial Realty, Inc. | 46,182 | 1,980,746 | ||||||
| SentinelOne Inc(a) | 38,685 | 997,686 | ||||||
| Silicon Laboratories, Inc.(a) | 26,724 | 2,775,554 | ||||||
| Sitime Corporation(a) | 9,879 | 1,669,650 | ||||||
| Skechers U.S.A., Inc., Class A(a) | 35,748 | 2,197,072 | ||||||
| SPS Commerce, Inc. (a) | 12,791 | 2,110,515 | ||||||
| Texas Roadhouse, Inc. | 10,504 | 2,007,524 | ||||||
| TPG, Inc. | 26,298 | 1,779,849 | ||||||
| Tradeweb Markets, Inc., Class A | 16,818 | 2,135,886 | ||||||
| Trex Company, Inc. (a) | 18,142 | 1,285,361 | ||||||
| Ulta Beauty, Inc. (a) | 4,281 | 1,579,603 | ||||||
| United Rentals, Inc. (a) | 1,755 | 1,426,464 | ||||||
| Veritiv Holdings Company | 14,731 | 1,609,951 | ||||||
| WillScott Mobile Mini Holding(a) | 36,501 | 1,209,643 | ||||||
| WW Grainger, Inc. | 1,627 | 1,804,717 | ||||||
See accompanying notes to financial statements.
32
| Grandeur Peak US Stalwarts Fund | Schedule of Investments |
| October 31, 2024 (Unaudited) |
| Shares | Fair Value | |||||||
| COMMON STOCKS — 98.29% (continued) | ||||||||
| United States — 86.27% (continued) | ||||||||
| Yeti Holdings, Inc.(a) | 46,734 | $ | 1,645,504 | |||||
| Zscaler, Inc.(a) | 7,076 | 1,279,270 | ||||||
| 120,401,074 | ||||||||
| Total Common Stocks (Cost $118,910,112) | 137,172,269 | |||||||
| Shares | Fair Value | |||||||
| PREFERRED STOCKS — 0.45% | ||||||||
| United States — 0.45% | ||||||||
| Gusto Inc. Preferred Series E(a)(b) | 20,595 | $ | 626,088 | |||||
| Total Preferred Stocks (Cost $625,992) | 626,088 | |||||||
| Total Investments — 98.74% (Cost $119,536,104) | 137,798,357 | |||||||
| Other Assets in Excess of Liabilities — 1.26% | 1,759,297 | |||||||
| NET ASSETS — 100.00% | $ | 139,557,654 | ||||||
| (a) | Non-income producing security. |
| (b) | As a result of the use of significant unobservable inputs to determine fair value, this investment has been classified as Level 3 assets. |
| Sector Composition (October 31, 2024) | ||||
| Technology | 25.0 | % | ||
| Industrials | 22.1 | % | ||
| Consumer Discretionary | 15.7 | % | ||
| Financials | 15.0 | % | ||
| Health Care | 13.7 | % | ||
| Consumer Staples | 3.8 | % | ||
| Real Estate | 1.4 | % | ||
| Materials | 0.9 | % | ||
| Communications | 0.7 | % | ||
| Listed Private Equity Investments | 0.4 | % | ||
| Other Assets in Excess of Liabilities | 1.3 | % | ||
| Total | 100 | % | ||
| Industry Composition (October 31, 2024) | ||||
| Application Software | 8.6 | % | ||
| IT Services | 6.5 | % | ||
| Semiconductor Devices | 5.4 | % | ||
| Industrial Wholesale & Rental | 4.9 | % | ||
| Mass Merchants | 4.6 | % | ||
| Electronics Components | 4.2 | % | ||
| Electrical Components | 3.8 | % | ||
| Specialty Apparel Stores | 3.0 | % | ||
| Specialty & Generic Pharma | 2.9 | % | ||
| Private Equity | 2.8 | % | ||
| Semiconductor Mfg | 2.3 | % | ||
| Investment Management | 2.3 | % | ||
| Health Care Services | 2.2 | % | ||
| Institutional Brokerage | 2.2 | % | ||
| Flow Control Equipment | 2.1 | % | ||
| Medical Equipment | 1.8 | % | ||
| Health Care Facilities | 1.8 | % | ||
| Wealth Management | 1.8 | % | ||
| Infrastructure Software | 1.7 | % | ||
| Food & Drug Stores | 1.7 | % | ||
| Health Care Supplies | 1.6 | % | ||
| Insurance Brokers & Services | 1.4 | % | ||
| Other Machinery & Equipment | 1.4 | % | ||
| Data & Transaction Processors | 1.4 | % | ||
| Comml & Res Bldg Equipment & Sys | 1.2 | % | ||
| Banks | 1.1 | % | ||
| Online Marketplace | 1.1 | % | ||
| Fabricated Metal & Hardware | 1.0 | % | ||
| Infrastructure Construction | 1.0 | % | ||
| Semiconductor Manufacturing | 1.0 | % | ||
| Industrial Owners & Developers | 1.0 | % | ||
| Life Science & Diagnostics | 1.0 | % | ||
| Other Industries (each less than 1%) | 17.9 | % | ||
| Other Assets in Excess of Liabilities | 1.3 | % | ||
| Total | 100 | % | ||
See accompanying notes to financial statements.
33
| Grandeur Peak Funds® | Statements of Assets and Liabilities |
| October 31, 2024 (Unaudited) |
| Grandeur Peak Emerging Markets Opportunities Fund | Grandeur Peak Global Contrarian Fund | Grandeur Peak Global Explorer Fund | Grandeur Peak Global Micro Cap Fund | Grandeur Peak Global Opportunities Fund | ||||||||||||||||
| ASSETS | ||||||||||||||||||||
| Investments, at cost | $ | 250,059,977 | $ | 139,308,931 | $ | 12,106,654 | $ | 38,778,503 | $ | 492,849,332 | ||||||||||
| Investments, at value | $ | 305,307,757 | $ | 153,926,107 | $ | 12,292,494 | $ | 44,810,580 | $ | 579,254,099 | ||||||||||
| Cash held at custodian | 1,582,765 | 238,952 | 43,797 | - | 1,630,294 | |||||||||||||||
| Foreign currency at fair value (Cost $1,140,871, $75,239, $44, $91 and $5,584) | 1,140,828 | 73,461 | 44 | 91 | 5,706 | |||||||||||||||
| Receivable for investments sold | 1,531,674 | 1,808,819 | 47,889 | 127,932 | 3,973,434 | |||||||||||||||
| Receivable for Fund shares sold | 17,775 | 48,770 | - | 60 | 124,225 | |||||||||||||||
| Dividends and interest receivable | 444,151 | 172,507 | 9,967 | 64,012 | 1,180,091 | |||||||||||||||
| Prepaid distribution fees - investor class | 1,451 | - | - | - | - | |||||||||||||||
| Prepaid expenses and other assets | 18,915 | 19,052 | 24,380 | 30,301 | 41,171 | |||||||||||||||
| TOTAL ASSETS | 310,045,316 | 156,287,668 | 12,418,571 | 45,032,976 | 586,208,259 | |||||||||||||||
| LIABILITIES | ||||||||||||||||||||
| Payable for investments purchased | 612,816 | 1,073,935 | 60,088 | - | 708,802 | |||||||||||||||
| Payable for Fund shares repurchased | 122,868 | 71,935 | - | - | 35,768 | |||||||||||||||
| Management fees payable | 333,725 | 127,742 | 27,123 | 62,711 | 553,973 | |||||||||||||||
| Distribution (12b-1) fees payable | - | - | - | - | 7,946 | |||||||||||||||
| Foreign Cap Gain Tax payable | 1,068,316 | 51,754 | 23,068 | 103,319 | 504,688 | |||||||||||||||
| Payable to related parties | 36,864 | 42,059 | 6,310 | 15,324 | 81,088 | |||||||||||||||
| Accrued expenses and other liabilities | 133,881 | 38,435 | 58,098 | 25,194 | 36,340 | |||||||||||||||
| TOTAL LIABILITIES | 2,308,470 | 1,405,860 | 174,687 | 244,086 | 1,928,605 | |||||||||||||||
| NET ASSETS | $ | 307,736,846 | $ | 154,881,808 | $ | 12,243,884 | $ | 44,788,890 | $ | 584,279,654 | ||||||||||
| NET ASSETS CONSISTS OF | ||||||||||||||||||||
| Paid in capital | $ | 248,515,909 | $ | 133,279,679 | $ | 13,789,945 | $ | 39,150,741 | $ | 497,539,656 | ||||||||||
| Total distributable earnings (losses) | 59,220,937 | 21,602,129 | (1,546,061 | ) | 5,638,149 | 86,739,998 | ||||||||||||||
| NET ASSETS | $ | 307,736,846 | $ | 154,881,808 | $ | 12,243,884 | $ | 44,788,890 | $ | 584,279,654 | ||||||||||
| PRICING OF SHARES: | ||||||||||||||||||||
| Investor Class | ||||||||||||||||||||
| Net Assets | $ | 6,572,998 | $ | - | $ | - | $ | - | $ | 36,512,687 | ||||||||||
| Shares of beneficial interest outstanding (a) | 520,825 | - | - | - | 10,612,253 | |||||||||||||||
| Net Asset Value, offering and redemption price per share | $ | 12.62 | $ | - | $ | - | $ | - | $ | 3.44 | ||||||||||
| Institutional Class | ||||||||||||||||||||
| Net Assets | $ | 301,163,848 | $ | 154,881,808 | $ | 12,243,884 | $ | 44,788,890 | $ | 547,766,967 | ||||||||||
| Shares of beneficial interest outstanding (a) | 23,554,174 | 9,281,361 | 1,511,580 | 3,119,004 | 154,992,176 | |||||||||||||||
| Net Asset Value, offering and redemption price per share | $ | 12.79 | $ | 16.69 | $ | 8.10 | $ | 14.36 | $ | 3.53 | ||||||||||
| (a) | Unlimited number of shares of beneficial interest authorized, no par value. |
See accompanying notes to financial statements.
34
| Grandeur Peak Funds® | Statements of Assets and Liabilities |
| October 31, 2024 (Unaudited) |
| Grandeur Peak Global Reach Fund | Grandeur Peak Global Stalwarts Fund | Grandeur Peak International Opportunities Fund | Grandeur Peak International Stalwarts Fund | Grandeur Peak US Stalwarts Fund | ||||||||||||||||
| ASSETS | ||||||||||||||||||||
| Investments, at cost | $ | 149,461,105 | $ | 101,169,092 | $ | 365,971,713 | $ | 1,452,791,693 | $ | 119,536,104 | ||||||||||
| Investments, at value | $ | 187,570,455 | $ | 119,529,037 | $ | 425,929,934 | $ | 1,623,274,074 | $ | 137,798,357 | ||||||||||
| Cash held at custodian | 872,311 | - | - | 16,070,985 | 1,690,164 | |||||||||||||||
| Foreign currency at fair value (Cost $126, $110,102, $571,403, $4,375,750 and $190) | 730 | 110,507 | 571,403 | 4,363,368 | 190 | |||||||||||||||
| Receivable for investments sold | 318,323 | 2,144,253 | 2,531,008 | 11,423,917 | 139,810 | |||||||||||||||
| Receivable for Fund shares sold | 66,666 | 3,560 | 63,690 | 822,355 | 115,000 | |||||||||||||||
| Dividends and interest receivable | 306,280 | 204,524 | 1,120,573 | 3,108,749 | 4,683 | |||||||||||||||
| Foreign Rec - FX Unrealized | - | - | 5,906 | - | ||||||||||||||||
| Prepaid expenses and other assets | 14,694 | 66,440 | 38,760 | 89,113 | 35,342 | |||||||||||||||
| TOTAL ASSETS | 189,149,459 | 122,058,321 | 430,255,368 | 1,659,158,467 | 139,783,546 | |||||||||||||||
| LIABILITIES | ||||||||||||||||||||
| Due to custodian | - | 123,446 | 101,290 | - | - | |||||||||||||||
| Payable for investments purchased | 872,967 | 760,974 | 405,283 | 19,374,967 | 106,721 | |||||||||||||||
| Payable for Fund shares repurchased | 46,727 | 702,437 | 107,535 | 2,779,245 | - | |||||||||||||||
| Management fees payable | 156,654 | 68,055 | 450,237 | 624,017 | 78,481 | |||||||||||||||
| Distribution (12b-1) fees payable | 714 | 618 | 8,378 | 29,297 | - | |||||||||||||||
| Payable to related parties | 26,127 | 25,016 | 43,407 | 133,202 | 14,803 | |||||||||||||||
| Foreign Cap Gain Tax payable | 178,093 | 35,235 | 654,030 | 614,577 | - | |||||||||||||||
| Foreign Rec - FX Unrealized | - | 5,268 | - | - | ||||||||||||||||
| Accrued expenses and other liabilities | 58,686 | 47,263 | 80,353 | 159,165 | 25,887 | |||||||||||||||
| TOTAL LIABILITIES | 1,339,968 | 1,763,044 | 1,855,781 | 23,714,470 | 225,892 | |||||||||||||||
| NET ASSETS | $ | 187,809,491 | $ | 120,295,277 | $ | 428,399,587 | $ | 1,635,443,997 | $ | 139,557,654 | ||||||||||
| Composition of Net Assets: | ||||||||||||||||||||
| Paid in capital | $ | 142,337,337 | $ | 127,103,411 | $ | 366,908,114 | $ | 1,545,107,824 | $ | 145,081,895 | ||||||||||
| Total distributable earnings (losses) | 45,472,154 | (6,808,134 | ) | 61,491,473 | 90,336,173 | (5,524,241 | ) | |||||||||||||
| NET ASSETS | $ | 187,809,491 | $ | 120,295,277 | $ | 428,399,587 | $ | 1,635,443,997 | $ | 139,557,654 | ||||||||||
| PRICING OF SHARES | ||||||||||||||||||||
| Investor Class | ||||||||||||||||||||
| Net Assets | $ | 19,122,827 | $ | 17,145,592 | $ | 17,502,063 | $ | 16,208,487 | $ | - | ||||||||||
| Shares of beneficial interest outstanding (a) | 1,174,913 | 1,084,415 | 5,380,021 | 970,733 | - | |||||||||||||||
| Net Asset Value, offering and redemption price per share | $ | 16.28 | $ | 15.81 | $ | 3.25 | $ | 16.70 | $ | - | ||||||||||
| Institutional Class | ||||||||||||||||||||
| Net Assets | $ | 168,686,664 | $ | 103,149,685 | $ | 410,897,524 | $ | 1,619,235,510 | $ | 139,557,654 | ||||||||||
| Shares of beneficial interest outstanding (a) | 10,228,473 | 6,419,199 | 124,733,923 | 95,972,284 | 7,097,728 | |||||||||||||||
| Net Asset Value, offering and redemption price per share | $ | 16.49 | $ | 16.07 | $ | 3.29 | $ | 16.87 | $ | 19.66 | ||||||||||
| (a) | Unlimited number of shares of beneficial interest authorized, no par value. |
See accompanying notes to financial statements.
35
| Grandeur Peak Funds® | Statements of Operations |
| October 31, 2024 (Unaudited) |
| Grandeur Peak Emerging Markets Opportunities Fund | Grandeur Peak Global Contrarian Fund | Grandeur Peak Global Explorer Fund | Grandeur Peak Global Micro Cap Fund | Grandeur Peak Global Opportunities Fund | ||||||||||||||||
| INVESTMENT INCOME | ||||||||||||||||||||
| Dividends | $ | 6,270,001 | $ | 3,964,195 | $ | 141,841 | $ | 606,578 | $ | 7,482,478 | ||||||||||
| Interest | 136,298 | 52,789 | 2,905 | 3,765 | 136,248 | |||||||||||||||
| Less: Foreign dividend withholding taxes | (502,937 | ) | (112,804 | ) | (13,178 | ) | (54,606 | ) | (530,910 | ) | ||||||||||
| TOTAL INVESTMENT INCOME | 5,903,362 | 3,904,180 | 131,568 | 555,737 | 7,087,816 | |||||||||||||||
| EXPENSES | ||||||||||||||||||||
| Investment advisor fees | 2,237,111 | 752,048 | 68,781 | 344,186 | 3,648,484 | |||||||||||||||
| Distribution and service fees - Investor Class | 8,826 | - | - | - | 52,333 | |||||||||||||||
| Custodian fees | 166,243 | 40,878 | 20,587 | 27,023 | 85,064 | |||||||||||||||
| Administrative fees | 57,519 | 38,429 | 7,705 | 15,230 | 96,439 | |||||||||||||||
| Registration fees | 27,600 | 18,800 | 8,800 | 13,300 | 25,950 | |||||||||||||||
| Transfer agent fees | 23,354 | 18,365 | 407 | 14,442 | 14,561 | |||||||||||||||
| Audit fees | 33,889 | 28,096 | 23,853 | 24,347 | 30,139 | |||||||||||||||
| Trustees fees and expenses | 3,908 | 4,066 | 4,106 | 4,087 | 3,649 | |||||||||||||||
| Chief compliance officer fees | 4,586 | 4,638 | 523 | 4,632 | 6,871 | |||||||||||||||
| Printing fees | 6,285 | 224 | 1,414 | 1,797 | 8,730 | |||||||||||||||
| Insurance expense | 1,286 | 552 | 550 | 550 | 1,836 | |||||||||||||||
| Legal fees | 5,894 | 1,420 | 456 | 495 | 8,587 | |||||||||||||||
| Other expenses | 6,610 | 5,808 | 1,978 | 1,406 | 12,349 | |||||||||||||||
| TOTAL EXPENSES | 2,583,111 | 913,329 | 139,160 | 451,495 | 3,994,992 | |||||||||||||||
| Less: Fees waived/reimbursed by the investment advisor | - | - | (60,984 | ) | - | (99,559 | ) | |||||||||||||
| Plus: Recapture of fees previously waived | - | 4,570 | - | 3,837 | - | |||||||||||||||
| NET EXPENSES | 2,583,111 | 917,899 | 78,176 | 455,332 | 3,895,433 | |||||||||||||||
| NET INVESTMENT INCOME | 3,320,251 | 2,986,281 | 53,392 | 100,405 | 3,192,383 | |||||||||||||||
| REALIZED AND UNREALIZED GAIN (LOSS) FROM INVESTMENTS | ||||||||||||||||||||
| Net realized gain (loss) from: | ||||||||||||||||||||
| Investments | 102,727 | 5,318,388 | 267,030 | 1,943,942 | (239,903 | ) | ||||||||||||||
| Foreign currency transactions | (46,671 | ) | (31,514 | ) | (1,561 | ) | 3,097 | 21,611 | ||||||||||||
| Net realized gain (loss) | 56,056 | 5,286,874 | 265,469 | 1,947,039 | (218,292 | ) | ||||||||||||||
| Net change in unrealized appreciation (depreciation) on: | ||||||||||||||||||||
| Investments | 3,358,767 | 6,208,676 | 442,458 | 1,194,743 | 7,626,835 | |||||||||||||||
| Foreign currency translations | (37,442 | ) | (10,144 | ) | (227 | ) | 38 | (20,495 | ) | |||||||||||
| Net change in unrealized appreciation | 3,321,325 | 6,198,532 | 442,231 | 1,194,781 | 7,606,340 | |||||||||||||||
| NET REALIZED AND UNREALIZED GAIN FROM INVESTMENTS | 3,377,381 | 11,485,406 | 707,700 | 3,141,820 | 7,388,048 | |||||||||||||||
| NET INCREASE IN NET ASSETS RESULTING FROM OPERATIONS | $ | 6,697,632 | $ | 14,471,687 | $ | 761,092 | $ | 3,242,225 | $ | 10,580,431 | ||||||||||
See accompanying notes to financial statements.
36
| Grandeur Peak Funds® | Statements of Operations |
| October 31, 2024 (Unaudited) |
| Grandeur Peak Global Reach Fund | Grandeur Peak Global Stalwarts Fund | Grandeur Peak International Opportunities Fund | Grandeur Peak International Stalwarts Fund | Grandeur Peak US Stalwarts Fund | ||||||||||||||||
| INVESTMENT INCOME | ||||||||||||||||||||
| Dividends | $ | 2,594,233 | $ | 973,170 | $ | 7,919,515 | $ | 15,904,200 | $ | 454,607 | ||||||||||
| Interest | 44,819 | 16,037 | 105,235 | 469,468 | 49,736 | |||||||||||||||
| Less: Foreign dividend withholding taxes | (188,062 | ) | (83,966 | ) | (677,137 | ) | (1,677,855 | ) | (520 | ) | ||||||||||
| TOTAL INVESTMENT INCOME | 2,450,990 | 905,241 | 7,347,613 | 14,695,813 | 503,823 | |||||||||||||||
| EXPENSES | ||||||||||||||||||||
| Investment advisor fees | 1,116,028 | 532,452 | 3,139,803 | 6,742,283 | 496,761 | |||||||||||||||
| Distribution and service fees - Investor Class | 25,628 | 23,701 | 24,599 | 24,156 | - | |||||||||||||||
| Custodian fees | 67,403 | 48,278 | 89,542 | 211,084 | 13,629 | |||||||||||||||
| Administrative fees | 21,283 | 27,758 | 75,464 | 257,400 | 24,085 | |||||||||||||||
| Transfer agent fees | 511 | 23,227 | 22,702 | 43,213 | 13,701 | |||||||||||||||
| Registration fees | 23,450 | 34,025 | 23,875 | 28,500 | 18,375 | |||||||||||||||
| Audit fees | 41,116 | 37,454 | 42,652 | 44,547 | 20,617 | |||||||||||||||
| Trustees fees and expenses | 3,999 | 4,034 | 3,838 | 3,362 | 4,069 | |||||||||||||||
| Printing fees | 16,267 | 5,563 | 2,167 | 131,152 | 2,924 | |||||||||||||||
| Legal fees | 2,419 | 959 | 5,872 | 30,429 | 1,262 | |||||||||||||||
| Chief compliance officer fees | 4,613 | 4,621 | 4,643 | 4,467 | 4,626 | |||||||||||||||
| Insurance expense | 1,836 | 920 | 1,286 | 1,499 | 920 | |||||||||||||||
| Other expenses | 5,310 | 4,191 | 10,007 | 43,631 | 5,703 | |||||||||||||||
| TOTAL EXPENSES | 1,329,863 | 747,183 | 3,446,450 | 7,565,723 | 606,672 | |||||||||||||||
| Less: Fees waived/reimbursed by the investment advisor | (36,685 | ) | - | (7,886 | ) | - | - | |||||||||||||
| NET EXPENSES | 1,293,178 | 747,183 | 3,438,564 | 7,565,723 | 606,672 | |||||||||||||||
| NET INVESTMENT INCOME (LOSS) | 1,157,812 | 158,058 | 3,909,049 | 7,130,090 | (102,849 | ) | ||||||||||||||
| REALIZED AND UNREALIZED GAIN (LOSS) FROM INVESTMENTS | ||||||||||||||||||||
| Net realized gain (loss) from: | ||||||||||||||||||||
| Investments | 3,309,117 | 10,086,609 | (5,413,115 | ) | 48,559,339 | 9,743,969 | ||||||||||||||
| Foreign currency transactions | (13,965 | ) | (26,229 | ) | (36,387 | ) | (429,204 | ) | (1,055 | ) | ||||||||||
| Net realized gain (loss) from: | 3,295,152 | 10,060,380 | (5,449,502 | ) | 48,130,135 | 9,742,914 | ||||||||||||||
| Net change in unrealized appreciation (depreciation) on: | ||||||||||||||||||||
| Investments | 9,887,284 | (4,284,012 | ) | 13,068,915 | (41,959,666 | ) | 1,910,323 | |||||||||||||
| Foreign currency translations | (6,170 | ) | 1,083 | (5,718 | ) | (44,323 | ) | (97 | ) | |||||||||||
| Net change in unrealized appreciation (depreciation) | 9,881,114 | (4,282,929 | ) | 13,063,197 | (42,003,989 | ) | 1,910,226 | |||||||||||||
| NET REALIZED AND UNREALIZED GAIN FROM INVESTMENTS | 13,176,266 | 5,777,451 | 7,613,695 | 6,126,146 | 11,653,140 | |||||||||||||||
| NET INCREASE IN NET ASSETS RESULTING FROM OPERATIONS | $ | 14,334,078 | $ | 5,935,509 | $ | 11,522,744 | $ | 13,256,236 | $ | 11,550,291 | ||||||||||
See accompanying notes to financial statements.
37
| Grandeur Peak Emerging Markets Opportunities Fund | Statements of Changes in Net Assets |
| For the Six Months Ended October 31, 2024 | For the Year Ended April 30, 2024 | |||||||
| (Unaudited) | ||||||||
| OPERATIONS | ||||||||
| Net investment income | $ | 3,320,251 | $ | 2,987,279 | ||||
| Net realized gain | 56,056 | 5,683,835 | ||||||
| Net change in unrealized appreciation | 3,321,325 | 2,952,975 | ||||||
| Net increase in net assets resulting from operations | 6,697,632 | 11,624,089 | ||||||
| DISTRIBUTIONS TO SHAREHOLDERS | ||||||||
| Investor Class | - | (307,551 | ) | |||||
| Institutional Class | - | (15,936,503 | ) | |||||
| Net decrease in net assets from distributions | - | (16,244,054 | ) | |||||
| CAPITAL SHARE TRANSACTIONS | ||||||||
| Proceeds from sales of shares: | ||||||||
| Investor Class | 106,830 | 130,592 | ||||||
| Institutional Class | 5,312,043 | 51,217,262 | ||||||
| Distributions reinvested: | ||||||||
| Investor Class | - | 289,662 | ||||||
| Institutional Class | - | 15,045,772 | ||||||
| Redemption fees: | ||||||||
| Investor Class | - | 55 | ||||||
| Institutional Class | 5,616 | 8,668 | ||||||
| Cost of shares redeemed: | ||||||||
| Investor Class | (922,136 | ) | (1,836,182 | ) | ||||
| Institutional Class | (50,044,508 | ) | (139,293,803 | ) | ||||
| Net decrease from capital shares transactions | (45,542,155 | ) | (74,437,974 | ) | ||||
| NET DECREASE IN NET ASSETS | (38,844,523 | ) | (79,057,939 | ) | ||||
| NET ASSETS | ||||||||
| Beginning of Period/Year | 346,581,369 | 425,639,308 | ||||||
| End of Period/Year | $ | 307,736,846 | $ | 346,581,369 | ||||
| OTHER INFORMATION | ||||||||
| Shares Transactions | ||||||||
| Investor Class | ||||||||
| Issued | 8,483 | 10,282 | ||||||
| Issued to shareholders in reinvestment of distributions | - | 23,025 | ||||||
| Redeemed | (72,651 | ) | (144,968 | ) | ||||
| Net decrease in share transactions | (64,168 | ) | (111,661 | ) | ||||
| Institutional Class | ||||||||
| Issued | 413,607 | 3,984,097 | ||||||
| Issued to shareholders in reinvestment of distributions | - | 1,182,844 | ||||||
| Redeemed | (3,907,564 | ) | (10,882,022 | ) | ||||
| Net decrease in share transactions | (3,493,957 | ) | (5,715,081 | ) | ||||
See accompanying notes to financial statements.
38
| Grandeur Peak Global Contrarian Fund | Statements of Changes in Net Assets |
| For the Six Months Ended October 31, 2024 | For the Year Ended April 30, 2024 | |||||||
| (Unaudited) | ||||||||
| OPERATIONS | ||||||||
| Net investment income | $ | 2,986,281 | $ | 3,140,123 | ||||
| Net realized gain | 5,286,874 | 10,502,520 | ||||||
| Net change in unrealized appreciation | 6,198,532 | 6,764,581 | ||||||
| Net increase in net assets resulting from operations | 14,471,687 | 20,407,224 | ||||||
| DISTRIBUTIONS TO SHAREHOLDERS | ||||||||
| Institutional Class | - | (2,725,193 | ) | |||||
| Net decrease in net assets from distributions | - | (2,725,193 | ) | |||||
| CAPITAL SHARE TRANSACTIONS | ||||||||
| Proceeds from sales of shares: | ||||||||
| Institutional Class | 13,361,237 | 38,932,301 | ||||||
| Distributions reinvested: | ||||||||
| Institutional Class | - | 2,697,004 | ||||||
| Redemption fees: | ||||||||
| Institutional Class | 826 | 7,235 | ||||||
| Cost of shares redeemed: | ||||||||
| Institutional Class | (14,615,199 | ) | (35,060,959 | ) | ||||
| Net increase (decrease) from capital shares transactions | (1,253,136 | ) | 6,575,581 | |||||
| NET INCREASE IN NET ASSETS | 13,218,551 | 24,257,612 | ||||||
| NET ASSETS | ||||||||
| Beginning of Period/Year | 141,663,257 | 117,405,645 | ||||||
| End of Period/Year | $ | 154,881,808 | $ | 141,663,257 | ||||
| OTHER INFORMATION | ||||||||
| Shares Transactions | ||||||||
| Institutional Class | ||||||||
| Issued | 822,475 | 2,781,445 | ||||||
| Issued to shareholders in reinvestment of distributions | - | 184,980 | ||||||
| Redeemed | (911,388 | ) | (2,450,862 | ) | ||||
| Net increase (decrease) in share transactions | (88,913 | ) | 515,563 | |||||
See accompanying notes to financial statements.
39
| Grandeur Peak Global Explorer Fund | Statements of Changes in Net Assets |
| For the Six Months Ended October 31, 2024 | For the Year Ended April 30, 2024 | |||||||
| (Unaudited) | ||||||||
| OPERATIONS | ||||||||
| Net investment income | $ | 53,392 | $ | 51,108 | ||||
| Net realized gain (loss) | 265,469 | (461,342 | ) | |||||
| Net change in unrealized appreciation | 442,231 | 894,245 | ||||||
| Net increase in net assets resulting from operations | 761,092 | 484,011 | ||||||
| DISTRIBUTIONS TO SHAREHOLDERS | ||||||||
| Institutional Class | - | (79,438 | ) | |||||
| Net decrease in net assets from distributions | - | (79,438 | ) | |||||
| CAPITAL SHARE TRANSACTIONS | ||||||||
| Proceeds from sales of shares: | ||||||||
| Institutional Class | 58,399 | 473,086 | ||||||
| Distributions reinvested: | ||||||||
| Institutional Class | - | 76,664 | ||||||
| Redemption fees: | ||||||||
| Institutional Class | 12 | 41 | ||||||
| Cost of shares redeemed: | ||||||||
| Institutional Class | (469,842 | ) | (1,504,003 | ) | ||||
| Net decrease from capital shares transactions | (411,431 | ) | (954,212 | ) | ||||
| NET INCREASE (DECREASE) IN NET ASSETS | 349,661 | (549,639 | ) | |||||
| NET ASSETS | ||||||||
| Beginning of Period/Year | 11,894,223 | 12,443,862 | ||||||
| End of Period/Year | $ | 12,243,884 | $ | 11,894,223 | ||||
| OTHER INFORMATION | ||||||||
| Shares Transactions | ||||||||
| Institutional Class | ||||||||
| Issued | 7,304 | 58,585 | ||||||
| Issued to shareholders in reinvestment of distributions | - | 9,741 | ||||||
| Redeemed | (58,197 | ) | (197,704 | ) | ||||
| Net decrease in share transactions | (50,893 | ) | (129,378 | ) | ||||
See accompanying notes to financial statements.
40
| Grandeur Peak Global Micro Cap Fund | Statements of Changes in Net Assets |
| For the Six Months Ended October 31, 2024 | For the Year Ended April 30, 2024 | |||||||
| (Unaudited) | ||||||||
| OPERATIONS | ||||||||
| Net investment income | $ | 100,405 | $ | 96,055 | ||||
| Net realized gain | 1,947,039 | 474,309 | ||||||
| Net change in unrealized appreciation | 1,194,781 | 2,427,048 | ||||||
| Net increase in net assets resulting from operations | 3,242,225 | 2,997,412 | ||||||
| CAPITAL SHARE TRANSACTIONS | ||||||||
| Proceeds from sales of shares: | ||||||||
| Institutional Class | 454,901 | 2,414,971 | ||||||
| Redemption fees: | ||||||||
| Institutional Class | 20 | 148 | ||||||
| Cost of shares redeemed: | ||||||||
| Institutional Class | (3,214,927 | ) | (6,337,562 | ) | ||||
| Net decrease from capital shares transactions | (2,760,006 | ) | (3,922,443 | ) | ||||
| NET INCREASE (DECREASE) IN NET ASSETS | 482,219 | (925,031 | ) | |||||
| NET ASSETS | ||||||||
| Beginning of Period/Year | 44,306,671 | 45,231,702 | ||||||
| End of Period/Year | $ | 44,788,890 | $ | 44,306,671 | ||||
| OTHER INFORMATION | ||||||||
| Shares Transactions | ||||||||
| Institutional Class | ||||||||
| Issued | 32,154 | 217,591 | ||||||
| Redeemed | (228,497 | ) | (537,580 | ) | ||||
| Net decrease in share transactions | (196,343 | ) | (319,989 | ) | ||||
See accompanying notes to financial statements.
41
| Grandeur Peak Global Opportunities Fund | Statements of Changes in Net Assets |
| For the Six Months Ended October 31, 2024 | For the Year Ended April 30, 2024 | |||||||
| (Unaudited) | ||||||||
| OPERATIONS | ||||||||
| Net investment income | $ | 3,192,383 | $ | 3,501,505 | ||||
| Net realized gain (loss) | (218,292 | ) | 32,661,888 | |||||
| Net change in unrealized appreciation (depreciation) | 7,606,340 | (40,890,282 | ) | |||||
| Net increase (decrease) in net assets resulting from operations | 10,580,431 | (4,726,889 | ) | |||||
| DISTRIBUTIONS TO SHAREHOLDERS | ||||||||
| Investor Class | - | (240,600 | ) | |||||
| Institutional Class | - | (4,110,106 | ) | |||||
| Net decrease in net assets from distributions | - | (4,350,706 | ) | |||||
| CAPITAL SHARE TRANSACTIONS | ||||||||
| Proceeds from sales of shares: | ||||||||
| Investor Class | 983,443 | 3,775,154 | ||||||
| Institutional Class | 73,816,729 | 46,896,007 | ||||||
| Distributions reinvested: | ||||||||
| Investor Class | - | 239,488 | ||||||
| Institutional Class | - | 3,696,674 | ||||||
| Redemption fees: | ||||||||
| Investor Class | 573 | 3,216 | ||||||
| Institutional Class | 16 | 5,813 | ||||||
| Cost of shares redeemed: | ||||||||
| Investor Class | (9,285,352 | ) | (31,883,146 | ) | ||||
| Institutional Class | (58,398,501 | ) | (123,286,257 | ) | ||||
| Net increase (decrease) from capital shares transactions | 7,116,908 | (100,553,051 | ) | |||||
| NET INCREASE (DECREASE) IN NET ASSETS | 17,697,339 | (109,630,646 | ) | |||||
| NET ASSETS | ||||||||
| Beginning of Period/Year | 566,582,315 | 676,212,961 | ||||||
| End of Period/Year | $ | 584,279,654 | $ | 566,582,315 | ||||
| OTHER INFORMATION | ||||||||
| Shares Transactions | ||||||||
| Investor Class | ||||||||
| Issued | 280,446 | 1,103,292 | ||||||
| Issued to shareholders in reinvestment of distributions | - | 65,975 | ||||||
| Redeemed | (2,639,958 | ) | (9,369,243 | ) | ||||
| Net decrease in share transactions | (2,359,512 | ) | (8,199,976 | ) | ||||
| Institutional Class | ||||||||
| Issued | 19,776,641 | 13,503,420 | ||||||
| Issued to shareholders in reinvestment of distributions | - | 993,730 | ||||||
| Redeemed | (16,170,810 | ) | (35,104,671 | ) | ||||
| Net increase (decrease) in share transactions | 3,605,831 | (20,607,521 | ) | |||||
See accompanying notes to financial statements.
42
| Grandeur Peak Global Reach Fund | Statements of Changes in Net Assets |
| For the Six Months Ended October 31, 2024 | For the Year Ended April 30, 2024 | |||||||
| (Unaudited) | ||||||||
| OPERATIONS | ||||||||
| Net investment income | $ | 1,157,812 | $ | 1,015,071 | ||||
| Net realized gain | 3,295,152 | 14,827,395 | ||||||
| Net change in appreciation (depreciation) | 9,881,114 | (6,940,733 | ) | |||||
| Net increase in net assets resulting from operations | 14,334,078 | 8,901,733 | ||||||
| DISTRIBUTIONS TO SHAREHOLDERS | ||||||||
| Investor Class | - | (34,521 | ) | |||||
| Institutional Class | - | (802,719 | ) | |||||
| Net decrease in net assets from distributions | - | (837,240 | ) | |||||
| CAPITAL SHARE TRANSACTIONS | ||||||||
| Proceeds from sales of shares: | ||||||||
| Investor Class | 600,820 | 1,904,687 | ||||||
| Institutional Class | 12,201,746 | 27,488,195 | ||||||
| Distributions reinvested: | ||||||||
| Investor Class | - | 24,470 | ||||||
| Institutional Class | - | 733,778 | ||||||
| Redemption fees: | ||||||||
| Investor Class | 374 | 91 | ||||||
| Institutional Class | 574 | 2,279 | ||||||
| Cost of shares redeemed: | ||||||||
| Investor Class | (3,660,472 | ) | (9,275,472 | ) | ||||
| Institutional Class | (44,113,957 | ) | (85,536,640 | ) | ||||
| Net decrease from capital shares transactions | (34,970,915 | ) | (64,658,612 | ) | ||||
| NET DECREASE IN NET ASSETS | (20,636,837 | ) | (56,594,119 | ) | ||||
| NET ASSETS | ||||||||
| Beginning of Period/Year | 208,446,328 | 265,040,447 | ||||||
| End of Period/Year | $ | 187,809,491 | $ | 208,446,328 | ||||
| OTHER INFORMATION | ||||||||
| Shares Transactions | ||||||||
| Investor Class | ||||||||
| Issued | 37,447 | 127,748 | ||||||
| Issued to shareholders in reinvestment of distributions | - | 2,188 | ||||||
| Redeemed | (228,895 | ) | (635,922 | ) | ||||
| Net decrease in share transactions | (191,448 | ) | (505,986 | ) | ||||
| Institutional Class | ||||||||
| Issued | 752,054 | 1,813,077 | ||||||
| Issued to shareholders in reinvestment of distributions | - | 46,092 | ||||||
| Redeemed | (2,738,166 | ) | (5,675,086 | ) | ||||
| Net decrease in share transactions | (1,986,112 | ) | (3,815,917 | ) | ||||
See accompanying notes to financial statements.
43
| Grandeur Peak Global Stalwarts Fund | Statements of Changes in Net Assets |
| For the Six Months Ended October 31, 2024 | For the Year Ended April 30, 2024 | |||||||
| (Unaudited) | ||||||||
| OPERATIONS | ||||||||
| Net investment income | $ | 158,058 | $ | 397,471 | ||||
| Net realized gain | 10,060,380 | 4,696,195 | ||||||
| Net change in unrealized appreciation (depreciation) | (4,282,929 | ) | 4,112,753 | |||||
| Net increase in net assets resulting from operations | 5,935,509 | 9,206,419 | ||||||
| DISTRIBUTIONS TO SHAREHOLDERS | ||||||||
| Investor Class | - | (27,755 | ) | |||||
| Institutional Class | - | (545,737 | ) | |||||
| Net decrease in net assets from distributions | - | (573,492 | ) | |||||
| FROM SHARES OF BENEFICIAL INTEREST | ||||||||
| Proceeds from sales of shares: | ||||||||
| Investor Class | 314,964 | 1,524,246 | ||||||
| Institutional Class | 1,560,235 | 13,623,611 | ||||||
| Distributions reinvested: | ||||||||
| Investor Class | - | 27,674 | ||||||
| Institutional Class | - | 507,153 | ||||||
| Redemption fees: | ||||||||
| Investor Class | 22 | 599 | ||||||
| Institutional Class | 5 | 28,025 | ||||||
| Cost of shares redeemed: | ||||||||
| Investor Class | (3,198,224 | ) | (14,477,178 | ) | ||||
| Institutional Class | (18,606,012 | ) | (74,192,892 | ) | ||||
| Net decrease from capital shares transactions | (19,929,010 | ) | (72,958,762 | ) | ||||
| NET DECREASE IN NET ASSETS | (13,993,501 | ) | (64,325,835 | ) | ||||
| NET ASSETS | ||||||||
| Beginning of Period/Year | 134,288,778 | 198,614,613 | ||||||
| End of Period/Year | $ | 120,295,277 | $ | 134,288,778 | ||||
| OTHER INFORMATION | ||||||||
| Shares Transactions | ||||||||
| Investor Class | ||||||||
| Issued | 19,694 | 102,854 | ||||||
| Issued to shareholders in reinvestment of distributions | - | 1,728 | ||||||
| Redeemed | (199,066 | ) | (961,228 | ) | ||||
| Net decrease in share transactions | (179,372 | ) | (856,646 | ) | ||||
| Institutional Class | ||||||||
| Issued | 96,195 | 928,439 | ||||||
| Issued to shareholders in reinvestment of distributions | - | 31,228 | ||||||
| Redeemed | (1,143,542 | ) | (4,927,810 | ) | ||||
| Net decrease in share transactions | (1,047,347 | ) | (3,968,143 | ) | ||||
See accompanying notes to financial statements.
44
| Grandeur Peak International Opportunities Fund | Statements of Changes in Net Assets |
| For the Six Months Ended October 31, 2024 | For the Year Ended April 30, 2024 | |||||||
| (Unaudited) | ||||||||
| OPERATIONS | ||||||||
| Net investment income | $ | 3,909,049 | $ | 4,023,025 | ||||
| Net realized gain (loss) | (5,449,502 | ) | 23,396,713 | |||||
| Net change in unrealized appreciation (depreciation) | 13,063,197 | (51,271,198 | ) | |||||
| Net increase (decrease) in net assets resulting from operations | 11,522,744 | (23,851,460 | ) | |||||
| DISTRIBUTIONS TO SHAREHOLDERS | ||||||||
| Investor Class | - | (150,979 | ) | |||||
| Institutional Class | - | (5,036,500 | ) | |||||
| Net decrease in net assets from distributions | - | (5,187,479 | ) | |||||
| FROM SHARES OF BENEFICIAL INTEREST | ||||||||
| Proceeds from sales of shares: | ||||||||
| Investor Class | 1,486,103 | 2,751,565 | ||||||
| Institutional Class | 16,423,582 | 36,177,464 | ||||||
| Distributions reinvested: | ||||||||
| Investor Class | - | 147,062 | ||||||
| Institutional Class | - | 4,783,119 | ||||||
| Redemption fees: | ||||||||
| Investor Class | 84 | 677 | ||||||
| Institutional Class | 12,136 | 1,836 | ||||||
| Cost of shares redeemed: | ||||||||
| Investor Class | (4,604,076 | ) | (10,657,882 | ) | ||||
| Institutional Class | (99,174,555 | ) | (134,556,586 | ) | ||||
| Net decrease from capital shares transactions | (85,856,726 | ) | (101,352,745 | ) | ||||
| NET DECREASE IN NET ASSETS | (74,333,982 | ) | (130,391,684 | ) | ||||
| NET ASSETS | ||||||||
| Beginning of Period/Year | 502,733,569 | 633,125,253 | ||||||
| End of Period/Year | $ | 428,399,587 | $ | 502,733,569 | ||||
| OTHER INFORMATION | ||||||||
| Shares Transactions | ||||||||
| Investor Class | ||||||||
| Issued | 448,694 | 822,581 | ||||||
| Issued to shareholders in reinvestment of distributions | - | 43,127 | ||||||
| Redeemed | (1,385,265 | ) | (3,272,373 | ) | ||||
| Net decrease in share transactions | (936,571 | ) | (2,406,665 | ) | ||||
| Institutional Class | ||||||||
| Issued | 4,921,688 | 10,997,776 | ||||||
| Issued to shareholders in reinvestment of distributions | - | 1,390,442 | ||||||
| Redeemed | (29,577,645 | ) | (40,857,316 | ) | ||||
| Net decrease in share transactions | (24,655,957 | ) | (28,469,098 | ) | ||||
See accompanying notes to financial statements.
45
| Grandeur Peak International Stalwarts Fund | Statements of Changes in Net Assets |
| For the Six Months Ended October 31, 2024 | For the Year Ended April 30, 2024 | |||||||
| (Unaudited) | ||||||||
| OPERATIONS | ||||||||
| Net investment income | $ | 7,130,090 | $ | 11,526,270 | ||||
| Net realized gain (loss) | 48,130,135 | (52,293,774 | ) | |||||
| Net change in unrealized appreciation (depreciation) | (42,003,989 | ) | 40,248,382 | |||||
| Net increase (decrease) in net assets resulting from operations | 13,256,236 | (519,122 | ) | |||||
| DISTRIBUTIONS TO SHAREHOLDERS | ||||||||
| Investor Class | - | (142,651 | ) | |||||
| Institutional Class | - | (13,208,019 | ) | |||||
| Net decrease in net assets from distributions | - | (13,350,670 | ) | |||||
| FROM SHARES OF BENEFICIAL INTEREST | ||||||||
| Proceeds from sales of shares: | ||||||||
| Investor Class | 458,782 | 1,264,021 | ||||||
| Institutional Class | 220,507,363 | 386,421,995 | ||||||
| Distributions reinvested: | ||||||||
| Investor Class | - | 142,588 | ||||||
| Institutional Class | - | 12,538,889 | ||||||
| Redemption fees: | ||||||||
| Investor Class | 3 | 394 | ||||||
| Institutional Class | 2,888 | 5,346 | ||||||
| Cost of shares redeemed: | ||||||||
| Investor Class | (4,986,546 | ) | (11,974,978 | ) | ||||
| Institutional Class | (169,064,973 | ) | (528,225,211 | ) | ||||
| Net increase (decrease) from capital shares transactions | 46,917,517 | (139,826,956 | ) | |||||
| NET INCREASE (DECREASE) IN NET ASSETS | 60,173,753 | (153,696,748 | ) | |||||
| NET ASSETS | ||||||||
| Beginning of Period/Year | 1,575,270,244 | 1,728,966,992 | ||||||
| End of Period/Year | $ | 1,635,443,997 | $ | 1,575,270,244 | ||||
| OTHER INFORMATION | ||||||||
| Shares Transactions | ||||||||
| Investor Class | ||||||||
| Issued | 26,508 | 76,655 | ||||||
| Issued to shareholders in reinvestment of distributions | - | 8,209 | ||||||
| Redeemed | (287,787 | ) | (734,508 | ) | ||||
| Net decrease in share transactions | (261,279 | ) | (649,644 | ) | ||||
| Institutional Class | ||||||||
| Issued | 12,680,531 | 23,570,745 | ||||||
| Issued to shareholders in reinvestment of distributions | - | 715,690 | ||||||
| Redeemed | (9,724,383 | ) | (33,126,239 | ) | ||||
| Net increase (decrease) in share transactions | 2,956,148 | (8,839,804 | ) | |||||
See accompanying notes to financial statements.
46
| Grandeur Peak US Stalwarts Fund | Statements of Changes in Net Assets |
| For the Six Months Ended October 31, 2024 | For the Year Ended April 30, 2024 | |||||||
| (Unaudited) | ||||||||
| OPERATIONS | ||||||||
| Net investment loss | $ | (102,849 | ) | $ | (75,669 | ) | ||
| Net realized gain (loss) | 9,742,914 | (1,636,595 | ) | |||||
| Net change in unrealized appreciation | 1,910,226 | 16,495,415 | ||||||
| Net increase in net assets resulting from operations | 11,550,291 | 14,783,151 | ||||||
| FROM SHARES OF BENEFICIAL INTEREST | ||||||||
| Proceeds from sales of shares: | ||||||||
| Institutional Class | 13,239,457 | 36,667,542 | ||||||
| Redemption fees: | ||||||||
| Institutional Class | 29 | 1,089 | ||||||
| Cost of shares redeemed: | ||||||||
| Institutional Class | (11,862,623 | ) | (29,279,999 | ) | ||||
| Net increase from capital shares transactions | 1,376,863 | 7,388,632 | ||||||
| NET INCREASE IN NET ASSETS | 12,927,154 | 22,171,783 | ||||||
| NET ASSETS | ||||||||
| Beginning of Period/Year | 126,630,500 | 104,458,717 | ||||||
| End of Period/Year | $ | 139,557,654 | $ | 126,630,500 | ||||
| OTHER INFORMATION | ||||||||
| Shares Transactions | ||||||||
| Institutional Class | ||||||||
| Issued | 694,112 | 2,118,398 | ||||||
| Redeemed | (630,574 | ) | (1,724,276 | ) | ||||
| Net increase in share transactions | 63,538 | 394,122 | ||||||
See accompanying notes to financial statements.
47
| Grandeur Peak Emerging Markets Opportunities Fund | Financial Highlights |
For a Share Outstanding Throughout the Years or Period Presented
| Investor Class | Six Months Ended October 31, 2024 | Year Ended April 30, 2024 | Year Ended April 30, 2023 | Year Ended April 30, 2022 | Year Ended April 30, 2021 | Year Ended April 30, 2020 | ||||||||||||||||||
| (Unaudited) | ||||||||||||||||||||||||
| NET ASSET VALUE, BEGINNING OF PERIOD/YEAR | $ | 12.40 | $ | 12.58 | $ | 13.21 | $ | 17.70 | $ | 11.07 | $ | 11.82 | ||||||||||||
| INCOME FROM INVESTMENT OPERATIONS | ||||||||||||||||||||||||
| Net investment income/(loss)(a) | 0.11 | 0.06 | 0.06 | (0.01 | ) | (0.08 | ) | 0.01 | ||||||||||||||||
| Net realized and unrealized gain/(loss) on investments | 0.11 | 0.25 | (0.67 | ) | (2.48 | ) | 6.71 | (0.75 | ) | |||||||||||||||
| Total income/(loss) from investment operations | 0.22 | 0.31 | (0.61 | ) | (2.49 | ) | 6.63 | (0.74 | ) | |||||||||||||||
| DISTRIBUTIONS | ||||||||||||||||||||||||
| From net investment income | - | (0.02 | ) | (0.02 | ) | - | (0.00 | )(b) | (0.01 | ) | ||||||||||||||
| From net realized gain on investments | - | (0.47 | ) | - | (2.00 | ) | - | - | ||||||||||||||||
| Total distributions | - | (0.49 | ) | (0.02 | ) | (2.00 | ) | (0.00 | )(b) | (0.01 | ) | |||||||||||||
| REDEMPTION FEES ADDED TO PAID-IN CAPITAL | - | 0.00 | (b) | 0.00 | (b) | - | 0.00 | (b) | - | |||||||||||||||
| NET ASSET VALUE, END OF PERIOD/YEAR | $ | 12.62 | $ | 12.40 | $ | 12.58 | $ | 13.21 | $ | 17.70 | $ | 11.07 | ||||||||||||
| TOTAL RETURN(c) | 1.77 | %(e) | 2.38 | %(d) | (4.62 | )% | (16.01 | )% | 59.92 | % | (6.29 | )% | ||||||||||||
| Net assets, at end of period/year (000s) | $ | 6,573 | $ | 7,253 | $ | 8,767 | $ | 10,846 | $ | 15,011 | $ | 10,056 | ||||||||||||
| Expenses (excluding fees waived/reimbursed by investment advisor) | 1.80 | %(f) | 1.83 | % | 1.70 | % | 1.76 | % | 1.75 | % | 1.76 | % | ||||||||||||
| Expenses (including fees waived/reimbursed by investment advisor) | 1.80 | %(f) | 1.81 | % | 1.68 | % | 1.63 | % | 1.68 | % | 1.74 | % | ||||||||||||
| Net investment income/(loss) | 1.76 | %(f) | 0.48 | % | 0.45 | % | (0.09 | )% | (0.50 | )% | 0.09 | % | ||||||||||||
| PORTFOLIO TURNOVER RATE | 15 | %(e) | 38 | % | 32 | % | 31 | % | 35 | % | 24 | % | ||||||||||||
| (a) | Per share numbers have been calculated using the average shares method. | |
| (b) | Less than $0.005 or ($0.005) per share. | |
| (c) | Total return in the above table is historical in nature and represents the rate that the investor would have earned or lost on an investment in the Fund assuming reinvestment of dividends and capital gain distributions, if any. Had the investment advisor not waived a portion of the Fund’s expenses in certain periods, total returns would have been lower. | |
| (d) | Includes adjustments in accordance with accounting principles generally accepted in the United States and, consequently, the net asset value for financial reporting purposes and the returns based upon those net asset values may differ from the net asset values and returns for shareholder transactions. | |
| (e) | Not annualized. | |
| (f) | Annualized. |
See accompanying notes to financial statements.
48
| Grandeur Peak Emerging Markets Opportunities Fund | Financial Highlights |
For a Share Outstanding Throughout the Years or Period Presented
| Institutional Class | Six Months Ended October 31, 2024 | Year Ended April 30, 2024 | Year Ended April 30, 2023 | Year Ended April 30, 2022 | Year Ended April 30, 2021 | Year Ended April 30, 2020 | ||||||||||||||||||
| (Unaudited) | ||||||||||||||||||||||||
| NET ASSET VALUE, BEGINNING OF PERIOD/YEAR | $ | 12.55 | $ | 12.72 | $ | 13.35 | $ | 17.83 | $ | 11.14 | $ | 11.88 | ||||||||||||
| INCOME FROM INVESTMENT OPERATIONS | ||||||||||||||||||||||||
| Net investment income/(loss)(a) | 0.13 | 0.09 | 0.08 | 0.03 | (0.04 | ) | 0.04 | |||||||||||||||||
| Net realized and unrealized gain/(loss) on investments | 0.11 | 0.25 | (0.67 | ) | (2.51 | ) | 6.76 | (0.75 | ) | |||||||||||||||
| Total income/(loss) from investment operations | 0.24 | 0.35 | (0.59 | ) | (2.48 | ) | 6.72 | (0.71 | ) | |||||||||||||||
| DISTRIBUTIONS | ||||||||||||||||||||||||
| From net investment income | - | (0.04 | ) | (0.04 | ) | - | (0.01 | ) | (0.03 | ) | ||||||||||||||
| From net realized gain on investments | - | (0.47 | ) | - | (2.00 | ) | (0.02 | ) | - | |||||||||||||||
| Total distributions | - | (0.51 | ) | (0.04 | ) | (2.00 | ) | (0.03 | ) | (0.03 | ) | |||||||||||||
| REDEMPTION FEES ADDED TO PAID-IN CAPITAL(b) | 0.00 | 0.00 | 0.00 | 0.00 | 0.00 | 0.00 | ||||||||||||||||||
| NET ASSET VALUE, END OF PERIOD/YEAR | $ | 12.79 | $ | 12.55 | $ | 12.72 | $ | 13.35 | $ | 17.83 | $ | 11.14 | ||||||||||||
| TOTAL RETURN(c) | 1.91 | %(e) | 2.66 | %(d) | (4.42 | )% | (15.82 | )% | 60.30 | % | (6.03 | )% | ||||||||||||
| Net assets, at end of period/year (000s) | $ | 301,164 | $ | 339,328 | $ | 416,872 | $ | 485,230 | $ | 623,538 | $ | 389,373 | ||||||||||||
| Expenses (excluding fees waived/reimbursed by investment advisor) | 1.55 | %(f) | 1.58 | % | 1.51 | % | 1.52 | % | 1.52 | % | 1.53 | % | ||||||||||||
| Expenses (including fees waived/reimbursed by investment advisor) | 1.55 | %(f) | 1.56 | % | 1.48 | % | 1.39 | % | 1.45 | % | 1.51 | % | ||||||||||||
| Net investment income/(loss) | 2.01 | %(f) | 0.73 | % | 0.66 | % | 0.15 | % | (0.27 | )% | 0.29 | % | ||||||||||||
| PORTFOLIO TURNOVER RATE | 15 | %(e) | 38 | % | 32 | % | 31 | % | 35 | % | 24 | % | ||||||||||||
| (a) | Per share numbers have been calculated using the average shares method. | |
| (b) | Less than $0.005 or ($0.005) per share. | |
| (c) | Total return in the above table is historical in nature and represents the rate that the investor would have earned or lost on an investment in the Fund assuming reinvestment of dividends and capital gain distributions, if any. Had the investment advisor not waived a portion of the Fund’s expenses in certain periods, total returns would have been lower. | |
| (d) | Includes adjustments in accordance with accounting principles generally accepted in the United States and, consequently, the net asset value for financial reporting purposes and the returns based upon those net asset values may differ from the net asset values and returns for shareholder transactions. | |
| (e) | Not annualized. | |
| (f) | Annualized. |
See accompanying notes to financial statements.
49
| Grandeur Peak Global Contrarian Fund | Financial Highlights |
For a Share Outstanding Throughout the Years or Period Presented
| Institutional Class | Six Months Ended October 31, 2024 | Year Ended April 30, 2024 | Year Ended April 30, 2023 | Year Ended April 30, 2022 | Year Ended April 30, 2021 | Period Ended April 30, 2020(a) | ||||||||||||||||||
| (Unaudited) | ||||||||||||||||||||||||
| NET ASSET VALUE, BEGINNING OF PERIOD/YEAR | $ | 15.12 | $ | 13.26 | $ | 13.60 | $ | 15.41 | $ | 8.78 | $ | 10.00 | ||||||||||||
| INCOME FROM INVESTMENT OPERATIONS | ||||||||||||||||||||||||
| Net investment income(b) | 0.32 | 0.34 | 0.30 | 0.20 | 0.25 | 0.06 | ||||||||||||||||||
| Net realized and unrealized gain/(loss) on investments | 1.25 | 1.81 | (0.26 | ) | (1.12 | ) | 6.61 | (1.25 | ) | |||||||||||||||
| Total income/(loss) from investment operations | 1.57 | 2.15 | 0.04 | (0.92 | ) | 6.86 | (1.19 | ) | ||||||||||||||||
| DISTRIBUTIONS | ||||||||||||||||||||||||
| From net investment income | - | (0.29 | ) | (0.29 | ) | (0.14 | ) | (0.23 | ) | (0.01 | ) | |||||||||||||
| From net realized gain on investments | - | - | (0.09 | ) | (0.75 | ) | - | (0.02 | ) | |||||||||||||||
| Total distributions | - | (0.29 | ) | (0.38 | ) | (0.89 | ) | (0.23 | ) | (0.03 | ) | |||||||||||||
| REDEMPTION FEES ADDED TO PAID-IN CAPITAL(c) | 0.00 | 0.00 | 0.00 | 0.00 | 0.00 | 0.00 | ||||||||||||||||||
| NET ASSET VALUE, END OF PERIOD/YEAR | $ | 16.69 | $ | 15.12 | $ | 13.26 | $ | 13.60 | $ | 15.41 | $ | 8.78 | ||||||||||||
| TOTAL RETURN(d) | 10.38 | %(e) | 16.28 | % | 0.42 | % | (6.51 | )% | 78.51 | % | (11.96 | )%(e) | ||||||||||||
| Net assets, at end of period/year (000s) | $ | 154,882 | $ | 141,663 | $ | 117,406 | $ | 106,129 | $ | 49,403 | $ | 8,861 | ||||||||||||
| Expenses (excluding fees waived/reimbursed/recaptured by investment advisor) | 1.21 | %(f)(h) | 1.25 | % | 1.35 | % | 1.40 | % | 1.87 | % | 4.69 | %(f)(g) | ||||||||||||
| Expenses (including fees waived/reimbursed/recaptured by investment advisor) | 1.21 | %(f)(i) | 1.35 | % | 1.35 | % | 1.35 | % | 1.35 | % | 1.35 | %(f)(g) | ||||||||||||
| Net investment income | 3.97 | %(f) | 2.42 | % | 2.29 | % | 1.33 | % | 1.91 | % | 1.05 | %(f) | ||||||||||||
| PORTFOLIO TURNOVER RATE | 30 | %(e) | 51 | % | 81 | % | 50 | % | 54 | % | 34 | %(e) | ||||||||||||
| (a) | The Fund commenced on September 17, 2019 and reorganized into the Trust on October 20, 2023. | |
| (b) | Per share numbers have been calculated using the average shares method. | |
| (c) | Less than $0.005 or ($0.005) per share. | |
| (d) | Total return in the above table is historical in nature and represents the rate that the investor would have earned or lost on an investment in the Fund assuming reinvestment of dividends and capital gain distributions, if any. Had the investment advisor not waived or recaptured a portion of the Fund’s expenses in certain periods, total returns would have been lower. | |
| (e) | Not annualized. | |
| (f) | Annualized. | |
| (g) | Expense ratios during startup periods may not be representative of longer term operating periods. | |
| (h) | Represents the ratio of expenses to average net assets absent fee waivers, expense reimbursements and/or expense recaptured by the Adviser. | |
| (i) | Represents the ratio of expenses to average net assets inclusive of fee waivers, expense reimbursement and/or expense recaptured by the Adviser. |
See accompanying notes to financial statements.
50
| Grandeur Peak Global Explorer Fund | Financial Highlights |
For a Share Outstanding Throughout the Years or Period Presented
| Institutional Class | Six Months Ended October 31, 2024 | Year Ended April 30, 2024 | Year Ended April 30, 2023 | Period Ended April 30, 2022(a) | ||||||||||||
| (Unaudited) | ||||||||||||||||
| NET ASSET VALUE, BEGINNING OF PERIOD/YEAR | $ | 7.61 | $ | 7.36 | $ | 7.80 | $ | 10.00 | ||||||||
| INCOME FROM INVESTMENT OPERATIONS | ||||||||||||||||
| Net investment income/(loss)(b) | 0.03 | 0.03 | 0.02 | (0.01 | ) | |||||||||||
| Net realized and unrealized loss on investments | 0.46 | 0.27 | (0.44 | ) | (2.19 | ) | ||||||||||
| Total loss from investment operations | 0.49 | 0.30 | (0.42 | ) | (2.20 | ) | ||||||||||
| DISTRIBUTIONS | ||||||||||||||||
| From net investment income | - | (0.05 | ) | (0.02 | ) | - | ||||||||||
| Total distributions | - | (0.05 | ) | (0.02 | ) | - | ||||||||||
| REDEMPTION FEES ADDED TO PAID-IN CAPITAL(c) | 0.00 | 0.00 | 0.00 | 0.00 | ||||||||||||
| NET ASSET VALUE, END OF PERIOD/YEAR | $ | 8.10 | $ | 7.61 | $ | 7.36 | $ | 7.80 | ||||||||
| TOTAL RETURN(d) | 6.44 | %(e) | 4.05 | % | (5.40 | )% | (22.00 | )%(e) | ||||||||
| Net assets, at end of period/year (000s) | $ | 12,244 | $ | 11,894 | $ | 12,444 | $ | 9,461 | ||||||||
| Expenses (excluding fees waived/reimbursed by investment advisor) | 2.23 | %(f) | 3.14 | % | 3.97 | % | 2.45 | %(f)(g) | ||||||||
| Expenses (including fees waived/reimbursed by investment advisor) | 1.25 | %(f) | 1.25 | % | 1.25 | % | 1.25 | %(f)(g) | ||||||||
| Net investment income/(loss) | 0.85 | %(f) | 0.42 | % | 0.29 | % | (0.16 | )%(f) | ||||||||
| PORTFOLIO TURNOVER RATE | 24 | %(e) | 43 | % | 38 | % | 8 | %(e) | ||||||||
| (a) | The Fund commenced on December 16, 2021 and reorganized into the Trust on October 20, 2023. | |
| (b) | Per share numbers have been calculated using the average shares method. | |
| (c) | Less than $0.005 or ($0.005) per share. | |
| (d) | Total return in the above table is historical in nature and represents the rate that the investor would have earned or lost on an investment in the Fund assuming reinvestment of dividends and capital gain distributions, if any. Had the investment advisor not waived a portion of the Fund’s expenses in certain periods, total returns would have been lower. | |
| (e) | Not annualized. | |
| (f) | Annualized. | |
| (g) | Expense ratios during startup periods may not be representative of longer term operating periods. |
See accompanying notes to financial statements.
51
| Grandeur Peak Global Micro Cap Fund | Financial Highlights |
For a Share Outstanding Throughout the Years or Period Presented
| Institutional Class | Six Months Ended October 31, 2024 | Year Ended April 30, 2024 | Year Ended April 30, 2023 | Year Ended April 30, 2022 | Year Ended April 30, 2021 | Year Ended April 30, 2020 | ||||||||||||||||||
| (Unaudited) | ||||||||||||||||||||||||
| NET ASSET VALUE, BEGINNING OF PERIOD/YEAR | $ | 13.36 | $ | 12.44 | $ | 13.49 | $ | 20.65 | $ | 11.05 | $ | 11.31 | ||||||||||||
| INCOME FROM INVESTMENT OPERATIONS | ||||||||||||||||||||||||
| Net investment income/(loss)(a) | 0.03 | 0.03 | 0.02 | (0.09 | ) | (0.10 | ) | 0.01 | ||||||||||||||||
| Net realized and unrealized gain/(loss) on investments | 0.97 | 0.89 | (1.07 | ) | (4.24 | ) | 11.17 | (0.19 | ) | |||||||||||||||
| Total income/(loss) from investment operations | 1.00 | 0.92 | (1.05 | ) | (4.33 | ) | 11.07 | (0.18 | ) | |||||||||||||||
| DISTRIBUTIONS | ||||||||||||||||||||||||
| From net investment income | - | - | - | - | (0.14 | ) | (0.03 | ) | ||||||||||||||||
| From net realized gain on investments | - | - | - | (2.83 | ) | (1.33 | ) | (0.05 | ) | |||||||||||||||
| Total distributions | - | - | - | (2.83 | ) | (1.47 | ) | (0.08 | ) | |||||||||||||||
| REDEMPTION FEES ADDED TO PAID-IN CAPITAL | 0.00 | (b) | 0.00 | (b) | 0.00 | (b) | 0.00 | (b) | - | 0.00 | (b) | |||||||||||||
| NET ASSET VALUE, END OF PERIOD/YEAR | $ | 14.36 | $ | 13.36 | $ | 12.44 | $ | 13.49 | $ | 20.65 | $ | 11.05 | ||||||||||||
| TOTAL RETURN(c) | 7.49 | %(d) | 7.40 | % | (7.78 | )% | (24.25 | )% | 102.43 | % | (1.62 | )% | ||||||||||||
| Net assets, at end of period/year (000s) | $ | 44,789 | $ | 44,307 | $ | 45,232 | $ | 53,175 | $ | 70,375 | $ | 29,634 | ||||||||||||
| Expenses (excluding fees waived/reimbursed by investment advisor) | 1.98 | %(e)(f) | 2.01 | % | 1.85 | % | 1.94 | % | 2.02 | % | 2.06 | % | ||||||||||||
| Expenses (including fees waived/reimbursed by investment advisor) | 2.00 | %(e)(g) | 2.00 | % | 1.85 | % | 1.94 | % | 2.00 | % | 2.00 | % | ||||||||||||
| Net investment income/(loss) | 0.44 | %(e) | 0.22 | % | 0.13 | % | (0.50 | )% | (0.62 | )% | 0.09 | % | ||||||||||||
| PORTFOLIO TURNOVER RATE | 16 | %(d) | 34 | % | 37 | % | 36 | % | 36 | % | 33 | % | ||||||||||||
| (a) | Per share numbers have been calculated using the average shares method. | |
| (b) | Less than $0.005 or ($0.005) per share. | |
| (c) | Total return in the above table is historical in nature and represents the rate that the investor would have earned or lost on an investment in the Fund assuming reinvestment of dividends and capital gain distributions, if any. Had the investment advisor not waived a portion of the Fund’s expenses in certain periods, total returns would have been lower. | |
| (d) | Not annualized. | |
| (e) | Annualized. | |
| (f) | Represents the ratio of expenses to average net assets absent fee waivers, expense reimbursements and/or expense recaptured by the Adviser. | |
| (g) | Represents the ratio of expenses to average net assets inclusive of fee waivers, expense reimbursement and/or expense recaptured by the Adviser. |
See accompanying notes to financial statements.
52
| Grandeur Peak Global Opportunities Fund | Financial Highlights |
For a Share Outstanding Throughout the Years or Period Presented
| Investor Class | Six Months Ended October 31, 2024 | Year Ended April 30, 2024 | Year Ended April 30, 2023 | Year Ended April 30, 2022 | Year Ended April 30, 2021 | Year Ended April 30, 2020 | ||||||||||||||||||
| (Unaudited) | ||||||||||||||||||||||||
| NET ASSET VALUE, BEGINNING OF PERIOD/YEAR | $ | 3.37 | $ | 3.42 | $ | 3.70 | $ | 5.51 | $ | 3.24 | $ | 3.48 | ||||||||||||
| INCOME FROM INVESTMENT OPERATIONS | ||||||||||||||||||||||||
| Net investment income/(loss)(a) | 0.02 | 0.05 | 0.01 | (0.01 | ) | (0.02 | ) | (0.01 | )(b) | |||||||||||||||
| Net realized and unrealized gain/(loss) on investments | 0.05 | (0.08 | ) | (0.23 | ) | (0.82 | ) | 2.66 | (0.03 | ) | ||||||||||||||
| Total income/(loss) from investment operations | 0.07 | (0.03 | ) | (0.22 | ) | (0.83 | ) | 2.64 | (0.04 | ) | ||||||||||||||
| DISTRIBUTIONS | ||||||||||||||||||||||||
| From net investment income | - | (0.02 | ) | - | - | (0.00 | )(c) | - | ||||||||||||||||
| From net realized gain on investments | - | - | (0.06 | ) | (0.98 | ) | (0.37 | ) | (0.20 | ) | ||||||||||||||
| Total distributions | - | (0.02 | ) | (0.06 | ) | (0.98 | ) | (0.37 | ) | (0.20 | ) | |||||||||||||
| REDEMPTION FEES ADDED TO PAID-IN CAPITAL(c) | 0.00 | 0.00 | 0.00 | 0.00 | 0.00 | 0.00 | ||||||||||||||||||
| NET ASSET VALUE, END OF PERIOD/YEAR | $ | 3.44 | $ | 3.37 | $ | 3.42 | $ | 3.70 | $ | 5.51 | $ | 3.24 | ||||||||||||
| TOTAL RETURN(d) | 2.08 | %(e) | (1.03 | )% | (5.99 | )% | (19.49 | )% | 82.94 | % | (1.73 | )% | ||||||||||||
| Net assets, at end of period/year (000s) | $ | 36,513 | $ | 43,680 | $ | 72,420 | $ | 92,173 | $ | 131,739 | $ | 92,843 | ||||||||||||
| Expenses (excluding fees waived/reimbursed by investment advisor) | 1.60 | %(f) | 1.63 | % | 1.60 | % | 1.57 | % | 1.60 | % | 1.61 | % | ||||||||||||
| Expenses (including fees waived/reimbursed by investment advisor) | 1.57 | %(f) | 1.58 | % | 1.54 | % | 1.45 | % | 1.51 | % | 1.57 | % | ||||||||||||
| Net investment income/(loss) | 0.85 | %(f) | 0.23 | % | 0.21 | % | (0.14 | )% | (0.34 | )% | (0.17 | )% | ||||||||||||
| PORTFOLIO TURNOVER RATE | 22 | %(e) | 36 | % | 28 | % | 33 | % | 47 | % | 41 | % | ||||||||||||
| (a) | Per share numbers have been calculated using the average shares method. | |
| (b) | The per share amount does not correspond to activity reflected in the Statement of Operations due to class specific expenses during the period. | |
| (c) | Less than $0.005 or ($0.005) per share. | |
| (d) | Total return in the above table is historical in nature and represents the rate that the investor would have earned or lost on an investment in the Fund assuming reinvestment of dividends and capital gain distributions, if any. Had the investment advisor not waived a portion of the Fund’s expenses in certain periods, total returns would have been lower. | |
| (e) | Not annualized. | |
| (f) | Annualized. |
See accompanying notes to financial statements.
53
| Grandeur Peak Global Opportunities Fund | Financial Highlights |
For a Share Outstanding Throughout the Years or Period Presented
| Institutional Class | Six Months Ended October 31, 2024 | Year Ended April 30, 2024 | Year Ended April 30, 2023 | Year Ended April 30, 2022 | Year Ended April 30, 2021 | Year Ended April 30, 2020 | ||||||||||||||||||
| (Unaudited) | ||||||||||||||||||||||||
| NET ASSET VALUE, BEGINNING OF PERIOD/YEAR | $ | 3.45 | $ | 3.51 | $ | 3.79 | $ | 5.61 | $ | 3.29 | $ | 3.52 | ||||||||||||
| INCOME FROM INVESTMENT OPERATIONS | ||||||||||||||||||||||||
| Net investment income(a) | 0.02 | 0.02 | 0.02 | 0.00 | 0.00 | 0.00 | ||||||||||||||||||
| Net realized and unrealized gain/(loss) on investments | 0.06 | (0.05 | ) | (0.24 | ) | (0.84 | ) | 2.70 | (0.03 | ) | ||||||||||||||
| Total income/(loss) from investment operations | 0.08 | (0.03 | ) | (0.22 | ) | (0.84 | ) | 2.70 | (0.03 | ) | ||||||||||||||
| DISTRIBUTIONS | ||||||||||||||||||||||||
| From net investment income | - | (0.03 | ) | (0.00 | ) | (0.00 | ) | (0.01 | ) | - | ||||||||||||||
| From net realized gain on investments | - | - | (0.06 | ) | (0.98 | ) | (0.37 | ) | (0.20 | ) | ||||||||||||||
| Total distributions | - | (0.03 | ) | (0.06 | ) | (0.98 | ) | (0.37 | ) | (0.20 | ) | |||||||||||||
| REDEMPTION FEES ADDED TO PAID-IN CAPITAL(b) | 0.00 | 0.00 | 0.00 | 0.00 | 0.00 | 0.00 | ||||||||||||||||||
| NET ASSET VALUE, END OF PERIOD/YEAR | $ | 3.53 | $ | 3.45 | $ | 3.51 | $ | 3.79 | $ | 5.61 | $ | 3.29 | ||||||||||||
| TOTAL RETURN(c) | 2.32 | %(d) | (1.01 | )% | (5.74 | )% | (19.30 | )% | 83.44 | % | (1.42 | )% | ||||||||||||
| Net assets, at end of period/year (000s) | $ | 547,767 | $ | 522,903 | $ | 603,793 | $ | 679,987 | $ | 889,823 | $ | 470,142 | ||||||||||||
| Expenses (excluding fees waived/reimbursed by investment advisor) | 1.35 | %(e) | 1.38 | % | 1.36 | % | 1.34 | % | 1.35 | % | 1.37 | % | ||||||||||||
| Expenses (including fees waived/reimbursed by investment advisor) | 1.32 | %(e) | 1.33 | % | 1.30 | % | 1.22 | % | 1.27 | % | 1.33 | % | ||||||||||||
| Net investment income/(loss) | 1.10 | %(e) | 0.48 | % | 0.44 | % | 0.09 | % | (0.08 | )% | 0.05 | % | ||||||||||||
| PORTFOLIO TURNOVER RATE | 22 | %(d) | 36 | % | 28 | % | 33 | % | 47 | % | 41 | % | ||||||||||||
| (a) | Per share numbers have been calculated using the average shares method. | |
| (b) | Less than $0.005 or ($0.005) per share. | |
| (c) | Total return in the above table is historical in nature and represents the rate that the investor would have earned or lost on an investment in the Fund assuming reinvestment of dividends and capital gain distributions, if any. Had the investment advisor not waived a portion of the Fund’s expenses in certain periods, total returns would have been lower. | |
| (d) | Not annualized. | |
| (e) | Annualized. |
See accompanying notes to financial statements.
54
| Grandeur Peak Global Reach Fund | Financial Highlights |
For a Share Outstanding Throughout the Years or Period Presented
| Investor Class | Six Months Ended October 31, 2024 | Year Ended April 30, 2024 | Year Ended April 30, 2023 | Year Ended April 30, 2022 | Year Ended April 30, 2021 | Year Ended April 30, 2020 | ||||||||||||||||||
| (Unaudited) | ||||||||||||||||||||||||
| NET ASSET VALUE, BEGINNING OF PERIOD/YEAR | $ | 15.18 | $ | 14.65 | $ | 16.01 | $ | 23.16 | $ | 14.12 | $ | 14.98 | ||||||||||||
| INCOME FROM INVESTMENT OPERATIONS | ||||||||||||||||||||||||
| Net investment income/(loss)(a) | 0.08 | 0.03 | 0.02 | (0.07 | ) | (0.07 | ) | (0.01 | )(b) | |||||||||||||||
| Net realized and unrealized gain/(loss) on investments | 1.02 | 0.52 | (1.38 | ) | (3.77 | ) | 10.79 | (0.44 | ) | |||||||||||||||
| Total income/(loss) from investment operations | 1.10 | 0.55 | (1.36 | ) | (3.84 | ) | 10.72 | (0.45 | ) | |||||||||||||||
| DISTRIBUTIONS | ||||||||||||||||||||||||
| From net investment income | - | (0.02 | ) | - | - | (0.01 | ) | - | ||||||||||||||||
| From net realized gain on investments | - | - | - | (3.31 | ) | (1.67 | ) | (0.41 | ) | |||||||||||||||
| Total distributions | - | (0.02 | ) | - | (3.31 | ) | (1.68 | ) | (0.41 | ) | ||||||||||||||
| REDEMPTION FEES ADDED TO PAID-IN CAPITAL(c) | 0.00 | 0.00 | 0.00 | 0.00 | 0.00 | 0.00 | ||||||||||||||||||
| NET ASSET VALUE, END OF PERIOD/YEAR | $ | 16.28 | $ | 15.18 | $ | 14.65 | $ | 16.01 | $ | 23.16 | $ | 14.12 | ||||||||||||
| TOTAL RETURN(d) | 7.25 | %(e) | 3.77 | % | (8.49 | )% | (20.17 | )% | 77.38 | % | (3.31 | )% | ||||||||||||
| Net assets, at end of period/year (000s) | $ | 19,123 | $ | 20,747 | $ | 27,427 | $ | 33,459 | $ | 59,164 | $ | 40,307 | ||||||||||||
| Expenses (excluding fees waived/reimbursed by investment advisor) | 1.54 | %(f) | 1.55 | % | 1.49 | % | 1.49 | % | 1.52 | % | 1.52 | % | ||||||||||||
| Expenses (including fees waived/reimbursed by investment advisor) | 1.50 | %(f) | 1.50 | % | 1.49 | % | 1.48 | % | 1.52 | % | 1.52 | % | ||||||||||||
| Net investment income/(loss) | 0.94 | %(f) | 0.22 | % | 0.16 | % | (0.32 | )% | (0.38 | )% | (0.04 | )% | ||||||||||||
| PORTFOLIO TURNOVER RATE | 26 | %(e) | 41 | % | 42 | % | 42 | % | 41 | % | 32 | % | ||||||||||||
| (a) | Per share numbers have been calculated using the average shares method. | |
| (b) | The per share amount does not correspond to activity reflected in the Statement of Operations due to class specific expenses during the period. | |
| (c) | Less than $0.005 or ($0.005) per share. | |
| (d) | Total return in the above table is historical in nature and represents the rate that the investor would have earned or lost on an investment in the Fund assuming reinvestment of dividends and capital gain distributions, if any. Had the investment advisor not waived a portion of the Fund’s expenses in certain periods, total returns would have been lower. | |
| (e) | Not annualized. | |
| (f) | Annualized. |
See accompanying notes to financial statements.
55
| Grandeur Peak Global Reach Fund | Financial Highlights |
For a Share Outstanding Throughout the Years or Period Presented
| Institutional Class | Six Months Ended October 31, 2024 | Year Ended April 30, 2024 | Year Ended April 30, 2023 | Year Ended April 30, 2022 | Year Ended April 30, 2021 | Year Ended April 30, 2020 | ||||||||||||||||||
| (Unaudited) | ||||||||||||||||||||||||
| NET ASSET VALUE, BEGINNING OF PERIOD/YEAR | $ | 15.37 | $ | 14.82 | $ | 16.17 | $ | 23.31 | $ | 14.19 | $ | 15.04 | ||||||||||||
| INCOME FROM INVESTMENT OPERATIONS | ||||||||||||||||||||||||
| Net investment income/(loss)(a) | 0.10 | 0.07 | 0.06 | (0.02 | ) | (0.03 | ) | 0.03 | ||||||||||||||||
| Net realized and unrealized gain/(loss) on investments | 1.02 | 0.54 | (1.40 | ) | (3.81 | ) | 10.86 | (0.45 | ) | |||||||||||||||
| Total income/(loss) from investment operations | 1.12 | 0.61 | (1.34 | ) | (3.83 | ) | 10.83 | (0.42 | ) | |||||||||||||||
| DISTRIBUTIONS | ||||||||||||||||||||||||
| From net investment income | - | (0.06 | ) | (0.01 | ) | - | (0.04 | ) | (0.02 | ) | ||||||||||||||
| From net realized gain on investments | - | - | - | (3.31 | ) | (1.67 | ) | (0.41 | ) | |||||||||||||||
| Total distributions | - | (0.06 | ) | (0.01 | ) | (3.31 | ) | (1.71 | ) | (0.43 | ) | |||||||||||||
| REDEMPTION FEES ADDED TO PAID-IN CAPITAL(b) | 0.00 | 0.00 | 0.00 | 0.00 | 0.00 | 0.00 | ||||||||||||||||||
| NET ASSET VALUE, END OF PERIOD/YEAR | $ | 16.49 | $ | 15.37 | $ | 14.82 | $ | 16.17 | $ | 23.31 | $ | 14.19 | ||||||||||||
| TOTAL RETURN(c) | 7.29 | %(d) | 4.11 | % | (8.30 | )% | (19.99 | )% | 77.81 | % | (3.09 | )% | ||||||||||||
| Net assets, at end of period/year (000s) | $ | 168,687 | $ | 187,699 | $ | 237,614 | $ | 287,502 | $ | 317,828 | $ | 200,988 | ||||||||||||
| Expenses (excluding fees waived/reimbursed by investment advisor) | 1.29 | %(e) | 1.30 | % | 1.26 | % | 1.25 | % | 1.27 | % | 1.27 | % | ||||||||||||
| Expenses (including fees waived/reimbursed by investment advisor) | 1.25 | %(e) | 1.25 | % | 1.25 | % | 1.24 | % | 1.27 | % | 1.27 | % | ||||||||||||
| Net investment income/(loss) | 1.16 | %(e) | 0.47 | % | 0.40 | % | (0.09 | )% | (0.14 | )% | 0.21 | % | ||||||||||||
| PORTFOLIO TURNOVER RATE | 26 | %(d) | 41 | % | 42 | % | 42 | % | 41 | % | 32 | % | ||||||||||||
| (a) | Per share numbers have been calculated using the average shares method. | |
| (b) | Less than $0.005 or ($0.005) per share. | |
| (c) | Total return in the above table is historical in nature and represents the rate that the investor would have earned or lost on an investment in the Fund assuming reinvestment of dividends and capital gain distributions, if any. Had the investment advisor not waived a portion of the Fund’s expenses in certain periods, total returns would have been lower. | |
| (d) | Not annualized. | |
| (e) | Annualized. |
See accompanying notes to financial statements.
56
| Grandeur Peak Global Stalwarts Fund | Financial Highlights |
For a Share Outstanding Throughout the Years or Period Presented
| Investor Class | Six Months Ended October 31, 2024 | Year Ended April 30, 2024 | Year Ended April 30, 2023 | Year Ended April 30, 2022 | Year Ended April 30, 2021 | Year Ended April 30, 2020 | ||||||||||||||||||
| (Unaudited) | ||||||||||||||||||||||||
| NET ASSET VALUE, BEGINNING OF PERIOD/YEAR | $ | 15.19 | $ | 14.47 | $ | 16.51 | $ | 23.26 | $ | 14.26 | $ | 14.83 | ||||||||||||
| INCOME FROM INVESTMENT OPERATIONS | ||||||||||||||||||||||||
| Net investment income/(loss)(a) | 0.00 | (c) | 0.01 | (0.01 | ) | (0.06 | ) | (0.04 | ) | (0.01 | )(b) | |||||||||||||
| Net realized and unrealized gain/(loss) on investments | 0.62 | 0.73 | (2.03 | ) | (4.21 | ) | 9.72 | 0.31 | ||||||||||||||||
| Total income/(loss) from investment operations | 0.62 | 0.74 | (2.04 | ) | (4.27 | ) | 9.68 | (0.32 | ) | |||||||||||||||
| DISTRIBUTIONS | ||||||||||||||||||||||||
| From net investment income | - | (0.02 | ) | - | - | - | (0.00 | )(c) | ||||||||||||||||
| From net realized gain on investments | - | - | - | (2.48 | ) | (0.68 | ) | (0.25 | ) | |||||||||||||||
| Total distributions | - | (0.02 | ) | - | (2.48 | ) | (0.68 | ) | (0.25 | ) | ||||||||||||||
| REDEMPTION FEES ADDED TO PAID-IN CAPITAL(c) | 0.00 | 0.00 | 0.00 | 0.00 | 0.00 | 0.00 | ||||||||||||||||||
| NET ASSET VALUE, END OF PERIOD/YEAR | $ | 15.81 | $ | 15.19 | $ | 14.47 | $ | 16.51 | $ | 23.26 | $ | 14.26 | ||||||||||||
| TOTAL RETURN(d) | 4.08 | %(d) | 5.09 | % | (12.36 | )% | (21.45 | )% | 68.36 | % | (2.22 | )% | ||||||||||||
| Net assets, at end of period/year (000s) | $ | 17,146 | $ | 19,194 | $ | 30,682 | $ | 51,984 | $ | 103,891 | $ | 85,310 | ||||||||||||
| Expenses (excluding fees waived/reimbursed by investment advisor) | 1.34 | %(e) | 1.27 | % | 1.21 | % | 1.17 | % | 1.21 | % | 1.24 | % | ||||||||||||
| Expenses (including fees waived/reimbursed by investment advisor) | 1.34 | %(e) | 1.27 | % | 1.21 | % | 1.17 | % | 1.21 | % | 1.24 | % | ||||||||||||
| Net investment income/(loss) | 0.03 | %(e) | 0.03 | % | (0.06 | )% | (0.24 | )% | (0.23 | )% | (0.10 | )% | ||||||||||||
| PORTFOLIO TURNOVER RATE | 35 | %(d) | 55 | % | 32 | % | 49 | % | 50 | % | 50 | % | ||||||||||||
| (a) | Per share numbers have been calculated using the average shares method. | |
| (b) | The per share amount does not correspond to activity reflected in the Statement of Operations due to class specific expenses during the period. | |
| (c) | Less than $0.005 or ($0.005) per share. | |
| (d) | Total return in the above table is historical in nature and represents the rate that the investor would have earned or lost on an investment in the Fund assuming reinvestment of dividends and capital gain distributions, if any. Had the investment advisor not waived a portion of the Fund’s expenses in certain periods, total returns would have been lower. | |
| (e) | Not annualized. | |
| (f) | Annualized. |
See accompanying notes to financial statements.
57
| Grandeur Peak Global Stalwarts Fund | Financial Highlights |
For a Share Outstanding Throughout the Years or Period Presented
| Institutional Class | Six Months Ended October 31, 2024 | Year Ended April 30, 2024 | Year Ended April 30, 2023 | Year Ended April 30, 2022 | Year Ended April 30, 2021 | Year Ended April 30, 2020 | ||||||||||||||||||
| (Unaudited) | ||||||||||||||||||||||||
| NET ASSET VALUE, BEGINNING OF PERIOD/YEAR | $ | 15.41 | $ | 14.69 | $ | 16.74 | $ | 23.50 | $ | 14.37 | $ | 14.93 | ||||||||||||
| INCOME FROM INVESTMENT OPERATIONS | ||||||||||||||||||||||||
| Net investment income/(loss)(a) | 0.02 | 0.04 | 0.03 | (0.00 | )(b) | 0.01 | 0.03 | |||||||||||||||||
| Net realized and unrealized gain/(loss) on investments | 0.64 | 0.74 | (2.05 | ) | (4.28 | ) | 9.80 | (0.31 | ) | |||||||||||||||
| Total income/(loss) from investment operations | 0.66 | 0.78 | (2.02 | ) | (4.28 | ) | 9.81 | (0.28 | ) | |||||||||||||||
| DISTRIBUTIONS | ||||||||||||||||||||||||
| From net investment income | - | (0.06 | ) | (0.03 | ) | - | - | (0.03 | ) | |||||||||||||||
| From net realized gain on investments | - | - | - | (2.48 | ) | (0.68 | ) | (0.25 | ) | |||||||||||||||
| Total distributions | - | (0.06 | ) | (0.03 | ) | (2.48 | ) | (0.68 | ) | (0.28 | ) | |||||||||||||
| REDEMPTION FEES ADDED TO PAID-IN CAPITAL(b) | 0.00 | 0.00 | 0.00 | 0.00 | 0.00 | 0.00 | ||||||||||||||||||
| NET ASSET VALUE, END OF PERIOD/YEAR | $ | 16.07 | $ | 15.41 | $ | 14.69 | $ | 16.74 | $ | 23.50 | $ | 14.37 | ||||||||||||
| TOTAL RETURN(c) | 4.28 | %(d) | 5.31 | % | (12.09 | )% | (21.26 | )% | 68.74 | % | (2.05 | )% | ||||||||||||
| Net assets, at end of period/year (000s) | $ | 103,150 | $ | 115,095 | $ | 167,932 | $ | 285,539 | $ | 263,711 | $ | 119,600 | ||||||||||||
| Expenses (excluding fees waived/reimbursed by investment advisor) | 1.09 | %(e) | 1.03 | % | 0.94 | % | 0.93 | % | 0.96 | % | 0.99 | % | ||||||||||||
| Expenses (including fees waived/reimbursed by investment advisor) | 1.09 | %(e) | 1.03 | % | 0.94 | % | 0.93 | % | 0.96 | % | 0.99 | % | ||||||||||||
| Net investment income/(loss) | 0.27 | %(e) | 0.28 | % | 0.21 | % | (0.01 | )% | 0.06 | % | 0.17 | % | ||||||||||||
| PORTFOLIO TURNOVER RATE | 35 | %(d) | 55 | % | 32 | % | 49 | % | 50 | % | 50 | % | ||||||||||||
| (a) | Per share numbers have been calculated using the average shares method. | |
| (b) | Less than $0.005 or ($0.005) per share. | |
| (c) | Total return in the above table is historical in nature and represents the rate that the investor would have earned or lost on an investment in the Fund assuming reinvestment of dividends and capital gain distributions, if any. Had the investment advisor not waived a portion of the Fund’s expenses in certain periods, total returns would have been lower. | |
| (d) | Not annualized. | |
| (e) | Annualized. |
See accompanying notes to financial statements.
58
| Grandeur Peak International Opportunities Fund | Financial Highlights |
For a Share Outstanding Throughout the Years or Period Presented
| Investor Class | Six Months Ended October 31, 2024 | Year Ended April 30, 2024 | Year Ended April 30, 2023 | Year Ended April 30, 2022 | Year Ended April 30, 2021 | Year Ended April 30, 2020 | ||||||||||||||||||
| (Unaudited) | ||||||||||||||||||||||||
| NET ASSET VALUE, BEGINNING OF PERIOD/YEAR | $ | 3.19 | $ | 3.36 | $ | 3.57 | $ | 5.17 | $ | 3.04 | $ | 3.34 | ||||||||||||
| INCOME FROM INVESTMENT OPERATIONS | ||||||||||||||||||||||||
| Net investment income/(loss)(a) | 0.02 | 0.01 | 0.01 | (0.01 | ) | (0.01 | ) | 0.00 | (b) | |||||||||||||||
| Net realized and unrealized gain/(loss) on investments | 0.04 | (0.16 | ) | (0.22 | ) | (0.94 | ) | 2.30 | (0.18 | ) | ||||||||||||||
| Total income/(loss) from investment operations | 0.06 | (0.15 | ) | (0.21 | ) | (0.95 | ) | 2.29 | (0.18 | ) | ||||||||||||||
| DISTRIBUTIONS | ||||||||||||||||||||||||
| From net investment income | - | (0.01 | ) | (0.00 | )(b) | - | (0.01 | ) | (0.00 | )(b) | ||||||||||||||
| From net realized gain on investments | - | (0.01 | ) | - | (0.65 | ) | (0.15 | ) | (0.12 | ) | ||||||||||||||
| Total distributions | - | (0.02 | ) | (0.00 | )(b) | (0.65 | ) | (0.16 | ) | (0.12 | ) | |||||||||||||
| REDEMPTION FEES ADDED TO PAID-IN CAPITAL(b) | 0.00 | 0.00 | 0.00 | 0.00 | 0.00 | 0.00 | ||||||||||||||||||
| NET ASSET VALUE, END OF PERIOD/YEAR | $ | 3.25 | $ | 3.19 | $ | 3.36 | $ | 3.57 | $ | 5.17 | $ | 3.04 | ||||||||||||
| TOTAL RETURN(c) | 1.88 | %(d) | (4.45 | )% | (5.85 | )% | (21.60 | )% | 75.87 | % | (5.79 | )% | ||||||||||||
| Net assets, at end of period/year (000s) | $ | 17,502 | $ | 20,177 | $ | 29,277 | $ | 40,835 | $ | 69,041 | $ | 41,351 | ||||||||||||
| Expenses (excluding fees waived/reimbursed by investment advisor) | 1.61 | %(e) | 1.64 | % | 1.60 | % | 1.60 | % | 1.60 | % | 1.61 | % | ||||||||||||
| Expenses (including fees waived/reimbursed by investment advisor) | 1.61 | %(e) | 1.61 | % | 1.55 | % | 1.48 | % | 1.53 | % | 1.58 | % | ||||||||||||
| Net investment income/(loss) | 1.32 | %(e) | 0.46 | % | 0.29 | % | (0.24 | )% | (0.27 | )% | 0.01 | % | ||||||||||||
| PORTFOLIO TURNOVER RATE | 15 | %(d) | 30 | % | 28 | % | 26 | % | 36 | % | 27 | % | ||||||||||||
| (a) | Per share numbers have been calculated using the average shares method. | |
| (b) | Less than $0.005 or ($0.005) per share. | |
| (c) | Total return in the above table is historical in nature and represents the rate that the investor would have earned or lost on an investment in the Fund assuming reinvestment of dividends and capital gain distributions, if any. Had the investment advisor not waived a portion of the Fund’s expenses in certain periods, total returns would have been lower. | |
| (d) | Not annualized. | |
| (e) | Annualized. |
See accompanying notes to financial statements.
59
| Grandeur Peak International Opportunities Fund | Financial Highlights |
For a Share Outstanding Throughout the Years or Period Presented
| Institutional Class | Six Months Ended October 31, 2024 | Year Ended April 30, 2024 | Year Ended April 30, 2023 | Year Ended April 30, 2022 | Year Ended April 30, 2021 | Year Ended April 30, 2020 | ||||||||||||||||||
| (Unaudited) | ||||||||||||||||||||||||
| NET ASSET VALUE, BEGINNING OF PERIOD/YEAR | $ | 3.23 | $ | 3.40 | $ | 3.61 | $ | 5.21 | $ | 3.06 | $ | 3.36 | ||||||||||||
| INCOME FROM INVESTMENT OPERATIONS | ||||||||||||||||||||||||
| Net investment income/(loss)(a) | 0.03 | 0.03 | 0.02 | (0.00 | )(b) | (0.00 | )(b) | 0.01 | ||||||||||||||||
| Net realized and unrealized gain/(loss) on investments | 0.03 | (0.17 | ) | (0.22 | ) | (0.95 | ) | 2.31 | (0.18 | ) | ||||||||||||||
| Total income/(loss) from investment operations | 0.06 | (0.14 | ) | (0.20 | ) | (0.95 | ) | 2.31 | (0.17 | ) | ||||||||||||||
| DISTRIBUTIONS | ||||||||||||||||||||||||
| From net investment income | - | (0.02 | ) | (0.01 | ) | (0.00 | )(b) | (0.01 | ) | (0.01 | ) | |||||||||||||
| From net realized gain on investments | - | (0.01 | ) | - | (0.65 | ) | (0.15 | ) | (0.12 | ) | ||||||||||||||
| Total distributions | - | (0.03 | ) | (0.01 | ) | (0.65 | ) | (0.16 | ) | (0.13 | ) | |||||||||||||
| REDEMPTION FEES ADDED TO PAID-IN CAPITAL(b) | 0.00 | 0.00 | 0.00 | 0.00 | 0.00 | 0.00 | ||||||||||||||||||
| NET ASSET VALUE, END OF PERIOD/YEAR | $ | 3.29 | $ | 3.23 | $ | 3.40 | $ | 3.61 | $ | 5.21 | $ | 3.06 | ||||||||||||
| TOTAL RETURN(c) | 1.86 | %(d) | (4.14 | )%(d) | (5.61 | )% | (21.38 | )% | 76.29 | % | (5.60 | )% | ||||||||||||
| Net assets, at end of period/year (000s) | $ | 410,898 | $ | 482,557 | $ | 603,848 | $ | 657,165 | $ | 904,059 | $ | 473,820 | ||||||||||||
| Expenses (excluding fees waived/reimbursed by investment advisor) | 1.36 | %(e) | 1.39 | % | 1.36 | % | 1.35 | % | 1.36 | % | 1.37 | % | ||||||||||||
| Expenses (including fees waived/reimbursed by investment advisor) | 1.36 | %(e) | 1.36 | % | 1.31 | % | 1.23 | % | 1.28 | % | 1.34 | % | ||||||||||||
| Net investment income/(loss) | 1.57 | %(e) | 0.71 | % | 0.51 | % | (0.01 | )% | (0.02 | )% | 0.24 | % | ||||||||||||
| PORTFOLIO TURNOVER RATE | 15 | %(d) | 30 | % | 28 | % | 26 | % | 36 | % | 27 | % | ||||||||||||
| (a) | Per share numbers have been calculated using the average shares method. | |
| (b) | Less than $0.005 or ($0.005) per share. | |
| (c) | Total return in the above table is historical in nature and represents the rate that the investor would have earned or lost on an investment in the Fund assuming reinvestment of dividends and capital gain distributions, if any. Had the investment advisor not waived a portion of the Fund’s expenses in certain periods, total returns would have been lower. | |
| (d) | Includes adjustments in accordance with accounting principles generally accepted in the United States and, consequently, the net asset value for financial reporting purposes and the returns based upon those net asset values may differ from the net asset values and returns for shareholder transactions. | |
| (d) | Not annualized. | |
| (e) | Annualized. |
See accompanying notes to financial statements.
60
| Grandeur Peak International Stalwarts Fund | Financial Highlights |
For a Share Outstanding Throughout the Years or Period Presented
| Investor Class | Six Months Ended October 31, 2024 | Year Ended April 30, 2024 | Year Ended April 30, 2023 | Year Ended April 30, 2022 | Year Ended April 30, 2021 | Year Ended April 30, 2020 | ||||||||||||||||||
| (Unaudited) | ||||||||||||||||||||||||
| NET ASSET VALUE, BEGINNING OF PERIOD/YEAR | $ | 16.56 | $ | 16.51 | $ | 17.91 | $ | 24.05 | $ | 14.40 | $ | 14.70 | ||||||||||||
| INCOME FROM INVESTMENT OPERATIONS | ||||||||||||||||||||||||
| Net investment income/(loss)(a) | 0.06 | 0.08 | 0.05 | (0.03 | ) | (0.00 | )(b) | 0.01 | ||||||||||||||||
| Net realized and unrealized gain/(loss) on investments | 0.08 | 0.07 | (1.44 | ) | (3.93 | ) | 9.70 | (0.29 | ) | |||||||||||||||
| Total income/(loss) from investment operations | 0.14 | 0.15 | (1.39 | ) | (3.96 | ) | 9.70 | (0.28 | ) | |||||||||||||||
| DISTRIBUTIONS | ||||||||||||||||||||||||
| From net investment income | - | (0.10 | ) | (0.01 | ) | - | - | (0.02 | ) | |||||||||||||||
| From net realized gain on investments | - | - | - | (2.18 | ) | (0.05 | ) | - | ||||||||||||||||
| Total distributions | - | (0.10 | ) | (0.01 | ) | (2.18 | ) | (0.05 | ) | (0.02 | ) | |||||||||||||
| REDEMPTION FEES ADDED TO PAID-IN CAPITAL(b) | 0.00 | 0.00 | 0.00 | 0.00 | 0.00 | 0.00 | ||||||||||||||||||
| NET ASSET VALUE, END OF PERIOD/YEAR | $ | 16.70 | $ | 16.56 | $ | 16.51 | $ | 17.91 | $ | 9.65 | $ | 14.40 | ||||||||||||
| TOTAL RETURN(c) | 0.85 | %(d) | 0.86 | % | (7.73 | )% | (19.07 | )% | 67.36 | % | (1.91 | )% | ||||||||||||
| Net assets, at end of period/year (000s) | $ | 16,208 | $ | 20,407 | $ | 31,075 | $ | 51,250 | $ | 67,688 | $ | 82,289 | ||||||||||||
| Expenses (excluding fees waived/reimbursed by investment advisor) | 1.15 | %(e) | 1.17 | % | 1.15 | % | 1.14 | % | 1.15 | % | 1.17 | % | ||||||||||||
| Expenses (including fees waived/reimbursed by investment advisor) | 1.15 | %(e) | 1.17 | % | 1.15 | % | 1.14 | % | 1.15 | % | 1.17 | % | ||||||||||||
| Net investment income/(loss) | 0.68 | %(e) | 0.51 | % | 0.32 | % | (0.13 | )% | (0.01 | )% | 0.04 | % | ||||||||||||
| PORTFOLIO TURNOVER RATE | 27 | %(d) | 54 | % | 32 | % | 43 | % | 33 | % | 32 | % | ||||||||||||
| (a) | Per share numbers have been calculated using the average shares method. | |
| (b) | Less than $0.005 or ($0.005) per share. | |
| (c) | Total return in the above table is historical in nature and represents the rate that the investor would have earned or lost on an investment in the Fund assuming reinvestment of dividends and capital gain distributions, if any. Had the investment advisor not waived a portion of the Fund’s expenses in certain periods, total returns would have been lower. | |
| (d) | Not annualized. | |
| (e) | Annualized. |
See accompanying notes to financial statements.
61
| Grandeur Peak International Stalwarts Fund | Financial Highlights |
For a Share Outstanding Throughout the Years or Period Presented
| Institutional Class | Six Months Ended October 31, 2024 | Year Ended April 30, 2024 | Year Ended April 30, 2023 | Year Ended April 30, 2022 | Year Ended April 30, 2021 | Year Ended April 30, 2020 | ||||||||||||||||||
| (Unaudited) | ||||||||||||||||||||||||
| NET ASSET VALUE, BEGINNING OF PERIOD/YEAR | $ | 16.72 | $ | 16.67 | $ | 18.06 | $ | 24.19 | $ | 14.46 | $ | 14.74 | ||||||||||||
| INCOME FROM INVESTMENT OPERATIONS | ||||||||||||||||||||||||
| Net investment income(a) | 0.07 | 0.12 | 0.09 | 0.03 | 0.06 | 0.05 | ||||||||||||||||||
| Net realized and unrealized gain/(loss) on investments | 0.08 | 0.08 | (1.44 | ) | (3.98 | ) | 9.75 | (0.29 | ) | |||||||||||||||
| Total income/(loss) from investment operations | 0.15 | 0.20 | (1.35 | ) | (3.95 | ) | 9.81 | (0.24 | ) | |||||||||||||||
| DISTRIBUTIONS | ||||||||||||||||||||||||
| From net investment income | - | (0.15 | ) | (0.04 | ) | (0.00 | )(b) | (0.03 | ) | (0.04 | ) | |||||||||||||
| From net realized gain on investments | - | - | - | (2.18 | ) | (0.05 | ) | - | ||||||||||||||||
| Total distributions | - | (0.15 | ) | (0.04 | ) | (2.18 | ) | (0.08 | ) | (0.04 | ) | |||||||||||||
| REDEMPTION FEES ADDED TO PAID-IN CAPITAL(b) | 0.00 | 0.00 | 0.00 | 0.00 | 0.00 | 0.00 | ||||||||||||||||||
| NET ASSET VALUE, END OF PERIOD/YEAR | $ | 16.87 | $ | 16.72 | $ | 16.67 | $ | 18.06 | $ | 9.73 | $ | 14.46 | ||||||||||||
| TOTAL RETURN(c) | 0.90 | %(d) | 1.13 | % | (7.45 | )% | (18.90 | )% | 67.84 | % | (1.63 | )% | ||||||||||||
| Net assets, at end of period/year (000s) | $ | 1,619,236 | $ | 1,554,863 | $ | 1,697,892 | $ | 1,583,122 | $ | 1,966,043 | $ | 870,916 | ||||||||||||
| Expenses (excluding fees waived/reimbursed by investment advisor) | 0.89 | %(e) | 0.92 | % | 0.90 | % | 0.89 | % | 0.90 | % | 0.92 | % | ||||||||||||
| Expenses (including fees waived/reimbursed by investment advisor) | 0.89 | %(e) | 0.92 | % | 0.90 | % | 0.89 | % | 0.90 | % | 0.92 | % | ||||||||||||
| Net investment income | 0.85 | %(e) | 0.72 | % | 0.55 | % | 0.13 | % | 0.31 | % | 0.32 | % | ||||||||||||
| PORTFOLIO TURNOVER RATE | 27 | %(d) | 54 | % | 32 | % | 43 | % | 33 | % | 32 | % | ||||||||||||
| (a) | Per share numbers have been calculated using the average shares method. | |
| (b) | Less than $0.005 or ($0.005) per share. | |
| (c) | Total return in the above table is historical in nature and represents the rate that the investor would have earned or lost on an investment in the Fund assuming reinvestment of dividends and capital gain distributions, if any. Had the investment advisor not waived a portion of the Fund’s expenses in certain periods, total returns would have been lower. | |
| (d) | Not annualized. | |
| (e) | Annualized. |
See accompanying notes to financial statements.
62
| Grandeur Peak US Stalwarts Fund | Financial Highlights |
For a Share Outstanding Throughout the Years or Periods Presented
| Investor Class | Six Months Ended October 31, 2024 | Year Ended April 30, 2024 | Year Ended April 30, 2023 | Year Ended April 30, 2022 | Year Ended April 30, 2021 | Period Ended April 30, 2020(a) | ||||||||||||||||||
| (Unaudited) | ||||||||||||||||||||||||
| NET ASSET VALUE, BEGINNING OF PERIOD/YEAR | $ | 18.00 | $ | 15.73 | $ | 17.65 | $ | 22.71 | $ | 13.15 | $ | 10.00 | ||||||||||||
| INCOME FROM INVESTMENT OPERATIONS | ||||||||||||||||||||||||
| Net investment income/(loss)(b) | (0.01 | ) | (0.01 | ) | (0.01 | ) | (0.03 | ) | (0.06 | ) | (0.01 | ) | ||||||||||||
| Net realized and unrealized gain/(loss) on investments | 1.67 | 2.28 | (1.91 | ) | (4.62 | ) | 9.73 | 3.16 | ||||||||||||||||
| Total income/(loss) from investment operations | 1.66 | 2.27 | (1.92 | ) | (4.65 | ) | 9.67 | 3.15 | ||||||||||||||||
| DISTRIBUTIONS | ||||||||||||||||||||||||
| From net investment income | - | - | (0.00 | )(c) | - | - | - | |||||||||||||||||
| From net realized gain on investments | - | - | - | (0.42 | ) | (0.11 | ) | - | ||||||||||||||||
| Total distributions | - | - | (0.00 | )(c) | (0.42 | ) | (0.11 | ) | - | |||||||||||||||
| REDEMPTION FEES ADDED TO PAID-IN CAPITAL | 0.00 | (c) | 0.00 | (c) | 0.00 | (c) | 0.01 | 0.00 | (c) | 0.00 | (c) | |||||||||||||
| NET ASSET VALUE, END OF PERIOD/YEAR | $ | 19.66 | $ | 18.00 | $ | 15.73 | $ | 17.65 | $ | 9.56 | $ | 13.15 | ||||||||||||
| TOTAL RETURN(d) | 9.22 | %(e) | 14.43 | % | (10.87 | )% | (20.93 | )% | 73.67 | % | 31.50 | %(e) | ||||||||||||
| Net assets, at end of period/year (000s) | $ | 139,558 | $ | 126,631 | $ | 104,459 | $ | 131,534 | $ | 126,106 | $ | 9,421 | ||||||||||||
| Expenses (excluding fees waived/reimbursed by investment advisor) | 0.92 | %(f) | 0.90 | % | 0.90 | % | 0.91 | % | 1.11 | % | 6.23 | %(f)(g) | ||||||||||||
| Expenses (including fees waived/reimbursed by investment advisor) | 0.92 | %(f) | 0.90 | % | 0.90 | % | 0.91 | % | 1.00 | % | 1.00 | %(f)(g) | ||||||||||||
| Net investment income/(loss) | (0.16 | )%(f) | (0.06 | )% | (0.07 | )% | (0.14 | )% | 0.30 | % | (0.53 | )%(f) | ||||||||||||
| PORTFOLIO TURNOVER RATE | 44 | %(e) | 60 | % | 56 | % | 31 | % | 24 | % | 2 | %(e) | ||||||||||||
| (a) | The Fund commenced on March 19, 2020 and reorganized into the Trust on October 20, 2023. | |
| (b) | Per share numbers have been calculated using the average shares method. | |
| (b) | The per share amount does not correspond to activity reflected in the Statement of Operations due to class specific expenses during the period. | |
| (c) | Less than $0.005 or ($0.005) per share. | |
| (d) | Total return in the above table is historical in nature and represents the rate that the investor would have earned or lost on an investment in the Fund assuming reinvestment of dividends and capital gain distributions, if any. Had the investment advisor not waived a portion of the Fund’s expenses in certain periods, total returns would have been lower. | |
| (e) | Not annualized. | |
| (f) | Annualized. | |
| (g) | Expense ratios during startup periods may not be representative of longer term operating periods. |
See accompanying notes to financial statements.
63
| Grandeur Peak Funds® | Notes to Financial Statements |
| October 31, 2024 (Unaudited) |
| 1. | ORGANIZATION |
The Grandeur Peak Emerging Markets Opportunities Fund, Grandeur Peak Global Contrarian Fund, Grandeur Peak Global Micro Cap Fund, Grandeur Peak Global Opportunities Fund, Grandeur Peak Global Reach Fund, Grandeur Peak Global Stalwarts Fund, Grandeur Peak International Opportunities Fund, Grandeur Peak International Stalwarts Fund and Grandeur Peak US Stalwarts Fund are diversified series of shares of beneficial interest and Grandeur Peak Global Explorer Fund, (each a “Fund” and collectively the “Funds”) a non-diversified series of shares of beneficial interest of Grandeur Peak Global Trust, (the “Trust”), a statutory trust organized under the laws of the State of Delaware on October 6, 2023, and registered under the Investment Company Act of 1940, as amended (the “1940 Act”), as an open-end management investment company. Each Fund reorganized on October 20, 2023 from a series of Financial Investors Trust (the “Predecessor Funds”) their predecessor fund to a series of Grandeur Peak Global Trust. Each Fund seeks long-term growth of capital. The inception date of each Fund is listed in the table below.
| Fund | Inception Date | |
| Grandeur Peak Emerging Markets Opportunities Fund | December 16, 2013 | |
| Grandeur Peak Global Contrarian Fund | September 17, 2019 | |
| Grandeur Peak Global Explorer Fund | December 16, 2021 | |
| Grandeur Peak Global Micro Cap Fund | October 20, 2015 | |
| Grandeur Peak Global Opportunities Fund | October 17, 2011 | |
| Grandeur Peak Global Reach Fund | June 19, 2013 | |
| Grandeur Peak Global Stalwarts Fund | September 1, 2015 | |
| Grandeur Peak International Opportunities Fund | October 17, 2011 | |
| Grandeur Peak International Stalwarts Fund | September 1, 2015 | |
| Grandeur Peak US Stalwarts Fund | March 19, 2020 |
The Funds offer Institutional Class shares. The Grandeur Peak Emerging Markets Fund, Grandeur Peak Global Opportunities Fund, Grandeur Peak Global Reach Fund, Grandeur Peak Global Stalwarts Fund, Grandeur Peak International Opportunities Fund and Grandeur Peak International Stalwarts Fund also offer Investor Class shares. All classes of shares for each of the Funds have identical rights to earnings, assets and voting privileges, except for class-specific expenses and exclusive rights to vote on matters affecting only individual classes.
| 2. | SUMMARY OF SIGNIFICANT ACCOUNTING POLICIES |
The following is a summary of significant accounting policies followed by the Funds in preparation of their financial statements. The policies are in conformity with generally accepted accounting principles in the United States of America (“GAAP”). The preparation of the financial statements requires management to make estimates and assumptions that affect the reported amounts of assets and liabilities and disclosure of contingent assets and liabilities at the date of the financial statements and the reported amounts of income and expenses for the year then ended. Actual results could differ from those estimates. Each Fund is an investment company and accordingly follows the investment company accounting and reporting guidance of the Financial Accounting Standards Board (“FASB”) Accounting Standards Codification Topic 946 “Financial Services Investment Companies,” including Accounting Standards Update 2013-08.
a. Investment Valuation – The Funds record their investments at fair value. In determining each Fund’s Net Asset Value (“NAV”) per share as of the close of the New York Stock Exchange (“NYSE”), currently 4:00 pm Eastern Time (“ET”) (the “Valuation Time”), securities traded on one or more securities exchanges. for which market quotations are readily available are valued at current market value using the last reported sales price. NASDAQ traded securities are valued using the NASDAQ Official Closing Price (“NOCP”). If no sale price is reported, the mean between the current bid and ask is used. Securities not traded or dealt in on any securities exchange and for which over-the-counter market (whether domestic or foreign) quotations are readily available generally shall be valued at the last sale price or, in the absence of a sale, at the current mean price on such over-the-counter market, (and if there is only a bid or only an ask price on such date, valuation will be at such bid or ask price for long or short positions, respectively).
The value of foreign currencies and of foreign securities whose value is quoted or calculated in a foreign currency shall be converted into US dollars based on foreign exchange rates provided by a major banking institution(s) or currency dealer(s) selected by the pricing agent providing such price, or by the advisor in the case of securities for which the advisor provides a fair value determination, at 4:00 pm ET or the nearest time prior to the Valuation Time, at which such foreign currency quotations are available.
The Funds may invest in warrants to participate in an anticipated increase in the market value of the security. A warrant entitles the holder to buy a security at a set price during a set period of time. If such market value increases, the warrant may be exercised and sold at a gain. A loss will be incurred if the market value decreases or if the term of the warrant expires before it is exercised. Warrants convey no rights to dividends or voting. An implied pricing method is used to value the rights.
64
| Grandeur Peak Funds® | Notes to Financial Statements |
| October 31, 2024 (Unaudited) |
When such prices or quotations are not available, or when Grandeur Peak Global Advisers, LLC (the “Advisor”) believes that they are unreliable, securities may be priced using the Trust’s fair value procedures.
Money market-type instruments that have a remaining maturity of 60 days or less are valued at bid prices from a pricing vendor, unless the Advisor believes another valuation is more appropriate.
Forward currency contracts shall be valued at the forward currency contract rates, determined at 4:00 pm ET or the nearest time prior to the Valuation Time, provided by a bank or dealer that the pricing agent or, if applicable, the Advisor believes to be reliable.
The Funds may hold investments, such as private investments, interests in commodity pools, other non-traded securities or temporarily illiquid securities, for which market quotations are not readily available or are determined to be unreliable. These securities will be valued using the “fair value” procedures approved by the Board of Trustees (the “Board”). The Board has designated the Advisor as its valuation designee (the “Valuation Designee”) for the execution of these procedures. The Board may also enlist third party consultants such a valuation specialist at a public accounting firm, valuation consultant or financial officer of a security issuer on an as-needed basis to assist the Valuation Designee in determining a security-specific fair value. The Board is responsible for reviewing and approving fair value methodologies utilized by the Valuation Designee, which approval shall be based upon whether the Valuation Designee followed the valuation procedures established by the Board.
Fair Valuation Process – Applicable investments are valued by the Valuation Designee pursuant to valuation procedures established by the Board. For example, fair value determinations are required for the following securities: (i) securities for which market quotations are insufficient or not readily available on a particular business day (including securities for which there is a short and temporary lapse in the provision of a price by the regular pricing source); (ii) securities for which, in the judgment of the Valuation Designee, the prices or values available do not represent the fair value of the instrument; factors which may cause the Valuation Designee to make such a judgment include, but are not limited to, the following: only a bid price or an asked price is available; the spread between bid and asked prices is substantial; the frequency of sales; the thinness of the market; the size of reported trades; and actions of the securities markets, such as the suspension or limitation of trading; (iii) securities determined to be illiquid; and (iv) securities with respect to which an event that will affect the value thereof has occurred (a “significant event”) since the closing prices were established on the principal exchange on which they are traded, but prior to a Fund’s calculation of its net asset value. Specifically, interests in commodity pools or managed futures pools are valued on a daily basis by reference to the closing market prices of each futures contract or other asset held by a pool, as adjusted for pool expenses. Restricted or illiquid investments, such as private investments or non-traded securities are valued based upon the current bid for the security from two or more independent dealers or other parties reasonably familiar with the facts and circumstances of the security (who should take into consideration all relevant factors as may be appropriate under the circumstances). If a current bid from such independent dealers or other independent parties is unavailable, the Valuation Designee shall determine, the fair value of such security using the following factors: (i) the type of security; (ii) the cost at date of purchase; (iii) the size and nature of a Fund’s holdings; (iv) the discount from market value of unrestricted securities of the same class at the time of purchase and subsequent thereto; (v) information as to any transactions or offers with respect to the security; (vi) the nature and duration of restrictions on disposition of the security and the existence of any registration rights; (vii) how the yield of the security compares to similar securities of companies of similar or equal creditworthiness; (viii) the level of recent trades of similar or comparable securities; (ix) the liquidity characteristics of the security; (x) current market conditions; and (xi) the market value of any securities into which the security is convertible or exchangeable.
The Funds utilize various methods to measure the fair value of most of their investments on a recurring basis. GAAP establishes a hierarchy that prioritizes inputs to valuation methods. The three levels of input are:
Level 1 – Unadjusted quoted prices in active markets for identical assets and liabilities.
Level 2 – Observable inputs other than quoted prices included in Level 1 that are observable for the asset or liability, either directly or indirectly. These inputs may include quoted prices for the identical instrument on an inactive market, prices for similar instruments, interest rates, prepayment speeds, credit risk, yield curves, default rates and similar data.
Level 3 – Unobservable inputs for the asset or liability, to the extent relevant observable inputs are not available, representing the Funds’ own assumptions about the assumptions a market participant would use in valuing the asset or liability, and would be based on the best information available.
The availability of observable inputs can vary from security to security and is affected by a wide variety of factors, including, for example, the type of security, whether the security is new and not yet established in the marketplace, the liquidity of markets and other characteristics particular to the security. To the extent that valuation is based on models or inputs that are less observable or unobservable in the market, the determination of fair value requires more judgment. Accordingly, the degree of judgment exercised in determining fair value is greatest for instruments categorized in Level 3.
65
| Grandeur Peak Funds® | Notes to Financial Statements |
| October 31, 2024 (Unaudited) |
The inputs used to measure fair value may fall into different levels of the fair value hierarchy. In such cases, for disclosure purposes, the level in the fair value hierarchy within which the fair value measurement falls in its entirety, is determined based on the lowest level input that is significant to the fair value measurement in its entirety. The inputs or methodology used for valuing securities are not necessarily an indication of the risk associated with investing in those securities.
The inputs or methodology used for valuing securities are not necessarily an indication of the risk associated with investing in those securities. The following tables summarize the inputs used for the six months ended as of October 31, 2024, for the Funds’ assets and liabilities measured at fair value:
| Investments in Securities at Value | Level 1 | Level 2 | Level 3 | Total | ||||||||||||
| Grandeur Peak Emerging Markets Opportunities Fund | ||||||||||||||||
| Common Stocks* | $ | 83,284,438 | $ | 222,023,319 | $ | - | $ | 305,307,757 | ||||||||
| Total | $ | 83,284,438 | $ | 222,023,319 | $ | - | $ | 305,307,757 | ||||||||
| Investments in Securities at Value | Level 1 | Level 2 | Level 3 | Total | ||||||||||||
| Grandeur Peak Global Contrarian Fund | ||||||||||||||||
| Common Stocks* | $ | 68,424,383 | $ | 85,501,724 | $ | - | $ | 153,926,107 | ||||||||
| Total | $ | 68,424,383 | $ | 85,501,724 | $ | - | $ | 153,926,107 | ||||||||
| Investments in Securities at Value | Level 1 | Level 2 | Level 3 | Total | ||||||||||||
| Grandeur Peak Global Explorer Fund | ||||||||||||||||
| Common Stocks* | $ | 5,876,954 | $ | 6,415,540 | $ | - | $ | 12,292,494 | ||||||||
| Total | $ | 5,876,954 | $ | 6,415,540 | $ | - | $ | 12,292,494 | ||||||||
| Investments in Securities at Value | Level 1 | Level 2 | Level 3 | Total | ||||||||||||
| Grandeur Peak Global Micro Cap Fund | ||||||||||||||||
| Common Stocks* | $ | 16,287,487 | $ | 28,523,093 | $ | - | $ | 44,810,580 | ||||||||
| Total | $ | 16,287,487 | $ | 28,523,093 | $ | - | $ | 44,810,580 | ||||||||
| Investments in Securities at Value | Level 1 | Level 2 | Level 3 | Total | ||||||||||||
| Grandeur Peak Global Opportunities Fund | ||||||||||||||||
| Common Stocks* | $ | 242,370,386 | $ | 336,883,713 | $ | - | $ | 579,254,099 | ||||||||
| Total | $ | 242,370,386 | $ | 336,883,713 | $ | - | $ | 579,254,099 | ||||||||
| Investments in Securities at Value | Level 1 | Level 2 | Level 3 | Total | ||||||||||||
| Grandeur Peak Global Reach Fund | ||||||||||||||||
| Common Stocks* | $ | 87,623,767 | $ | 97,819,610 | $ | 731,724 | $ | 186,175,101 | ||||||||
| Exchange-Traded Funds | 415,228 | - | - | 415,228 | ||||||||||||
| Preferred Stocks | - | - | 980,126 | 980,126 | ||||||||||||
| Total | $ | 88,038,995 | $ | 97,819,610 | $ | 1,711,850 | $ | 187,570,455 | ||||||||
| Investments in Securities at Value | Level 1 | Level 2 | Level 3 | Total | ||||||||||||
| Grandeur Peak Global Stalwarts Fund | ||||||||||||||||
| Common Stocks* | $ | 60,532,210 | $ | 56,901,420 | $ | 951,242 | $ | 118,384,872 | ||||||||
| Preferred Stocks | - | - | 1,144,165 | 1,144,165 | ||||||||||||
| Total | $ | 60,532,210 | $ | 56,901,420 | $ | 2,095,407 | $ | 119,529,037 | ||||||||
66
| Grandeur Peak Funds® | Notes to Financial Statements |
| October 31, 2024 (Unaudited) |
| Investments in Securities at Value | Level 1 | Level 2 | Level 3 | Total | ||||||||||||
| Grandeur Peak International Opportunities Fund | ||||||||||||||||
| Common Stocks* | $ | 107,812,151 | $ | 318,117,783 | $ | - | $ | 425,929,934 | ||||||||
| Total | $ | 107,812,151 | $ | 318,117,783 | $ | - | $ | 425,929,934 | ||||||||
| Investments in Securities at Value | Level 1 | Level 2 | Level 3 | Total | ||||||||||||
| Grandeur Peak International Stalwarts Fund | ||||||||||||||||
| Common Stocks* | $ | 440,884,477 | $ | 1,182,389,597 | $ | - | $ | 1,623,274,074 | ||||||||
| Total | $ | 440,884,477 | $ | 1,182,389,597 | $ | - | $ | 1,623,274,074 | ||||||||
| Investments in Securities at Value | Level 1 | Level 2 | Level 3 | Total | ||||||||||||
| Grandeur Peak US Stalwarts Fund | ||||||||||||||||
| Common Stocks* | $ | 129,478,863 | $ | 7,181,205 | $ | 512,201 | $ | 137,172,269 | ||||||||
| Preferred Stocks | - | - | 626,088 | 626,088 | ||||||||||||
| Total | $ | 129,478,863 | $ | 7,181,205 | $ | 1,138,289 | $ | 137,798,357 | ||||||||
| * | For a detailed country breakdown, see the accompanying Schedule of Investments. |
The following is a reconciliation of the investments in which significant unobservable inputs (Level 3) were used in determining fair value:
| Grandeur Peak Global Reach Fund | Common Stocks | Preferred Stocks | Total | |||||||||
| Balance as of April 30, 2024 | $ | 731,724 | $ | 980,126 | $ | 1,711,850 | ||||||
| Realized Gain (Loss) | - | - | - | |||||||||
| Change in Unrealized Appreciation (Depreciation) | - | - | - | |||||||||
| Purchases | - | - | - | |||||||||
| Sales Proceeds | - | - | - | |||||||||
| Transfer in/out Level 3 | - | - | - | |||||||||
| Balance as of October 31, 2024 | $ | 731,724 | $ | 980,126 | $ | 1,711,850 | ||||||
| Net change in unrealized appreciation (depreciation) included in the Statements of Operations attributable to Level 3 investments held at October 31, 2024 | $ | - | $ | - | $ | - | ||||||
| Grandeur Peak Global Stalwarts Fund | Common Stocks | Preferred Stocks | Total | |||||||||
| Balance as of April 30, 2024 | $ | 951,242 | $ | 1,144,165 | $ | 2,095,407 | ||||||
| Realized Gain (Loss) | - | - | - | |||||||||
| Change in Unrealized Appreciation (Depreciation) | - | - | - | |||||||||
| Purchases | - | - | - | |||||||||
| Sales Proceeds | - | - | - | |||||||||
| Transfer in/out Level 3 | - | - | - | |||||||||
| Balance as of October 31, 2024 | $ | 951,242 | $ | 1,144,165 | $ | 2,095,407 | ||||||
| Net change in unrealized appreciation/(depreciation) included in the Statements of Operations attributable to Level 3 investments held at October 31, 2024 | $ | - | $ | - | $ | - | ||||||
| Grandeur Peak US Stalwarts Fund | Common Stocks | Preferred Stocks | Total | |||||||||
| Balance as of April 30, 2024 | $ | 512,201 | $ | 626,088 | $ | 1,138,289 | ||||||
| Realized Gain (Loss) | - | - | - | |||||||||
| Change in Unrealized Appreciation (Depreciation) | - | - | - | |||||||||
| Purchases | - | - | - | |||||||||
| Sales Proceeds | - | - | - | |||||||||
| Transfer in/out Level 3 | - | - | - | |||||||||
| Balance as of October 31, 2024 | $ | 512,201 | $ | 626,088 | $ | 1,138,289 | ||||||
| Net change in unrealized appreciation (depreciation) included in the Statements of Operations attributable to Level 3 investments held at October 31, 2024 | $ | - | $ | - | $ | - | ||||||
67
| Grandeur Peak Funds® | Notes to Financial Statements |
| October 31, 2024 (Unaudited) |
The table below provides additional information about the Level 3 Fair Value Measurements as of October 31, 2024:
Quantitative Information about Level 3 Fair Value Measurements
Grandeur Peak Global Reach Fund
| Asset Class | Fair Value (USD) at 10/31/24 | Valuation Technique | Unobservable Inputs(a) | Value/Range | ||||||
| Common Stocks | $ | 731,724 | Discounted/Third-Party Valuation | Third Party Valuation | Discounted Partnership Interest/27.94% | |||||
| Preferred Stocks | $ | 980,126 | Market Approach | Enterprise Value-to-Sales Multiple | 4.80x | |||||
Grandeur Peak Global Stalwarts Fund
| Asset Class | Fair Value (USD) at 10/31/24 | Valuation Technique | Unobservable Inputs(a) | Value/Range | ||||||
| Common Stocks | $ | 951,242 | Discounted/Third-Party Valuation | Third Party Valuation | Discounted Partnership Interest/27.94% | |||||
| Preferred Stocks | $ | 1,144,165 | Market Approach | Enterprise Value-to-Sales Multiple | 4.80x | |||||
Grandeur Peak US Stalwarts Fund
| Asset Class | Fair Value (USD) at 10/31/24 | Valuation Technique | Unobservable Inputs(a) | Value/Range | ||||||
| Common Stocks | $ | 512,201 | Discounted/Third-Party Valuation | Third Party Valuation | Discounted Partnership Interest/27.94% | |||||
| Preferred Stocks | $ | 626,088 | Market Approach | Enterprise Value-to-Sales Multiple | 4.80x | |||||
b. Exchange Traded Funds – The Funds may invest in exchange traded funds (“ETFs”). ETFs are a type of fund bought and sold on a securities exchange. An ETF trades like common stock and represents a fixed portfolio of securities. The risks of owning an ETF generally reflect the risks of owning the underlying securities they are designed to track, although the lack of liquidity in an ETF could result in it being more volatile. Additionally, ETFs have fees and expenses that reduce their value.
c. Security Transactions and Related Income – Security transactions are accounted for on a trade date basis. Interest income is recognized on an accrual basis. Discounts are accreted and premiums are amortized on securities purchased over the lives of the respective securities using the effective interest method. Dividend income is recorded on the ex-dividend date. Realized gains or losses from sales of securities are determined by comparing the identified cost of the security lot sold with the net sales proceeds.
d. Foreign Securities Risk – Investing in securities of foreign issuers and currency transactions may involve certain considerations and risks not typically associated with investments in the United States. These risks include revaluation of currencies, adverse fluctuations in foreign currency values and possible adverse political, social and economic developments, including those particular to a specific industry, country or region. These conditions could cause the securities and their markets to be less liquid and prices more volatile than those of comparable US companies and US government securities.
e. Foreign Currency Translations – The books and records of the Funds are maintained in US dollars. The market values of securities which are not traded in US currency are recorded in the financial statements after translation to US dollars based on the applicable exchange rates at the end of the period. The costs of such securities are translated at exchange rates prevailing when acquired. Related interest, dividends and withholding taxes are accrued at the rates of exchange prevailing on the respective dates of such transactions.
68
| Grandeur Peak Funds® | Notes to Financial Statements |
| October 31, 2024 (Unaudited) |
Net realized gains and losses on foreign currency transactions represent net gains and losses from currency realized between the trade and settlement dates on securities transactions and the difference between income accrued versus income received. The effect of changes in foreign currency exchange rates on investments in securities are included with the net realized and unrealized gain or loss on investment securities.
f. Forward Foreign Currency Contracts – As foreign securities are purchased and sold, the Funds may enter into forward foreign currency contracts in order to hedge against foreign currency exchange rate risks. The market value of the contracts fluctuate with changes in currency exchange rates. The contract is marked-to-market daily and the change in market value is recorded by the Funds as an unrealized gain or loss. As foreign securities are sold, a portion of the contract is generally closed and the Funds record a realized gain or loss equal to the difference between the value of the contract at the time it was opened and the value at the time it was closed.
A Fund investing in forward foreign currency contracts is exposed to risk if the value of the currency changes unfavorably, if the counterparties to the contracts are unable to meet the terms of their contracts or if the Fund is unable to enter into a closing position. There were no forward foreign currency contracts outstanding as of October 31, 2024.
g. Special Purpose Vehicle – The Funds may invest in a Special Purpose Vehicle (a “SPV”). A SPV is a separate legal entity created by an organization. An SPV is a distinct company with its own assets and liabilities, as well as its own legal status. Usually, they are created for a specific objective, often to isolate financial risk. As it is a separate legal entity, if the parent company goes bankrupt, the special purpose vehicle can carry on.
h. Cash Management Transactions – The Funds subscribe to the Brown Brothers Harriman & Co. (“BBH”) Cash Management Service (“CMS”), whereby cash balances are automatically swept into overnight offshore demand deposits with either the BBH Grand Cayman branch or a branch of a pre-approved commercial bank. This fully automated program allows the Funds to earn interest on cash balances. Excess cash with deposit institutions domiciled outside of the U.S. are subject to sovereign actions in the jurisdiction of the deposit institution including, but not limited to, freeze, seizure or diminution. Cash balances in the BBH CMS are included on the Statements of Assets and Liabilities under Cash and Foreign Cash, at Value. As of October 31, 2024, the Funds had the following cash balances participating in the BBH CMS:
| Fund | ||||
| Grandeur Peak Emerging Markets Opportunities Fund | $ | 1,556,997 | ||
| Grandeur Peak Global Contrarian Fund | 233,218 | |||
| Grandeur Peak Global Explorer Fund | 43,250 | |||
| Grandeur Peak Global Micro Cap Fund | - | |||
| Grandeur Peak Global Opportunities Fund | 1,615,445 | |||
| Grandeur Peak Global Reach Fund | 849,226 | |||
| Grandeur Peak Global Stalwarts Fund | - | |||
| Grandeur Peak International Opportunities Fund | - | |||
| Grandeur Peak International Stalwarts Fund | 16,025,367 | |||
| Grandeur Peak US Stalwarts Fund | 1,683,175 | |||
As of October 31, 2024, the Funds had the following foreign cash balances participating in the BBH CMS (cost and value of foreign cash balances are equal):
| Fund | ||||
| Grandeur Peak Emerging Markets Opportunities Fund | $ | - | ||
| Grandeur Peak Global Contrarian Fund | 57,201 | |||
| Grandeur Peak Global Explorer Fund | 32 | |||
| Grandeur Peak Global Micro Cap Fund | - | |||
| Grandeur Peak Global Opportunities Fund | 5,369 | |||
| Grandeur Peak Global Reach Fund | 31 | |||
| Grandeur Peak Global Stalwarts Fund | 2,589 | |||
| Grandeur Peak International Opportunities Fund | 5,525 | |||
| Grandeur Peak International Stalwarts Fund | 38,342 | |||
| Grandeur Peak US Stalwarts Fund | 14 | |||
i. Federal Income Taxes – It is each Fund’s policy to continue to comply with all sections of the Internal Revenue Code applicable to regulated investment companies and to distribute all of its taxable income and gains, if any, to its shareholders and therefore, no provision for federal income tax has been made. Each Fund is treated as a separate taxpayer for federal income tax purposes. The Funds recognize the tax benefits of uncertain tax positions only when the position is “more likely than not” to be sustained assuming examination by tax authorities. Management has analyzed the Funds’ tax positions and has concluded that no liability for unrecognized tax benefits should be recorded related to uncertain tax positions taken on returns filed for open tax years of 2022 through 2024, or expected to be taken in the Funds’ April 30, 2025 year-end tax returns. The Funds identify
69
| Grandeur Peak Funds® | Notes to Financial Statements |
| October 31, 2024 (Unaudited) |
their major tax jurisdiction as US federal, Ohio and foreign jurisdictions where a Fund makes significant investments. No Fund is aware of any tax positions for which it is reasonably possible that the total amounts of unrecognized tax benefits will change materially in the next twelve months. The Funds recognize interest and penalties, if any, related to unrecognized tax benefits as income tax expense in the Statements of Operations. During the six months ended October 31, 2024, the Funds did not incur any interest or penalties.
j. Distributions to Shareholders – It is each Fund’s policy to distribute its respective net investment income and net capital gains, if any, annually. Distributions of net investment income and net capital gains are determined in accordance with income tax regulations which may differ from GAAP. Differences in dividends from net investment income per share between the classes are due to service and distribution related expenses. Dividends and distributions to shareholders are recorded on the ex-date.
k. Class Accounting – Each class represents an interest in the same assets of a Fund and classes are identical except for differences in their sales charge structures, ongoing service fees and distribution charges. All classes of shares of a Fund have equal voting privileges with respect to such Fund except that each class has exclusive voting rights with respect to its service and/or distribution plans. A Fund’s income, expenses (other than class specific distribution and service fees) and realized and unrealized gains and losses are allocated proportionately each day based upon the relative net assets of each class of such Fund.
l. Foreign Taxes – Withholding taxes on foreign dividends have been provided for in accordance with the Trust’s understanding of the applicable country’s tax rules and rates. Each Fund may be subject to foreign taxes (a portion of which may be reclaimable) on income.
During the year ended April 30, 2024, Grandeur Peak Emerging Markets Opportunities Fund, Grandeur Peak Global Contrarian Fund, Grandeur Peak Global Explorer Fund, Grandeur Peak Global Opportunities Fund and Grandeur Peak Global Reach Fund incurred a capital gain tax for securities held in India during the reorganization of the Funds as the reorganization is being considered a realized event for foreign institutional investors; such amounts are included in the Statements of Operations under Net Realized Gain (Loss) from Investments.
m. Indemnification – The Trust indemnifies its officers and the Board for certain liabilities that may arise from the performance of their duties to the Trust. Additionally, in the normal course of business, the Funds enter into contracts that contain a variety of representations and warranties and which provide general indemnities. The Funds’ maximum exposure under these arrangements is unknown, as this would involve future claims that may be made against the Funds that have not yet occurred. However, based on experience, the risk of loss due to these warranties and indemnities appears to be remote.
n. Expenses – Expenses of the Trust that are directly identifiable to a specific fund are charged to that fund. Expenses which are not readily identifiable to a specific fund, are allocated in such a manner as deemed equitable, taking into consideration the nature and type of expense and the relative sizes of the funds in the Trust.
o. Market Risk – The value of each Fund’s portfolio holdings may fluctuate in response to events specific to the companies or markets in which the Fund invests, as well as economic, political, or social events in the United States or abroad. Each Fund is subject to the risk that the securities markets will move down, sometimes rapidly and unpredictably, based on overall economic conditions and other factors, which may negatively affect the Fund’s performance. Securities markets may experience long periods of decline in value.
Local, state, regional, national or global events such as war, acts of terrorism, the spread of infectious illness or other public health issues, recessions, or other events could have a significant impact on a Fund and its investments and could result in decreases to the Fund’s net asset value. Political, geopolitical, natural and other events, including war, terrorism, trade disputes, government shutdowns, market closures, natural and environmental disasters, climate change and climate-related events, epidemics, pandemics and other public health crises and related events and governments’ reactions to such events have led, and in the future may lead, to economic uncertainty, decreased economic activity, increased market volatility and other disruptive effects on U.S. and global economies and markets. Such events may have significant adverse direct or indirect effects on a Fund and its investments. For example, a widespread health crisis such as a global pandemic could cause substantial market volatility, exchange trading suspensions and closures, impact the ability to complete redemptions, and affect Fund performance. A health crisis may exacerbate other preexisting political, social and economic risks. In addition, the increasing interconnectedness of markets around the world may result in many markets being affected by events or conditions in a single country or region or events affecting a single or small number of issuers.
| 3. | INVESTMENT ADVISORY AGREEMENT AND TRANSACTIONS WITH RELATED PARTIES |
a. Management Fees – The Advisor serves as each Fund’s investment advisor. Pursuant to an investment advisory agreement with the Trust, on behalf of the Funds, the Advisor, subject to the oversight of the Board and in conformity with the stated policies of the Funds, manages all business activities of the Funds. As compensation for its services, each Fund pays the Advisor an annual management fee based on each Fund’s average daily net assets, accrued daily and paid monthly. The following table reflects the Funds’ advisory fee rates.
70
| Grandeur Peak Funds® | Notes to Financial Statements |
| October 31, 2024 (Unaudited) |
| Fund | Advisory Fee | |||
| Grandeur Peak Emerging Markets Opportunities Fund | 1.35 | % | ||
| Grandeur Peak Global Contrarian Fund | 1.00 | % | ||
| Grandeur Peak Global Explorer Fund | 1.10 | % | ||
| Grandeur Peak Global Micro Cap Fund | 1.50 | % | ||
| Grandeur Peak Global Opportunities Fund | 1.25 | % | ||
| Grandeur Peak Global Reach Fund | 1.10 | % | ||
| Grandeur Peak Global Stalwarts Fund | 0.80 | % | ||
| Grandeur Peak International Opportunities Fund | 1.25 | % | ||
| Grandeur Peak International Stalwarts Fund | 0.80 | % | ||
| Grandeur Peak US Stalwarts Fund | 0.75 | % | ||
Pursuant to an operating expense limitation agreement between the Advisor and the Trust, the Advisor has agreed to waive its fees and/or expenses for each Fund to the extent necessary to maintain each Fund’s Total Annual Fund Operating Expenses (excluding any front-end or contingent deferred loads, brokerage fees and commissions, acquired fund fees and expenses, borrowing costs (such as interest and dividend expense on securities sold short), taxes, and extraordinary expenses, such as litigation expenses (which may increase indemnification of the Funds’ officers and trustees, contractual indemnification of the Funds’ service providers (other than the Advisor))) at a certain level through September 1, 2025. This operating expense limitation agreement can be terminated only by, or with the consent of, the Board. The Advisor is permitted to receive reimbursement from a Fund for fees it waived and Fund expenses it paid, subject to the limitation that: (1) the reimbursement for fees and expenses will be made only if payable within three years from the date the fees and expenses were initially waived or paid; and (2) the reimbursement may not be made if it would cause the expense limitation currently in effect or in effect at the time of the waiver or payment, whichever is lower, to be exceeded. The following table reflects each Fund’s expense cap.
| Fund | Expense Cap | |||
| Grandeur Peak Emerging Markets Opportunities Fund | ||||
| Investor Class | 1.95 | % | ||
| Institutional Class | 1.70 | % | ||
| Grandeur Peak Global Contrarian Fund | ||||
| Institutional Class | 1.35 | % | ||
| Grandeur Peak Global Explorer Fund | ||||
| Institutional Class | 1.25 | % | ||
| Grandeur Peak Global Micro Cap Fund | ||||
| Institutional Class | 2.00 | % | ||
| Grandeur Peak Global Opportunities Fund | ||||
| Investor Class | 1.75 | % | ||
| Institutional Class | 1.50 | % | ||
| Grandeur Peak Global Reach Fund | ||||
| Investor Class | 1.50 | % | ||
| Institutional Class | 1.25 | % | ||
| Grandeur Peak Global Stalwarts Fund | ||||
| Investor Class | 1.35 | % | ||
| Institutional Class | 1.10 | % | ||
| Grandeur Peak International Opportunities Fund | ||||
| Investor Class | 1.75 | % | ||
| Institutional Class | 1.50 | % | ||
| Grandeur Peak International Stalwarts Fund | ||||
| Investor Class | 1.35 | % | ||
| Institutional Class | 1.10 | % | ||
| Grandeur Peak US Stalwarts Fund | ||||
| Institutional Class | 1.00 | % | ||
In addition to the foregoing contractual arrangements, the Advisor has contractually agreed to waive, with respect to the Grandeur Peak Global Opportunities Fund and the Grandeur Peak International Opportunities Fund, annual management fees to the extent such fees exceed 1.00% on assets above $500 million (the annual management fee rate with respect to such Funds will remain 1.25% on the first $500 million in assets). Additionally, the Advisor has contractually agreed to waive, with respect to the Grandeur Peak Emerging Markets Opportunities Fund, annual management fees to the extent such fees exceed 1.00% on all assets above $400 million (the annual management fee rate with respect to the Fund
71
| Grandeur Peak Funds® | Notes to Financial Statements |
| October 31, 2024 (Unaudited) |
will remain 1.35% on the first $400 million in assets). Previously, the Advisor had voluntarily agreed, effective January 1, 2018, to waive, with respect to the Grandeur Peak Emerging Markets Opportunities Fund, annual management fees to the extent such fees exceed 1.20% on all assets above $400 million (the annual management fee rate with respect to the Fund will remain 1.35% on the first $400 million in assets). These additional contractual waivers are not subject to recoupment by the Advisor. Additional fees waived by the Advisor for the six months ended October 31, 2024 are disclosed in the Statements of Operations.
As of October 31, 2024, the fee waivers/reimbursements and/or recoupments were as follows:
| Fund | Fees Waived/ Reimbursed By Advisor | Recoupment of Previously Waived Fees by Advisor | ||||||
| Grandeur Peak Emerging Markets Opportunities Fund | $ | - | $ | - | ||||
| Grandeur Peak Global Contrarian Fund | - | 4,570 | ||||||
| Grandeur Peak Global Explorer Fund | 60,984 | - | ||||||
| Grandeur Peak Global Micro Cap Fund | - | 3,837 | ||||||
| Grandeur Peak Global Opportunities Fund | 99,559 | - | ||||||
| Grandeur Peak Global Reach Fund | 36,685 | - | ||||||
| Grandeur Peak Global Stalwarts Fund | - | - | ||||||
| Grandeur Peak International Opportunities Fund | 7,886 | - | ||||||
| Grandeur Peak International Stalwarts Fund | - | - | ||||||
| Grandeur Peak US Stalwarts Fund | - | - | ||||||
As of October 31, 2024, the Advisor has waived/reimbursed expenses that may be recovered no later than April 30 of the years indicated below:
| Fund | Expires 2025 | Expires 2026 | Expires 2027 | Total | ||||||||||||
| Grandeur Peak Emerging Markets Opportunities Fund | $ | - | $ | - | $ | - | $ | - | ||||||||
| Grandeur Peak Global Contrarian Fund | 4,570 | - | - | 4,570 | ||||||||||||
| Grandeur Peak Global Explorer Fund | 39,713 | 280,910 | 230,004 | 550,627 | ||||||||||||
| Grandeur Peak Global Micro Cap Fund | - | - | 3,837 | 3,837 | ||||||||||||
| Grandeur Peak Global Opportunities Fund | - | - | - | - | ||||||||||||
| Grandeur Peak Global Reach Fund | 49,396 | 28,389 | 119,486 | 197,271 | ||||||||||||
| Grandeur Peak Global Stalwarts Fund | - | - | - | - | ||||||||||||
| Grandeur Peak International Opportunities Fund | - | - | - | - | ||||||||||||
| Grandeur Peak International Stalwarts Fund | - | - | - | - | ||||||||||||
| Grandeur Peak US Stalwarts Fund | - | - | - | - | ||||||||||||
Each Fund was reorganized on October 20, 2023 from a series of Financial Investors Trust to a series of the Trust (the “Reorganizations”). Prior to the Reorganizations, the Funds had advisory and expense limitation agreements with Financial Investors Trust. The fees charged to the Funds did not change as a result of the Reorganizations and the amounts waived by the Predecessor Funds are still subject to recapture by the Advisor.
b. Distributor – The Distributor of the Funds is Northern Lights Distributors, LLC (the “Distributor”). The Trust has adopted, with respect to the Funds, the Trust’s Master Distribution and Shareholder Servicing Plan for the Funds’ Investor Class shares (the “Plan”) pursuant to Rule 12b-1 under the 1940 Act, to pay for certain distribution activities and shareholder services. The Plan provides a monthly service and/or distribution fee that is calculated at an annual rate of 0.25% per year of the average daily net assets of each Fund’s Investor Class shares and paid to the Distributor to be used to pay for distribution and shareholder servicing activities. The following table reflects the Funds incurred distribution fees for the six months ended October 31, 2024.
| Fund | Distribution Fees | |||
| Grandeur Peak Emerging Markets Opportunities Fund | $ | 8,826 | ||
| Grandeur Peak Global Contrarian Fund | - | |||
| Grandeur Peak Global Explorer Fund | - | |||
| Grandeur Peak Global Micro Cap Fund | - | |||
| Grandeur Peak Global Opportunities Fund | 52,333 | |||
| Grandeur Peak Global Reach Fund | 25,628 | |||
| Grandeur Peak Global Stalwarts Fund | 23,701 | |||
| Grandeur Peak International Opportunities Fund | 24,599 | |||
| Grandeur Peak International Stalwarts Fund | 24,156 | |||
| Grandeur Peak US Stalwarts Fund | - | |||
72
| Grandeur Peak Funds® | Notes to Financial Statements |
| October 31, 2024 (Unaudited) |
c. Administration, Fund Accounting and Transfer Agency Fees
Administrator Fees and Expenses
Ultimus Fund Solutions, LLC (“UFS”) – UFS, an affiliate of the Distributor, provides administration, fund accounting, and transfer agent services to the Trust. Pursuant to a separate servicing agreement with UFS, the Funds pays UFS customary fees for providing administration, fund accounting and transfer agency services to the Funds. Certain officers of the Trust are also officers of UFS and are not paid any fees directly by the Funds for serving in such capacities.
Compliance Services
Northern Lights Compliance Services, LLC (“NLCS”) – NLCS, an affiliate of UFS and the Distributor, provides a Chief Compliance Officer to the Trust, as well as related compliance services, pursuant to a consulting agreement between NLCS and the Trust. Under the terms of such agreement, NLCS receives customary fees from the Funds.
Printing Services
BluGiant, LLC (“BluGiant”) – BluGiant, an affiliate of UFS and the Distributor, provides EDGAR conversion and filing services as well as print management services for the Funds on an ad-hoc basis. For the provision of these services, BluGiant receives customary fees from the Funds.
| 4. | INVESTMENT TRANSACTIONS |
The cost of purchases and the proceeds from sales of investments, other than short-term investments, for the six months ended October 31, 2024 were as follows:
| Fund | Purchases of Securities | Proceeds From Sales of Securities | ||||||
| Grandeur Peak Emerging Markets Opportunities Fund | $ | 47,666,761 | $ | 82,389,146 | ||||
| Grandeur Peak Global Contrarian Fund | 45,221,886 | 43,464,481 | ||||||
| Grandeur Peak Global Explorer Fund | 2,928,694 | 3,222,554 | ||||||
| Grandeur Peak Global Micro Cap Fund | 7,099,990 | 9,517,242 | ||||||
| Grandeur Peak Global Opportunities Fund | 145,538,269 | 126,077,975 | ||||||
| Grandeur Peak Global Reach Fund | 51,880,986 | 78,575,784 | ||||||
| Grandeur Peak Global Stalwarts Fund | 45,381,281 | 66,425,163 | ||||||
| Grandeur Peak International Opportunities Fund | 71,955,418 | 153,446,157 | ||||||
| Grandeur Peak International Stalwarts Fund | 528,541,911 | 441,810,999 | ||||||
| Grandeur Peak US Stalwarts Fund | 56,979,201 | 56,731,673 | ||||||
| 5. | SHARES OF BENEFICIAL INTEREST |
The capitalization of the Trust consists of an unlimited number of shares of beneficial interest with no par value per share. Holders of the shares of the Funds of the Trust have one vote for each share held and a proportionate fraction of a vote for each fractional share. All shares issued and outstanding are fully paid and are transferable and redeemable at the option of the shareholder. Purchasers of the share do not have any obligation to make payments to the Trust or its creditors solely by reason of the purchasers’ ownership of the shares. Shares have no pre-emptive rights.
Shares redeemed within 60 days of purchase may incur a 2% short-term redemption fee deducted from the redemption amount. For the six months ended October 31, 2024, the redemption fees charged by the Funds are presented in the Statement of Changes in Net Assets.
73
| Grandeur Peak Funds® | Notes to Financial Statements |
| October 31, 2024 (Unaudited) |
| 6. | DISTRIBUTIONS AND TAX COMPONENTS OF CAPITAL |
The Statement of Assets and Liabilities represents cost for financial reporting purposes. The aggregate cost for federal tax purposes is listed in the table below and differs from market value by net unrealized appreciation (depreciation) which consisted of:
| Fund | Tax Cost | Gross Unrealized Appreciation | Gross Unrealized Depreciation | Net Unrealized Appreciation/ (Depreciation) | ||||||||||||
| Grandeur Peak Emerging Markets Opportunities Fund | $ | 251,999,950 | $ | 75,463,806 | $ | (22,155,999 | ) | $ | 53,307,807 | |||||||
| Grandeur Peak Global Contrarian Fund | 142,208,575 | 28,835,648 | (17,118,116 | ) | 11,717,532 | |||||||||||
| Grandeur Peak Global Explorer Fund | 12,220,433 | 1,735,716 | (1,663,655 | ) | 72,061 | |||||||||||
| Grandeur Peak Global Micro Cap Fund | 39,568,145 | 9,535,329 | (4,292,894 | ) | 5,242,435 | |||||||||||
| Grandeur Peak Global Opportunities Fund | 496,248,502 | 118,298,020 | (35,292,423 | ) | 83,005,597 | |||||||||||
| Grandeur Peak Global Reach Fund | 151,379,269 | 44,514,817 | (8,323,631 | ) | 36,191,186 | |||||||||||
| Grandeur Peak Global Stalwarts Fund | 102,957,262 | 24,680,016 | (8,108,241 | ) | 16,571,775 | |||||||||||
| Grandeur Peak International Opportunities Fund | 370,347,707 | 99,954,703 | (44,372,476 | ) | 55,582,227 | |||||||||||
| Grandeur Peak International Stalwarts Fund | 1,469,511,908 | 294,167,290 | (140,405,124 | ) | 153,762,166 | |||||||||||
| Grandeur Peak US Stalwarts Fund | 120,983,644 | 24,093,040 | (7,278,327 | ) | 16,814,713 | |||||||||||
The tax character of Fund distributions paid for the years ended April 30, 2024, and April 30, 2023, was as follows:
For fiscal year ended 4/30/2024 | | Ordinary Income | | | Long-Term Capital Gains | | | Return of Capital | | | Total | | ||||
| Grandeur Peak Emerging Markets Opportunities Fund | $ | 5,695,054 | $ | 10,549,000 | $ | - | $ | 16,244,054 | ||||||||
| Grandeur Peak Global Contrarian Fund | 2,725,193 | - | - | 2,725,193 | ||||||||||||
| Grandeur Peak Global Explorer Fund | 79,438 | - | - | 79,438 | ||||||||||||
| Grandeur Peak Global Micro Cap Fund | - | - | - | - | ||||||||||||
| Grandeur Peak Global Opportunities Fund | 4,350,706 | - | - | 4,350,706 | ||||||||||||
| Grandeur Peak Global Reach Fund | 837,240 | - | - | 837,240 | ||||||||||||
| Grandeur Peak Global Stalwarts Fund | 573,492 | - | - | 573,492 | ||||||||||||
| Grandeur Peak International Opportunities Fund | 2,921,691 | 2,265,788 | - | 5,187,479 | ||||||||||||
| Grandeur Peak International Stalwarts Fund | 13,350,670 | - | - | 13,350,670 | ||||||||||||
| Grandeur Peak US Stalwarts Fund | - | - | - | - | ||||||||||||
| For fiscal year ended 4/30/2023 | | Ordinary Income | | | Long-Term Capital Gains | | | Return of Capital | | | Total | | ||||
| Grandeur Peak Emerging Markets Opportunities Fund | $ | 926,920 | $ | 316,164 | $ | - | $ | 1,243,084 | ||||||||
| Grandeur Peak Global Contrarian Fund | 1,928,652 | 574,678 | - | 2,503,330 | ||||||||||||
| Grandeur Peak Global Explorer Fund | 24,043 | - | - | 24,043 | ||||||||||||
| Grandeur Peak Global Micro Cap Fund | - | - | - | - | ||||||||||||
| Grandeur Peak Global Opportunities Fund | 691,880 | 10,505,369 | - | 11,197,249 | ||||||||||||
| Grandeur Peak Global Reach Fund | 128,741 | - | - | 128,741 | ||||||||||||
| Grandeur Peak Global Stalwarts Fund | - | - | 323,040 | 323,040 | ||||||||||||
| Grandeur Peak International Opportunities Fund | 1,295,306 | - | - | 1,295,306 | ||||||||||||
| Grandeur Peak International Stalwarts Fund | 3,960,284 | - | - | 3,960,284 | ||||||||||||
| Grandeur Peak US Stalwarts Fund | 13,503 | - | - | 13,503 | ||||||||||||
74
| Grandeur Peak Funds® | Notes to Financial Statements |
| October 31, 2024 (Unaudited) |
As of April 30, 2024, the components of accumulated earnings/(deficit) on a tax basis were as follows:
| | | Undistributed Ordinary Income | | | Undistributed Long-Term Capital Gains | | | Post October Loss and Late Year Loss | | | Capital Loss Carry Forwards | | | Other Book/Tax Differences | | | Unrealized Appreciation/ (Depreciation) | | | Total Distributable Earnings/(Losses) | | |||||||
| Grandeur Peak Emerging Markets Opportunities Fund | $ | 13,209 | $ | 2,573,671 | $ | - | $ | - | $ | - | $ | 49,936,425 | $ | 52,523,305 | ||||||||||||||
| Grandeur Peak Global Contrarian Fund | 3,628,337 | - | - | (1,559,770 | ) | - | 5,061,875 | 7,130,442 | ||||||||||||||||||||
| Grandeur Peak Global Explorer Fund | 50,487 | - | - | (1,986,857 | ) | - | (370,783 | ) | (2,307,153 | ) | ||||||||||||||||||
| Grandeur Peak Global Micro Cap Fund | 229,086 | - | - | (1,878,080 | ) | - | 4,044,918 | 2,395,924 | ||||||||||||||||||||
| Grandeur Peak Global Opportunities Fund | 1,375,112 | - | - | (562,116 | ) | - | 75,346,571 | 76,159,567 | ||||||||||||||||||||
| Grandeur Peak Global Reach Fund | 1,121,672 | 3,718,343 | - | - | - | 26,298,061 | 31,138,076 | |||||||||||||||||||||
| Grandeur Peak Global Stalwarts Fund | - | - | (86,769 | ) | (33,506,294 | ) | - | 20,849,420 | (12,743,643 | ) | ||||||||||||||||||
| Grandeur Peak International Opportunities Fund | 3,889,071 | 3,613,624 | - | - | - | 42,466,034 | 49,968,729 | |||||||||||||||||||||
| Grandeur Peak International Stalwarts Fund | 4,229,334 | - | - | (122,762,705 | ) | - | 195,613,308 | 77,079,937 | ||||||||||||||||||||
| Grandeur Peak US Stalwarts Fund | - | - | (119,176 | ) | (31,859,843 | ) | - | 14,904,487 | (17,074,532 | ) | ||||||||||||||||||
The difference between book basis and tax basis undistributed net investment income/(loss), accumulated net realized gain/(loss), and unrealized appreciation/(depreciation) from investments is primarily attributable to the tax deferral of losses on wash sales and passive foreign investment companies, and adjustments for partnerships. The unrealized appreciation (depreciation) in the table above includes unrealized foreign currency gains (losses) as noted below:
| Unrealized | ||||
| Foreign Currency Gains/(Losses) | ||||
| Grandeur Peak Emerging Markets Opportunities Fund | $ | (12,630 | ) | |
| Grandeur Peak Global Contrarian Fund | (4,285 | ) | ||
| Grandeur Peak Global Explorer Fund | (385 | ) | ||
| Grandeur Peak Global Micro Cap Fund | (2,774 | ) | ||
| Grandeur Peak Global Opportunities Fund | (32,191 | ) | ||
| Grandeur Peak Global Reach Fund | (5,842 | ) | ||
| Grandeur Peak Global Stalwarts Fund | (6,367 | ) | ||
| Grandeur Peak International Opportunities Fund | (47,279 | ) | ||
| Grandeur Peak International Stalwarts Fund | (108,522 | ) | ||
| Grandeur Peak US Stalwarts Fund | 97 | |||
Late year losses incurred after December 31 within the fiscal year are deemed to arise on the first business day of the following fiscal year for tax purposes. Grandeur Peak Global Stalwarts Fund and Grandeur Peak US Stalwarts Fund incurred and elected to defer such late year losses of $86,769 and $119,176, respectively.
75
| Grandeur Peak Funds® | Notes to Financial Statements |
| October 31, 2024 (Unaudited) |
At April 30, 2024, the Funds had capital loss carry forwards for federal income tax purposes available to offset future capital gains, and capital loss carryforwards utilized as follows:
| | | Non-expiring Short-Term | | | Non-expiring Long-Term | | | Total | | | CLCF Utilized | | ||||
| Grandeur Peak Emerging Markets Opportunities Fund | $ | - | $ | - | $ | - | $ | - | ||||||||
| Grandeur Peak Global Contrarian Fund | 114,832 | 1,444,938 | 1,559,770 | 7,889,267 | ||||||||||||
| Grandeur Peak Global Explorer Fund | 865,803 | 1,121,054 | 1,986,857 | - | ||||||||||||
| Grandeur Peak Global Micro Cap Fund | 1,878,080 | - | 1,878,080 | 810,812 | ||||||||||||
| Grandeur Peak Global Opportunities Fund | 562,116 | - | 562,116 | 11,672,770 | ||||||||||||
| Grandeur Peak Global Reach Fund | - | - | - | 7,965,843 | ||||||||||||
| Grandeur Peak Global Stalwarts Fund | 33,506,294 | - | 33,506,294 | - | ||||||||||||
| Grandeur Peak International Opportunities Fund | - | - | - | 10,966,568 | ||||||||||||
| Grandeur Peak International Stalwarts Fund | 92,731,799 | 30,030,906 | 122,762,705 | - | ||||||||||||
| Grandeur Peak US Stalwarts Fund | 20,339,004 | 11,520,839 | 31,859,843 | - | ||||||||||||
During the fiscal period ended April 30, 2024, certain of the Funds utilized tax equalization which is the use of earnings and profits distributions to shareholders on redemption of shares as part of the dividends paid deduction for income tax purposes. Permanent book and tax differences, primarily attributable to the book/tax basis treatment of non-deductible expenses, net operating losses, distributions in excess, and use of tax equalization credits, resulted in reclassifications for the Funds for the fiscal year ended April 30, 2024, as follows:
| Distributable | ||||||||
| Paid In Capital | Earnings/ (Losses) | |||||||
| Grandeur Peak Emerging Markets Opportunities Fund | $ | 1,624,304 | $ | (1,624,304 | ) | |||
| Grandeur Peak Global Contrarian Fund | - | - | ||||||
| Grandeur Peak Global Explorer Fund | (11,628 | ) | 11,628 | |||||
| Grandeur Peak Global Micro Cap Fund | - | - | ||||||
| Grandeur Peak Global Opportunities Fund | - | - | ||||||
| Grandeur Peak Global Reach Fund | 111,304 | (111,304 | ) | |||||
| Grandeur Peak Global Stalwarts Fund | (59,903 | ) | 59,903 | |||||
| Grandeur Peak International Opportunities Fund | 150,750 | (150,750 | ) | |||||
| Grandeur Peak International Stalwarts Fund | (6,485 | ) | 6,485 | |||||
| Grandeur Peak US Stalwarts Fund | (35,667 | ) | 35,667 | |||||
| 7. | CONTROL OWNERSHIP |
The beneficial ownership, either directly or indirectly, of 25% or more of the outstanding shares of a fund creates a presumption of control of the fund under Section 2(a)(9) of the 1940 Act. Such control may affect the voting rights of other shareholders. The following table provides the name and address of any person who owns of record or beneficially 25% or more of the outstanding shares of each class of a Fund as of October 31, 2024:
| Fund | Shareholder Name | Percentage of Interest | ||||
| Grandeur Peak Emerging Markets Opportunities Fund | National Financial Services, LLC | 48.3 | % | |||
| Grandeur Peak Global Contrarian Fund | Charles Schwab & Co. Inc. | 52.0 | % | |||
| National Financial Services, LLC | 27.5 | % | ||||
| Grandeur Peak Global Explorer Fund | Grandeur Peak Global Advisors, LLC | 33.9 | % | |||
| Charles Schwab & Co. Inc. | 32.4 | % | ||||
| Grandeur Peak Global Micro Cap Fund | N/A | N/A | ||||
| Grandeur Peak Global Opportunities Fund | Charles Schwab & Co. Inc. | 38.7 | % | |||
| Grandeur Peak Global Reach Fund | Charles Schwab & Co. Inc. | 29.0 | % | |||
| Edward D Jones Co. | 25.4 | % | ||||
| Grandeur Peak Global Stalwarts Fund | National Financial Services, LLC | 35.0 | % | |||
| Charles Schwab & Co. Inc. | 31.5 | % | ||||
| Grandeur Peak International Opportunities Fund | National Financial Services, LLC | 26.0 | % | |||
| Grandeur Peak International Stalwarts Fund | N/A | N/A | ||||
| Grandeur Peak US Stalwarts Fund | Charles Schwab & Co. Inc. | 50.7 | % | |||
| Saxon & Co. FBO Allerton Foundation | 39.5 | % | ||||
| 8. | SUBSEQUENT EVENTS |
Subsequent events after the date of the Statements of Assets and Liabilities have been evaluated through the date the financial statements were issued. Management has determined that no events or transactions occurred requiring adjustment or disclosure in the financial statements.
76
| Grandeur Peak Funds® | Notes to Financial Statements |
| October 31, 2024 (Unaudited) |
Effective January 1, 2025, the Adviser has voluntarily agreed to waive a portion of the management fees through December 31, 2025, for the Funds listed below.
| Fund | Waiver |
| Grandeur Peak Emerging Markets Opportunities Fund | 0.10% |
| Grandeur Peak Global Explorer Fund | 0.10% |
| Grandeur Peak Global Opportunities Fund | 0.10% |
| Grandeur Peak Global Reach Fund | 0.10% |
| Grandeur Peak International Opportunities Fund | 0.10% |
| Grandeur Peak Global Stalwarts Fund | 0.05% |
| Grandeur Peak International Stalwarts Fund | 0.05% |
| Grandeur Peak US Stalwarts Fund | 0.05% |
77
| Grandeur Peak Funds® | Additional Information |
| October 31, 2024 (Unaudited) |
1. FUND HOLDINGS
Each Fund files its complete schedule of portfolio holdings with the Securities and Exchange Commission (SEC) for the first and third quarters of each fiscal year as an exhibit to its reports on Form N-PORT, within sixty days after the end of the period. The Funds’ Form N-PORT reports are available on the SEC’s Web site at http://www.sec.gov. The Funds’ Form N-PORT reports are also available upon request by calling 1-877-314-9006.
2. FUND PROXY VOTING POLICIES, PROCEDURES AND SUMMARIES
The Funds’ policies and procedures used in determining how to vote proxies and information regarding how the Funds voted proxies relating to portfolio securities during the most recent prior 12-month period ending June 30 are available without charge, upon request, by calling 1-877-314-9006 or by referring to the SEC’s website at http://www.sec.gov.
78

Item 8. Changes in and Disagreements with Accountants for Open-End Management Investment Companies.
Not applicable.
Item 9. Proxy Disclosures for Open-End Management Investment Companies.
Not applicable.
Item 10. Remuneration Paid to Directors, Officers, and Others of Open-End Management Investment Companies.
Included under Item 7
Item 11. Statement Regarding Basis for Approval of Investment Advisory Contract.
Included under Item 7
Item 12. Disclosure of Proxy Voting Policies and Procedures for Closed-End Management Investment Companies.
Not applicable.
Item 13. Portfolio Managers of Closed-End Management Investment Companies.
Not applicable.
Item 14. Purchases of Equity Securities by Closed-End Management Investment Company and Affiliated Purchasers.
Not applicable.
Item 15. Submission of Matters to a Vote of Security Holders.
None
Item 16. Controls and Procedures
| (a) | The registrant’s Principal Executive Officer and Principal Financial Officer have concluded that the registrant’s disclosure controls and procedures (as defined in Rule 30a-3(c) under the Act) are effective in design and operation as of a date within 90 days of this report on Form N-CSR, based on their evaluation of these disclosure controls and procedures as required by Rule 30a-3(b) under the Act. |
| (b) | There were no changes in the registrant’s internal control over financial reporting (as defined in Rule 30a-3(d) under the Act) during the period covered by this report that have materially affected, or are reasonably likely to materially affect, the registrant’s internal control over financial reporting. |
Item 17. Disclosure of Securities Lending Activities for Closed-End Management Investment Companies.
Not applicable.
Item 18. Recovery of Erroneously Awarded Compensation.
| (a) | Not applicable. |
| (b) | Not applicable. |
Item 19. Exhibits.
| (a)(1) | Not applicable. |
| (a)(2) | Not applicable. |
| (a)(4) | Not applicable. |
| (b) | Certifications required by Rule 30a-2(b) under the Act (17 CFR 270.30a-2(b)): Attached hereto |
SIGNATURES
Pursuant to the requirements of the Securities Exchange Act of 1934 and the Investment Company Act of 1940, the registrant has duly caused this report to be signed on its behalf by the undersigned, thereunto duly authorized.
| Grandeur Peak Global Trust | ||
| By | /s/ Brian Curley | |
| Brian Curley | ||
| Principal Executive Officer/President | ||
| Date: | 12/27/2024 |
Pursuant to the requirements of the Securities Exchange Act of 1934 and the Investment Company Act of 1940, this report has been signed below by the following persons on behalf of the registrant and in the capacities and on the dates indicated.
| By | /s/ Brian Curley | |
| Brian Curley | ||
| Principal Executive Officer/President |
| Date: | 12/27/2024 |
| By | /s/ Richard Gleason | |
| Richard Gleason | ||
| Principal Financial Officer/Treasurer |
| Date: | 12/27/2024 |