Slide 1

March 2005
Investing In Chesapeake
Slide 2

Disclaimer
This presentation includes forward-looking statements that are made pursuant to the safe harbor provisions of the Private Securities
Litigation Reform Act of 1995. Changes in the following important factors, among others, could cause Chesapeake's actual results to differ
materially from those expressed in the forward-looking statements: competitive products and pricing; production costs (particularly for raw
materials such as folding carton and plastics materials); fluctuations in demand; possible recessionary trends in U.S. and global economies;
governmental policies and regulations; interest rates; currency translation movements; the ability of the Company to remain in compliance
with its debt covenants; and other risks that are detailed from time to time in reports filed by the Company with the Securities and
Exchange Commission.
This presentation speaks only as of the date of this presentation and Chesapeake assumes no obligation to update the presentation. Users
of the presentation are advised to review public disclosure by Chesapeake subsequent to the date of this presentation.
Non-GAAP Financial Measures
Cash Flow Available for Shareholders and Debt Reduction - To supplement the company's consolidated financial statements presented in
accordance with generally accepted accounting principles in the United States ("GAAP"), the company reports "cash flow available for
shareholders and debt reduction," defined as net cash provided by operating activities plus net cash provided by (or minus net cash used
in) investing activities, which is a non-GAAP measure. The company's management believes this non-GAAP measure enhances the overall
understanding of the company's ability to pay-down debt and pay dividends to its shareholders. In addition, this non-GAAP measure is a
primary indicator management uses as a basis for planning and forecasting future periods. The presentation of this additional information is
not meant to be considered in isolation or as a substitute for cash flows provided by operating activities determined in accordance with
GAAP.
Financial Results Excluding Special Items - To supplement the company's consolidated financial statements presented on a GAAP basis, the
company reports income from continuing operations before (1) costs related to the extinguishment of debt and (2) the gain on the
settlement of indemnification obligations. The company's management believes this non-GAAP measure provides investors, potential
investors, securities analysts and others with useful additional information to evaluate the performance of the business, because it excludes
expenses that management believes are not indicative of the operating results of the business. In addition, this non-GAAP measure is used
by management to evaluate the operating performance of the company. The presentation of this additional information is not meant to be
considered in isolation or as a substitute for income from continuing operations and earnings per share determined in accordance with
GAAP.
Chesapeake defines EBITDA as income from continuing operations before interest, income taxes, depreciation, amortization, restructuring
charges and gains on sales of businesses. EBITDA is not a measure of performance defined by GAAP and should not be considered in
isolation or as a substitute for net income or cash flows from operating activities, which have been prepared in accordance with GAAP. We
believe EBITDA provides useful information regarding our ability to service our debt and is used by investors and analysts to evaluate
companies within the packaging industry. EBITDA may be adjusted for certain cash and non-cash charges to determine compliance with
certain financial covenants under our senior credit facility. EBITDA, as presented, may not be comparable to the calculation of similarly
titled measures reported by other companies.
Slide 3

Business and Strategic
Overview
Thomas H. Johnson
Chairman & Chief Executive Officer
Slide 4

Company Overview
NYSE Symbol: CSK
Shares Outstanding: 19.7 million
Market Capitalization: $422 million
Dividend: $.88/share
Share Ownership:
Insider 6%
Institutional 72%
Retail 22%
Top Five Shareholders:
T. Rowe Price
Dimension Fund Advisors
Barrow Hanley
Barclays Global Investors
Strong Capital Management
Stock Price Indices: January 2003-March 18, 2005
-30.00
-20.00
-10.00
0.00
10.00
20.00
30.00
40.00
50.00
60.00
70.00
80.00
1/1/2003
3/1/2003
5/1/2003
7/1/2003
9/1/2003
11/1/2003
1/1/2004
3/1/2004
5/1/2004
7/1/2004
9/1/2004
11/1/2004
1/1/2005
3/1/2005
CSK Russell 2000 Composite Index Small Cap S&P 600
Slide 5

Investment Highlights
A leading supplier of specialty plastic packaging products to niche end-use markets
Expansions into North America and emerging markets may enhance future earnings growth
Existing platform and significant investment in infrastructure provides organic growth opportunities
Focus on higher growth, lower cyclicality end-use markets that require rigorous process & quality control, brand positioning and product differentiation
A leading supplier of value-added, specialty paperboard packaging in Europe
Slide 6

Chesapeake's Transformation
Chesapeake has transformed itself from a small North American producer of commodity paper
products to a leading European supplier of value-added specialty packaging products
1996 2004
Acquired value-added
specialty packaging
assets, primarily in
Europe where the
attractive
opportunities existed
Integrated
acquisitions,
rationalized
operations and
refined core
competencies
A leading specialty
paper based and
plastic packaging
supplier with strong
competitive positions
in many attractive
end-use markets
Began divesting
North American
commodity paper
assets
2004 2001 - 2003 1999 - 2000 1997
Commodity focused
Integrated producer with significant capital requirements
Highly cyclical end-markets
Primarily North American
Specialty orientation
Leading positions in target niche end-use markets
Non-integrated, value-added converting company
Reduced cyclicality
90% European
Slide 7
Chesapeake Today
A leading multi-substrate producer of value-added, specialty
packaging products
Largest specialty paper-based packaging supplier in Europe
A leading provider of specialty plastic packaging to niche end-use markets
Successful business model based on several key competitive
advantages
Ability to provide innovative, high quality packaging solutions
Comprehensive design expertise
Pan-European presence with state-of-the-art, strategically located facilities
Long-standing, collaborative customer relationships with well-recognized companies
Focus on attractive, defensible end-use markets
Pharmaceuticals and healthcare
International and branded products
Tobacco
Specialty chemicals
Slide 8

Company Overview
Sales by Market Sales by Geography
Pharma-Healthcare 35%
Specialty Chemicals 4%
Food & Household 23%
Tobacco 13%
United Kingdom 56%
Other 4%
Belgium 6%
Ireland 7%
Germany 11%
United States 2%
France 10%
2004 Revenues $1.03 Billion
25% International & Branded (Spirits, Confectionery & Cosmetics)
South Africa 4%
Slide 9
Paperboard Packaging
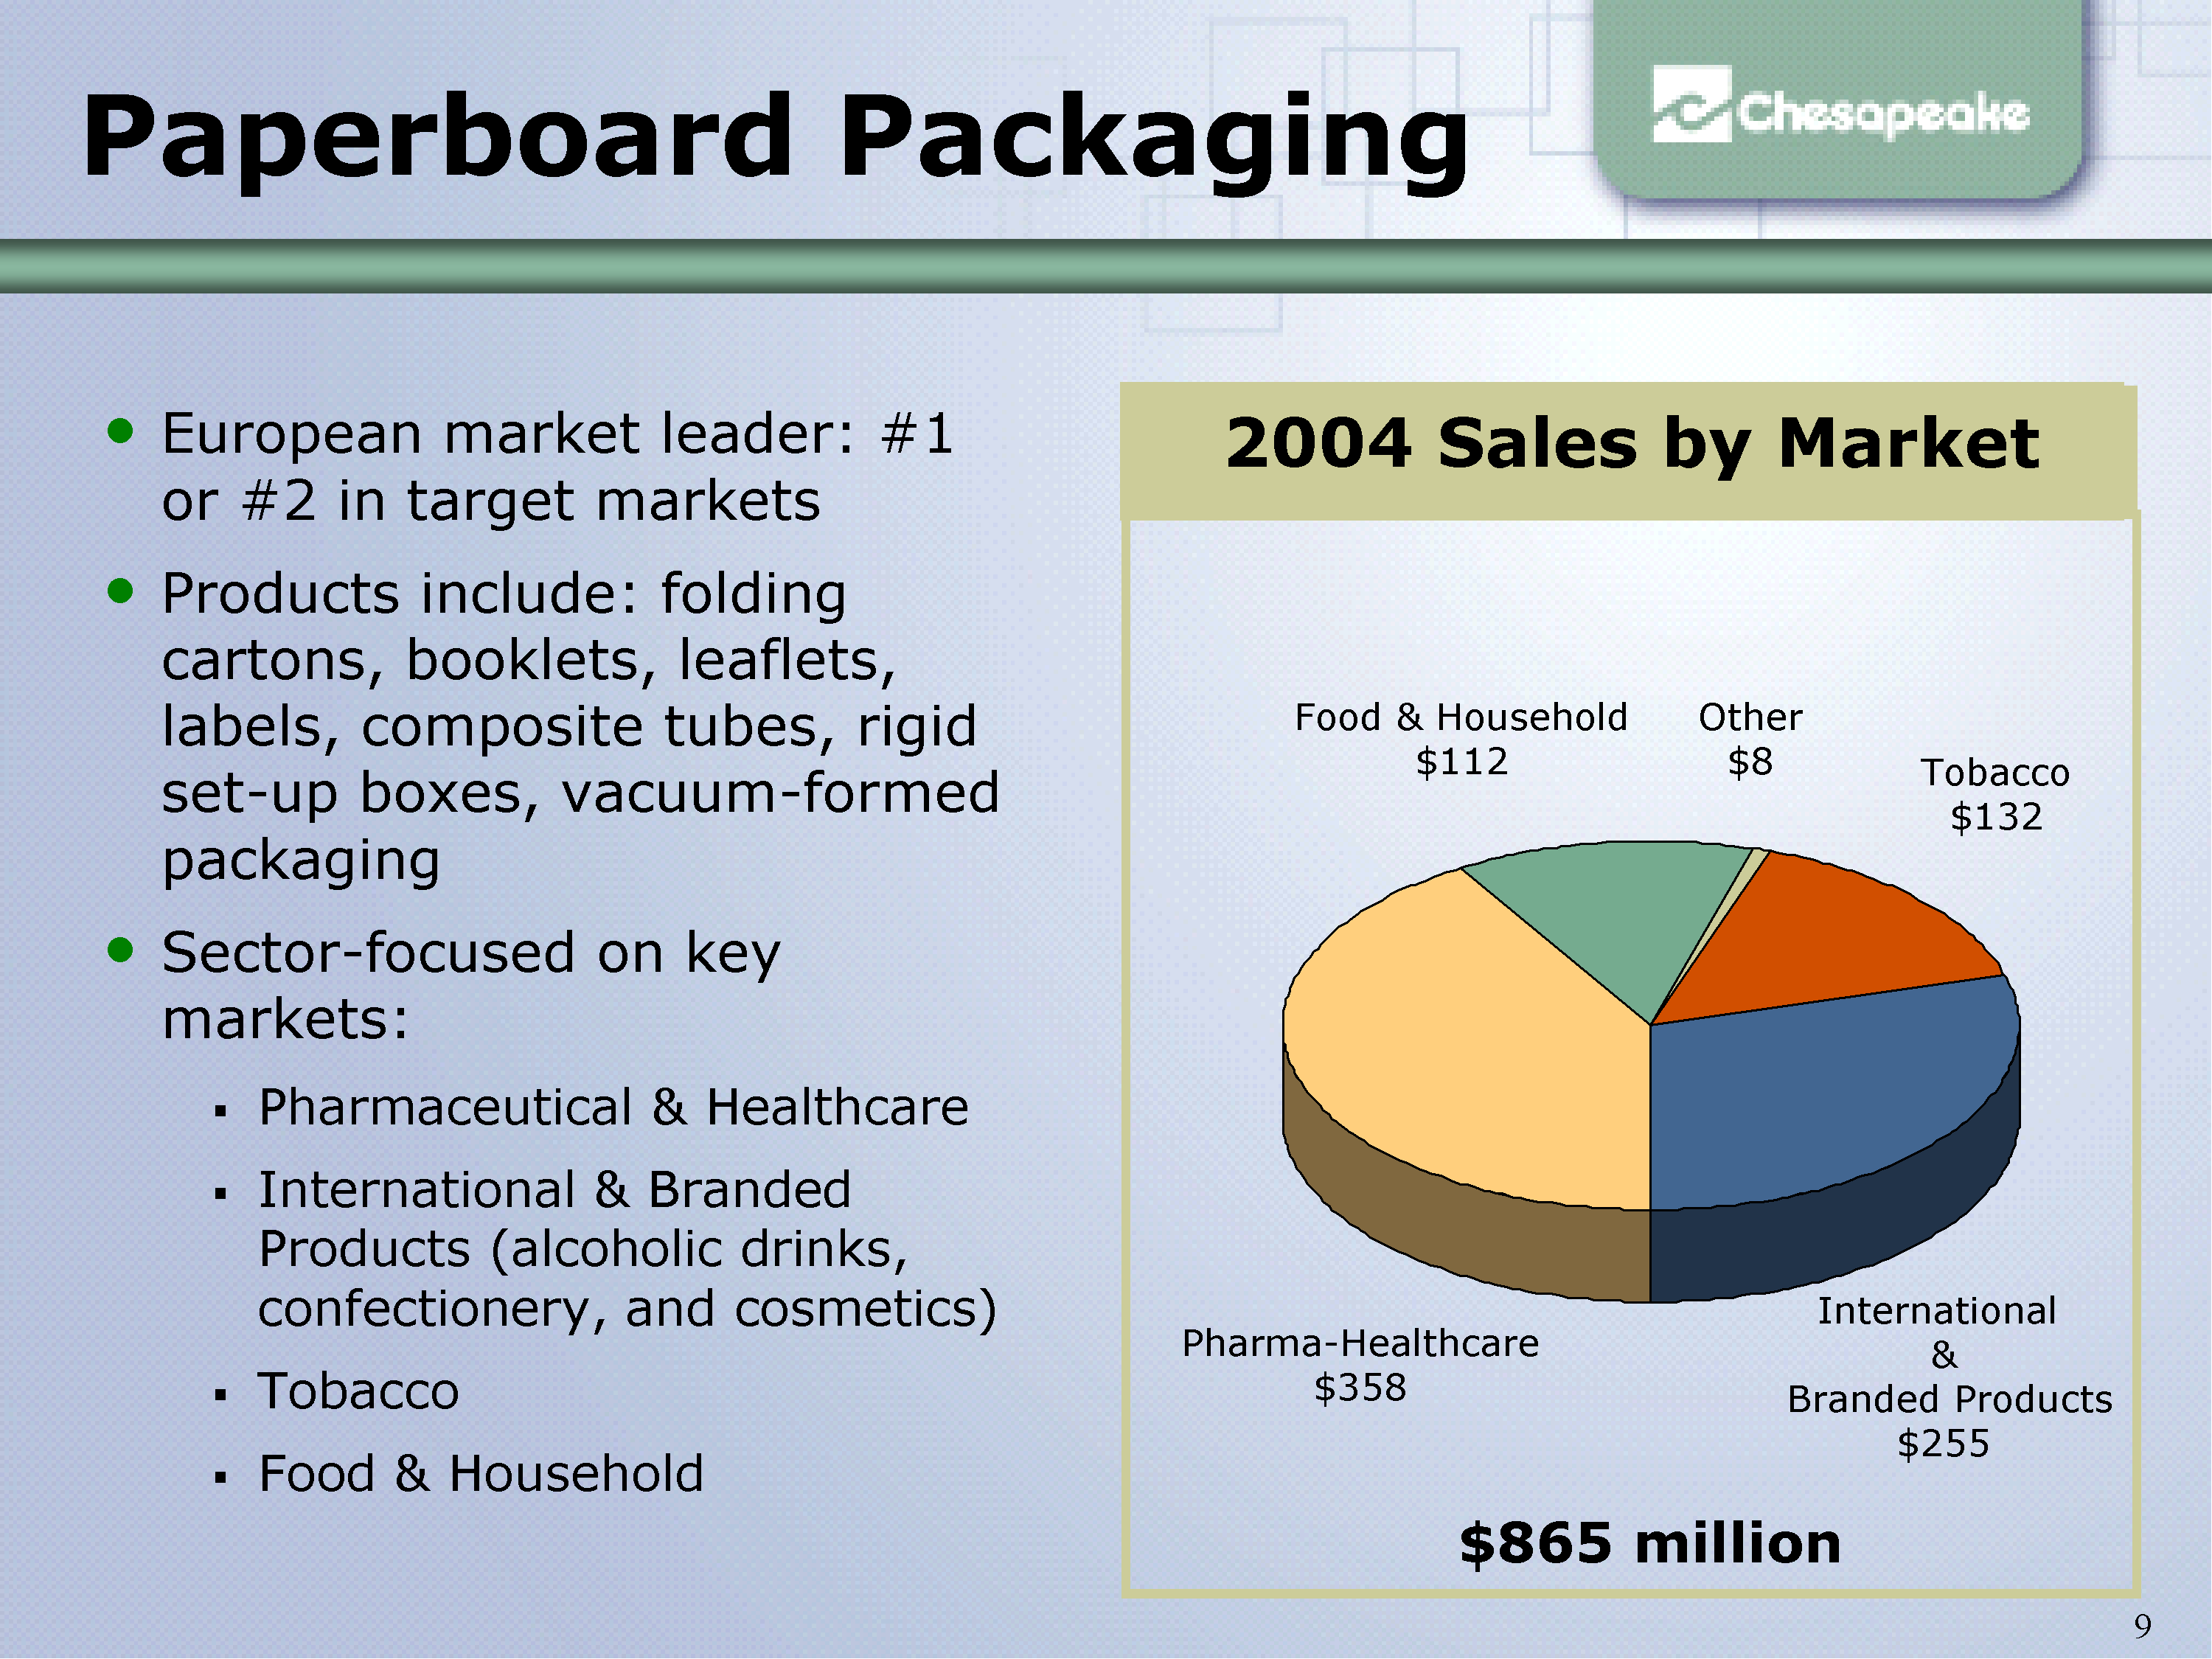
2004 Sales by MarketEuropean market leader: #1 or #2 in target markets
Products include: folding cartons, booklets, leaflets, labels, composite tubes, rigid set-up boxes, vacuum-formed packaging
Sector-focused on key markets:
Pharmaceutical & Healthcare
International & Branded Products (alcoholic drinks, confectionery, and cosmetics)
Tobacco
Food & Household
Pharma-Healthcare
$358
Food & Household
$112
Other
$8 Tobacco
$132
International & Branded Products
$255
$865 million
Slide 10
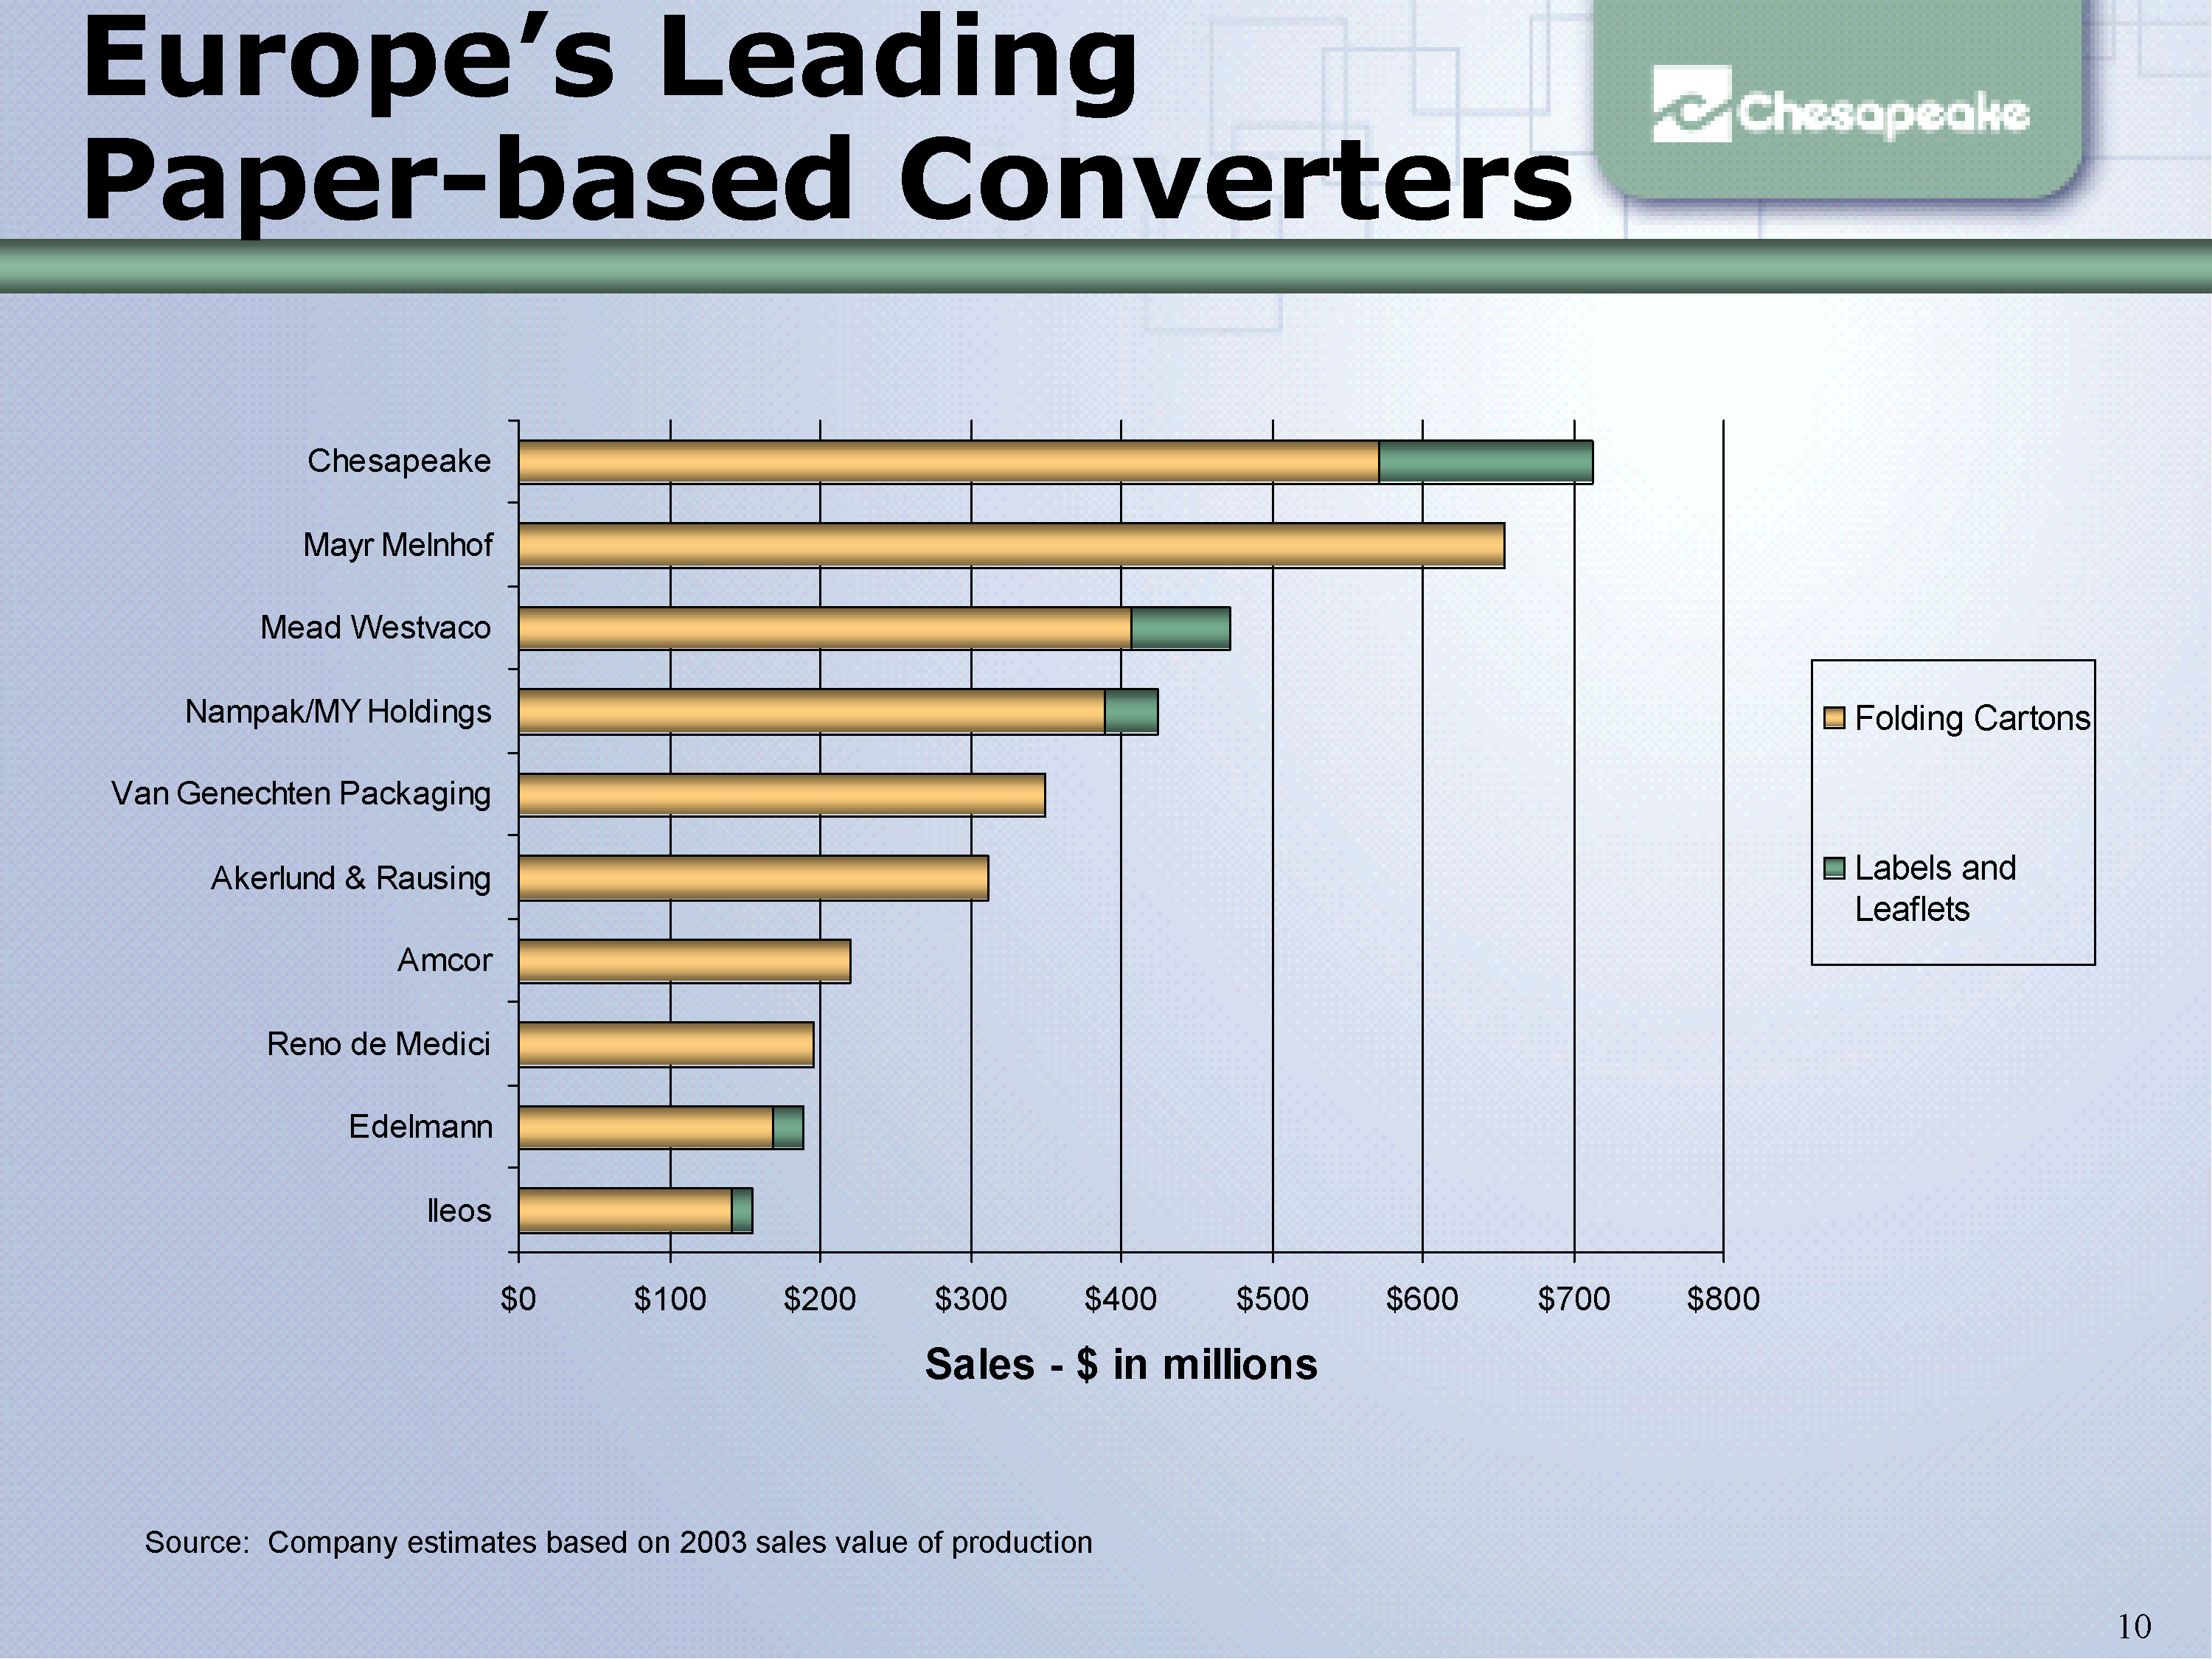
Source: Company estimates based on 2003 sales value of production
Europe's Leading Paper-based Converters
$0 $100 $200 $300 $400 $500 $600 $700 $800
Ileos
Edelmann
Reno de Medici
Amcor
Akerlund & Rausing
Van Genechten Packaging
Nampak/MY Holdings
Mead Westvaco
Mayr Melnhof
Chesapeake
Sales - $ in millions
Folding Cartons
Labels and
Leaflets
Slide 11
Plastic Packaging
Leadership positions in selected niche markets
Barrier containers for invasive fluids
PET soft drink bottles in South Africa
HDPE milk bottles in Ireland
Products: HDPE bottles, containers and closures; PET bottles, containers, closures & preforms
Primary markets: specialty chemicals, beverages, pharmaceutical & healthcare
Principal customers include: ABI, Syngenta, Macaw, C&C Group,
Coca-Cola, Glanbia & Pepsi
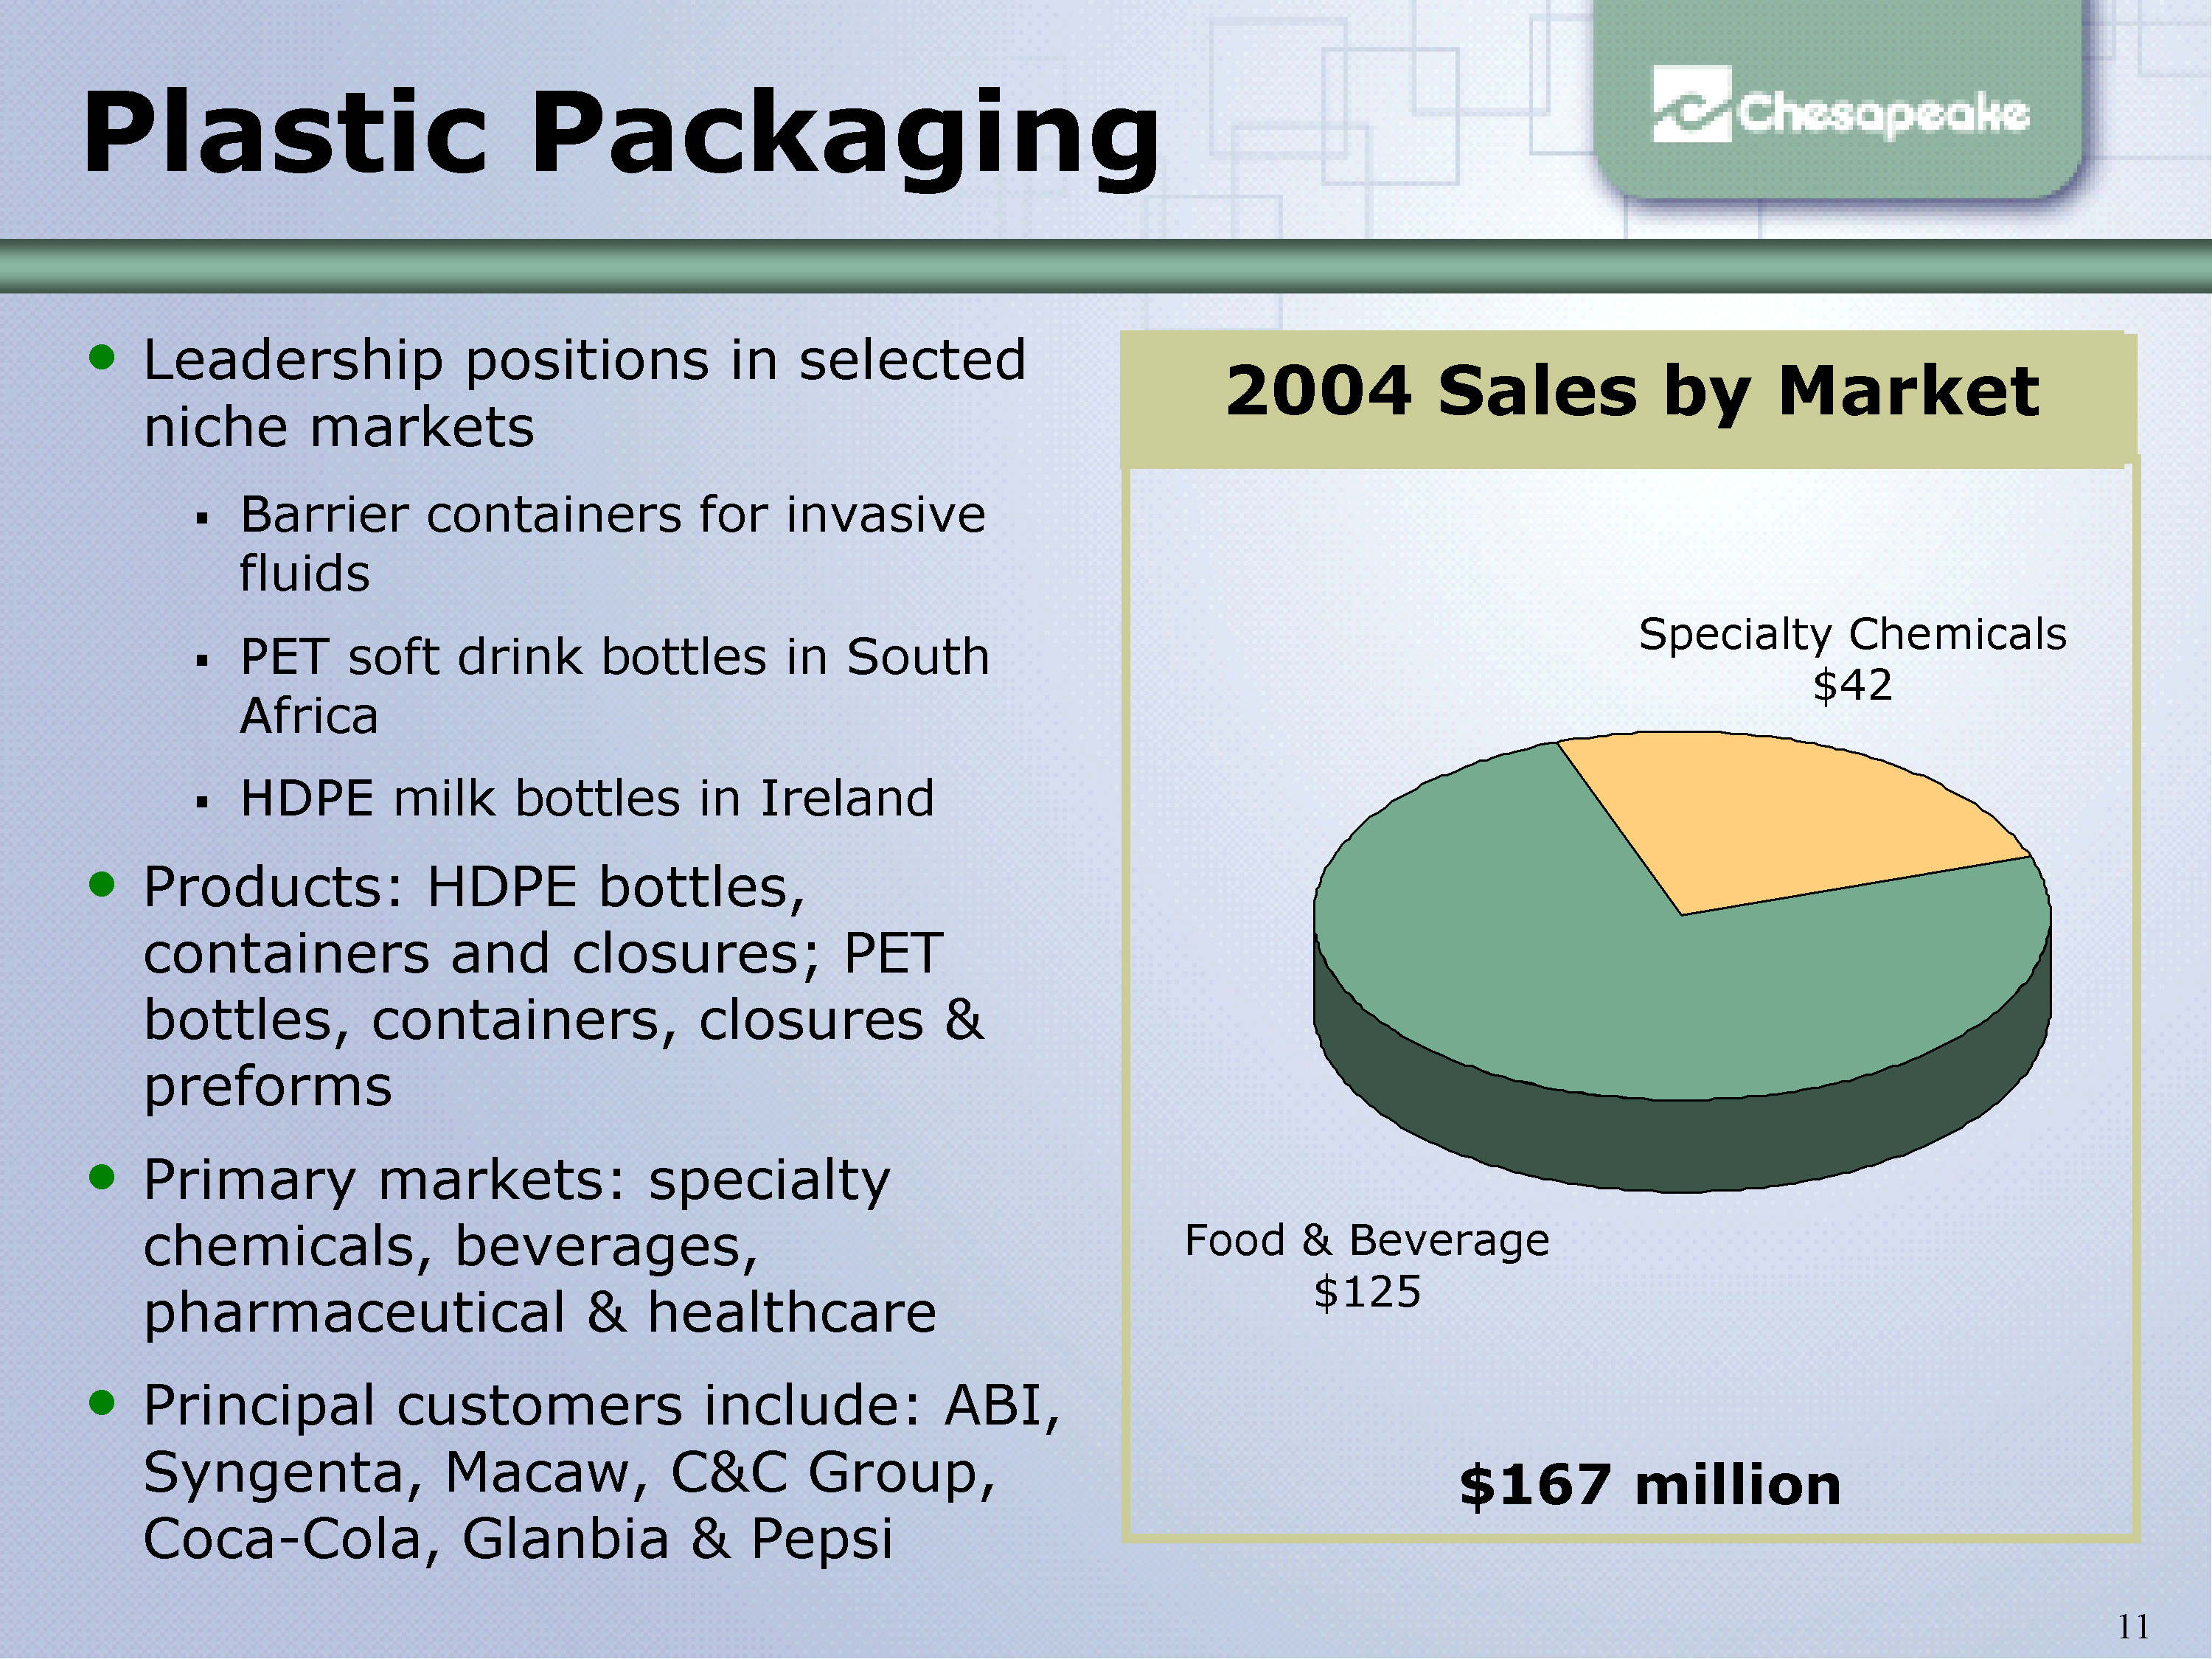
2004 Sales by Market
Specialty Chemicals $42
Food & Beverage $125
$167 million
Slide 12
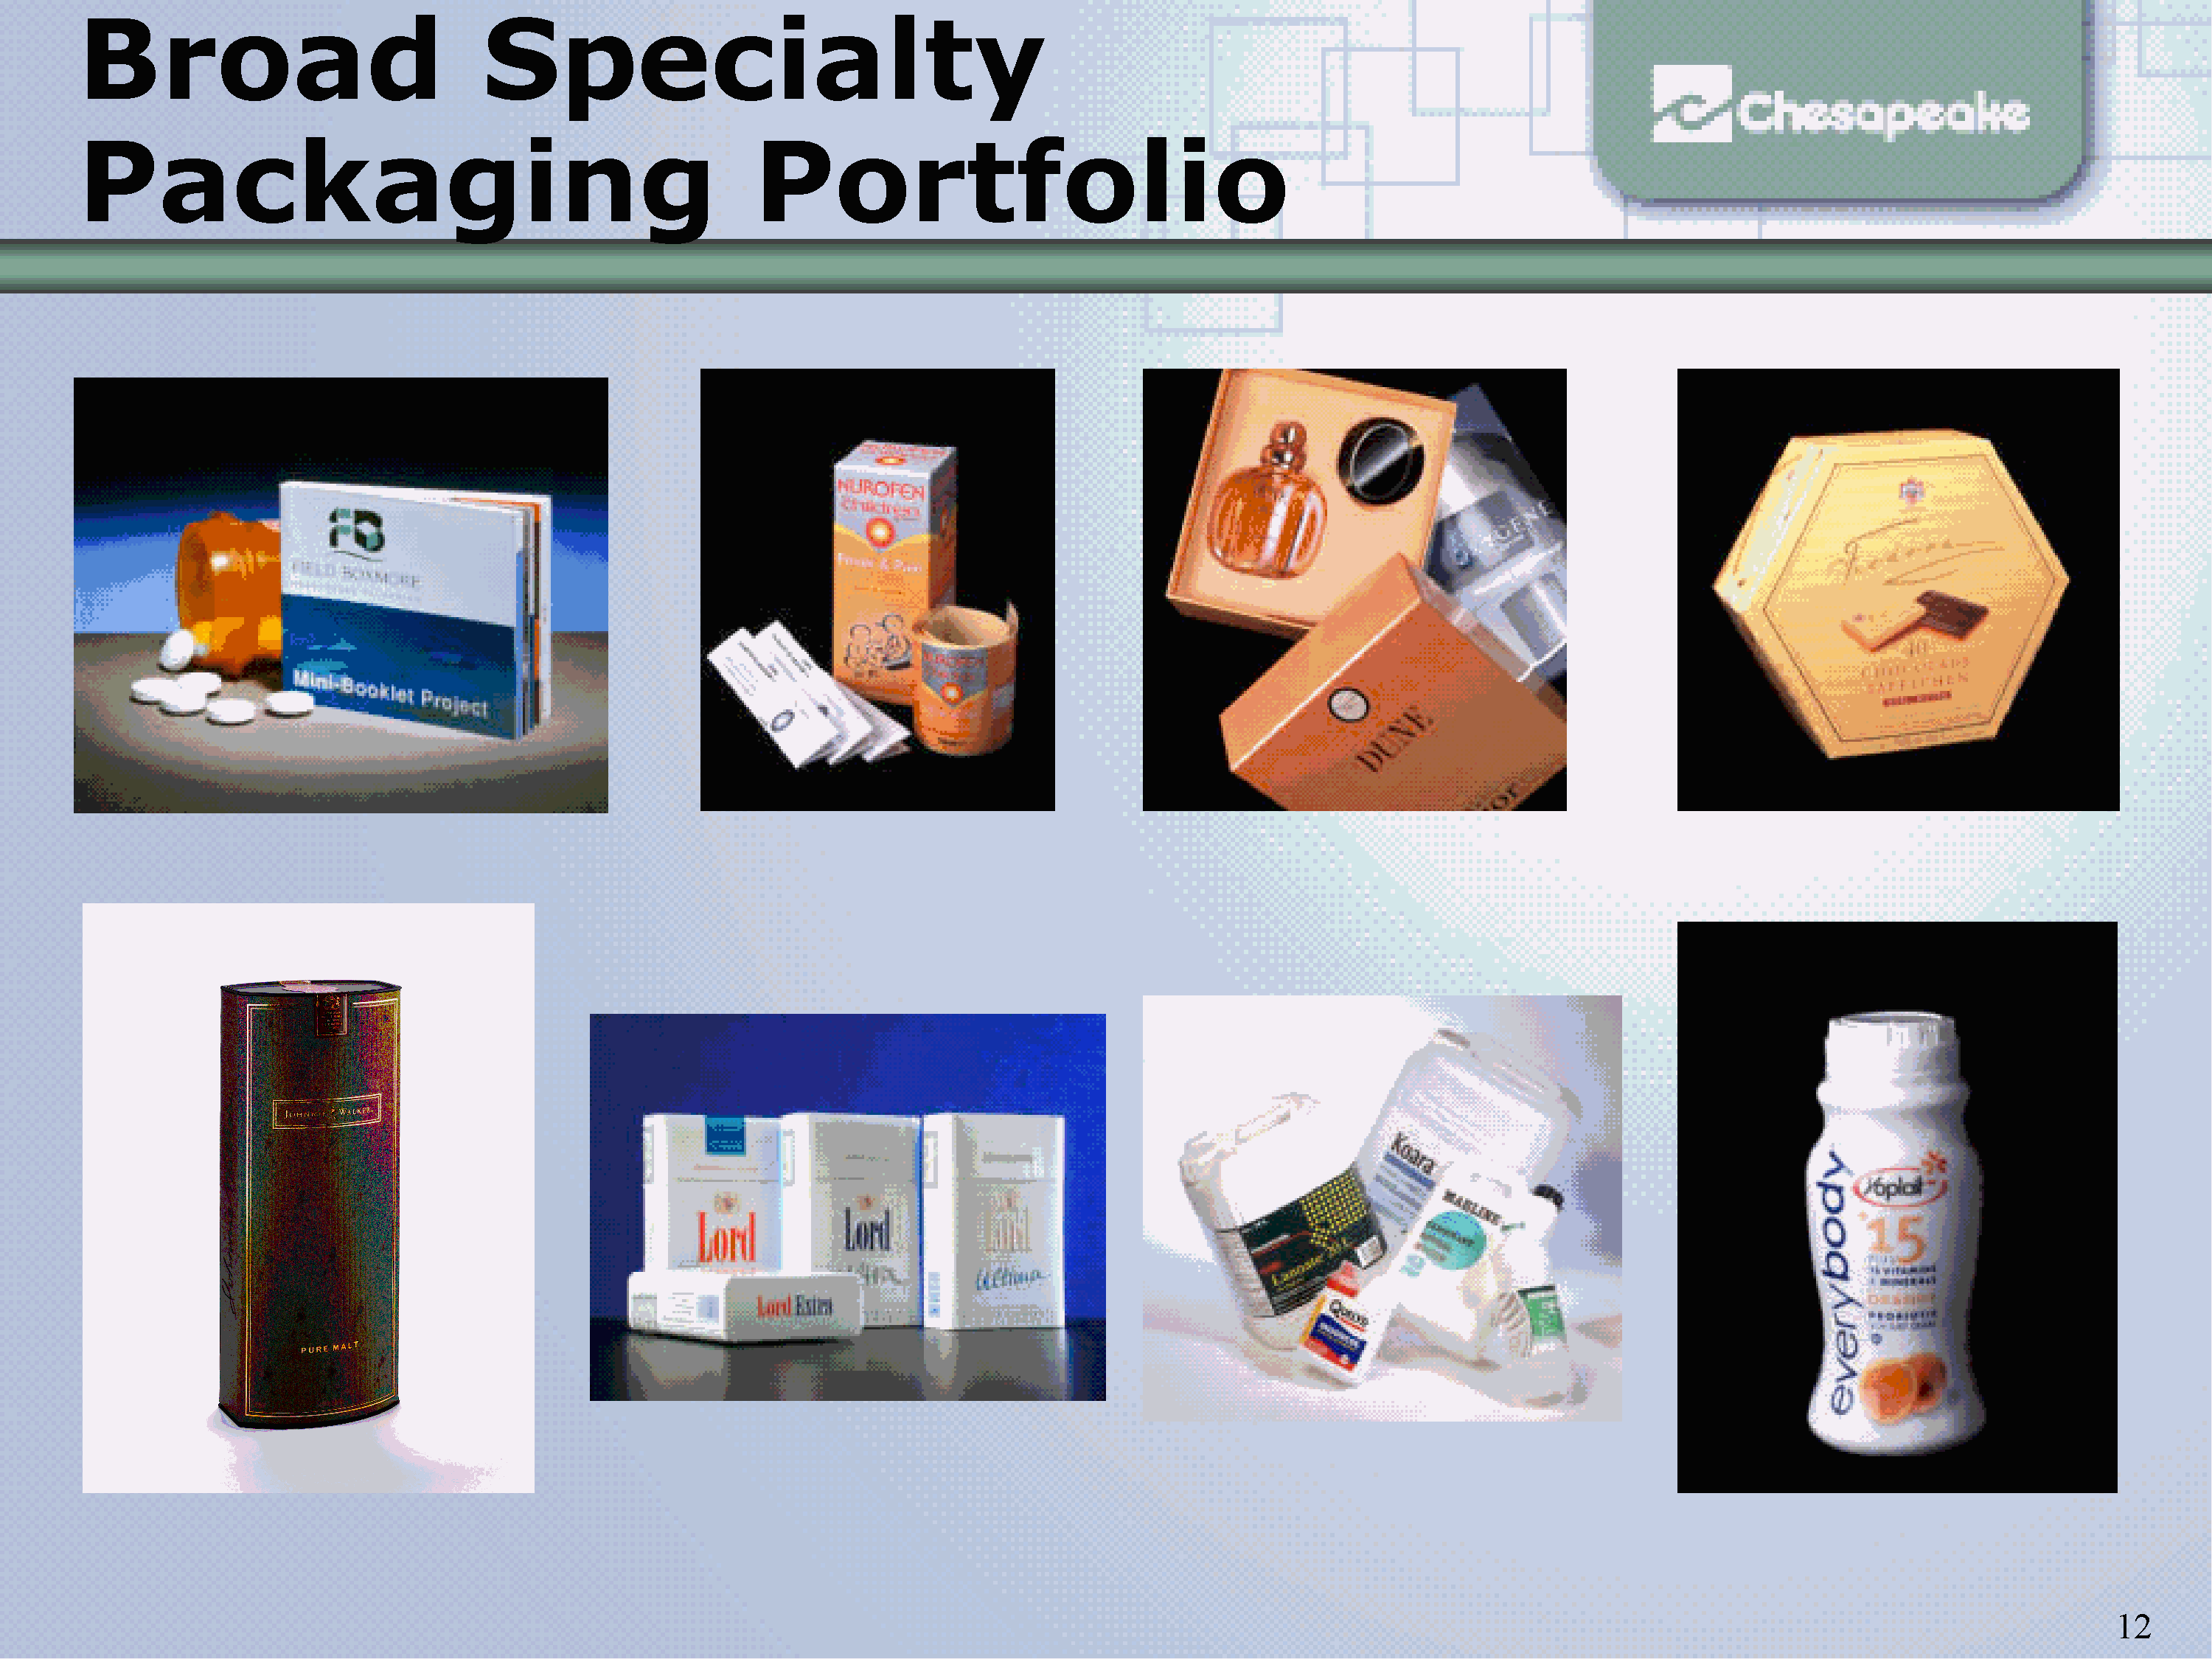
Broad Specialty
Packaging Portfolio
Slide 13
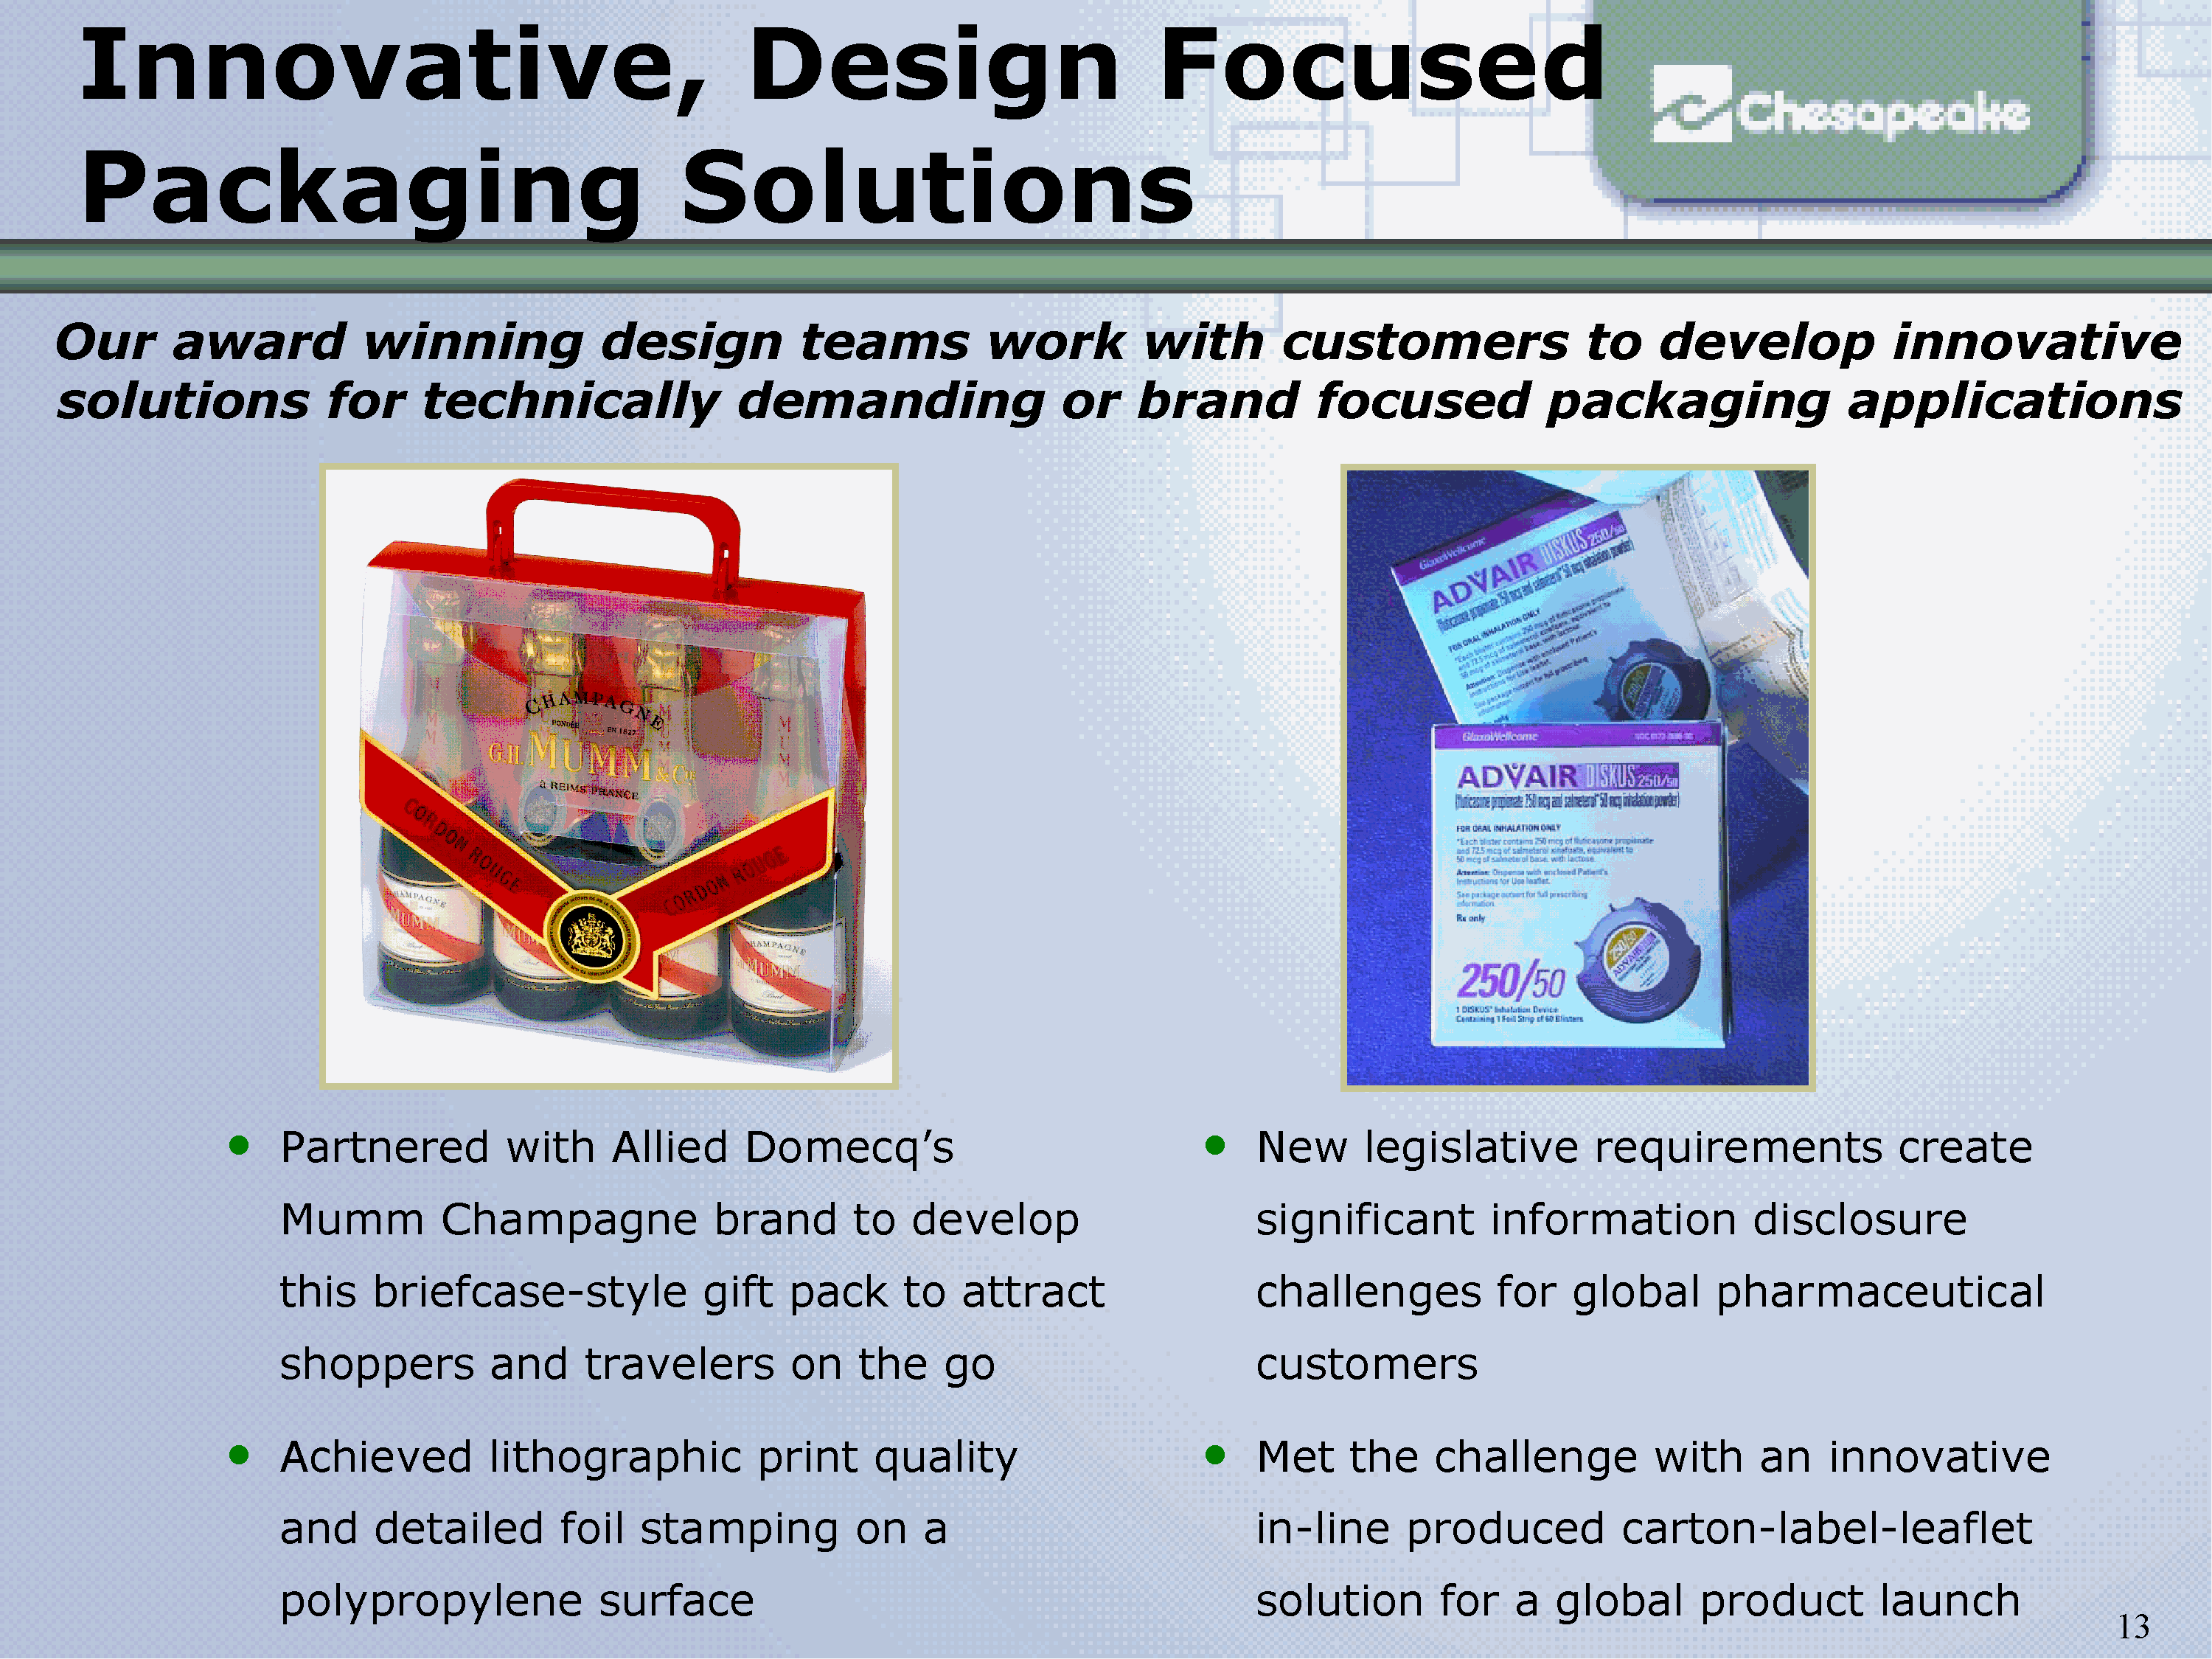
Innovative, Design Focused Packaging Solutions
New legislative requirements create significant information disclosure
challenges for global pharmaceutical customers
Met the challenge with an innovative in-line produced carton-label-leaflet
solution for a global product launch
Our award winning design teams work with customers to develop innovative
solutions for technically demanding or brand focused packaging applications
Partnered with Allied Domecq's Mumm Champagne brand to develop
this briefcase-style gift pack to attract shoppers and travelers on the go
Achieved lithographic print quality and detailed foil stamping on a
polypropylene surface
Slide 14
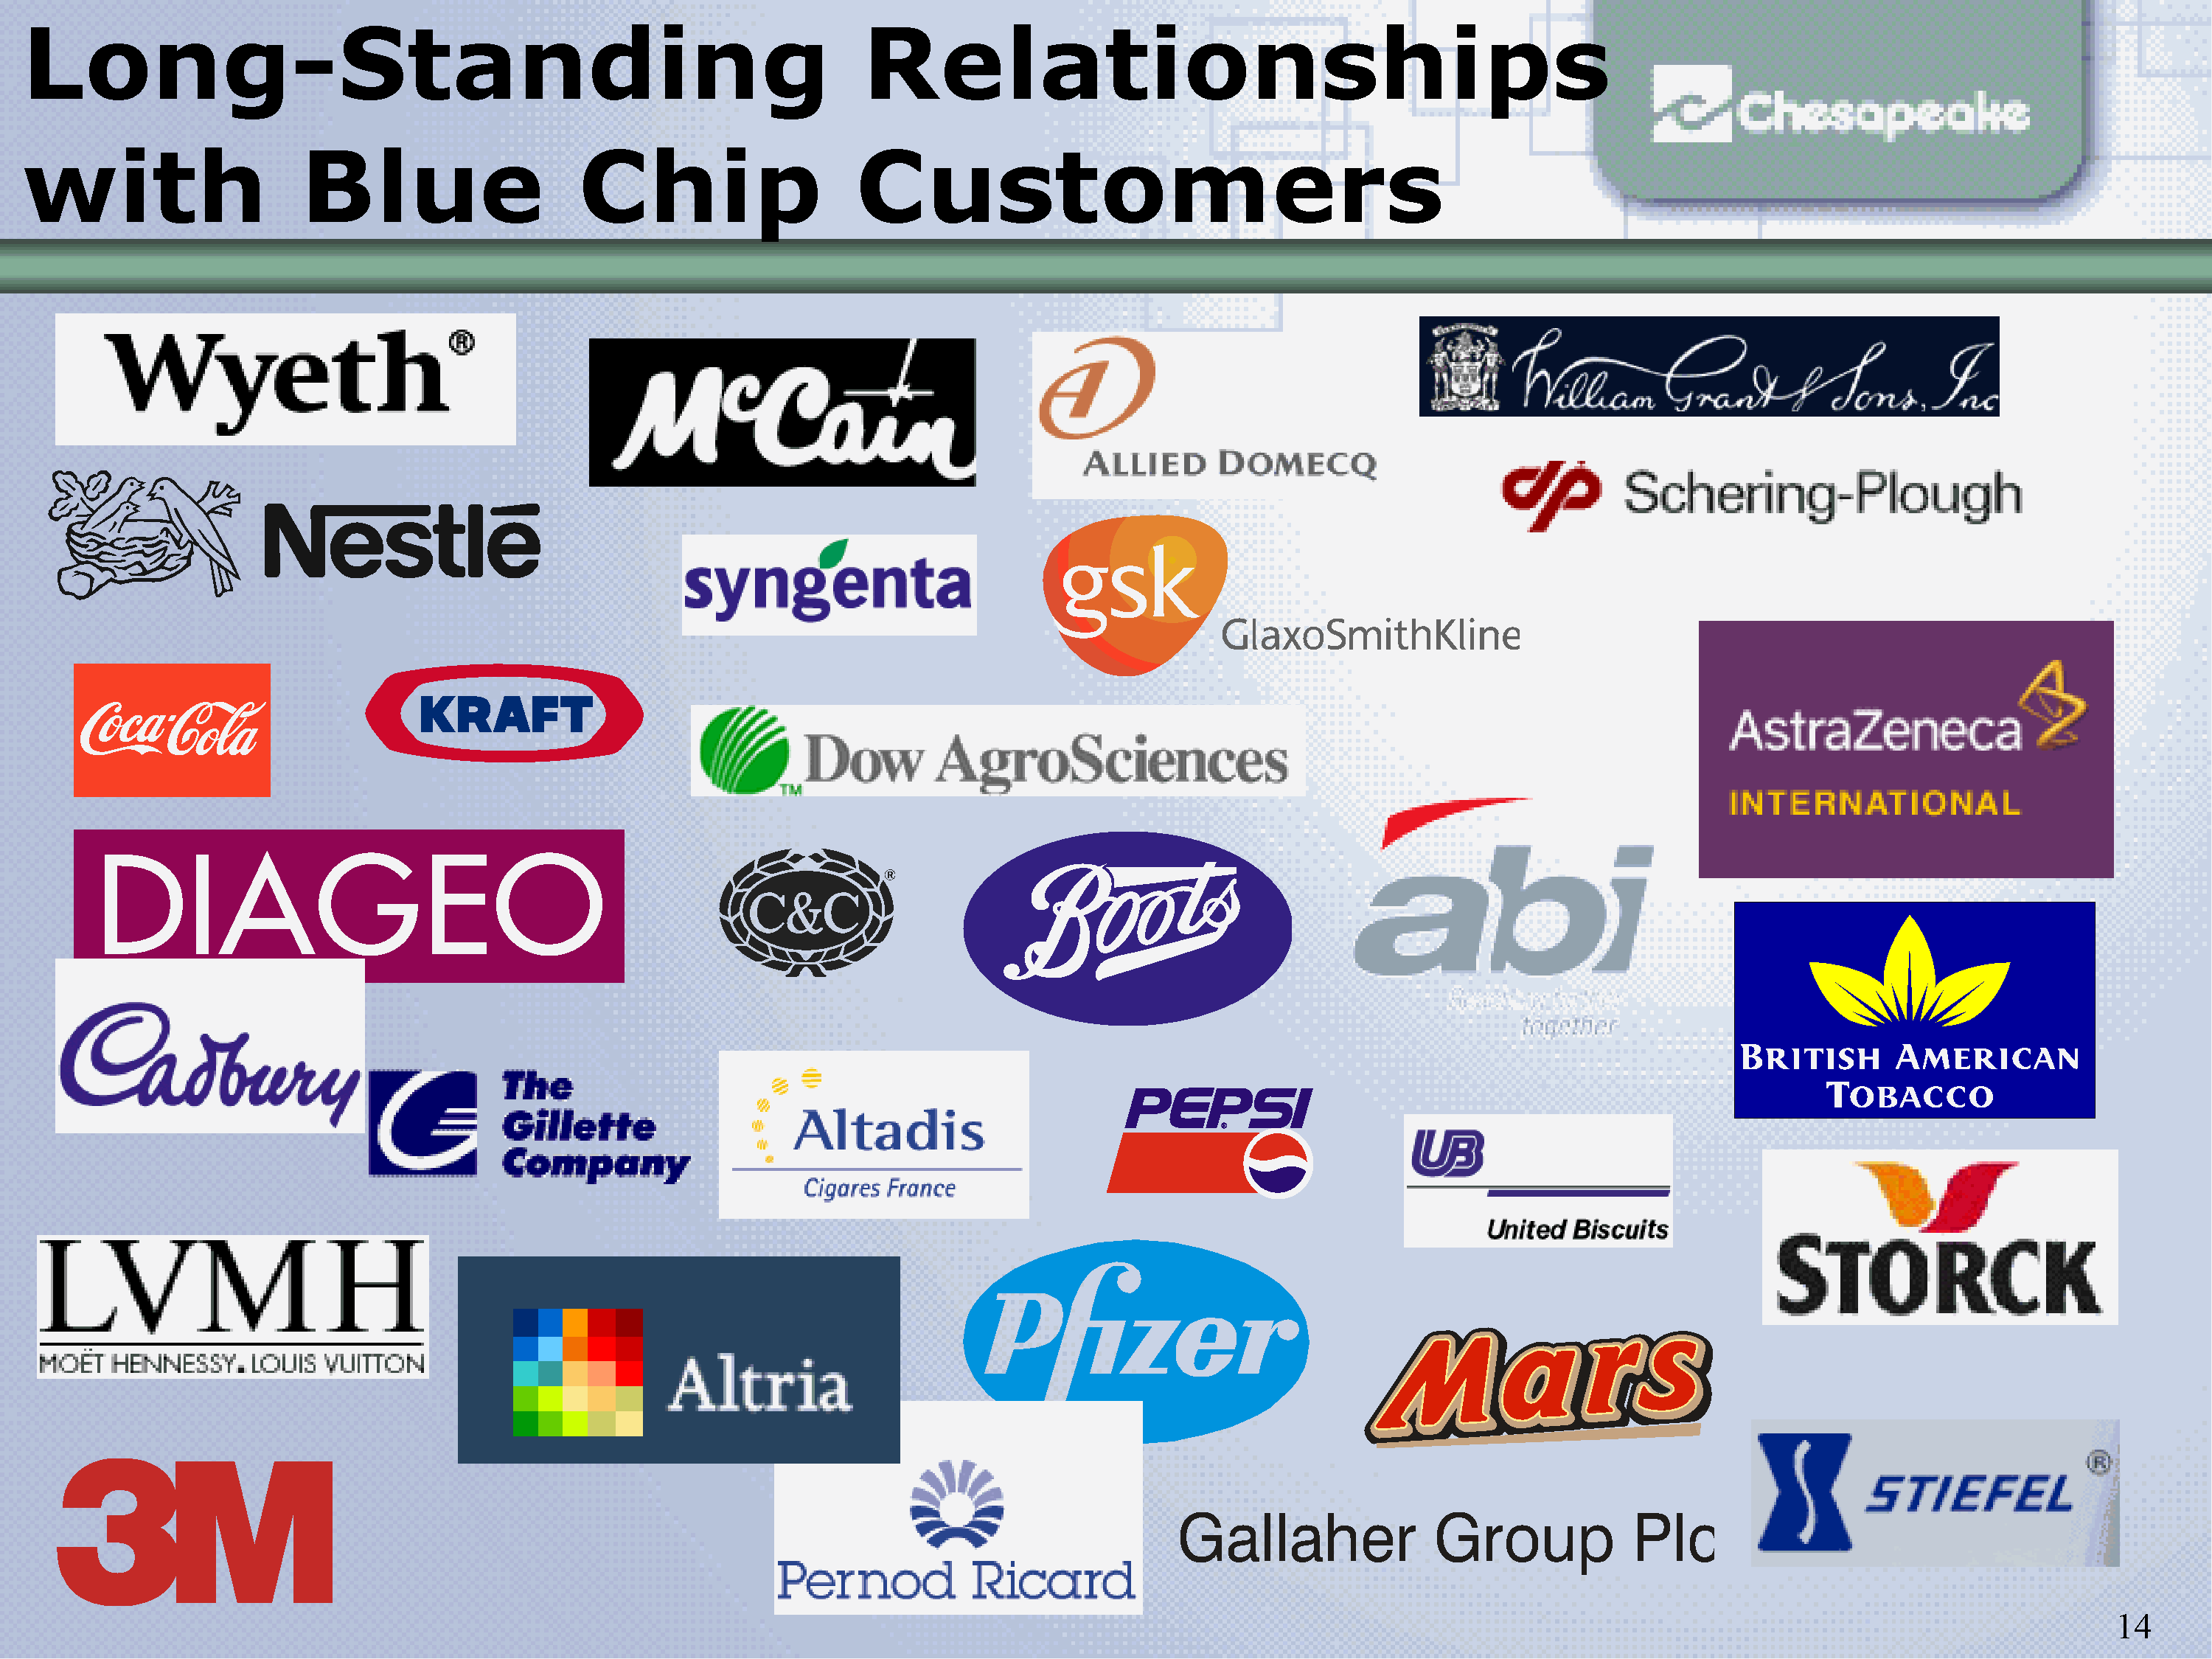
Long-Standing Relationships
with Blue Chip Customers
Wyeth McCain Allied Domecq William Grant Jones, Inc Nestle Syngenta GSK GlaxoSmithKline Schering-Plough Coca-Cola Kraft Dow AgroSciences AstraZeneca International Diageo C&C Boots abi British American Tobacco Cadbury The Gillette Company Altadis Pepsi UB United Biscuits Storck LVMH Altria Pfizer Mars 3M Pernod Ricard Gallaher Group Plc Stiefel
Slide 15
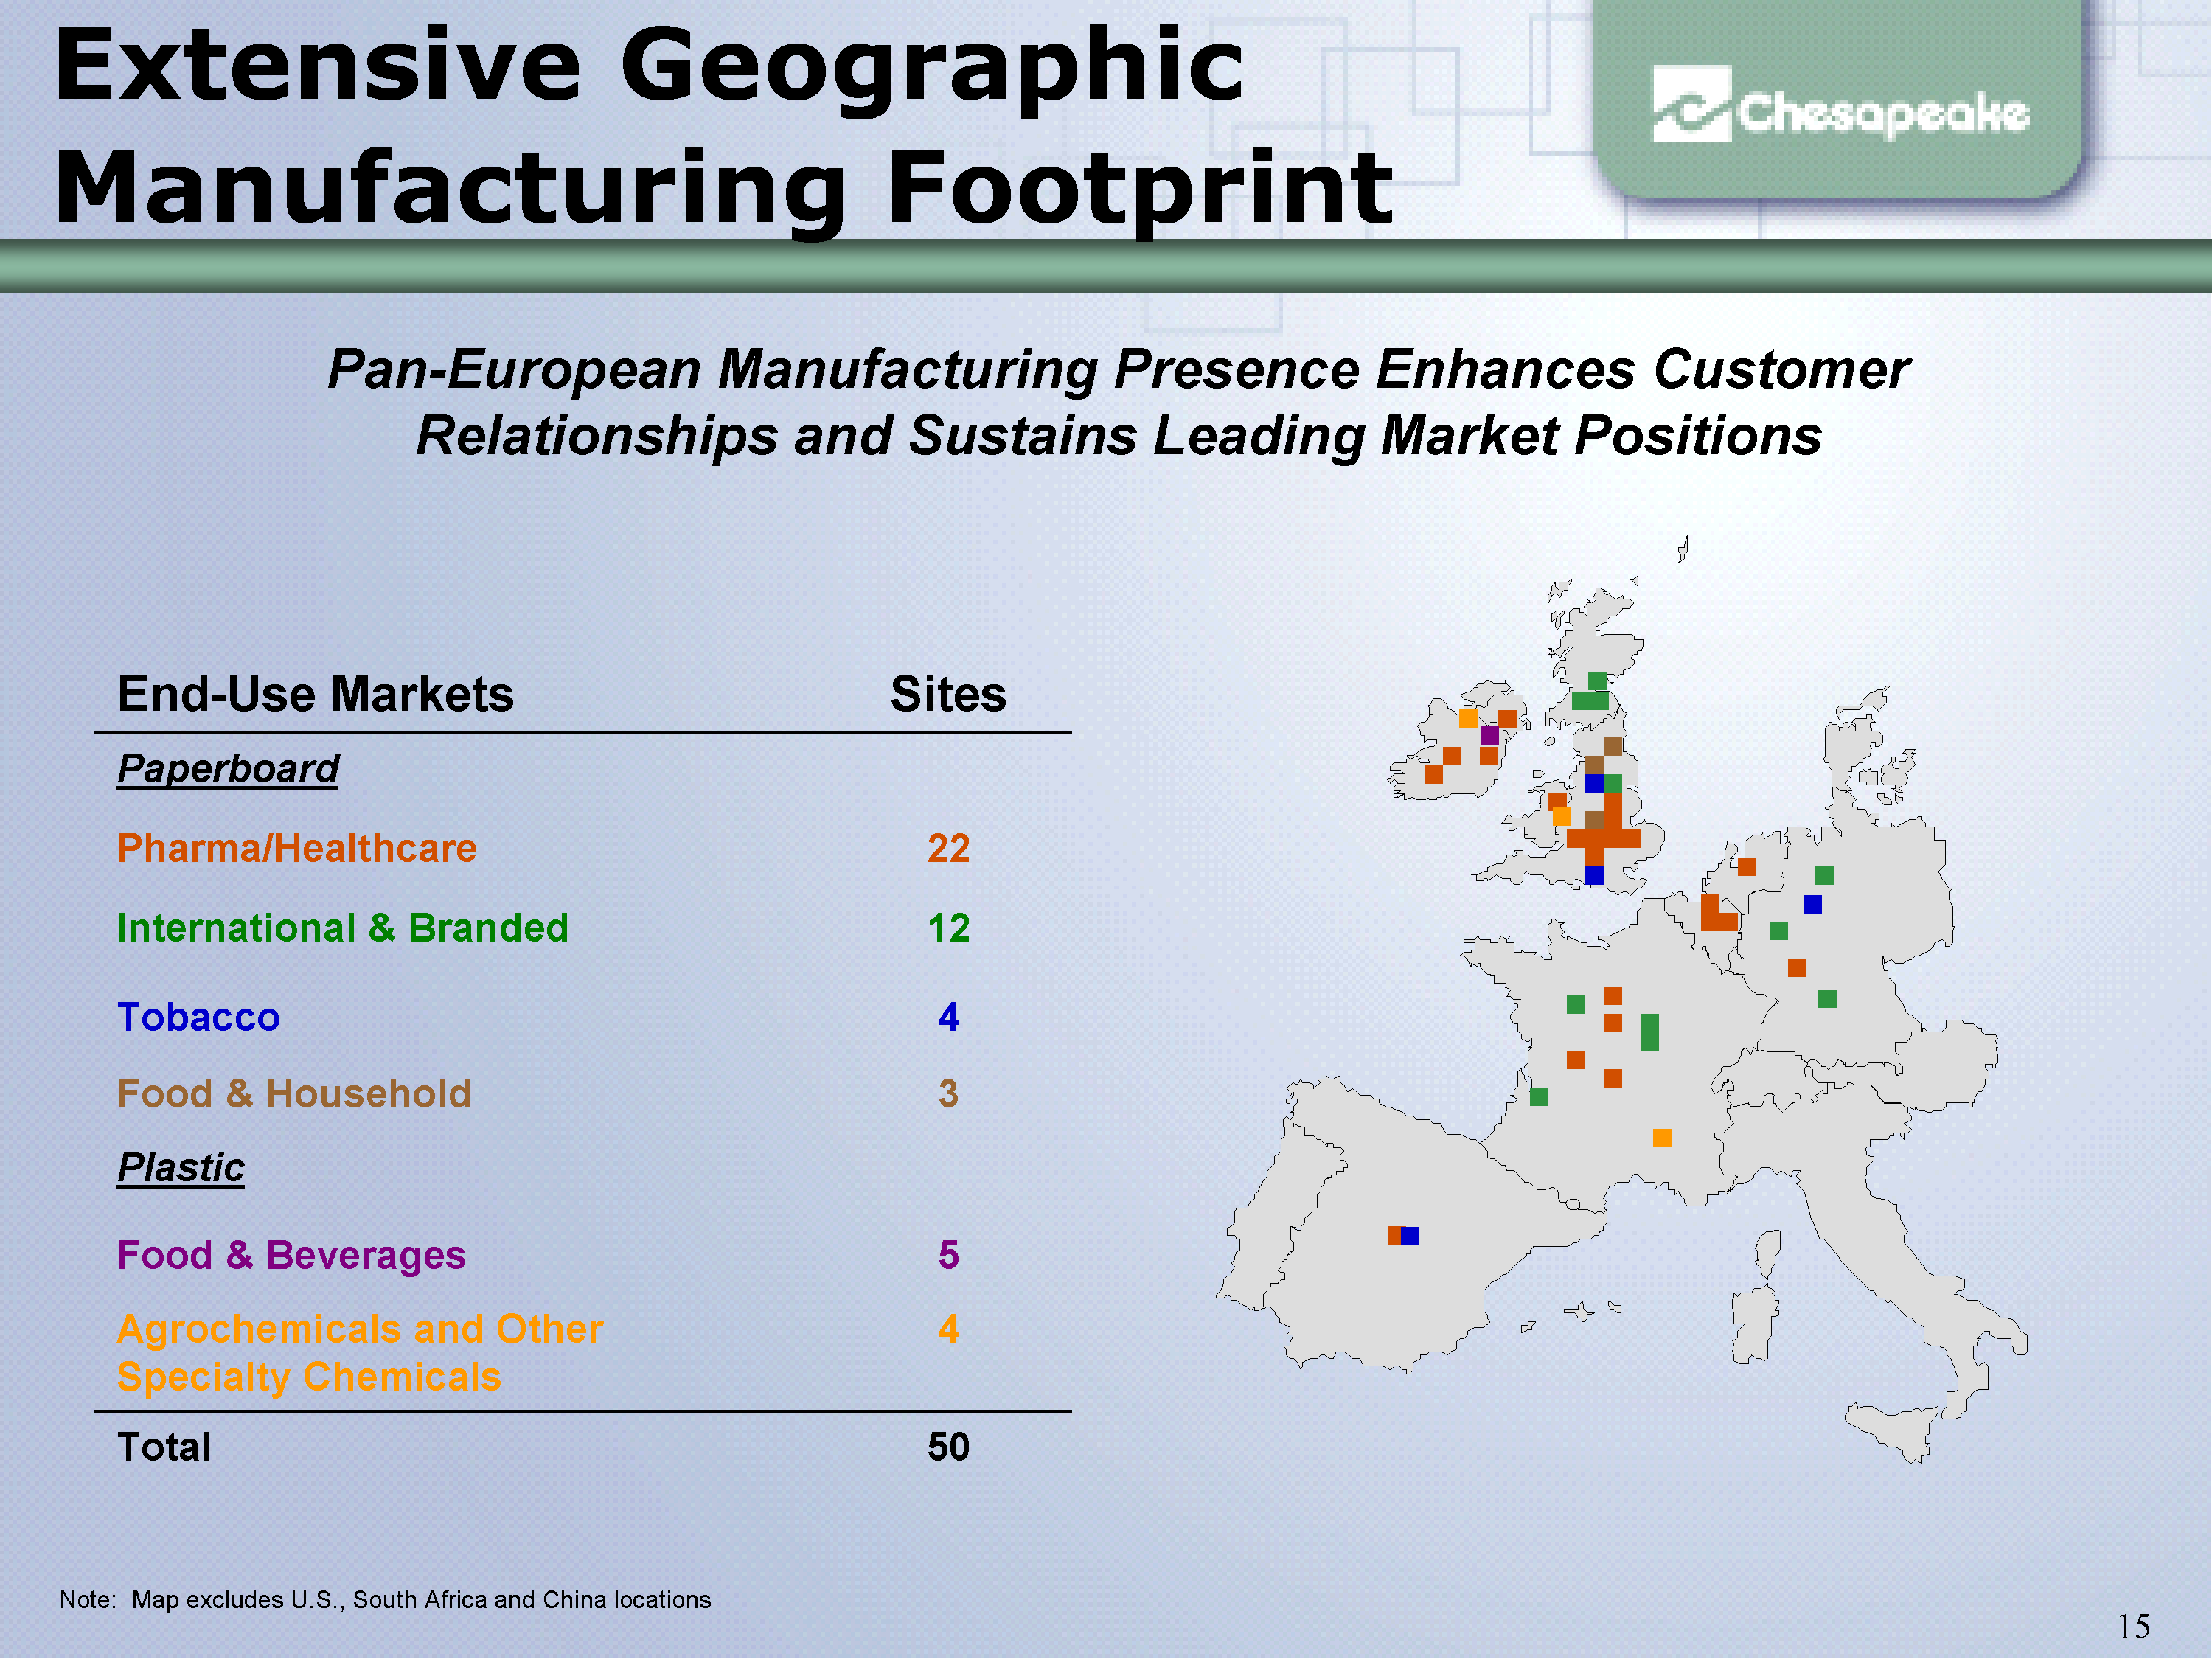
Extensive Geographic
Manufacturing Footprint
Pan-European Manufacturing Presence Enhances Customer
Relationships and Sustains Leading Market Positions
Plastic
Paperboard
50 Total
4 Agrochemicals and Other
Specialty Chemicals
5 Food & Beverages
3 Food & Household
4 Tobacco
12 International & Branded
22 Pharma/Healthcare
Sites End-Use Markets
Note: Map excludes U.S., South Africa and China locations
Slide 16
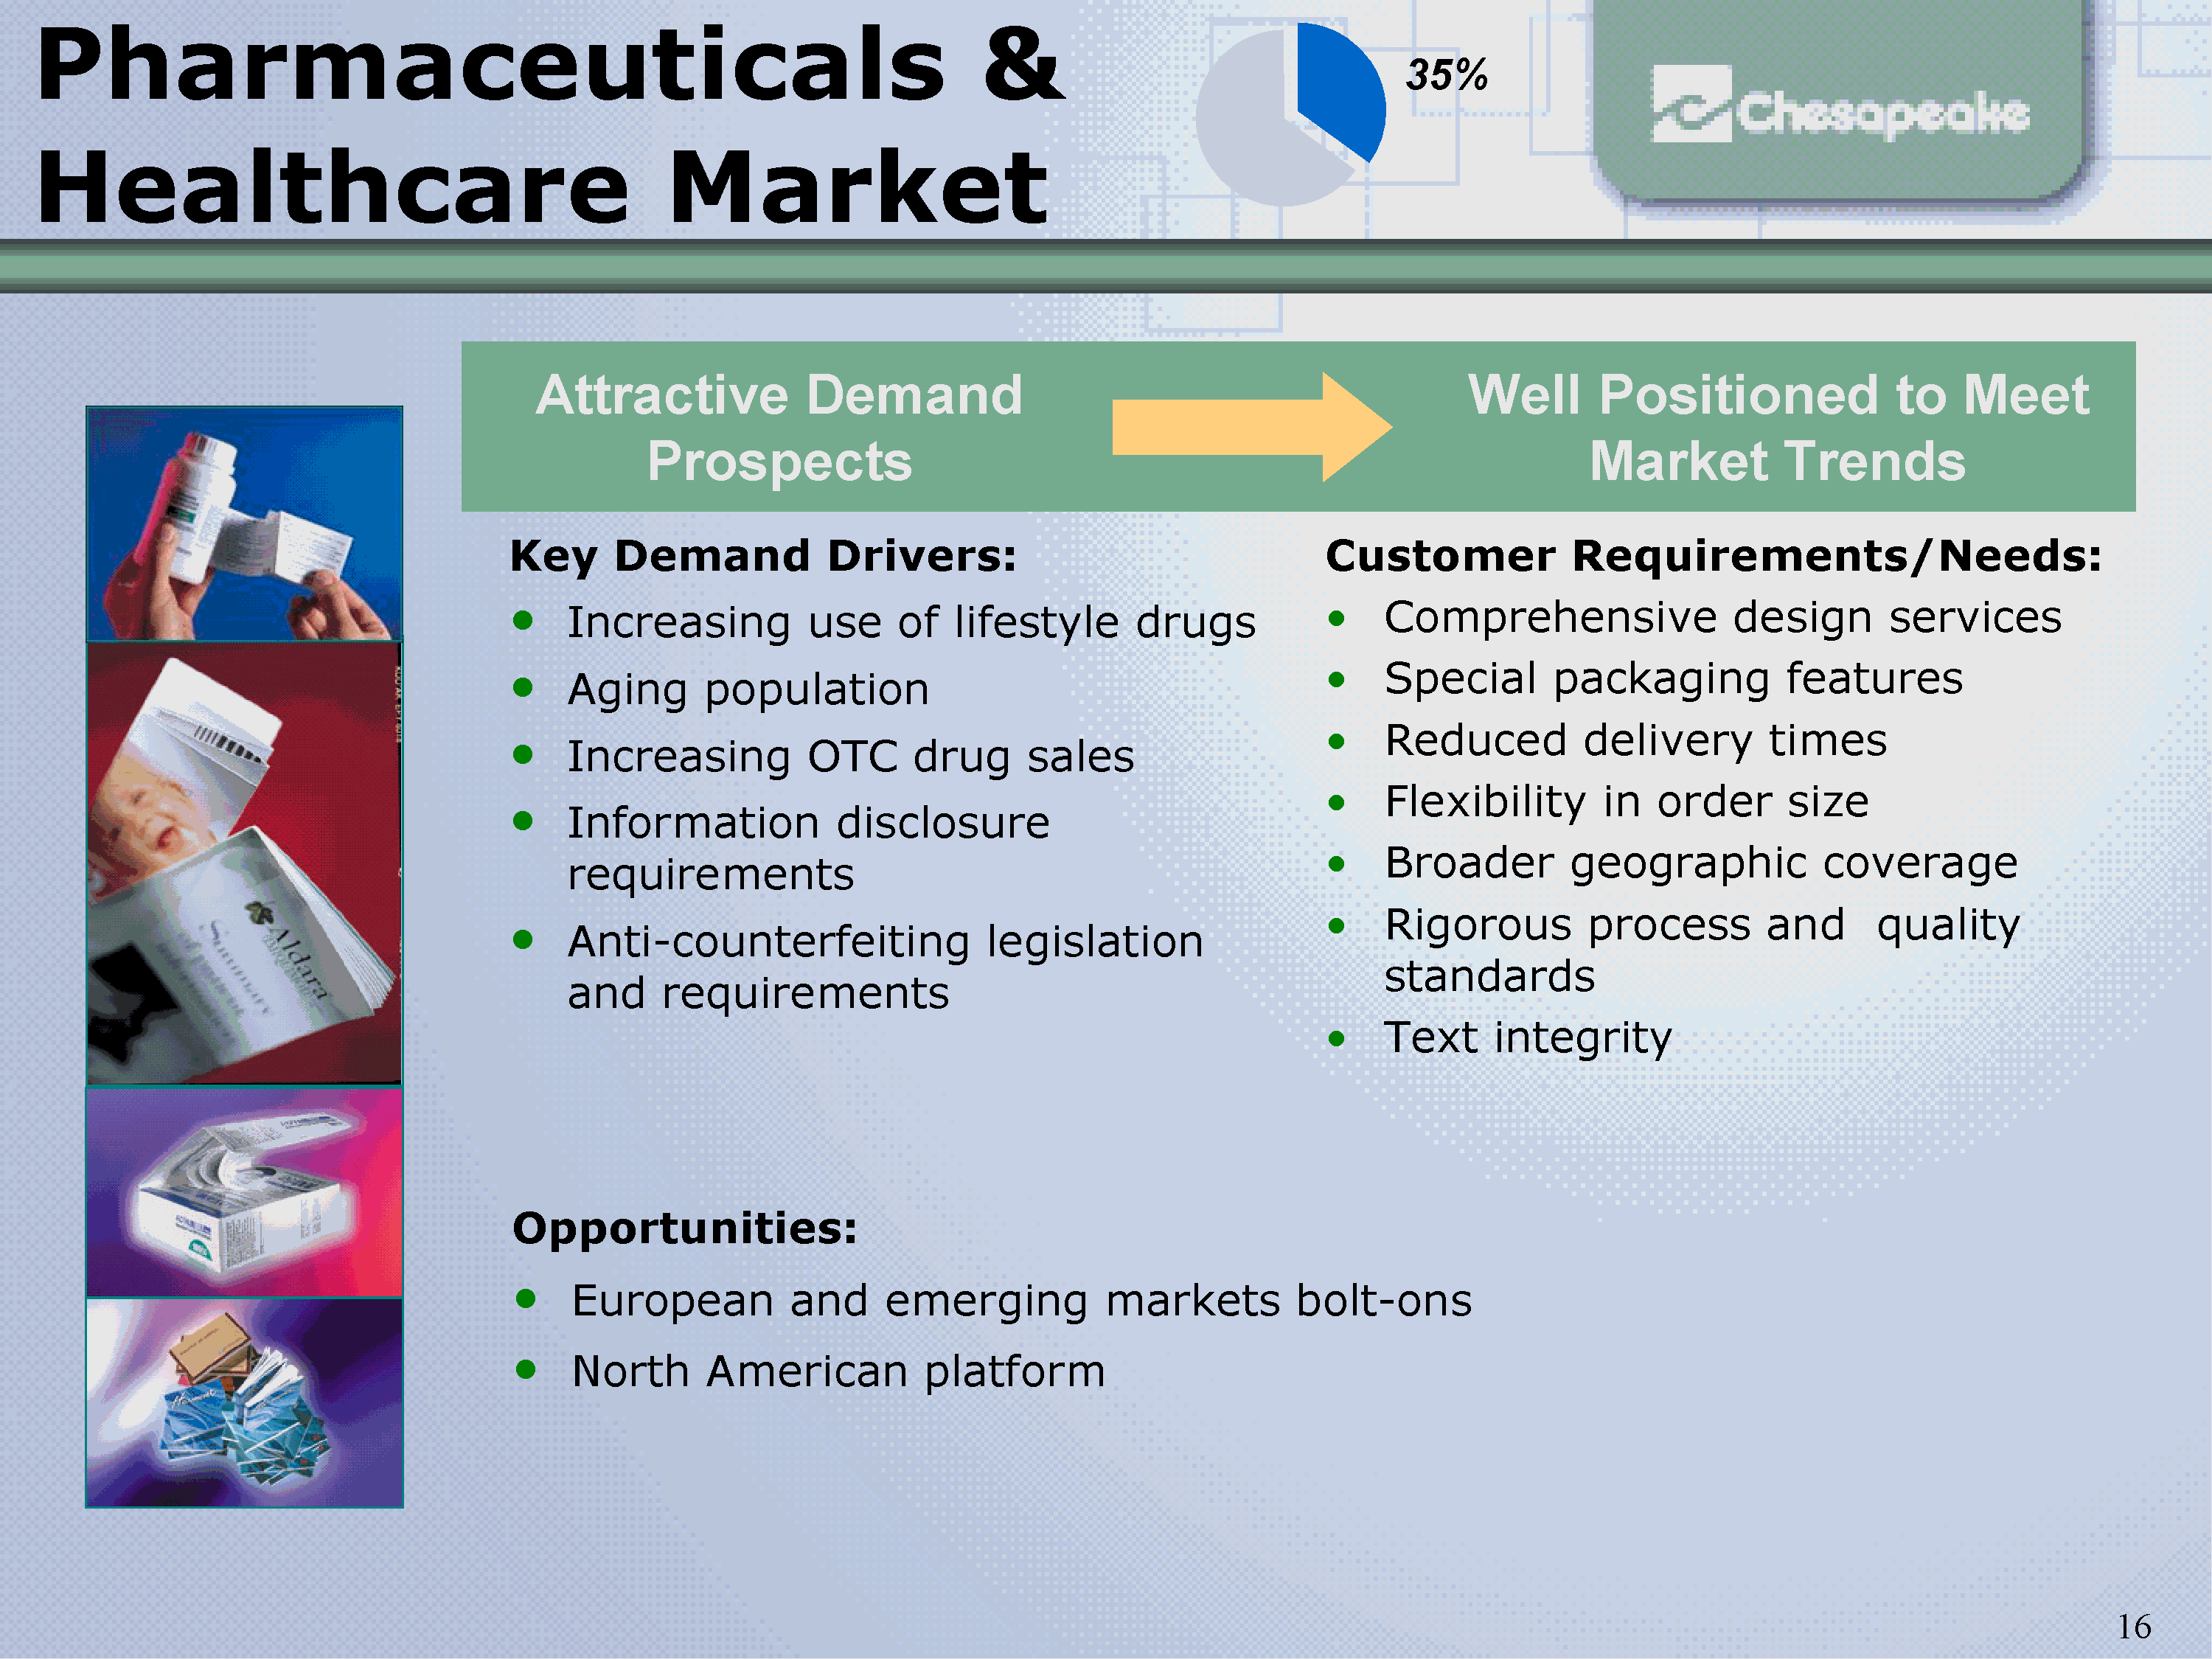
Pharmaceuticals & Healthcare Market
Customer Requirements/Needs:
Comprehensive design services
Special packaging features
Reduced delivery times
Flexibility in order size
Broader geographic coverage
Rigorous process and quality
standards
Text integrity
Key Demand Drivers:
Increasing use of lifestyle drugs
Aging population
Increasing OTC drug sales
Information disclosure
requirements
Anti-counterfeiting legislation
and requirements
Attractive Demand
Prospects
Well Positioned to Meet
Market Trends
35%
Opportunities:
European and emerging markets bolt-ons
North American platform
Slide 17
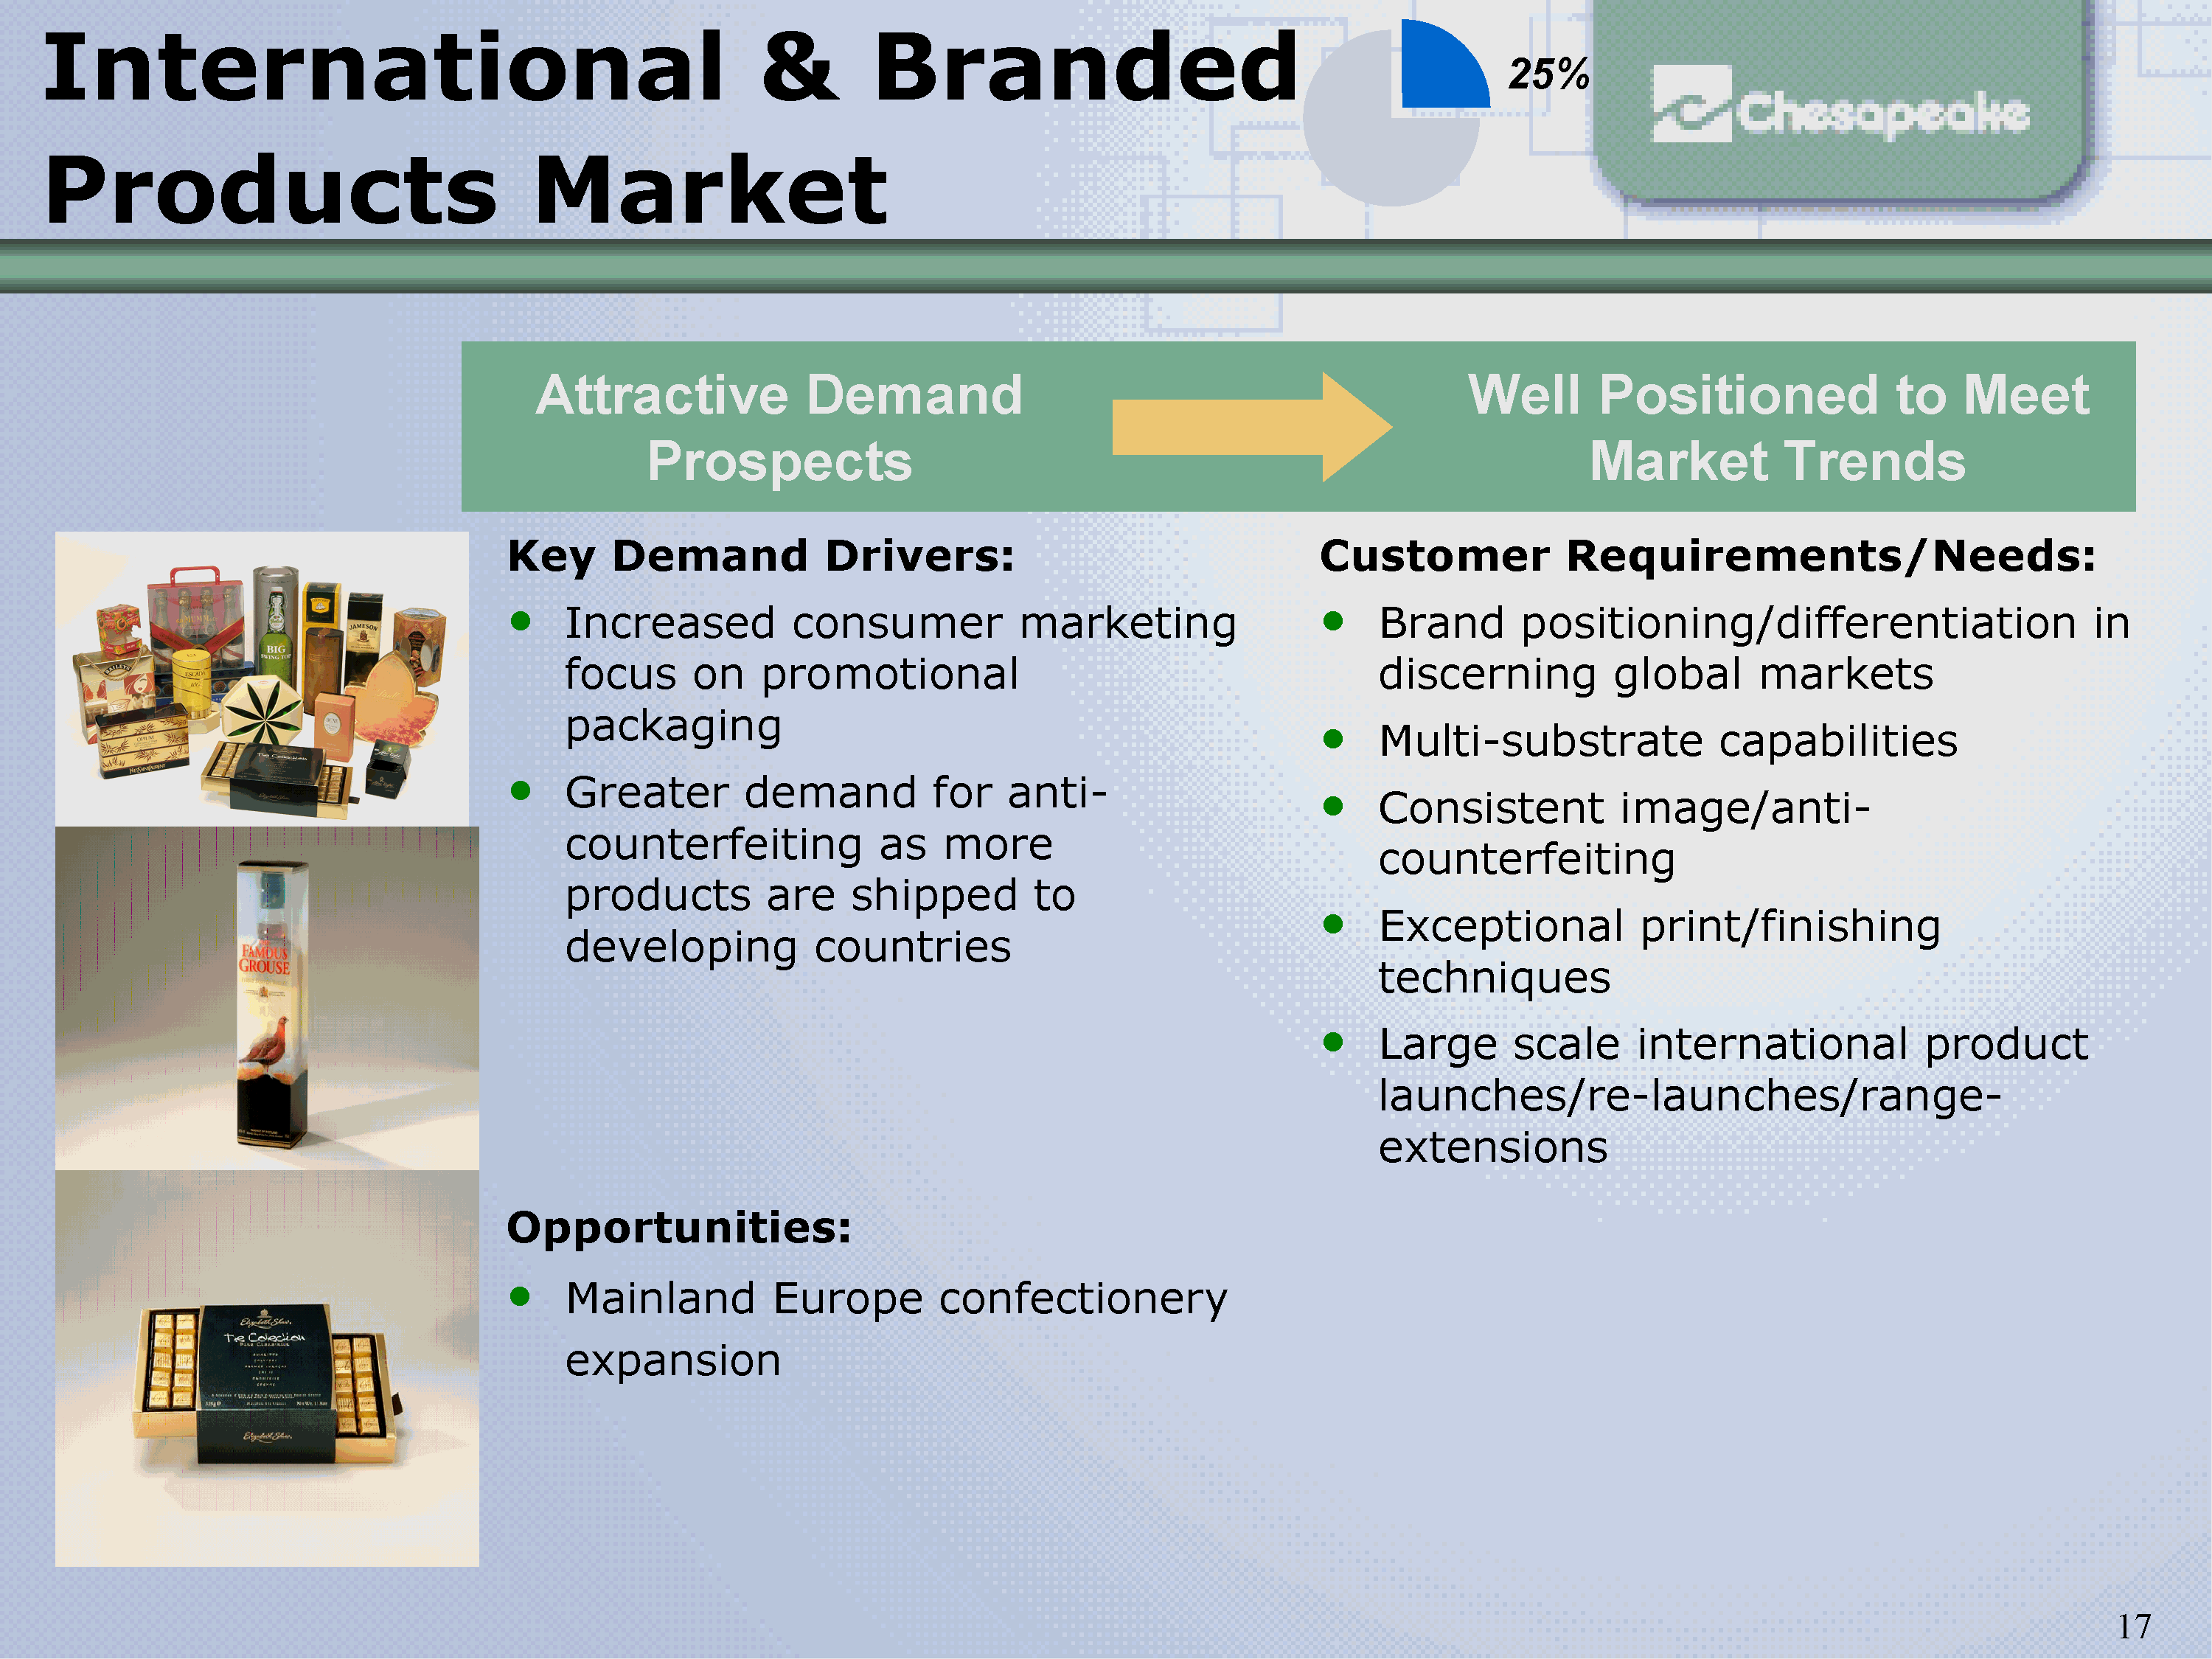
International & Branded
Products Market
Attractive Demand
Prospects
Well Positioned to Meet
Market Trends
Customer Requirements/Needs:
Brand positioning/differentiation in
discerning global markets
Multi-substrate capabilities
Consistent image/anticounterfeiting
Exceptional print/finishing
techniques
Large scale international product
launches/re-launches/rangeextensions
Key Demand Drivers:
Increased consumer marketing
focus on promotional
packaging
Greater demand for anticounterfeiting
as more
products are shipped to
developing countries
Opportunities:
Mainland Europe confectionery
expansion
25%
Slide 18
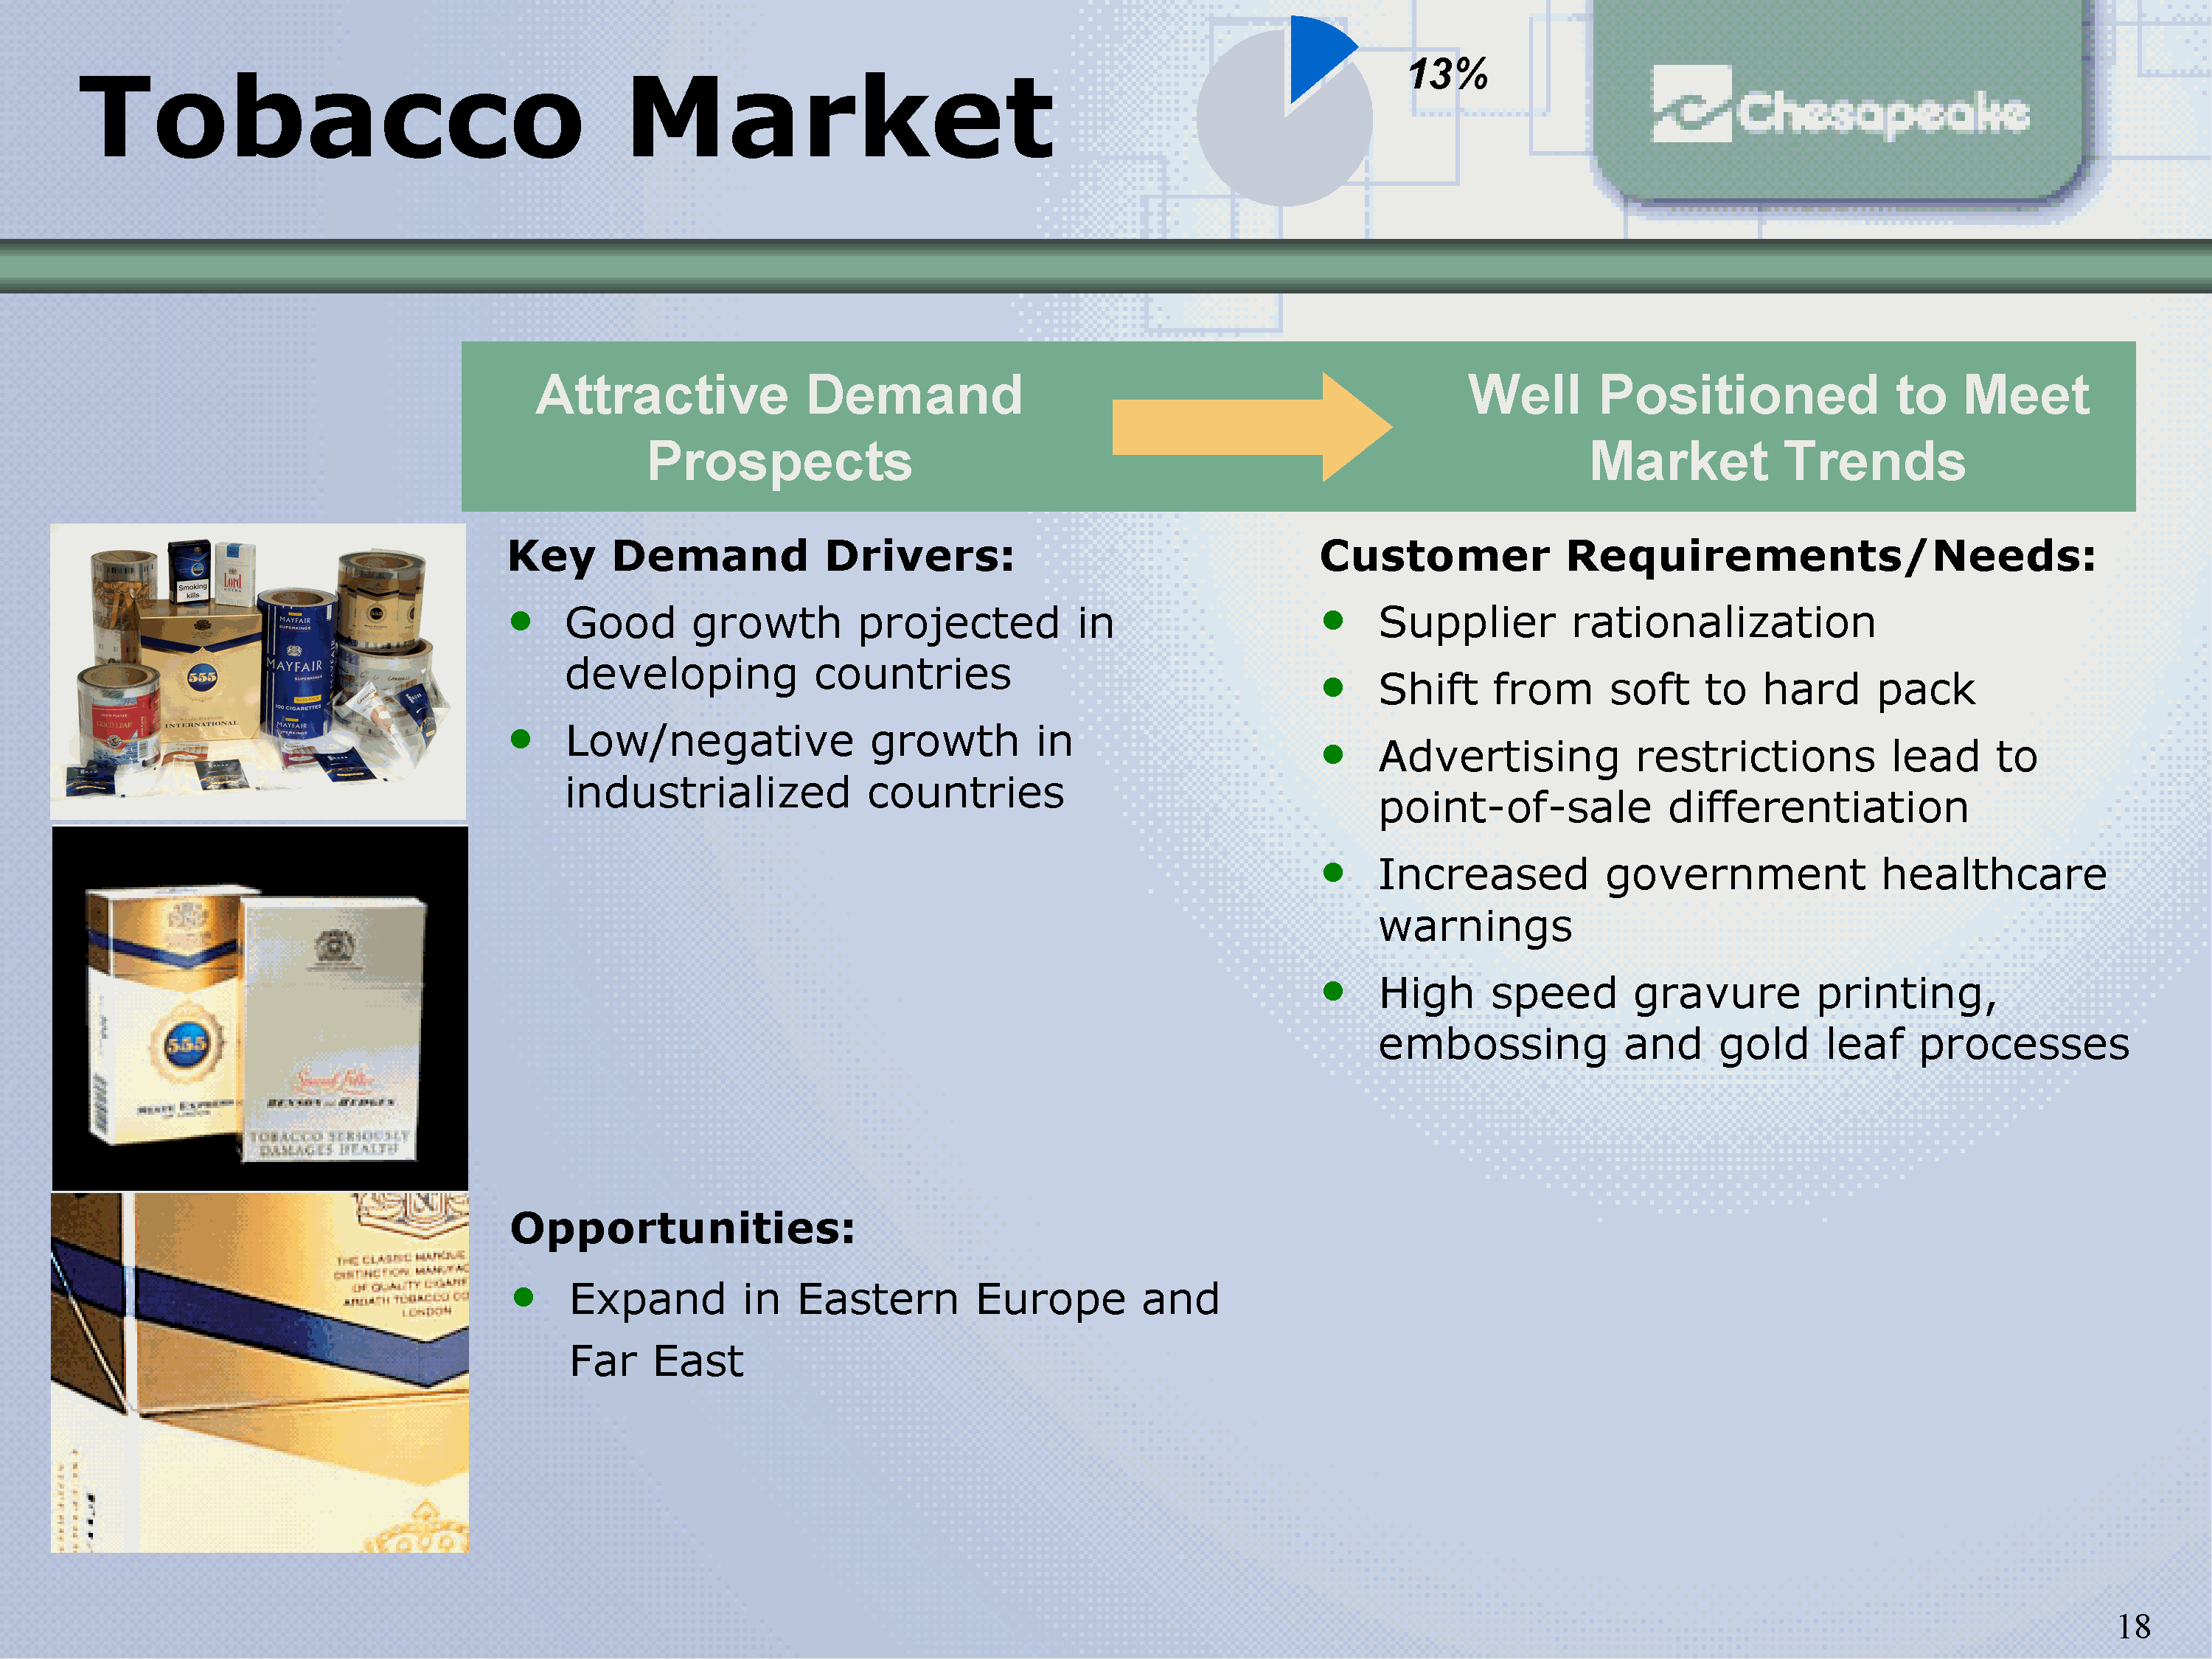
Tobacco Market
Attractive Demand
Prospects
Well Positioned to Meet
Market Trends
Customer Requirements/Needs:
Supplier rationalization
Shift from soft to hard pack
Advertising restrictions lead to
point-of-sale differentiation
Increased government healthcare
warnings
High speed gravure printing,
embossing and gold leaf processes
Key Demand Drivers:
Good growth projected in
developing countries
Low/negative growth in
industrialized countries
Opportunities:
Expand in Eastern Europe and
Far East
13%
Slide 19
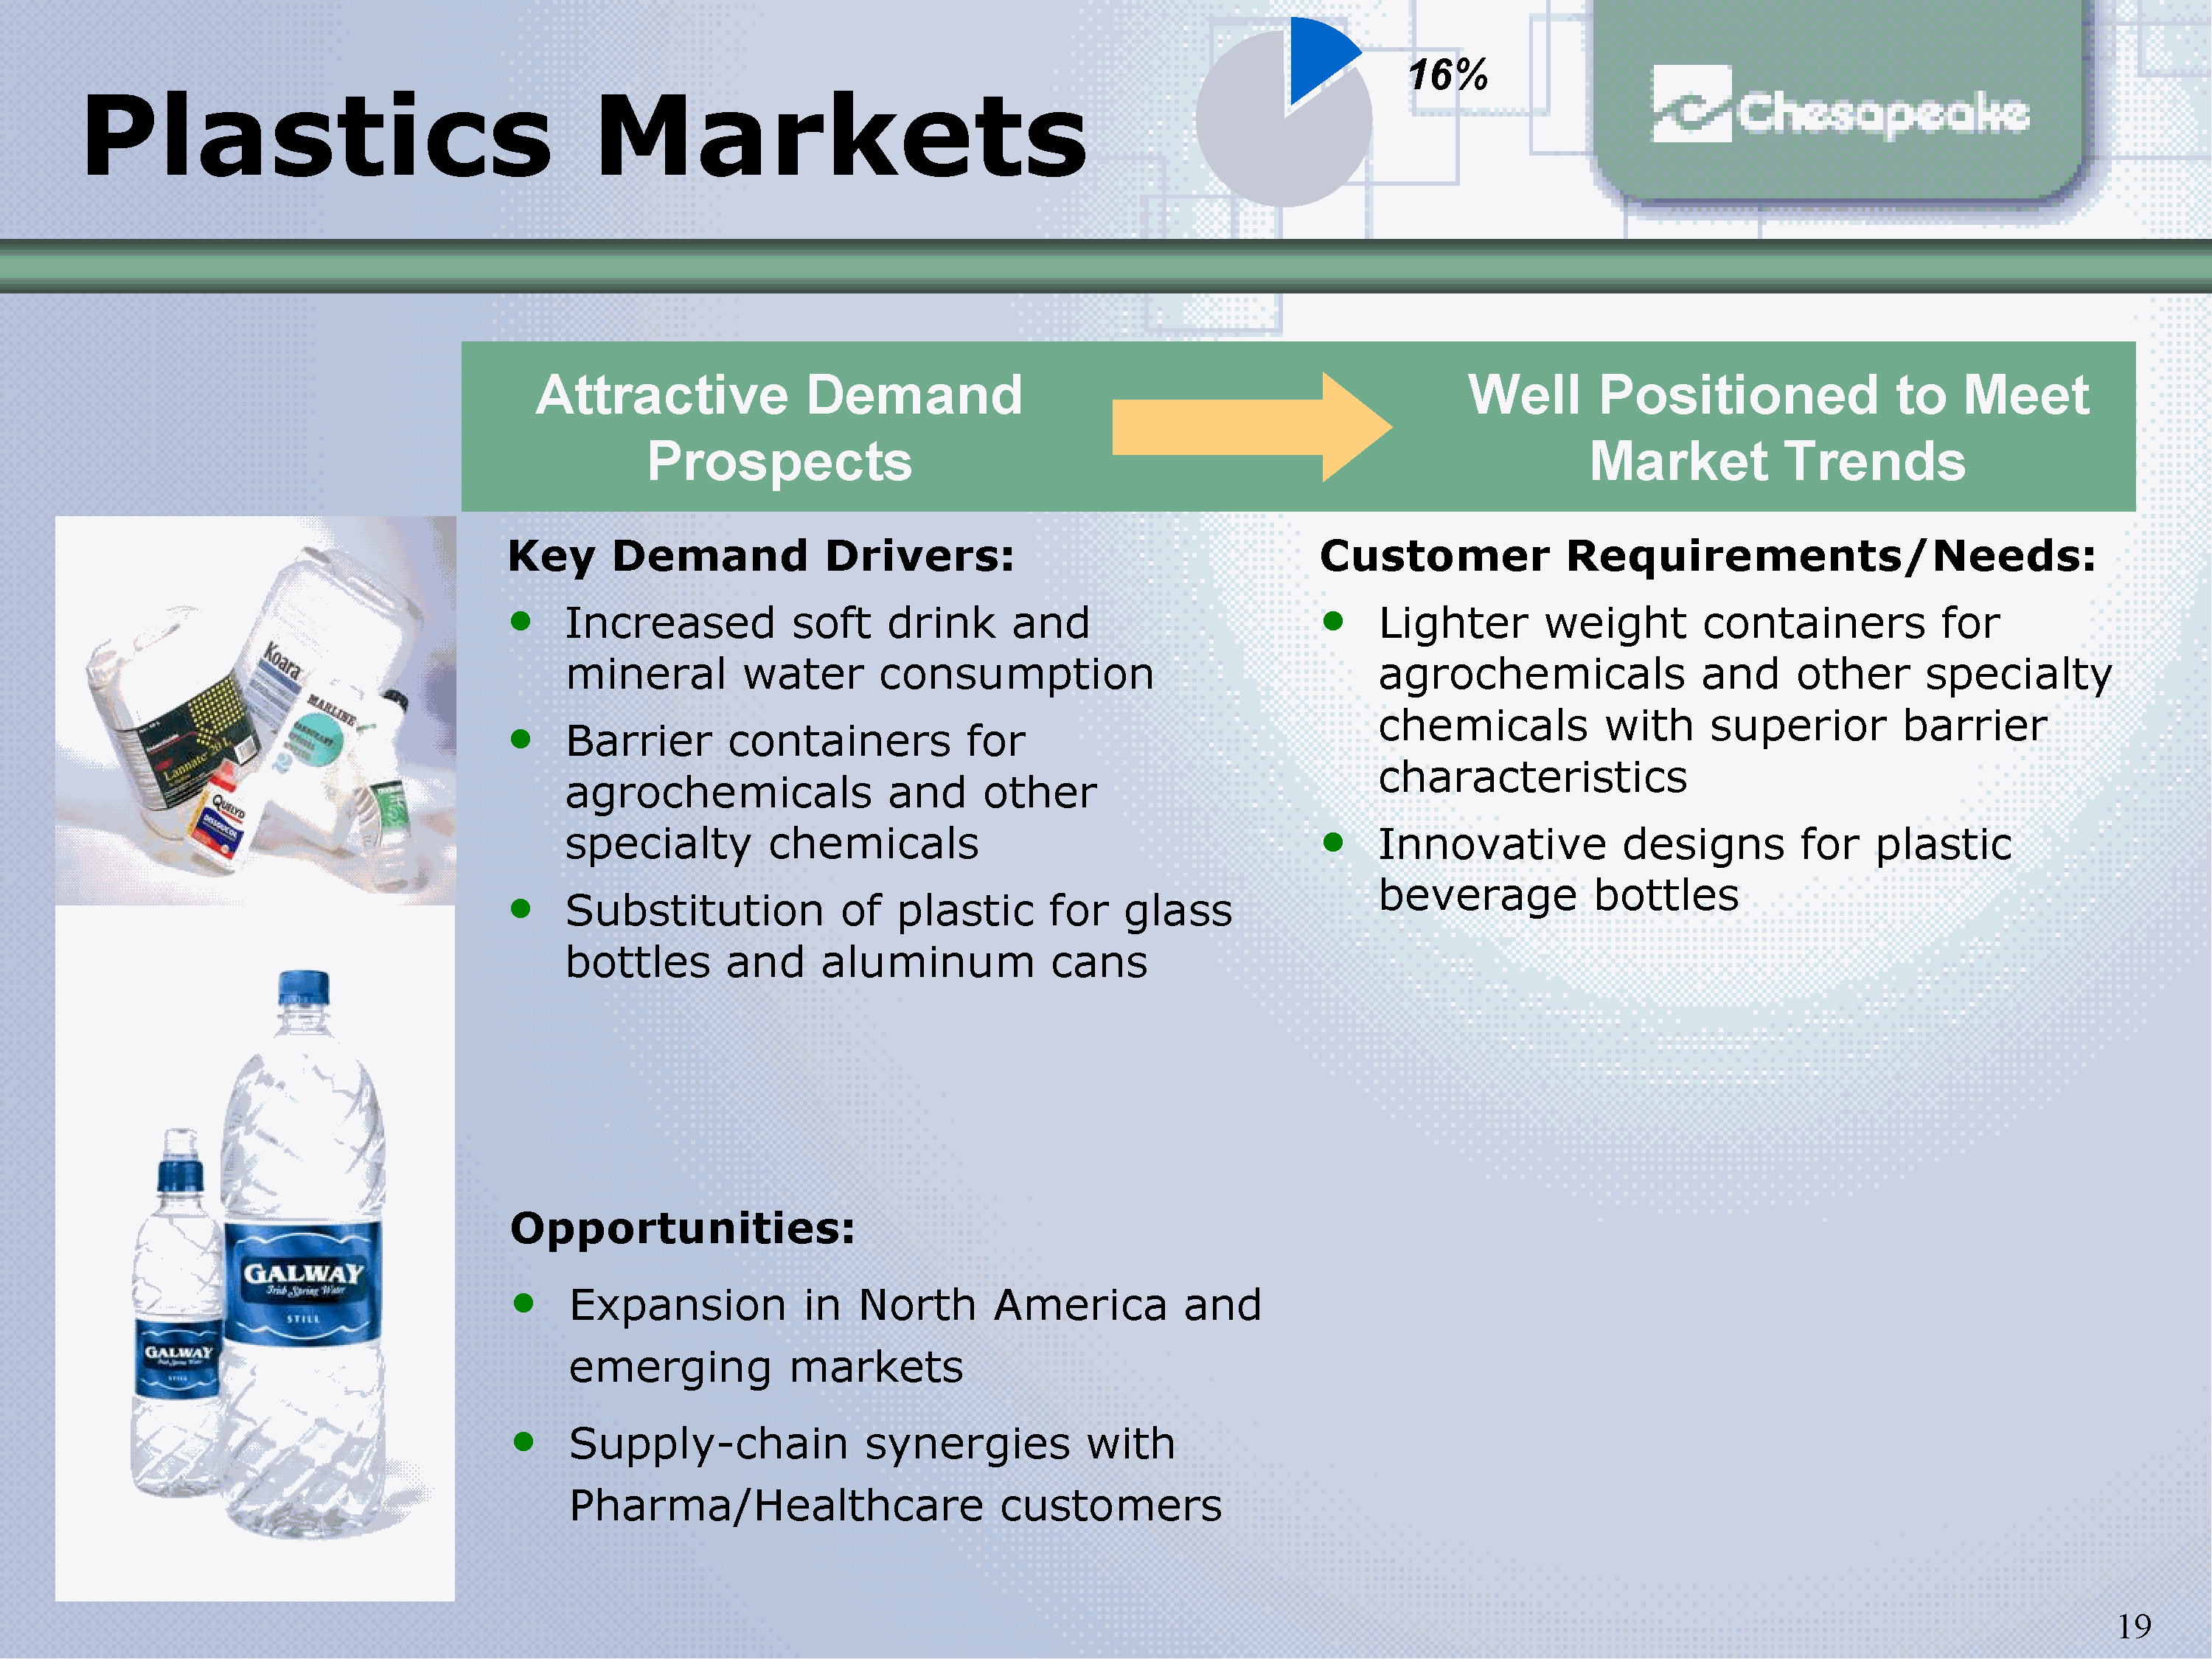
Plastics Markets
Attractive Demand
Prospects
Well Positioned to Meet
Market Trends
Customer Requirements/Needs:
Lighter weight containers for
agrochemicals and other specialty
chemicals with superior barrier
characteristics
Innovative designs for plastic
beverage bottles
Key Demand Drivers:
Increased soft drink and
mineral water consumption
Barrier containers for
agrochemicals and other
specialty chemicals
Substitution of plastic for glass
bottles and aluminum cans
Opportunities:
Expansion in North America and
emerging markets
Supply-chain synergies with
Pharma/Healthcare customers
16%
Slide 20
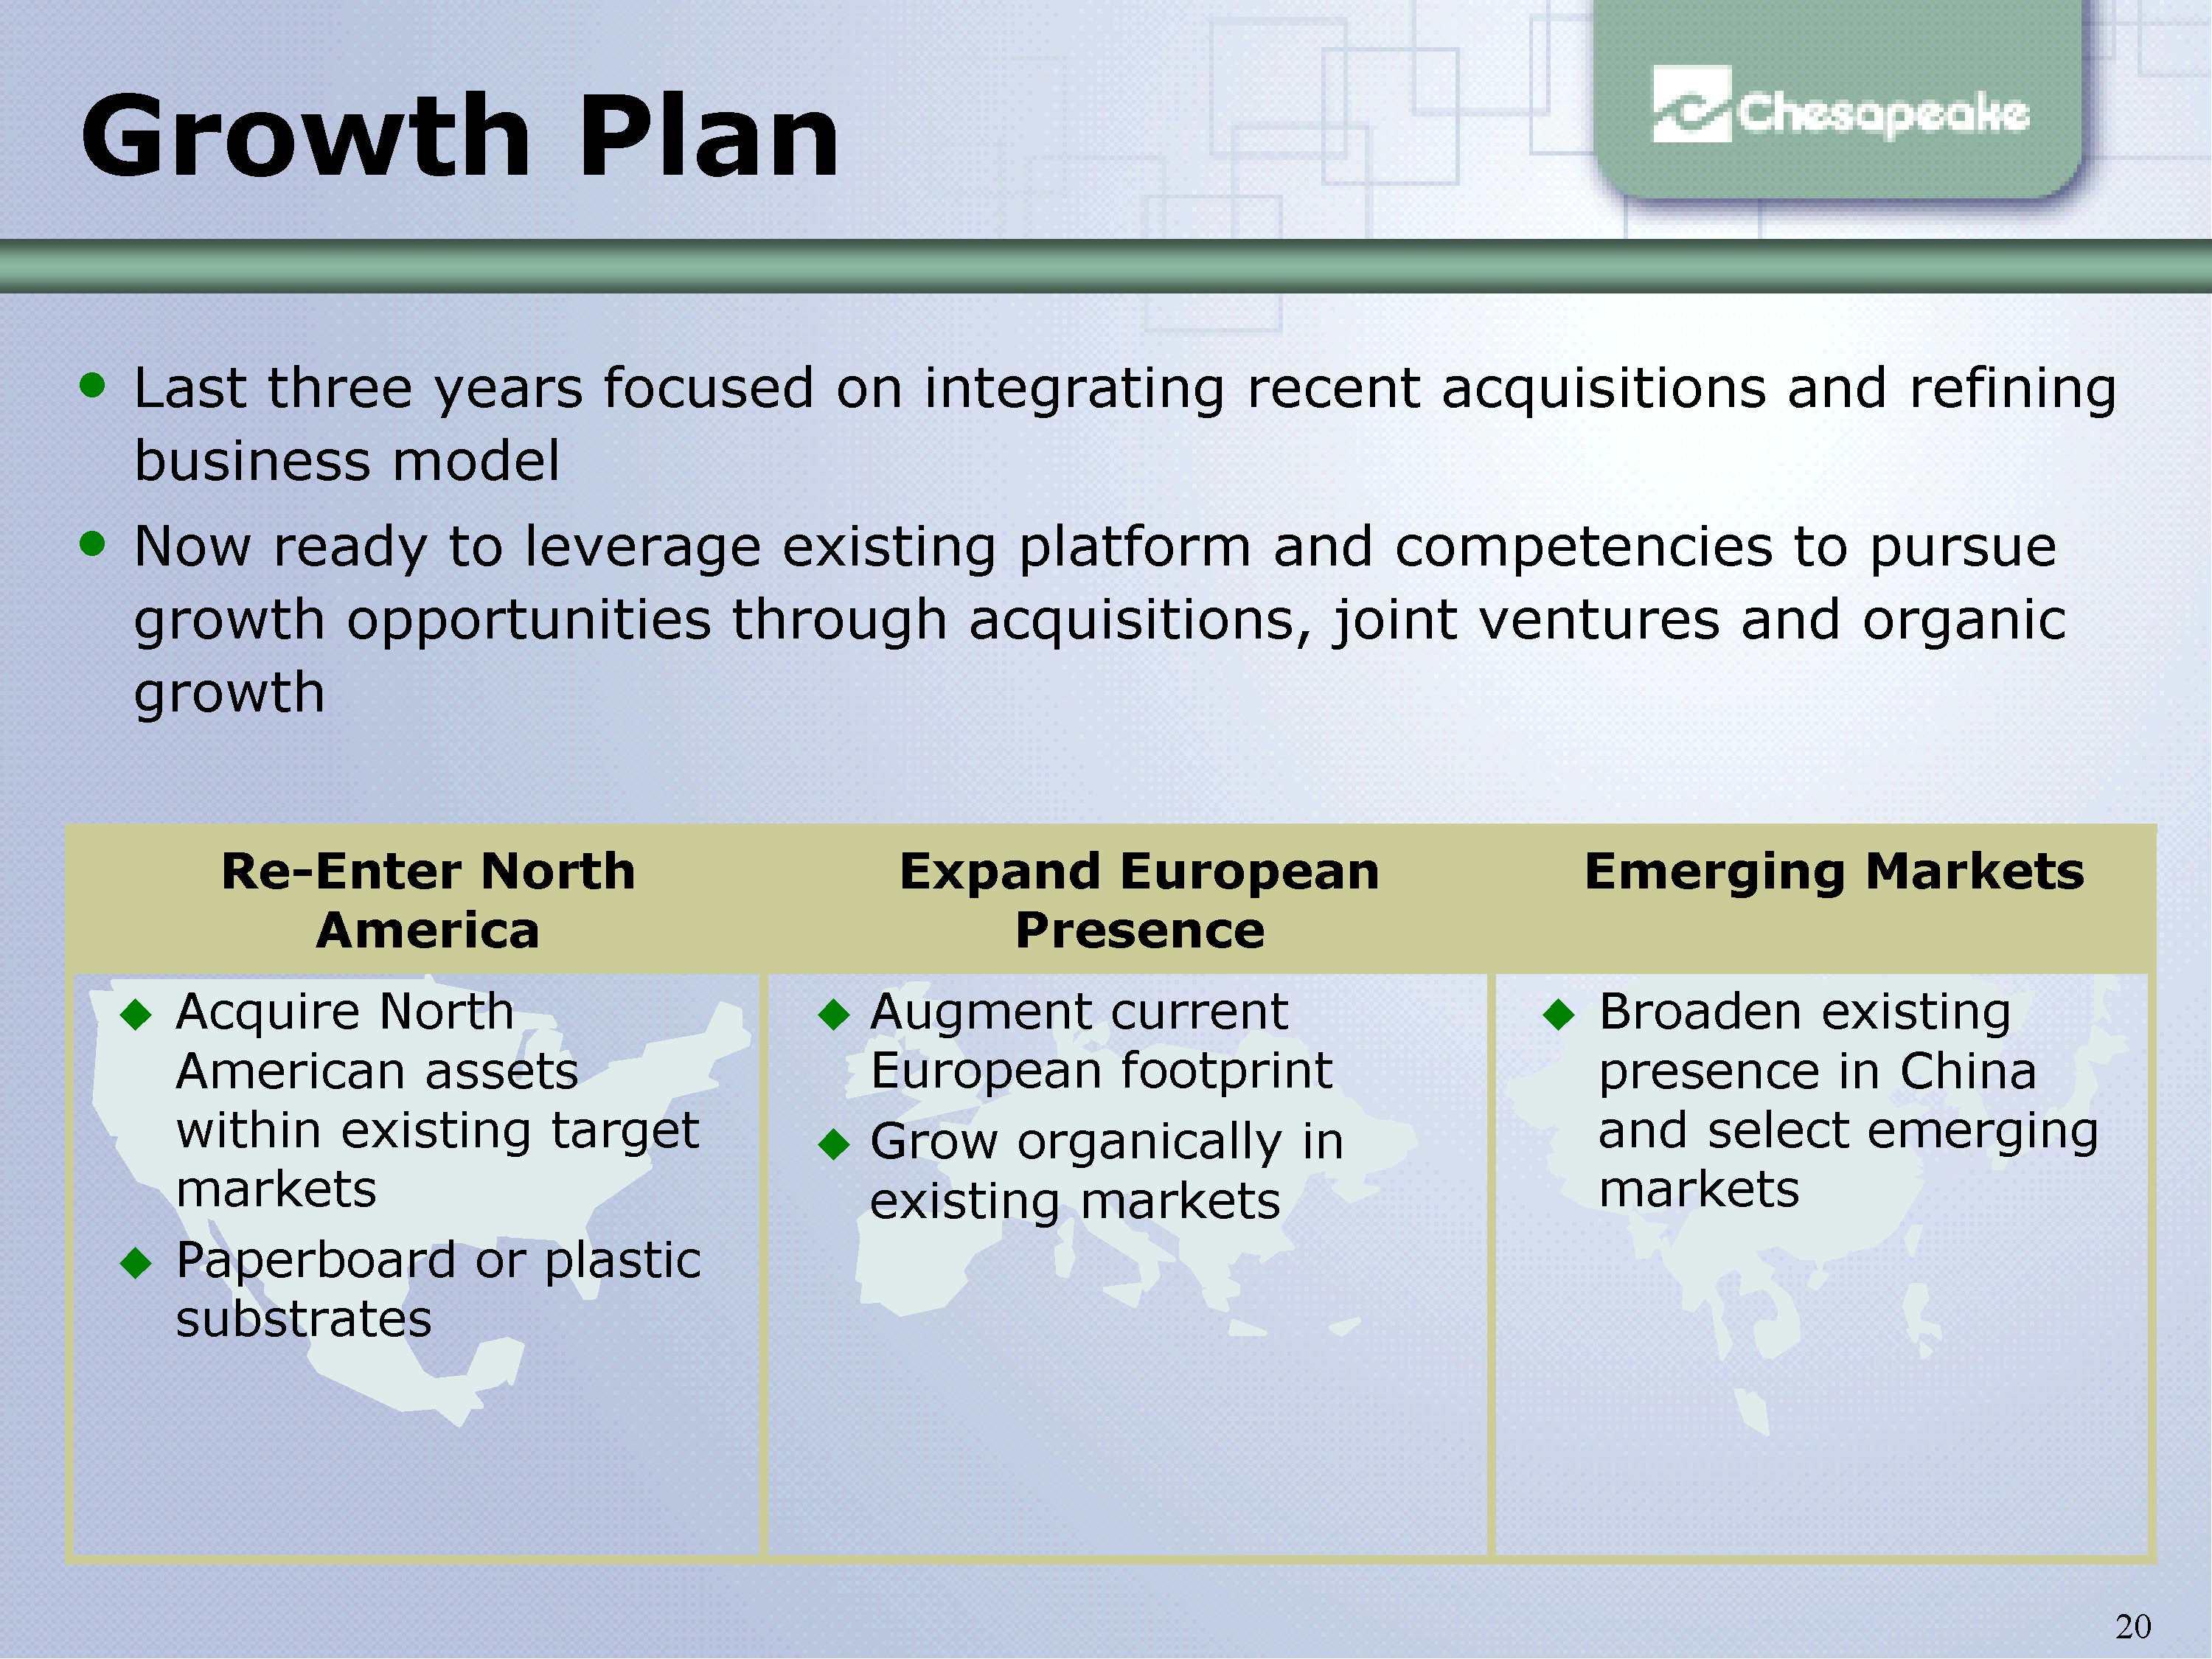
Growth Plan
Broaden existing
presence in China
and select emerging
markets
Augment current
European footprint
Grow organically in
existing markets
Acquire North
American assets
within existing target
markets
Paperboard or plastic
substrates
Emerging Markets Expand European
Presence
Re-Enter North
America
Last three years focused on integrating recent acquisitions and refining
business model
Now ready to leverage existing platform and competencies to pursue
growth opportunities through acquisitions, joint ventures and organic
growth
Slide 21

Financial Review
Joel K. Mostrom
Senior Vice President
Chief Financial Officer
Slide 22
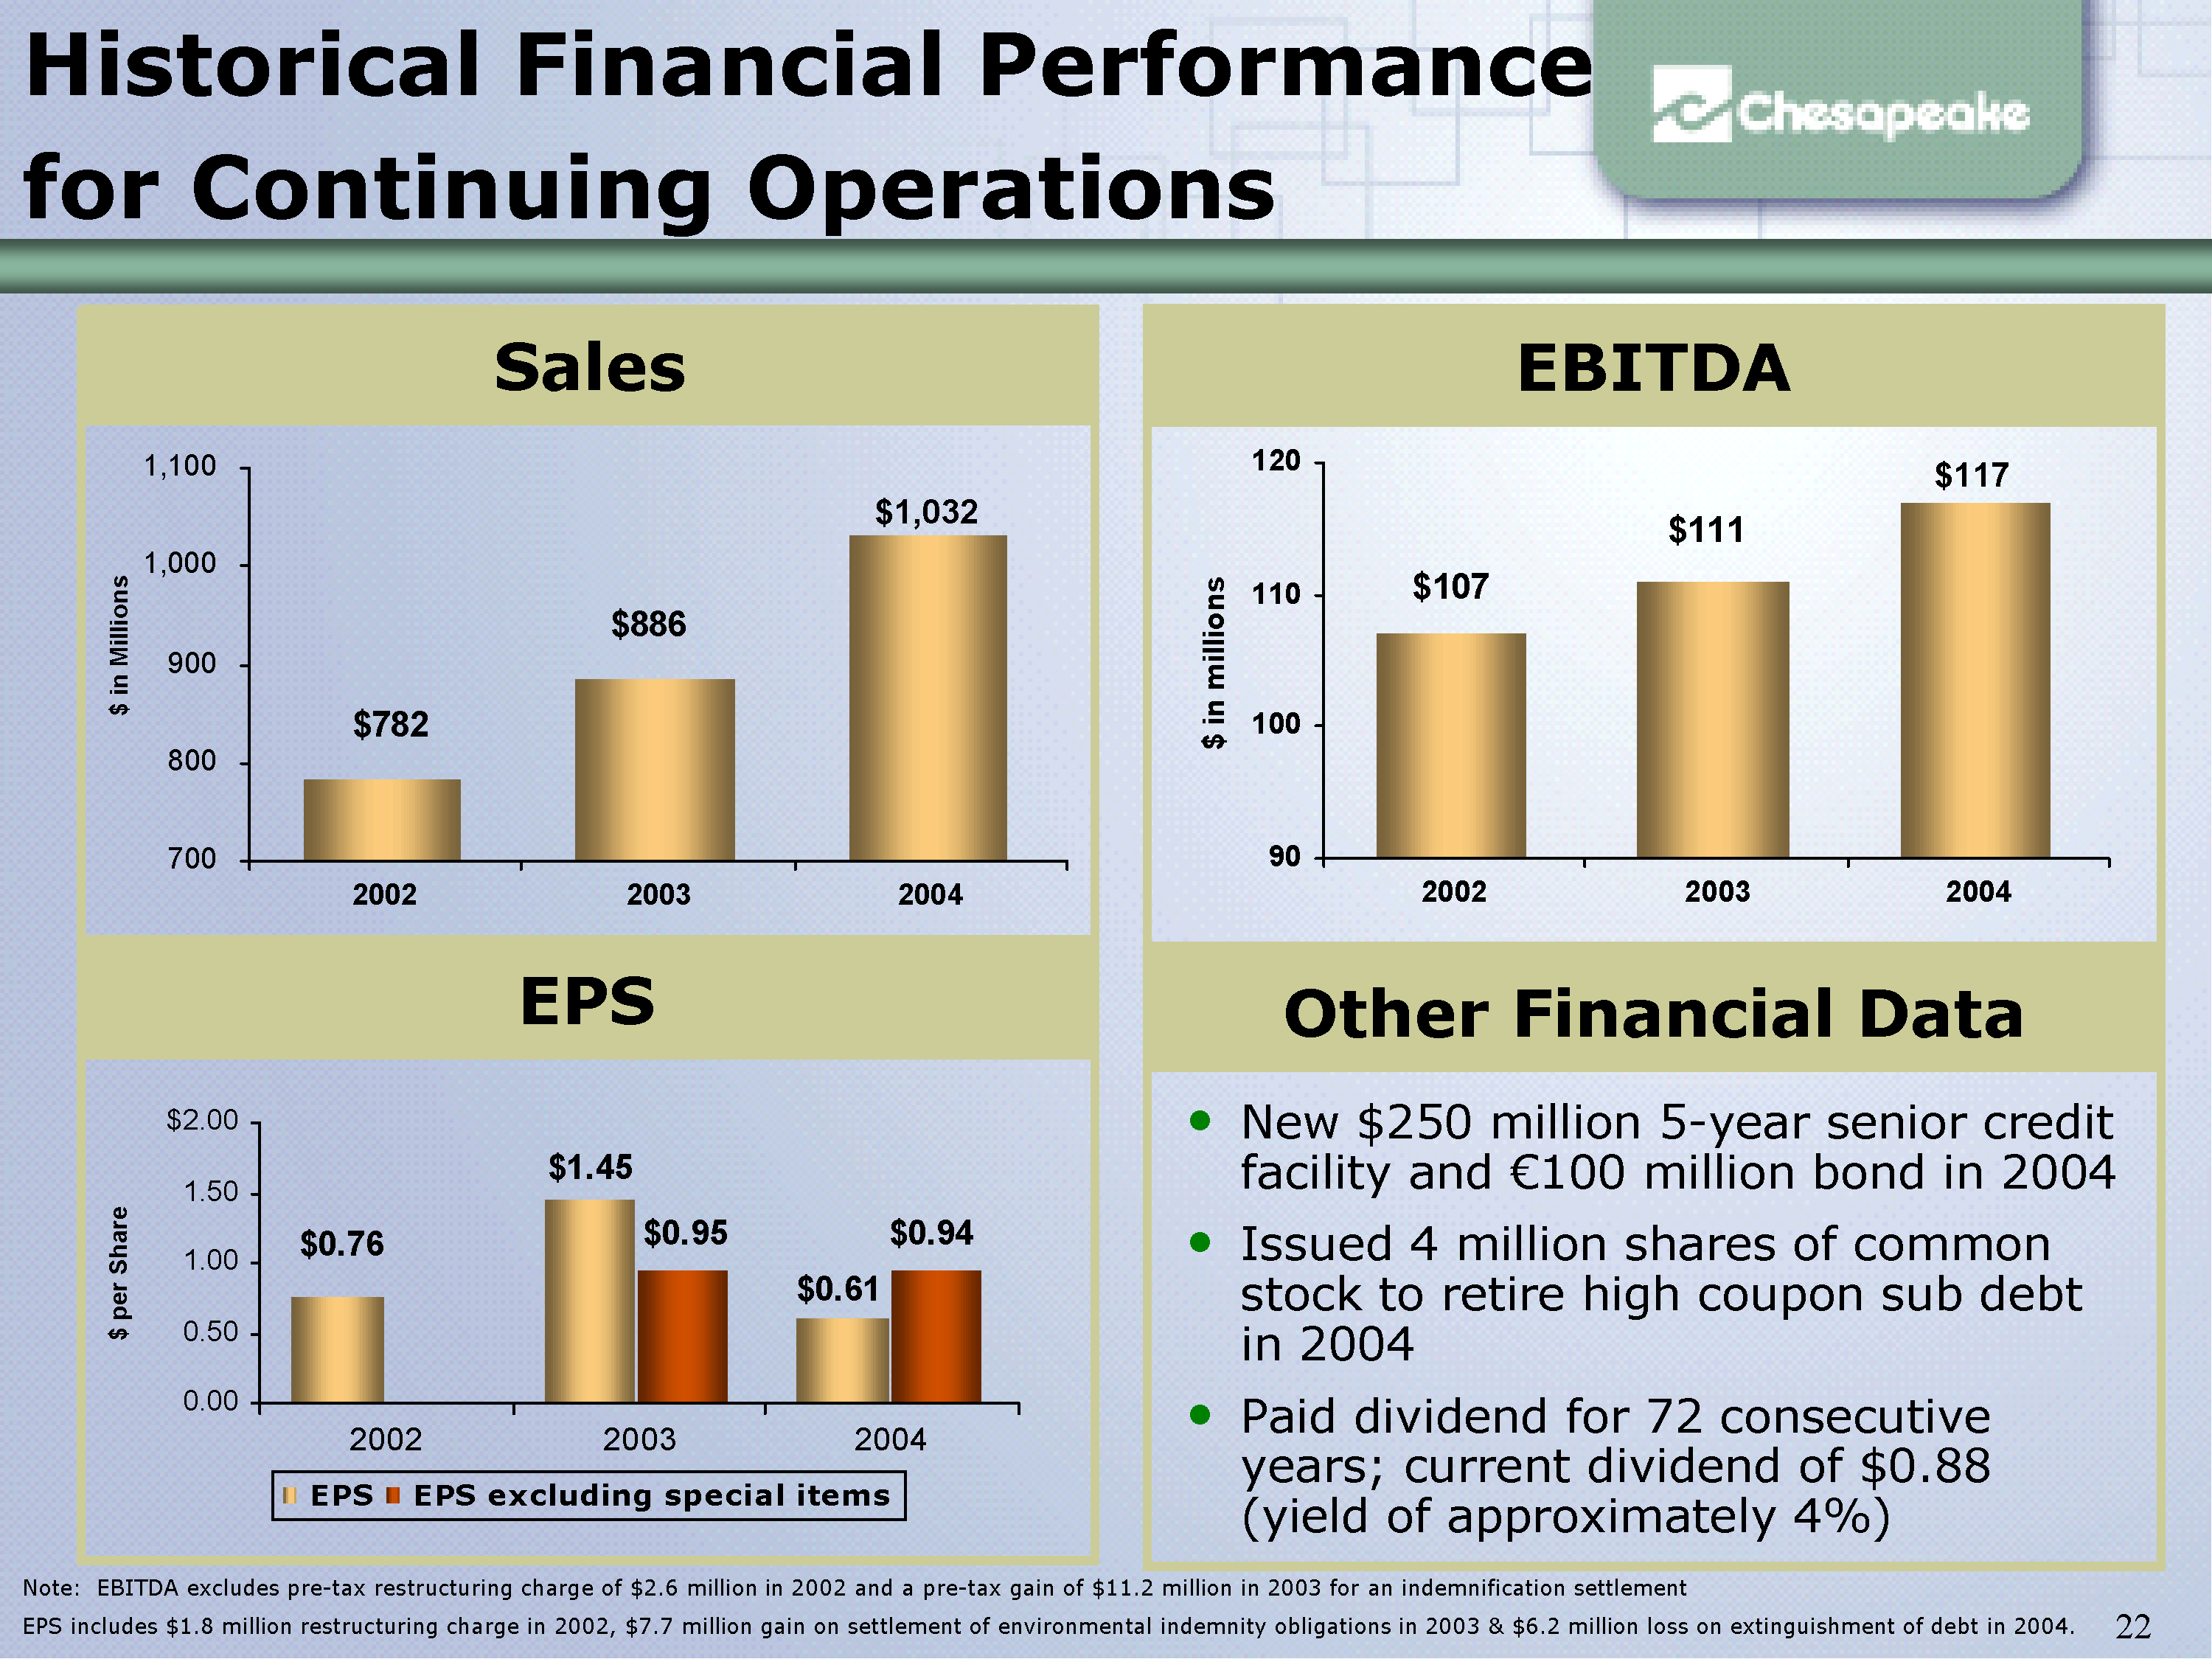
700
800
900
1,000
1,100
2002 2003 2004
$782
$886
$1,032
EBITDA
Other Financial Data
Historical Financial Performance
for Continuing Operations
Sales
EPS
New $250 million 5-year senior credit
facility and Euro 100 million bond in 2004
Issued 4 million shares of common
stock to retire high coupon sub debt
in 2004
Paid dividend for 72 consecutive years; current dividend of $0.88 (yield of approximately 4%)
Note: EBITDA excludes pre-tax restructuring charge of $2.6 million in 2002 and a pre-tax gain of $11.2 million in 2003 for an indemnification settlement
EPS includes $1.8 million restructuring charge in 2002, $7.7 million gain on settlement of environmental indemnity obligations in 2003 & $6.2 million loss on extinguishment of debt in 2004.
90
100
110
120
2002 2003 2004
$ in millions
$107
$111
$0.94 $0.76
$1.45
$0.61
$0.95
0.00
0.50
1.00
1.50
$2.00
2002 2003 2004
EPS EPS excluding special items
$1,032
$117
$ in Millions $ per Share
Slide 23
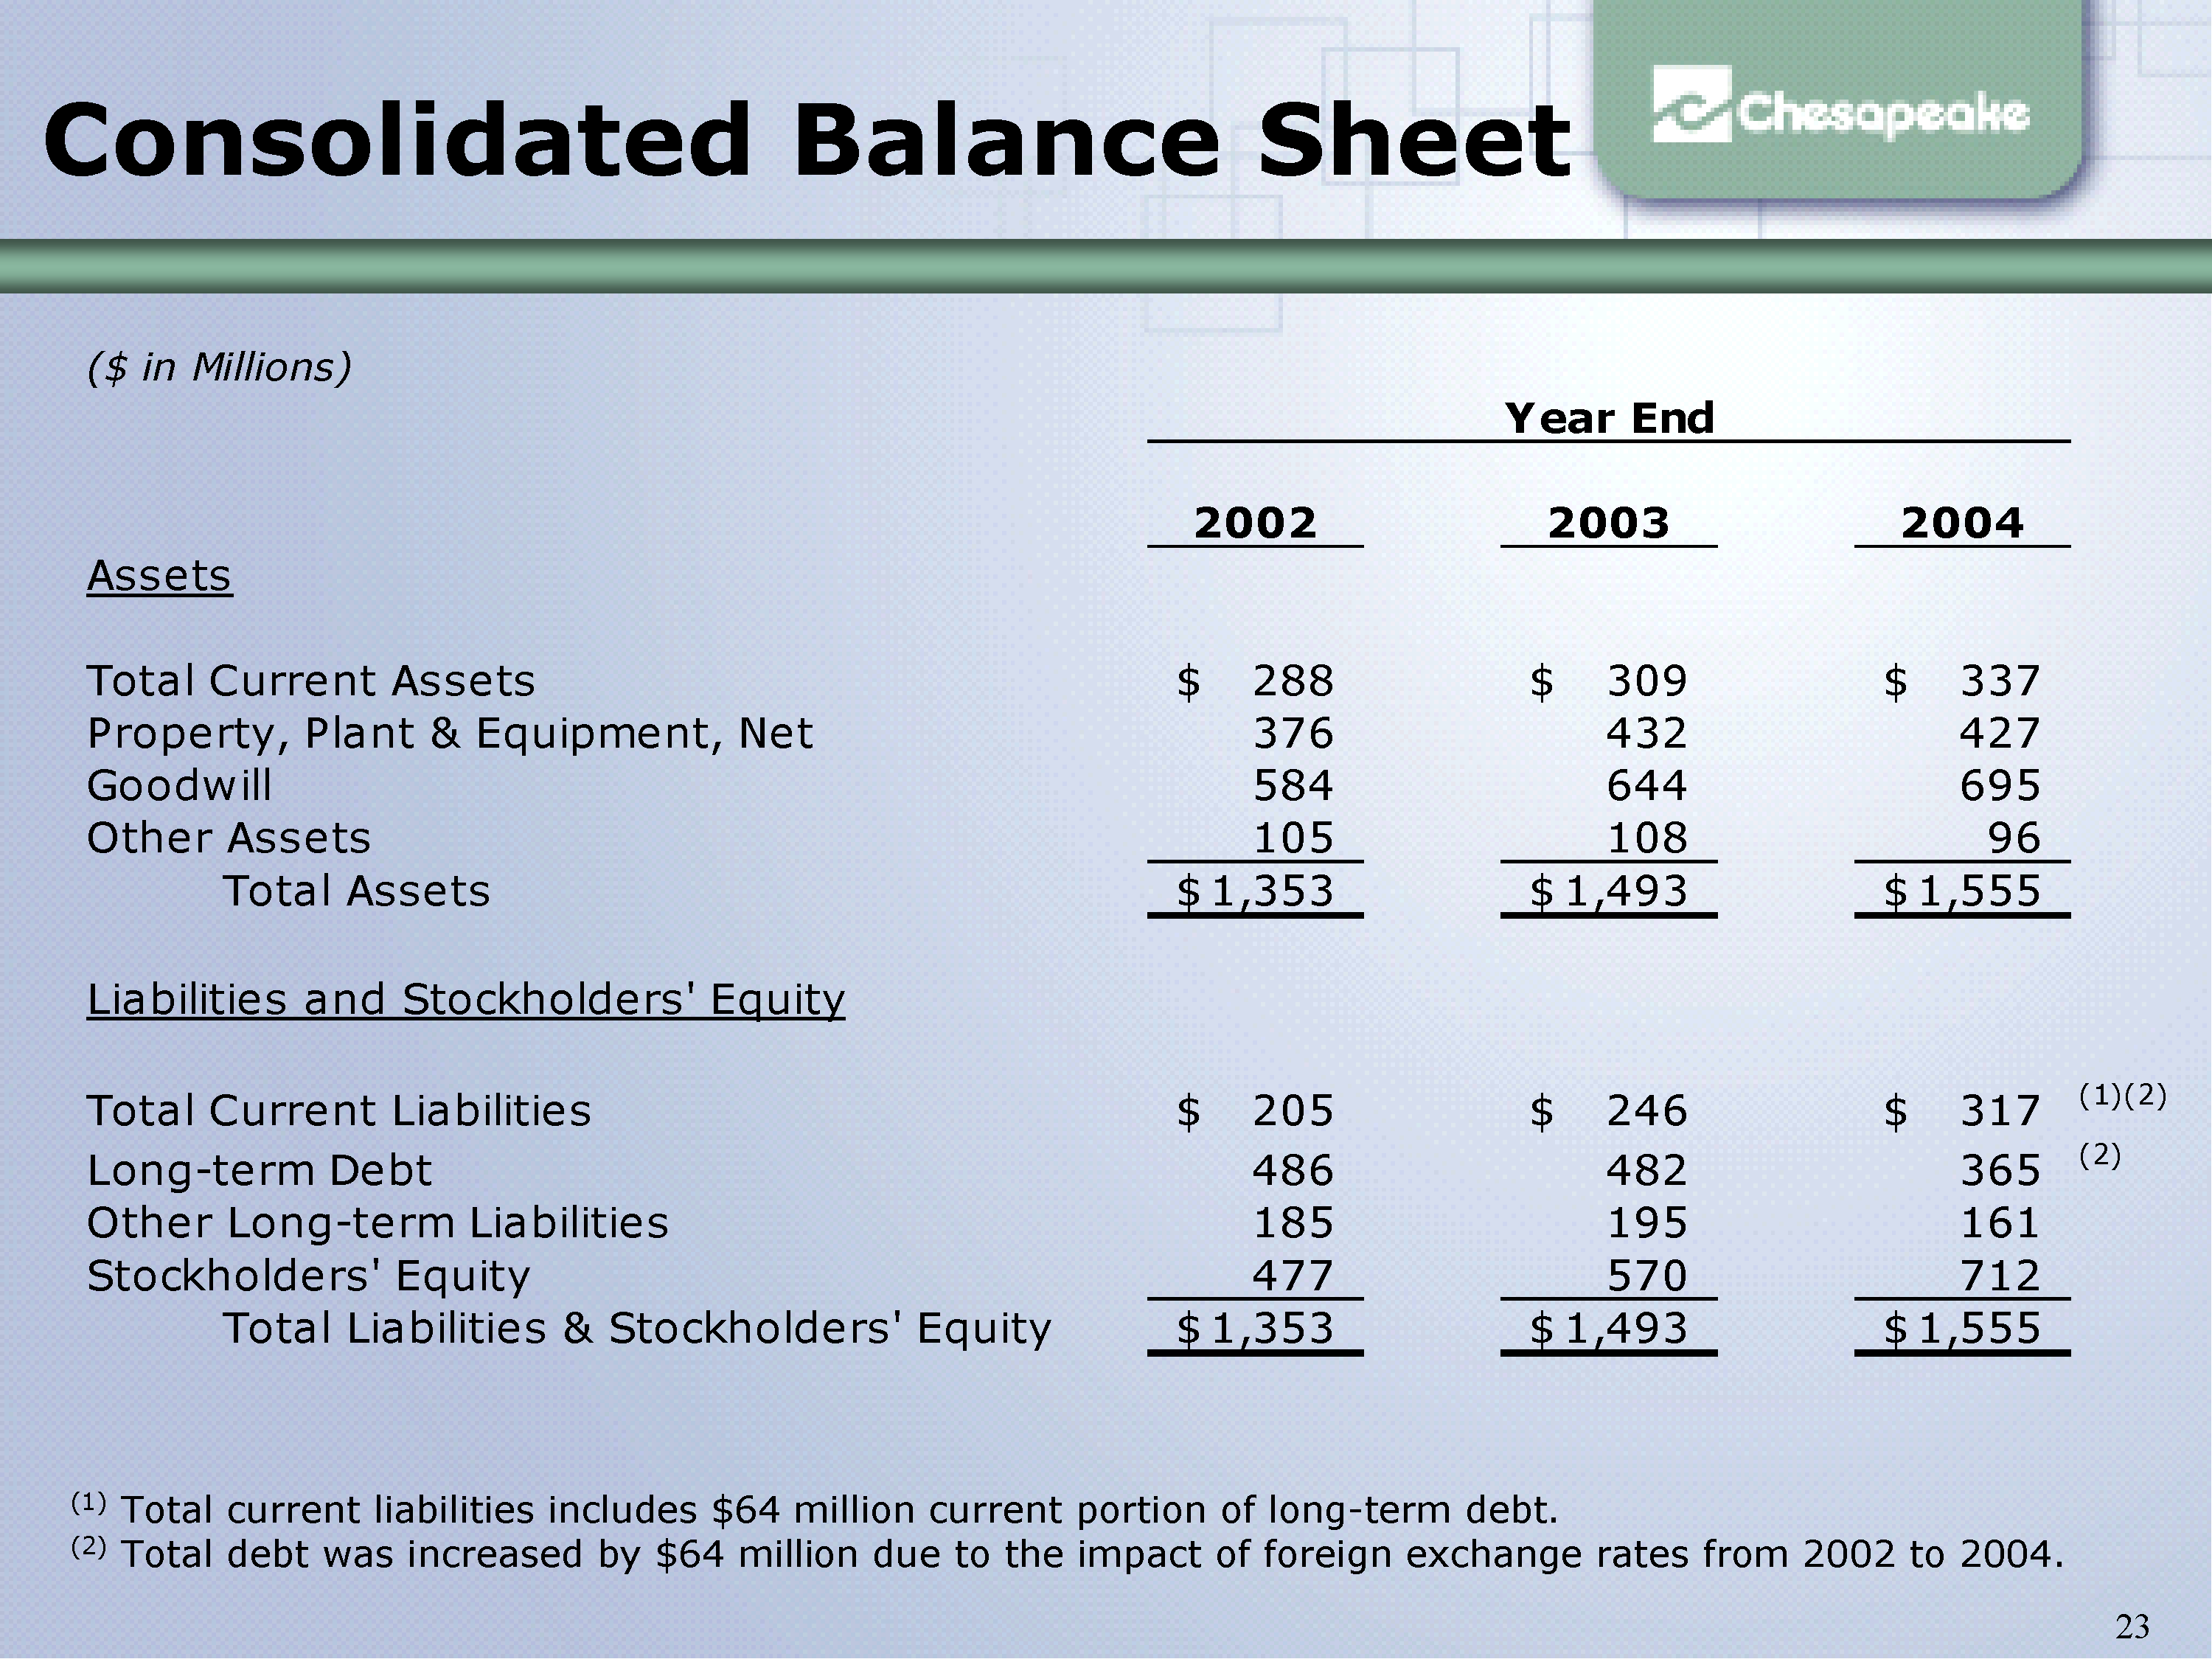
($ in Millions)
Year End
2002 2003 2004
Assets
Total Current Assets $ 288 $ 309 $ 337
Property, Plant & Equipment, Net 376 432 427
Goodwill 584 644 695
Other Assets 105 108 96
Total Assets $ 1,353 $ 1,493 $ 1,555
Liabilities and Stockholders' Equity
Total Current Liabilities $ 205 $ 246 $ 317 (1)(2)
Long-term Debt 486 482 365 (2)
Other Long-term Liabilities 185 195 161
Stockholders' Equity 477 570 712
Total Liabilities & Stockholders' Equity 1,353 $ 1,493 $ 1,555 $
Consolidated Balance Sheet
(1) Total current liabilities includes $64 million current portion of long-term debt.
(2) Total debt was increased by $64 million due to the impact of foreign exchange rates from 2002 to 2004.
Slide 24
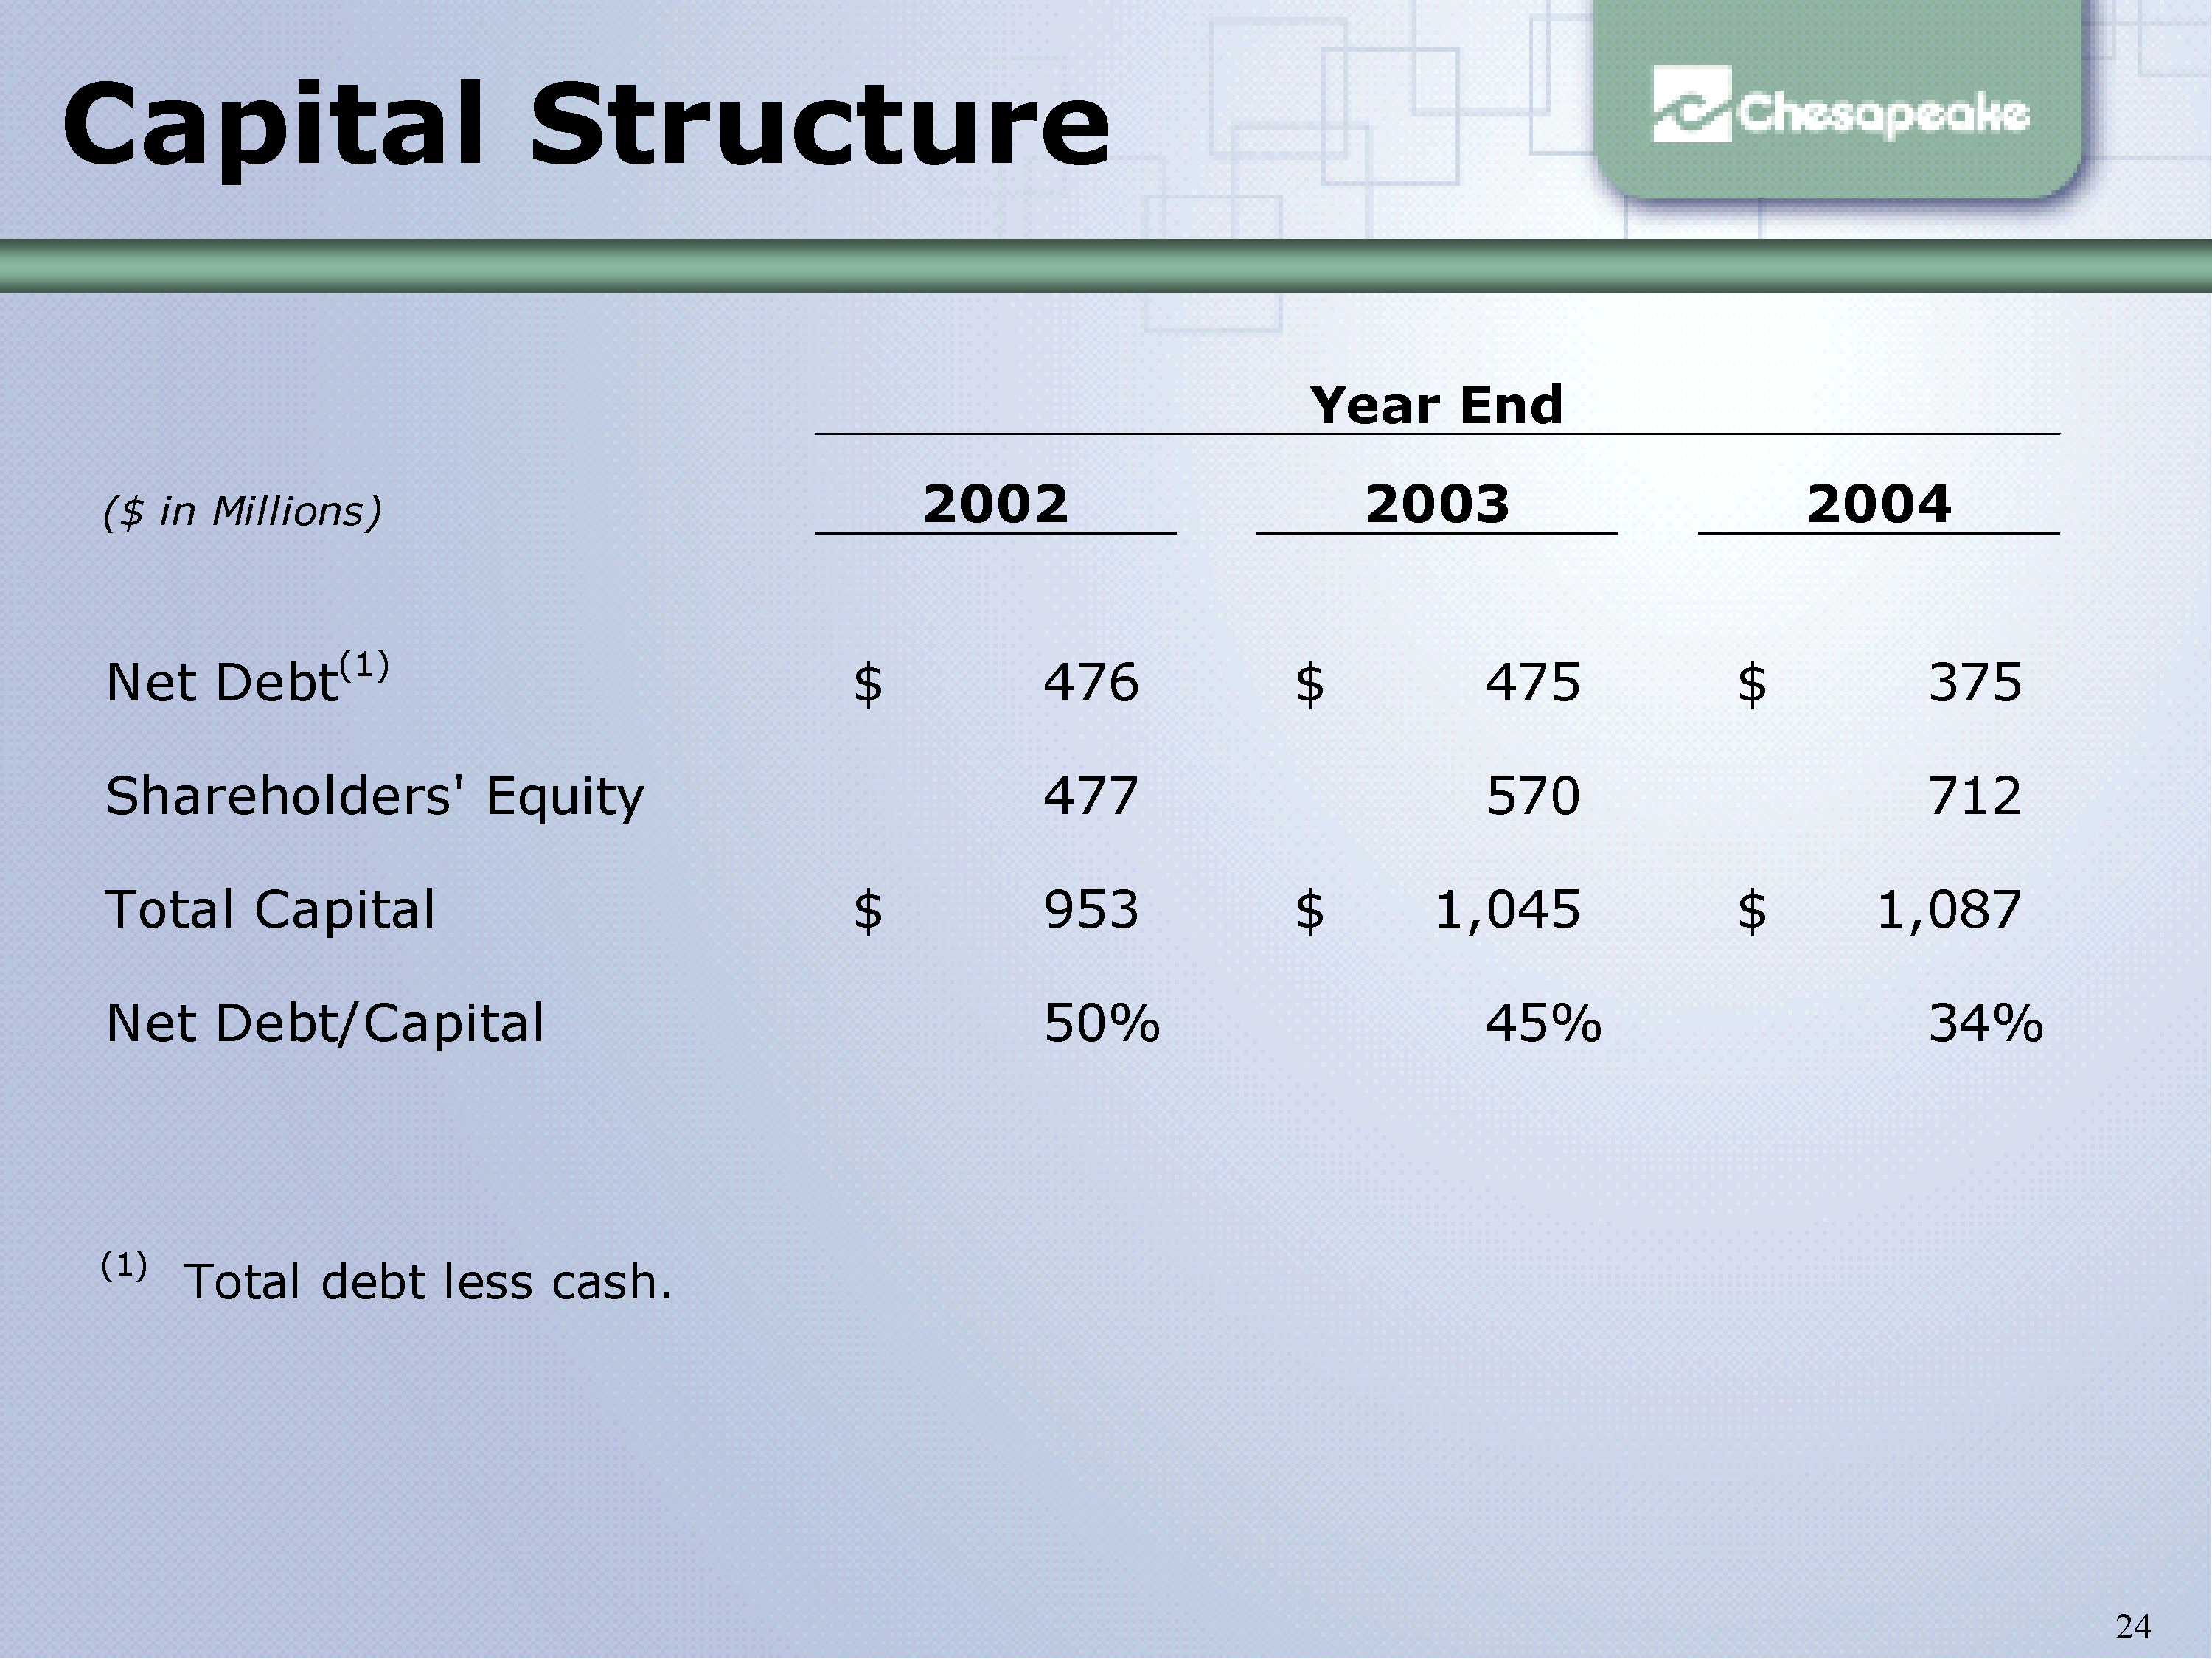
Capital Structure
($ in Millions)2002 2003 2004
Net Debt(1) $ 476 $ 475 $ 375
Shareholders' Equity 477 570 712
Total Capital $ 953 $ 1,045 $ 1,087
Net Debt/Capital 50% 45% 34%
(1) Total debt less cash.
Year End
Slide 25
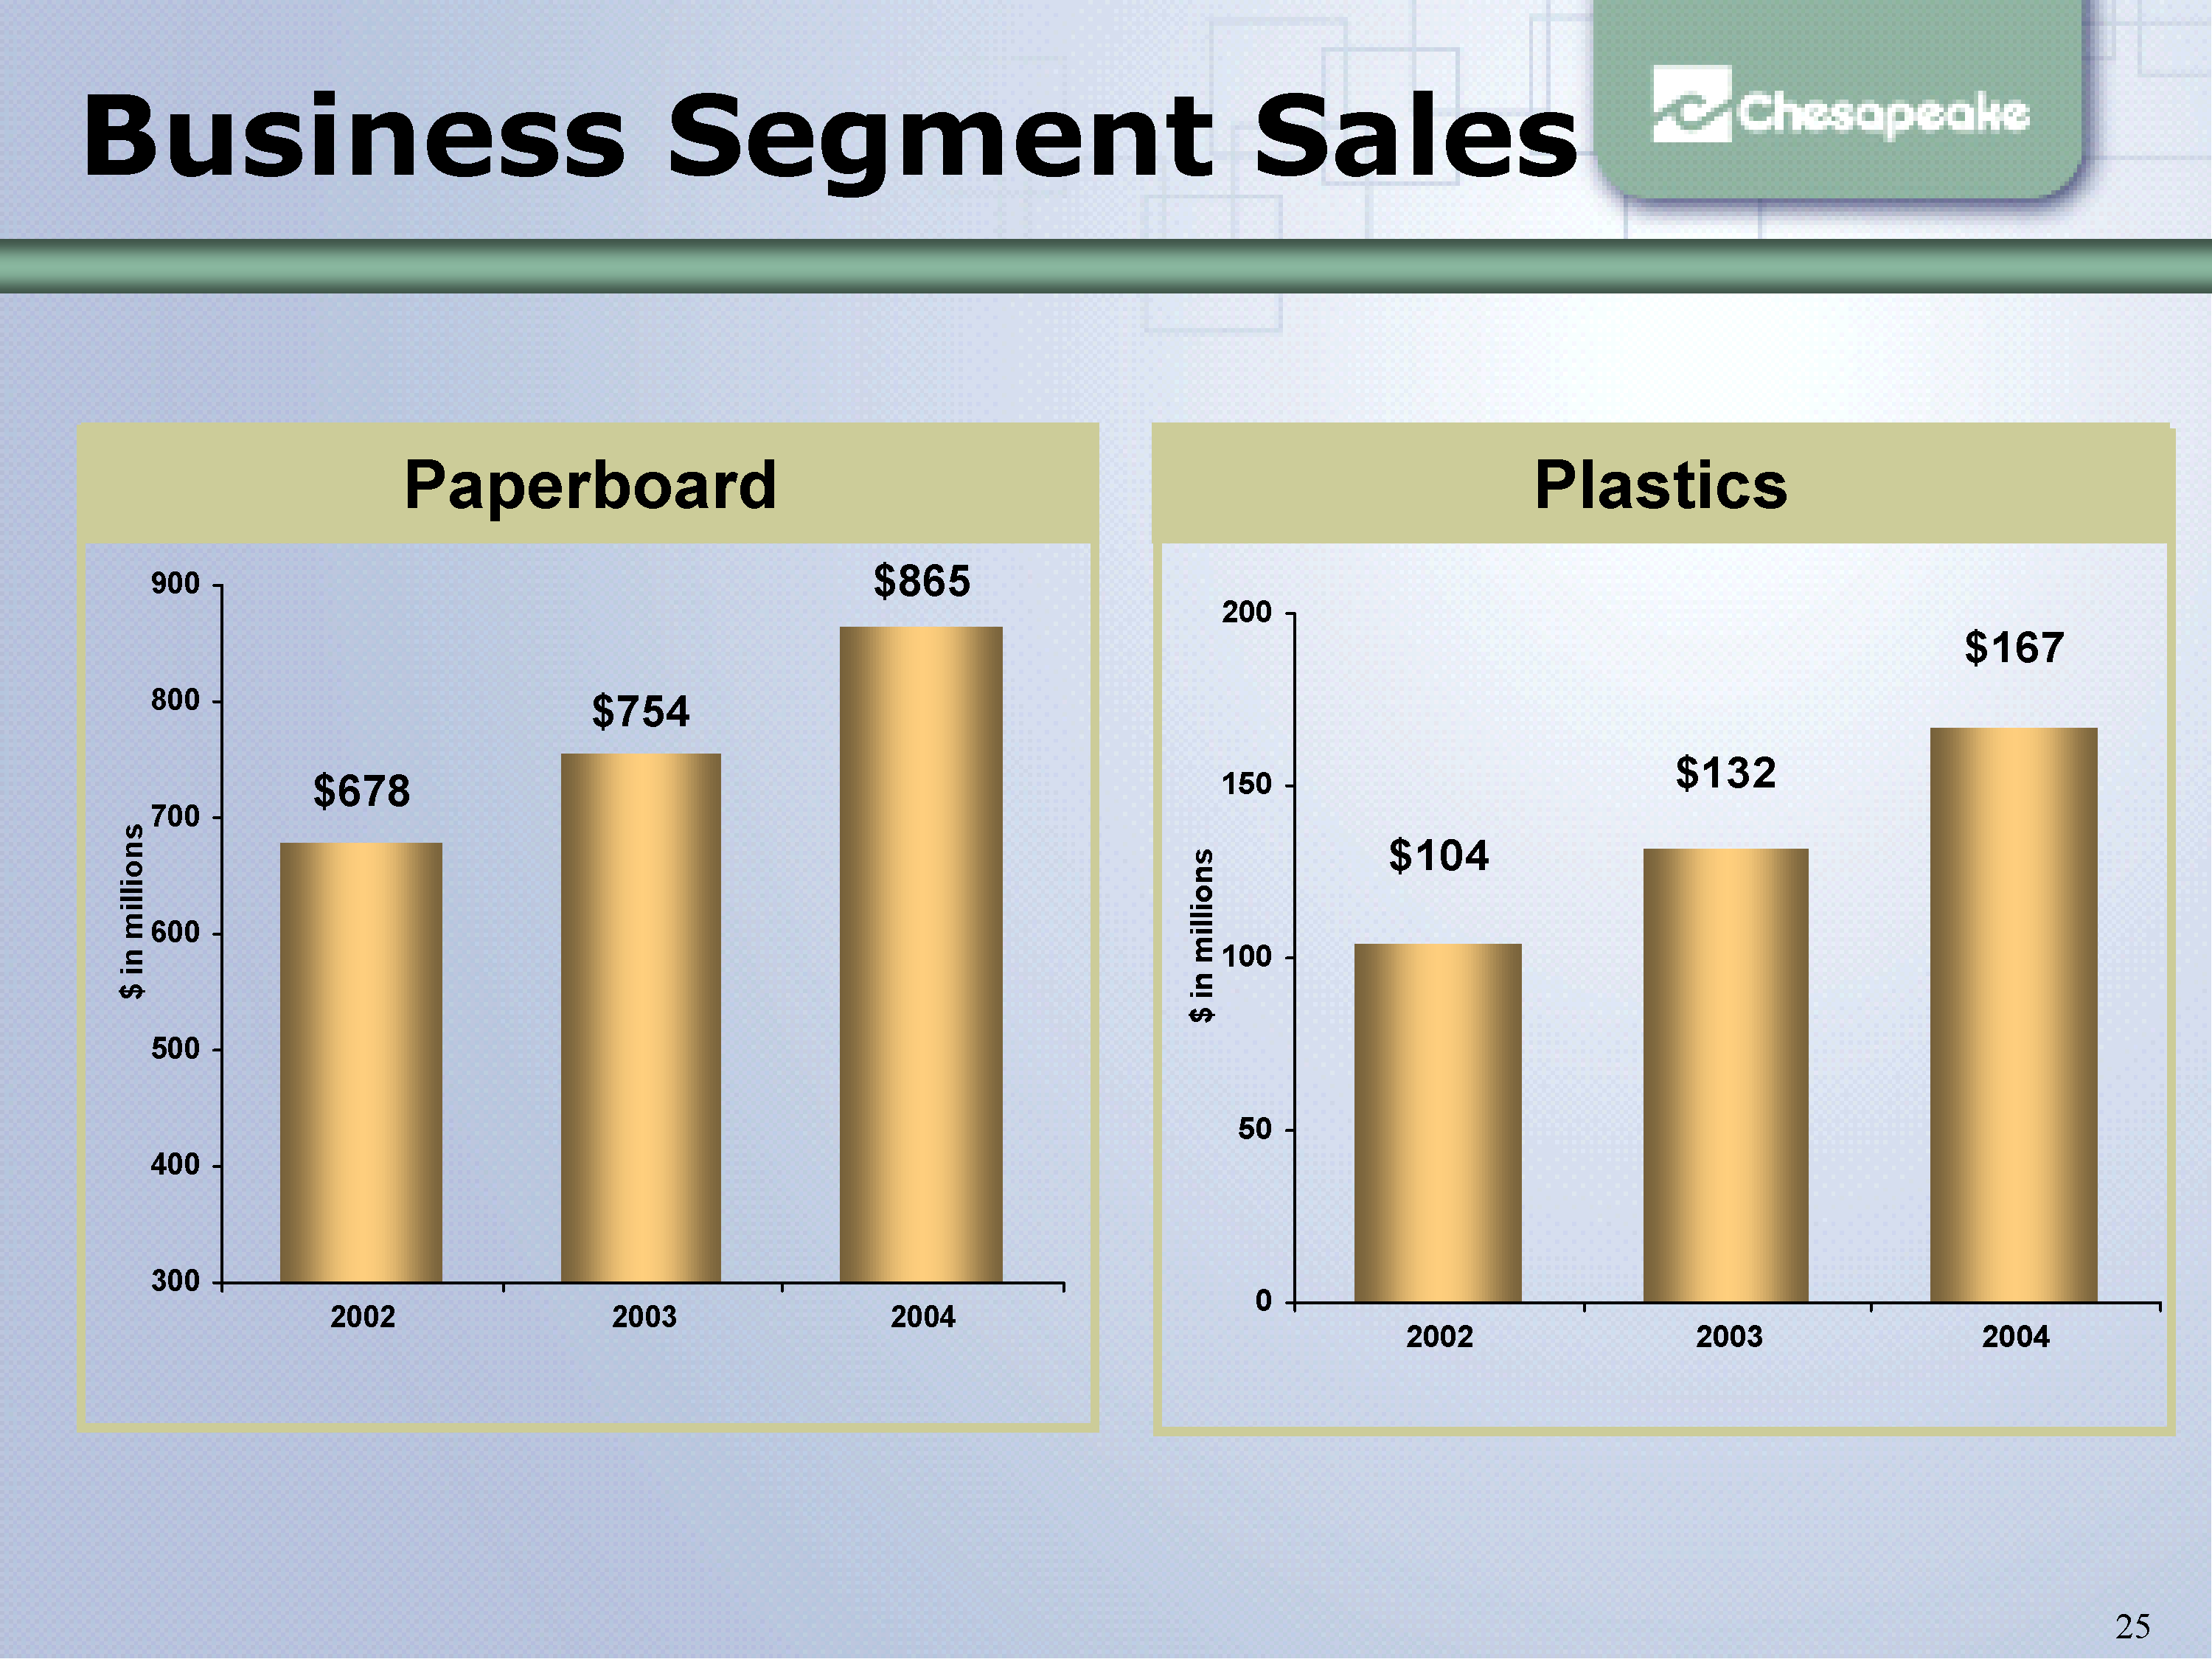
Business Segment Sales
$678
$754
$865
300
400
500
600
700
800
900
2002 2003 2004
Paperboard Plastics
$104
$132
$167
0
50
100
150
200
2002 2003 2004
$ in millions
Slide 26
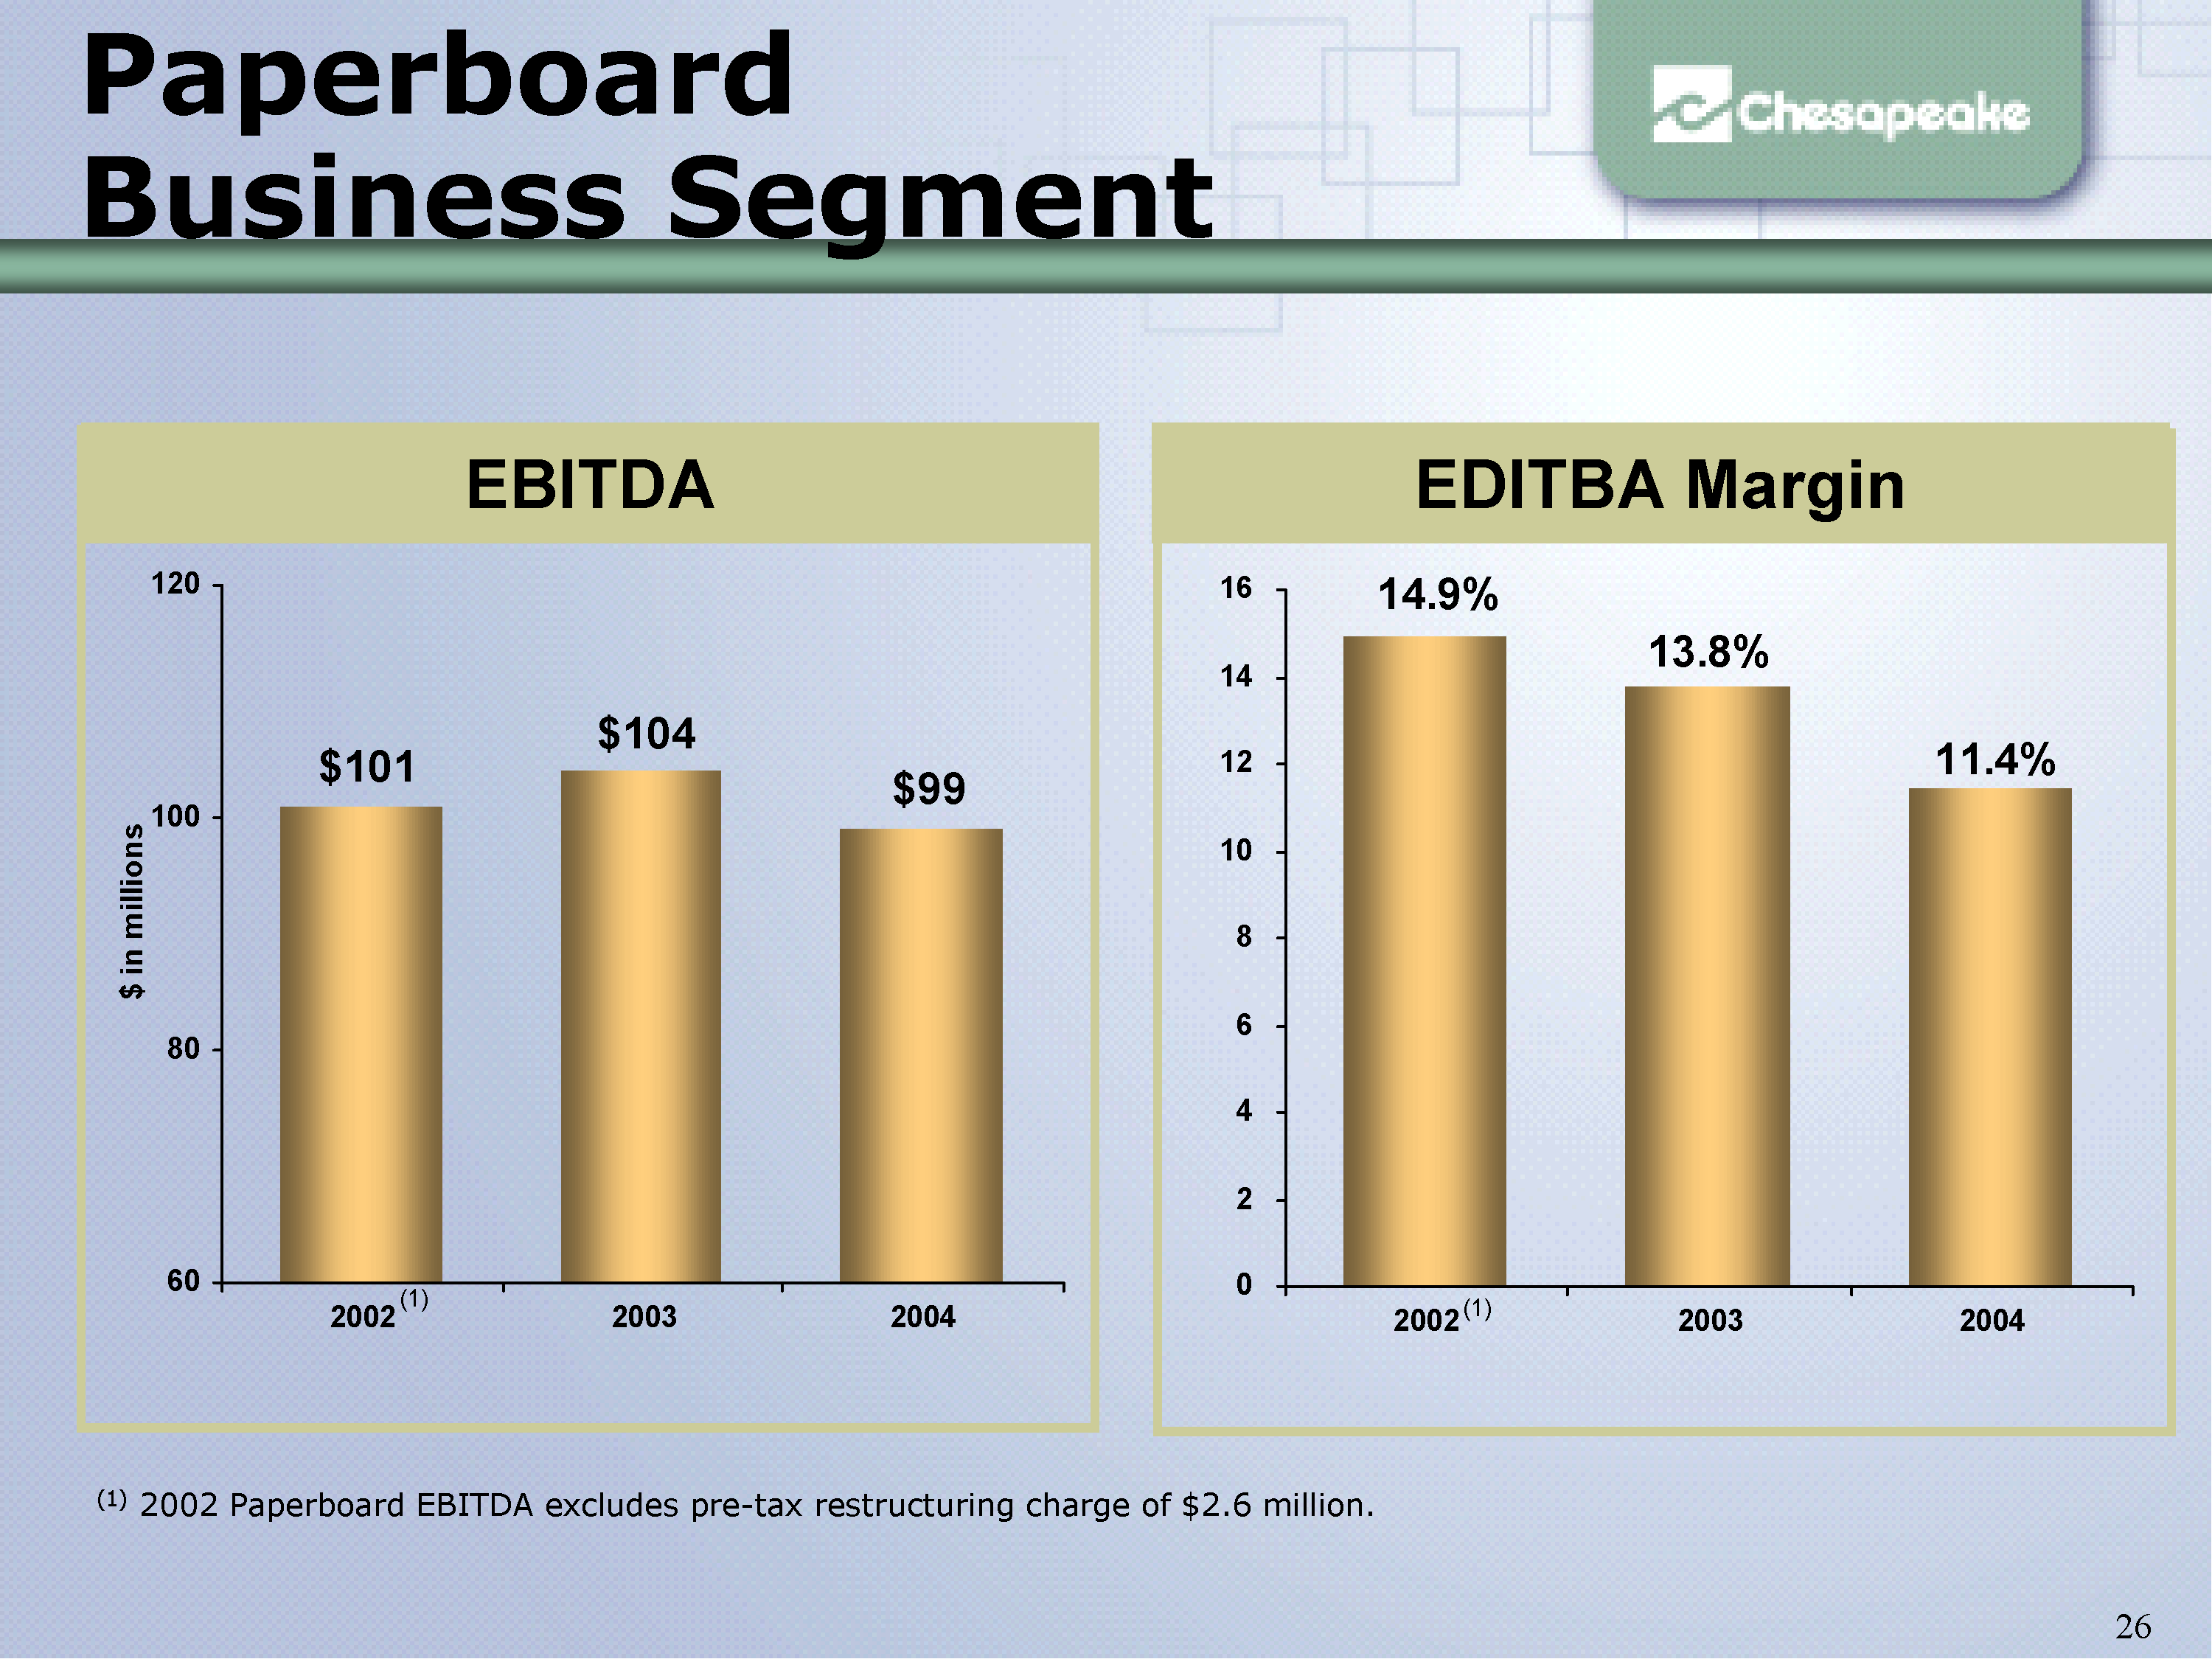
Paperboard
Business Segment
$101
$104
$99
60
80
100
120
2002 2003 2004
$ in millions
EBITDA EDITBA Margin
(1) 2002 Paperboard EBITDA excludes pre-tax restructuring charge of $2.6 million.
(1) (1)
14.9%
13.8%
11.4%
0
2
4
6
8
10
12
14
16
2002 2003 2004
Slide 27
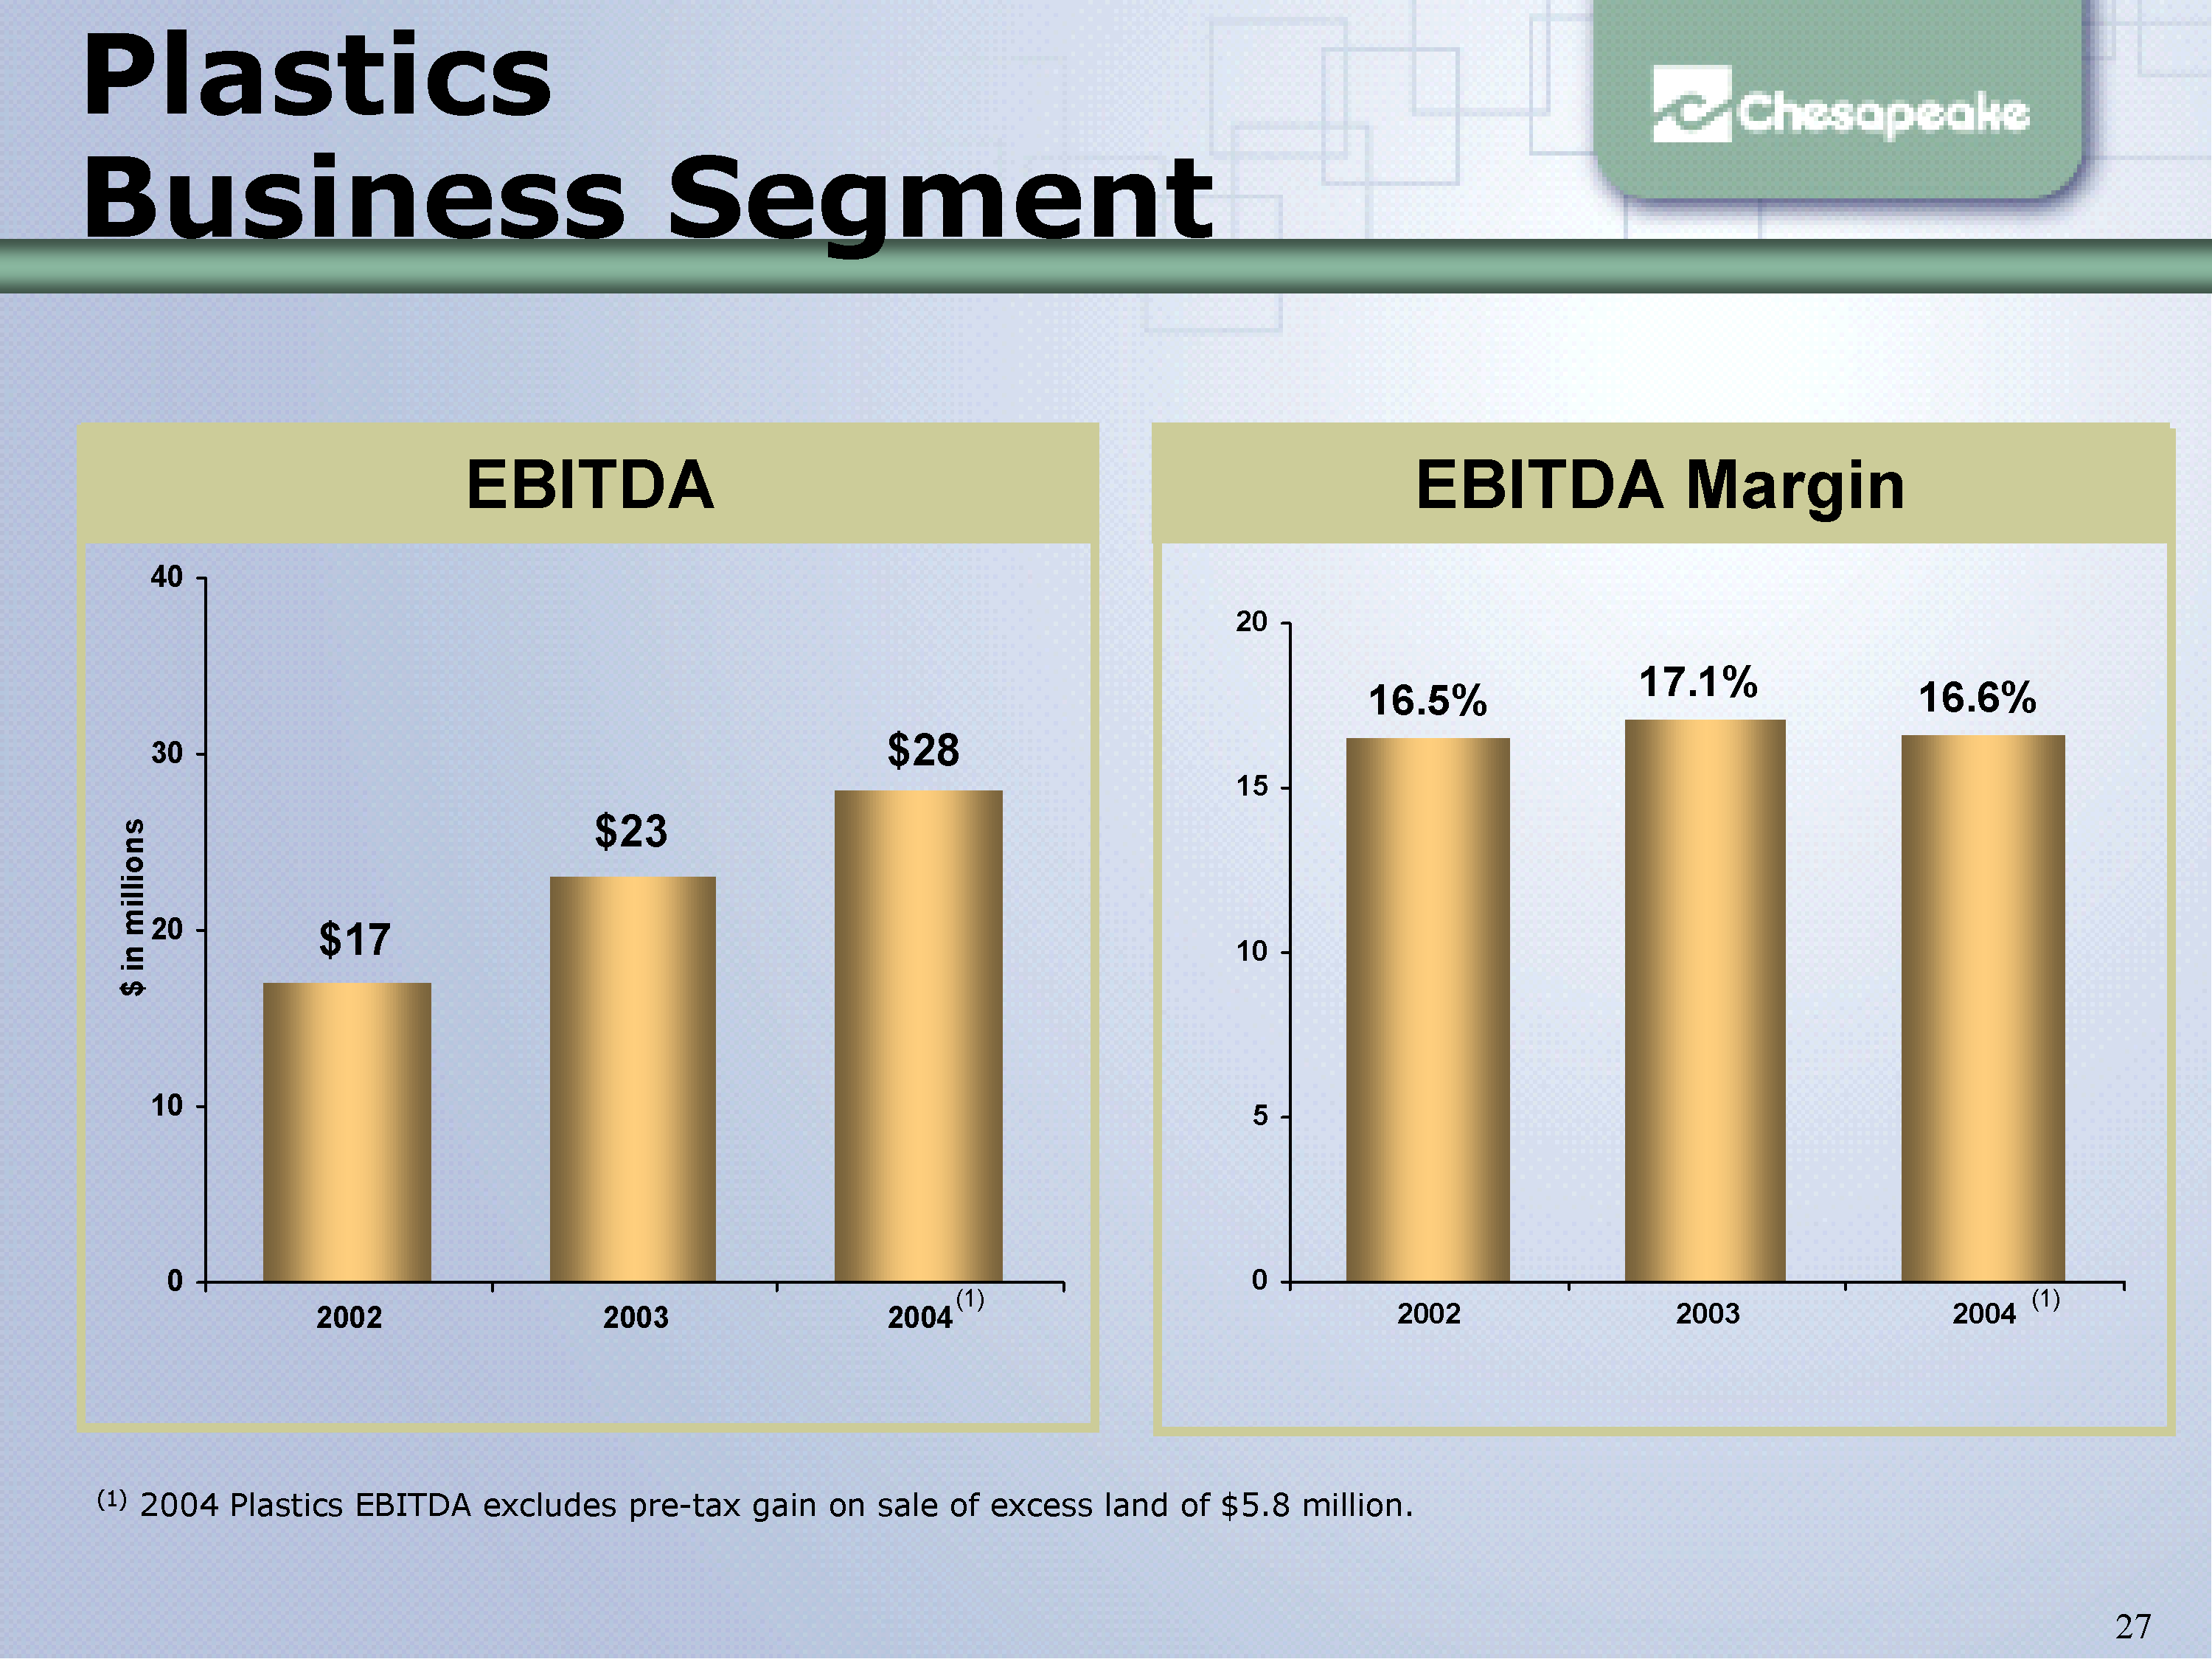
Plastics
Business Segment
EBITDA EBITDA Margin
16.5% 17.1% 16.6%
0
5
10
15
20
2002 2003 2004
(1) 2004 Plastics EBITDA excludes pre-tax gain on sale of excess land of $5.8 million.
(1) (1)
$17
$23
$28
0
10
20
30
40
2002 2003 2004
$ in millions
Slide 28
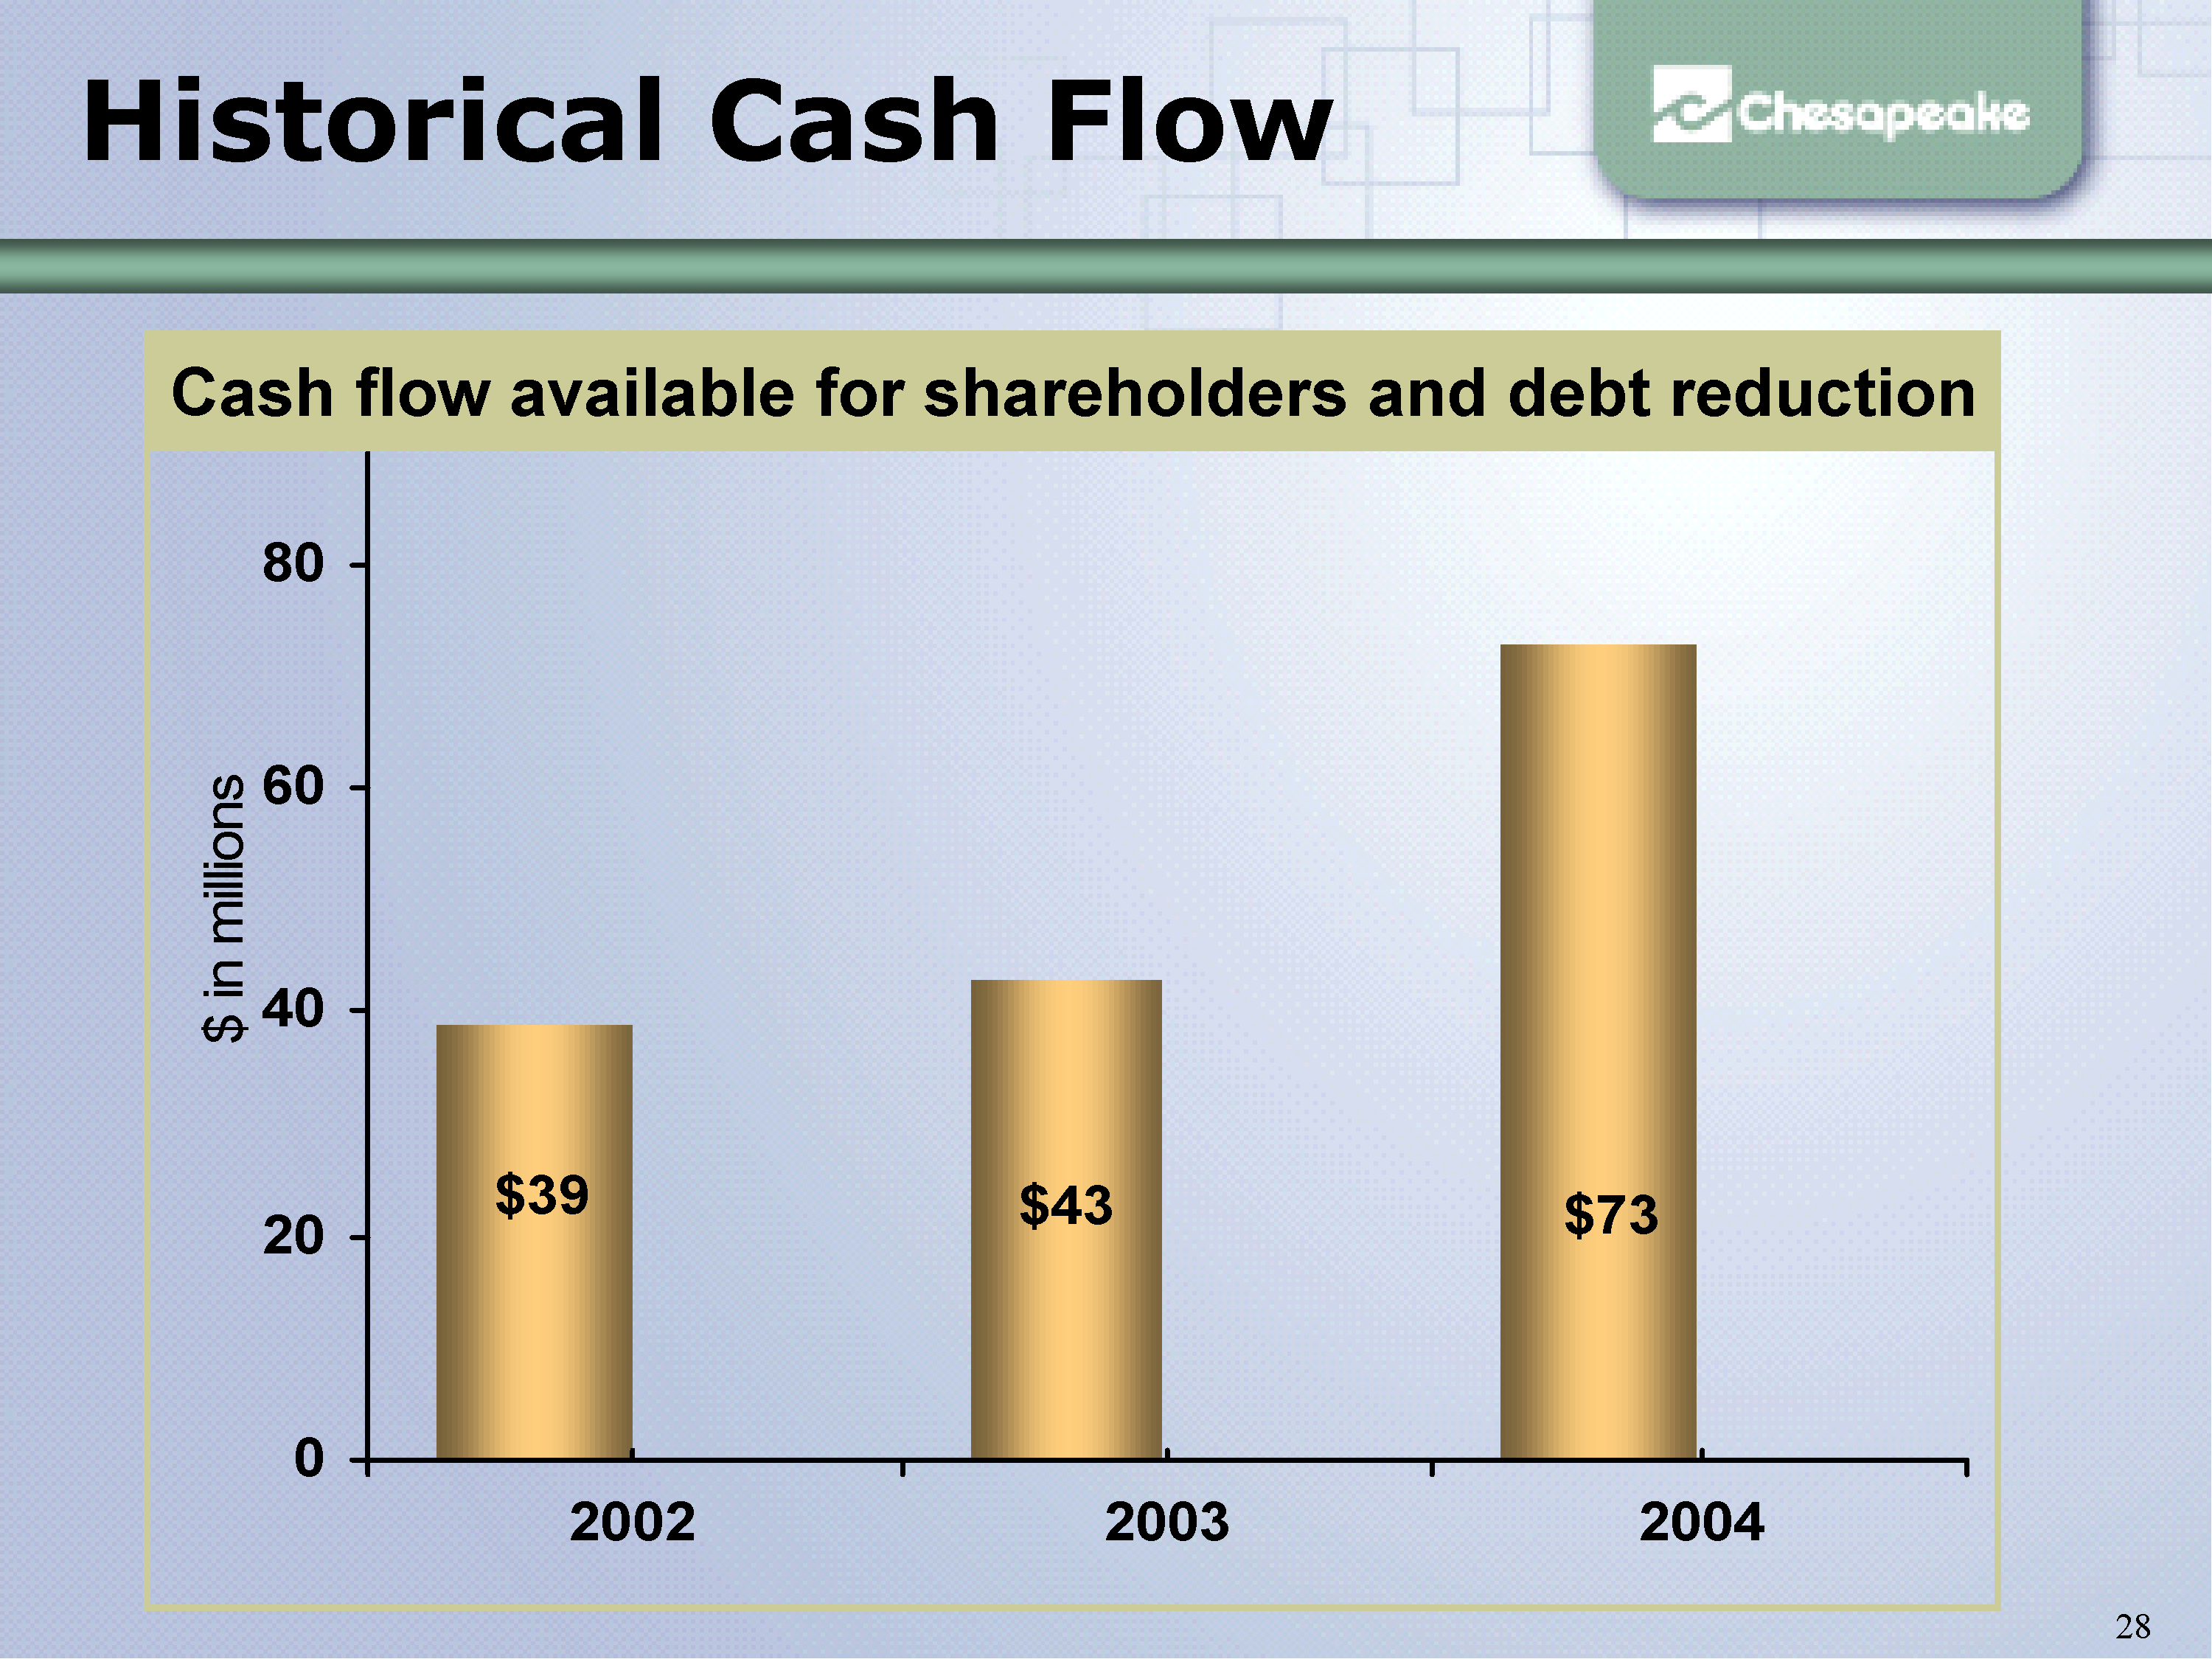
$39 $43 $73
0
20
40
60
80
2002 2003 2004
$ in millions
Cash flow available for shareholders and debt reduction
Historical Cash Flow
Slide 29
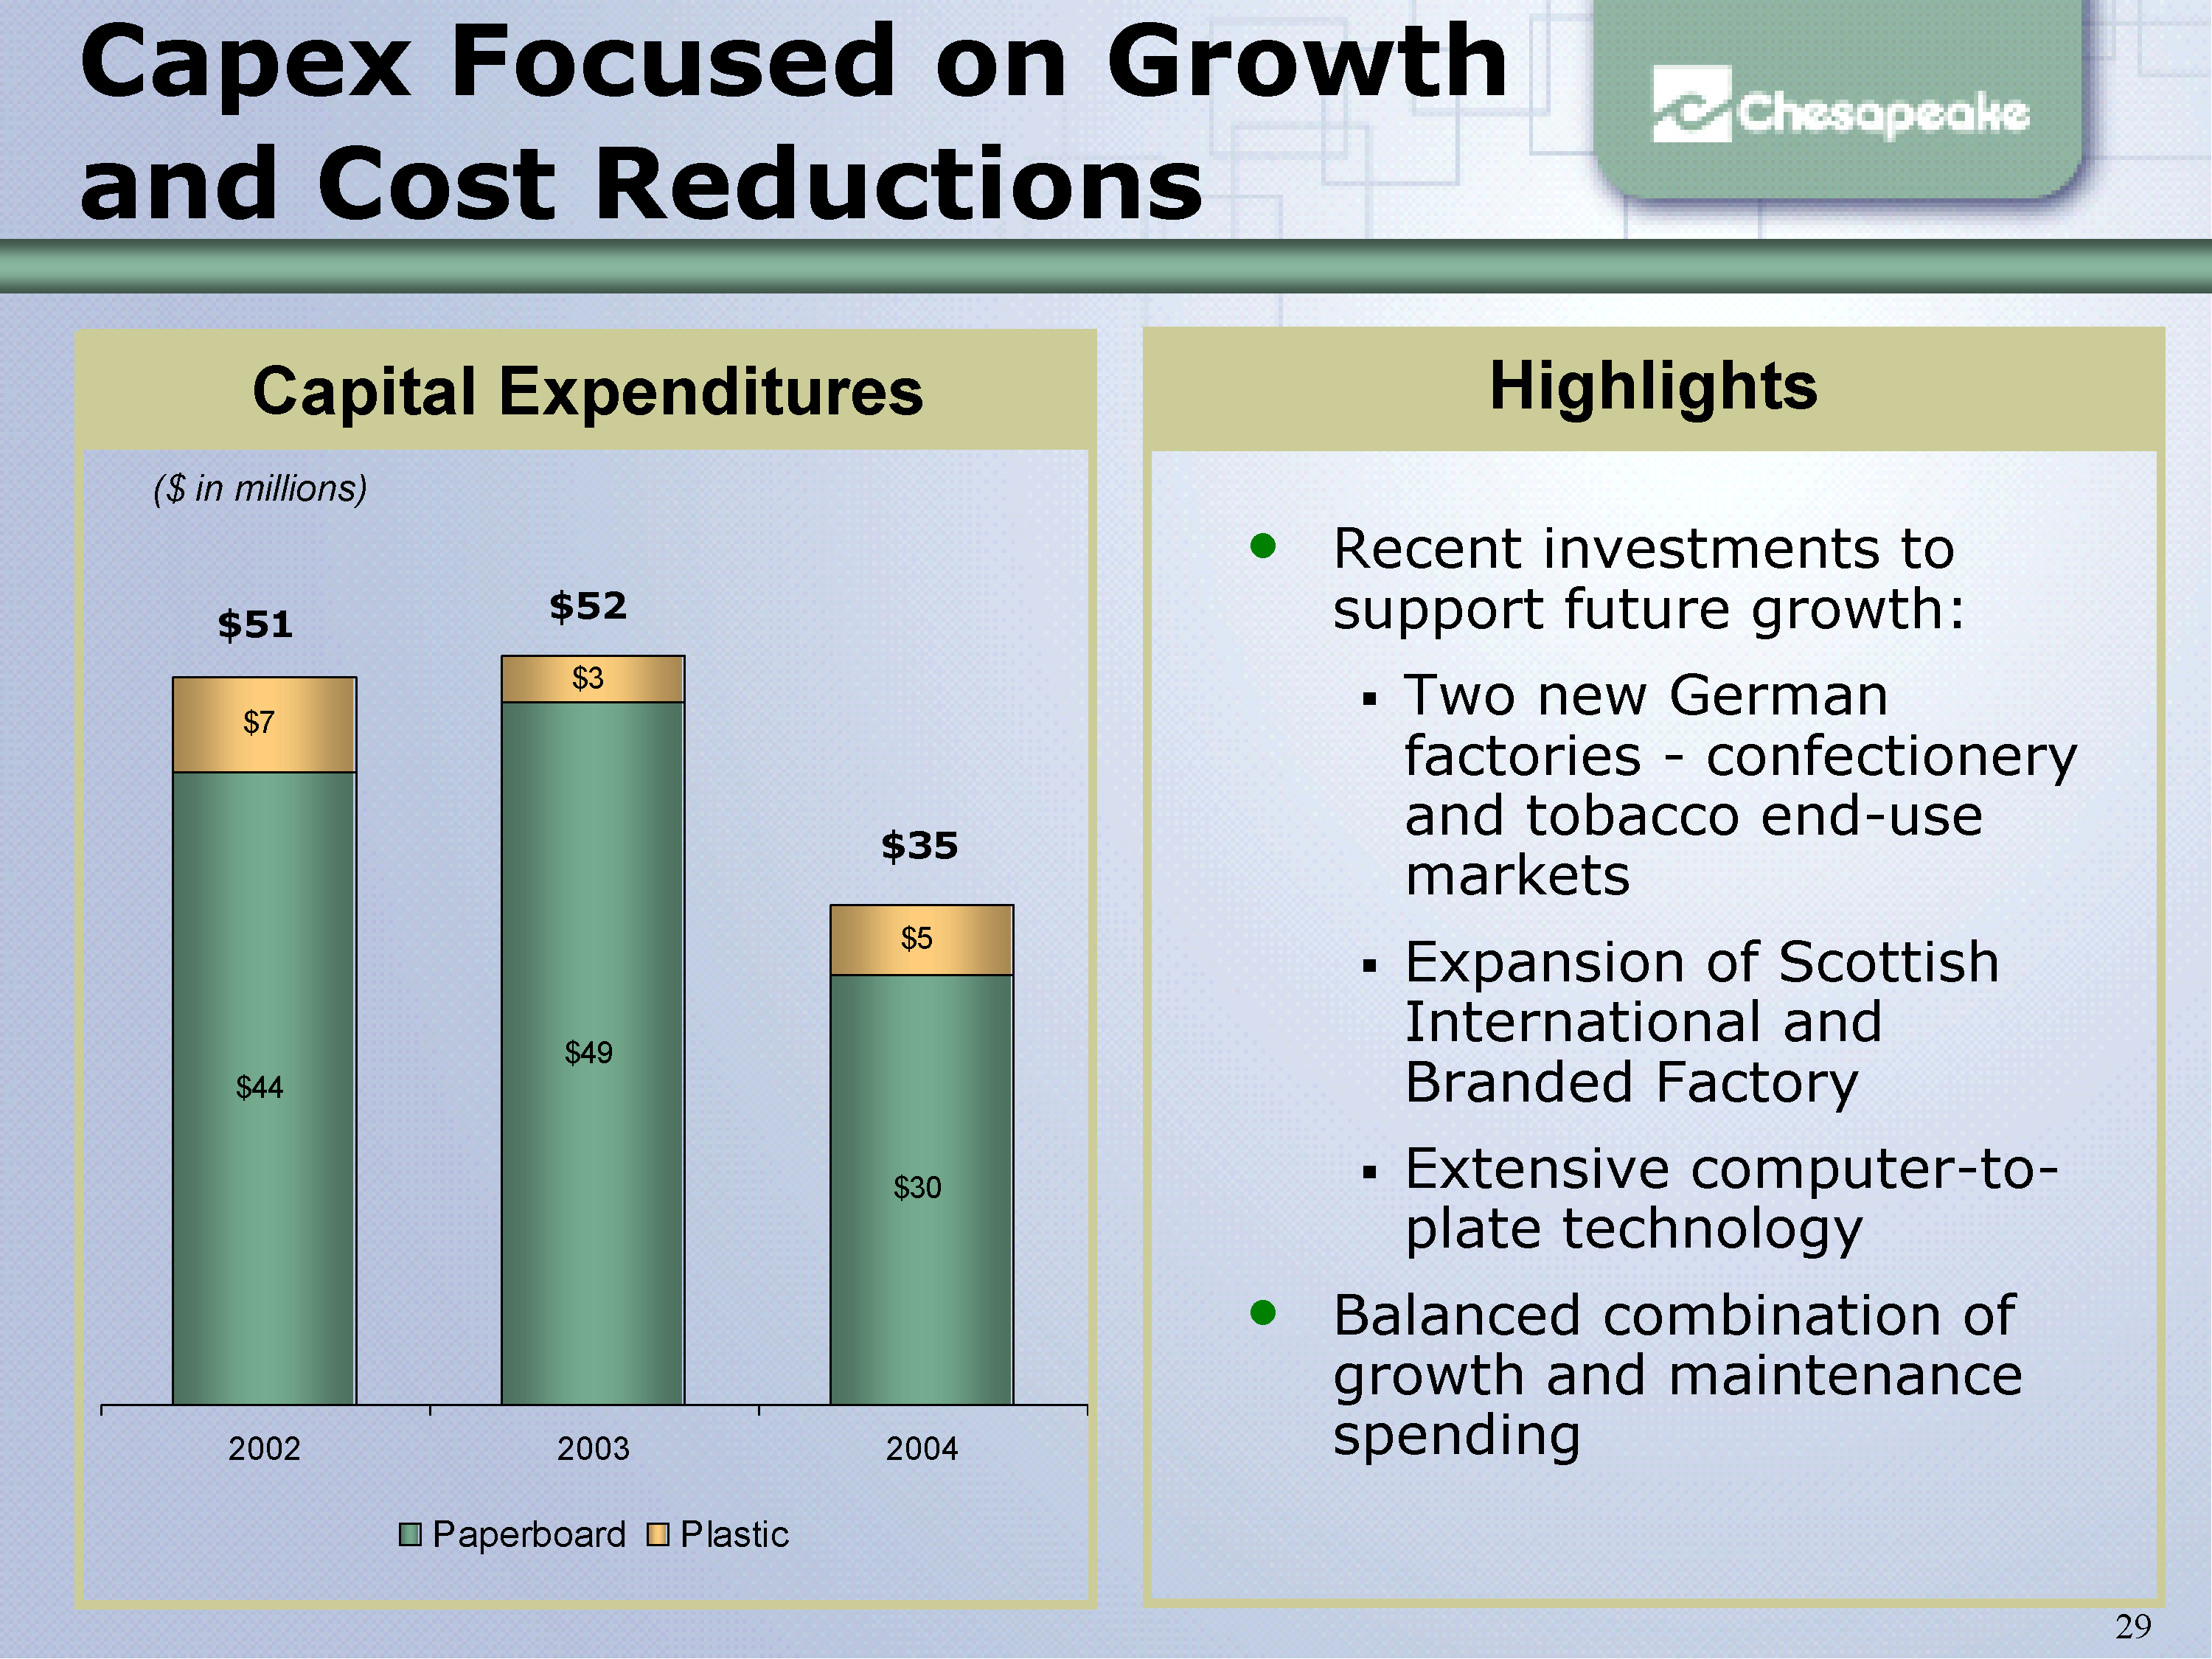
$44
$49
$30
$7
$3
$5
2002 2003 2004
Paperboard Plastic
$51 $52
Capital Expenditures
Capex Focused on Growth and Cost Reductions Highlights
($ in millions)
Recent investments to
support future growth:
Two new German
factories - confectionery
and tobacco end-use
markets
Expansion of Scottish
International and
Branded Factory
Extensive computer-to-plate
technology
Balanced combination of
growth and maintenance
spending
$35
Slide 30
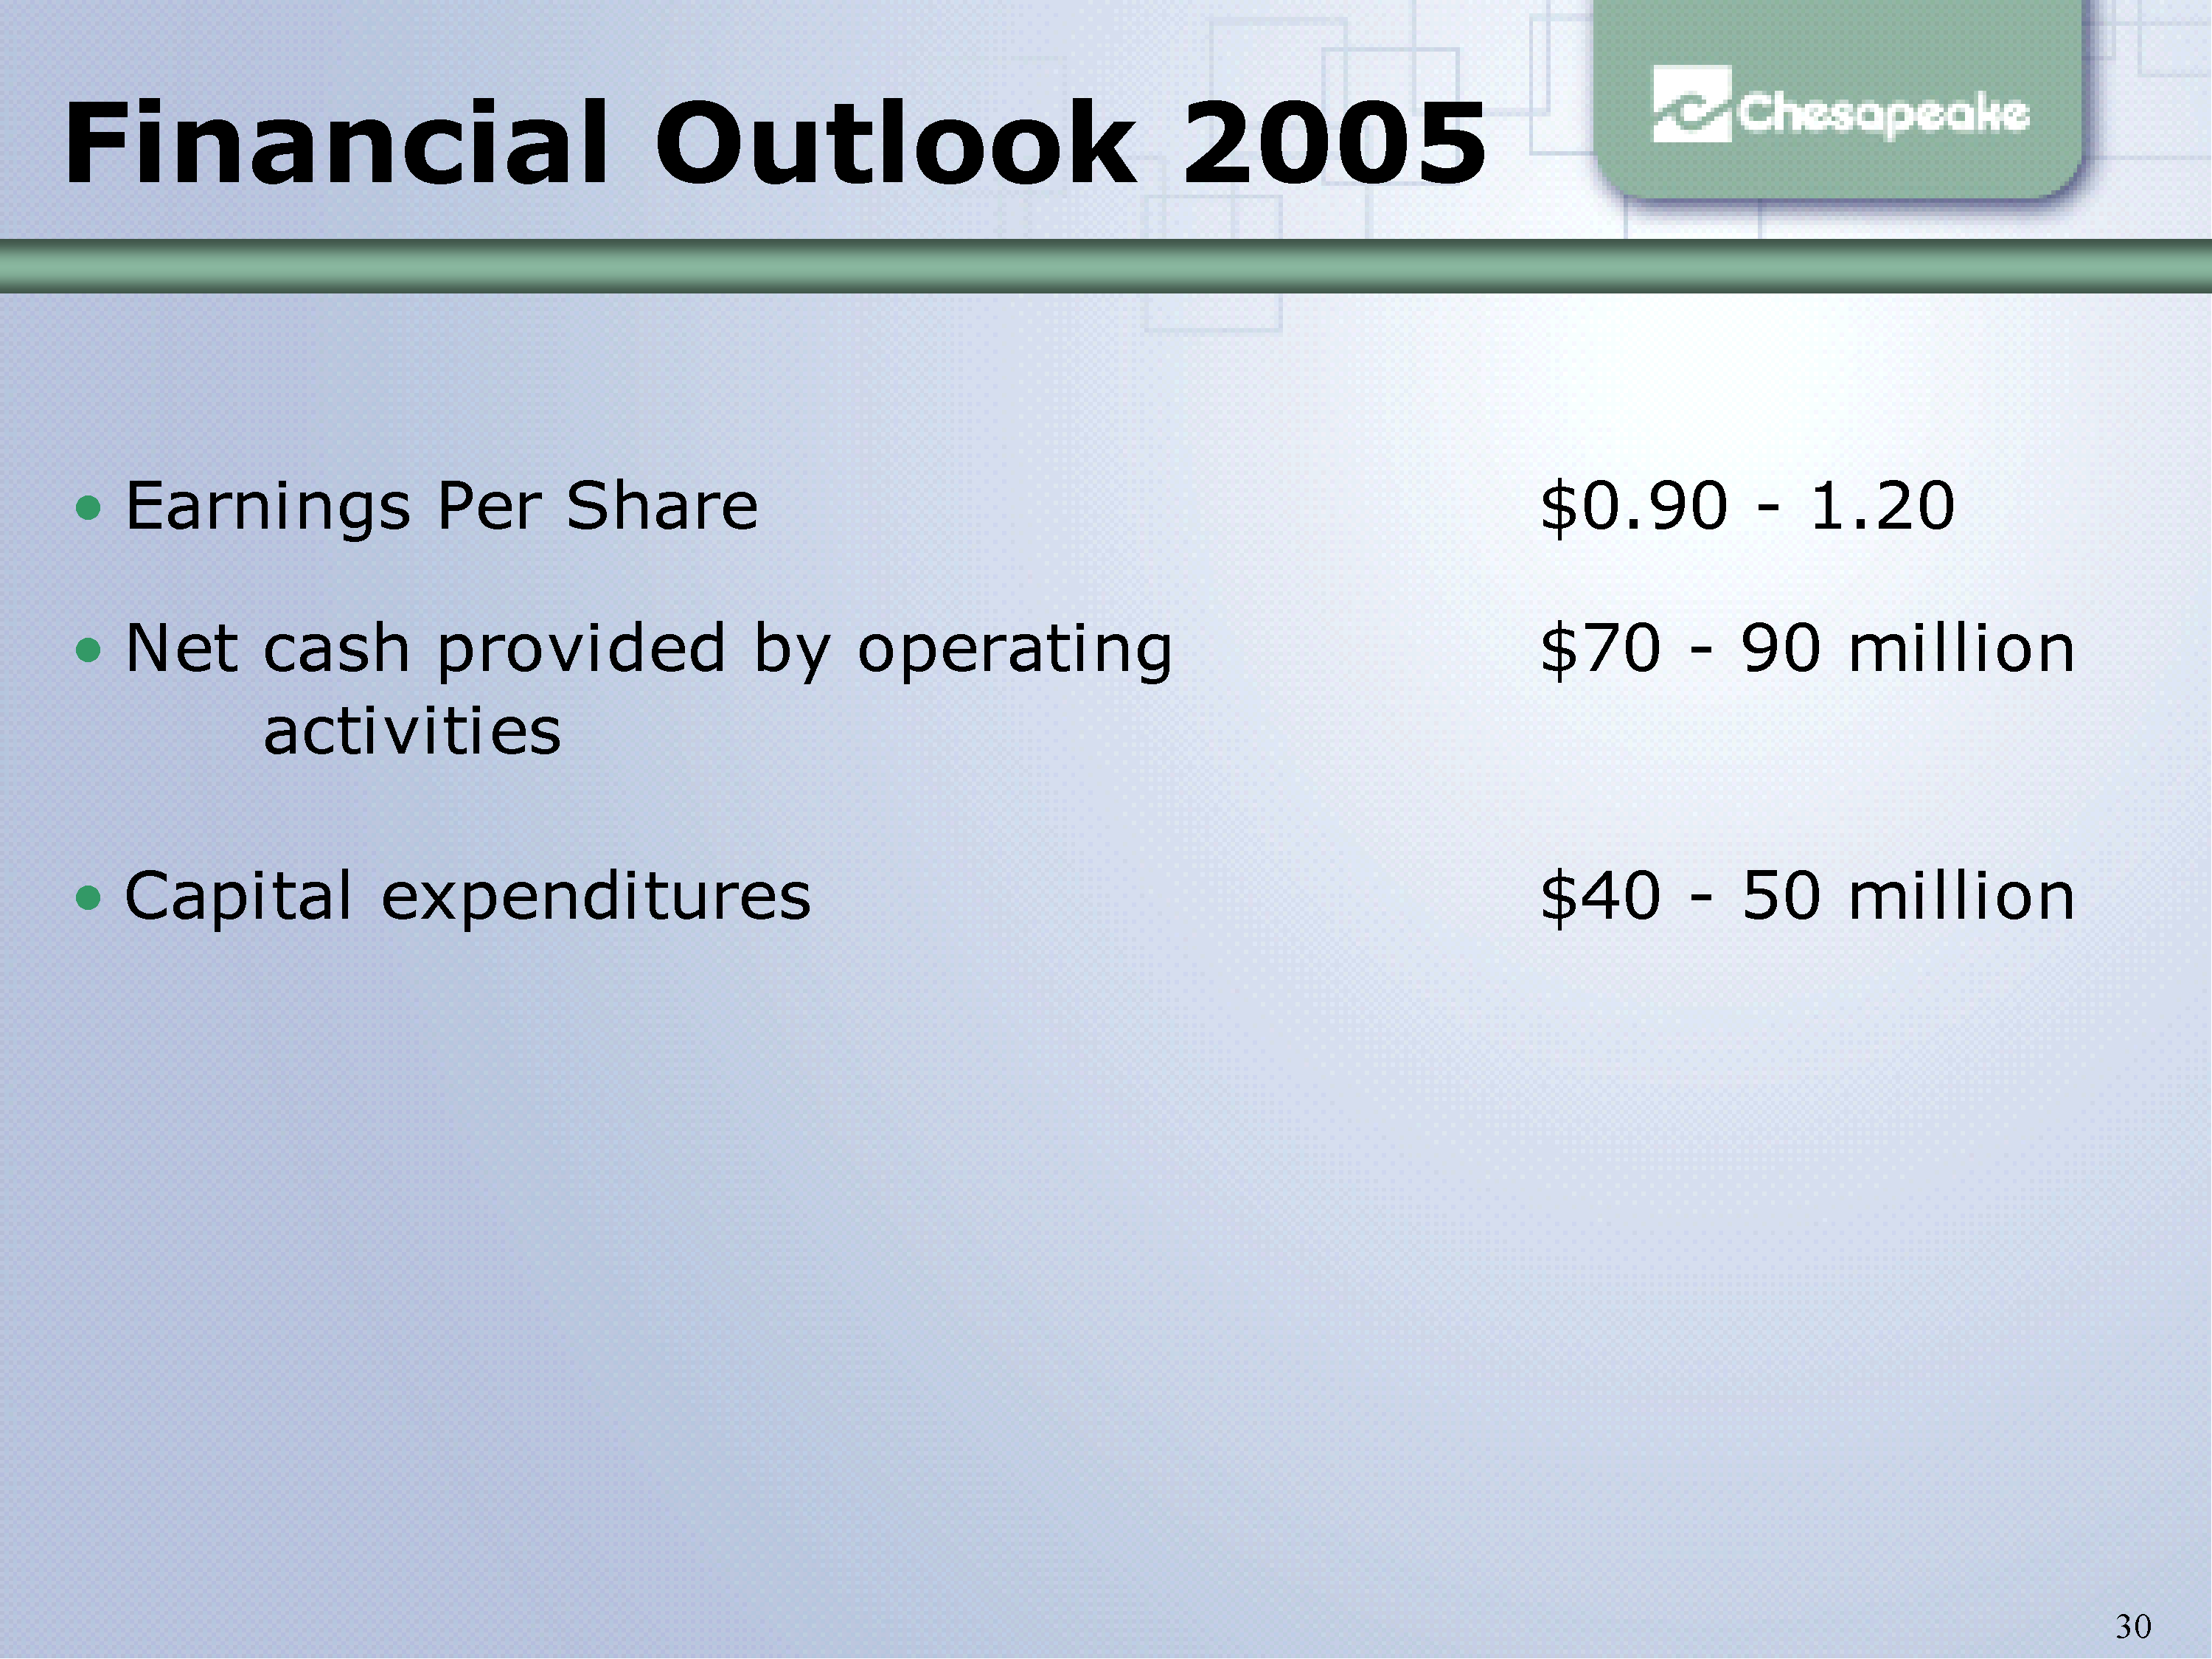
Financial Outlook 2005
Earnings Per Share $0.90 - 1.20
Net cash provided by operating $70 - 90 million
activities
Capital expenditures $40 - 50 million
Slide 31
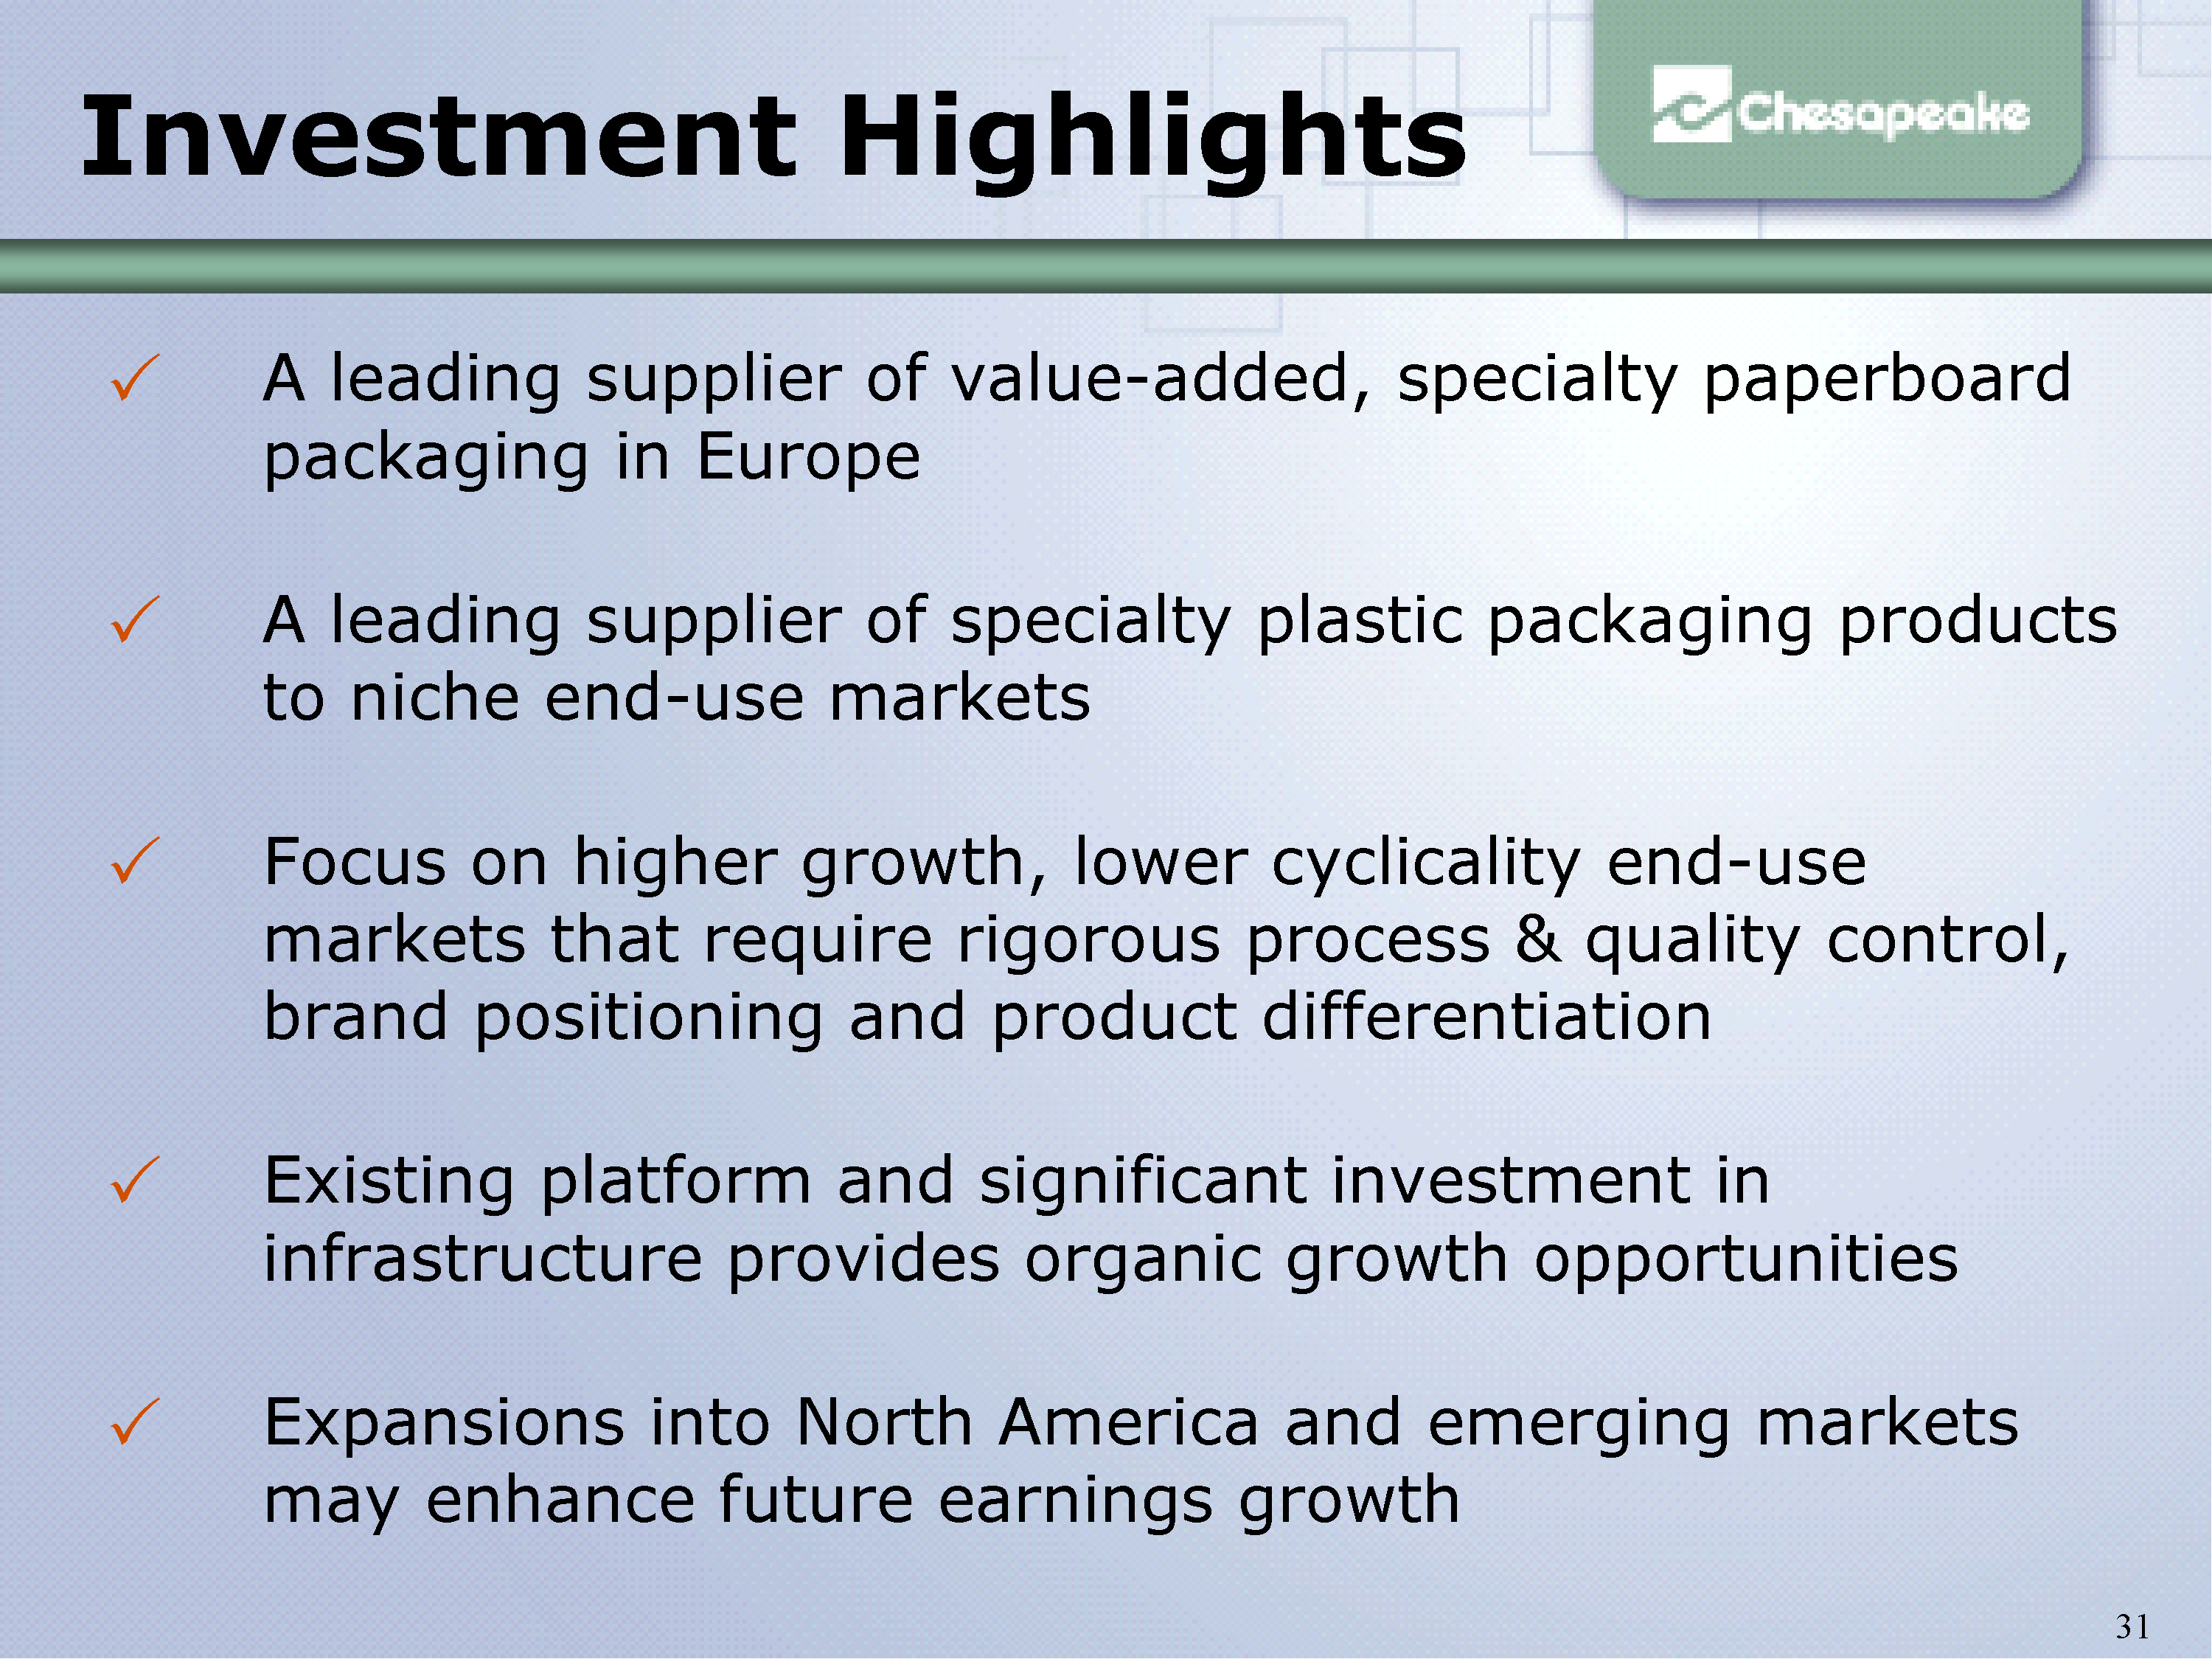
Investment Highlights
A leading supplier of specialty plastic packaging products to niche end-use markets
Expansions into North America and emerging markets may enhance future earnings growth
Existing platform and significant investment in infrastructure provides organic growth opportunities
Focus on higher growth, lower cyclicality end-use markets that require rigorous process & quality control, brand positioning and product differentiation
A leading supplier of value-added, specialty paperboard packaging in Europe
Slide 32
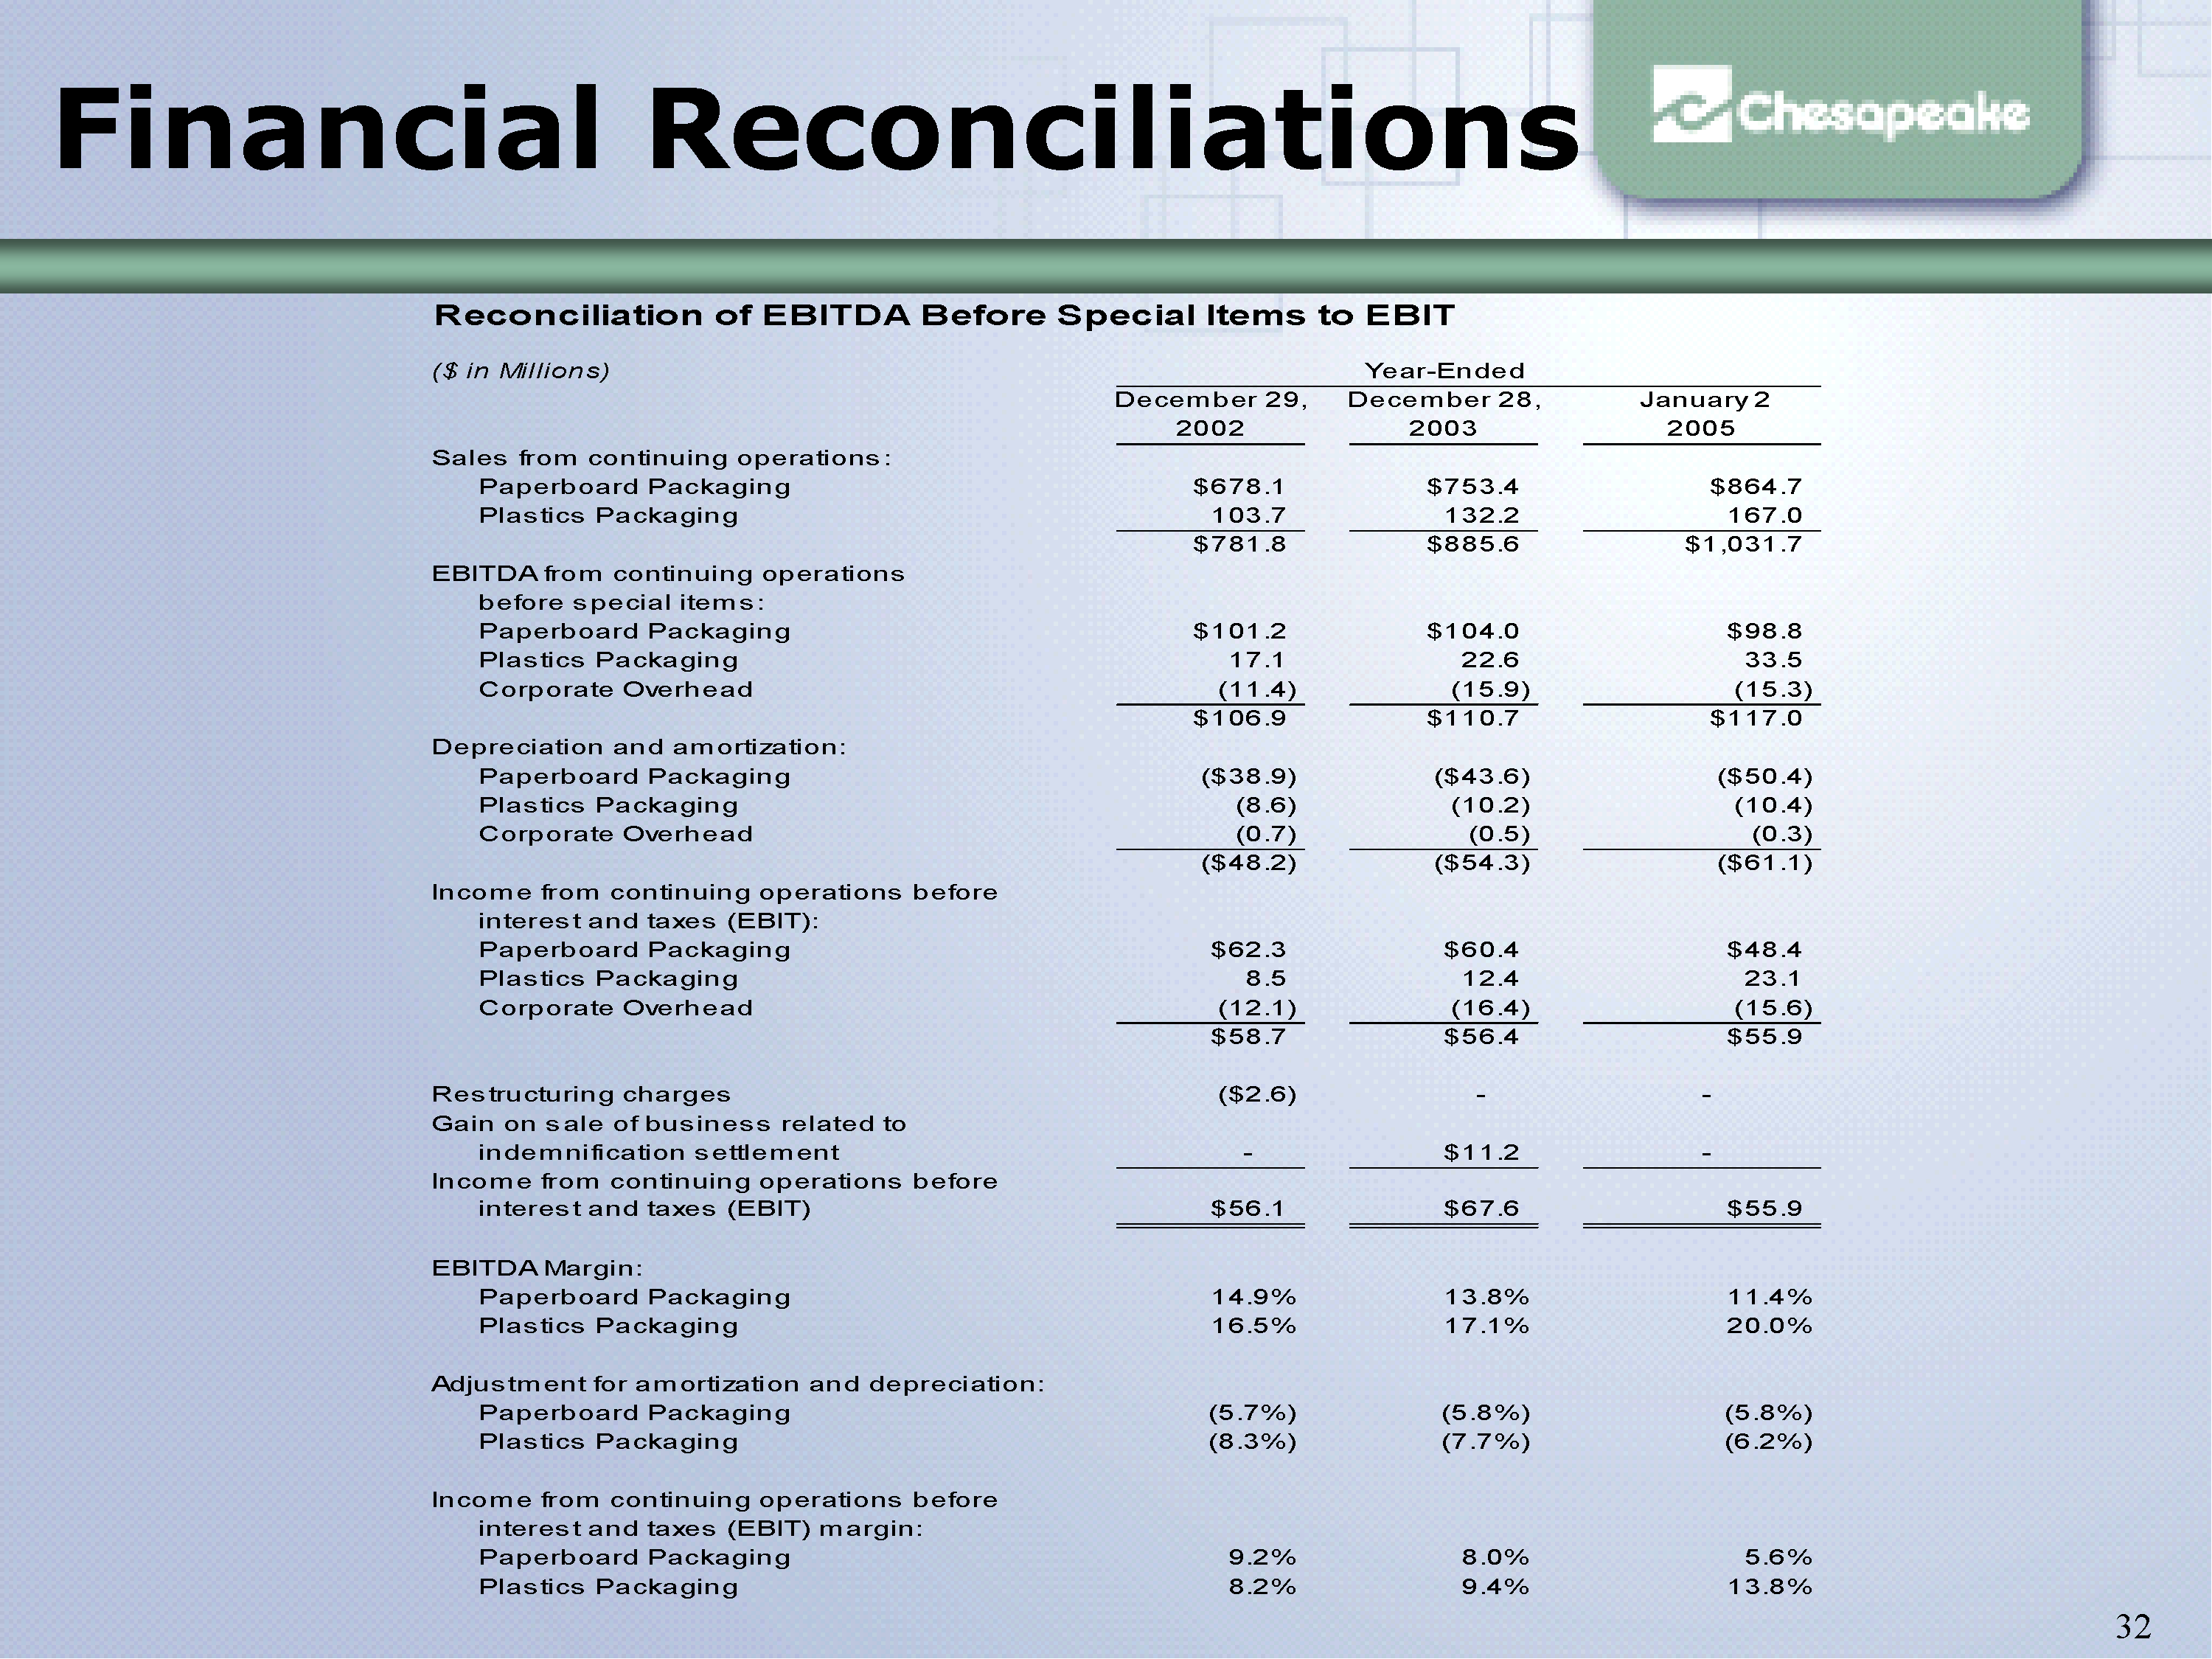
Financial Reconciliations
Reconciliation of EBITDA Before Special Items to EBIT
($ in Millions)Year-Ended
December 29, December 28, January 2
2002 2003 2005
Sales from continuing operations:
Paperboard Packaging $678.1 $753.4 $864.7
Plastics Packaging 103.7 132.2 167.0
$781.8 $885.6 $1,031.7
EBITDA from continuing operations
before special items:
Paperboard Packaging $101.2 $104.0 $98.8
Plastics Packaging 17.1 22.6 33.5
Corporate Overhead (11.4) (15.9) (15.3)
$106.9 $110.7 $117.0
Depreciation and amortization:
Paperboard Packaging ($38.9) ($43.6) ($50.4)
Plastics Packaging (8.6) (10.2) (10.4)
Corporate Overhead (0.7) (0.5) (0.3)
($48.2) ($54.3) ($61.1)
Income from continuing operations before
interest and taxes (EBIT):
Paperboard Packaging $62.3 $60.4 $48.4
Plastics Packaging 8.5 12.4 23.1
Corporate Overhead (12.1) (16.4) (15.6)
$58.7 $56.4 $55.9
Restructuring charges ($2.6) - -
Gain on sale of business related to
indemnification settlement - $11.2 -
Income from continuing operations before
interest and taxes (EBIT) $56.1 $67.6 $55.9
EBITDA Margin:
Paperboard Packaging 14.9% 13.8% 11.4%
Plastics Packaging 16.5% 17.1% 20.0%
Adjustment for amortization and depreciation:
Paperboard Packaging (5.7%) (5.8%) (5.8%)
Plastics Packaging (8.3%) (7.7%) (6.2%)
Income from continuing operations before
interest and taxes (EBIT) margin:
Paperboard Packaging 9.2% 8.0% 5.6%
Plastics Packaging 8.2% 9.4% 13.8%
Slide 33

Financial Reconciliations
Reconciliation of Cash Flow Available for Shareholders and Debt Reduction
to Net Cash Provided by Operating Activities
($ in Millions)
Year-Ended
December 29, December 28, January 2,
2002 2003 2005
Cash flow available for shareholders & debt reduct $38.7 $43.3 $72.6
Add: Net cash used in investing activities 12.4 36.7 20.5
Net cash provided by operating activities $51.1 $80.0 $93.1
($ in Millions)
Year-Ended
December 29, December 28, January 2,
2002 2003 2005
Income from continuing operations before
special items, per diluted share $0.76 $0.95 $0.94
Add: gain on sale of business after taxes - 0.50 -
Less: loss on extinguishment of debt after taxes - - (0.33)
Income from continuing operations, per $0.76 $1.45 $0.61
diluted share
Reconciliation of EPS Before Special Items to EPS
Slide 34

March 2004
Investing In Chesapeake


