As filed with the U.S. Securities and Exchange Commission on February 3, 2025.
Registration No. 333-
UNITED STATES
SECURITIES AND EXCHANGE COMMISSION
Washington, D.C. 20549
FORM F-1
REGISTRATION STATEMENT
UNDER
THE SECURITIES ACT OF 1933
BBB Foods Inc.
(Exact Name of Registrant as Specified in its Charter)
British Virgin Islands (State or Other Jurisdiction of Incorporation or Organization) | 5411 (Primary Standard Industrial Classification Code Number) | N/A (I.R.S. Employer Identification No.) |
Av. Presidente Masaryk 8
Polanco V Sección, Miguel Hidalgo
Mexico City, Mexico 11560
+52 (55) 1102-1200
(Address, including Zip Code, and Telephone Number, including Area Code, of Registrant’s Principal Executive Offices)
Cogency Global Inc.
122 East 42nd Street, 18th floor
New York, NY 10168
+1 (212) 947-7200
(Name, Address, including Zip Code, and Telephone Number, including Area Code, of Agent for Service)
Copies to:
S. Todd Crider Simpson Thacher & Bartlett LLP 425 Lexington Avenue New York, New York 10017 + 1 (212) 455-2000 | Jorge U. Juantorena Manuel Silva Cleary Gottlieb Steen & Hamilton LLP One Liberty Plaza New York, New York 10006 +1 (212) 225-2000 |
Approximate date of commencement of proposed sale to the public: As soon as practicable after the effective date of this registration statement.
If any of the securities being registered on this Form are to be offered on a delayed or continuous basis pursuant to Rule 415 under the Securities Act of 1933, check the following box. ☐
If this Form is filed to register additional securities for an offering pursuant to Rule 462(b) under the Securities Act, check the following box and list the Securities Act registration statement number of the earlier effective registration statement for the same offering. ☐
If this Form is a post-effective amendment filed pursuant to Rule 462(c) under the Securities Act, check the following box and list the Securities Act registration statement number of the earlier effective registration statement for the same offering. ☐
If this Form is a post-effective amendment filed pursuant to Rule 462(d) under the Securities Act, check the following box and list the Securities Act registration statement number of the earlier effective registration statement for the same offering. ☐
Indicate by check mark whether the registrant is an emerging growth company as defined in Rule 405 of the Securities Act of 1933.
Emerging growth company ☐
If an emerging growth company that prepares its financial statements in accordance with U.S. GAAP, indicate by check mark if the registrant has elected not to use the extended transition period for complying with any new or revised financial accounting standards† provided pursuant to Section 7(a)(2)(B) of the Securities Act. ☐
† The term “new or revised financial accounting standard” refers to any update issued by the Financial Accounting Standards Board to its Accounting Standards Codification after April 5, 2012.
The Registrant hereby amends this registration statement on such date or dates as may be necessary to delay its effective date until the Registrant shall file a further amendment which specifically states that this registration statement shall thereafter become effective in accordance with Section 8(a) of the U.S. Securities Act of 1933, as amended, or until the registration statement shall become effective on such date as the Commission, acting pursuant to said Section 8(a), may determine.
The information in this preliminary prospectus is not complete and may be changed. We and the selling shareholders may not sell these securities until the registration statement filed with the U.S. Securities and Exchange Commission is effective. This preliminary prospectus is not an offer to sell these securities and it is not soliciting an offer to buy these securities in any jurisdiction where the offer or sale is not permitted.
SUBJECT TO COMPLETION, DATED FEBRUARY 3, 2025
PRELIMINARY PROSPECTUS
17,500,000 Class A common shares

BBB Foods Inc.
(incorporated in the British Virgin Islands)
The selling shareholders identified in this prospectus are offering 17,500,000 Class A common shares of BBB Foods Inc., consisting of (i) 15,500,000 Class A common shares issuable upon conversion of 15,500,000 Class C common shares held by existing holders of our Class C common shares and (ii) 2,000,000 Class A common shares issuable upon conversion of 2,000,000 Class C common shares acquired upon the net exercise of stock options under our 2004 Option Plan (the “Exercised Stock Options”). We will not receive any proceeds from the sale of Class A common shares by the selling shareholders.
Our Class A common shares are listed and trade on the New York Stock Exchange under the symbol “TBBB.” On January 31, 2025, the last reported sale price of our Class A common shares on the New York Stock Exchange was US$31.02. The public offering price will be determined through negotiations among us, the selling shareholders and the lead underwriters in this offering and therefore the recent market price used throughout this prospectus may not be indicative of the public offering price.
We have three classes of common shares: Class A common shares, Class B common shares and Class C common shares. The rights of the holders of each class of our common shares are identical, except with respect to voting, conversion, preemptive rights and transfer restrictions applicable to the Class B common shares and conversion and transfer restrictions applicable to our Class C common shares. Each Class A common share is entitled to one vote. Each Class B common share is entitled to 15 votes and is convertible into one Class A common share automatically upon transfer, subject to certain exceptions. Each Class C common share is entitled to one vote and is convertible into one Class A common share in certain circumstances, including automatically upon certain transfers and the expiry of the transfer restrictions that apply to the Class C common shares. Class B common shares and Class C common shares are not listed on any stock exchange and are not publicly traded. Holders of Class A common shares, Class B common shares and Class C common shares vote together as a single class on all matters unless otherwise required by law and subject to certain exceptions set forth in our memorandum and articles of association.
Following this offering, our issued and outstanding Class B common shares, will represent 41.7% of the combined voting power of our outstanding common shares and 4.6% of our total equity ownership, assuming no exercise of the underwriters’ option to purchase additional Class A common shares from the selling shareholders. For further information, see “Description of Share Capital.” Prior to this offering, Bolton Partners Ltd., a vehicle affiliated with our founder, Chairman and Chief Executive Officer, owned, directly or indirectly, all of our Class B common shares and a portion of our Class C common shares. As a result, Bolton Partners Ltd. beneficially owned approximately 46.4% of the combined voting power of our outstanding common shares prior to this offering, and will beneficially own approximately 44.9% of the combined voting power of our outstanding common shares following this offering, assuming no exercise of the underwirters' option to purchase additional Class A common shares from the selling shareholders, and therefore has significant influence over matters requiring shareholder approval.
We are a “foreign private issuer” under the U.S. federal securities laws and, as a result, have elected to comply with certain reduced public company disclosure and reporting requirements. See “Risk Factors—Risks Relating to this Offering and Our Class A Common Shares—Our status as a foreign private issuer exempts us from certain of the corporate governance standards of the New York Stock Exchange, limiting the protections afforded to investors” and “Risk Factors—Risks Relating to this Offering and Our Class A Common Shares—As a foreign private issuer, we have different disclosure and other requirements from U.S. domestic registrants. We may take advantage of exemptions from certain corporate governance regulations of the New York Stock Exchange, and this may result in less protection for the holders of our Class A common shares.”
Investing in our Class A common shares involves a high degree of risk. See “Risk Factors” beginning on page 26 of this prospectus.
|
| Per Class A |
| Total | ||
Public offering price |
| US$ |
|
| US$ |
|
Underwriting discount and commissions(1) |
| US$ |
|
| US$ |
|
Proceeds to the selling shareholders (before expenses)(2) (3) |
| US$ |
|
| US$ |
|
The selling shareholders have granted the underwriters the right to purchase up to an aggregate of 2,625,000 additional Class A common shares from the selling shareholders within 30 days from the date of this prospectus, at the public offering price, less underwriting discounts and commissions. We will not receive any proceeds from the sale of Class A common shares by the selling shareholders.
Neither the U.S. Securities and Exchange Commission (the “SEC”), nor any state securities commission has approved or disapproved of these securities or determined if this prospectus, including the documents incorporated by reference into this prospectus, is truthful or complete. Any representation to the contrary is a criminal offense.
We expect to deliver the Class A common shares to purchasers against payment in New York, New York, on or about , 2025, through the book-entry facilities of The Depository Trust Company.
| Global Coordinators |
| |
|
|
| |
|
|
| |
J.P. Morgan |
| Morgan Stanley | |
|
| ||
| Joint Bookrunners |
| |
|
|
|
|
|
|
| |
BTG Pactual | Santander | Scotiabank | |
|
| ||
The date of this prospectus is , 2025. | |||

Tiendas 3B
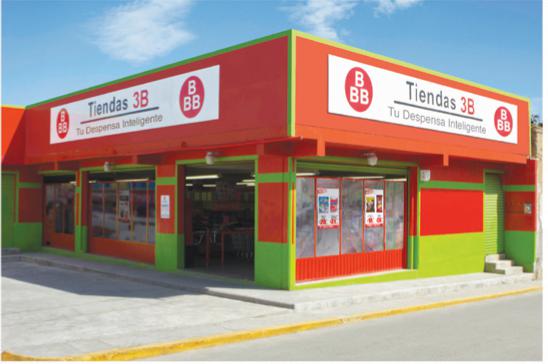
We are the pioneers and leaders of hard discount grocery retail in Mexico. Our name, 3B means: “Bueno, Bonito y Barato” or “Good, Nice and Affordable”. It summarizes our mission of offering irresistible value to budget savvy consumers.

Simple, yet disruptive business model that drives customer savings and improves our value proposition.
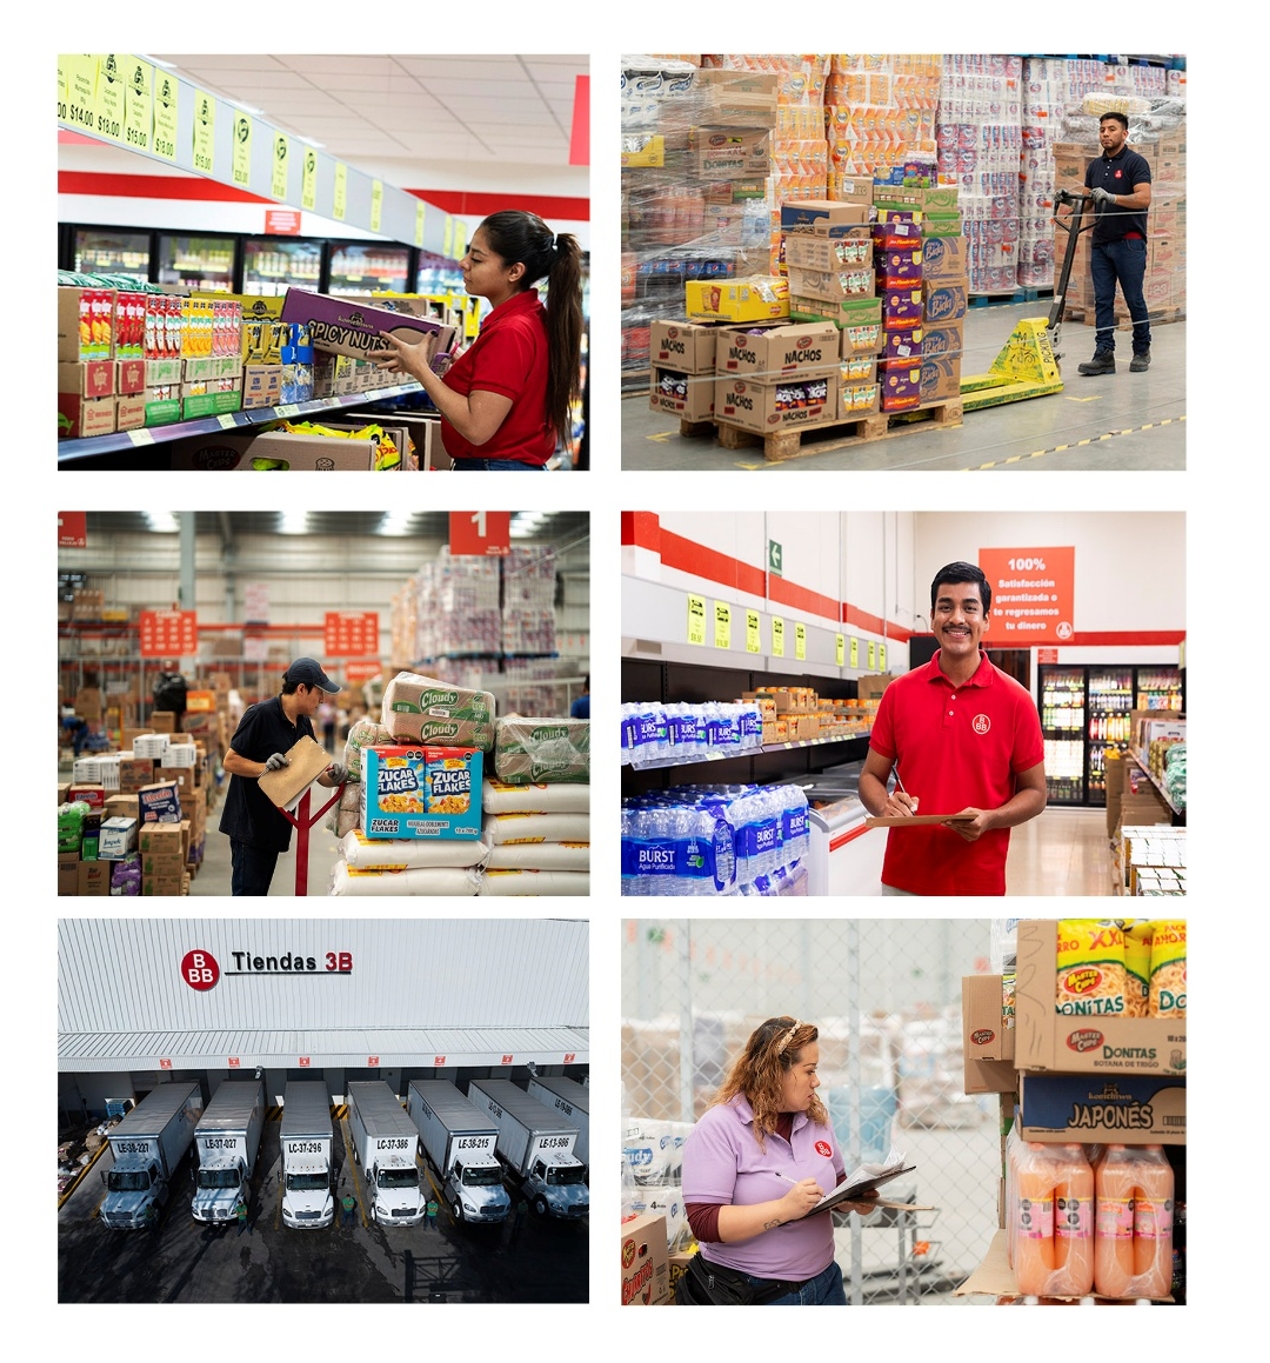
We have absolute confidence in our product quality, backed up by our no-questions-asked no-receipt-needed money-back return policy.

Private label products are core to our strategy. High-quality and low prices enhance our customers’ value for money and allow us to maintain everyday low prices.

Our 2,772 stores are strategically located close to our customers’ homes to provide a more efficient and cost-effective shopping experience.

TABLE OF CONTENTS
|
| Page |
| iii | |
| 1 | |
| 28 | |
| 53 | |
| 55 | |
| 56 | |
| 57 | |
MANAGEMENT’S DISCUSSION AND ANALYSIS OF FINANCIAL CONDITION AND RESULTS OF OPERATIONS |
| 58 |
| 76 | |
| 109 | |
| 119 | |
| 122 | |
| 126 | |
| 128 | |
| 144 | |
| 146 | |
| 150 | |
| 163 | |
| 163 | |
| 163 | |
| 164 | |
| 165 | |
| 166 | |
| F-1 |
None of we, the selling shareholders, the underwriters, nor any of our or their respective agents have authorized anyone to give any information or make any representation about this offering that is different from, or in addition to that contained in this prospectus, including in the documents incorporated by reference in this prospectus, the related registration statement, any free writing prospectus prepared by or on behalf of us or we may refer to you. None of we, the selling shareholders, the underwriters, nor any of our or their respective agents will have or take responsibility and can provide no assurance as to the reliability of any other information that others may give you.
To the extent there is a conflict between the information contained in this prospectus, on the one hand, and the information contained in any document incorporated by reference filed with the SEC before the date of this prospectus, on the other hand, you should rely on the information in this prospectus. If any statement in a document incorporated by reference is inconsistent with a statement in another document incorporated by reference having a later date, the statement in the document having the later date modifies or supersedes the earlier statement.
This prospectus is being used in connection with this offering of the Class A common shares in the United States and, to the extent described below, elsewhere. This offering is being made in the United States and elsewhere based solely on the information contained in this prospectus, including the documents incorporated by reference into this prospectus. You should assume that the information appearing in this prospectus is accurate only as of the date on the front cover of this prospectus, regardless of the time of delivery of this prospectus or of any sale of the Class A common shares. Our business, financial condition, results of operations, cash flows and prospects may have changed since the date on the front cover of this prospectus.
None of we, the selling shareholders, the underwriters, nor any of our or their respective agents are offering or seeking offers to purchase the Class A common shares in any jurisdiction where such offers or sales are not permitted. We have not undertaken any efforts to qualify this offering for offers and sales to the public in any
i
jurisdiction outside the United States, and we do not expect to make offers and sales to the public in jurisdictions located outside the United States (including Mexico). However, we may make offers and sales outside the United States in circumstances that do not constitute a public offer or distribution under applicable laws and regulations.
This offering is being made in the United States and elsewhere based solely on the information contained or incorporated by reference in this prospectus.
Notice to Investors Outside the United States. None of we, the selling shareholders, the underwriters, nor any of our or their respective agents have done anything that would permit this offering or possession or distribution of this prospectus or any free writing prospectus in connection with this offering in any jurisdiction, other than the United States, where action for that purpose is required. Persons outside the United States who come into possession of this prospectus or any such free writing prospectus must inform themselves about, and observe any restrictions relating to, this offering of our Class A common shares and the distribution of this prospectus and any such free writing prospectus outside the United States.
Notice to Mexican Investors. The Class A common shares have not been and will not be registered with the Mexican National Securities Registry (Registro Nacional de Valores, or the “RNV”) maintained by the Mexican National Banking and Securities Commission (Comisión Nacional Bancaria y de Valores, or the “CNBV”), and therefore, the Class A common shares may not be offered or sold publicly in Mexico or otherwise be subject to brokerage activities in Mexico, the Class A common shares may be offered and sold in Mexico, on a private placement basis, solely to investors that qualify as institutional or qualified investors pursuant to the private placement exemption set forth in Article 8 of the Mexican Securities Market Law (Ley del Mercado de Valores) and regulations thereunder. The information contained or incorporated by reference in this prospectus is solely our responsibility and has not been reviewed or authorized by the CNBV and may not be publicly distributed in Mexico. In making an investment decision, all investors, including any Mexican investor, who may acquire Class A common shares from time to time, must rely on their own examination of the Issuer and the terms of this offering, including the merits and risks involved.
ii
PRESENTATION OF FINANCIAL AND OTHER INFORMATION
Certain Definitions
Unless the context otherwise requires, references in this prospectus to “Tiendas 3B,” the “Company,” “we,” “our,” “us” and similar terms are to BBB Foods Inc., together with its consolidated subsidiaries; references to the “Issuer” are to BBB Foods Inc., the company whose Class A common shares are being offered by this prospectus, and not to any of its subsidiaries; references to our “principal shareholder” are to Bolton Partners Ltd., a vehicle affiliated with Mr. K. Anthony Hatoum, our founder, Chairman and Chief Executive Officer; and references to the “selling shareholders” are to those shareholders listed as selling shareholders under “Selling Shareholders.”
The term “Companies Act” refers to the BVI Business Companies Act, 2004 (as amended) of the British Virgin Islands.
The term “sales” refers to our Revenue from sales of merchandise.
Currency Information
The term “Mexican peso” and the symbol “Ps.” refer to the legal currency of Mexico, and the term “U.S. dollar” and the symbol “US$” refer to the legal currency of the United States.
This prospectus contains translations of certain Mexican peso amounts into U.S. dollars at specified rates solely for the convenience of the reader. These translations should not be construed as representations that the Mexican peso amounts actually represent such U.S. dollar amounts or could be converted into U.S. dollars at the rate indicated as of the dates mentioned herein or at any other rate. Unless otherwise indicated, we have translated Mexican peso amounts into U.S. dollars at the rate of Ps.19.629 per US$1.00, the exchange rate to pay foreign currency denominated obligations due on September 30, 2024 published by the Mexican Central Bank in the Mexican Federal Official Gazette (Diario Oficial de la Federación, or the “Official Gazette”). In addition, we have translated the U.S. dollar amounts outstanding on the Promissory Notes and the Convertible Notes (described under “Management’s Discussion and Analysis of Financial Condition and Results of Operations—Liquidity and Capital Resources—Promissory Notes and Convertible Notes”) as of December 31, 2023 into Mexican pesos at the rate of Ps.16.89 per US$1.00 (the exchange rate to pay foreign currency denominated obligations due on December 31, 2023, published by the Mexican Central Bank in the Official Gazette).
Financial Statement Presentation
The Issuer, the company whose Class A common shares are being offered in this prospectus, was incorporated on July 9, 2004 in the British Virgin Islands with company number 605635.
The financial information presented or incorporated by reference herein has been derived from our audited consolidated financial statements as of December 31, 2023 and 2022 and for the years ended December 31, 2023, 2022 and 2021, together with the notes thereto, and our unaudited interim condensed consolidated financial statements as of September 30, 2024 and for the three and nine months ended September 30, 2024 and 2023, together with the notes thereto, prepared in accordance with International Financial Reporting Standards (“IFRS”) as issued by the International Accounting Standards Board (“IASB”), and included elsewhere in this prospectus.
The summary consolidated historical financial data should be read in conjunction with “Special Note Regarding Non-IFRS Financial Measures,” “Management’s Discussion and Analysis of Financial Condition and Results of Operations,” our audited consolidated financial statements as of December 31, 2023 and 2022 and for the years ended December 31, 2023, 2022 and 2021, together with the notes thereto, incorporated by reference in this prospectus, and our unaudited interim condensed consolidated financial statements as of September 30, 2024 and for the three and nine months ended September 30, 2024 and 2023, together with the notes thereto, included elsewhere in this prospectus.
iii
Special Note Regarding Non-IFRS Financial Measures
For convenience of investors, this prospectus presents certain non-IFRS financial measures, which are not recognized under IFRS. A non-IFRS financial measure is generally defined as one that purports to measure financial performance but excludes or includes amounts that would not be so adjusted in the most comparable IFRS measure. Specifically we present:
For a discussion on the use of these measures and a reconciliation of the most directly comparable IFRS measures, see “Summary Financial and Other Information —Non-IFRS Financial Measures and Key Operating Metrics—Non-IFRS Financial Measures.”
Non-IFRS financial measures do not have standardized meanings and may not be directly comparable to similarly-titled measures adopted by other companies. These non-IFRS financial measures are used by our management for decision-making purposes and to assess our financial and operating performance, generate future operating plans and make strategic decisions regarding the allocation of capital. The non-IFRS measures presented have limitations as analytical tools, and you should not consider them in isolation or as substitutes for analysis of our results of operations presented in accordance with IFRS. Additionally, our calculations of non-IFRS measures may be different from the calculations used by other companies, including our competitors, and therefore, our measures may not be comparable to those of other companies.
Rounding Adjustments
We have made rounding adjustments to certain numbers presented in this prospectus. As a result, numerical figures presented as totals may not always be the exact arithmetic results of their components. Percentage figures included in this prospectus have not, in all cases, been calculated on the basis of such rounded figures but on the basis of such amounts prior to rounding. For this reason, certain percentage amounts in this prospectus may vary from those obtained by performing the same calculations using the figures in our audited consolidated financial statements as of December 31, 2023 and 2022 and for the years ended December 31, 2023, 2022 and 2021, together with the notes thereto, incorporated by reference in this prospectus, and our unaudited interim condensed consolidated financial statements as of September 30, 2024 and for the three and nine months ended September 30, 2024 and 2023, together with the notes thereto, included elsewhere or incorporated by reference in this prospectus.
Market and Industry Data
This prospectus contains data related to economic conditions in the market in which we operate. The information contained in this prospectus concerning economic conditions is based on publicly available information from third-party sources that we believe to be reliable. Market data and certain industry forecast data used in this prospectus were derived from our management’s knowledge and our experience in the industry, internal reports and studies, where appropriate, as well as estimates, market research, publicly available information and industry publications. We obtained the information included in this prospectus relating to the industry in which we operate, as well as the estimates concerning market shares, through internal research, public information and publications on the industry prepared by official public sources, such as: the Mexican Central Bank (Banco de México), the World Bank, the National Minimum Wage Commission (Comisión Nacional de Salarios Mínimos), the Mexican Statistic and National Geography Institute (Instituto Nacional de Estadística y Geografía, or “INEGI”), the Central Intelligence Agency World Factbook, Euromonitor International Passport: Retail, 2024 edition, and NielsenIQ México Services.
Industry publications, governmental publications, and other market sources, including those referred to above, generally state that the information they include has been obtained from sources believed to be reliable, but that the accuracy and completeness of such information is not guaranteed. We have no reason to believe any of this information or these reports are inaccurate in any material respect and believe and act as if they are reliable. Neither we, the underwriters, nor their respective agents have independently verified it and they are subject to change based on various factors, including those discussed in the section entitled “Risk Factors.” Estimates of market and industry
iv
data are based on statistical models, key assumptions and limited data sampling, and actual market and industry data may differ significantly from estimated industry data. In addition, the data that we compile internally, and our estimates have not been verified by an independent source. Information derived from management’s knowledge and our experience is presented on a reasonable, good faith basis. Except as disclosed in this prospectus, none of the publications, reports or other published industry sources referred to in this prospectus were commissioned by us or prepared at our request. Except as disclosed in this prospectus, we have not sought or obtained the consent of any of these sources to include such market data in this prospectus.
Information in this prospectus mentioning “Euromonitor” as a source is from independent market research carried out by Euromonitor International Limited but should not be relied upon in making, or refraining from making, any investment decision. All figures related to the development of the grocery retail industry in Mexico presented in this prospectus that are sourced from Euromonitor have been quoted from Euromonitor International, Retail, 2024 edition. Unless otherwise stated, all value data citations are in retail selling prices to consumers, excluding value added tax, in U.S. dollars, at year-on-year exchange rates and at current prices for the year.
Trademarks and Trade Names
We own or have rights to trademarks, service marks and trade names that we use in connection with the operation of our business, including our corporate name, logos, and website names. Other trademarks, service marks and trade names appearing in this prospectus are the property of their respective owners. Solely for convenience, some of the trademarks, service marks and trade names referred to in this prospectus are listed without the ® and TM symbols, but we will assert, to the fullest extent under applicable law, our rights to our trademarks, service marks and trade names.
v
PROSPECTUS SUMMARY
This summary highlights selected information contained elsewhere or incorporated by reference in this prospectus. This summary may not contain all the information that may be important or relevant to you in making your investment decision. Before you decide to invest in our Class A common shares, we urge you to read this entire prospectus and the documents incorporated by reference in this prospectus carefully, including our audited consolidated financial statements as of December 31, 2023 and 2022 and for the years ended December 31, 2023, 2022 and 2021, together with the notes thereto, and our unaudited interim condensed consolidated financial statements as of September 30, 2024 and for the three and nine months ended September 30, 2024 and 2023, together with the notes thereto, included elsewhere in or incorporated by reference in this prospectus and the information set forth under “Risk Factors,” “Business” and “Management’s Discussion and Analysis of Financial Condition and Results of Operations.”
Overview
We are pioneers and leaders of the grocery hard discount model in Mexico and one of the fastest growing retailers in the country as measured by our sales and store growth rates. The 3B name, which references “Bueno, Bonito y Barato” – a Mexican saying which translates to “Good, Nice and Affordable”– summarizes our mission of offering irresistible value to budget savvy consumers through great quality products at bargain prices. From 2020 to 2023, our total revenue grew at a compounded annual growth rate (“CAGR”) of 34.7%, reaching Ps.44.1 billion (US$2.2 billion) for 2023, and our number of stores increased from 1,249 as of year-end 2020 to 2,772 as of year-end 2024, which represents a CAGR of 22.1%. Our total revenue for the 12-month period ended September 30, 2024 was Ps.53.4 billion (US$2.7 billion), with a total of 2,772 stores in operation as of December 31, 2024.
Our business model is simple yet disruptive: we offer a limited assortment of products that cover the daily grocery needs of our clients. We price our products to offer what is generally market-leading value for money: the lowest sustainable price in the market for a given quality. Our stores also offer convenience, since they are generally located within central neighborhoods that allow for daily visits and minimize transportation needs for our customers. Our customers visit us on average three to four times per week to fulfill one or two days of groceries.
The Tiendas 3B product range consists of approximately 800 stock keeping units (“SKUs”) of branded, private label and spot products.
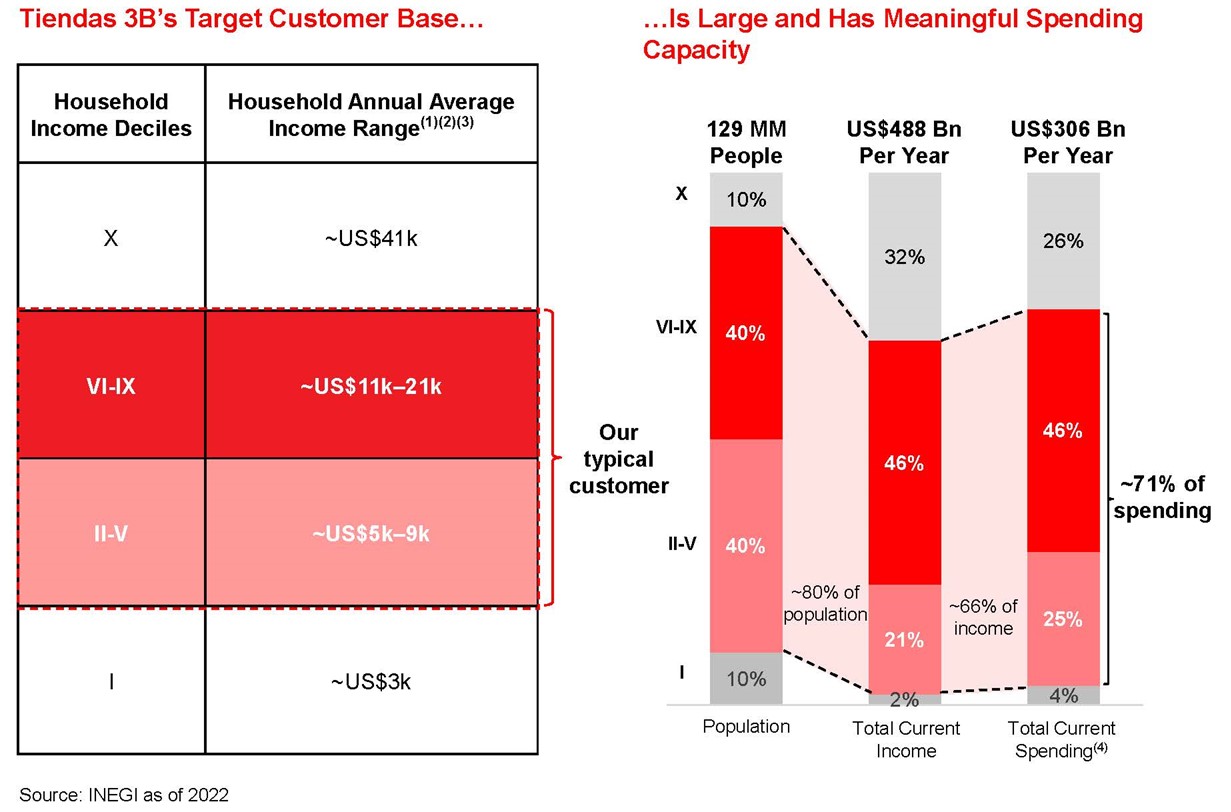
Our stores serve low-to-middle income households, which according to the National Survey of Household Income and Expenditure conducted by INEGI in 2022, spent US$216 billion in 2022, or 70.7% of the Mexican population’s total current monetary spend, defined by INEGI as a households’ expenditure on food, beverages and tobacco, personal care, house cleaning products and over the counter healthcare products, among other categories other than rent and financial expenditures. We believe that our business model, which focuses on both value and convenience, allows us to serve our target market better than incumbent competitors and maintain real and sustainable competitive advantages.
Due to our low number of SKUs and focus on serving daily grocery needs, we have been able to achieve a high ratio of sales per SKU and a ratio of 3.1 Payable Days to Inventory Days during 2023, driving significant cash
1
flow generation. We are also able to benefit from a virtuous cycle, where the ever-increasing scale of our purchases per SKU allows us to negotiate increasingly lower prices with our suppliers and, in turn, we are able to transfer those savings to our customers, therefore increasing customer loyalty and our sales.
The Tiendas 3B business model is highly efficient, allowing us to operate with gross margins that are lower than those of leading grocery retailers in Mexico, based on publicly available information. The strength of our model is underpinned by our limited product assortment, our decentralized organization, and our culture that values efficiency and simplicity. Efficiency translates into savings that can be passed on to our customers.
Our management is decentralized and organized into regions, each run by a regional director, and built around a distribution center that serves approximately 150 stores. Each region has sufficient functional resources to operate autonomously and efficiently. This structure, supported by nimble central headquarters, has enabled us to scale efficiently by allowing us to dynamically select new store locations in a constant pursuit of scale and expansion, while achieving positive gross and operating profit. Additionally, it enables suppliers to reach our decision makers quickly, fostering collaboration and accelerating the development of private label products.
Developing and retaining talent, as well as fostering a strong corporate culture, are key components of our business model and essential to sustaining our rapid growth rates and achieving efficiencies. We anticipate our personnel needs several years in advance and invest significant resources to ensure that we have the right talent at the right time.
We believe that the hard discount segment in Mexico has significant entry barriers for new participants, including: (i) the time and capital it takes to achieve scale and profitability given the inherent low gross margins of a hard discounter; (ii) the knowledge required to find competitive real estate and qualified personnel; (iii) the investment and know-how required to develop a meaningful private label product offering; and (iv) obtaining access to highly qualified senior management and experienced teams.
Our Business Model
Our business model is based on the following pillars:
2
The Grocery Retail Industry in Mexico
Large and growing market
The Mexican formal grocery market had approximately US$157 billion annual sales for 2023 and is projected to grow at a 8.8% compounded annual rate from 2023 to 2028, according to Euromonitor. The market is expected to reach US$239 billion in annual sales by 2028.
Fragmented market: One dominant player but otherwise highly fragmented
The grocery market in Mexico is best viewed in two channels: the Modern (or organized) channel, which is a sub-set of the formal grocery market and which we define to include discounters, hypermarkets, supermarkets, convenience retailers and warehouse clubs, and the Traditional (or informal) channel, which we define to include, among others, local grocers and food, drink, and tobacco specialty stores. The Modern channel, which represented US$103 billion in annual sales for 2023 based on data from Euromonitor, can be further divided into full-price retailers and discounters (including soft discounters and hard discounters, such as Tiendas 3B). Discounters represented 29.7% of the Modern channel for the year ended December 31, 2023, according to data from Euromonitor.
Walmex is the dominant player in the Modern channel, representing 32.5% of that channel’s total sales for 2023 based on data from Euromonitor. Walmex’s most successful format is Bodega Aurrera, a discounter which represented 16.0% of sales in the Modern channel. Beyond that, the market is highly fragmented.
The hard discount business model
Hard discount is still a nascent business model in Mexico within the Modern channel. According to NielsenIQ, hard discounters, such as Tiendas 3B and Tiendas Neto, only represented 3.0% of sales in the Mexican grocery market for 2023. Although large retail players, such as Walmex (through Bodega Aurrera Express) or FEMSA (through Tiendas BARA), have presence in discount formats, since inception, Tiendas 3B has successfully competed with those formats as well as with other established grocery players as shown by our growth track record.
Hard discount grocery retailers, like ourselves, are different from other retailers in the Modern channel. The hard discount model focuses on a limited assortment of high value for money, high rotation branded and private label products that address the consumer’s essential daily needs. A hard discounters operations seek to be highly efficient and simple, with streamlined logistics, distribution, storefront operations and standardized no-frill store layouts with flexible locations. As a result of the efficiencies in the business model, hard discounters who achieve scale tend to have low gross margins and yet can achieve high returns on invested capital.
3
Tiendas 3B’s addressable market
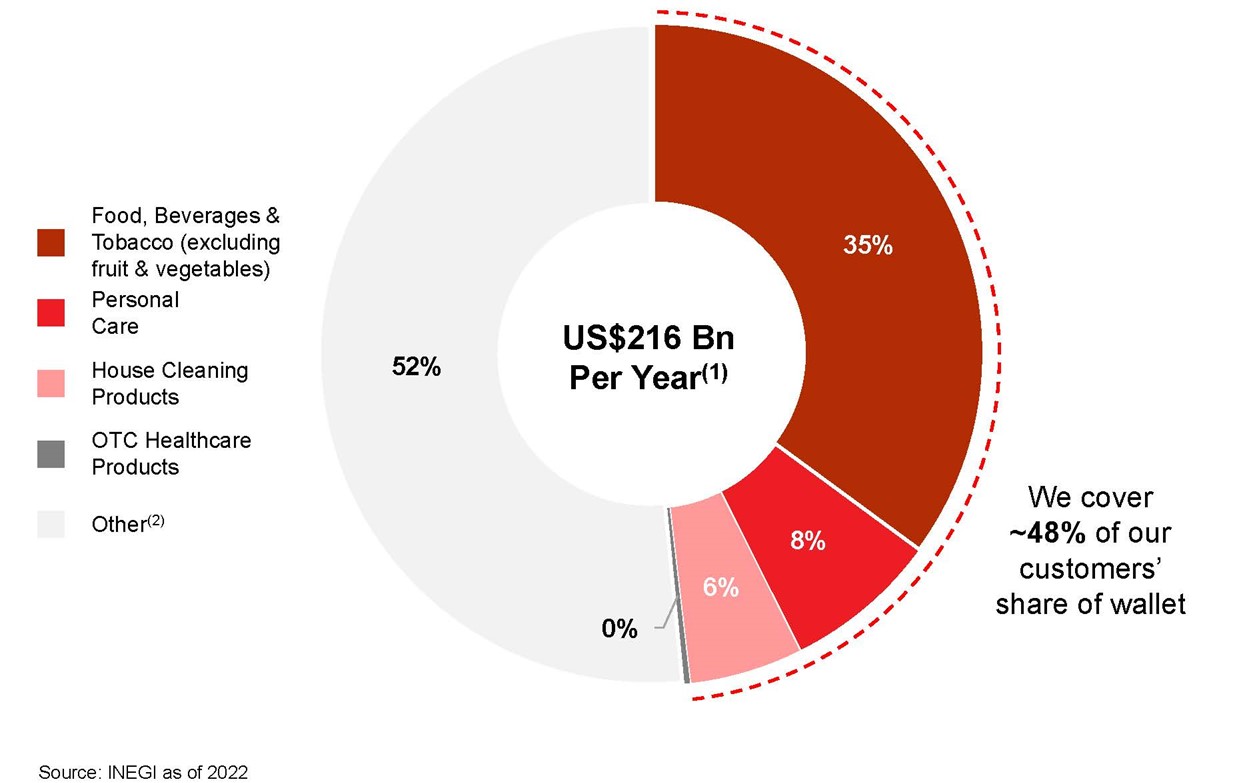
Our stores serve low-to-middle income households, which according to the National Survey of Household Income and Expenditure conducted by INEGI in 2022, spent US$216 billion in 2022, or 70.7% of the Mexican population’s total current monetary spend. According to data from INEGI, approximately 48.4% of annual average Mexican household total current monetary spend within the second to ninth income decile is destined to food (excluding fruits and vegetables), beverages and tobacco, personal care products, house cleaning products and over the counter medicines. Our product offering covers all of these categories. Further, approximately 35.1% of annual average Mexican household current monetary spend within the second to ninth income decile is destined to food (excluding fruits and vegetables) and beverage products alone, such as the ones we sell.
|
|
|
|
| ||
Notes: |
| Notes: | ||
1. 2. 3. 4.
| Considers an exchange rate of Ps.19.629 per US$1.00. Each household has on average 3.43 members Range considers average income by income decile Excludes non-monetary expenses with an estimated value of US$83.7 billion. Non-monetary expenses include self-consumption, payments in kind, gifts, and the estimated rent households would have had to pay if they didn’t own their house |
| 1. 2. | Total current monetary spend for income deciles II to IX Includes transportation & communications, education, housing, clothing, fruit and vegetables, and healthcare (excl. OTC products) |
Tiendas 3B’s whitespace opportunity
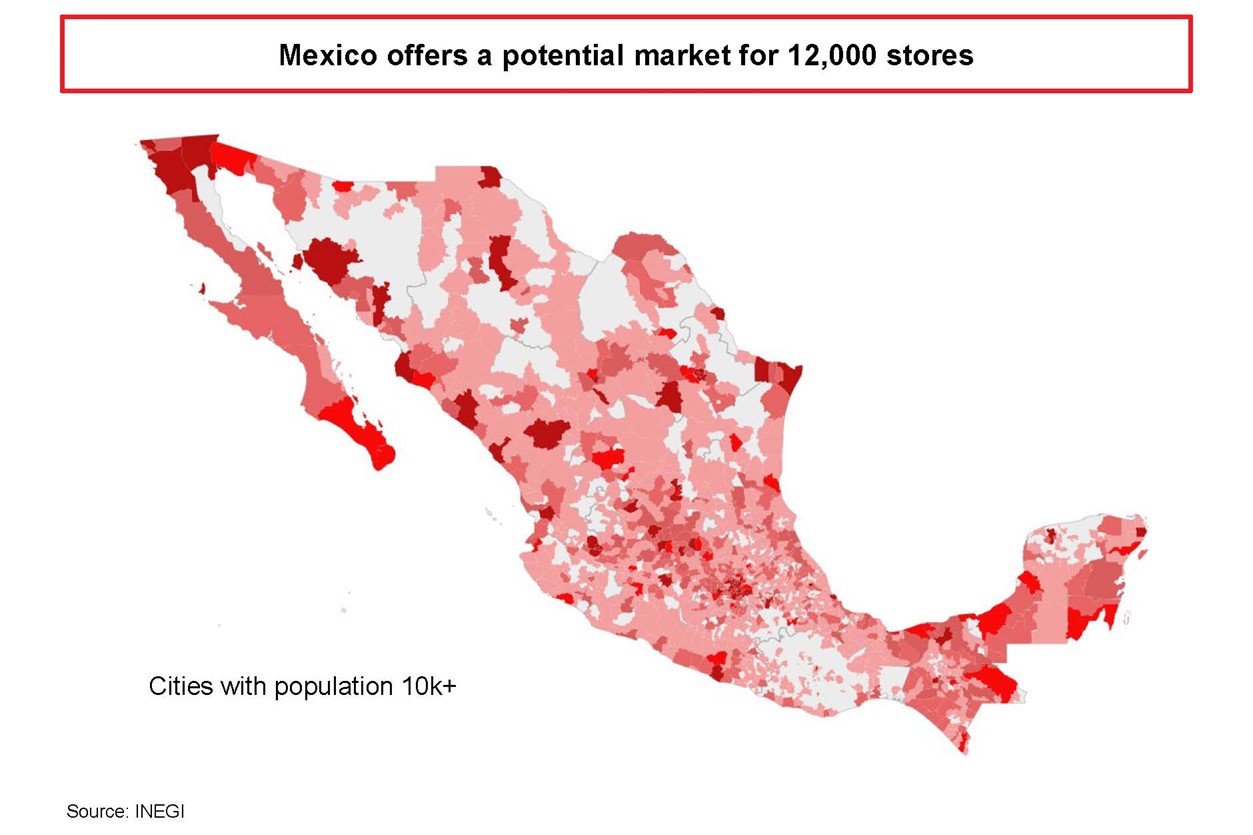
We believe that there is a large whitespace opportunity for Tiendas 3B. This opportunity will be driven by market expansion as a result of favorable demographic trends, the under-penetration of hard discount stores in the Mexican grocery market, and hard discount’s growing appeal with the Mexican consumers. Tiendas 3B’s addressable market is large and poised for continued growth.
Based on our estimates at December 31, 2023, we believe there is a potential to open at least 12,000 additional Tiendas 3B stores in Mexico at current population levels in urban areas alone. We have mapped out whitespace by identifying communities with over 10,000 inhabitants as our stores are designed to adequately serve that number of people in a trade area of 800 meters from each store. This would represent almost a five-fold increase over our 2,772 stores as of December 31, 2024.
4
Hard discount in Mexico has significant growth potential when compared to other countries
The hard discount retail market in Mexico appears to be underpenetrated when compared to other countries with more established hard discount retail markets.
According to NielsenIQ, in 2023, the hard discount market in Mexico represented only 3.0% of NielsenIQ’s measurement of the Mexican grocery market. In contrast, grocery retailers which we consider hard discounters in Germany (i.e., Aldi and Lidl), in Poland (i.e., Biedronka, Aldi and Lidl), and in Turkey (i.e., BIM and A101), which are countries with successful and mature hard-discount markets, represented 24.2%, 36.8% and 24.6%, respectively, of their corresponding grocery market’s annual sales in 2023 based on data from Euromonitor.
5
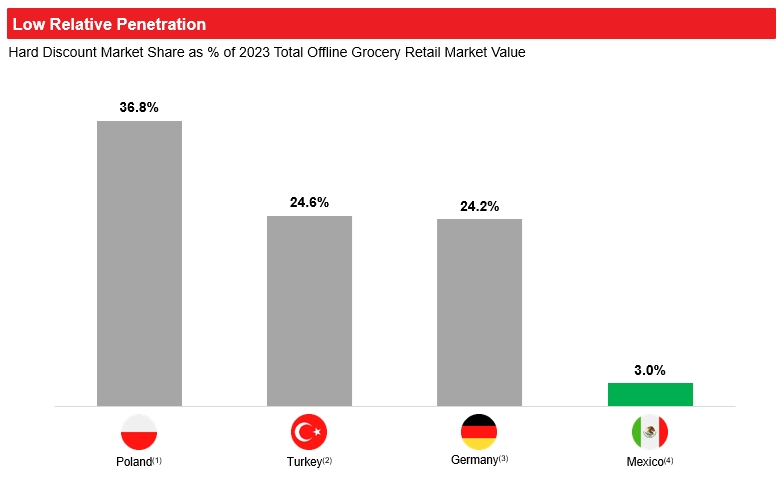
Notes:
1. | Considers Biedronka, Lidl and Aldi | 3. | Considers Aldi and Lidl |
2. | Considers BIM and A101 | 4.
| Information from "NielsenIQ Homescan Hard Discounters Report" |
Although the Mexican food retail market has other features that differentiates it from that of Germany, Poland and Turkey at the time the hard discount model was introduced in those countries, including having a highly developed and efficient food retailers, we believe that these markets exemplify how the hard discount model can prosper even as countries grow richer. Initially, similar to Mexico, German and Polish consumers were attracted to hard discount given the great value proposition. At the time hard discount was introduced in Germany (1946 following the Second World War), in Poland (1990 following the fall of the Soviet Union) and Turkey (in 1995), German real gross domestic product (“GDP”) per capita, adjusted for inflation to date and price differences between countries was US$7,195, Poland’s was US$8,150 and Turkey’s was US$9,963. Even as per capita income ramped up in those countries, hard discounter penetration continued to increase. Although there is no assurance that the Mexican market will develop in the same fashion, we believe Mexican consumers are increasingly attracted to the hard discount model’s value proposition.
Our Competitive Strengths
Since inception, we have successfully competed with well-established grocery retailers and our sustainable competitive advantages have allowed us to thrive. We believe that as we continue to grow, our advantages will become more pronounced:
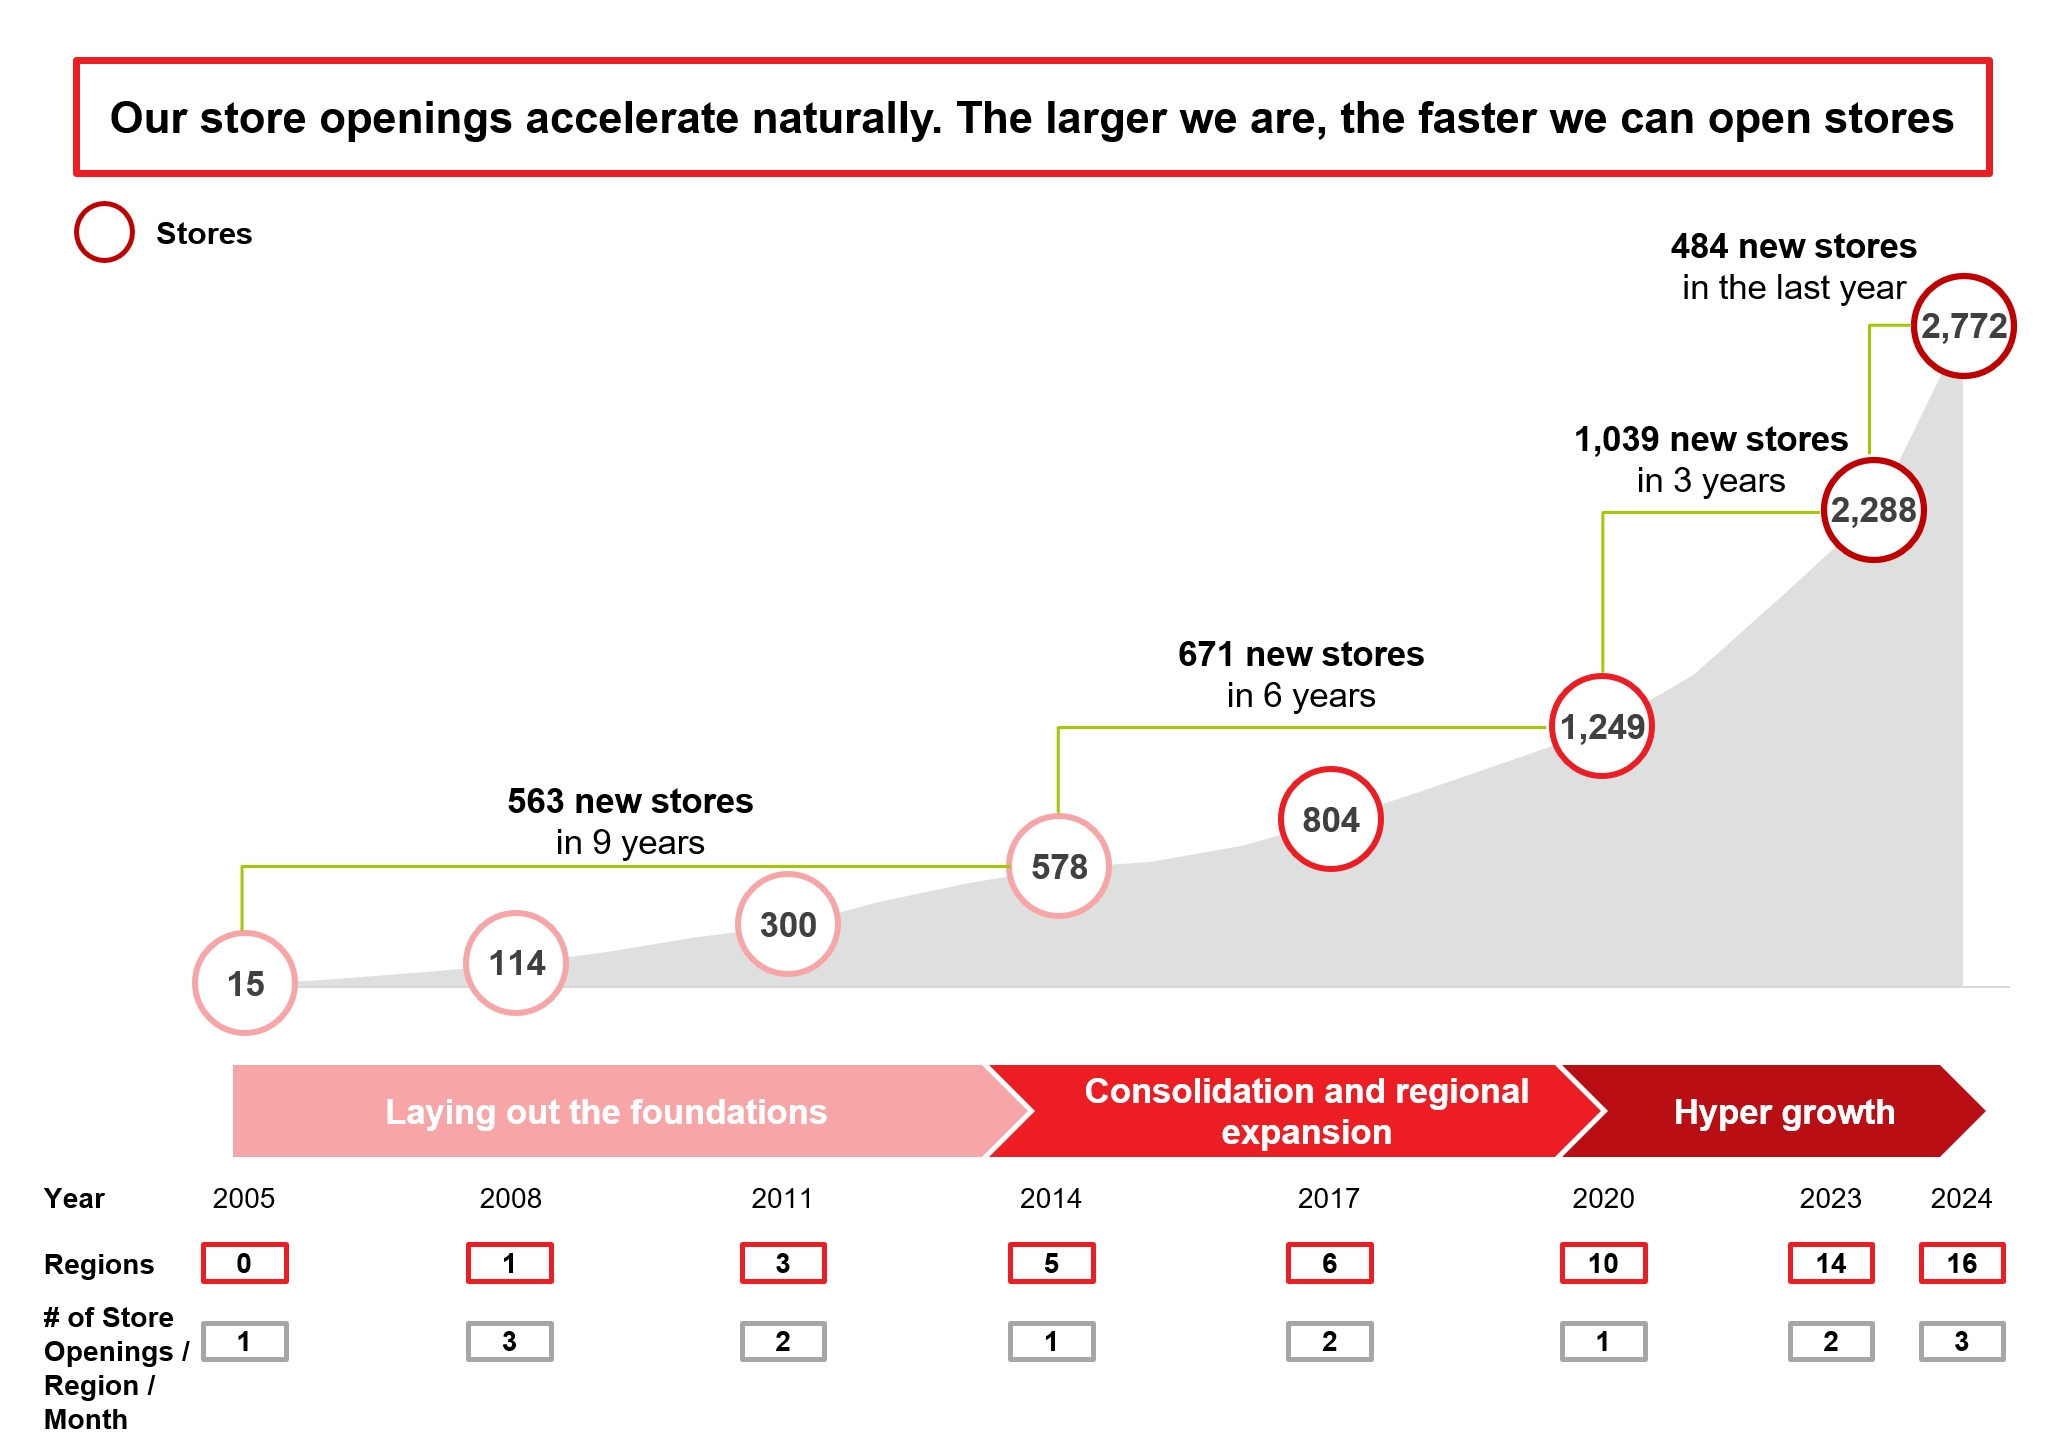
Rapid store expansion capacity
We opened our first store in February 2005, and as of December 31, 2024, we had 2,772 stores and 16 distribution centers. As our sales have grown, the pace of our store openings has accelerated naturally, as illustrated in the chart below. We had 392 net new store openings during 2022, 396 net new store openings during 2023 and 484 net new store openings during 2024, which translates into an average of one new store opening every 18 hours.
6
We are the fastest growing retailer in Mexico in terms of sales, based on a comparison of our sales figures with Euromonitor’s analysis of sales growth for the fastest growing retail players in Mexico. As shown below, Tiendas 3B has significantly outpaced incumbent retailers, with a total revenue CAGR of 34.7% from 2020 to 2023.
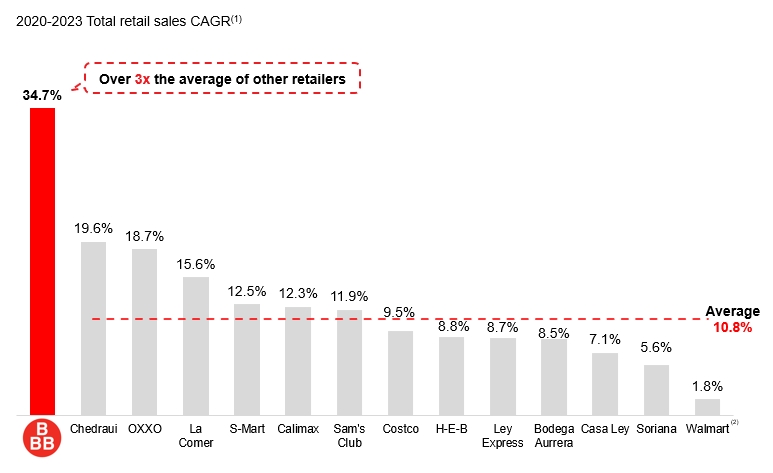
Source: Based on a comparison of Tiendas 3B's sales figures with Euromonitor's analysis of sales growth for competitors
Notes:
7
Sales growth underpinned by strong fundamentals
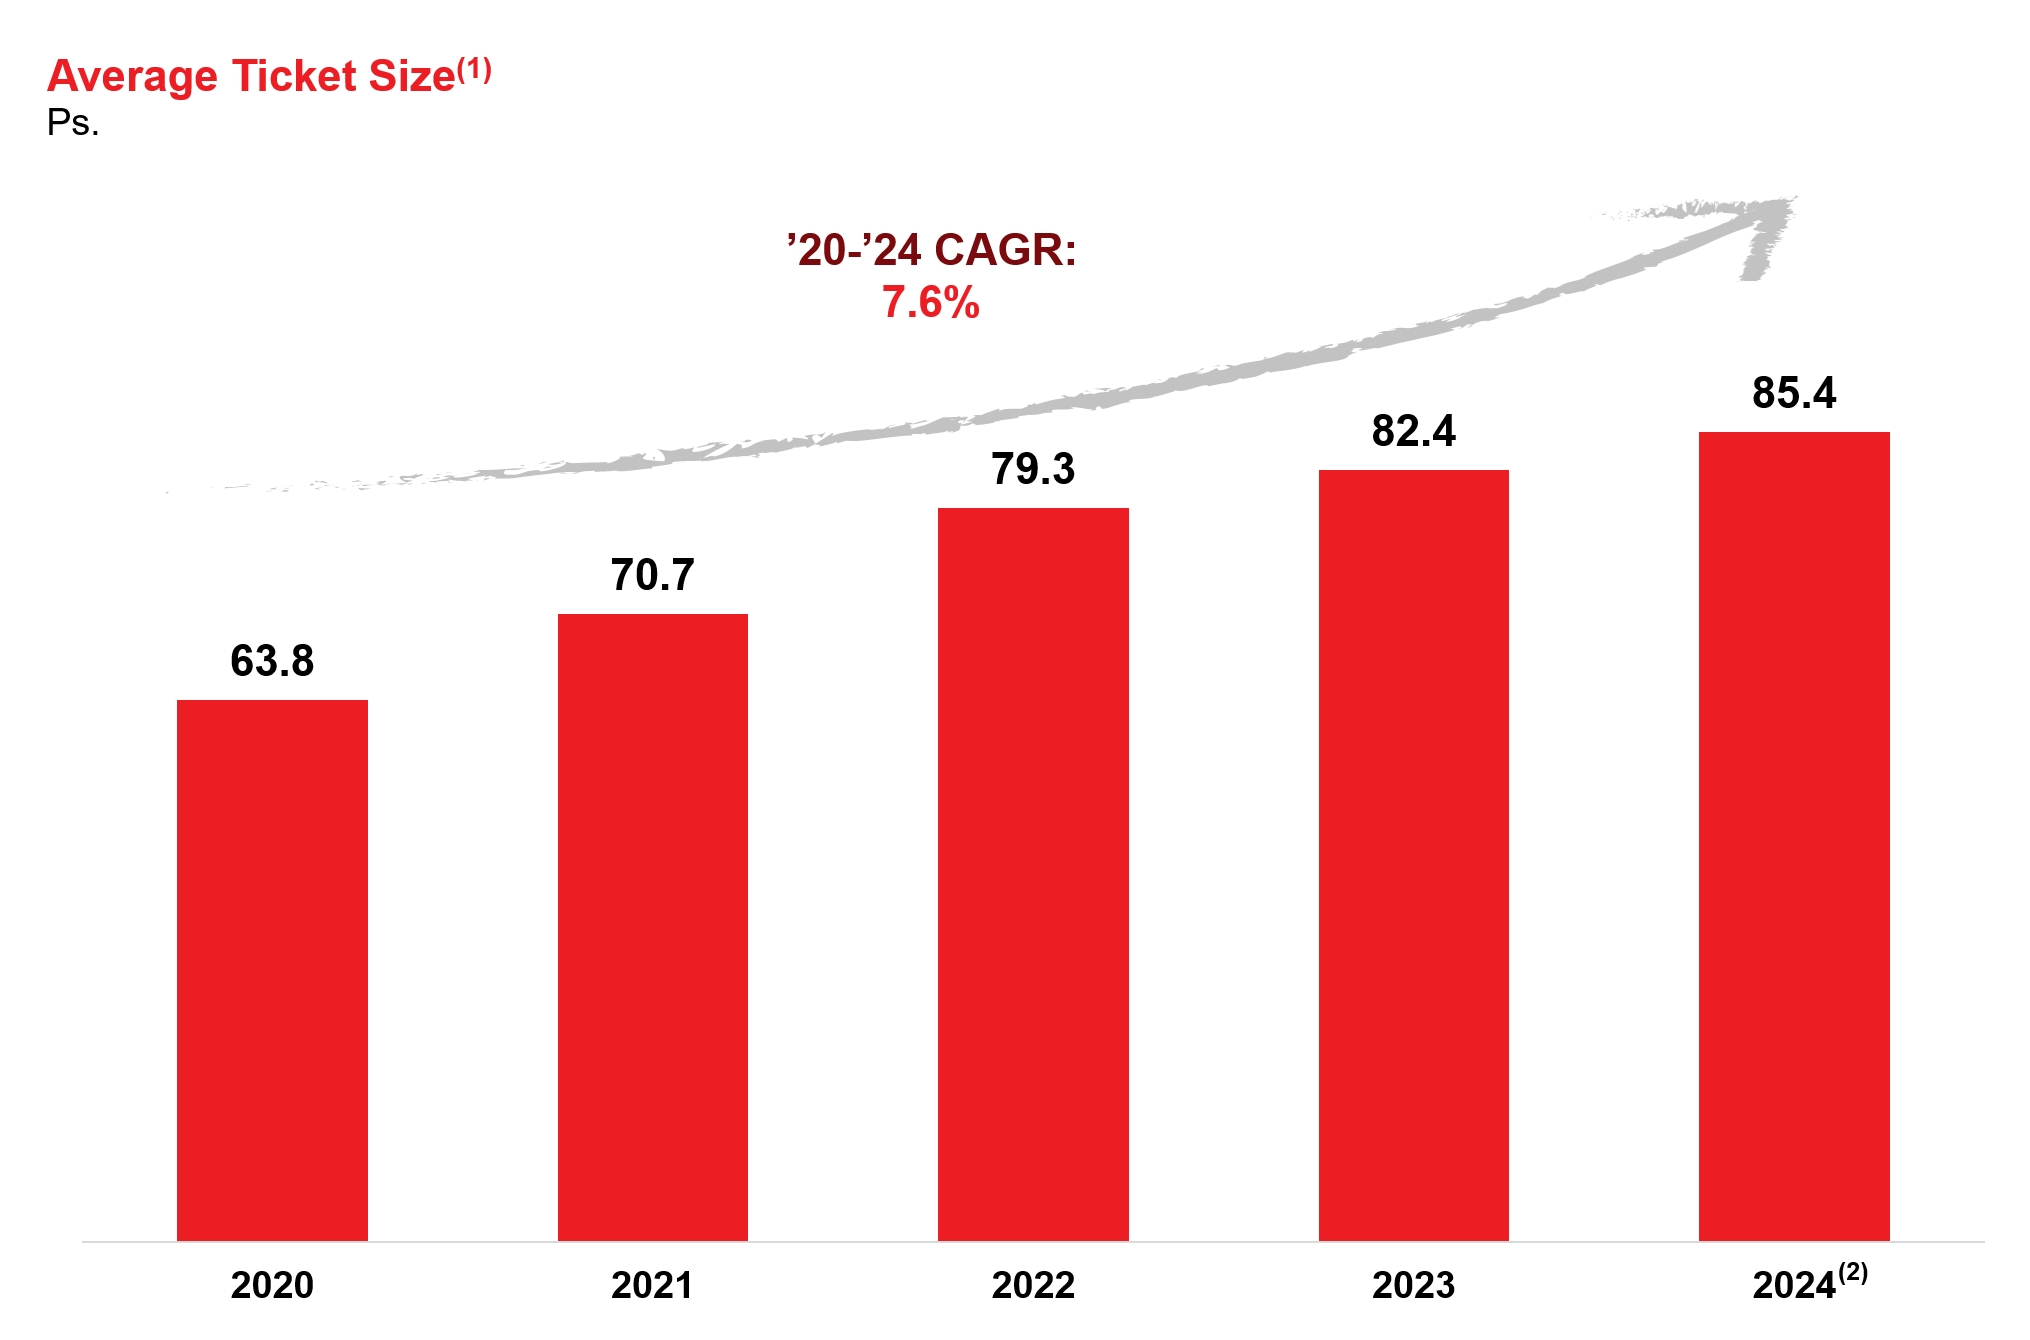
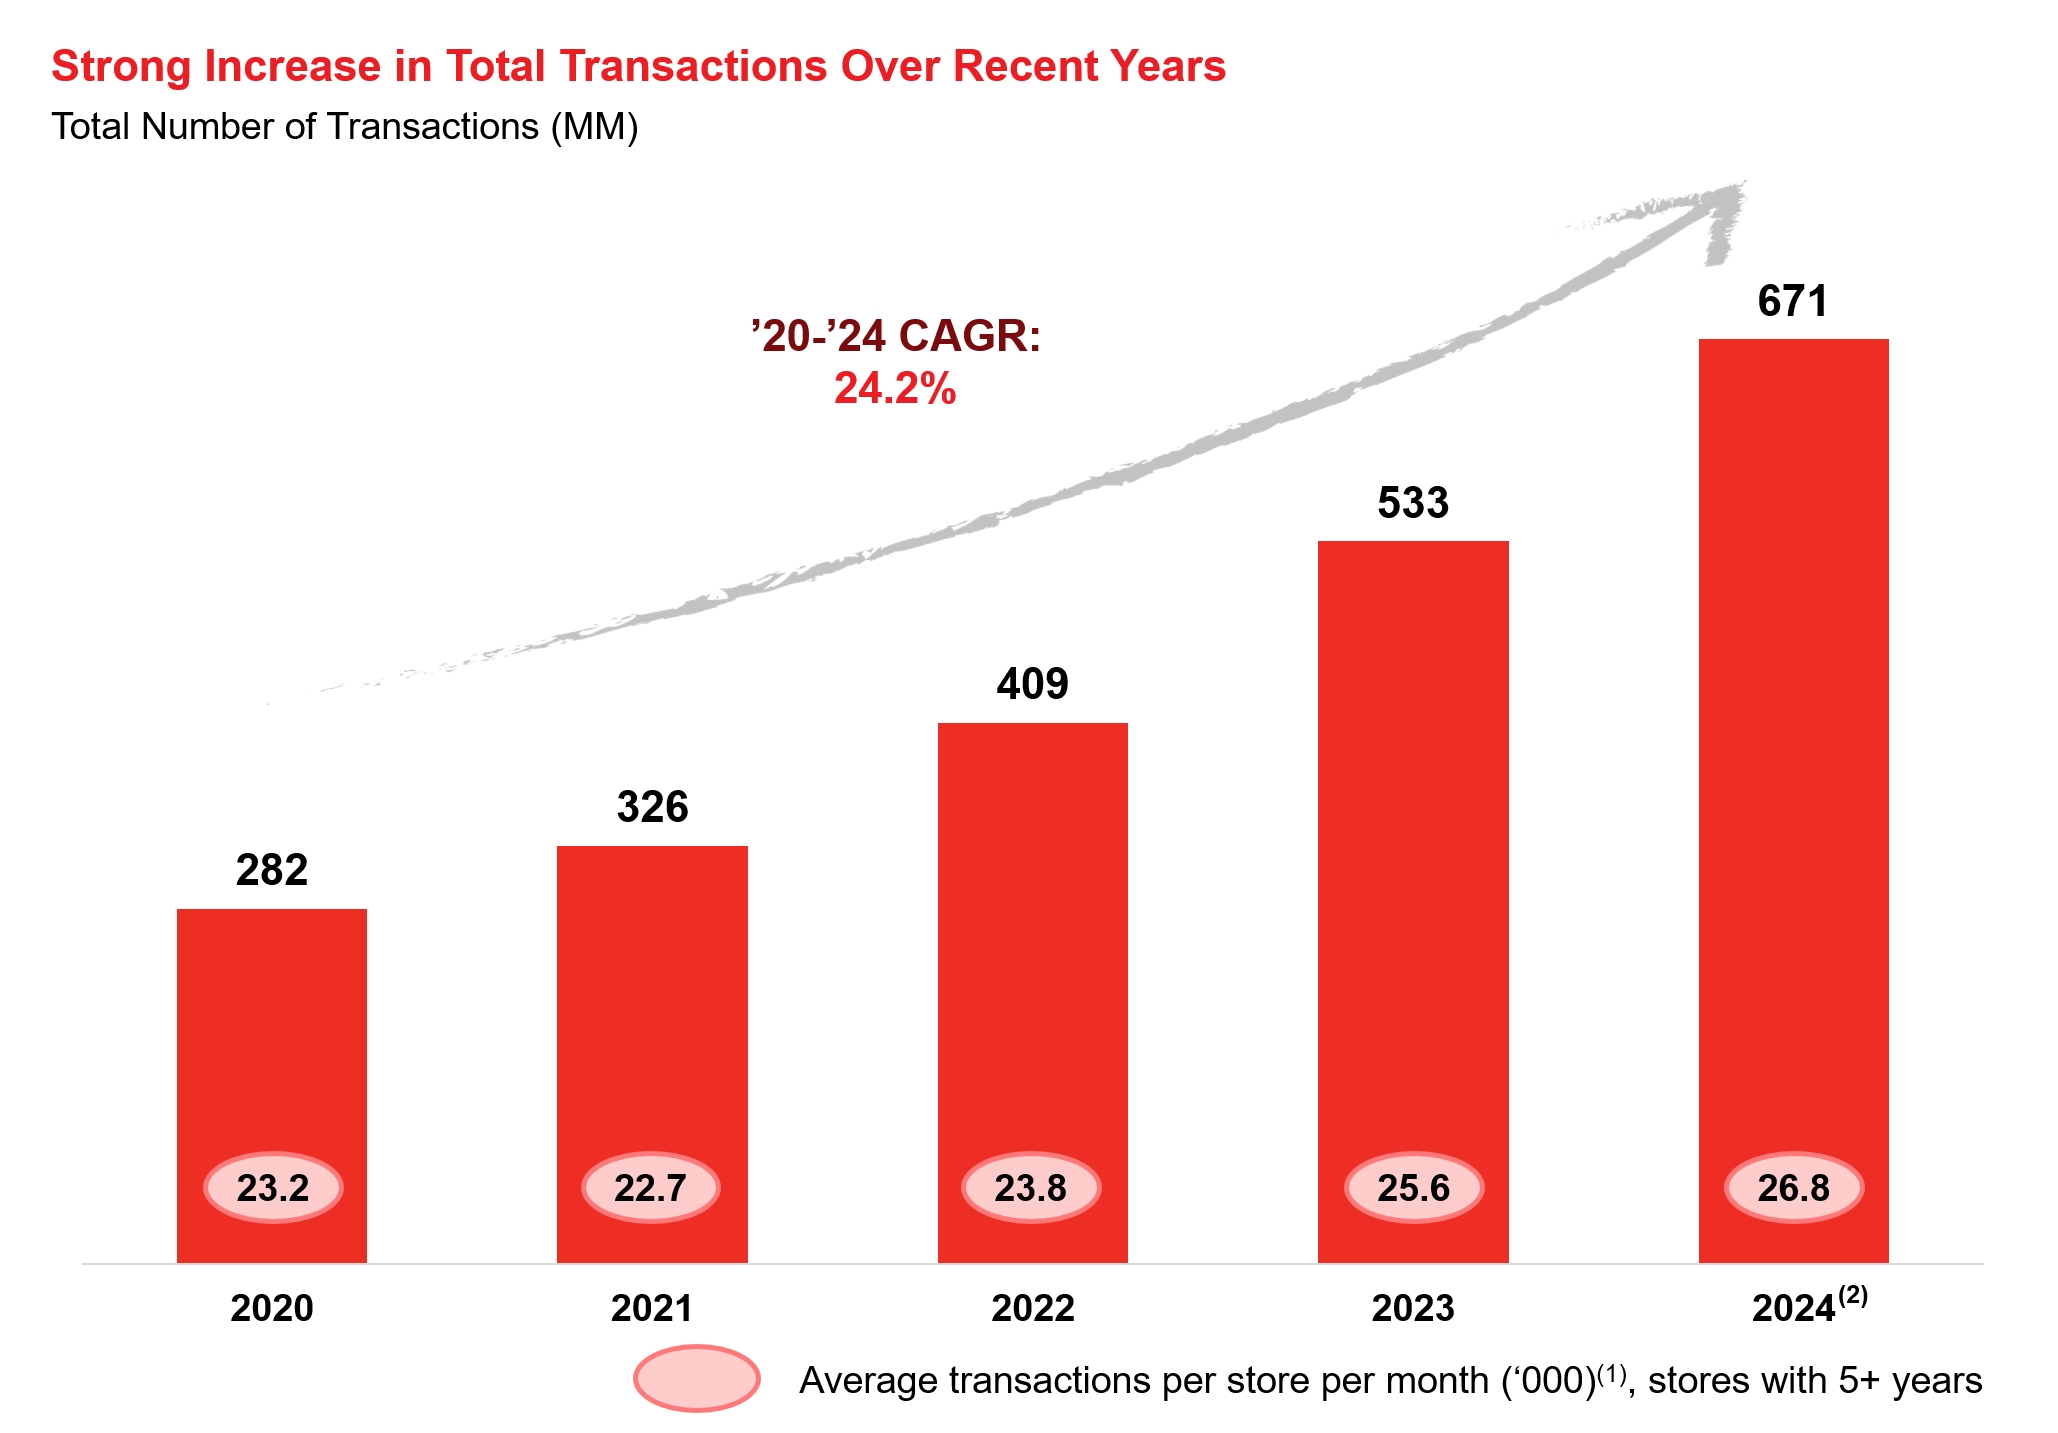
Our Same Store Sales growth and expansion are underpinned by strong store level fundamentals. Although growth through geographic expansion and store openings is a strong component of our expansion strategy, we believe our model is sustainable and scalable given the combined effect of growing average ticket size and a growing volume of transactions per store at our existing stores.
|
|
Notes: |
Notes: |
1. | We calculate average ticket size by dividing revenue from sales of merchandise by total number of transactions | 1. | Average transactions per store per month, only considering stores from vintages with five or more years of operations |
2. | Based on the mid-point of the approximated Total Revenue range for 2024 based on the preliminary information available as of the date of this prospectus | 2. | Based on the mid-point of the approximated Total Revenue range for 2024 based on the preliminary information available as of the date of this prospectus |
High rotation of our inventory to generate significant negative working capital
By focusing on high rotation items and limiting them to one-brand one-size, curated to satisfy most grocery needs of the average Mexican family, we are able to keep low Inventory Days. In 2023, we had 21 Inventory Days.
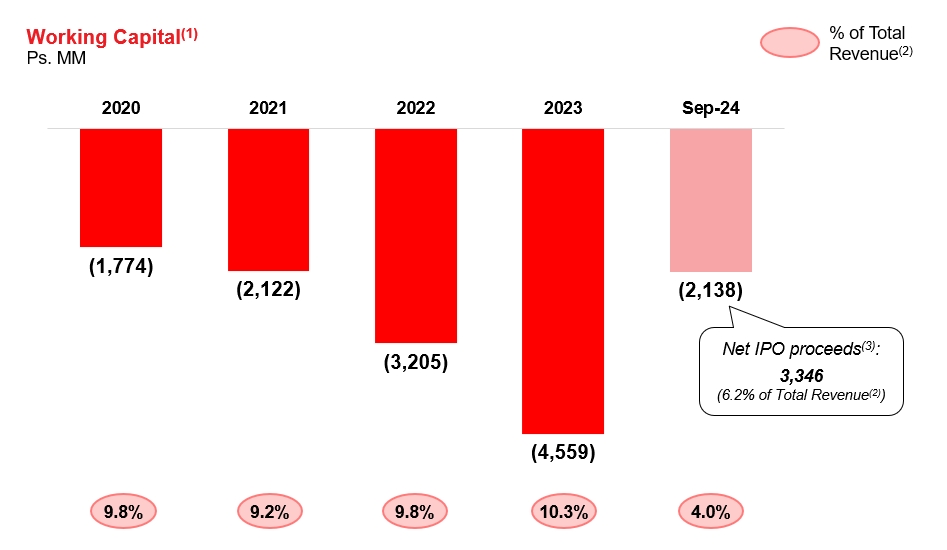
Our supplier payment terms (65 Payable Days for 2023) and low Inventory Days (21 Inventory Days for 2023), create a favorable negative working capital cycle that has enabled us to self-fund our rapid expansion. Our negative working capital for 2022, 2023 and the nine months ended September 30, 2024 was Ps.3,205,200 thousand, Ps.4,558,781 thousand and Ps.2,138,451, respectively. Net cash flows provided by our operating activities were Ps.1,366,308 thousand, Ps.2,116,335 thousand, Ps.3,140,349 thousand and Ps.2,378,208 thousand for 2021, 2022, 2023 and the nine months ended September 30, 2024, respectively, compared to our capital expenditures of Ps.532,173 thousand, Ps.1,122,877 thousand, Ps.1,798,019 thousand and Ps.1,642,397 thousand for 2021, 2022, 2023 and the nine months ended September 30, 2024, respectively.
8
Notes:
1. We calculate working capital as total current assets minus total current liabilities.
2. We calculate the percentage of working capital to total revenue for a period by dividing the working capital as of the end of the period by the total revenue for the last twelve months ending on the corresponding period.
3. Net IPO proceeds translated into Mexican pesos for convenience only at the rate of Ps.19.629 per US$1.00, the exchange rate to pay foreign currency denominated obligations due on September 30, 2024 published by the Mexican Central Bank in the Official Gazette.
Lean operational model designed to maximize efficiency and minimize costs
Our limited assortment of products allows us to simplify and optimize operations leading to low sales expense as a percentage of total revenue, which was 10.9% for 2023 and 10.2% for the nine months ended September 30, 2024.
Every aspect of our operations has been carefully optimized for efficiency. We reduce working hours and operating costs by designing our products and packaging with efficiency in mind, choosing the right truck sizes and equipment, making judicious use of technology and efficiently distributing refrigerated goods, store orders, and managing our proprietary logistics infrastructure. For example, we reduce time and costs from stocking shelves by selling directly from the box (usually lidless) that arrives from our distribution centers. Our trucks and stores are designed to allow one driver to unload a store delivery single-handedly in 30 minutes or less and our distribution centers are strategically located to allow optimal re-stocking efficiency and route planning.
Standard supermarkets, with a larger number of SKUs are more complex and costly to run. They need higher gross margins to sustain their operations. By being able to operate at lower costs, we can achieve positive operating profit even with low gross margins, and can offer sustainable lower prices, which we believe is very hard to replicate for traditional grocery retailers.
Significant purchasing power
As our sales have grown, so has our purchasing power. We believe we can buy at very competitive prices since our sales are concentrated in a relatively lower number of SKUs. This allows us to continually lower our purchase costs, improve our payment terms and develop strong supplier relationships, which in turn enables us to transfer generated savings on to our customers. Further, we cooperate closely with our private label suppliers to
9
help them negotiate better terms on their own supplies and raw materials, which also translates into savings for our customers.
Building and constantly reinforcing customer trust and loyalty
We have built enduring customer relationships based on trust in our pricing and quality. We believe that this trust is a cornerstone of our business, allowing us to accelerate our sales growth and eventually expand into higher ticket items and additional product categories (so long as they also deliver our characteristic value-for-money). We offer a no-questions-asked no-receipt-needed money-back return policy on all products we sell. This guarantee helps build trust and encourages our customers to try our private label products.
Decentralized and nimble organization that is close to the action
We have a decentralized and lean organizational structure built around autonomous regions each led by a regional director. As of December 31, 2024, we had 16 operating regions. Each region consists of approximately 150 stores supported by a single distribution center with functional support areas, such as human resources, real estate, logistics, IT and regional purchasing and accounting. For example, the regional directors decide which new stores to open (within company guidelines) without requiring headquarters’ approval. All regions are similarly sized and configured in terms of operations and the model is readily replicable. As each region increases the number of stores it operates beyond 150 and up to 200, a new region is formed in adjacent geographies and stores are shifted accordingly to optimize logistics.
We believe this approach has many benefits. Decisions are closer to the action and therefore nimble. There is less bureaucracy. Opening new regions is rapid, efficient, and cost effective. Benchmarking among similar regions makes managing the entire business efficient and allows us to maintain a small central office even at scale.
We invest significantly in human resource development and our culture. We believe this is essential to maintaining sustainable profitable growth and managing a decentralized structure. We achieve these goals by long-term planning, a belief in the concept of talent density, and investing in in-person training, which is supplemented by more than 100 training modules found in our online “Universidad 3B,” which is designed to foster a strong cultural affinity and operational excellence across the organization.
Founder-led management team with leading industry expertise
We are a founder-led company with a solid management team, the majority of which has been working together for more than 16 years, most since inception. Our management team has 130+ years of combined experience in the retail and hard discount industry, has extensive knowledge of the Mexican grocery market, and has held relevant positions within local and international players. The trajectory and continuity of our management team contributes to a strong and stable corporate culture that is both customer and employee-centric. Our management team has developed highly specialized know-how that we believe is hard to replicate and a key differentiating factor that has propelled our success.
Our Strategy
Unrelenting focus on lean operating model to support profitable growth
Our business model has proven to be sustainable and resilient through different economic cycles, which we expect to continue. We believe we still have room to continue to improve our operating margins through the scalability of our platform. We have sustainably low operating costs as a percentage of sales, driven by scale, rigorous cost discipline, the judicious use of technology, making our processes even more efficient, and better integrating with our private label suppliers. We believe our current operational structure will allow us to continue supporting our expansion efforts at marginal incremental costs.
10
Rapidly expanding number of stores in contiguous regions, while maintaining low investment requirements per new store
We aim to open stores in places that are convenient for our customers, most of which access our stores on foot. We follow a disciplined approach to our geographic expansion without compromising our supply and distribution capabilities. Our standardized format and requirements assure that our capital requirements for new stores remain low, an important component as we fund our rapid expansion.
As of December 31, 2024, our stores were concentrated in 16 states in the central region of Mexico, including: Mexico City, State of Mexico, Hidalgo, Puebla, Tlaxcala, Morelos, Queretaro, Guanajuato, Michoacán, Guerrero, Veracruz, Aguascalientes, Nayarit, Jalisco, Zacatecas and San Luis Potosí. This geographic footprint has resulted from progressive expansion as we add new distribution centers to support stores in new areas, in each case targeting critical density to support the efficiencies of our structure. Our store location map reflects our disciplined expansion approach.
Developing new private label product lines
We intend to consolidate our private label leadership by continuing to develop new private label product lines that offer higher value for money than branded alternatives to our customers. We work closely with over 130 suppliers of our private label products to develop new and innovative product lines. Our close relationship and integration allow us to adapt our offering to changing customer needs and preferences. As we increase our private label sales penetration going forward, we will drive greater value to our customers, which we expect will translate into sales growth, while also increasing control of our margins and improving our profitability.
Our frequent client interactions, extensive market studies, and ongoing testing of products, allow us to understand and anticipate customer preferences, and to meet their evolving needs. Our team of 39 purchasers as of December 31, 2024 work hand in hand with our suppliers to continuously innovate and improve our portfolio of products.
We help our suppliers grow alongside us by providing transparency of our growth plans, paying them on time and facilitating access to our wide network of other supplier relationships. We see suppliers as strategic partners because we often find opportunities to develop brands and product presentations, aiming to increase the quality and improve the price of our products. We also help suppliers by sharing best practices we see from suppliers of other of our products (for example access to better packaging and labeling alternatives), which creates efficiencies across our business. Our annual private label supplier fair assists this exchange of ideas and solidifies our supplier ecosystem.
Increasing our sales of “Los Irrepetibles”
We intend to increase the sales contribution of “Los Irrepetibles,” our spot product offering that includes grocery and non-grocery products such as, electronics, apparel, home goods, and others. We offer a changing selection of approximately 50 spot products every two weeks on average. These products offer notably high value for money and add a treasure hunt factor to the shopping experience. We call them “Los Irrepetibles” because they are offered at prices so low that they will not be “repeated” (replenished) once we sell out.
Part of our strategy is to selectively offer higher ticket spot items that still offer tremendous value for money. We are currently conducting tests on a limited scale to assess our customers’ acceptance of these price points and product price elasticity. Going forward, we plan to expand our spot product purchasing division to improve purchasing capacity and product sourcing.
Introducing new categories of products and services
We plan to selectively introduce new product categories to meet our customers’ needs. At any moment we are actively testing several new product categories. As a result of these efforts, we recently introduced the beauty category in our stores. Additionally, we plan to expand our assortment in certain categories, including ice creams
11
and fresh and frozen meats. Based on our internal analysis, we believe there is sufficient demand to introduce SKUs to our offering and drive additional sales and wallet penetration.
Additionally, we believe that our increasingly ubiquitous store footprint can be leveraged to increase the services we offer to our customers at our locations. Currently we offer utility and service payments, top-ups, amongst others. We see opportunities to expand our service offering given our customers’ frequent store visits each week.
Recent Developments
Full Year 2024 Update
Our results for the year ended December 31, 2024 are not yet available as of the date of this prospectus. We expect to finalize our consolidated financial results as of and for the year ended December 31, 2024 after this offering is completed.
Based upon the preliminary information available to us as of the date hereof, we expect to have total revenue between Ps.57.4 billion and Ps.57.5 billion (US$2.92 billion and US$2.93 billion) for full year 2024, which represents an approximate increase of between 30.2% and 30.4% compared to full year 2023, and an estimated CAGR of approximately 33.6% from 2020 to 2024.
We expect our operating income for full year 2024 to increase compared to full year 2023. We note that during 2024, we incurred expenses of between Ps.140 million and Ps.165 million for the year which we believe were largely non-recurring and related to our initial public offering in 2024 (our “IPO”) and our transition to a public company and associated reporting, compliance and other obligations. Approximately fifty to sixty percent of these expenses were incurred during the fourth quarter of 2024 which will affect our margins for that quarter.
During 2024, we had 484 net new store openings to reach 2,772 total stores as of December 31, 2024, which represents a 21.1% increase in our store count compared to year-end 2023. We estimate our Same Store Sales growth for 2024 to be approximately 13.4%, which was underpinned by an estimated increase in average ticket size from Ps.82.4 in 2023 to approximately Ps.85.4 in 2024 and an estimated increase in transactions per store per month (considering stores from vintages with five or more years of operations) from 25.6 thousand in 2023 to approximately 26.8 thousand in 2024. Our private label penetration also increased, with sales from private labels representing an estimated 54% of our sales in 2024 compared to 46.5% in 2023.
We caution you that these results are subject to risks and uncertainties, including those described in this prospectus, and actual results may differ materially. These preliminary results should not be viewed as a substitute for full annual financial statements prepared in accordance with IFRS. For additional information on factors that could impact our results, please refer to the sections “Risk Factors” and “Forward-Looking Statements.” We do not undertake any obligation to update publicly or revise forward-looking statements, whether as a result of new information, future events, or otherwise. You should read this preliminary information in conjunction with our consolidated financial statements and the related operating and financial data contained or incorporated by reference herein.
Management is responsible for the preparation and presentation of the preliminary financial information and estimates included herein. The statements regarding our financial and operating results as of and for the year ended December 31, 2024 are based on our reasonable estimates and preliminary unaudited information available as of the date of this prospectus. Internal reviews and procedures necessary to complete our consolidated financial results as of and for the year ended December 31, 2024 are ongoing as of the date of this prospectus. Accordingly, we cannot provide any assurances that our consolidated financial results as of and for the year ended December 31, 2024 will be consistent with the trends and financial and operating performance shown in our financial information that has been included in this prospectus, or that such results (or the market perception of such results) will not adversely affect the trading price of our Class A common shares.
12
In addition, the preliminary financial information and estimates referred to above have not been audited, reviewed, examined, compiled or subject to agreed-upon procedures by PricewaterhouseCoopers, S.C. Accordingly, PricewaterhouseCoopers, S.C. expresses no opinion or any other form of assurance with respect to such preliminary financial information or statements included herein.
Option and RSU Grants
As of the date of this prospectus, our board of directors has approved the following awards under the new Equity Incentive Plan that was adopted in connection with our IPO:
Merger of Mexican Subsidiaries
In connection with a simplification of our operations, our Mexican subsidiaries, Tiendas BBB, S.A. de C.V. and Desarrolladora Tres B, S.A. de C.V. merged with and into Tiendas Tres B, S.A. de C.V., our main operating subsidiary, with Tiendas Tres B, S.A. de C.V. surviving the merger. The merger was approved by the shareholders of the merged entities on December 31, 2024. We do not expect this transaction to have any effects on our financial position or results of operations.
Summary of Risk Factors
An investment in our Class A common shares is subject to a number of risks, including risks relating to our business and industry, risks related to Mexico and risks related to this offering and our Class A common shares. Please read the information under “Risk Factors” for a more thorough description of these and other risks. Below is a summary of the principal risks we face:
13
Our Corporate Structure
The Issuer is a holding company incorporated in the British Virgin Islands. The Issuer has no material operations of its own and substantially all of its operations are conducted through the Issuer’s Mexican subsidiary. Investors in the Class A common shares are purchasing equity interests in the British Virgin Islands holding company, and not in such Mexican subsidiary. We indirectly hold 100% equity interests in our Mexican subsidiary.
14
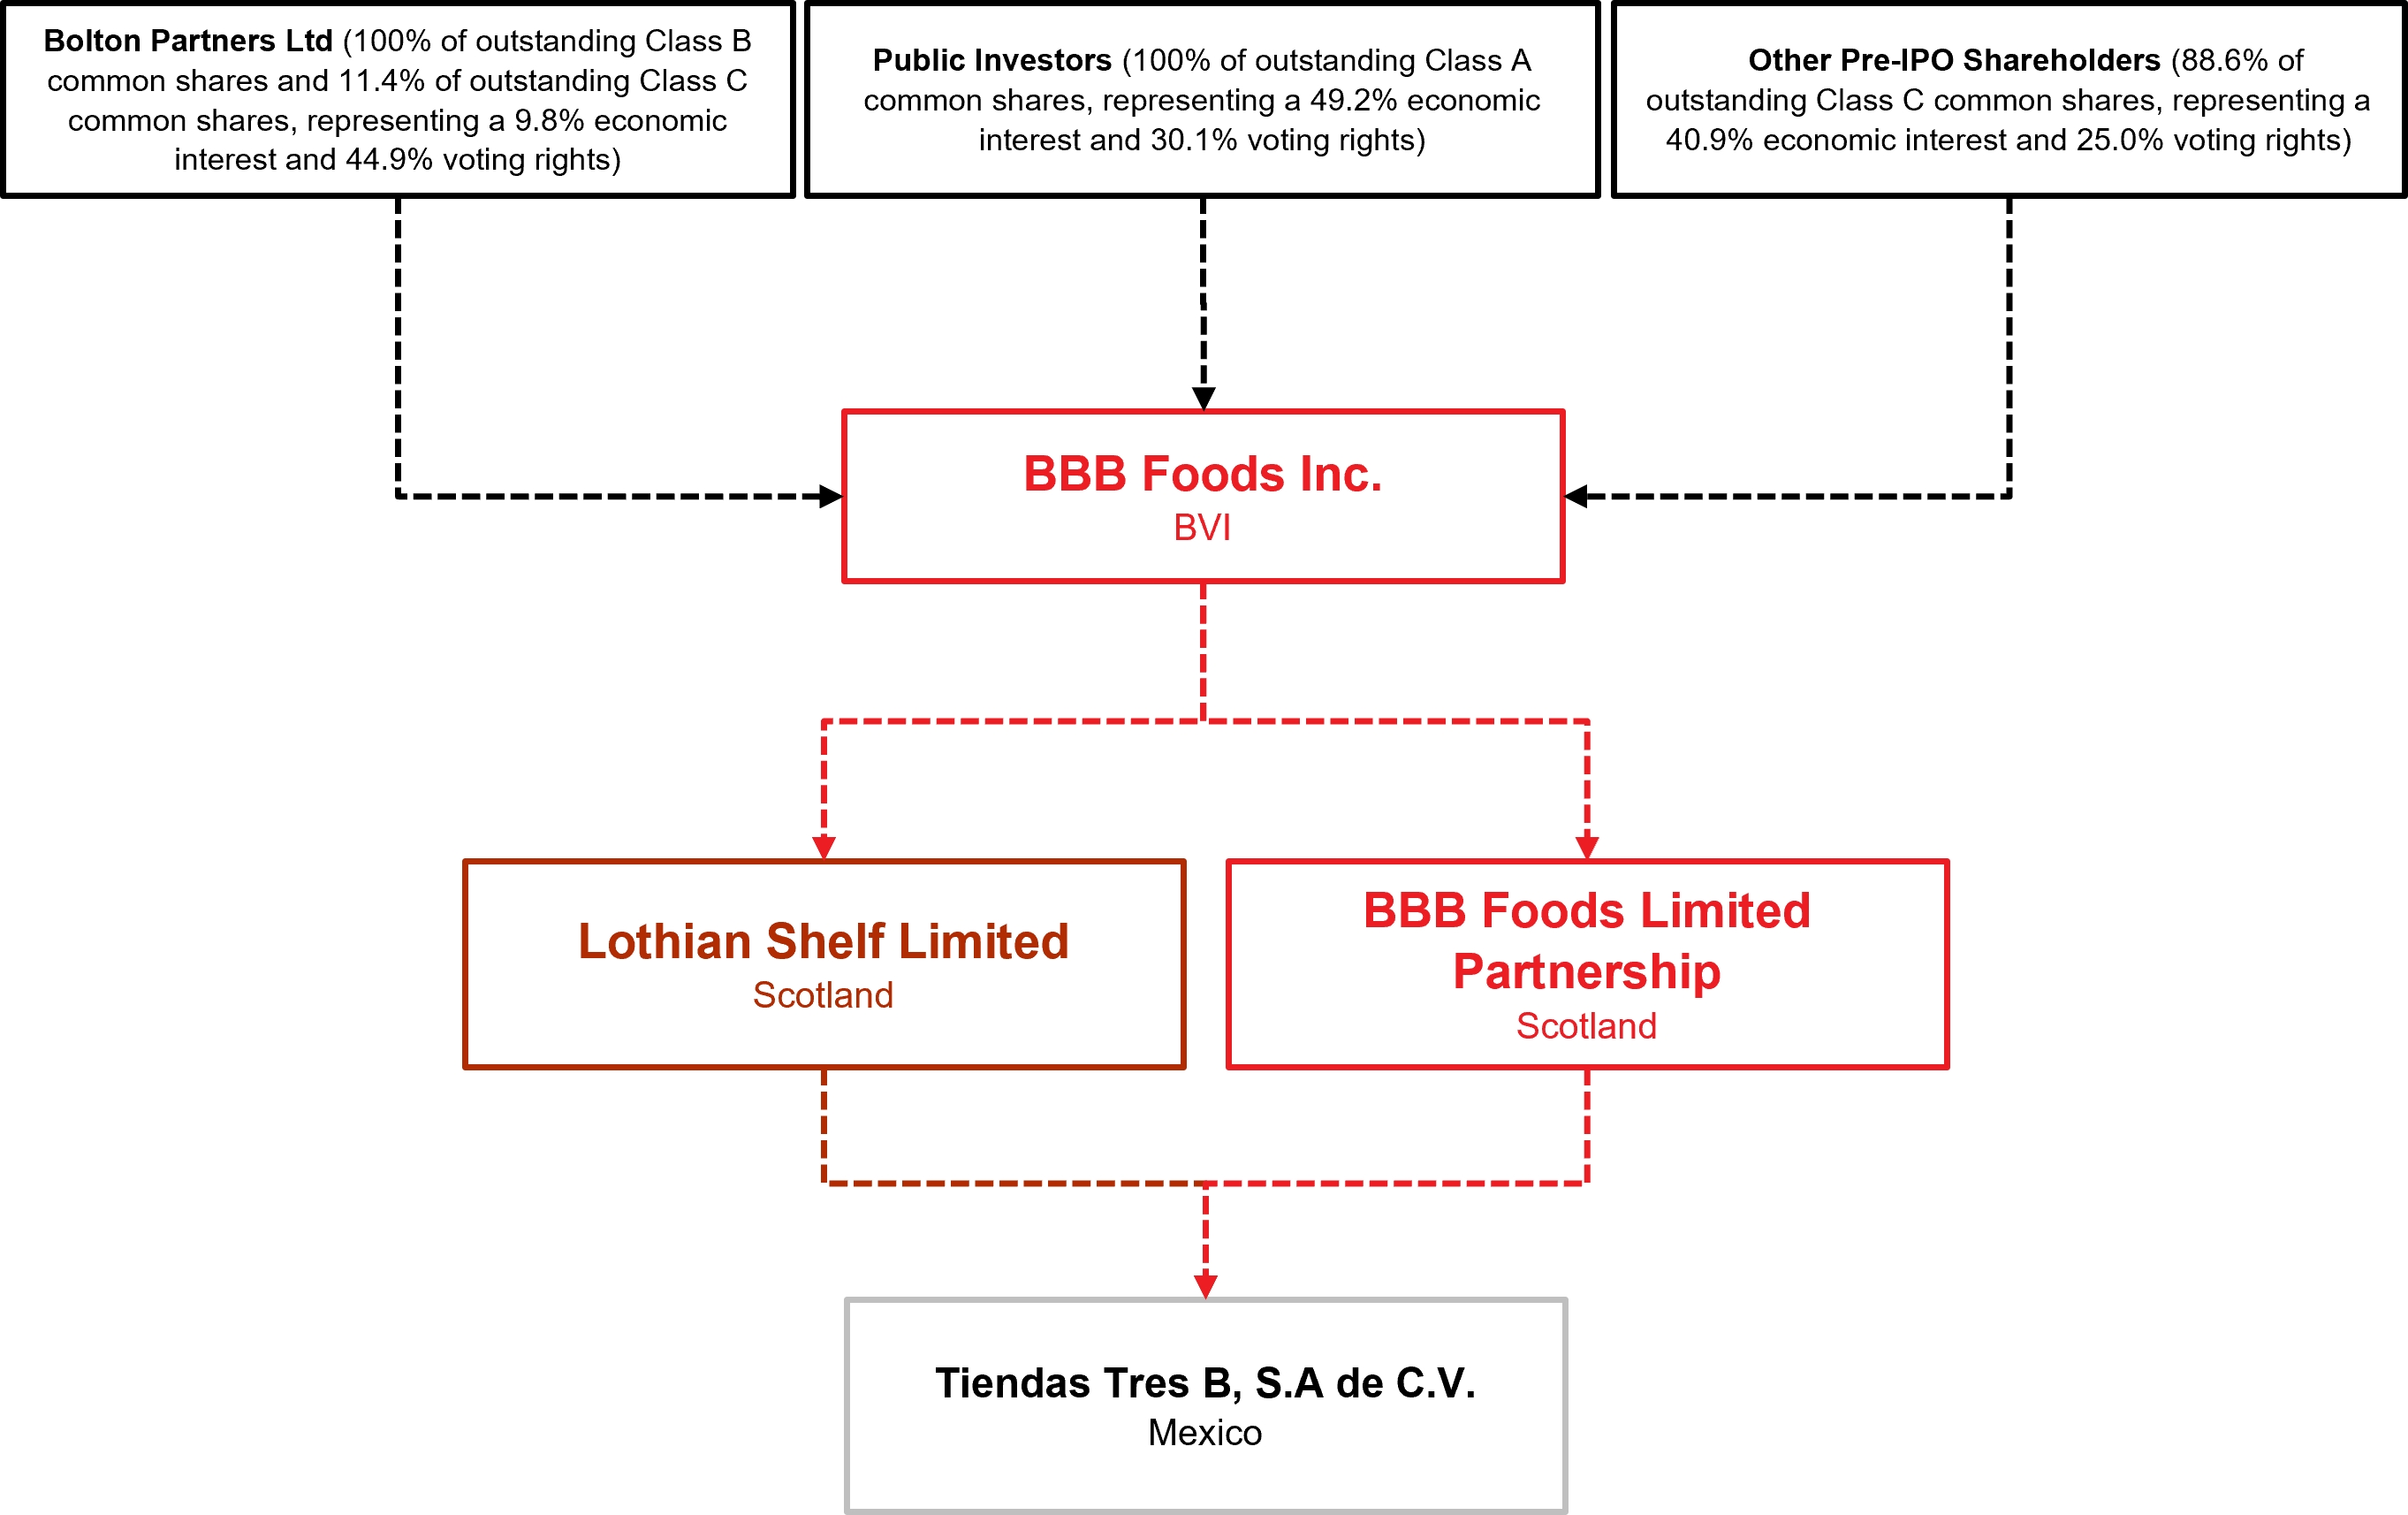
The following chart and the information set forth in the following paragraph presents our corporate structure, including our principal shareholder and principal subsidiaries immediately after the completion of this offering, assuming no exercise of the underwriters’ option to purchase additional Class A common shares.
Bolton Partners Ltd., our principal shareholder, beneficially owned approximately 46.4% of the combined voting power of our outstanding common shares prior to this offering, and will beneficially own approximately 44.9% of the combined voting power of our outstanding common shares following this offering, and therefore has, and will continue to have, significant influence over matters requiring shareholder approval.
However, the foregoing does not include Class C common shares that will be held by our principal shareholder and our directors and officers in respect of both unvested and vested (but currently unexercisable) stock options (other than the Class C common shares corresponding to the Exercised Stock Options) or delayed-delivery awards under the Liquidity Event Share Plan and the Bolton Partners Share Allocation, as applicable. Taking into account such Class C common shares which our principal shareholder, directors and officers will be entitled to receive at later dates, and assuming net settlement at their respective strike prices, our principal shareholder would beneficially own approximately 43.6% of the combined voting power of our outstanding common shares following this offering. See “Selling Shareholders.”
Corporate Information
We were incorporated on July 9, 2004 under the laws of the British Virgin Islands with company number 605635. Our principal executive offices are located at Av. Presidente Masaryk 8, Polanco V Sección, Miguel Hidalgo, Mexico City, Mexico 11560. Our registered office is located at Commerce House, Wickhams Cay 1, P.O. Box 3140, Road Town, Tortola VG1110, British Virgin Islands. Our website is www.tiendas3b.com and our investor relations website is https://www.investortiendas3b.com/. The information contained in, or accessible through, our website is not incorporated into this prospectus or the registration statement of which it forms a part and does not form part of, this prospectus, and you should not consider such information in deciding whether to invest in our Class A common shares.
Conventions that Apply to this Prospectus
Except as otherwise indicated or the context requires, all information in this prospectus assumes:
15
In addition, except for the Exercised Stock Options, or as otherwise indicated or the context requires, the share numbers in this prospectus do not reflect the issuance of (i) any common shares issuable upon the exercise of stock options granted under our 2004 Option Plan, (ii) any common shares issuable upon the exercise of stock options or RSUs granted under our Equity Incentive Plan, or (iii) common shares awarded under the Liquidity Event Share Plan or allocated under the Bolton Partners Share Allocation, nor do they reflect the common shares reserved for issuance under our Equity Incentive Plan.
As of the date of this prospectus, and prior to the exercise of the Exercise Stock Options:
All of such Class C common shares (including those referred to above) are subject to the restrictions on transfer of Class C common shares described under “Description of Our Share Capital—Class C Common Shares.” For additional information regarding the restricted exercise of vested options and delayed delivery of Class C common shares under the Bolton Partners Share Allocation or the Liquidity Event Share Plan, see “Management—2004 Option Plan,” “Management—Liquidity Event Shares” and “Management—Bolton Partners Share Allocation.”
The Class C common shares held by the selling shareholders to be sold in this offering will automatically convert into Class A common shares on a share-for-share basis immediately prior to the settlement of this offering. As a result, purchasers of our common shares in this offering will only receive Class A common shares, and only Class A common shares are being offered by this prospectus. Class B common shares that are not sold by the selling shareholders, will remain Class B common shares unless otherwise converted into Class A common shares. Class C common shares that are not sold by the selling shareholders, including if the underwriters do not exercise their option to purchase additional Class A common shares from the selling shareholders in connection with this offering, will remain Class C common shares unless otherwise converted into Class A common shares. See “Description of Share Capital.”
16
The Offering
This summary highlights information presented in greater detail elsewhere in this prospectus. This summary is not complete and does not contain all the information you should consider before investing in our Class A common shares. You should carefully read this entire prospectus before investing in our Class A common shares including “Risk Factors,” our audited consolidated financial statements as of December 31, 2023 and 2022 and for the years ended December 31, 2023, 2022 and 2021, together with the notes thereto, incorporated by reference in this prospectus, and our unaudited interim condensed consolidated financial statements as of September 30, 2024 and for the three and nine months ended September 30, 2024 and 2023, together with the notes thereto, included elsewhere in this prospectus.
Issuer |
| BBB Foods Inc. |
Class A common shares offered by the |
| 17,500,000 Class A common shares, if the underwriters do not exercise their option to purchase additional Class A common shares from the selling shareholders, or 20,125,000 Class A common shares if the underwriters exercise in full their option to purchase additional Class A common shares from the selling shareholders. The Class A common shares offered hereby consist of (i) Class A common shares issuable upon conversion of Class C common shares held by existing holders of our Class C common shares and (ii) Class A common shares issuable upon conversion of Class C common shares acquired upon the net exercise of the Exercised Stock Options. We will not receive any proceeds from the sale of any Class A common shares by the selling shareholders. |
Class A common shares, Class B |
| Immediately prior to this offering, we had 38,709,677 Class A common shares, 5,200,000 Class B common shares and 68,291,075 Class C common shares outstanding (not including the 2,000,000Class C common shares corresponding to the Exercised Stock Options). |
Class A common shares outstanding |
| 56,209,677 Class A common shares, if the underwriters do not exercise their option to purchase additional Class A common shares from the selling shareholders, or 58,834,677 Class A common shares if the underwriters exercise in full their option to purchase additional Class A common shares from the selling shareholders. |
Class B common shares outstanding |
| 5,200,000 Class B common shares. |
Class C common shares outstanding |
| 52,791,075 Class C common shares, if the underwriters do not exercise their option to purchase additional Class A common shares from the selling shareholders, or 50,466,075 Class C common shares if the underwriters exercise in full their option to purchase additional Class A common shares from the selling shareholders. |
Class C common shares subject to stock |
| 40,943,724 Class C common shares (including the 2,000,000 Class C common shares corresponding to the Exercised Stock Options). |
Class C common shares subject to stock |
| 38,859,033 Class C common shares, if the underwriters do not exercise their option to purchase additional Class A common shares from the selling shareholders, or 38,542,914 Class C common shares if the |
17
|
| underwriters exercise in full their option to purchase additional Class A common shares from the selling shareholders. |
Voting rights |
| The Class A common shares are entitled to one vote per share, whereas the Class B common shares (which are not being sold in this offering) are entitled to 15 votes per share. The Class C common shares (which are not being sold in this offering) are entitled to one vote per share. Each Class B common share may be converted into one Class A common share at the option of the holder. If, at any time, the number of outstanding Class B common shares represents less than 1.0% of the aggregate common shares of the Issuer then outstanding, then each Class B common share will convert automatically into one Class A common share. In addition, each Class B common share will convert automatically into one Class A common share upon any transfer, except for transfers to affiliates and others as described under “Description of Share Capital—Conversion.” Each Class C common share will be converted into one Class A common share upon any transfer, except for transfers to affiliates and others as described under “Description of Share Capital— Conversion” and shall be converted automatically upon the expiry of certain transfer restrictions applicable to the Class C common shares. Holders of Class A common shares, Class B common shares and Class C common shares will vote together as a single class on all matters unless otherwise required by law and subject to certain exceptions set forth in our memorandum and articles of association as described under “Description of Share Capital—Voting Rights.” Upon consummation of this offering, assuming no exercise of the underwriters’ option to purchase additional Class A common shares from the selling shareholders, (1) holders of Class A common shares will hold approximately 30.1% of the combined voting power of our outstanding common shares and approximately 49.2% of our total equity ownership; (2) holders of Class B common shares will hold approximately 41.7% of the combined voting power of our outstanding common shares and approximately 4.6% of our total equity ownership; and (3) holders of Class C common shares will hold approximately 28.2% of the combined voting power of our outstanding common shares and approximately 46.2% of our total equity ownership. If the underwriters exercise their option to purchase additional Class A common shares from the selling shareholders in full, (1) holders of Class A common shares will hold approximately 31.4% of the combined voting power of our outstanding common shares and approximately 51.4% of our total equity ownership; (2) holders of Class B common shares will hold approximately 41.6% of the combined voting power of our outstanding common shares and approximately 4.5% of our total equity ownership; and (3) holders of Class C common shares will hold |
18
|
| approximately 26.9% of the combined voting power of our outstanding common shares and approximately 44.1% of our total equity ownership. The rights of the holders of Class A common shares, Class B common shares and Class C common shares are identical, except with respect to voting, conversion, preemptive rights (as detailed below) and transfer restrictions applicable to the Class B common shares and conversion rights and transfer restrictions applicable to the Class C common shares. Holders of Class B common shares are entitled to preemptive rights to purchase additional Class B common shares in the event that additional Class A common shares are issued, upon the same economic terms and at the same price, in order to maintain such holder’s proportional ownership interest in the Issuer. See “Description of Share Capital” for a description of the material terms of our common shares and the difference between our Class A common shares, Class B common shares and Class C common shares. |
Option to purchase additional Class A |
| The selling shareholders have granted the underwriters the option to purchase up to an additional 2,625,000 Class A common shares from the selling shareholders within 30 days of the date of this prospectus, at the public offering price, less underwriting discounts and commissions, on the same terms as set forth in this prospectus. |
Listing |
| Our Class A common shares are listed on the New York Stock Exchange under the symbol “TBBB.” |
Use of proceeds |
| We will not receive any of the proceeds from Class A common shares sold by the selling shareholders. See “Use of Proceeds.” |
Share capital before and after offering |
| As of the date of this prospectus, we are authorized to issue an unlimited number of Class A common shares, an unlimited number of Class B common shares and an unlimited number of Class C common shares. Immediately after this offering, the Issuer will have outstanding 56,209,677 Class A common shares, 5,200,000 Class B common shares and 52,791,075 Class C common shares, assuming no exercise of the underwriters’ option to purchase additional Class A common shares from the selling shareholders. |
Dividend policy |
| The amount of any distributions will depend on many factors, such as our results of operations, financial condition, cash requirements, prospects and other factors deemed relevant by our board of directors and shareholders. We currently intend to retain all available funds and future earnings, if any, to fund the development and expansion of our business and we do not anticipate paying any cash dividends in the foreseeable future. See “Dividends and Dividend Policy.” |
Lock-ups |
| Holders of our Class B common shares and Class C common shares are subject to restrictions on the transfer of such shares for 24 months from the expiry of the initial 180-day lock-up period on August 6, 2024 (the “Liquidity Lock-Up Period”) relating to our IPO. See “Description of Share Capital.” |
19
Risk factors |
| See “Risk Factors” and the other information included in this prospectus for a discussion of factors you should consider before deciding to invest in our Class A common shares. |
Unless otherwise indicated, all information contained in this prospectus assumes no exercise of the option granted to the underwriters to purchase up to additional 2,625,000 Class A common shares from the selling shareholders in connection with this offering.
20
Summary Financial and Other Information
The following tables set forth, for the periods and as of the dates indicated, our summary financial and operating data. The financial information presented herein has been derived from our audited consolidated financial statements as of December 31, 2023 and 2022 and for the years ended December 31, 2023, 2022 and 2021, together with the notes thereto, incorporated by reference in this prospectus, and our unaudited interim condensed consolidated financial statements as of September 30, 2024 and for the three and nine months ended September 30, 2024 and 2023, together with the notes thereto, each prepared in accordance with IFRS as issued by the IASB, and included elsewhere in this prospectus.
The summary consolidated historical financial data should be read in conjunction with “Presentation of Financial and Other Information,” “Management’s Discussion and Analysis of Financial Condition and Results of Operations,” our audited consolidated financial statements as of December 31, 2023 and 2022 and for the years ended December 31, 2023, 2022 and 2021, together with the notes thereto, and our unaudited interim condensed consolidated financial statements as of September 30, 2024 and for the three and nine months ended September 30, 2024 and 2023, together with the notes thereto, included elsewhere in this prospectus.
Our consolidated financial statements are stated in Mexican pesos.
Summary Consolidated Statements of Comprehensive Income Data
For the nine months ended |
|
| For the years ended |
| ||||||||||||||||||||||||
2024 |
| 2024 |
| 2023 |
| 2023 |
| 2023 |
| 2022 |
| 2021 |
| |||||||||||||||
(thousands of US$, |
| (thousands of Ps., except outstanding shares and per share amounts) |
| (thousands of US$, |
|
| (thousands of Ps., except outstanding shares and per share amounts) |
| ||||||||||||||||||||
Revenue from sales of | US$ |
| 2,089,510 |
| Ps. |
| 41,014,985 |
| Ps. |
| 31,694,573 |
| US$ |
| 2,240,960 |
| Ps. |
| 43,987,803 |
| Ps. |
| 32,472,577 |
| Ps. |
| 23,032,275 |
|
Sales of recyclables |
|
| 3,944 |
|
|
| 77,416 |
|
|
| 68,282 |
|
|
| 4,618 |
|
|
| 90,656 |
|
|
| 107,820 |
|
|
| 58,906 |
|
Total revenue |
|
| 2,093,454 |
|
|
| 41,092,401 |
|
|
| 31,762,855 |
|
|
| 2,245,578 |
|
|
| 44,078,459 |
|
|
| 32,580,397 |
|
|
| 23,091,181 |
|
Cost of sales |
|
| (1,753,233 | ) |
|
| (34,414,213 | ) |
|
| (26,733,603 | ) |
|
| (1,886,930 | ) |
|
| (37,038,542 | ) |
|
| (27,655,643 | ) |
|
| (19,655,090 | ) |
Gross profit |
|
| 340,220 |
|
|
| 6,678,188 |
|
|
| 5,029,252 |
|
|
| 358,649 |
|
|
| 7,039,917 |
|
|
| 4,924,754 |
|
|
| 3,436,091 |
|
Sales expenses |
|
| (214,400 | ) |
|
| (4,208,458 | ) |
|
| (3,431,030 | ) |
|
| (245,703 | ) |
|
| (4,822,912 | ) |
|
| (3,460,840 | ) |
|
| (2,422,688 | ) |
Administrative expenses |
|
| (72,676 | ) |
|
| (1,426,551 | ) |
|
| (1,033,144 | ) |
|
| (70,657 | ) |
|
| (1,386,929 | ) |
|
| (952,090 | ) |
|
| (623,874 | ) |
Other income (expense) – |
|
| 360 |
|
|
| 7,066 |
|
|
| 692 |
|
|
| (1,845 | ) |
|
| (36,213 | ) |
|
| 8,445 |
|
|
| 4,524 |
|
Operating profit |
|
| 53,505 |
|
|
| 1,050,245 |
|
|
| 565,770 |
|
|
| 40,443 |
|
|
| 793,863 |
|
|
| 520,269 |
|
|
| 394,053 |
|
Financial income |
|
| 5,579 |
|
|
| 109,501 |
|
|
| 20,510 |
|
|
| 1,328 |
|
|
| 26,069 |
|
|
| 19,840 |
|
|
| 7,988 |
|
Financial costs |
|
| (47,076 | ) |
|
| (924,055 | ) |
|
| (1,007,868 | ) |
|
| (77,799 | ) |
|
| (1,527,107 | ) |
|
| (1,168,786 | ) |
|
| (1,004,535 | ) |
Exchange rate fluctuation |
|
| 19,631 |
|
|
| 385,335 |
|
|
| 403,922 |
|
|
| 30,886 |
|
|
| 606,270 |
|
|
| 264,930 |
|
|
| (122,368 | ) |
Financial costs – net |
|
| (21,867 | ) |
|
| (429,219 | ) |
|
| (583,436 | ) |
|
| (45,584 | ) |
|
| (894,768 | ) |
|
| (884,016 | ) |
|
| (1,118,915 | ) |
Profit (Loss) before |
|
| 31,638 |
|
|
| 621,026 |
|
|
| (17,666 | ) |
|
| (5,141 | ) |
|
| (100,905 | ) |
|
| (363,747 | ) |
|
| (724,862 | ) |
Income tax expense |
|
| (13,400 | ) |
|
| (263,033 | ) |
|
| (191,503 | ) |
|
| (10,456 | ) |
|
| (205,248 | ) |
|
| (201,363 | ) |
|
| (91,812 | ) |
Net profit (loss) for the | US$ |
| 18,238 |
| Ps. |
| 357,993 |
| Ps. |
| (209,169 | ) | US$ |
| (15,597 | ) | Ps. |
| (306,153 | ) | Ps. |
| (565,110 | ) | Ps. |
| (816,674 | ) |
Weighted average |
| N/A |
|
| N/A |
|
|
| 12,000,000 |
|
|
| 12,000,000 |
|
|
| 12,000,000 |
|
|
| 12,000,000 |
|
|
| 12,000,000 |
| ||
Weighted average |
|
| 107,798,668 |
|
|
| 107,798,668 |
|
| N/A |
|
| N/A |
|
| N/A |
|
| N/A |
|
| N/A |
| |||||
Weighted average |
|
| 137,894,806 |
|
|
| 137,894,806 |
|
| N/A |
|
| N/A |
|
| N/A |
|
| N/A |
|
| N/A |
| |||||
Basic earnings (loss) per | US$ |
| 0.17 |
| Ps. |
| 3.32 |
| Ps. |
| (17.43 | ) | US$ |
| (1.30 | ) | Ps. |
| (25.51 | ) | Ps. |
| (47.09 | ) | Ps. |
| (68.06 | ) |
Diluted earnings (loss) per | US$ |
| 0.13 |
| Ps. |
| 2.60 |
| Ps. |
| (17.43 | ) | US$ |
| (1.30 | ) | Ps. |
| (25.51 | ) | Ps. |
| (47.09 | ) | Ps. |
| (68.06 | ) |
21
Consolidated Statement of Financial Position Data
As of September 30, |
|
| As of December 31, |
| ||||||||||||||||||||
2024 |
|
| 2024 |
|
| 2023 |
|
| 2023 |
|
| 2022 |
| |||||||||||
(thousands of US$)(1) |
|
| (thousands of Ps.) |
|
| (thousands of US$)(1) |
|
| (thousands of Ps.) |
| ||||||||||||||
Assets |
|
|
|
|
|
|
|
|
|
|
|
|
|
|
|
|
|
|
| |||||
Current assets: |
|
|
|
|
|
|
|
|
|
|
|
|
|
|
|
|
|
|
| |||||
Cash and cash equivalents | US$ |
| 64,644 |
|
| Ps. |
| 1,268,902 |
|
| US$ |
| 62,177 |
|
| Ps. |
| 1,220,471 |
|
| Ps. |
| 984,976 |
|
Short-term bank deposits |
|
| 150,976 |
|
|
|
| 2,963,511 |
|
|
|
| — |
|
|
|
| — |
|
|
|
| — |
|
Creditors |
|
| 187 |
|
|
|
| 3,669 |
|
|
|
| — |
|
|
|
| — |
|
|
|
| — |
|
Derivative financial instruments |
|
| 371 |
|
|
|
| 7,287 |
|
|
|
| — |
|
|
|
| — |
|
|
|
| — |
|
Sundry debtors |
|
| 2,421 |
|
|
|
| 47,523 |
|
|
|
| 561 |
|
|
|
| 11,020 |
|
|
|
| 19,885 |
|
VAT receivable |
|
| 54,097 |
|
|
|
| 1,061,873 |
|
|
|
| 37,250 |
|
|
|
| 731,186 |
|
|
|
| 609,581 |
|
Advanced payments |
|
| 6,870 |
|
|
|
| 134,846 |
|
|
|
| 3,719 |
|
|
|
| 72,998 |
|
|
|
| 53,155 |
|
Inventories |
|
| 128,617 |
|
|
|
| 2,524,631 |
|
|
|
| 120,102 |
|
|
|
| 2,357,485 |
|
|
|
| 1,931,605 |
|
Total current assets |
|
| 408,184 |
|
|
|
| 8,012,242 |
|
|
|
| 223,810 |
|
|
|
| 4,393,160 |
|
|
|
| 3,599,202 |
|
Non-current assets: |
|
|
|
|
|
|
|
|
|
|
|
|
|
|
|
|
|
|
| |||||
Guarantee deposits |
|
| 1,933 |
|
|
|
| 37,949 |
|
|
|
| 1,690 |
|
|
|
| 33,174 |
|
|
|
| 27,741 |
|
Property, furniture, equipment, and lease-hold |
|
| 297,985 |
|
|
|
| 5,849,141 |
|
|
|
| 234,668 |
|
|
|
| 4,606,300 |
|
|
|
| 3,164,204 |
|
Right-of-use assets – Net |
|
| 330,530 |
|
|
|
| 6,487,974 |
|
|
|
| 281,247 |
|
|
|
| 5,520,596 |
|
|
|
| 4,696,459 |
|
Intangible assets – Net |
|
| 346 |
|
|
|
| 6,794 |
|
|
|
| 345 |
|
|
|
| 6,771 |
|
|
|
| 8,241 |
|
Deferred income tax |
|
| 25,197 |
|
|
|
| 494,588 |
|
|
|
| 20,572 |
|
|
|
| 403,801 |
|
|
|
| 299,060 |
|
Total non-current assets |
|
| 655,991 |
|
|
|
| 12,876,446 |
|
|
|
| 538,522 |
|
|
|
| 10,570,642 |
|
|
|
| 8,195,705 |
|
Total assets | US$ |
| 1,064,175 |
|
| Ps. |
| 20,888,688 |
|
| US$ |
| 762,331 |
|
| Ps. |
| 14,963,802 |
|
| Ps. |
| 11,794,907 |
|
|
|
|
|
|
|
|
|
|
|
|
|
|
|
|
|
|
|
|
| |||||
Liabilities and Stockholders’ Equity |
|
|
|
|
|
|
|
|
|
|
|
|
|
|
|
|
|
|
| |||||
Current liabilities: |
|
|
|
|
|
|
|
|
|
|
|
|
|
|
|
|
|
|
| |||||
Suppliers | US$ |
| 400,176 |
|
| Ps. |
| 7,855,059 |
|
| US$ |
| 363,039 |
|
| Ps. |
| 7,126,089 |
|
| Ps. |
| 5,390,192 |
|
Accounts payable and accrued expenses |
|
| 28,164 |
|
|
|
| 552,826 |
|
|
|
| 16,453 |
|
|
|
| 322,959 |
|
|
|
| 273,731 |
|
Income tax payable |
|
| 2,208 |
|
|
|
| 43,350 |
|
|
|
| 118 |
|
|
|
| 2,326 |
|
|
|
| 73,304 |
|
Bonus payable to related parties |
|
| — |
|
|
|
| — |
|
|
|
| 3,996 |
|
|
|
| 78,430 |
|
|
|
| 43,834 |
|
Short-term debt |
|
| 46,634 |
|
|
|
| 915,377 |
|
|
|
| 37,910 |
|
|
|
| 744,137 |
|
|
|
| 491,236 |
|
Lease liabilities |
|
| 31,587 |
|
|
|
| 620,019 |
|
|
|
| 27,384 |
|
|
|
| 537,515 |
|
|
|
| 417,307 |
|
Employees’ statutory profit sharing payable |
|
| 8,358 |
|
|
|
| 164,062 |
|
|
|
| 7,157 |
|
|
|
| 140,485 |
|
|
|
| 114,798 |
|
Total current liabilities |
|
| 517,127 |
|
|
|
| 10,150,693 |
|
|
|
| 456,057 |
|
|
|
| 8,951,941 |
|
|
|
| 6,804,402 |
|
Non-current liabilities: |
|
|
|
|
|
|
|
|
|
|
|
|
|
|
|
|
|
|
| |||||
Debt with related parties |
|
| — |
|
|
|
| — |
|
|
|
| 221,124 |
|
|
|
| 4,340,452 |
|
|
|
| 4,276,058 |
|
Bonus payable to related parties |
|
| — |
|
|
|
| — |
|
|
|
| — |
|
|
|
| — |
|
|
|
| 44,528 |
|
Long-term debt |
|
| 4,497 |
|
|
|
| 88,273 |
|
|
|
| 29,411 |
|
|
|
| 577,318 |
|
|
|
| 540,734 |
|
Lease liabilities |
|
| 340,834 |
|
|
|
| 6,690,227 |
|
|
|
| 290,728 |
|
|
|
| 5,706,707 |
|
|
|
| 4,828,135 |
|
Employee benefits |
|
| 1,438 |
|
|
|
| 28,231 |
|
|
|
| 1,133 |
|
|
|
| 22,232 |
|
|
|
| 14,311 |
|
|
|
|
|
|
|
|
|
|
|
|
|
|
|
|
|
|
|
|
| |||||
Total non-current liabilities |
|
| 346,769 |
|
|
|
| 6,806,731 |
|
|
|
| 542,397 |
|
|
|
| 10,646,709 |
|
|
|
| 9,703,766 |
|
Total liabilities |
|
| 863,896 |
|
|
|
| 16,957,424 |
|
|
|
| 998,454 |
|
|
|
| 19,598,650 |
|
|
|
| 16,508,168 |
|
|
|
|
|
|
|
|
|
|
|
|
|
|
|
|
|
|
|
|
| |||||
Stockholders’ equity: |
|
|
|
|
|
|
|
|
|
|
|
|
|
|
|
|
|
|
| |||||
Capital stock |
|
| 421,995 |
|
|
|
| 8,283,347 |
|
|
|
| 24,009 |
|
|
|
| 471,282 |
|
|
|
| 471,282 |
|
Reserve for share-based payments |
|
| 63,567 |
|
|
|
| 1,247,755 |
|
|
|
| 43,390 |
|
|
|
| 851,701 |
|
|
|
| 467,135 |
|
Cumulative losses |
|
| (285,284 | ) |
|
|
| (5,599,838 | ) |
|
|
| (303,522 | ) |
|
|
| (5,957,831 | ) |
|
|
| (5,651,678 | ) |
Total stockholders’ equity |
|
| 200,278 |
|
|
|
| 3,931,264 |
|
|
|
| (236,122 | ) |
|
|
| (4,634,848 | ) |
|
|
| (4,713,261 | ) |
Total liabilities and stockholders’ equity | US$ |
| 1,064,175 |
|
| Ps. |
| 20,888,688 |
|
| US$ |
| 762,331 |
|
| Ps. |
| 14,963,802 |
|
| Ps. |
| 11,794,907 |
|
22
Non-IFRS Financial Measures and Key Operating Metrics
Non-IFRS Financial Measures
For the convenience of investors, this prospectus presents certain non-IFRS financial measures, which are not recognized under IFRS. A non-IFRS financial measure is generally defined as one that purports to measure financial performance but excludes or includes amounts that would not be so adjusted in the most comparable IFRS measure.
Non-IFRS financial measures do not have standardized meanings and may not be directly comparable to similarly titled measures adopted by other companies. These non-IFRS financial measures are used by our management for decision-making purposes and to assess our financial and operating performance, generate future operating plans and make strategic decisions regarding the allocation of capital. The non-IFRS measures presented herein have limitations as analytical tools, and you should not consider them in isolation or as substitutes for analysis of our results of operations presented in accordance with IFRS. Additionally, our calculations of non-IFRS measures may be different from the calculations used by other companies, including our competitors, and therefore, our measures may not be comparable to those of other companies.
| As of and for the |
|
| As of and for the year ended |
| |||||||||||||||
| 2024 |
|
| 2023 |
|
| 2022 |
|
| 2021 |
| |||||||||
Net profit (loss) for the period |
| Ps. |
| 357,993 |
|
| Ps. |
| (306,153 | ) |
| Ps. |
| (565,110 | ) |
| Ps. |
| (816,674 | ) |
EBITDA (Ps. thousands) |
| Ps. |
| 2,002,331 |
|
| Ps. |
| 1,882,958 |
|
| Ps. |
| 1,305,323 |
|
| Ps. |
| 924,207 |
|
Net profit (loss) for the period |
| US$ |
| 18,238 |
|
| US$ |
| (15,597 | ) |
| US$ |
| (28,790 | ) |
| US$ |
| (41,605 | ) |
EBITDA (US$ thousands)(1) |
| US$ |
| 102,009 |
|
| US$ |
| 95,927 |
|
| US$ |
| 66,500 |
|
| US$ |
| 47,084 |
|
Net margin (%) |
|
|
| 0.9 | % |
|
|
| (0.7 | )% |
|
|
| (1.7 | )% |
|
|
| (3.5 | )% |
EBITDA Margin (%) |
|
|
| 4.9 | % |
|
|
| 4.3 | % |
|
|
| 4.0 | % |
|
|
| 4.0 | % |
The following is an explanation and, as applicable, reconciliations of our Non-IFRS financial measures.
EBITDA Calculations
Our management uses EBITDA and EBITDA Margin, to supplement IFRS measures of performance in the evaluation of the effectiveness of our business strategies, to make budgeting decisions and to compare our performance against that of other peer companies using similar measures. However, you should not consider these measures in isolation, as an alternative to net profit or loss, as an indicator of our operating or financial performance or as an indicator of cash provided by operating activities, or as a substitute for analysis of our results as reported under IFRS, since these measures do not reflect:
Since not all companies use identical calculations for these types of measures, the presentation of these measures may not be comparable to other similarly titled measures of other companies and can differ significantly from company to company.
23
We calculate “EBITDA” as net income (loss) for the period, plus income tax expense, financial costs, net, and total depreciation and amortization. We calculate “EBITDA Margin” for a period by dividing EBITDA for the corresponding period by total revenue for such period.
Our management believes that EBITDA and EBITDA Margin are useful metrics to measure our operational efficiency and financial soundness relative to other peers, as it excludes the impact of certain accounting and financing decisions.
Set forth below is a reconciliation of EBITDA to net loss for the period.
| As of September 30, |
|
|
| As of December 31, |
| |||||||||||||||||||
| 2024 |
|
| 2023 |
|
| 2023 |
|
| 2022 |
|
| 2021 |
| |||||||||||
|
| (thousands of Ps. unless indicated otherwise) |
| ||||||||||||||||||||||
Net profit (loss) for the |
| Ps. |
| 357,993 |
|
| Ps. |
| (209,169 | ) |
| Ps. |
| (306,153 | ) |
| Ps. |
| (565,110 | ) |
| Ps. |
| (816,674 | ) |
Income tax expense |
|
|
| 263,033 |
|
|
|
| 191,503 |
|
|
|
| 205,248 |
|
|
|
| 201,363 |
|
|
|
| 91,812 |
|
Financial costs – net |
|
|
| 429,219 |
|
|
|
| 583,436 |
|
|
|
| 894,768 |
|
|
|
| 884,016 |
|
|
|
| 1,118,915 |
|
Total depreciation and |
|
|
| 952,086 |
|
|
|
| 758,046 |
|
|
|
| 1,089,095 |
|
|
|
| 785,054 |
|
|
|
| 530,154 |
|
EBITDA |
|
|
| 2,002,331 |
|
|
|
| 1,323,816 |
|
|
|
| 1,882,958 |
|
|
|
| 1,305,323 |
|
|
|
| 924,207 |
|
Total revenue |
| Ps. |
| 41,092,401 |
|
| Ps. |
| 31,762,855 |
|
| Ps. |
| 44,078,459 |
|
| Ps. |
| 32,580,397 |
|
| Ps. |
| 23,091,181 |
|
Net margin (%)(2) |
|
|
| 0.9 | % |
|
|
| (0.7 | )% |
|
|
| (0.7 | )% |
|
|
| (1.7 | )% |
|
|
| (3.5 | )% |
EBITDA Margin (%) |
|
|
| 4.9 | % |
|
|
| 4.2 | % |
|
|
| 4.3 | % |
|
|
| 4.0 | % |
|
|
| 4.0 | % |
Other financial data |
|
|
|
|
|
|
|
|
|
|
|
|
|
|
|
|
|
|
|
| |||||
Lease payments(3) |
|
|
| (1,139,828 | ) |
|
|
| (859,684 | ) |
|
|
| (1,186,260 | ) |
|
|
| (826,730 | ) |
|
|
| (598,432 | ) |
IPO expenses |
|
|
| 23,269 |
|
|
|
| 16,843 |
|
|
|
| 28,432 |
|
|
|
| 16,023 |
|
|
|
| — |
|
Share-based payment |
|
|
| 396,054 |
|
|
|
| 302,438 |
|
|
|
| 384,566 |
|
|
|
| 303,789 |
|
|
|
| 142,123 |
|
Key Operating Metrics
In addition, we present the following key operating metrics in this prospectus, which we believe serve as measures of our operations.
| As of and |
|
| As of and for the year ended December 31, |
| |||||||||||
| 2024 |
|
| 2023 |
|
| 2022 |
|
| 2021 |
| |||||
Same Store Sales Growth (%) |
|
| 13.2 | % |
|
| 17.6 | % |
|
| 21.9 | % |
|
| 12.3 | % |
Inventory Days (days) |
|
| 19 |
|
|
| 21 |
|
|
| 22 |
|
|
| 22 |
|
Payable Days (days) |
|
| 63 |
|
|
| 65 |
|
|
| 65 |
|
|
| 69 |
|
Receivable Days (days) |
|
| 0.2 |
|
|
| 0.1 |
|
|
| 0.1 |
|
|
| 0.1 |
|
The following are explanations of how we calculate the key operating metrics and target unit economics that we present here or elsewhere in this prospectus.
Same Store Sales
We measure “Same Store Sales” using revenue from sales of merchandise from stores that were operational for at least the full preceding 12 months for the periods under consideration. When calculating this measure, we exclude stores that were temporarily closed (for one month or more) or permanently closed during the periods in consideration.
24
We measure Same Store Sales growth by comparing the Same Store Sales of stores that were open during the measurement period. For example, if a store began operations on September 1, 2023, it would not be included in Same Store Sales growth for the years ending December 31, 2023 or 2024. However, such store would be included in Same Store Sales growth for the year ending December 31, 2025. Our calculation of Same Store Sales may differ from Same Store Sales or similar metrics reported by other retailers.
Our management believes that Same Stores Sales is a relevant measure of the sales performance of a portfolio of stores that have been operating during the period under consideration. It enables us to assess how our existing stores’ sales over a comparable period are performing year-over-year, excluding the impact of new store openings or closures, allowing us to measure the growth performance attributable to the existing store base.
Inventory Days
We calculate “Inventory Days” to be the average of beginning and end of period inventory balance, divided by cost of sales for the period and multiplied by the number of days during the period. Inventory Days measures the average number of days we keep inventory on hand before selling the product. This operating metric allows us to track our inventory management policies and observe how quickly we are able to rotate inventory, which is key to our cash conversion cycle.
Payable Days
We calculate “Payable Days” to be the sum of the average of beginning and end of period balance of suppliers, accounts payable and accrued expenses and current portion of bonus payable to related parties, divided by cost of sales for the period and multiplied by the number of days during the period. Payable Days measures the average number of days that it takes us to pay suppliers after receiving goods or services. This metric allows us to track the terms of payment policies with suppliers and our ability to finance our operations through agreements with our suppliers.
Receivable Days
We calculate “Receivable Days” to be the average of beginning and end of period balance of Sundry debtors divided by revenue from sales of merchandise for the period and multiplied by the number of days during the period. Receivable Days measures the average number of days that it takes us to collect cash from customers after making a sale. This metric shows how quickly we convert revenues into cash received from our customers.
Payback Period
“Payback Period” is meant to represent, on a vintage basis, the average number of months it takes an operating store to recover the Average Investment per Store. The calculation excludes stores that were either permanently or temporarily closed. We calculate Payback Period for stores of a given vintage by adding the average 4-Wall Profitability per store and the cumulative changes in those stores’ operational accounts (defined as accounts payable, inventories and accounts receivables) and comparing the result to the Average Investment per Store made to open stores of that vintage.
The Payback Period helps management track new stores’ financial performance and manage resource allocation. The Payback Period is achieved for a given vintage of stores when the average 4-Wall Profitability and the cumulative changes in those stores’ operational accounts equals the Average Investment per Store made to open such stores.
Our target unit economics included in this prospectus are presented on a per store basis and our informed by our prior vintages performance. Our Payback Period for a given store is similarly calculated by adding targeted 4-Wall Profitability for the given store and the target cumulative changes in such stores’ operational accounts and comparing the result to the investment per store of such store.
25
Sales per Store
We define our “Sales per Store” as the average of the revenue from sales of merchandise achieved by our stores that were open for the full year in consideration. When calculating this measure, we exclude stores that were temporarily closed (for one month or more) or permanently closed during the period in consideration.
This measure assists our management’s understanding of how store performance has evolved across different vintages. Sales per Store also serves as a benchmark to measure the performance of new stores and is useful to set growth and expansion targets.
4-Wall Profitability and 4-Wall Profitability Margin
We define “4-Wall Profitability” for a given vintage as revenue from sales of merchandise, minus cost of sales, plus discounts and rebates, plus differences with suppliers, minus private label packaging expenses, minus shrinkage, minus store expenses, which include store personnel expense, rent expenses, advertising, water, electricity, security, store and office equipment maintenance, building maintenance, stationery, waste and recyclable recollection services, and depreciation, among others. We calculate 4-Wall Profitability Margin for a period by dividing 4-Wall Profitability of stores of a certain vintage for the corresponding period by revenue from sales of merchandise for stores of that vintage for such period.
4-Wall Profitability and 4-Wall Profitability Margin are commonly used metrics in the retail industry that measure the profitability at the store level. Our management believes that 4-Wall Profitability and 4-Wall Profitability Margin are helpful metrics to measure our operational efficiency at the store level, without considering the effect of certain logistics and headquarters expenses not attributable to our stores.
Our target unit economics included in this prospectus are presented on a per store basis and are informed by our prior vintages performance. Our 4-Wall Profitability and 4-Wall Profitability Margin on a per store basis are similarly calculated as revenue from sales of merchandise, minus cost of sales, plus discounts and rebates, plus differences with suppliers, minus private label packaging expenses, minus shrinkage, minus store expenses, which include store personnel expense, rent expenses, advertising, water, electricity, security, store and office equipment maintenance, building maintenance, stationery, waste and recyclable recollection services, and depreciation, among others.
Average Investment per Store
Our “Average Investment per Store” measures the average investment required to open a store of a given vintage. We calculate the Average Investment per Store by adding the cumulative aggregate investment (including remodeling, furniture and equipment, shelfing, refrigeration equipment, security equipment, moving equipment, computer equipment, and others) incurred for all stores of a given vintage and then dividing it by the number of stores that opened during such vintage.
Our Average Investment per Store is a relevant unit economic for our expansion strategy as it provides relevant guidance on the average necessary investment required to open and continue to operate a new store and allows us to benchmark a store’s productivity based on their required initial and recurring investment needs.
Our target unit economics included in this prospectus are presented on a per store basis and are informed by our prior vintages performance. Our investment per store is similarly calculated by adding the aggregate investment (including remodeling, furniture and equipment, shelfing, refrigeration equipment, security equipment, moving equipment, computer equipment, and others) incurred for a store.
Cash-on-Cash Return
We calculate our “Cash-on-Cash Return” by dividing the 4-Wall Profitability of stores of a certain vintage for the period under consideration by the Average Investment per Store for stores of the same vintage.
26
Our management believes that the Cash-on-Cash Return is a helpful metric to measure our productivity and expected return at a store level as well as measure the efficiency of our capital deployment.
Our target unit economics included in this prospectus are presented on a per store basis and are informed by our prior vintages performance. Our Cash-on-Cash Return on a per store basis is similarly calculated by dividing the 4-Wall Profitability of such store by the corresponding investment per store.
Sales Ramp-up Evolution by Vintage
“Sales Ramp-up Evolution by Vintage” measures, for stores of the same vintage, the median of such stores’ revenue from sales of merchandise during 12-month periods since the start of operations. When calculating this measure, we exclude the first calendar month of a store’s operations to account for stores that are not open for the entire month. Additionally, stores that have been permanently closed are excluded from the calculation.
Our management believes that Sales Ramp-up Evolution by Vintage is a relevant metric to measure our stores’ sales performance progression over time, compared to previously opened stores. It allows us to track the evolution of our stores’ sales productivity since opening and compare them with other stores opened in different years.
27
RISK FACTORS
An investment in our Class A common shares involves significant risks. Before you decide to invest in our Class A common shares, you should carefully consider all of the information set forth in this prospectus, including the risks described below. Note that an investment in the securities of issuers whose operations are located in emerging market countries such as Mexico involves a higher degree of risk than an investment in the securities of issuers whose operations are located in the United States or other more developed countries. In the event that any of these risks occurs, our business, financial condition, results of operations, cash flows and prospects may be materially adversely affected and, as a result, the value of our Class A common shares may decline and you may lose all or part of your investment. We currently believe that the risks described below are those that may adversely affect us. Additional risks and uncertainties not currently known to us, or that we currently believe to be immaterial, may have a material adverse effect on us in the future.
When determining whether to invest, you should also refer to the other information contained or incorporated by reference in this prospectus, including our audited consolidated financial statements as of December 31, 2023 and 2022 and for the years ended December 31, 2023, 2022 and 2021, together with the notes thereto, incorporated by reference in this prospectus, and our unaudited interim condensed consolidated financial statements as of September 30, 2024 and for the three and nine months ended September 30, 2024 and 2023, together with the notes thereto. You should also carefully review the cautionary statements referred to under “Special Note Regarding Forward-Looking Statements.” Our actual results could differ materially and adversely from those anticipated in this prospectus.
For the purposes of this section, the indication that a risk, uncertainty or problem may or will have an “adverse effect on us” or will “adversely affect us” means that the risk, uncertainty or problem could have a material adverse effect on our business, financial condition, results of operations, cash flows, prospects and/or the liquidity or trading price of our Class A common shares, except as otherwise indicated or as the context may otherwise require. You should view similar expressions in this “Risk Factors” section as having a similar meaning.
Risks Relating to Our Business and Industry
Economic factors may reduce our customers’ spending, impair our ability to execute our strategies and initiatives, and increase our costs and expenses, which could result in materially decreased sales or profitability.
Many of our customers have fixed or low incomes and limited discretionary spending resources. Any factor that could adversely affect their disposable income could impact potential customers’ ability to shop in our stores as well as decrease their spending or cause them to shift their spending to our lower price and lower margin product choices, which could result in materially lower sales and/or profitability. Factors that could reduce our customers’ disposable income include but are not limited to unemployment or underemployment or decline in real wages; inflation; pandemics; higher fuel, energy, healthcare and housing costs, interest rates and tax rates; lack of available credit; and decreases in, or elimination of, government subsidies such as assistance programs.
Many of the economic factors listed above, as well as commodity rates; transportation, energy costs, lease and insurance costs; wage rates; foreign exchange rate fluctuations; measures that create barriers to or increase the costs of international trade (including increased import duties or tariffs); changes in applicable laws and regulations; reduction in the level of remittances and other economic factors, also could impair our ability to successfully execute our strategies and initiatives, as well as increase our cost of goods sold and selling, general and administrative expenses (including real estate costs), and may have other adverse consequences that we are unable to fully anticipate or control, all of which may materially decrease our sales or profitability.
Our plans depend significantly on strategies and initiatives designed to increase sales and profitability and improve the efficiencies, costs and effectiveness of our operations, and failure to achieve or sustain these plans could materially affect our results of operations.
We have short-term and long-term strategies and initiatives, which are designed to continue to improve our results of operations and financial condition. These include initiatives such as those relating to merchandising, real
28
estate and new store development, private label product development, inventory management, supply chain, store operations, expense reduction, and technology. The effectiveness of these initiatives is inherently uncertain, even when tested successfully, and is dependent on consistency of training and execution, workforce stability, ease of execution and scalability, and the absence of offsetting factors that can influence results adversely. The number of our stores and distribution centers and our decentralized field management also contribute to the challenging nature of these factors. Other risk factors described herein also could negatively affect general implementation. Failure to achieve successful or cost-effective implementation of our initiatives could materially and adversely affect our business, results of operations and financial condition.
The success of our merchandising initiatives depends in part on our ability to predict the products that our customers will demand and to identify and timely respond to evolving trends in consumer preferences and demographic shifts in our markets. If we are unable to select and timely obtain products that are attractive to customers and at costs that allow us to sell them at an acceptable profit, or to effectively market such products, it could result in materially decreased sales and profitability.
We have experienced rapid growth in the past and there can be no assurance that the growth rate of our business will continue at such levels in the future.
We have experienced rapid growth as a business since our inception in 2005, averaging a store opening every 18 hours in 2024, every 22 hours in 2023 and every 22 hours in 2022, with Same Store Sales growth of 13.2% in the nine months ended September 30, 2024, 17.6% in 2023 and 21.9% in 2022, in each case compared to the prior year. Moreover, our growth has been largely focused in 16 states across the center of Mexico which are generally more densely populated and developed than other regions in Mexico. Expansion into new regions involves risks and uncertainties related to our ability to replicate our business model, efficiently expand our logistics capabilities and achieve profitability. Although we expect to continue to grow our store network, including by expanding into new regions, we cannot assure that we will be able to achieve a similar growth rate in store openings, that stores in untested regions will be equally profitable or that we will be able to replicate our distribution network model in new regions.
Our growth depends on our ability to successfully lease, obtain permits for and adapt real estate spaces for stores and distribution centers.
Our expansion depends, in part, on our ability to identify retail space and distribution center space that is attractive in terms of location, size and the contractual conditions of the lease, as well as on our ability to obtain the necessary permits for such spaces on a timely basis. In order to be suitable, retail locations must comply with certain characteristics in terms of size and configuration for our business model, which might not be widely available in the market at any given time. In addition, the market for commercial property and industrial property in large metropolitan areas in Mexico is increasingly competitive and we believe that competition for such properties is likely to continue increasing. If we fail to identify and secure such spaces on a timely basis for any reason, including as a result of competition from other companies seeking similar locations or our inability to obtain the necessary permits, our anticipated growth may be adversely affected. There can be no assurance that we will successfully identify and lease suitable properties, lease such properties on acceptable terms on a timely basis or obtain the necessary permits to begin operating new stores.
The performance and operation of our business are subject to risks associated with our leased property portfolio.
We lease all the retail locations for our retail stores which are generally subject to periodic rent review, lease expiry and renegotiation. As a result, we are susceptible to changes in the property rental market, such as increases in market rents. Our stores are also subject to various local laws and regulatory requirements.
New stores and stores with renewed lease terms may not produce anticipated levels of revenue while increasing our costs, which would increase our expenses as a percentage of sales and adversely affect our competitive position and profitability. There can be no assurance that we will continue to be able to renew our store lease agreements on acceptable terms or at all as they expire. In addition, we must comply on an ongoing basis with the various applicable local laws and regulatory requirements. If we are unable to renew lease agreements for existing store locations as they expire or lease other favorable locations on acceptable terms, or if our existing rental
29
agreements are terminated or revised to our detriment for any reason, or if we fail to comply with applicable local laws and regulatory requirements, our financial condition and operating results could be adversely affected.
Our financial results are subject to risks relating to competition and narrow profit margins in the food retail industry, which could adversely affect our results of operations and financial condition.
The retail food industry in Mexico is highly fragmented and increasingly competitive and our market and strategy are generally characterized by narrow profit margins. Market participants in our industry generally compete with respect to price, customers, store location, merchandise quality, product assortment and presentation, service offerings, in-stock consistency, customer service, ease of shopping experience, promotional activity, employees, and market share. We compete with hard discount stores such as Bodega Aurrera Express, Tiendas Neto and Tiendas BARA, discount formats of large retailers such as Bodega Aurrera, Walmart-Express, Súper Ché, Soriana Mercado, among others, and also with other retailers, including international, national, regional and local supermarket chains, independent grocery stores, specialty food stores, convenience stores, open-air markets, bodegas, small grocery stores, general merchandisers and discount retailers. We also expect to see increased competition from government-run stores (Tiendas del Bienestar), which product offering is being expanded by the current administration, to sell more consumer staples and necessities at low prices. In particular, we compete against informal vendors which represent a significant part of the Mexican economy. According to INEGI, informal economic activity in Mexico was responsible for 24.4% of Mexican gross domestic product in 2023 employed on average 55.0% of the country’s workforce. Informal vendors also have different formats, from small street side stands to larger, well stocked neighborhood shops or specialty stands in markets, all of which target a customer segment similar to ours. Given the informal nature of their operations, informal vendors are able to offer substantial cost savings to customers.
Our ability to compete depends on our ability to maintain our existing stores and open new stores in advantageous locations, as well as to offer the most competitive prices. To maintain competitive prices, we may be required to lower them, either temporarily or permanently, and may have limited ability to increase them in response to increased costs, resulting in lower margins and reduced profitability. Some of our competitors have greater financial, distribution, marketing and other resources, and may be able to secure better arrangements with suppliers than us.
Competition is intense, and is expected to continue to be so as we expand within Mexico and start competing against regional players. Some of our competitors may seek to reduce their store locations while others enter or increase their presence in our geographic and product markets (including through the expansion of the availability of delivery services) and expand the availability of mobile, web-based and other digital technologies, to facilitate a more convenient and competitive online and in-store shopping experience. If our competitors or other discount food retailers were to enter our industry in a significant way, including through alliances or other business combinations, it could significantly alter the competitive dynamics of the retail marketplace and result in competitors with greatly improved competitive positions, which could materially affect our financial performance. Our ability to effectively compete will depend substantially on our continued ability to develop and execute compelling and cost-effective strategies and initiatives. If we fail to anticipate or respond effectively to competitive pressures and industry changes, it could materially affect our results of operations and financial condition.
Failure to attract, develop and retain qualified employees while controlling labor costs, as well as other labor issues, could adversely affect our financial performance.
Our future growth and performance, positive customer experience and legal and regulatory compliance depends on our ability to attract, develop, retain and motivate qualified employees while operating in an industry challenged by historically high rates of employee turnover. Our ability to meet our labor needs, while controlling our labor costs, is subject to many external factors, including competition for and availability of qualified personnel, unemployment levels, wage rates (including the heightened possibility of increased federal, state and/ or local minimum wage rates), health and other insurance costs, changes in employment and labor laws or other workplace regulations (including those relating to employee benefit programs such as health insurance and paid leave programs or the proposed labor law reform in Mexico aimed at reducing the maximum working hours per week that was recently being discussed by Mexican Congress and could be reintroduced in future legislative terms), employee activism, and our reputation and relevance within the labor market. If we are unable to attract, develop and retain adequate numbers of qualified employees, our operations, customer service levels, legal and regulatory compliance,
30
and support functions could suffer. In addition, to the extent a significant portion of our employee base unionizes, or attempts to unionize, our labor and other related costs could increase. Our ability to pass along labor and other related costs to our customers is constrained by our everyday low-price model, and we may not be able to offset such increased costs elsewhere in our business.
Our success depends on our executive officers, our regional management and other key personnel. If we lose key personnel or are unable to hire additional qualified personnel, our business may be harmed.
Our future success depends to a significant degree on the skills, experience and efforts of our executive officers, and other key personnel. Importantly, given our decentralized management structure, we depend significantly on our regional management teams. The unexpected loss of the services of any of such persons could adversely affect our operations. There can be no assurance that our executive succession planning, retention or hiring efforts will be successful. Competition for skilled and experienced management personnel is intense, and a failure to attract and retain new qualified personnel could adversely affect our operations.
Our private labels may not be successful in improving our gross profit and may increase certain of the risks we face.
Our business has expanded its own range of private label items, which included 95 different private label brands and over 422 SKUs as of December 31, 2023, representing 46.5% of our sales for 2023, and 108 different private label brands and over 458 SKUs as of December 31, 2024, representing an estimated 54% of our sales for 2024. These private labels are important for future growth prospects as private label items offer an important source of differentiation against our competitors and also generally offer more attractive margins. The sale and expansion of these offerings also subjects us to or increases certain risks, such as: product liability claims and product recalls; disruptions in raw material and finished product supply and distribution chains; inability to successfully protect our proprietary rights; claims related to trademarks and proprietary rights of third parties; supplier labor and human rights issues, and other risks generally encountered by entities that source, sell and market exclusive branded offerings for retail. Further, most of our private label items are manufactured in Mexico, and while our policies set out standards for ethical business practices, it does not control these manufacturers or their labor or other business practices. Maintaining broad market acceptance of our private label items depends on many factors, including pricing, costs, quality and customer perception, and we may not achieve or maintain expected sales for our private label items.
Failure to appropriately address these risks could materially and adversely affect our private label initiatives, reputation, results of operations and financial condition.
Expansion into new product categories may carry significant risks and impact our operational results.
Our expansion into new product categories, including perishables, may present significant risks, potentially leading to adverse effects on our operational results. Introducing new products or categories requires substantial investment in procurement, storage, distribution, and marketing, as well as regulatory compliance and additional market competition. Specifically, perishables pose unique challenges due to their limited shelf life, needing rapid turnover and high-quality supply chain management to prevent loss. In addition, there is also the inherent risk that these new products or categories may not resonate with our customers, leading to underwhelming sales, excess inventory, and reduced margins. Failure to successfully anticipate consumer preference or efficiently manage these expanded offerings could result in unsold inventory, and financial losses, all of which could negatively impact our profitability and operating results.
Risks associated with or faced by our suppliers could adversely affect our financial performance.
We source our merchandise and private label products from a wide variety of primarily domestic suppliers. Our ability to offer a wide variety of products to our customers depends on our ability to obtain adequate products and supplies from manufacturers and other suppliers. Our suppliers’ ability to timely manufacture and deliver the products we purchase may be subject to changes to the prices and flow of goods and ingredients and most often are for reasons beyond our control, such as political or civil unrest, acts of war, currency fluctuations, disruptions in
31
maritime lanes, port labor disputes, economic conditions and instability in countries in which foreign suppliers are located, the financial instability of suppliers, failure to meet our terms and conditions or our standards, issues with our suppliers’ labor practices or labor problems they may experience (such as strikes, stoppages or slowdowns, which could also increase labor costs during and following the disruption), the availability and cost of raw materials, pandemic outbreaks, merchandise quality or safety issues, transport availability and cost, increases in wage rates and taxes, transport security, inflation, and other factors relating to suppliers and the countries in which they are located or from which they import. Such changes could adversely affect our operations and profitability.
Our ability to maintain the accelerated growth rate we have experienced is heavily dependent, among other factors, on the ability of our suppliers to increase their capacity so they are able to fulfill our purchase orders at the same pace we expand and open new stores. Our suppliers may need to increase their capital expenditures and incur significant costs to increase such capacity. To the extent our suppliers are not able to increase their production and fulfillment capacity at the same rate we have grown, our ability to continue expanding rapidly may be impaired and as a result our margins and results of operations may be adversely affected. Additionally, if a supplier fails to deliver on its commitments, we could experience merchandise sellouts that could lead to lost sales and reputational harm. Further, failure of suppliers to meet our compliance protocols could prolong our procurement lead time, resulting in lost sales and adverse margin impact.
In the course of our operations, divergences and disputes may arise with our suppliers, including in relation to the terms of service and payment, which may result in an interruption or termination of our relationship with one or more suppliers, due to our election or as a result of actions by such supplier. Any such interruption or termination of a relationship could adversely affect our operations until such time as we replace such supplier. Any interruption or termination that has not been previously anticipated, especially if it results in interruption of our services or delivery of merchandise, could result in lost sales and adverse margin impact during any period in which such interruption is ongoing and result in reputational harm.
In the year ended December 31, 2023, we purchased products from 322 suppliers, with our largest supplier accounting for 3.7% of our total purchases, and the five largest suppliers accounting for 16.8% of our total purchases. Although we have developed a broad network of suppliers, some of our top selling products are only supplied by a single supplier or manufacturer. If any such single supply source becomes unavailable for any reason, replacing such supplier may be costly and adversely affect our ability to sell a given product until an adequate replacement is found. This risk is especially pronounced for our private label products where a supplier’s failure could adversely affect the availability of a specific product across our entire store network. While we generally believe substitute suppliers are available, until such a replacement is found and such supplier passes our quality control assessments, we could face a temporary reduction in store inventory levels and/or a reduction in the quality of our merchandise. These factors could materially decrease our sales, reduce our margins and adversely affect our results of operations.
Our trademarks and trade names may be misappropriated or challenged by others.
We own the material trademark and trade name rights used in connection with our brands, private labels and the marketing and sale of our products. We believe our brand names and related intellectual property are important to our continued success. We attempt to protect our trademarks and trade names by exercising our rights under applicable trademark and copyright laws. Any infringement of our intellectual property rights would likely result in a commitment of our time and resources to protect these rights through litigation or otherwise, which could be expensive and time-consuming. If we were to fail to protect our intellectual property rights for any reason, it could have an adverse effect on our business, results of operations and financial condition. We are subject and may continue to be subject to trademark disputes relating to the products that we sell and if we were to fail to protect our intellectual property rights for any reason, it could have an adverse effect on our business, results of operations and financial condition.
32
We maintain a negative working capital position.
As is customary for businesses with high inventory turnover and strict control over working capital, we consistently maintain a negative working capital position, in which our 65 Payable Days for 2023 exceeded our 21 Inventory Days for 2023.
Although we have received funding through a combination of equity issuances and incurrence of debt to fund our foundation and initial growth, our working capital and capital expenditure requirements have historically been funded entirely from cash generated by our operations. Cash flows from our operating activities have been, and we expect that these cash flows will continue to be, the single largest source of our liquidity and capital resources.
Negative working capital is an important driver in our cash flow from operating activities and is used to finance our store expansion. Our negative working capital and increases in our negative working capital has been and is expected to continue to be a major source of capital resources.
If our revenues decrease materially, or key suppliers change payment terms, we may not have enough available cash to meet our obligations as they become due or fund our expansion. Further, we may not be able to raise additional funds on satisfactory terms, if at all, through equity or debt financings to meet our obligations or continue funding our expansion. In such an event, we may be required to delay, limit, reduce or terminate our business development or expansion efforts. Our business, financial condition and results of operations could be materially adversely affected as a result.
As a result of selling food products, we face the risk of product liability claims and adverse publicity.
The packaging, marketing, distribution and sale of food products purchased from others, as well as the production of foods under our private label brand names, entail an inherent risk of contamination or deterioration, which could potentially lead to product liability, product recall and resultant adverse liability and publicity. These products may contain contaminants that could, in certain cases, cause illness, injury or death to consumers. Our suppliers are legally responsible for any contamination or damage to goods during the production phase. However, we become legally responsible for any such defects from the moment we accept the goods from our suppliers. In many instances, it is difficult to determine during what phase contamination or damage occurred. There can be no assurance that any claims will not be asserted against us in the future or that we will not be forced to undertake significant product recalls. Moreover, we do not have product liability insurance and do not have contractual indemnification provisions in all cases. If a material product liability claim were successful, contractual indemnifications may not be adequate to cover all liabilities we may incur. If we do not have adequate contractual indemnification available product liability claims relating to defective products could have a material adverse effect on our ability to successfully market our products and on our financial condition and operating results.
Even if a product liability claim is not successful or is not fully pursued, the negative publicity surrounding any alleged contamination or deterioration of our private label products could have a material adverse effect on our brand, image and profitability of these products.
Inventory shrinkage may negatively affect our results of operations and financial condition.
Although historically we have not experienced significant inventory shrinkage, inventory shrinkage is an unavoidable cost of doing business. Higher rates of inventory shrinkage or increased security or other costs to combat inventory theft could adversely affect our results of operations and financial condition. There can be no assurance that we will be successful in our efforts to contain or reduce inventory shrinkage.
Our return policy may negatively affect our profitability and financial condition.
Our commitment to customer satisfaction includes a no-questions-asked no-receipt needed money-back return policy, which, while enhancing consumer confidence and loyalty, also exposes us to certain financial risks. This policy can lead to a higher volume of returned merchandise compared to competitors with more restrictive return policies. Handling returns involves additional logistics, restocking, and customer service costs, and can result in the inability to resell returned products at full price, particularly if they are perishable, used, or no longer in
33
salable condition. High return rates can lead to increased waste, affect inventory management, and result in financial losses, impacting our margins and overall profitability. The financial impact could include additional expenses related to the processing and disposition of returns, which could adversely affect our results of operations.
Our cash flows from operations, profitability and financial condition may be negatively affected if we are not successful in managing our inventory balances.
Our inventory balance represented 12.1% and 15.8% of our total assets as of September 30, 2024 and December 31, 2023, respectively. Efficient inventory management is a key component of our business success and profitability. We must maintain sufficient inventory levels and an appropriate product mix to meet our customers’ demands without allowing those levels to increase such that the costs to store and hold the goods unduly impacts our financial results or increases the risk of inventory shrinkage. If we do not accurately predict customer trends, spending levels, or price sensitivity, we may have to take unanticipated markdowns to dispose of the excess inventory, which also can adversely affect our financial results. We continue to focus on ways to reduce these risks, but we cannot make assurances that we will be successful in our inventory management. If we are not successful in managing our inventory balances, our cash flows from operations and financial condition may be negatively affected.
A significant disruption to our distribution network, the capacity of our distribution centers or the timely receipt of inventory could adversely affect sales or increase our transportation costs, which would decrease our profitability.
We rely on our distribution and transportation network to provide goods to our stores timely and cost-effectively. We and our vendors primarily rely on trucks to move goods from vendor locations to our distribution centers and our stores. Any disruption, unanticipated or unusual expense or operational failure related to this process (e.g., delivery delays, including as a result of pandemic outbreaks, or increases in transportation costs (such as those we experienced during 2021 and continue to experience), including increased fuel costs, import freight costs, a decrease in transportation capacity; or labor shortages) could negatively impact sales and profits. Labor shortages or work stoppages in the transportation industry or disruptions to the national and international transportation infrastructure, including as a result of pandemics, war or natural disasters, could also increase our costs or otherwise negatively affect our business.
As of December 31, 2024, all of our 16 distribution centers were leased by us, and we are analyzing the expansion of our distribution capabilities in line with our store openings. Delays in opening new facilities as they become necessary, termination of the leases of our distribution centers, renewing leases on less advantageous terms for existing facilities, or our failure to integrate new facilities, could adversely affect our financial performance by slowing store growth or by increasing transportation and product costs. In addition, distribution-related construction or expansion projects entail risks that could cause delays and cost overruns, such as: shortages of materials or skilled labor; work stoppages; unforeseen construction, scheduling, engineering, environmental or geological problems; weather interference; fires or other casualty losses; and unanticipated cost increases. For these reasons, the completion date and ultimate cost of these projects could differ significantly from initial expectations, and we cannot guarantee that any project will be completed on time or within established budgets.
Material damage or interruptions to our information systems as a result of external factors, staffing shortages or challenges in maintaining or updating our existing technology or developing or implementing new technology could materially and adversely affect our business and results of operations.
We depend on a variety of information technology systems, including systems owned and managed by third-party vendors, for the efficient functioning of our business, including, without limitation, transaction processing and the management of our employees, facilities, logistics, inventories, stores and customer-facing digital applications and operations. Our technology initiatives may not deliver desired results or may do so on a delayed schedule. Additionally, such systems are subject to damage or interruption from power surges and outages, facility damage, physical theft, computer and telecommunications failures, inadequate or ineffective redundancy, malicious code (including malware, ransomware, or similar), successful attacks (e.g., account compromise; phishing; denial of service; and application, network or system vulnerability exploitation), software upgrade failures or code defects, natural disasters and human error. Design defects, damage to, or interruption to these systems may require a
34
significant investment to repair or replace, disrupt our operations, result in the loss or corruption of critical data, and harm our reputation, all of which could materially and adversely affect our business or results of operations. Moreover, developing or implementing new technologies may result in risks associated with unfamiliar or untested technology, such as loss or corruption of critical data, logistics failures among other undesired results.
Failure to maintain the security of our business, customer, employee or vendor information or to comply with privacy laws could expose us to litigation, government enforcement actions and costly response measures, and could materially harm our reputation and affect our business and financial performance.
In connection with sales, we transmit confidential credit and debit card information which is encrypted using point-to-point encryption. We also have access to, collect or maintain certain private or confidential information regarding our customers, employees and their dependents, and vendors, as well as our business. Some of this information is stored electronically, some of which may leverage third-party service providers. Additionally, we may share information with select vendors that assist us in conducting our business. While we have implemented procedures and technology intended to protect such information and require appropriate controls of our vendors, external attackers could compromise such controls and result in unauthorized disclosure of such information, as attacks are becoming increasingly sophisticated, may include attacks on our third-party business partners, and do not always or immediately produce detectable indicators of compromise. Moreover, inadvertent or malicious internal personnel actions could result in a defeat of security measures and a compromise of our or our third-party vendors’ information systems. Like other retailers, we and our vendors have experienced threats to, and infrequent immaterial incidents involving, data and systems, including by perpetrators of attempted random or targeted malicious attacks; computer malware, ransomware, bots, or other destructive or disruptive software; and attempts to misappropriate our information and cause system failures and disruptions. If attackers obtain customer, employee or vendor passwords through unrelated third-party breaches, and if impacted customers, employees, or vendors do not employ good online security practices (e.g., use the same password across different sites), these passwords could be used to gain access to their information or accounts with us in certain situations.
A significant security breach of any kind experienced by us or one of our vendors, which could be undetected for a period of time, or a significant failure by us or one of our vendors to comply with applicable privacy and information security laws, regulations and standards could expose us to risks of data loss, litigation, government enforcement actions, fines or penalties, credit card brand assessments, negative publicity and reputational harm, business disruption and costly response measures (e.g., providing notification to, and credit monitoring services for, affected individuals, as well as further upgrades to our security measures) which may not be covered by or may exceed the coverage limits of our insurance policies, and could materially disrupt our operations. Any resulting negative publicity could significantly harm our reputation which could cause us to lose market share and could materially and adversely affect our business and financial performance.
Natural disasters and unusual weather conditions (whether or not caused by climate change), pandemic outbreaks or other health crises, political or civil unrest, acts of violence or terrorism, and disruptive global political events could disrupt business and result in lower sales and otherwise adversely affect our financial performance.
The occurrence of one or more natural disasters, such as Hurricane Otis and Hurricane John that struck Acapulco, Guerrero on Mexico’s pacific coast on October 25, 2023 and September 23, 2024, respectively, where we have 54 stores, and other future hurricanes, fires, floods, tornadoes, earthquakes, unusual weather conditions, pandemic outbreaks or other health crises, political or civil unrest, acts of violence or terrorism, looting (including within our stores, distribution centers or other Company property), or disruptive global political events or similar disruptions could adversely affect our reputation, business and financial performance. If any of these events result in the closure, or a limitation on operating hours, of one or more of our distribution centers, a significant number of stores, our sourcing offices, our corporate headquarters or data center or impact one or more of our key suppliers, our operations and financial performance could be materially and adversely affected through an inability or reduced ability to make deliveries, process payroll or provide other support functions to our stores and through lost sales. For example, as a result of Hurricane Otis and Hurricane John, our stores in Acapulco and surrounding areas suffered significant damages and property loss. Given the extensive damage to Acapulco’s infrastructure, its population and their property, 51 stores were temporarily closed and thus we have delayed our expansion plans in the city which may affect our broader expansion plans, operations and financial performance. Although our stores were covered by
35
insurance, we can provide no assurance that our insurers will cover all or a substantial amount of the losses incurred. Moreover, even if we receive adequate compensation from insurers, there is no guaranty that economic conditions in Acapulco will recover in a manner that will allow us to operate under the same conditions that prevailed before the storm.
These events also could affect consumer shopping patterns or prevent customers from reaching our stores, which could lead to lost sales and higher markdowns, or result in increases in fuel or other energy prices, fuel shortage(s), new store or distribution center opening delays, the temporary lack of an adequate work force in a market, the temporary or long-term disruption of product availability in our stores, the temporary or long-term inability to obtain or access technology needed to effectively run our business, disruption of our utility services or information systems, and damage to our reputation. These events may also increase the costs of insurance if they result in significant loss of property or other insurable damage by us or in the market more generally.
Our current insurance program may expose us to unexpected costs and negatively affect our financial performance.
Our insurance coverage reflects deductibles, self-insured retentions, limits of liability and similar provisions that we believe are prudent based on our operations. However, there are types of losses we may incur but against which we cannot be insured or which we believe are not economically reasonable to insure, such as losses due to acts of war, certain crimes (including employee crime), certain wage and hour and other employment-related claims and litigation, actions based on certain consumer protection laws, and some natural and other disasters or similar events. If we incur material uninsured losses, our financial performance could suffer. Certain material events, such as political developments, security concerns and natural disasters have resulted, and may result again in sizable losses for the insurance industry and adversely affect the availability of adequate insurance coverage or result in excessive premium increases. To offset negative insurance market trends, we may elect to self-insure, accept higher deductibles or reduce the amount of coverage. In addition, we self-insure a significant portion of expected losses under our workers’ compensation, automobile liability, general liability (including claims made against certain of our landlords), property loss, and group health insurance programs. Significant changes in actuarial assumptions and management estimates underlying our recorded liabilities for these losses, including any expected increases in medical and indemnity costs, could result in materially different expenses than expected under these programs, which could materially and adversely affect our results of operations and financial condition. Although we maintain property insurance for catastrophic events at our store support center and distribution centers, we are effectively self-insured for other property losses. If we experience a greater number of these losses than we anticipate, our financial performance could be adversely affected.
Any events that negatively impact the reputation of, or value associated with the Tiendas 3B brand or any of our private labels could adversely affect our business.
The Tiendas 3B brand along with our other private labels are important assets of our business. Maintaining the reputation of and value associated with our brands is central to the success of our business we could be adversely affected if customers lose confidence in the safety and quality of the products sold or provided by us. For third-party brands, we depend on our suppliers’ investments in their own marketing and promotion of their brands in order for customers to purchase their products rather than those of the suppliers’ competitors. We also depend on our suppliers to comply with applicable employment, environmental and other laws and standards so as not to negatively impact the Tiendas 3B brand. However, there can be no assurance that suppliers are or will remain in compliance with such laws.
In light of the increased public focus on employment, health and safety and environmental matters, a violation, or allegations of a violation of such laws or regulations, or a failure to achieve particular standards by any of our manufacturers, could lead to unfavorable publicity and a decline in public demand for our products, or require us to incur expenditure or make changes to our supply chain and other business arrangements to ensure compliance. Any such events concerning us, or any of our manufacturers or suppliers that supply our products could create substantial erosion in the reputation of, or value associated with, the Tiendas 3B brand or our other private labels and could result in a material adverse effect on our business, results of operations, financial condition, or prospects.
36
A significant change in governmental regulations and requirements could materially increase our cost of doing business, and noncompliance with governmental regulations could materially and adversely affect our financial performance.
We routinely incur significant costs in complying with numerous and frequently changing laws and regulations, including those applicable to the opening and operation of our stores. The complexity of this regulatory environment and related compliance costs continue to increase due to additional legal and regulatory requirements, our expanding operations, and increased regulatory scrutiny and enforcement efforts. New or revised laws, regulations, policies, rules (normas oficiales) and related interpretations and enforcement practices, particularly those dealing with the sale of products, including without limitation, product and food safety, marketing or labeling; consumer protection; information security and privacy; labor and employment; employee wages and benefits; health and safety; imports and customs; taxes; and environmental compliance and climate-related disclosure, may significantly increase our expenses or require extensive system and operating changes that could materially increase our cost of doing business. Violations of applicable laws and regulations or untimely or incomplete execution of a required product recall can result in significant penalties (including loss of licenses or significant fines), class action or other litigation, governmental investigation or action and reputational damage. Additionally, changes in tax laws (including those related to the corporate tax rate), the interpretation of existing laws, or our failure to sustain our reporting positions on examination could adversely affect our overall effective tax rate. Furthermore, significant and/or rapid increases to the minimum wage rates could adversely affect our earnings if we are not able to otherwise offset these increased labor costs elsewhere in our business.
In December 2021, the Organization for Economic Cooperation and Development (“OECD”) released final “Pillar Two” model rules pursuant to the Global Anti-Base Erosion Proposal (“GloBE”) to reform international corporate taxation. Large multinational enterprises within the scope of the rules are required to calculate their GloBE effective tax rate for each jurisdiction where they operate. They will be liable to pay a top-up tax for the difference between their GloBE effective tax rate per jurisdiction and the 15% minimum rate.
The rules issued by the OECD have not been enacted in the British Virgin Islands, which is where the Company is incorporated, nor Mexico, which is where the Company has most of its operations; however, Pillar Two legislation was enacted in the United Kingdom, the jurisdiction in which BBB Foods Limited Partnership and Lothian Shelf Limited are organized, and came into effect starting January 1, 2024. Aside from the potential disclosures or informative returns that may be required by each jurisdiction, considering Tiendas Tres B, S.A. de C.V., has an effective tax rate that exceeds 15%, no additional corporate tax is expected to be recognized in connection with the Mexican source of revenue, even if Pillar Two legislation, or similar legislation is passed by either the British Virgin Islands or Mexico.
Our operations are subject to the general risks of litigation.
We are involved, on an ongoing basis, in litigation arising in the ordinary course of business or otherwise, which could result in unfavorable decisions or financial penalties against us. Litigation may include class actions involving consumers, shareholders, employees or personal injury, and claims related to commercial, labor, employment, antitrust, tax, administrative, intellectual property, torts, contract, securities or environmental matters. Moreover, litigation requires substantial time, which may distract our management. Even if we are successful, any litigation may be costly, and any awards may not approximate the costs of such litigation. Furthermore, there may be claims or expenses, which are denied insurance coverage by our insurance carriers, not fully covered by our insurance, in excess of the amount of our insurance coverage or not insurable at all. Litigation trends and expenses and the outcomes of litigation cannot be predicted with certainty and adverse litigations, trends, expenses and outcomes could have a material adverse effect on our business, financial condition, results of operations and prospects.
We will continue to be subject to legal proceedings and we may be subject to investigations. We cannot assure you that these proceedings and investigations will not have an adverse effect on our business, financial condition, results of operations and prospects. Moreover, adverse publicity about regulatory or legal actions or investigations and allegations by other parties involved in regulatory or legal actions against us could damage our reputation and brand image, undermine our customers’ confidence and reduce long-term demand for our products, even if the regulatory or legal action is unfounded or not material to our operations.
37
The development and strengthening of the class action system could adversely affect our business and operations.
Since 2011, there has been a legal framework in Mexico that allows the exercise of class actions in relation to the consumption of goods or services and in environmental matters. This could result in the filing of class actions against us by our customers or other market participants. Due to lack of judicial precedents in the interpretation and application of such laws, we cannot anticipate that class actions will be initiated against us, the outcome of any class action brought against us under such laws, including the extent of any liability and the impact of such liability on our activities, our financial situation, results of operations, cash flows, its prospects and/or the market price of our Class A common shares.
Changes in law, structural reforms, and related regulations that could impact pricing, reimbursement and coverage may adversely affect our business.
The continuing increase in consumer expenditures has been the subject of considerable government attention almost everywhere we conduct business. We cannot assure you that local, regional or federal government in the regions in which we operate will not enact laws or regulations designed to protect customer or reduce costs for consumers, including by imposing price caps on basic staples such as those primarily sold at our stores. Any such laws or regulations, changes thereto, or the enforcement thereof could adversely affect our pricing and profitability. Moreover, local governments may delay or restrict permits for new store locations in an effort to protect smaller local businesses or municipal markets, which could affect our ability to continue expanding.
Government investigations into sales and marketing practices may result in substantial penalties.
We operate in complex legal and regulatory environments, and any failure to comply with applicable laws, rules and regulations may result in civil and/or criminal legal proceedings. As those rules and regulations change or as interpretations of those regulations evolve, our prior conduct or that of companies we have acquired may be called into question. Such proceedings are unpredictable and may develop over lengthy periods of time. In addition, fines and corrective measures can be expensive and disruptive to operations.
We are subject to the Mexican federal anticorruption laws, and similar worldwide anticorruption, anti-bribery and anti-money laundering laws. Failure to comply with these laws could result in penalties, which could harm our reputation and have an adverse effect on our business.
Our business is subject to a significant number of laws, rules and regulations, including those relating to anti-bribery, anti-corruption and anti-money laundering. However, the Mexican regulatory regime related to anti-bribery, anti-corruption and anti-money laundering legislation is still developing and could be less stringent than anti-bribery, anti-corruption and anti-money laundering legislation, which has been implemented in other jurisdictions.
We have implemented compliance processes and internal control systems designed to prevent and detect inappropriate practices, fraud or violation of law. However, our existing compliance processes and internal control systems may not be sufficient to prevent or detect all inappropriate practices, fraud or violations of law by our employees, contractors, agents, officers or any other persons who conduct business with or on behalf of us. We may in the future discover instances in which we have failed to comply with applicable laws and regulations or internal controls. If any of our employees, contractors, agents, officers or other persons with whom we conduct business engage in fraudulent, corrupt or other improper or unethical business practices or otherwise violate applicable laws, regulations or our own internal compliance systems, we could become subject to one or more enforcement actions by Mexican or foreign authorities (including the U.S. Department of Justice) or otherwise be found to be in violation of such laws, which may result in penalties, fines and sanctions and in turn adversely affect our reputation, business, financial condition and results of operations.
We are subject to the provisions contained in the Mexican Industrial Property Law.
The brands that we operate are subject to the special provisions contained in the Mexican Industrial Property Law (Ley Federal de Protección a la Propiedad Industrial). These provisions are subject to frequent changes, which generally have a tendency to make them more stringent. Although future capital and operating expenses have been budgeted to maintain compliance with the Mexican Industrial Property Law, it cannot be guaranteed that they will be sufficient in the face of a change or future application of a much stricter law than the
38
current one. Therefore, we cannot assure you that the costs of complying with this law or the provisions related to this matter, current and future, or derived from a more strict or different interpretation of this law, and the responsibility that could be incurred by failure to comply with it will not adversely affect our operations, results of operations, cash flow or financial condition.
Evolving expectations and/or requirements for reporting on or implementing environmental, social and governance (ESG) programs could increase our costs, and failure to meet expectations or requirements could adversely affect our sales and results of operations.
Expectations from shareholders, customers, employees, and other third parties concerning ESG reporting have increased and are increasing, and our ability to meet those expectations is dependent on several factors, including cooperation from suppliers and access to consistent and reliable data. Regulatory requirements relating to ESG matters are also increasing, including a new rule on the Enhancement and Standardization of Climate-Related Disclosures for Investors adopted by the SEC on March 6, 2024 which will require the disclosure of information including a registrant’s material climate-related risks, activities to mitigate that risk, oversight of climate-related risks, any material climate-related targets or goals, the financial statement impacts of severe weather events, and, for certain issuers, Scope 1 and 2 greenhouse gas emissions. Although this new rule was voluntarily stayed by the SEC on April 4, 2024, pending resolution of multiple challenges to be heard by the United States Court of Appeals for the Eighth Circuit, we cannot assure you that the stay will not be lifted in the future.
Meeting stakeholder expectations and regulatory requirements could require additional resources and compliance costs. In addition, negative consumer perceptions regarding the sourcing of the products we sell and the sufficiency and transparency of our reporting on ESG matters, where applicable or as required by recently adopted regulations, and events that give rise to actual, potential, or perceived compliance and social responsibility concerns could damage our reputation, result in lost sales, cause our clients to seek alternative sources for their products and make it difficult and costly for us to regain our client’s confidence.
We are subject to risks due to breaches of the Federal Law on Protection of Personal Data Held by Private Parties (Ley Federal de Protección de Datos Personales en Posesión de los Particulares).
We are subject to compliance with the Federal Law on Protection of Personal Data Held by Private Parties (Ley Federal de Protección de Datos Personales en Posesión de los Particulares). While we have procedures in place to comply at all times with such law, we are susceptible to breaches, due to our highly diversified operation and increasing e-commerce activity as well as complexity over digital protections, and its interactions across multiple systems including hardware, software, networks, applications, services or any other information technology that allow the exchange or computerized processing or digitized data. We will be susceptible to any violation that interrupts the protection of customer information, administrative security measures, physical security, unauthorized access by third parties, protection of mobile equipment, maintenance of data warehouses, technical security measures, electronic support, and physical support, among others. Since some of the information we receive is considered as sensitive in terms of the Mexican Federal Law on Personal Data Protection (Ley Federal de Protección de Datos Personales en Posesión de los Particulares), any breaches or perceived breaches of data privacy may lead to a wide range of sanctions from regulators as well as reduced confidence from clients and affect our reputation, which may have a substantial effect on our results.
We are subject to the Mexican Federal Consumer Protection Law.
We are subject to laws and regulations related to consumer protection, particularly with respect to our marketing and promotional programs. Despite the strict measures we take to protect our customers and our constant focus on improving the customer experience, there is a risk that a violation of consumer protection laws may occur at a store as part of our daily interaction with clients. In the event of non-compliance, the Mexican Consumer Protection Agency (Procuraduría Federal del Consumidor) could initiate proceedings against us, as well as impose sanctions, such as fines or closures to establishments, which could affect our operating results. Additionally, we may be subject to penalties from the Mexican Consumer Protection Agency (Procuraduría Federal del Consumidor) if we use marketing materials with inaccurate or misleading information, which, in turn may have an adverse effect in our reputation, business, financial condition and results of operations.
39
Risks Relating to Mexico and Other Global Risks
Since our operations are all based in Mexico, economic developments in Mexico may adversely affect our business and results of operations.
Currently, all of our operations are conducted, and all of our customers are located, in Mexico. Accordingly, our ability to raise revenues, our financial condition and results of operations are substantially dependent on the economic conditions prevailing in Mexico. As a result, our business may be significantly affected by the Mexican economy’s general condition, by the depreciation of the Mexican peso, by inflation and high interest rates in Mexico, or by political developments in Mexico. Declines in growth, high rates of inflation and high interest rates in Mexico have a generally adverse effect on our operations. If inflation in Mexico increases while economic growth slows, our business, results of operations and financial condition will be affected. The Mexican government may adopt policies, changes in law and drastic measures to attempt to control and reduce the inflation such as price controls and restrict product offering which may have a significant effect on Mexican private business, supply chains and ultimately our margins In addition, high interest rates and economic instability could increase our costs of financing.
In recent years, Mexico’s sovereign debt rating was subject to downward revisions and negative outlooks from major rating agencies as a result of such agencies assessment of the overall financial capacity of the government of Mexico to pay its obligations and its ability to meet its financial commitments as they become due. Factors influencing such rating have historically included, among others, concerns about public spending pressure, election cycles, trade tensions, the ability of the Mexican state oil company (Petróleos Mexicanos, or “PEMEX”) to meet its obligations and the Mexican government’s support of PEMEX and the general macroeconomic outlook, and more recently, the constitutional overhaul risks undermining the checks and balances of the country’s judicial system. We cannot ensure that the rating agencies will not announce additional downgrades of Mexico and/or PEMEX in the future. These downgrades could adversely affect the Mexican economy and, consequently, our business, financial condition, operating results and prospects. According to INEGI, for the year ended December 31, 2022, real GDP increased 3.1% and for the year ended December 31, 2023, real GDP increased 3.3%. In the event that the Mexican economy experiences a deterioration in GDP growth or of economic conditions such as inflation, interest rate increases, downgrade of sovereign debt, among other factors, the activities, financial situation, operating results, cash flows and/or prospects of the Issuer, could be adversely and significantly affected.
Developments in other countries could materially affect the Mexican economy and, in turn, our business, financial condition and results of operations.
Mexico’s economy is vulnerable to global market downturns and economic slowdowns. The macroeconomic environment in which we operate is beyond our control, and the future economic environment may continue to be less favorable than in recent years. There is no assurance of a strong economic recovery or that the current economic conditions will ameliorate. The risks associated with current and potential changes in the Mexican economy are significant and could have a material adverse effect on our business and results of operations.
The market prices of securities issued by companies with Mexican operations are affected to varying degrees by the economic and market situation in other places, including the United States, China, the rest of Latin America and other countries with emerging markets. Therefore, investors’ reactions to events in any of these countries could have an adverse effect on the market price of securities issued by companies with Mexican operations. Past economic crises that have occurred in the United States, China or in countries with emerging markets could cause a decrease in the levels of interest in the securities issued by companies with Mexican operations.
In the past, the emergence of adverse economic conditions in other emerging countries has led to capital flight and, consequently, to decreases in the value of foreign investments in Mexico. The financial crisis that arose in the United States during the third quarter of 2008, unleashed a global recession that directly and indirectly affected the economy and the Mexican stock markets and caused, among other things, fluctuations in purchase prices the sale of securities issued by publicly traded companies, shortage of credit, budget cuts, economic slowdowns, volatility in exchange rates, and inflationary pressures. Similarly, as a result of the COVID-19 pandemic, the global economy, including that of Mexico, was materially and adversely affected by a significant lack of liquidity, disruption in the
40
credit markets, reduced business activity, rising unemployment, interest rates changes and erosion of consumer confidence which affected our customers.
Financial problems or an increase in risk related to investment in emerging economies or a perception of risk could limit foreign investment in Mexico and adversely affect the Mexican economy. Mexico has historically experienced uneven periods of economic growth and there can be no assurance that the overall business environment in which we operate will improve and we cannot predict the impact any future economic downturn could have on our results of operations and financial condition. However, consumer demand generally decreases during economic downturns, which will negatively affect our business and results of operations.
Fluctuations in the U.S. economy may adversely affect Mexico’s economy and our business.
The United States is the country with the highest share of trade with Mexico. Accordingly, the U.S. economy heavily influences the Mexican economy, and therefore, the deterioration of the United States’ economy, any amendments to, or termination of, the USMCA, claims thereunder or other related events may impact the economy of Mexico. Economic conditions in Mexico have become increasingly correlated to economic conditions in the United States as a result of the North American Free Trade Agreement, and, subsequently, the USMCA, which has induced higher economic activity between the two countries and increased the remittance of funds from Mexican immigrants working in the United States to Mexican residents. On an annual basis, in 2023, almost 82.7% of Mexico’s total exports were purchased by the United States, the single country with the highest share of trade with Mexico.
Likewise, any action taken by the new U.S. or Mexico administrations, including changes to the USMCA, tariffs and/or other U.S. government policies or executive orders that may be adopted or issued by the U.S. administration, could have a negative impact on the Mexican economy, such as reductions in the levels of remittances, reduced commercial activity or bilateral trade or declining foreign direct investment in Mexico. In particular, actions taken by the new U.S. federal administration that took office in January 2025 may cast uncertainty on global financial and economic markets. The full extent of the actions that the new U.S. federal administration will implement is presently unclear, and if implemented, how these actions may impact the hard discount grocery retail market in Mexico. Any actions taken by the new U.S. administration may have a negative impact on the U.S. economy, or indirectly on the Mexican economy, and on our business, financial condition, and results of operations.
In addition, increased or perceptions of increased economic protectionism in the United States, Mexico and other countries could potentially lead to lower levels of trade and investment and economic growth, which could have a similarly negative impact on the Mexican economy. These economic and political consequences could adversely affect our business, operating results and financial condition.
We cannot make assurances that any events in the United States or elsewhere will not materially and adversely affect us.
The effects of public health crises may amplify the risks and uncertainties facing our business.
Pandemic outbreaks have impacted and may continue to impact our business. The long-term effects of the social, economic, and financial disruptions caused by pandemics, as well as the government responses to these disruptions, remain uncertain. Additionally, the impact on our business from the long-term effects of public health crises will depend on numerous factors that we cannot accurately predict.
We cannot predict with certainty the extent that our operations may be impacted by any effects of pandemics or other health crises on us or on our customers, suppliers, vendors, and other business partners, and each of their respective financial condition; however, any adverse effect on these parties could materially and adversely impact us. To the extent that any health disruptions affect the Mexican and global economy and our business, it may also heighten other risks described under the “Risk Factors” heading, including but not limited to those related to consumer behavior and expectations, competition, implementation of strategic initiatives, cybersecurity threats,
41
payment-related risks, supply chain disruptions, labor availability and cost, litigation and operational risk as a result of regulatory requirements.
The political situation in Mexico could negatively affect our operating results.
In Mexico, political instability has been a determining factor in business investment and economic conditions. Significant changes in laws, public policies and/or regulations or the use of public referendums (consultas populares) could affect Mexico’s political and economic situation, which could, in turn, adversely affect our business. Any change in the current consumer protection or outer regulatory policies could have a significant effect on Mexican consumer service providers, including us, variations in interest rates, demand for our products and services, market conditions, and the prices of and returns on Mexican securities.
Political events in Mexico may significantly affect our business operations. In June 2024, Mexico held presidential, federal and local elections. Claudia Sheinbaum won the presidency and her political party, Movimiento Regeneración Nacional (National Regeneration Movement, or “MORENA”) won a qualified majority in both the Senate and the Chamber of Deputies, as well as most local elections. This majority could allow MORENA to make changes in laws, policies and regulations, including through constitutional amendments. Pursuant to recent constitutional amendments, Mexican presidents, who were previously limited to one six-year term, are now also subject to a public vote of no confidence (revocación de mandato) in the third year of their term, which could lead to their removal. Any revocation of a president’s mandate and subsequent elections could create political instability which may have a significant adverse effect on investor confidence in Mexico, the Mexican economy, exchange rates and trade, which could, in turn, adversely impact our business.
It is generally expected that Ms. Sheinbaum will continue her predecessor’s political and economic agenda and that the Mexican federal government will increasingly make significant changes to policies, laws and regulations, including amendments to the Mexican Constitution. In the second half of 2024, a series of constitutional amendments passed by the Mexican Congress have raised concerns about judicial independence and the rule of law in Mexico. Among these amendments is a judicial reform that requires all judges, including Supreme Court Justices, to be elected by popular vote. Additionally, changes were made to prevent any challenges to constitutional amendments, effectively granting these reforms immunity from judicial review. Furthermore, these constitutional amendments included the dissolution of certain independent regulatory bodies in Mexico, consolidating their functions under federal government agencies.
We cannot predict whether potential changes in Mexican governmental and economic policy could adversely affect Mexico’s economic conditions or the sector in which we operate, nor can we provide any assurance that political developments in Mexico, or that resulting economic, social and political instability will not have an adverse effect on our business, results of operations, financial condition and prospects or the price of our Class A common shares.
Fluctuation of the Mexican peso relative to the U.S. dollar could adversely affect our financial condition, our ability to repay obligations and results of operations.
The exchange rate for the Mexican peso fluctuates in relation to the U.S. dollar and such fluctuations may, from time to time, have a material adverse effect on our earnings, assets, liability valuation and cash flows. Given most of our suppliers’ raw materials are dollarized commodities or subject to global price fluctuations, depreciations of the Mexican peso may also increase the cost of our products. Given our pricing strategy, we may not always be able to pass on these increased costs to our clients sufficiently quickly or at all. Any failure or delay to pass on increased costs may adversely affect our profitability.” A material devaluation or depreciation of the Mexican peso against the U.S. dollar may result in disruption of the international foreign exchange markets and may limit our ability to transfer or to convert Mexican pesos into U.S. dollars and other currencies to make timely payments of our U.S. dollar-denominated obligations.
The Mexican peso is a free-floating currency and, as such, it experiences exchange rate fluctuations relative to the U.S. dollar over time. According to the Mexican Central Bank, as of December 31, 2021, the Mexican peso had depreciated against the U.S. dollar by 3.2% as compared to December 31, 2020, as of December 31, 2022, the Mexican peso had appreciated 5.9% as compared to December 31, 2021, and as of December 31, 2023, the Mexican
42
peso had appreciated 12.7 as compared to December 31, 2022; during 2024, the Mexican peso has significantly depreciated against the U.S. dollar. While the Mexican government does not currently restrict, and since 1982 has not restricted, the right or ability of Mexican or foreign persons or entities to convert Mexican pesos into U.S. dollars or to transfer other currencies out of Mexico, the Mexican government could impose restrictive exchange rate policies or exchange controls in the future, as it has done in the past. Currency fluctuations may have an adverse effect on our financial position, results and cash flows in future periods. When the financial markets are volatile, as they have been in recent periods, our results may be substantially affected by variations in exchange rates and commodity prices and, to a lesser degree, interest rates. These effects include foreign exchange gain and loss on assets and liabilities denominated in U.S. dollars, fair value gain and loss on derivative financial instruments, commodities prices and changes in interest income and interest expense. These effects can be much more volatile than our operating performance and our operating cash flows.
The Mexican government exercises significant influence over the economy, and we face the risk of change in law.
The Mexican government has and is increasingly seeking to exert additional influence over the Mexican economy. Policies implemented by the Mexican government, changes in law and structural reforms may have a significant effect on Mexican private business, assets and securities. In the past, no party had a majority in Mexico’s congress, and congressional opposition hampered the passage of laws and reforms. As of the date of this prospectus, the president’s political party and its allies hold a qualified majority in the Chamber of Deputies and the Senate and a strong influence in various local legislatures. The increased influence of the executive branch increases the risk of unexpected changes in law and policy.
Security risks in Mexico could increase, and this could adversely affect our results.
Mexico continues to experience high levels of violence and crime due to, among other factors, the activities of organized crime. Despite the measures adopted by the Mexican government, organized crime (especially drug-related crime) continues to exist and operate in Mexico. These activities, their possible escalation and the violence associated with them have had and may have a negative impact on the Mexican economy or on our operations in the future. The presence of violence among drug cartels, and between these and the Mexican law enforcement and armed forces, or an increase in other types of crime, pose a risk to our business, and might negatively impact business continuity.
High crime rates throughout Mexico could negatively our sales and operations. We and our personnel are exposed to safety threats such as theft, assault or destruction of property. Additionally, our fleet and the merchandise it transports is subject to an increased risk of theft, particularly on Mexican highways. Although we have established measures to mitigate these risks and recover stolen goods, criminal events, could negatively influence business by reducing the flow of customers to our stores if the area is deemed or perceived to be unsafe and may disrupt our supply chain and increase our operating, logistics and safety costs.
Changes in global trade policy could adversely affect our business.
Political leaders in the United States and in other countries have been elected on protectionist platforms, fueling doubts about the future of global free trade. The U.S. government has indicated its intent to alter its approach to international trade policy and in some cases to renegotiate, or potentially terminate, certain existing bilateral or multi-lateral trade agreements and treaties with foreign countries, and has made proposals and taken actions related thereto. In addition, the U.S. government has recently imposed tariffs on certain foreign goods, including steel and aluminum and has indicated a willingness to impose tariffs on imports of other products, including a 25% tariff on all imports from Mexico. Some foreign governments, including China, have instituted retaliatory tariffs on certain U.S. goods and have indicated a willingness to impose additional tariffs on U.S. products. Other countries, including Mexico, have threatened retaliatory tariffs on certain U.S. products. Global trade disruption, significant introductions of trade barriers and bilateral trade frictions, together with any future downturns in the global economy resulting therefrom, could adversely affect our financial performance. In particular, the United States, Mexico and Canada renegotiated the North American Free Trade Agreement. Under the successor USMCA, several provisions were renegotiated and the extent to which they will affect the Mexican economy is still uncertain. There can be no assurance that the USMCA will not be renegotiated, or its terms will continue to drive growth in Mexico, or that
43
U.S. and Mexico trade relations will not deteriorate leading to further imposition of trade barriers. Any trade dispute between the United States and Mexico may have negative effects on the Mexican economy, the exchange rate, inflation and economic prospects, which will in turn negatively affect our business and results of operations.
High inflation rates may adversely affect our financial condition and results of operations.
The current inflation rate in Mexico is higher than the inflation rates of its most important commercial partners, including the United States and Canada. High inflation rates could adversely affect our business and financial condition and our results of operations. Mexico has a history of high levels of inflation and may experience high inflation in the future. Historically, inflation in Mexico has led to higher interest rates, depreciation of the Mexican peso and the imposition of substantial government controls over prices. The annual rate of inflation for the last three years, as measured by changes in the Mexican National Consumer Price Index (Índice Nacional de Precios al Consumidor), as provided by INEGI and as published by the Mexican Central Bank, was 7.4% in 2021, 7.8% in 2022 and 4.7% in 2023. If Mexico experiences high levels of inflation as it has in the past, these might adversely affect our operations and financial performance.
Furthermore, geopolitical developments, such as the Russia-Ukraine conflict and global supply chain disruptions continue to increase uncertainty in the outlook of near-term and long-term economic activity, including whether inflation will continue and how long, and at what rate. Increases in inflation raise our costs for commodities, labor, materials and services and other costs required to grow and operate our business, and failure to secure these on reasonable terms may adversely impact our financial condition. Additionally, increases in inflation, along with geopolitical developments and global supply chain disruptions, have caused, and may in the future cause, global economic uncertainty and uncertainty about the interest rate environment, which may make it more difficult, costly or dilutive for us to secure additional financing. A failure to adequately respond to these risks could have a material adverse impact on our financial condition, results of operations or cash flows.
Risks Relating to this Offering and Our Class A Common Shares
Our principal shareholder, Bolton Partners Ltd., owns all of our Class B common shares and a portion of our Class C common shares, which in the aggregate will represent approximately 44.9% of the voting power of our common shares immediately following this offering and will therefore exercise significant influence over all matters requiring shareholder approval, which will limit or preclude your ability to influence corporate matters.
Each Class A common share, which are the shares being sold in this offering, entitles its holder to one vote per share, each Class C common share entitles its holder one vote per share and each Class B common share entitles its holder to 15 votes per share, so long as the total number of the issued and outstanding Class B common shares represents at least 1.0% of the aggregate number of the aggregate common shares of the Issuer then outstanding.
Immediately following this offering, our principal shareholder will own all of our Class B common shares and a portion of our Class C common shares, representing approximately 44.9% of the voting power and 9.8% of the total number of our outstanding common shares, and will therefore have significant influence over matters requiring shareholder approval. However, the foregoing does not include Class C common shares that will be held by our principal shareholder and our directors and officers in respect of both unvested and vested (but currently unexercisable) stock options or delayed-delivery awards or allocations under the Liquidity Event Share Plan and the Bolton Partners Share Allocation, as applicable. Taking into account such Class C common shares, which our principal shareholder, directors and officers will be entitled to receive at later dates, and assuming net settlement at their respective strike prices, our principal shareholder would beneficially own approximately 43.6% of the combined voting power of our outstanding common shares following this offering. See “Principal Shareholders” and “Selling Shareholders.”
As a result, and for so long as our principal shareholder continues to beneficially own a sufficient number of Class B common shares and Class C common shares, our principal shareholder will have significant influence over the outcome of all decisions taken by our shareholders. Our principal shareholder will also be able to significantly influence our actions in areas such as business strategy, financing, distributions, acquisitions and dispositions of assets or businesses. For example, our principal shareholder’s significant influence may cause us to make acquisitions that increase the amount of our indebtedness or outstanding Class A common shares or inhibit
44
change of control transactions that benefit other shareholders. Our principal shareholder’s decisions on these matters may be contrary to your expectations, preferences, or interests. Our principal shareholder may be able to prevent any other shareholder, including you, from blocking these actions. Our multiple class capital structure and our staggered board of directors may also limit the ability of others to acquire control. For more information, see “Description of Share Capital—Voting Rights” and “Management—Board of Directors.”
Our Class A common shares may not be a suitable investment for all investors, as an investment in our Class A common shares presents risks and the possibility of financial losses.
The investment in our Class A common shares is subject to risks. Investors who wish to invest in our Class A common shares are subject to asset losses, including loss of the entire value of their investment, as well as other risks, including those related to our Class A common shares, us, the sector in which we operate, our shareholders and the general macroeconomic environment in Mexico, among other risks.
Each potential investor in our Class A common shares must therefore determine the suitability of that investment in light of its own circumstances. In particular, each potential investor should:
We may elect to raise additional capital in the future by issuing securities or may enter into corporate transactions with an effect similar to a merger, which may dilute your interest in our shares and affect the trading price of our Class A common shares.
We may elect to raise additional funds to grow our business and implement our growth strategy through public or private issuances of common shares or securities convertible into, or exchangeable for, our Class A common shares, including by using Class A common shares as acquisition consideration. Any such event may dilute your interest in our share capital or result in a decrease in the market price of our Class A common shares. In addition, we may also enter into mergers or other similar transactions in the future, which may dilute your interest in our shares or result in a decrease in the market price of our Class A common shares. Any fundraising through the issuance of shares or securities convertible into or exchangeable for our Class A common shares, or the participation in corporate transactions with an effect similar to a merger, may dilute your interest in our capital stock or result in a decrease in the market price of our Class A common shares.
We do not anticipate paying any cash dividends in the foreseeable future.
We currently intend to retain our future earnings, if any, for the foreseeable future, to fund the operation of our business and future growth. Accordingly, we do not anticipate paying any cash dividends to holders of our Class A common shares. As a result, capital appreciation in the price of our Class A common shares, if any, will be your only source of gain on an investment in our Class A common shares. The declaration, payment and amount of any future dividends will be made at the discretion of our board of directors and will depend upon, among other things, the results of operations, cash flows and financial condition, operating and capital requirements, and other factors as our board of directors considers relevant. In addition, our holding company structure makes us dependent on the operations of our subsidiaries. There is no assurance that future dividends will be paid, and if dividends are paid, there is no assurance with respect to the amount of any such dividend. See “Dividends and Dividend Policy.”
45
Class A common shares eligible for future sale, or the perception that there may be future sales of Class A common shares, may cause the market price of our Class A common shares to drop significantly.
The market price of our Class A common shares may decline as a result of sales of a large number of our Class A common shares in the market, by our principal shareholder or our existing shareholders after this offering or the perception that these sales may occur. These sales, or the possibility that these sales may occur, also might make it more difficult for us to sell equity securities in the future at a time and at a price that we deem appropriate.
Following the completion of this offering, we will have outstanding 56,209,677 Class A common shares (or 58,834,677 Class A common shares, if the underwriters exercise in full their option to purchase additional shares from the selling shareholders), 5,200,000 Class B common shares and 52,791,075 Class C common shares (or 50,466,075 Class C common shares, if the underwriters exercise in full their option to purchase additional shares from the selling shareholder). Our Class A common shares sold in this offering will be freely tradable without restriction or further registration under the Securities Act by persons other than our affiliates within the meaning of Rule 144 of the Securities Act.
Our existing shareholders or entities controlled by them or their permitted transferees are, pursuant to the lock-up provisions of our memorandum and articles of association described below and certain other transfer restrictions, unable to sell their Class B common shares or Class C common shares or convert those shares into Class A common shares for sale in the public market for the duration of the Liquidity Lock-up Period, other than pursuant to registration rights in connection with other possible follow-on offerings. If any of our shareholders, the affiliated entities controlled by them or their respective permitted transferees were to sell a large number of their Class A common shares pursuant to their registration rights, the market price of our Class A common shares may decline significantly. In addition, the perception in the public markets that sales by them might occur may also cause the trading price of our Class A common shares to decline.
Our memorandum and articles of association provide that the holders of Class B common shares and Class C common shares, subject to certain exceptions, in connection with additional follow-on offerings, if requested by the requisite shareholders, may not directly or indirectly offer, sell, contract to sell, pledge, grant any option to purchase, make any short sale or otherwise dispose of any Class A common shares, Class B common shares or Class C common shares, or any options or warrants to purchase any such shares, or any securities convertible into, exchangeable for or that represent the right to receive such shares for the duration of the Liquidity Lock-Up Period.
Sales of a substantial number of our Class A common shares upon expiration of the lock-up provisions of our memorandum and articles of association, the perception that such sales may occur, could cause the market price of our Class A common shares to fall or make it more difficult for you to sell your Class A common shares at a time and price that you deem appropriate.
Our multiple class capital structure means our Class A common shares are not included in certain indices. We cannot predict the impact this may have on the trading price of our Class A common shares.
We cannot predict whether our multiple class capital structure, combined with the concentrated control of our company will result in a lower or more volatile market price of our Class A common shares or in adverse publicity or other adverse consequences. FTSE Russell, S&P Dow Jones and MSCI announced changes to their eligibility criteria for the inclusion of shares of public companies on certain indices, namely, to exclude companies with multiple classes of common shares. FTSE Russell requires greater than five percent of the company’s voting rights (aggregated across all of its equity securities, including, where identifiable, those not listed or trading) in the hands of public shareholders whereas S&P Dow Jones announced that companies with multiple share class structures, such as ours, will not be eligible for inclusion in the S&P 500, S&P MidCap 400 and S&P SmallCap 600, which together comprise the S&P Composite 1500. MSCI also announced its review of no-vote and multi-class structures and temporarily barred new multi-class listings from its ACWI Investable Market Index and U.S. Investable Market 2500 Index. We cannot guarantee that other stock indices will not take a similar approach to FTSE Russell, S&P Dow Jones and MSCI in the future. Pursuant to these policies, our multiple class capital structure makes our Class A common shares ineligible for inclusion in such indices and mutual funds, exchange-traded funds and other investment vehicles that attempt to passively track these indices will not invest in our stock. Any such exclusion from indices could result in a less active trading market for our Class A common shares and
46
depress the valuations of publicly traded companies excluded from the indices compared to those of similar companies that are included. In addition, several shareholder advisory firms have announced their opposition to the use of multiple share class structures. As a result, our multiple class capital structure may cause shareholder advisory firms to publish negative commentary about our corporate governance practices or otherwise seek to cause us to change our capital structure. Any actions or publications by shareholder advisory firms critical of our corporate governance practices or capital structure could also adversely affect the value of our Class A common shares.
Our holding company structure makes us dependent on the operations of our subsidiaries.
The Issuer is a company limited by shares incorporated under the laws of the British Virgin Islands. The Issuer operates as a holding company and, accordingly, our material assets are our direct and indirect equity interests in our subsidiaries. The Issuer is therefore dependent upon the results of operations and, in turn, the payments, dividends and distributions from our subsidiaries for funds to pay our holding company’s operating and other expenses and to pay future cash dividends or distributions, if any, to holders of our Class A common shares, and we may have tax costs in connection with any dividend or distribution. In addition, the payments, dividends and distributions from our subsidiaries to us for funds to pay future cash dividends or distributions, if any, to holders of our Class A common shares, could be restricted under financing arrangements that we or our subsidiaries may enter into in the future and we and such subsidiaries may be required to obtain the approval of lenders to make such payments to us in the event they are in default of their repayment obligations. Under Mexican law, our Mexican subsidiary may only pay dividends, if among other things, any existing losses applicable to prior years have been made up or absorbed into shareholders equity and after at least 5% of net profits for the relevant fiscal year have been allocated to a legal reserve until the amount of the reserve equals 20% of a company’s paid-in capital stock. If we or our Mexican subsidiary fail to comply with the requirements to pay dividends under Mexican law, we may not be able to make distributions to our shareholders or service our debt obligations, which could ultimately have a material adverse effect on us.
If securities or industry analysts do not publish research, or publish inaccurate or unfavorable research, about our business, the price of our Class A common shares and their trading volume could decline.
The trading market for our Class A common shares will depend in part on the research and reports that securities or industry analysts publish about us or our business. If no or too few securities or industry analysts cover our company, the trading price for our Class A common shares would likely be negatively affected. If one or more of the analysts who cover us downgrade our Class A common shares or publish inaccurate or unfavorable research about our business, the price of our Class A common shares would likely decline. If one or more of these analysts cease coverage of our company or fail to publish reports on us regularly, demand for our Class A common shares could decrease, which might cause the price of our Class A common shares and their trading volume to decline.
As a foreign private issuer, we have different disclosure and other requirements than U.S. domestic registrants.
As a foreign private issuer, we are subject to different disclosure and other requirements than domestic U.S. registrants. For example, as a foreign private issuer, in the United States, we are not subject to the same disclosure requirements as a domestic U.S. registrant under the U.S. Securities Exchange Act of 1934, as amended (the “Exchange Act”), including the requirements to prepare and issue quarterly reports on Form 10-Q or to file current reports on Form 8-K upon the occurrence of specified significant events, the proxy rules applicable to domestic U.S. registrants under Section 14 of the Exchange Act or the insider reporting and short-swing profit rules applicable to domestic U.S. registrants under Section 16 of the Exchange Act. In addition, we rely on exemptions from certain U.S. rules which permit us to follow British Virgin Islands legal requirements rather than certain of the requirements that are applicable to U.S. domestic registrants.
Furthermore, foreign private issuers are required to file their annual report on Form 20-F within 120 days after the end of each fiscal year, while U.S. domestic issuers that are accelerated filers are required to file their annual report on Form 10-K within 75 days after the end of each fiscal year. Foreign private issuers are also exempt from Regulation Fair Disclosure, aimed at preventing issuers from making selective disclosures of material information. As a result of the above, even though we are required to furnish reports on Form 6-K disclosing the limited information which we have made or are required to make public pursuant to British Virgin Islands law, or
47
are required to distribute to shareholders generally, and that is material to us, you may not receive information of the same type or amount that is required to be disclosed to shareholders of a U.S. company.
As a foreign private issuer, we are permitted to, and we rely on exemptions from certain corporate governance standards applicable to U.S. issuers, including the requirement that a majority of an issuer’s directors consist of independent directors. This may afford less protection to holders of our Class A common shares.
U.S. rules require listed companies to have, among other things, a majority of the members of their board of directors to be independent, and to have independent director oversight of executive compensation, nomination of directors and corporate governance matters. As a foreign private issuer, however, we are permitted to, and we follow home country practice in lieu of the above requirements. See “Description of Share Capital—British Virgin Islands Company Considerations”
We may lose our foreign private issuer status which would then require us to comply with the Exchange Act’s domestic reporting regime and cause us to incur significant legal, accounting and other expenses.
In order to maintain our current status as a foreign private issuer, either (a) more than 50% of our common shares must be either directly or indirectly owned of record by non-residents of the United States or (b)(1) a majority of our executive officers or directors may not be U.S. citizens or residents; (2) more than 50% of our assets must not be located in the United States; and (3) our business must be administered principally outside the United States. If we lose this status, we would be required to comply with the Exchange Act reporting and other requirements applicable to U.S. domestic issuers, which are more detailed and extensive than the requirements for foreign private issuers. We may also be required to make changes in our corporate governance practices in accordance with various SEC and New York Stock Exchange rules. The regulatory and compliance costs to us under U.S. securities laws if we are required to comply with the reporting requirements applicable to a U.S. domestic issuer may be significantly higher than the costs we will incur as a foreign private issuer.
An active trading market for our common shares may not be sustainable. If an active trading market is not maintained, investors may not be able to resell their shares at or above offering price and our ability to raise capital in the future may be impaired.
Although our Class A common shares are listed and traded on the New York Stock Exchange, there is no guarantee that an active trading market for our shares will be maintained. If such a market is not sustained, you may find it challenging to sell the Class A common shares you have purchased without negatively impacting the market price or being unable to sell them at all. Additionally, the absence of an active trading market could hinder our ability to raise capital for acquiring other companies or technologies by using our shares as consideration.
If the trading price of our Class A common shares fluctuates, you could lose a significant part of your investment.
The market price of our Class A common shares may be influenced by many factors, some of which are beyond our control, including:
48
In addition, the stock market in general has experienced substantial price and volume fluctuations that have often been unrelated or disproportionate to the operating performance of particular companies affected. These broad market and industry factors may materially harm the market price of our Class A common shares, regardless of our operating performance. In the past, following periods of volatility in the market price of certain companies’ securities, securities class action litigation has been instituted against these companies. This litigation, if instituted against us, could adversely affect our financial condition or results of operations. If a market is not maintained, the liquidity and price of our Class A common shares could be seriously harmed.
We have identified material weaknesses in our internal control over financial reporting and, if we fail to remediate such deficiencies (or identify and remediate any other material weaknesses) or otherwise fail to maintain an effective system of internal controls, we may be unable to accurately report our results of operations, meet our reporting obligations or prevent fraud. Any inability to report and file our financial results accurately and timely could harm our business and adversely impact the trading price of our securities.
Internal control over financial reporting is a process designed to provide reasonable assurance regarding the reliability of financial reporting and the preparation of financial statements in accordance with IFRS. A material weakness is defined as a deficiency, or a combination of deficiencies, in internal control over financial reporting, such that there is a reasonable possibility that a material misstatement of a company’s annual or interim financial statements will not be prevented or detected on a timely basis by the company’s internal controls.
Prior to our IPO, we were a private company and had limited accounting and financial reporting personnel and other resources with which to address our internal controls and procedures. As a privately held company, we were not required to evaluate our internal control over financial reporting in a manner that meets the standards of publicly traded companies required by Section 404(a) of the Sarbanes-Oxley Act of 2002 (the “Sarbanes-Oxley Act”). We are still in the process of implementing Internal Control-Integrated Framework (2013 Framework) issued by the Committee of Sponsoring Organizations of the Treadway Commission (“COSO”). However, in connection with the audit of our financial statements as of December 31, 2023 and 2022 and for the years ended December 31, 2023, 2022 and 2021 in accordance with the Public Company Accounting Oversight Board (“PCAOB”) standards, we identified material weaknesses in our internal control over financial reporting relating to the presentation of our consolidated financial statements under IFRS related to (i) our reliance on outside advisors for support and (ii) the segregation of duties related to our ERP system.
Following the identification of these material weaknesses, we have taken measures, and plan to continue to take additional measures, to remediate these issues. However, the implementation of these measures may not fully address the material weaknesses in our internal control over financial reporting that we have identified, and we cannot, as of the date of this prospectus, conclude that they have been fully remediated. Unless these material weaknesses are timely remediated, there is a risk that our internal control processes may not detect, or detect on a timely basis, misstatements in our financial statements or other financial reporting. As of the date of this prospectus, we have hired personnel that will reduce our dependence on third party advisors in respect of financial reporting matters. Additionally, we have staffed our internal control area to support the implementation of our internal control program and have worked actively during 2024 to implement a program of compliance with the Sarbanes-Oxley Act. We are currently aiming to remediate during 2025 the material weaknesses we have identified as part of this internal control program, implementing compensating mitigating controls.
Since our IPO, we have been subject to the reporting requirements under the Exchange Act and the Sarbanes-Oxley Act, as well as the rules and regulations of the SEC. Furthermore, once we have fully implemented Internal Control-Integrated Framework (2013 Framework) issued by COSO, and we perform an evaluation of internal controls over financial reporting under the Sarbanes-Oxley Act, we may identify further issues, including additional material weaknesses or control deficiencies. If we fail to maintain the adequacy of our internal control over financial reporting, as these rules and regulations are modified, supplemented, or amended from time to time, we may not be able to conclude on an ongoing basis that we have effective internal control over financial reporting in accordance with Section 404 of the Sarbanes-Oxley Act. In addition, even if our management concludes that our
49
internal control over financial reporting is effective, our independent registered public accounting firm, after conducting its own independent testing, may disagree with our assessment or may issue a report that is qualified if it is not satisfied with our internal controls or the level at which our controls are documented, designed, operated or reviewed, or if it interprets the relevant requirements differently from us. In addition, as a public company, our reporting obligations may place a significant strain on our management, operational and financial resources, and systems for the foreseeable future. We may be unable to timely complete our evaluation testing and any required remediation.
If we fail to achieve and maintain an effective internal control environment or remediate any identified material weaknesses and other deficiencies or discover and address future material weaknesses or deficiencies, we could suffer material misstatements in our financial statements, fail to meet our reporting obligations or fail to prevent fraud, which would likely cause investors to lose confidence in our reported financial information. This could, in turn, limit our access to capital markets, subject our Class A common shares to potential delisting from the New York Stock Exchange, harm our results of operations, or lead to a decline in the trading price of our Class A common shares.
Risks Relating to Investing in a British Virgin Islands Company
We are a British Virgin Islands company and it may be difficult for you to obtain or enforce judgments against us or our executive officers and directors in the United States.
The Issuer is incorporated under the laws of the British Virgin Islands. Most of our assets are located outside the United States. Furthermore, most of our directors and officers and the experts named in this prospectus reside outside the United States, and most of their assets are located outside the United States. As a result, you may find it difficult to effect service of process within the United States upon these persons or to enforce outside the United States judgments obtained against us or these persons in U.S. courts, including judgments in actions predicated upon the civil liability provisions of the U.S. federal securities laws. Likewise, it may also be difficult for you to enforce in U.S. courts judgments obtained against us or these persons in courts located in jurisdictions outside the United States, including actions predicated upon the civil liability provisions of the U.S. federal securities laws. It may also be difficult or impossible for an investor to bring an action in a British Virgin Islands court predicated upon the civil liability provisions of the U.S. federal securities laws against us or these persons.
As there is no treaty in force on the reciprocal recognition and enforcement of judgments in civil and commercial matters between the United States and the British Virgin Islands, courts in the British Virgin Islands will not automatically recognize and enforce a final judgment rendered by a U.S. court.
Any final and conclusive monetary judgment obtained against us in U.S. courts, for a definite sum, may be treated by the courts of the British Virgin Islands as a cause of action in itself so that no retrial of the issued would be necessary, provided that in respect of the U.S. judgment:
50
You may face difficulties in protecting your interests, and your ability to protect your rights through the U.S. federal courts may be limited, because the Issuer is incorporated in the British Virgin Islands.
The Issuer is a company incorporated under the laws of the British Virgin Islands. As a result, it may be difficult for investors to enforce judgments obtained in the United States courts against the Issuer or our directors or officers.
Our corporate affairs are governed by our memorandum and articles of association, the Companies Act and the common law of the British Virgin Islands. Under our memorandum and articles of association, we indemnify and hold our directors harmless against all claims and suits brought against them, subject to limited exceptions. Under our memorandum and articles of association, to the extent allowed by law, the rights and obligations among or between us, any of our current or former directors, officers and employees and any current or former shareholder are governed exclusively by the laws of the British Virgin Islands and subject to the exclusive jurisdiction of the British Virgin Islands courts, unless those rights or obligations do not relate to or arise out of their capacities as such. This exclusive jurisdiction may limit the shareholders’ ability to bring a claim against us in a jurisdiction that they consider favorable to them in disputes with us. In addition, it may be costlier for shareholders to present claims in the courts located in the British Virgin Islands, which could discourage such claims. Nevertheless, our shareholders will not be deemed to have waived their rights related to our compliance with U.S. federal securities laws and the rules and regulations thereunder applicable to foreign private issuers. Although there is doubt as to whether U.S. courts would enforce this provision in an action brought in the United States under U.S. securities laws, this provision could make enforcing judgments obtained outside the British Virgin Islands more difficult to enforce against our assets in the British Virgin Islands or jurisdictions that would apply British Virgin Islands law.
There may be less publicly available information about us than is regularly published by or about U.S. issuers. Also, the British Virgin Islands regulations governing the securities of British Virgin Islands companies are not as extensive as those in effect in the United States, and the British Virgin Islands law and regulations in respect of corporate governance matters may not be as protective of minority shareholders as state corporation laws in the United States. Therefore, you may have more difficulty protecting your interests in connection with actions taken by the Issuer, our directors and officers or our principal shareholder than you would as a shareholder of a corporation incorporated in the United States.
The rights of shareholders to take action against the directors, actions by minority shareholders and the statutory and fiduciary responsibilities of our directors to the Issuer under British Virgin Islands law are governed by the Companies Act and the common law of the British Virgin Islands. The common law of the British Virgin Islands is derived from English common law, and whilst the decisions of the English courts are of persuasive authority, they are not binding on a court in the British Virgin Islands. The rights of our shareholders and the statutory and fiduciary responsibilities of our directors under British Virgin Islands law may not be as clearly established as they would be under statutes or judicial precedent in some jurisdictions in the United States. In particular, the British Virgin Islands has a less developed body of securities laws as compared to the United States, and some states, such as Delaware, have more fully developed and judicially interpreted bodies of corporate law. In addition, while statutory provisions do exist in British Virgin Islands law for derivative actions to be brought in certain circumstances, such actions require the permission of a court in the British Virgin Islands and shareholders in British Virgin Islands companies may not have standing to initiate a shareholder derivative action in a federal court of the United States. The circumstances in which any such action may be brought, and the procedures and defenses that may be available in respect to any such action, may result in the rights of shareholders of a British Virgin Islands company being more limited than those of shareholders of a company organized in the United States. Accordingly, shareholders may have fewer alternatives available to them if they believe that corporate wrongdoing has occurred.
The British Virgin Islands courts are also unlikely:
51
As a result of all of the above, public shareholders may have more difficulty in protecting their interests in the face of actions taken by the Issuer, our board of directors, our management or our principal shareholder than they would as public shareholders of a U.S. company. For a discussion of certain differences between the provisions of the Companies Act, remedies available to shareholders and the laws applicable to companies incorporated in the United States and their shareholders, see “Description of Share Capital––British Virgin Islands Company Considerations.”
You may not be able to participate in future equity offerings, and you may not receive any value for rights that we may grant.
Under our memorandum and articles of association, holders of Class B common shares are entitled to preemptive rights in the event that additional Class A common shares are issued in order to maintain their proportional ownership interest. However, our memorandum and articles of association also provide that such preemptive subscription rights do not apply to certain issuances of securities by us, including (i) pursuant to any employee compensation plans; (ii) as consideration for (a) any merger, consolidation or purchase of assets or (b) recapitalization or reorganization; (iii) in connection with a pro rata division of shares or dividend in specie or distribution; or (iv) pursuant to any bona fide shareholder rights plan adopted by the Company, and holders of our Class B common shares are not entitled to the benefits of any redemption or sinking fund provisions.
We are required to comply with economic substance requirements in the British Virgin Islands.
The British Virgin Islands, together with several other non-European Union jurisdictions, have introduced legislation aimed at addressing concerns raised by the Council of the European Union as to offshore structures engaged in certain activities which attract profits without real economic activity. With effect from January 1, 2019, the Economic Substance (Companies and Limited Partnerships) Act, 2018 (as amended, the “ESA”) came into force in the British Virgin Islands introducing certain economic substance requirements for British Virgin Islands tax resident companies which are engaged in certain “relevant activities,” which in our case applies for financial years from 2019 onwards.
At present, the activities which are conducted by us would constitute holding business. Although it is presently anticipated that the ESA will have little material impact on us or our operations, as the legislation is new and remains subject to further clarification and interpretation it may not be possible to ascertain the precise impact of any legislative changes or changes in official guidance on us. We are required to make an annual filing with the British Virgin Islands International Tax Authority confirming if we carried out any “relevant activities” during the preceding financial period and, if so, providing certain prescribed information.
If our activities change or if the scope of the “relevant activities” is changed by subsequent legislation, we may be required to increase our substance in the British Virgin Islands to satisfy such requirements, which could result in additional costs that could adversely affect our financial condition or results of operations. If we were required to satisfy economic substance requirements in the British Virgin Islands but failed to do so, we could face financial penalties, restriction or regulation of our business activities and/or may be struck off as a registered entity in the British Virgin Islands or liquidated.
52
SPECIAL NOTE REGARDING FORWARD-LOOKING STATEMENTS
This prospectus contains or incorporates by reference forward-looking statements within the meaning of U.S. federal securities laws. You can identify these statements because they are not limited to historical fact or they use words such as “outlook,” “may,” “will,” “should,” “could,” “would,” “believe,” “anticipate,” “plan,” “expect,” “estimate,” “forecast,” “confident,” “opportunities,” “goal,” “prospect,” “positioned,” “intend,” “committed,” “continue,” “future,” “guidance,” “years ahead,” “looking ahead,” “going forward,” “focused on,” “will likely result,” “can,” “project,” “accelerate,” “schedule,” “on track,” “seek,” “ensure,” “potential,” “objective,” “focused on,” “predict,” “look to,” “likely to,” “scheduled to,” or “subject to” and similar expressions that concern our strategy, plans, intentions, initiatives, or beliefs about future occurrences or results.
Readers are cautioned not to place undue reliance on these forward-looking statements, which speak only as of the date on which they are made. There is no assurance that the expected events, trends or results will actually occur and we and the underwriters undertake no obligation to update publicly or revise any forward-looking statements and estimates whether as a result of new information, future events or otherwise.
Forward-looking statements include, but are not limited to, statements regarding our current belief or expectations as of the date of this prospectus and estimates on future events and trends that affect or may affect our business, financial condition, results of operations, liquidity, prospects and the trading price of our Class A common shares. Although such forward-looking statements are based on assumptions and information currently available to us, which we believe to be reasonable, none of the forward-looking statements, whether expressed or implied, are indicative of or guarantee future results. Given such limitations, you should not make any investment decision on the basis of the forward-looking statements contained herein.
All forward-looking statements are subject to risks, uncertainties and other factors (including, without limitation, those described under “Risk Factors”) that may cause our actual results to differ materially from those which we expected. Key factors that could cause actual results to differ materially from the expectations expressed in or implied by such forward-looking statements, include, but are not limited to:
53
We caution you that the foregoing list of significant factors may not contain all of the material factors that are important to you. In addition, in light of these risks and uncertainties, the matters referred to in the forward-looking statements contained or incorporated by reference in this prospectus may not in fact occur. Many of these risks are beyond our ability to control or predict. All forward-looking statements attributable to us or persons acting on our behalf are expressly qualified in their entirety by the cautionary statements contained throughout this prospectus.
We caution you that the important factors referenced above may not contain all of the factors that are important to you. We cannot assure you that we will realize the results or developments we expect or anticipate or, even if substantially realized, that they will result in the consequences or affect us or our operations in the way we expect. We undertake no obligation, and specifically disclaim any duty, to update or revise any forward-looking statement as a result of new information, future events or otherwise, except as may be required by law. As a result of these risks and uncertainties, we caution you not to place undue reliance on any forward-looking statements included herein or that may be made elsewhere from time to time by, or on behalf of, us.
54
USE OF PROCEEDS
We will not receive any proceeds from the sale of Class A common shares by the selling shareholders. The selling shareholders are selling all of the Class A common shares sold in this offering, including from any exercise by the underwriters of their options to purchase additional shares.
55
DIVIDENDS AND DIVIDEND POLICY
The amount of any dividends will depend on many factors, such as our results of operations, financial condition, cash requirements, prospects and other factors deemed relevant by our board of directors. We currently intend to retain all available funds and future earnings, if any, to fund the development and expansion of our business and we do not anticipate paying any cash dividends in the foreseeable future. Any future determination to pay dividends will be made at the discretion of our board of directors and will depend on various factors, including applicable laws, our results of operations, financial condition, cash requirements, future prospects and any other factors deemed relevant by our board of directors.
As a holding company, our ability to pay dividends depends on our receipt of cash dividends from our operating subsidiaries, which may further restrict our ability to pay dividends as a result of their respective jurisdictions of incorporation (including imposing legal restrictions on dividend distribution by subsidiaries), agreements of our subsidiaries or covenants under future indebtedness that we or they may incur. Our ability to pay dividends is therefore directly related to positive and distributable net results from our subsidiaries. See “Risk Factors—Risks Related to Our Business and Industry—Our holding company structure makes us dependent on the operations of our subsidiaries.” In 2023 and in 2024, we did not declare or pay any dividends.
Certain British Virgin Islands and Mexican Legal Requirements Related to Dividends
Dividends may only be paid in accordance with the provisions of our memorandum and articles of association and Section 57 of the British Virgin Islands Business Companies Act, 2004 (as amended) where the board of directors is satisfied on reasonable grounds that immediately after the payment of the dividend the value of the Issuer’s assets will exceed its liabilities and the Issuer will be able to pay its debts as they fall due. Pursuant to our memorandum and articles of association, all dividends unclaimed for three years after having been declared may be forfeited by a resolution of directors for the benefit of the Issuer. See “Description of Share Capital.”
Under Mexican law, subject to the satisfaction of certain quorum requirements, only shareholders at a general meeting have the authority to declare a dividend. Although not required by law, such declarations typically follow the recommendation of the board of directors. Additionally, under Mexican law, our Mexican subsidiary may only pay dividends if, among other things, any existing losses applicable to prior years have been made up or absorbed into shareholders’ equity and after at least 5% of net profits for the relevant fiscal year have been allocated to a legal reserve until the amount of the reserve equals 20% of a company’s paid-in capital stock.
The amount and payment of future dividends, if any, will be subject to applicable law and will depend upon a variety of factors that may be considered by our board of directors or our shareholders, including our future operating results, financial condition, capital requirements, investments in potential acquisitions or other growth opportunities, legal restrictions, contractual restrictions in our current and future debt instruments and our ability to obtain funds from our subsidiaries. Such factors may limit or prevent the payment of any future dividends and may be considered by our board of directors in recommending, or by our shareholders in approving, the payment of any future dividends.
56
CAPITALIZATION
The table below sets forth our current and non-current debt and lease liabilities, our total stockholders’ equity and total capitalization (defined as the sum of total debt and lease liabilities plus total stockholders’ equity) as of September 30, 2024, derived from our interim unaudited condensed consolidated financial statements as of September 30, 2024.
You should read this table in conjunction with “Presentation of Financial Information” “Use of Proceeds,” “Summary Financial Information,” “Management’s Discussion and Analysis of Financial Condition and Results of Operations,” our audited consolidated financial statements as of December 31, 2023 and 2022 and for the years ended December 31, 2023, 2022 and 2021, together with the notes thereto, incorporated by reference in this prospectus, and our unaudited interim condensed consolidated financial statements as of September 30, 2024 and for the three and nine months ended September 2024 and 2023, together with the notes thereto, in each case included elsewhere in this prospectus.
We will not receive any proceeds from the sale of Class A common shares by the selling shareholders, and accordingly, our total capitalization will not be impacted by such proceeds received by the selling shareholders. The expenses related to this offering that will be paid by the Company are not expected to be material to the Company.
As of September 30, |
| |||
(thousands of Ps.) |
| |||
Cash and cash equivalents | Ps. |
| 1,268,902 |
|
Current debt and lease liabilities: |
|
|
| |
Short-term debt |
|
| 915,377 |
|
Lease liabilities |
|
| 620,019 |
|
Non-current debt and lease liabilities: |
|
|
| |
Debt with related parties |
|
| — |
|
Long-term debt |
|
| 88,273 |
|
Lease liabilities |
|
| 6,690,227 |
|
Total debt and lease liabilities | Ps. |
| 8,313,896 |
|
Stockholders’ equity: |
|
|
| |
Capital stock |
|
| 8,283,347 |
|
Reserve for share-based payments |
|
| 1,247,755 |
|
Cumulative losses |
|
| (5,599,838 | ) |
Total stockholders’ equity | Ps. |
| 3,931,264 |
|
Total capitalization | Ps. |
| 12,245,160 |
|
There has been no material change to our capitalization since September 30, 2024 except for changes to the reserve for share-based payments in connection with the grant of stock options and RSUs on December 10, 2024, as described under "Prospectus Summary—Recent Developments—Option and RSU Grants." However, the full effect of such grants has not been fully determined since we expect to finalize our consolidated financial results as of and for the year ended December 31, 2024 after this offering is completed.
57
MANAGEMENT’S DISCUSSION AND ANALYSIS OF FINANCIAL CONDITION AND RESULTS OF OPERATIONS
This section contains or incorporates by reference forward-looking statements that involve risks and uncertainties. Our actual results and the timing of events may differ significantly from those expressed or implied in such forward-looking statements for several reasons, including those described under “Special Note Regarding Forward-Looking Statements” and “Risk Factors” and other issues discussed herein.
The following analysis and discussion of our financial condition and results of operations should be read in conjunction with our audited consolidated financial statements as of December 31, 2023 and 2022 and for the years ended December 31, 2023, 2022 and 2021, together with the notes thereto, incorporated by reference in this prospectus, and our unaudited interim condensed consolidated financial statements as of September 30, 2024 and for the three and nine months ended September 30, 2024 and 2023, together with the notes thereto, in each case included elsewhere in this prospectus, as well as the information set forth under “Presentation of Financial and Other Information” and “Summary Financial and Other Information.” Our consolidated financial statements are presented in thousands of Mexican pesos, except as otherwise specified.
Overview
We are pioneers and leaders of the grocery hard discount model in Mexico and one of the fastest growing retailers in the country as measured by our sales and store growth rates. From 2020 to 2023, our total revenue grew at a CAGR of 34.7%, reaching Ps.44.1 billion (US$2.2 billion) for 2023, and our number of stores increased from 1,249 as of year-end 2020 to 2,772 as of year-end 2024, which represents a CAGR of 22.1%. Our total revenue for the 12-month period ended September 30, 2024 was Ps.53.4 billion (US$2.7 billion), with a total of 2,772 stores in operation as of December 31, 2024.
Our business model is simple yet disruptive: we offer a limited assortment of products that cover the daily grocery needs of our clients. We price our products to offer what is generally market-leading value for money: the lowest sustainable price in the market for a given quality. Our stores also offer convenience, since they are generally located within central neighborhoods that allow for daily visits and minimize transportation needs for our customers. Our customers visit us on average three to four times per week to fulfill one or two days of groceries.
The Tiendas 3B product range consists of approximately 800 SKUs of branded, private label and spot products.
This discussion, which presents our results for the years ended December 31, 2023, 2022 and 2021 and for the nine months ended September 30, 2024 and 2023, should be read in conjunction with our audited consolidated financial statements as of December 31, 2023 and 2022 and for the years ended December 31, 2023, 2022 and 2021, incorporated by reference in this prospectus, together with the notes thereto, and our unaudited interim condensed consolidated financial statements as of September 30, 2024 and for the three and nine months ended September 30, 2024 and 2023, together with the notes thereto, in each case included elsewhere in this prospectus. We intend for this discussion to provide the reader with information that will assist in understanding our financial statements, the changes in certain key items in those financial statements from period to period and the primary factors that accounted for those changes. We also discuss certain performance metrics that management uses to assess our performance.
58
Principal Factors Affecting our Results of Operations and Material Trends
Overall economic trends. The overall economic environment and related changes in consumer behavior have a significant impact on our business. Given we focus on consumer staples, shifts in economic conditions may increase or decrease customer spending at our stores. While improvements in economic conditions generally lead to increased spending, our business model naturally hedges against downturns as consumers seek affordability during economically challenging times. When economic conditions improve, we tend to retain these captured customers as they appreciate our focus not only on price but also on quality. Macroeconomic factors that can affect customer spending patterns, and thereby our results of operations, include employment rates, inflation, business conditions, the availability of credit, interest rates, flow of remittances from abroad, tax rates and fuel and energy costs.
Product mix, consumer preferences and demand. Our ability to continue appealing to existing customers and attract new ones depends on our capacity to originate, develop, and offer a compelling product assortment of private labels and branded products that is aligned to customer preferences. Although most of our products are staples, misjudging the market for our products may result in excess inventories or lower sales, impacting our sales growth and profitability.
Materialization of infrastructure investment to support growth. Our historical operating results reflect the impact of our ongoing investments to support our growth, including store expansion investments as well as in our proprietary warehouse and distribution network. We have made significant investments in our business that we believe have laid the foundation for continued profitable growth. We believe that strengthening our management team and enhancing our information systems, including our regional management, will enable us to support our continued growth and allow scaling our profitable business model.
Effective sourcing and distribution of products. Our sales and gross profit are affected by our ability to purchase the products we sell in sufficient quantities at competitive prices. We believe our suppliers have adequate capacity to meet our current and anticipated demand, in part because we collaborate and coordinate closely with them on the development of new private label products. However, our suppliers’ ability to timely manufacture and deliver the products may be subject to various factors, including, among others, changes to the prices and flow of goods and ingredients, logistics disruptions, availability and cost of raw materials and labor disruptions. Any disruption in our supply chain could adversely affect our sales and profitability, including due to an inability to procure and stock sufficient quantities of merchandise to match market demand and our expansion plans resulting in lost sales.
Inflation and deflation trends. Our financial results can be directly impacted by substantial increases in product costs due to commodity cost increases or general inflation, which could lead to a reduction in our sales as well as greater margin pressure if costs cannot be passed on to consumers. To date, changes in general inflation have not materially impacted our business. In response to increasing general inflation, we seek to minimize the impact of such events by sourcing our merchandise from different vendors, changing our product mix and increasing our pricing when necessary.
Public Company Cost
Since our IPO, we have been required to comply with new laws, regulations and requirements that we did not need to comply with as a private company, including provisions of the Sarbanes-Oxley Act, other applicable SEC regulations and the requirements of the New York Stock Exchange. Compliance with the requirements of being a public company has required us to increase our administrative expenses in order to pay our employees, legal counsel and accounting advisors to assist us in, among other things, instituting and monitoring a more comprehensive compliance and board governance function, establishing and maintaining internal control over financial reporting in accordance with Section 404 of the Sarbanes-Oxley Act and preparing and distributing periodic public reports in compliance with our obligations under the federal securities laws. In addition, as a public company, it has been more expensive for us to obtain directors’ and officers’ liability insurance.
59
Components of Our Results of Operations
The following is a summary of the principal line items comprising consolidated statements of profit or loss.
Revenue from Sales of Merchandise
Revenue from sales of merchandise represents the sale of products to customers net of returns made by customers. Additionally, revenue from sales of merchandise includes net revenues earned from service fees and commissions collected from clients that make payments to third parties at our stores such as cell-phone providers and utilities.
Sales of Recyclables
Sales of recyclables includes sales of ancillary materials used in our day-to-day operations, such as cardboard and stretch film, net of costs of delivery of these products based on established contractual terms and conditions.
Cost of Sales
Cost of sales represents the cost of merchandise that is sold at our, stores including logistics costs incurred in bringing each product to the final point of sale and warehousing costs, as well as depreciation of properties, furniture, equipment and lease-hold improvements, right-of-use assets and shrinkage.
Gross Profit
Gross profit is equal to revenue from sales of merchandise and sales of recyclables net of cost of sales.
Sales Expenses
Sales expenses generally consist of expenses relating to our stores and the operation of our stores, including wages and salaries of store employees, depreciation of properties, furniture, equipment and lease-hold improvements and right-of-use assets, amortization of intangible assets, energy expenses, social security contributions relating to store employees, maintenance and conservation expenses and cash-in-transit services.
Administrative Expenses
Administrative expenses generally consist of expenses relating to headquarters, regional offices and the back office, including wages and salaries of administrative employees, depreciation, and amortization, energy, social security contributions of administrative employees, payments relating to options granted under our share-based compensation plan, administrative services, advertising expenses, corporate services, maintenance and conservation expenses and professional fees.
Other Income—Net
Other income includes a variety of income streams, including revenues from asset disposals, reimbursement of costs, and insurance proceeds, among others.
Operating Profit
Operating profit is equal to gross profit net of sales expenses, administrative expenses, plus other income— net.
Financial Income
Financial income is comprised of interest generated on accounts or investments held by us.
60
Financial Costs
Financial costs are comprised principally of interest on lease liabilities, promissory notes, convertible notes and the financing of transportation and store equipment, including through a reverse factoring arrangement we have entered into with Santander.
Exchange Rate Fluctuation
Foreign currency transactions are translated to the functional currency using the exchange rates in effect on the transactions dates. Gains and losses on exchange fluctuations resulting from such transactions and for conversion at the exchange rates at the end of the year of monetary assets and liabilities denominated in foreign currency are recognized as exchange rate fluctuation gain or loss. Exchange rate fluctuations for the nine months ended September 30, 2023 are primarily driven by changes in the carrying value of amounts payable under the Promissory Notes and the Convertible Notes, which were payable at maturity in U.S. dollars, but were repaid in full in 2024 with the proceeds of our IPO. Additionally, after our IPO, we keep U.S. dollars deriving from the IPO proceeds on our balance sheet, which also contributes to the exposure to exchange rate fluctuations.
Historical Results of Operations
For the Nine Months Ended September 30, 2024 compared to the Nine Months Ended September 30, 2023
| For the nine months ended |
|
| Variation |
| |||||||||
| 2024 |
|
| 2023 |
|
| (%) |
| ||||||
| (thousands of Ps.) |
|
|
|
| |||||||||
Revenue from sales of merchandise |
| Ps. |
| 41,014,985 |
|
| Ps. |
| 31,694,573 |
|
|
| 29.4 | % |
Sales of recyclables |
|
|
| 77,416 |
|
|
|
| 68,282 |
|
|
| 13.4 | % |
Total revenue |
|
|
| 41,092,401 |
|
|
|
| 31,762,855 |
|
|
| 29.4 | % |
Cost of sales |
|
|
| (34,414,213 | ) |
|
|
| (26,733,603 | ) |
|
| 28.7 | % |
Gross profit |
|
|
| 6,678,188 |
|
|
|
| 5,029,252 |
|
|
| 32.8 | % |
Sales expenses |
|
|
| (4,208,458 | ) |
|
|
| (3,431,030 | ) |
|
| 22.7 | % |
Administrative expenses |
|
|
| (1,426,551 | ) |
|
|
| (1,033,144 | ) |
|
| 38.1 | % |
Other income – net |
|
|
| 7,066 |
|
|
|
| 692 |
|
|
| 921.1 | % |
Operating profit |
|
|
| 1,050,245 |
|
|
|
| 565,770 |
|
|
| 85.6 | % |
Financial income |
|
|
| 109,501 |
|
|
|
| 20,510 |
|
|
| 433.9 | % |
Financial costs |
|
|
| (924,055 | ) |
|
|
| (1,007,868 | ) |
|
| (8.3 | )% |
Exchange rate fluctuation |
|
|
| 385,335 |
|
|
|
| 403,922 |
|
|
| (4.6 | )% |
Financial costs – net |
|
|
| (429,219 | ) |
|
|
| (583,436 | ) |
|
| (26.4 | )% |
Profit (loss) before income tax |
|
|
| 621,026 |
|
|
|
| (17,666 | ) |
| n.m. |
| |
Income tax expense |
|
|
| (263,033 | ) |
|
|
| (191,503 | ) |
|
| 37.4 | % |
Net profit (loss) for the period |
| Ps. |
| 357,993 |
|
| Ps. |
| (209,169 | ) |
| n.m. |
| |
Revenue from Sales of Merchandise
Revenue from sales of merchandise increased 29.4% to Ps.41,014,985 thousand for the nine months ended September 30, 2024 from Ps.31,694,573 thousand for the nine months ended September 30, 2023. Of the total increase in revenue from sales of merchandise, 34.7% was attributable to sales from 499 net new stores opened between October 1, 2023 and September 30, 2024, while 70.4% of the increase was attributable to increases in sales volume and a 5.1% reduction was attributable to lower prices due to shifts in the product mix. Same Store Sales for the nine months ended September 30, 2024 increased 13.2%.
61
Sales of Recyclables
Sales of recyclables increased 13.4% to Ps.77,416 thousand for the nine months ended September 30, 2024 from Ps.68,282 thousand for the nine months ended September 30, 2023. The increase was mainly driven by an increase in sales, offset by a decrease in the cardboard price per ton.
Cost of Sales
Cost of sales increased 28.7% to Ps.34,414,213 thousand for the nine months ended September 30, 2024 from Ps.26,733,603 thousand for the nine months ended September 30, 2023. The increase was attributable mainly to an increase in sales in existing stores and new stores and was proportional to the increase in revenue from sales of merchandise. Our cost of sales as a percentage of total revenue was 83.7% and 84.2% for the nine months ended September 30, 2024 and 2023, respectively.
Gross Profit
Gross profit increased 32.8% to Ps.6,678,188 thousand for the nine months ended September 30, 2024 from Ps.5,029,252 thousand for the nine months ended September 30, 2023, and our gross profit margin, calculated as gross profit as a percentage of total revenue, was 16.3% and 15.8% for the nine months ended September 30, 2024 and 2023, respectively.
Sales Expenses
Sales expenses increased 22.7% to Ps.4,208,458thousand for the nine months ended September 30, 2024 from Ps.3,431,030 thousand for the nine months ended September 30, 2023. Our sales expenses as a percentage of total revenue improved to 10.2% from 10.9% for the nine months ended September 30, 2024 and 2023, respectively. The increase in sales expenses remained proportional to the increase in revenue from sales of merchandise and largely derived from the opening of new stores, an increase in headcount required to operate new stores, and to the effects of inflation.
Administrative Expenses
Administrative expenses increased 38.1% to Ps.1,426,551 thousand for the nine months ended September 30, 2024 from Ps.1,033,144 thousand for the nine months ended September 30, 2023. Our administrative expenses, as a percentage of total revenue, were 3.5% and 3.3% for the nine months ended September 30, 2024 and 2023, respectively. The increase in administrative expenses was principally due to (i) the acquisition of top-tier talent to support our expansion efforts, (ii) expenses incurred in preparation for becoming a public company, (iii) higher regional office expenses in anticipation of the opening of new regions, and (iv) non-recurring fees, mainly related to our IPO. Expenses recognized in respect of grants under our share-based compensation plan during the nine months ended September 30, 2024 and 2023 were Ps.396,054thousand and Ps.302,438 thousand, respectively.
Other Income—Net
Other income – net increased 921.1% to Ps.7,066 thousand for the nine months ended September 30, 2024 from Ps.692 thousand for the nine months ended September 30, 2023.
Operating Profit
For the reasons described above, operating profit increased 85.6% to Ps.1,050,245 thousand for the nine months ended September 30, 2024 from Ps.565,770 thousand for the nine months ended September 30, 2023. Our operating profit, as a percentage of total revenue, was 2.6% and 1.8% for the nine months ended September 30, 2024 and 2023, respectively.
62
Financial Income
Financial income increased 433.9% to Ps.109,501 thousand for the nine months ended September 30, 2024 from Ps.20,510 thousand for the nine months ended September 30, 2023. The increase was primarily due to income earned from investing the net proceeds received from our IPO.
Financial Costs
Financial costs decreased 8.3% to Ps.924,055 thousand for the nine months ended September 30, 2024 from Ps.1,007,868 thousand for the nine months ended September 30, 2023. This decrease was primarily driven by the decreased interest expense related to the Promissory Notes and the Convertible Notes, which were repaid in February 2024, using a portion of the primary proceeds from our IPO, offset by an increase in the lease payments in connection with incremental lease agreements for our expanding store base of Ps.757,618thousand and Ps.526,566 thousand, during the nine months ended September 30, 2024 and 2023, respectively.
Exchange Rate Fluctuation
Exchange rate fluctuation was a gain of Ps.385,335 thousand for the nine months ended September 30, 2024, as compared to a gain of Ps.403,922 thousand for the nine months ended September 30, 2023. This change was primarily driven by the significant devaluation of the U.S. dollar against the Mexican peso during the nine months ended September 30, 2023, at which time we had a net exposure to U.S. dollar-denominated debt, resulting in a significant exchange rate fluctuation gain. In 2024, we repaid the promissory notes, denominated in U.S. dollars, using the IPO proceeds. Following our IPO, we now have a net positive exposure to U.S. dollars due to holding a substantial amount of financial assets in U.S. dollars. Since our IPO, the Mexican peso has depreciated against the U.S. dollar, contributing to a positive exchange rate fluctuation; however, the positive impact in 2024 was lower compared to the gain recorded in 2023. See Notes 8 and 14 to our interim unaudited condensed consolidated financial statements as of September 30, 2024, and for the nine months ended September 30, 2024 and 2023, for further information.
Financial Costs—Net
For the reasons described above, financial costs – net decreased 26.4% to Ps.429,219 thousand for the nine months ended September 30, 2024 from Ps.583,436 thousand for the nine months ended September 30, 2023.
Profit (Loss) Before Income Tax
For the reasons described above, profit before income tax was Ps.621,026 thousand for the nine months ended September 30, 2024 as compared to a loss before income tax of Ps.17,666 thousand for the nine months ended September 30, 2023.
Income Tax Expense
Income tax expense increased 37.4% to Ps.263,033 thousand for the nine months ended September 30, 2024 from Ps.191,503 thousand for the nine months ended September 30, 2023. This change was due to an increase in taxable profits in our subsidiaries, on which an increase in the annual income tax expense is expected to be recognized for the full financial year, which in turn, is partially offset by the estimated expenditure and the likely level of tax benefits on the effective tax rate for the full financial year.
Net Profit (Loss) for the Period
For the reasons described above, net profit was Ps.357,993 thousand for the nine months ended September 30, 2024 as compared to a net loss of Ps.209,169 thousand for the nine months ended September 30, 2023.
63
For the Year Ended December 31, 2023 compared to the Year Ended December 31, 2022
| For the year ended December 31, |
|
| Variation |
| |||||||||
| 2023 |
|
| 2022 |
|
| (%) |
| ||||||
| (thousands of Ps.) |
|
|
|
| |||||||||
Revenue from sales of merchandise |
| Ps. |
| 43,987,803 |
|
| Ps. |
| 32,472,577 |
|
|
| 35.5 | % |
Sales of recyclables |
|
|
| 90,656 |
|
|
|
| 107,820 |
|
|
| (15.9 | )% |
Total revenue |
|
|
| 44,078,459 |
|
|
|
| 32,580,397 |
|
|
| 35.3 | % |
Cost of sales |
|
|
| (37,038,542 | ) |
|
|
| (27,655,643 | ) |
|
| 33.9 | % |
Gross profit |
|
|
| 7,039,917 |
|
|
|
| 4,924,754 |
|
|
| 42.9 | % |
Sales expenses |
|
|
| (4,822,912 | ) |
|
|
| (3,460,840 | ) |
|
| 39.4 | % |
Administrative expenses |
|
|
| (1,386,929 | ) |
|
|
| (952,090 | ) |
|
| 45.7 | % |
Other (expense) income – net |
|
|
| (36,213 | ) |
|
|
| 8,445 |
|
|
| (528.8 | )% |
Operating profit |
|
|
| 793,863 |
|
|
|
| 520,269 |
|
|
| 52.6 | % |
Financial income |
|
|
| 26,069 |
|
|
|
| 19,840 |
|
|
| 31.4 | % |
Financial costs |
|
|
| (1,527,107 | ) |
|
|
| (1,168,786 | ) |
|
| 30.7 | % |
Exchange rate fluctuation |
|
|
| 606,270 |
|
|
|
| 264,930 |
|
|
| 128.8 | % |
Financial costs – net |
|
|
| (894,768 | ) |
|
|
| (884,016 | ) |
|
| 1.2 | % |
Loss before income tax |
|
|
| (100,905 | ) |
|
|
| (363,747 | ) |
|
| (72.3 | )% |
Income tax expense |
|
|
| (205,248 | ) |
|
|
| (201,363 | ) |
|
| 1.9 | % |
Net loss for the period |
| Ps. |
| (306,153 | ) |
|
|
| (565,110 | ) |
|
| (45.8 | )% |
Revenue from Sales of Merchandise
Revenue from sales of merchandise increased 35.5% to Ps.43,987,803 thousand for the year ended December 31, 2023 from Ps.32,472,577 thousand for the year ended December 31, 2022. Of the total increase in revenue from sales of merchandise, 18.9% was attributable to sales from 396 net new stores opened in 2023, while 57.2% of the increase was attributable to increases in sales volume and 23.9% of the increase was attributable to higher prices due to inflation and shifts in the product mix. Same Store Sales for the year ended December 31, 2023 increased 17.6%.
Sales of Recyclables
Sales of recyclables decreased 15.9% to Ps.90,656 thousand for the year ended December 31, 2023 from Ps.107,820 thousand for the year ended December 31, 2022. The decrease was mainly driven by a decrease in the cardboard price per ton, partially offset by an increase in higher sales.
Cost of Sales
Cost of sales increased 33.9% to Ps.37,038,542 thousand for the year ended December 31, 2023 from Ps.27,655,643 thousand for the year ended December 31, 2022. The increase was attributable mainly to an increase in sales in existing stores and new stores and was proportional to the increase in revenue from sales of merchandise. However, this increase was partially offset by better negotiations with suppliers resulting in a lower increase relative to the growth of revenue from sales of merchandise growth in the year ended December 31, 2022. Our cost of sales as a percentage of total revenue was 84.0% and 84.9% for the years ended December 31, 2023 and 2022, respectively.
Gross Profit
Gross profit increased 42.9% to Ps.7,039,917 thousand for the year ended December 31, 2023 from Ps.4,924,754 thousand for the year ended December 31, 2022, and our gross profit margin, calculated as gross profit as a percentage of total revenue, was 16.0% and 15.1% for the years ended December 31, 2023 and 2022, respectively.
64
Sales Expenses
Sales expenses increased 39.4% to Ps.4,822,912 thousand for the year ended December 31, 2023 from Ps.3,460,840 thousand for the year ended December 31, 2022. Our sales expenses as a percentage of total revenue, were 10.9% and 10.6% for the years ended December 31, 2023 and 2022, respectively. The increase in sales expenses was driven by the increase in the number of stores, as headcount expanded to operate new stores, plus the impact of wage inflation on labor costs.
Administrative Expenses
Administrative expenses increased 45.7% to Ps.1,386,929 thousand for the year ended December 31, 2023 from Ps.952,090 thousand for the year ended December 31, 2022. Our administrative expenses, as a percentage of total revenue, were 3.1% and 2.9% for the years ended December 31, 2023 and 2022, respectively. The increase in administrative expenses was principally due to option (i) grants under our share-based compensation plan, (ii) expenses incurred to meet our public company obligations, (iii) expenses related to expansion of operations to new regions during the year ended December 31, 2023 and (iv) other non-recurring expenses, principally relating to our IPO. We estimate that the increase in the volume of our operations will tend to stabilize certain administrative expenses such as those relating to IT systems, key executive personnel expenses and personnel expenses for roles such as category managers, IT and finance. Expenses recognized in respect of grants under our share-based compensation plan during the years ended December 31, 2023 and 2022 were Ps.384,566 thousand and Ps.303,789 thousand, respectively.
Other (Expense) Income -Net
Other (expense) income - net amounted to a net expense of Ps.36,213 thousand for the year ended December 31, 2023 as compared to net income of Ps.8,445 thousand for the year ended December 31, 2022. The increase in the net expense was mainly due to property damage caused by Hurricane Otis that resulted in an impairment loss.
Operating Profit
For the reasons described above, operating profit increased 52.6% to Ps.793,863 thousand for the year ended December 31, 2023 from Ps.520,269 thousand for the year ended December 31, 2022. Our operating profit, as a percentage of total revenue, were 1.8% and 1.6% for the years ended December 31, 2023 and 2022, respectively.
Financial Income
Financial income increased 31.4% to Ps.26,069 thousand for the year ended December 31, 2023 from Ps.19,840 thousand for the year ended December 31, 2022. The increase was primarily attributable to a higher interest gain on short-term investments and an increase in the gain on commissions from supplier finance arrangements.
Financial Costs
Financial costs increased 30.7% to Ps.1,527,107 thousand for the year ended December 31, 2023 from Ps.1,168,786 thousand for the year ended December 31, 2022. This increase was primarily driven by Ps.619,779 thousand and Ps.615,592 thousand in accrued interest on the Promissory Notes and Convertible Notes (which were repaid in full with the proceeds of our IPO) during the year ended December 31, 2023 and 2022, respectively, as well as the increased interest expense generated by increased lease liabilities, due to new lease agreements for our expanding store base of Ps.762,872 thousand and Ps.507,875 thousand, during the year ended December 31, 2023 and 2022, respectively.
Exchange Rate Fluctuation
Exchange rate fluctuation was a gain of Ps.606,270 thousand for the year ended December 31, 2023 as compared to a gain of Ps.264,930 thousand for the year ended December 31, 2022. This change was driven by the
65
significant appreciation of the Mexican peso against the U.S. dollar during the year ended December 31, 2023, which, in turn, impacted the carrying value of the Promissory Notes and the Convertible Notes (which were repaid in full with the proceeds of our IPO), which were denominated in U.S. dollars. See Notes 13 and 14 to our consolidated financial statements as of December 31, 2023 and 2022 and for the years ended December 31, 2023, 2022 and 2021, incorporated by reference in this prospectus, for further information.
Financial Costs-Net
For the reasons described above, financial costs - net increased 1.2% to Ps.894,768 thousand for the year ended December 31, 2023 from Ps.884,016 thousand for the year ended December 31, 2022.
Loss Before Income Tax
For the reasons described above, loss before income tax was Ps.100,905 thousand for the year ended December 31, 2023 as compared to a loss before income tax of Ps.363,747 thousand for the year ended December 31, 2022.
Income Tax Expense
Income tax expense increased 1.9% to Ps.205,248 thousand for the year ended December 31, 2023 from Ps.201,363 thousand for the year ended December 31, 2022. This change was due to an increase in taxable profits in our subsidiaries, on which an increase in the annual income tax expense was recognized for the full financial year, which, in turn, was partially offset by deferred income tax benefit for expected future tax deductions.
Net Loss for the Period
For the reasons described above, net loss was Ps.306,153 thousand for the year ended December 31, 2023 as compared to a net loss of Ps.565,110 thousand for the year ended December 31, 2022.
For the Year Ended December 31, 2022 compared to the Year Ended December 31, 2021
| For the year ended December 31, |
|
| Variation |
| |||||||||
| 2022 |
|
| 2021 |
|
| (%) |
| ||||||
| (thousands of Ps.) |
|
|
|
| |||||||||
Revenue from sales of merchandise |
| Ps. |
| 32,472,577 |
|
| Ps. |
| 23,032,275 |
|
|
| 41.0 | % |
Sales of recyclables |
|
|
| 107,820 |
|
|
|
| 58,906 |
|
|
| 83.0 | % |
Total revenue |
|
|
| 32,580,397 |
|
|
|
| 23,091,181 |
|
|
| 41.1 | % |
Cost of sales |
|
|
| (27,655,643 | ) |
|
|
| (19,655,090 | ) |
|
| 40.7 | % |
Gross profit |
|
|
| 4,924,754 |
|
|
|
| 3,436,091 |
|
|
| 43.3 | % |
Sales expenses |
|
|
| (3,460,840 | ) |
|
|
| (2,422,688 | ) |
|
| 42.9 | % |
Administrative expenses |
|
|
| (952,090 | ) |
|
|
| (623,874 | ) |
|
| 52.6 | % |
Other income - net |
|
|
| 8,445 |
|
|
|
| 4,524 |
|
|
| 86.7 | % |
Operating profit |
|
|
| 520,269 |
|
|
|
| 394,053 |
|
|
| 32.0 | % |
Financial income |
|
|
| 19,840 |
|
|
|
| 7,988 |
|
|
| 148.4 | % |
Financial costs |
|
|
| (1,168,786 | ) |
|
|
| (1,004,535 | ) |
|
| 16.4 | % |
Exchange rate fluctuation |
|
|
| 264,930 |
|
|
|
| (122,368 | ) |
|
| (316.5 | )% |
Financial costs - net |
|
|
| (884,016 | ) |
|
|
| (1,118,915 | ) |
|
| (21.0 | )% |
Loss before income tax |
|
|
| (363,747 | ) |
|
|
| (724,862 | ) |
|
| (49.8 | )% |
Income tax expense |
|
|
| (201,363 | ) |
|
|
| (91,812 | ) |
|
| 119.3 | % |
Net loss for the year |
| Ps. |
| (565,110 | ) |
| Ps. |
| (816,674 | ) |
|
| (30.8 | )% |
66
Revenue from Sales of Merchandise
Revenue from sales of merchandise increased 41.0% to Ps.32,472,577 thousand for 2022 from Ps.23,032,275 thousand for 2021. Of the total increase in revenue from sales of merchandise, 22.8% was attributable to sales from 392 net new stores in 2022, while 38.9% of the increase was attributable to increases in sales volume and 38.3% of the increase was attributable to higher prices due to inflation and shifts in the product mix. Same Store Sales for 2022 increased 21.9%.
Sales of Recyclables
Sales of recyclables increased 83.0% to Ps.107,820 thousand for 2022 from Ps.58,906 thousand for 2021. The increase was mainly driven by an increase in the sale of ancillary materials mainly due to an increase of revenue from the sales of merchandise which led to a higher volume of ancillary materials and operational enhancements in the collection of these materials from our stores.
Cost of Sales
Cost of sales increased 40.7% to Ps.27,655,643 thousand for 2022 from Ps.19,655,090 thousand for 2021. The increase was attributable mainly to the increase in sales in existing stores and new stores and was proportional to our increase in revenue from sales of merchandise. However, this increase was partially offset by administrative efficiencies from better negotiations with suppliers and better shrinkage control resulting in a lower increase relative to the growth of revenue from sales of merchandise growth in 2022. Our cost of sales as a percentage of total revenue was 84.9% and 85.1% in 2022 and 2021, respectively.
Gross Profit
Gross profit increased 43.3% to Ps.4,924,754 thousand for 2022 from Ps.3,436,091 thousand for 2021, and our gross profit margin, calculated as gross profit as a percentage of total revenue, was 15.1% and 14.9% in 2022 and 2021, respectively.
Sales Expenses
Sales expenses increased 42.9% to Ps.3,460,840 thousand for 2022 from Ps.2,422,688 thousand for 2021. Our sales expenses as a percentage of total revenue, were approximately flat at 10.6% and 10.5% in 2022 and 2021, respectively. The increase in sales expenses remained proportional to the increase in revenue from sales of merchandise and largely derived from the increase in the number of stores, as headcount expanded to operate new stores, plus the impact of wage inflation on labor costs.
Administrative Expenses
Administrative expenses increased 52.6% to Ps.952,090 thousand for 2022 from Ps.623,874 thousand for 2021. Our administrative expenses, as a percentage of total revenue, were 2.9% and 2.7% in 2022 and 2021, respectively. The increase in administrative expenses was principally due to option grants under our share-based compensation plan, but administrative expenses were otherwise in proportion to the growth in revenue from sales of merchandise from 2021 to 2022. We estimate that the increase in the volume of our operations will tend to stabilize certain administrative expenses such as those relating to IT systems, key executive personnel expenses and personnel expenses for roles such as category managers, IT and finance. Expenses recognized in respect of grants under our share-based compensation plan during 2022 and 2021 were Ps.303,789 thousand and Ps.142,123 thousand, respectively.
Other Income-Net
Other income - net increased 86.7% to an expense of Ps.8,445 thousand for 2022 from an expense of Ps.4,524 thousand for 2021. The increase was mainly driven by non-recurring sales of fixed assets.
67
Operating Profit
For the reasons described above, operating profit increased 32.0% to Ps.520,269 thousand for 2022 from Ps.394,053 thousand for 2021. Our operating profit, as a percentage of total revenue, was 1.6% in 2022 and 1.7% in 2021.
Financial Income
Financial income increased 148.4% to Ps.19,840 thousand for 2022 from Ps.7,988 thousand for 2021. The increase was primarily attributable to a higher interest gain on short-term investments.
Financial Costs
Financial costs increased 16.4% to Ps.1,168,786 thousand for 2022 from Ps.1,004,535 thousand for 2021. This increase was primarily driven by Ps.615,592 thousand and Ps.537,411 thousand in accrued interest on the Promissory Notes and Convertible Notes (which were repaid in full with the proceeds of our IPO) during 2022 and 2021, respectively, as well as the increased interest expense generated by increased lease liabilities, due to new lease agreements for our expanding store base of Ps.507,875 thousand and Ps.440,678 thousand, during 2022 and 2021, respectively.
Exchange Rate Fluctuation
Exchange rate fluctuation was a gain of Ps.264,930 thousand for 2022 as compared to a loss of Ps.122,368 thousand for 2021. This change was driven by the significant appreciation of the Mexican peso against the U.S. dollar during 2022, which, in turn, impacted the carrying value of the Promissory Notes and the Convertible Notes (which were repaid in full with the proceeds of our IPO), which are denominated in U.S. dollars. See Notes 13 and 14 to our audited consolidated financial statements as of December 31, 2023 and 2022 and for the years ended December 31, 2023, 2022 and 2021, incorporated by reference in this prospectus, for further information.
Financial Costs-Net
For the reasons described above, financial costs - net decreased 21.0% to Ps.884,016 thousand for 2022 from Ps.1,118,915 thousand for 2021.
Loss Before Income Tax
For the reasons described above, loss before income tax was Ps.363,747 thousand for 2022 as compared to a loss of Ps.724,862 thousand for 2021.
Income Tax Expense
Income tax expense increased 119.3% to Ps.201,363 thousand for 2022 from Ps.91,812 thousand for 2021. The increase was attributable to higher taxable profits, resulting from the increased revenue from sales of merchandise, an increase in non-deductible expenses and inflationary adjustments to tax profit. For 2022, we had a negative effective tax rate of 55.4%, as compared to a negative effective tax rate of 12.7% for 2021.
Net Loss for the Year
For the reasons described above, net loss was Ps.565,110 thousand for 2022 as compared to a net loss of Ps.816,674 thousand for 2021.
Seasonality
Since our products mostly consist of food staples, our sales are not generally affected by seasonality. Variations in our performance from quarter to quarter are generally a consequence of store openings and holidays. Therefore, the results for a given quarter may not be indicative of results expected for the entire year.
68
Liquidity and Capital Resources
The following discussion of our liquidity and capital resources is based on the financial information derived from our audited consolidated financial statements as of December 31, 2023 and 2022 and for the years ended December 31, 2023, 2022 and 2021, incorporated by reference in this prospectus, and our unaudited interim condensed consolidated financial statements as of September 30, 2024 and for the three and nine months ended September 30, 2024 and 2023, included elsewhere in this prospectus.
Overview
Liquidity represents our ability to generate sufficient cash flows from operating activities to meet our obligations as well as our ability to obtain appropriate financing.
As a result of our inventory and account payables management strategy, we generally rely on our positive cash flow dynamics as a source of financing for our operations and expansion. We have historically benefited from our working capital dynamic driven from our favorable payable terms relative to the high rotation of our inventory and minimal receivable balances, as most of our sales from merchandise are received in cash at the time of sale. As a result, we can generate a significant amount of negative working capital from such timing differences. Our negative working capital for 2022, 2023 and the nine months ended September 30, 2024 was Ps.3,205,200 thousand, Ps.4,558,781 thousand and Ps.2,138,451 thousand, respectively. As of December 31, 2023 and 2022, our total current assets amounted to Ps.4,393,160 thousand and Ps.3,599,202 thousand, respectively. As of September 30, 2024, our total current assets amounted to Ps.8,012,242 thousand.
We have also used certain amounts of short-term and long-term debt with related parties and third parties to supplement our cash flows. As of December 31, 2023 and 2022, our long-term debt with third parties consisted of Ps.577,318 thousand and Ps.540,734 thousand, respectively. As of September 30, 2024, our long-term debt consisted of Ps.88,273 thousand. In addition to financing from third parties, we issued several series of senior and junior U.S. dollar-denominated pay-in-kind Promissory Notes that would have matured on December 31, 2026, most of which were held by related parties, including some of our shareholders, and which were repaid in full in 2024 with the proceeds of our IPO. The aggregate principal amount and accrued interest outstanding on the Promissory Notes was US$261,057 thousand (Ps.4,410,166 thousand) as of December 31, 2023. We also issued Convertible Notes which were repaid in full in 2024 with the proceeds of our IPO. The aggregate principal amount and accrued interest outstanding on the Convertible Notes was US$22,494 thousand (Ps.380,002 thousand) as of December 31, 2023. See “—Indebtedness—Promissory Notes and Convertible Notes” for additional information.
In addition, we have entered into a reverse factoring arrangement with Banco Santander Mexico, S.A. (“Santander”) pursuant to which a participating supplier receives the original invoice amount discounted at an agreed rate, and we pay Santander the original amount of the invoice within 60 days after the supplier collects the invoice from Santander. The aggregate limit of amounts invoiced under this arrangement was Ps.350,000 thousand; however, on December 4, 2023, the Company increased the aggregate limit to Ps.500,000 thousand. Pursuant to the terms of this arrangement, we have created a trust, which is meant to be an alternative source of payment in the case of a payment default. Cash flows coming from 419 stores are deposited in a bi-weekly minimum aggregate amount of Ps.300,000 thousand in the trust account as a pass-through and released to Tiendas 3B treasury on a daily basis, as long as no payment default occurs. This trust serves as well as an alternative source of payment for the Revolving Credit Line of Ps.300,000 thousand the company contracted with Santander. See Note 3.8 to our audited consolidated financial statements as of December 31, 2023 and 2022 and for the years ended December 31, 2023, 2022 and 2021, incorporated by reference in this prospectus, for more information about this arrangement.
On June 2, 2023, we and HSBC Mexico, S.A. (“HSBC”) entered into a reverse factoring transaction (the “HSBC Supplier Finance Agreement”) and a credit facility (the “HSBC Credit Line,” and together with the HSBC Supplier Finance Agreement, the “HSBC Agreement”). The original aggregate principal amount financeable under the HSBC Agreement was Ps.450,000 thousand. This amount was increased to Ps.700,000 thousand on June 20, 2024. Pursuant to the terms of the HSBC Supplier Finance Agreement, participating suppliers may discount their invoices with HSBC, and they will receive the original invoice amount discounted at an agreed rate and we will then pay HSBC the original amount by the earlier of: (x) the date HSBC pays the supplier plus the number of credit days originally agreed to with the supplier, and (y) 90 days after the supplier collects the invoice from HSBC. The
69
supplier elects which invoices are entered into the factoring transaction. Once entered, such invoices are novated and the liability of the Company to cover such invoice is extinguished. Invoices that are not discounted with HSBC are payable to the supplier at the original maturity date. There are no commissions or interests payable to HSBC when invoices are discounted, and only an opening commission of Ps.2,250 thousand was paid for entering into the original agreement. In addition, under the terms of the HSBC Agreement, the Company must comply with certain covenants, including restrictions on dividends. Additionally, pursuant to the terms of the HSBC Agreement, we have created a trust, which is meant to be an alternative source of payment in the case of a payment default, into which Ps.540,000 thousand of cash flows have to be deposited (as a pass-through) on the trust each month. However, the deposits are released daily to Tiendas 3B so long as no payment default occurs.
We intend to increase our capital expenditures to support the growth in our business and operations. We believe that our existing cash and cash equivalents and the liquidity provided from other sources of funds will be sufficient to meet our anticipated cash needs for at least the next 12 months, considering our expected organic growth. Our future capital requirements and the adequacy of available funds will depend on many factors, including those described under “Risk Factors.” In addition, the impact of rising interest rates has adversely affected the cost of borrowing, hedging activities and access to capital in general, which could limit our ability to obtain financing or hedges in a timely manner, on acceptable terms or at all.
Cash Flows
The following table sets forth certain consolidated cash flow information for the periods indicated:
| For the nine months ended |
| ||||||||
| 2024 |
|
| 2023 |
| |||||
|
| (thousands of Ps.) |
| |||||||
Net cash flows provided by operating |
| Ps. |
| 2,378,208 |
|
| Ps. |
| 1,942,839 |
|
Net cash flows used in investing |
|
|
| (4,171,848 | ) |
|
|
| (901,193 | ) |
Net cash flows obtained from (used in) |
|
|
| 1,747,828 |
|
|
|
| (1,027,374 | ) |
Increase (decrease) in cash and cash |
|
|
| (45,812 | ) |
|
|
| 14,272 |
|
Effect of foreign exchange movements |
|
|
| 94,243 |
|
|
|
| 1,835 |
|
Net increase in cash and cash |
| Ps. |
| 48,431 |
|
| Ps. |
| 16,107 |
|
| For the Years Ended December 31, |
| |||||||||||||
| 2023 |
|
| 2022 |
|
| 2021 |
| |||||||
| (thousands of Ps.) |
|
|
|
|
| |||||||||
Net cash flows provided by |
| Ps. |
| 3,140,349 |
|
| Ps. |
| 2,116,335 |
|
| Ps. |
| 1,366,308 |
|
Net cash flows used in investing |
|
|
| (1,778,789 | ) |
|
|
| (1,111,350 | ) |
|
|
| (524,080 | ) |
Net cash flows used in financing |
|
|
| (1,095,692 | ) |
|
|
| (1,027,115 | ) |
|
|
| (450,241 | ) |
Increase (decrease) in cash and |
|
|
| 265,868 |
|
|
|
| (22,130 | ) |
|
|
| 391,987 |
|
Effect of foreign exchange |
|
|
| (30,373 | ) |
|
|
| 7,066 |
|
|
|
| (1,963 | ) |
Net increase (decrease) in cash |
| Ps. |
| 235,495 |
|
| Ps. |
| (15,064 | ) |
| Ps. |
| 390,024 |
|
70
Net Cash Provided by Operating Activities
Net cash provided by operating activities was Ps.2,378,208 thousand and Ps.1,942,839 thousand for the nine months ended September 30, 2024 and 2023, respectively. Net cash provided by operating activities for the nine months ended September 30, 2024 increased by Ps.435,369 thousand as compared to the nine months ended September 30, 2023, primarily driven by an increase in accounts payable to suppliers and a positive impact of loss before income tax. The foregoing was partially offset by interest payable on Promissory Notes and Convertible Notes.
Net cash provided by operating activities was Ps.3,140,349 thousand, Ps.2,116,335 thousand and Ps.1,366,308 thousand for the years ended December 31, 2023, 2022 and 2021, respectively. Net cash provided by operating activities for the year ended December 31, 2023 increased by Ps.1,024,014 thousand as compared to the year ended December 31, 2022, primarily driven by increase in accounts payable to suppliers, reflecting higher purchasing volumes due to 396 net new stores and higher sales from existing stores. The foregoing was partially offset by an increase in inventories primarily due to the same increase in sales volume, and a positive contribution from increased operating profit . Net cash provided by operating activities for the year ended December 31, 2022 increased by Ps.750,027 thousand as compared to the year ended December 31, 2021, primarily driven by an increase in accounts payable to suppliers and a positive impact of loss before income tax. The foregoing was partially offset by an increase in inventory balance due to the opening of 392 new stores and higher sales, and a positive contribution from increased operating profit.
Net Cash Used in Investing Activities
Net cash used in investing activities generally consists of expenses and capital expenditures to expand our number of stores and distribution centers, investments in our supply chain, including purchase and sale of property and equipment, and maintenance of existing stores.
Net cash used in investing activities was Ps.4,171,848 thousand for the nine months ended September 30, 2024, compared to net cash used in investing activities of Ps.901,193 thousand for the nine months ended September 30, 2023. Net cash used in investing activities increased by Ps.3,270,655 thousand for the nine months ended September 30, 2024 as compared to the nine months ended September 30, 2023, mainly as we expanded our store count by 499 net new store openings between October 1, 2023 and September 30, 2024 and two new distribution centers, leading to increased purchases of property and equipment and of cold rooms.
Net cash used in investing activities was Ps.1,778,789 thousand, Ps.1,111,350 thousand and Ps.524,080 thousand for the years ended December 31, 2023, 2022 and 2021 and 2020, Net cash used in investing activities increased by Ps.667,439 thousand for the year ended December 31, 2023 as compared to the year ended December 31, 2022, mainly as we expanded our store count by 396 net new store openings and three new distribution centers, one if which opened during 2023 and the other two opened in the first quarter of 2024, leading to increased purchases of property and equipment and of cold rooms. Net cash used in investing activities increased by Ps.587,270 thousand for the year ended December 31, 2022 as compared to the year ended December 31, 2021, mainly as we expanded our store count by 392 net new store openings and one new distribution center, leading to increased purchases of property and equipment and of cold rooms. We expect to continue to use cash to make expenditures to open new stores, renovate existing stores and distribution centers, acquire store equipment and transportation equipment and invest in software.
Net Cash Obtained from (Used in) Financing Activities
Net cash used in financing activities generally consists of transactions related to our short-term and long-term debt and financing obligations. Transactions with non-controlling interest shareholders are also classified as cash flows from financing activities.
Net cash obtained from financing activities was Ps.1,747,828 thousand for the nine months ended September 30, 2024 compared to net cash used in financing activities of Ps.1,027,374 thousand for the nine months ended September 30, 2023. Net cash obtained from financing activities varied by Ps.2,775,202 thousand for the nine months ended September 30, 2024 as compared to net cash used in financing activities for the nine months ended
71
September 30, 2023, mainly driven by the proceeds received from the initial public offering, partially offset by the repayment of all amounts outstanding under the Promissory Notes and the Convertible Notes, and the increase of lease payments due to our 499 net new store openings between October 1, 2023 and September 30, 2024 and the opening of two new distribution centers.
Net cash used in financing activities was Ps.1,095,692 thousand, Ps.1,027,115 thousand and Ps.450,241 thousand for the years ended December 31, 2023, 2022 and 2021, respectively. Net cash used in financing activities increased by Ps.68,577 thousand for the year ended December 31, 2023 as compared to the year ended December 31, 2022, mainly driven by an increase of lease payments due to 396 net new store openings and the three new distribution centers, one of which opened during 2023 and the other two opened in the first quarter of 2024, offset by an increase in transactions under our reverse factoring arrangement with Santander. Net cash used in financing activities increased by Ps.576,874 thousand for the year ended December 31, 2022 as compared to the year ended December 31, 2021, mainly driven by an increase of lease payments due to 392 net new store openings and the opening of three distribution centers, offset by an increase in transactions under our reverse factoring arrangement with Santander.
Capital Expenditures
We make, and expect to continue to make, capital expenditures for store openings, renovation of existing stores and distribution centers, acquisitions of store equipment and transportation equipment, and investments in software.
For the year ending December 31, 2025, we have budgeted capital expenditures of approximately Ps.3,650 million, including approximately Ps.2,550 million for opening new stores and approximately Ps.360 million for opening four new distribution centers, which will be funded through our operating activities. Our capital expenditures represented 4.0% and 3.0% of our total revenue in the nine months ended September 30, 2024 and 2023, respectively. Capital expenditures for the nine months ended September 30, 2024 and 2023 amounted to Ps.1,642 million and Ps.940 million, respectively. Our capital expenditures represented 4.1%, 3.4% and 2.3% of our total revenue in 2023, 2022 and 2021, respectively. Capital expenditures for the years ended December 31, 2023, 2022 and 2021 amounted to Ps.1,798 million, Ps.1,123 million and Ps.532 million, respectively.
We expect to fund our capital expenditures program with a combination of cash flows from operations and additional financing. We cannot assure you that we will generate sufficient cash flow from operations, or that we will have access to external financing sources, to adequately fund such or any future capital expenditures.
Indebtedness
Our indebtedness for borrowed money consists of promissory notes and convertible notes which we incurred to finance our expansion. Additionally, we have historically incurred limited amounts of third-party financing for our operations, which has been limited to supplier financing lines and financial leases of transportation and certain store equipment.
72
The table below sets forth selected information regarding our outstanding indebtedness corresponding to the Promissory Notes and the Convertible Notes (which were repaid in full with the proceeds of our IPO) as of December 31, 2023, 2022 and 2021. Variations in the aggregate amount of our indebtedness from period to period are primarily due to either increases in accrued interest payable on the Promissory Notes which, were payable in U.S. dollars, or to the issuance of the Convertible Notes, which were repaid in full with the proceeds of our IPO.
| As of September 30, |
|
| As of December 31, |
| |||||||||||||||
| 2024 |
|
| 2023 |
|
| 2022 |
|
| 2021 |
| |||||||||
| (thousands of Ps.) |
| ||||||||||||||||||
Senior Promissory Notes |
|
|
|
|
|
|
|
|
|
|
|
|
|
|
|
| ||||
Debt – Related parties |
| Ps. |
| — |
|
| Ps. |
| 4,158,458 |
|
| Ps. |
| 4,098,238 |
|
| Ps. |
| 3,815,332 |
|
Debt – Third parties |
|
|
| — |
|
|
|
| 20,454 |
|
|
|
| 20,158 |
|
|
|
| 18,767 |
|
Total |
| Ps. |
| — |
|
| Ps. |
| 4,178,912 |
|
| Ps. |
| 4,118,396 |
|
| Ps. |
| 3,834,099 |
|
2017 Junior Promissory Notes |
|
|
|
|
|
|
|
|
|
|
|
|
|
|
|
| ||||
Debt – Related parties |
| Ps. |
| — |
|
| Ps. |
| 179,245 |
|
| Ps. |
| 175,114 |
|
| Ps. |
| 161,591 |
|
Debt – Third parties |
|
|
| — |
|
|
|
| 34,142 |
|
|
|
| 33,355 |
|
|
|
| 30,779 |
|
Total |
| Ps. |
| — |
|
| Ps. |
| 213,387 |
|
| Ps. |
| 208,469 |
|
| Ps. |
| 192,370 |
|
2020 Junior Promissory Notes |
|
|
|
|
|
|
|
|
|
|
|
|
|
|
|
| ||||
Debt – Related parties |
| Ps. |
| — |
|
| Ps. |
| 2,749 |
|
| Ps. |
| 2,707 |
|
| Ps. |
| 2,520 |
|
Debt – Third parties |
|
|
| — |
|
|
|
| 15,118 |
|
|
|
| 14,890 |
|
|
|
| 13,863 |
|
Total |
| Ps. |
| — |
|
| Ps. |
| 17,867 |
|
| Ps. |
| 17,597 |
|
| Ps. |
| 16,383 |
|
Convertible Notes |
|
|
|
|
|
|
|
|
|
|
|
|
|
|
|
| ||||
Debt – Third parties |
| Ps. |
| — |
|
| Ps. |
| 380,002 |
|
| Ps. |
| 376,878 |
|
| Ps. |
| 346,719 |
|
Total |
| Ps. |
| — |
|
| Ps. |
| 380,002 |
|
| Ps. |
| 376,878 |
|
| Ps. |
| 346,719 |
|
Promissory Notes and Convertible Notes
Prior to our IPO, as part of our financing strategy, we incurred indebtedness pursuant to certain senior and junior U.S. dollar-denominated pay-in-kind promissory notes and pay-in-kind convertible notes, all of which were repaid in full with the proceeds of our IPO. The Promissory Notes and Convertible Notes contained substantially identical covenants, including relating to limitations on disposition of assets, restricted payments and incurrence of indebtedness, and were guaranteed by Tiendas BBB, S.A. de C.V., Tiendas Tres B, S.A. de C.V. and Desarrolladora Tres B, S.A. de C.V. (the “Guarantors”). As of the date of this prospectus, the Guarantors have merged into Tiendas Tres B, S.A. de C.V., with this entity surviving the merger.
Set forth below is a summary of the principal terms of the Promissory Notes, which were repaid in full with the proceeds of our IPO, and the Convertible Notes:
Senior Promissory Notes. On November 30, 2016, BBB Foods Inc. entered into a Senior Promissory Notes Agreement, pursuant to which BBB Foods Inc. issued U.S. dollar-denominated payment-in-kind promissory notes (the “Senior Promissory Notes”) in the aggregate principal amount of US$94,747,329 (Ps.1,669,401 thousand) with an original maturity date of November 30, 2022, which was later extended to May 31, 2024 and then to December 31, 2026 by the holders. The Senior Promissory Notes accrued interest at a rate of 14% per annum with a default interest rate of 5% per annum. Interest on the Senior Promissory Notes was added to the outstanding principal amount thereof, such that the outstanding principal amount increased by an amount equal to the accrued interest. As of December 31, 2023, accrued interest contractually outstanding on the Senior Promissory Notes was US$152,620,740 (Ps.2,578,298 thousand). The aggregate principal amount and all accrued interest on the Senior Promissory Notes was payable on the maturity date. 99.5% of the aggregate principal amount of the Senior Promissory Notes was held by related parties of the Issuer, including certain of its shareholders, and the remaining 0.5% was held by third parties. The Senior Promissory Notes were guaranteed by the Guarantors pursuant to a guarantee agreement dated November 20, 2020. As consideration for the Senior Promissory Note holders’ agreement to extend the maturity from May 31, 2024 to December 31, 2026, we agreed to pay an additional
73
US$4,100,000 to the Senior Promissory Note holders on the date the Senior Promissory Notes were repaid with the proceeds of our IPO.
2017 Junior Promissory Notes. On August 9, 2017, BBB Foods Inc. entered into a Junior Promissory Notes Agreement, pursuant to which BBB Foods Inc. issued U.S. dollar-denominated payment-in-kind promissory notes (the “2017 Junior Promissory Notes”) in the aggregate principal amount of US$5,000,000 (Ps.88,098 thousand) with an original maturity date of November 30, 2022, which was later extended to May 31, 2024 and then to December 31, 2026 by the holders. The 2017 Junior Promissory Notes were subordinated and junior in right of payment to the Senior Promissory Notes. The 2017 Junior Promissory Notes accrued interest at a rate of 15% per annum with a default interest rate of 5% per annum. Interest on the 2017 Junior Promissory Notes was added to the outstanding principal amount thereof, such that the outstanding principal amount increased by an amount equal to the accrued interest. As of December 31, 2023, accrued interest contractually outstanding on the 2017 Junior Promissory Notes was US$7,631,284 (Ps.128,919 thousand). The aggregate principal amount and all accrued interest on the 2017 Junior Promissory Notes was payable on the maturity date. 84.0% of the aggregate principal amount of the 2017 Junior Promissory Notes was held by related parties of the Issuer, including certain of its shareholders and the remaining 16.0% is held by third parties. The 2017 Junior Promissory Notes were guaranteed by the Guarantors pursuant to a guarantee agreement dated November 20, 2020. As consideration for the 2017 Junior Promissory Note holders’ agreement to extend the maturity from May 31, 2024 to December 31, 2026, we agreed to pay an additional US$230,000 to the 2017 Junior Promissory Note holders on the date the 2017 Junior Promissory Notes were repaid with the proceeds of our IPO.
2020 Junior Promissory Notes. On June 30, 2020, BBB Foods Inc. entered into a Junior Promissory Notes Agreement, pursuant to which BBB Foods Inc. issued U.S. dollar-denominated payment-in-kind promissory notes (the “2020 Junior Promissory Notes” and, together with the 2017 Junior Promissory Notes, the “Junior Promissory Notes” and the Junior Promissory Notes, together with the Senior Promissory Notes, the “Promissory Notes”) in an aggregate principal amount of US$650,000 (Ps.11,453 thousand) with an original maturity date of June 30, 2023, which was later extended to May 31, 2024 and then to December 31, 2026 by the holders. The 2020 Junior Promissory Notes were subordinated and junior in right of payment to the Senior Promissory Notes. The 2020 Junior Promissory Notes accrued interest at a rate of 14% per annum with a default interest rate of 5% per annum. Interest on the 2020 Junior Promissory Notes was added to the outstanding principal amount thereof, such that the outstanding principal amount increased by an amount equal to the accrued interest. As of December 31, 2023, accrued interest contractually outstanding on the 2020 Junior Promissory Notes was US$407,613 (Ps.6,887 thousand). The aggregate principal amount and all accrued interest on the 2020 Junior Promissory Notes was payable on the maturity date. 15.4% of the aggregate principal amount of our 2020 Junior Promissory Notes was held by related parties of the Issuer, including certain of its shareholders and the remaining 84.6% is held by third parties. The 2020 Junior Promissory Notes were guaranteed by the Guarantors pursuant to a guarantee agreement dated November 20, 2020. As consideration for the 2020 Junior Promissory Note holders’ agreement to extend the maturity from May 31, 2024 to December 31, 2026, we agreed to pay an additional US$20,000 to the 2020 Junior Promissory Note holders on the date the 2020 Junior Promissory Notes were repaid with the proceeds of our IPO.
Convertible Notes. On November 20, 2020, BBB Foods Inc. entered into a Junior Convertible Promissory Note Agreement with LIV FD, S.A. de C.V., S.O.F.O.M., E.N.R., pursuant to which BBB Foods Inc. issued U.S. dollar-denominated convertible notes in an aggregate principal amount of US$15,000,000 (the “Convertible Notes”). The Issuer has issued two convertible notes under the facility. The first Convertible Note was issued on November 20, 2020 in an aggregate principal amount of US$7,500,000. The second Convertible Note was issued on February 3, 2021 in an aggregate principal amount of US$7,500,000. The Convertible Notes were subordinated and junior in right of payment to the Senior Promissory Notes. The Convertible Notes matured on November 20, 2026 and accrued interest at a rate of 14% per annum compounded quarterly. Interest on the Convertible Notes was added to the outstanding principal amount thereof, such that the outstanding principal amount increased by an amount equal to the accrued interest. The aggregate principal amount and all accrued interest on the Convertible Notes was payable on the maturity date. The Convertible Notes were guaranteed by the Guarantors pursuant to a guarantee agreement dated November 20, 2020. As of December 31, 2023, the contractual amounts payable under the Convertible Notes was US$22,830,216 (Ps.385,682 thousand), respectively.
Starting on May 25, 2025, and until the maturity date, the Convertible Notes were convertible into Class A common shares of the Issuer, at the option of the holder. The number of Class A common shares in which the
74
Convertible Notes were convertible was equal to the outstanding principal amount plus the amount of all accrued and unpaid interest at the time of the conversion, divided by the conversion price (US$86.25). The Convertible Notes were classified as a financial liability since there was no fixed conversion rate because they were denominated in U.S. dollars and the Issuer’s functional currency is the Mexico peso. Therefore, the conversion rate would have been determined depending on the exchange rate on the conversion date. Additionally, because the Convertible Notes were convertible at the option of the holder, the amount of principal and accrued interest from the incurrence of the debt until settlement was uncertain.
Quantitative and Qualitative Disclosures About Market Risk
We are exposed to a variety of risks in the ordinary course of our business, including, but not limited to, currency risk, liquidity risk and credit risk. We regularly assess each of these risks to minimize any adverse effects on our business as a result of those factors. See Note 5 to our to our audited consolidated financial statements as of December 31, 2023 and 2022 and for the years ended December 31, 2023, 2022 and 2021, incorporated by reference in this prospectus, and Note 4 to our to our interim unaudited condensed consolidated financial statements as of September 30, 2024 and for the three and nine months ended September 30, 2024 and 2023, for further discussion of our exposure to these risks.
Critical Accounting Policies and Estimates
Our financial statements are prepared in conformity with IFRS. In preparing our financial statements, we make assumptions, judgements and estimates about the carrying amounts of assets and liabilities that are not readily apparent from other sources. We base our estimates, assumptions and significant judgements on historical experience and other factors that we considered relevant. Actual results may differ from said estimates.
We reviewed our estimates, assumptions and significant judgments continuously. Our revisions to accounting estimates are recognized in the review period and future periods if the review affects both the current period and subsequent periods.
We disclose our significant accounting policies in the notes accompanying our consolidated financial statements included elsewhere in this prospectus.
Information on the judgments made in applying accounting policies that have significant effect on the amounts recognized in our consolidated financial statements are included in Note 4 to our audited consolidated financial statements as of December 31, 2023 and 2022 and for the years ended December 31, 2023, 2022, and 2021, incorporated by reference in this prospectus, and Note 3 to our to our interim unaudited condensed consolidated financial statements as of September 30, 2024 and for the three and nine months ended September 30, 2024 and 2023.
75
BUSINESS AND INDUSTRY
Overview
We are pioneers and leaders of the grocery hard discount model in Mexico and one of the fastest growing retailers in the country as measured by our sales and store growth rates. The 3B name, which references “Bueno, Bonito y Barato” – a Mexican saying which translates to “Good, Nice and Affordable”– summarizes our mission of offering irresistible value to budget savvy consumers through great quality products at bargain prices. From 2020 to 2023, our total revenue grew at a compounded annual growth rate (“CAGR”) of 34.7%, reaching Ps.44.1 billion (US$2.2 billion) for 2023, and our number of stores increased from 1,249 as of year-end 2020 to 2,772 as of year-end 2024, which represents a CAGR of 22.1%. Our total revenue for the 12-month period ended September 30, 2024 was Ps.53.4 billion (US$2.7 billion), with a total of 2,772 stores in operation as of December 31, 2024.
Our business model is simple yet disruptive: we offer a limited assortment of products that cover the daily grocery needs of our clients. We price our products to offer what is generally market-leading value for money: the lowest sustainable price in the market for a given quality. Our stores also offer convenience, since they are generally located within central neighborhoods that allow for daily visits and minimize transportation needs for our customers. Our customers visit us on average three to four times per week to fulfill one or two days of groceries.
The Tiendas 3B product range consists of approximately 800 SKUs of branded, private label and spot products.
Our stores serve low-to-middle income households, which according to the National Survey of Household Income and Expenditure conducted by INEGI in 2022, spent US$216 billion in 2023, or 70.7% of the Mexican population’s total current monetary spend, defined by INEGI as a households’ expenditure on food, beverages and tobacco, personal care, house cleaning products and over the counter healthcare products, among other categories other than rent and financial expenditures. We believe that our business model, which focuses on both value and convenience, allows us to serve our target market better than incumbent competitors and maintain real and sustainable competitive advantages.
Due to our low number of SKUs and focus on serving daily grocery needs, we have been able to achieve a high ratio of sales per SKU and a ratio of 3.1 Payable Days to Inventory Days during 2023. We are also able to benefit from a virtuous cycle, where the ever-increasing scale of our purchases per SKU allows us to negotiate increasingly lower prices with our suppliers and, in turn, we are able to transfer those savings to our customers, therefore increasing customer loyalty and our sales.
The Tiendas 3B business model is highly efficient, allowing us to operate with gross margins that are lower than those of leading grocery retailers in Mexico, based on publicly available information. The strength of our model is underpinned by our limited product assortment, our decentralized organization, and our culture that values efficiency and simplicity. Efficiency translates into savings that can be passed on to our customers.
76
Our management is decentralized and organized into regions, each run by a regional director, and built around a distribution center that serves approximately 150 (and up to 200) stores. Each region has sufficient functional resources to operate autonomously and efficiently. This structure, supported by nimble central headquarters, has enabled us to scale efficiently by allowing us to dynamically select new store locations in a constant pursuit of scale and expansion, while achieving positive gross and operating profit. Additionally, it enables suppliers to reach our decision makers quickly, fostering collaboration and accelerating the development of private label products.
Developing and retaining talent, as well as fostering a strong corporate culture, are key components of our business model and essential to sustaining our rapid growth rates and achieving efficiencies. We anticipate our personnel needs several years in advance and invest significant resources to ensure that we have the right talent at the right time.
We believe that the hard discount segment in Mexico has significant entry barriers for new participants, including: (i) the time and capital it takes to achieve scale and profitability given the inherent low gross margins of a hard discounter; (ii) the knowledge required to find competitive real estate and qualified personnel; (iii) the investment and know-how required to develop a meaningful private label product offering; and (iv) obtaining access to highly qualified senior management and experienced teams.
Our Business Model
Our business model is based on the following pillars:
77
Mexico Macroeconomic Environment and Demographic Overview
Macroeconomic Environment
Mexico: A large and growing economy with strong fundamentals
Mexico has maintained healthy macroeconomic fundamentals that offer a stable investment outlook conducive to long-term returns. With a GDP of US$1.8 trillion in 2023, Mexico ranked as the second largest economy in Latin America and the 12th largest in the world, according to the World Bank. Since 2010, Mexico has posted a real GDP annual average growth of 2.0% on the back of strong macro fundamentals such as controlled inflation (4.7% in 2023), low unemployment rates (2.6% in 2023), high trade openness index levels (66.6% in 2023), and robust foreign exchange reserves (US$214 billion in 2023).
Disciplined fiscal policy contributing to a stable environment for investors
Mexico’s disciplined fiscal policy also provides a stable backdrop for investment. For 2023, Mexico had a (1.5%) primary fiscal balance and public debt levels at 53% of GDP, which has enabled the country to maintain its investment grade credit ratings of Baa2/BBB/BBB- (Moody’s/S&P/Fitch).
Demographic Overview
Favorable demographics, with a young and expanding population
The grocery sector in Mexico is poised to benefit from demographic trends in Mexico, which has a large and rapidly growing young population. According to the latest data presented by INEGI in 2023, Mexico’s population reached 129 million people, making it the second most populous country in Latin America. From 2010 to 2023, Mexico had an average annual population growth rate of 1.0%. This rate was higher than those of Latin America, the US, and European Union, which experienced an average growth rate of 0.9%, 0.6%, and 0.1%, respectively over the same period, according to the World Bank. According to the Central Intelligence Agency World Factbook, in 2023 the average age in Mexico was 30.6 years, lower than the average age in Brazil (34.7), Chile (36.6) and the United States (38.5).
Mid and low socioeconomic segments are a major driving force in consumer spending
Mexico’s population is heavily concentrated in the low and mid-low socioeconomic segments (within the second to ninth income decile), representing 80.0% of the total population, according to INEGI. This segment of the population plays a crucial role in the economy, serving as a major driving force behind consumer spending and thus making it one of the largest and most attractive market segments for businesses. Our stores serve low-to-middle income households, which according to the National Survey of Household Income and Expenditure conducted by INEGI in 2022, spent US$216 billion in 2022, or 70.7% of the Mexican population’s total current monetary spend.
78
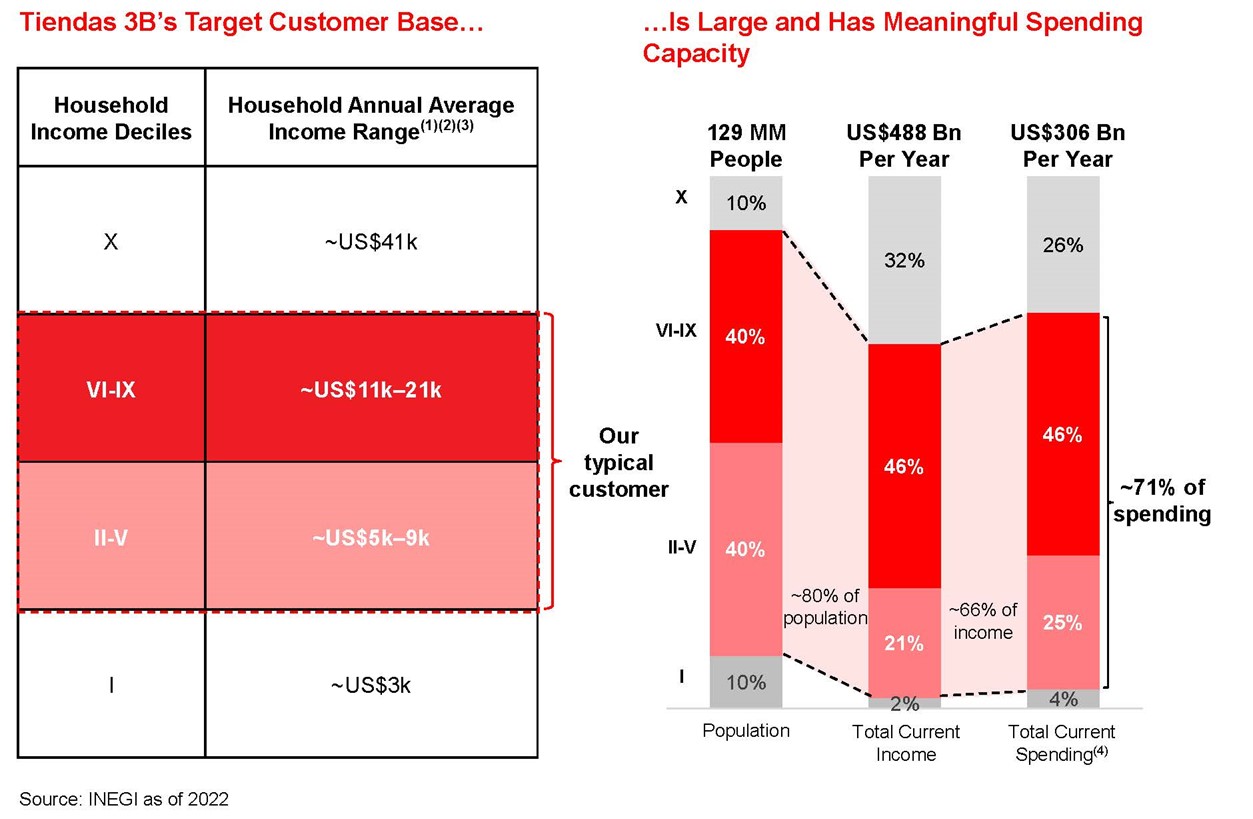
Notes:
1. 2. 3. | Considers an exchange rate of Ps.19.629 per US$1.00. Each household has on average 3.43 members Range considers average income by income decile |
| 4. | Excludes non-monetary expenses with an estimated value of US$83.7 billion. Non-monetary expenses include self-consumption, payments in kind, gifts, and the estimated rent households would have had to pay if they didn’t own their house |
We capture a large share of total household expenditure
According to data from INEGI, approximately 48% of the annual average Mexican household current monetary spend within the second to ninth income decile of our target customers is destined to food (excluding fruits and vegetables), beverages and tobacco, personal care products, house cleaning products and over the counter medicines, which are all product categories offered at our stores. Further, approximately 35% of annual average Mexican household current monetary spend within the second to ninth income decile is destined to food (excluding fruits and vegetables) and beverage products alone, such as the ones we sell.
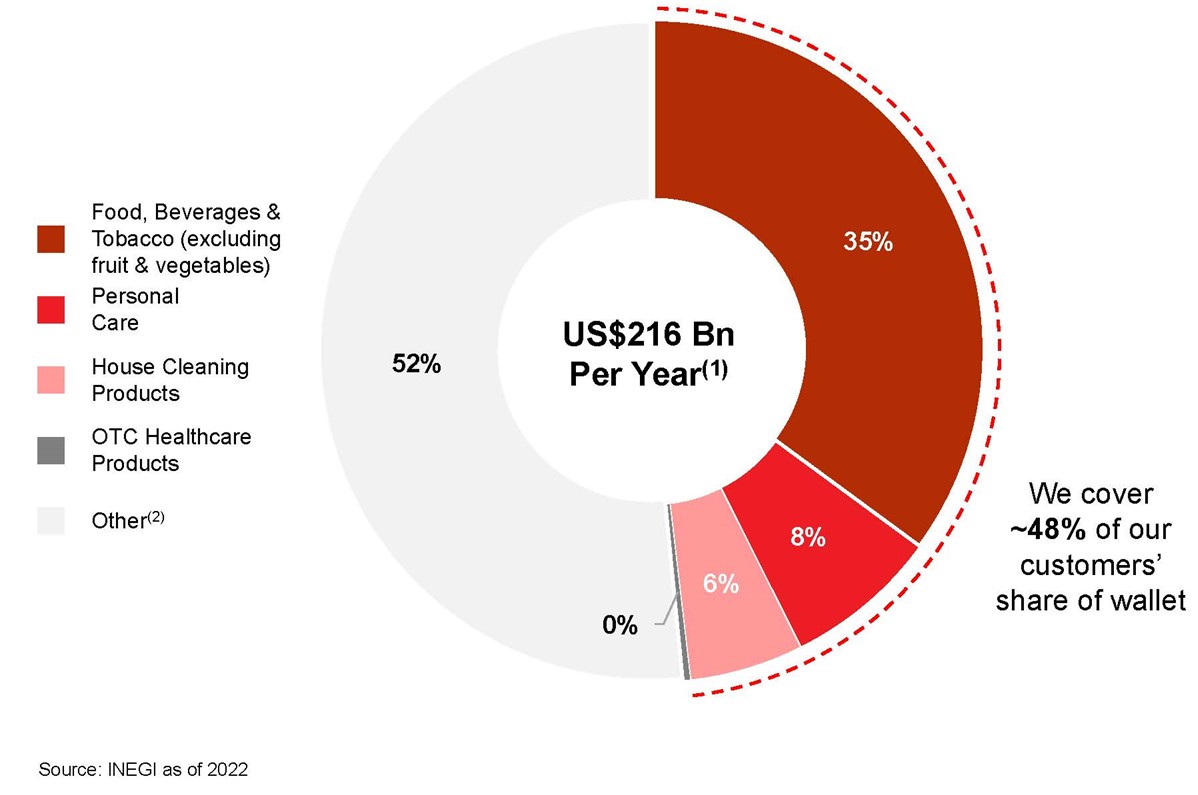
79
Notes:
1. Total current monetary spend for income deciles II to IX
2. Includes transportation & communications, education, housing, clothing, fruit and vegetables, and healthcare (excl. OTC products)
Favorable Tailwinds Supporting the Mexican Consumer
Consistent real wage growth
The minimum wage in Mexico has experienced significant growth since 2018, resulting in higher disposable household income. According to the National Minimum Wage Commission, over the last five years, the annual compounded growth rate (in local currency) was 19.4%, surpassing inflation and leading to real increases of the minimum wage, which in turn leads to more disposable income for lower income households.
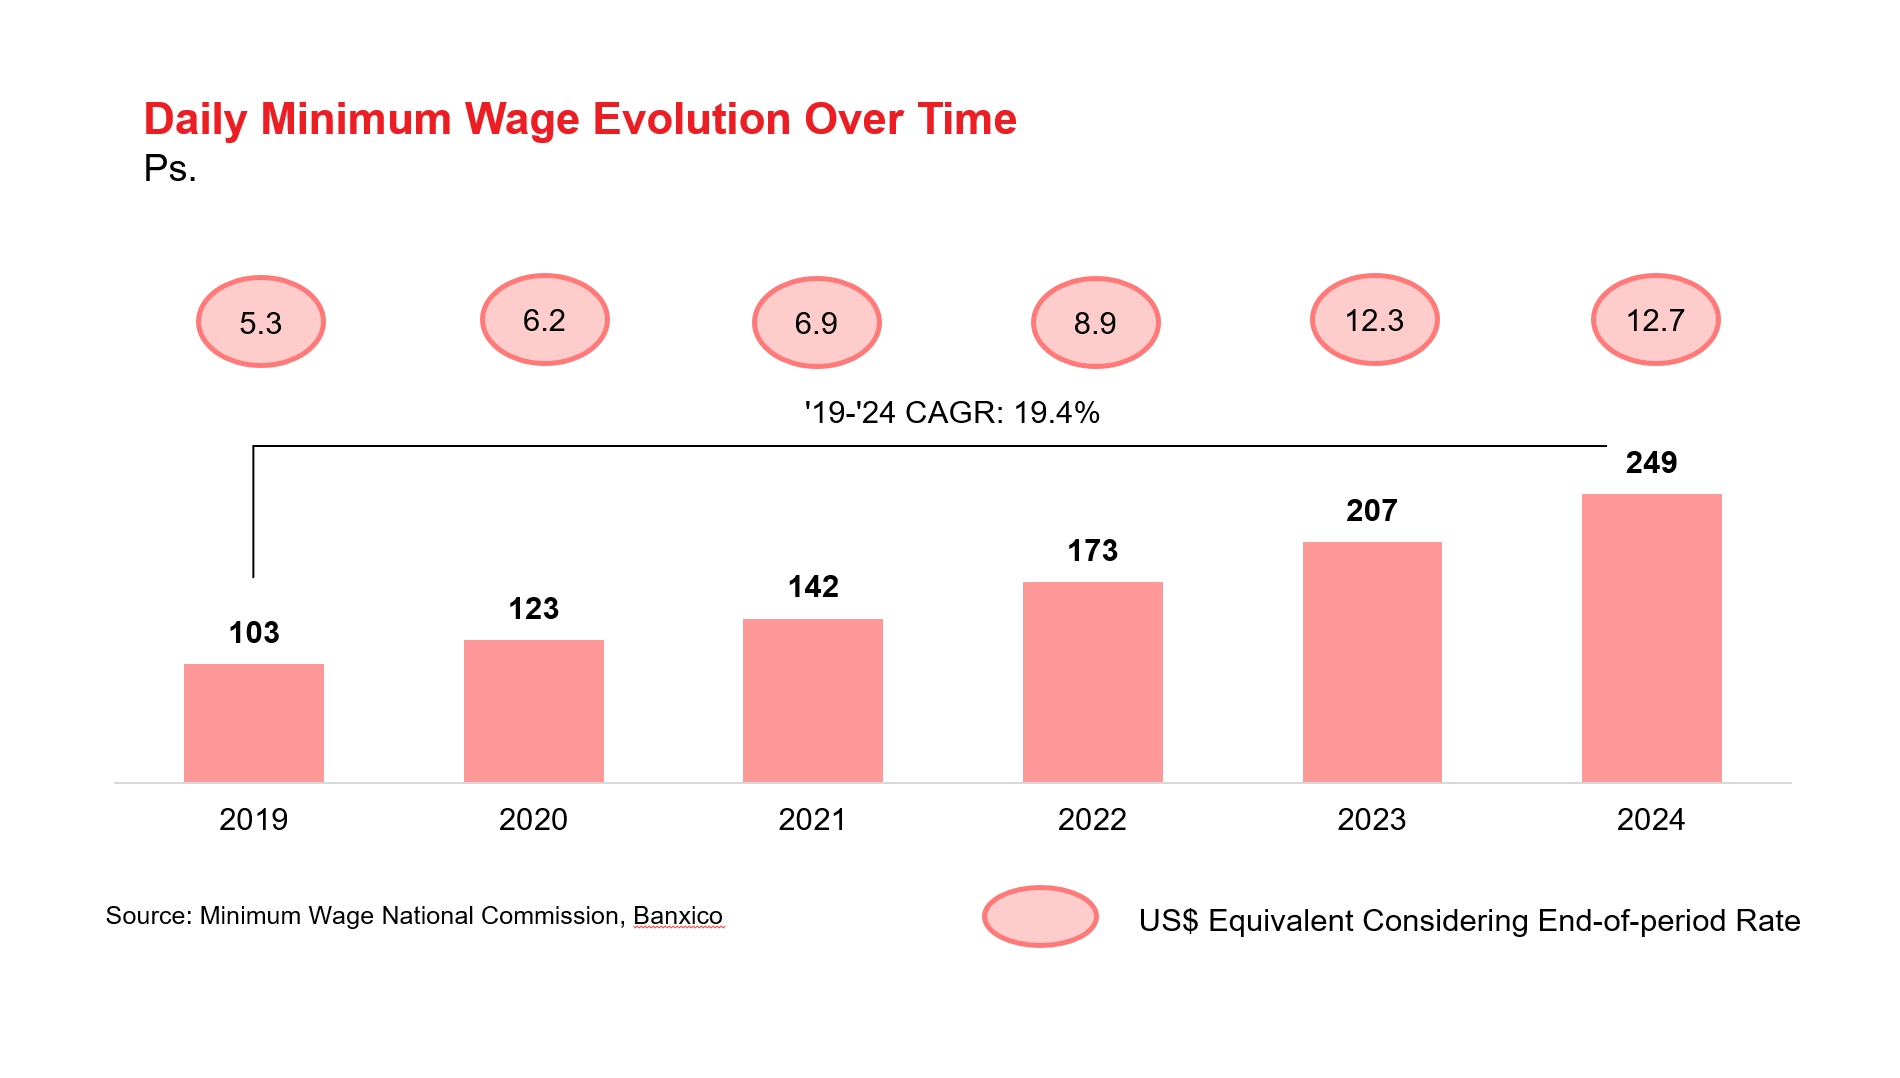
80
Daily Minimum Wage Evolution Over Time
High remittances provide support for increased spending
In 2023, remittances to Mexico (mainly money sent by Mexicans or Mexican descendants living outside of Mexico – primarily in the United States) reached an all-time-high of US$63.3 billion, supporting consumption spending in the country. Remittances have historically supplemented consumption expenditure of low- to middle-income households.
The Grocery Retail Industry in Mexico
Large and growing market
The Mexican formal grocery market had approximately US$157 billion annual sales for 2023 and is projected to grow at a 8.8% compounded annual rate from 2023 to 2028, according to Euromonitor. The market is expected to reach US$239 billion in annual sales by 2028.
Fragmented market: One dominant player but otherwise highly fragmented
The grocery market in Mexico is best viewed in two channels: the Modern (or organized) channel, which is a sub-set of the formal grocery market and which we define to include discounters, hypermarkets, supermarkets, convenience retailers and warehouse clubs, and the Traditional (or informal) channel, which we define to include, among others, local grocers and food, drink, and tobacco specialty stores. The Modern channel, which represented US$103 billion in annual sales for 2023 based on data from Euromonitor, can be further divided into full-price retailers and discounters (including soft discounters and hard discounters, such as Tiendas 3B). Discounters represented 29.7% of the Modern channel for the year ended December 31, 2023, according to data from Euromonitor.
Walmex is the dominant player in the Modern channel, representing 32.5% of that channel’s total sales for 2023 based on data from Euromonitor. Walmex’s most successful format is Bodega Aurrera, a discounter which represented 16.0% of sales in the Modern channel. Beyond that, the market is highly fragmented.
The hard discount business model
Hard discount is still a nascent business model in Mexico within the Modern channel. According to NielsenIQ, hard discounters, such as Tiendas 3B and Tiendas Neto, only represented 3.0% of sales in the Mexican grocery market for 2023. Although large retail players, such as Walmex (through Bodega Aurrera Express) or FEMSA (through Tiendas BARA), have presence in discount formats, since inception, Tiendas 3B has successfully competed with those formats as well as with other established grocery players as shown by our growth track record.
Hard discount grocery retailers, like ourselves, are different from other retailers in the Modern channel. The hard discount model focuses on a limited assortment of high value for money, high rotation branded and private label products that address the consumer’s essential daily needs. A hard discounters operations seek to be highly efficient and simple, with streamlined logistics, distribution, storefront operations and standardized no-frill store layouts with flexible locations. As a result of the efficiencies in the business model, hard discounters who achieve scale tend to have low gross margins and yet can achieve high returns on invested capital.
81
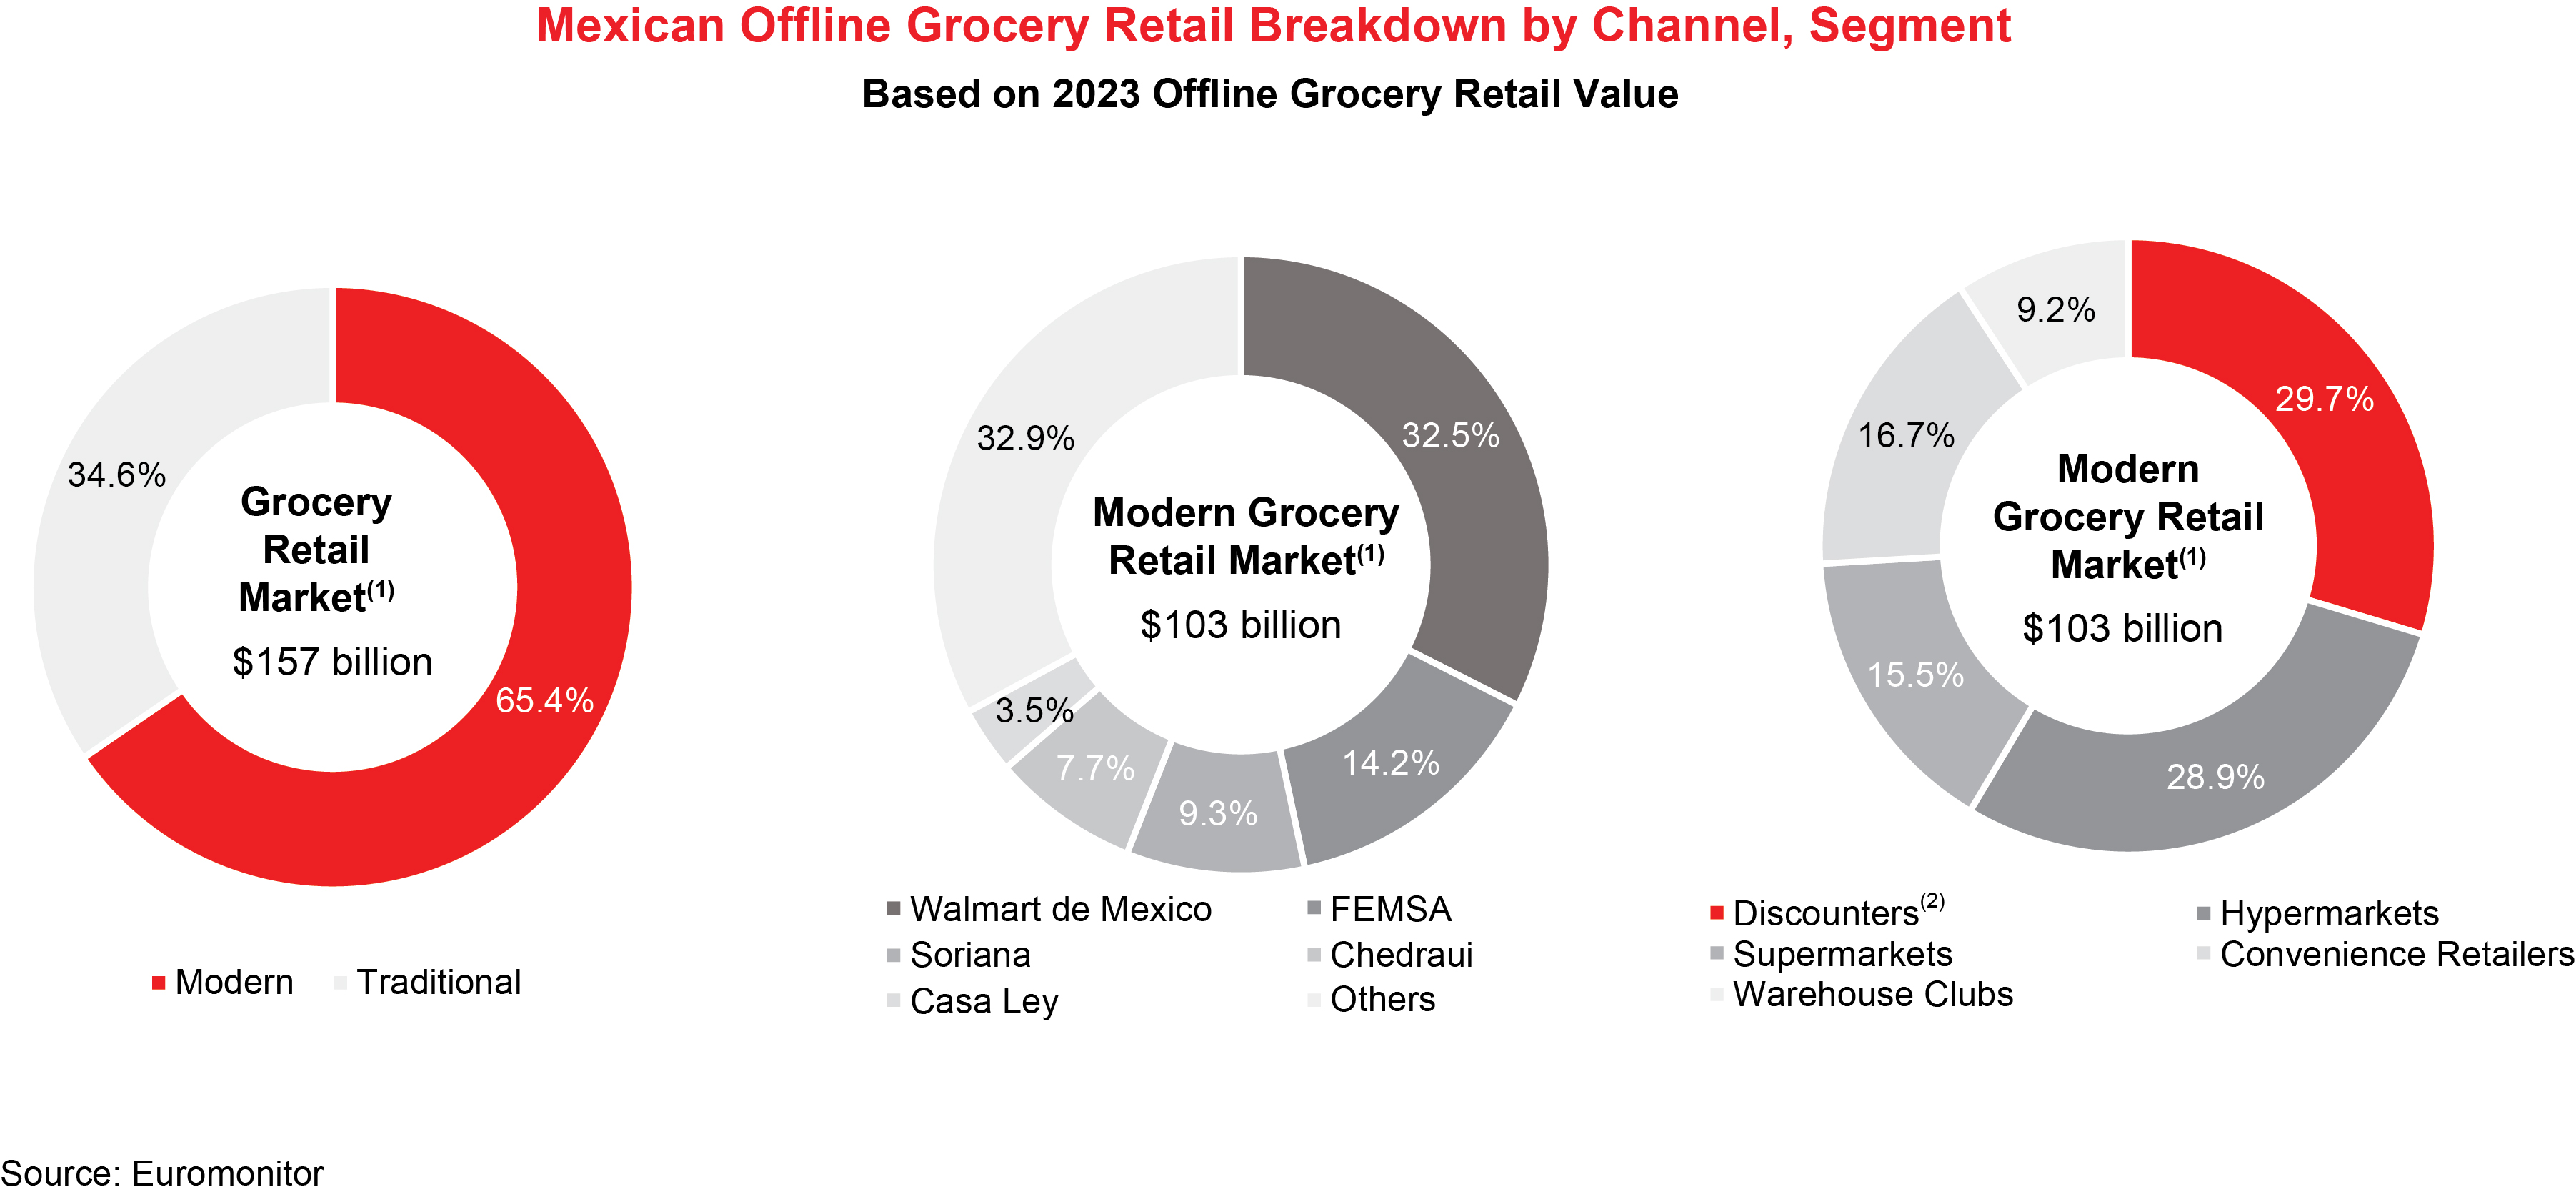
Notes:
1. Only considers offline grocery retail (i.e., excludes e-commerce sales)
2. Includes soft and hard discounters
Tiendas 3B’s addressable market
Our stores serve low-to-middle income households, which according to the National Survey of Household Income and Expenditure conducted by INEGI in 2022, spent US$216 billion in 2022, or 70.7% of the Mexican population’s total current monetary spend. According to data from INEGI, approximately 48.4% of annual average Mexican household current monetary spend within the second to ninth income decile is destined to food (excluding fruits and vegetables), beverages and tobacco, personal care products, house cleaning products and over the counter medicines. Our product offering covers all of these categories. Further, approximately 35.1% of annual average Mexican current monetary spend within the second to ninth income decile is destined to food (excluding fruits and vegetables) and beverage products alone, such as the ones we sell.
Tiendas 3B’s whitespace opportunity
We believe that there is a large whitespace opportunity for Tiendas 3B. This opportunity will be driven by market expansion as a result of favorable demographic trends, the under-penetration of hard discount stores in the Mexican grocery market, and hard discount’s growing appeal with the Mexican consumers. Tiendas 3B’s addressable market is large and poised for continued growth.
Based on our estimates at December 31, 2023, we believe there is a potential to open at least 12,000 additional Tiendas 3B stores in Mexico at current population levels in urban areas alone. We have mapped out whitespace by identifying communities with over 10,000 inhabitants as our stores are designed to adequately serve that number of people in a trade area of 800 meters from each store. This would represent almost a five-fold increase over our 2,772 stores as of December 31, 2024.
82
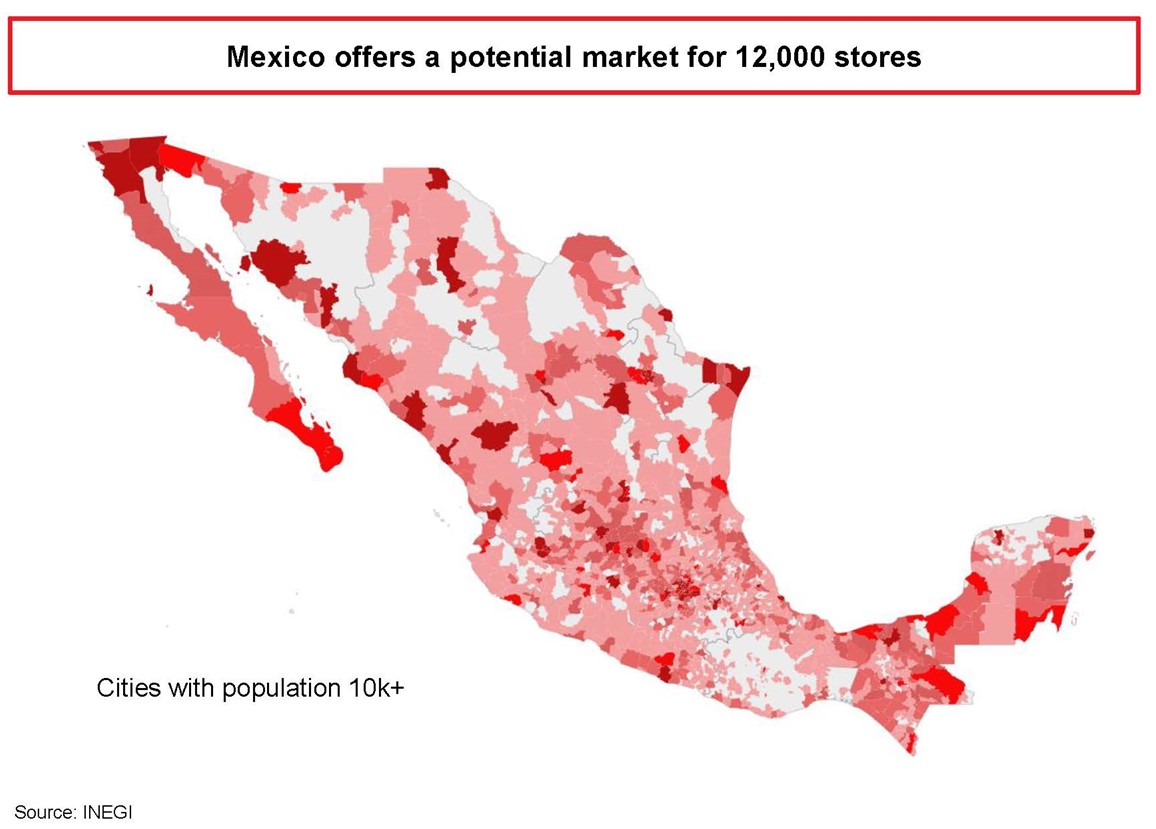
Hard discount in Mexico has significant growth potential when compared to other countries
The hard discount retail market in Mexico appears to be underpenetrated when compared to other countries with more established hard discount retail markets.
According to NielsenIQ, in 2023, the hard discount market in Mexico represented only 3.0% of NielsenIQ’s measurement of the Mexican grocery market. In contrast, grocery retailers which we consider hard discounters in Germany (i.e., Aldi and Lidl), in Poland (i.e., Biedronka, Aldi and Lidl), and in Turkey (i.e., BIM and A101), which are countries with successful and mature hard-discount markets, represented 24.2%, 36.8% and 24.6%, respectively, of their corresponding grocery market’s annual sales in 2023 based on data from Euromonitor.
83

Notes:
1. Considers Biedronka, Lidl and Aldi 2. Considers BIM and A101 | 3. Considers Aldi and Lidl 4. Information from "NielsenIQ Homescan Hard Discounters Report" |
Although the Mexican food retail market has other features that differentiates it from that of Germany, Poland and Turkey at the time the hard discount model was introduced in those countries, including having a highly developed and efficient food retailers, we believe that these markets exemplify how the hard discount model can prosper even as countries grow richer. Initially, similar to Mexico, German and Polish consumers were attracted to hard discount given the great value proposition. At the time hard discount was introduced in Germany (1946 following the Second World War), in Poland (1990 following the fall of the Soviet Union) and Turkey (in 1995), German real GDP per capita, adjusted for inflation to date and price differences between countries was US$7,195, Poland’s was US$8,150 and Turkey’s was US$9,963. Even as per capita income ramped up in those countries, hard discounter penetration continued to increase. Although there is no assurance that the Mexican market will develop in the same fashion, we believe Mexican consumers are increasingly attracted to the hard discount model’s value proposition.
Our History
In 2004, K. Anthony Hatoum, founder, Chairman and Chief Executive Officer of Tiendas 3B, decided to start a new hard discounter in Mexico based on his experience with BIM, the successful Turkish hard discounter, and his conviction of the model’s sustainable competitive advantages and financial attractiveness. After analyzing the prospects of several countries in Asia, Eastern Europe and Latin America, Mr. Hatoum chose to start this new business in Mexico. Convinced by the country’s business case, he opened the first store in February of 2005 in Mexico City.
The development of private label products, core to offering high value to our customers, has been part of our business strategy since our founding. We launched our first private label, “LactiBu,” a modified liquid milk formula, in May 2005. As of December 31, 2024, we had developed over 108 different private label brands, representing over 458 SKUs. Our value offer to our customers improves continuously as we introduce new private labels and continue to improve existing ones.
As of December 31, 2024, we had grown to become the leading hard discount retailer in Mexico with 2,772 stores, 16 distribution centers and 25,300 employees. The charts below highlight our growth trajectory from 2020 to 2023.
84
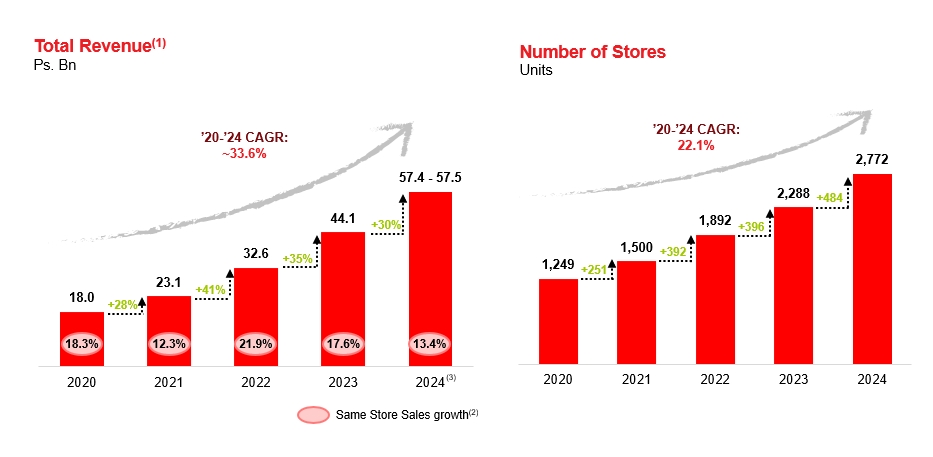
Notes:
1. | Total revenue is calculated as the sum of Revenue from sales of merchandise and sales of recyclables |
2. | “Same Store Sales” is calculated using revenue from sales of merchandise from stores that were operational for at least the full 12 months for the periods under consideration. Stores that were temporarily closed (for one month or more) or permanently closed during the periods in consideration were excluded when calculating this measure. Same Store Sales growth is measured by comparing the Same Store Sales of stores that were open during the measurement period. |
3. | Mid-point of the approximated Total Revenue range for 2024 of Ps.57.4 million - Ps.57.5 million based on the preliminary information available as of the date of this prospectus |
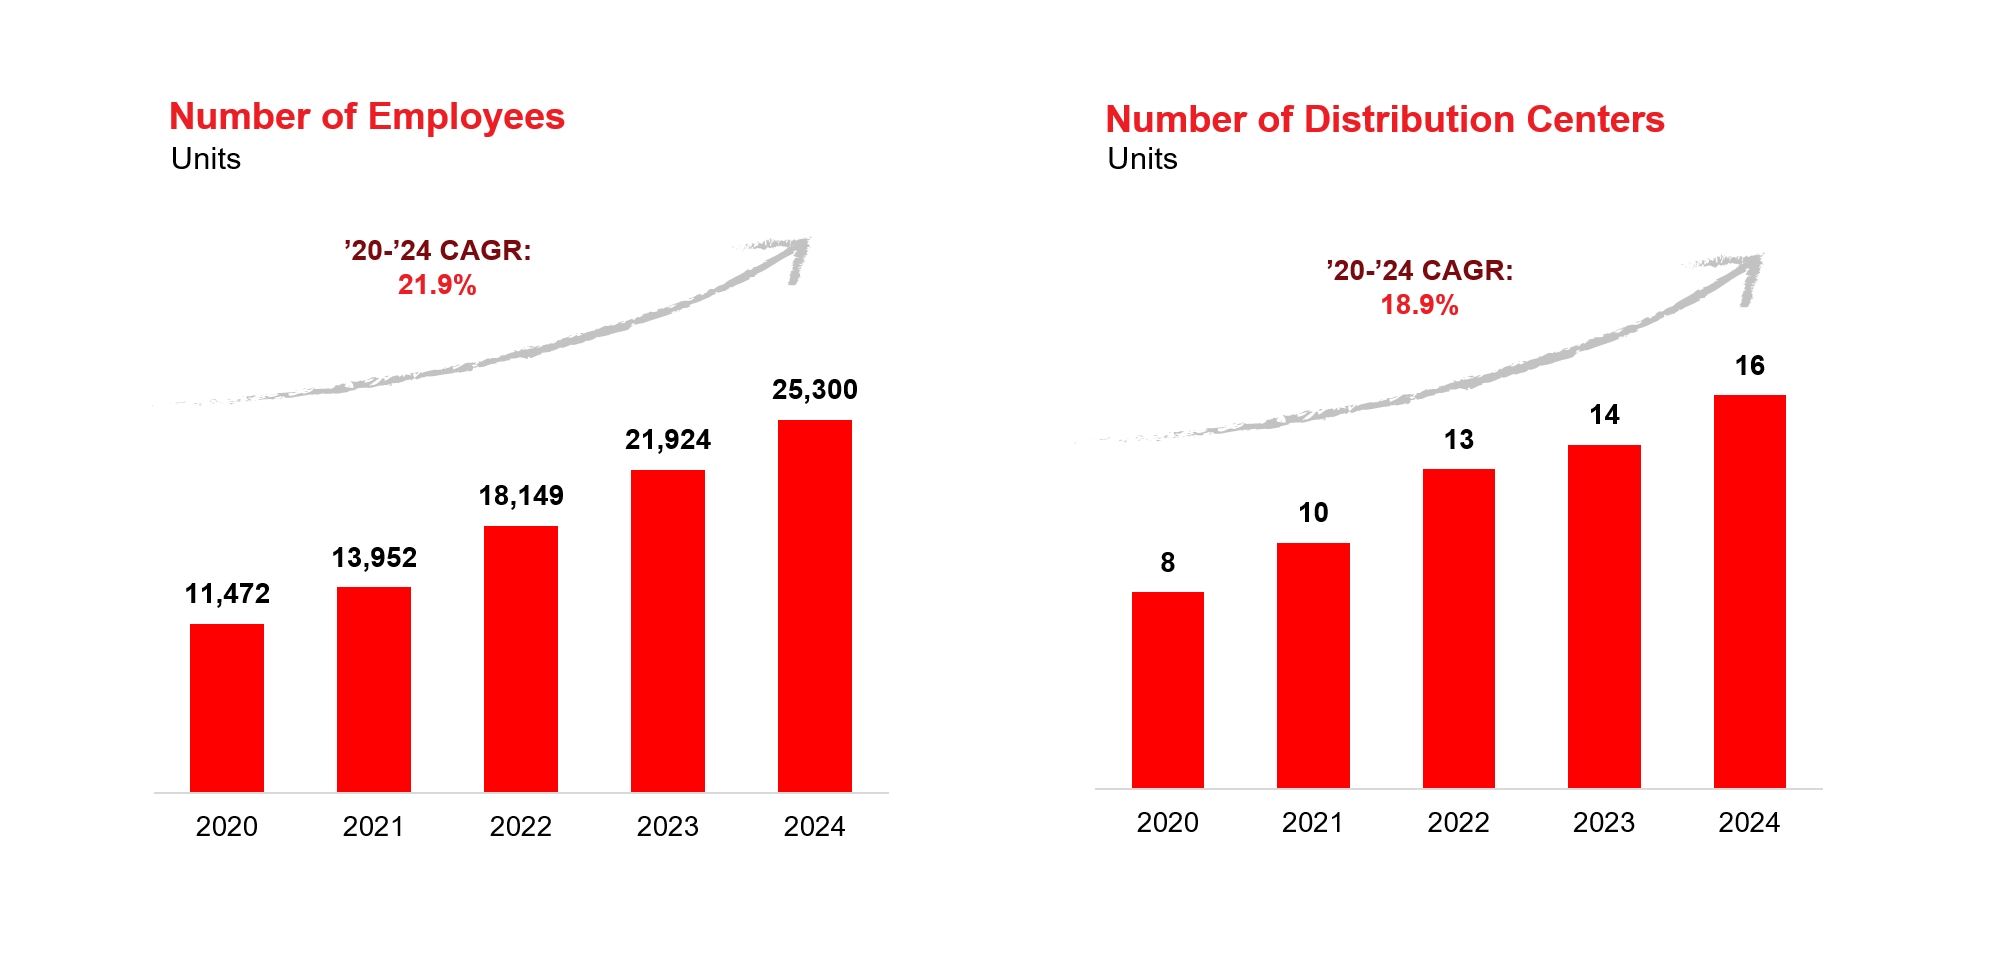
85
Our sales growth is attributable to both our store footprint expansion as well as Same Store Sales growth from our existing store base. Our Same Store Sales growth has seen consistent double-digit growth over recent years. As a result of our strong sales growth and operational efficiency, we have a track record of growing EBITDA, as depicted below.
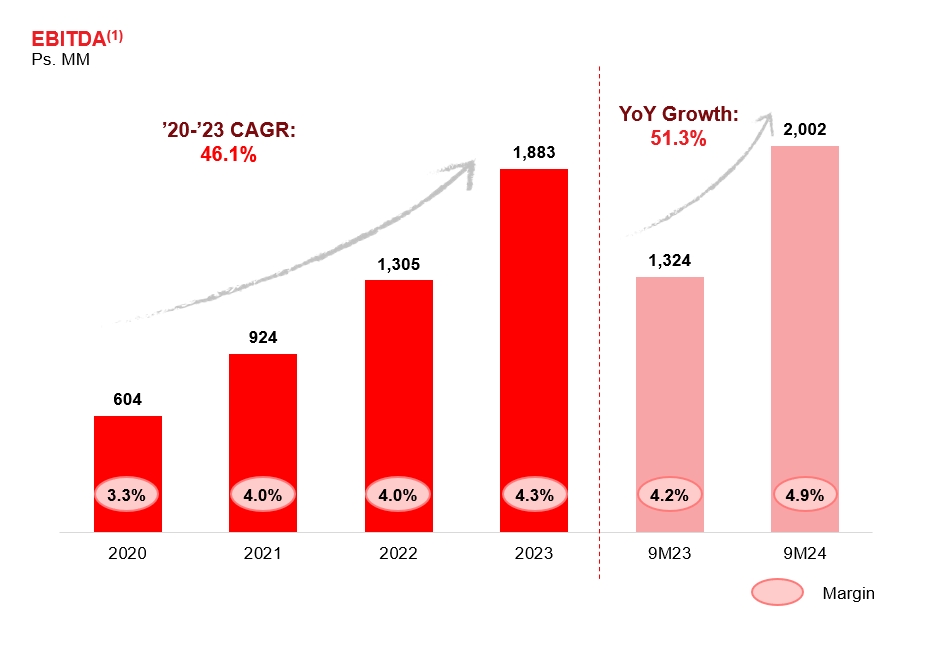
Notes:
1. We calculate “EBITDA” as net income (loss) for the period, plus income tax expense, financial costs, net, and total depreciation and amortization. We calculate “EBITDA Margin” for a period by dividing EBITDA for the corresponding period by total revenue for such period
Our founder-led management team continues to run the business and has successfully transitioned the company from a startup to Mexico’s 119th most important company according to Expansión magazine’s ranking of the 500 most important companies in Mexico. Tiendas 3B was recognized by the Financial Times in 2024 as one of the fastest growing companies in the Americas.
Our belief in building a solid foundation to sustain high growth has led us to invest heavily in human resource development early on, establishing a strong culture, building robust processes, and an enterprise resource planning system capable of sustaining thousands of stores. This investment today has been fully justified as it is what we believe has allowed the company to sustain high growth rates.
86
Key milestones in our history are shown below:
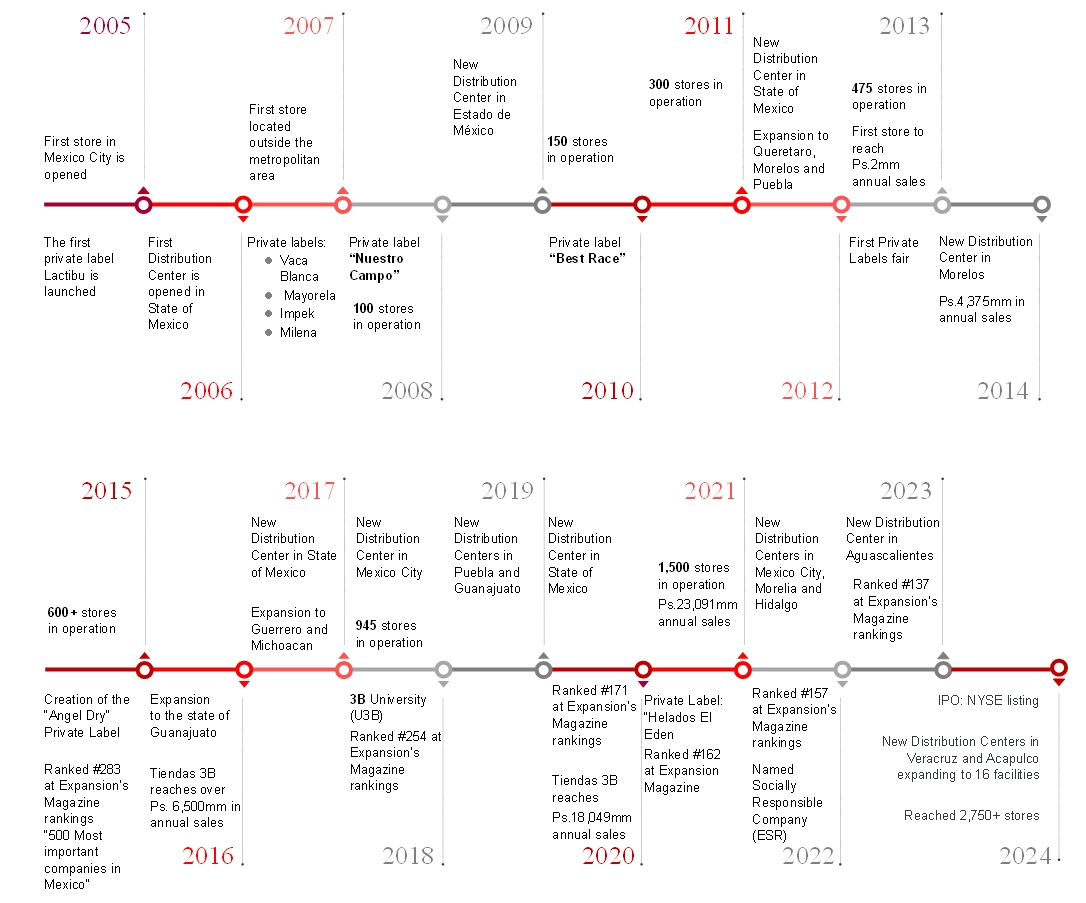
Competitive Landscape for Tiendas 3B
Walmex is the dominant force in Mexico’s grocery retail sector with a 32.5% share of the Modern channel’s 2023 sales. Its portfolio is spearheaded by Bodega Aurrera, a discounter and the leading discount format in Mexico, which represented 49.2% of Walmex’s 2023 sales. The remainder of Walmex’s sales are contributed by Walmart, a hypermarket, and Sam’s Club, a warehouse club, which represented 27.0% and 19.3% of sales, respectively. Walmart Express and Superama, supermarkets, adds an additional 4.0% and 0.5% of sales, respectively. To put in perspective Walmex’s market dominance, Walmart’s U.S. market share was 25.3% in 2023 according to Euromonitor.
Walmart sets the competitive tone in most modern grocery segments by leveraging its purchasing power and setting aggressive prices. Consumers, equipped with more information and purchasing options than ever, are constantly evaluating alternatives. Competitors are challenged to match these prices without compromising profitability, emphasizing the necessity for a distinct value proposition and constant differentiation.
We primarily compete with Bodega Aurrera (especially with its Express format), Tiendas Neto, and FEMSA’s Tiendas BARA. Due to our stores’ centralized locations, in the middle of neighborhoods, we also compete with traditional retailers, such as small independent corner grocers, pop-up markets, street vendors and municipal markets. Given the fragmentation of the retail sector we believe that our company competes against any format that offers products similar to what we currently offer.
87
In order to successfully compete, we believe that a grocery retailer needs to have notable and sustainable competitive advantages that allow it to set itself apart. Tiendas 3B does so by offering highly competitive prices without sacrificing quality, and convenient access to its stores.
Our Competitive Strengths
Since inception, we have successfully competed with well-established grocery retailers and our sustainable competitive advantages have allowed us to thrive. We believe that as we continue to grow, our advantages will become more pronounced:
Rapid store expansion capacity
We opened our first store in February 2005, and as of December 31, 2024, we had 2,772 stores and 16 distribution centers. As our sales have grown, the pace of our store openings has accelerated naturally, as illustrated in the chart below. We had 392 net new store openings during 2022, 396 net new store openings during 2023 and 484 net new store openings during 2024, which translates into an average of one new store opening every 18 hours.

We are the fastest growing retailer in Mexico in terms of sales, based on a comparison of our sales figures with Euromonitor’s analysis of sales growth for the fastest growing retail players in Mexico. As shown below, Tiendas 3B has significantly outpaced incumbent retailers, with a total revenue CAGR of 34.7% from 2020 to 2023.
88

Source: Based on a comparison of Tiendas 3B's sales figures with Euromonitor's analysis of sales growth for competitors
Notes:
Sales growth underpinned by strong fundamentals
Our Same Store Sales growth and expansion are underpinned by strong store level fundamentals. Although growth through geographic expansion and store openings is a strong component of our expansion strategy, we believe our model is sustainable and scalable given the combined effect of growing average ticket size and a growing volume of transactions per store at our existing stores.
|
|
Notes: |
|
Notes: | ||
1. | We calculate average ticket size by dividing revenue from sales of merchandise by total number of transactions |
| 1. | Average transactions per store per month, only considering stores from vintages with five or more years of operations |
2. | Based on the mid-point of the approximated Total Revenue range for 2024 based on the preliminary information available as of the date of this prospectus |
| 2. | Based on the mid-point of the approximated Total Revenue range for 2024 based on the preliminary information available as of the date of this prospectus |
89
High rotation of our inventory to generate significant negative working capital
By focusing on high rotation items and limiting them to one-brand one-size, curated to satisfy most grocery needs of the average Mexican family, we are able to keep low Inventory Days. In 2023, we had 21 Inventory Days.
Our supplier payment terms (65 Payable Days for 2023) and low Inventory Days (21 Inventory Days for 2023), create a favorable negative working capital cycle that has enabled us to self-fund our rapid expansion. Our negative working capital for 2022, 2023 and the nine months ended September 30, 2024 was Ps.3,205,200 thousand, Ps.4,558,781 thousand and Ps.2,138,451 thousand, respectively. Net cash flows provided by our operating activities were Ps.1,366,308 thousand, Ps.2,116,335 thousand, Ps.3,140,349 thousand and Ps.2,378,208 thousand for 2021, 2022, 2023 and the nine months ended September 30, 2024, respectively, compared to our capital expenditures of Ps.532,173 thousand, Ps.1,122,877 thousand, Ps.1,798,019 thousand and Ps.1,642,397 thousand for 2021, 2022 and 2023 and the nine months ended September 30, 2024, respectively.

Notes:
1. We calculate working capital as total current assets minus total current liabilities.
2. We calculate the percentage of working capital to total revenue for a period by dividing the working capital as of the end of the period by the total revenue for the last twelve months ending on the corresponding period.
3. Net IPO proceeds translated into Mexican pesos for convenience only at the rate of Ps.19.629 per US$1.00, the exchange rate to pay foreign currency denominated obligations due on September 30, 2024 published by the Mexican Central Bank in the Official Gazette.
Lean operational model designed to maximize efficiency and minimize costs
Our limited assortment of products allows us to simplify and optimize operations leading to low sales expense as a percentage of total revenue, which was 10.9% for 2023 and 10.2% for the nine months ended September 30, 2024.
Every aspect of our operations has been carefully optimized for efficiency. We reduce working hours and operating costs by designing our products and packaging with efficiency in mind, choosing the right truck sizes and equipment, making judicious use of technology and efficiently distributing refrigerated goods, store orders, and managing our proprietary logistics infrastructure. For example, we reduce time and costs from stocking shelves by selling directly from the box (usually lidless) that arrives from our distribution centers. Our trucks and stores are designed to allow one driver to unload a store delivery single-handedly in 30 minutes or less and our distribution centers are strategically located to allow optimal re-stocking efficiency and route planning.
Standard supermarkets, with a larger number of SKUs are more complex and costly to run. They need higher gross margins to sustain their operations. By being able to operate at lower costs, we can achieve positive
90
operating profit even with low gross margins, and can offer sustainable lower prices, which we believe is very hard to replicate for traditional grocery retailers.
Significant purchasing power
As our sales have grown, so has our purchasing power. We believe we can buy at very competitive prices since our sales are concentrated in a relatively lower number of SKUs. This allows us to continually lower our purchase costs, improve our payment terms and develop strong supplier relationships, which in turn enables us to transfer generated savings on to our customers. Further, we cooperate closely with our private label suppliers to help them negotiate better terms on their own supplies and raw materials, which also translates into savings for our customers.
Building and constantly reinforcing customer trust and loyalty
We have built enduring customer relationships based on trust in our pricing and quality. We believe that this trust is a cornerstone of our business, allowing us to accelerate our sales growth and eventually expand into higher ticket items and additional product categories (so long as they also deliver our characteristic value-for-money). We offer a no-questions-asked no-receipt-needed money-back return policy on all products we sell. This guarantee helps build trust and encourages our customers to try our private label products.
Decentralized and nimble organization that is close to the action
We have a decentralized and lean organizational structure built around autonomous regions each led by a regional director. As of December 31, 2024, we had 16 operating regions. Each region consists of approximately 150 stores supported by a single distribution center with functional support areas, such as human resources, real estate, logistics, IT and regional purchasing and accounting. For example, the regional directors decide which new stores to open (within company guidelines) without requiring headquarters’ approval. All regions are similarly sized and configured in terms of operations and the model is readily replicable. As each region increases the number of stores it operates beyond 150 and up to 200, a new region is formed in adjacent geographies and stores are shifted accordingly to optimize logistics.
We believe this approach has many benefits. Decisions are closer to the action and therefore nimble. There is less bureaucracy. Opening new regions is rapid, efficient, and cost effective. Benchmarking among similar regions makes managing the entire business efficient and allows us to maintain a small central office even at scale.
We invest significantly in human resource development and our culture. We believe this is essential to maintaining sustainable gross and operating profit growth and managing a decentralized structure. We achieve these goals by long-term planning, a belief in the concept of talent density, and investing in in-person training, which is supplemented by more than 100 training modules found in our online “Universidad 3B,” which is designed to foster a strong cultural affinity and operational excellence across the organization.
Founder-led management team with leading industry expertise
We are a founder-led company with a solid management team, the majority of which has been working together for more than 16 years, most since inception. Our management team has 130+ years of combined experience in the retail and hard discount industry, has extensive knowledge of the Mexican grocery market, and has held relevant positions within local and international players. The trajectory and continuity of our management team contributes to a strong and stable corporate culture that is both customer and employee-centric. Our management team has developed highly specialized know-how that we believe is hard to replicate and a key differentiating factor that has propelled our success.
Challenges for potential new Entrants
The intense competitive landscape in Mexico’s grocery retail sector creates a natural high barrier for any potential new entrant. Any new entrant will encounter large established players like Walmex, whose scale and successful discount format Bodega Aurrera sets the upper limit on prices, and hard discounters, but also hundreds of
91
other retailers with thousands of locations that offer similar products and categories. Additionally, there is a large informal sector which is comprised of street markets and mom & pop stores that operate with low overhead costs and generally do not pay taxes. Even in a competitive environment such as this, Tiendas 3B has thrived. As new entrants do not typically start at scale (unless through an acquisition), they would need to expand while sustaining relatively low gross margins. Moreover, new entrants would have to develop a competitive advantage that trumps the value proposition and established presence of the incumbents. Historical data underscores the complexity of the landscape. Over the past two decades, several players have been acquired after facing competitive pressures.
Prominent Exits in Mexico’s Grocery Retail Sector (2002-2024)
Retailer |
| Transaction |
| Year |
Comercial Mexicana |
| Acquired by Soriana |
| 2015 |
Super Precio (Gigante) |
| Acquired by Grupo Salinas and becomes Tiendas Neto |
| 2012 |
Despensa del Hogar (Corvi) |
| Acquired by Super Precio |
| 2009 |
Gigante |
| Acquired by Soriana |
| 2007 |
Carrefour |
| Acquired by Chedraui |
| 2005 |
Auchan |
| Acquired by Comercial Mexicana |
| 2003 |
Our Strategy
Unrelenting focus on lean operating model to support profitable growth
Our business model has proven to be sustainable and resilient through different economic cycles, which we expect to continue. We believe we still have room to continue to improve our operating margins through the scalability of our platform. We have sustainably low operating costs as a percentage of sales, driven by scale, rigorous cost discipline, the judicious use of technology, making our processes even more efficient, and better integrating with our private label suppliers. We believe our current operational structure will allow us to continue supporting our expansion efforts at marginal incremental costs.
Rapidly expanding number of stores in contiguous regions, while maintaining low investment requirements per new store
We aim to open stores in places that are convenient for our customers, most of which access our stores on foot. We follow a disciplined approach to our geographic expansion without compromising our supply and distribution capabilities. Our standardized format and requirements assure that our capital requirements for new stores remain low, an important component as we fund our rapid expansion.
As of December 31, 2024, our stores were concentrated in 16 states in the central region of Mexico, including: Mexico City, State of Mexico, Hidalgo, Puebla, Tlaxcala, Morelos, Queretaro, Guanajuato, Michoacán, Guerrero, Veracruz, Aguascalientes, Nayarit, Jalisco, Zacatecas, and San Luis Potosí. This geographic footprint has resulted from progressive expansion as we add new distribution centers to support stores in new areas, in each case targeting critical density to support the efficiencies of our structure. Our store location map reflects our disciplined expansion approach.
92
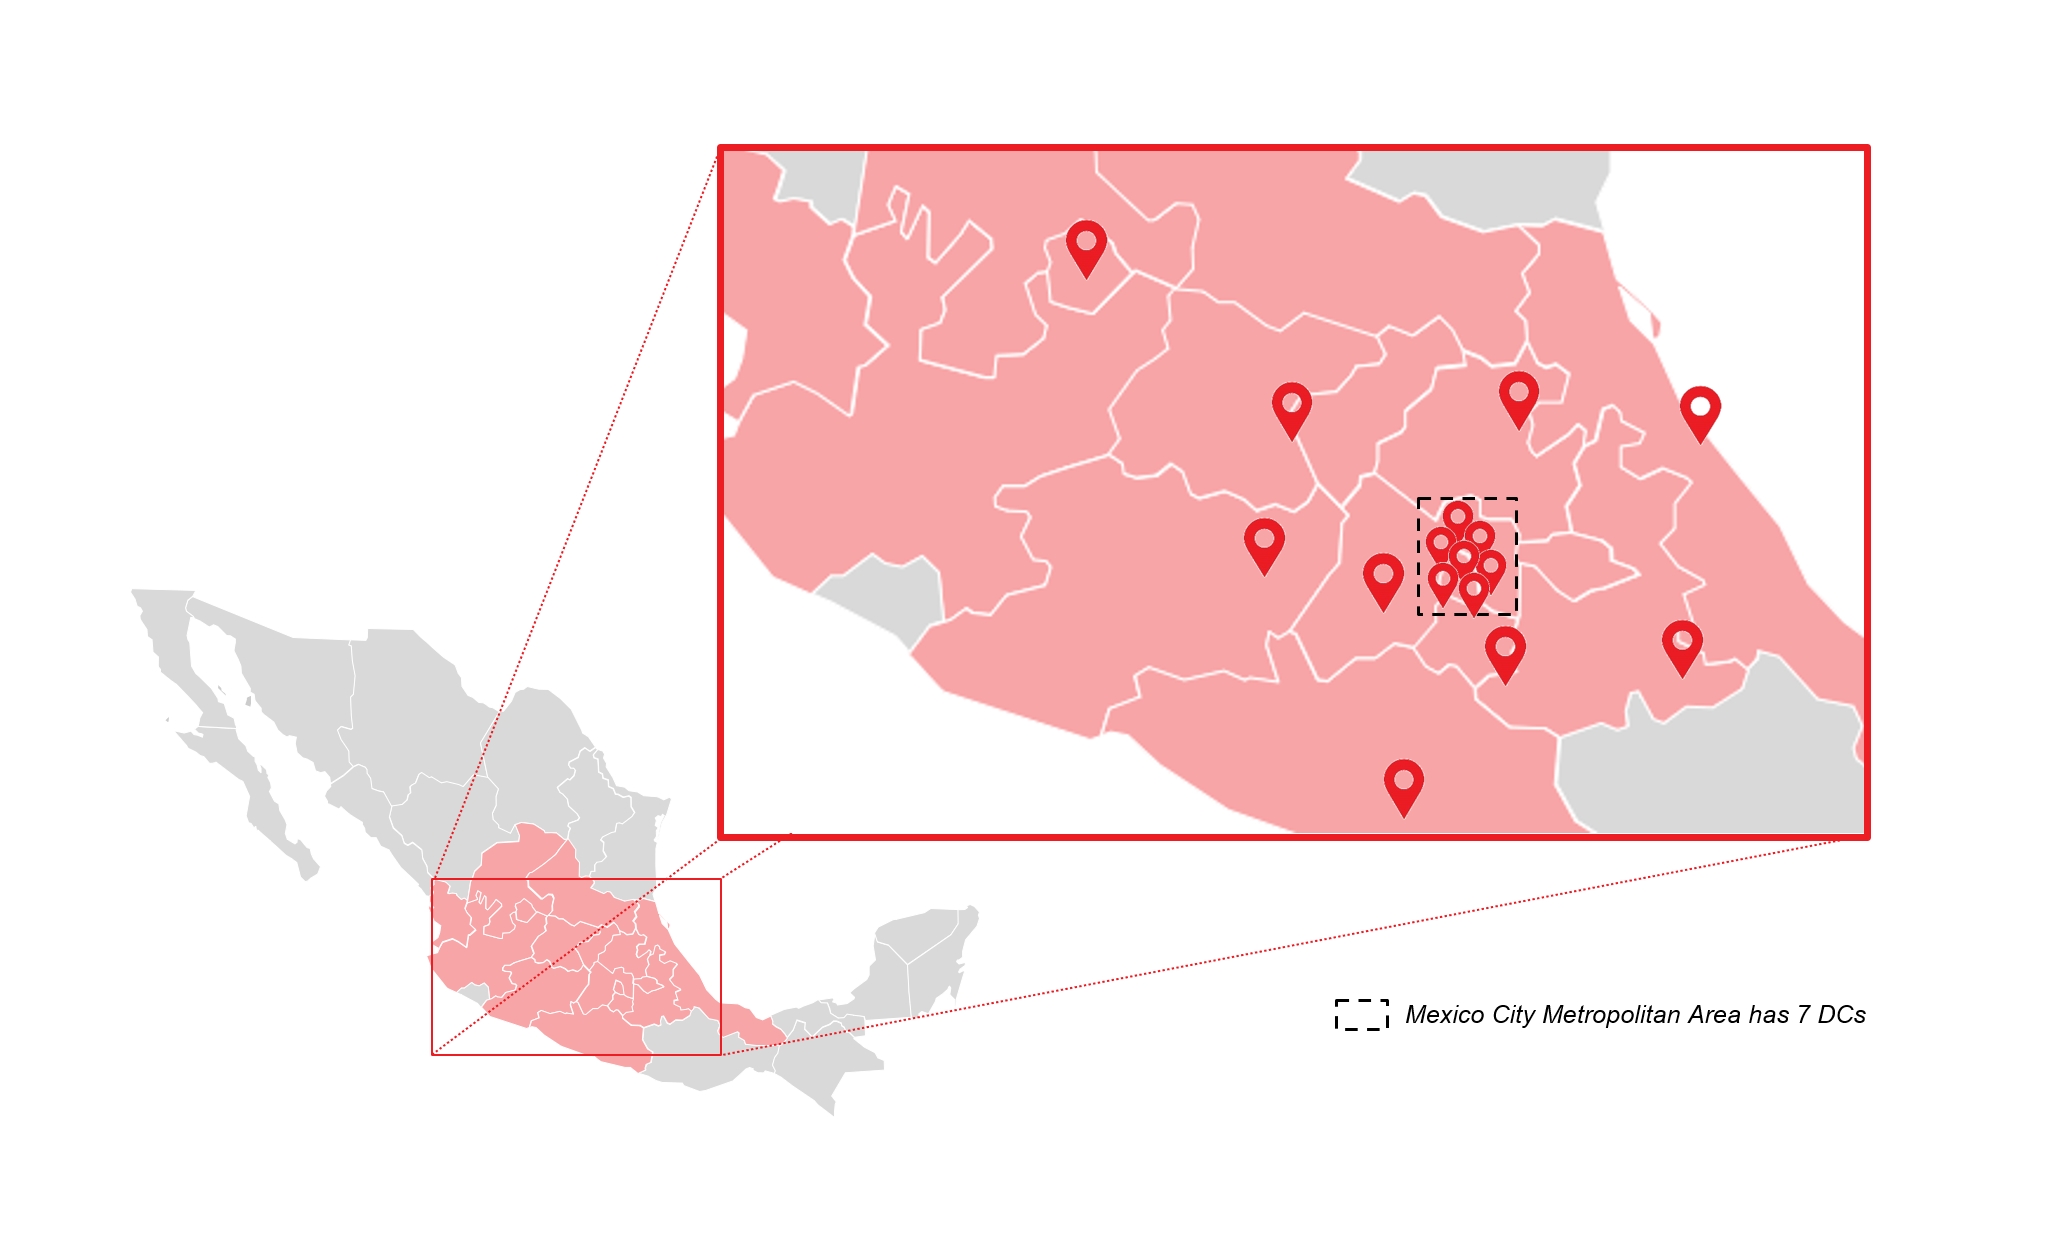
Developing new private label product lines
We intend to consolidate our private label leadership by continuing to develop new private label product lines that offer higher value for money than branded alternatives to our customers. We work closely with over 130 suppliers of our private label products to develop new and innovative product lines. Our close relationship and integration allow us to adapt our offering to changing customer needs and preferences. As we increase our private label sales penetration going forward, we will drive greater value to our customers, which we expect will translate into sales growth, while also increasing control of our margins and improving our profitability.
Our frequent client interactions, extensive market studies, and ongoing testing of products, allow us to understand and anticipate customer preferences, and to meet their evolving needs. Our team of 39 purchasers as of December 31, 2024 work hand in hand with our suppliers to continuously innovate and improve our portfolio of products.
We help our suppliers grow alongside us by providing transparency of our growth plans, paying them on time and facilitating access to our wide network of other supplier relationships. We see suppliers as strategic partners because we often find opportunities to develop brands and product presentations, aiming to increase the quality and improve the price of our products. We also help suppliers by sharing best practices we see from suppliers of other of our products (for example access to better packaging and labeling alternatives), which creates efficiencies across our business. Our annual private label supplier fair assists this exchange of ideas and solidifies our supplier ecosystem.
Increasing our sales of “Los Irrepetibles”
We intend to increase the sales contribution of “Los Irrepetibles,” our spot product offering that includes grocery and non-grocery products such as, electronics, apparel, home goods, and others. We offer a changing selection of approximately 50 spot products every two weeks on average. These products offer notably high value for money and add a treasure hunt factor to the shopping experience. We call them “Los Irrepetibles” because they are offered at prices so low that they will not be “repeated” (replenished) once we sell out.
Part of our strategy is to selectively offer higher ticket spot items that still offer tremendous value for money. We are currently conducting tests on a limited scale to assess our customers’ acceptance of these price points and product price elasticity. Going forward, we plan to expand our spot product purchasing division to improve purchasing capacity and product sourcing.
93
Introducing new categories of products and services
We plan to selectively introduce new product categories to meet our customers’ needs. At any moment we are actively testing several new product categories. As a result of these efforts, we recently introduced the beauty category in our stores. Additionally, we plan to expand our assortment in certain categories, including ice creams and fresh and frozen meats. Based on our internal analysis, we believe there is sufficient demand to introduce SKUs to our offering and drive additional sales and wallet penetration.
Additionally, we believe that our increasingly ubiquitous store footprint can be leveraged to increase the services we offer to our customers at our locations. Currently we offer utility and service payments, top-ups, amongst others. We see opportunities to expand our service offering given our customers’ frequent store visits each week.
Our Stores
Our stores have been thoughtfully designed to improve our customer’s experience and achieve operational efficiencies.
Standardized Stores that are Efficient and Economical to Operate
Our stores follow a standardized format in terms of layout, size, assortment, and personnel. This facilitates operational efficiency and scalable growth. As of September 30, 2024, the size distribution of our stores was as follows: approximately 22.0% are smaller than 300 square meters, 60.0% range between 300 square meters and 450 square meters, and 18.0% exceed 450 square meters. This uniformity enables us to streamline inventory management, and optimized staffing, and other operational processes. The store’s exterior façade is painted in our corporate colors (red and green) that contrast with the typical street colors for better visibility and promote our brand. The interior of our stores is well lit, with wide and convenient aisles and reduced shelving height that allows store employees to see the full store, which in turn helps control shrinkage and makes restocking quicker and easier.
Moreover, we are generally able to negotiate favorable lease terms when we open new stores. Our rents are fixed, increase with inflation and on average represent 2.0 % of a store’s sales. This is possible because we do not need to be at the premium location of a given target area. Our store locations are selected based on the accessibility for our clients and ease of maneuvering, parking and unloading of our trucks for restocking.
Convenient Store Locations for our Customers
Depending on the specific characteristics of each location, we tailor our store placements for both urban and non-urban settings. In urban areas, we position our stores in the heart of neighborhoods. This strategic placement aligns with our vision to reduce time and costs for families, making our stores readily accessible for daily needs and enabling frequent visits. In non-urban areas, we seek to be at the confluence of traffic, at major intersections, or in places where the inhabitants of a wider geography come to fulfill their grocery shopping.
Geographical Presence
We opened our first store in Mexico City and have since expanded primarily in the central region of Mexico. As of December 31, 2024, we were present in Mexico City, State of Mexico, Hidalgo, Puebla, Tlaxcala, Morelos, Querétaro, Guanajuato, Michoacán, Guerrero, Veracruz, Aguascalientes, Nayarit, Jalisco, Zacatecas, and San Luis Potosí. We believe the concentrated density of our geographic footprint illustrates our operational discipline and demonstrates the ongoing opportunity for geographic expansion.
Our real estate efforts are led by seasoned teams with more than 100 years of combined experience. Each of our regions has its own real estate team which is familiar with the local market and demand dynamics. The teams follow a standard and disciplined approach to searching, appraising, negotiating, and closing real estate transactions. Each region decides on its new store locations and each regional director approves new stores without the need to get headquarters’ approval, to the extent they adhere to our real estate guidelines.
94
As we open more regions, the number of real estate teams increases and so does our ability to increase the rate of store openings. We will continue to increase the density of stores in the areas in which we currently operate, while seeking to expand and increase our penetration in the near term in Jalisco and in neighboring states to those where we operate, such as Oaxaca.
Our geographical presence is shown below:
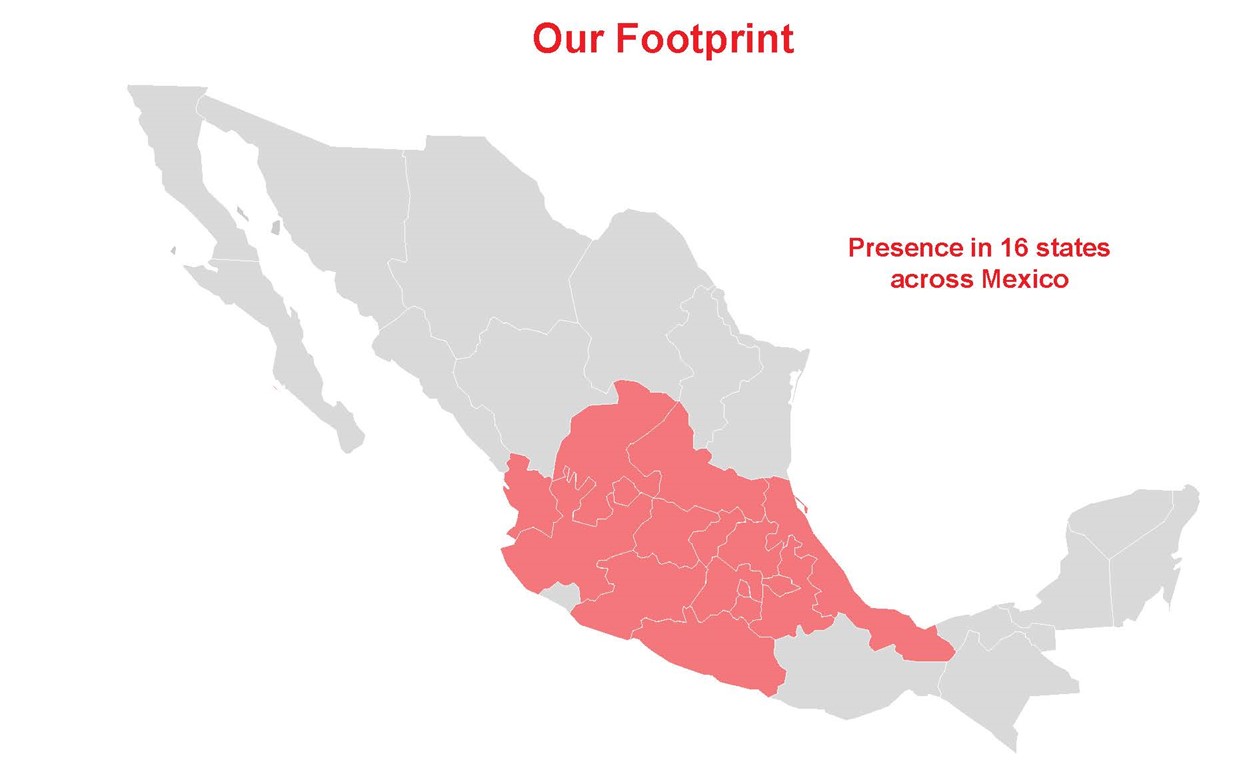
Standard Store Operations
Our stores are open from 8:00 a.m. to 9:30 p.m., seven days a week, all year round. A typical store is operated by a store manager, two assistant managers, and a team of 6 sales associates on average. The store manager is responsible for managing and developing their team, ordering, restocking, serving and selling to customers, maintaining operating standards, and executing any in-store communication/marketing campaigns. A District Manager manages between six and eight stores and, in turn, reports to a Zone Manager who oversees 40 to 80 stores. The Zone Manager reports to the Regional Director who manages all aspects of his/her region.
All our products are presented in boxes, as delivered by our suppliers. We prefer, to the extent possible, to sell directly from pallets on lidless boxes. The order of the display of products is identical in each store. This convenient layout increases our productivity by reducing the number of employees needed to staff our stores, as we do not need employees to unpack individual packages or create and maintain merchandise displays. Additionally, the pallet stocking format allows us to restock our products quickly and easily.
Store Unit Economics
The strength of our unit economics is a key element of what makes our business model attractive. By pursuing a target driven and disciplined expansion strategy we have been able to shorten our store sales ramp-up periods in real terms, where each new store vintage achieves a higher level of sales, adjusted by inflation, earlier than older vintages as shown below.
95
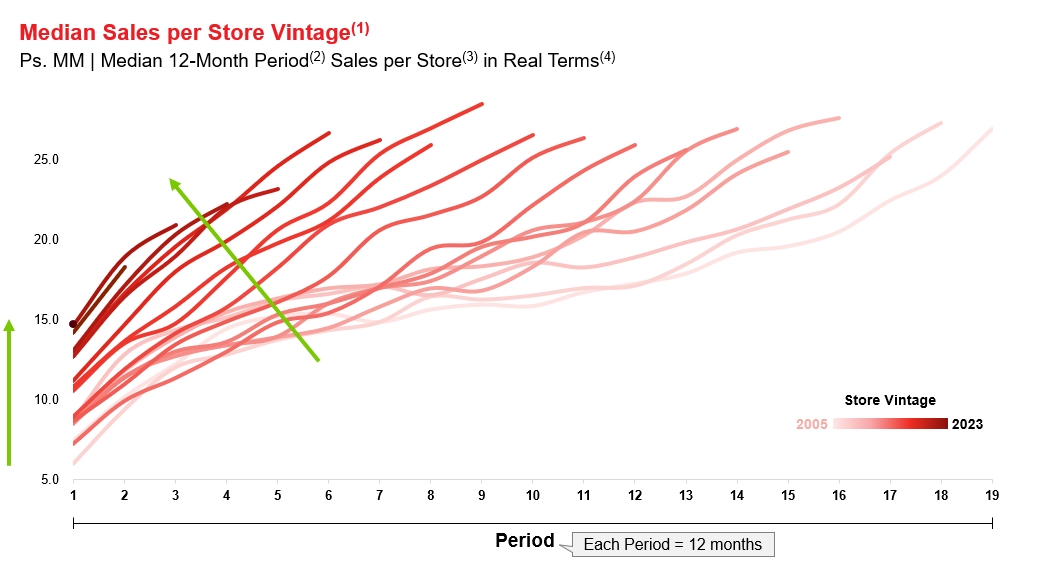
Source: Company information
Notes:
1. “Sales Ramp-up Evolution by Vintage” measures, for stores of the same vintage, the median of such stores’ revenue from sales of merchandise during 12-month periods since the start of operation. When calculating this measure, we exclude the first calendar month of a store’s operations to account for stores that are not open for the entire month, as well as stores that have been permanently closed
2. 12-month period since opening, excludes month 1. i.e., period 1 is from month 2 through month 13 since opening
3. Median 12-month period sales of all stores opened in the corresponding vintage (excludes first month to “normalize” dates in which stores are operational since opening). Closed stores are excluded from median calculation
4. All figures in real Ps. terms as of December 31, 2024, adjusted for inflation using Mexican National Consumer Price Index (Índice Nacional de Precios al Consumidor), as provided by INEGI and as published by the Mexican Central Bank
The performance of some of our most recent vintages was affected by Hurricane Otis and Hurricane John that struck Acapulco, Guerrero on Mexico’s pacific coast on October 25, 2023 and September 23, 2024, respectively. Between 2020 and 2023, we opened 55 stores in the region, and, because of these natural disasters, our stores and the surrounding areas suffered significant damages and property loss. As a result, 51 of our stores were temporarily closed in this region. To better understand the performance of our 2020, 2021, 2022 and 2023 store vintages, the following chart displays the median sales per store vintage, excluding those stores affected by Hurricane Otis and Hurricane John in Acapulco.
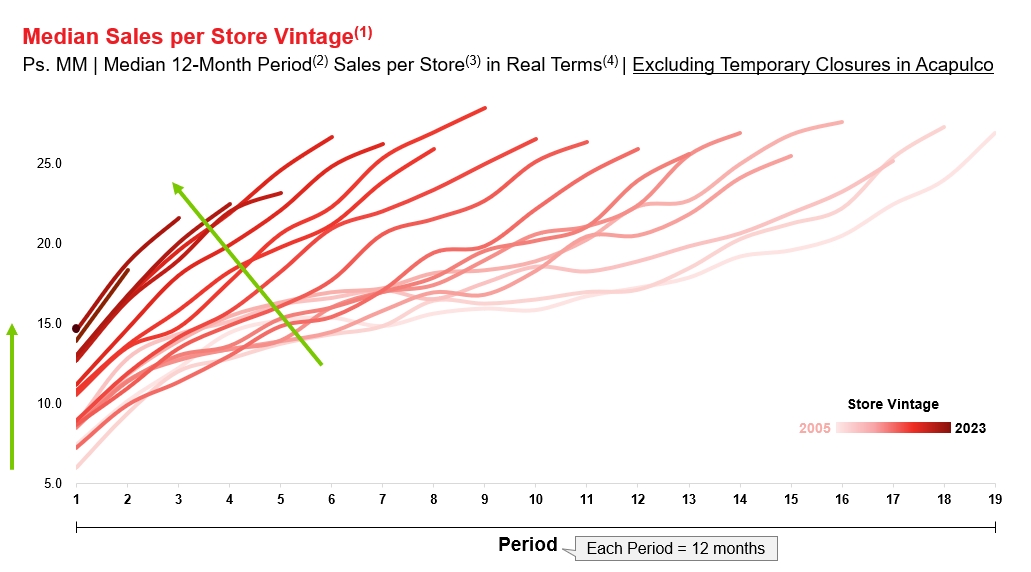
Source: Company information
96
Notes:
1. “Sales Ramp-up Evolution by Vintage” measures, for stores of the same vintage, the median of such stores’ revenue from sales of merchandise during 12-month periods since the start of operation. When calculating this measure, we exclude the first calendar month of a store’s operations to account for stores that are not open for the entire month, as well as stores that have been permanently closed
2. 12-month period since opening, excludes month 1. i.e., period 1 is from month 2 through month 13 since opening
3. Median 12-month period sales of all stores opened in the corresponding vintage (excludes first month to “normalize” dates in which stores are operational since opening). Closed stores are excluded from median calculation, as well as stores in Acapulco that suffered temporary closures due to Hurricane Otis and Hurricane John.
4. All figures in real Ps. terms as of December 31, 2024, adjusted for inflation using Mexican National Consumer Price Index (Índice Nacional de Precios al Consumidor), as provided by INEGI and as published by the Mexican Central Bank
As part of our disciplined expansion strategy, we seek to open stores that will meet the following target unit economics by their 36th month of operations.
Target Unit Economics(1)
Sales per Store (Ps. thousands) |
| Ps. |
| 26,600 |
|
4-Wall Profitability Margin (%) |
|
|
| 9.7 | % |
Average investment per store (Ps. thousands) |
| Ps. |
| 4,300 |
|
Payback period (months) |
|
| 25 months |
| |
Cash-on-cash return (%) |
|
|
| 60 | % |
Reflects targets for the 36th month of operations on an annualized basis.
These per store targets are based on the historical performance of our 2019 to 2024 vintages. As a reference, during 2023, our 2020 vintage stores, which is the most recent vintage with stores that have been operating for at least 36 months, achieved on a vintage basis, Ps.21.2 million of Sales per Store and a 4-Wall Profitability Margin of 9.7%. For each store, we target a 60.0% cash-on-cash return by the 36th month, based on a targeted average investment per store of Ps.4,300 thousand, which is slightly higher than our Average Investment per Store for our 2019 vintage to account for inflationary effects, expected slightly larger store sizes, additional refrigeration, increased air conditioning in tropical weather areas where we continue to expand and other improvements for new stores. Our goal is for each store to have a 25-month payback period. Based on our historical data, we believe that our targets are applicable to our stores generally, regardless of region or whether the store is in an urban, suburban or rural setting.
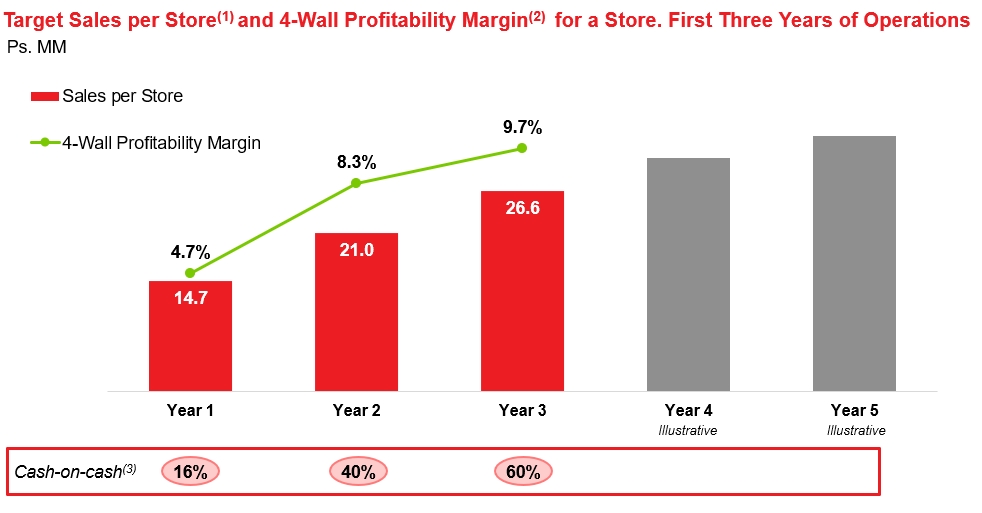
Notes:
1. | “Sales per Store” is the average of the revenue from sales of merchandise for a store open for a full year in consideration. |
2. | “4-Wall Profitability” for a given vintage is calculated as revenue from sales of merchandise, minus cost of sales, plus discounts and rebates, plus differences with suppliers, minus private label packaging expenses, minus shrinkage, minus store expenses, which include store |
97
| personnel expense, rent expenses, advertising, water, electricity, security, store and office equipment maintenance, building maintenance, stationery, waste and recyclable recollection services, and depreciation, among others. We calculate 4-Wall Profitability Margin for a period by dividing 4-Wall Profitability of stores of a certain vintage for the corresponding period by revenue from sales of merchandise for stores of that vintage for such period. |
3. | “Cash-on-cash” is calculated by dividing the 4-Wall Profitability of stores of a certain vintage for the period under consideration by the Average Investment per Store for stores of the same vintage. The “Average Investment per Store” measures the average investment required to open a store of a given vintage. We calculate the Average Investment per Store by adding the cumulative aggregate investment (including remodeling, furniture and equipment, shelfing, refrigeration equipment, security equipment, moving equipment, computer equipment, and others) incurred for all stores of a given vintage and then dividing it by the number of stores that opened during such vintage. |
Our Products & Suppliers
Types of Products we Carry
Our stores carry the leading brand products in their most popular size, as well as our private label products that we believe are of equivalent or better quality but at a lower price. In addition, we offer spot products (similar to Aldi’s Aktuell/Special buys): these are quality food and non-food products such as clothing, electronics, household goods and others. We introduce an array of approximately 50 spot products every two weeks on average, that offer notably high value for money and higher gross profit margins. They add a treasure hunt factor to our stores. We call them “Los Irrepetibles” as they are offered at prices so low that they will not be “repeated” (replenished) once we sell out.
Sourcing of Our Portfolio of Products
Each Tiendas 3B store carries on average 800 SKUs, as compared to 3,000 SKUs for a convenience store and approximately 10,000 or more SKUs for a conventional supermarket based on analysis of publicly available information. Our high purchasing power develops strong supplier relationships which in turn translates to better payment terms and lower purchasing costs that allow us to maintain our low prices, which in turn boosts sales. Our non-private label products are sourced directly form leading consumer good suppliers in Mexico. In 2023, we purchased from 322 suppliers, with our largest supplier’s products accounting for only 3.7% of our purchases, and the five largest suppliers accounting for only 16.8% of our purchases.
Our private label products are developed with manufacturers’ partners. These are carefully selected for their ability to provide high-quality products and scale production to meet demand, their efficiency, and their belief in our business model. We seek to build long-term partnerships with transparent pricing, proactively planning future manufacturing capacity and consulting on improved technologies.
Our ongoing growth strategy relies on the continued development and increased sales of our private label products. Our private label products are developed and designed largely by our in-house purchasing team, who are fully responsible for all aspects of the product. Our purchasing team is integral to our operations, ensuring that our supply chain is efficient and scales with our growth. The team identifies the required or potential new product, identifies the potential supplier, develops specifications and tests samples, designs the packaging and image, and selects and registers the brand name. Before launching a private label, the team tests it or a proxy product to determine price elasticity and fine tune the design for maximum sales and performance. To launch a product, a marketing and communication campaign is prepared targeting both our clients and our store teams. The purchasing team is tasked with developing enduring partnerships with our private label product suppliers in order to ensure supply chain synchronization, quality consistency and costs efficiencies.
According to Euromonitor 2023 report on “Retailing in Mexico,” the perception of private label brands continues to improve. In the past, private labels were perceived as inferior to the branded alternatives. Nowadays, Euromonitor states that Tiendas 3B has the most developed private label offering in Mexico, with a combination of low prices and good quality.
Pricing
Our pricing policy is designed to attract new customers and retain existing ones. We endeavor to sell our products at the lowest possible prices. We minimize our operating costs throughout all aspects of the value chain,
98
from site selection, store layout, merchandise selection, purchasing, staffing, distribution, and management. These savings are passed on to our customers by reducing the price of our products.
In order to ensure that our pricing remains competitive, we regularly monitor our competitors’ prices based on an index we have established for our top 100 SKUs by sales. We compare prices on average once every two weeks. Based on this index, our records suggest that during 2023, our prices were on average 14.6% below those of Bodega Aurrera, and 8.1% below those of Tiendas Neto. Moreover, we leverage our private label offering to offer tremendous value for money, typically pricing our products below the price of branded label alternatives in our competitor’s stores on a unit basis. For example, on a unit basis, based on our internal price check dated January 15, 2025, our private label Vaca Blanca whole milk was 31.0% cheaper than the leading brand alternative at a competing store and our dairy formula LactiBu, was priced 29.0% cheaper than the leading brand alternative at a competing store with Lactibu having a higher milk protein content. Similarly, on a unit basis, our pancake mix was 29.0% cheaper than the leading brand alternative at a competing store based on average market prices. As a further example, our chocolate ice cream is 25% cheaper than the leading brand alternative at a competing store.
We aim to keep our prices as stable as possible. We react rapidly to price changes by our competitors when warranted but we usually do not respond to short-term offers. We also endeavor to be the last retailer in the market to increase prices based on an increase in the cost of raw materials and the first retailer in the market to decrease prices based on a decrease in the cost of raw materials. Our goal is to gain customer trust and loyalty, especially from value-oriented customers.
Prices are determined at a Product and Pricing Committee meeting that takes place once a week. The Director of Purchasing meets together with the members of our Operation Committee, the Chief Executive Officer, and the relevant purchasers. We adopt a standard price (based on the pricing of our competition and our analysis of price elasticity for each product we sell) for all our stores. When required we will create a special price list to deal with a specific regional requirement to remain the competitive option for our clients.
Typically, we revise the prices for only a limited number of SKUs at each Product and Pricing Committee meeting. If certain pricing decisions must be made quickly, we are able to call a special meeting to react rapidly.
Quality Control
Quality control is key to building trust in our private label products and cementing our reputation. We conduct regular laboratory tests to check that contracted specifications are met, relying on well-regarded laboratories in Mexico, such as Cencon and Biofleming. We audit the manufacturing facilities of our suppliers on a regular basis. We perform quality checks of our products when they arrive at our distribution centers and randomly select samples for further laboratory testing. We also keep samples of every lot received in case we need to investigate a quality-related issue or to send a product to test if it complies with the contracted quality standards.
Our Customers
Our customer base is largely composed of smart value shoppers—aligned with our slogan “tu despensa inteligente” or “your smart pantry choice.” We serve the low-to middle socioeconomic segments in Mexico, specifically those in the second to ninth income deciles. However, our broader target increasingly encompasses value shoppers across all income brackets. We define our typical customer as anyone who buys groceries, primarily focusing on those looking for value for money, a convenient and pleasant shopping experience, and minimizing transportation costs.
Approximately 85.0% of our customers are women, primarily between the ages of 30 and 60. The majority are homemakers (46.0%), followed by employed individuals (28.0%) and small merchants or shopkeepers (15.0%). New customers initially buy in our stores because of the competitive pricing of our branded and spot products. Over time, however, as they become more familiar with our offering, customers begin to try our private label products, which eventually become their preferred choice for their mix of value and quality.
99
The shopping experience is typically localized, as most customers live within a 10-street (800-meter) radius of their favored store. They visit our stores three to four times a week, purchasing enough for a maximum of two days. For items we currently do not offer, like fresh fruits and vegetables, they complete their shopping needs within the neighborhood.
Sales and Marketing
We price our products at the lowest sustainable price and for simplicity maintain standard price lists across all our stores. Our products do not go on sale and any promotional activity does not involve changes in prices. The one exception being the end-of-life products that get heavily discounted.
We have a no-questions-asked no-receipt needed money-back return policy. To instill customer confidence in our product offering, we allow customers to return any product if they are dissatisfied with it, with no questions asked and without requiring a receipt. This marketing strategy allows customers to test our private label products and break ingrained consumption patterns associated with very traditional brands.
We do not engage in material levels of advertising. We prefer to invest in offering the lowest price possible for our customers. Our marketing strategy is low-cost and efficient, consisting mostly of in-store advertising using our radio channel and displaying posters with impactful messages. We selectively use flyers for new store openings and to promote seasonal products. We conduct activation campaigns where for two weeks we display a given private label product at the end of the check-out counter (without any additional discount). Our preference remains to skip initiatives that add costs and instead focus on lower prices to drive customer loyalty. Word of mouth remains our most potent marketing tool.
Seasonality
Since our products mostly consist of food staples, our sales are not generally affected by seasonality. Variations in our performance from quarter to quarter are generally a consequence of store openings and holidays. Therefore, the results for a given quarter may not be indicative of results expected for the entire year.
Logistics
Consistent with our efficiency focused operational ethos, we have built efficient distribution and fulfillment capabilities. Our decentralized organization is built around autonomous regions. Each region has a distribution center and its own truck fleet that serves its stores. This decentralization reduces complexity and therefore costs, including logistics costs.
Distribution Centers
We believe we are highly efficient with our logistics and distributions infrastructure without sacrificing service and speed. As of December 31, 2024, we operated 16 distribution centers. Each serves approximately 150 stores, with a capacity to stretch to serve up to 200 stores, within a 150-kilometer radius, within a capacity to stretch up to a 200-kilometer radius. When the number of total stores served by any given distribution center approaches the 150-store mark, we proceed to open a new distribution center nearby and redistribute the stores to optimize distances and routing.
A typical distribution center is 12,000 square meters, with additional space for a maneuvering yard. Each distribution center carries the vast majority of the SKUs we sell, including refrigerated items. Frozen items, a relatively new category, are being rolled out to all our stores gradually as we build frozen refrigeration in our distribution centers.
Our distribution centers are designed to be efficient and reduce the amount of man hours required to move our products. We make use of cross-docking, whenever possible, use an ABC layout, which allocates space depending on inventory turnover, and favor floor storage instead of racks, as it is more efficient for fast-moving SKUs.
100
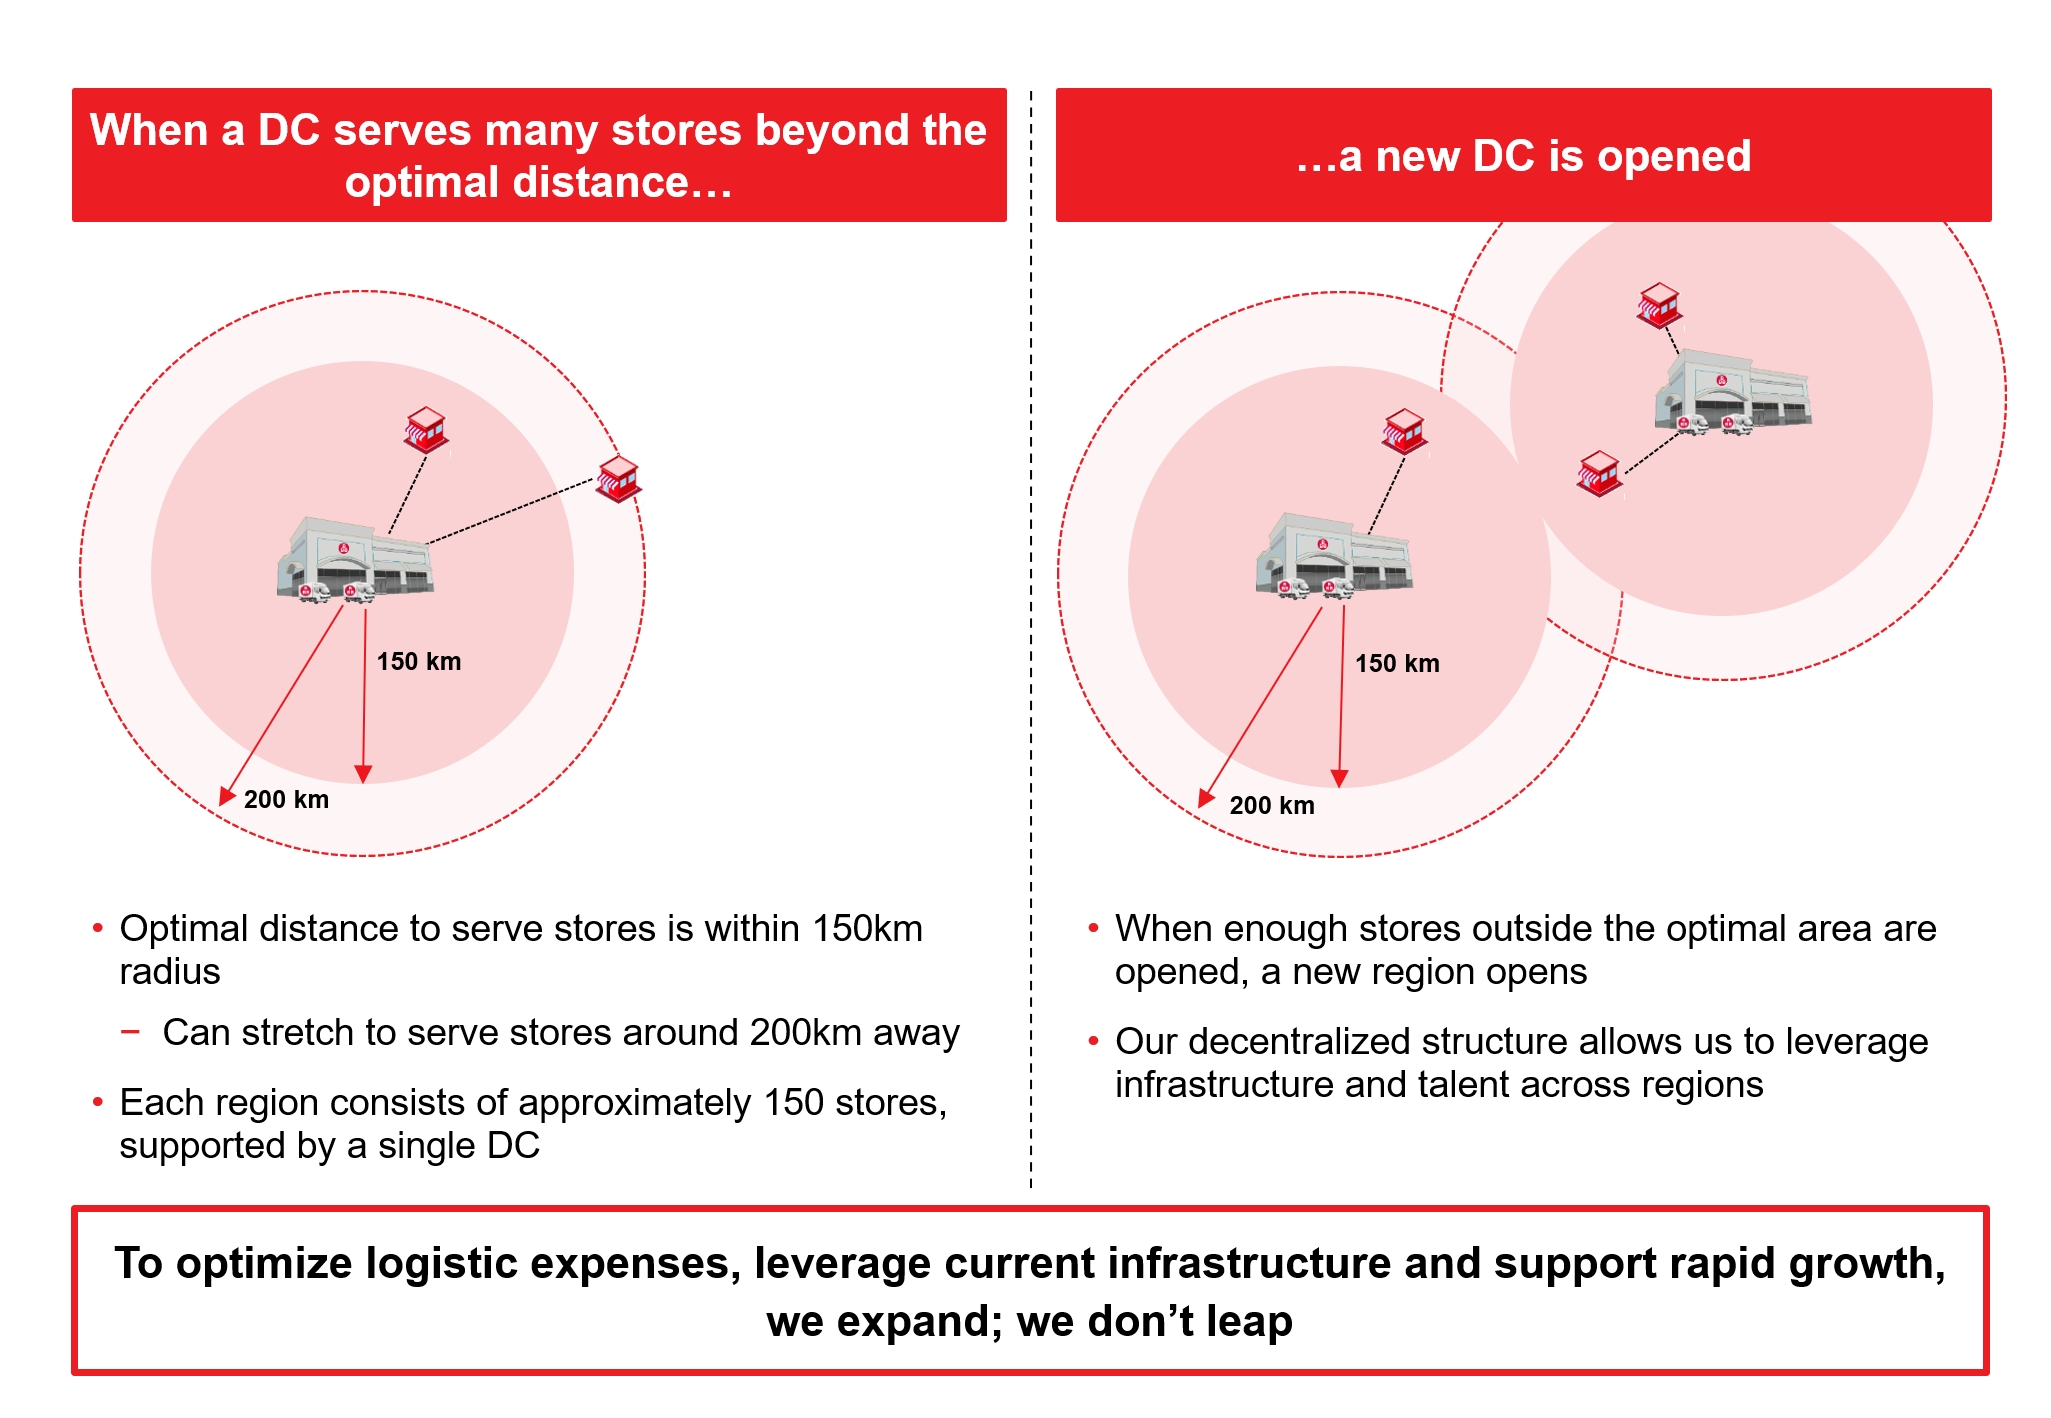
The main operations and process of our distribution center consist of:
Receiving
After placing an order with our suppliers, a receiving appointment is made, with a receiving dock reserved, and a receiving team programmed to unload the order when it arrives. The process is designed to take up the least amount of time possible from the moment our supplier arrives at the distribution center to the moment it leaves.
Picking
Store orders are processed overnight and ready to pick up in the morning. Pickers receive their “pick lists” on their mobile devices, which tell them what to pick. Once an item is picked up, the order is updated and confirmed on the mobile device. This system, tailor-made to support our process, allows for accurate and quick picking. In addition, we incentivize efficient picking by giving picking speed and accuracy bonuses to our pickers.
Store fulfillment
Once the order of a store has been picked, it is checked and palletized ready to be loaded in the truck that will deliver the order to the store that same day.
The proximity of our distribution centers to our stores allows for optimal re-stocking frequency and route planning. Store restocking frequency is dynamic and ranges from twice a week to daily and depends on sales volumes. We fulfill store orders one day after an order is placed. A single truck can visit up to four stores per day.
As of December 31, 2024, we operated a fleet of 367 same-model trucks and over 971 utility for our District Managers, Zone Managers and other personnel. Standardization simplifies truck management and operations thus reducing costs. For security and for key performance indicator management, we monitor our fleet through real-time geographic positioning, live video, and dual-way audio.
A fundamental part of our logistics operation is our drivers. We provide a comprehensive 385-hour training program where the operator is taught skills covering mechanics, driver education, regulations, and service culture.
101
Since December 31, 2023, our academy has become compulsory for all our drivers to ensure better logistics efficiency, timeliness and safety.
Operations and Decision-Making
We have a decentralized and lean organizational structure built around autonomous regions, each led by a Regional Director. Each region consists of approximately 150 stores and a distribution center. A region has all the functional areas it needs to operate autonomously. These include human resources, real estate, logistics, IT and regional purchasing and accounting. All regions are similarly sized, organized and operated.
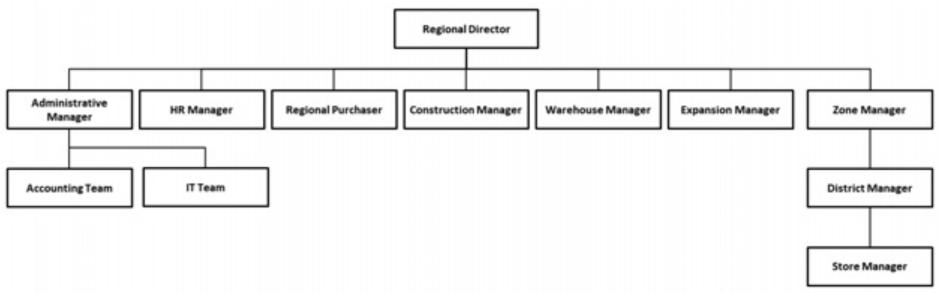
Sales and Operations
Each region typically has two Zone Managers, each of whom is responsible for 40 to 80 stores. The Zone Manager reports directly to the Regional Director on all matters related to store operations and sales. A Zone Manager is responsible for ensuring the efficient operations of stores and for their maintenance and must visit each of their stores at least once every two months. Each Zone Manager oversees six to 10 District Managers. A District Manager ensures that the stores’ operations are conducted in compliance with our procedures and rules. They are responsible for visiting each store at least twice a week and monitoring competition and general market conditions, controlling inventories and ordering procedures, and recruiting new store employees.
Logistics
A Distribution Center manager reports directly to the Regional Director and oversees all logistics and fulfillment matters. Their direct reports consist of the heads of receiving, picking, and dispatching and they are responsible for maintaining an efficient and disciplined logistics operation.
Human Resources
Our regional human resources teams are responsible for recruiting, training, and developing all personnel their region. They monitor and enforce adherence to centrally set human performance indicators, such as turnover rates and specific development tracks for roles like Store Manager, District Manager, Zone Manager and Regional Director. Additionally, they manage the annual training plans and warehouse development programs. When a labor-related issue arises the team actively manages it. The team also assess workplace quality and metrics. Their role is pivotal in maintaining a balanced and effective workforce aligned with our culture and corporate objectives.
Real Estate
Our regional real estate team is tasked with securing and opening new stores. A significant part of their role is the negotiation of lease terms and ensuring compliance with our unit economic targets for each potential opening site. By maintaining a database of potential locations and competitor insights, they enable data-driven decision-making. The team maintains an open line of communication with district and zone managers, allowing real-time market analysis that informs our broader expansion strategy.
102
Administration and Accounting
Our regional administration and accounting teams primarily focus on operational finances. The team collaborates closely with Zone and District Managers to manage budgets and ensure operational efficiency. They track store-level financial performance indicators such as 4-Wall Profitability and capital expenditures. They assist in the planning and execution of initiatives like inventory control, labor costs, and expense management. Cash flow and basic accounting tasks are managed to ensure the region’s financial health. Their work acts as the financial backbone for the region, aiding in tactical decision-making while aligning with the company’s broader objectives.
Purchasing
The regional purchasing team is responsible for executing purchase orders based on demand forecasts and supplier lead times, as well as for maintaining optimum inventory levels in the region. To meet regional tastes, they manage a portfolio of up to 10 regional SKUs, and are responsible for negotiating, purchasing, and managing these products. The team actively participates in bi-weekly and monthly operational meetings to address concerns and propose improvements. Their activities are integral to ensuring smooth and cost-efficient operations.
IT Support
The regional IT Support team ensures the seamless operation of information and communication systems by resolving technical issues and incidents in computing equipment. The team performs remote and on-site troubleshooting. They also execute preventive maintenance and are in charge of any regional special projects.
Our Regional Directors meet with the members of our Operation Committee every quarter. At these meetings, the Regional Managers discuss issues affecting their regions and make decisions that will be applied across the company.
Our Headquarters
Our central office (headquarters) is located in Mexico City and is home to our Chief Executive Officer, Chief Financial Officer and Investor Relations Officer, Director of Sales and Operations, Director of Purchasing, Director of Human Resources, Director of Information Technology and Director of Real Estate.
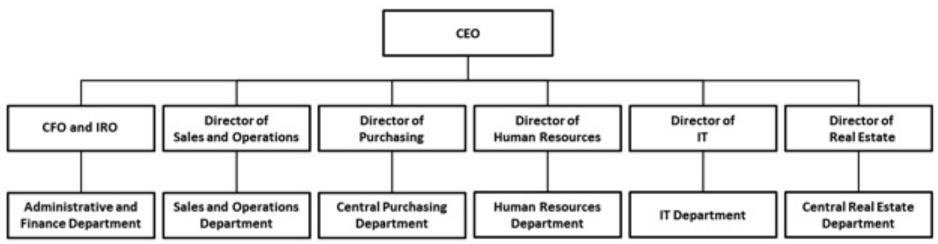
Our headquarters is also home to our Product and Pricing Committee, our Operation Committee, our Central Purchasing Department, our Finance and Administration Department, our Central Human Resources Department, and our Information Technology Department.
Our Central Purchasing Department is responsible for all decisions relating to our suppliers and purchasing prices. Our finance and administration department is responsible for financial reporting, treasury, taxes and budgeting. Our Information Technology department is responsible for ensuring the smooth and uninterrupted operations of all our systems as well as the development of all our future technology-driven capabilities. Our human resources department coordinates recruitment for our headquarters and managers and above levels in regions; they also shape culture and training efforts across the organization. Our real estate department oversees openings and
103
negotiation of stores across the region, defines annual goals for new locations, and identifies and negotiates locations for distribution centers.
Committees
Our Product and Pricing Committee consists of our Director of Purchasing, our Director of Sales and Operations and our Chief Executive Officer. This committee discusses and makes decisions on all matters related to introducing new products, phasing out existing products, testing products, quality control issues and changing prices. It is also responsible of approving overall promotions and advertisements.
Our Operation Committee is responsible for overseeing our operations, as well as general company strategy. It is chaired by our Chief Executive Officer and includes our Chief Financial Officer and Investor Relations Officer, our Director of Sales and Operations and our Director of Human Resources.
Human Capital and Our Culture
At the heart of our corporate culture are our core values: trustworthiness, honesty, and modesty. We view these values as central to our past success and future aspirations. We strive to instill these values in all our employees and suppliers to improve the communities where we operate. As of December 31, 2024, of our 25,300 employees, 4,070 were employed in our warehouses and distribution centers, 20,848 were employed at our stores and 382 were employed in our corporate offices. We endeavor to provide competitive compensation and benefits that attract and retain top-tier talent and are committed to promoting diversity among our teams through an inclusive culture that seeks to integrate people from different parts of the world that enrich and support efforts to meet business objectives.
We prioritize continuous learning and development for our employees. In 2018, we introduced “University 3B” (or “Universidad 3B”), an online training initiative. Our employees are automatically enrolled to the platform which offers over 100 courses, from theoretical insights to practical applications, covering key areas such as our business model, process protocols, safety guidelines, exclusive brand knowledge, and role-specific certifications.
In order to cultivate leadership, we have developed a specialized program to accelerate the growth of key-talent within our organization. During this 78-hour program, we focus on skills relating to supervision, management decision-making, result focus, information and management and information analysis. This program is conducted twice a year with a local prestigious university, the Escuela Bancaria y Comercial. This initiative has led to the promotion of over 42 employees to managerial positions between January 1, 2023, and December 31, 2024.
We champion career growth with a hands-on evaluation program, designed to propel employees’ career trajectories within the company. A key initiative of our training and employee development is our performance review process. Our digitalized process allows us to measure key employee metrics and competencies based on each employee’s position.
Employee growth and retention are at the forefront of our strategies. We diligently track metrics like applications, staffing, turnover, and internal promotions. Our comprehensive career plans coupled with a meritocratic advancement model, offer multidisciplinary career growth opportunities. During 2024, we promoted 4,970 of our employees, reflecting our commitment to career development and growth within our organization.
We recognize that our employees’ well-being is paramount to their professional success. To further our commitment, we have a toll-free telephone line handled by health professionals who provide psychological, nutritional, and medical advice to our employees.
104
Integral to our corporate culture is the value we place on open communication. We believe in empowering our employees and that they should have voice in company matters. For example, all employees have access to a platform with direct access to our Chief Executive Officer, all improvement proposals are heard and responded to through this platform. Proposals that we believe may add value to the business are analyzed in detail and implemented.
Regulatory Considerations
Our business and operations are subject to various laws and regulations as well as local governmental authorizations to open and operate our stores. Our Mexican subsidiary’s operations are primarily governed by the Mexican Corporations Law and associated provisions, while real estate property leasing activities in Mexico are governed by the Mexican Constitution, state civil codes, and various laws and regulations, which provide a legal framework for the use, operation, and transfer of real estate properties in Mexico, including environmental matters.
We are also subject to the provisions contained in the Mexican Intellectual Property Law (Ley de Propiedad Industrial) with respect to the use of our trademarks, and to the Mexican General Health Law (Ley General de Salud) and the Mexican Official Standards (Normas Oficiales Mexicanas) for the health and safety practices involved in the preparation, distribution and sale of food products. Our failure to comply with any of these laws and norms may result in the imposition of administrative penalties, including fines and the temporary or permanent closure of our facilities. We believe that as of this date we are in substantial compliance with all such laws and norms.
More specifically, we and the various properties we lease and which are used as stores or warehouses are primarily subject to the following Mexican laws and regulations:
Local Laws and Regulations
Our stores are subject to various local laws and regulatory requirements, including permitting and licensing requirements. Local regulations, including municipal or local ordinances, zoning restrictions and other restrictions imposed by local authorities or private community organizations may restrict the use of our properties and may
105
require us to obtain approval from such bodies at any time with respect to our stores, including prior to developing such properties or when developing or undertaking renovations of our stores. As part of the development process, we are required to obtain the applicable land use certificates, construction permits, operating licenses and fire and safety approvals from the Civil Protection Office (Oficina de Protección Civil).
Expropriation
None of our stores have been expropriated to date. However, under the Expropriation Law, the government has the power to expropriate or temporarily occupy in whole or in part any land or real estate property inside Mexican territory. Expropriation may be carried out in the public interest or for national security reasons. In the event of expropriation, the owner is to be paid compensation, we as tenants would not have the right to directly receive any compensation if the land where a store is located is expropriated. If there is disagreement as to the amount payable as compensation, a judicial authority may be asked to determine such amount. There is no clear definition as to when a compensation payment for the expropriation of any of the properties would be made or as to the payment amount the owner or we as tenants would receive in such event.
Environmental Regulations
As of this date, we do not have environmental certifications of any kind. The construction and operation of our stores and distribution centers may be subject to the Mexican General Law on Ecological Balance and Environmental Protection (Ley General del Equilibrio Ecológico y la Protección al Ambiente, or the “Mexican General Environmental Law”) and the related implementing regulations, the General Law for the Prevention and Comprehensive Management of Waste (Ley General para la Prevención y Gestión Integral de los Residuos) and the related implementing regulations, the National Waters Law (Ley de Aguas Nacionales) and the related implementing regulations, the Regulations for Environmental Protection Against Noise Pollution (Reglamento para la Protección del Ambiente contra la Contaminación Originada por la Emisión de Ruido), the General Law for Sustainable Forest Development (Ley General de Desarrollo Forestal Sustentable), the General Law on Wildlife (Ley General de Vida Silvestre), the General Law on Climate Change (Ley General de Cambio Climático), numerous Mexican Official Standards (Normas Oficiales Mexicanas), and other federal, state and municipal environmental laws and regulations and agency agreements where our stores and/or facilities are located or could be developed (collectively, “Environmental Laws”).
The Mexican General Environmental Law generally sets forth the legal framework applicable to the environmental impact procedure as well as the release of contaminants into the environment. The regulations that have been issued pursuant to this law affect ecological planning, risk assessment and environmental impact, air pollution, protected natural areas, protection of flora and fauna, preservation and prudent use of natural resources and soil pollution, among others. Additionally, the Mexican General Law for the Prevention and Comprehensive Management of Waste regulates the generation and handling of hazardous waste and materials as well as the release of contaminants into the environment.
Non-compliance with the Environmental Laws may result in the imposition of administrative fines or sanctions, remedial actions, revocations of authorizations, licenses, or permits, administrative arrests, temporary or permanent closure of facilities, or imprisonment, when environmental violations are classified as criminal offenses.
In our process of developing stores and distribution centers, our approach is to adhere to an environmental management system and certain environmental guidelines. This does not mean that we have specific environmental policies or certificates, recognitions, or programs for environmental and natural resource protection, defense, or restoration. While we cannot assure you that in all cases, we are and will be in full compliance with all laws, we believe that the stores and distribution centers that we develop: (i) do not represent a significant environmental risk, (ii) have all relevant material permits and authorizations, and (iii) comply with all applicable Environmental Laws.
106
Compliance and Controls
We are fully committed to maintaining strong compliance and controls for financial reporting, as evidenced by the measures currently being implemented. The Company recognizes the significance of accurate and reliable financial information in building investor trust. To establish a robust internal control framework, Tiendas 3B has conducted a comprehensive assessment of potential risks and documented them meticulously. Key control activities are being designed and implemented to mitigate these risks and ensure the completeness and accuracy of financial reporting. In addition, information and communication channels are being strengthened to promote timely and accurate reporting. Tiendas 3B’s proactive approach to compliance and controls underscores its commitment to upholding high standards of transparency and adherence to relevant laws and regulatory requirements.
Legal and Administrative Proceedings
From time to time, we are or may become involved in disputes that arise in the ordinary course of our business. Any claims against us, whether meritorious or not, can be time-consuming, result in costly litigation, require significant management time and result in the diversion of significant operational resources. We are subject to several legal proceedings, including civil and labor claims, which we generally believe are common and incidental to business operations in Mexico.
We record provisions, if any, based on our external and in-house counsel’s assessment of the likelihood of loss as well as the history of similar and related proceedings. Our financial statements reflect the provisions for legal proceedings in accordance with accounting rules when our external counsel advises that (i) an outflow of resources is probable to settle the obligation and (ii) a reliable estimate can be made of the amount of the obligation. Our provisions for probable losses arising from legal proceedings are estimated and periodically adjusted by management after consideration of the opinions of our external counsel.
As of September 30, 2024, we had not recorded any provisions in connection with legal proceedings based on probable loss. However, legal proceedings are inherently unpredictable and subject to significant uncertainties. If one or more cases result in a judgment against us in any reporting period for amounts that exceed our management’s expectations, the impact on our operating results or financial condition for that reporting period could be material.
On February 1, 2023, the Mexican tax authority (Servicio de Administración Tributaria, or the “SAT”) commenced an audit of our tax return for the fiscal year ended 2018. The SAT is questioning the deductibility of certain expenses for services. The SAT is also asking for a reduction of the capital contribution account balance. The audit and the substance of questions raised by the SAT are consistent with audits currently undertaken by the SAT with respect to other Mexican corporate taxpayers. However, the challenges made by the SAT refer to actual operating expenses incurred by the Company, which were necessary for the operation of the Company and which the Company believes were properly supported and documented.
We are currently undergoing a mediation process with the tax authority and the Mexican tax ombudsman (Procuraduría de la Defensa del Contribuyente) to attempt to reach a settlement. As of today, we are in the final stage of a possible settlement; once this settlement has been finalized, we will be able to know the possible tax assessment, if any. To the extent the mediation is not resolved to our satisfaction and the SAT determines that taxes are owed, we would expect to exercise our legal rights including the right to appeal such determination. In such event, to the extent it were to occur, any appeal process could take a number of years to conclude and there is no assurance whether we will prevail.
See “Risk Factors—Risks Relating to Our Business and Industry—Our operations are subject to the general risks of litigation.”
107
Intellectual Property
Our most important brands, slogans and logos are protected by trademarks in Mexico through registration with the Mexican Industrial Property Institute (Instituto Mexicano de la Propiedad Industrial). Protection of a trademark in Mexico continues for as long as the brand is registered and used. As of September 30, 2024, we had approximately 1,491 owned brand files and registries in Mexico. In addition, within Mexico our licensors register their own brands granting us the right to use them within the territory.
Properties
As of December 31, 2024, we only owned one property used in our operations. Our remaining 2,771 stores and office space is leased from a wide array of landlords. No landlord represents more than 6.5% of our lease expense. We believe that having a diffuse landlord base allows us to achieve better commercial lease terms. Each of our lease follows a standard form of Mexican law governed agreement, which includes a 10-year term with an automatic 10-year renewal and may be terminated at will by us. To minimize our initial store expenditures, we typically only advance two months of rent and give one month of rent as a security deposit. In some jurisdictions, the local civil code additionally requires that the landlord grant us a right of first refusal in the event they decide to sell the relevant property to a third party.
108
MANAGEMENT
We are managed by our board of directors and by our senior management, pursuant to our memorandum and articles of association.
Board of Directors
Our memorandum and articles of association provide that the board of directors will be composed of a minimum of seven directors and a maximum of 15 directors, with the number of board seats being exclusively determined by a resolution of directors (and, for the avoidance of doubt, the size of the board of directors may not be changed by the shareholders of the Company at any time (whether by resolution of members, special resolution of members or otherwise)).
Our board of directors is composed of nine members. Our directors do not have a retirement age requirement under our memorandum and articles of association.
Our memorandum and articles of association provide that, subject to certain exceptions, directors are elected by resolution of our shareholders, which requires the affirmative vote of a plurality of the votes cast on the resolution by the shareholders entitled to vote who are present, in person or by proxy, at the meeting (notwithstanding that such votes may represent less than a majority of the votes represented at the meeting and entitled to vote). Each director is appointed and elected for such term as set out in our memorandum and articles of association or until his or her earlier death, resignation or removal.
Our memorandum and articles of association provide that our directors are divided into three classes designated as the “Class I,” “Class II,” and “Class III” directors. Each director will serve for a term ending on the date of the third annual general meeting of the shareholders following the annual general meeting of the shareholders at which such director was elected (except that the terms of the Class I, Class II and Class III directors listed below expire at the annual meetings identified below), subject to the provisions of our memorandum and articles of association. The Class I directors that were put in place upon consummation of our IPO will hold office until our next annual general meeting. Our directors have been divided among the three classes as follows:
See “Description of Share Capital” for further information.
109
The following table sets forth the current members of our board of directors and their ages as of December 31, 2024.
Name |
| Age |
| Position |
|
K. Anthony Hatoum |
| 61 |
| Chairman |
|
Nicole Reich |
| 59 |
| Independent Director |
|
Dan Gertsacov |
| 49 |
| Independent Director |
|
Jean-François Le Ruyet |
| 56 |
| Director |
|
Alexander Fuster |
| 59 |
| Independent Director |
|
Juan Pablo Cappello |
| 57 |
| Independent Director |
|
Sami Khouri |
| 73 |
| Independent Director |
|
Alexis Meffre |
| 49 |
| Director |
|
Stephanie Martinez |
| 48 |
| Independent Director |
|
The business address of our directors is Av. Presidente Masaryk 8, Polanco V Sección, Miguel Hidalgo, Mexico City, Mexico 11560. The following sets forth biographical information for each of the members of our board of directors:
K. Anthony Hatoum
K. Anthony Hatoum is the founder, Chairman of the board of directors and Chief Executive Officer of the Issuer. Mr. Hatoum began his professional career in J.P. Morgan’s investment banking division in New York and later as a Senior Engagement Manager at McKinsey & Co. in New York. He later joined Merrill Lynch’s global private equity group as a Managing Director where he covered BIM, the Turkish hard-discount food retailer. Mr. Hatoum began his first of a series of entrepreneurial ventures in 1998, and he also co-founded Advantage Card, a leading credit card, consumer finance and loyalty program in Turkey and then went on to co-found E-bebek, a leading retailer of baby products in Turkey and among the first online retailer in Turkey. Mr. Hatoum holds a Bachelor’s Degree in Civil Engineering from Columbia University, a Master’s Degree in Civil Engineering from the Massachusetts Institute of Technology and an MBA from Stanford Graduate School of Business.
Nicole Reich
Nicole Reich has been a director of the Issuer since 2023. Ms. Reich is the President of the Board of BNP Paribas Cardif Mexico, the insurance arm of BNP Paribas in Mexico, where she previously served as chief executive officer for eight years. Ms. Reich has held other leadership positions in the financial sector, primarily across Latin America, including at The Bank of Nova Scotia and Citi. Ms. Reich also serves as president of the Risk and Audit Committees of multiple institutions. She has received numerous accolades, including “Woman of the Year” by the Mexican Senate. Ms. Reich holds a Bachelor’s Degree in Computer Science from the Instituto Tecnológico de Estudios Superiores de Monterrey and an MBA from the Instituto Tecnológico Autónomo de México (ITAM) with postgraduate studies at the Kellogg School of Business at Northwestern University.
Dan Gertsacov
Dan Gertsacov has been a director of the Issuer since 2023. Mr. Gertsacov is an executive with 25 years of experience in the technology, food and restaurant industries. His experience includes senior roles at Google, Arcos Dorados and Focus Brands. Mr. Gertsacov is a Senior Advisor at McKinsey & Company. He holds a Bachelor of Arts degree with Honors from the University of Richmond and an MBA from Harvard Business School.
Jean-François Le Ruyet
Jean-François Le Ruyet has been a director of the Issuer since 2023. Mr. Le Ruyet is a partner at Quilvest Capital Partners, where he is the co-manager of the global co-investment and fund programs with a focus on European buy-out funds. He also serves on Quilvest Capital Partner’s global investment committee and the co-investment investment committee. Prior to joining Quilvest Capital Partners in 2003, Mr. Le Ruyet was management and strategic consultant with Bain & Company and later with McKinsey & Company. At McKinsey, he worked with
110
several European private equity sponsors with a focus on media and consumer goods and was involved with strategic and market due diligence as well as merger and acquisition valuation. Prior to his consulting career, he worked for two years at Société Générale in São Paulo, Brazil. Mr. Le Ruyet received his undergraduate degree from Ecole des Hautes Etudes Commerciales in Paris, France and an MBA from Columbia Business School.
Alexander Fuster
Alexander Fuster has been a director of the Issuer since 2011. Mr. Fuster is currently a private investor and heads a family office based in Miami, Florida. Prior to his current role, Mr. Fuster co-founded and led a series of privately-held healthcare investments in managed care, and medical services provider networks with an integrated pharmacy delivery system in Florida. He was a founding principal at Penske Capital Partners, a private equity firm in New York and also served as president of Leland Corporation, a private investor venture fund. Mr. Fuster was also a consultant at McKinsey & Company and an accountant and consultant for PricewaterhouseCoopers. He holds a Bachelor of Sciences in Business Administration degree with high honors from the University of Notre Dame and an MBA from Stanford University’s Graduate School of Business.
Juan Pablo Cappello
Juan Pablo Cappello has been a director of the Issuer since 2020. Mr. Cappello is the co-founder and partner of PAG Law and has been actively advising companies throughout Latin America for over thirty years since he began his legal career at one of the leading law firms in Santiago, Chile. His practice has focused on financial technology and digital assets, having served as the chief legal officer of Patagon.com, considered among the first financial technology business in Latin America, and led the in-house team in the sale to Santander. Mr. Cappello has since been involved in the co-founding of other business ventures, including NUE Life Health and Wonder.com. He is actively involved in the growth of development of Miami’s technology ecosystem, having founded LAB Miami, LAB Ventures and Miami Angels. PAG Law has been named Latin American Venture Capital Law Firm of the Year – 2022 by Global 100. Mr. Cappello received his undergraduate degree from Duke University and his law degree from NYU Law School.
Sami Khouri
Sami Khouri has been a director of the Issuer since 2004. Mr. Khouri is the chief executive officer and a board member of United Investors Holding SAL, a Beirut-based group of distribution companies, that retail and distribute brands such as Nike, Converse and Levi’s. Since 1975, he has been actively involved in various business enterprises and has founded different ventures in diversified sectors, including local consumer goods industries, import and distributorships for multinational suppliers in fast moving consumer goods, pharmaceuticals, real estate development and investment banking. Mr. Khouri also serves as director in Gazzaoui Holding, an electrical component and water pump distributor in Lebanon and Qatar, as well a director of Eathos Ltd, a restaurant franchise operator in the Kingdom of Saudi Arabia and the Gulf states. Additionally, he is actively involved in several non-governmental organizations. Mr. Khouri serves as a director of Endeavor, global organization that supports high-impact entrepreneurs in emerging markets, The Lebanese Center for Palliative Care/BALSAM and Ruwwad Al Tanmeya in Lebanon, which is focused on the empowerment of marginalized societies through scholarships for education, and as a Trustee of Nusaned, a humanitarian community-based Lebanese NGO. He holds a degree in Economics from the American University of Beirut.
Alexis Meffre
Alexis Meffre has been a director of the Issuer since 2023. Mr. Meffre joined Quilvest Capital Partners in 2018 as its Executive Chairman and he currently serves as CEO and heads its Executive Committee. He has over 20 years of private equity and finance experience across Europe, the United States and in Emerging Markets. Prior to joining Quilvest, Mr. Meffre was a Director at ACG Capital (ex Groupama Private Equity), co-manager of the investment team and member of the investment committee. At ACG Capital, he was leading private equity fund investments in primary and secondary opportunities, buy-out, venture capital and/ growth equity, debt and mezzanine, infrastructure and special situations. Mr. Meffre was also actively involved in client relationship, fundraising and new products development. From 2003 to 2007, he worked at Proparco (a French Development Financial Institution) where he co-founded the Private Equity team, focusing on emerging markets (direct
111
investments, private equity fund investments and co-investments). Mr. Meffre began his career as financial analyst in Sydney with BNP PARIBAS Equities Australia and then joined Goldman Sachs Global Investment Research focusing on EMEA markets in London. He serves on the Bemberg Family Council, as well as the Boards of Bemberg Capital, Quilvest Capital Partners SA, Quilvest Capital Partners AM SA (the Quilvest Group AIFM). Mr. Meffre is a graduate from HEC Paris (Hautes Etudes Commerciales) and IEP Paris (Institut d’Etudes Politiques de Paris).
Stephanie Martinez
Stephanie Martinez has been a director of the Issuer since 2023. Ms. Martinez is currently the managing director for France of Montblanc, a German luxury pen and accessory label owned by Richemont. Before 2024 and for 10 years, she was the managing director of the same company for Latin America, where she oversaw the brand’s expansion into the region. Prior to Montblanc, Ms. Martinez was the managing director for Mexico of Swarovski, an Austrian family business in its fifth generation. She has also held positions at luxury label Chanel. Ms. Martinez holds a business degree from Neoma Business School and a diploma from Instituto Tecnológico Autónomo de México (ITAM).
Executive Officers
Our officers are appointed by the board of directors. The following table sets forth our current executive officers, their titles, their ages and the years with our company as of December 31, 2024.
Officer |
| Position |
| Age |
| Years with our company |
|
K. Anthony Hatoum |
| Chief Executive Officer |
| 61 |
| 20 |
|
Eduardo Pizzuto |
| Chief Financial Officer and Investor Relations Officer |
| 54 |
| 17 |
|
Diego Apalategui |
| Director of Sales and Operations |
| 48 |
| 20 |
|
Luis Bermúdez |
| Director of Purchasing |
| 54 |
| 6 |
|
Javier Suárez |
| Director of Human Resources |
| 48 |
| 20 |
|
Pablo Grattarola |
| Director of Information Technology |
| 52 |
| 1 |
|
Alejandro Dávila |
| Director of Real Estate |
| 47 |
| 2 |
|
The business address of our key executives is Av. Presidente Masaryk 8, Polanco V Sección, Mexico City, Mexico 11560. The following sets forth biographical information for each of our key executives:
K. Anthony Hatoum. See “—Board of Directors.”
Eduardo Pizzuto
Eduardo Pizzuto is the Chief Financial Officer and Investor Relations Officer of the Issuer. Mr. Pizzuto has been with the Issuer since 2007, actively involved in various capacities which include expansion, procurement and operational aspects, while overseeing financial aspects of the business. Before joining the Issuer, he was chief executive officer at a valve manufacturing company. Mr. Pizzuto has also worked for Nestlé Purina, managing its Wal-Mart Sam’s account in Bentonville, Arkansas, and later serving as the National Sales Manager of Nestlé Purina in Mexico. Mr. Pizzuto holds a Bachelor’s Degree in Industrial Engineering from Universidad Iberoamericana in Mexico and an MBA from Cox School of Business at Southern Methodist University.
Diego Apalategui
Diego Apalategui is the Director of Sales and Operations of the Issuer. Mr. Apalategui has over two decades of experience in the retail industry. After beginning his career as a restaurant manager with Burger King Argentina, he transitioned to EKI, a then nascent retail venture with just six stores which scaled during Mr. Apalategui’s tenure to 250 stores. Mr. Apalategui joined Tiendas 3B in December 2004 as Director of Sales and Operations. He graduated as a commercial agent from the Navy Commander Tomas Espora secondary school in Buenos Aires.
112
Luis Bermúdez
Luis Bermúdez is the Director of Purchasing of the Issuer. Mr. Bermúdez has more than 20 years of international experience in category management and strategic purchasing with a focus on private label assortment building and discount retailing concepts. He began his career at Lidl Discount Spain as a Category Manager and then transitioned to Aldi Discount Spain, where he managed a broad portfolio of providers. Before joining Tiendas 3B in 2018, Mr. Bermúdez served as Import Categories Purchasing Manager for the Saudi Market at Dukan Retailing Discount Company While there, he was involved in the company’s purchasing strategy. Mr. Bermúdez holds a Bachelor’s Degree in Business Administration, with a specialization in Market Research, from the Escuela Superior de Negocios y Marketing in Zaragoza, Spain. He also holds an MBA from ESIC Business & Marketing School in Barcelona, Spain.
Javier Suárez
Javier Suárez is the Director of Human Resources of the Issuer. Mr. Suárez has been with the Company since 2004 helping shape the growth and development of Tiendas 3B’s workforce. He began his professional career in operational roles at McDonald’s in Argentina, and later as Operations Manager of EKI. Mr. Suárez holds a Bachelor’s and Master’s degree in Humanistic Psychology from Universidad Gestalt in Mexico City and is currently pursuing a Ph.D. in philosophy at the same institution. Mr. Suárez also holds an MBA degree from IPADE Business School in Mexico City. Additionally, he is a professor of human capital management and strategic relationships at Universidad Panamericana in Mexico City.
Pablo Grattarola
Pablo Grattarola is the Director of Information Technology of the Issuer. Mr. Grattarola brings over two decades of multi-sector experience to the role. He began his career at AB-InBev in Uruguay, where he advanced from IT Analyst to Regional IT Lead over a 10-year period, gaining significant experience in risk, compliance, and auditing processes. Mr. Grattarola later transitioned to the role of chief information officer across various industries, including retail, health, financial technology, and finance. He served as chief information officer of Banco Santander Uruguay, where he led key initiatives in risk, compliance, and cybersecurity and was involved in various projects including enterprise resource planning migrations and credit card conversions, as well as being involved in the mergers and acquisitions and due diligence activities. Mr. Grattarola holds an Information Systems Engineering Degree from Universidad Tecnológica Nacional and an MBA degree from Universidad de Belgrano, both in Argentina. He also holds an AGILE Certification from Maryland University and is an active member of the ISACA Uruguay organization, which focuses on cybersecurity.
Alejandro Dávila
Alejandro Dávila is the Director of Real Estate of the Issuer. Prior to joining Tiendas 3B in 2022, Mr. Davila worked at OXXO, where he served as General Manager for OXXO Colombia and was closely involved in OXXO’s international expansion, overseeing the company’s growth into Colombia, Chile, Brazil and Peru between 2018 and 2021. Mr. Dávila holds a civil engineering degree from Instituto Tecnológico de Nuevo León, with a Master’s Degree in Business Planning from Instituto Tecnológico de Piedras Negras and leadership diplomas from Instituto Tecnológico y de Estudios Superiores de Monterrey and IPADE Business School, all in Mexico.
Committees
The board of directors of the Issuer has formed an Audit Committee. In addition, although not required under the laws of the British Virgin Islands, our memorandum and articles of association establish a Compensation Committee and we have recently approved the creation of an ESG Committee. The board of directors may dissolve and appoint at any time any committee. At least one meeting shall be held by each committee on a quarterly basis.
Audit Committee
The Audit Committee is comprised of Ms. Reich, who is the chair, and Messrs. Gertsacov, Fuster and Cappello.
113
The Audit Committee is governed by a charter that complies with the New York Stock Exchange rules. The Audit Committee is responsible for, among other things:
Compensation Committee
The Compensation Committee is comprised Ms. Reich, Mr. Khouri and Mr. Fuster. The Compensation Committee is responsible for assessing and providing recommendations to the board of directors in relation to salaries and compensation packages of executive officers of the Issuer, and for administering the 2004 Option Plan and Equity Incentive Plan.
ESG Committee
The ESG Committee is comprised of Mr. Le Ruyet and Mr. Gerstacov. The ESG Committee is responsible for reviewing the development of the Company’s sustainability strategy, as well as monitoring its implementation and progress.
Code of Ethics
On January 28, 2024 we adopted a revised Code of Business Conducts and Ethics, which applies to all of our directors, officers and employees. We intend to disclose future amendments to, or waivers of, our code of ethics on the same page of our investor relations website.
114
Family Relationships
There are no family relationships between any of the directors and executive officers.
Compensation of Directors and Officers
We are not required by British Virgin Islands law to disclose compensation paid to our senior management on an individual basis and we have not otherwise publicly disclosed this information elsewhere.
Our directors, executive officers and management in general receive fixed and variable compensation. They also receive benefits generally in line with market practice in Mexico. The fixed component of their compensation is set on market terms and adjusted annually.
The variable component consists of cash bonuses and awards of options to purchase shares. Cash bonuses are paid to executive officers and members of our management based on previously agreed targets for the business and have been approved by the board of directors each year. Options have been awarded under our 2004 Option Plan or Equity Incentive Plan, as discussed below.
For the nine months ended September 30, 2024, and the year ended December 31, 2023, the aggregate compensation expense for the members of the board of directors and our executive officers for services in all capacities was Ps.577,496 thousand and Ps.515,483 thousand, respectively, which includes both share-based payments and cash compensation. In addition, as part of our retention strategy, certain of our executive officers agreed to defer the payment of certain accrued bonuses. For the year ended December 31, 2023, the deferred bonus payable to our executive officers was Ps.43,161 thousand, and for the nine months ended September 30, 2024, there was no outstanding balance of deferred bonus payable to our executive officers.
2004 Option Plan
We maintain a Non-Qualified Stock Option Plan, dated as of July 15, 2004 (as amended) (the “2004 Option Plan”) pursuant to which we have granted options to purchase Class C common shares of the Issuer to certain employees, directors and other service providers of the Issuer and its subsidiaries. The share options are generally subject to time-based vesting requirements and generally vest over a five-year period, with 25% of the share options vesting at the end of each of the second, third, fourth and fifth calendar year following the calendar year in which they were granted (subject to continued employment and service requirements) (the “Common Options”). In connection with our IPO, our board of directors agreed to accelerate the vesting of all Common Options that were issued during or prior to December 2020 to the extent that such Common Options were outstanding and unvested as of immediately prior to the closing of our IPO.
We have also issued certain exit options under the 2004 Option Plan to senior management and to current and former members of the board of directors. They are identical in terms to the Common Options granted under the 2004 Option Plan, except that they vest immediately upon the occurrence of a liquidity event, such an initial public offering by the Company (the “Exit Options” and, together with the Common Options, the “Stock Options”) Accordingly, all of the Exit Options vested upon our IPO.
The maximum number of Class C common shares that may be issued under the 2004 Option Plan was 45,000,000 Class C common shares, subject to adjustment in accordance with the terms of the 2004 Option Plan.
As of the date of this prospectus, a total of 40,943,724 Class C common shares are issuable upon the exercise of Stock Options granted under our 2004 Option Plan, of which 27,513,099 Class C common shares correspond to Stock Options that are fully vested (including the Common Options for which vesting was accelerated). Of the 40,943,724 Class C common shares issuable upon the exercise of Stock Options, 33,498,750 Class C common shares correspond to Common Options and 7,444,974 correspond to Exit Options, as described below.
115
The table below sets forth the number of Class C common shares issuable upon the exercise of Common Option granted per year (net of forfeitures) and the weighted average strike prices of the Class C common shares subject to Common Options (considering the 3-for-1 share split effected in connection with our IPO).
| Number of Class C common shares subject to Common Options |
| |||||||||||||
| 2023 |
|
| 2022 |
|
| 2021 |
| |||||||
Outstanding as of January 1, |
|
|
| 29,366,250 |
|
|
|
| 22,031,250 |
|
|
|
| 16,991,250 |
|
Granted during the year |
|
|
| 6,270,000 |
|
|
|
| 7,335,000 |
|
|
|
| 5,085,000 |
|
Forfeited during the year |
|
|
| (645,000 | ) |
|
|
| — |
|
|
|
| (45,000 | ) |
Outstanding as of December 31, |
|
|
| 34,991,250 |
|
|
|
| 29,366,250 |
|
|
|
| 22,031,250 |
|
Weighted average strike price per |
| US$ | 6.02 |
|
| US$ |
| 4.69 |
|
| US$ |
| 3.03 |
| |
During 2024 and until the date of this prospectus, a total of 1,492,500 Class C common shares subject to Common Options were forfeited (considering the 3-for-1 share split effected in connection with our IPO). Thus, the Class C common shares issuable upon the exercise of Common Options as of the date of this prospectus are 33,498,750.
The table below sets forth the number of Class C common shares issuable upon the exercise of Exit Options granted per year (net of forfeitures) and the weighted average strike prices of the Class C common shares subject to Exit Options (considering the 3-for-1 share split effected in connection with our IPO).
| Number of Class C common shares subject to Exit Options |
| |||||||||||||
| 2023 |
|
| 2022 |
|
| 2021 |
| |||||||
Outstanding as of January 1, |
|
|
| 7,064,982 |
|
|
|
| 7,064,982 |
|
|
|
| 6,544,974 |
|
Granted during the year |
|
|
| 379,992 |
|
|
|
| — |
|
|
|
| 900,000 |
|
Forfeited during the year |
|
|
| — |
|
|
|
| — |
|
|
|
| (379,992 | ) |
Outstanding as of December 31, |
|
|
| 7,444,974 |
|
|
|
| 7,064,982 |
|
|
|
| 7,064,982 |
|
Weighted average strike price per |
| US$ |
| 3.43 |
|
| US$ |
| 3.45 |
|
| US$ |
| 3.45 |
|
During 2024 and until the date of this prospectus, there were no granted nor forfeited Exit Options. Thus, the Class C common shares issuable upon the exercise of Exit Options granted as of such date were 7,444,974.
The Stock Options issued under the 2004 Option Plan are governed by the terms of the 2004 Option Plan, and the Common Options (to the extent unvested) will continue to vest on the same terms and conditions that originally applied to such Common Options. No additional Stock Options have been or will be granted under the 2004 Option Plan after our IPO. Since the Class C common shares were subject to restrictions on sale for a period of 180 days after the date of the prospectus relating to our IPO, and are subject to additional restrictions for a further 24 months following such 180-day period, our board determined that any vested Stock Options issued under the 2004 Option Plan cannot be exercised until the earliest to occur of (1) the conversion of Class C common shares pursuant to the initial exercise of registration rights under our memorandum and articles of association, (2) July 8, 2026, (3) upon and in connection with any business combination or offer to acquire the Company that would represent a change in control of the Company, which will result in the automatic acceleration of all vested options, and (4) the conversion of Class C common shares into Class A common shares upon the affirmative vote of holders representing at least 75% of the votes of the Class B common shares and Class C common shares voting as a single class (provided that such conversion does not take place within 18 months of the date of the prospectus relating to our IPO).
Liquidity Event Shares
Our board of directors adopted a plan in which certain members of senior management and Bolton Partners Ltd., a vehicle affiliated with Mr. Hatoum, were eligible to receive Class C common shares following consummation of our IPO (the “Liquidity Event Share Plan”). The maximum amount of 7,500,000 Class C common shares that could be allocated under the Liquidity Event Share Plan was reached upon the consummation of our IPO.
116
Delivery of the Class C common shares under the Liquidity Event Share Plan is delayed until after the earlier of (1) a date to be determined by us that is after January 1, 2025 but on or prior to December 31, 2025 or (2) any business combination or offer to acquire the Company that would represent a change in control of the Company and also constitutes a change in the ownership or effective control of the Company, or in the ownership of a substantial portion of the assets of the Company, in each case, within the meaning of Section 409A of the U.S. Internal Revenue Code of 1986, as amended (the “Delayed Delivery”).
Bolton Partners Share Allocation
Pursuant to the terms of the 2004 shareholders’ agreement as in effect prior to our IPO, Bolton Partners Ltd., a vehicle affiliated with Mr. Hatoum, was entitled to receive Class C common shares of the Company following consummation of our IPO (the “Bolton Partners Share Allocation”). 4,224,960 Class C shares were allocated to Bolton Partners as a result. These shares will be subject to Delayed Delivery. See “Principal Shareholders” for the share ownership of Bolton Partners Ltd.
Equity Incentive Plan
Our board of directors has adopted, and our shareholders have approved, an equity incentive plan (the “Equity Incentive Plan”) prior to the completion of our IPO, in order to provide a means through which to attract, retain and motivate key personnel. Awards under the Equity Incentive Plan may be granted to any (i) individual employed by the Issuer or its subsidiaries (other than those U.S. employees covered by a collective bargaining agreement unless and to the extent that such eligibility is set forth in such collective bargaining agreement or similar agreement); (ii) director of the Issuer or its subsidiaries; or (iii) consultant or advisor to the Issuer or its subsidiaries who may be offered securities registrable pursuant to a registration statement on Form S-8 under the Securities Act. The Equity Incentive Plan will be administered by the Compensation Committee or such other committee of our board of directors to which it has properly delegated power, or if no such committee or subcommittee exists, our board of directors.
Under the Equity Incentive Plan, 8,400,000 Class A common shares were initially reserved for issuance. Each award granted under the Equity Incentive Plan will reduce the plan share reserve by the number of common shares underlying the award. Notwithstanding the foregoing, the plan share reserve shall be automatically increased on the first day of each fiscal year following the fiscal year ended December 31, 2024, by a number of common shares equal to the lesser of (i) 2.0% of all outstanding common shares on the last day of the immediately preceding fiscal year, and (ii) the number of common shares as may be determined by our board of directors.
All awards granted under the Equity Incentive Plan will vest and/or become exercisable in such manner and on such date or dates or upon such event or events as determined by the Compensation Committee. Awards available for grant under the Equity Incentive Plan include non-qualified stock options and incentive stock options, restricted common shares, restricted stock units, other equity-based awards tied to the value of our Class A common shares, and cash-based awards.
Awards other than cash-based awards are generally subject to adjustment in the event of (i) any dividend (other than regular cash dividends) or other distribution, recapitalization, stock split, reverse stock split, reorganization, merger, consolidation, split-up, split-off, spin-off, combination, repurchase or exchange of common shares or other securities, or other similar transactions or events, or (ii) unusual or nonrecurring events affecting the Issuer, including changes in applicable rules, rulings, regulations or other requirement. In addition, in connection with any change in control, the Compensation Committee may, in its sole discretion, provide for any one or more of the following: (i) a substitution or assumption of, acceleration of the vesting of, the exercisability of, or lapse of restrictions on, any one or more outstanding awards and (ii) cancellation of any one or more outstanding awards and payment to the holders of such awards that are vested as of such cancellation (including any awards that would vest as a result of the occurrence of such event but for such cancellation) the value of such awards, if any, as determined by the Compensation Committee.
Our board of directors of directors may amend, alter, suspend, discontinue, or terminate the Equity Incentive Plan or any portion thereof at any time, but no such amendment, alteration, suspension, discontinuance or termination may be made without shareholder approval if (i) such approval is required under applicable law; (ii) it
117
would materially increase the number of securities which may be issued under the Equity Incentive Plan (except for adjustments in connection with certain corporate events); or (iii) it would materially modify the requirements for participation in the Equity Incentive Plan. Any such amendment, alteration, suspension, discontinuance or termination that would materially and adversely affect the rights of any participant or any holder or beneficiary of any award will not to that extent be effective without such individual’s consent.
All awards granted under the Equity Incentive Plan are subject to reduction, cancellation, forfeiture or recoupment to the extent necessary to comply with (i) any clawback, forfeiture or other similar policy adopted by our board of directors or the Compensation Committee and as in effect from time to time and (ii) applicable law.
As of the date of this prospectus, our board of directors has approved the following awards under the new Equity Incentive Plan:
Agreements with our Executives
As required under Mexican labor laws, certain of our executive officers have entered into employment agreements with us, certain of which provide for severance and notice of termination benefits.
Directors’ and Officers’ Insurance
We hold a directors’ and officers’ insurance coverage in reasonable and customary amounts with respect to general civil liability, including liabilities under the Securities Act, for acts carried out by our directors and executive officers in the course of their duties.
Share Ownership
The shares and any outstanding options beneficially owned by our directors and officers and/or entities affiliated with these individuals are disclosed in the section entitled “Principal Shareholders.”
118
The table below contains information regarding the beneficial ownership of our equity securities, as of January 31, 2025, by:
The percentages of beneficial ownership in the table below are calculated on the basis of the following numbers of shares outstanding as of January 31, 2025: 38,709,677 Class A common shares, 5,200,000 Class B common shares and 68,291,075 Class C common shares outstanding, excluding the 2,000,000 Class C common shares corresponding to the Exercised Stock Options. The table below does not reflect ownership after this offering.
Beneficial ownership is determined under SEC rules and generally includes voting or investment power over securities. Except in cases where community property laws apply or as indicated in the footnotes to this table, we believe that each shareholder identified in the table below possesses sole voting and investment power over all the Class A common shares, Class B common shares or Class C common shares shown as beneficially owned by the shareholder in the table.
Common shares subject to options, warrants or rights that were exercisable at January 31, 2025 or that will be exercisable within 60 days of the date of this offering, are considered to be outstanding and beneficially owned by the person who holds such options, warrants or rights for purposes of computing that person’s common share ownership, but are not treated as outstanding for the purpose of computing the percentage ownership of any other person. As of the date hereof, there are no common shares subject to options exercisable within 60 days because they are either unvested in the case of stock options and RSUs granted under our Equity Incentive Plan, or subject to restrictions on exercise in the case of Stock Options under our 2004 Incentive Plan as described in “Management—2004 Option Plan.”
The holders of our Class A common shares, Class B common shares and Class C common shares have identical rights, except that:
119
For more information, see “Description of Share Capital.”
| Common Shares Beneficially Owned(1) |
| Total | |||||||||||||||||
| Class A |
| Class B |
| Class C |
|
| |||||||||||||
| Shares |
|
| % |
| Shares |
|
| % |
| Shares |
|
| % |
| % | ||||
Directors and Executive Officers | (3) |
|
|
|
|
|
|
|
|
|
|
|
|
|
|
|
| |||
K. Anthony Hatoum | (4) |
| — |
|
| — |
|
| 5,200,000 |
|
| 100.0% |
|
| 7,834,223 |
|
| 11.5% |
| 46.4% |
Nicole Reich de Polignac |
|
| — |
|
| — |
|
| — |
|
| — |
|
| — |
|
| — |
| — |
Dan Gertsacov |
|
| — |
|
| — |
|
| — |
|
| — |
|
| — |
|
| — |
| — |
Jean-François Le Ruyet | (5) |
| — |
|
| — |
|
| — |
|
| — |
| * |
|
| * |
| * | |
Alexander Fuster |
|
| — |
|
| — |
|
| — |
|
| — |
|
| — |
|
| — |
| — |
Juan Pablo Cappello |
|
| — |
|
| — |
|
| — |
|
| — |
|
| — |
|
| — |
| — |
Sami Khouri | (6) |
| — |
|
| — |
|
| — |
|
| — |
|
| 5,430,940 |
|
| 8.0% |
| 2.9% |
Alexis Meffre | (7) |
| — |
|
| — |
|
| — |
|
| — |
|
| — |
|
| — |
| — |
Stephanie Martinez |
|
| — |
|
| — |
|
| — |
|
| — |
|
| — |
|
| — |
| — |
Eduardo Pizzuto |
|
| — |
|
| — |
|
| — |
|
| — |
| * |
|
| * |
| * | |
Diego Apalategui |
|
| — |
|
| — |
|
| — |
|
| — |
|
| — |
|
| — |
| — |
Luis Bermúdez |
|
| — |
|
| — |
|
| — |
|
| — |
|
| — |
|
| — |
| — |
Javier Suárez |
|
| — |
|
| — |
|
| — |
|
| — |
|
| — |
|
| — |
| — |
Pablo Grattarola |
|
| — |
|
| — |
|
| — |
|
| — |
|
| — |
|
| — |
| — |
Alejandro Dávila |
|
| — |
|
| — |
|
| — |
|
| — |
|
| — |
|
| — |
| — |
All directors and executive officers as a group (15 persons) | (8) |
| — |
|
| — |
|
| 5,200,000 |
|
| 100.0% |
|
| 13,923,918 |
|
| 20.4% |
| 49.7% |
|
|
|
|
|
|
|
|
|
|
|
|
|
|
|
|
| — | |||
5% Shareholders |
|
|
|
|
|
|
|
|
|
|
|
|
|
|
|
| — | |||
QS 3B Aggregator Inc. | (9) |
| — |
|
| — |
|
| — |
|
| — |
|
| 21,525,261 |
|
| 31.5% |
| 11.6% |
Capital International Investors | (10) |
| 6,732,117 |
|
| 17.4% |
|
| — |
|
| — |
|
| — |
|
| — |
| 3.6% |
Capital Research Global Investors | (11) |
| 3,882,121 |
|
| 10.0% |
|
| — |
|
| — |
|
| — |
|
| — |
| 2.1% |
Gilder Gagnon Howe & Co LLC | (12) |
| 2,769,424 |
|
| 7.2% |
|
| — |
|
| — |
|
| — |
|
| — |
| 1.5% |
Morgan Stanley | (13) |
| 2,667,298 |
|
| 6.9% |
|
| — |
|
| — |
|
| — |
|
| — |
| 1.4% |
FMR LLC | (14) |
| 2,616,770 |
|
| 6.8% |
|
| — |
|
| — |
|
| — |
|
| — |
| 1.4% |
William Blair Investment Management | (15) |
| 1,947,327 |
|
| 5.0% |
|
| — |
|
| — |
|
| — |
|
| — |
| 1.1% |
|
|
|
|
|
|
|
|
|
|
|
|
|
|
|
|
|
| |||
Other shareholders | (16) |
| 18,094,620 |
|
| 46.7% |
|
| — |
|
| — |
|
| 32,841,896 |
|
| — |
| 46.7% |
Total shares per Class |
|
| 38,709,677 |
|
| 100.0% |
|
| 5,200,000 |
|
| 100.0% |
|
| 68,291,075 |
|
| 100.0% |
| 100.0% |
* Indicates beneficial ownership of less than 1%.
However, the table above and the foregoing ownership information do not include the following shares that are or will be held by directly or indirectly by Mr. Hatoum through Bolton Partners Ltd. after this offering (i) 8,550,000 Class C common shares issuable upon exercise of Stock Options granted under our 2004 Option Plan (including unvested and vested but currently unexercisable Stock Options); (ii) 6,000,000 Class C common shares awarded immediately prior to the consummation of our IPO pursuant to the Liquidity Event Share Plan, but subject to Delayed Delivery; (iii) 4,224,960 Class C common shares under the Bolton Partners Share Allocation but subject to Delayed Delivery, and (iv) 275,000 Class A common shares issuable upon exercise of stock options or RSUs granted under our Equity Incentive Plan (all of which are unvested). Taking into account such Class A common shares and Class C common shares, as well as other Class A common shares and Class C common shares similarly issuable under stock options under our current Equity Incentive Plan, our 2004 Option Plan (including both unvested and
120
vested (but currently unexercisable) and assuming net settlement at their respective strike prices), and those awarded under the Liquidity Event Share Plan, Mr. Hatoum, directly or indirectly through Bolton Partners Ltd., would beneficially own approximately 43.6% of the combined voting power of our outstanding common shares following this offering. See “Management—2004 Option Plan,” “Management—Liquidity Event Shares” and “Management—Bolton Partners Share Allocation.”
121
This prospectus relates to the sale by the selling shareholders of 17,500,000 Class A common Shares, consisting of (i) 15,500,000 Class A common shares issuable upon conversion of 15,500,000 Class C common shares held by existing holders of our Class C common shares and (ii) 2,000,000 Class A common shares issuable upon conversion of 2,000,000 Class C common shares acquired upon the net exercise of stock options under our 2004 Option Plan.
When we refer to the “selling shareholders” in this prospectus, we mean the entities and persons listed in the tables below.
The table below sets forth, as of the date of this prospectus, the name of the selling shareholders for which Class A common shares are being registered and offered for sale to the public, the number of such Class A common shares being offered for sale by the selling shareholders and the respective beneficial ownership of Class A common shares, Class B common shares and Class C common shares by the selling shareholders prior to and after this offering. The number of common shares being sold by certain groups of persons is presented on an aggregated group basis, as opposed to an individual basis, since the aggregate holding of the group is less than 1% of all our common shares outstanding immediately prior to this offering.
In accordance with SEC rules, common shares subject to options, warrants or rights that are exercisable within 60 days of the date of this offering, are considered to be outstanding and beneficially owned by the person who holds such options, warrants or rights for purposes of computing that person’s common share ownership, but are not treated as outstanding for the purpose of computing the percentage ownership of any other person. As of the date hereof, there are no common shares subject to options exercisable within 60 days because they are either unvested in the case of stock options and RSUs granted under our Equity Incentive Plan, or subject to restrictions on exercise in the case of Stock Options under our 2004 Incentive Plan as described in “Management—2004 Option Plan.”
| Common shares Beneficially Owned | % of Total Beneficial Ownership Prior to this Offering | Class A Common Shares to be Sold in this Offering without Exercise of Underwriters' Option (1) | Common shares Beneficially Owned | % of Total Beneficial Ownership After Offering Without Exercise of Underwriters' Option | Class A Common Shares to be Sold in this Offering with Full Exercise of Underwriters' Option (1) | Common shares Beneficially Owned | % of Total Beneficial Ownership After Offering With Full Exercise of Underwriters' Option | ||||||||||||||||
| Class A | Class B | Class C |
|
| Class A | Class B | Class C |
|
| Class A | Class B | Class C |
| ||||||||||
| Shares | % | Shares | % | Shares | % | % | Shares | Shares | % | Shares | % | Shares | % | % | Shares | Shares | % | Shares | % | Shares | % | % | |
QS 3B Aggregator Inc. | (2) | - | - | - | - | 21,525,261 | 31.5% | 19.2% | 6,919,437 | - | - | - | - | 14,605,824 | 27.7% | 12.8% | 7,957,353 | - | - | - | - | 13,567,908 | 26.9% | 11.8% |
QS Direct SI 2 S C A SICAR | (3) | - | - | - | - | 508,716 | * | * | 163,529 | - | - | - | - | 345,187 | * | * | 188,059 | - | - | - | - | 320,657 | * | * |
Quilvest (Switzerland) Ltd. | (4) | - | - | - | - | 2,548,994 | 3.7% | 2.3% | 819,384 | - | - | - | - | 1,729,610 | 3.3% | 1.5% | 942,293 | - | - | - | - | 1,606,701 | 3.2% | 1.4% |
Bolton Partners Ltd. | (5) | - | - | 5,200,000 | 100.0% | 7,834,223 | 11.5% | 11.6% | 1,804,347 | - | - | 5,200,000 | 100.0% | 6,029,876 | 11.4% | 9.8% | 2,075,000 | - | - | 5,200,000 | 100.0% | 5,759,223 | 11.4% | 9.6% |
Sami Khouri | (6) | - | - | - | - | 5,430,940 | 8.0% | 4.8% | 1,539,826 | - | - | - | - | 3,891,114 | 7.4% | 3.4% | 1,770,800 | - | - | - | - | 3,660,140 | 7.3% | 3.2% |
M E Freeman Tr | (7) | - | - | - | - | 198,046 | * | * | 63,662 | - | - | - | - | 134,384 | * | * | 73,211 | - | - | - | - | 124,835 | * | * |
Serge Walid Sarkis | (8) | - | - | - | - | 49,144 | * | * | 15,796 | - | - | - | - | 33,348 | * | * | 18,165 | - | - | - | - | 30,979 | * | * |
KM Trust | (9) | - | - | - | - | 187,781 | * | * | 60,362 | - | - | - | - | 127,419 | * | * | 69,416 | - | - | - | - | 118,365 | * | * |
Armstrong International Ltd | (10) | - | - | - | - | 32,614 | * | * | 10,483 | - | - | - | - | 22,131 | * | * | 12,055 | - | - | - | - | 20,559 | * | * |
Yatara 5 Ltd | (11) | - | - | - | - | 32,614 | * | * | 10,483 | - | - | - | - | 22,131 | * | * | 12,055 | - | - | - | - | 20,559 | * | * |
Capricorn Financial Holdings Inc | (12) | - | - | - | - | 43,485 | * | * | 13,978 | - | - | - | - | 29,507 | * | * | 16,074 | - | - | - | - | 27,411 | * | * |
850 Holdings Pte Limited | (13) | - | - | - | - | 1,078,429 | 1.6% | 1.0% | 346,666 | - | - | - | - | 731,763 | 1.4% | * | 398,667 | - | - | - | - | 679,762 | 1.3% | * |
Dania Sakka | (14) | - | - | - | - | 1,297,338 | 1.9% | 1.2% | 417,036 | - | - | - | - | 880,302 | 1.7% | * | 479,592 | - | - | - | - | 817,746 | 1.6% | * |
Altouq Sa | (15) | - | - | - | - | 173,662 | * | * | 55,824 | - | - | - | - | 117,838 | * | * | 64,197 | - | - | - | - | 109,465 | * | * |
Fady Michel Abouchalache & Leila Abouchalache Jt Ten | (16) | - | - | - | - | 1,114,079 | 1.6% | 1.0% | 195,652 | - | - | - | - | 918,427 | 1.7% | * | 225,000 | - | - | - | - | 889,079 | 1.8% | * |
Omran Mohammed A Alomran | (17) | - | - | - | - | 210,952 | * | * | 67,811 | - | - | - | - | 143,141 | * | * | 77,982 | - | - | - | - | 132,970 | * | * |
Gulrez Arshad | (18) | - | - | - | - | 401,874 | * | * | 17,392 | - | - | - | - | 384,482 | * | * | 20,000 | - | - | - | - | 381,874 | * | * |
Shergul Arshad | (19) | - | - | - | - | 60,000 | * | * | 14,783 | - | - | - | - | 45,217 | * | * | 17,000 | - | - | - | - | 43,000 | * | * |
Shehime Arshad | (20) | - | - | - | - | 60,000 | * | * | 10,435 | - | - | - | - | 49,565 | * | * | 12,000 | - | - | - | - | 48,000 | * | * |
Lawrence Arye Neubauer | (21) | - | - | - | - | 35,077 | * | * | 11,275 | - | - | - | - | 23,802 | * | * | 12,966 | - | - | - | - | 22,111 | * | * |
Elan Adiel Schultz | (22) | - | - | - | - | 447,859 | * | * | 113,043 | - | - | - | - | 334,816 | * | * | 130,000 | - | - | - | - | 317,859 | * | * |
B Goodman Family Trust | (23) | - | - | - | - | 43,212 | * | * | 3,758 | - | - | - | - | 39,454 | * | * | 4,321 | - | - | - | - | 38,891 | * | * |
Melissa Goodman 1998 Trust | (24) | - | - | - | - | 36,435 | * | * | 3,168 | - | - | - | - | 33,267 | * | * | 3,643 | - | - | - | - | 32,792 | * | * |
Jodi Goodman 1998 Trust | (25) | - | - | - | - | 43,212 | * | * | 3,758 | - | - | - | - | 39,454 | * | * | 4,321 | - | - | - | - | 38,891 | * | * |
Melissa Goodman | (26) | - | - | - | - | 6,777 | * | * | 590 | - | - | - | - | 6,187 | * | * | 678 | - | - | - | - | 6,099 | * | * |
Adam J Zipper 2023 Grat | (27) | - | - | - | - | 706,716 | 1.0% | * | 179,753 | - | - | - | - | 526,963 | 1.0% | * | 206,716 | - | - | - | - | 500,000 | 1.0% | * |
Charity Lynn Beck Tod On File Subject To Cpu Rules | (28) | - | - | - | - | 480,000 | * | * | 154,298 | - | - | - | - | 325,702 | * | * | 177,443 | - | - | - | - | 302,557 | * | * |
Verna Holding Sal | (29) | - | - | - | - | 895,932 | 1.3% | * | 288,001 | - | - | - | - | 607,931 | 1.2% | * | 331,202 | - | - | - | - | 564,730 | 1.1% | * |
Howard Stuart Rimerman | (30) | - | - | - | - | 9,610 | * | * | 3,088 | - | - | - | - | 6,522 | * | * | 3,551 | - | - | - | - | 6,059 | * | * |
James H Luther | (31) | - | - | - | - | 132,147 | * | * | 11,787 | - | - | - | - | 120,360 | * | * | 13,555 | - | - | - | - | 118,592 | * | * |
Agape Fiduciary Gmbh | (32) | - | - | - | - | 2,420,204 | 3.5% | 2.2% | 777,987 | - | - | - | - | 1,642,217 | 3.1% | 1.4% | 894,686 | - | - | - | - | 1,525,518 | 3.0% | 1.3% |
Ali Khanbhai | (33) | - | - | - | - | 9,610 | * | * | 3,088 | - | - | - | - | 6,522 | * | * | 3,551 | - | - | - | - | 6,059 | * | * |
Manomi Investments Ltd | (34) | - | - | - | - | 272,954 | * | * | 87,741 | - | - | - | - | 185,213 | * | * | 100,903 | - | - | - | - | 172,051 | * | * |
Walid Majdalani | (35) | - | - | - | - | 63,053 | * | * | 20,268 | - | - | - | - | 42,785 | * | * | 23,308 | - | - | - | - | 39,745 | * | * |
Fadi Fakhri | (36) | - | - | - | - | 92,310 | * | * | 29,674 | - | - | - | - | 62,636 | * | * | 34,124 | - | - | - | - | 58,186 | * | * |
Wissam Jabr | (37) | - | - | - | - | 121,152 | * | * | 38,943 | - | - | - | - | 82,209 | * | * | 44,784 | - | - | - | - | 76,368 | * | * |
Zein Daouk | (38) | - | - | - | - | 42,858 | * | * | 11,131 | - | - | - | - | 31,727 | * | * | 12,800 | - | - | - | - | 30,058 | * | * |
Abdullah Ibrahim Abdullah Al Hobayb | (39) | - | - | - | - | 2,637,366 | 3.9% | 2.4% | 847,796 | - | - | - | - | 1,789,570 | 3.4% | 1.6% | 974,966 | - | - | - | - | 1,662,400 | 3.3% | 1.5% |
Kactus Investment Llc | (40) | - | - | - | - | 717,183 | 1.1% | * | 155,652 | - | - | - | - | 561,531 | 1.1% | * | 179,000 | - | - | - | - | 538,183 | 1.1% | * |
Executive Officers | (41) | - | - | - | - | 10,714 | * | * | 846,525 | - | - | - | - | 10,714 | * | * | 973,500 | - | - | - | - | 10,714 | * | * |
Directors | (42) | - | - | - | - | 648,041 | * | * | 221,357 | - | - | - | - | 439,726 | * | * | 254,563 | - | - | - | - | 408,478 | * | * |
Current & Former Employees | (43) | - | - | - | - | - | - | - | 1,140,433 | - | - | - | - | - | * | * | 1,311,500 | - | - | - | - | - | * | * |
Other Option Holders | (44) | - | - | - | - | - | - | - | - | - | - | - | - | - | * | * | - | - | - | - | - | - | * | * |
Total |
| - | - | 5,200,000 | 100.0% | 52,660,574 | 77.1% | 51.6% | 17,500,000 | - | - | 5,200,000 | 100.0% | 37,160,574 | 70.4% | 37.1% | 20,125,000 | - | - | 5,200,000 | 100.0% | 34,835,574 | 69.0% | 35.0% |
* Indicates beneficial ownership of less than 1% of the class of common shares.
The following is a description of certain related party transactions we have entered into or amended since January 1, 2020, including transactions with the following (other than compensation arrangements and employment agreements described under “Management”): (i) entities that control or are under common control with us, (ii) individuals that own 10% or more of the voting power in the Issuer and close family members thereof, (iii) executive officers of the Issuer and close family members thereof and (iv) directors of the Issuer.
Promissory Notes and Convertible Notes. As part of our financing strategy prior to our IPO, we incurred indebtedness pursuant to the Promissory Notes and Convertible Notes. The Promissory Notes were held mostly by related parties, including certain of our shareholders and certain of our executive officers. Proceeds from our IPO were used to pay the Promissory Notes in full. The table below sets forth the amounts owing to related parties under the Promissory Notes (including principal and accrued interest). See “Management’s Discussion of Results of Operations and Financial Condition—Indebtedness” for additional information about the terms of the Promissory Notes.
In addition to the amounts set forth below, as consideration for the Promissory Note holders’ agreement to extend the maturity of the Promissory Notes from May 31, 2024 to December 31, 2026, we agreed to pay, on the date the Promissory Notes were repaid with the proceeds of our IPO, an additional: (1) US$4,100,000 to the Senior Promissory Note holders, (2) US$230,000 to the 2017 Junior Promissory Note holders and (3) US$20,000 to the 2020 Junior Promissory Note holders.
| Amounts |
|
| Amounts |
| ||||
Senior Promissory Notes |
|
|
|
|
|
|
| ||
Quilvest Capital Partners(1) |
|
| — |
|
| Ps. | 1.162.319 |
| |
BBB Investment Group |
|
| — |
|
|
|
| 136,508 |
|
Sami Khouri(2) |
|
| — |
|
|
|
| 101,602 |
|
Other shareholders* |
|
| — |
|
|
|
| 191,573 |
|
Executive officers** |
|
| — |
|
|
|
| 448 |
|
2017 Junior Promissory Notes |
|
|
|
|
|
|
| ||
Mexico Offshore, S.A.L |
|
| — |
|
|
|
| 10,134 |
|
Other shareholders* |
|
| — |
|
|
|
| 13,512 |
|
Executive officers and close |
|
| — |
|
|
|
| 45,603 |
|
Other related party |
|
| — |
|
|
|
| 1,689 |
|
2020 Junior Promissory Notes |
|
|
|
|
|
|
| ||
Other Shareholders* |
|
| — |
|
|
|
| 1,689 |
|
Total |
|
| — |
|
| Ps. |
| 1,665,077 |
|
* Includes shareholders of the Issuer that individually own common shares representing less than 5% of the voting power in the Issuer.
** Includes executive officers of the Issuer that individually own common shares representing less than 1% of the voting power of the Issuer.
Advisory Fee. In connection with certain amendments to our shareholders’ agreement as in effect prior to our IPO and the Senior Promissory Notes, we agreed to pay a one-time US$400,000 service fee to affiliates of Quilvest Capital Partners. Entities affiliated with Quilvest Capital Partners are significant shareholders of the Issuer. The service fee was payable concurrently with the payment of the Senior Promissory Notes, which occurred in February 2024.
126
Related Party Transaction Policy
We have a Related Party Transaction Policy which requires certain related party transactions to be approved by our board of directors.
Indemnification
Our memorandum and articles of association will require us to indemnify our directors and executive officers to the fullest extent permitted by law.
Agreements with our Directors and Executive Directors
Certain of our executive officers have entered into employment agreements with us. See “Management— Agreements with our Executives.” As part of our retention strategy, certain of our executive officers agreed to defer the payment of certain accrued bonuses. For the nine months ended September 30, 2024, deferred bonus payable to our executive officers was zero. None of our directors have entered into service agreements with us.
Registration Rights
Holders of our Class B common shares and Class C common shares will be entitled to certain registration rights. See “Description of Our Share Capital—Class B Common Shares” and “Description of Our Share Capital—Class C Common Shares” for more information.
127
The following description of the material terms of our common shares is not intended to be a complete summary of the rights and preferences of such shares and is qualified by reference to our memorandum and articles of association as they are in effect since the completion of our IPO. The following description may not contain all of the information that is important to you and we therefore refer you to our memorandum and articles of association, copies of which are filed with the SEC as exhibits to the registration statement of which this prospectus is a part. We urge you to read the applicable provisions of British Virgin Islands law and our memorandum and articles of association in their entirety for a complete description of the rights and preferences of our common shares.
General
The Issuer is a company incorporated in the British Virgin Islands as a business company limited by shares and our affairs are governed by the provisions of our memorandum and articles of association, as amended and restated from time to time, and by the provisions of applicable British Virgin Islands law, including the Companies Act and regulations made thereunder.
Our company number in the British Virgin Islands is 605635. As provided in our memorandum and articles of association, subject to British Virgin Islands law, we have full capacity to carry on or undertake any business or activity, do any act or enter into any transaction and, for such purposes, full rights, powers and privileges. Our registered office is at Commerce House, Wickhams Cay 1, P.O. Box 3140, Road Town, Tortola VG1110, British Virgin Islands.
The transfer agent and registrar for our Class A common shares, Class B common shares and Class C common shares is Computershare Trust Company, N.A., which maintains the register of shareholders for each class of our shares in New York, New York.
As of the date of this prospectus, our memorandum and articles of association authorize the issuance of an unlimited number of Class A common shares, an unlimited number of Class B common shares and an unlimited number of Class C common shares. As of the date of this prospectus, 38,709,677 Class A common shares, 5,200,000 Class B common shares and 68,291,075 Class C common shares were issued, fully paid and outstanding.
Upon the completion of this offering, we will have 56,209,677 Class A common shares, 5,200,000 Class B common shares and 52,791,075 Class C common shares issued and outstanding, assuming no exercise of the underwriters’ option to purchase additional Class A common shares from the selling shareholders.
The maximum number of shares that we are authorized to issue may be changed by resolution of shareholders amending our memorandum and articles of association, although our board of directors also has the power to resolve to amend our memorandum and articles of association by resolution of the board to authorize us to issue one or more new classes of preferred shares (as more fully described under “—Preferred Shares”). Shares may be issued from time to time only by resolution of the board of directors.
Our Class A common shares are listed on the New York Stock Exchange under the symbol “TBBB.”
Initial settlement of our Class A common shares will take place on the closing date of this offering through The Depository Trust Company, or DTC, in accordance with its customary settlement procedures for equity securities. Each person owning Class A common shares held through DTC must rely on the procedures thereof and on institutions that have accounts therewith to exercise any rights of a holder of the Class A common shares. Persons wishing to obtain certificates for their Class A common shares must make arrangements with DTC.
The following is a summary of the material provisions of our shares and our memorandum and articles of association.
128
Class A Common Shares
Holders of our Class A common shares may freely hold and vote their shares. The following summarizes the rights of holders of our Class A common shares:
Class B Common Shares
Upon consummation of this offering, all of our Class B common shares are owned or controlled, directly or indirectly, by our principal shareholder. Holders of our Class B common shares may freely hold and vote their shares.
The following summarizes the rights of holders of our Class B common shares and certain restrictions applicable thereto:
129
Class C Common Shares
Holders of our Class C common shares may freely hold and vote their shares. The following summarizes the rights of holders of our Class C common shares and certain restrictions applicable thereto:
130
Notwithstanding the foregoing, upon a waiver by the representatives of the underwriters of the 180-day lock-up period set forth in the underwriting agreement and the approval by our board of directors of an offering of Class A common shares to the public, the Company may also permit holders of Class B common shares and/or Class C common shares to convert a portion of their shares into Class A common shares for sale in such offering.
131
Holders of Class A common shares will vote together with holders of Class B common shares and Class C common shares as a single class. However, in certain circumstances described in our memorandum and articles of association each class of common shares would vote separately, including if a change was proposed to the rights attaching to that class of shares in a manner that did not equally affect the other classes of common shares.
Preferred Shares
Our board of directors may resolve to amend our memorandum and articles of association by resolution of directors to authorize us to issue one or more new classes of preferred shares and may determine the rights, privileges, restrictions and conditions attaching to each such class of preferred shares (which may be more favorable than those attaching to the common shares), as the board of directors may determine in its sole and absolute discretion, including without limitation:
Shareholders’ Meetings and Consents
The following summarizes certain relevant provisions of British Virgin Islands laws and our memorandum and articles of association in relation to our shareholders’ meetings:
132
133
We expect that the first meeting of shareholders following our IPO and this offering will be held no later than April 2025.
British Virgin Islands Company Considerations
Our corporate affairs are governed by our memorandum and articles of association and the provisions of applicable British Virgin Islands law, including the Companies Act. The Companies Act differs from laws applicable to United States corporations and their shareholders. Set forth below is a summary of some significant differences between the provisions of the Companies Act applicable to us and the laws applicable to companies incorporated in the United States and their shareholders. A brief discussion of certain other provisions of the Companies Act and British Virgin Islands law also follows.
We cannot predict whether British Virgin Islands courts would reach the same conclusions based on a particular set of facts as the U.S. courts would be expected to reach. Thus, you may have more difficulty in protecting your interests in the face of actions by the Issuer, management, directors or principal shareholder than would shareholders of a corporation incorporated in a United States jurisdiction, which has developed a substantial body of case law. The following table provides a comparison between the statutory provisions of the Companies Act together with the provisions of our memorandum and articles of association) and the Delaware General Corporation Law relating to shareholders’ rights.
British Virgin Islands |
| Delaware |
Shareholders’ Voting Rights | ||
Any person authorized to vote may be represented at a meeting by a proxy who may speak and vote on behalf of the member. |
| Any person authorized to vote may authorize another person or persons to act for him by proxy. |
Quorum is fixed by our memorandum and articles of association, to consist of the holder or holders present in person or by proxy entitled to exercise not less than 30% of the votes of the shares entitled to vote on the resolutions. |
| For stock corporations, the charter or by-laws may specify the number to constitute a quorum but in no event shall a quorum consist of less than one-third of shares entitled to vote at a meeting. In the absence of such specifications, a majority of shares shall constitute a quorum. |
Under our memorandum and articles of association, subject to any rights or restrictions attached to any shares, at any general meeting every shareholder who is present in person or by proxy shall have one vote and on a poll every shareholder present in person or by proxy shall have one vote for each Class A common share and Class C common share of which such shareholder is the holder and 15 votes per Class B common share of which such shareholder is the holder. The chair is responsible for deciding in such manner as they consider appropriate whether any resolution proposed has been carried or not and the |
| For non-stock companies, the charter or by-laws may specify the number of shareholders to constitute a quorum. In the absence of this, one-third of the shareholders shall constitute a quorum. |
134
British Virgin Islands |
| Delaware |
result of their decision shall be announced to the general meeting and recorded in the minutes of the general meeting. If the chair has any doubt as to the outcome of the vote on a proposed resolution, they shall cause a poll to be taken of all votes cast upon such resolution. If the chair fails to take a poll then any shareholder present in person or by proxy who disputes the announcement by the chair of the result of any vote may immediately following such announcement demand that a poll be taken and the chair shall cause a poll to be taken. If a poll is taken at any general meeting, the result shall be announced to the general meeting and recorded in the minutes of the general meeting. |
|
|
Changes in the rights of shareholders that affect all shareholders equally require approval of a majority of shareholders. Changes to the class rights attaching to the Class A common shares, Class B common shares or Class C common shares as set forth in our memorandum and articles of association may require approval by way of resolution of a majority of those outstanding Class A common shares, Class B common shares or Class C common shares, respectively, attending a meeting of such class and voting in respect of such resolution. |
| Except as provided in the charter documents, changes in the rights of shareholders as set forth in the charter documents require approval of a majority of its shareholders. |
However, the above is subject to any greater majority required under our memorandum and articles of association or the Companies Act, provided that for these purposes the creation, designation or issue of preferred shares with rights and privileges ranking in priority to an existing class of shares shall be deemed not to be a change or variation of the rights of such existing class. |
|
|
The memorandum and articles of association do not provide for cumulative voting. |
| The charter documents may provide for cumulative voting. |
All other matters to be decided upon by the shareholders require a majority vote of shareholders who being so entitled attend and vote at the general meeting, unless the Companies Act or the memorandum and articles of association requires a higher majority. Our memorandum and articles of association in certain circumstances require a higher majority. Our memorandum and articles of association also may be amended by resolution of directors, including to create the rights, preferences, designations and limitations attaching to any blank check preferred shares. |
|
|
135
British Virgin Islands |
| Delaware |
Directors | ||
Board must consist of at least one director. |
| Board must consist of at least one member. |
Directors are appointed for the term, if any, fixed by the resolution appointing them, or until their earlier death, resignation or removal. If no term is fixed on the appointment of a Director, the Director shall serve indefinitely until their earlier death, resignation or removal. Our memorandum and articles of association fix a rotating three-year term to elect directors for each of our three classes of directorships. |
|
|
Fiduciary Duties | ||
Directors and officers owe statutory and fiduciary duties at common law and under statute as follows: (a) Duty to act honestly and in good faith in what the directors believe to be in the best interests of the company; (b) Duty to exercise powers for a proper purpose and directors shall not act, or agree to act, in a matter that contravenes the Companies Act or our memorandum and articles of association. Duty to exercise the care, diligence and skill that a reasonable director would exercise in the circumstances taking into account, without limitation: (a) the nature of the company; (b) the nature of the decision; and (c) the position of the director and the nature of the responsibilities undertaken by him. |
| Directors and officers must act in good faith, with the care of a prudent person, and in the best interest of the corporation. Directors and officers must refrain from self-dealing, usurping corporate opportunities and receiving improper personal benefits. Decisions made by directors and officers on an informed basis, in good faith and in the honest belief that the action was taken in the best interest of the corporation will be protected by the “business judgment rule.” |
The Companies Act provides that a director of a company shall, immediately after becoming aware of the fact that they are interested in a transaction entered into, or to be entered into, by the company, disclose the interest to the board of directors of the company. However, the failure of a director to disclose that interest does not affect the validity of a transaction entered into by the director or the company, so long as the transaction was not required to be disclosed because the transaction is between the company and the director themselves and is in the ordinary course of business and on usual terms and conditions. Additionally, the failure of a director to disclose an interest does not affect the validity of the transaction entered into by the company if (a) the material facts of the interest of the director in the transaction are |
| Directors may vote on a matter in which they have an interest so long as the director has disclosed any interests in the transaction. |
136
British Virgin Islands |
| Delaware |
known by the shareholders and the transaction is approved or ratified by a resolution of shareholders entitled to vote at a meeting of shareholders or (b) the company received fair value for the transaction. Pursuant to the Companies Act and our memorandum and articles of association, so long as a director has disclosed any interests in a transaction entered into or to be entered into by the company to the board of directors they may: (a) vote on a matter relating to the transaction; (b) attend a meeting of directors at which a matter relating to the transaction arises and be included among the directors present at the meeting for the purposes of a quorum; and (c) sign a document on behalf of the company, or do any other thing in their capacity as a director, that relates to the transaction. |
|
|
Shareholders’ Derivative Actions | ||
Generally speaking, the company is the proper plaintiff in any action affecting the company. A shareholder may, with the permission of the British Virgin Islands court, bring an action or intervene in a matter in the name of the company, in certain circumstances. Such actions are known as derivative actions. The British Virgin Islands court may only (but is not obliged to) grant permission to bring a derivative action where the following circumstances apply: (a) the company does not intend to bring, diligently continue or defend or discontinue the proceedings; and (b) it is in the interests of the company that the conduct of the proceedings not be left to the directors or to the determination of the shareholders as a whole. |
| In any derivative suit instituted by a shareholder of a corporation, it shall be averred in the complaint that the plaintiff was a shareholder of the corporation at the time of the transaction of which he complains or that such shareholder’s stock thereafter devolved upon such shareholder by operation of law. Complaint shall set forth with particularity the efforts of the plaintiff to obtain the action by the board of directors or the reasons for not making such effort. Such action shall not be dismissed or compromised without the approval of the Chancery Court. |
When considering whether to grant leave, the British Virgin Islands court is also required to have regard to the following matters: (a) whether the shareholder is acting in good faith; (b) whether a derivative action is in the interests of the company, taking into account the directors’ views on commercial matters; |
| If we were a Delaware corporation, a shareholder whose shares were cancelled in connection with our dissolution, would not be able to bring a derivative action against us after the common shares have been cancelled. |
137
British Virgin Islands |
| Delaware |
(c) whether the action is likely to succeed; (d) the costs of the proceedings in relation to the relief likely to be obtained; and (e) whether another alternative remedy to the derivative action is available. |
|
|
As noted above, the Companies Act differs from laws applicable to United States corporations and their shareholders. Set forth below is a summary of some of the significant provisions of the Companies Act applicable to us and the laws applicable to companies incorporated in the United States and their shareholders.
Mergers and Similar Arrangements. The Companies Act provides for “mergers” as that expression is understood under United States corporate law. Under the Companies Act, two or more companies may either merge into one of such existing companies (the “surviving company”) or consolidate with both existing companies ceasing to exist and forming a new company (the “consolidated company”). The procedure for a merger or consolidation between the company and another company (which need not be a British Virgin Islands company, and which may be the company’s parent or subsidiary, but need not be) is set out in the Companies Act. The directors of the British Virgin Islands company or British Virgin Islands companies which are to merge or consolidate must approve a written plan of merger or consolidation which, with the exception of a merger between a parent company and its subsidiary, must also be approved by a resolution of the shareholders who are entitled to vote and actually vote at a quorate meeting of shareholders (or by written resolution of the shareholders) of the British Virgin Islands company or British Virgin Islands companies which are to merge. A foreign company which is able to participate in the merger or consolidation under the laws of its foreign jurisdiction is required by the Companies Act to comply with the laws of that foreign jurisdiction in relation to the merger or consolidation. The company must then execute articles of merger or consolidation, containing certain prescribed details. The plan and articles of merger or consolidation are then filed with the Registrar of Corporate Affairs in the British Virgin Islands. The Registrar then registers the articles of merger or consolidation and any amendment to the memorandum and articles of the surviving company in a merger or the memorandum and articles of association of the new consolidated company in a consolidation and issue a certificate of merger or consolidation (which is conclusive evidence of compliance with all requirements of the Companies Act in respect of the merger or consolidation). The merger is effective on the date that the articles of merger are registered with the Registrar or on such subsequent date, not exceeding thirty days, as is stated in the articles of merger or consolidation.
As soon as a merger becomes effective:
138
The Registrar shall strike off the register of companies each constituent company that is not the surviving company in the case of a merger and all constituent companies in the case of a consolidation.
If the directors determine it to be in the best interests of the company, it is also possible for a merger to be approved as a court approved plan of arrangement or scheme of arrangement in accordance with the Companies Act.
Poison Pill Defenses. Under the Companies Act, there are no provisions which specifically prevent the issuance of preferred shares or any such other ‘poison pill’ measures and there is relevant jurisprudence which support the legality of the Issuer adopting “poison pill” measures. Our memorandum and articles of association expressly permit the creation and issuance of preferred shares. Therefore, the directors may issue preferred shares that have characteristics that may be deemed to be anti-takeover without the approval of the holders of common shares. Additionally, such a designation of shares may be used in connection with plans that are poison pill plans. As noted above under the Companies Act, a director in the exercise of his powers and performance of his duties is required to act honestly and in good faith in what the director believes to be the best interests of the company.
Directors. The directors are divided into three classes designated Class I, Class II and Class III. Each director shall serve for a term ending on the date of the third annual general meeting of the shareholders following the annual general meeting of the shareholders at which such director was elected and subject to the provisions of our memorandum and articles of association, and being understood that for the first designation, directors designated as Class I directors shall serve for a term ending on the date of the first annual general meeting of shareholders following our IPO, directors initially designated as Class II directors shall serve for a term ending on the second annual general meeting of shareholders following our IPO, and directors initially designated as Class III directors shall serve for a term ending on the date of the third annual general meeting of the shareholders following our IPO. There is nothing under the laws of the British Virgin Islands which specifically prohibits or restricts the creation of cumulative voting rights for the election of our directors. However, our memorandum and articles of association do not provide for cumulative voting for such elections.
Our memorandum and articles of association provide that, subject to any rights of holders of preferred shares to elect additional directors under specified circumstances, the number of directors will be fixed from time to time exclusively pursuant to a resolution adopted by our board of directors. Our memorandum and articles of association also provide that, subject to the rights granted to one or more series of preferred stock then outstanding, any vacancies on our board of directors will be filled only by the affirmative vote of a majority of the remaining directors, even if less than a quorum.
There are no share ownership qualifications for directors.
Meetings of our board of directors may be convened at any time by any of our directors.
A meeting of our board of directors will be quorate if at least a majority of the directors are present. At any meeting of our directors, each director is entitled to one vote. Questions arising at a meeting of our board of directors are required to be decided by simple majority votes of the directors present or represented at the meeting (except for certain matters which require the approval of two-thirds of the directors, including the removal of directors without cause and the removal of the chief executive officer). Our board of directors also may pass resolutions without a meeting by written consent.
139
Agents and Officers. Our board of directors has the power to appoint any person (whether or not a director or other officer of the company) to be an agent and/or officer of the company.
When appointing an agent or officer of the company, our directors may authorize the agent or officer to appoint one or more substitutes or delegates to exercise some or all of the powers conferred on the agent or officer. Our directors may remove an agent or officer and may revoke or vary a power conferred on them.
Indemnification of Directors. Our memorandum and articles of association provide that, subject to certain limitations, the company shall indemnify its directors and officers against all expenses, including legal fees, and against all judgments, fines and amounts paid in settlement and reasonably incurred in connection with legal, administrative or investigative proceedings. Such indemnity only applies if the person acted honestly and in good faith with a view to the best interests of the company and, in the case of criminal proceedings, the person had no reasonable cause to believe that their conduct was unlawful. The decision of the directors as to whether the person acted honestly and in good faith and with a view to the best interests of the company and as to whether the person had no reasonable cause to believe that his conduct was unlawful is, in the absence of fraud, sufficient for the purposes of the memorandum and articles of association, unless a question of law is involved. The termination of any proceedings by any judgment, order, settlement, conviction or the entering of a nolle prosequi does not, by itself, create a presumption that the person did not act honestly and in good faith and with a view to the best interests of the company or that the person had reasonable cause to believe that his conduct was unlawful.
Directors and Conflicts of Interest. As noted in the table above, pursuant to the Companies Act and a company’s memorandum and articles of association, a director of a company who has an interest in a transaction and who has declared such interest to the other directors, may:
Shareholders’ Suits. Our British Virgin Islands counsel is not aware of any reported class action having been brought in a British Virgin Islands court. The enforcement of the company’s rights will ordinarily be a matter for its directors.
In certain limited circumstances, a shareholder has the right to seek various remedies against the company in the event the directors are in breach of their duties under the Companies Act. Pursuant to Section 184B of the Companies Act, if a company or director of a company engages in, or proposes to engage in or has engaged in, conduct that contravenes the provisions of the Companies Act or the memorandum and articles of association of the company, the British Virgin Islands court may, on application of a shareholder or director of the company, make an order directing the company or director to comply with, or restraining the company or director from engaging in conduct that contravenes the Companies Act or the memorandum and articles of association. Furthermore, pursuant to section 184I(1) of the Companies Act a shareholder of a company who considers that the affairs of the company have been, are being or likely to be, conducted in a manner that is, or any acts of the company have been, or are likely to be oppressive, unfairly discriminatory, or unfairly prejudicial to him in that capacity, may apply to the British Virgin Islands court for an order which, inter alia, can require the company or any other person to pay compensation to the shareholders.
140
The Companies Act provides for a series of remedies available to shareholders. Where a company incorporated under the Companies Act conducts some activity, which breaches the Companies Act or the company’s memorandum and articles of association, the court can issue a restraining or compliance order. Under the Companies Act, a shareholder of a company may bring an action against the company for breach of a duty owed by the company to him as a member. A shareholder also may, with the permission of the British Virgin Islands court, bring an action or intervene in a matter in the name of the company, in certain circumstances. Such actions are known as derivative actions. As noted above, the British Virgin Islands court may only (but is not obliged to) grant permission to bring a derivative action where the following circumstances apply:
When considering whether to grant leave, the British Virgin Islands court is also required to have regard to the following matters:
Any member of a company may apply to the British Virgin Islands court under the Insolvency Act for the appointment of a liquidator to liquidate the company and the court may appoint a liquidator for the company if it is of the opinion that it is just and equitable to do so.
The Companies Act provides that any shareholder of a company is entitled to payment of the fair value of their shares upon dissenting from any of the following:
Generally, any other claims against a company by its shareholders must be based on the general laws of contract or tort applicable in the British Virgin Islands or their individual rights as shareholders as established by the company’s memorandum and articles of association. There are common law rights for the protection of shareholders that may be invoked, largely derived from English common law. Under the general English company law known as the rule in Foss v. Harbottle, a court will generally refuse to interfere with the management of a company at the insistence of a minority of its shareholders who express dissatisfaction with the conduct of the company’s affairs by
141
the majority or the board of directors. However, every shareholder is entitled to seek to have the affairs of the company conducted properly according to law and the constituent documents of the corporation. As such, if those who control the company have persistently disregarded the requirements of company law or the provisions of the company’s memorandum and articles of association, then the courts may grant relief. Generally, the areas in which the courts will intervene are the following:
Compulsory Acquisition. Under the Companies Act, subject to any limitations in a company’s memorandum or articles, members holding 90% of the votes of the outstanding shares entitled to vote, and members holding 90% of the votes of the outstanding shares of each class of shares entitled to vote, may give a written instruction to the company directing the company to redeem the shares held by the remaining members. Upon receipt of such written instruction, the company shall redeem the shares specified in the written instruction, irrespective of whether or not the shares are by their terms redeemable. The company shall give written notice to each member whose shares are to be redeemed stating the redemption price and the manner in which the redemption is to be effected. A member whose shares are to be so redeemed is entitled to dissent from such redemption, and to be paid the fair value of his shares, as described under “Shareholders’ Suits.”
Share Repurchases and Redemptions. As permitted by the Companies Act and our memorandum and articles of association, shares may be repurchased, redeemed or otherwise acquired by us. Depending on the circumstances of the redemption or repurchase, our directors may need to determine that immediately following the redemption or repurchase we will be able to satisfy our debts as they fall due and the value of our assets exceeds our liabilities. Our directors may only exercise this power on our behalf, subject to the Companies Act, our memorandum and articles of association and to any applicable requirements imposed from time to time by the SEC, the New York Stock Exchange or any other stock exchange on which our securities are listed.
Dividends. Subject to the Companies Act and our memorandum and articles of association, our directors may declare dividends at a time and amount they think fit if they are satisfied, on reasonable grounds, that, immediately after distribution of the dividend, the value of our assets will exceed our liabilities and we will be able to pay our debts as they fall due. No dividend shall carry interest against us.
Rights of Non-resident or Foreign Shareholders and Disclosure of Substantial Shareholdings. There are no limitations imposed by our memorandum and articles of association on the rights of non-resident or foreign shareholders to hold or exercise voting rights on our shares. In addition, there are no provisions in our memorandum and articles of association governing the ownership threshold above which shareholder ownership must be disclosed.
Untraceable Shareholders. Under our memorandum and articles of association, we are entitled to sell any shares of a shareholder who is untraceable, as long as:
The net proceeds of any such sale shall belong to us, and when we receive these net proceeds we shall become indebted to the former shareholder for an amount equal to such net proceeds.
142
Transfer of Shares. Subject to any applicable provisions and restrictions set forth in our memorandum and articles of association, any of our shareholders may transfer all or any of his or her shares in accordance with the laws, rules, procedures and other requirements applicable to shares listed on the New York Stock Exchange.
Inspection of Books and Records. Under the Companies Act, members of the general public via a British Virgin Islands registered agent or legal practitioner, on payment of a nominal fee, can obtain copies of the public records of a company available at the office of the Registrar which will include the company’s certificate of incorporation, its memorandum and articles of association (with any amendments) and records of license fees paid to date and will also disclose any articles of dissolution, articles of merger and a register of charges if the company has elected to file such a register. Upon payment of an additional search fee, the names of the current directors are also available.
A member of a company is entitled, on giving written notice to the company, to inspect:
Notwithstanding the foregoing, and subject to our memorandum and articles of association, the directors may, if they are satisfied that it would be contrary to the company’s interests to allow a member to inspect any document, or part of a document, specified in (b), (c) or (d) above, refuse to permit the member to inspect the document or limit the inspection of the document, including limiting the making of copies or the taking of extracts from the records. Our memorandum and articles of association do not prohibit the directors from refusing an inspection.
Where a company fails or refuses to permit a member to inspect a document or permits a member to inspect a document subject to limitations, that member may apply to the British Virgin Islands court for an order that he should be permitted to inspect the document or to inspect the document without limitation.
Dissolution; Winding Up. As permitted by the Companies Act and our memorandum and articles of association, the Issuer may be voluntarily liquidated under Part XII of the Companies Act by resolution of directors and resolution of shareholders if we have no liabilities or we are able to pay our debts as they fall due.
The Issuer may also be wound up in circumstances where we are insolvent in accordance with the terms of the Insolvency Act.
Anti-Money Laundering Laws. In order to comply with legislation or regulations aimed at the prevention of money laundering we are required to adopt and maintain anti-money laundering procedures, and may require subscribers to provide evidence to verify their identity. Where permitted, and subject to certain conditions, we also may delegate the maintenance of our anti-money laundering procedures (including the acquisition of due diligence information) to a suitable person.
We reserve the right to request such information as is necessary to verify the identity of a subscriber. In the event of delay or failure on the part of the subscriber in producing any information required for verification purposes, we may refuse to accept the application, in which case any funds received will be returned without interest to the account from which they were originally debited.
If any person resident in the British Virgin Islands knows or suspects that another person is engaged in money laundering or terrorist financing and the information for that knowledge or suspicion came to their attention in the course of their business the person will be required to report his belief or suspicion to the Financial Investigation Agency of the British Virgin Islands, pursuant to the Proceeds of Criminal Conduct Act 1997 (as amended). Such a report shall not be treated as a breach of confidence or of any restriction upon the disclosure of information imposed by any enactment or otherwise.
143
CLASS A COMMON SHARES ELIGIBLE FOR FUTURE SALE
Future sales of substantial amounts of our Class A common shares in the public market after this offering, or the possibility of these sales occurring, could materially and adversely affect the prevailing market prices. Furthermore, since only a limited number of Class A common shares will be available for sale shortly after this offering because of contractual and legal restrictions on resale described below, sales of substantial amounts of Class A common shares in the public market after those restrictions lapse could adversely affect the prevailing market price for our Class A common shares, as well as our ability to raise equity capital in the future.
We have 38,709,677 Class A common shares outstanding. The Class A common shares to be sold in this offering by the selling shareholders will be freely tradable. The Class B common shares and Class C common shares outstanding after this offering, representing 50.8% of our outstanding shares if the underwriters do not exercise their option to purchase additional Class A common shares from the selling shareholders, will be held by our current shareholders and restricted under applicable securities laws and lock-up provisions and/or other transfer restrictions set forth in our memorandum and articles of association, as described under “Description of Share Capital” and below. Following the expiration of such lock-up restrictions, all Class B common shares (as converted into Class A common shares at the end of the applicable lock-up period) and Class C common shares (as converted into Class A common shares at the end of the applicable lock-up period) will be eligible for resale in compliance with Rule 144 or Rule 701. “Restricted securities” as defined under Rule 144 were issued and sold by us in reliance on exemptions from the registration requirements of the Securities Act. These Class A common shares may be sold in the public market only if registered or pursuant to an exemption from registration, such as Rule 144 or Rule 701 under the Securities Act.
Lock-up Provisions of Our Memorandum and Articles of Association
In addition to restrictions on sales and dispositions in our memorandum and articles of association relating to our IPO described in our memorandum and articles of association, the Liquidity Lock-Up Period will be in force for a period commenced on the date of expiry of the 180-day initial lock-up period and ending 24 months after such date, during which the holders of Class B common shares and Class C common shares may not directly or indirectly offer, sell, pledge, grant any option to purchase, make any short sale or otherwise dispose of any Class B common shares or Class C common shares (or grant or enter into any option, warrant, convertible security, hedging arrangement or other transaction relating thereto), except for certain permitted transfers described in our memorandum and articles of association. See “Description of Share Capital—Class B Common Shares” and “Description of Share Capital—Class C Common Shares.”
Rule 144
In general, under Rule 144 under the Securities Act, a person (or persons whose shares are aggregated) who is not deemed to have been an affiliate of ours at any time during the three months preceding a sale, and who has beneficially owned restricted securities within the meaning of Rule 144 for at least six months (including any period of consecutive ownership of preceding non-affiliated holders) would be entitled to sell those shares, subject only to the availability of current public information about us. A non-affiliated person who has beneficially owned restricted securities within the meaning of Rule 144 for at least one year would be entitled to sell those shares without regard to the provisions of Rule 144.
A person (or persons whose shares are aggregated) who is deemed to be an affiliate of ours and who has beneficially owned restricted securities within the meaning of Rule 144 for at least six months would be entitled to sell within any three-month period a number of shares that does not exceed the greater of one percent of the then outstanding shares of our Class A common shares or the average weekly trading volume of our Class A common shares on the during the four calendar weeks preceding such sale. Such sales are also subject to certain manner of sale provisions, notice requirements and the availability of current public information about us.
144
Rule 701
Rule 701 generally allows a shareholder who purchased Class A common shares pursuant to a written compensatory plan or contract and who is not deemed to have been an affiliate of us during the immediately preceding 90 days to sell these Class A common shares in reliance upon Rule 144, but without being required to comply with the public information, holding period, volume limitation, or notice provisions of Rule 144. Rule 701 also permits affiliates of our company to sell their Rule 701 Class A common shares under Rule 144 without complying with the holding period requirements of Rule 144. All holders of Rule 701 Class A common shares, however, are required to wait until 90 days after the date of this prospectus before selling such Class A common shares pursuant to Rule 701.
Registration Rights
Our memorandum and articles of association grant holders of our Class B common shares and Class C common shares customary registration rights for the resale of the Class A common shares into which the Class B common shares and Class C common shares held by them are convertible. Registration of these shares under the Securities Act would result in these shares becoming freely tradable without restriction under the Securities Act immediately upon the effectiveness of the registration, except for shares purchased by affiliates. Class A common shares covered by a registration statement will be eligible for sales in the public market upon the expiration, or their release from the terms of, the lock-up provisions of our memorandum and articles of association described above and under “Description of Our Share Capital.” Any sales of Class A common shares by these shareholders could have a material adverse effect on the trading price of our Class A common shares.
Equity Incentive Plan
We filed a registration statement on Form S-8 under the Securities Act following our IPO to register all of the Class A common shares issued or reserved for issuance under our 2004 Option Plan and Equity Incentive Plan. See “Management—2004 Option Plan” and “Management—Equity Incentive Plan.” Class A common shares covered by this registration statement will be eligible for sale in the public market, upon the expiration of the lock-up provisions of our memorandum and articles of association, and subject to vesting of any options to receive such Class A common shares.
145
CERTAIN TAX CONSIDERATIONS
The following summary contains a description of certain British Virgin Islands, Mexican and U.S. federal income tax consequences of the acquisition, ownership and disposition of our Class A common shares. It does not purport to be a comprehensive description of all the tax considerations that may be relevant to a decision to purchase the Class A common shares, is not applicable to all categories of investors, some of which may be subject to special rules, and does not address all of the British Virgin Islands, Mexican and U.S. federal income tax considerations applicable to any particular holder. The summary is based upon the tax laws of the British Virgin Islands, Mexico and the United States and regulations thereunder as of the date hereof, which are subject to change.
Prospective purchasers of our Class A common shares should consult their own tax advisors about the particular British Virgin Islands, Mexican and U.S. federal, state, local and other tax consequences to them of the acquisition, ownership and disposition of our Class A common shares.
British Virgin Islands Tax Considerations
The Government of the British Virgin Islands does not, under existing legislation, impose any income, corporate or capital gains tax, estate duty, inheritance tax, gift tax or withholding tax upon the Issuer or its security holders who are not tax resident in the British Virgin Islands.
We are not liable to pay any form of taxation in the British Virgin Islands and all dividends, interest, rents, royalties, compensations and other amounts paid by us to persons who are not persons resident in the British Virgin Islands are exempt from all forms of taxation in the British Virgin Islands and any capital gains realized with respect to any shares, debt obligations, or other securities of ours by persons who are not persons resident in the British Virgin Islands are exempt from all forms of taxation in the British Virgin Islands.
No estate, inheritance, succession or gift tax, rate, duty, levy or other charge is payable by persons who are not persons resident in the British Virgin Islands with respect to any shares, debt obligation or other securities of ours.
Subject to the payment of stamp duty on the acquisition of property in the British Virgin Islands by us (and in respect of certain transactions in respect of the shares, debt obligations or other securities of British Virgin Islands incorporated companies owning land in the British Virgin Islands), all instruments relating to transfers of property to or by us and all instruments relating to transactions in respect of the shares, debt obligations or other securities of ours and all instruments relating to other transactions relating to our business are exempt from payment of stamp duty in the British Virgin Islands.
There are currently no withholding taxes or exchange control regulations in the British Virgin Islands applicable to us or our shareholders.
Certain Mexican Tax Considerations
This summary is provided for non-Mexican Holders (as defined below) that acquire the Class A common shares in this offering and does not address tax consequences to holders that are regarded as tax-resident in Mexico for tax purposes.
The Issuer is a non-Mexican resident for tax purposes given that its administration and place of effective management are located outside of Mexico. Any capital gains realized or dividend distributions received by non-Mexican Holders with respect to Class A common shares will not be deemed as Mexican-sourced income, and thus will not be subject to Mexican taxation.
For purposes of this summary, the term “non-Mexican Holder” shall mean a beneficial owner of Class A common shares that is not a resident of Mexico for tax purposes and does not conduct a business through a permanent establishment in Mexico for tax purposes.
146
There are no Mexican inheritance, gift, succession, or value added taxes applicable to the purchase, ownership, or disposition of the Class A common shares by non-Mexican Holders.
Certain United States Federal Income Tax Considerations
The following discussion describes certain U.S. federal income tax consequences of the ownership and disposition of our Class A common shares. This discussion deals only with Class A common shares that are held as capital assets by a U.S. Holder (as defined below).
As used herein, the term “U.S. Holder” means a beneficial owner of our Class A common shares that is, for U.S. federal income tax purposes, any of the following:
This discussion is based upon provisions of the U.S. Internal Revenue Code of 1986, as amended (the “Code”), and regulations, rulings and judicial decisions thereunder, all as of the date hereof. Those authorities may be changed, perhaps retroactively, so as to result in U.S. federal income tax consequences different from those summarized below.
This discussion does not represent a detailed description of the U.S. federal income tax consequences applicable to you if you are subject to special treatment under the U.S. federal income tax laws, including if you are:
If a partnership (or other entity or arrangement treated as a partnership for U.S. federal income tax purposes) holds our Class A common shares, the tax treatment of a partner will generally depend upon the status of
147
the partner and the activities of the partnership. If you are a partnership or partner of a partnership holding our Class A common shares, you should consult your tax advisors.
This summary does not contain a detailed description of all the U.S. federal income tax consequences to you in light of your particular circumstances and does not address the Medicare tax on net investment income, U.S. federal estate and gift taxes or the effects of any state, local or non-U.S. tax laws. If you are considering the purchase of our Class A common shares, you should consult your own tax advisors concerning the particular U.S. federal income tax consequences to you of the ownership and disposition of our Class A common shares, as well as the consequences to you arising under other U.S. federal tax laws (such as estate and gift tax laws) and the laws of any other taxing jurisdiction.
Except as specifically noted below under “—Passive Foreign Investment Company,” the following discussion assumes we are not, and will not be, a passive foreign investment company (“PFIC”) for U.S. federal income tax purposes.
Taxation of Dividends
The gross amount of distributions on our Class A common shares will be taxable as dividends to the extent paid out of our current or accumulated earnings and profits, as determined under U.S. federal income tax principles. To the extent that the amount of any distribution exceeds our current and accumulated earnings and profits for a taxable year, the distribution will first be treated as a tax-free return of capital, causing a reduction in your tax basis in the Class A common shares, and to the extent the amount of the distribution exceeds your tax basis, the excess will be taxed as capital gain recognized on a sale or exchange (as discussed below under “—Taxation of Sales or Exchanges”). We do not, however, expect to determine earnings and profits in accordance with U.S. federal income tax principles. Therefore, you should expect that a distribution will generally be reported as a dividend for U.S. federal income tax purposes.
Any dividends that you receive (including any withheld taxes) will be includable in your gross income as ordinary income from foreign sources on the day actually or constructively received by you. Such dividends will not be eligible for the dividends received deduction generally allowed to corporations under the Code.
Subject to applicable limitations (including a minimum holding period requirement), dividends received by non-corporate U.S. Holders from a qualified foreign corporation may be treated as “qualified dividend income” that is subject to reduced rates of taxation. For these purposes, a foreign corporation is treated as a qualified foreign corporation with respect to dividends paid by that corporation on shares that are readily tradable on an established securities market in the United States. U.S. Treasury Department guidance indicates that our Class A common shares, which are listed on the New York Stock Exchange, are readily tradable on an established securities market in the United States. Thus, we believe that any dividends we pay on our Class A common shares to non-corporate U.S. Holders will be potentially eligible for these reduced tax rates. However, non-corporate U.S. Holders will not be eligible for reduced tax rates on any dividends received from us if we are a PFIC (as discussed below under “—Passive Foreign Investment Company”) in the taxable year in which such dividends are paid or in the preceding taxable year. You should consult your own tax advisors regarding the application of these rules to your particular circumstances.
Distributions of Class A common shares or rights to subscribe for Class A common shares that are received as part of a pro rata distribution to all of our shareholders (and for which the shareholders do not have a right to receive cash or other property instead) generally will not be subject to U.S. federal income tax.
Taxation of Sales or Exchanges
For U.S. federal income tax purposes, you will recognize taxable gain or loss on any sale, exchange or other taxable disposition of Class A common shares in an amount equal to the difference between the amount realized for the Class A common shares) and your tax basis in the Class A common shares. Such gain or loss will generally be capital gain or loss and will generally be long-term capital gain or loss if you have held the Class A common shares for more than one year. Long-term capital gains of non-corporate U.S. Holders (including individuals) are eligible for reduced rates of taxation. The deductibility of capital losses is subject to limitations. Any gain or loss recognized by you will generally be treated as U.S. source gain or loss.
148
Passive Foreign Investment Company
In general, we will be a PFIC for any taxable year in which, after applying certain look-through rules, (i) at least 75% of our gross income is passive income, or (ii) at least 50% of the value (generally determined based on a quarterly average) of our assets is attributable to assets that produce, or are held for the production of, passive income. For this purpose, passive income generally includes dividends, interest, royalties and rents (other than royalties and rents derived in the active conduct of a trade or business and not derived from a related person). In addition, cash and other assets readily convertible into cash are generally considered passive assets.
Based on the past and projected composition of our income and assets, and the value of our assets, including goodwill, we do not believe we were a PFIC for our most recent taxable year, and we do not expect to become a PFIC in the current taxable year or the foreseeable future, although there can be no assurance in this regard. The determination of whether we are a PFIC is made annually. Accordingly, it is possible that we may become a PFIC in the current or any future taxable year due to changes in our asset or income composition or in the value of our assets.
If we are a PFIC for any taxable year during which you hold our Class A common shares, you could be subject to additional U.S. federal income taxes on gain recognized with respect to our Class A common shares and on certain distributions, plus an interest charge on certain taxes treated as having been deferred under the PFIC rules. Although the determination of whether we are a PFIC is made annually, if we are a PFIC for any taxable year in which you hold our Class A common shares, we would generally continue to be treated as a PFIC with respect to you for all succeeding years during which you hold the Class A common shares, even if we ceased to meet the threshold requirements for PFIC status during such years. However, if we cease to be a PFIC, you can avoid the continuing impact of the PFIC rules by making a special election to recognize gain as if your Class A common shares had been sold on the last day of the last taxable year during which we were a PFIC.
You will generally be required to file Internal Revenue Service (“IRS”) Form 8621 if you hold our Class A common shares in any year in which we are classified as a PFIC. You are urged to consult your tax advisors concerning the U.S. federal income tax consequences of holding Class A common shares if we are considered a PFIC in any taxable year, including the potential availability and effect of any elections which would provide for alternative treatment.
Information Reporting and Backup Withholding
In general, information reporting will apply to dividends in respect of our Class A common shares and the proceeds from the sale, exchange or other disposition of Class A common shares that are paid to you within the United States (and in certain cases, outside the United States), unless you establish that you are an exempt recipient. Backup withholding may apply to such payments if you fail to provide a taxpayer identification number and a certification that you are not subject to backup withholding or if you fail to report in full dividend and interest income.
Backup withholding is not an additional tax. Any amounts withheld under the backup withholding rules will be allowed as a refund or a credit against your U.S. federal income tax liability provided the required information is timely furnished to the IRS.
Certain U.S. Holders that own “specified foreign financial assets” with an aggregate value in excess of US$50,000 on the last day of the taxable year or US$75,000 at any time during the taxable year (or in some circumstances, a higher threshold) may be required to report information relating to such assets with their tax returns. “Specified foreign financial assets” may include financial accounts maintained by foreign financial institutions, as well as the following, but only if they are held for investment and not held in accounts maintained by financial institutions: (i) stocks and securities issued by non-U.S. persons, (ii) financial instruments and contracts that have non-U.S. issuers or counterparties, and (iii) interests in foreign entities. Significant penalties may apply for failing to satisfy this filing requirement. You are urged to consult your own tax advisors regarding information reporting requirements relating to your ownership of the Class A common shares.
149
UNDERWRITING
Under the terms and subject to the conditions in an underwriting agreement dated , 2025, the underwriters named below, for whom J.P. Morgan Securities LLC, Morgan Stanley & Co. LLC, Banco BTG Pactual, S.A. — Cayman Branch, Santander US Capital Markets LLC and Scotia Capital (USA) Inc. are acting as representatives, have severally agreed to purchase, and the selling shareholders have agreed to sell to them, severally and not jointly, the number of Class A common shares indicated below:
Underwriter |
| Number of |
| |
J.P. Morgan Securities LLC |
|
|
| |
Morgan Stanley & Co. LLC |
|
|
| |
Banco BTG Pactual S.A. - Cayman Branch |
|
|
| |
Santander US Capital Markets LLC |
|
|
| |
Scotia Capital (USA) Inc. |
|
|
| |
Total |
|
| 17,500,000 |
|
Banco BTG Pactual S.A. — Cayman Branch is not a broker-dealer registered with the SEC, and therefore may not make sales of any Class A common shares in the United States or to U.S. persons except in compliance with applicable U.S. laws and regulations. To the extent Banco BTG Pactual S.A. — Cayman Branch intends to effect sales of the Class A common shares in the United States, it will do so only through BTG Pactual US Capital, LLC or one or more U.S. registered broker-dealers, or otherwise as permitted by applicable U.S. law.
The underwriters and the representatives are collectively referred to as the “underwriters” and the “representatives,” respectively. The underwriters are offering the Class A common shares subject to their acceptance of the Class A common shares from the selling shareholders (if the underwriters exercise their option to purchase additional Class A common shares from the selling shareholders) and subject to prior sale. The underwriting agreement provides that the obligations of the several underwriters to pay for and accept delivery of the Class A common shares offered by this prospectus are subject to the approval of certain legal matters by their counsel and to certain other conditions. The underwriters are obligated to take and pay for all of the Class A common shares offered by this prospectus if any such shares are taken. However, the underwriters are not required to take or pay for the Class A common shares covered by the underwriters’ over-allotment option to purchase additional Class A common shares described below.
The selling shareholders have granted the underwriters an option, exercisable for 30 days from the date of this prospectus, to purchase up to 2,625,000 additional Class A common shares at the public offering price listed on the cover page of this prospectus, less underwriting discounts and commissions. The underwriters may exercise this option solely for the purpose of covering over-allotments, if any, made in connection with the offering of the Class A common shares by this prospectus. To the extent the option is exercised, each underwriter will become obligated, subject to certain conditions, to purchase about the same percentage of the additional Class A common shares as the number listed next to the underwriter’s name in the preceding table bears to the total number of Class A common shares listed next to the names of all underwriters in the preceding table.
We and the selling shareholders have agreed to indemnify the several underwriters against certain liabilities, including liabilities under the Securities Act or to contribute to payments the underwriters may be required to make in respect of those liabilities.
150
Commissions and Discounts
The following table shows the per Class A common share and total public offering price, underwriting discounts and commissions, and proceeds before expenses to the selling shareholders. These amounts are shown assuming both no exercise and full exercise of the underwriters’ option to purchase up to an additional 2,625,000 Class A common shares from the selling shareholders.
| Total | |||||
| Per Class A |
| No Exercise |
| Full Exercise | |
| (US$) | |||||
Public offering price |
|
|
|
|
|
|
Underwriting discounts and commissions to be |
|
|
|
|
|
|
Proceeds, before expenses, to the selling |
|
|
|
|
|
|
We estimate that our share of the total expenses of this offering, excluding underwriting discounts and commissions, will be approximately US$1,963,100. We have agreed to reimburse the underwriters for certain of their expenses incurred in connection with this offering.
Class A common shares sold by the underwriters to the public will initially be offered at the public offering price set forth on the cover of this prospectus. Any Class A common shares sold by the underwriters to securities dealers may be sold at a discount of up to US$ per Class A common share from the public offering price. After the offering of the Class A common shares, the representatives may change the offering price and the other selling terms. The offering of the Class A common shares by the underwriters is subject to receipt and acceptance and subject to the underwriters’ right to reject any order in whole or in part.
Expiration of Lock-up Provisions of Our Memorandum and Articles of Association
All remaining Class A common shares or securities convertible into or exchangeable for Class A common shares (including our Class B common shares and Class C common shares) subject to the lock-up provisions of our memorandum and articles of association will be released prior to the opening of trading on the first full trading day following the periods described therein.
We have also agreed not to file with the SEC a registration statement under the Securities Act relating to, any securities that are substantially similar to the Class A common shares, including but not limited to any options or warrants to purchase Class A common shares or any securities that are convertible into or exchangeable for, or that represent the right to receive, Class A common shares (including Class B common shares and Class C common shares) or any such substantially similar securities, or publicly disclose the intention to make any offer, sale, pledge, disposition or filing or enter into any swap or other agreement that transfers, in whole or in part, any of the economic consequences of ownership of Class A common shares or any such other securities. These restrictions will not apply to: (1) the conversion of Class C common shares into Class A common shares to be sold pursuant to this offering; (2) grants of stock options, share awards, restricted shares, restricted stock units or other equity awards; (3) the issuance of Class A common shares or securities convertible into or exchangeable for Class A common shares (including Class B common shares and Class C common shares) upon the exercise of an option, restricted stock unit or warrant under an equity incentive plan; (4) the issuance of Class A common shares or securities convertible into or exchangeable for Class A common shares (including Class B common shares and Class C common shares) upon the conversion of a security described in this prospectus; (5) the issuance of Class A common shares or securities convertible into or exchangeable for Class A common shares (including Class B common shares and Class C common shares) in connection with a merger, acquisition, joint venture or strategic participation entered into by us; provided that the aggregate number of such Class A common shares or securities convertible into or exchangeable for Class A common shares (including Class B common shares and Class C common shares) issued thereby shall not exceed 10% of the total number of Class A common shares or securities convertible into or exchangeable for Class A common shares (including Class B common shares and Class C common shares) issued and outstanding as of the
151
date of such merger, acquisition, joint venture or strategic participation; and (6) the filing by us of any registration statement on Form S-8 or a successor form thereto relating to the Equity Incentive Plan described in this prospectus.
Listing Venue
Our Class A common shares are listed on the New York Stock Exchange under the symbol “TBBB.”
The public offering price will be negotiated among us, the selling shareholders and the representatives. Among the factors to be considered in determining the public offering price of the shares, in addition to prevailing market conditions, will be our historical performance, estimates of our business potential and earnings prospects, an assessment of our management and the consideration of the above factors in relation to market valuation of companies in related businesses.
Relationships
The underwriters and their respective affiliates are full service financial institutions engaged in various activities, which may include sales and trading, commercial and investment banking, advisory, investment management, investment research, principal investment, hedging, market making, brokerage and other financial and non-financial activities and services. Certain of the underwriters and their respective affiliates have provided, and may in the future provide, a variety of these services to us and to persons and entities with relationships with us, for which they received or will receive customary fees and expenses.
In the ordinary course of their various business activities, the underwriters and their respective affiliates, officers, directors and employees may purchase, sell or hold a broad array of investments and actively traded securities, derivatives, loans, commodities, currencies, credit default swaps and other financial instruments for their own account and for the accounts of their customers or affiliates, and such investment and trading activities may involve or relate to assets, securities and/or instruments of ours (directly, as collateral securing other obligations or otherwise) and/or persons and entities with relationships with us. The underwriters and their respective affiliates may also communicate independent investment recommendations, market color or trading ideas and/or publish or express independent research views in respect of such assets, securities or instruments and may at any time hold, or recommend to clients that they should acquire, long and/or short positions in such assets, securities and instruments.
Price Stabilization, Short Positions and Penalty Bids
In connection with this offering, the underwriters may purchase and sell Class A common shares in the open market. These transactions may include short sales, stabilizing transactions and purchases to cover positions created by short sales. Short sales involve the sale by the underwriters of a greater number of shares than they are required to purchase in this offering, and a short position represents the amount of such sales that have not been covered by subsequent purchases. A “covered short position” is a short position that is not greater than the number of additional Class A common shares for which the underwriters’ option described above may be exercised. The underwriters may cover any covered short position by either exercising their option to purchase additional Class A common shares or purchasing shares in the open market. In determining the source of shares to cover the covered short position, the underwriters will consider, among other things, the price of shares available for purchase in the open market as compared to the price at which they may purchase additional Class A common shares pursuant to the option described above. “Naked” short sales are any short sales that create a short position greater than the number of additional Class A common shares for which the option described above may be exercised. The underwriters must cover any such naked short position by purchasing shares in the open market. A naked short position is more likely to be created if the underwriters are concerned that there may be downward pressure on the price of the Class A common shares in the open market after pricing that could adversely affect investors who purchase in this offering. Stabilizing transactions consist of various bids for or purchases of Class A common shares made by the underwriters in the open market prior to the completion of this offering.
The underwriters may also impose a penalty bid. This occurs when a particular underwriter repays to the underwriters a portion of the underwriting discount received by it because the representatives have repurchased shares sold by or for the account of such underwriter in stabilizing or short covering transactions.
152
Purchases to cover a short position and stabilizing transactions, as well as other purchases by the underwriters for their own accounts, may have the effect of preventing or retarding a decline in the market price of our Class A common shares, and together with the imposition of the penalty bid, may stabilize, maintain or otherwise affect the market price of the Class A common shares. As a result, the price of the Class A common shares may be higher than the price that otherwise might exist in the open market. The underwriters are not required to engage in these activities and may end any of these activities at any time. These transactions may be effected on the New York Stock Exchange, in the over-the-counter market or otherwise.
Electronic Distribution
In connection with this offering, certain of the underwriters or securities dealers may distribute prospectuses by electronic means, such as email.
Selling Restrictions
European Economic Area and the United Kingdom
In relation to each Member State of the European Economic Area (each, a “Relevant State”), no Class A common shares have been offered or will be offered pursuant to this offering to the public in that Relevant State prior to the publication of a prospectus in relation to the Class A common shares which has been approved by the competent authority in that Relevant State or, where appropriate, approved in another Relevant State and notified to the competent authority in that Relevant State, all in accordance with the Prospectus Regulation, except that offers of Class A common shares may be made to the public in that Relevant State at any time pursuant to the following exemptions under the Prospectus Regulation:
provided that no such offer of Class A common shares shall require us or any underwriter to publish a prospectus pursuant to Article 3 of the Prospectus Regulation or supplement a prospectus pursuant to Article 23 of the Prospectus Regulation and each person who initially acquires any Class A common shares or to whom any offer is made will be deemed to have represented, acknowledged, and agreed to and with each of the underwriters and us that it is a “qualified investor” with the meaning of Article 2(e) of the Prospectus Regulation. In the case of any Class A common shares being offered to a financial intermediary as that term is used in Article 5(1) of the Prospectus Regulation, each such financial intermediary will be deemed to have represented, acknowledged, and agreed that the Class A common shares acquired by it in this offering have not been acquired on a non-discretionary basis on behalf of, nor have they been acquired with a view to their offer or resale to, persons in circumstances which may give rise to an offer of any Class A common shares to the public other than their offer or resale in a Relevant State to qualified investors as so defined or in circumstances in which the prior consent of the underwriters have been obtained to each such proposed offer or resale.
We, the underwriters and their and our respective affiliates will rely upon the truth and accuracy of the foregoing representations, acknowledgements and agreements.
For the purposes of this provision, the expression an “offer to the public” in relation to any Class A common shares in any Relevant State means the communication in any form and by any means of sufficient information on the terms of the offer and any Class A common shares to be offered so as to enable an investor to decide to purchase or subscribe for any Class A common shares, and the expression “Prospectus Regulation” means Regulation (EU) 2017/1129 (as amended).
The above selling restriction is in addition to any other selling restrictions set out below.
153
In connection with this offering, J.P. Morgan Securities LLC, Morgan Stanley & Co. LLC, Banco BTG Pactual, S.A. — Cayman Branch, Santander US Capital Markets LLC, and Scotia Capital (USA) Inc. are not acting for anyone other than the issuer and will not be responsible to anyone other than the issuer for providing the protections afforded to their clients nor for providing advice in relation to this offering.
United Kingdom
No Class A common shares have been offered or will be offered pursuant to this offering to the public in the United Kingdom, except that Class A common shares may be made offered to the public in the United Kingdom at any time:
provided that no such offer of Class A common shares shall require us or any underwriter to publish a prospectus pursuant to section 85 of the FSMA or supplement a prospectus pursuant to Article 23 of the UK Prospectus Regulation and each person who initially acquires any Class A common shares or to whom any offer is made will be deemed to have represented, warranted and agreed to and with each of the underwriters and us that it is a qualified investor within the meaning of Article 2 of the UK Prospectus Regulation.
In the case of any Class A common shares being offered to a financial intermediary as that term is used in Article 5(1) of the UK Prospectus Regulation, each financial intermediary will also be deemed to have represented, warranted and agreed that the Class A common shares acquired by it in this offering have not been acquired on a non-discretionary basis on behalf of, nor have they been acquired with a view to their offer or resale to, persons in circumstances which may give rise to an offer of any Class A common shares to the public, other than their offer or resale in the United Kingdom to qualified investors as so defined or in circumstances in which the prior consent of the representatives has been obtained to each such proposed offer or resale.
We, the selling shareholders, the underwriters and their affiliates will rely upon the truth and accuracy of the foregoing representations, warranties and agreements. Notwithstanding the above, a person who is not a “qualified investor” and who has notified the representatives of such fact in writing may, with the prior consent of the representatives, be permitted to acquire Class A common shares in this offering.
For the purposes of this provision, the expression an “offer to the public” in relation to the Class A common shares in the United Kingdom means the communication in any form and by any means of sufficient information on the terms of the offer and the Class A common shares to be offered so as to enable an investor to decide to purchase or subscribe for the Class A common shares, and the expression “UK Prospectus Regulation” means Regulation (EU) 2017/1129 as it forms part of United Kingdom domestic law by virtue of the European Union (Withdrawal) Act 2018.
In the United Kingdom, this prospectus and any other material in relation to the Class A common shares described herein are only being distributed to, and are only directed at, persons who are “qualified investors “ (as defined in the UK Prospectus Regulation ) who are (i) persons having professional experience in matters relating to investments falling within Article 19(5) of the Financial Services and Markets Act 2000 (Financial Promotion) Order 2005 (as amended, the “Order”), or (ii) high net worth entities falling within Article 49(2)(a) to (d) of the Order, or (iii) persons to whom it would otherwise be lawful to distribute them, all such persons together being referred to as “Relevant Persons.” In the United Kingdom, the Class A common shares are only available to, and any invitation, offer or agreement to subscribe, purchase or otherwise acquire such Class A common shares will be engaged in only with, Relevant Persons. This prospectus and its contents are confidential and should not be distributed, published or reproduced (in whole or in part) or disclosed by any recipients to any other person in the United Kingdom. Any person in the United Kingdom that is not a Relevant Person should not act or rely on this prospectus or its contents.
154
Argentina
The Class A common shares are not authorized for public offering in Argentina by the Comisión Nacional de Valores pursuant to Argentine Public Offering Law No. 17,811, as amended, and they shall not be sold publicly. Therefore, any transaction carried out in Argentina must be made privately.
Australia
No placement document, prospectus, product disclosure statement or other disclosure document has been lodged or will be lodged with the Australian Securities and Investments Commission (“ASIC”), in relation to this offering. This document does not constitute a prospectus, product disclosure statement or other disclosure document under the Corporations Act 2001 (the Corporations Act) and does not purport to include the information required for a prospectus, product disclosure statement or other disclosure document under the Corporations Act.
Any offer in Australia of the Class A common shares may only be made to persons (the Exempt Investors) who are “sophisticated investors” (within the meaning of section 708(8) of the Corporations Act), “professional investors” (within the meaning of section 708(11) of the Corporations Act) or otherwise pursuant to one or more exemptions contained in section 708 of the Corporations Act so that it is lawful to offer the Class A common shares without disclosure to investors under Chapter 6D of the Corporations Act.
The Class A common shares applied for by Exempt Investors in Australia must not be offered for sale in Australia in the period of 12 months after the date of allotment under this offering, except in circumstances where disclosure to investors under Chapter 6D of the Corporations Act would not be required pursuant to an exemption under section 708 of the Corporations Act or otherwise or where the offer is pursuant to a disclosure document which complies with Chapter 6D of the Corporations Act. Any person acquiring Class A common shares must observe such Australian on-sale restrictions.
The Issuer is not licensed in Australia to provide financial product advice in relation to the Class A common shares. This prospectus contains general information only and does not take account of the investment objectives, financial situation or particular needs of any particular person. It does not contain any securities recommendations or financial product advice. Any advice contained in this document is general advice only. Before making an investment decision on the basis of this document, investors should consider the appropriateness of the information in this document, having regard to their own objectives, financial situation and needs, and, if necessary, seek expert advice on those matters. No cooling off period applies to an acquisition of the Class A common shares.
Brazil
The offer and sale of our Class A common shares has not been and will not be registered with the Brazilian Securities Commission (Comissão de Valores Mobiliários—“CVM”) and, therefore, will not be carried out by any means that would constitute a public offering in Brazil under CVM Resolution No. 160, dated July 13, 2022, as amended (“CVM Resolution 160”) or unauthorized distribution under Brazilian laws and regulations. Our Class A common shares will be authorized for trading on organized non-Brazilian securities markets and may only be offered to Brazilian professional investors (as defined by applicable CVM regulation), who may only acquire our Class A common shares through a non-Brazilian account, with settlement outside Brazil in non-Brazilian currency. Trading our Class A common shares on regulated securities markets in Brazil is prohibited.
British Virgin Islands
This document does not constitute, and there will not be, an offering of common shares to the public in the British Virgin Islands. This document may not be sent or distributed to persons in the British Virgin Islands and no invitation or offer to subscribe, purchase or otherwise acquire the Class A common shares will be made to, persons in the British Virgin Islands. However, the Class A common shares may be offered and sold to business companies incorporated in the British Virgin Islands and limited partnerships formed in the British Virgin Islands; provided that any such offering and sale is made outside the British Virgin Islands or the Class A common shares are otherwise offered and sold as permitted by the laws of the British Virgin Islands.
155
Canada
The securities may be sold in Canada only to purchasers purchasing, or deemed to be purchasing, as principal that are accredited investors, as defined in National Instrument 45-106 Prospectus Exemptions or subsection 73.3(1) of the Securities Act (Ontario), and are permitted clients, as defined in National Instrument 31-103 Registration Requirements, Exemptions, and Ongoing Registrant Obligations. Any resale of the securities must be made in accordance with an exemption form, or in a transaction not subject to, the prospectus requirements of applicable securities laws.
Securities legislation in certain provinces or territories of Canada may provide a purchaser with remedies for rescission or damages if this prospectus (including any amendment thereto) contains a misrepresentation; provided, that the remedies for rescission or damages are exercised by the purchaser within the time limit prescribed by the securities legislation of the purchaser’s province or territory. The purchaser should refer to any applicable provisions of the securities legislation of the purchaser’s province or territory of these rights or consult with a legal advisor.
Pursuant to section 3A.3 of National Instrument 33-105 Underwriting Conflicts (NI 33-105), the underwriters are not required to comply with the disclosure requirements of NI 33-105 regarding underwriter conflicts of interest in connection with this offering.
Cayman Islands
This prospectus does not constitute a public offer of the Class A common shares, whether by way of sale or subscription, in the Cayman Islands. The Class A common shares have not been offered or sold, and will not be offered or sold, directly or indirectly, in the Cayman Islands.
Chile
The offer of the Class A common shares is subject to CMF Rule 336. The Class A common shares being offered will not be registered under the Chilean Securities Market Law in the Securities Registry (Registro de Valores) or in the Foreign Securities Registry (Registro de Valores Extranjeros) of the CMF and, therefore, the Class A common shares are not subject to the supervision of the CMF. As unregistered securities, we are not required to disclose public information about the Class A common shares in Chile. Accordingly, the Class A common shares cannot and will not be publicly offered to persons in Chile unless they are registered in the corresponding securities registry. The Class A common shares may only be offered in Chile in circumstances that do not constitute a public offering under Chilean law or in compliance with CMF Rule 336. Pursuant to CMF Rule 336, the Class A common shares may be privately offered in Chile to certain “qualified investors” identified as such therein (which in turn are further described in Rule No. 216, dated June 12, 2008 and in Rule No. 410, dated July 27, 2016, both issued by the CMF).
LA OFERTA DE LAS ACCIONES COMUNES CLASE A SE ACOGE A LA NORMA DE CARÁCTER GENERAL No. 336 DE LA CMF. LAS ACCIONES COMUNES CLASE A QUE SE OFRECEN NO ESTÁN INSCRITOS BAJO LA LEY DE MERCADO DE VALORES EN EL REGISTRO DE VALORES O EN EL REGISTRO DE VALORES EXTRANJEROS QUE LLEVA LA CMF, POR LO QUE TALES VALORES NO ESTÁN SUJETOS A LA FISCALIZACIÓN DE ÉSTA. POR TRATARSE DE VALORES NO INSCRITOS, NO EXISTE OBLIGACIÓN POR PARTE DEL EMISOR DE ENTREGAR EN CHILE INFORMACIÓN PÚBLICA RESPECTO DE ESTOS VALORES. LAS ACCIONES COMUNES CLASE A NO PODRÁN SER OBJETO DE OFERTA PÚBLICA EN CHILE MIENTRAS NO SEAN INSCRITOS EN EL REGISTRO DE VALORES CORRESPONDIENTE. LAS ACCIONES COMUNES CLASE A SOLO PODRÁN SER OFRECIDOS EN CHILE EN CIRCUNSTANCIAS QUE NO CONSTITUYAN UNA OFERTA PÚBLICA O CUMPLIENDO CON LO DISPUESTO EN LA NORMA DE CARÁCTER GENERAL No. 336 DE LA CMF. EN CONFORMIDAD CON LO DISPUESTO POR LA NORMA DE CARÁCTER GENERAL No. 336, LAS ACCIONES COMUNES CLASE A PODRÁN SER OFRECIDOS PRIVADAMENTE A CIERTOS “INVERSIONISTAS CALIFICADOS,” IDENTIFICADOS COMO TAL EN DICHA NORMA (Y QUE A SU VEZ ESTÁN DESCRITOS EN LA NORMA DE CARÁCTER GENERAL No. 216 DE LA CMF DE FECHA 12 DE JUNIO DE 2008 Y EN LA NORMA DE CARÁCTER GENERAL No. 410 DE LA CMF DE FECHA 27 DE JULIO DE 2016).
156
China
The Class A common shares may not be offered or sold directly or indirectly to the public in the People’s Republic of China (“China”) and neither this prospectus, which has not been submitted to the Chinese Securities and Regulatory Commission, nor any offering material or information contained herein relating to the Class A common shares may be supplied to the public in China or used in connection with any offer for the subscription or sale of Class A common shares to the public in China. The Class A common shares may only be offered or sold to China related organizations which are authorized to engage in foreign exchange business and offshore investment from outside of China. Such China-related investors may be subject to foreign exchange control approval and filing requirements under the relevant Chinese foreign exchange regulations. For the purpose of this paragraph, China does not include Taiwan and the special administrative regions of Hong Kong and Macau.
Colombia
The Class A common shares have not been and will not be registered on the Colombian National Registry of Securities and Issuers or in the Colombian Stock Exchange. Therefore, the Class A common shares may not be publicly offered in Colombia. This material is for your sole and exclusive use as a determined entity, including any of your shareholders, administrators or employees, as applicable. You acknowledge the Colombian laws and regulations (specifically foreign exchange and tax regulations) applicable to any transaction or investment consummated pursuant hereto and represent that you are the sole liable party for full compliance with any such laws and regulations.
France
Neither this prospectus nor any other offering material relating to the Class A common shares described in this prospectus has been submitted to the clearance procedures of the Autorité des Marchés Financiers or of the competent authority of another member state of the European Economic Area and notified to the Autorité des Marchés Financiers. The Class A common shares have not been offered or sold and will not be offered or sold, directly or indirectly, to the public in France. Neither this prospectus nor any other offering material relating to the Class A common shares has been or will be: (1) released, issued, distributed or caused to be released, issued or distributed to the public in France; or (2) used in connection with any offer for subscription or sale of the Class A common shares to the public in France. Such offers, sales and distributions will be made in France only to: (a) persons providing investment services relating to portfolio management for the account of third parties (personnes fournissant le service d’investissement de gestion de portefeuille pour compte de tiers), and/or (b) qualified investors (investisseurs qualifiés) acting for their own account, and/or (c) a limited circle of investors (cercle restreint) acting for their own account, as defined in, and in accordance with, Articles L. 411-1, L. 411-2, D. 411-1 and D. 411-4 of the French Code monétaire et financier.
The Class A common shares may be resold directly or indirectly, only in compliance with articles L.411-1, L.411-2, L.412-1 and L.621-8 through L.621-8-3 of the French Code monétaire et financier.
Germany
The Class A common shares will not be offered, sold or publicly promoted or advertised in the Federal Republic of Germany other than in compliance with the German Securities Prospectus Act (Gesetz uber die Erstellung, Billigung und Veroffentlichung des Prospekts, der beim offentlicken Angebot von Wertpapieren oder bei der Zulassung von Wertpapieren zum Handel an einem organisierten Markt zu veroffenlichen ist—Wertpapierprospektgesetz) as of June 22, 2005, effective as of July 1, 2005, as amended, or any other laws and regulations applicable in the Federal Republic of Germany governing the issue, offering and sale of securities. No selling prospectus (Verkaufsprospeckt) within the meaning of the German Securities Selling Prospectus Act has been or will be registered within the Financial Supervisory Authority of the Federal Republic of Germany or otherwise published in Germany.
157
Hong Kong
The Class A common shares may not be offered or sold in Hong Kong by means of any document other than (1) in circumstances which do not constitute an offer to the public within the meaning of the Companies (Winding Up and Miscellaneous Provisions) Ordinance (Cap. 32 of the Laws of Hong Kong), or (“Companies (Winding Up and Miscellaneous Provisions) Ordinance”) or which do not constitute an invitation to the public within the meaning of the Securities and Futures Ordinance (Cap. 571 of the Laws of Hong Kong) (“Securities and Futures Ordinance”); (2) to “professional investors” as defined in the Securities and Futures Ordinance and any rules made thereunder; or (3) in other circumstances which do not result in the document being a “prospectus” as defined in the Companies (Winding Up and Miscellaneous Provisions) Ordinance, and no advertisement, invitation or document relating to the Class A common shares may be issued or may be in the possession of any person for the purpose of issue (in each case whether in Hong Kong or elsewhere), which is directed at, or the contents of which are likely to be accessed or read by, the public in Hong Kong (except if permitted to do so under the securities laws of Hong Kong) other than with respect to Class A common shares which are or are intended to be disposed of only to persons outside Hong Kong or only to “professional investors” in Hong Kong as defined in the Securities and Futures Ordinance and any rules made thereunder.
Ireland
The Class A common shares will not be placed in or involving Ireland otherwise than in conformity with the provisions of the Intermediaries Act 1995 of Ireland (as amended) including, without limitation, Sections 9 and 23 (including advertising restrictions made thereunder) thereof and the codes of conduct made under Section 37 thereof.
Israel
This document does not constitute a prospectus under the Israeli Securities Law, 5728-1968, or the Securities Law, and has not been filed with or approved by the Israel Securities Authority. In Israel, this prospectus is being distributed only to, and is directed only at, and any offer of the Class A common shares is directed only at, (1) a limited number of persons in accordance with the Israeli Securities Law; and (2) investors listed in the first addendum, or the Addendum, to the Israeli Securities Law, consisting primarily of joint investment in trust funds, provident funds, insurance companies, banks, portfolio managers, investment advisors, members of the Tel Aviv Stock Exchange, underwriters, venture capital funds, entities with equity in excess of NIS 50 million and “qualified individuals,” each as defined in the Addendum (as it may be amended from time to time), collectively referred to as qualified investors (in each case, purchasing for their own account or, where permitted under the Addendum, for the accounts of their clients who are investors listed in the Addendum). Qualified investors are required to submit written confirmation that they fall within the scope of the Addendum, are aware of its meaning and agree to it.
Italy
The offering of the Class A common shares has not been registered pursuant to Italian securities legislation and, accordingly, no Class A common shares may be offered or sold in the Republic of Italy in a solicitation to the public, and sales of the Class A common shares in the Republic of Italy shall be effected in accordance with all Italian securities, tax and exchange control and other applicable laws and regulation.
No offer, sale or delivery of the Class A common shares or distribution of copies of any document relating to the Class A common shares will be made in the Republic of Italy except: (1) to “Professional Investors,” as defined in Article 31.2 of Regulation No. 11522 of 1 July 1998 of the Commissione Nazionale per la Società e la Borsa, or the CONSOB, as amended, or CONSOB Regulation No. 11522, pursuant to Article 30.2 and 100 of Legislative Decree No. 58 of 24 February 1998, as amended, or the Italian Financial Act; or (2) in any other circumstances where an express exemption from compliance with the solicitation restrictions applies, as provided under the Italian Financial Act or Regulation No. 11971 of 14 May 1999, as amended.
Any such offer, sale or delivery of the Class A common shares or any document relating to the Class A common shares in the Republic of Italy must be: (1) made by investment firms, banks or financial intermediaries permitted to conduct such activities in the Republic of Italy in accordance with Legislative Decree No. 385 of 1
158
September 1993 as amended, the Italian Financial Act, CONSOB Regulation No. 11522 and any other applicable laws and regulations; and (2) in compliance with any other applicable notification requirement or limitation which may be imposed by CONSOB or the Bank of Italy.
Investors should also note that, in any subsequent distribution of the Class A common shares in the Republic of Italy, Article 100-bis of the Italian Financial Act may require compliance with the law relating to public offers of securities. Furthermore, where the Class A common shares are placed solely with professional investors and are then systematically resold on the secondary market at any time in the 12 months following such placing, purchasers of Class A common shares who are acting outside of the course of their business or profession may in certain circumstances be entitled to declare such purchase void and to claim damages from any authorized person at whose premises the Class A common shares were purchased, unless an exemption provided for under the Italian Financial Act applies.
Japan
The securities have not been and will not be registered under the Financial Instruments and Exchange Act of Japan (Act No. 25 of 1948, as amended), or the “FIEA.” The securities may not be offered or sold, directly or indirectly, in Japan or to or for the benefit of any resident of Japan (including any person resident in Japan or any corporation or other entity organized under the laws of Japan) or to others for reoffering or resale, directly or indirectly, in Japan or to or for the benefit of any resident of Japan, except pursuant to an exemption from the registration requirements of the FIEA and otherwise in compliance with any relevant laws and regulations of Japan.
Kuwait
The Class A common shares have not been authorized or licensed for offering, marketing or sale in the State of Kuwait. The distribution of this prospectus and the offering and sale of the Class A common shares in the State of Kuwait is restricted by law unless a license is obtained from the Kuwait Ministry of Commerce and Industry in accordance with Law 31 of 1990. Persons into whose possession this prospectus comes are required by us and the international underwriters to inform themselves about and to observe such restrictions. Investors in the State of Kuwait who approach us or any of the international underwriters to obtain copies of this prospectus are required by us and the international underwriters to keep such prospectus confidential and not to make copies thereof or distribute the same to any other person and are also required to observe the restrictions provided for in all jurisdictions with respect to offering, marketing and the sale of the Class A common shares.
Mexico
The Class A common shares have not been and will not be registered with the Mexican National Securities Registry maintained by the CNBV, and may not be offered or sold publicly in Mexico or otherwise be subject to brokerage activities in Mexico, the Class A common shares may be offered and sold to investors that qualify as institutional or qualified investors pursuant to a private placement exemption set forth in Article 8 of the Mexican Securities Market Law. The information contained or incorporated by reference in this prospectus is solely our responsibility and has not been reviewed or authorized by the CNBV and may not be publicly distributed in Mexico. In making an investment decision, all investors, including any Mexican investor, who may acquire Class A common shares from time to time, must rely on their own examination of the Issuer and the terms of this offering, including the merits and risks involved.
Netherlands
The Class A common shares may not be offered, sold, transferred or delivered, in or from the Netherlands, as part of the initial distribution or as part of any reoffering, and neither this prospectus nor any other document in respect of the international offering may be distributed in or from the Netherlands, other than to individuals or legal entities who or which trade or invest in securities in the conduct of their profession or trade (which includes banks, investment banks, securities firms, insurance companies, pension funds, other institutional investors and treasury departments and finance companies of large enterprises), in which case, it must be made clear upon making the offer
159
and from any documents or advertisements in which a forthcoming offering of Class A common shares is publicly announced that the offer is exclusively made to said individuals or legal entities.
Peru
The Class A common shares and this prospectus have not been registered in Peru under the Decreto Supremo Nº 093-2002-EF: Texto Único Ordenado de la Ley del Mercado de Valores, (the “Peruvian Securities Law”) or before the Superintendencia del Mercado de Valores and cannot be offered or sold in Peru except in a private offering under the meaning of the Peruvian Securities Laws. The Peruvian Securities Law provides that an offering directed exclusively to “institutional investors” (as defined in the Institutional Investors Market Regulations) qualifies as a private offering. The Class A common shares acquired by institutional investors in Peru cannot be transferred to a third party, unless such transfer is made to another institutional investor or the Class A common shares have been previously registered with the Registro Público del Mercado de Valores.
Portugal
No document, circular, advertisement or any offering material in relation to the share has been or will be subject to approval by the Portuguese Securities Market Commission (Comissão do Mercado de Valores Mobiliários), or the CMVM. No Class A common shares may be offered, re-offered, advertised, sold, re-sold or delivered in circumstances which could qualify as a public offer (oferta pública) pursuant to the Portuguese Securities Code (Código dos Valores Mobiliários), and/or in circumstances which could qualify the issue of the Class A common shares as an issue or public placement of securities in the Portuguese market. This prospectus and any document, circular, advertisements or any offering material may not be directly or indirectly distributed to the public. All offers, sales and distributions of the Class A common shares have been and may only be made in Portugal in circumstances that, pursuant to the Portuguese Securities Code, qualify as a private placement (oferta particular), all in accordance with the Portuguese Securities Code. Pursuant to the Portuguese Securities Code, the private placement in Portugal or to Portuguese residents of the Class A common shares by public companies (sociedades abertas) or by companies that are issuers of securities listed on a market must be notified to the CMVM for statistical purposes. Any offer or sale of the Class A common shares in Portugal must comply with all applicable provisions of the Portuguese Securities Code and any applicable CMVM Regulations and all relevant Portuguese laws and regulations. The placement of the Class A common shares in the Portuguese jurisdiction or to any entities which are resident in Portugal, including the publication of a prospectus, when applicable, must comply with all applicable laws and regulations in force in Portugal and with the Prospectus Directive, and such placement shall only be performed to the extent that there is full compliance with such laws and regulations.
Qatar
The Class A common shares described in this prospectus have not been, and will not be, offered, sold or delivered, at any time, directly or indirectly in the State of Qatar in a manner that would constitute a public offering. This prospectus has not been, and will not be, registered with or approved by the Qatar Financial Markets Authority or Qatar Central Bank and may not be publicly distributed. This prospectus is intended for the original recipient only and must not be provided to any other person. It is not for general circulation in the State of Qatar and may not be reproduced or used for any other purpose.
Saudi Arabia
Any investor in the Kingdom of Saudi Arabia or who is a Saudi person (a “Saudi Investor”) who acquires the Class A common shares pursuant to this offering should note that the offer of the Class A common shares is an exempt offer under sub-paragraph (3) of paragraph (a) of Article 16 of the “Offer of Securities Regulations” as issued by the Board of the Capital Market Authority resolution number 2-11-2004 dated October 4, 2004 and amended by the resolution of the Board of Capital Market Authority resolution number 1-33-2004 dated December 21, 2004 (the “KSA Regulations”). The Class A common shares may be offered to no more than 60 Saudi Investors and the minimum amount payable per Saudi Investor must not be less than Saudi Riyal (“SR”) 1 million or an equivalent amount. The offer of Class A common shares is therefore exempt from the public offer provisions of the KSA Regulations, but is subject to the following restrictions on secondary market activity: (1) A Saudi Investor (the transferor) who has acquired Class A common shares pursuant to this exempt offer may not offer or sell Class A
160
common shares to any person (referred to as a transferee) unless the price to be paid by the transferee for such Class A common shares equals or exceeds SR1 million; (2) If the provisions of paragraph (1) cannot be fulfilled because the price of the Class A common shares being offered or sold to the transferee has declined since the date of the original exempt offer, the transferor may offer or sell the Class A common shares to the transferee if their purchase price during the period of the original exempt offer was equal to or exceeded SR1 million; and (3) If the provisions of paragraphs (1) and (2) cannot be fulfilled, the transferor may offer or sell the Class A common shares if he/she sells his entire holding of the Class A common shares to one transferee.
Singapore
This prospectus has not been and will not be registered as a prospectus with the Monetary Authority of Singapore under the Securities and Futures Act, Chapter 289 of Singapore (the “SFA”). Accordingly, each underwriter has not offered or sold any Class A common shares or caused such Class A common shares to be made the subject of an invitation for subscription or purchase and will not offer or sell such Class A common shares or cause such Class A common shares to be made the subject of an invitation for subscription or purchase, and has not circulated or distributed, nor will it circulate or distribute, this prospectus or any other document or material in connection with the offer or sale, or invitation for subscription or purchase, of such Class A common shares, whether directly or indirectly, to persons in Singapore other than (1) to an institutional investor under Section 274 of the SFA; (2) to a relevant person pursuant to Section 275(1), or any person pursuant to Section 275(1A), and in accordance with the conditions specified in Section 275, of the SFA; or (3) otherwise pursuant to, and in accordance with the conditions of, any other applicable provision of the SFA.
Where the Class A common shares are subscribed or purchased under Section 275 of the SFA by a relevant person which is: (x) a corporation (which is not an accredited investor (as defined in Section 4A of the SFA)) the sole business of which is to hold investments and the entire share capital of which is owned by one or more individuals, each of whom is an accredited investor; or (y) a trust (where the trustee is not an accredited investor) whose sole purpose is to hold investments and each beneficiary of the trust is an individual who is an accredited investor, securities (as defined in Section 239(1) of the SFA) of that corporation or the beneficiaries’ rights and interest (howsoever described) in that trust shall not be transferred within six months after that corporation or that trust has acquired the Class A common shares pursuant to an offer made under Section 275 of the SFA, except: (1) to an institutional investor under Section 274 of the SFA or to a relevant person (as defined in Section 275(2) of the SFA), or to any person arising from an offer referred to in Section 275(1A), or Section 276(4)(1)(B) of the SFA; (2) where no consideration is or will be given for the transfer; (3) where the transfer is by operation of law; (4) as specified in Section 276(7) of the SFA; or (5) as specified in Regulation 32 of the Securities and Futures (Offers of Investments) (Shares and Debentures) Regulations 2005 of Singapore.
Singapore Securities and Futures Act Product Classification—Solely for the purposes of its obligations pursuant to sections 309B(1)(a) and 309B(1)(c) of the Securities and Futures Act (Chapter 289 of Singapore) (the “SFA”), we have determined, and hereby notify all relevant persons (as defined in Section 309A of the SFA) that the Class A common shares are “prescribed capital markets products” (as defined in the Securities and Futures (Capital Markets Products) Regulations 2018) and Excluded Investment Products (as defined in MAS Notice SFA 04-N12: Notice on the Sale of Investment Products and MAS Notice FAA-N16: Notice on Recommendations on Investment Products).
South Korea
The Class A common shares have not been and will not be registered with the Financial Services Commission of Korea for public offering in Korea under the Financial Investment Services and Capital Markets Act, or the FSCMA. The Class A common shares may not be offered, sold or delivered, or offered or sold for re-offering or resale, directly or indirectly, in Korea or to any Korean resident (as such term is defined in the Foreign Exchange Transaction Law of Korea, or FETL) other than the Accredited Investors (as such term is defined in Article 11 of the Presidential Decree of the FSCMA), for a period of one year from the date of issuance of the Class A common shares except pursuant to the applicable laws and regulations of Korea, including the FSCMA and the FETL and the decrees and regulations thereunder. The Class A common shares may not be resold to Korean residents unless the purchaser of the Class A common shares complies with all applicable regulatory requirements (including but not
161
limited to government reporting requirements under the FETL and its subordinate decrees and regulations) in connection with the purchase of the Class A common shares.
Spain
The Class A common shares have not been registered with the Spanish National Commission for the Securities Market and, therefore, no Class A common shares may be publicly offered, sold or delivered, nor any public offer in respect of the Class A common shares made, nor may any prospectus or any other offering or publicity material relating to the Class A common shares be distributed in Spain by the international agents or any person acting on their behalf, except in compliance with Spanish laws and regulations.
Switzerland
This prospectus is not intended to constitute an offer or solicitation to purchase or invest in the securities. The securities may not be publicly offered, directly or indirectly, in Switzerland within the meaning of the Swiss Financial Services Act (“FinSA”) and no application has or will be made to admit the securities to trading on any trading venue (exchange or multilateral trading facility) in Switzerland. Neither this prospectus nor any other offering or marketing material relating to the securities constitutes a prospectus pursuant to the FinSA, and neither this prospectus nor any other offering or marketing material relating to the securities may be publicly distributed or otherwise made publicly available in Switzerland.
United Arab Emirates
The Class A common shares have not been, and are not being, publicly offered, sold, promoted or advertised in the United Arab Emirates (including the Dubai International Financial Centre) other than in compliance with the laws of the United Arab Emirates (and the Dubai International Financial Centre) governing the issue, offering and sale of securities. Further, this prospectus does not constitute a public offer of securities in the United Arab Emirates (including the Dubai International Financial Centre) and is not intended to be a public offer. This prospectus has not been approved by or filed with the Central Bank of the United Arab Emirates, the Securities and Commodities Authority or the Dubai Financial Services Authority.
162
EXPENSES OF THE OFFERING
We estimate that the expenses in connection with this offering, other than underwriting discounts and commissions, will be as follows:
| Amount (US$) |
| ||
Expenses: |
|
|
| |
SEC registration fee |
|
| 94,100 |
|
New York Stock Exchange listing fee |
|
| 96,000 |
|
FINRA fee |
|
| 105,000 |
|
Printing and engraving expenses |
|
| 106,000 |
|
Legal fees and expenses |
|
| 1,112,000 |
|
Accounting fees and expenses |
|
| 320,000 |
|
Miscellaneous costs |
|
| 130,000 |
|
Total |
|
| 1,963,100 |
|
All amounts in the table are estimates except the SEC registration fee, the New York Stock Exchange listing fee and the FINRA filing fee. We will pay all of the expenses of this offering listed above.
LEGAL MATTERS
Certain matters of U.S. federal and New York State law will be passed upon for us by Simpson Thacher & Bartlett LLP, and for the underwriters by Cleary Gottlieb Steen & Hamilton LLP. Certain matters of Mexican law will be passed upon for us by Greenberg Traurig S.C. and for the underwriters by Ritch, Mueller y Nicolau, S.C. The validity of the Class A common shares offered in this offering and other legal matters as to British Virgin Islands law will be passed upon for us by Conyers Dill & Pearman.
EXPERTS
The financial statements incorporated in this prospectus by reference to the Annual Report on Form 20-F for the year ended December 31, 2023 have been so incorporated in reliance on the report of PricewaterhouseCoopers, S.C., an independent registered public accounting firm, given on the authority of said firm as experts in auditing and accounting.
163
ENFORCEABILITY OF CIVIL LIABILITIES
We are incorporated under the laws of the British Virgin Islands with limited liability. We are incorporated in the British Virgin Islands because of certain benefits associated with being a British Virgin Islands company, such as political and economic stability, an effective judicial system, a favorable tax system, the absence of exchange control or currency restrictions and the availability of professional and support services. However, the British Virgin Islands has a less developed body of securities laws as compared to the United States and provides protections for investors to a significantly lesser extent. In addition, British Virgin Islands companies may not have standing to sue before the federal courts of the United States.
A majority of our directors and officers, as well as certain of the experts named herein, reside outside of the United States. Substantially all of the assets of such non-resident persons and substantially all of our assets are located outside the United States and several of such directors and officers reside in Mexico. As a result, it may not be possible for investors to effect service of process outside Mexico upon such directors or officers, or to enforce against us or such parties in courts outside Mexico, judgments predicated solely upon the civil liability provisions of the federal securities laws of the United States or other non-Mexican regulations, as applicable. Based on the opinion of our special Mexican counsel, there is doubt as to the enforceability in Mexican courts, in original actions or in actions for enforcement of judgments obtained in courts of jurisdictions outside Mexico, including the United States, of civil liabilities arising under the laws of any jurisdiction outside Mexico, including any judgment predicated solely upon United States federal or state securities laws. We have been advised by our special Mexican counsel that no treaty is currently in effect between the United States and Mexico that covers the reciprocal enforcement of foreign judgments. In the past, Mexican courts have enforced judgments rendered in the United States by virtue of the legal principles of reciprocity and comity, consisting of the review in Mexico of a United States judgment to ascertain, among other matters, whether Mexican legal principles of due process and public policy (orden público), among other requirements set forth under Mexican law, have been complied with, without reviewing the merits of the subject matter of the case. See “Risk Factors—Risks Relating to Investing in a British Virgin Islands Company—We are a British Virgin Islands company and it may be difficult for you to obtain or enforce judgments against us or our executive officers and directors in the United States.
We have been advised by Conyers Dill & Pearman, our counsel as to British Virgin Islands law, that the United States and the British Virgin Islands do not have a treaty providing for reciprocal recognition and enforcement of judgments of courts of the United States in civil and commercial matters and that a final judgment for the payment of money rendered by any general or state court in the United States based on civil liability, whether or not predicated solely upon the U.S. federal securities laws, would not be automatically enforceable in the British Virgin Islands. We have been advised by Conyers Dill & Pearman that a final and conclusive judgment obtained in U.S. federal or state courts under which a sum of money is payable (i.e., not being a sum claimed by a revenue authority for taxes or other charges of a similar nature by a governmental authority, or in respect of a fine or penalty or multiple or punitive damages) may be the subject of an action on a debt in the courts of the British Virgin Islands under British Virgin Islands common law and should be enforceable provided that in respect of the U.S. judgment:
164
WHERE YOU CAN FIND MORE INFORMATION
We have filed with the SEC a registration statement on Form F-1 (including amendments and exhibits to the registration statement) under the Securities Act. This prospectus, which is part of the registration statement, does not contain all of the information set forth or incorporated by reference in the registration statement and the exhibits and schedules to the registration statement. For further information, we refer you to the registration statement and the exhibits and schedules filed as part of the registration statement. If a document has been filed as an exhibit to the registration statement, we refer you to the copy of the document that has been filed. Each statement in this prospectus relating to a document filed as an exhibit is qualified in all respects by the filed exhibit. Each statement regarding a contract, agreement or other document is qualified in its entirety by reference to the actual document.
We are subject to the informational requirements of the Exchange Act that are applicable to foreign private issuers. Accordingly, we will be required to file reports and other information with the SEC, including annual reports on Form 20-F and reports on Form 6-K. The SEC maintains an internet website at http://www.sec.gov, from which you can electronically access the registration statement and its materials.
As a foreign private issuer, we are exempt under the Exchange Act from, among other things, the rules prescribing the furnishing and content of proxy statements, and our executive officers, directors and principal shareholder are exempt from the reporting and short-swing profit recovery provisions contained in Section 16 of the Exchange Act. In addition, we will not be required under the Exchange Act to file periodic reports and financial statements with the SEC as frequently or as promptly as U.S. companies whose securities are registered under the Exchange Act. However, we are required to file with the SEC within four months after the end of each fiscal year (which is currently four months from December 31, the end of our fiscal year), or such applicable time as required by the SEC, an annual report on Form 20-F containing financial statements, which will be examined and reported on with an opinion expressed by an independent public accounting firm.
We also maintain an investor website at www.investorstiendas3b.com. Our website and the information contained therein or connected thereto will not be deemed to be incorporated into the prospectus or the registration statement of which this prospectus forms a part, and you should not rely on any such information in making your decision whether to purchase our Class A common shares.
We will send the transfer agent a copy of all notices of shareholders’ meetings and other reports, communications and information that are made generally available to shareholders. The transfer agent has agreed to mail to all shareholders a notice containing the information (or a summary of the information) contained in any notice of a meeting of our shareholders received by the transfer agent and will make available to all shareholders such notices and all such other reports and communications received by the transfer agent.
You may request a copy of our SEC filings, at no cost, by contacting us at the number or address specified below.
Av. Presidente Masaryk 8, Polanco V Sección, Miguel Hidalgo
Mexico City, Mexico 11560
Email: ir@tiendas3b.com
Tel: +52 (55) 1102-1200
165
INCORPORATION BY REFERENCE
The SEC allows us to “incorporate by reference” the information we file or furnish with it, which means that we can disclose important information to you by referring you to those documents. The information incorporated by reference is considered to be part of this prospectus. The documents we are incorporating by reference as of their respective dates of filing are:
Any statement contained in this prospectus or in a document incorporated or deemed to be incorporated by reference into this prospectus will be deemed to be modified or superseded for purposes of this prospectus to the extent that a statement contained in this prospectus or any others subsequently filed document that is deemed to be incorporated by reference into this prospectus modifies or supersedes the statement. Any statement so modified or superseded will not be deemed, except as so modified or superseded, to constitute a part of this prospectus.
We will provide at no cost to each person, including any beneficial owner, to whom this prospectus is delivered, upon written or oral request, a copy of any or all documents that are incorporated by reference into this prospectus, but not delivered with the prospectus, other than exhibits to the documents unless the exhibits are specifically incorporated by reference into the documents that this prospectus incorporates. These documents can be accessed at www.investorstiendas3b.com you may request them by contacting us at:
Av. Presidente Masaryk 8, Polanco V Sección, Miguel Hidalgo
Mexico City, Mexico 11560
Email: ir@tiendas3b.com
Tel: +52 (55) 1102-1200
The information on or accessible through our website is not part of and is not incorporated by reference into this prospectus, and the inclusion of our website address in this prospectus is an inactive textual reference only.
166
INDEX TO FINANCIAL STATEMENTS
Unaudited Interim Condensed Consolidated Financial Statements as of September 30, 2024, December 31, 2023 and for the three and nine-month periods ended September 30, 2024 and 2023 | ||
| ||
Unaudited Interim Condensed Consolidated Statements of Financial Position |
| F-2 |
Unaudited Interim Condensed Consolidated Statements of Profit or Loss |
| F-3 |
Unaudited Interim Condensed Consolidated Statements of Changes in Stockholders’ Equity |
| F-4 |
Unaudited Interim Condensed Consolidated Statements of Cash Flows |
| F-5 |
Notes to Unaudited Interim Condensed Consolidated Financial Statements |
| F-6 |
F-1
BBB Foods Inc. and subsidiaries
Unaudited Interim Condensed Consolidated Statements of Financial Position
As of September 30, 2024 and December 31, 2023
Thousands of Mexican Pesos (Ps.)
| As of |
|
| As of |
| |||||
| September 30, |
|
| December 31, |
| |||||
| 2024 |
|
| 2023 |
| |||||
Assets |
|
|
|
|
|
|
|
| ||
Current assets: |
|
|
|
|
|
|
|
| ||
Cash and cash equivalents |
| Ps. |
| 1,268,902 |
|
| Ps. |
| 1,220,471 |
|
Short-term bank deposits (Note 8) |
|
|
| 2,963,511 |
|
|
|
| — |
|
Creditors |
|
|
| 3,669 |
|
|
|
| — |
|
Derivative financial instruments (Note 8) |
|
|
| 7,287 |
|
|
|
| — |
|
Sundry debtors |
|
|
| 47,523 |
|
|
|
| 11,020 |
|
VAT receivable |
|
|
| 1,061,873 |
|
|
|
| 731,186 |
|
Advanced payments |
|
|
| 134,846 |
|
|
|
| 72,998 |
|
Inventories |
|
|
| 2,524,631 |
|
|
|
| 2,357,485 |
|
Total current assets |
|
|
| 8,012,242 |
|
|
|
| 4,393,160 |
|
Non-current assets: |
|
|
|
|
|
|
|
| ||
Guarantee deposits |
|
|
| 37,949 |
|
|
|
| 33,174 |
|
Property, furniture, equipment, and lease-hold improvements - |
|
|
| 5,849,141 |
|
|
|
| 4,606,300 |
|
Right-of-use assets - Net (Note 7) |
|
|
| 6,487,974 |
|
|
|
| 5,520,596 |
|
Intangible assets - Net |
|
|
| 6,794 |
|
|
|
| 6,771 |
|
Deferred income tax |
|
|
| 494,588 |
|
|
|
| 403,801 |
|
Total non-current assets |
|
|
| 12,876,446 |
|
|
|
| 10,570,642 |
|
Total assets |
| Ps. |
| 20,888,688 |
|
| Ps. |
| 14,963,802 |
|
Liabilities and Stockholders’ Equity |
|
|
|
|
|
|
|
| ||
Current liabilities: |
|
|
|
|
|
|
|
| ||
Suppliers |
| Ps. |
| 7,855,059 |
|
| Ps. |
| 7,126,089 |
|
Accounts payable and accrued expenses |
|
|
| 552,826 |
|
|
|
| 322,959 |
|
Income tax payable |
|
|
| 43,350 |
|
|
|
| 2,326 |
|
Bonus payable to related parties (Note 9) |
|
|
| — |
|
|
|
| 78,430 |
|
Short-term debt (Note 10) |
|
|
| 915,377 |
|
|
|
| 744,137 |
|
Lease liabilities (Note 11) |
|
|
| 620,019 |
|
|
|
| 537,515 |
|
Employees’ statutory profit sharing payable |
|
|
| 164,062 |
|
|
|
| 140,485 |
|
Total current liabilities |
|
|
| 10,150,693 |
|
|
|
| 8,951,941 |
|
Non-current liabilities: |
|
|
|
|
|
|
|
| ||
Debt with related parties (Note 9) |
|
|
| — |
|
|
|
| 4,340,452 |
|
Long-term debt (Note 10) |
|
|
| 88,273 |
|
|
|
| 577,318 |
|
Lease liabilities (Note 11) |
|
|
| 6,690,227 |
|
|
|
| 5,706,707 |
|
Employee benefits |
|
|
| 28,231 |
|
|
|
| 22,232 |
|
Total non-current liabilities |
|
|
| 6,806,731 |
|
|
|
| 10,646,709 |
|
Total liabilities |
|
|
| 16,957,424 |
|
|
|
| 19,598,650 |
|
Stockholders’ equity: |
|
|
|
|
|
|
|
| ||
Capital stock (Note 15) |
|
|
| 8,283,347 |
|
|
|
| 471,282 |
|
Reserve for share-based payments (Note 17) |
|
|
| 1,247,755 |
|
|
|
| 851,701 |
|
Cumulative losses |
|
|
| (5,599,838 | ) |
|
|
| (5,957,831 | ) |
Total stockholders’ equity |
|
|
| 3,931,264 |
|
|
|
| (4,634,848 | ) |
Total liabilities and stockholders’ equity |
| Ps. |
| 20,888,688 |
|
| Ps. |
| 14,963,802 |
|
The accompanying notes are an integral part of these interim condensed consolidated financial statements.
F-2
BBB Foods Inc. and subsidiaries
Unaudited Interim Condensed Consolidated Statements of Profit or Loss
For the three-month and nine-month periods ended September 30, 2024 and 2023
Thousands of Mexican Pesos (Ps.) except for number of shares and earnings (loss) per share
| For the three-month periods ended |
|
| For the nine-month periods ended |
| |||||||||||||||
| September 30, |
|
| September 30, |
| |||||||||||||||
|
| 2024 |
|
|
| 2023 |
|
|
| 2024 |
|
|
| 2023 |
| |||||
Revenue from sales of merchandise |
| Ps. |
| 14,807,698 |
|
| Ps. |
| 11,399,566 |
|
| Ps. |
| 41,014,985 |
|
| Ps. |
| 31,694,573 |
|
Sales of recyclables |
|
|
| 26,108 |
|
|
|
| 25,609 |
|
|
|
| 77,416 |
|
|
|
| 68,282 |
|
Total revenue |
|
|
| 14,833,806 |
|
|
|
| 11,425,175 |
|
|
|
| 41,092,401 |
|
|
|
| 31,762,855 |
|
Cost of sales (Note 13) |
|
|
| (12,490,108 | ) |
|
|
| (9,618,847 | ) |
|
|
| (34,414,213 | ) |
|
|
| (26,733,603 | ) |
Gross profit |
|
|
| 2,343,698 |
|
|
|
| 1,806,328 |
|
|
|
| 6,678,188 |
|
|
|
| 5,029,252 |
|
Sales expenses (Note 13) |
|
|
| (1,498,500 | ) |
|
|
| (1,218,570 | ) |
|
|
| (4,208,458 | ) |
|
|
| (3,431,030 | ) |
Administrative expenses (Note 13) |
|
|
| (494,399 | ) |
|
|
| (374,347 | ) |
|
|
| (1,426,551 | ) |
|
|
| (1,033,144 | ) |
Other income (expense) - Net |
|
|
| 1,770 |
|
|
|
| (2,865 | ) |
|
|
| 7,066 |
|
|
|
| 692 |
|
Operating profit |
|
|
| 352,569 |
|
|
|
| 210,546 |
|
|
|
| 1,050,245 |
|
|
|
| 565,770 |
|
Financial income (Note 14) |
|
|
| 47,642 |
|
|
|
| 7,388 |
|
|
|
| 109,501 |
|
|
|
| 20,510 |
|
Financial costs (Note 14) |
|
|
| (286,930 | ) |
|
|
| (298,527 | ) |
|
|
| (924,055 | ) |
|
|
| (1,007,868 | ) |
Exchange rate fluctuation (Note 14) |
|
|
| 210,191 |
|
|
|
| (145,667 | ) |
|
|
| 385,335 |
|
|
|
| 403,922 |
|
Financial costs - Net |
|
|
| (29,097 | ) |
|
|
| (436,806 | ) |
|
|
| (429,219 | ) |
|
|
| (583,436 | ) |
Profit (loss) before income tax |
|
|
| 323,472 |
|
|
|
| (226,260 | ) |
|
|
| 621,026 |
|
|
|
| (17,666 | ) |
Income tax expense |
|
|
| (65,872 | ) |
|
|
| (112,791 | ) |
|
|
| (263,033 | ) |
|
|
| (191,503 | ) |
Consolidated net profit (loss) for the period |
| Ps. |
| 257,600 |
|
| Ps. |
| (339,051 | ) |
| Ps. |
| 357,993 |
|
| Ps. |
| (209,169 | ) |
Basic and diluted loss per class A share |
|
|
|
|
| Ps. |
| (28.25 | ) |
|
|
|
|
| Ps. |
| (17.43 | ) | ||
Basic earnings per common share (Note 16) |
| Ps. |
| 2.30 |
|
|
|
|
|
| Ps. |
| 3.32 |
|
|
|
|
| ||
Diluted earnings per common share |
| Ps. |
| 1.81 |
|
|
|
|
|
| Ps. |
| 2.60 |
|
|
|
|
| ||
Weighted average common shares |
|
|
|
|
|
|
|
|
|
|
|
|
|
|
|
| ||||
Basic |
|
|
| 112,200,752 |
|
|
|
|
|
|
|
| 107,798,668 |
|
|
|
|
| ||
Diluted |
|
|
| 142,254,384 |
|
|
|
|
|
|
|
| 137,894,806 |
|
|
|
|
| ||
Weighted average class A shares (Note 16) |
|
|
|
|
|
|
| 12,000,000 |
|
|
|
|
|
|
|
| 12,000,000 |
| ||
The accompanying notes are an integral part of these interim condensed consolidated financial statements.
F-3
BBB Foods Inc. and subsidiaries
Unaudited Interim Condensed Consolidated Statements of Changes in Stockholders’ Equity
For the nine-month periods ended September 30, 2024 and 2023
Thousands of Mexican Pesos (Ps.)
Capital stock |
|
| Cumulative |
|
| Reserve for |
|
| Total |
| |||||||||
Balances as of January 1, 2023 | Ps. |
| 471,282 |
|
| Ps. |
| (5,651,678 | ) |
| Ps. |
| 467,135 |
|
| Ps. |
| (4,713,261 | ) |
Net loss for the period |
|
| — |
|
|
|
| (209,169 | ) |
|
|
| — |
|
|
|
| (209,169 | ) |
Share - based payments (Note 17) |
|
| — |
|
|
|
| — |
|
|
|
| 302,438 |
|
|
|
| 302,438 |
|
Balances as of September 30, 2023 |
|
| 471,282 |
|
|
|
| (5,860,847 | ) |
|
|
| 769,573 |
|
|
|
| (4,619,992 | ) |
Balances as of January 1, 2024 |
|
| 471,282 |
|
|
|
| (5,957,831 | ) |
|
|
| 851,701 |
|
|
|
| (4,634,848 | ) |
Net profit for the period |
|
| — |
|
|
|
| 357,993 |
|
|
|
| — |
|
|
|
| 357,993 |
|
Share - based payments (Note 17) |
|
| — |
|
|
|
| — |
|
|
|
| 396,054 |
|
|
|
| 396,054 |
|
Initial public offering, net of |
|
| 7,812,065 |
|
|
|
| — |
|
|
|
| — |
|
|
|
| 7,812,065 |
|
Balances as of September 30, 2024 | Ps. |
| 8,283,347 |
|
| Ps. |
| (5,599,838 | ) |
| Ps. |
| 1,247,755 |
|
| Ps. |
| 3,931,264 |
|
The accompanying notes are an integral part of these interim condensed consolidated financial statements.
F-4
BBB Foods Inc. and subsidiaries
Unaudited Interim Condensed Consolidated Statements of Cash Flows
For the nine-month periods ended September 30, 2024 and 2023
Thousands of Mexican Pesos (Ps.)
| For the nine-month periods ended |
| ||||||||
| September 30, |
| ||||||||
| 2024 |
|
| 2023 |
| |||||
Operating activities |
|
|
|
|
|
|
|
| ||
Profit (loss) before income tax |
| Ps. |
| 621,026 |
|
| Ps. |
| (17,666 | ) |
Adjustments for: |
|
|
|
|
|
|
|
| ||
Depreciation of property, furniture, equipment, |
|
|
|
|
|
|
|
| ||
and lease-hold improvements (Note 6) |
|
|
| 468,985 |
|
|
|
| 334,184 |
|
Depreciation of right-of-use assets (Note 7) |
|
|
| 481,244 |
|
|
|
| 421,872 |
|
Amortization of intangible assets |
|
|
| 1,857 |
|
|
|
| 1,990 |
|
Employee benefits |
|
|
| 5,999 |
|
|
|
| — |
|
Interest payable on Promissory Notes and Convertible Notes (Note 5) |
|
|
| 82,588 |
|
|
|
| 459,621 |
|
Interest expense on lease liabilities (Note 11) |
|
|
| 757,618 |
|
|
|
| 526,566 |
|
Interest on debt and bonus payable and amortization of issuance costs |
|
|
| 29,471 |
|
|
|
| 21,676 |
|
Other financial income |
|
|
| (102,214 | ) |
|
|
| (20,510 | ) |
Gain on fair value of derivative financial instrument (Note 8) |
|
|
| (7,287 | ) |
|
|
| — |
|
Interests and commissions from credit lines |
|
|
| 54,378 |
|
|
|
| — |
|
Gain on termination of lease agreements |
|
|
| (387 | ) |
|
|
| — |
|
Exchange rate fluctuation |
|
|
| (385,335 | ) |
|
|
| (469,030 | ) |
Share-based payments expense (Note 17) |
|
|
| 396,054 |
|
|
|
| 302,438 |
|
|
|
| 2,403,997 |
|
|
|
| 1,561,141 |
| |
Increase in inventories |
|
|
| (167,146 | ) |
|
|
| (259,525 | ) |
Increase in other current assets and guarantee deposits |
|
|
| (446,657 | ) |
|
|
| (150,082 | ) |
Increase in suppliers (including supplier finance arrangements) |
|
|
| 728,969 |
|
|
|
| 1,013,497 |
|
Increase (decrease) in other current liabilities |
|
|
| 248,169 |
|
|
|
| 68,147 |
|
Increase (decrease) on bonus payable to related parties (Note 9) |
|
|
| (79,351 | ) |
|
|
| 11,412 |
|
Income taxes paid |
|
|
| (309,773 | ) |
|
|
| (301,751 | ) |
Net cash flows provided by operating activities |
|
|
| 2,378,208 |
|
|
|
| 1,942,839 |
|
Investing activities |
|
|
|
|
|
|
|
| ||
Purchase of property, furniture, equipment, and lease-hold improvements |
|
|
| (1,642,397 | ) |
|
|
| (940,202 | ) |
Sale of property and equipment (Note 6) |
|
|
| 1,856 |
|
|
|
| 2,454 |
|
Additions to intangible assets |
|
|
| (1,880 | ) |
|
|
| (799 | ) |
Short-term bank deposits (Note 8) |
|
|
| (2,621,393 | ) |
|
|
|
| |
Interest earned on short-term investments |
|
|
| 91,966 |
|
|
|
| 37,354 |
|
Net cash flows used in investing activities |
|
|
| (4,171,848 | ) |
|
|
| (901,193 | ) |
Financing activities |
|
|
|
|
|
|
|
| ||
Payments made on reverse factoring transactions-net |
|
|
|
|
|
|
|
| ||
of commissions received (Note 5) |
|
|
| (2,266,340 | ) |
|
|
| (1,320,996 | ) |
Finance obtained through supplier finance |
|
|
|
|
|
|
|
| ||
arrangements (Note 5) |
|
|
| 2,385,967 |
|
|
|
| 1,334,506 |
|
Proceeds from Santander and HSBC credit line |
|
|
| 58,806 |
|
|
|
| 300,314 |
|
Payment of debt (Note 5) |
|
|
| (107,557 | ) |
|
|
| (463,437 | ) |
Interest payment on debt (Note 5) |
|
|
| (76,691 | ) |
|
|
| (18,077 | ) |
Lease payments (Note 11) |
|
|
| (1,139,828 | ) |
|
|
| (859,684 | ) |
Payment of principal of Promissory Notes (Notes 5 and 9) |
|
|
| (1,969,602 | ) |
|
|
| — |
|
Payment of accrued Interests of Promissory Notes (Notes 5 and 9) |
|
|
| (2,955,495 | ) |
|
|
| — |
|
Proceeds from initial public offering, net of underwriting fees (Note 1) |
|
|
| 7,841,837 |
|
|
|
| — |
|
Initial public offering costs |
|
|
| (23,269 | ) |
|
|
| — |
|
Net cash flows obtained from (used in) financing activities |
|
|
| 1,747,828 |
|
|
|
| (1,027,374 | ) |
Net (decrease) increase in cash and cash equivalents |
|
|
| (45,812 | ) |
|
|
| 14,272 |
|
Effect of foreign exchange movements on cash balances |
|
|
| 94,243 |
|
|
|
| 1,835 |
|
Cash and cash equivalents at beginning of period |
|
|
| 1,220,471 |
|
|
|
| 984,976 |
|
Cash and cash equivalents at end of period |
| Ps. |
| 1,268,902 |
|
| Ps. |
| 1,001,083 |
|
The accompanying notes are an integral part of these interim condensed consolidated financial statements.
F-5
BBB Foods Inc. and subsidiaries
Notes to the Unaudited Interim Condensed Consolidated Financial Statements
As of September 30, 2024, December 31, 2023 and for the three and nine-month periods ended September 30, 2024 and 2023
Amounts expressed in Thousands of Mexican Pesos (Ps.)
Note 1 - History and activity of the Company:
BBB Foods Inc. is a holding company incorporated in the British Virgin Islands on July 9, 2004 with company number 605635, that directly controls two Scottish entities:
In a stockholders' meeting held on December 31, 2024, BBB Foods Limited Partnership and Lothian Shelf Limited approved the merger of Tiendas BBB and Desarrolladora Tres B into Tiendas Tres B, as the surviving company. This transaction did not have any effect on the accompanying interim condensed consolidated financial statements.
The Subsidiaries currently operate in Mexico (except for BBB Foods Limited Partnership and Lothian Shelf Limited). BBB Foods Inc., collectively with the Subsidiaries, is hereinafter referred to as the “Company”, “BBB Foods”, or the “Group”.
BBB Foods Inc.’s registered office is located at Commerce House, Wickhams Cay 1, P.O. Box 3140, Road Town, Tortola, British Virgin Islands. BBB Foods Inc., as an entity incorporated and existing under the laws of the British Virgin Islands, is not subject to any form of taxation. The Company’s controlling parties are QS BBB, Inc., QS 3B Inc., QS T3B Inc., and Quilvest (Switzerland) Ltd, which are collectively referred to as “QS BBB”, and Bolton Partners LTD, who have joint control over the Company.
F-6
BBB Foods Inc. and subsidiaries
Notes to the Unaudited Interim Condensed Consolidated Financial Statements
As of September 30, 2024, December 31, 2023 and for the three and nine-month periods ended September 30, 2024 and 2023
The following are the Subsidiaries as of September 30, 2024 and December 31, 2023 over which control is exercised, directly and indirectly:
|
| % of ownership |
|
|
|
|
|
| ||
Company |
| September 30, |
| December 31, |
| Country |
| Functional currency |
| Main activity |
BBB Foods Limited Partnership |
| 100% |
| 100% |
| Scotland |
| Mexican peso |
| Intermediate parent |
Lothian Shelf Limited |
| 100% |
| 100% |
| Scotland |
| Mexican peso |
| Holding Company |
Tiendas Tres B, S.A. de C.V. |
| 100% |
| 100% |
| Mexico |
| Mexican peso |
| Operating company |
Tiendas BBB, S.A. de C.V. |
| 100% |
| 100% |
| Mexico |
| Mexican peso |
| Owner of some trademarks |
Desarrolladora Tres B, S.A. |
| 100% |
| 100% |
| Mexico |
| Mexican peso |
| Owner of a piece of land |
Company listing on NYSE, and Payment of Promissory Notes and Convertible Notes
On February 8, 2024, BBB Foods listed its Class A common shares on the New York Stock Exchange in connection with its Initial Public Offering (“IPO”) and on February 13, 2024, BBB Foods received net proceeds of Ps.7,812,065 from the IPO, net of underwriting discount and incremental and direct costs. The Company used the proceeds to repay in full the Promissory Notes and Convertible Notes (See Notes 9 and 10).
Additionally, certain of the Company’s stockholders sold an additional 5,610,098 Class A common shares at an initial public offering price of US$17.50 per share, and on February 15, 2024, certain stockholders sold an additional 5,049,088 Class A common shares at US$17.50 per share pursuant to the exercise of the underwriters’ over-allotment option. The Company did not receive any proceeds from the sale of Class A common shares.
Hurricane Otis
On October 25, 2023, Hurricane Otis struck the city of Acapulco, Mexico where the Company operated 54 stores as of such date. During the aftermath of the hurricane, 51 stores were temporarily closed; however, as of November 22, 2024, the Company had reopened 50 stores. The Company had fixed costs of Ps. 11,818 on the closed stores mainly due to payments of rent, utilities, wages and salaries.
As a result of the impact of Hurricane Otis, the Company recognized Ps. 42,422 in impairment losses as other expenses for the year ended December 31, 2023 due to damages to properties, furniture, equipment, and lease-hold improvements resulting from the hurricane and related events. In addition, the Company recognized Ps. 7,598 as sales expenses for the year ended December 31, 2023 in connection with cash losses due to theft, debris removal and equipment repairs. Finally, the Company also recognized Ps. 30,409 in cost of sales for the year ended December 31, 2023 as a result of inventory write down.
The Company holds insurance coverage relating to the damages from Hurricane Otis, which maximum liability limit amounts to US$3,586,750 (Ps. 63,197) for this specific event. However, this amount has not been recognized as an asset, since represents a contingent asset to Tiendas Tres B (the recovery is not virtually certain). As of November 22, 2024, the Company has not recovered any amount from the insurer.
Note 2 - Basis of preparation:
These interim condensed consolidated financial statements as of September 30, 2024, December 31, 2023, and for the three and nine-month periods ended September 30, 2024 and 2023 have been prepared in accordance with International Accounting Standard (“IAS”) 34, Interim Financial Reporting. These interim condensed consolidated
F-7
BBB Foods Inc. and subsidiaries
Notes to the Unaudited Interim Condensed Consolidated Financial Statements
As of September 30, 2024, December 31, 2023 and for the three and nine-month periods ended September 30, 2024 and 2023
financial statements do not include all the information and disclosures required in the annual financial statements and should be read in conjunction with the Company’s annual consolidated financial statements as of December 31, 2023, and any public announcements made by the Company during the interim reporting period. The accounting policies adopted in the preparation of these interim condensed consolidated financial statements are consistent with those utilized in the annual consolidated financial statements, except for the adoption of new and amended standards as set out in Note 3 and the following:
Short-term bank deposits
Short-term bank deposits are classified as financial assets measured at amortized cost. This classification is based on the criteria that the Company holds these financial assets within a business model to collect contractual cash flows, and the contractual terms of the financial asset give rise, on specified dates, to cash flows that are solely payments of principal and interest on the outstanding principal amount.
Interest revenue from short-term bank deposits is calculated using the effective interest method. This method involves applying the effective interest rate to the gross carrying amount of the financial asset.
Since the Company’s products mostly consist of food staples, sales are not generally affected by seasonality. Variations in the performance from quarter to quarter are generally a consequence of store openings and holidays. Therefore, these interim condensed consolidated financial statements do not include any significant seasonality effects that would impact the comparability of the periods presented.
These interim condensed consolidated financial statements and their accompanying notes were authorized for issuance on December 10, 2024 (except with respect to the matter disclosed in Note 20, which was authorized on January 14, 2025), by Kamal Anthony Hatoum (Chief Executive Officer) and Eduardo Pizzuto (Chief Financial Officer).
Note 3 - New and amended standards and interpretations
The accounting policies adopted in the preparation of these interim condensed consolidated financial statements are consistent with those followed in the preparation of the Company’s annual consolidated financial statements for the year ended December 31, 2023, except for the adoption of new standards effective as of January 1, 2024. The Company has not early adopted any standard, interpretation or amendment that has been issued but is not yet effective. Several amendments apply for the first time in 2024, but do not have an impact on the interim condensed consolidated financial statements of the Company.
In 2024, the Company adopted a series of amendments, issued by the IASB that are effective for annual periods that begin on or after January 1, 2024, which is the date as of these amendments were adopted. The conclusions related to their adoption are described below.
The amendments specify the requirements for classifying liabilities as current or non-current with covenants and clarify what is meant by to defer settlement, that a right to defer settlement must exist at the end of the reporting period, that the classification is unaffected by the likelihood that an entity will exercise
F-8
BBB Foods Inc. and subsidiaries
Notes to the Unaudited Interim Condensed Consolidated Financial Statements
As of September 30, 2024, December 31, 2023 and for the three and nine-month periods ended September 30, 2024 and 2023
its deferral right, that only if an embedded derivative in a convertible liability is itself an equity instrument would the terms of a liability not impact its classification and the disclosures to be included.
The amendments also clarify that the requirement for the right to exist at the end of the reporting period applies to covenants which the entity is required to comply with on or before the reporting date regardless of whether the lender tests for compliance at that date or at a later date. The amendments must be applied prospectively for annual periods beginning on or after January 1, 2024.
The Company does not expect that this amendment will have an impact on its annual financial statements.
The amendments specify that arrangements that are solely credit enhancements for the entity or instruments used by the entity to settle directly with a supplier the amounts owed are not supplier finance arrangements.
In addition, the amendments require that entities disclose information that enables users of financial statements to assess how supplier finance arrangements affect an entity’s liabilities and cash flows and to understand the effect of supplier finance arrangements on an entity’s exposure to liquidity risk and how the entity might be affected if the arrangements were no longer available to it. The amendment must be applied to annual periods beginning on or after January 1, 2024.
The Company expects that this amendment will require additional disclosures in its annual financial statements.
The amendment to IFRS 16 Leases specifies the requirements that a seller-lessee uses in measuring the lease liability arising in a sale and leaseback transaction, to ensure the seller-lessee does not recognize any amount of the gain or loss that relates to the right of use it retains. A seller-lessee applies the amendment retrospectively in accordance with IAS 8 to sale and leaseback transactions entered into after the date of initial application A seller-lessee applies the amendment to annual reporting periods beginning on or after January 1, 2024.
The amendment has had no impact on the Company’s in the interim condensed consolidated financial statements since it does not have sale and leaseback transactions.
In July 2024, the International Accounting Standards Board (IASB) published IFRIC agenda decision on segment reporting clarifying certain requirements for segment disclosures.
The Company is assessing this agenda decision and will amend its segment disclosures in the annual financial statements, if any.
Amendments to IAS 21 | Lack of exchangeability (2) |
Amendments to IFRS 9 and IFRS 7 | Classification and Measurement of Financial Instruments (3) |
Amendments to IFRS 18 | Presentation and Disclosure in Financial Statements (4) |
Amendments to IFRS 19 | Subsidiaries without Public Accounting Accountability: Disclosures (4) |
F-9
BBB Foods Inc. and subsidiaries
Notes to the Unaudited Interim Condensed Consolidated Financial Statements
As of September 30, 2024, December 31, 2023 and for the three and nine-month periods ended September 30, 2024 and 2023
Note 4 - Risk management:
The amount due to the financial institutions regarding the reverse factoring transactions amounted to Ps. 852,205 (out of which Ps. 559,229 corresponded to Santander and HSBC, and Ps. 292,976 to other financial institutions) and Ps. 472,950 (out of which Ps. 449,850 corresponded to Santander and HSBC, and Ps. 23,100 to other financial institutions) as of September 30, 2024 and December 31, 2023, respectively, which can lead to concentration of liquidity risk. However, the Company choses which accounts payable the financial institutions will settle and decides which accounts will remain payable to the suppliers, being able to manage such risk.
The Company's contractual maturities of its financial liabilities are detailed below according to the maturity periods. The table has been prepared on the basis of cash flows without discounting, from the first date on which the Company may be required to pay. The table includes the cash flows corresponding to the principal amount and its interest.
| Up to 1 |
|
| More than 1 and |
|
| Over 3 and up |
|
| More than |
|
| Total |
| |||||||||||
September 30, 2024 |
|
|
|
|
|
|
|
|
|
|
|
|
|
|
|
|
|
|
|
| |||||
Debt (excluding issuance costs) |
| Ps. |
| 934,020 |
|
| Ps. |
| 95,691 |
|
| Ps. |
| — |
|
| Ps. |
| — |
|
| Ps. |
| 1,029,711 |
|
Accounts payable and accrued |
|
|
|
|
|
|
|
|
|
|
|
|
|
|
|
|
|
|
|
| |||||
expenses |
|
|
| 552,826 |
|
|
|
| — |
|
|
|
| — |
|
|
|
| — |
|
|
|
| 552,826 |
|
Suppliers |
|
|
| 7,855,059 |
|
|
|
| — |
|
|
|
| — |
|
|
|
| — |
|
|
|
| 7,855,059 |
|
Lease liabilities |
|
|
| 1,547,364 |
|
|
|
| 2,890,004 |
|
|
|
| 2,474,297 |
|
|
|
| 7,616,382 |
|
|
|
| 14,528,047 |
|
Total |
| Ps. |
| 10,889,269 |
|
| Ps. |
| 2,985,695 |
|
| Ps. |
| 2,474,297 |
|
| Ps. |
| 7,616,382 |
|
| Ps. |
| 23,965,643 |
|
|
| Up to 1 |
|
|
| More than 1 and |
|
|
| Over 3 and up |
|
|
| More than |
|
|
| Total |
| ||||||
December 31, 2023 |
|
|
|
|
|
|
|
|
|
|
|
|
|
|
|
|
|
|
|
| |||||
Debt (excluding issuance costs) |
| Ps. |
| 768,576 |
|
| Ps. |
| 423,962 |
|
| Ps. |
| — |
|
| Ps. |
| — |
|
| Ps. |
| 1,192,538 |
|
Debt with related parties |
|
|
| — |
|
|
|
| 1,665,422 |
|
|
|
| — |
|
|
|
| — |
|
|
|
| 1,665,422 |
|
Interest payable on Promissory |
|
|
| — |
|
|
|
| 5,087,245 |
|
|
|
| — |
|
|
|
| — |
|
|
|
| 5,087,245 |
|
Costs of modification and |
|
|
| — |
|
|
|
| 80,244 |
|
|
|
| — |
|
|
|
| — |
|
|
|
| 80,244 |
|
Accounts payable and accrued |
|
|
| 322,959 |
|
|
|
| — |
|
|
|
| — |
|
|
|
| — |
|
|
|
| 322,959 |
|
Suppliers |
|
|
| 7,126,089 |
|
|
|
| — |
|
|
|
| — |
|
|
|
| — |
|
|
|
| 7,126,089 |
|
Lease liabilities |
|
|
| 1,293,219 |
|
|
|
| 2,382,138 |
|
|
|
| 2,062,570 |
|
|
|
| 6,401,351 |
|
|
|
| 12,139,278 |
|
Total |
| Ps. |
| 9,510,843 |
|
| Ps. |
| 9,639,011 |
|
| Ps. |
| 2,062,570 |
|
| Ps. |
| 6,401,351 |
|
| Ps. |
| 27,613,775 |
|
The Company’s objectives on managing capital risk are safeguarding the Company’ ability to continue as an ongoing business, maximizing benefits for shareholders and maintaining an optimal capital structure to reduce the cost of capital.
With the objective of maintaining or adjusting the capital structure, the Company can reduce capital in favor of its stockholders and / or to cover accumulated losses. Consistent with other participants in the industry, the Company monitors capital based on the operating leverage ratio.
F-10
BBB Foods Inc. and subsidiaries
Notes to the Unaudited Interim Condensed Consolidated Financial Statements
As of September 30, 2024, December 31, 2023 and for the three and nine-month periods ended September 30, 2024 and 2023
The Company’s exposure to the volatility of the exchange rate of its functional currency against the US dollar (US$) for the Company's financial instruments is shown below (figures in this table are expressed in US$):
| September 30, |
|
| December 31, |
| |||||
Financial assets |
| US$. |
| 168,680,767 |
|
| US$. |
| 13,643,181 |
|
Financial liabilities |
|
|
| (377,286 | ) |
|
|
| (287,343,524 | ) |
Foreign exchange monetary position |
| US$. |
| 168,303,481 |
|
| US$. |
| (273,700,343 | ) |
The exchange rates at the date of the financial statements, for one US dollar, were as follows:
| For the nine-month periods ended |
|
|
|
|
|
|
|
|
|
| |||||||||
| September 30, |
|
| September 30, |
|
| December 31, |
|
| September 30, |
| |||||||||
| 2024 |
|
| 2023 |
|
| 2024 |
|
| 2023 |
|
| 2023 |
| ||||||
| Average exchange rate |
|
| Closing exchange rate |
| |||||||||||||||
Ps./US$ |
|
| 17.7468 |
|
|
| 17.7859 |
|
|
| 19.6290 |
|
|
| 16.8935 |
|
|
| 17.6195 |
|
A hypothetical variation of 10% in the Ps./US$ exchange rate and keeping all other variables constant would have resulted in a profit or loss of Ps. 330,363 in the interim condensed consolidated statement of profit or loss for the nine-month period ended September 30, 2024.
The Company's debt is at fixed rates; therefore, the Company is not exposed to interest rate variation risk of loans bearing interest at variable rates. However, fixed-interest loans expose the Company to interest rate risk at fair value, which implies that the Company might be paying interest at rates significantly different from those of an observable market.
Note 5 - Cash flows information:
| September 30, 2024 |
|
| September 30, 2023 |
| |||||
Investing activities |
|
|
|
|
|
|
|
| ||
Right-of-use assets |
| Ps. |
| (1,448,622 | ) |
| Ps. |
| (960,197 | ) |
Property, furniture, equipment, lease-hold |
|
|
| (71,285 | ) |
|
|
| (463,204 | ) |
Initial public offering capitalized costs |
|
|
| (9,525 | ) |
|
|
|
| |
Financing activities |
|
|
|
|
|
|
|
| ||
Lease liabilities |
| Ps. |
| 1,448,622 |
|
| Ps. |
| 960,197 |
|
Long-term debt |
|
|
| 71,285 |
|
|
|
| 463,204 |
|
Debt with related parties |
|
|
| (4,391 | ) |
|
|
| — |
|
Accounts payable and accrued expenses |
|
|
| 4,391 |
|
|
|
| — |
|
F-11
BBB Foods Inc. and subsidiaries
Notes to the Unaudited Interim Condensed Consolidated Financial Statements
As of September 30, 2024, December 31, 2023 and for the three and nine-month periods ended September 30, 2024 and 2023
|
| Promissory Notes |
|
| Financing of |
|
| Supplier |
|
|
|
|
| ||||||||||||
| Related |
|
| Third parties |
|
| Debt |
|
| Total |
| ||||||||||||||
As of January 1, 2023 |
| Ps. |
| 4,276,058 |
|
| Ps. |
| 445,281 |
|
| Ps. |
| 248,353 |
|
| Ps. |
| 338,336 |
|
| Ps. |
| 5,308,028 |
|
Increase of new debt (non-cash |
|
|
| — |
|
|
|
| — |
|
|
|
| 463,204 |
|
|
|
| — |
|
|
|
| 463,204 |
|
Interest payable on Promissory Notes |
|
|
| 413,254 |
|
|
|
| 46,367 |
|
|
|
| — |
|
|
|
| — |
|
|
|
| 459,621 |
|
Payment of debt |
|
|
| — |
|
|
|
| — |
|
|
|
| (463,437 | ) |
|
|
| — |
|
|
|
| (463,437 | ) |
Interest payment on debt |
|
|
| — |
|
|
|
| — |
|
|
|
| (18,077 | ) |
|
|
| — |
|
|
|
| (18,077 | ) |
Accrued interest on debt |
|
|
| — |
|
|
|
| — |
|
|
|
| 18,077 |
|
|
|
| — |
|
|
|
| 18,077 |
|
Proceeds from Santander and HSBC |
|
|
|
|
|
|
|
|
|
|
|
|
|
|
|
|
|
|
|
| |||||
credit line |
|
|
| — |
|
|
|
| — |
|
|
|
| 300,314 |
|
|
|
| — |
|
|
|
| 300,314 |
|
Finance obtained through supplier |
|
|
|
|
|
|
|
|
|
|
|
|
|
|
|
|
|
|
|
| |||||
finance arrangements |
|
|
| — |
|
|
|
| — |
|
|
|
| — |
|
|
|
| 1,334,506 |
|
|
|
| 1,334,506 |
|
Payments made on reverse factoring |
|
|
|
|
|
|
|
|
|
|
|
|
|
|
|
|
|
|
|
| |||||
transactions |
|
|
| — |
|
|
|
| — |
|
|
|
| — |
|
|
|
| (1,328,640 | ) |
|
|
| (1,328,640 | ) |
Exchange fluctuation |
|
|
| (388,593 | ) |
|
|
| (40,496 | ) |
|
|
| — |
|
|
|
| — |
|
|
|
| (429,089 | ) |
As of September 30, 2023 |
| Ps. |
| 4,300,719 |
|
| Ps. |
| 451,152 |
|
| Ps. |
| 548,434 |
|
| Ps. |
| 344,202 |
|
| Ps. |
| 5,644,507 |
|
| Promissory Notes |
|
| Financing of |
|
| Supplier |
|
|
|
|
| |||||||||||||
| Related |
|
| Third parties |
|
| Debt |
|
| Total |
| ||||||||||||||
As of January 1, 2024 |
| Ps. |
| 4,340,452 |
|
| Ps. |
| 449,716 |
|
| Ps. |
| 421,887 |
|
| Ps. |
| 449,850 |
|
| Ps. |
| 5,661,905 |
|
Increase of new debt (non-cash |
|
|
| — |
|
|
|
| — |
|
|
|
| 71,285 |
|
|
|
| — |
|
|
|
| 71,285 |
|
Reclassification of debt (non-cash |
|
|
| (4,391 | ) |
|
|
| — |
|
|
|
| — |
|
|
|
| — |
|
|
|
| (4,391 | ) |
Interest payable on Promissory Notes |
|
|
| 76,168 |
|
|
|
| 6,420 |
|
|
|
| — |
|
|
|
| — |
|
|
|
| 82,588 |
|
Payment of principal of Promissory |
|
|
| (1,682,625 | ) |
|
|
| (286,977 | ) |
|
|
| — |
|
|
|
| — |
|
|
|
| (1,969,602 | ) |
Payment of accrued interests of |
|
|
| (2,774,333 | ) |
|
|
| (181,162 | ) |
|
|
| — |
|
|
|
| — |
|
|
|
| (2,955,495 | ) |
Amortization of issuance costs |
|
|
| — |
|
|
|
| 5,967 |
|
|
|
| — |
|
|
|
| — |
|
|
|
| 5,697 |
|
Payment of debt |
|
|
| — |
|
|
|
| — |
|
|
|
| (107,557 | ) |
|
|
| — |
|
|
|
| (107,557 | ) |
Interest payment on debt |
|
|
| — |
|
|
|
| — |
|
|
|
| (76,691 | ) |
|
|
| — |
|
|
|
| (76,691 | ) |
Accrued interest on debt |
|
|
| — |
|
|
|
| — |
|
|
|
| 76,691 |
|
|
|
| — |
|
|
|
| 76,691 |
|
Proceeds from Santander and HSBC |
|
|
| — |
|
|
|
| — |
|
|
|
| 58,806 |
|
|
|
| — |
|
|
|
| 58,806 |
|
Finance obtained through supplier |
|
|
| — |
|
|
|
| — |
|
|
|
| — |
|
|
|
| 2,385,967 |
|
|
|
| 2,385,967 |
|
Payments made on reverse factoring |
|
|
| — |
|
|
|
| — |
|
|
|
| — |
|
|
|
| (2,276,588 | ) |
|
|
| (2,276,588 | ) |
Exchange fluctuation |
|
|
| 44,729 |
|
|
|
| 6,036 |
|
|
|
| — |
|
|
|
| — |
|
|
|
| 50,765 |
|
As of September 30, 2024 |
| Ps. |
| — |
|
| Ps. |
| — |
|
| Ps. |
| 444,421 |
|
| Ps. |
| 559,229 |
|
| Ps. |
| 1,003,650 |
|
F-12
BBB Foods Inc. and subsidiaries
Notes to the Unaudited Interim Condensed Consolidated Financial Statements
As of September 30, 2024, December 31, 2023 and for the three and nine-month periods ended September 30, 2024 and 2023
Note 6 - Property, furniture, equipment and lease-hold improvements - Net:
The reconciliation between values of property, furniture, equipment and lease-hold improvements at beginning and end of period is as shown below.
Buildings |
| Land |
| Transportation |
| Transportation |
| Furniture and |
| Store |
| Store |
| Lease-hold |
| Computer |
| Storage |
| Molds |
| Total |
| |||||||||||||||||||||||||
September 30, 2024 |
|
|
|
|
|
|
|
|
|
|
|
|
|
|
|
|
|
|
|
|
|
|
|
|
|
|
|
|
|
|
|
|
|
|
|
| ||||||||||||
Initial balance | Ps. |
| 185 |
| Ps. |
| 871 |
| Ps. |
| 15,143 |
| Ps. |
| 431,229 |
| Ps. |
| 57,131 |
| Ps. |
| 904,531 |
| Ps. |
| 572,331 |
| Ps. |
| 2,468,575 |
| Ps. |
| 120,666 |
| Ps. |
| 35,638 |
| Ps. |
| — |
| Ps. |
| 4,606,300 |
|
Acquisitions |
|
| — |
|
|
| — |
|
|
| — |
|
|
| 71,285 |
|
|
| 12,989 |
|
|
| 353,677 |
|
|
| 155,327 |
|
|
| 1,079,796 |
|
|
| 39,127 |
|
|
| 1,481 |
|
|
| — |
|
|
| 1,713,682 |
|
Disposals |
|
| — |
|
|
| — |
|
|
| (417 | ) |
|
| (1,439 | ) |
|
| — |
|
|
| — |
|
|
| — |
|
|
| — |
|
|
| — |
|
|
| — |
|
|
| — |
|
|
| (1,856 | ) |
Depreciation |
|
| (51 | ) |
|
| — |
|
|
| (7,386 | ) |
|
| (49,104 | ) |
|
| (7,321 | ) |
|
| (99,173 | ) |
|
| (26,029 | ) |
|
| (229,203 | ) |
|
| (46,874 | ) |
|
| (3,844 | ) |
|
| — |
|
|
| (468,985 | ) |
Final balance | Ps. |
| 134 |
| Ps. |
| 871 |
| Ps. |
| 7,340 |
| Ps. |
| 451,971 |
| Ps. |
| 62,799 |
| Ps. |
| 1,159,035 |
| Ps. |
| 701,629 |
| Ps. |
| 3,319,168 |
| Ps. |
| 112,919 |
| Ps. |
| 33,275 |
| Ps. |
| — |
| Ps. |
| 5,849,141 |
|
September 30, 2024 |
|
|
|
|
|
|
|
|
|
|
|
|
|
|
|
|
|
|
|
|
|
|
|
|
|
|
|
|
|
|
|
|
|
|
|
| ||||||||||||
Cost | Ps. |
| 1,481 |
| Ps. |
| 871 |
| Ps. |
| 89,289 |
| Ps. |
| 667,819 |
| Ps. |
| 115,904 |
| Ps. |
| 1,610,701 |
| Ps. |
| 862,222 |
| Ps. |
| 4,256,381 |
| Ps. |
| 390,046 |
| Ps. |
| 57,662 |
| Ps. |
| 3,580 |
| Ps. |
| 8,055,956 |
|
Accumulated |
|
| (1,347 | ) |
|
| — |
|
|
| (81,949 | ) |
|
| (215,848 | ) |
|
| (44,370 | ) |
|
| (447,092 | ) |
|
| (160,593 | ) |
|
| (937,213 | ) |
|
| (274,082 | ) |
|
| (24,387 | ) |
|
| (3,580 | ) |
|
| (2,190,461 | ) |
Impairment |
|
| — |
|
|
| — |
|
|
| — |
|
|
| — |
|
|
| (8,735 | ) |
|
| (4,574 | ) |
|
| — |
|
|
| — |
|
|
| (3,045 | ) |
|
| — |
|
|
| — |
|
|
| (16,354 | ) |
Final balance | Ps. |
| 134 |
| Ps. |
| 871 |
| Ps. |
| 7,340 |
| Ps. |
| 451,971 |
| Ps. |
| 62,799 |
| Ps. |
| 1,159,035 |
| Ps. |
| 701,629 |
| Ps. |
| 3,319,168 |
| Ps. |
| 112,919 |
| Ps. |
| 33,275 |
| Ps. |
| — |
| Ps. |
| 5,849,141 |
|
December 31, 2023 |
|
|
|
|
|
|
|
|
|
|
|
|
|
|
|
|
|
|
|
|
|
|
|
|
|
|
|
|
|
|
|
|
|
|
|
| ||||||||||||
Initial balance | Ps. |
| 259 |
| Ps. |
| 871 |
| Ps. |
| 20,442 |
| Ps. |
| 313,219 |
| Ps. |
| 44,235 |
| Ps. |
| 567,115 |
| Ps. |
| 453,608 |
| Ps. |
| 1,633,311 |
| Ps. |
| 97,123 |
| Ps. |
| 34,021 |
| Ps. |
| — |
| Ps. |
| 3,164,204 |
|
Acquisitions |
|
| — |
|
|
| — |
|
|
| 6,321 |
|
|
| 172,364 |
|
|
| 29,110 |
|
|
| 435,466 |
|
|
| 149,192 |
|
|
| 1,097,423 |
|
|
| 80,218 |
|
|
| 6,609 |
|
|
| — |
|
|
| 1,976,703 |
|
Disposals |
|
| — |
|
|
| — |
|
|
| (123 | ) |
|
| (3,402 | ) |
|
| — |
|
|
| (7 | ) |
|
| (42 | ) |
|
| — |
|
|
| — |
|
|
| (202 | ) |
|
| — |
|
|
| (3,776 | ) |
Impairment |
|
| — |
|
|
| — |
|
|
| — |
|
|
| — |
|
|
| (8,734 | ) |
|
| (4,574 | ) |
|
| — |
|
|
| (26,069 | ) |
|
| (3,045 | ) |
|
| — |
|
|
| — |
|
|
| (42,422 | ) |
Depreciation |
|
| (74 | ) |
|
| — |
|
|
| (11,497 | ) |
|
| (50,952 | ) |
|
| (7,480 | ) |
|
| (93,469 | ) |
|
| (30,427 | ) |
|
| (236,090 | ) |
|
| (53,630 | ) |
|
| (4,790 | ) |
|
| — |
|
|
| (488,409 | ) |
Final balance | Ps. |
| 185 |
| Ps. |
| 871 |
| Ps. |
| 15,143 |
| Ps. |
| 431,229 |
| Ps. |
| 57,131 |
| Ps. |
| 904,531 |
| Ps. |
| 572,331 |
| Ps. |
| 2,468,575 |
| Ps. |
| 120,666 |
| Ps. |
| 35,638 |
| Ps. |
| — |
| Ps. |
| 4,606,300 |
|
December 31, 2023 |
|
|
|
|
|
|
|
|
|
|
|
|
|
|
|
|
|
|
|
|
|
|
|
|
|
|
|
|
|
|
|
|
|
|
|
| ||||||||||||
Cost | Ps. |
| 1,481 |
| Ps. |
| 871 |
| Ps. |
| 98,761 |
| Ps. |
| 599,230 |
| Ps. |
| 103,320 |
| Ps. |
| 1,257,024 |
| Ps. |
| 706,895 |
| Ps. |
| 3,202,654 |
| Ps. |
| 350,920 |
| Ps. |
| 56,181 |
| Ps. |
| 3,580 |
| Ps. |
| 6,380,917 |
|
Impairment |
|
| — |
|
|
| — |
|
|
| — |
|
|
| — |
|
|
| (8,734 | ) |
|
| (4,574 | ) |
|
| — |
|
|
| (26,069 | ) |
|
| (3,045 | ) |
|
| — |
|
|
| — |
|
|
| (42,422 | ) |
Accumulated |
|
| (1,296 | ) |
|
| — |
|
|
| (83,618 | ) |
|
| (168,001 | ) |
|
| (37,455 | ) |
|
| (347,919 | ) |
|
| (134,564 | ) |
|
| (708,010 | ) |
|
| (227,209 | ) |
|
| (20,543 | ) |
|
| (3,580 | ) |
|
| (1,732,195 | ) |
Final balance | Ps. |
| 185 |
| Ps. |
| 871 |
| Ps. |
| 15,143 |
| Ps. |
| 431,229 |
| Ps. |
| 57,131 |
| Ps. |
| 904,531 |
| Ps. |
| 572,331 |
| Ps. |
| 2,468,575 |
| Ps. |
| 120,666 |
| Ps. |
| 35,638 |
| Ps. |
| — |
| Ps. |
| 4,606,300 |
|
The depreciation of property, furniture, equipment and lease-hold improvements for the nine-month periods ended September 30, 2024 and 2023 amounted to Ps. 468,985 and Ps. 334,184, respectively; the depreciation of property, furniture, equipment and lease-hold improvements recognized in cost of sales for the nine-month periods ended September 30, 2024 and 2023 amounted to Ps. 91,011 and Ps. 66,244, respectively; and the depreciation of property, furniture, equipment and lease-hold improvements recognized in sales and administrative expenses for the nine-month periods ended September 30, 2024 and 2023 amounted to Ps. 377,974 and Ps. 267,940, respectively. In addition, as of December 31, 2023, the Company impaired property damage from Hurricane Otis by Ps.42,422 (See Note 1), which was recognized in the statement of profit or loss as other expenses.
F-13
BBB Foods Inc. and subsidiaries
Notes to the Unaudited Interim Condensed Consolidated Financial Statements
As of September 30, 2024, December 31, 2023 and for the three and nine-month periods ended September 30, 2024 and 2023
Note 7 - Right-of-use assets - Net:
The Company has signed various lease contracts used in its operations, including machinery, vehicles, other equipment and commercial premises. There are no future cash outflows derived from residual value guarantees, restrictions imposed by tenants on sale and leaseback transactions.
The average term of the lease contracts as of September 30, 2024 and December 31, 2023 was 5 to 20 years for buildings, 10 years for store equipment, and 8 years for transportation equipment. The Company applies the recognition exemptions with respect to “short-term leases” and “low-value asset leases”.
The right-of-use asset recognized in the interim condensed consolidated statement of financial position as of September 30, 2024 and the fiscal year ended on December 31, 2023, was as shown below.
| Building |
|
| Transportation equipment |
|
| Store |
|
| Total |
| |||||||||
As of January 1, 2023 |
| Ps. |
| 4,472,888 |
|
| Ps. |
| 55,999 |
|
| Ps. |
| 167,572 |
|
| Ps. |
| 4,696,459 |
|
Additions |
|
|
| 1,282,448 |
|
|
|
| 63,778 |
|
|
|
| 75,942 |
|
|
|
| 1,422,168 |
|
Depreciation |
|
|
| (553,468 | ) |
|
|
| (20,693 | ) |
|
|
| (23,870 | ) |
|
|
| (598,031 | ) |
As of December 31, 2023 |
| Ps. |
| 5,201,868 |
|
| Ps. |
| 99,084 |
|
| Ps. |
| 219,644 |
|
| Ps. |
| 5,520,596 |
|
Additions |
|
|
| 1,354,571 |
|
|
|
| 66,114 |
|
|
|
| 29,399 |
|
|
|
| 1,450,084 |
|
Write-offs |
|
|
| — |
|
|
|
| (1,462 | ) |
|
|
| — |
|
|
|
| (1,462 | ) |
Depreciation |
|
|
| (432,802 | ) |
|
|
| (27,049 | ) |
|
|
| (21,393 | ) |
|
|
| (481,244 | ) |
As of September 30, 2024 |
| Ps. |
| 6,123,637 |
|
| Ps. |
| 136,687 |
|
| Ps. |
| 227,650 |
|
| Ps. |
| 6,487,974 |
|
During the nine-month periods ended September 30, 2024 and 2023, the Company had expenses related to low-value leased assets and short-term leases included in sale and administrative expenses for an amount of Ps. 9,837 and Ps. 9,574 respectively. During the same periods, the Company did not have variable lease payments.
The Company had total cash outflows for leases in the nine-month periods ended September 30, 2024 and 2023, for an amount of Ps. 1,139,828 and Ps. 859,684, respectively.
For the nine-month periods ended September 30, 2024 and 2023, the Company recognized depreciation of the right-of-use asset in cost of sales for Ps. 87,549 and Ps. 63,627, respectively.
For the nine-month periods ended September 30, 2024 and 2023, the Company recognized depreciation of the right-of-use asset in sales expenses for Ps. 393,695 and Ps. 358,245, respectively.
The Company has several lease contracts that include extension and termination options. These options are negotiated by Management to provide flexibility in managing the leased-asset portfolio and align with the Group business needs. Management exercises significant judgement in determining whether these extension and termination options are reasonably certain to be exercised. As of September 30, 2024 and December 31, 2023, the Company considered all optional extensions that are enforceable in its lease contracts; therefore, there are no future cash outflows derived from extensions that are not planned to be exercised.
F-14
BBB Foods Inc. and subsidiaries
Notes to the Unaudited Interim Condensed Consolidated Financial Statements
As of September 30, 2024, December 31, 2023 and for the three and nine-month periods ended September 30, 2024 and 2023
Note 8 - Financial instruments by category:
The Company classified their financial assets and liabilities as follows:
| September 30, |
|
| December 31, |
| |||||
Financial assets at amortized cost: |
|
|
|
|
|
|
|
| ||
Cash and cash equivalents |
| Ps. |
| 1,268,902 |
|
| Ps. |
| 1,220,471 |
|
Short term bank deposits (1) |
|
|
| 2,963,511 |
|
|
|
| — |
|
Creditors |
|
|
| 3,669 |
|
|
|
| — |
|
Sundry debtors |
|
|
| 47,523 |
|
|
|
| 11,020 |
|
Financial assets at fair value |
|
|
|
|
|
|
|
| ||
Derivative financial instruments (2) |
|
|
| 7,287 |
|
|
|
| — |
|
Total |
| Ps. |
| 4,290,892 |
|
| Ps. |
| 1,231,491 |
|
| September 30, |
|
| December 31, |
| |||||
Financial liabilities at amortized cost: |
|
|
|
|
|
|
|
| ||
Debt with related parties |
| Ps. |
| — |
|
| Ps. |
| 4,340,452 |
|
Accounts payable and accrued expenses |
|
|
| 552,826 |
|
|
|
| 322,959 |
|
Suppliers |
|
|
| 7,855,059 |
|
|
|
| 7,126,089 |
|
Lease liabilities |
|
|
| 7,310,246 |
|
|
|
| 6,244,222 |
|
Debt |
|
|
| 1,003,650 |
|
|
|
| 1,321,455 |
|
Total |
| Ps. |
| 16,721,781 |
|
| Ps. |
| 19,355,177 |
|
Fair value of financial assets and liabilities measured at amortized cost
The amount of cash and cash equivalents, short-term bank deposits, creditors, sundry debtors and suppliers, approximate their fair value due to their short-term maturity. The net carrying amount of these accounts represents the expected cash flows to be received as of September 30, 2024 and December 31, 2023.
The estimated carrying amount and fair value of the liabilities measured at amortized costs are as follows:
| September 30, 2024 |
|
| December 31, 2023 |
| |||||||||||||||
| Carrying amount |
|
| Fair value |
|
| Carrying amount |
|
| Fair value |
| |||||||||
Debt to related parties and debt to |
|
|
|
|
|
|
|
|
|
|
|
|
|
|
|
| ||||
third parties (1) |
| Ps. |
| — |
|
| Ps. |
| — |
|
| Ps. |
| 4,790,168 |
|
| Ps. |
| 4,798,894 |
|
F-15
BBB Foods Inc. and subsidiaries
Notes to the Unaudited Interim Condensed Consolidated Financial Statements
As of September 30, 2024, December 31, 2023 and for the three and nine-month periods ended September 30, 2024 and 2023
Long-term fixed-rate and variable-rate interest-bearing loans and borrowings are evaluated by the Company based on parameters such as interest rates, specific country risk factors, and the risk characteristics of the financed project.
As of September 30, 2024 and December 31, 2023, there were no transfers between the levels of the fair value hierarchy.
Fair value hierarchy
The following is an analysis of financial instruments measured in accordance with the fair value hierarchy. The 3 different levels used are presented below:
Note 9 - Debt with related parties:
9.1 Transactions with related parties
| For the nine-month periods ended |
| ||||||||
| September 30, |
|
| September 30, |
| |||||
Interest expense on Promissory Notes |
| Ps. |
| 20,800 |
|
| Ps. |
| 112,844 |
|
Interest expense on Promissory Notes |
|
|
| 53,189 |
|
|
|
| 288,686 |
|
Interest expense on Promissory Notes |
|
|
| 1,979 |
|
|
|
| 10,649 |
|
Interest expense on Promissory Notes |
|
|
| 200 |
|
|
|
| 1,075 |
|
Deferred bonus expense payable to key |
|
|
| — |
|
|
|
| 11,412 |
|
Interest accrued on deferred bonus |
|
|
| 1,191 |
|
|
|
| 3,604 |
|
Professional fees payable to other |
|
|
| — |
|
|
|
| 1,401 |
|
Total |
| Ps. |
| 77,359 |
|
| Ps. |
| 429,671 |
|
9.2 Balances with related parties
Current liabilities
| September 30, |
|
| December 31, |
| |||||
Deferred bonus payable to related |
| Ps. |
| — |
|
| Ps. |
| 43,161 |
|
Other bonus payable |
|
|
| — |
|
|
|
| 35,269 |
|
Total |
| Ps. |
| — |
|
| Ps. |
| 78,430 |
|
F-16
BBB Foods Inc. and subsidiaries
Notes to the Unaudited Interim Condensed Consolidated Financial Statements
As of September 30, 2024, December 31, 2023 and for the three and nine-month periods ended September 30, 2024 and 2023
Non-current liabilities
| September 30, |
|
| December 31, |
| |||||
Promissory Notes |
| Ps. |
| — |
|
| Ps. |
| 4,340,452 |
|
In February 2024, the Company repaid the outstanding amount of Senior, 2017 Junior and 2020 Junior Promissory Notes, with the proceeds of the IPO (See Note 1).
9.3 As of December 31, 2023, the Company’s debt related to the Promissory Notes was as follows:
Debt with related parties
December 31, 2023 | ||||||||||||||||||||||||||||
Promissory | Amount of |
|
| Currency |
| Principal |
|
| Accrued |
|
| Total |
|
| Interest |
|
| Maturity |
| Guarantee(3) | ||||||||
Non-Current |
|
|
|
|
|
|
|
|
|
|
|
|
|
|
|
|
|
|
|
|
|
|
| |||||
Senior Promissory Notes |
| 94,747,329 |
|
| US$ |
| Ps. |
| 1,592,780 |
|
| Ps. |
| 2,565,678 |
|
| Ps. |
| 4,158,458 |
|
|
| 14 | % |
| Dec 2026 |
| Guaranteed |
2017 Junior Promissory |
| 5,000,000 |
|
| US$ |
|
|
| 70,953 |
|
|
|
| 108,292 |
|
|
|
| 179,245 |
|
|
| 15 | % |
| Dec 2026 |
| Guaranteed |
2020 Junior Promissory |
| 650,000 |
|
| US$ |
|
|
| 1,689 |
|
|
|
| 1,060 |
|
|
|
| 2,749 |
|
|
| 14 | % |
| Dec 2026 |
| Guaranteed |
Total |
| 100,397,329 |
|
|
|
| Ps. |
| 1,665,422 |
|
| Ps. |
| 2,675,030 |
|
| Ps. |
| 4,340,452 |
|
|
|
|
|
|
|
| |
Terms and conditions of the Promissory Notes
On November 30, 2016, BBB Foods Inc. entered into a Senior Promissory Notes Agreement, pursuant to which the Company issued promissory notes (the “Senior Notes”) in the aggregate amount of US$94,747,329, of which 99.5% was due to related parties and 0.5% to third parties, bearing interest at an annual rate of 14%, with principal and interest payable at maturity.
On October 23, 2023, the Company signed a new amendment to extend the maturity to December 31, 2026 agreeing to pay an additional amount of US$4,100,000 at maturity to the registered holders, and an advisory fee of US$400,000 to QS Management Ltd., in order to modify the existing terms and conditions of the original debt, which leads to classify the transaction as a modification of debt.
The Senior Notes are held by both related parties, and third parties. The total amount has been split to show the nature of the counterparty creditors.
F-17
BBB Foods Inc. and subsidiaries
Notes to the Unaudited Interim Condensed Consolidated Financial Statements
As of September 30, 2024, December 31, 2023 and for the three and nine-month periods ended September 30, 2024 and 2023
Amounts outstanding under the Senior Notes were comprised as follows:
| September 30, |
|
| December 31, |
| |||||
Related parties |
| Ps. |
| — |
|
| Ps. |
| 4,158,458 |
|
Third parties |
|
|
| — |
|
|
|
| 20,454 |
|
Total |
| Ps. |
| — |
|
| Ps. |
| 4,178,912 |
|
The related parties were as follows:
| September 30, |
|
| December 31, |
| |||||
BBB Foods Inc. stockholders |
| Ps. |
| — |
|
| Ps. |
| 1,122,056 |
|
Investment fund related to QS BBB |
|
|
| — |
|
|
|
| 3,035,234 |
|
Key management personnel |
|
|
| — |
|
|
|
| 1,168 |
|
Total |
| Ps. |
| — |
|
| Ps. |
| 4,158,458 |
|
On August 9, 2017, BBB Foods Inc. entered into a Junior Promissory Notes Agreement, pursuant to which the Company issued promissory notes (the “2017 Junior Notes") in the aggregate amount of US$5,000,000, of which 84% was due to related parties and 16% to third parties, with a term of 9 years bearing interest at an annual rate of 15%, with principal and interest payable at maturity.
On October 23, 2023, the Company signed a new amendment to extend the maturity to December 31, 2026 agreeing to pay an additional amount of US$230,000 to the registered holders, in order to modify the existing terms and conditions of the original debt, which leads to classify the transaction as a modification of debt.
The 2017 Junior Notes are held by both related parties, and third parties. The total amount has been split to show the nature of the counterparty creditors.
Amounts outstanding under the 2017 Junior Notes were comprised as follows:
| September 30, |
|
| December 31, |
| |||||
Related parties |
| Ps. |
| — |
|
| Ps. |
| 179,245 |
|
Third parties |
|
|
| — |
|
|
|
| 34,142 |
|
Total |
| Ps. |
| — |
|
| Ps. |
| 213,387 |
|
The related parties were as follows:
| September 30, |
|
| December 31, |
| |||||
Key management personnel |
| Ps. |
| — |
|
| Ps. |
| 104,559 |
|
BBB Foods Inc. stockholders |
|
|
| — |
|
|
|
| 59,748 |
|
Close family member of key |
|
|
| — |
|
|
|
| 10,670 |
|
Other related parties |
|
|
| — |
|
|
|
| 4,268 |
|
Total |
| Ps. |
| — |
|
| Ps. |
| 179,245 |
|
F-18
BBB Foods Inc. and subsidiaries
Notes to the Unaudited Interim Condensed Consolidated Financial Statements
As of September 30, 2024, December 31, 2023 and for the three and nine-month periods ended September 30, 2024 and 2023
On June 30, 2020, BBB Foods Inc. entered into a Junior Promissory Notes Agreement, whereby the Company issued promissory notes (the “2020 Junior Notes”), in the aggregate amount of US$650,000, out of which 15.4% corresponded to related parties and 84.6% to third parties, with 6 years-term, bearing interest at an annual rate of 14%, with principal and interest payable at maturity.
The 2020 Junior Notes are held by both related parties, and third parties, so the total amount has been split to show the nature of the counterparty creditors.
Amounts outstanding under the 2020 Junior Notes were comprised as follows:
| September 30, |
|
| December 31, |
| |||||
Related parties |
| Ps. |
| — |
|
| Ps. |
| 2,749 |
|
Third parties |
|
|
| — |
|
|
|
| 15,118 |
|
Total |
| Ps. |
| — |
|
| Ps. |
| 17,867 |
|
The related parties were as follows:
| September 30, |
|
| December 31, |
| |||||
BBB Foods Inc. shareholders |
| Ps. |
| — |
|
| Ps. |
| 2,749 |
|
The Promissory Notes contained certain provisions that the Company complied as of December 31, 2023.
9.4 Key Management personnel compensation
| For the nine-month periods ended |
| ||||||||
| September 30, |
|
| September 30, |
| |||||
Share-based payments (See Note 17) |
| Ps. |
| 396,054 |
|
| Ps. |
| 302,438 |
|
Short-term employee benefits |
|
|
| 181,442 |
|
|
|
| 85,819 |
|
Deferred bonus (See Note 9.1) |
|
|
| — |
|
|
|
| 11,412 |
|
| Ps. |
| 577,496 |
|
| Ps. |
| 399,669 |
| |
F-19
BBB Foods Inc. and subsidiaries
Notes to the Unaudited Interim Condensed Consolidated Financial Statements
As of September 30, 2024, December 31, 2023 and for the three and nine-month periods ended September 30, 2024 and 2023
Note 10 - Debt:
The Company’s debt is as follows:
| September 30, |
|
| December 31, |
| |||||
Short-term debt: |
|
|
|
|
|
|
|
| ||
Short-term financing of transportation |
| Ps. |
| 115,197 |
|
| Ps. |
| 112,142 |
|
Supplier finance arrangement (1) (3) |
|
|
| 559,229 |
|
|
|
| 449,850 |
|
Credit Lines (2) (3) |
|
|
| 240,951 |
|
|
|
| 182,145 |
|
Total short-term debt |
| Ps. |
| 915,377 |
|
| Ps. |
| 744,137 |
|
Long-term debt: |
|
|
|
|
|
|
|
| ||
Long-term financing of transportation |
| Ps. |
| 88,273 |
|
| Ps. |
| 127,602 |
|
Promissory Notes |
|
|
| — |
|
|
|
| 449,716 |
|
Total long-term debt |
| Ps. |
| 88,273 |
|
| Ps. |
| 577,318 |
|
Total debt |
| Ps. |
| 1,003,650 |
|
| Ps. |
| 1,321,455 |
|
i. Financing of transportation and store equipment
F-20
BBB Foods Inc. and subsidiaries
Notes to the Unaudited Interim Condensed Consolidated Financial Statements
As of September 30, 2024, December 31, 2023 and for the three and nine-month periods ended September 30, 2024 and 2023
The transportation and store equipment are pledged as collateral. This financing is denominated, in Mexican pesos and accrues monthly interest as shown below.
|
|
|
|
| Remaining contract |
| September 30, |
|
| December 31, |
| |||||
Institution |
| Concept |
| Effective rate |
| period (1) |
| 2024 |
|
| 2023 |
| ||||
Banco Mercantil del Norte |
| Transportation equipment |
| From 13.20 to 14.99 |
| 1 year |
| Ps. |
| 149 |
|
| Ps. |
| 149 |
|
Daimler Chrysler Financial |
| Transportation equipment |
| From 12.20 to 12.90 |
| 1 year |
|
|
| 114,532 |
|
|
|
| 111,551 |
|
Daimler Chrysler Financial |
| Transportation equipment |
| From 12.30 to 12.90 |
| 3 years |
|
|
| 87,717 |
|
|
|
| 127,602 |
|
NR Finance México, S.A. de |
| Transportation equipment |
| 9.43 |
| 1 year |
|
|
| 13 |
|
|
|
| 13 |
|
Toyota Financial Services |
| Transportation equipment |
| 11.99 |
| 1 year |
|
|
| — |
|
|
|
| 70 |
|
Grupo Financiero Santander |
| Transportation equipment |
| 12.99 |
| 1 year |
|
|
| — |
|
|
|
| 123 |
|
Baliequipment Sa D |
| Cooling equipment |
| 12.98 |
| 1 year |
|
|
| — |
|
|
|
| 236 |
|
ALD Market Innovation |
| Cooling equipment |
| 10 |
| 1 year |
|
|
| 503 |
|
|
|
| — |
|
ALD Market Innovation |
| Cooling equipment |
| 10 |
| 2 year |
|
|
| 556 |
|
|
|
| — |
|
Grupo Financiero Santander |
| Santander credit line |
| TIIE + 2.00 |
| 1 year |
|
|
| 130,951 |
|
|
|
| 182,145 |
|
Grupo Financiero HSBC |
| HSBC credit line |
| TIIE + 3.25 |
| 1 year |
|
|
| 110,000 |
|
|
|
| — |
|
Supplier finance arrangement |
| HSBC |
| N/A |
| N/A |
|
|
| 240,458 |
|
|
|
| 233,930 |
|
Supplier finance arrangement |
| Santander |
| N/A |
| N/A |
|
|
| 318,771 |
|
|
|
| 215,920 |
|
Total debt |
|
|
|
|
|
|
|
|
| 1,003,650 |
|
|
|
| 871,739 |
|
Total short-term debt |
|
|
|
|
|
|
|
|
| 915,377 |
|
|
|
| 744,137 |
|
Total long-term debt |
|
|
|
|
|
|
| Ps. |
| 88,273 |
|
| Ps. |
| 127,602 |
|
ii. Promissory Notes
In February 2024, the Company repaid the outstanding amount of Senior, 2017 Junior and 2020 Junior Promissory Notes and Convertible Notes, with the proceeds of the IPO. As of December 31, 2023, the outstanding amount was Ps. 449,716 and the amount paid in February 2024 was Ps. 468,139.
As of December 31, 2023, the Company’s debt under the Promissory Notes was as follows:
| December 31, 2023 |
|
| ||||||||||||||||||||||||||
Promissory |
| Amount of |
|
| Currency |
| Principal |
|
| Accrued |
|
| Total |
|
| Interest |
|
| Maturity |
| Guarantee(3) | ||||||||
Non-Current Senior |
|
| 94,747,329 |
|
| US$ |
| Ps. |
| 7,834 |
|
| Ps. |
| 12,620 |
|
| Ps. |
| 20,454 |
|
|
| 14 | % |
| Dec 2026 |
| Guaranteed |
2017 Junior |
|
| 5,000,000 |
|
| US$ |
|
|
| 13,515 |
|
|
|
| 20,627 |
|
|
|
| 34,142 |
|
|
| 15 | % |
| Dec 2026 |
| Guaranteed |
2020 Junior |
|
| 650,000 |
|
| US$ |
|
|
| 9,291 |
|
|
|
| 5,827 |
|
|
|
| 15,118 |
|
|
| 14 | % |
| Dec 2026 |
| Guaranteed |
Convertible Notes |
|
| 15,000,000 |
|
| US$ |
|
|
| 248,569 |
|
|
|
| 131,433 |
|
|
|
| 380,002 |
|
|
| 14 | % |
| Nov 2026 |
| Guaranteed |
Total |
|
| 115,397,329 |
|
|
|
| Ps. |
| 279,209 |
|
| Ps |
| 170,507 |
|
| Ps. |
| 449,716 |
|
|
|
|
|
|
|
| |
F-21
BBB Foods Inc. and subsidiaries
Notes to the Unaudited Interim Condensed Consolidated Financial Statements
As of September 30, 2024, December 31, 2023 and for the three and nine-month periods ended September 30, 2024 and 2023
iii. Convertible Notes
On November 20, 2020, BBB Foods Inc. entered into a Junior Convertible Promissory Notes Agreement with LIV FD, S.A. de C.V., S.O.F.O.M., E.N.R.
Under the terms of this agreement, BBB Foods Inc. issued a first junior convertible promissory note in the amount of US$7,500,000 and on February 3, 2021, issued a second junior convertible promissory note in the amount of US$7,500,000, with issuance costs of US$112,500. Both instruments had a term of 6 years and mature on November 20, 2026, and bear interest at annual rate of 14% compounded quarterly, with principal and interest payable at maturity. The first and the second junior convertible promissory notes are referred to as the “Convertible Notes”.
Between May 20, 2025, and the maturity date, the Convertible Notes were convertible into Company’s common shares, at the option of the holder. Convertible Notes would be convertible into the number of Class C Shares equal to the outstanding principal amount plus the amount of all accrued and unpaid interest at the time of the conversion and divided by the Conversion Price (US$86.25).
According to the terms and conditions, the Convertible Notes included an option to acquire the Company’s equity at a determined price in U.S. dollars, which qualifies as an embedded derivative. This derivative had to be recognized as a financial instrument measured at fair value through profit or loss, as it was not closely related to the underlying Convertible Notes. However, the value of the embedded derivative as of February 14, 2024, and December 31, 2023, was not material.
With the proceeds of the IPO, the Company repaid the outstanding amount of Convertible Notes totaling US$23,229,744 (Ps. 396,485).
Note 11 - Lease liabilities:
From December 31, 2023 to September 30, 2024, the Company has recognized the lease liabilities shown below:
| September 30, |
|
| December 31, |
| |||||
Lease liabilities: |
|
|
|
|
|
|
|
| ||
Current |
| Ps. |
| 620,019 |
|
| Ps. |
| 537,515 |
|
Non-current |
|
|
| 6,690,227 |
|
|
|
| 5,706,707 |
|
| Ps. |
| 7,310,246 |
|
| Ps. |
| 6,244,222 |
| |
F-22
BBB Foods Inc. and subsidiaries
Notes to the Unaudited Interim Condensed Consolidated Financial Statements
As of September 30, 2024, December 31, 2023 and for the three and nine-month periods ended September 30, 2024 and 2023
Set out below are the carrying amounts of lease liabilities and the movements during the period:
|
|
|
|
| Transportation |
|
| Store |
|
|
|
|
| |||||||
| Building |
|
| equipment |
|
| equipment |
|
| Total |
| |||||||||
Lease liabilities as of January 1, 2023 |
| Ps. |
| 5,092,225 |
|
| Ps. |
| 47,234 |
|
| Ps. |
| 105,983 |
|
| Ps. |
| 5,245,442 |
|
New leases |
|
|
| 1,282,448 |
|
|
|
| 63,778 |
|
|
|
| 75,942 |
|
|
|
| 1,422,168 |
|
Interest expense |
|
|
| 728,878 |
|
|
|
| 9,689 |
|
|
|
| 24,305 |
|
|
|
| 762,872 |
|
Payment of leases |
|
|
| (1,071,930 | ) |
|
|
| (31,242 | ) |
|
|
| (83,088 | ) |
|
|
| (1,186,260 | ) |
Lease liabilities as of December 31, 2023 |
| Ps. |
| 6,031,621 |
|
| Ps. |
| 89,459 |
|
| Ps. |
| 123,142 |
|
| Ps. |
| 6,244,222 |
|
New leases |
|
|
| 1,354,571 |
|
|
|
| 66,114 |
|
|
|
| 29,399 |
|
|
|
| 1,450,084 |
|
Interest expense |
|
|
| 725,331 |
|
|
|
| 14,305 |
|
|
|
| 17,982 |
|
|
|
| 757,618 |
|
Write-offs |
|
|
| — |
|
|
|
| (1,850 | ) |
|
|
| — |
|
|
|
| (1,850 | ) |
Payment of leases |
|
|
| (1,011,129 | ) |
|
|
| (39,970 | ) |
|
|
| (88,729 | ) |
|
|
| (1,139,828 | ) |
Lease liabilities as of September 30, 2024 |
| Ps. |
| 7,100,394 |
|
| Ps. |
| 128,058 |
|
| Ps. |
| 81,794 |
|
| Ps. |
| 7,310,246 |
|
The following are the amounts recognized in profit or loss:
| For the nine-month periods ended |
| ||||||||
| September 30, |
|
| September 30, |
| |||||
Depreciation expense of right-of-use assets |
| Ps. |
| 481,244 |
|
| Ps. |
| 421,872 |
|
Interest expense on lease liabilities |
|
|
| 757,618 |
|
|
|
| 526,566 |
|
Expense relating to leases of low-value |
|
|
| 9,837 |
|
|
|
| 9,574 |
|
Total amount recognized in profit or loss |
| Ps. |
| 1,248,699 |
|
| Ps. |
| 958,012 |
|
The Company has no cash outflows to which is potentially exposed since in the measurement of the lease liabilities, the optional renewal is always included.
F-23
BBB Foods Inc. and subsidiaries
Notes to the Unaudited Interim Condensed Consolidated Financial Statements
As of September 30, 2024, December 31, 2023 and for the three and nine-month periods ended September 30, 2024 and 2023
Note 12 - Income tax:
BBB Foods Inc., as an entity incorporated and existing under the laws of the British Virgin Islands (“BVI”), is not subject to any form of taxation and therefore there is no tax rate to be applied and will continue to be in the future. The laws of the BVI specifically provide that a BVI business entity such as BBB Foods Inc. is exempt from any income, capital gains, estate or other tax in the British Virgin Islands. However, the statutory rate of income tax in Mexico applicable to the Company’s Mexican Subsidiaries was and will continue to be 30%.
Income tax expense is recognized based on management’s estimate of the weighted average effective annual income tax rate expected for the full fiscal year. In addition, there were no enacted or substantially enacted tax rates to recognize the remeasurement of deferred tax balances in the interim periods.
The Company estimates the amount of expenditure and the likely level of tax benefits in the coming interim periods and the likely effect on the effective tax rate for the full year. The expenditures related to the opening of new stores which consisted mainly in new leases and property, furniture, equipment, and leasehold improvements had a material effect on the effective tax rate. Therefore, the Company recognized a net deferred tax assets of Ps. 260,012 and Ps.102,473 in the nine-month periods ended September 30, 2024 and 2023, respectively, and spread the effect of the change in the deferred tax assets over the full years ending December 31, 2024, and 2023, respectively, based on application of an annual effective tax rate.
As indicated above, the transactions in BVI, are not subject to tax, and the Mexican subsidiaries are subject to 30% tax rate. Therefore, according to IAS 34 the Company determined the estimated average annual tax rate used for the nine-month periods ended September 30, 2024, and 2023 separately for the transactions of each jurisdiction, where the 0% tax rate was used to the items related to BVI, and 39% and 60% respectively for the Mexican subsidiaries, which exclude the impact of the non-deductible share based payments that were not considered in the effective tax rate given the distortive effect, but instead such impact was considered on each of the interim periods as they arose. Although the Company historically had losses before income taxes at the consolidated level, the Mexican Subsidiaries had historically had profits before income taxes (without considering the share-based payments expense) to which an annual income tax is expected to be recognized for the full fiscal year. Moreover, in the nine-month period ended on September 30, 2024, the Company generated a consolidated profit before income tax.
Note 13 - Cost and expenses by nature
The cost of sales is comprised as shown below:
| For the nine-month periods ended |
| ||||||||
| September 30, |
|
| September 30, |
| |||||
| 2024 |
|
| 2023 |
| |||||
Cost of merchandise and logistic costs |
| Ps. |
| 34,235,653 |
|
| Ps. |
| 26,603,732 |
|
Depreciation of property, furniture, |
|
|
| 91,011 |
|
|
|
| 66,244 |
|
Depreciation of right-of-use asset |
|
|
| 87,549 |
|
|
|
| 63,627 |
|
Cost of sales |
| Ps. |
| 34,414,213 |
|
| Ps. |
| 26,733,603 |
|
F-24
BBB Foods Inc. and subsidiaries
Notes to the Unaudited Interim Condensed Consolidated Financial Statements
As of September 30, 2024, December 31, 2023 and for the three and nine-month periods ended September 30, 2024 and 2023
The sales and administrative expenses are as follows:
| For the nine-month periods ended |
| ||||||||
| September 30, |
|
| September 30, |
| |||||
| 2024 |
|
| 2023 |
| |||||
Personnel expenses |
| Ps. |
| 2,791,671 |
|
| Ps. |
| 2,268,607 |
|
Depreciation and amortization |
|
|
| 773,526 |
|
|
|
| 628,175 |
|
Cash-in-transit services, surveillance and |
|
|
| 492,480 |
|
|
|
| 401,465 |
|
Energy, fuel, and lubricants |
|
|
| 387,400 |
|
|
|
| 300,823 |
|
Shared-based payments (1) |
|
|
| 396,054 |
|
|
|
| 302,438 |
|
Advertising |
|
|
| 122,773 |
|
|
|
| 107,537 |
|
Other taxes and rights |
|
|
| 123,499 |
|
|
|
| 97,281 |
|
Professional services (2) |
|
|
| 209,471 |
|
|
|
| 72,307 |
|
Other |
|
|
| 338,135 |
|
|
|
| 285,541 |
|
Total sales and administrative expenses |
| Ps. |
| 5,635,009 |
|
| Ps. |
| 4,464,174 |
|
Note 14 - Financial costs - Net:
For the nine-month periods ended September 30, 2024 and 2023, the financial (costs) income are as follow:
| For the nine-month periods ended |
| ||||||||
| September 30, |
|
| September 30, |
| |||||
Financial income: |
|
|
|
|
|
|
|
| ||
Interest income |
| Ps. |
| 43,625 |
|
| Ps. |
| 12,866 |
|
Interest generated by short term bank |
|
|
| 48,341 |
|
|
|
| — |
|
Gain on fair value valuation of derivative |
|
|
| 7,287 |
|
|
|
| — |
|
Other commissions |
|
|
| 10,248 |
|
|
|
| 7,644 |
|
Financial income |
| Ps. |
| 109,501 |
|
| Ps. |
| 20,510 |
|
F-25
BBB Foods Inc. and subsidiaries
Notes to the Unaudited Interim Condensed Consolidated Financial Statements
As of September 30, 2024, December 31, 2023 and for the three and nine-month periods ended September 30, 2024 and 2023
| For the nine-month periods ended |
| ||||||||
| September 30, |
|
| September 30, |
| |||||
Financial costs: |
|
|
|
|
|
|
|
| ||
Interest cost on lease liabilities |
| Ps. |
| (757,618 | ) |
| Ps. |
| (526,566 | ) |
Interest cost on Promissory Notes |
|
|
| (82,588 | ) |
|
|
| (459,621 | ) |
Interest on bonus payable to related |
|
|
| (1,191 | ) |
|
|
| (3,604 | ) |
Reverse factoring and other commissions |
|
|
| (18,754 | ) |
|
|
| (3,154 | ) |
Interest cost on credit lines |
|
|
| (41,591 | ) |
|
|
| — |
|
Interest cost on financing of |
|
|
| (22,313 | ) |
|
|
| (14,923 | ) |
Financial costs |
| Ps. |
| (924,055 | ) |
| Ps. |
| (1,007,868 | ) |
Exchange rate fluctuation: |
|
|
|
|
|
|
|
| ||
Gain for exchange rate fluctuation |
| Ps. |
| 444,415 |
|
| Ps. |
| 440,447 |
|
Loss for exchange rate fluctuation |
|
|
| (59,080 | ) |
|
|
| (36,525 | ) |
Exchange rate fluctuation |
| Ps. |
| 385,335 |
|
| Ps. |
| 403,922 |
|
Financial costs - Net |
| Ps. |
| (429,219 | ) |
| Ps. |
| (583,436 | ) |
Note 15 - Capital stock:
On January 29, 2024, the Board’s Resolutions meeting agreed a 3-for-1 split of its common shares that was affected immediately prior to the completion of the IPO, resulting in a retrospective adjustment to the Class A, B, C, D and E common shares, increasing their number of shares.
In addition, in January 2024 there was a reorganization of the existing shares into Class A, B and C shares, each of which occurred immediately prior to the completion of the IPO.
As of December 31, 2023 and September 30, 2024, the capital stock was comprised as follows (considering the 3-for-1 split occurred in 2024):
Number of |
|
|
| Capital Stock |
| ||||
As of December 31, 2023 |
| 84,150,261 |
| (1) |
| Ps. |
| 471,282 |
|
As of September 30, 2024 |
| 112,200,752 |
| (2) |
| Ps. |
| 8,283,347 |
|
The number of shares outstanding, considering the 3-for-1 share split, and the total value for each class as of September 30, 2024, and December 31, 2023 are as follows:
| Class A |
|
| Class B |
|
| Class C |
|
| Class D |
|
| Class E |
|
| Total |
| |||||||
As of December 31, |
|
| 12,000,000 |
|
|
| 33,075,000 |
|
|
| — |
|
|
| 25,714,284 |
|
|
| 13,360,977 |
|
|
| 84,150,261 |
|
Share reorganization |
|
| (1,340,814 | ) |
|
| (27,875,000 | ) |
|
| 68,291,075 |
|
|
| (25,714,284 | ) |
|
| (13,360,977 | ) |
|
| — |
|
Issued shares at the |
|
| 28,050,491 |
|
|
| — |
|
|
| — |
|
|
| — |
|
|
| — |
|
|
| 28,050,491 |
|
As of September 30, |
|
| 38,709,677 |
|
|
| 5,200,000 |
|
|
| 68,291,075 |
|
|
| — |
|
|
| — |
|
|
| 112,200,752 |
|
F-26
BBB Foods Inc. and subsidiaries
Notes to the Unaudited Interim Condensed Consolidated Financial Statements
As of September 30, 2024, December 31, 2023 and for the three and nine-month periods ended September 30, 2024 and 2023
| As of September 30, |
|
| As of December 31, |
| |||||||||||||
| 2024 |
|
| 2023 |
| |||||||||||||
Description |
| Number of |
|
| Total value |
|
| Number of |
|
| Total value |
| ||||||
Class A (1) |
|
| 38,709,677 |
|
| Ps. |
| 7,812,065 |
|
|
| 12,000,000 |
|
| Ps. |
| — |
|
Class B (2) |
|
| 5,200,000 |
|
|
|
| 19,569 |
|
|
| 33,075,000 |
|
|
|
| 124,470 |
|
Class C (3) |
|
| 68,291,075 |
|
|
|
| 451,713 |
|
|
| — |
|
|
|
| — |
|
Class D (3) |
|
| — |
|
|
|
| — |
|
|
| 25,714,284 |
|
|
|
| 163,904 |
|
Class E (4) |
|
| — |
|
|
|
| — |
|
|
| 13,360,977 |
|
|
|
| 182,908 |
|
Total |
|
| 112,200,752 |
|
| Ps. |
| 8,283,347 |
|
|
| 84,150,261 |
|
| Ps. |
| 471,282 |
|
As a result of completing the Company’s IPO at a public offering price of US$17.50 per share, the total value of the Class A common shares is comprised as follows:
Total value |
| |||
Value Class A Common Shares as of | Ps. |
| — |
|
Proceeds from the IPO |
|
| 8,386,992 |
|
Underwriting fees and incremental and direct costs |
|
| (574,927 | ) |
Value Class A Common Shares as of | Ps. |
| 7,812,065 |
|
Note 16 - Earnings (loss) per share:
Earnings (loss) per share are classified as basic and diluted. Basic earnings (loss) are intended to provide a measure of the participation of each ordinary share of BBB Foods Inc. in the performance that the Company had in the periods presented. Basic earnings (loss) are calculated by dividing the earnings (loss) for the period attributable to the ordinary equity holders of the controlling interest by the weighted average number of ordinary shares outstanding during the year.
Diluted shares are intended to provide a measure of the participation of each ordinary share in the Company's performance considering the dilutive effects (reduction in profits or increase in losses) of the potential ordinary
F-27
BBB Foods Inc. and subsidiaries
Notes to the Unaudited Interim Condensed Consolidated Financial Statements
As of September 30, 2024, December 31, 2023 and for the three and nine-month periods ended September 30, 2024 and 2023
shares in circulation during the period. Diluted earnings (loss) per share are calculated by dividing the earnings (loss) of the year attributable to the ordinary equity holders of the controlling interest by the weighted average number of ordinary shares outstanding during the year plus the weighted average number of ordinary shares that have dilutive potential.
For the nine-month period ended on September 30, 2023, the Company did not present diluted earnings per share as it recognized a net loss for the period, which would result in an antidilutive effect.
For the nine-month period ended on September 30, 2024, the Company analyzed whether there were dilutive effects from potential ordinary shares arising from share-based payments and Convertible Note, as the Company recognized profit in such period. The Company determined that all of the 14,145,408 options (each of which grants each holder the right to receive three Class C common shares, derived from the 3-for-1 share split effected in connection with the IPO) granted to eligible employees, as noted in Note 17, have a dilutive effect. Additionally, in the estimation of the diluted earnings per share, the potential dilution of the Convertible Note is estimated until February 14, 2024, date on which it was settled.
The information on earnings (loss) per share and number of shares used in the calculations of basic and diluted earnings (loss) per share is shown below:
| For the three-month periods ended |
|
| For the nine-month periods ended |
| |||||||||||||||
| September 30, |
|
| September 30, |
|
| September 30, |
|
| September 30, |
| |||||||||
| 2024 |
|
| 2023 |
|
| 2024 |
|
| 2023 |
| |||||||||
|
|
|
|
|
|
|
|
|
|
|
|
|
|
|
|
| ||||
Net income available to common stockholders |
| Ps. |
| 257,600 |
|
|
|
|
|
| Ps. |
| 357,993 |
|
|
|
|
| ||
Weighted average common shares (2) |
|
|
| 112,200,752 |
|
|
|
|
|
|
|
| 107,798,668 |
|
|
|
|
| ||
Basic earnings per share |
| Ps. |
| 2.30 |
|
|
|
|
|
| Ps. |
| 3.32 |
|
|
|
|
| ||
Net income available to common stockholders |
| Ps. |
| 258,008 |
|
|
|
|
|
| Ps. |
| 358,401 |
|
|
|
|
| ||
Diluted weighted average common shares (2) |
|
|
| 142,254,384 |
|
|
|
|
|
|
|
| 137,894,806 |
|
|
|
|
| ||
Diluted earnings per share |
| Ps. |
| 1.81 |
|
|
|
|
|
|
|
| 2.60 |
|
|
|
|
| ||
|
|
|
|
|
|
|
|
|
|
|
|
|
|
|
|
| ||||
Not loss available to class A shares |
|
|
|
|
| Ps. |
| (339,051 | ) |
|
|
|
|
| Ps. |
| (209,169 | ) | ||
Basic and diluted loss per class A share |
|
|
|
|
| Ps. |
| (28.25 | ) |
|
|
|
|
| Ps. |
| (17.43 | ) | ||
Weighted average class A shares (1) |
|
|
|
|
|
|
| 12,000,000 |
|
|
|
|
|
|
|
| 12,000,000 |
| ||
Note 17 - Share-based payments
Common Options
The Company has a share-based payments plan for its employees. As stated in the terms of the share-based compensation plan (the “Plan”), eligible employees will obtain share-based payments pursuant to the terms of the Plan.
F-28
BBB Foods Inc. and subsidiaries
Notes to the Unaudited Interim Condensed Consolidated Financial Statements
As of September 30, 2024, December 31, 2023 and for the three and nine-month periods ended September 30, 2024 and 2023
For the nine-month period ended September 30, 2024, the Company did not grant options under the Plan.
The following table illustrates the movements in share options under the Plan during the nine-month period ended September 30, 2024 and for the year ended December 31, 2023. Derived from the 3-for-1 share split effected in connection with the IPO, each option grants employees to acquire 3 Class C shares of BBB Foods Inc:
| Number of share |
| ||
| options |
| ||
Outstanding as of January 1, 2023 |
|
| 9,788,750 |
|
Granted during the year |
|
| 2,090,000 |
|
Forfeited during the year |
|
| (215,000 | ) |
Outstanding as of December 31, 2023 |
|
| 11,663,750 |
|
Exercisable as of December 31, 2023 |
|
| — |
|
Granted during the nine-month period |
|
| — |
|
Forfeited during the nine-month period |
|
| — |
|
Outstanding as of September 30, 2024 |
|
| 11,663,750 |
|
Exercisable as of September 30, 2024 |
|
| — |
|
As of September 30, 2024, there are 11,663,750 Common Options outstanding. Of these, 5,775,625 options have vested, while 5,888,125 options remain unvested.
Exit Options
Exit Options will be paid in equity in the occurrence of an exit event, such as an IPO; therefore, the vesting period of such options represents the best estimate of the Company for the occurrence of an exit event.
The fair value of the share options vested is determined using an option pricing model and a binomial tree valuation model, which considers the Company’s share price based on future discounted cash flows. The Company awarded options to purchase Class C Shares, each share having a par value of one cent U.S. dollars (US$0.01).
For the year ended December 31, 2023 the Company granted 126,664 Exit Options to former members of the Board of Directors, that were previously granted in 2020 and forfeited in 2021. In January 2023, the Company re-granted the same number of Exit Options to such former members of the Board of Directors, which simultaneously vested in its entirety for not having the performance condition of being at the Company until the occurrence of an IPO, and the award was recognized as a new grant. The fair value of the share options vested is determined using an option pricing model and a binomial tree valuation model, which considers the Company’s share price based on future discounted cash flows. The Company awarded options to purchase Class C Shares, each share having a par value of one cent U.S. dollars (US$0.01).
F-29
BBB Foods Inc. and subsidiaries
Notes to the Unaudited Interim Condensed Consolidated Financial Statements
As of September 30, 2024, December 31, 2023 and for the three and nine-month periods ended September 30, 2024 and 2023
The following table illustrates the movements in Exit Options during the nine-month period ended September 30, 2024 and for the year ended December 31, 2023. Derived from the 3-for-1 share split effected in connection with the IPO, each option grants employees to acquire 3 Class C shares of BBB Foods Inc:
| Number of share |
| ||
| options |
| ||
Outstanding as of January 1, 2023 |
|
| 2,354,994 |
|
Granted during the year |
|
| 126,664 |
|
Forfeited during the year |
|
| — |
|
Outstanding as of December 31, 2023 |
|
| 2,481,658 |
|
Exercisable as of December 31, 2023 |
|
| — |
|
Granted during the nine-month period |
|
| — |
|
Forfeited during the nine-month period |
|
| — |
|
Outstanding as of September 30, 2024 |
|
| 2,481,658 |
|
Exercisable as of September 30, 2024 |
|
| — |
|
As a result of the IPO (See Note 1), all the outstanding Exit Options as of September 30, 2024, have vested.
The share-based payments during the nine-month periods ended September 30, 2024 and 2023 were recognized in administrative expenses as follow:
| For the nine-month periods ended |
| ||||||||
| September 30, |
|
| September 30, |
| |||||
Options granted under the Plan |
| Ps. |
| 375,280 |
|
| Ps. |
| 178,157 |
|
Exit Options |
|
|
| 20,774 |
|
|
|
| 124,281 |
|
Share-based payments |
| Ps. |
| 396,054 |
|
| Ps. |
| 302,438 |
|
Note 18 - Subsequent events:
In preparing the interim condensed consolidated financial statements, the Company has evaluated the events and transactions for recognition or disclosure subsequent to September 30, 2024, and through December 10, 2024 (date of approval of the interim condensed consolidated financial statements), and no significant subsequent events were identified.
Note 19 - Contingencies:
The Company is involved in several lawsuits and claims derived from the ordinary course of business. It is expected that the outcome of these matters will not have significant adverse effects on the Company's financial position or future consolidated results of operations.
Note 20 – Correction of an error:
Further to the approval of the interim financial statements on January 14, 2025, the Company identified that some options that had been deemed anti-dilutive actually had a dilutive effect, which affected the diluted weighted average common shares outstanding and the calculation of diluted earnings per common share previously reported. For the three-month period ended September 30, 2024, and the nine-month period ended on the same date, the diluted weighted average common shares outstanding previously reported amounted to 136,283,972 and 131,924,394, respectively, which were adjusted to 142,254,384 and 137,894,806, respectively. Consequently, diluted earnings per common share previously reported for the same periods previously reported as Ps.1.89 and
F-30
BBB Foods Inc. and subsidiaries
Notes to the Unaudited Interim Condensed Consolidated Financial Statements
As of September 30, 2024, December 31, 2023 and for the three and nine-month periods ended September 30, 2024 and 2023
Ps.2.72, respectively, were adjusted to Ps.1.81 and Ps.2.60, respectively. The financial statements previously issued were revised to correct the error mentioned above.
F-31
17,500,000 Class A common shares
BBB Foods Inc.
Global Coordinators
J.P. Morgan |
| Morgan Stanley |
Joint Bookrunners
BTG Pactual | Santander | Scotiabank |
, 2025
EXHIBIT INDEX
Exhibit No. |
| Description |
|
|
|
1.01 |
| |
|
|
|
3.01 |
| |
|
|
|
5.01 |
| |
|
|
|
21.01 |
| |
|
|
|
23.01 |
| |
|
|
|
23.02 |
| Consent of Conyers Dill & Pearman (included in Exhibit 5.01) |
|
|
|
24.01 |
| Powers of attorney (included on signature page to the registration statement) |
|
|
|
107 |
|
PART II
INFORMATION NOT REQUIRED IN PROSPECTUS
Item 6. Indemnification of Directors and Officers.
Under British Virgin Islands law, each of our directors and officers, in performing his or her functions, is required to act honestly and in good faith with a view to our best interests and exercise the care, diligence and skill that a reasonably prudent person would exercise in comparable circumstances. Fiduciary duties are owed to the Issuer and, under British Virgin Islands law (and as further provided by our memorandum and articles of association), our directors will not be personally liable to us or our shareholders for any acts or omissions in the performance of their fiduciary duties. Such limitation of liability does not affect the availability of equitable remedies such as injunctive relief or rescission. These provisions will not limit the liability of directors under United States federal securities laws.
Our memorandum and articles of association provide that we shall indemnify any of our directors, officers or anyone serving at our request as a director or officer of another entity against all expenses, including legal fees, and against all judgments, fines and amounts paid in settlement and reasonably incurred in connection with legal, administrative or investigate proceeding or suits; provided that such indemnification shall not apply unless the person claiming such indemnification acted honestly and in good faith and in what he or she believed to be the best interests of the Issuer and, in the case criminal proceedings, the person had no reasonable cause to believe that his or her conduct was unlawful. We may pay any expenses, including legal fees, incurred by any such person in defending any legal, administrative or investigative proceedings in advance of the final disposition of the proceedings. If a person to be indemnified has been successful in defense of any proceedings referred to above, the director or officer is entitled to be indemnified against all expenses, including legal fees, and against all judgments, fines and amounts paid in settlement and reasonably incurred by the director or officer in connection with the proceedings.
We may purchase and maintain insurance in relation to any of our directors or officers against any liability asserted against the directors or officers and incurred by the directors or officers in that capacity, whether or not we have or would have had the power to indemnify the directors or officers against the liability as provided in our memorandum and articles of association.
Insofar as indemnification for liabilities arising under the Securities Act may be permitted to our directors, officers or controlling persons pursuant to the foregoing provisions, we have been informed that in the opinion of the SEC, such indemnification is against public policy as expressed in the Securities Act and is therefore unenforceable as a matter of United States law.
Item 7. Recent Sales of Unregistered Securities.
During the past three years, we have issued and sold the securities described below without registering the securities under the Securities Act. None of these transactions involved any underwriters’ underwriting discounts or commissions, or any public offering. We believe that each of the following issuances was exempt from registration under the Securities Act in reliance on Rule 701 under the Securities Act or pursuant to Section 4(a)(2) of the Securities Act regarding transactions not involving a public offering. Except as otherwise set forth below, we have not made any sales of unregistered securities during the past three years.
Options to Purchase Common Shares
During the past three years, we have granted an aggregate of 6,230,000 options to purchase Class C shares of the Issuer to certain employees, directors and other service providers of the Issuer as described below. As a result of the 3-for-1 share split effected in connection with our IPO, each option grants each holder the right to receive three Class C common shares.
II-1
Exit Options
During the past three years, we have granted an aggregate of 426,664 options to certain employees, directors and other service providers of the Issuer as described below. Each exit option is exercisable following a liquidity event, such as an initial public offering by the Issuer. As a result of the 3-for-1 share split effected in connection with our IPO, each option grants each holder the right to receive three Class C common shares.
Item 8. Exhibits and Financial Statement Schedules.
The agreements included as exhibits to this registration statement contain representations and warranties by each of the parties to the applicable agreement. These representations and warranties were made for the benefit of the other parties to the applicable agreement and (1) were not intended to be treated as categorical statements of fact, but rather as a way of allocating the risk to one of the parties if those statements prove to be inaccurate; (2) may have been qualified in such agreement by disclosures that were made to the other party in connection with the negotiation of the applicable agreement; (3) may apply contract standards of “materiality” that are different from “materiality” under the applicable securities laws; and (4) were made only as of the date of the applicable agreement or such other date or dates as may be specified in the agreement. We acknowledge that, notwithstanding the inclusion of the foregoing cautionary statements, we are responsible for considering whether additional specific disclosures of material information regarding material contractual provisions are required to make the statements in this registration statement not misleading.
Item 9. Undertakings.
II-2
II-3
SIGNATURES
Pursuant to the requirements of the U.S. Securities Act of 1933, as amended, the registrant certifies that it has reasonable grounds to believe that it meets all of the requirements for filing on Form F-1 and has duly caused this registration statement to be signed on its behalf by the undersigned, thereunto duly authorized, in Mexico City, Mexico, on February 3, 2025.
BBB Foods Inc. | |
|
|
By: | /s/ K. Anthony Hatoum |
| Name: K. Anthony Hatoum |
| Title: Chief Executive Officer and Chairman |
|
|
|
|
By: | /s/ Eduardo Pizzuto |
| Name: Eduardo Pizzuto |
| Title: Chief Financial Officer and Investor |
| Relations Officer |
|
|
II-4
POWER OF ATTORNEY
KNOW ALL PERSONS BY THESE PRESENTS, that each person whose signature appears below hereby constitutes and appoints Eduardo Pizzuto and Jose Raz Guzman and each of them, individually, as his or her true and lawful attorneys-in-fact and agents, with full power of substitution and resubstitution, for him or her and in his or her name, place and stead in any and all capacities, in connection with this registration statement, including to sign in the name and on behalf of the undersigned, this registration statement and any and all amendments thereto, including post-effective amendments and registrations filed pursuant to Rule 462 under the U.S. Securities Act of 1933, as amended, and to file the same, with all exhibits thereto, and other documents in connection therewith, with the U.S. Securities and Exchange Commission, granting unto such attorneys-in-fact and agents full power and authority to do and perform each and every act and thing requisite and necessary to be done in and about the premises, as fully to all intents and purposes as he might or could do in person, hereby ratifying and confirming all that such attorneys-in-fact and agents, or his or her substitutes, may lawfully do or cause to be done by virtue hereof.
Pursuant to the requirements of the Securities Act, this registration statement has been signed by the following persons in the capacities indicated on February 3, 2025.
Name | Title | ||
|
|
|
|
By: | /s/ K. Anthony Hatoum |
| Chief Executive Officer and Chairman |
| Name: K. Anthony Hatoum |
| (principal executive officer) |
|
|
|
|
By: | /s/ Eduardo Pizzuto |
| Chief Financial Officer and Investor Relations |
| Name: Eduardo Pizzuto |
| (principal financial officer and principal accounting officer) |
|
|
|
|
By: | /s/ Nicole Reich |
| Director |
| Name: Nicole Reich |
|
|
|
|
|
|
By: | /s/ Dan Gertsacov |
| Director |
| Name: Dan Gertsacov |
|
|
|
|
|
|
By: | /s/ Jean Fran-François Le Ruyet |
| Director |
| Name: Jean-François Le Ruyet |
|
|
|
|
|
|
By: | /s/ Alexander Fuster |
| Director |
| Name: Alexander Fuster |
|
|
|
|
|
|
By: | /s/ Juan Pablo Capello |
| Director |
| Name: Juan Pablo Cappello |
|
|
|
|
|
|
By: | /s/ Sami Khouri |
| Director |
| Name: Sami Khouri |
|
|
|
|
|
|
By: | /s/ Alexis Meffre |
| Director |
| Name: Alexis Meffre |
|
|
|
|
|
|
By: | /s/ Stephanie Martinez |
| Director |
| Name: Stephanie Martinez |
|
|
II-5
SIGNATURE OF AUTHORIZED REPRESENTATIVE OF THE REGISTRANT IN THE UNITED STATES
Pursuant to the Securities Act of 1933, as amended, the undersigned, the duly authorized representative in the United States of America, has signed this registration statement or amendment thereto in New York, New York, on February 3, 2025.
COGENCY GLOBAL INC. | ||
|
|
|
By: |
| /s/ Colleen A. De Vries |
Name: |
| Colleen A. De Vries |
Title: |
| Senior Vice President |
II-6